Sargent, NE Map & Demographics
Sargent Map
Sargent Overview
$27,497
PER CAPITA INCOME
$60,179
AVG FAMILY INCOME
$49,750
AVG HOUSEHOLD INCOME
50.5%
WAGE / INCOME GAP [ % ]
49.5¢/ $1
WAGE / INCOME GAP [ $ ]
0.40
INEQUALITY / GINI INDEX
486
TOTAL POPULATION
237
MALE POPULATION
249
FEMALE POPULATION
95.18
MALES / 100 FEMALES
105.06
FEMALES / 100 MALES
46.5
MEDIAN AGE
2.8
AVG FAMILY SIZE
2.3
AVG HOUSEHOLD SIZE
258
LABOR FORCE [ PEOPLE ]
63.4%
PERCENT IN LABOR FORCE
1.6%
UNEMPLOYMENT RATE
Sargent Zip Codes
Sargent Area Codes
Income in Sargent
Income Overview in Sargent
Per Capita Income in Sargent is $27,497, while median incomes of families and households are $60,179 and $49,750 respectively.
| Characteristic | Number | Measure |
| Per Capita Income | 486 | $27,497 |
| Median Family Income | 131 | $60,179 |
| Mean Family Income | 131 | $69,617 |
| Median Household Income | 208 | $49,750 |
| Mean Household Income | 208 | $57,308 |
| Income Deficit | 131 | $0 |
| Wage / Income Gap (%) | 486 | 50.47% |
| Wage / Income Gap ($) | 486 | 49.53¢ per $1 |
| Gini / Inequality Index | 486 | 0.40 |
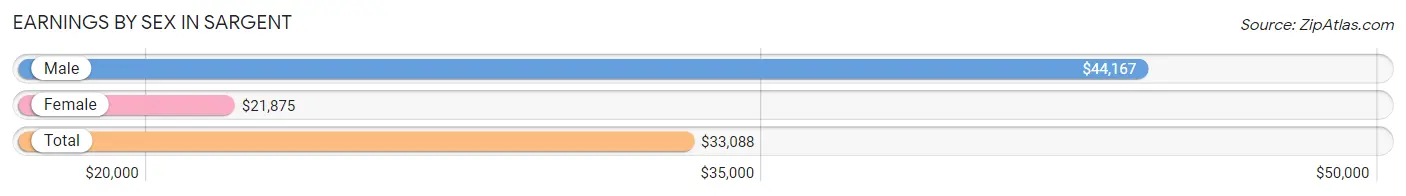
Earnings by Sex in Sargent
Average Earnings in Sargent are $33,088, $44,167 for men and $21,875 for women, a difference of 50.5%.
| Sex | Number | Average Earnings |
| Male | 146 (51.0%) | $44,167 |
| Female | 140 (48.9%) | $21,875 |
| Total | 286 (100.0%) | $33,088 |
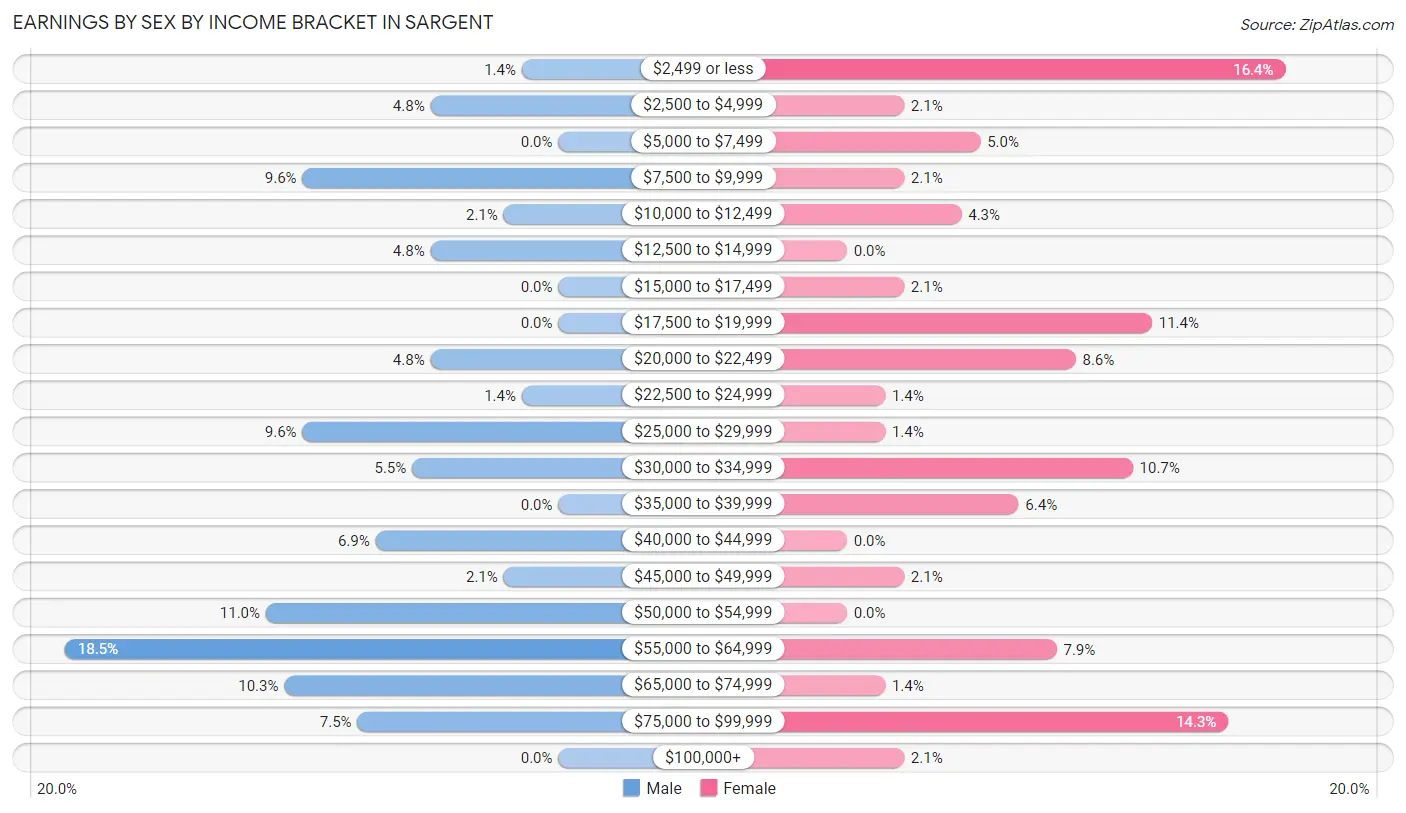
Earnings by Sex by Income Bracket in Sargent
The most common earnings brackets in Sargent are $55,000 to $64,999 for men (27 | 18.5%) and $2,499 or less for women (23 | 16.4%).
| Income | Male | Female |
| $2,499 or less | 2 (1.4%) | 23 (16.4%) |
| $2,500 to $4,999 | 7 (4.8%) | 3 (2.1%) |
| $5,000 to $7,499 | 0 (0.0%) | 7 (5.0%) |
| $7,500 to $9,999 | 14 (9.6%) | 3 (2.1%) |
| $10,000 to $12,499 | 3 (2.1%) | 6 (4.3%) |
| $12,500 to $14,999 | 7 (4.8%) | 0 (0.0%) |
| $15,000 to $17,499 | 0 (0.0%) | 3 (2.1%) |
| $17,500 to $19,999 | 0 (0.0%) | 16 (11.4%) |
| $20,000 to $22,499 | 7 (4.8%) | 12 (8.6%) |
| $22,500 to $24,999 | 2 (1.4%) | 2 (1.4%) |
| $25,000 to $29,999 | 14 (9.6%) | 2 (1.4%) |
| $30,000 to $34,999 | 8 (5.5%) | 15 (10.7%) |
| $35,000 to $39,999 | 0 (0.0%) | 9 (6.4%) |
| $40,000 to $44,999 | 10 (6.9%) | 0 (0.0%) |
| $45,000 to $49,999 | 3 (2.1%) | 3 (2.1%) |
| $50,000 to $54,999 | 16 (11.0%) | 0 (0.0%) |
| $55,000 to $64,999 | 27 (18.5%) | 11 (7.9%) |
| $65,000 to $74,999 | 15 (10.3%) | 2 (1.4%) |
| $75,000 to $99,999 | 11 (7.5%) | 20 (14.3%) |
| $100,000+ | 0 (0.0%) | 3 (2.1%) |
| Total | 146 (100.0%) | 140 (100.0%) |
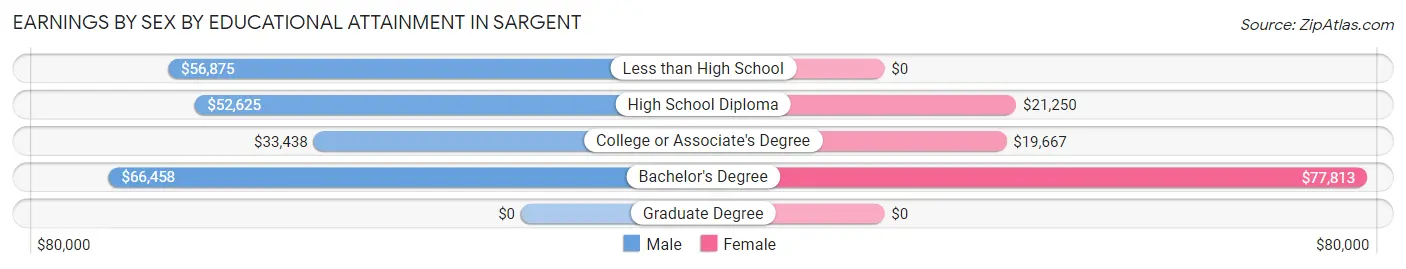
Earnings by Sex by Educational Attainment in Sargent
Average earnings in Sargent are $53,203 for men and $31,667 for women, a difference of 40.5%. Men with an educational attainment of bachelor's degree enjoy the highest average annual earnings of $66,458, while those with college or associate's degree education earn the least with $33,438. Women with an educational attainment of bachelor's degree earn the most with the average annual earnings of $77,813, while those with college or associate's degree education have the smallest earnings of $19,667.
| Educational Attainment | Male Income | Female Income |
| Less than High School | $56,875 | $0 |
| High School Diploma | $52,625 | $21,250 |
| College or Associate's Degree | $33,438 | $19,667 |
| Bachelor's Degree | $66,458 | $77,813 |
| Graduate Degree | - | - |
| Total | $53,203 | $31,667 |
Family Income in Sargent
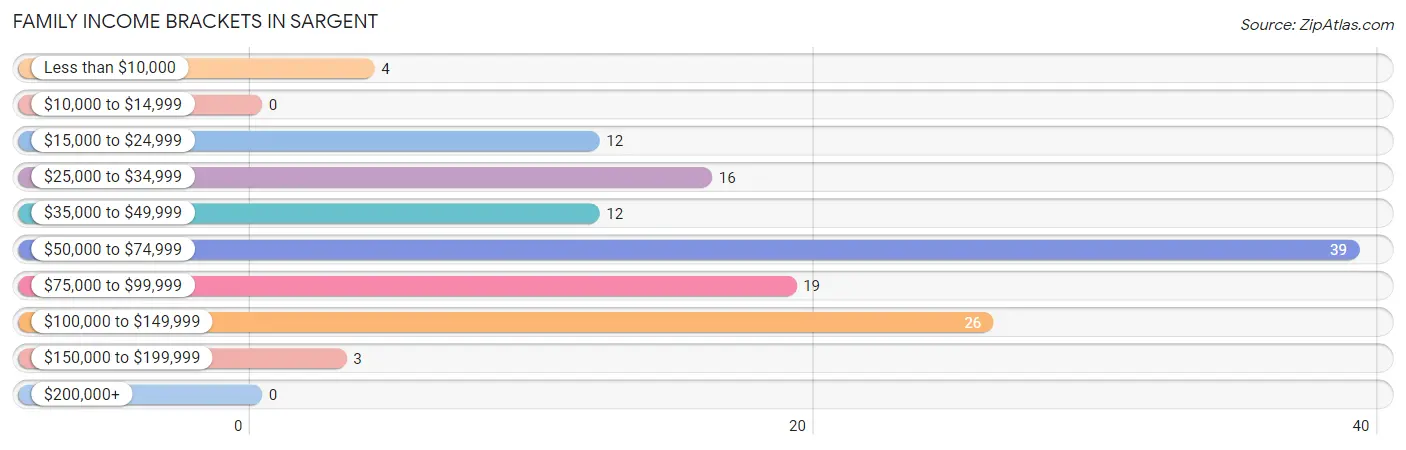
Family Income Brackets in Sargent
According to the Sargent family income data, there are 39 families falling into the $50,000 to $74,999 income range, which is the most common income bracket and makes up 29.8% of all families.
| Income Bracket | # Families | % Families |
| Less than $10,000 | 4 | 3.1% |
| $10,000 to $14,999 | 0 | 0.0% |
| $15,000 to $24,999 | 12 | 9.2% |
| $25,000 to $34,999 | 16 | 12.2% |
| $35,000 to $49,999 | 12 | 9.2% |
| $50,000 to $74,999 | 39 | 29.8% |
| $75,000 to $99,999 | 19 | 14.5% |
| $100,000 to $149,999 | 26 | 19.8% |
| $150,000 to $199,999 | 3 | 2.3% |
| $200,000+ | 0 | 0.0% |
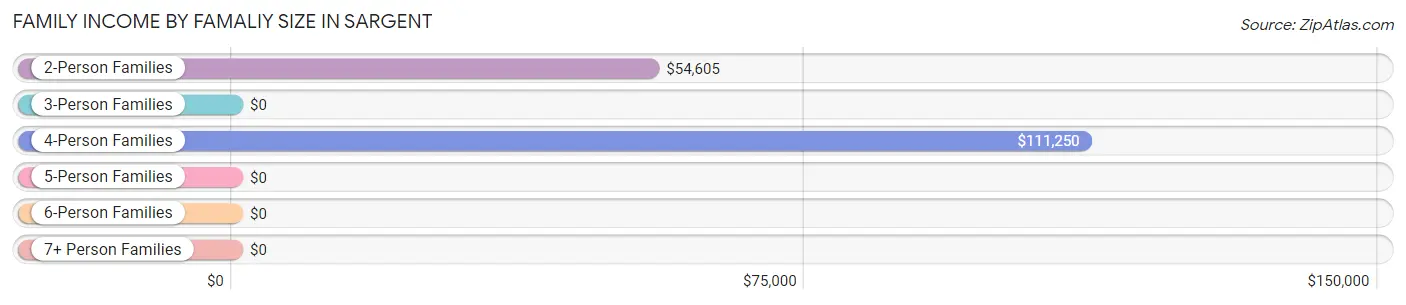
Family Income by Famaliy Size in Sargent
4-person families (10 | 7.6%) account for the highest median family income in Sargent with $111,250 per family, while 4-person families (10 | 7.6%) have the highest median income of $27,812 per family member.
| Income Bracket | # Families | Median Income |
| 2-Person Families | 84 (64.1%) | $54,605 |
| 3-Person Families | 29 (22.1%) | $0 |
| 4-Person Families | 10 (7.6%) | $111,250 |
| 5-Person Families | 6 (4.6%) | $0 |
| 6-Person Families | 2 (1.5%) | $0 |
| 7+ Person Families | 0 (0.0%) | $0 |
| Total | 131 (100.0%) | $60,179 |
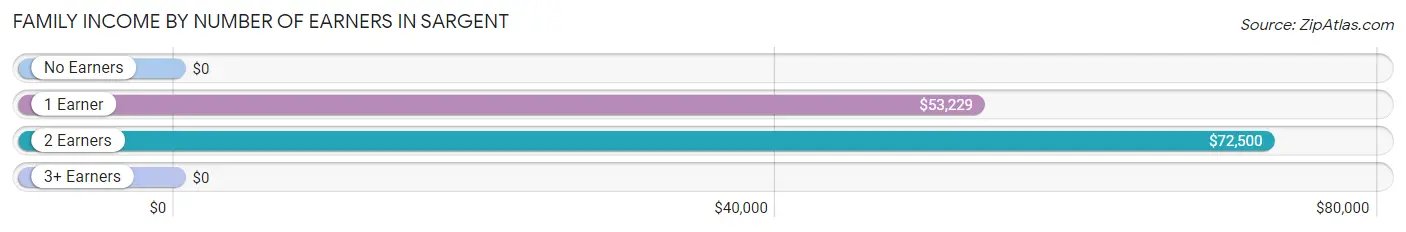
Family Income by Number of Earners in Sargent
| Number of Earners | # Families | Median Income |
| No Earners | 10 (7.6%) | $0 |
| 1 Earner | 53 (40.5%) | $53,229 |
| 2 Earners | 60 (45.8%) | $72,500 |
| 3+ Earners | 8 (6.1%) | $0 |
| Total | 131 (100.0%) | $60,179 |
Household Income in Sargent
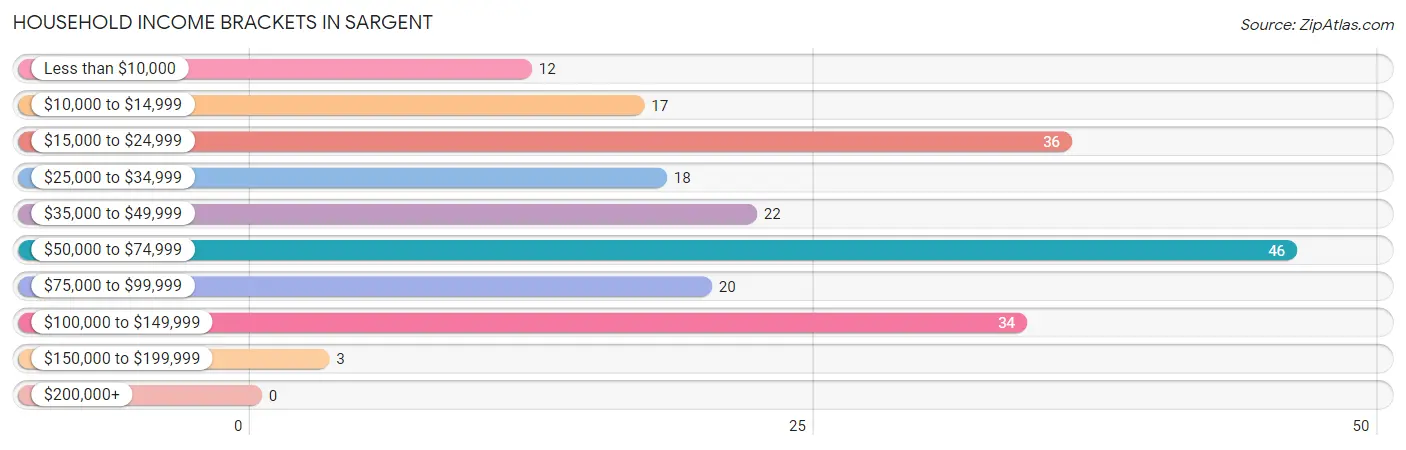
Household Income Brackets in Sargent
With 46 households falling in the category, the $50,000 to $74,999 income range is the most frequent in Sargent, accounting for 22.1% of all households.
| Income Bracket | # Households | % Households |
| Less than $10,000 | 12 | 5.8% |
| $10,000 to $14,999 | 17 | 8.2% |
| $15,000 to $24,999 | 36 | 17.3% |
| $25,000 to $34,999 | 18 | 8.7% |
| $35,000 to $49,999 | 22 | 10.6% |
| $50,000 to $74,999 | 46 | 22.1% |
| $75,000 to $99,999 | 20 | 9.6% |
| $100,000 to $149,999 | 34 | 16.3% |
| $150,000 to $199,999 | 3 | 1.4% |
| $200,000+ | 0 | 0.0% |
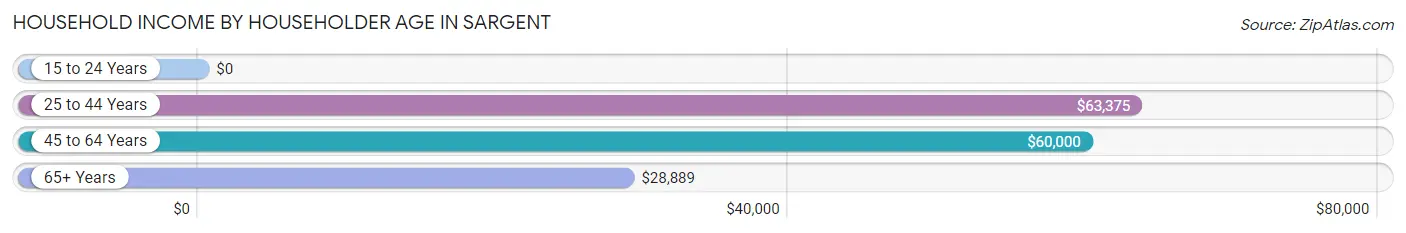
Household Income by Householder Age in Sargent
The median household income in Sargent is $49,750, with the highest median household income of $63,375 found in the 25 to 44 years age bracket for the primary householder. A total of 51 households (24.5%) fall into this category. Meanwhile, the 15 to 24 years age bracket for the primary householder has the lowest median household income of $0, with 5 households (2.4%) in this group.
| Income Bracket | # Households | Median Income |
| 15 to 24 Years | 5 (2.4%) | $0 |
| 25 to 44 Years | 51 (24.5%) | $63,375 |
| 45 to 64 Years | 88 (42.3%) | $60,000 |
| 65+ Years | 64 (30.8%) | $28,889 |
| Total | 208 (100.0%) | $49,750 |
Poverty in Sargent
Income Below Poverty by Sex and Age in Sargent
With 10.7% poverty level for males and 12.0% for females among the residents of Sargent, 45 to 54 year old males and 75 year old and over females are the most vulnerable to poverty, with 13 males (30.9%) and 14 females (48.3%) in their respective age groups living below the poverty level.
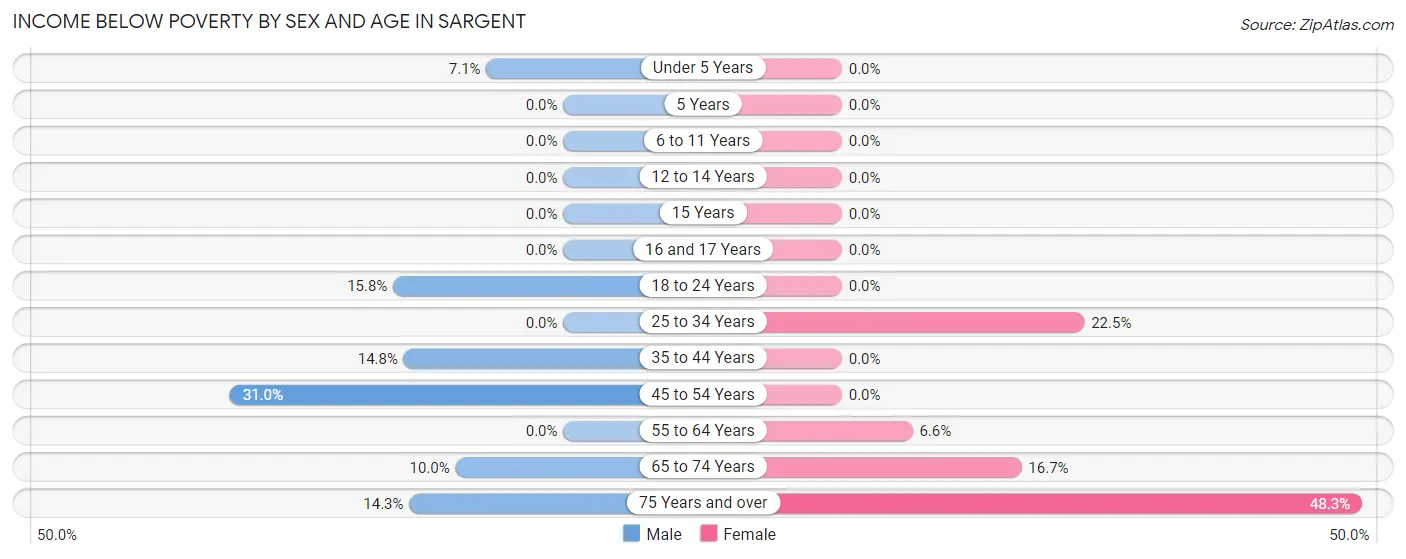
| Age Bracket | Male | Female |
| Under 5 Years | 1 (7.1%) | 0 (0.0%) |
| 5 Years | 0 (0.0%) | 0 (0.0%) |
| 6 to 11 Years | 0 (0.0%) | 0 (0.0%) |
| 12 to 14 Years | 0 (0.0%) | 0 (0.0%) |
| 15 Years | 0 (0.0%) | 0 (0.0%) |
| 16 and 17 Years | 0 (0.0%) | 0 (0.0%) |
| 18 to 24 Years | 3 (15.8%) | 0 (0.0%) |
| 25 to 34 Years | 0 (0.0%) | 9 (22.5%) |
| 35 to 44 Years | 4 (14.8%) | 0 (0.0%) |
| 45 to 54 Years | 13 (30.9%) | 0 (0.0%) |
| 55 to 64 Years | 0 (0.0%) | 4 (6.6%) |
| 65 to 74 Years | 2 (10.0%) | 3 (16.7%) |
| 75 Years and over | 2 (14.3%) | 14 (48.3%) |
| Total | 25 (10.7%) | 30 (12.0%) |
Income Above Poverty by Sex and Age in Sargent
According to the poverty statistics in Sargent, males aged 5 years and females aged under 5 years are the age groups that are most secure financially, with 100.0% of males and 100.0% of females in these age groups living above the poverty line.
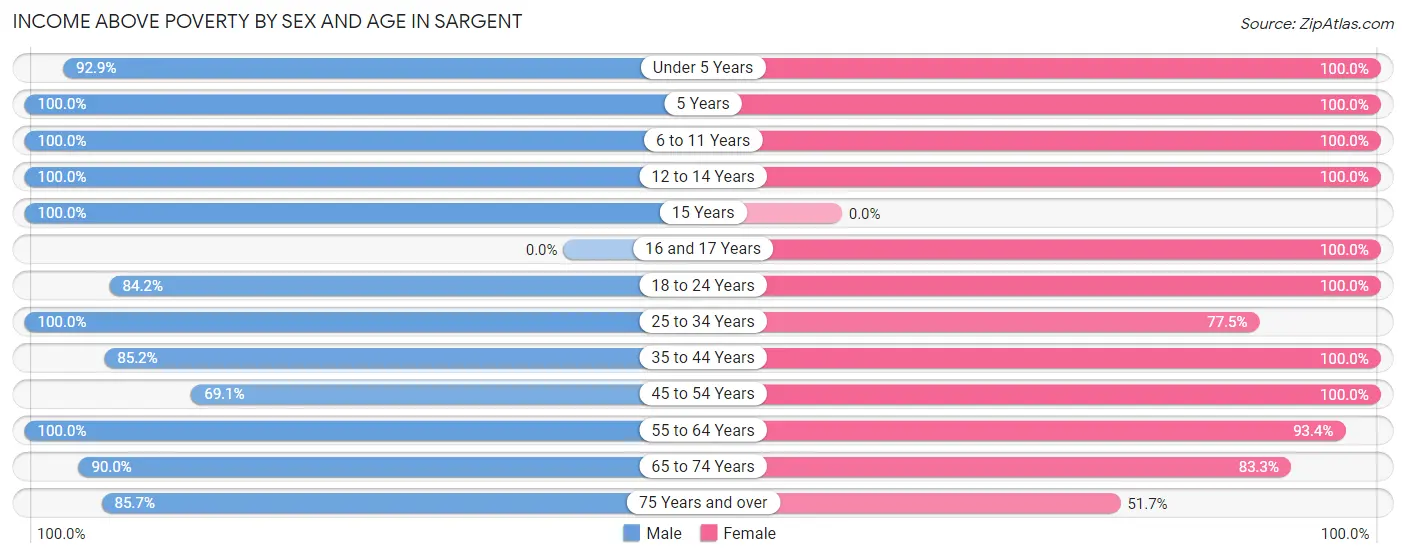
| Age Bracket | Male | Female |
| Under 5 Years | 13 (92.9%) | 30 (100.0%) |
| 5 Years | 1 (100.0%) | 4 (100.0%) |
| 6 to 11 Years | 15 (100.0%) | 3 (100.0%) |
| 12 to 14 Years | 3 (100.0%) | 3 (100.0%) |
| 15 Years | 3 (100.0%) | 0 (0.0%) |
| 16 and 17 Years | 0 (0.0%) | 4 (100.0%) |
| 18 to 24 Years | 16 (84.2%) | 18 (100.0%) |
| 25 to 34 Years | 33 (100.0%) | 31 (77.5%) |
| 35 to 44 Years | 23 (85.2%) | 6 (100.0%) |
| 45 to 54 Years | 29 (69.1%) | 33 (100.0%) |
| 55 to 64 Years | 43 (100.0%) | 57 (93.4%) |
| 65 to 74 Years | 18 (90.0%) | 15 (83.3%) |
| 75 Years and over | 12 (85.7%) | 15 (51.7%) |
| Total | 209 (89.3%) | 219 (87.9%) |
Income Below Poverty Among Married-Couple Families in Sargent
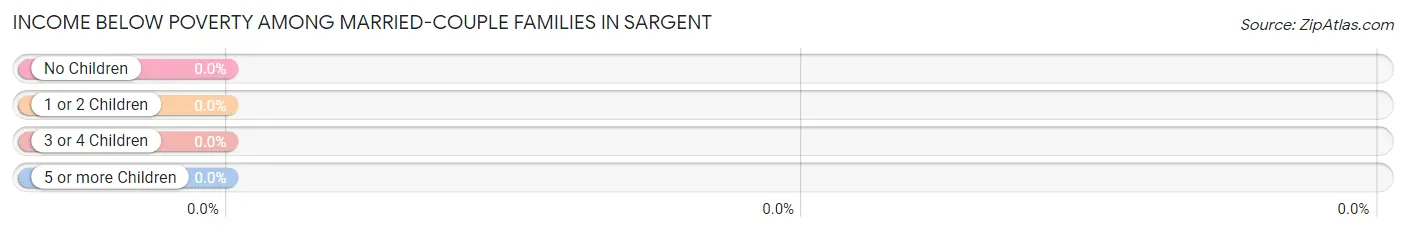
| Children | Above Poverty | Below Poverty |
| No Children | 60 (100.0%) | 0 (0.0%) |
| 1 or 2 Children | 30 (100.0%) | 0 (0.0%) |
| 3 or 4 Children | 8 (100.0%) | 0 (0.0%) |
| 5 or more Children | 0 (0.0%) | 0 (0.0%) |
| Total | 98 (100.0%) | 0 (0.0%) |
Income Below Poverty Among Single-Parent Households in Sargent
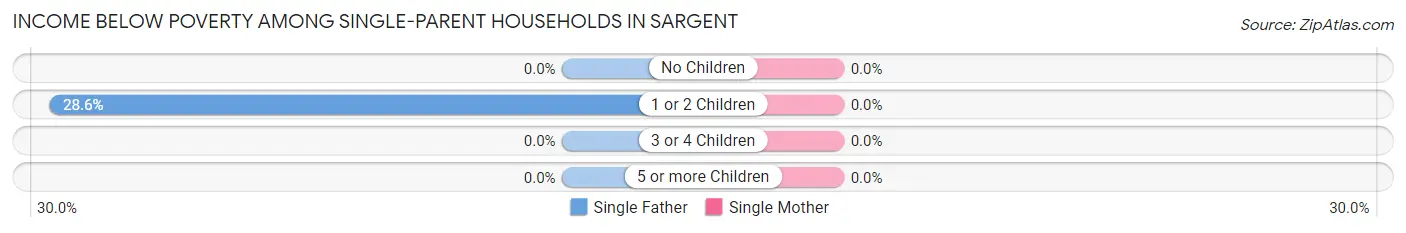
| Children | Single Father | Single Mother |
| No Children | 0 (0.0%) | 0 (0.0%) |
| 1 or 2 Children | 4 (28.6%) | 0 (0.0%) |
| 3 or 4 Children | 0 (0.0%) | 0 (0.0%) |
| 5 or more Children | 0 (0.0%) | 0 (0.0%) |
| Total | 4 (28.6%) | 0 (0.0%) |
Income Below Poverty Among Married-Couple vs Single-Parent Households in Sargent
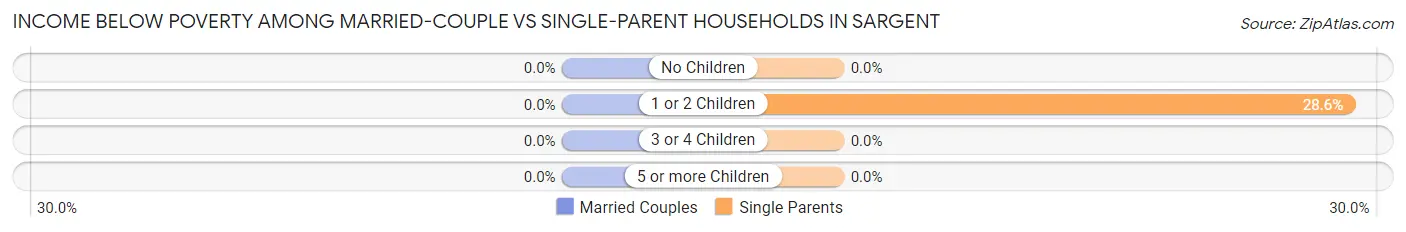
| Children | Married-Couple Families | Single-Parent Households |
| No Children | 0 (0.0%) | 0 (0.0%) |
| 1 or 2 Children | 0 (0.0%) | 4 (28.6%) |
| 3 or 4 Children | 0 (0.0%) | 0 (0.0%) |
| 5 or more Children | 0 (0.0%) | 0 (0.0%) |
| Total | 0 (0.0%) | 4 (12.1%) |
Race in Sargent
The most populous races in Sargent are White / Caucasian (471 | 96.9%), Two or more Races (13 | 2.7%), and Black / African American (2 | 0.4%).
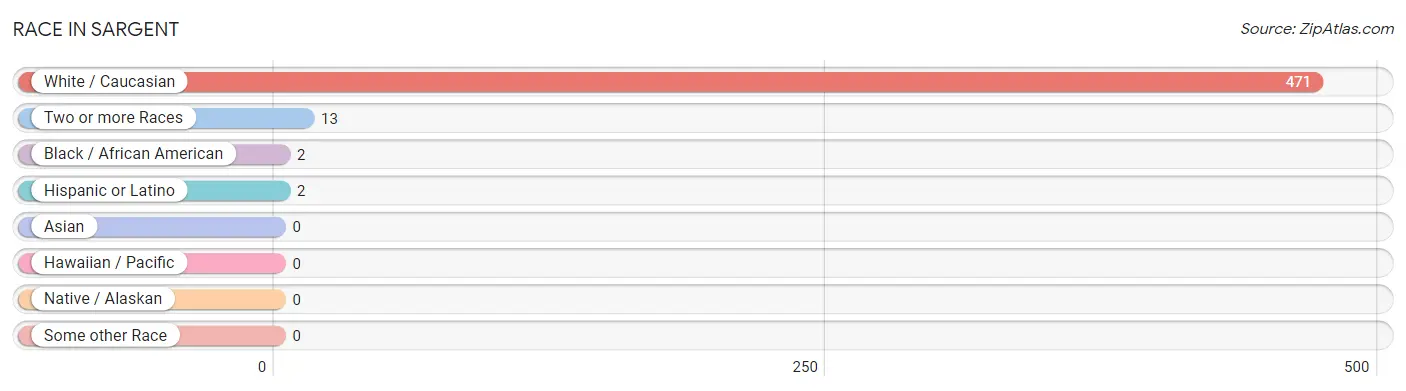
| Race | # Population | % Population |
| Asian | 0 | 0.0% |
| Black / African American | 2 | 0.4% |
| Hawaiian / Pacific | 0 | 0.0% |
| Hispanic or Latino | 2 | 0.4% |
| Native / Alaskan | 0 | 0.0% |
| White / Caucasian | 471 | 96.9% |
| Two or more Races | 13 | 2.7% |
| Some other Race | 0 | 0.0% |
| Total | 486 | 100.0% |
Ancestry in Sargent
The most populous ancestries reported in Sargent are German (143 | 29.4%), Irish (51 | 10.5%), English (43 | 8.8%), American (36 | 7.4%), and Czech (34 | 7.0%), together accounting for 63.2% of all Sargent residents.
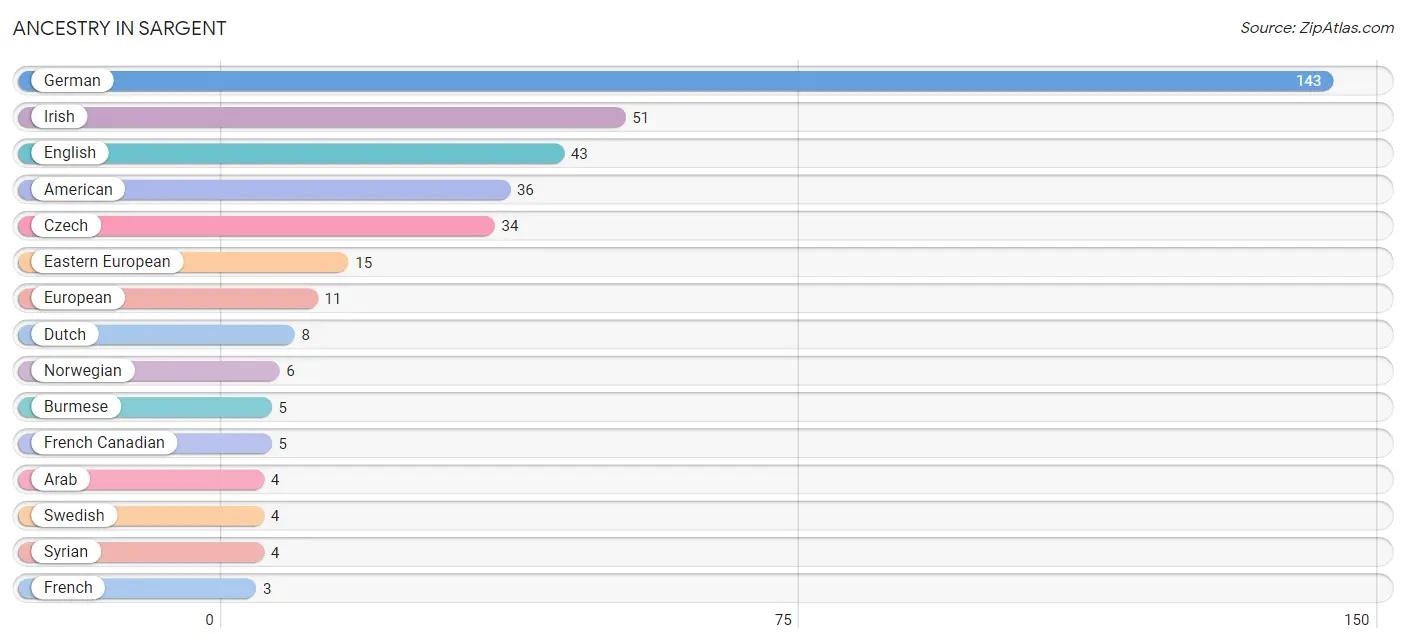
| Ancestry | # Population | % Population |
| American | 36 | 7.4% |
| Arab | 4 | 0.8% |
| Austrian | 1 | 0.2% |
| Burmese | 5 | 1.0% |
| Czech | 34 | 7.0% |
| Danish | 2 | 0.4% |
| Dutch | 8 | 1.7% |
| Eastern European | 15 | 3.1% |
| English | 43 | 8.8% |
| European | 11 | 2.3% |
| French | 3 | 0.6% |
| French Canadian | 5 | 1.0% |
| German | 143 | 29.4% |
| Irish | 51 | 10.5% |
| Mexican | 2 | 0.4% |
| Norwegian | 6 | 1.2% |
| Polish | 3 | 0.6% |
| Russian | 3 | 0.6% |
| Scotch-Irish | 3 | 0.6% |
| Scottish | 1 | 0.2% |
| Swedish | 4 | 0.8% |
| Syrian | 4 | 0.8% |
| Welsh | 2 | 0.4% | View All 23 Rows |
Immigrants in Sargent

| Immigration Origin | # Population | % Population | View All 0 Rows |
Sex and Age in Sargent
Sex and Age in Sargent
The most populous age groups in Sargent are 45 to 49 Years (35 | 14.8%) for men and 60 to 64 Years (41 | 16.5%) for women.
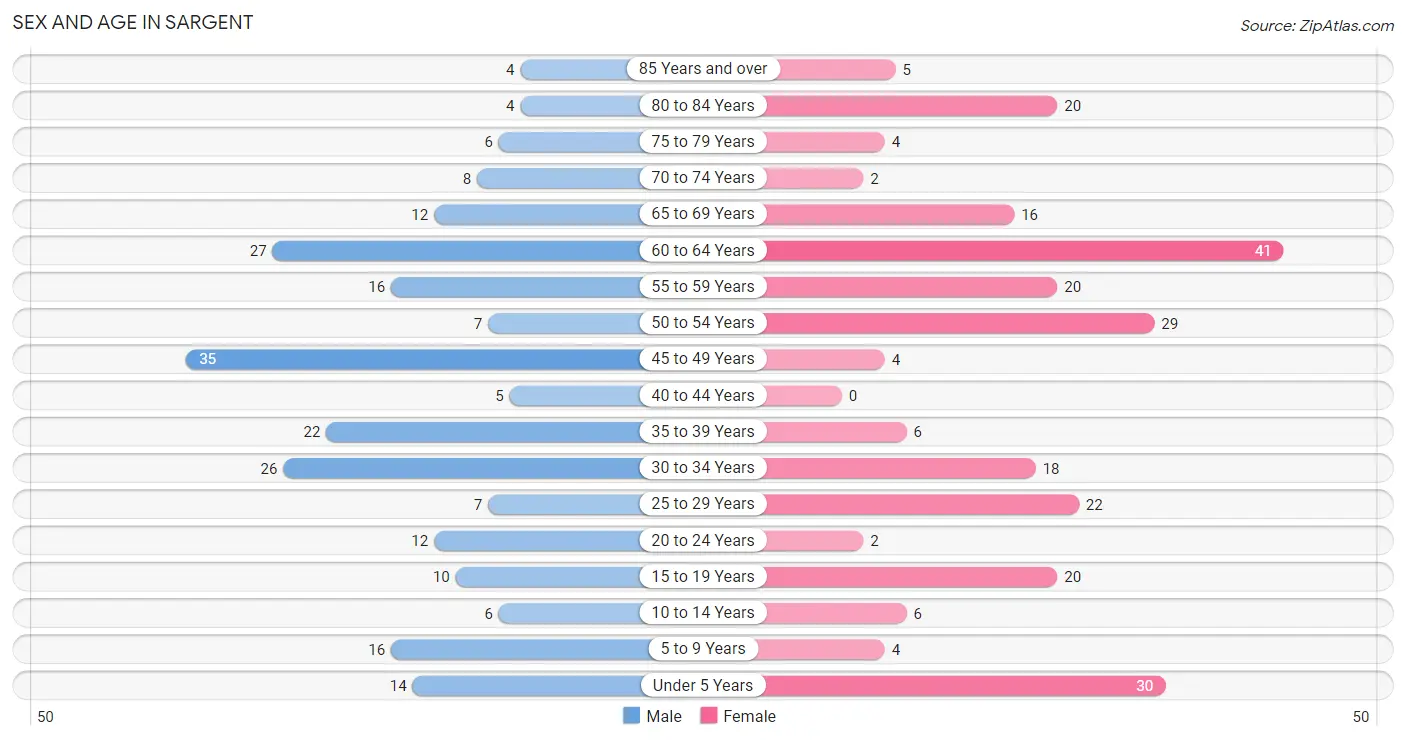
| Age Bracket | Male | Female |
| Under 5 Years | 14 (5.9%) | 30 (12.0%) |
| 5 to 9 Years | 16 (6.8%) | 4 (1.6%) |
| 10 to 14 Years | 6 (2.5%) | 6 (2.4%) |
| 15 to 19 Years | 10 (4.2%) | 20 (8.0%) |
| 20 to 24 Years | 12 (5.1%) | 2 (0.8%) |
| 25 to 29 Years | 7 (2.9%) | 22 (8.8%) |
| 30 to 34 Years | 26 (11.0%) | 18 (7.2%) |
| 35 to 39 Years | 22 (9.3%) | 6 (2.4%) |
| 40 to 44 Years | 5 (2.1%) | 0 (0.0%) |
| 45 to 49 Years | 35 (14.8%) | 4 (1.6%) |
| 50 to 54 Years | 7 (2.9%) | 29 (11.7%) |
| 55 to 59 Years | 16 (6.8%) | 20 (8.0%) |
| 60 to 64 Years | 27 (11.4%) | 41 (16.5%) |
| 65 to 69 Years | 12 (5.1%) | 16 (6.4%) |
| 70 to 74 Years | 8 (3.4%) | 2 (0.8%) |
| 75 to 79 Years | 6 (2.5%) | 4 (1.6%) |
| 80 to 84 Years | 4 (1.7%) | 20 (8.0%) |
| 85 Years and over | 4 (1.7%) | 5 (2.0%) |
| Total | 237 (100.0%) | 249 (100.0%) |
Families and Households in Sargent
Median Family Size in Sargent
The median family size in Sargent is 2.79 persons per family, with married-couple families (98 | 74.8%) accounting for the largest median family size of 3.1 persons per family. On the other hand, single male/father families (14 | 10.7%) represent the smallest median family size with 1.86 persons per family.
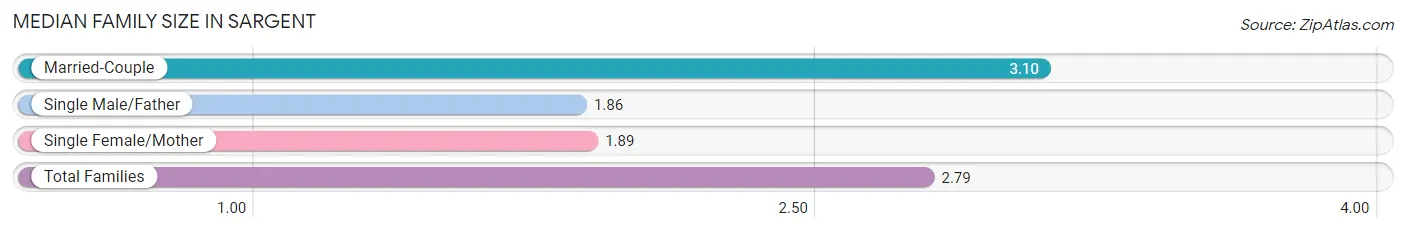
| Family Type | # Families | Family Size |
| Married-Couple | 98 (74.8%) | 3.10 |
| Single Male/Father | 14 (10.7%) | 1.86 |
| Single Female/Mother | 19 (14.5%) | 1.89 |
| Total Families | 131 (100.0%) | 2.79 |
Median Household Size in Sargent
The median household size in Sargent is 2.34 persons per household, with single female/mother households (19 | 9.1%) accounting for the largest median household size of 3.16 persons per household. non-family households (77 | 37.0%) represent the smallest median household size with 1.10 persons per household.
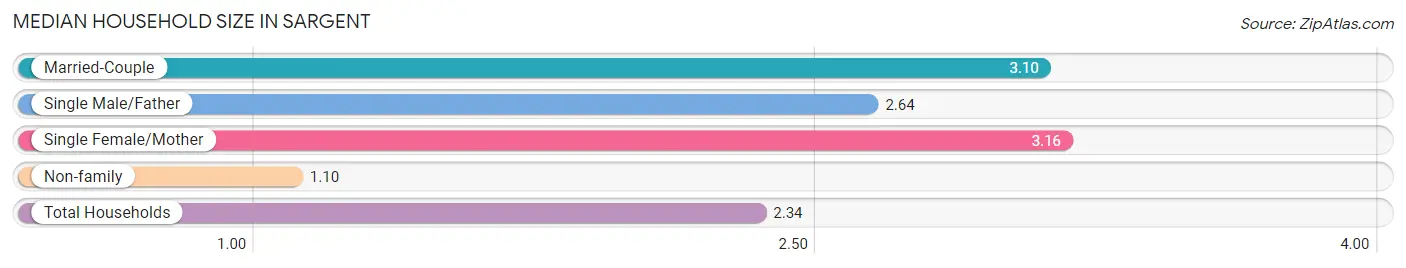
| Household Type | # Households | Household Size |
| Married-Couple | 98 (47.1%) | 3.10 |
| Single Male/Father | 14 (6.7%) | 2.64 |
| Single Female/Mother | 19 (9.1%) | 3.16 |
| Non-family | 77 (37.0%) | 1.10 |
| Total Households | 208 (100.0%) | 2.34 |
Household Size by Marriage Status in Sargent
Out of a total of 208 households in Sargent, 131 (63.0%) are family households, while 77 (37.0%) are nonfamily households. The most numerous type of family households are 2-person households, comprising 62, and the most common type of nonfamily households are 1-person households, comprising 67.
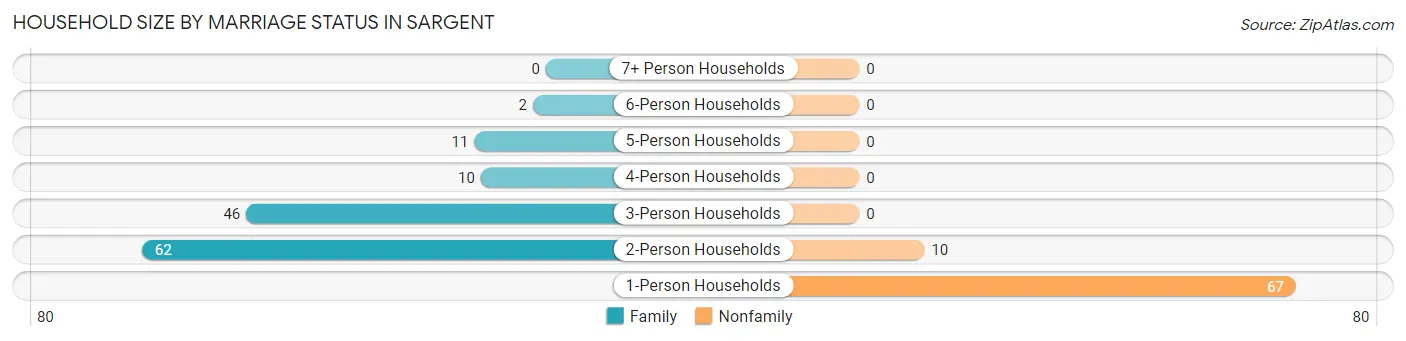
| Household Size | Family Households | Nonfamily Households |
| 1-Person Households | - | 67 (32.2%) |
| 2-Person Households | 62 (29.8%) | 10 (4.8%) |
| 3-Person Households | 46 (22.1%) | 0 (0.0%) |
| 4-Person Households | 10 (4.8%) | 0 (0.0%) |
| 5-Person Households | 11 (5.3%) | 0 (0.0%) |
| 6-Person Households | 2 (1.0%) | 0 (0.0%) |
| 7+ Person Households | 0 (0.0%) | 0 (0.0%) |
| Total | 131 (63.0%) | 77 (37.0%) |
Female Fertility in Sargent
Fertility by Age in Sargent
Average fertility rate in Sargent is 141.0 births per 1,000 women. Women in the age bracket of 20 to 34 years have the highest fertility rate with 310.0 births per 1,000 women. Women in the age bracket of 20 to 34 years acount for 100.0% of all women with births.
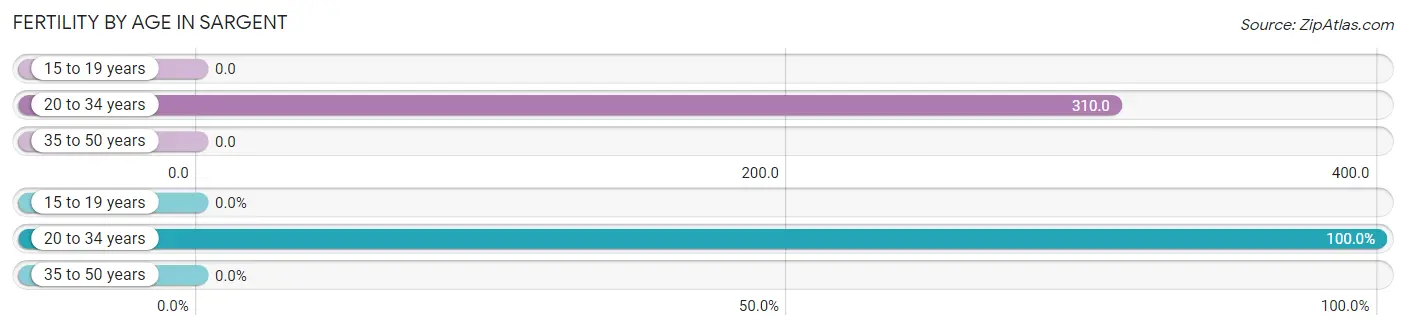
| Age Bracket | Women with Births | Births / 1,000 Women |
| 15 to 19 years | 0 (0.0%) | 0.0 |
| 20 to 34 years | 13 (100.0%) | 310.0 |
| 35 to 50 years | 0 (0.0%) | 0.0 |
| Total | 13 (100.0%) | 141.0 |
Fertility by Age by Marriage Status in Sargent
30.8% of women with births (13) in Sargent are married. The highest percentage of unmarried women with births falls into 20 to 34 years age bracket with 69.2% of them unmarried at the time of birth, while the lowest percentage of unmarried women with births belong to 20 to 34 years age bracket with 69.2% of them unmarried.
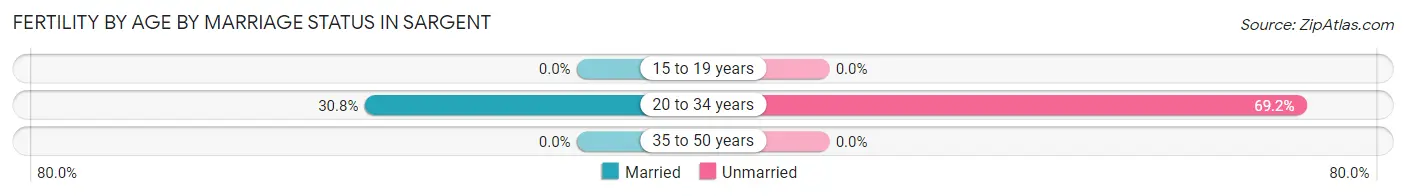
| Age Bracket | Married | Unmarried |
| 15 to 19 years | 0 (0.0%) | 0 (0.0%) |
| 20 to 34 years | 4 (30.8%) | 9 (69.2%) |
| 35 to 50 years | 0 (0.0%) | 0 (0.0%) |
| Total | 4 (30.8%) | 9 (69.2%) |
Fertility by Education in Sargent
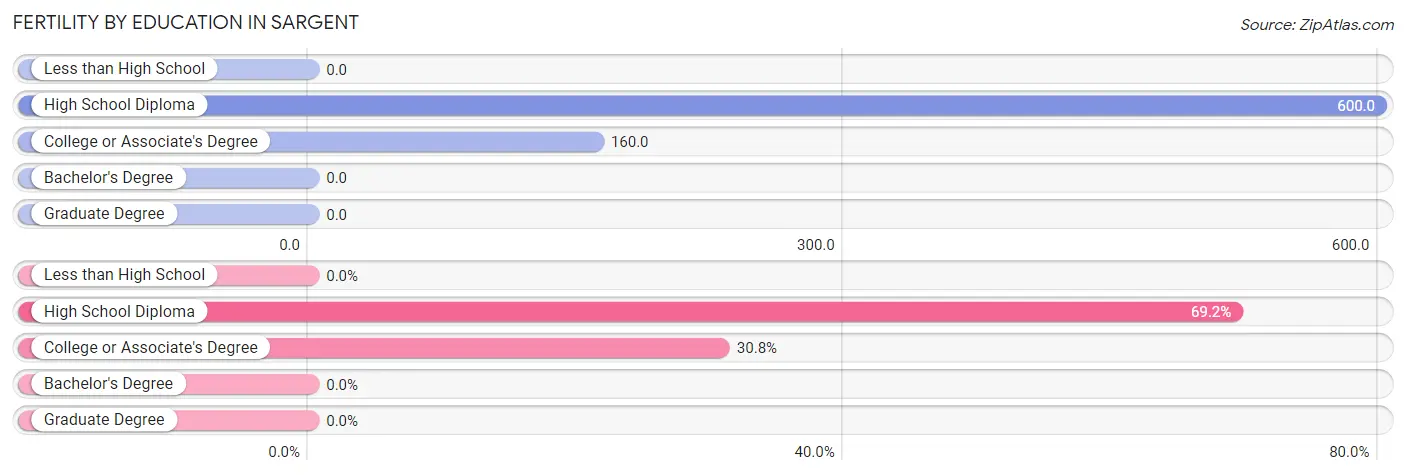
| Educational Attainment | Women with Births | Births / 1,000 Women |
| Less than High School | 0 (0.0%) | 0.0 |
| High School Diploma | 9 (69.2%) | 600.0 |
| College or Associate's Degree | 4 (30.8%) | 160.0 |
| Bachelor's Degree | 0 (0.0%) | 0.0 |
| Graduate Degree | 0 (0.0%) | 0.0 |
| Total | 13 (100.0%) | 141.0 |
Fertility by Education by Marriage Status in Sargent
69.2% of women with births in Sargent are unmarried. Women with the educational attainment of college or associate's degree are most likely to be married with 100.0% of them married at childbirth, while women with the educational attainment of high school diploma are least likely to be married with 100.0% of them unmarried at childbirth.
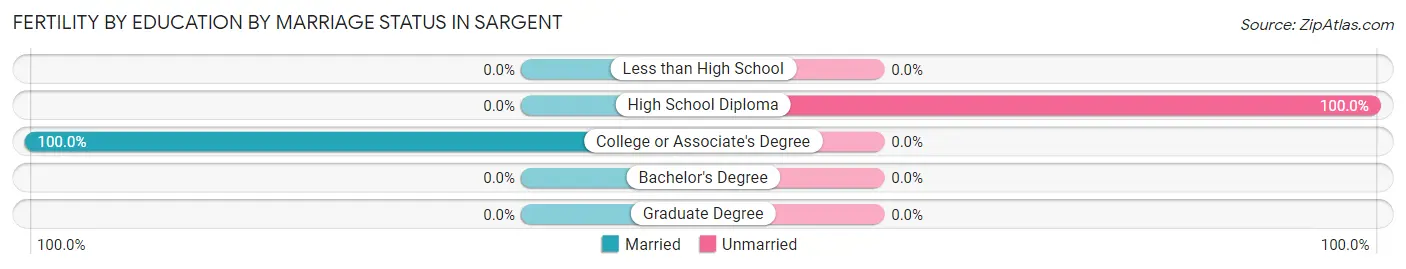
| Educational Attainment | Married | Unmarried |
| Less than High School | 0 (0.0%) | 0 (0.0%) |
| High School Diploma | 0 (0.0%) | 9 (100.0%) |
| College or Associate's Degree | 4 (100.0%) | 0 (0.0%) |
| Bachelor's Degree | 0 (0.0%) | 0 (0.0%) |
| Graduate Degree | 0 (0.0%) | 0 (0.0%) |
| Total | 4 (30.8%) | 9 (69.2%) |
Employment Characteristics in Sargent
Employment by Class of Employer in Sargent
Among the 231 employed individuals in Sargent, private company employees (162 | 70.1%), local government employees (31 | 13.4%), and not-for-profit organizations (18 | 7.8%) make up the most common classes of employment.
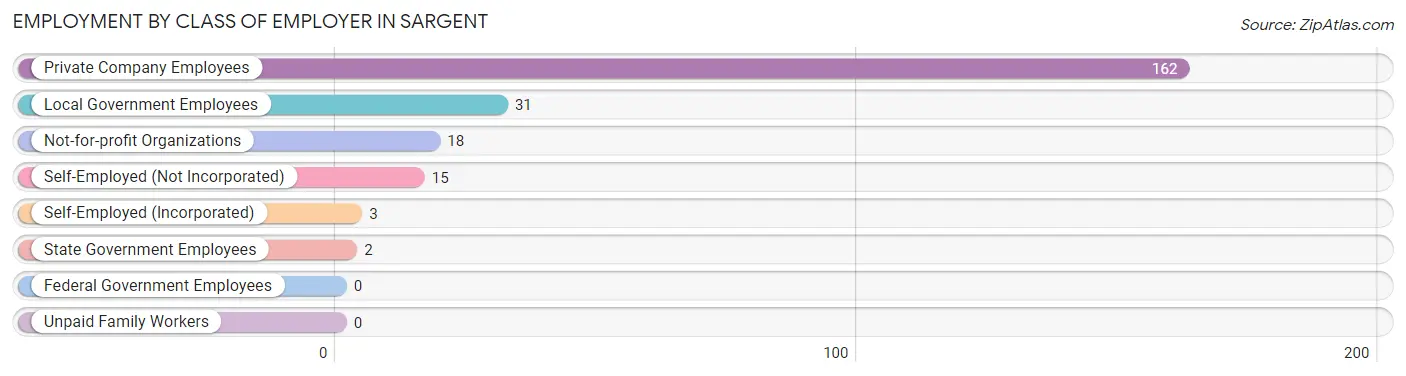
| Employer Class | # Employees | % Employees |
| Private Company Employees | 162 | 70.1% |
| Self-Employed (Incorporated) | 3 | 1.3% |
| Self-Employed (Not Incorporated) | 15 | 6.5% |
| Not-for-profit Organizations | 18 | 7.8% |
| Local Government Employees | 31 | 13.4% |
| State Government Employees | 2 | 0.9% |
| Federal Government Employees | 0 | 0.0% |
| Unpaid Family Workers | 0 | 0.0% |
| Total | 231 | 100.0% |
Employment Status by Age in Sargent
According to the labor force statistics for Sargent, out of the total population over 16 years of age (407), 63.4% or 258 individuals are in the labor force, with 1.6% or 4 of them unemployed. The age group with the highest labor force participation rate is 20 to 24 years, with 100.0% or 14 individuals in the labor force. Within the labor force, the 35 to 44 years age range has the highest percentage of unemployed individuals, with 12.1% or 4 of them being unemployed.
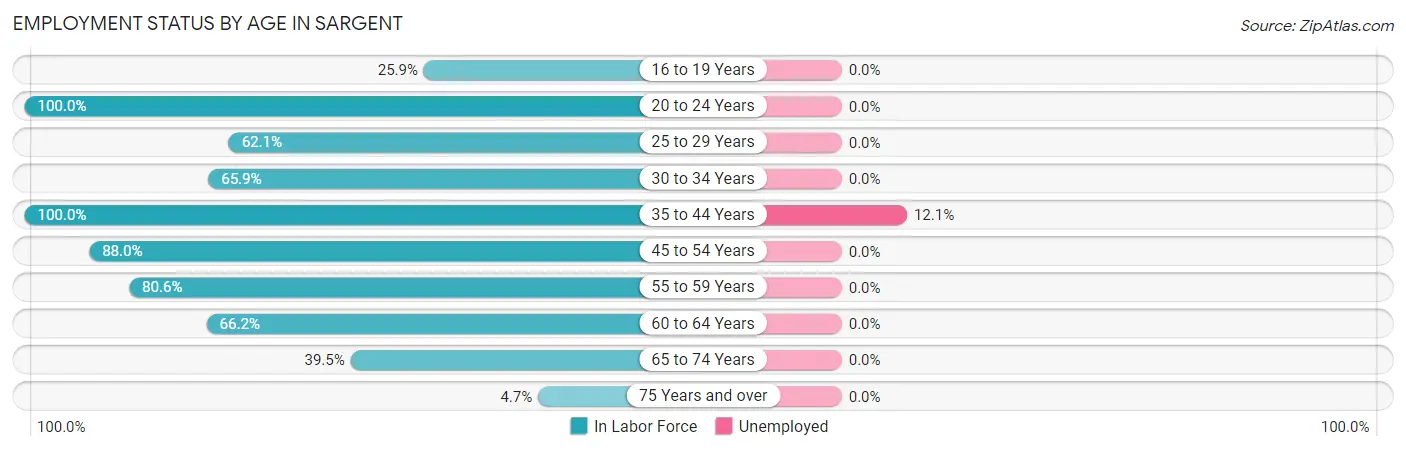
| Age Bracket | In Labor Force | Unemployed |
| 16 to 19 Years | 7 (25.9%) | 0 (0.0%) |
| 20 to 24 Years | 14 (100.0%) | 0 (0.0%) |
| 25 to 29 Years | 18 (62.1%) | 0 (0.0%) |
| 30 to 34 Years | 29 (65.9%) | 0 (0.0%) |
| 35 to 44 Years | 33 (100.0%) | 4 (12.1%) |
| 45 to 54 Years | 66 (88.0%) | 0 (0.0%) |
| 55 to 59 Years | 29 (80.6%) | 0 (0.0%) |
| 60 to 64 Years | 45 (66.2%) | 0 (0.0%) |
| 65 to 74 Years | 15 (39.5%) | 0 (0.0%) |
| 75 Years and over | 2 (4.7%) | 0 (0.0%) |
| Total | 258 (63.4%) | 4 (1.6%) |
Employment Status by Educational Attainment in Sargent
According to labor force statistics for Sargent, 77.2% of individuals (220) out of the total population between 25 and 64 years of age (285) are in the labor force, with 1.8% or 4 of them being unemployed. The group with the highest labor force participation rate are those with the educational attainment of bachelor's degree or higher, with 91.9% or 57 individuals in the labor force. Within the labor force, individuals with high school diploma education have the highest percentage of unemployment, with 5.1% or 4 of them being unemployed.
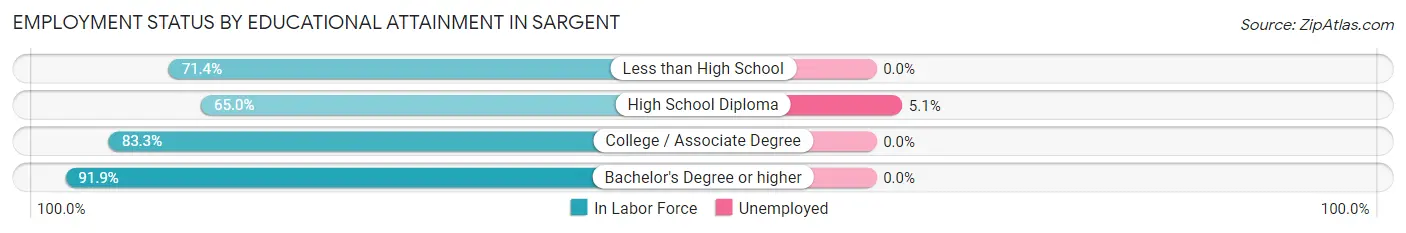
| Educational Attainment | In Labor Force | Unemployed |
| Less than High School | 5 (71.4%) | 0 (0.0%) |
| High School Diploma | 78 (65.0%) | 6 (5.1%) |
| College / Associate Degree | 80 (83.3%) | 0 (0.0%) |
| Bachelor's Degree or higher | 57 (91.9%) | 0 (0.0%) |
| Total | 220 (77.2%) | 5 (1.8%) |
Employment Occupations by Sex in Sargent
Management, Business, Science and Arts Occupations
The most common Management, Business, Science and Arts occupations in Sargent are Management (39 | 15.3%), Community & Social Service (19 | 7.5%), Education Instruction & Library (16 | 6.3%), Computers, Engineering & Science (3 | 1.2%), and Life, Physical & Social Science (3 | 1.2%).
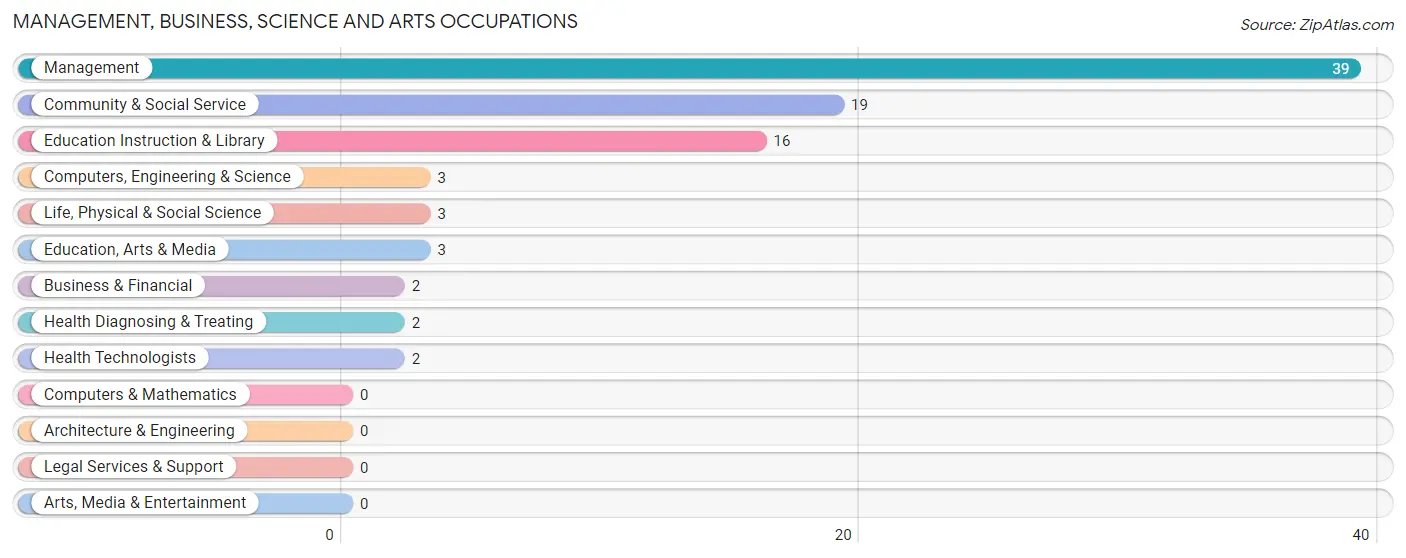
Management, Business, Science and Arts Occupations by Sex
Within the Management, Business, Science and Arts occupations in Sargent, the most male-oriented occupations are Management (69.2%), Education Instruction & Library (56.2%), and Community & Social Service (47.4%), while the most female-oriented occupations are Business & Financial (100.0%), Computers, Engineering & Science (100.0%), and Life, Physical & Social Science (100.0%).
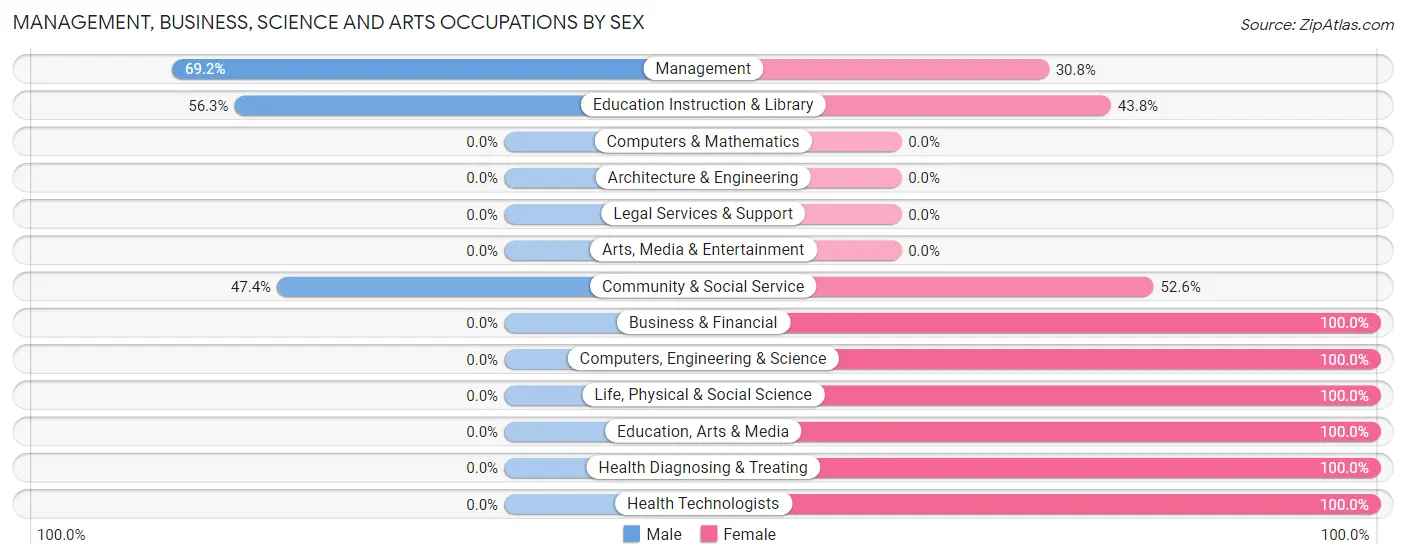
| Occupation | Male | Female |
| Management | 27 (69.2%) | 12 (30.8%) |
| Business & Financial | 0 (0.0%) | 2 (100.0%) |
| Computers, Engineering & Science | 0 (0.0%) | 3 (100.0%) |
| Computers & Mathematics | 0 (0.0%) | 0 (0.0%) |
| Architecture & Engineering | 0 (0.0%) | 0 (0.0%) |
| Life, Physical & Social Science | 0 (0.0%) | 3 (100.0%) |
| Community & Social Service | 9 (47.4%) | 10 (52.6%) |
| Education, Arts & Media | 0 (0.0%) | 3 (100.0%) |
| Legal Services & Support | 0 (0.0%) | 0 (0.0%) |
| Education Instruction & Library | 9 (56.2%) | 7 (43.8%) |
| Arts, Media & Entertainment | 0 (0.0%) | 0 (0.0%) |
| Health Diagnosing & Treating | 0 (0.0%) | 2 (100.0%) |
| Health Technologists | 0 (0.0%) | 2 (100.0%) |
| Total (Category) | 36 (55.4%) | 29 (44.6%) |
| Total (Overall) | 141 (55.5%) | 113 (44.5%) |
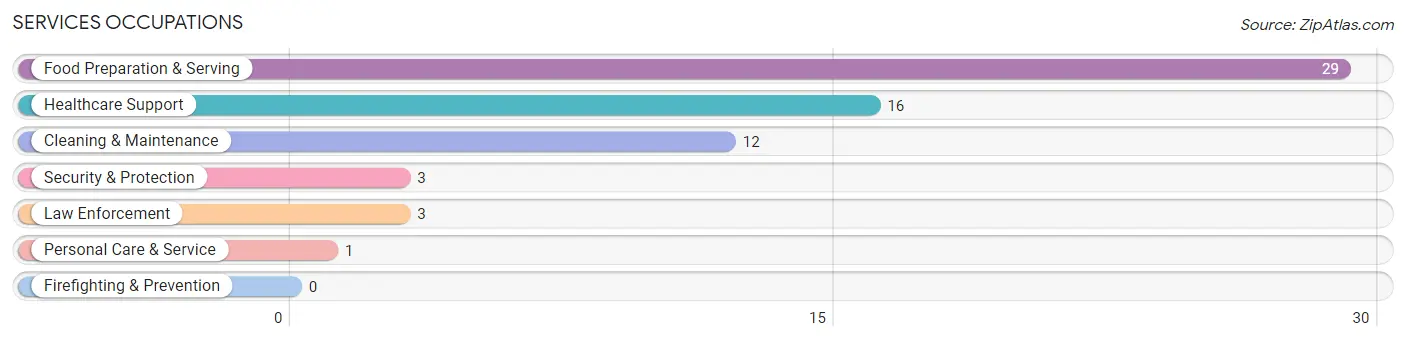
Services Occupations
The most common Services occupations in Sargent are Food Preparation & Serving (29 | 11.4%), Healthcare Support (16 | 6.3%), Cleaning & Maintenance (12 | 4.7%), Security & Protection (3 | 1.2%), and Law Enforcement (3 | 1.2%).
Services Occupations by Sex
Within the Services occupations in Sargent, the most male-oriented occupations are Security & Protection (100.0%), Law Enforcement (100.0%), and Cleaning & Maintenance (58.3%), while the most female-oriented occupations are Healthcare Support (100.0%), Personal Care & Service (100.0%), and Food Preparation & Serving (48.3%).
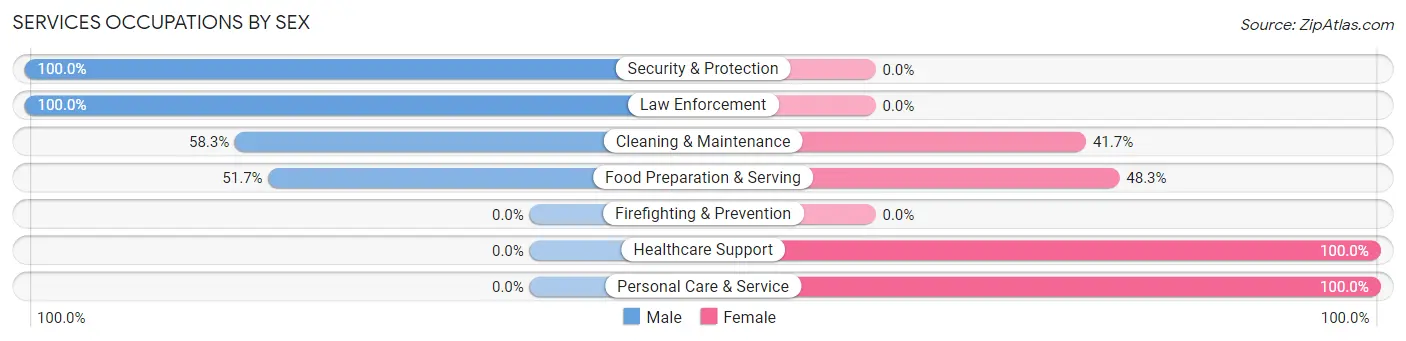
| Occupation | Male | Female |
| Healthcare Support | 0 (0.0%) | 16 (100.0%) |
| Security & Protection | 3 (100.0%) | 0 (0.0%) |
| Firefighting & Prevention | 0 (0.0%) | 0 (0.0%) |
| Law Enforcement | 3 (100.0%) | 0 (0.0%) |
| Food Preparation & Serving | 15 (51.7%) | 14 (48.3%) |
| Cleaning & Maintenance | 7 (58.3%) | 5 (41.7%) |
| Personal Care & Service | 0 (0.0%) | 1 (100.0%) |
| Total (Category) | 25 (41.0%) | 36 (59.0%) |
| Total (Overall) | 141 (55.5%) | 113 (44.5%) |
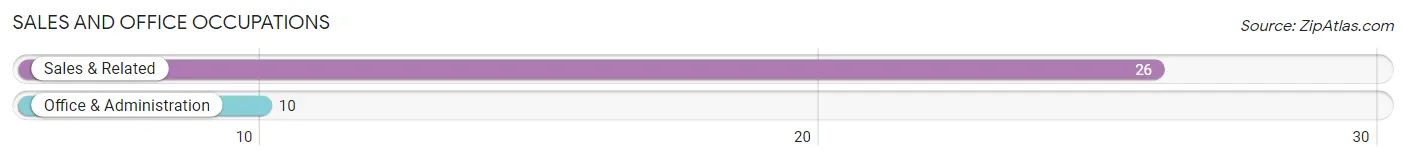
Sales and Office Occupations
The most common Sales and Office occupations in Sargent are Sales & Related (26 | 10.2%), and Office & Administration (10 | 3.9%).
Sales and Office Occupations by Sex
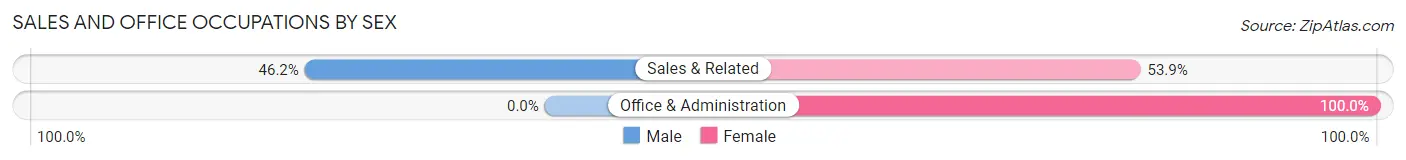
| Occupation | Male | Female |
| Sales & Related | 12 (46.2%) | 14 (53.8%) |
| Office & Administration | 0 (0.0%) | 10 (100.0%) |
| Total (Category) | 12 (33.3%) | 24 (66.7%) |
| Total (Overall) | 141 (55.5%) | 113 (44.5%) |
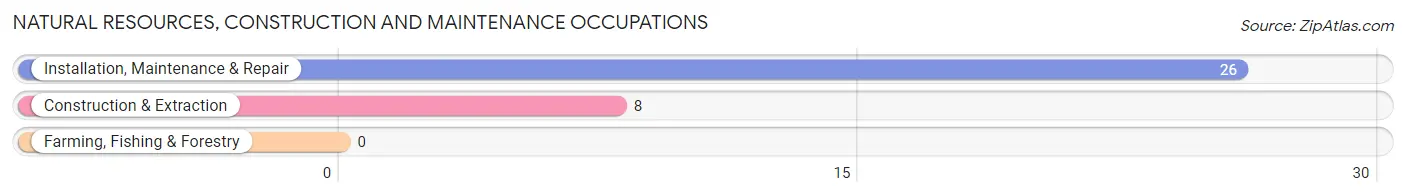
Natural Resources, Construction and Maintenance Occupations
The most common Natural Resources, Construction and Maintenance occupations in Sargent are Installation, Maintenance & Repair (26 | 10.2%), and Construction & Extraction (8 | 3.2%).
Natural Resources, Construction and Maintenance Occupations by Sex
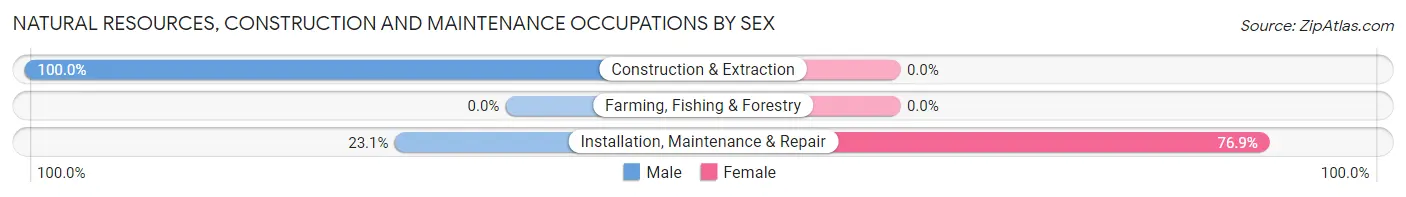
| Occupation | Male | Female |
| Farming, Fishing & Forestry | 0 (0.0%) | 0 (0.0%) |
| Construction & Extraction | 8 (100.0%) | 0 (0.0%) |
| Installation, Maintenance & Repair | 6 (23.1%) | 20 (76.9%) |
| Total (Category) | 14 (41.2%) | 20 (58.8%) |
| Total (Overall) | 141 (55.5%) | 113 (44.5%) |
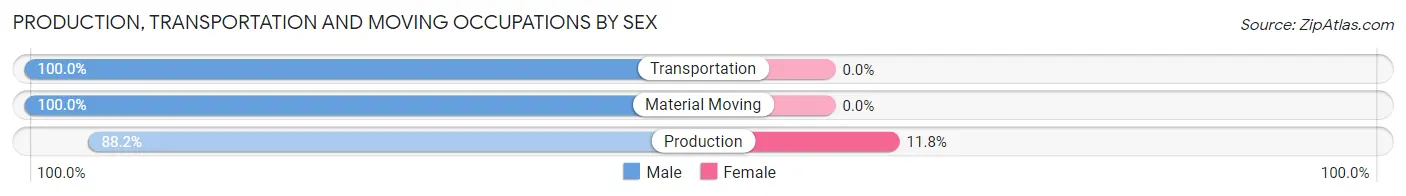
Production, Transportation and Moving Occupations
The most common Production, Transportation and Moving occupations in Sargent are Production (34 | 13.4%), Transportation (23 | 9.1%), and Material Moving (1 | 0.4%).
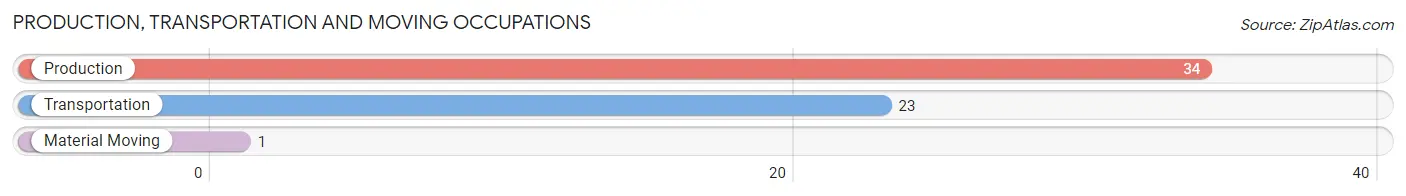
Production, Transportation and Moving Occupations by Sex
| Occupation | Male | Female |
| Production | 30 (88.2%) | 4 (11.8%) |
| Transportation | 23 (100.0%) | 0 (0.0%) |
| Material Moving | 1 (100.0%) | 0 (0.0%) |
| Total (Category) | 54 (93.1%) | 4 (6.9%) |
| Total (Overall) | 141 (55.5%) | 113 (44.5%) |
Employment Industries by Sex in Sargent
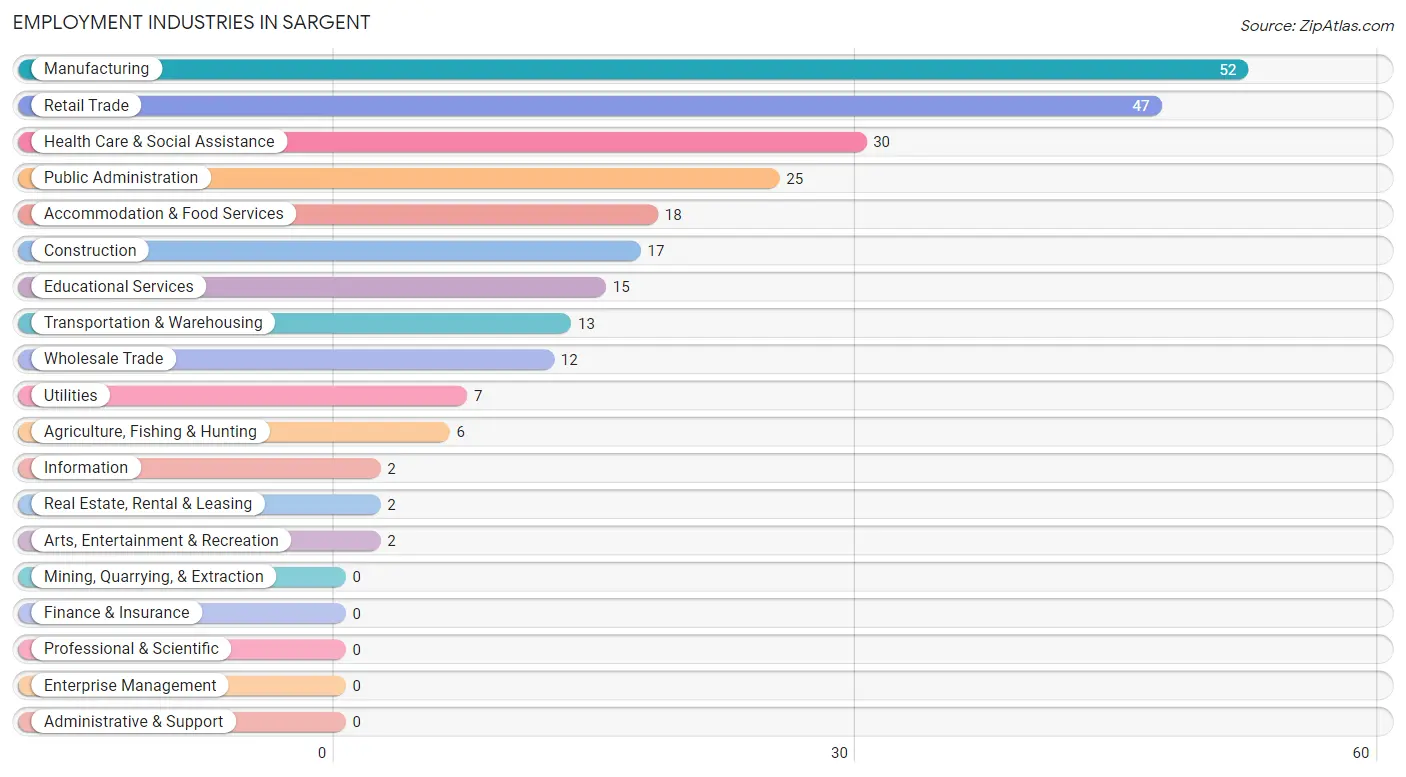
Employment Industries in Sargent
The major employment industries in Sargent include Manufacturing (52 | 20.5%), Retail Trade (47 | 18.5%), Health Care & Social Assistance (30 | 11.8%), Public Administration (25 | 9.8%), and Accommodation & Food Services (18 | 7.1%).
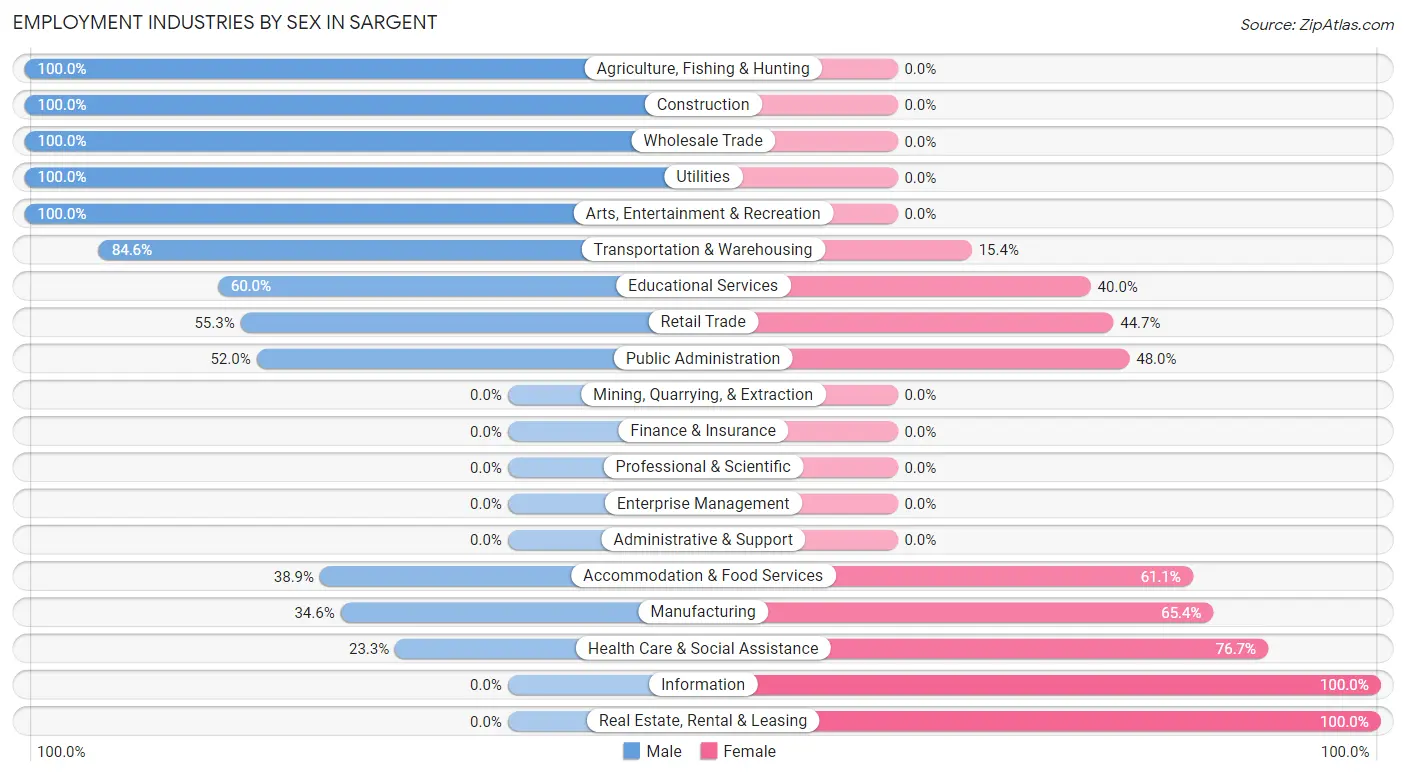
Employment Industries by Sex in Sargent
The Sargent industries that see more men than women are Agriculture, Fishing & Hunting (100.0%), Construction (100.0%), and Wholesale Trade (100.0%), whereas the industries that tend to have a higher number of women are Information (100.0%), Real Estate, Rental & Leasing (100.0%), and Health Care & Social Assistance (76.7%).
| Industry | Male | Female |
| Agriculture, Fishing & Hunting | 6 (100.0%) | 0 (0.0%) |
| Mining, Quarrying, & Extraction | 0 (0.0%) | 0 (0.0%) |
| Construction | 17 (100.0%) | 0 (0.0%) |
| Manufacturing | 18 (34.6%) | 34 (65.4%) |
| Wholesale Trade | 12 (100.0%) | 0 (0.0%) |
| Retail Trade | 26 (55.3%) | 21 (44.7%) |
| Transportation & Warehousing | 11 (84.6%) | 2 (15.4%) |
| Utilities | 7 (100.0%) | 0 (0.0%) |
| Information | 0 (0.0%) | 2 (100.0%) |
| Finance & Insurance | 0 (0.0%) | 0 (0.0%) |
| Real Estate, Rental & Leasing | 0 (0.0%) | 2 (100.0%) |
| Professional & Scientific | 0 (0.0%) | 0 (0.0%) |
| Enterprise Management | 0 (0.0%) | 0 (0.0%) |
| Administrative & Support | 0 (0.0%) | 0 (0.0%) |
| Educational Services | 9 (60.0%) | 6 (40.0%) |
| Health Care & Social Assistance | 7 (23.3%) | 23 (76.7%) |
| Arts, Entertainment & Recreation | 2 (100.0%) | 0 (0.0%) |
| Accommodation & Food Services | 7 (38.9%) | 11 (61.1%) |
| Public Administration | 13 (52.0%) | 12 (48.0%) |
| Total | 141 (55.5%) | 113 (44.5%) |
Education in Sargent
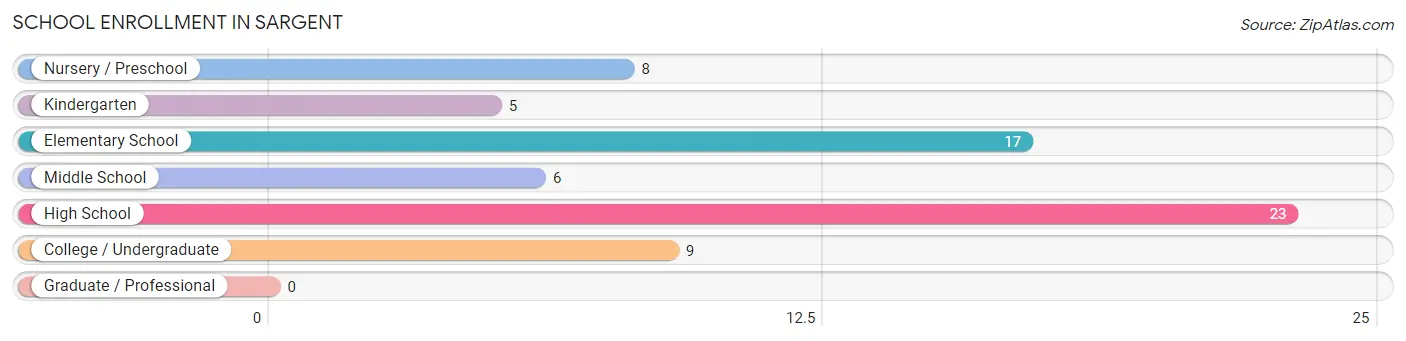
School Enrollment in Sargent
The most common levels of schooling among the 68 students in Sargent are high school (23 | 33.8%), elementary school (17 | 25.0%), and college / undergraduate (9 | 13.2%).
| School Level | # Students | % Students |
| Nursery / Preschool | 8 | 11.8% |
| Kindergarten | 5 | 7.3% |
| Elementary School | 17 | 25.0% |
| Middle School | 6 | 8.8% |
| High School | 23 | 33.8% |
| College / Undergraduate | 9 | 13.2% |
| Graduate / Professional | 0 | 0.0% |
| Total | 68 | 100.0% |
School Enrollment by Age by Funding Source in Sargent
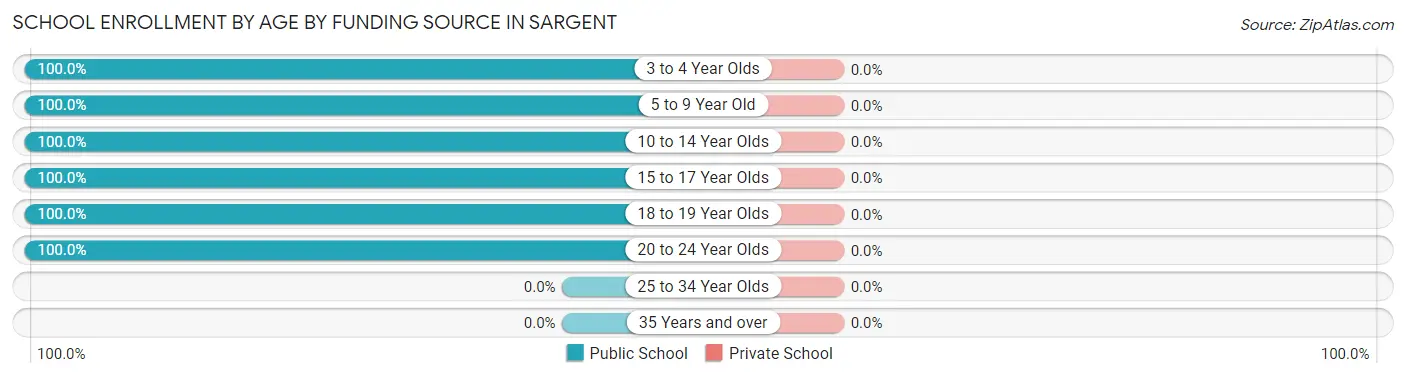
| Age Bracket | Public School | Private School |
| 3 to 4 Year Olds | 7 (100.0%) | 0 (0.0%) |
| 5 to 9 Year Old | 20 (100.0%) | 0 (0.0%) |
| 10 to 14 Year Olds | 9 (100.0%) | 0 (0.0%) |
| 15 to 17 Year Olds | 7 (100.0%) | 0 (0.0%) |
| 18 to 19 Year Olds | 16 (100.0%) | 0 (0.0%) |
| 20 to 24 Year Olds | 9 (100.0%) | 0 (0.0%) |
| 25 to 34 Year Olds | 0 (0.0%) | 0 (0.0%) |
| 35 Years and over | 0 (0.0%) | 0 (0.0%) |
| Total | 68 (100.0%) | 0 (0.0%) |
Educational Attainment by Field of Study in Sargent
Bio, nature & agricultural (24 | 33.8%), education (22 | 31.0%), science & technology (10 | 14.1%), business (5 | 7.0%), and physical & health sciences (4 | 5.6%) are the most common fields of study among 71 individuals in Sargent who have obtained a bachelor's degree or higher.
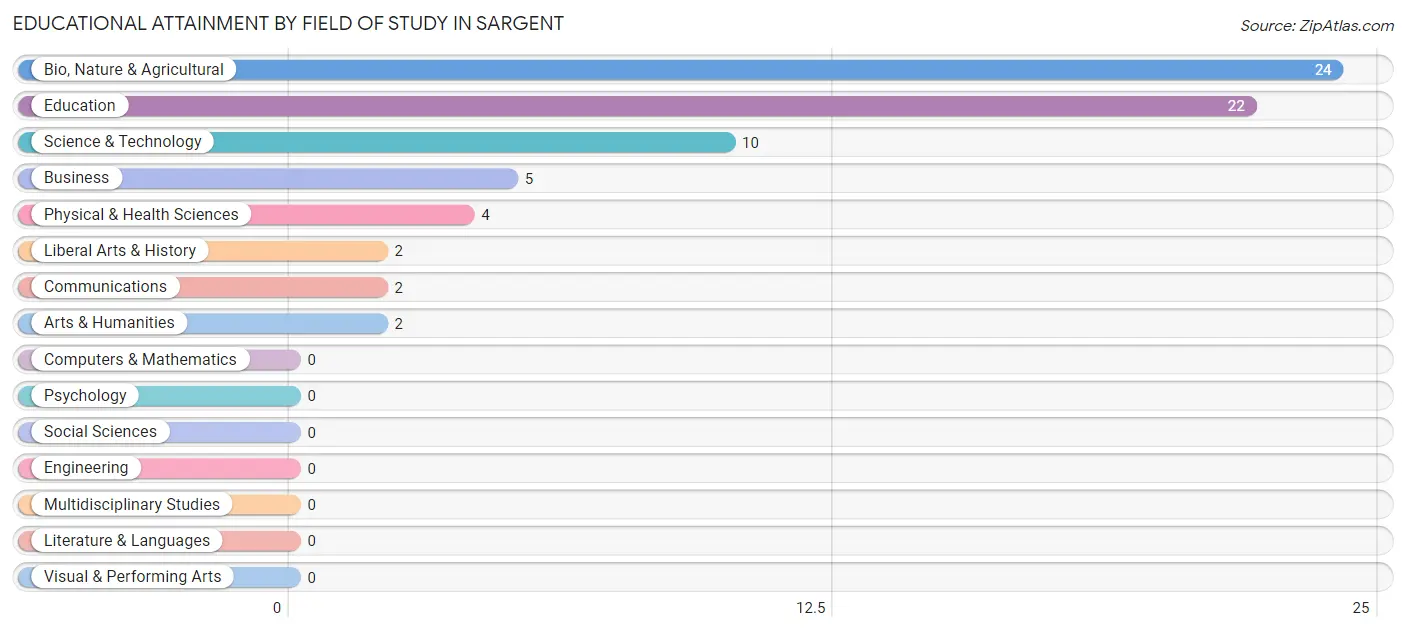
| Field of Study | # Graduates | % Graduates |
| Computers & Mathematics | 0 | 0.0% |
| Bio, Nature & Agricultural | 24 | 33.8% |
| Physical & Health Sciences | 4 | 5.6% |
| Psychology | 0 | 0.0% |
| Social Sciences | 0 | 0.0% |
| Engineering | 0 | 0.0% |
| Multidisciplinary Studies | 0 | 0.0% |
| Science & Technology | 10 | 14.1% |
| Business | 5 | 7.0% |
| Education | 22 | 31.0% |
| Literature & Languages | 0 | 0.0% |
| Liberal Arts & History | 2 | 2.8% |
| Visual & Performing Arts | 0 | 0.0% |
| Communications | 2 | 2.8% |
| Arts & Humanities | 2 | 2.8% |
| Total | 71 | 100.0% |
Transportation & Commute in Sargent
Vehicle Availability by Sex in Sargent
The most prevalent vehicle ownership categories in Sargent are males with 3 vehicles (66, accounting for 53.7%) and females with 3 vehicles (50, making up 61.1%).
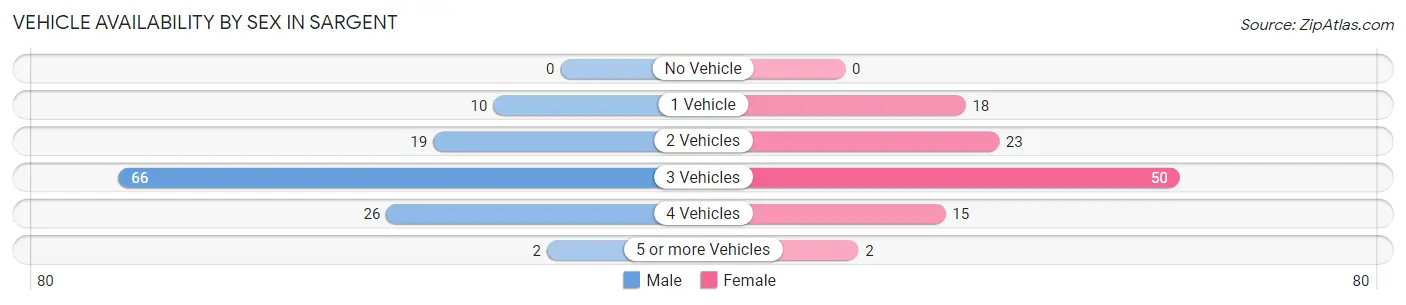
| Vehicles Available | Male | Female |
| No Vehicle | 0 (0.0%) | 0 (0.0%) |
| 1 Vehicle | 10 (8.1%) | 18 (16.7%) |
| 2 Vehicles | 19 (15.4%) | 23 (21.3%) |
| 3 Vehicles | 66 (53.7%) | 50 (46.3%) |
| 4 Vehicles | 26 (21.1%) | 15 (13.9%) |
| 5 or more Vehicles | 2 (1.6%) | 2 (1.8%) |
| Total | 123 (100.0%) | 108 (100.0%) |
Commute Time in Sargent
The most frequently occuring commute durations in Sargent are 30 to 34 minutes (75 commuters, 32.6%), 5 to 9 minutes (70 commuters, 30.4%), and less than 5 minutes (42 commuters, 18.3%).
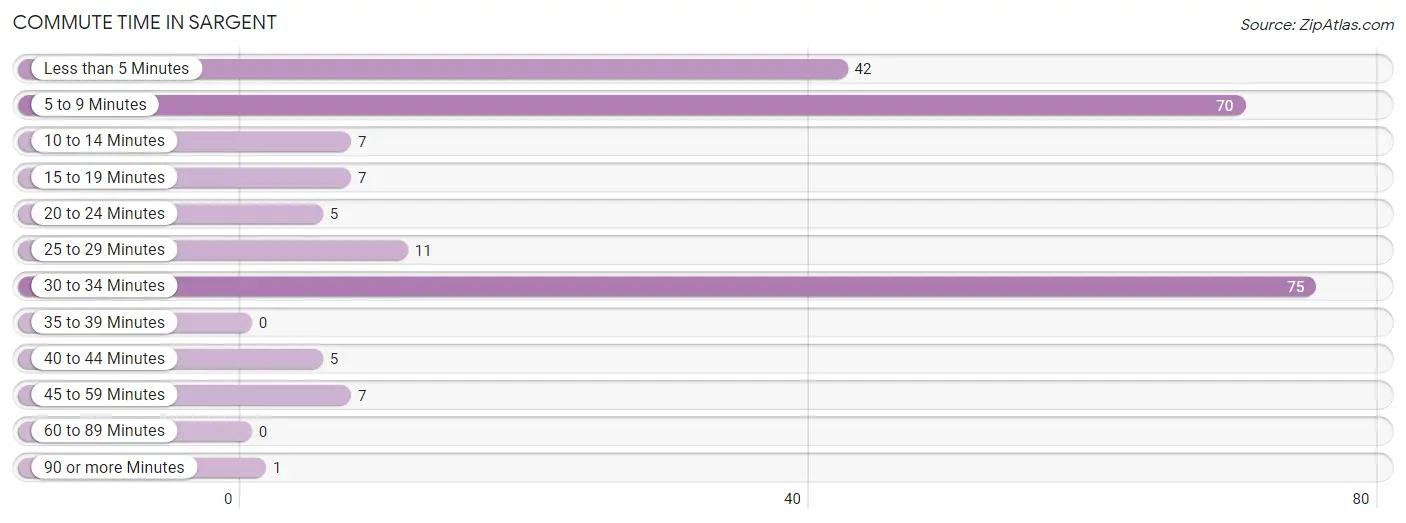
| Commute Time | # Commuters | % Commuters |
| Less than 5 Minutes | 42 | 18.3% |
| 5 to 9 Minutes | 70 | 30.4% |
| 10 to 14 Minutes | 7 | 3.0% |
| 15 to 19 Minutes | 7 | 3.0% |
| 20 to 24 Minutes | 5 | 2.2% |
| 25 to 29 Minutes | 11 | 4.8% |
| 30 to 34 Minutes | 75 | 32.6% |
| 35 to 39 Minutes | 0 | 0.0% |
| 40 to 44 Minutes | 5 | 2.2% |
| 45 to 59 Minutes | 7 | 3.0% |
| 60 to 89 Minutes | 0 | 0.0% |
| 90 or more Minutes | 1 | 0.4% |
Commute Time by Sex in Sargent
The most common commute times in Sargent are less than 5 minutes (34 commuters, 27.6%) for males and 30 to 34 minutes (47 commuters, 43.9%) for females.
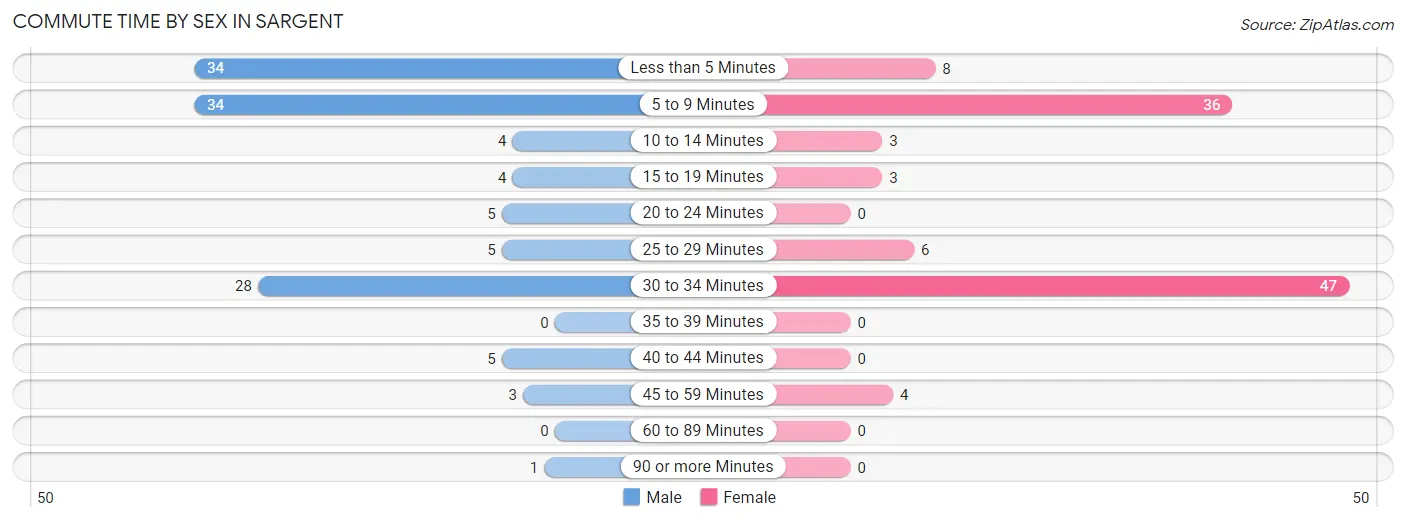
| Commute Time | Male | Female |
| Less than 5 Minutes | 34 (27.6%) | 8 (7.5%) |
| 5 to 9 Minutes | 34 (27.6%) | 36 (33.6%) |
| 10 to 14 Minutes | 4 (3.3%) | 3 (2.8%) |
| 15 to 19 Minutes | 4 (3.3%) | 3 (2.8%) |
| 20 to 24 Minutes | 5 (4.1%) | 0 (0.0%) |
| 25 to 29 Minutes | 5 (4.1%) | 6 (5.6%) |
| 30 to 34 Minutes | 28 (22.8%) | 47 (43.9%) |
| 35 to 39 Minutes | 0 (0.0%) | 0 (0.0%) |
| 40 to 44 Minutes | 5 (4.1%) | 0 (0.0%) |
| 45 to 59 Minutes | 3 (2.4%) | 4 (3.7%) |
| 60 to 89 Minutes | 0 (0.0%) | 0 (0.0%) |
| 90 or more Minutes | 1 (0.8%) | 0 (0.0%) |
Time of Departure to Work by Sex in Sargent
The most frequent times of departure to work in Sargent are 6:00 AM to 6:29 AM (24, 19.5%) for males and 6:00 AM to 6:29 AM (30, 28.0%) for females.
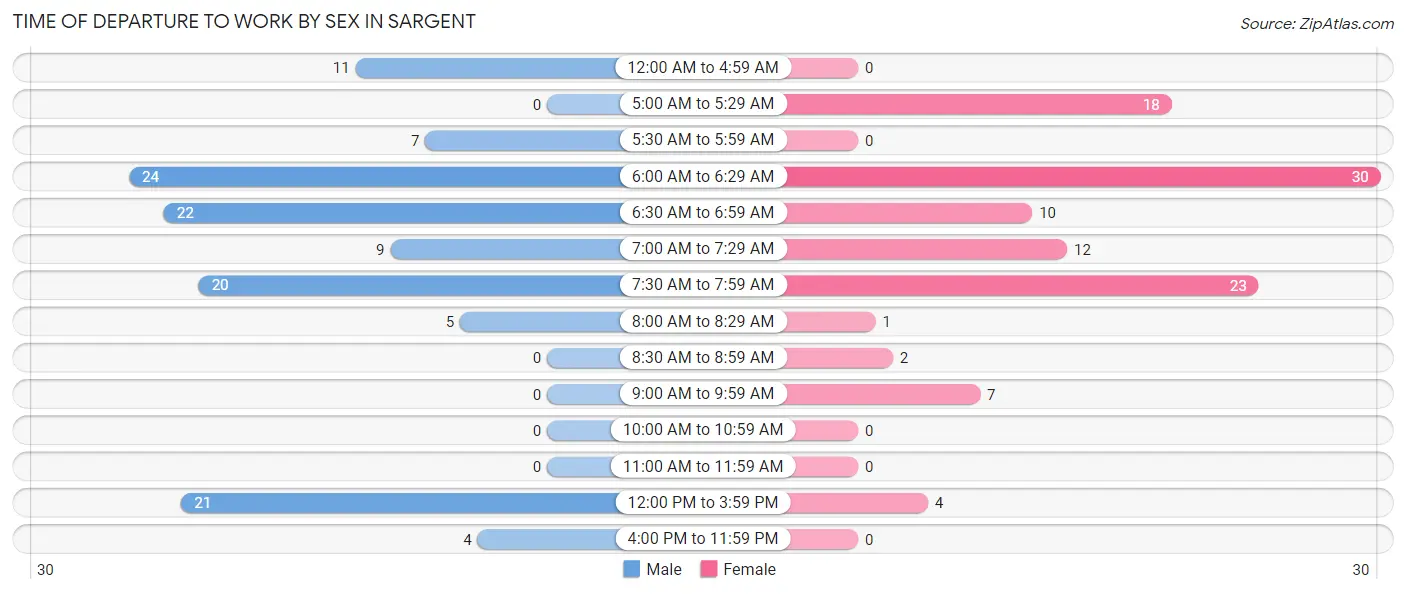
| Time of Departure | Male | Female |
| 12:00 AM to 4:59 AM | 11 (8.9%) | 0 (0.0%) |
| 5:00 AM to 5:29 AM | 0 (0.0%) | 18 (16.8%) |
| 5:30 AM to 5:59 AM | 7 (5.7%) | 0 (0.0%) |
| 6:00 AM to 6:29 AM | 24 (19.5%) | 30 (28.0%) |
| 6:30 AM to 6:59 AM | 22 (17.9%) | 10 (9.3%) |
| 7:00 AM to 7:29 AM | 9 (7.3%) | 12 (11.2%) |
| 7:30 AM to 7:59 AM | 20 (16.3%) | 23 (21.5%) |
| 8:00 AM to 8:29 AM | 5 (4.1%) | 1 (0.9%) |
| 8:30 AM to 8:59 AM | 0 (0.0%) | 2 (1.9%) |
| 9:00 AM to 9:59 AM | 0 (0.0%) | 7 (6.5%) |
| 10:00 AM to 10:59 AM | 0 (0.0%) | 0 (0.0%) |
| 11:00 AM to 11:59 AM | 0 (0.0%) | 0 (0.0%) |
| 12:00 PM to 3:59 PM | 21 (17.1%) | 4 (3.7%) |
| 4:00 PM to 11:59 PM | 4 (3.3%) | 0 (0.0%) |
| Total | 123 (100.0%) | 107 (100.0%) |
Housing Occupancy in Sargent
Occupancy by Ownership in Sargent
Of the total 208 dwellings in Sargent, owner-occupied units account for 151 (72.6%), while renter-occupied units make up 57 (27.4%).
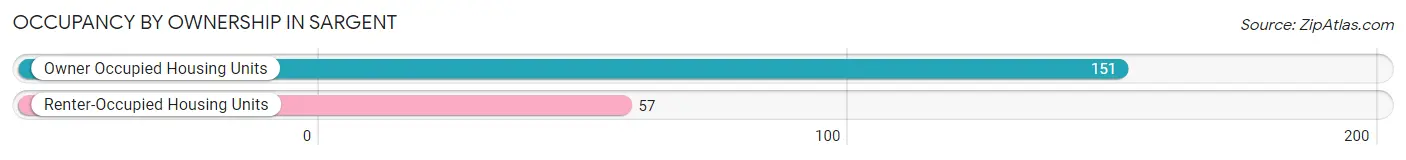
| Occupancy | # Housing Units | % Housing Units |
| Owner Occupied Housing Units | 151 | 72.6% |
| Renter-Occupied Housing Units | 57 | 27.4% |
| Total Occupied Housing Units | 208 | 100.0% |
Occupancy by Household Size in Sargent
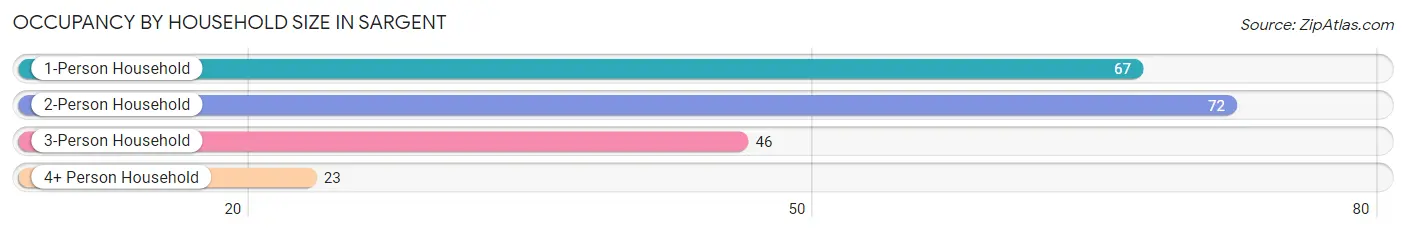
| Household Size | # Housing Units | % Housing Units |
| 1-Person Household | 67 | 32.2% |
| 2-Person Household | 72 | 34.6% |
| 3-Person Household | 46 | 22.1% |
| 4+ Person Household | 23 | 11.1% |
| Total Housing Units | 208 | 100.0% |
Occupancy by Ownership by Household Size in Sargent
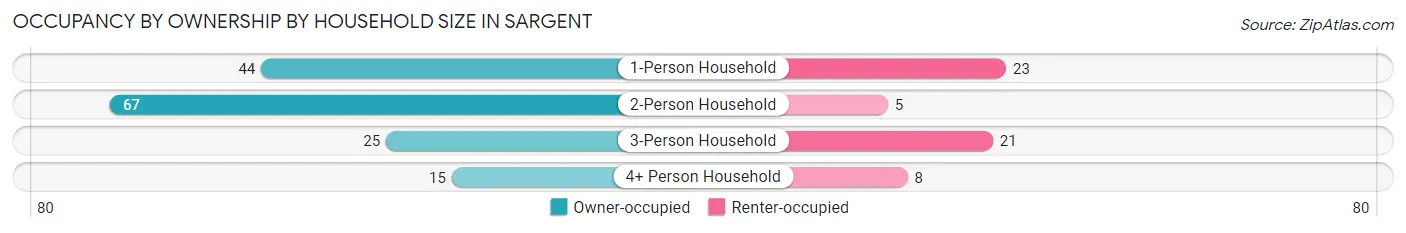
| Household Size | Owner-occupied | Renter-occupied |
| 1-Person Household | 44 (65.7%) | 23 (34.3%) |
| 2-Person Household | 67 (93.1%) | 5 (6.9%) |
| 3-Person Household | 25 (54.3%) | 21 (45.7%) |
| 4+ Person Household | 15 (65.2%) | 8 (34.8%) |
| Total Housing Units | 151 (72.6%) | 57 (27.4%) |
Occupancy by Educational Attainment in Sargent
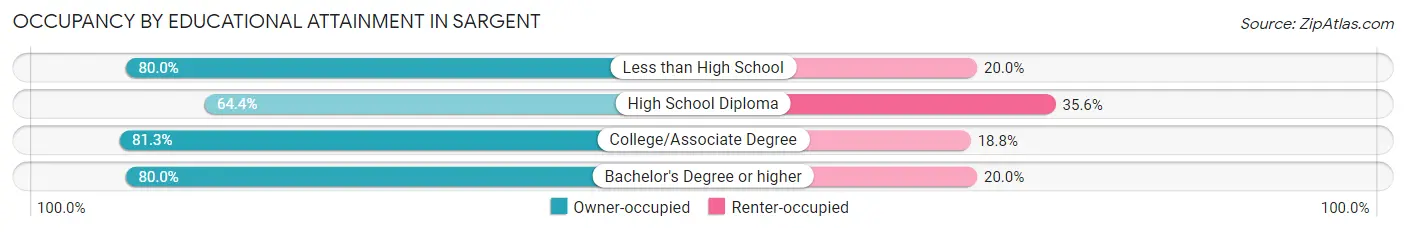
| Household Size | Owner-occupied | Renter-occupied |
| Less than High School | 8 (80.0%) | 2 (20.0%) |
| High School Diploma | 67 (64.4%) | 37 (35.6%) |
| College/Associate Degree | 52 (81.2%) | 12 (18.8%) |
| Bachelor's Degree or higher | 24 (80.0%) | 6 (20.0%) |
Occupancy by Age of Householder in Sargent
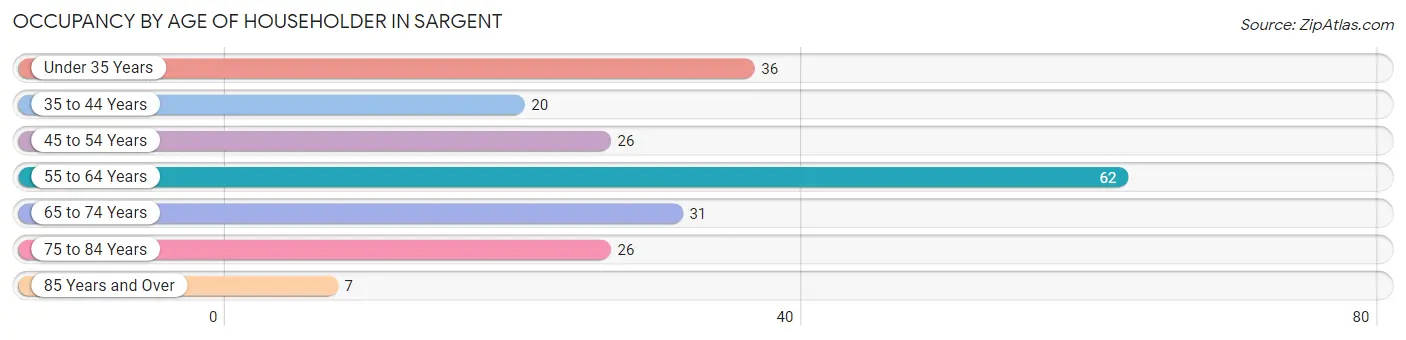
| Age Bracket | # Households | % Households |
| Under 35 Years | 36 | 17.3% |
| 35 to 44 Years | 20 | 9.6% |
| 45 to 54 Years | 26 | 12.5% |
| 55 to 64 Years | 62 | 29.8% |
| 65 to 74 Years | 31 | 14.9% |
| 75 to 84 Years | 26 | 12.5% |
| 85 Years and Over | 7 | 3.4% |
| Total | 208 | 100.0% |
Housing Finances in Sargent
Median Income by Occupancy in Sargent
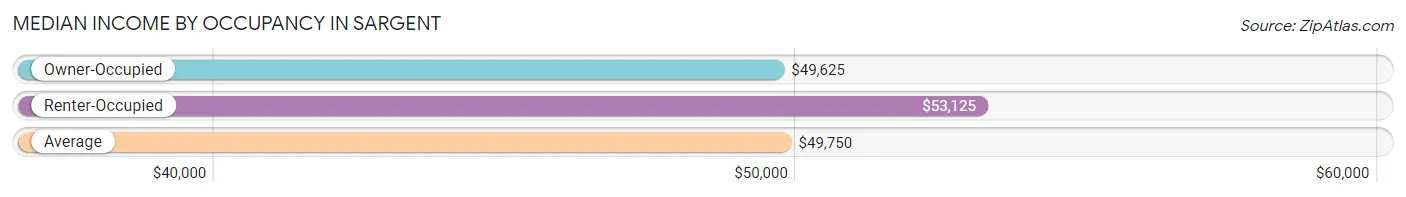
| Occupancy Type | # Households | Median Income |
| Owner-Occupied | 151 (72.6%) | $49,625 |
| Renter-Occupied | 57 (27.4%) | $53,125 |
| Average | 208 (100.0%) | $49,750 |
Occupancy by Householder Income Bracket in Sargent
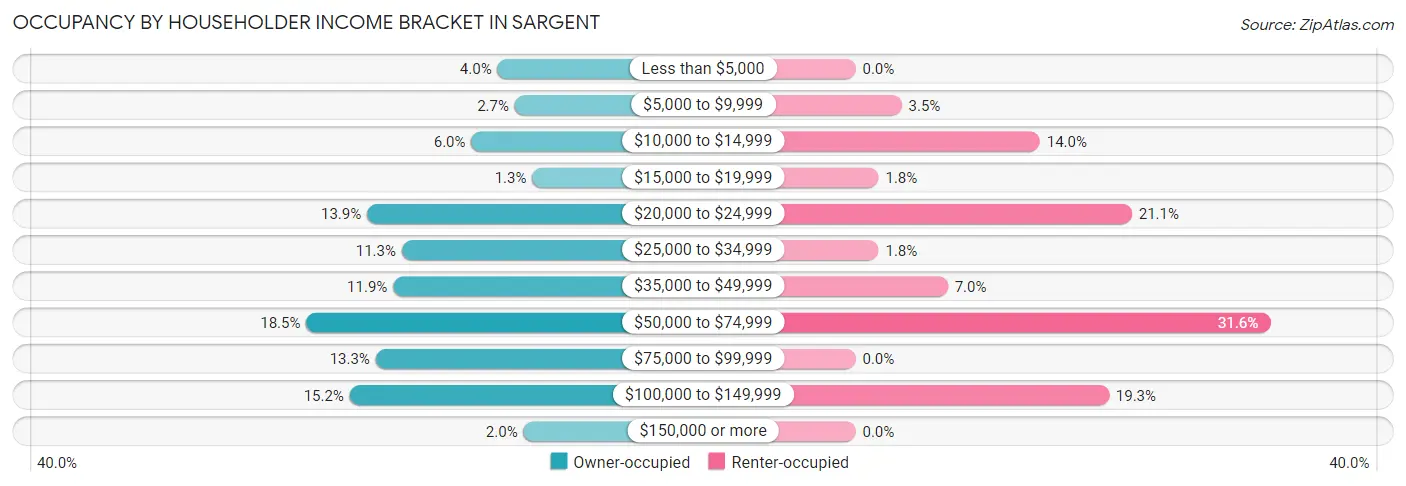
| Income Bracket | Owner-occupied | Renter-occupied |
| Less than $5,000 | 6 (4.0%) | 0 (0.0%) |
| $5,000 to $9,999 | 4 (2.6%) | 2 (3.5%) |
| $10,000 to $14,999 | 9 (6.0%) | 8 (14.0%) |
| $15,000 to $19,999 | 2 (1.3%) | 1 (1.8%) |
| $20,000 to $24,999 | 21 (13.9%) | 12 (21.0%) |
| $25,000 to $34,999 | 17 (11.3%) | 1 (1.8%) |
| $35,000 to $49,999 | 18 (11.9%) | 4 (7.0%) |
| $50,000 to $74,999 | 28 (18.5%) | 18 (31.6%) |
| $75,000 to $99,999 | 20 (13.3%) | 0 (0.0%) |
| $100,000 to $149,999 | 23 (15.2%) | 11 (19.3%) |
| $150,000 or more | 3 (2.0%) | 0 (0.0%) |
| Total | 151 (100.0%) | 57 (100.0%) |
Monthly Housing Cost Tiers in Sargent
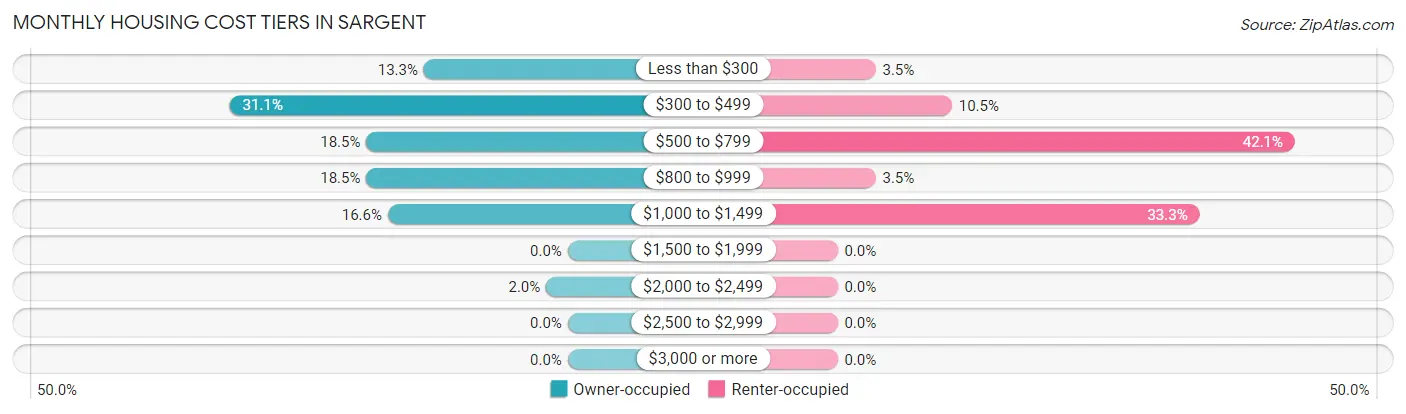
| Monthly Cost | Owner-occupied | Renter-occupied |
| Less than $300 | 20 (13.3%) | 2 (3.5%) |
| $300 to $499 | 47 (31.1%) | 6 (10.5%) |
| $500 to $799 | 28 (18.5%) | 24 (42.1%) |
| $800 to $999 | 28 (18.5%) | 2 (3.5%) |
| $1,000 to $1,499 | 25 (16.6%) | 19 (33.3%) |
| $1,500 to $1,999 | 0 (0.0%) | 0 (0.0%) |
| $2,000 to $2,499 | 3 (2.0%) | 0 (0.0%) |
| $2,500 to $2,999 | 0 (0.0%) | 0 (0.0%) |
| $3,000 or more | 0 (0.0%) | 0 (0.0%) |
| Total | 151 (100.0%) | 57 (100.0%) |
Physical Housing Characteristics in Sargent
Housing Structures in Sargent
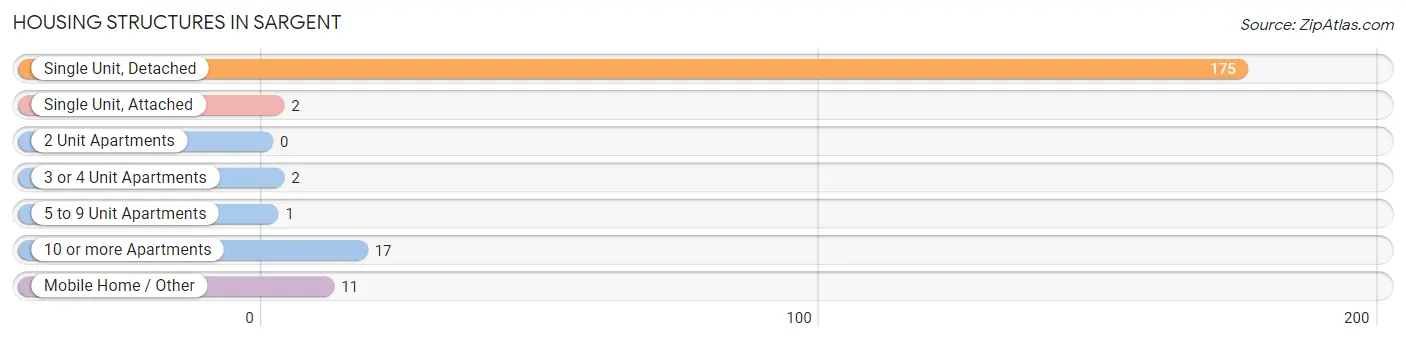
| Structure Type | # Housing Units | % Housing Units |
| Single Unit, Detached | 175 | 84.1% |
| Single Unit, Attached | 2 | 1.0% |
| 2 Unit Apartments | 0 | 0.0% |
| 3 or 4 Unit Apartments | 2 | 1.0% |
| 5 to 9 Unit Apartments | 1 | 0.5% |
| 10 or more Apartments | 17 | 8.2% |
| Mobile Home / Other | 11 | 5.3% |
| Total | 208 | 100.0% |
Housing Structures by Occupancy in Sargent
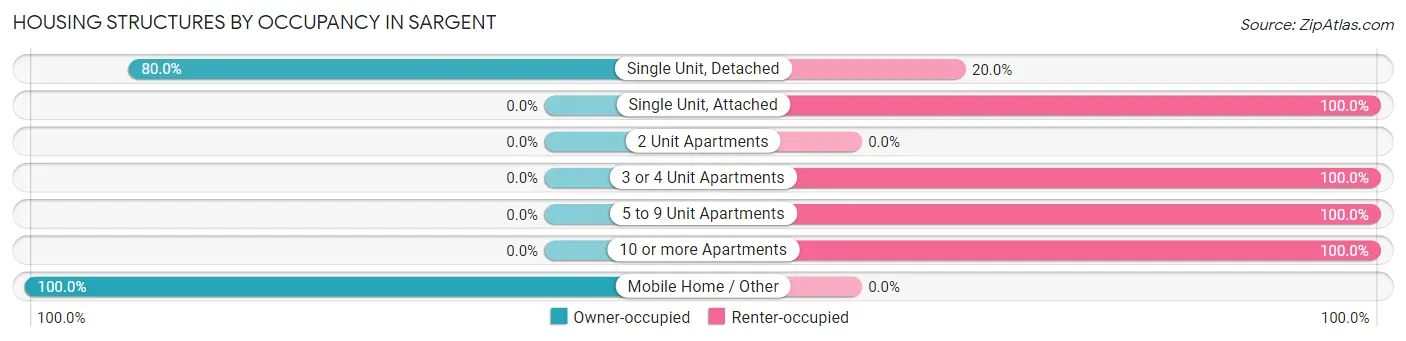
| Structure Type | Owner-occupied | Renter-occupied |
| Single Unit, Detached | 140 (80.0%) | 35 (20.0%) |
| Single Unit, Attached | 0 (0.0%) | 2 (100.0%) |
| 2 Unit Apartments | 0 (0.0%) | 0 (0.0%) |
| 3 or 4 Unit Apartments | 0 (0.0%) | 2 (100.0%) |
| 5 to 9 Unit Apartments | 0 (0.0%) | 1 (100.0%) |
| 10 or more Apartments | 0 (0.0%) | 17 (100.0%) |
| Mobile Home / Other | 11 (100.0%) | 0 (0.0%) |
| Total | 151 (72.6%) | 57 (27.4%) |
Housing Structures by Number of Rooms in Sargent
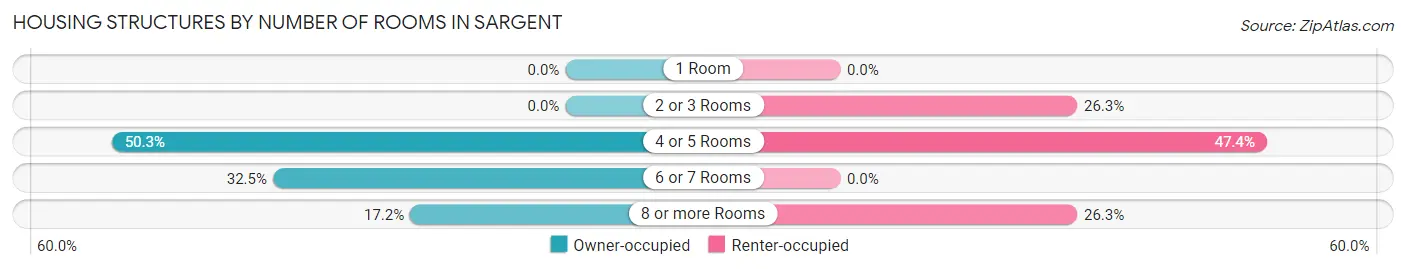
| Number of Rooms | Owner-occupied | Renter-occupied |
| 1 Room | 0 (0.0%) | 0 (0.0%) |
| 2 or 3 Rooms | 0 (0.0%) | 15 (26.3%) |
| 4 or 5 Rooms | 76 (50.3%) | 27 (47.4%) |
| 6 or 7 Rooms | 49 (32.5%) | 0 (0.0%) |
| 8 or more Rooms | 26 (17.2%) | 15 (26.3%) |
| Total | 151 (100.0%) | 57 (100.0%) |
Housing Structure by Heating Type in Sargent
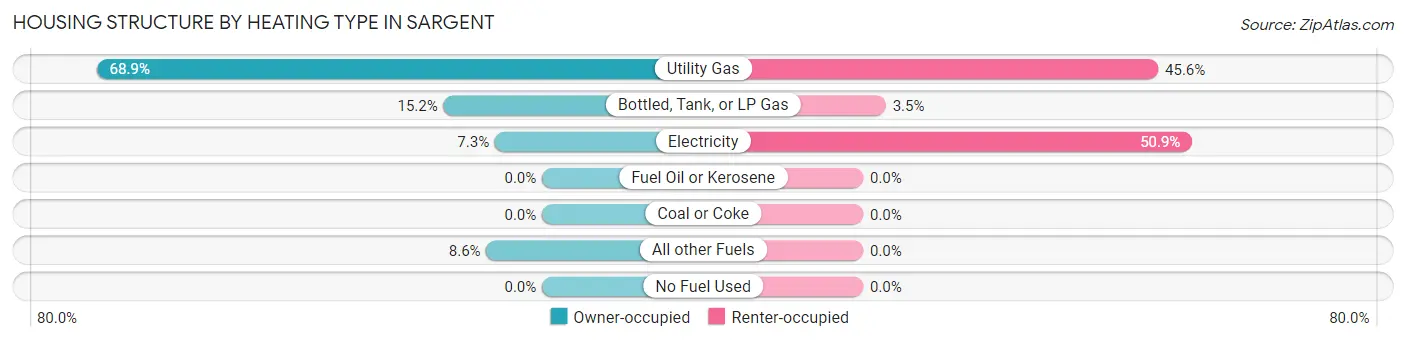
| Heating Type | Owner-occupied | Renter-occupied |
| Utility Gas | 104 (68.9%) | 26 (45.6%) |
| Bottled, Tank, or LP Gas | 23 (15.2%) | 2 (3.5%) |
| Electricity | 11 (7.3%) | 29 (50.9%) |
| Fuel Oil or Kerosene | 0 (0.0%) | 0 (0.0%) |
| Coal or Coke | 0 (0.0%) | 0 (0.0%) |
| All other Fuels | 13 (8.6%) | 0 (0.0%) |
| No Fuel Used | 0 (0.0%) | 0 (0.0%) |
| Total | 151 (100.0%) | 57 (100.0%) |
Household Vehicle Usage in Sargent
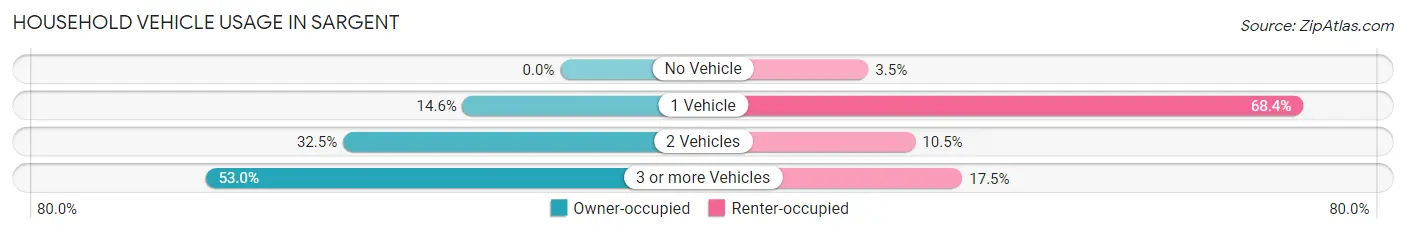
| Vehicles per Household | Owner-occupied | Renter-occupied |
| No Vehicle | 0 (0.0%) | 2 (3.5%) |
| 1 Vehicle | 22 (14.6%) | 39 (68.4%) |
| 2 Vehicles | 49 (32.5%) | 6 (10.5%) |
| 3 or more Vehicles | 80 (53.0%) | 10 (17.5%) |
| Total | 151 (100.0%) | 57 (100.0%) |
Real Estate & Mortgages in Sargent
Real Estate and Mortgage Overview in Sargent
| Characteristic | Without Mortgage | With Mortgage |
| Housing Units | 91 | 60 |
| Median Property Value | $56,300 | $69,000 |
| Median Household Income | $49,219 | $0 |
| Monthly Housing Costs | $391 | $0 |
| Real Estate Taxes | $656 | $15 |
Property Value by Mortgage Status in Sargent
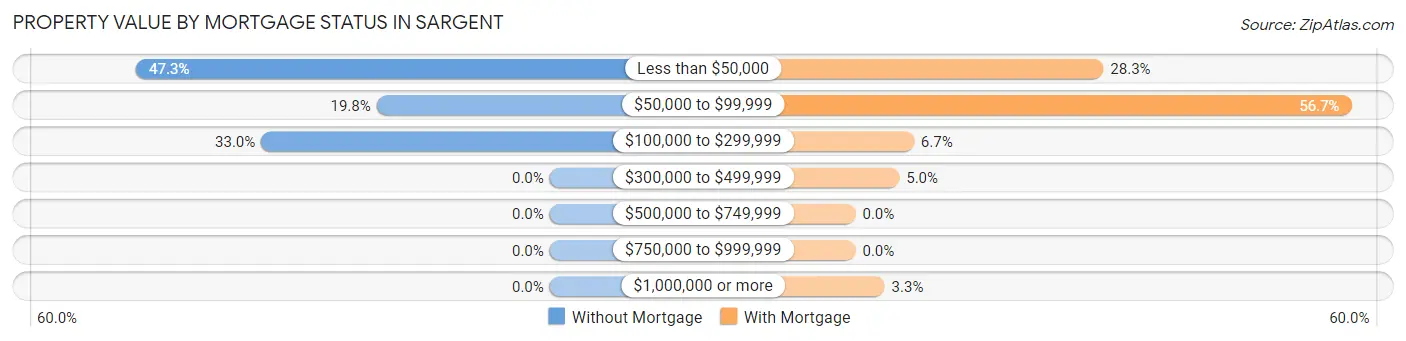
| Property Value | Without Mortgage | With Mortgage |
| Less than $50,000 | 43 (47.2%) | 17 (28.3%) |
| $50,000 to $99,999 | 18 (19.8%) | 34 (56.7%) |
| $100,000 to $299,999 | 30 (33.0%) | 4 (6.7%) |
| $300,000 to $499,999 | 0 (0.0%) | 3 (5.0%) |
| $500,000 to $749,999 | 0 (0.0%) | 0 (0.0%) |
| $750,000 to $999,999 | 0 (0.0%) | 0 (0.0%) |
| $1,000,000 or more | 0 (0.0%) | 2 (3.3%) |
| Total | 91 (100.0%) | 60 (100.0%) |
Household Income by Mortgage Status in Sargent
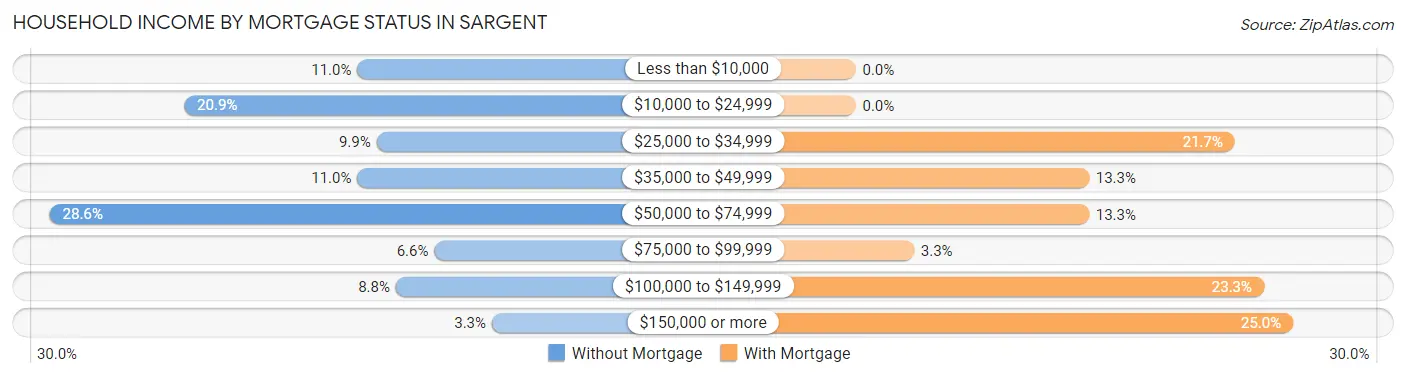
| Household Income | Without Mortgage | With Mortgage |
| Less than $10,000 | 10 (11.0%) | 0 (0.0%) |
| $10,000 to $24,999 | 19 (20.9%) | 0 (0.0%) |
| $25,000 to $34,999 | 9 (9.9%) | 13 (21.7%) |
| $35,000 to $49,999 | 10 (11.0%) | 8 (13.3%) |
| $50,000 to $74,999 | 26 (28.6%) | 8 (13.3%) |
| $75,000 to $99,999 | 6 (6.6%) | 2 (3.3%) |
| $100,000 to $149,999 | 8 (8.8%) | 14 (23.3%) |
| $150,000 or more | 3 (3.3%) | 15 (25.0%) |
| Total | 91 (100.0%) | 60 (100.0%) |
Property Value to Household Income Ratio in Sargent
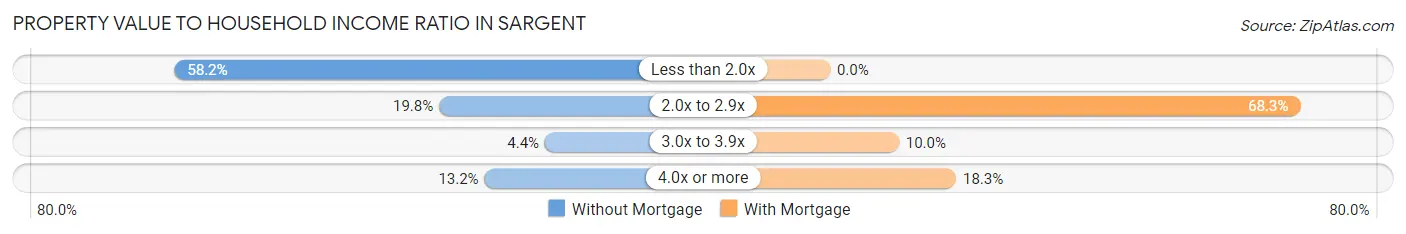
| Value-to-Income Ratio | Without Mortgage | With Mortgage |
| Less than 2.0x | 53 (58.2%) | 0 (0.0%) |
| 2.0x to 2.9x | 18 (19.8%) | 41 (68.3%) |
| 3.0x to 3.9x | 4 (4.4%) | 6 (10.0%) |
| 4.0x or more | 12 (13.2%) | 11 (18.3%) |
| Total | 91 (100.0%) | 60 (100.0%) |
Real Estate Taxes by Mortgage Status in Sargent
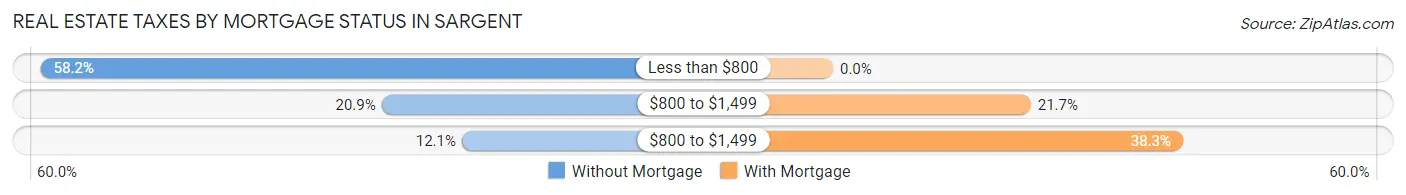
| Property Taxes | Without Mortgage | With Mortgage |
| Less than $800 | 53 (58.2%) | 0 (0.0%) |
| $800 to $1,499 | 19 (20.9%) | 13 (21.7%) |
| $800 to $1,499 | 11 (12.1%) | 23 (38.3%) |
| Total | 91 (100.0%) | 60 (100.0%) |
Health & Disability in Sargent
Health Insurance Coverage by Age in Sargent
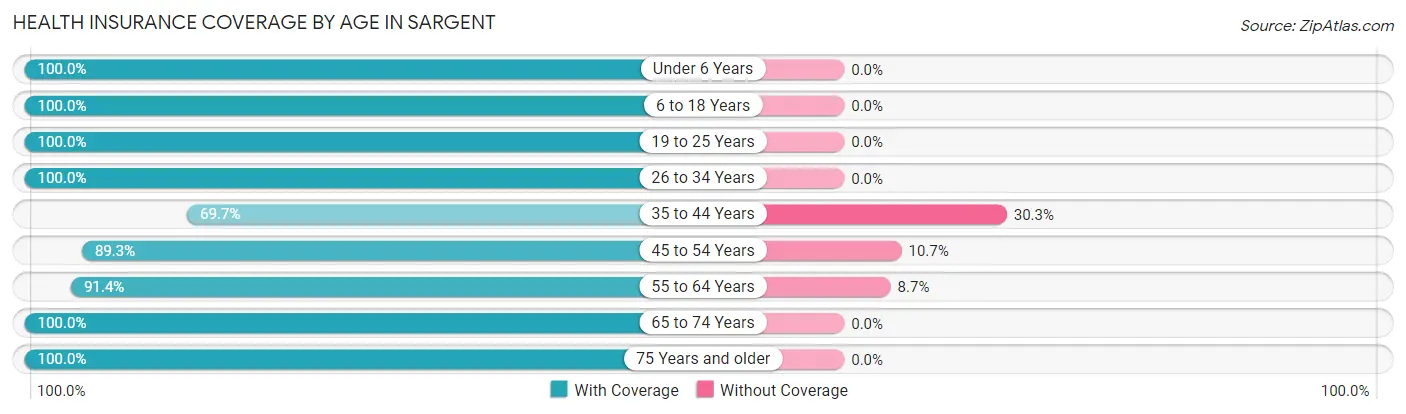
| Age Bracket | With Coverage | Without Coverage |
| Under 6 Years | 49 (100.0%) | 0 (0.0%) |
| 6 to 18 Years | 50 (100.0%) | 0 (0.0%) |
| 19 to 25 Years | 27 (100.0%) | 0 (0.0%) |
| 26 to 34 Years | 67 (100.0%) | 0 (0.0%) |
| 35 to 44 Years | 23 (69.7%) | 10 (30.3%) |
| 45 to 54 Years | 67 (89.3%) | 8 (10.7%) |
| 55 to 64 Years | 95 (91.3%) | 9 (8.6%) |
| 65 to 74 Years | 38 (100.0%) | 0 (0.0%) |
| 75 Years and older | 43 (100.0%) | 0 (0.0%) |
| Total | 459 (94.4%) | 27 (5.6%) |
Health Insurance Coverage by Citizenship Status in Sargent
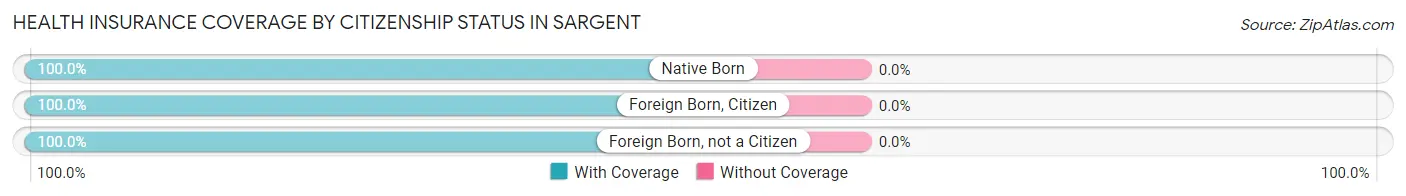
| Citizenship Status | With Coverage | Without Coverage |
| Native Born | 49 (100.0%) | 0 (0.0%) |
| Foreign Born, Citizen | 50 (100.0%) | 0 (0.0%) |
| Foreign Born, not a Citizen | 27 (100.0%) | 0 (0.0%) |
Health Insurance Coverage by Household Income in Sargent
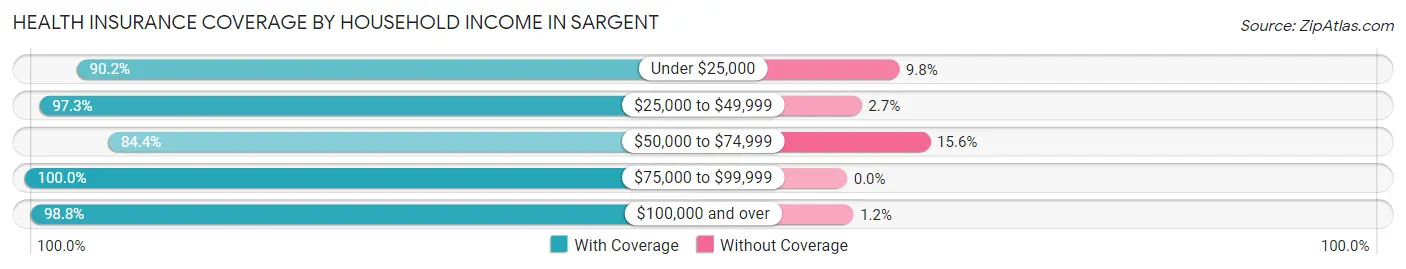
| Household Income | With Coverage | Without Coverage |
| Under $25,000 | 74 (90.2%) | 8 (9.8%) |
| $25,000 to $49,999 | 71 (97.3%) | 2 (2.7%) |
| $50,000 to $74,999 | 81 (84.4%) | 15 (15.6%) |
| $75,000 to $99,999 | 68 (100.0%) | 0 (0.0%) |
| $100,000 and over | 165 (98.8%) | 2 (1.2%) |
Public vs Private Health Insurance Coverage by Age in Sargent
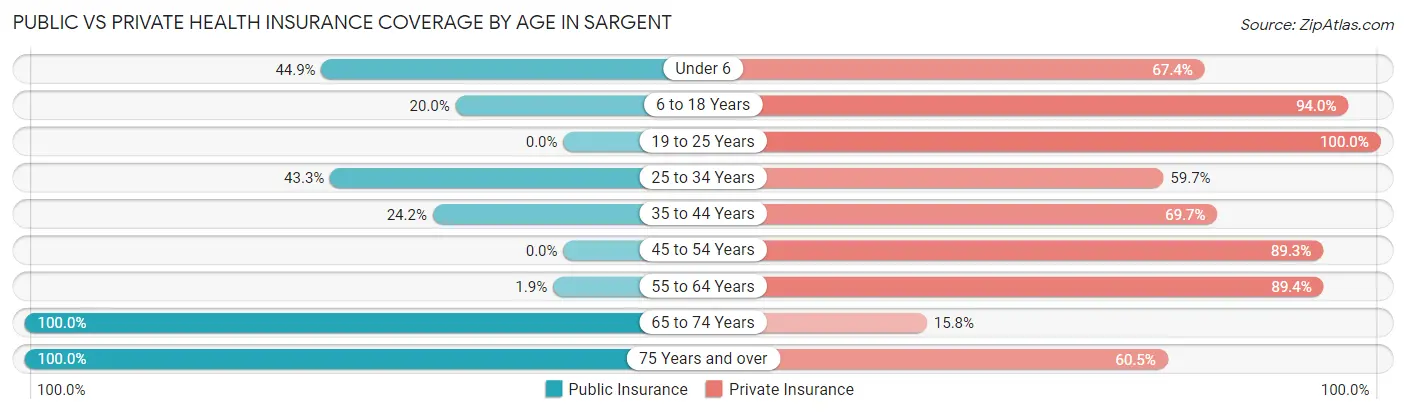
| Age Bracket | Public Insurance | Private Insurance |
| Under 6 | 22 (44.9%) | 33 (67.3%) |
| 6 to 18 Years | 10 (20.0%) | 47 (94.0%) |
| 19 to 25 Years | 0 (0.0%) | 27 (100.0%) |
| 25 to 34 Years | 29 (43.3%) | 40 (59.7%) |
| 35 to 44 Years | 8 (24.2%) | 23 (69.7%) |
| 45 to 54 Years | 0 (0.0%) | 67 (89.3%) |
| 55 to 64 Years | 2 (1.9%) | 93 (89.4%) |
| 65 to 74 Years | 38 (100.0%) | 6 (15.8%) |
| 75 Years and over | 43 (100.0%) | 26 (60.5%) |
| Total | 152 (31.3%) | 362 (74.5%) |
Disability Status by Sex by Age in Sargent
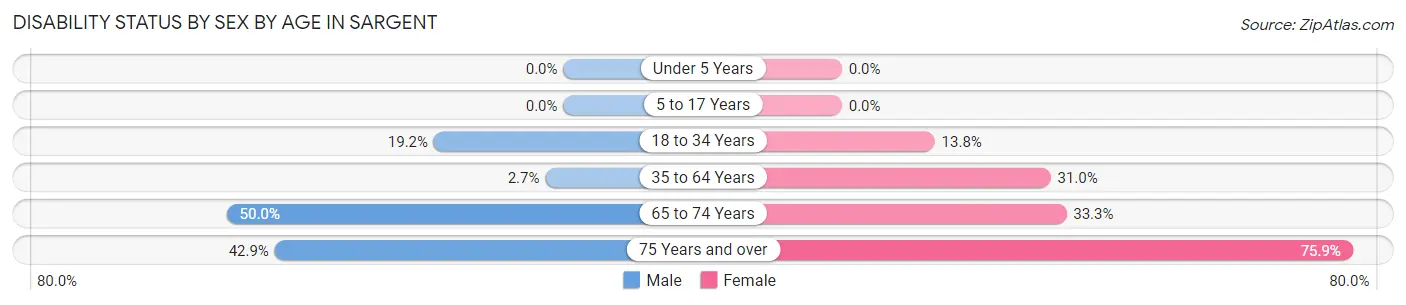
| Age Bracket | Male | Female |
| Under 5 Years | 0 (0.0%) | 0 (0.0%) |
| 5 to 17 Years | 0 (0.0%) | 0 (0.0%) |
| 18 to 34 Years | 10 (19.2%) | 8 (13.8%) |
| 35 to 64 Years | 3 (2.7%) | 31 (31.0%) |
| 65 to 74 Years | 10 (50.0%) | 6 (33.3%) |
| 75 Years and over | 6 (42.9%) | 22 (75.9%) |
Disability Class by Sex by Age in Sargent
Disability Class: Hearing Difficulty
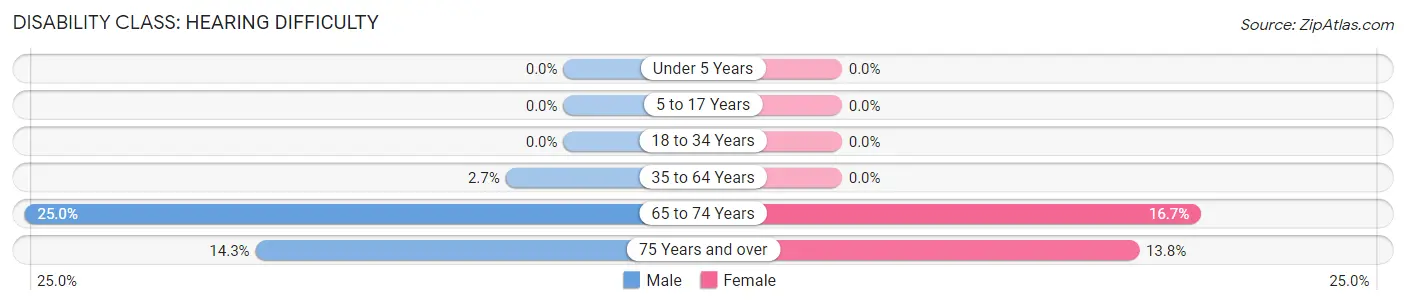
| Age Bracket | Male | Female |
| Under 5 Years | 0 (0.0%) | 0 (0.0%) |
| 5 to 17 Years | 0 (0.0%) | 0 (0.0%) |
| 18 to 34 Years | 0 (0.0%) | 0 (0.0%) |
| 35 to 64 Years | 3 (2.7%) | 0 (0.0%) |
| 65 to 74 Years | 5 (25.0%) | 3 (16.7%) |
| 75 Years and over | 2 (14.3%) | 4 (13.8%) |
Disability Class: Vision Difficulty
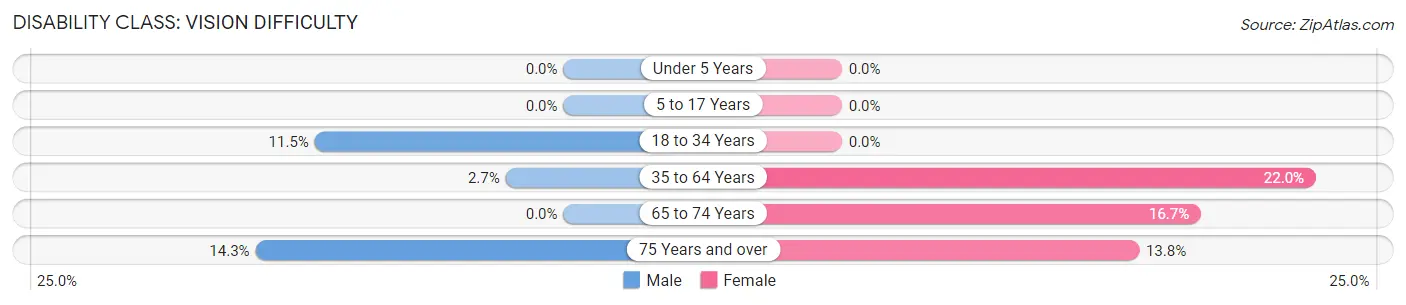
| Age Bracket | Male | Female |
| Under 5 Years | 0 (0.0%) | 0 (0.0%) |
| 5 to 17 Years | 0 (0.0%) | 0 (0.0%) |
| 18 to 34 Years | 6 (11.5%) | 0 (0.0%) |
| 35 to 64 Years | 3 (2.7%) | 22 (22.0%) |
| 65 to 74 Years | 0 (0.0%) | 3 (16.7%) |
| 75 Years and over | 2 (14.3%) | 4 (13.8%) |
Disability Class: Cognitive Difficulty
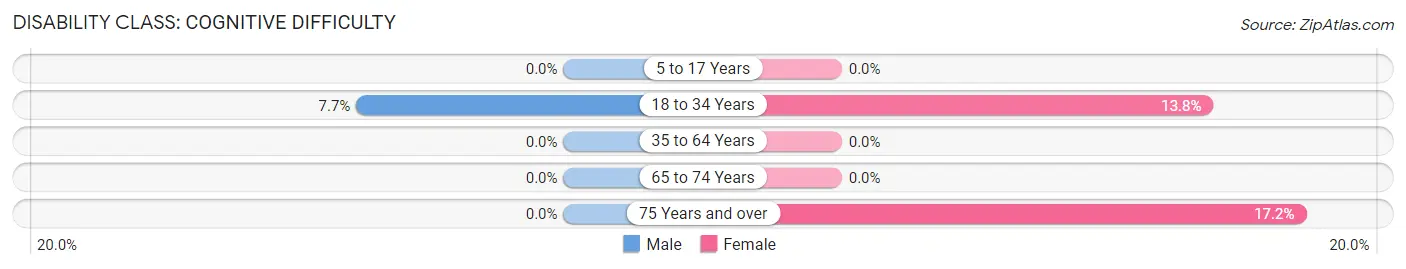
| Age Bracket | Male | Female |
| 5 to 17 Years | 0 (0.0%) | 0 (0.0%) |
| 18 to 34 Years | 4 (7.7%) | 8 (13.8%) |
| 35 to 64 Years | 0 (0.0%) | 0 (0.0%) |
| 65 to 74 Years | 0 (0.0%) | 0 (0.0%) |
| 75 Years and over | 0 (0.0%) | 5 (17.2%) |
Disability Class: Ambulatory Difficulty
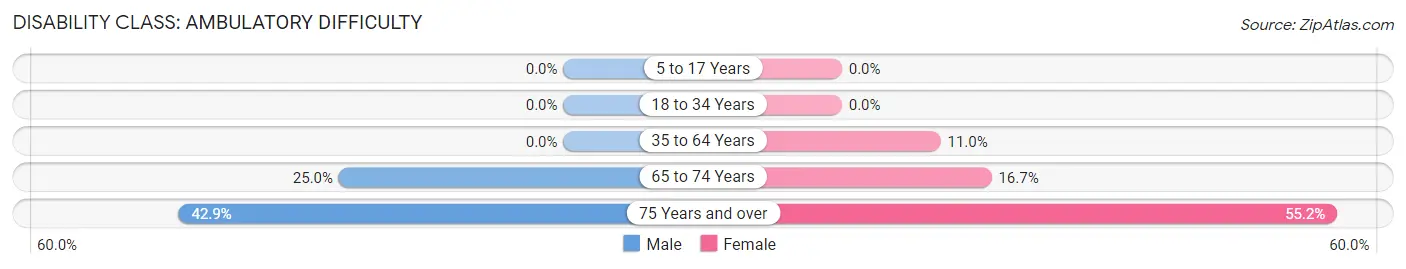
| Age Bracket | Male | Female |
| 5 to 17 Years | 0 (0.0%) | 0 (0.0%) |
| 18 to 34 Years | 0 (0.0%) | 0 (0.0%) |
| 35 to 64 Years | 0 (0.0%) | 11 (11.0%) |
| 65 to 74 Years | 5 (25.0%) | 3 (16.7%) |
| 75 Years and over | 6 (42.9%) | 16 (55.2%) |
Disability Class: Self-Care Difficulty
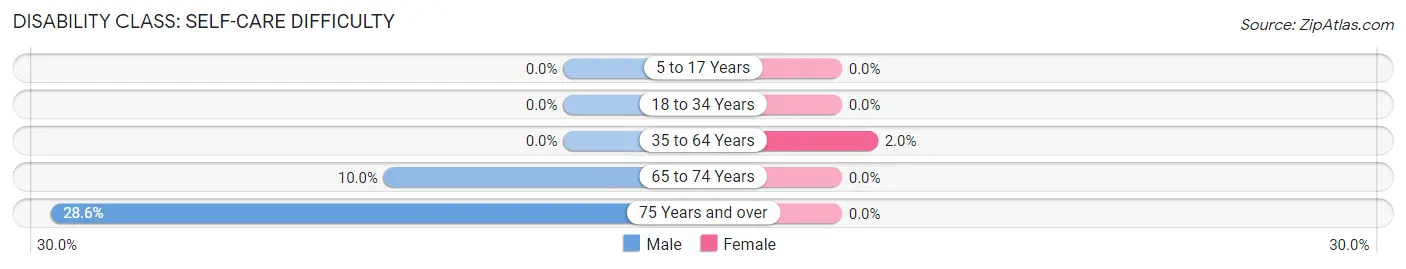
| Age Bracket | Male | Female |
| 5 to 17 Years | 0 (0.0%) | 0 (0.0%) |
| 18 to 34 Years | 0 (0.0%) | 0 (0.0%) |
| 35 to 64 Years | 0 (0.0%) | 2 (2.0%) |
| 65 to 74 Years | 2 (10.0%) | 0 (0.0%) |
| 75 Years and over | 4 (28.6%) | 0 (0.0%) |
Technology Access in Sargent
Computing Device Access in Sargent
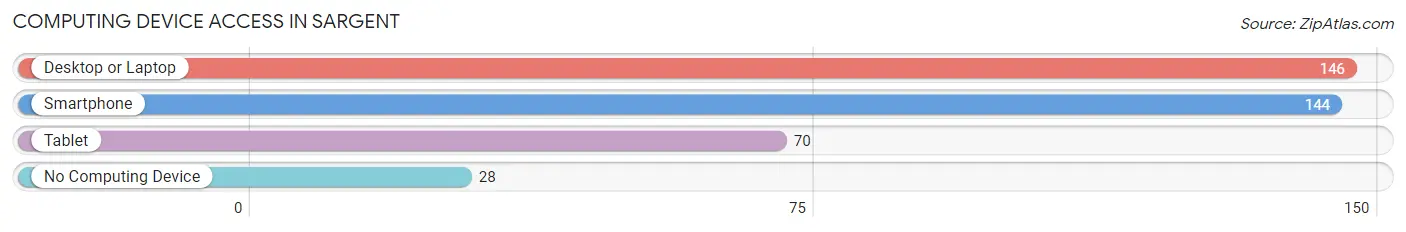
| Device Type | # Households | % Households |
| Desktop or Laptop | 146 | 70.2% |
| Smartphone | 144 | 69.2% |
| Tablet | 70 | 33.7% |
| No Computing Device | 28 | 13.5% |
| Total | 208 | 100.0% |
Internet Access in Sargent
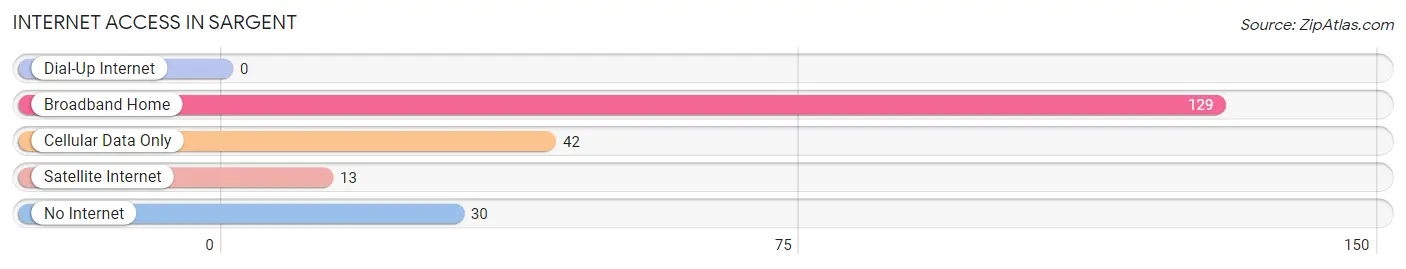
| Internet Type | # Households | % Households |
| Dial-Up Internet | 0 | 0.0% |
| Broadband Home | 129 | 62.0% |
| Cellular Data Only | 42 | 20.2% |
| Satellite Internet | 13 | 6.2% |
| No Internet | 30 | 14.4% |
| Total | 208 | 100.0% |
Sargent Summary
Sargent is a small village located in Custer County, Nebraska. It is situated on the banks of the North Platte River, approximately 20 miles south of North Platte. The village was founded in 1887 and was named after a local rancher, John Sargent. The population of Sargent was estimated to be around 250 in 2020.
Geography
Sargent is located in the Sandhills region of Nebraska, which is characterized by rolling hills and sandy soils. The village is situated on the banks of the North Platte River, which provides a source of irrigation for the local agricultural industry. The area is also home to a variety of wildlife, including deer, antelope, and wild turkeys.
The climate in Sargent is semi-arid, with hot summers and cold winters. Average temperatures range from a low of -2°F in the winter to a high of 95°F in the summer. The average annual precipitation is around 17 inches.
Economy
The economy of Sargent is largely based on agriculture. The local farmers grow a variety of crops, including corn, wheat, and soybeans. The area is also home to a number of cattle ranches, which provide beef and dairy products to the local market.
In addition to agriculture, Sargent is home to a number of small businesses, including a grocery store, a hardware store, and a restaurant. The village also has a post office and a bank.
Demographics
The population of Sargent was estimated to be around 250 in 2020. The majority of the population is white (96.4%), followed by Hispanic (2.4%), and Native American (1.2%). The median household income is $45,000, and the median age is 44.
The village is served by the Sargent Public School District, which includes an elementary school, a middle school, and a high school. The village also has a public library and a community center.
Conclusion
Sargent is a small village located in Custer County, Nebraska. It is situated on the banks of the North Platte River and is home to a population of around 250 people. The economy of Sargent is largely based on agriculture, with local farmers growing a variety of crops and cattle ranchers providing beef and dairy products to the local market. The village is served by the Sargent Public School District and has a public library and a community center.
Common Questions
What is Per Capita Income in Sargent?
Per Capita income in Sargent is $27,497.
What is the Median Family Income in Sargent?
Median Family Income in Sargent is $60,179.
What is the Median Household income in Sargent?
Median Household Income in Sargent is $49,750.
What is Income or Wage Gap in Sargent?
Income or Wage Gap in Sargent is 50.5%.
Women in Sargent earn 49.5 cents for every dollar earned by a man.
What is Inequality or Gini Index in Sargent?
Inequality or Gini Index in Sargent is 0.40.
What is the Total Population of Sargent?
Total Population of Sargent is 486.
What is the Total Male Population of Sargent?
Total Male Population of Sargent is 237.
What is the Total Female Population of Sargent?
Total Female Population of Sargent is 249.
What is the Ratio of Males per 100 Females in Sargent?
There are 95.18 Males per 100 Females in Sargent.
What is the Ratio of Females per 100 Males in Sargent?
There are 105.06 Females per 100 Males in Sargent.
What is the Median Population Age in Sargent?
Median Population Age in Sargent is 46.5 Years.
What is the Average Family Size in Sargent
Average Family Size in Sargent is 2.8 People.
What is the Average Household Size in Sargent
Average Household Size in Sargent is 2.3 People.
How Large is the Labor Force in Sargent?
There are 258 People in the Labor Forcein in Sargent.
What is the Percentage of People in the Labor Force in Sargent?
63.4% of People are in the Labor Force in Sargent.
What is the Unemployment Rate in Sargent?
Unemployment Rate in Sargent is 1.6%.