Ruskin, NE Map & Demographics
Ruskin Map
Ruskin Overview
$29,288
PER CAPITA INCOME
$73,708
AVG FAMILY INCOME
$73,375
AVG HOUSEHOLD INCOME
34.9%
WAGE / INCOME GAP [ % ]
65.1¢/ $1
WAGE / INCOME GAP [ $ ]
0.23
INEQUALITY / GINI INDEX
172
TOTAL POPULATION
78
MALE POPULATION
94
FEMALE POPULATION
82.98
MALES / 100 FEMALES
120.51
FEMALES / 100 MALES
60.3
MEDIAN AGE
2.5
AVG FAMILY SIZE
2.4
AVG HOUSEHOLD SIZE
94
LABOR FORCE [ PEOPLE ]
60.3%
PERCENT IN LABOR FORCE
Ruskin Zip Codes
Ruskin Area Codes
Income in Ruskin
Income Overview in Ruskin
Per Capita Income in Ruskin is $29,288, while median incomes of families and households are $73,708 and $73,375 respectively.
| Characteristic | Number | Measure |
| Per Capita Income | 172 | $29,288 |
| Median Family Income | 63 | $73,708 |
| Mean Family Income | 63 | $75,692 |
| Median Household Income | 73 | $73,375 |
| Mean Household Income | 73 | $70,803 |
| Income Deficit | 63 | $0 |
| Wage / Income Gap (%) | 172 | 34.95% |
| Wage / Income Gap ($) | 172 | 65.05¢ per $1 |
| Gini / Inequality Index | 172 | 0.23 |
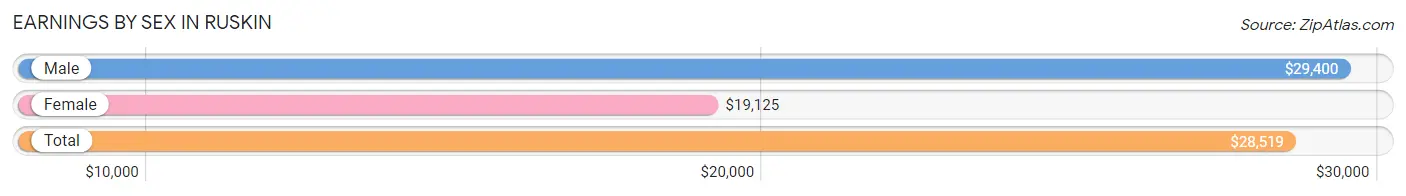
Earnings by Sex in Ruskin
Average Earnings in Ruskin are $28,519, $29,400 for men and $19,125 for women, a difference of 34.9%.
| Sex | Number | Average Earnings |
| Male | 54 (56.2%) | $29,400 |
| Female | 42 (43.8%) | $19,125 |
| Total | 96 (100.0%) | $28,519 |
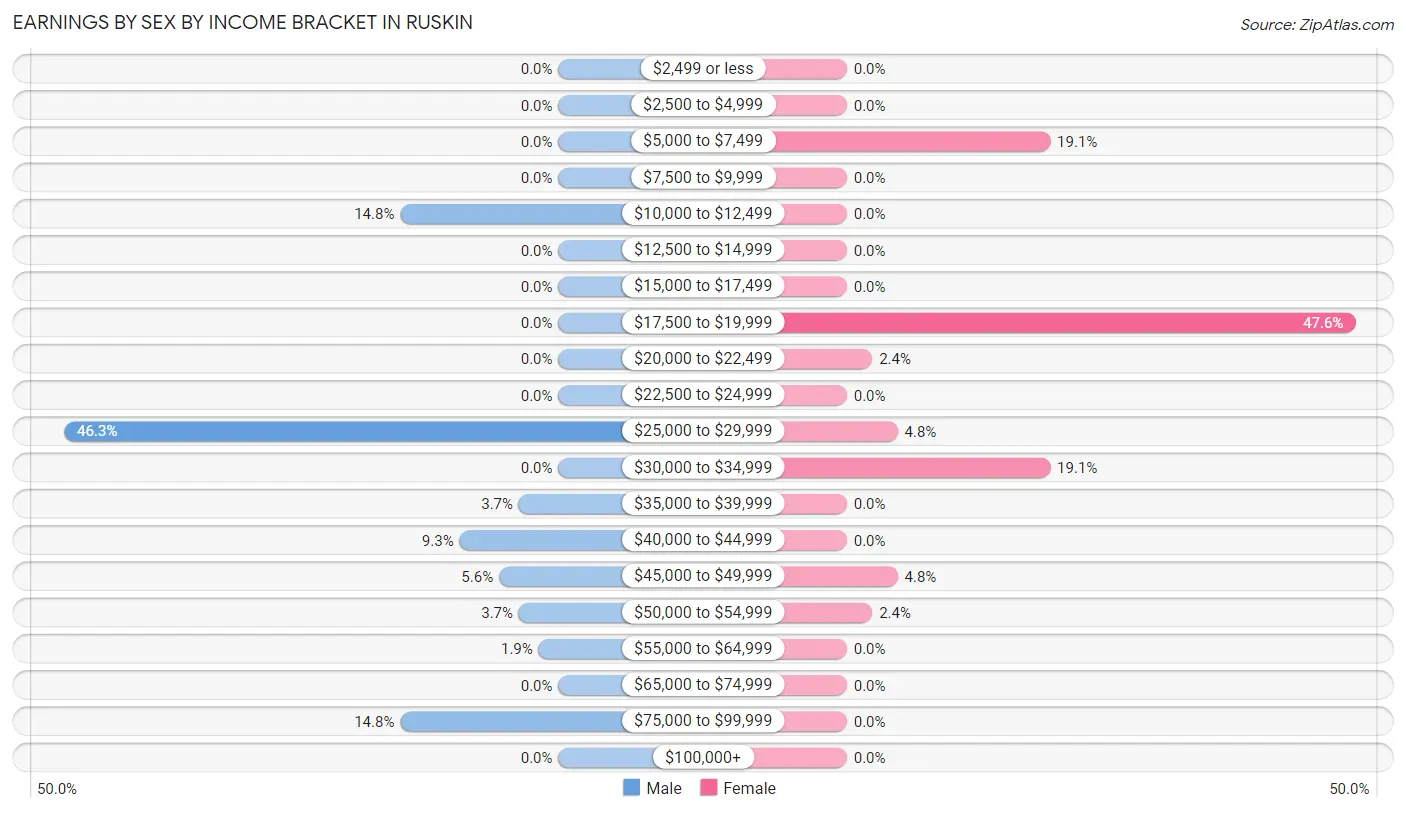
Earnings by Sex by Income Bracket in Ruskin
The most common earnings brackets in Ruskin are $25,000 to $29,999 for men (25 | 46.3%) and $17,500 to $19,999 for women (20 | 47.6%).
| Income | Male | Female |
| $2,499 or less | 0 (0.0%) | 0 (0.0%) |
| $2,500 to $4,999 | 0 (0.0%) | 0 (0.0%) |
| $5,000 to $7,499 | 0 (0.0%) | 8 (19.1%) |
| $7,500 to $9,999 | 0 (0.0%) | 0 (0.0%) |
| $10,000 to $12,499 | 8 (14.8%) | 0 (0.0%) |
| $12,500 to $14,999 | 0 (0.0%) | 0 (0.0%) |
| $15,000 to $17,499 | 0 (0.0%) | 0 (0.0%) |
| $17,500 to $19,999 | 0 (0.0%) | 20 (47.6%) |
| $20,000 to $22,499 | 0 (0.0%) | 1 (2.4%) |
| $22,500 to $24,999 | 0 (0.0%) | 0 (0.0%) |
| $25,000 to $29,999 | 25 (46.3%) | 2 (4.8%) |
| $30,000 to $34,999 | 0 (0.0%) | 8 (19.1%) |
| $35,000 to $39,999 | 2 (3.7%) | 0 (0.0%) |
| $40,000 to $44,999 | 5 (9.3%) | 0 (0.0%) |
| $45,000 to $49,999 | 3 (5.6%) | 2 (4.8%) |
| $50,000 to $54,999 | 2 (3.7%) | 1 (2.4%) |
| $55,000 to $64,999 | 1 (1.8%) | 0 (0.0%) |
| $65,000 to $74,999 | 0 (0.0%) | 0 (0.0%) |
| $75,000 to $99,999 | 8 (14.8%) | 0 (0.0%) |
| $100,000+ | 0 (0.0%) | 0 (0.0%) |
| Total | 54 (100.0%) | 42 (100.0%) |
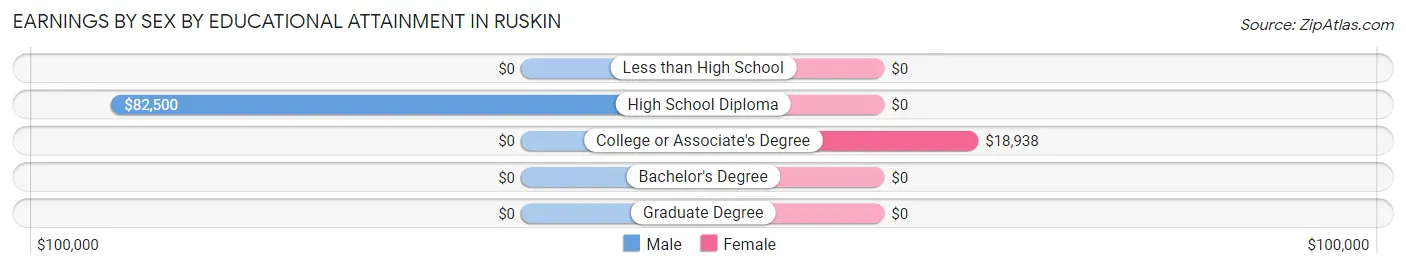
Earnings by Sex by Educational Attainment in Ruskin
Average earnings in Ruskin are $29,400 for men and $19,125 for women, a difference of 34.9%. Men with an educational attainment of high school diploma enjoy the highest average annual earnings of $82,500, while those with high school diploma education earn the least with $82,500. Women with an educational attainment of college or associate's degree earn the most with the average annual earnings of $18,938, while those with college or associate's degree education have the smallest earnings of $18,938.
| Educational Attainment | Male Income | Female Income |
| Less than High School | - | - |
| High School Diploma | $82,500 | $0 |
| College or Associate's Degree | - | - |
| Bachelor's Degree | - | - |
| Graduate Degree | - | - |
| Total | $29,400 | $19,125 |
Family Income in Ruskin
Family Income Brackets in Ruskin
According to the Ruskin family income data, there are 41 families falling into the $50,000 to $74,999 income range, which is the most common income bracket and makes up 65.1% of all families.
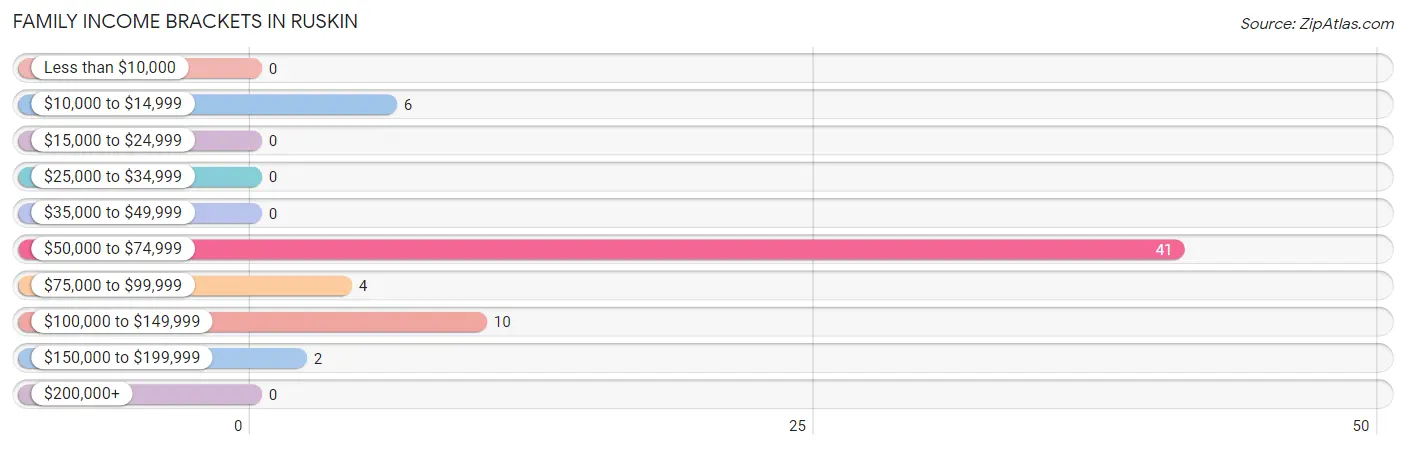
| Income Bracket | # Families | % Families |
| Less than $10,000 | 0 | 0.0% |
| $10,000 to $14,999 | 6 | 9.5% |
| $15,000 to $24,999 | 0 | 0.0% |
| $25,000 to $34,999 | 0 | 0.0% |
| $35,000 to $49,999 | 0 | 0.0% |
| $50,000 to $74,999 | 41 | 65.1% |
| $75,000 to $99,999 | 4 | 6.3% |
| $100,000 to $149,999 | 10 | 15.9% |
| $150,000 to $199,999 | 2 | 3.2% |
| $200,000+ | 0 | 0.0% |
Family Income by Famaliy Size in Ruskin
2-person families (44 | 69.8%) account for the highest median family income in Ruskin with $74,196 per family, while 2-person families (44 | 69.8%) have the highest median income of $37,098 per family member.
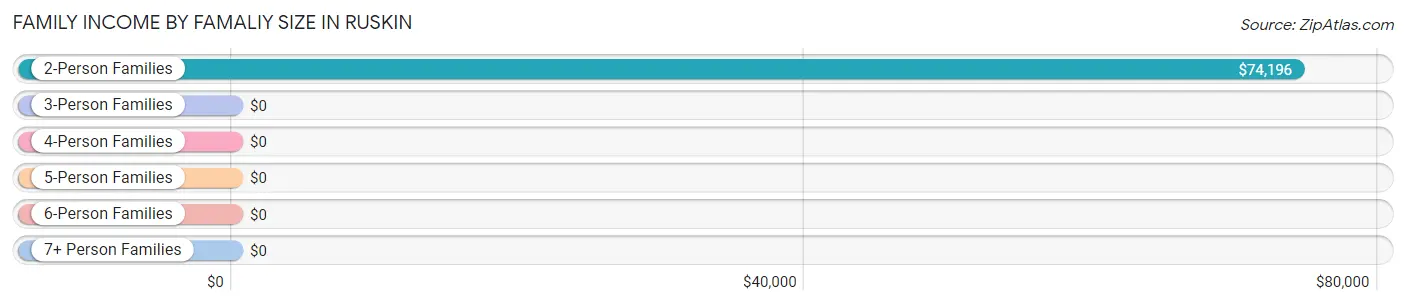
| Income Bracket | # Families | Median Income |
| 2-Person Families | 44 (69.8%) | $74,196 |
| 3-Person Families | 10 (15.9%) | $0 |
| 4-Person Families | 8 (12.7%) | $0 |
| 5-Person Families | 1 (1.6%) | $0 |
| 6-Person Families | 0 (0.0%) | $0 |
| 7+ Person Families | 0 (0.0%) | $0 |
| Total | 63 (100.0%) | $73,708 |
Family Income by Number of Earners in Ruskin
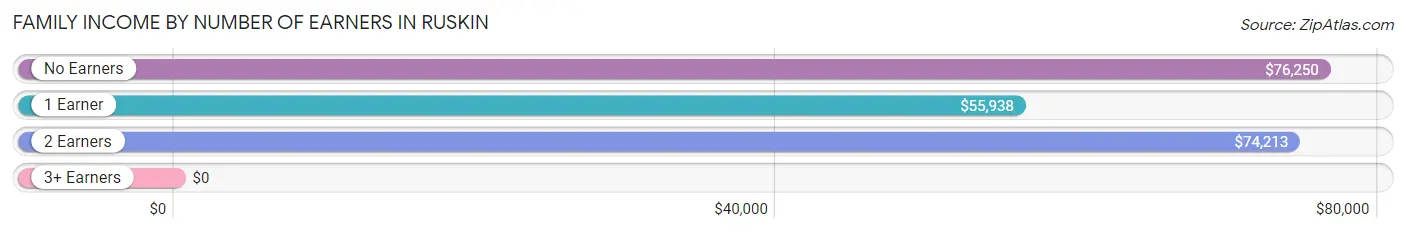
| Number of Earners | # Families | Median Income |
| No Earners | 6 (9.5%) | $76,250 |
| 1 Earner | 18 (28.6%) | $55,938 |
| 2 Earners | 39 (61.9%) | $74,213 |
| 3+ Earners | 0 (0.0%) | $0 |
| Total | 63 (100.0%) | $73,708 |
Household Income in Ruskin
Household Income Brackets in Ruskin
With 41 households falling in the category, the $50,000 to $74,999 income range is the most frequent in Ruskin, accounting for 56.2% of all households.
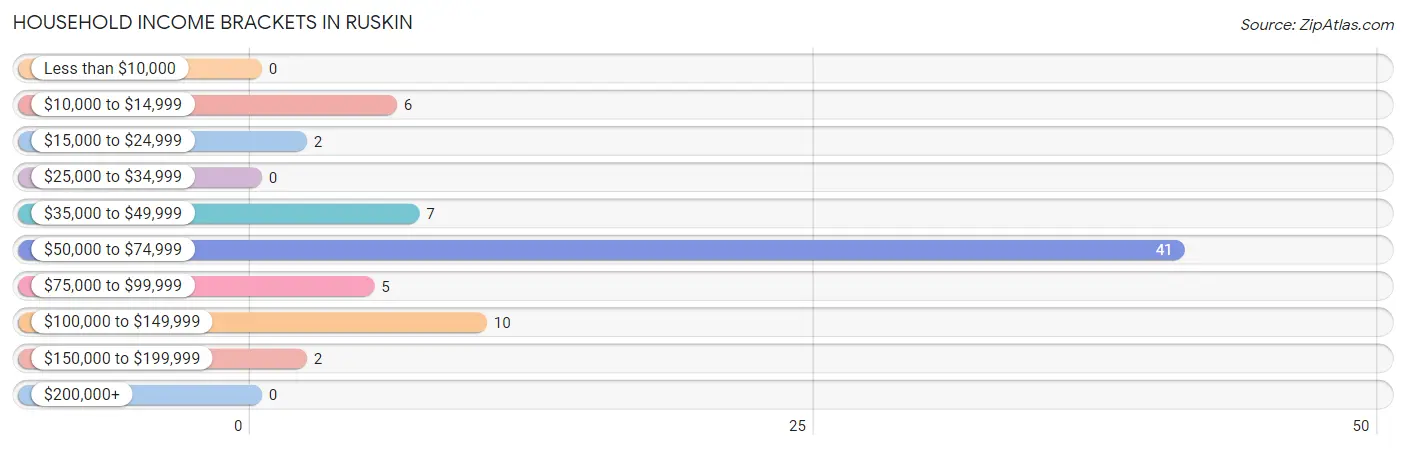
| Income Bracket | # Households | % Households |
| Less than $10,000 | 0 | 0.0% |
| $10,000 to $14,999 | 6 | 8.2% |
| $15,000 to $24,999 | 2 | 2.7% |
| $25,000 to $34,999 | 0 | 0.0% |
| $35,000 to $49,999 | 7 | 9.6% |
| $50,000 to $74,999 | 41 | 56.2% |
| $75,000 to $99,999 | 5 | 6.8% |
| $100,000 to $149,999 | 10 | 13.7% |
| $150,000 to $199,999 | 2 | 2.7% |
| $200,000+ | 0 | 0.0% |
Household Income by Householder Age in Ruskin
The median household income in Ruskin is $73,375, with the highest median household income of $73,750 found in the 65+ years age bracket for the primary householder. A total of 42 households (57.5%) fall into this category.
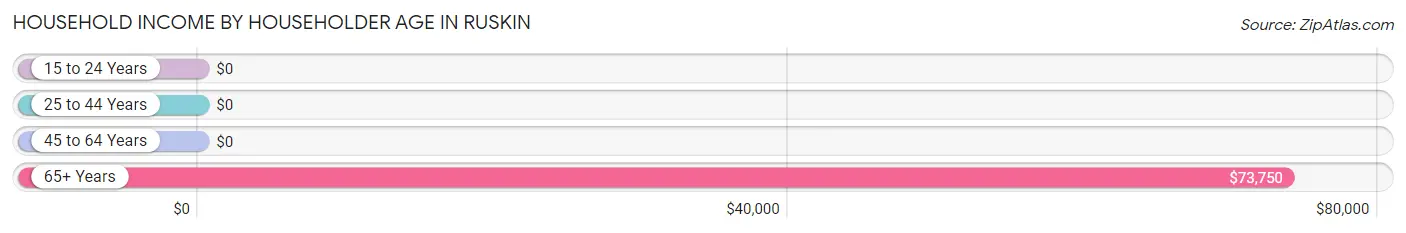
| Income Bracket | # Households | Median Income |
| 15 to 24 Years | 0 (0.0%) | $0 |
| 25 to 44 Years | 12 (16.4%) | $0 |
| 45 to 64 Years | 19 (26.0%) | $0 |
| 65+ Years | 42 (57.5%) | $73,750 |
| Total | 73 (100.0%) | $73,375 |
Poverty in Ruskin
Income Below Poverty by Sex and Age in Ruskin
With 7.7% poverty level for males and 26.6% for females among the residents of Ruskin, 25 to 34 year old males and 18 to 24 year old females are the most vulnerable to poverty, with 6 males (85.7%) and 14 females (100.0%) in their respective age groups living below the poverty level.
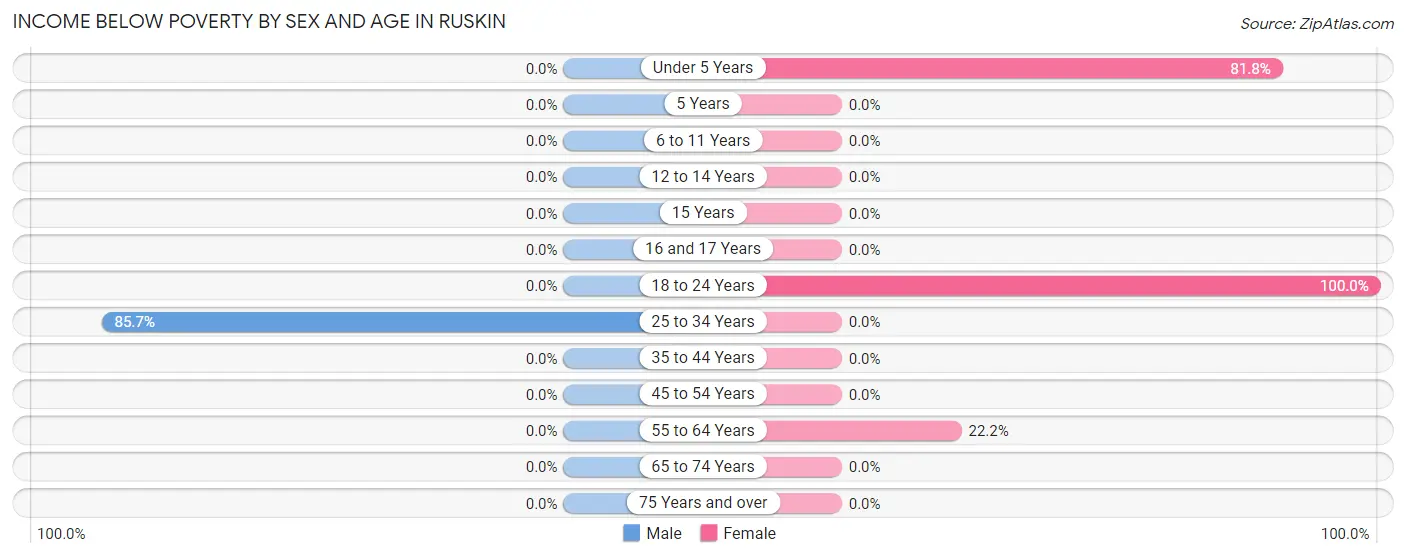
| Age Bracket | Male | Female |
| Under 5 Years | 0 (0.0%) | 9 (81.8%) |
| 5 Years | 0 (0.0%) | 0 (0.0%) |
| 6 to 11 Years | 0 (0.0%) | 0 (0.0%) |
| 12 to 14 Years | 0 (0.0%) | 0 (0.0%) |
| 15 Years | 0 (0.0%) | 0 (0.0%) |
| 16 and 17 Years | 0 (0.0%) | 0 (0.0%) |
| 18 to 24 Years | 0 (0.0%) | 14 (100.0%) |
| 25 to 34 Years | 6 (85.7%) | 0 (0.0%) |
| 35 to 44 Years | 0 (0.0%) | 0 (0.0%) |
| 45 to 54 Years | 0 (0.0%) | 0 (0.0%) |
| 55 to 64 Years | 0 (0.0%) | 2 (22.2%) |
| 65 to 74 Years | 0 (0.0%) | 0 (0.0%) |
| 75 Years and over | 0 (0.0%) | 0 (0.0%) |
| Total | 6 (7.7%) | 25 (26.6%) |
Income Above Poverty by Sex and Age in Ruskin
According to the poverty statistics in Ruskin, males aged 6 to 11 years and females aged 12 to 14 years are the age groups that are most secure financially, with 100.0% of males and 100.0% of females in these age groups living above the poverty line.
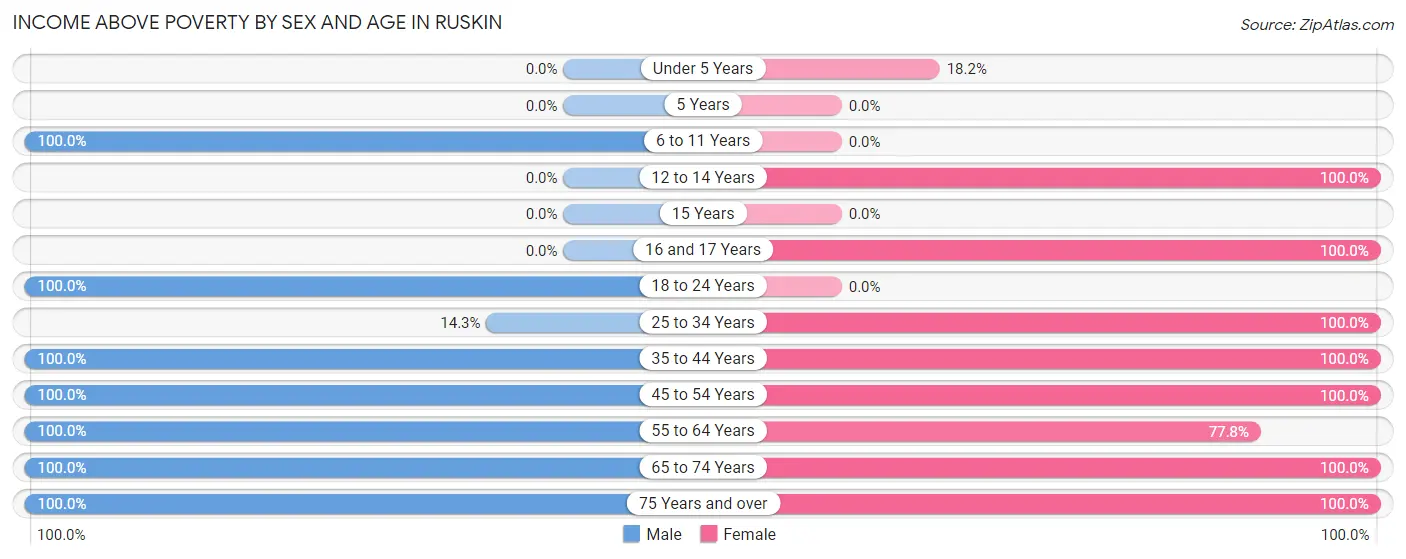
| Age Bracket | Male | Female |
| Under 5 Years | 0 (0.0%) | 2 (18.2%) |
| 5 Years | 0 (0.0%) | 0 (0.0%) |
| 6 to 11 Years | 4 (100.0%) | 0 (0.0%) |
| 12 to 14 Years | 0 (0.0%) | 1 (100.0%) |
| 15 Years | 0 (0.0%) | 0 (0.0%) |
| 16 and 17 Years | 0 (0.0%) | 2 (100.0%) |
| 18 to 24 Years | 12 (100.0%) | 0 (0.0%) |
| 25 to 34 Years | 1 (14.3%) | 7 (100.0%) |
| 35 to 44 Years | 4 (100.0%) | 1 (100.0%) |
| 45 to 54 Years | 1 (100.0%) | 8 (100.0%) |
| 55 to 64 Years | 11 (100.0%) | 7 (77.8%) |
| 65 to 74 Years | 33 (100.0%) | 31 (100.0%) |
| 75 Years and over | 6 (100.0%) | 10 (100.0%) |
| Total | 72 (92.3%) | 69 (73.4%) |
Income Below Poverty Among Married-Couple Families in Ruskin
The poverty statistics for married-couple families in Ruskin show that 10.9% or 6 of the total 55 families live below the poverty line. Families with 1 or 2 children have the highest poverty rate of 75.0%, comprising of 6 families. On the other hand, families with no children have the lowest poverty rate of 0.0%, which includes 0 families.
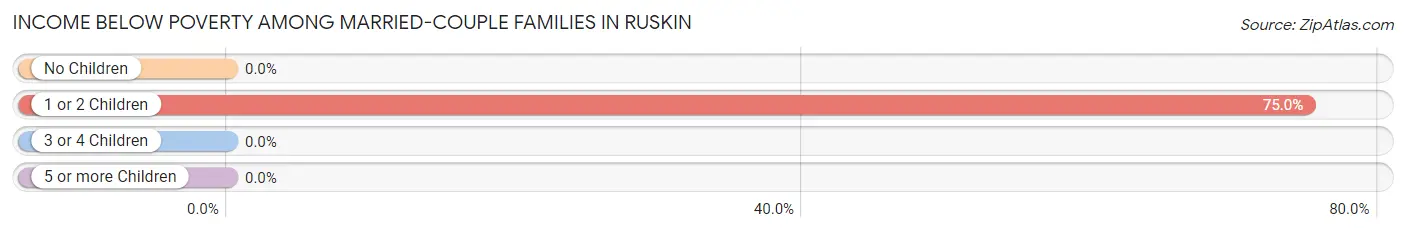
| Children | Above Poverty | Below Poverty |
| No Children | 46 (100.0%) | 0 (0.0%) |
| 1 or 2 Children | 2 (25.0%) | 6 (75.0%) |
| 3 or 4 Children | 1 (100.0%) | 0 (0.0%) |
| 5 or more Children | 0 (0.0%) | 0 (0.0%) |
| Total | 49 (89.1%) | 6 (10.9%) |
Income Below Poverty Among Single-Parent Households in Ruskin
| Children | Single Father | Single Mother |
| No Children | 0 (0.0%) | 0 (0.0%) |
| 1 or 2 Children | 0 (0.0%) | 0 (0.0%) |
| 3 or 4 Children | 0 (0.0%) | 0 (0.0%) |
| 5 or more Children | 0 (0.0%) | 0 (0.0%) |
| Total | 0 (0.0%) | 0 (0.0%) |
Income Below Poverty Among Married-Couple vs Single-Parent Households in Ruskin
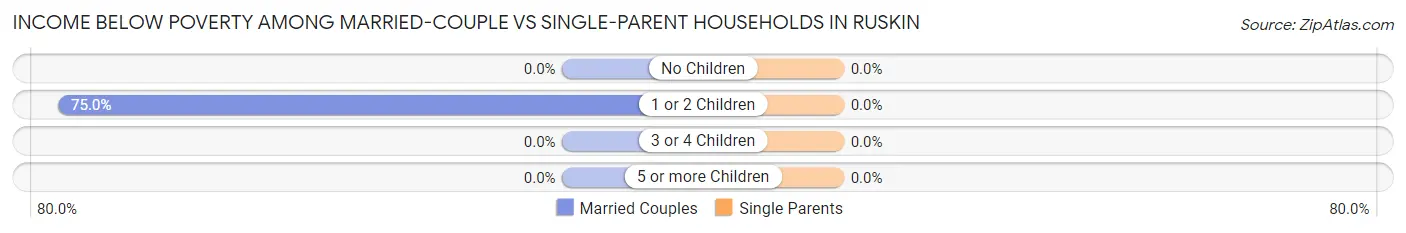
| Children | Married-Couple Families | Single-Parent Households |
| No Children | 0 (0.0%) | 0 (0.0%) |
| 1 or 2 Children | 6 (75.0%) | 0 (0.0%) |
| 3 or 4 Children | 0 (0.0%) | 0 (0.0%) |
| 5 or more Children | 0 (0.0%) | 0 (0.0%) |
| Total | 6 (10.9%) | 0 (0.0%) |
Race in Ruskin
The most populous races in Ruskin are White / Caucasian (158 | 91.9%), Hispanic or Latino (14 | 8.1%), and Some other Race (14 | 8.1%).
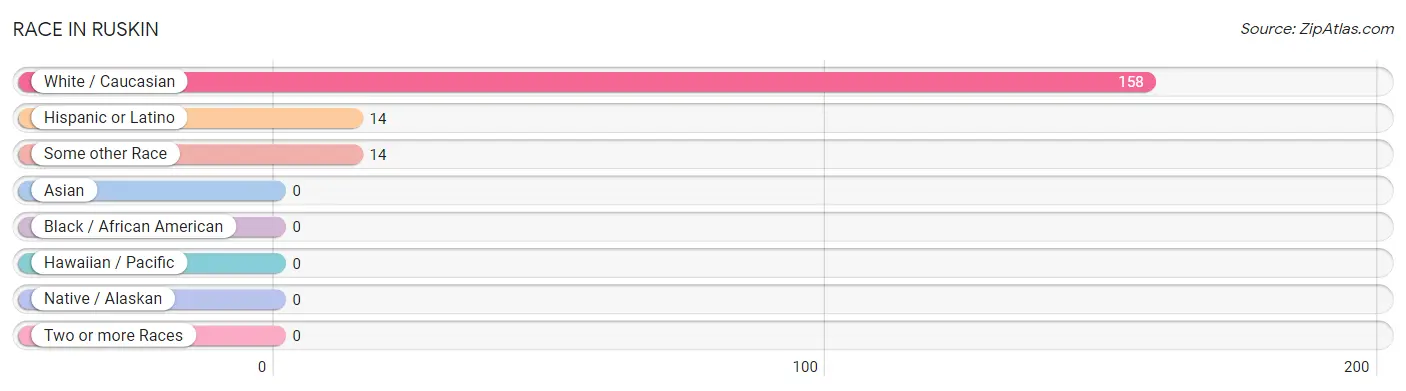
| Race | # Population | % Population |
| Asian | 0 | 0.0% |
| Black / African American | 0 | 0.0% |
| Hawaiian / Pacific | 0 | 0.0% |
| Hispanic or Latino | 14 | 8.1% |
| Native / Alaskan | 0 | 0.0% |
| White / Caucasian | 158 | 91.9% |
| Two or more Races | 0 | 0.0% |
| Some other Race | 14 | 8.1% |
| Total | 172 | 100.0% |
Ancestry in Ruskin
The most populous ancestries reported in Ruskin are German (99 | 57.6%), Italian (14 | 8.1%), Mexican (14 | 8.1%), Danish (9 | 5.2%), and Polish (9 | 5.2%), together accounting for 84.3% of all Ruskin residents.
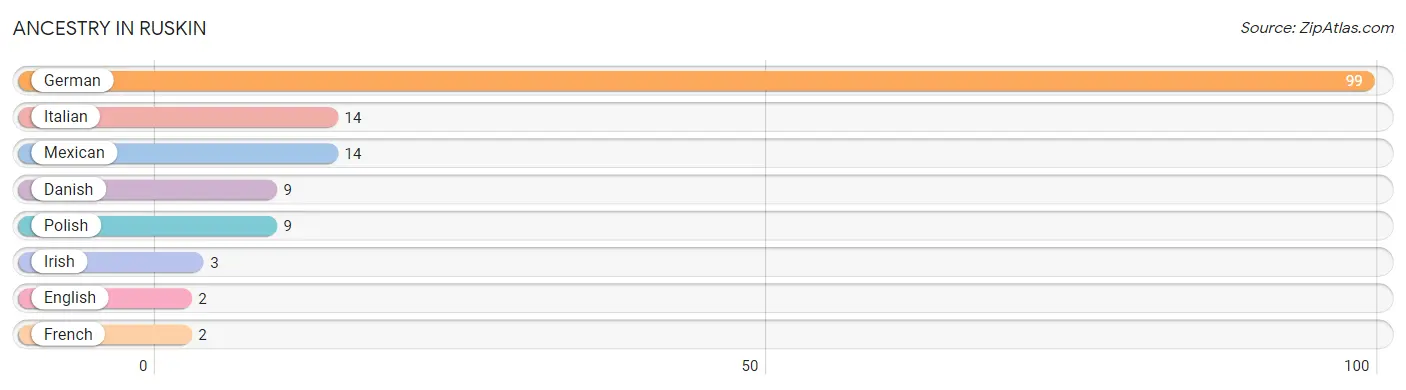
| Ancestry | # Population | % Population |
| Danish | 9 | 5.2% |
| English | 2 | 1.2% |
| French | 2 | 1.2% |
| German | 99 | 57.6% |
| Irish | 3 | 1.7% |
| Italian | 14 | 8.1% |
| Mexican | 14 | 8.1% |
| Polish | 9 | 5.2% | View All 8 Rows |
Immigrants in Ruskin
The most numerous immigrant groups reported in Ruskin came from Central America (14 | 8.1%), Latin America (14 | 8.1%), and Mexico (14 | 8.1%), together accounting for 24.4% of all Ruskin residents.
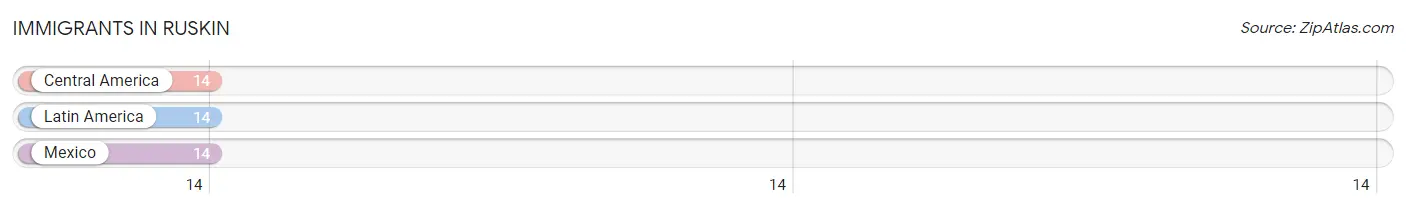
| Immigration Origin | # Population | % Population |
| Central America | 14 | 8.1% |
| Latin America | 14 | 8.1% |
| Mexico | 14 | 8.1% | View All 3 Rows |
Sex and Age in Ruskin
Sex and Age in Ruskin
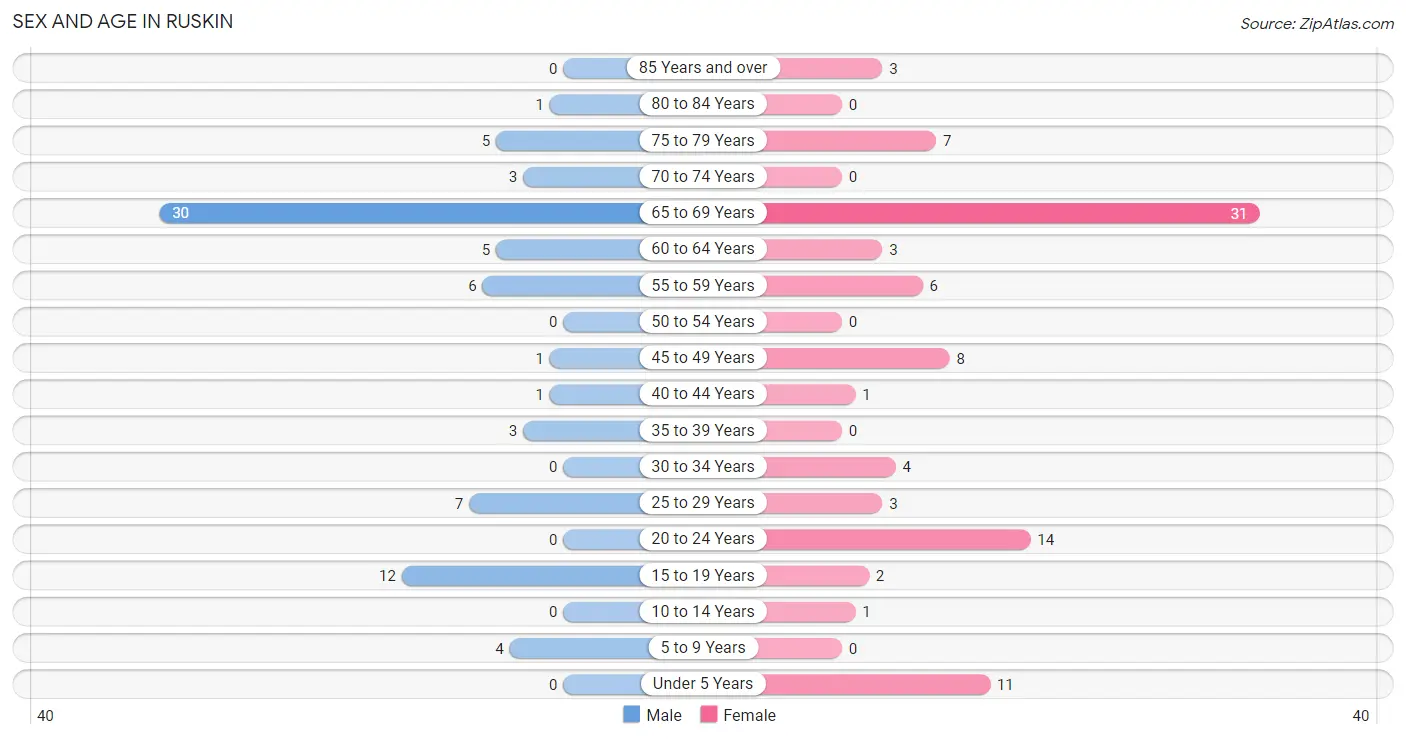
The most populous age groups in Ruskin are 65 to 69 Years (30 | 38.5%) for men and 65 to 69 Years (31 | 33.0%) for women.
| Age Bracket | Male | Female |
| Under 5 Years | 0 (0.0%) | 11 (11.7%) |
| 5 to 9 Years | 4 (5.1%) | 0 (0.0%) |
| 10 to 14 Years | 0 (0.0%) | 1 (1.1%) |
| 15 to 19 Years | 12 (15.4%) | 2 (2.1%) |
| 20 to 24 Years | 0 (0.0%) | 14 (14.9%) |
| 25 to 29 Years | 7 (9.0%) | 3 (3.2%) |
| 30 to 34 Years | 0 (0.0%) | 4 (4.3%) |
| 35 to 39 Years | 3 (3.8%) | 0 (0.0%) |
| 40 to 44 Years | 1 (1.3%) | 1 (1.1%) |
| 45 to 49 Years | 1 (1.3%) | 8 (8.5%) |
| 50 to 54 Years | 0 (0.0%) | 0 (0.0%) |
| 55 to 59 Years | 6 (7.7%) | 6 (6.4%) |
| 60 to 64 Years | 5 (6.4%) | 3 (3.2%) |
| 65 to 69 Years | 30 (38.5%) | 31 (33.0%) |
| 70 to 74 Years | 3 (3.8%) | 0 (0.0%) |
| 75 to 79 Years | 5 (6.4%) | 7 (7.4%) |
| 80 to 84 Years | 1 (1.3%) | 0 (0.0%) |
| 85 Years and over | 0 (0.0%) | 3 (3.2%) |
| Total | 78 (100.0%) | 94 (100.0%) |
Families and Households in Ruskin
Median Family Size in Ruskin
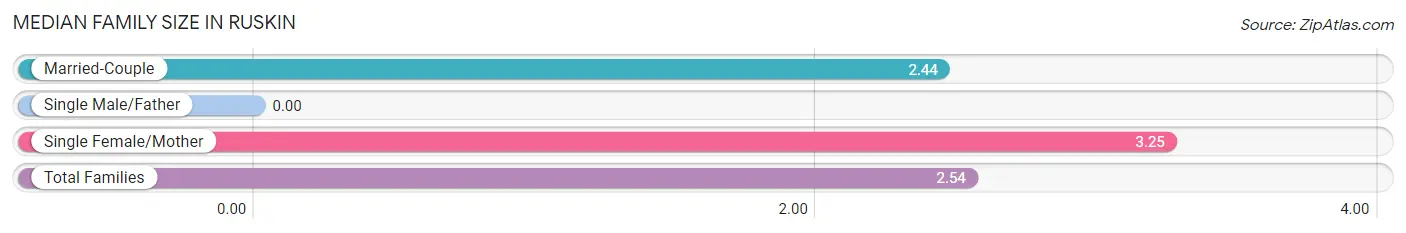
| Family Type | # Families | Family Size |
| Married-Couple | 55 (87.3%) | 2.44 |
| Single Male/Father | 0 (0.0%) | - |
| Single Female/Mother | 8 (12.7%) | 3.25 |
| Total Families | 63 (100.0%) | 2.54 |
Median Household Size in Ruskin
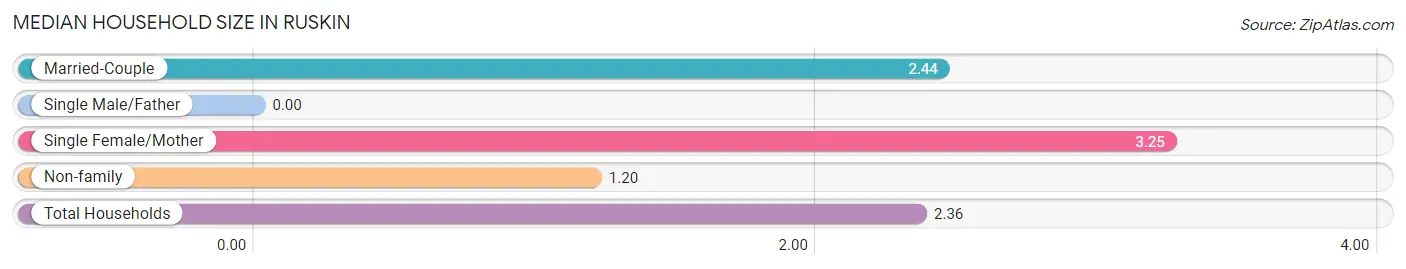
| Household Type | # Households | Household Size |
| Married-Couple | 55 (75.3%) | 2.44 |
| Single Male/Father | 0 (0.0%) | - |
| Single Female/Mother | 8 (11.0%) | 3.25 |
| Non-family | 10 (13.7%) | 1.20 |
| Total Households | 73 (100.0%) | 2.36 |
Household Size by Marriage Status in Ruskin
Out of a total of 73 households in Ruskin, 63 (86.3%) are family households, while 10 (13.7%) are nonfamily households. The most numerous type of family households are 2-person households, comprising 44, and the most common type of nonfamily households are 1-person households, comprising 8.
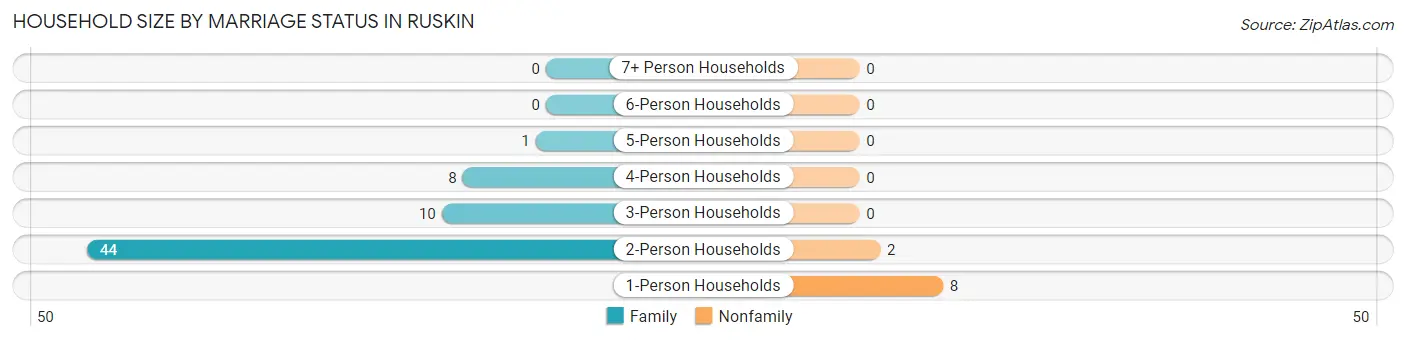
| Household Size | Family Households | Nonfamily Households |
| 1-Person Households | - | 8 (11.0%) |
| 2-Person Households | 44 (60.3%) | 2 (2.7%) |
| 3-Person Households | 10 (13.7%) | 0 (0.0%) |
| 4-Person Households | 8 (11.0%) | 0 (0.0%) |
| 5-Person Households | 1 (1.4%) | 0 (0.0%) |
| 6-Person Households | 0 (0.0%) | 0 (0.0%) |
| 7+ Person Households | 0 (0.0%) | 0 (0.0%) |
| Total | 63 (86.3%) | 10 (13.7%) |
Female Fertility in Ruskin
Fertility by Age in Ruskin
| Age Bracket | Women with Births | Births / 1,000 Women |
| 15 to 19 years | 0 (0.0%) | 0.0 |
| 20 to 34 years | 0 (0.0%) | 0.0 |
| 35 to 50 years | 0 (0.0%) | 0.0 |
| Total | 0 (0.0%) | 0.0 |
Fertility by Age by Marriage Status in Ruskin
| Age Bracket | Married | Unmarried |
| 15 to 19 years | 0 (0.0%) | 0 (0.0%) |
| 20 to 34 years | 0 (0.0%) | 0 (0.0%) |
| 35 to 50 years | 0 (0.0%) | 0 (0.0%) |
| Total | 0 (0.0%) | 0 (0.0%) |
Fertility by Education in Ruskin
| Educational Attainment | Women with Births | Births / 1,000 Women |
| Less than High School | 0 (0.0%) | 0.0 |
| High School Diploma | 0 (0.0%) | 0.0 |
| College or Associate's Degree | 0 (0.0%) | 0.0 |
| Bachelor's Degree | 0 (0.0%) | 0.0 |
| Graduate Degree | 0 (0.0%) | 0.0 |
| Total | 0 (0.0%) | 0.0 |
Fertility by Education by Marriage Status in Ruskin
| Educational Attainment | Married | Unmarried |
| Less than High School | 0 (0.0%) | 0 (0.0%) |
| High School Diploma | 0 (0.0%) | 0 (0.0%) |
| College or Associate's Degree | 0 (0.0%) | 0 (0.0%) |
| Bachelor's Degree | 0 (0.0%) | 0 (0.0%) |
| Graduate Degree | 0 (0.0%) | 0 (0.0%) |
| Total | 0 (0.0%) | 0 (0.0%) |
Employment Characteristics in Ruskin
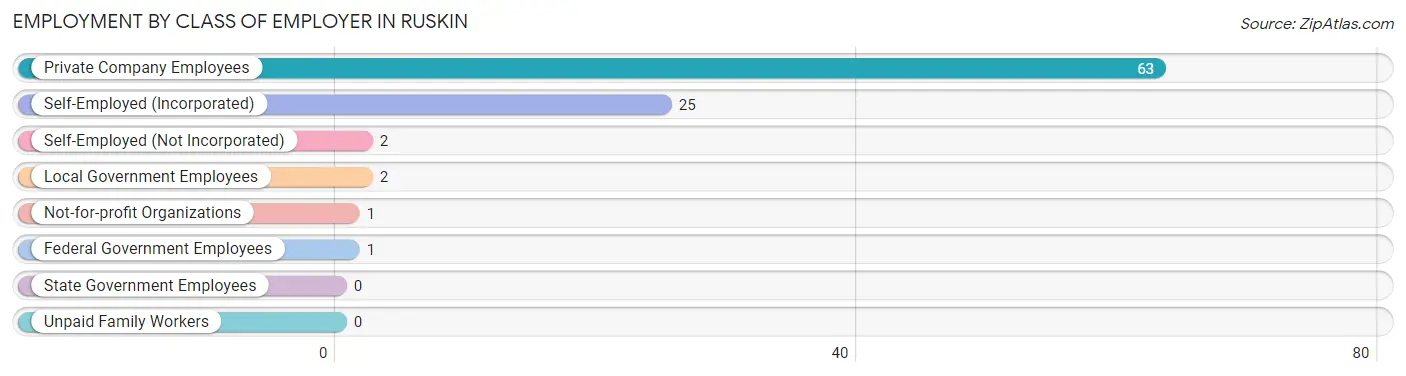
Employment by Class of Employer in Ruskin
Among the 94 employed individuals in Ruskin, private company employees (63 | 67.0%), self-employed (incorporated) (25 | 26.6%), and self-employed (not incorporated) (2 | 2.1%) make up the most common classes of employment.
| Employer Class | # Employees | % Employees |
| Private Company Employees | 63 | 67.0% |
| Self-Employed (Incorporated) | 25 | 26.6% |
| Self-Employed (Not Incorporated) | 2 | 2.1% |
| Not-for-profit Organizations | 1 | 1.1% |
| Local Government Employees | 2 | 2.1% |
| State Government Employees | 0 | 0.0% |
| Federal Government Employees | 1 | 1.1% |
| Unpaid Family Workers | 0 | 0.0% |
| Total | 94 | 100.0% |
Employment Status by Age in Ruskin
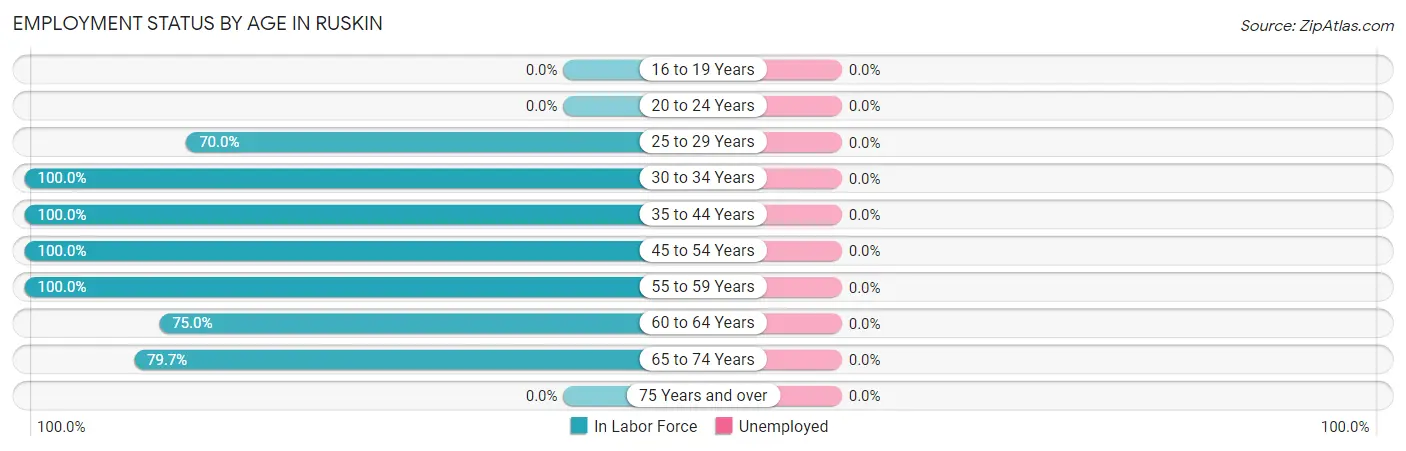
| Age Bracket | In Labor Force | Unemployed |
| 16 to 19 Years | 0 (0.0%) | 0 (0.0%) |
| 20 to 24 Years | 0 (0.0%) | 0 (0.0%) |
| 25 to 29 Years | 7 (70.0%) | 0 (0.0%) |
| 30 to 34 Years | 4 (100.0%) | 0 (0.0%) |
| 35 to 44 Years | 5 (100.0%) | 0 (0.0%) |
| 45 to 54 Years | 9 (100.0%) | 0 (0.0%) |
| 55 to 59 Years | 12 (100.0%) | 0 (0.0%) |
| 60 to 64 Years | 6 (75.0%) | 0 (0.0%) |
| 65 to 74 Years | 51 (79.7%) | 0 (0.0%) |
| 75 Years and over | 0 (0.0%) | 0 (0.0%) |
| Total | 94 (60.3%) | 0 (0.0%) |
Employment Status by Educational Attainment in Ruskin
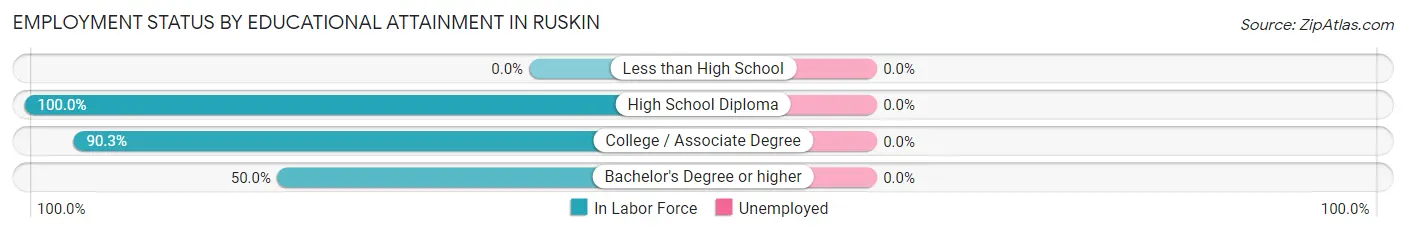
| Educational Attainment | In Labor Force | Unemployed |
| Less than High School | 0 (0.0%) | 0 (0.0%) |
| High School Diploma | 13 (100.0%) | 0 (0.0%) |
| College / Associate Degree | 28 (90.3%) | 0 (0.0%) |
| Bachelor's Degree or higher | 2 (50.0%) | 0 (0.0%) |
| Total | 43 (89.6%) | 0 (0.0%) |
Employment Occupations by Sex in Ruskin
Management, Business, Science and Arts Occupations
The most common Management, Business, Science and Arts occupations in Ruskin are Management (26 | 27.7%), Community & Social Service (1 | 1.1%), and Education, Arts & Media (1 | 1.1%).
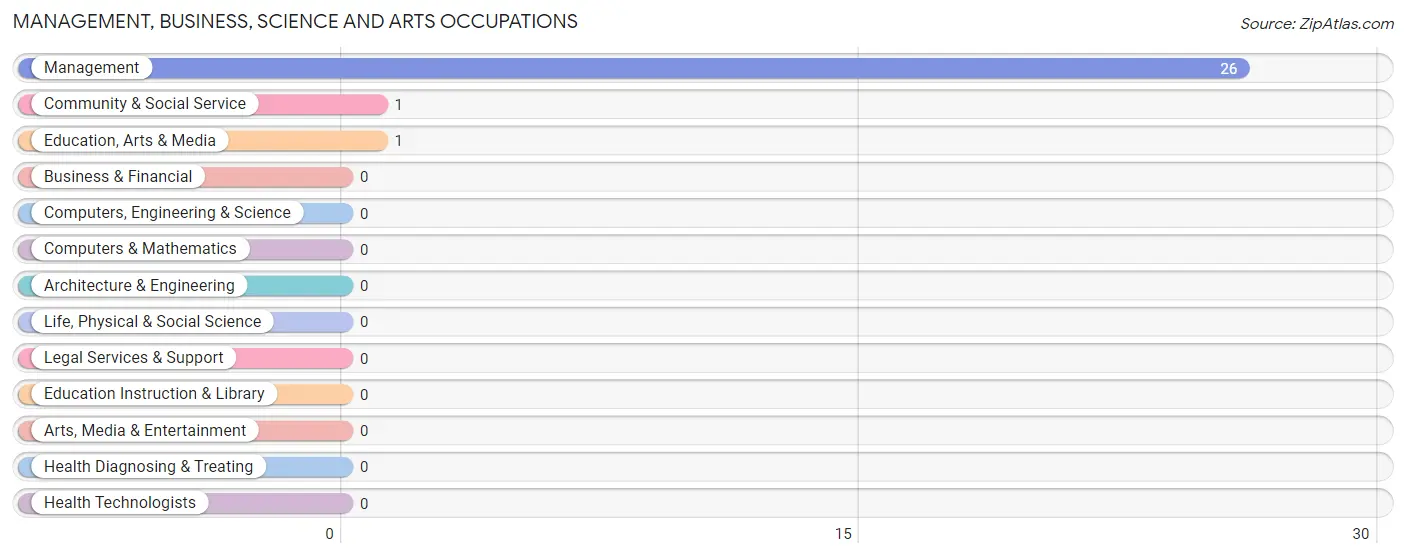
Management, Business, Science and Arts Occupations by Sex
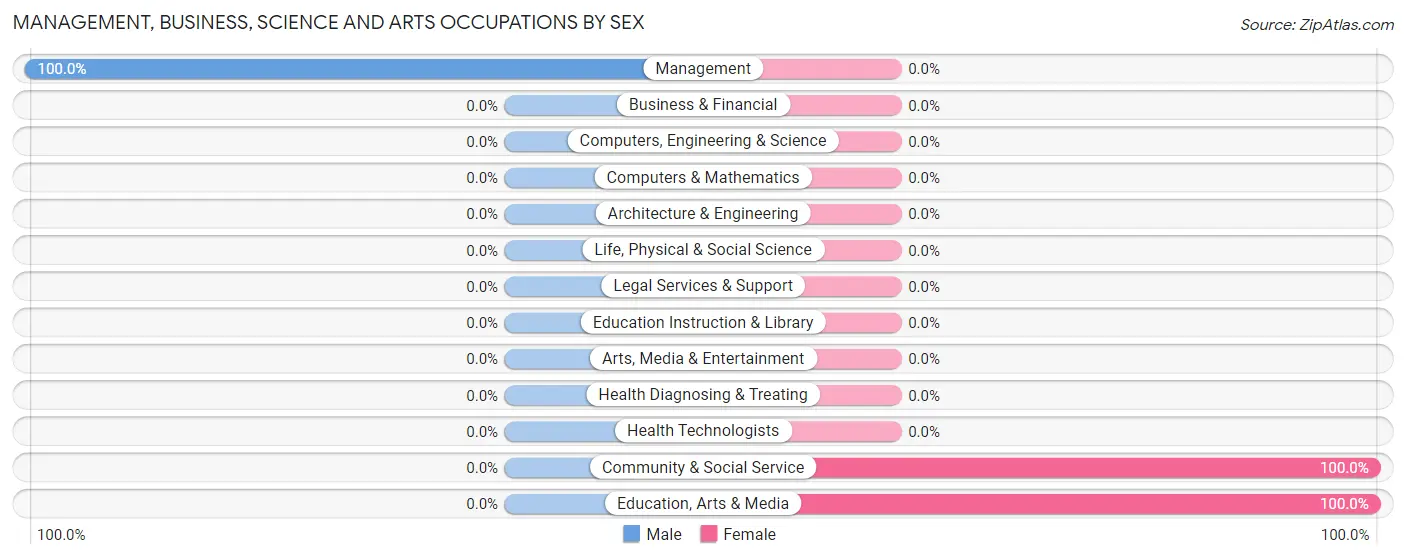
| Occupation | Male | Female |
| Management | 26 (100.0%) | 0 (0.0%) |
| Business & Financial | 0 (0.0%) | 0 (0.0%) |
| Computers, Engineering & Science | 0 (0.0%) | 0 (0.0%) |
| Computers & Mathematics | 0 (0.0%) | 0 (0.0%) |
| Architecture & Engineering | 0 (0.0%) | 0 (0.0%) |
| Life, Physical & Social Science | 0 (0.0%) | 0 (0.0%) |
| Community & Social Service | 0 (0.0%) | 1 (100.0%) |
| Education, Arts & Media | 0 (0.0%) | 1 (100.0%) |
| Legal Services & Support | 0 (0.0%) | 0 (0.0%) |
| Education Instruction & Library | 0 (0.0%) | 0 (0.0%) |
| Arts, Media & Entertainment | 0 (0.0%) | 0 (0.0%) |
| Health Diagnosing & Treating | 0 (0.0%) | 0 (0.0%) |
| Health Technologists | 0 (0.0%) | 0 (0.0%) |
| Total (Category) | 26 (96.3%) | 1 (3.7%) |
| Total (Overall) | 52 (55.3%) | 42 (44.7%) |
Services Occupations
The most common Services occupations in Ruskin are Food Preparation & Serving (6 | 6.4%), Cleaning & Maintenance (3 | 3.2%), and Personal Care & Service (2 | 2.1%).
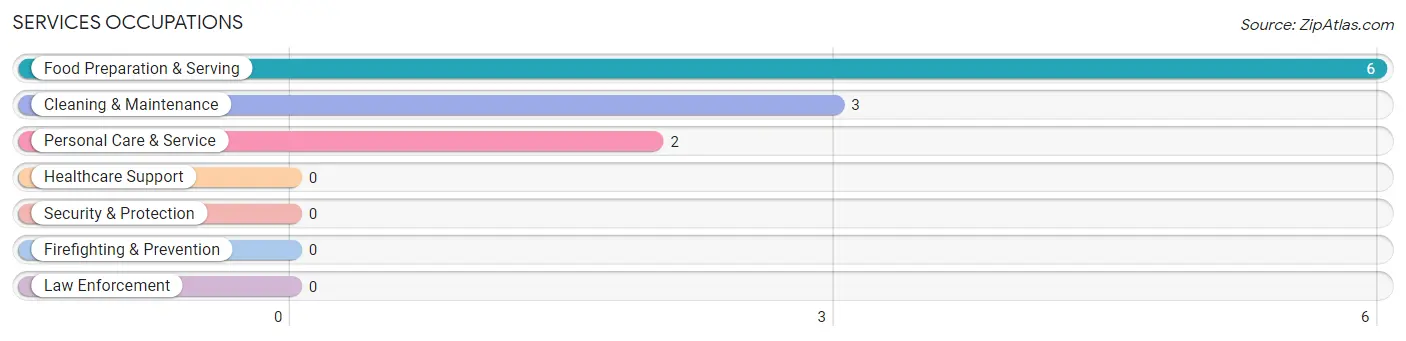
Services Occupations by Sex
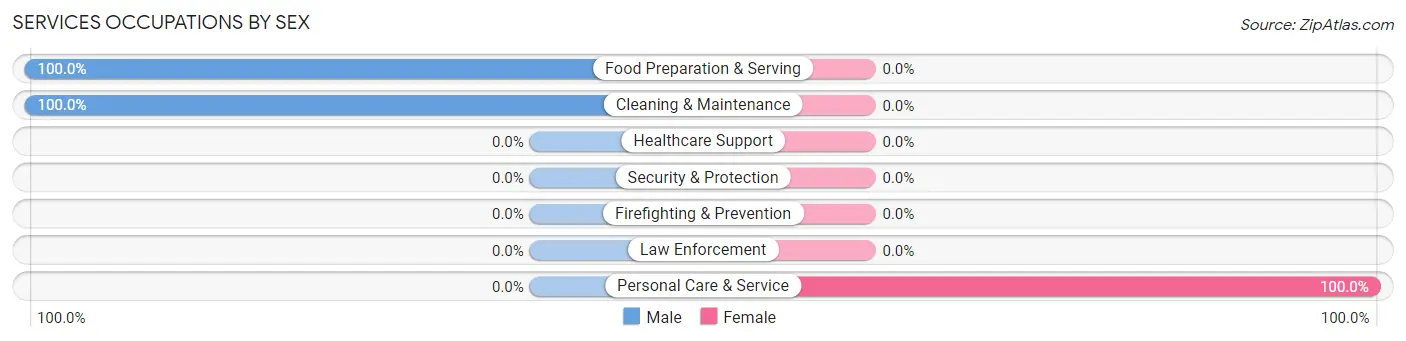
| Occupation | Male | Female |
| Healthcare Support | 0 (0.0%) | 0 (0.0%) |
| Security & Protection | 0 (0.0%) | 0 (0.0%) |
| Firefighting & Prevention | 0 (0.0%) | 0 (0.0%) |
| Law Enforcement | 0 (0.0%) | 0 (0.0%) |
| Food Preparation & Serving | 6 (100.0%) | 0 (0.0%) |
| Cleaning & Maintenance | 3 (100.0%) | 0 (0.0%) |
| Personal Care & Service | 0 (0.0%) | 2 (100.0%) |
| Total (Category) | 9 (81.8%) | 2 (18.2%) |
| Total (Overall) | 52 (55.3%) | 42 (44.7%) |
Sales and Office Occupations
The most common Sales and Office occupations in Ruskin are Office & Administration (31 | 33.0%), and Sales & Related (10 | 10.6%).

Sales and Office Occupations by Sex

| Occupation | Male | Female |
| Sales & Related | 2 (20.0%) | 8 (80.0%) |
| Office & Administration | 0 (0.0%) | 31 (100.0%) |
| Total (Category) | 2 (4.9%) | 39 (95.1%) |
| Total (Overall) | 52 (55.3%) | 42 (44.7%) |
Natural Resources, Construction and Maintenance Occupations
The most common Natural Resources, Construction and Maintenance occupations in Ruskin are Construction & Extraction (2 | 2.1%), Installation, Maintenance & Repair (2 | 2.1%), and Farming, Fishing & Forestry (1 | 1.1%).
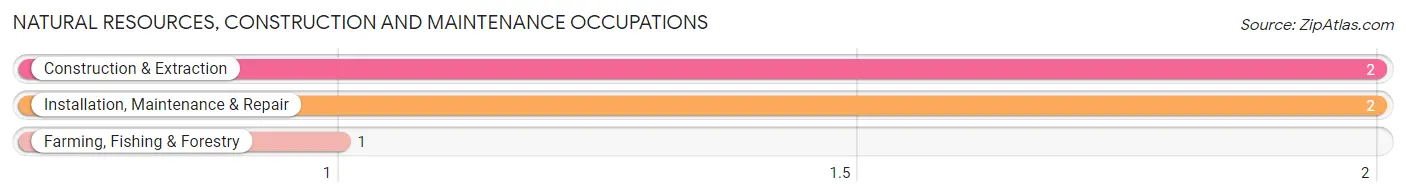
Natural Resources, Construction and Maintenance Occupations by Sex
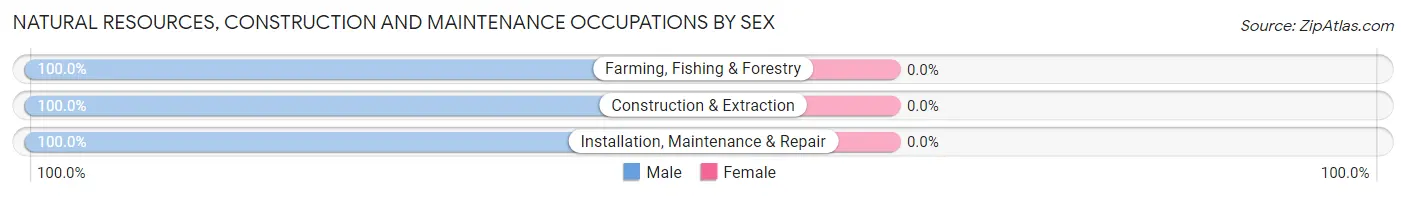
| Occupation | Male | Female |
| Farming, Fishing & Forestry | 1 (100.0%) | 0 (0.0%) |
| Construction & Extraction | 2 (100.0%) | 0 (0.0%) |
| Installation, Maintenance & Repair | 2 (100.0%) | 0 (0.0%) |
| Total (Category) | 5 (100.0%) | 0 (0.0%) |
| Total (Overall) | 52 (55.3%) | 42 (44.7%) |
Production, Transportation and Moving Occupations
The most common Production, Transportation and Moving occupations in Ruskin are Transportation (8 | 8.5%), Production (1 | 1.1%), and Material Moving (1 | 1.1%).
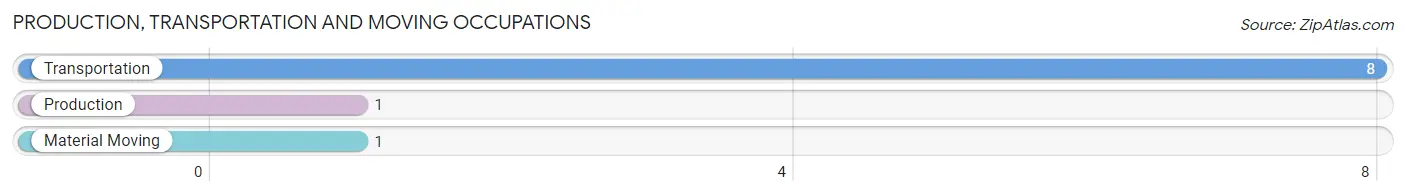
Production, Transportation and Moving Occupations by Sex
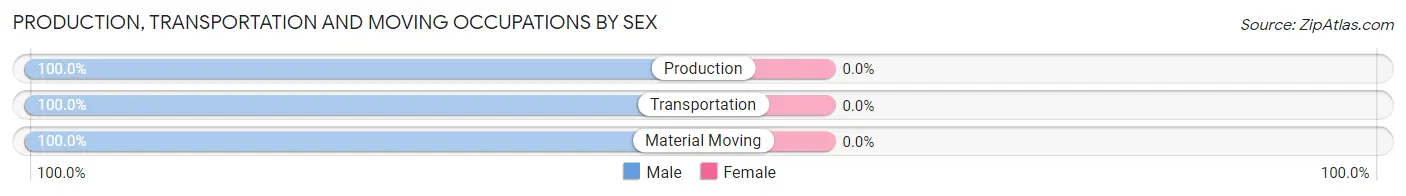
| Occupation | Male | Female |
| Production | 1 (100.0%) | 0 (0.0%) |
| Transportation | 8 (100.0%) | 0 (0.0%) |
| Material Moving | 1 (100.0%) | 0 (0.0%) |
| Total (Category) | 10 (100.0%) | 0 (0.0%) |
| Total (Overall) | 52 (55.3%) | 42 (44.7%) |
Employment Industries by Sex in Ruskin
Employment Industries in Ruskin
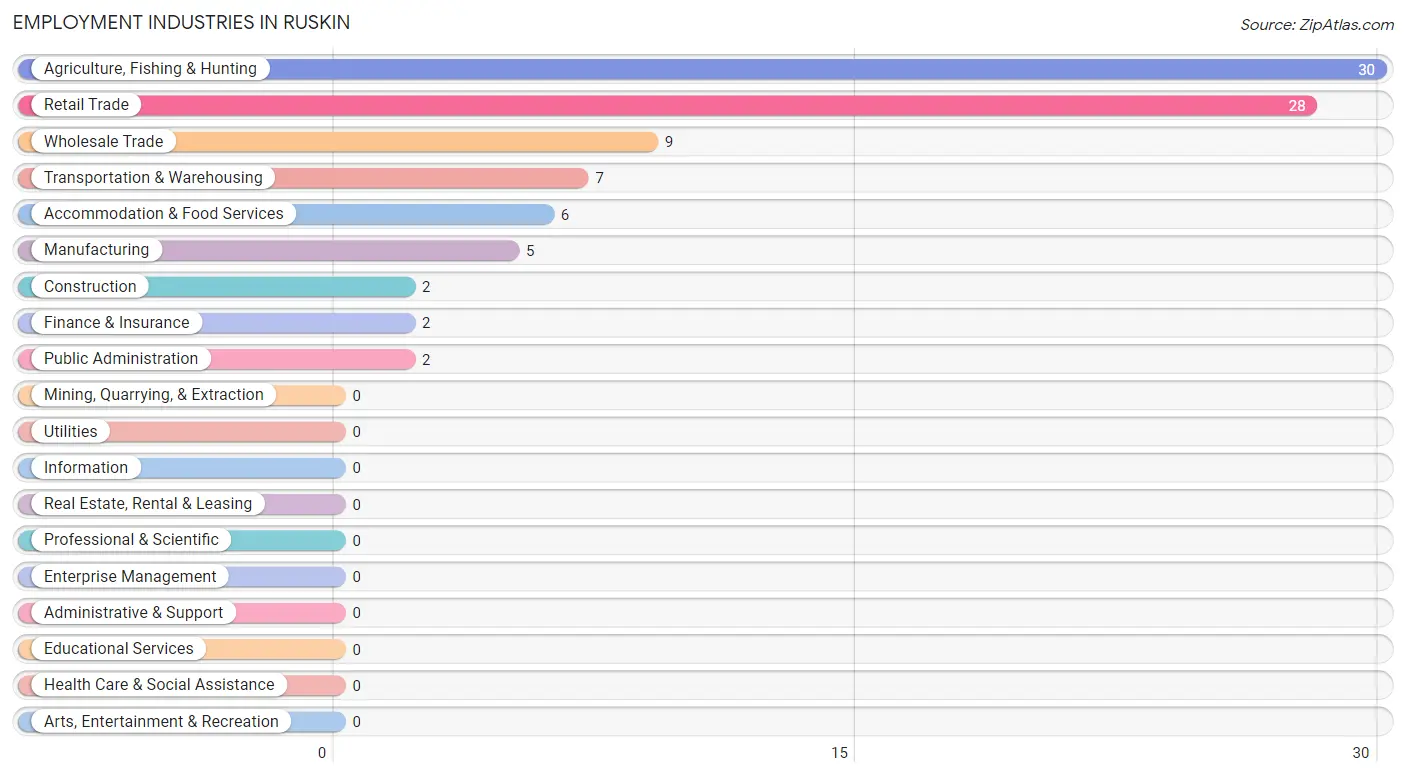
The major employment industries in Ruskin include Agriculture, Fishing & Hunting (30 | 31.9%), Retail Trade (28 | 29.8%), Wholesale Trade (9 | 9.6%), Transportation & Warehousing (7 | 7.4%), and Accommodation & Food Services (6 | 6.4%).
Employment Industries by Sex in Ruskin
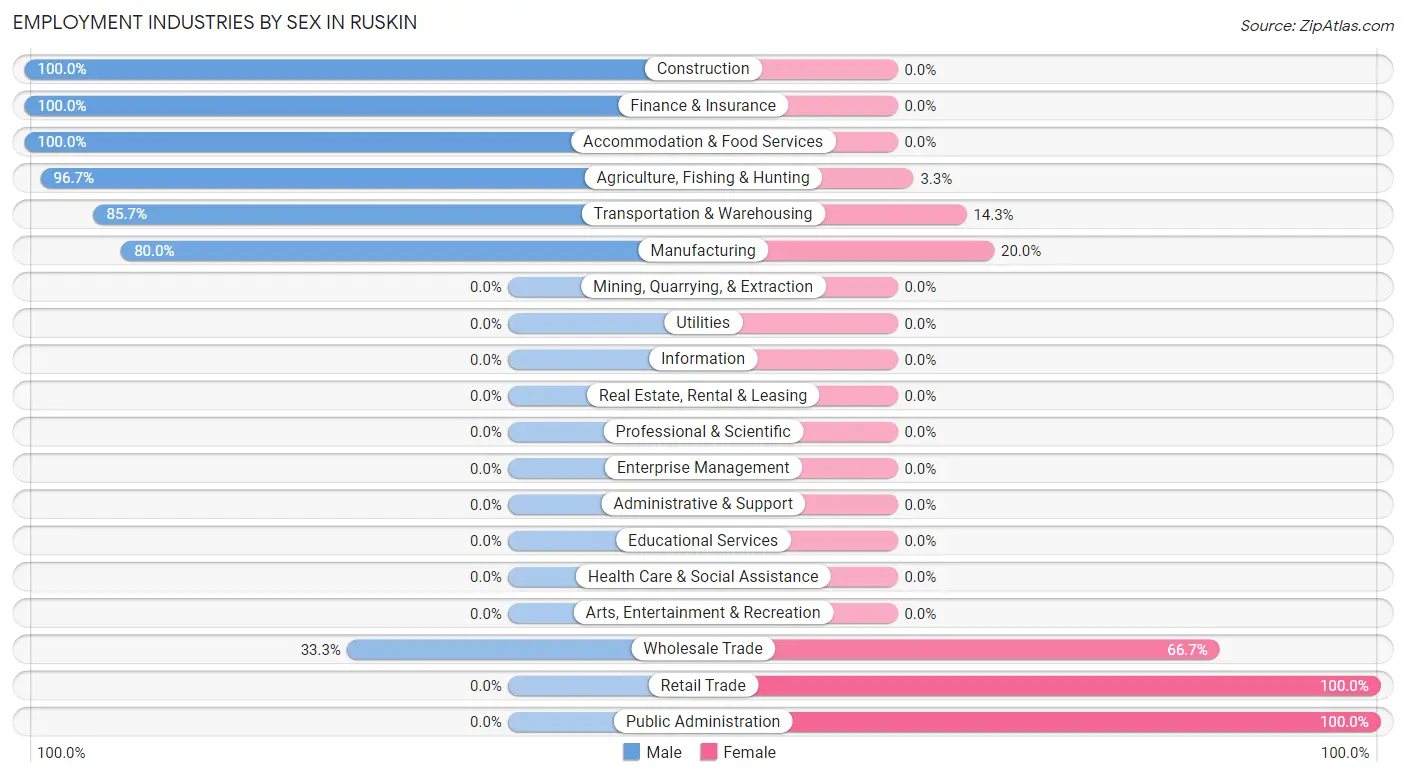
The Ruskin industries that see more men than women are Construction (100.0%), Finance & Insurance (100.0%), and Accommodation & Food Services (100.0%), whereas the industries that tend to have a higher number of women are Retail Trade (100.0%), Public Administration (100.0%), and Wholesale Trade (66.7%).
| Industry | Male | Female |
| Agriculture, Fishing & Hunting | 29 (96.7%) | 1 (3.3%) |
| Mining, Quarrying, & Extraction | 0 (0.0%) | 0 (0.0%) |
| Construction | 2 (100.0%) | 0 (0.0%) |
| Manufacturing | 4 (80.0%) | 1 (20.0%) |
| Wholesale Trade | 3 (33.3%) | 6 (66.7%) |
| Retail Trade | 0 (0.0%) | 28 (100.0%) |
| Transportation & Warehousing | 6 (85.7%) | 1 (14.3%) |
| Utilities | 0 (0.0%) | 0 (0.0%) |
| Information | 0 (0.0%) | 0 (0.0%) |
| Finance & Insurance | 2 (100.0%) | 0 (0.0%) |
| Real Estate, Rental & Leasing | 0 (0.0%) | 0 (0.0%) |
| Professional & Scientific | 0 (0.0%) | 0 (0.0%) |
| Enterprise Management | 0 (0.0%) | 0 (0.0%) |
| Administrative & Support | 0 (0.0%) | 0 (0.0%) |
| Educational Services | 0 (0.0%) | 0 (0.0%) |
| Health Care & Social Assistance | 0 (0.0%) | 0 (0.0%) |
| Arts, Entertainment & Recreation | 0 (0.0%) | 0 (0.0%) |
| Accommodation & Food Services | 6 (100.0%) | 0 (0.0%) |
| Public Administration | 0 (0.0%) | 2 (100.0%) |
| Total | 52 (55.3%) | 42 (44.7%) |
Education in Ruskin
School Enrollment in Ruskin
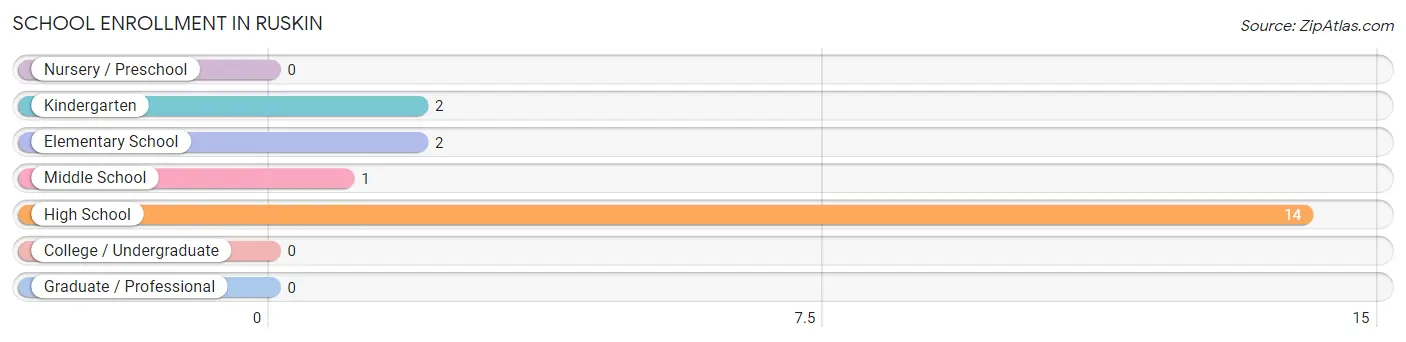
The most common levels of schooling among the 19 students in Ruskin are high school (14 | 73.7%), kindergarten (2 | 10.5%), and elementary school (2 | 10.5%).
| School Level | # Students | % Students |
| Nursery / Preschool | 0 | 0.0% |
| Kindergarten | 2 | 10.5% |
| Elementary School | 2 | 10.5% |
| Middle School | 1 | 5.3% |
| High School | 14 | 73.7% |
| College / Undergraduate | 0 | 0.0% |
| Graduate / Professional | 0 | 0.0% |
| Total | 19 | 100.0% |
School Enrollment by Age by Funding Source in Ruskin
| Age Bracket | Public School | Private School |
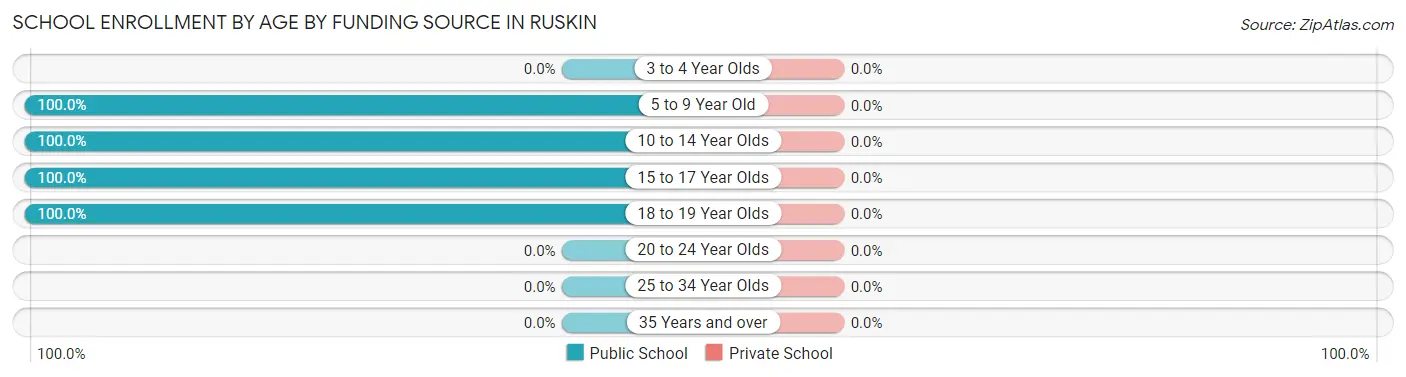
| 3 to 4 Year Olds | 0 (0.0%) | 0 (0.0%) |
| 5 to 9 Year Old | 4 (100.0%) | 0 (0.0%) |
| 10 to 14 Year Olds | 1 (100.0%) | 0 (0.0%) |
| 15 to 17 Year Olds | 2 (100.0%) | 0 (0.0%) |
| 18 to 19 Year Olds | 12 (100.0%) | 0 (0.0%) |
| 20 to 24 Year Olds | 0 (0.0%) | 0 (0.0%) |
| 25 to 34 Year Olds | 0 (0.0%) | 0 (0.0%) |
| 35 Years and over | 0 (0.0%) | 0 (0.0%) |
| Total | 19 (100.0%) | 0 (0.0%) |
Educational Attainment by Field of Study in Ruskin
Bio, nature & agricultural (27 | 75.0%), education (4 | 11.1%), business (2 | 5.6%), literature & languages (1 | 2.8%), and liberal arts & history (1 | 2.8%) are the most common fields of study among 36 individuals in Ruskin who have obtained a bachelor's degree or higher.
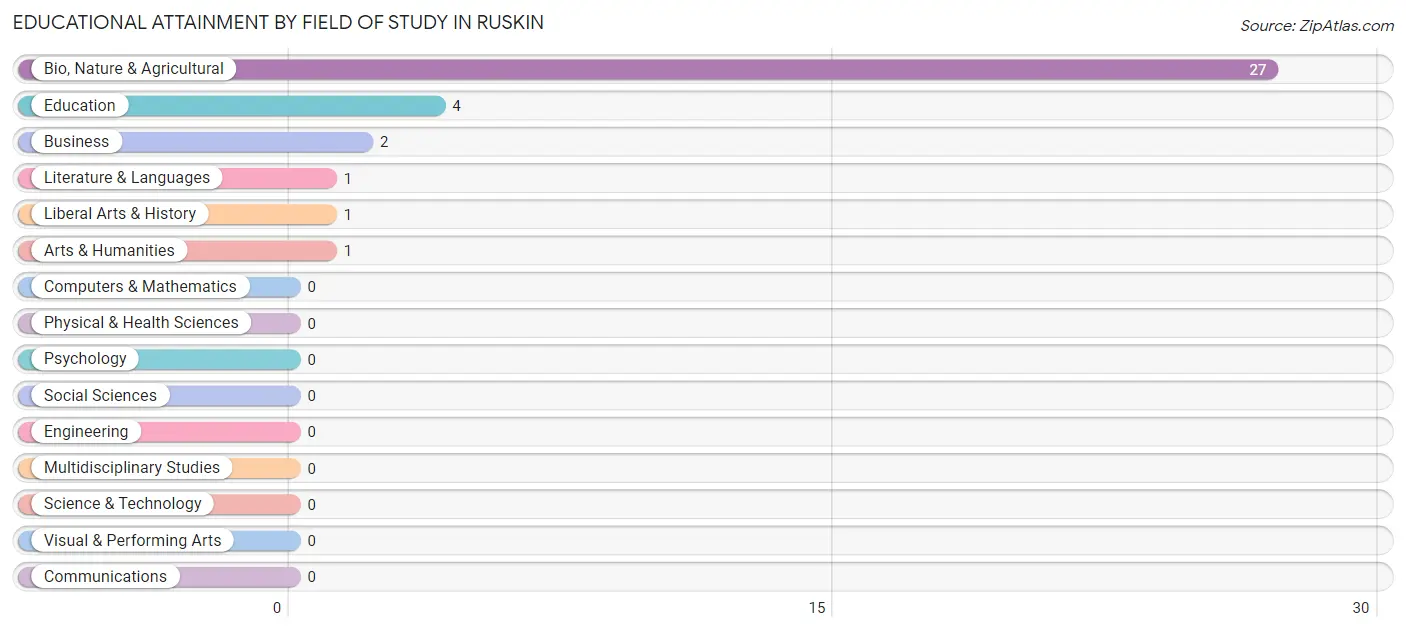
| Field of Study | # Graduates | % Graduates |
| Computers & Mathematics | 0 | 0.0% |
| Bio, Nature & Agricultural | 27 | 75.0% |
| Physical & Health Sciences | 0 | 0.0% |
| Psychology | 0 | 0.0% |
| Social Sciences | 0 | 0.0% |
| Engineering | 0 | 0.0% |
| Multidisciplinary Studies | 0 | 0.0% |
| Science & Technology | 0 | 0.0% |
| Business | 2 | 5.6% |
| Education | 4 | 11.1% |
| Literature & Languages | 1 | 2.8% |
| Liberal Arts & History | 1 | 2.8% |
| Visual & Performing Arts | 0 | 0.0% |
| Communications | 0 | 0.0% |
| Arts & Humanities | 1 | 2.8% |
| Total | 36 | 100.0% |
Transportation & Commute in Ruskin
Vehicle Availability by Sex in Ruskin
The most prevalent vehicle ownership categories in Ruskin are males with 2 vehicles (31, accounting for 59.6%) and females with 2 vehicles (24, making up 73.8%).
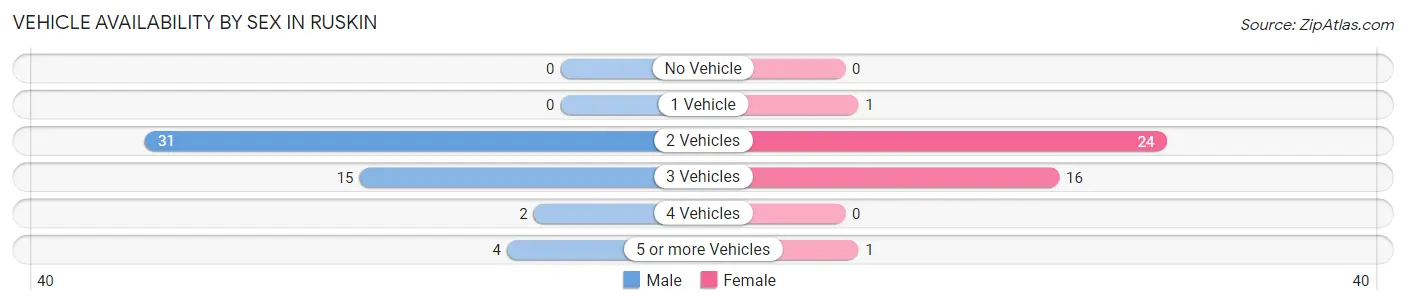
| Vehicles Available | Male | Female |
| No Vehicle | 0 (0.0%) | 0 (0.0%) |
| 1 Vehicle | 0 (0.0%) | 1 (2.4%) |
| 2 Vehicles | 31 (59.6%) | 24 (57.1%) |
| 3 Vehicles | 15 (28.8%) | 16 (38.1%) |
| 4 Vehicles | 2 (3.8%) | 0 (0.0%) |
| 5 or more Vehicles | 4 (7.7%) | 1 (2.4%) |
| Total | 52 (100.0%) | 42 (100.0%) |
Commute Time in Ruskin
The most frequently occuring commute durations in Ruskin are less than 5 minutes (28 commuters, 31.1%), 15 to 19 minutes (25 commuters, 27.8%), and 20 to 24 minutes (24 commuters, 26.7%).
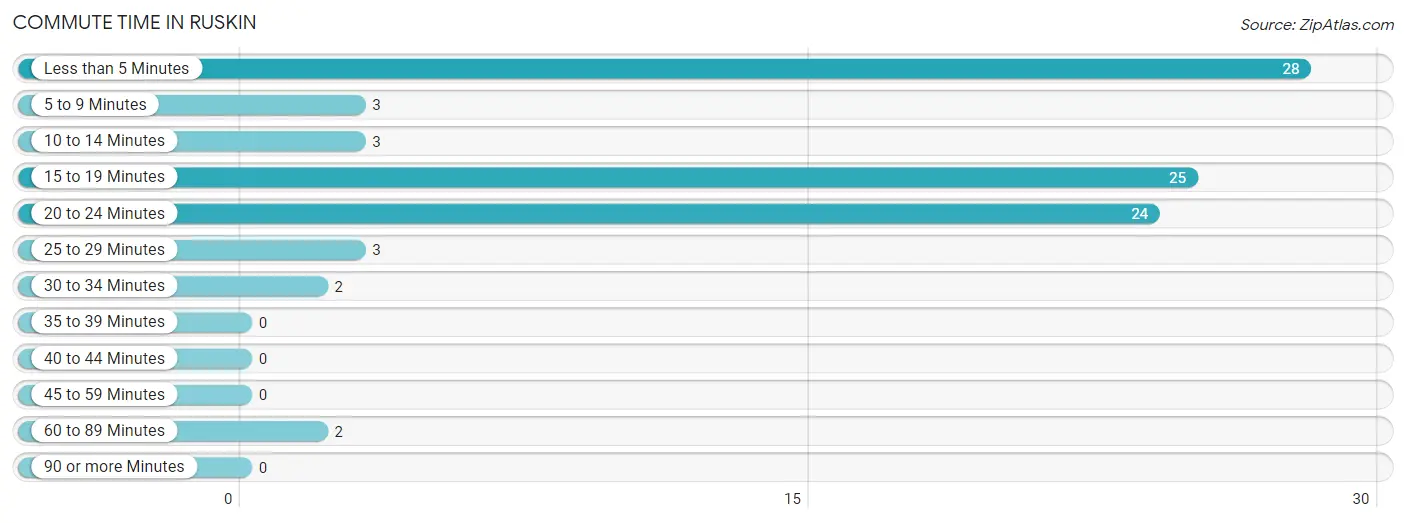
| Commute Time | # Commuters | % Commuters |
| Less than 5 Minutes | 28 | 31.1% |
| 5 to 9 Minutes | 3 | 3.3% |
| 10 to 14 Minutes | 3 | 3.3% |
| 15 to 19 Minutes | 25 | 27.8% |
| 20 to 24 Minutes | 24 | 26.7% |
| 25 to 29 Minutes | 3 | 3.3% |
| 30 to 34 Minutes | 2 | 2.2% |
| 35 to 39 Minutes | 0 | 0.0% |
| 40 to 44 Minutes | 0 | 0.0% |
| 45 to 59 Minutes | 0 | 0.0% |
| 60 to 89 Minutes | 2 | 2.2% |
| 90 or more Minutes | 0 | 0.0% |
Commute Time by Sex in Ruskin
The most common commute times in Ruskin are 15 to 19 minutes (25 commuters, 50.0%) for males and less than 5 minutes (26 commuters, 65.0%) for females.
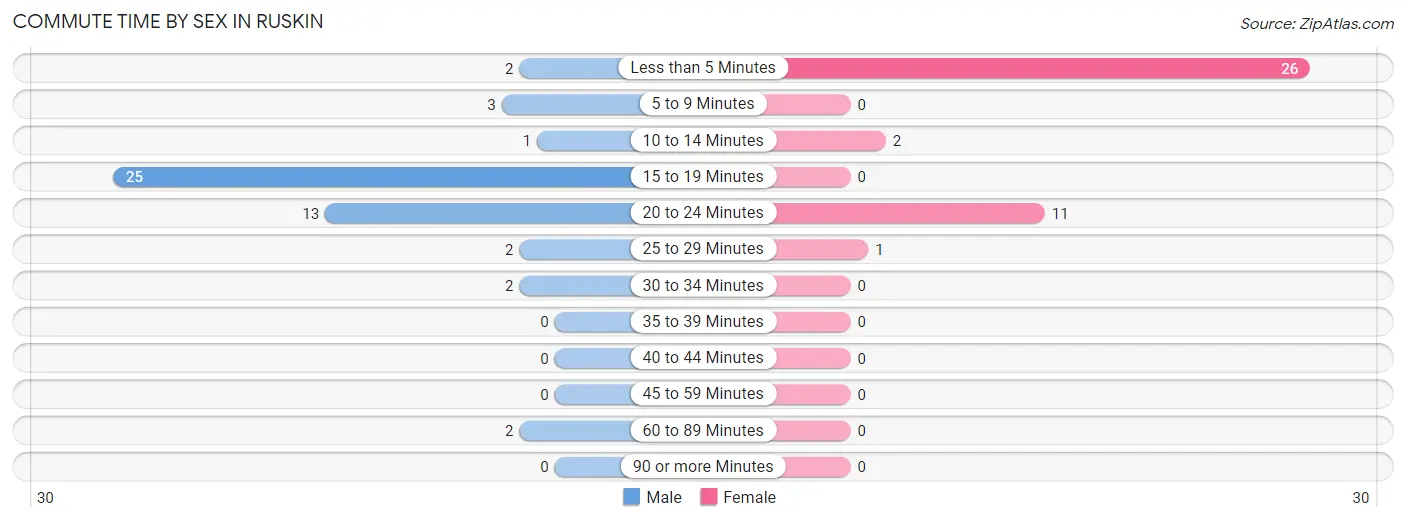
| Commute Time | Male | Female |
| Less than 5 Minutes | 2 (4.0%) | 26 (65.0%) |
| 5 to 9 Minutes | 3 (6.0%) | 0 (0.0%) |
| 10 to 14 Minutes | 1 (2.0%) | 2 (5.0%) |
| 15 to 19 Minutes | 25 (50.0%) | 0 (0.0%) |
| 20 to 24 Minutes | 13 (26.0%) | 11 (27.5%) |
| 25 to 29 Minutes | 2 (4.0%) | 1 (2.5%) |
| 30 to 34 Minutes | 2 (4.0%) | 0 (0.0%) |
| 35 to 39 Minutes | 0 (0.0%) | 0 (0.0%) |
| 40 to 44 Minutes | 0 (0.0%) | 0 (0.0%) |
| 45 to 59 Minutes | 0 (0.0%) | 0 (0.0%) |
| 60 to 89 Minutes | 2 (4.0%) | 0 (0.0%) |
| 90 or more Minutes | 0 (0.0%) | 0 (0.0%) |
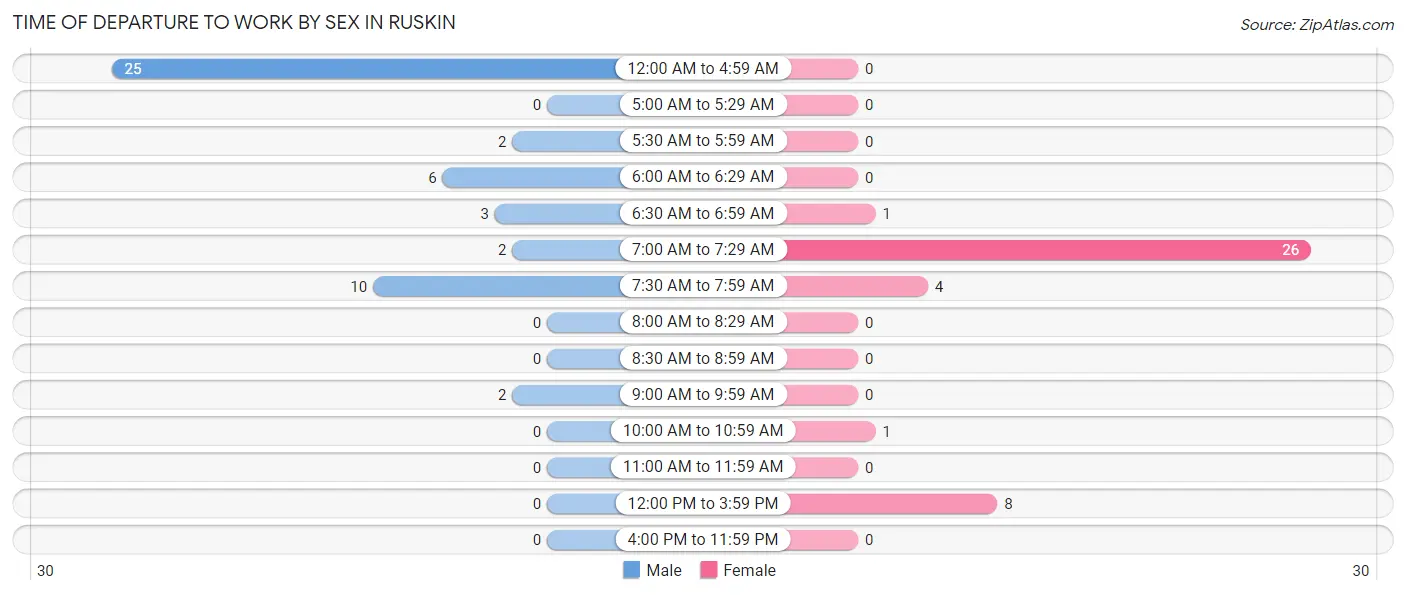
Time of Departure to Work by Sex in Ruskin
The most frequent times of departure to work in Ruskin are 12:00 AM to 4:59 AM (25, 50.0%) for males and 7:00 AM to 7:29 AM (26, 65.0%) for females.
| Time of Departure | Male | Female |
| 12:00 AM to 4:59 AM | 25 (50.0%) | 0 (0.0%) |
| 5:00 AM to 5:29 AM | 0 (0.0%) | 0 (0.0%) |
| 5:30 AM to 5:59 AM | 2 (4.0%) | 0 (0.0%) |
| 6:00 AM to 6:29 AM | 6 (12.0%) | 0 (0.0%) |
| 6:30 AM to 6:59 AM | 3 (6.0%) | 1 (2.5%) |
| 7:00 AM to 7:29 AM | 2 (4.0%) | 26 (65.0%) |
| 7:30 AM to 7:59 AM | 10 (20.0%) | 4 (10.0%) |
| 8:00 AM to 8:29 AM | 0 (0.0%) | 0 (0.0%) |
| 8:30 AM to 8:59 AM | 0 (0.0%) | 0 (0.0%) |
| 9:00 AM to 9:59 AM | 2 (4.0%) | 0 (0.0%) |
| 10:00 AM to 10:59 AM | 0 (0.0%) | 1 (2.5%) |
| 11:00 AM to 11:59 AM | 0 (0.0%) | 0 (0.0%) |
| 12:00 PM to 3:59 PM | 0 (0.0%) | 8 (20.0%) |
| 4:00 PM to 11:59 PM | 0 (0.0%) | 0 (0.0%) |
| Total | 50 (100.0%) | 40 (100.0%) |
Housing Occupancy in Ruskin
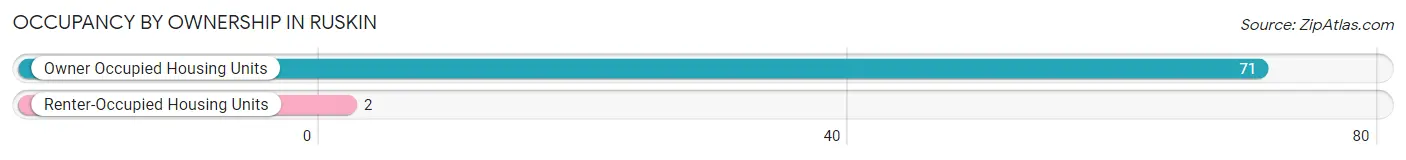
Occupancy by Ownership in Ruskin
Of the total 73 dwellings in Ruskin, owner-occupied units account for 71 (97.3%), while renter-occupied units make up 2 (2.7%).
| Occupancy | # Housing Units | % Housing Units |
| Owner Occupied Housing Units | 71 | 97.3% |
| Renter-Occupied Housing Units | 2 | 2.7% |
| Total Occupied Housing Units | 73 | 100.0% |
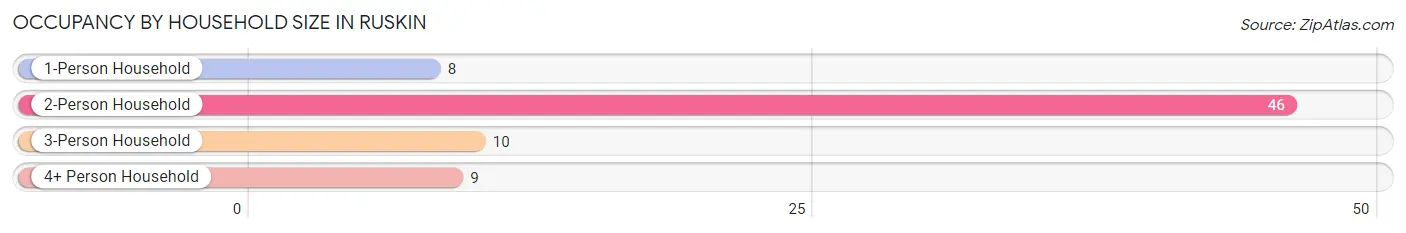
Occupancy by Household Size in Ruskin
| Household Size | # Housing Units | % Housing Units |
| 1-Person Household | 8 | 11.0% |
| 2-Person Household | 46 | 63.0% |
| 3-Person Household | 10 | 13.7% |
| 4+ Person Household | 9 | 12.3% |
| Total Housing Units | 73 | 100.0% |
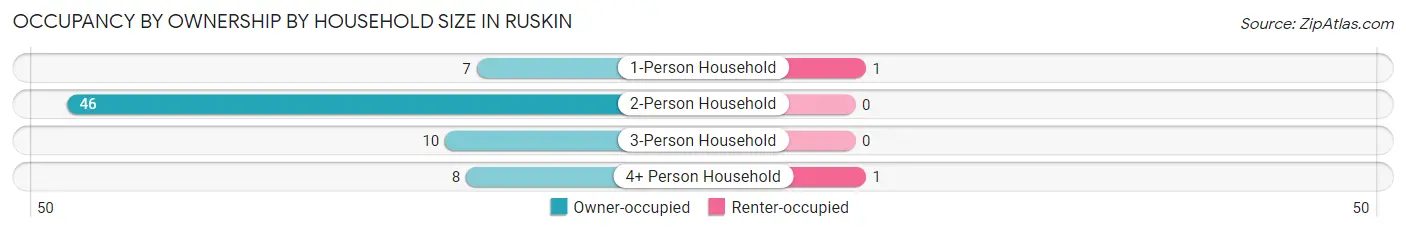
Occupancy by Ownership by Household Size in Ruskin
| Household Size | Owner-occupied | Renter-occupied |
| 1-Person Household | 7 (87.5%) | 1 (12.5%) |
| 2-Person Household | 46 (100.0%) | 0 (0.0%) |
| 3-Person Household | 10 (100.0%) | 0 (0.0%) |
| 4+ Person Household | 8 (88.9%) | 1 (11.1%) |
| Total Housing Units | 71 (97.3%) | 2 (2.7%) |
Occupancy by Educational Attainment in Ruskin
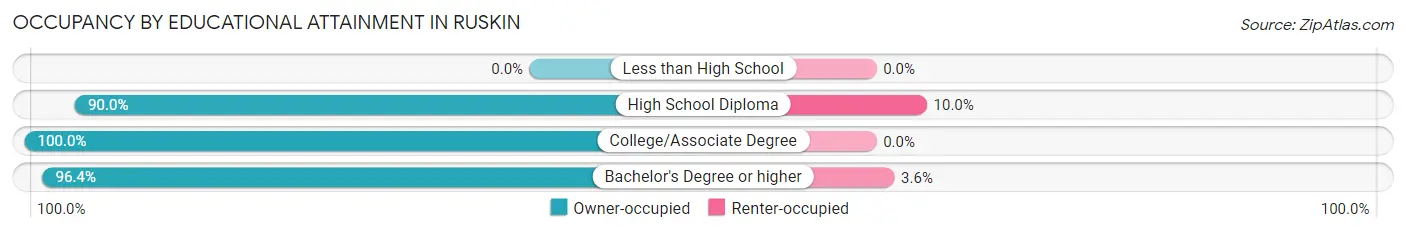
| Household Size | Owner-occupied | Renter-occupied |
| Less than High School | 0 (0.0%) | 0 (0.0%) |
| High School Diploma | 9 (90.0%) | 1 (10.0%) |
| College/Associate Degree | 35 (100.0%) | 0 (0.0%) |
| Bachelor's Degree or higher | 27 (96.4%) | 1 (3.6%) |
Occupancy by Age of Householder in Ruskin
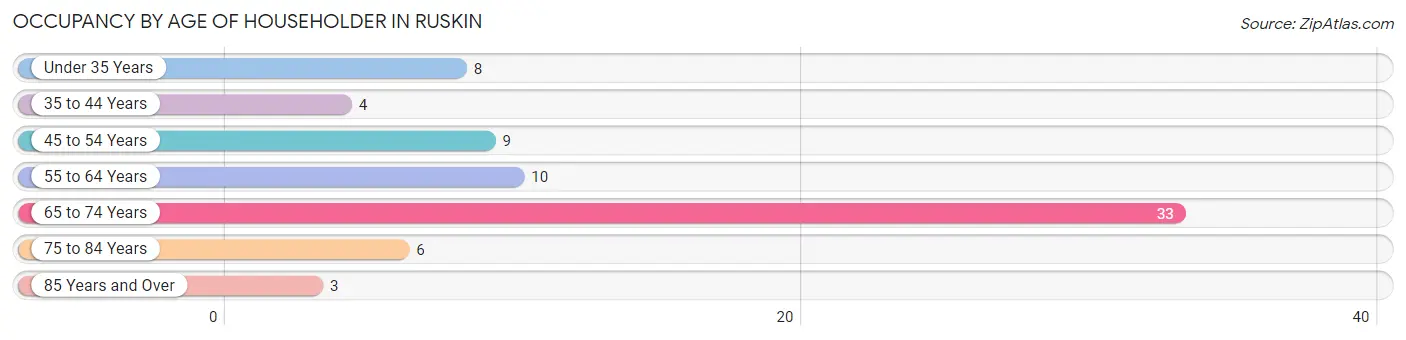
| Age Bracket | # Households | % Households |
| Under 35 Years | 8 | 11.0% |
| 35 to 44 Years | 4 | 5.5% |
| 45 to 54 Years | 9 | 12.3% |
| 55 to 64 Years | 10 | 13.7% |
| 65 to 74 Years | 33 | 45.2% |
| 75 to 84 Years | 6 | 8.2% |
| 85 Years and Over | 3 | 4.1% |
| Total | 73 | 100.0% |
Housing Finances in Ruskin
Median Income by Occupancy in Ruskin
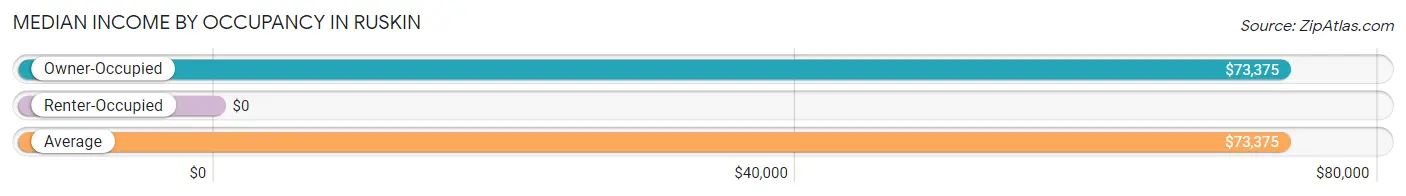
| Occupancy Type | # Households | Median Income |
| Owner-Occupied | 71 (97.3%) | $73,375 |
| Renter-Occupied | 2 (2.7%) | $0 |
| Average | 73 (100.0%) | $73,375 |
Occupancy by Householder Income Bracket in Ruskin
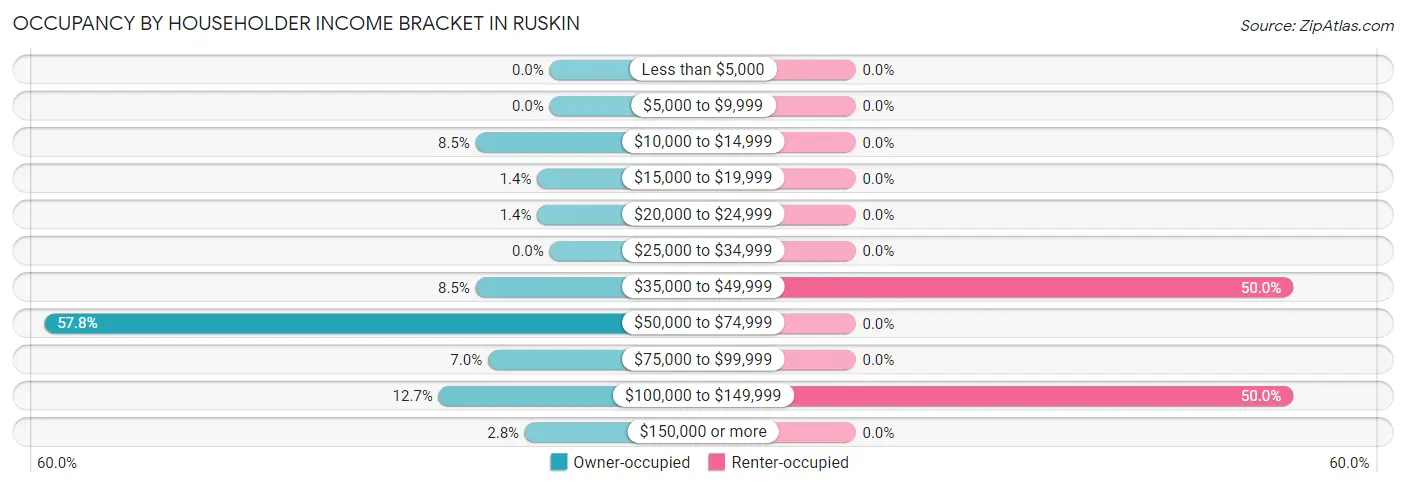
| Income Bracket | Owner-occupied | Renter-occupied |
| Less than $5,000 | 0 (0.0%) | 0 (0.0%) |
| $5,000 to $9,999 | 0 (0.0%) | 0 (0.0%) |
| $10,000 to $14,999 | 6 (8.5%) | 0 (0.0%) |
| $15,000 to $19,999 | 1 (1.4%) | 0 (0.0%) |
| $20,000 to $24,999 | 1 (1.4%) | 0 (0.0%) |
| $25,000 to $34,999 | 0 (0.0%) | 0 (0.0%) |
| $35,000 to $49,999 | 6 (8.5%) | 1 (50.0%) |
| $50,000 to $74,999 | 41 (57.8%) | 0 (0.0%) |
| $75,000 to $99,999 | 5 (7.0%) | 0 (0.0%) |
| $100,000 to $149,999 | 9 (12.7%) | 1 (50.0%) |
| $150,000 or more | 2 (2.8%) | 0 (0.0%) |
| Total | 71 (100.0%) | 2 (100.0%) |
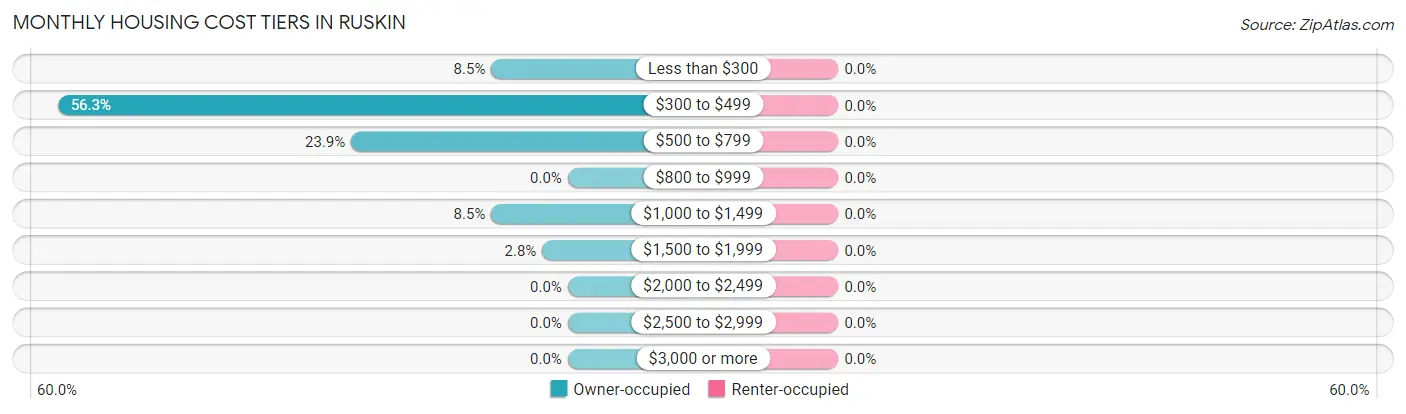
Monthly Housing Cost Tiers in Ruskin
| Monthly Cost | Owner-occupied | Renter-occupied |
| Less than $300 | 6 (8.5%) | 0 (0.0%) |
| $300 to $499 | 40 (56.3%) | 0 (0.0%) |
| $500 to $799 | 17 (23.9%) | 0 (0.0%) |
| $800 to $999 | 0 (0.0%) | 0 (0.0%) |
| $1,000 to $1,499 | 6 (8.5%) | 0 (0.0%) |
| $1,500 to $1,999 | 2 (2.8%) | 0 (0.0%) |
| $2,000 to $2,499 | 0 (0.0%) | 0 (0.0%) |
| $2,500 to $2,999 | 0 (0.0%) | 0 (0.0%) |
| $3,000 or more | 0 (0.0%) | 0 (0.0%) |
| Total | 71 (100.0%) | 2 (100.0%) |
Physical Housing Characteristics in Ruskin
Housing Structures in Ruskin
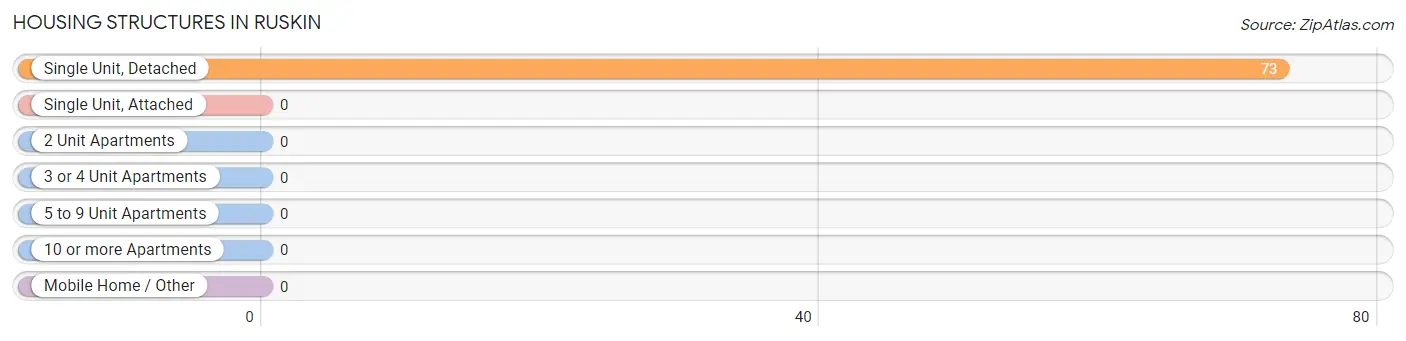
| Structure Type | # Housing Units | % Housing Units |
| Single Unit, Detached | 73 | 100.0% |
| Single Unit, Attached | 0 | 0.0% |
| 2 Unit Apartments | 0 | 0.0% |
| 3 or 4 Unit Apartments | 0 | 0.0% |
| 5 to 9 Unit Apartments | 0 | 0.0% |
| 10 or more Apartments | 0 | 0.0% |
| Mobile Home / Other | 0 | 0.0% |
| Total | 73 | 100.0% |
Housing Structures by Occupancy in Ruskin
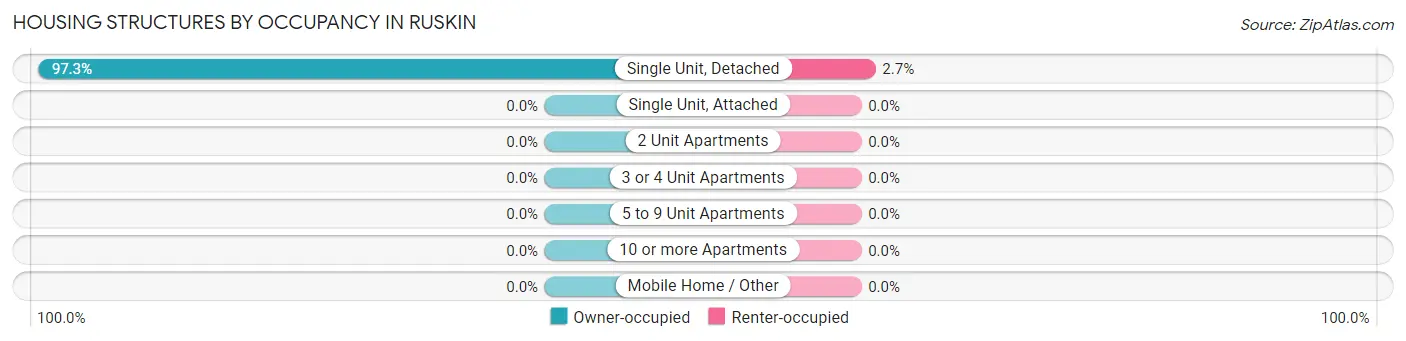
| Structure Type | Owner-occupied | Renter-occupied |
| Single Unit, Detached | 71 (97.3%) | 2 (2.7%) |
| Single Unit, Attached | 0 (0.0%) | 0 (0.0%) |
| 2 Unit Apartments | 0 (0.0%) | 0 (0.0%) |
| 3 or 4 Unit Apartments | 0 (0.0%) | 0 (0.0%) |
| 5 to 9 Unit Apartments | 0 (0.0%) | 0 (0.0%) |
| 10 or more Apartments | 0 (0.0%) | 0 (0.0%) |
| Mobile Home / Other | 0 (0.0%) | 0 (0.0%) |
| Total | 71 (97.3%) | 2 (2.7%) |
Housing Structures by Number of Rooms in Ruskin
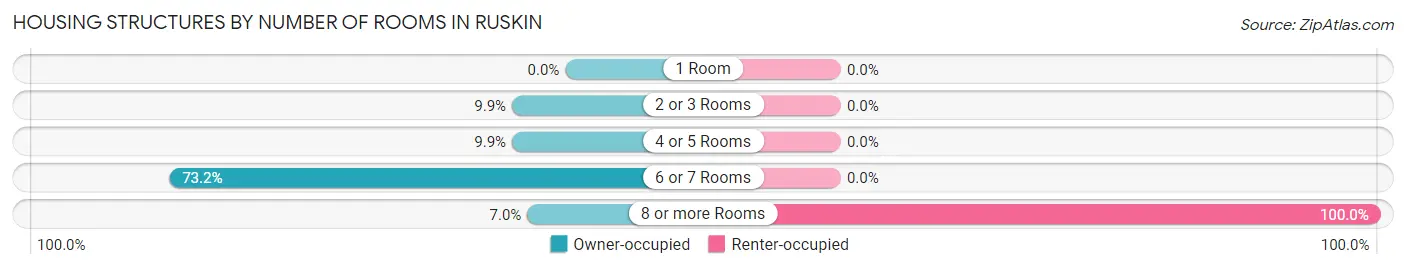
| Number of Rooms | Owner-occupied | Renter-occupied |
| 1 Room | 0 (0.0%) | 0 (0.0%) |
| 2 or 3 Rooms | 7 (9.9%) | 0 (0.0%) |
| 4 or 5 Rooms | 7 (9.9%) | 0 (0.0%) |
| 6 or 7 Rooms | 52 (73.2%) | 0 (0.0%) |
| 8 or more Rooms | 5 (7.0%) | 2 (100.0%) |
| Total | 71 (100.0%) | 2 (100.0%) |
Housing Structure by Heating Type in Ruskin
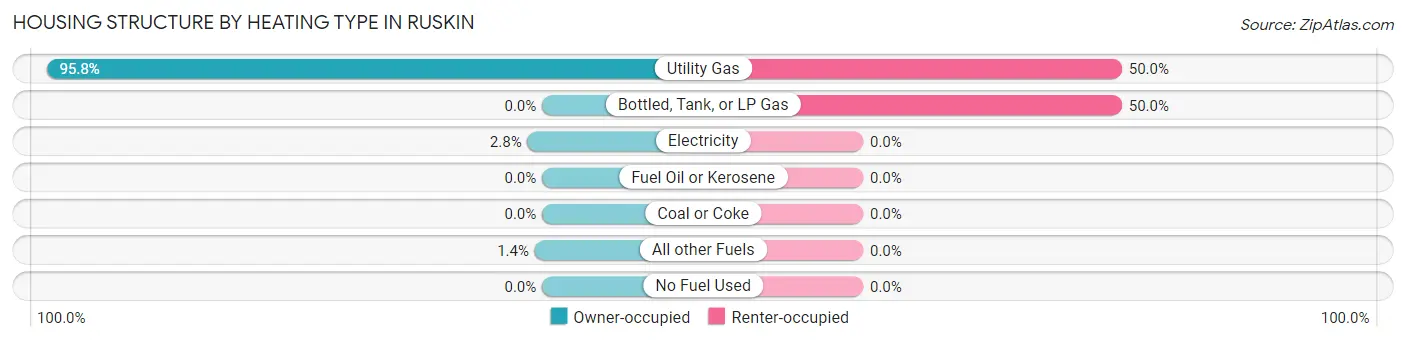
| Heating Type | Owner-occupied | Renter-occupied |
| Utility Gas | 68 (95.8%) | 1 (50.0%) |
| Bottled, Tank, or LP Gas | 0 (0.0%) | 1 (50.0%) |
| Electricity | 2 (2.8%) | 0 (0.0%) |
| Fuel Oil or Kerosene | 0 (0.0%) | 0 (0.0%) |
| Coal or Coke | 0 (0.0%) | 0 (0.0%) |
| All other Fuels | 1 (1.4%) | 0 (0.0%) |
| No Fuel Used | 0 (0.0%) | 0 (0.0%) |
| Total | 71 (100.0%) | 2 (100.0%) |
Household Vehicle Usage in Ruskin
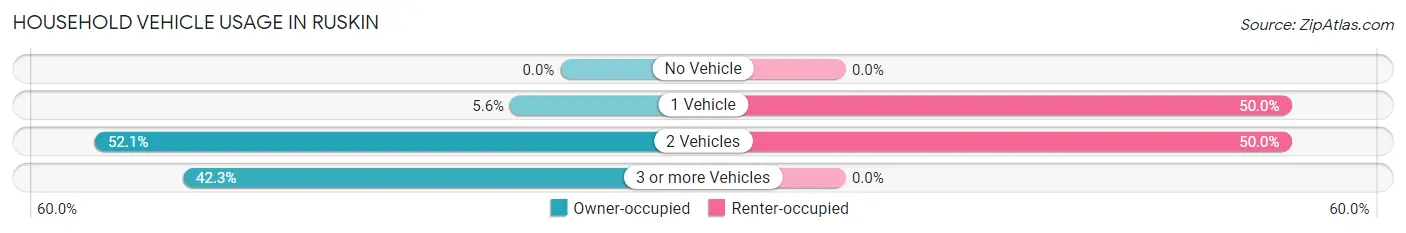
| Vehicles per Household | Owner-occupied | Renter-occupied |
| No Vehicle | 0 (0.0%) | 0 (0.0%) |
| 1 Vehicle | 4 (5.6%) | 1 (50.0%) |
| 2 Vehicles | 37 (52.1%) | 1 (50.0%) |
| 3 or more Vehicles | 30 (42.2%) | 0 (0.0%) |
| Total | 71 (100.0%) | 2 (100.0%) |
Real Estate & Mortgages in Ruskin
Real Estate and Mortgage Overview in Ruskin
| Characteristic | Without Mortgage | With Mortgage |
| Housing Units | 53 | 18 |
| Median Property Value | $92,900 | $0 |
| Median Household Income | $73,259 | $2 |
| Monthly Housing Costs | $428 | $0 |
| Real Estate Taxes | - | - |
Property Value by Mortgage Status in Ruskin
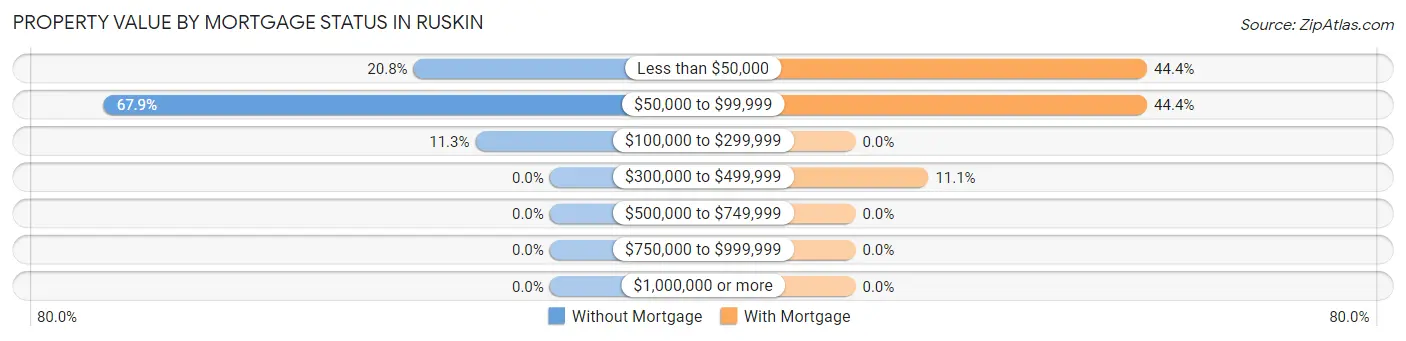
| Property Value | Without Mortgage | With Mortgage |
| Less than $50,000 | 11 (20.7%) | 8 (44.4%) |
| $50,000 to $99,999 | 36 (67.9%) | 8 (44.4%) |
| $100,000 to $299,999 | 6 (11.3%) | 0 (0.0%) |
| $300,000 to $499,999 | 0 (0.0%) | 2 (11.1%) |
| $500,000 to $749,999 | 0 (0.0%) | 0 (0.0%) |
| $750,000 to $999,999 | 0 (0.0%) | 0 (0.0%) |
| $1,000,000 or more | 0 (0.0%) | 0 (0.0%) |
| Total | 53 (100.0%) | 18 (100.0%) |
Household Income by Mortgage Status in Ruskin
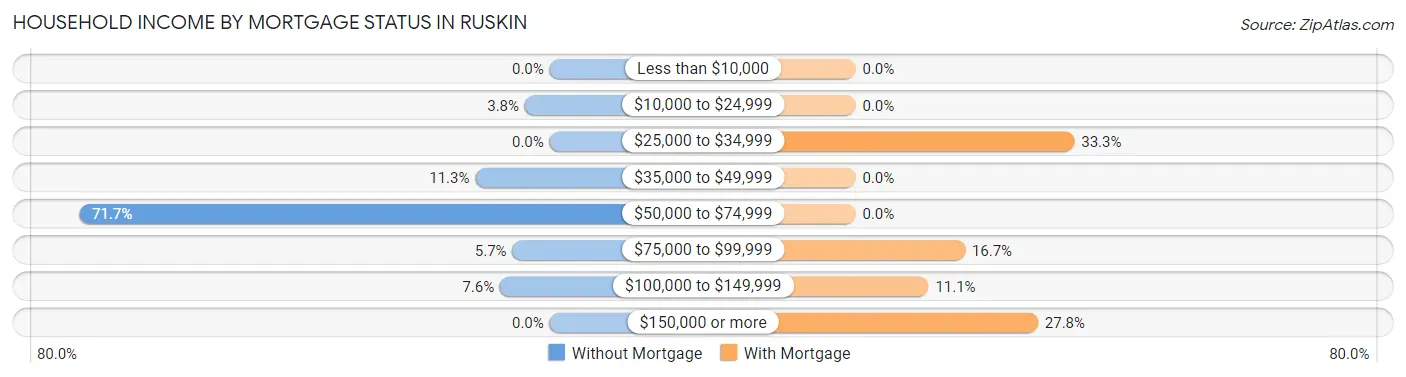
| Household Income | Without Mortgage | With Mortgage |
| Less than $10,000 | 0 (0.0%) | 0 (0.0%) |
| $10,000 to $24,999 | 2 (3.8%) | 0 (0.0%) |
| $25,000 to $34,999 | 0 (0.0%) | 6 (33.3%) |
| $35,000 to $49,999 | 6 (11.3%) | 0 (0.0%) |
| $50,000 to $74,999 | 38 (71.7%) | 0 (0.0%) |
| $75,000 to $99,999 | 3 (5.7%) | 3 (16.7%) |
| $100,000 to $149,999 | 4 (7.5%) | 2 (11.1%) |
| $150,000 or more | 0 (0.0%) | 5 (27.8%) |
| Total | 53 (100.0%) | 18 (100.0%) |
Property Value to Household Income Ratio in Ruskin
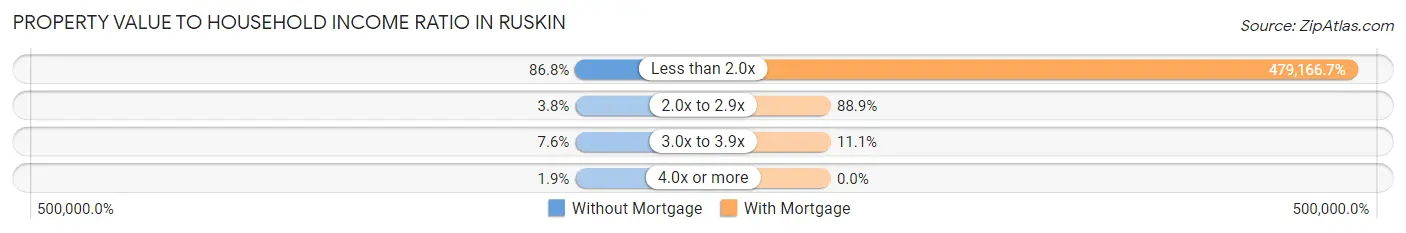
| Value-to-Income Ratio | Without Mortgage | With Mortgage |
| Less than 2.0x | 46 (86.8%) | 86,250 (479,166.7%) |
| 2.0x to 2.9x | 2 (3.8%) | 16 (88.9%) |
| 3.0x to 3.9x | 4 (7.5%) | 2 (11.1%) |
| 4.0x or more | 1 (1.9%) | 0 (0.0%) |
| Total | 53 (100.0%) | 18 (100.0%) |
Real Estate Taxes by Mortgage Status in Ruskin
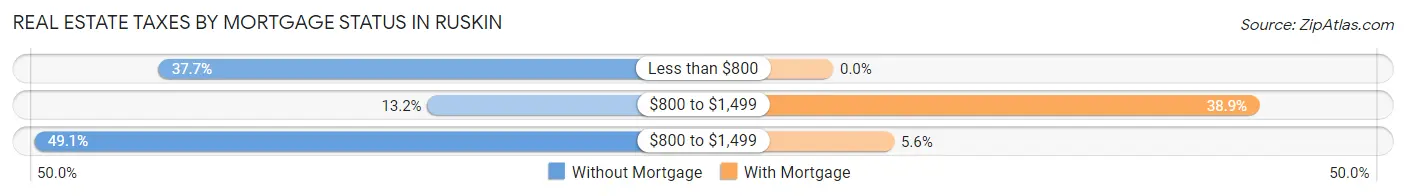
| Property Taxes | Without Mortgage | With Mortgage |
| Less than $800 | 20 (37.7%) | 0 (0.0%) |
| $800 to $1,499 | 7 (13.2%) | 7 (38.9%) |
| $800 to $1,499 | 26 (49.1%) | 1 (5.6%) |
| Total | 53 (100.0%) | 18 (100.0%) |
Health & Disability in Ruskin
Health Insurance Coverage by Age in Ruskin
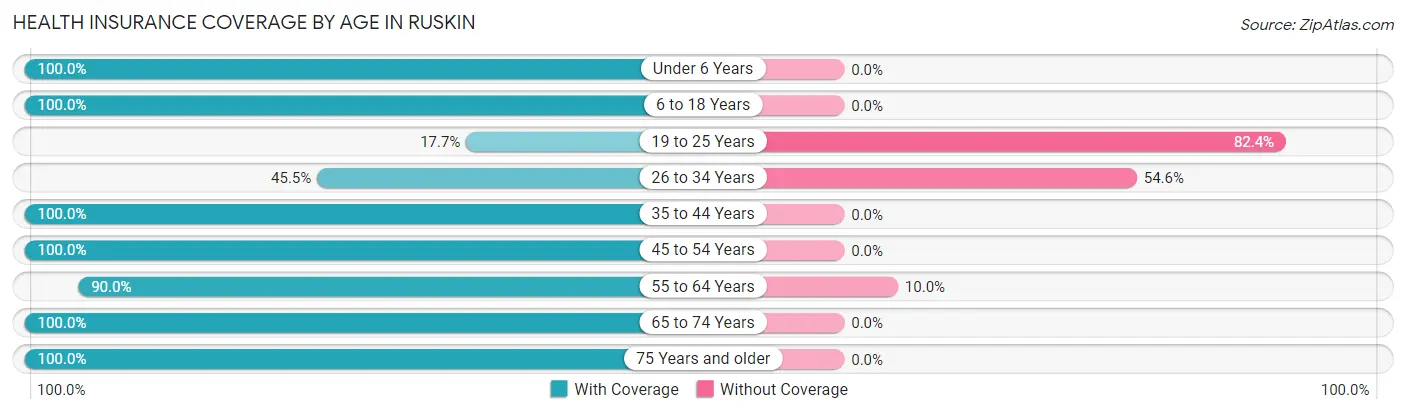
| Age Bracket | With Coverage | Without Coverage |
| Under 6 Years | 11 (100.0%) | 0 (0.0%) |
| 6 to 18 Years | 19 (100.0%) | 0 (0.0%) |
| 19 to 25 Years | 3 (17.6%) | 14 (82.4%) |
| 26 to 34 Years | 5 (45.5%) | 6 (54.5%) |
| 35 to 44 Years | 5 (100.0%) | 0 (0.0%) |
| 45 to 54 Years | 9 (100.0%) | 0 (0.0%) |
| 55 to 64 Years | 18 (90.0%) | 2 (10.0%) |
| 65 to 74 Years | 64 (100.0%) | 0 (0.0%) |
| 75 Years and older | 16 (100.0%) | 0 (0.0%) |
| Total | 150 (87.2%) | 22 (12.8%) |
Health Insurance Coverage by Citizenship Status in Ruskin
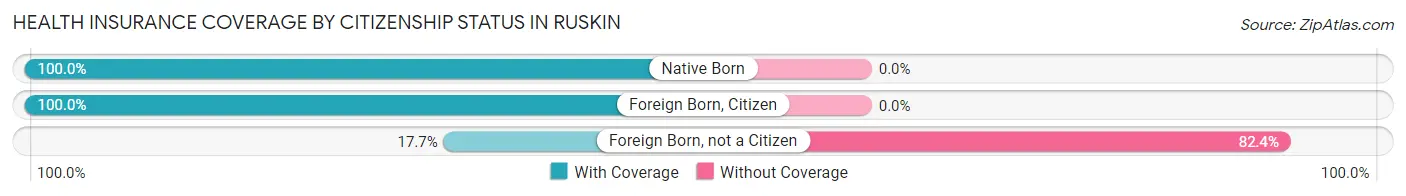
| Citizenship Status | With Coverage | Without Coverage |
| Native Born | 11 (100.0%) | 0 (0.0%) |
| Foreign Born, Citizen | 19 (100.0%) | 0 (0.0%) |
| Foreign Born, not a Citizen | 3 (17.6%) | 14 (82.4%) |
Health Insurance Coverage by Household Income in Ruskin
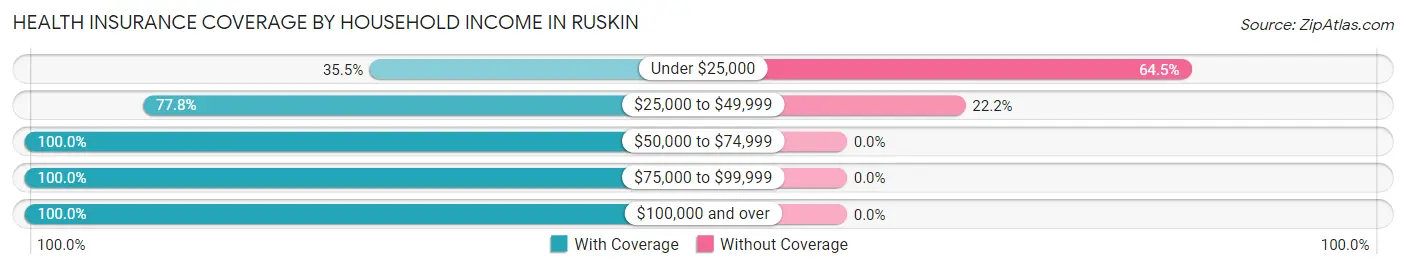
| Household Income | With Coverage | Without Coverage |
| Under $25,000 | 11 (35.5%) | 20 (64.5%) |
| $25,000 to $49,999 | 7 (77.8%) | 2 (22.2%) |
| $50,000 to $74,999 | 90 (100.0%) | 0 (0.0%) |
| $75,000 to $99,999 | 11 (100.0%) | 0 (0.0%) |
| $100,000 and over | 31 (100.0%) | 0 (0.0%) |
Public vs Private Health Insurance Coverage by Age in Ruskin
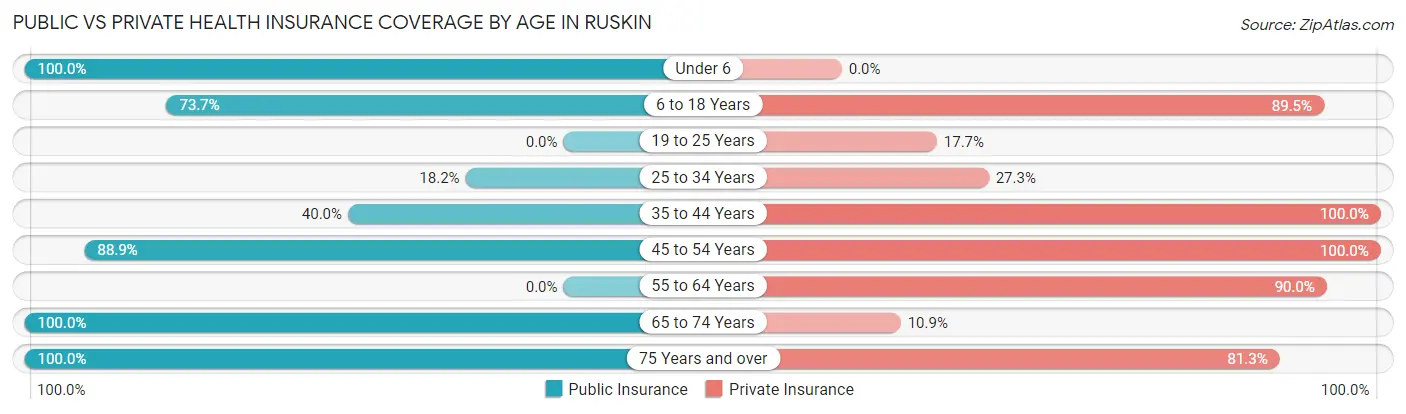
| Age Bracket | Public Insurance | Private Insurance |
| Under 6 | 11 (100.0%) | 0 (0.0%) |
| 6 to 18 Years | 14 (73.7%) | 17 (89.5%) |
| 19 to 25 Years | 0 (0.0%) | 3 (17.6%) |
| 25 to 34 Years | 2 (18.2%) | 3 (27.3%) |
| 35 to 44 Years | 2 (40.0%) | 5 (100.0%) |
| 45 to 54 Years | 8 (88.9%) | 9 (100.0%) |
| 55 to 64 Years | 0 (0.0%) | 18 (90.0%) |
| 65 to 74 Years | 64 (100.0%) | 7 (10.9%) |
| 75 Years and over | 16 (100.0%) | 13 (81.2%) |
| Total | 117 (68.0%) | 75 (43.6%) |
Disability Status by Sex by Age in Ruskin
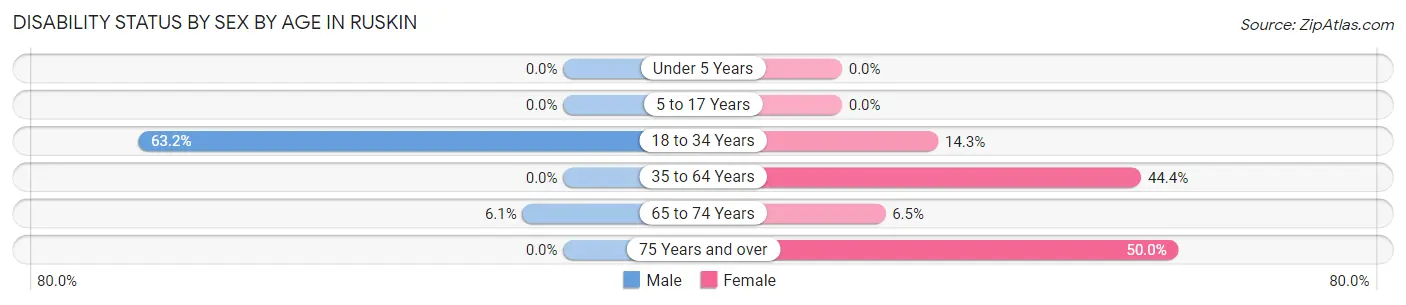
| Age Bracket | Male | Female |
| Under 5 Years | 0 (0.0%) | 0 (0.0%) |
| 5 to 17 Years | 0 (0.0%) | 0 (0.0%) |
| 18 to 34 Years | 12 (63.2%) | 3 (14.3%) |
| 35 to 64 Years | 0 (0.0%) | 8 (44.4%) |
| 65 to 74 Years | 2 (6.1%) | 2 (6.5%) |
| 75 Years and over | 0 (0.0%) | 5 (50.0%) |
Disability Class by Sex by Age in Ruskin
Disability Class: Hearing Difficulty
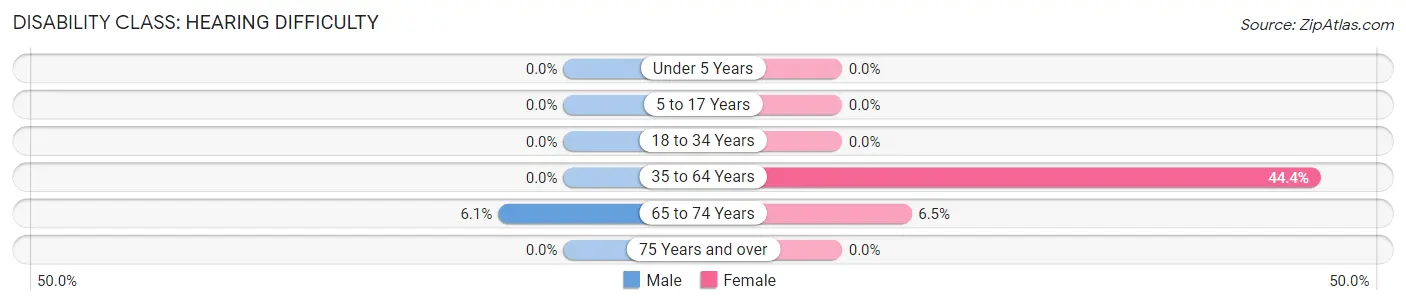
| Age Bracket | Male | Female |
| Under 5 Years | 0 (0.0%) | 0 (0.0%) |
| 5 to 17 Years | 0 (0.0%) | 0 (0.0%) |
| 18 to 34 Years | 0 (0.0%) | 0 (0.0%) |
| 35 to 64 Years | 0 (0.0%) | 8 (44.4%) |
| 65 to 74 Years | 2 (6.1%) | 2 (6.5%) |
| 75 Years and over | 0 (0.0%) | 0 (0.0%) |
Disability Class: Vision Difficulty
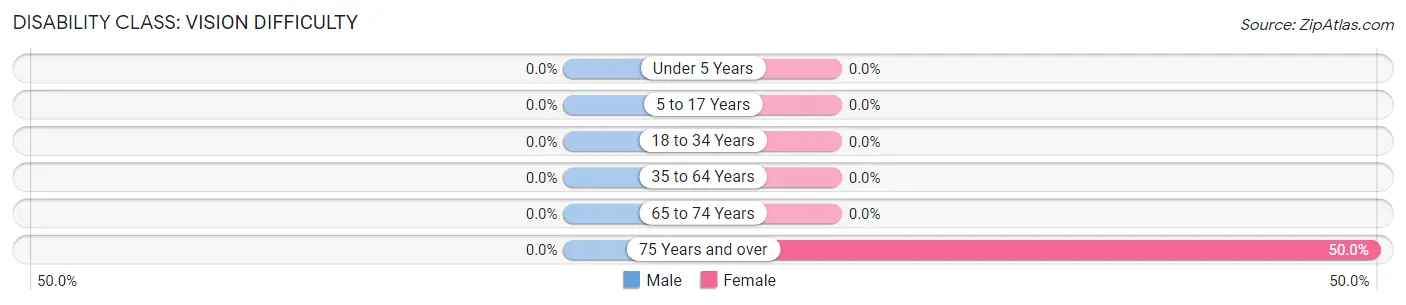
| Age Bracket | Male | Female |
| Under 5 Years | 0 (0.0%) | 0 (0.0%) |
| 5 to 17 Years | 0 (0.0%) | 0 (0.0%) |
| 18 to 34 Years | 0 (0.0%) | 0 (0.0%) |
| 35 to 64 Years | 0 (0.0%) | 0 (0.0%) |
| 65 to 74 Years | 0 (0.0%) | 0 (0.0%) |
| 75 Years and over | 0 (0.0%) | 5 (50.0%) |
Disability Class: Cognitive Difficulty
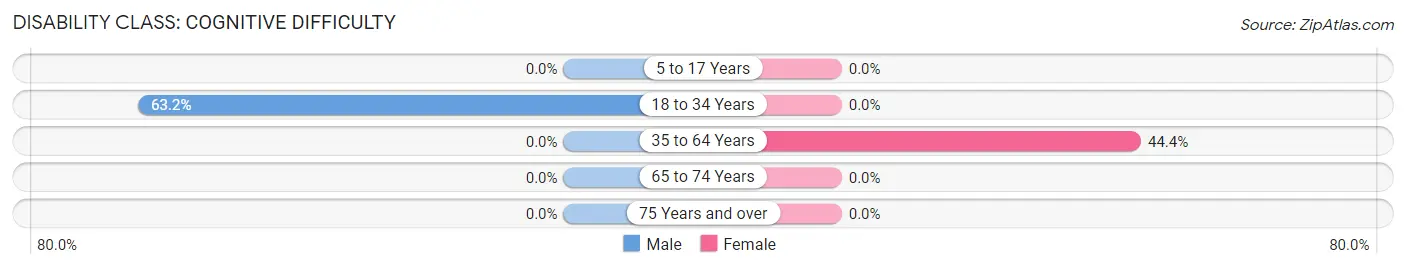
| Age Bracket | Male | Female |
| 5 to 17 Years | 0 (0.0%) | 0 (0.0%) |
| 18 to 34 Years | 12 (63.2%) | 0 (0.0%) |
| 35 to 64 Years | 0 (0.0%) | 8 (44.4%) |
| 65 to 74 Years | 0 (0.0%) | 0 (0.0%) |
| 75 Years and over | 0 (0.0%) | 0 (0.0%) |
Disability Class: Ambulatory Difficulty
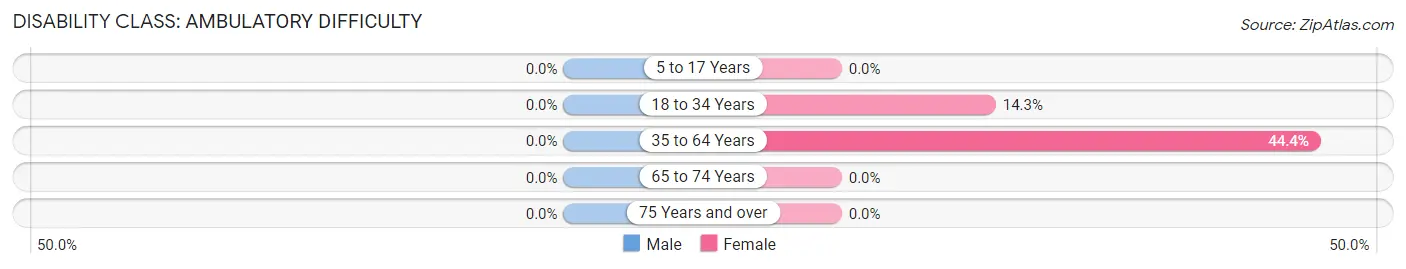
| Age Bracket | Male | Female |
| 5 to 17 Years | 0 (0.0%) | 0 (0.0%) |
| 18 to 34 Years | 0 (0.0%) | 3 (14.3%) |
| 35 to 64 Years | 0 (0.0%) | 8 (44.4%) |
| 65 to 74 Years | 0 (0.0%) | 0 (0.0%) |
| 75 Years and over | 0 (0.0%) | 0 (0.0%) |
Disability Class: Self-Care Difficulty
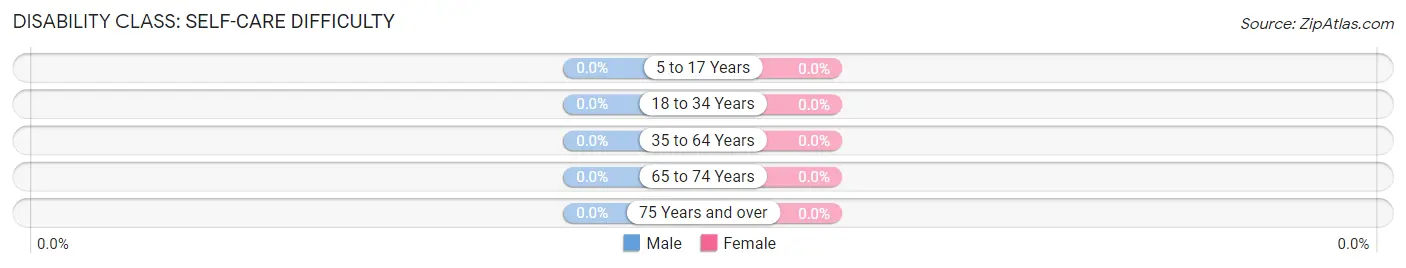
| Age Bracket | Male | Female |
| 5 to 17 Years | 0 (0.0%) | 0 (0.0%) |
| 18 to 34 Years | 0 (0.0%) | 0 (0.0%) |
| 35 to 64 Years | 0 (0.0%) | 0 (0.0%) |
| 65 to 74 Years | 0 (0.0%) | 0 (0.0%) |
| 75 Years and over | 0 (0.0%) | 0 (0.0%) |
Technology Access in Ruskin
Computing Device Access in Ruskin
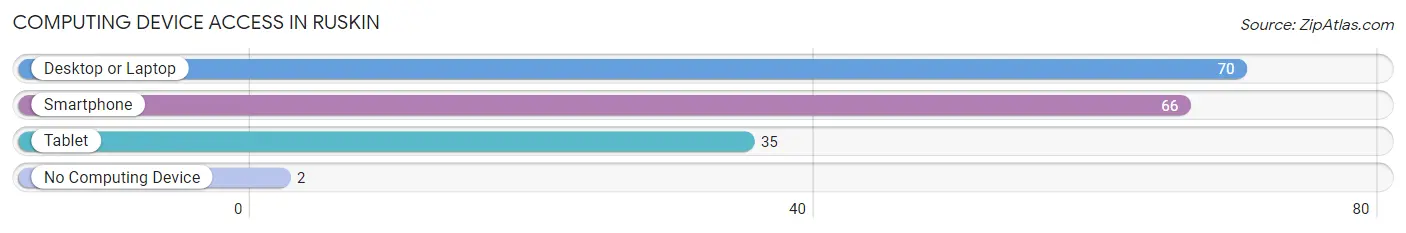
| Device Type | # Households | % Households |
| Desktop or Laptop | 70 | 95.9% |
| Smartphone | 66 | 90.4% |
| Tablet | 35 | 47.9% |
| No Computing Device | 2 | 2.7% |
| Total | 73 | 100.0% |
Internet Access in Ruskin
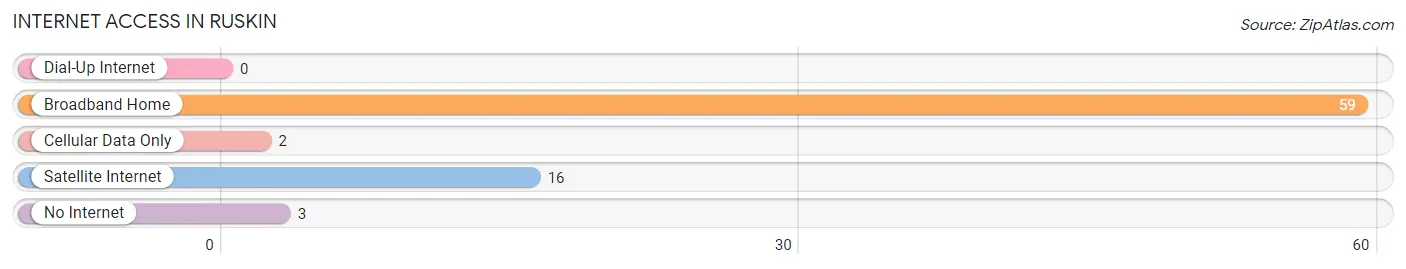
| Internet Type | # Households | % Households |
| Dial-Up Internet | 0 | 0.0% |
| Broadband Home | 59 | 80.8% |
| Cellular Data Only | 2 | 2.7% |
| Satellite Internet | 16 | 21.9% |
| No Internet | 3 | 4.1% |
| Total | 73 | 100.0% |
Ruskin Summary
Ruskin, Nebraska is a small town located in the southeastern corner of the state, near the border of Iowa. It is situated in the heart of the Loess Hills, a region of rolling hills and prairies that is known for its rich soil and abundant wildlife. The town was founded in 1887 by a group of settlers from Iowa, and it has since grown to a population of just over 500 people.
Geography
Ruskin is located in the southeastern corner of Nebraska, near the border of Iowa. It is situated in the heart of the Loess Hills, a region of rolling hills and prairies that is known for its rich soil and abundant wildlife. The town is located on the banks of the Missouri River, and it is surrounded by a number of small lakes and ponds. The area is also home to a variety of wildlife, including deer, wild turkeys, and a variety of birds.
The climate in Ruskin is generally mild, with hot summers and cold winters. The average temperature in the summer is around 80 degrees Fahrenheit, while the average temperature in the winter is around 20 degrees Fahrenheit. The area receives an average of 30 inches of precipitation each year, with most of it falling in the form of snow.
Economy
The economy of Ruskin is largely based on agriculture. The town is home to a number of farms, which produce a variety of crops, including corn, soybeans, and wheat. The town also has a number of small businesses, including a grocery store, a hardware store, and a few restaurants.
Demographics
As of the 2010 census, the population of Ruskin was 514 people. The racial makeup of the town was 97.3% White, 0.6% African American, 0.2% Native American, 0.2% Asian, 0.2% from other races, and 1.7% from two or more races. The median household income in Ruskin was $41,250, and the median family income was $50,000.
History
Ruskin was founded in 1887 by a group of settlers from Iowa. The town was named after the English poet and art critic John Ruskin, who was a major influence on the Arts and Crafts Movement. The town grew slowly over the years, and by the early 1900s it had become a thriving agricultural community.
In the 1950s, the town began to experience a decline in population as many of its residents moved away in search of better economic opportunities. However, in recent years the town has seen a resurgence in population, as people have moved back to the area in search of a more rural lifestyle.
Today, Ruskin is a small but vibrant community. The town is home to a number of small businesses, and it is a popular destination for tourists who are looking to explore the area’s natural beauty. The town is also home to a number of festivals and events throughout the year, including the annual Ruskin Days celebration.
Common Questions
What is Per Capita Income in Ruskin?
Per Capita income in Ruskin is $29,288.
What is the Median Family Income in Ruskin?
Median Family Income in Ruskin is $73,708.
What is the Median Household income in Ruskin?
Median Household Income in Ruskin is $73,375.
What is Income or Wage Gap in Ruskin?
Income or Wage Gap in Ruskin is 34.9%.
Women in Ruskin earn 65.1 cents for every dollar earned by a man.
What is Inequality or Gini Index in Ruskin?
Inequality or Gini Index in Ruskin is 0.23.
What is the Total Population of Ruskin?
Total Population of Ruskin is 172.
What is the Total Male Population of Ruskin?
Total Male Population of Ruskin is 78.
What is the Total Female Population of Ruskin?
Total Female Population of Ruskin is 94.
What is the Ratio of Males per 100 Females in Ruskin?
There are 82.98 Males per 100 Females in Ruskin.
What is the Ratio of Females per 100 Males in Ruskin?
There are 120.51 Females per 100 Males in Ruskin.
What is the Median Population Age in Ruskin?
Median Population Age in Ruskin is 60.3 Years.
What is the Average Family Size in Ruskin
Average Family Size in Ruskin is 2.5 People.
What is the Average Household Size in Ruskin
Average Household Size in Ruskin is 2.4 People.
How Large is the Labor Force in Ruskin?
There are 94 People in the Labor Forcein in Ruskin.
What is the Percentage of People in the Labor Force in Ruskin?
60.3% of People are in the Labor Force in Ruskin.