Rosalie, NE Map & Demographics
Rosalie Map
Rosalie Overview
$24,282
PER CAPITA INCOME
$101,667
AVG FAMILY INCOME
$72,500
AVG HOUSEHOLD INCOME
7.4%
WAGE / INCOME GAP [ % ]
92.6¢/ $1
WAGE / INCOME GAP [ $ ]
0.42
INEQUALITY / GINI INDEX
233
TOTAL POPULATION
143
MALE POPULATION
90
FEMALE POPULATION
158.89
MALES / 100 FEMALES
62.94
FEMALES / 100 MALES
24.4
MEDIAN AGE
5.0
AVG FAMILY SIZE
3.9
AVG HOUSEHOLD SIZE
108
LABOR FORCE [ PEOPLE ]
70.6%
PERCENT IN LABOR FORCE
12.0%
UNEMPLOYMENT RATE
Rosalie Zip Codes
Rosalie Area Codes
Income in Rosalie
Income Overview in Rosalie
Per Capita Income in Rosalie is $24,282, while median incomes of families and households are $101,667 and $72,500 respectively.
| Characteristic | Number | Measure |
| Per Capita Income | 233 | $24,282 |
| Median Family Income | 38 | $101,667 |
| Mean Family Income | 38 | $103,879 |
| Median Household Income | 60 | $72,500 |
| Mean Household Income | 60 | $82,883 |
| Income Deficit | 38 | $0 |
| Wage / Income Gap (%) | 233 | 7.43% |
| Wage / Income Gap ($) | 233 | 92.57¢ per $1 |
| Gini / Inequality Index | 233 | 0.42 |
Earnings by Sex in Rosalie
Average Earnings in Rosalie are $41,944, $43,750 for men and $40,500 for women, a difference of 7.4%.
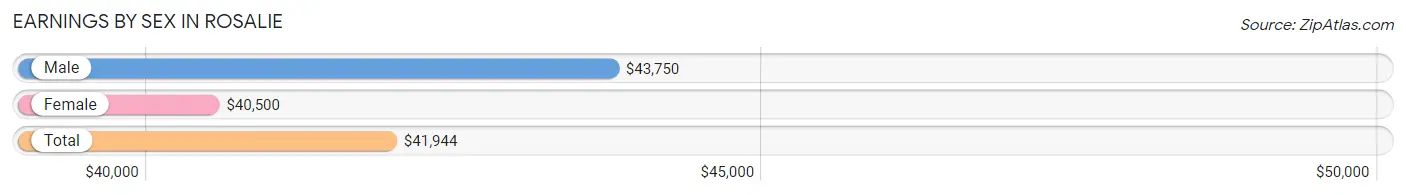
| Sex | Number | Average Earnings |
| Male | 64 (59.3%) | $43,750 |
| Female | 44 (40.7%) | $40,500 |
| Total | 108 (100.0%) | $41,944 |
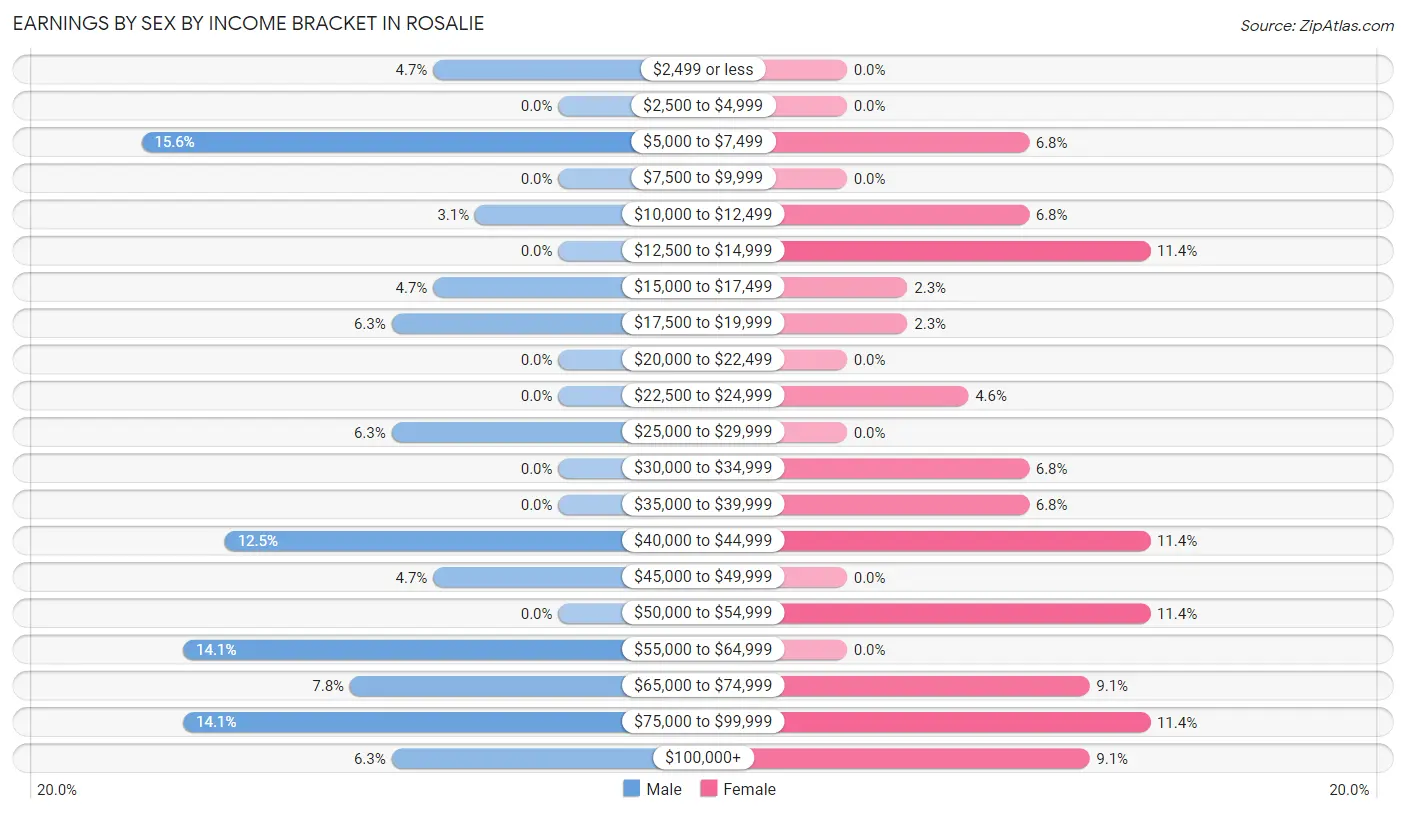
Earnings by Sex by Income Bracket in Rosalie
The most common earnings brackets in Rosalie are $5,000 to $7,499 for men (10 | 15.6%) and $12,500 to $14,999 for women (5 | 11.4%).
| Income | Male | Female |
| $2,499 or less | 3 (4.7%) | 0 (0.0%) |
| $2,500 to $4,999 | 0 (0.0%) | 0 (0.0%) |
| $5,000 to $7,499 | 10 (15.6%) | 3 (6.8%) |
| $7,500 to $9,999 | 0 (0.0%) | 0 (0.0%) |
| $10,000 to $12,499 | 2 (3.1%) | 3 (6.8%) |
| $12,500 to $14,999 | 0 (0.0%) | 5 (11.4%) |
| $15,000 to $17,499 | 3 (4.7%) | 1 (2.3%) |
| $17,500 to $19,999 | 4 (6.2%) | 1 (2.3%) |
| $20,000 to $22,499 | 0 (0.0%) | 0 (0.0%) |
| $22,500 to $24,999 | 0 (0.0%) | 2 (4.5%) |
| $25,000 to $29,999 | 4 (6.2%) | 0 (0.0%) |
| $30,000 to $34,999 | 0 (0.0%) | 3 (6.8%) |
| $35,000 to $39,999 | 0 (0.0%) | 3 (6.8%) |
| $40,000 to $44,999 | 8 (12.5%) | 5 (11.4%) |
| $45,000 to $49,999 | 3 (4.7%) | 0 (0.0%) |
| $50,000 to $54,999 | 0 (0.0%) | 5 (11.4%) |
| $55,000 to $64,999 | 9 (14.1%) | 0 (0.0%) |
| $65,000 to $74,999 | 5 (7.8%) | 4 (9.1%) |
| $75,000 to $99,999 | 9 (14.1%) | 5 (11.4%) |
| $100,000+ | 4 (6.2%) | 4 (9.1%) |
| Total | 64 (100.0%) | 44 (100.0%) |
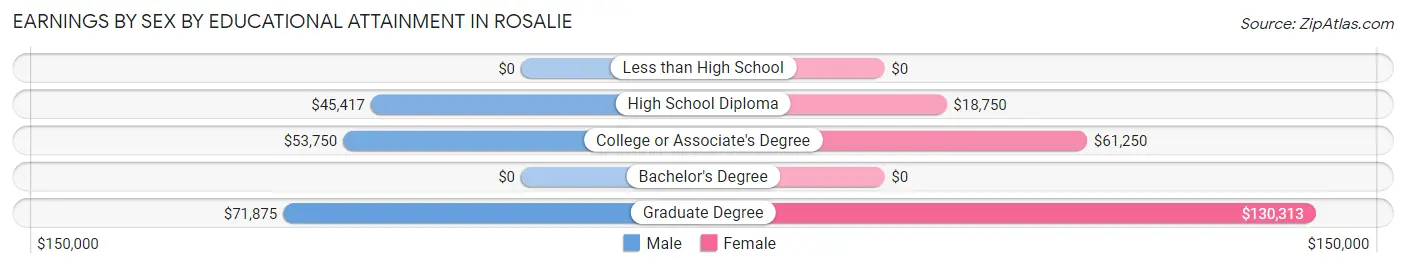
Earnings by Sex by Educational Attainment in Rosalie
Average earnings in Rosalie are $63,000 for men and $46,250 for women, a difference of 26.6%. Men with an educational attainment of graduate degree enjoy the highest average annual earnings of $71,875, while those with high school diploma education earn the least with $45,417. Women with an educational attainment of graduate degree earn the most with the average annual earnings of $130,313, while those with high school diploma education have the smallest earnings of $18,750.
| Educational Attainment | Male Income | Female Income |
| Less than High School | - | - |
| High School Diploma | $45,417 | $18,750 |
| College or Associate's Degree | $53,750 | $61,250 |
| Bachelor's Degree | - | - |
| Graduate Degree | $71,875 | $130,313 |
| Total | $63,000 | $46,250 |
Family Income in Rosalie
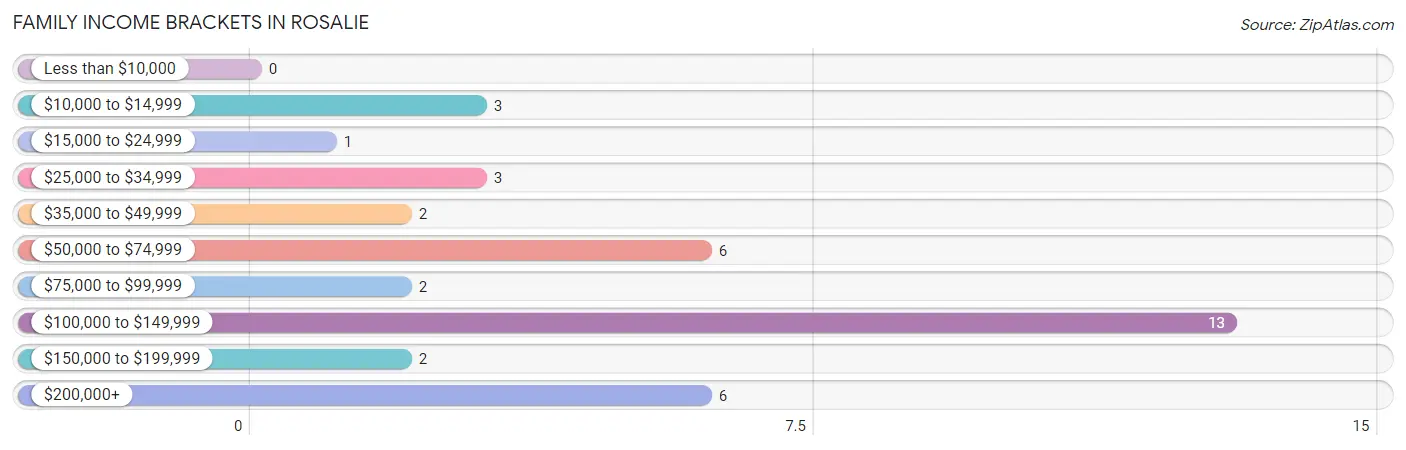
Family Income Brackets in Rosalie
According to the Rosalie family income data, there are 13 families falling into the $100,000 to $149,999 income range, which is the most common income bracket and makes up 34.2% of all families.
| Income Bracket | # Families | % Families |
| Less than $10,000 | 0 | 0.0% |
| $10,000 to $14,999 | 3 | 7.9% |
| $15,000 to $24,999 | 1 | 2.6% |
| $25,000 to $34,999 | 3 | 7.9% |
| $35,000 to $49,999 | 2 | 5.3% |
| $50,000 to $74,999 | 6 | 15.8% |
| $75,000 to $99,999 | 2 | 5.3% |
| $100,000 to $149,999 | 13 | 34.2% |
| $150,000 to $199,999 | 2 | 5.3% |
| $200,000+ | 6 | 15.8% |
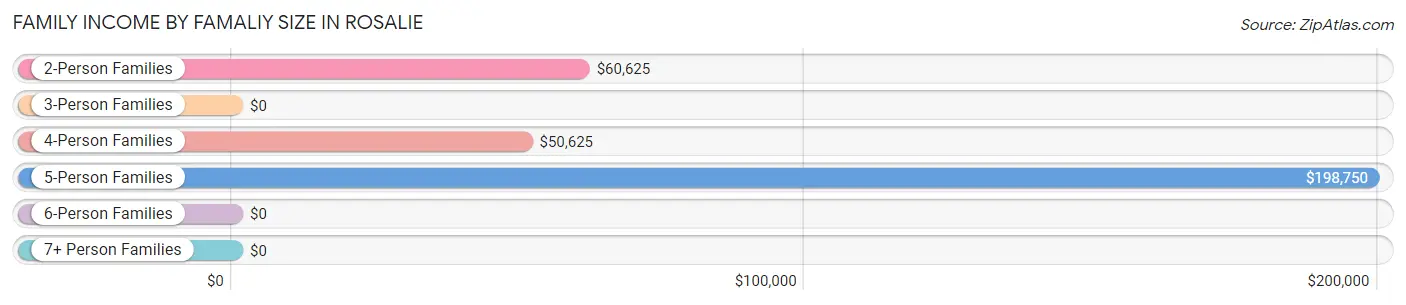
Family Income by Famaliy Size in Rosalie
5-person families (8 | 21.0%) account for the highest median family income in Rosalie with $198,750 per family, while 5-person families (8 | 21.0%) have the highest median income of $39,750 per family member.
| Income Bracket | # Families | Median Income |
| 2-Person Families | 11 (28.9%) | $60,625 |
| 3-Person Families | 2 (5.3%) | $0 |
| 4-Person Families | 9 (23.7%) | $50,625 |
| 5-Person Families | 8 (21.0%) | $198,750 |
| 6-Person Families | 4 (10.5%) | $0 |
| 7+ Person Families | 4 (10.5%) | $0 |
| Total | 38 (100.0%) | $101,667 |
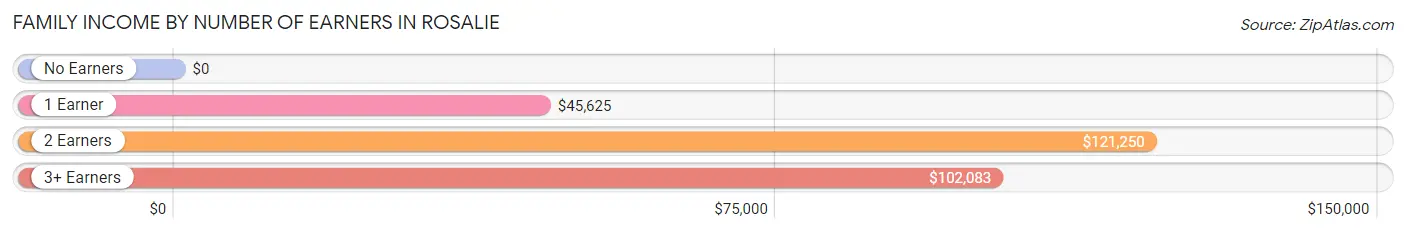
Family Income by Number of Earners in Rosalie
| Number of Earners | # Families | Median Income |
| No Earners | 4 (10.5%) | $0 |
| 1 Earner | 11 (28.9%) | $45,625 |
| 2 Earners | 14 (36.8%) | $121,250 |
| 3+ Earners | 9 (23.7%) | $102,083 |
| Total | 38 (100.0%) | $101,667 |
Household Income in Rosalie
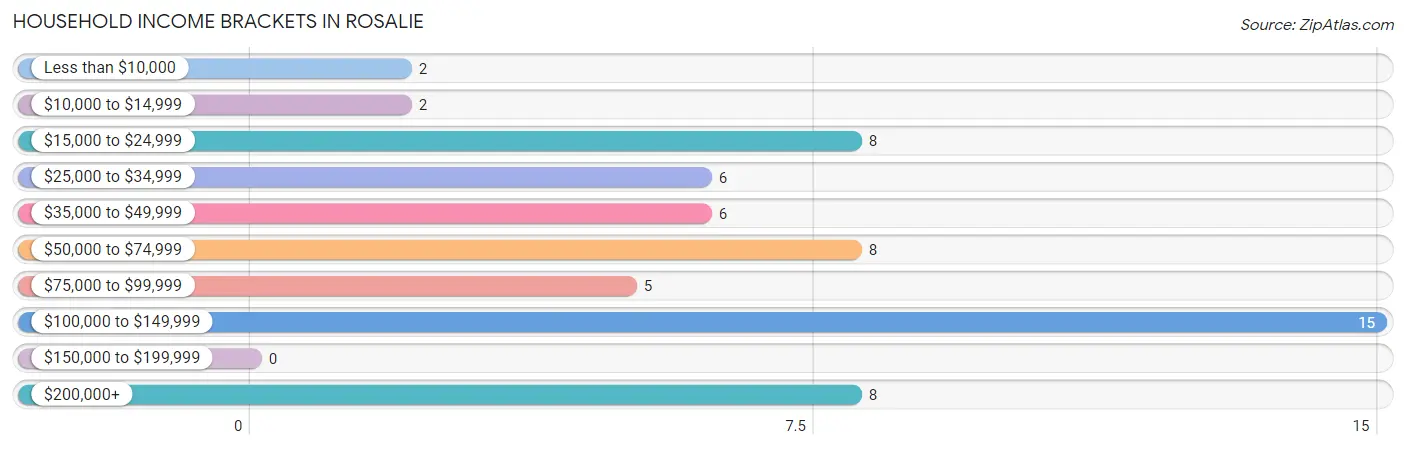
Household Income Brackets in Rosalie
With 15 households falling in the category, the $100,000 to $149,999 income range is the most frequent in Rosalie, accounting for 25.0% of all households.
| Income Bracket | # Households | % Households |
| Less than $10,000 | 2 | 3.3% |
| $10,000 to $14,999 | 2 | 3.3% |
| $15,000 to $24,999 | 8 | 13.3% |
| $25,000 to $34,999 | 6 | 10.0% |
| $35,000 to $49,999 | 6 | 10.0% |
| $50,000 to $74,999 | 8 | 13.3% |
| $75,000 to $99,999 | 5 | 8.3% |
| $100,000 to $149,999 | 15 | 25.0% |
| $150,000 to $199,999 | 0 | 0.0% |
| $200,000+ | 8 | 13.3% |
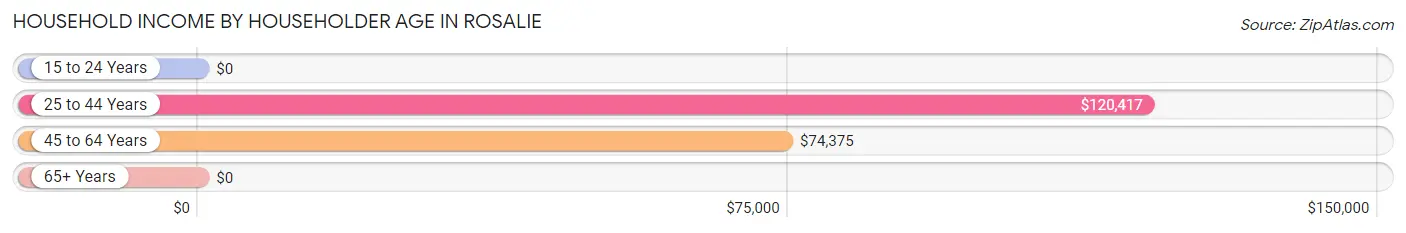
Household Income by Householder Age in Rosalie
The median household income in Rosalie is $72,500, with the highest median household income of $120,417 found in the 25 to 44 years age bracket for the primary householder. A total of 20 households (33.3%) fall into this category. Meanwhile, the 15 to 24 years age bracket for the primary householder has the lowest median household income of $0, with 4 households (6.7%) in this group.
| Income Bracket | # Households | Median Income |
| 15 to 24 Years | 4 (6.7%) | $0 |
| 25 to 44 Years | 20 (33.3%) | $120,417 |
| 45 to 64 Years | 23 (38.3%) | $74,375 |
| 65+ Years | 13 (21.7%) | $0 |
| Total | 60 (100.0%) | $72,500 |
Poverty in Rosalie
Income Below Poverty by Sex and Age in Rosalie
With 7.2% poverty level for males and 21.1% for females among the residents of Rosalie, 16 and 17 year old males and 18 to 24 year old females are the most vulnerable to poverty, with 3 males (42.9%) and 10 females (83.3%) in their respective age groups living below the poverty level.
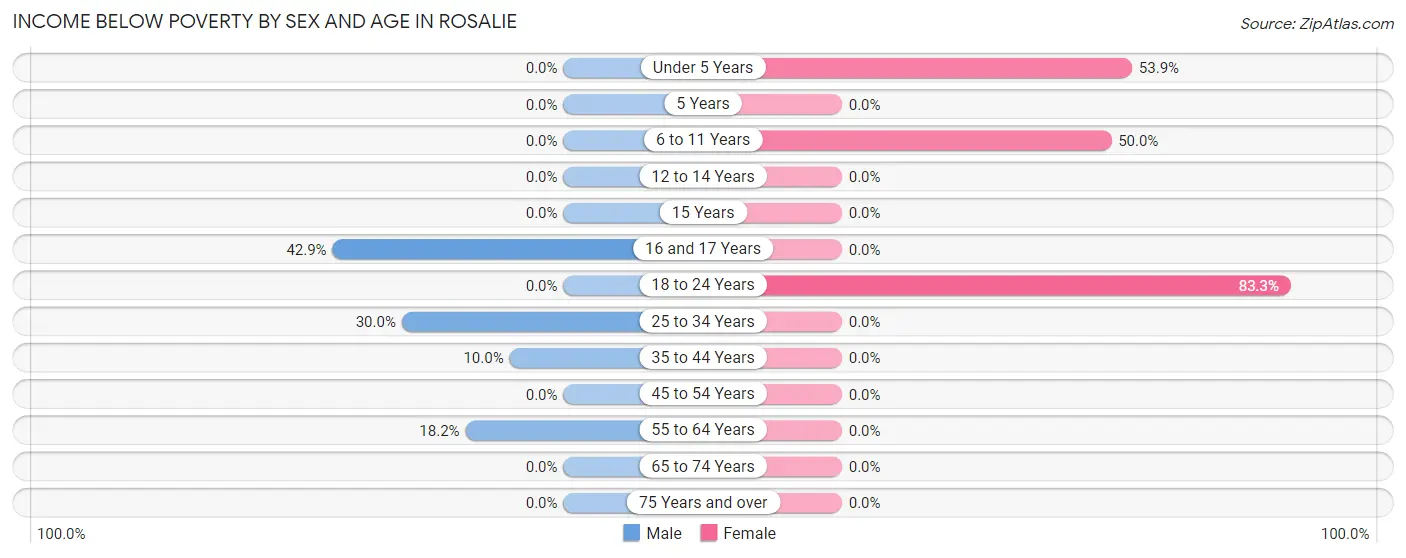
| Age Bracket | Male | Female |
| Under 5 Years | 0 (0.0%) | 7 (53.8%) |
| 5 Years | 0 (0.0%) | 0 (0.0%) |
| 6 to 11 Years | 0 (0.0%) | 2 (50.0%) |
| 12 to 14 Years | 0 (0.0%) | 0 (0.0%) |
| 15 Years | 0 (0.0%) | 0 (0.0%) |
| 16 and 17 Years | 3 (42.9%) | 0 (0.0%) |
| 18 to 24 Years | 0 (0.0%) | 10 (83.3%) |
| 25 to 34 Years | 3 (30.0%) | 0 (0.0%) |
| 35 to 44 Years | 2 (10.0%) | 0 (0.0%) |
| 45 to 54 Years | 0 (0.0%) | 0 (0.0%) |
| 55 to 64 Years | 2 (18.2%) | 0 (0.0%) |
| 65 to 74 Years | 0 (0.0%) | 0 (0.0%) |
| 75 Years and over | 0 (0.0%) | 0 (0.0%) |
| Total | 10 (7.2%) | 19 (21.1%) |
Income Above Poverty by Sex and Age in Rosalie
According to the poverty statistics in Rosalie, males aged under 5 years and females aged 12 to 14 years are the age groups that are most secure financially, with 100.0% of males and 100.0% of females in these age groups living above the poverty line.
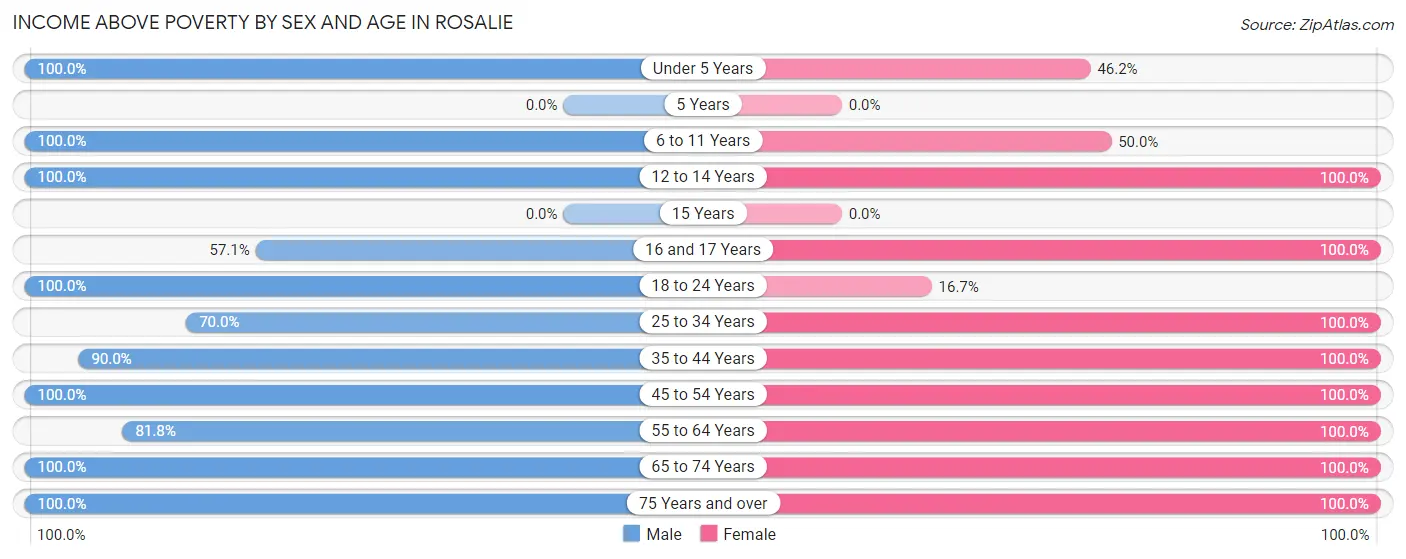
| Age Bracket | Male | Female |
| Under 5 Years | 13 (100.0%) | 6 (46.2%) |
| 5 Years | 0 (0.0%) | 0 (0.0%) |
| 6 to 11 Years | 30 (100.0%) | 2 (50.0%) |
| 12 to 14 Years | 10 (100.0%) | 6 (100.0%) |
| 15 Years | 0 (0.0%) | 0 (0.0%) |
| 16 and 17 Years | 4 (57.1%) | 5 (100.0%) |
| 18 to 24 Years | 17 (100.0%) | 2 (16.7%) |
| 25 to 34 Years | 7 (70.0%) | 16 (100.0%) |
| 35 to 44 Years | 18 (90.0%) | 9 (100.0%) |
| 45 to 54 Years | 14 (100.0%) | 8 (100.0%) |
| 55 to 64 Years | 9 (81.8%) | 6 (100.0%) |
| 65 to 74 Years | 5 (100.0%) | 6 (100.0%) |
| 75 Years and over | 2 (100.0%) | 5 (100.0%) |
| Total | 129 (92.8%) | 71 (78.9%) |
Income Below Poverty Among Married-Couple Families in Rosalie
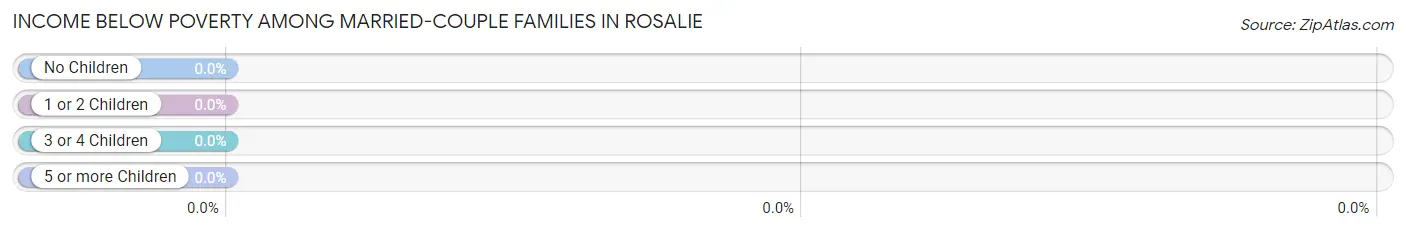
| Children | Above Poverty | Below Poverty |
| No Children | 9 (100.0%) | 0 (0.0%) |
| 1 or 2 Children | 9 (100.0%) | 0 (0.0%) |
| 3 or 4 Children | 8 (100.0%) | 0 (0.0%) |
| 5 or more Children | 4 (100.0%) | 0 (0.0%) |
| Total | 30 (100.0%) | 0 (0.0%) |
Income Below Poverty Among Single-Parent Households in Rosalie
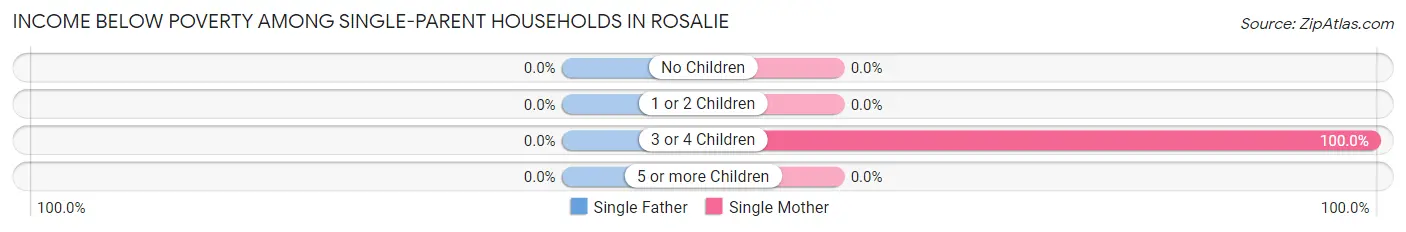
| Children | Single Father | Single Mother |
| No Children | 0 (0.0%) | 0 (0.0%) |
| 1 or 2 Children | 0 (0.0%) | 0 (0.0%) |
| 3 or 4 Children | 0 (0.0%) | 3 (100.0%) |
| 5 or more Children | 0 (0.0%) | 0 (0.0%) |
| Total | 0 (0.0%) | 3 (37.5%) |
Income Below Poverty Among Married-Couple vs Single-Parent Households in Rosalie
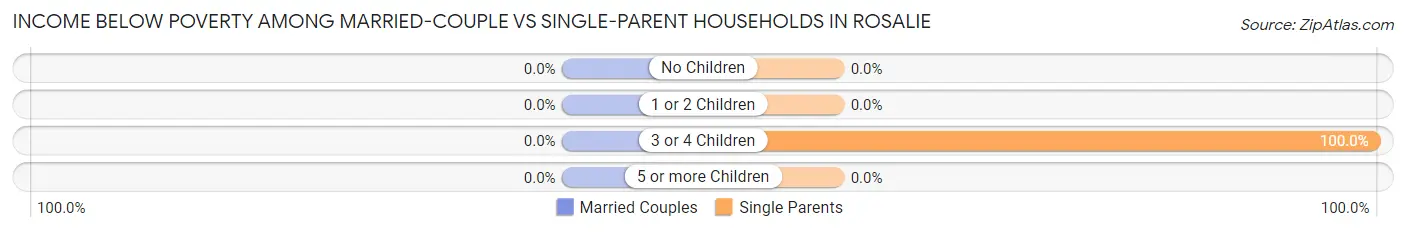
| Children | Married-Couple Families | Single-Parent Households |
| No Children | 0 (0.0%) | 0 (0.0%) |
| 1 or 2 Children | 0 (0.0%) | 0 (0.0%) |
| 3 or 4 Children | 0 (0.0%) | 3 (100.0%) |
| 5 or more Children | 0 (0.0%) | 0 (0.0%) |
| Total | 0 (0.0%) | 3 (37.5%) |
Race in Rosalie
The most populous races in Rosalie are Native / Alaskan (141 | 60.5%), White / Caucasian (63 | 27.0%), and Two or more Races (29 | 12.4%).
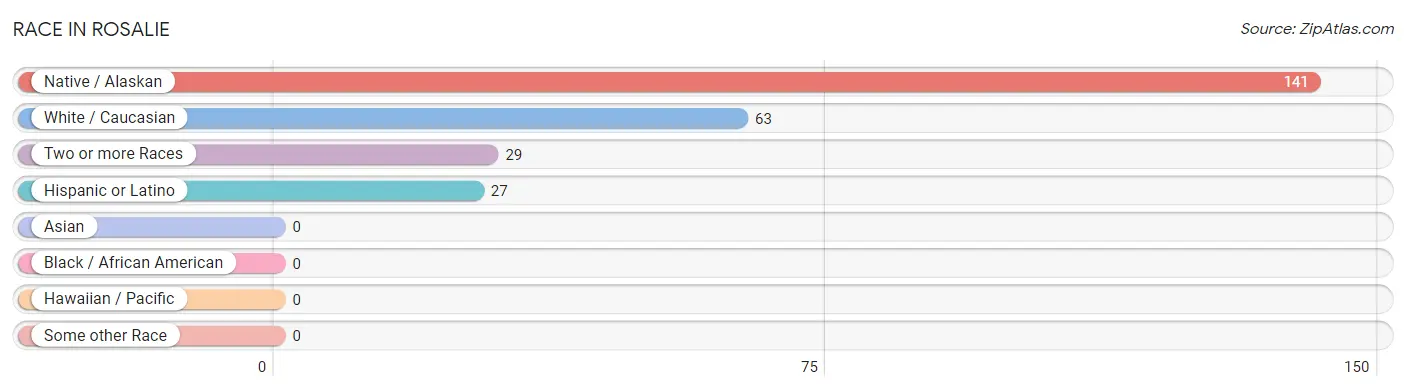
| Race | # Population | % Population |
| Asian | 0 | 0.0% |
| Black / African American | 0 | 0.0% |
| Hawaiian / Pacific | 0 | 0.0% |
| Hispanic or Latino | 27 | 11.6% |
| Native / Alaskan | 141 | 60.5% |
| White / Caucasian | 63 | 27.0% |
| Two or more Races | 29 | 12.4% |
| Some other Race | 0 | 0.0% |
| Total | 233 | 100.0% |
Ancestry in Rosalie
The most populous ancestries reported in Rosalie are German (57 | 24.5%), Mexican (27 | 11.6%), Navajo (13 | 5.6%), Czech (12 | 5.1%), and Italian (9 | 3.9%), together accounting for 50.6% of all Rosalie residents.
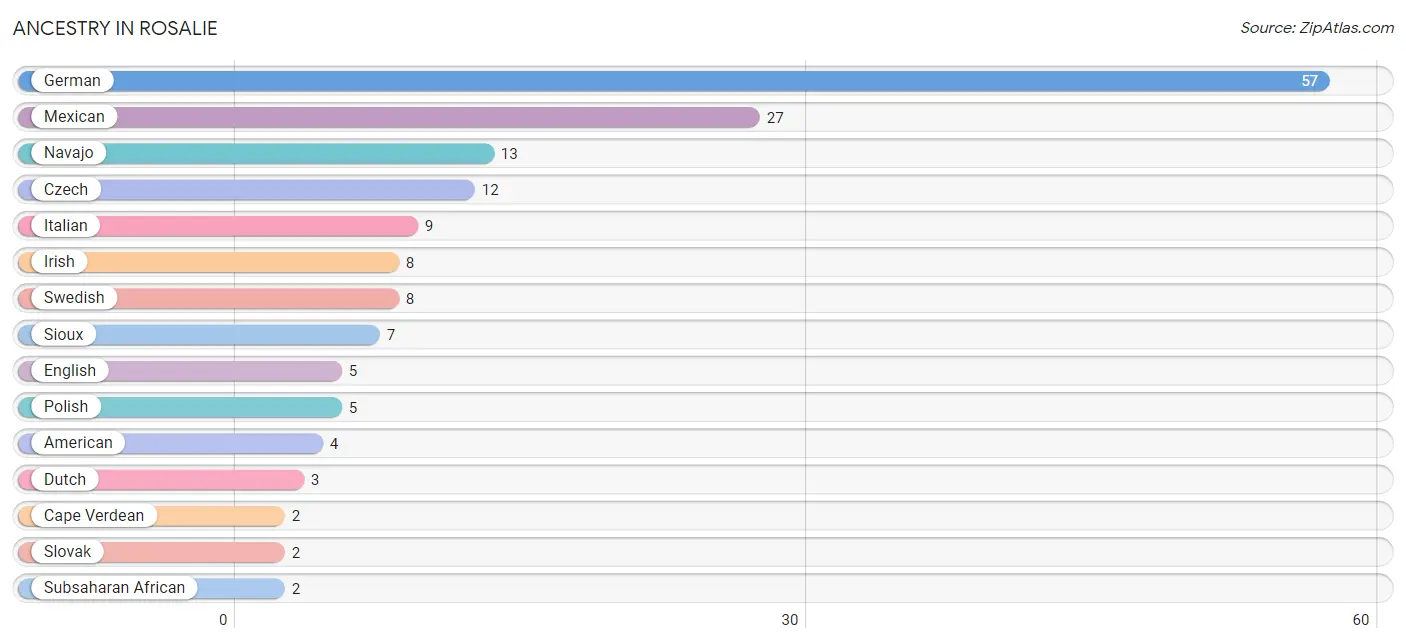
| Ancestry | # Population | % Population |
| American | 4 | 1.7% |
| Cape Verdean | 2 | 0.9% |
| Czech | 12 | 5.1% |
| Czechoslovakian | 1 | 0.4% |
| Dutch | 3 | 1.3% |
| English | 5 | 2.1% |
| French | 1 | 0.4% |
| German | 57 | 24.5% |
| Irish | 8 | 3.4% |
| Italian | 9 | 3.9% |
| Mexican | 27 | 11.6% |
| Navajo | 13 | 5.6% |
| Norwegian | 1 | 0.4% |
| Polish | 5 | 2.1% |
| Sioux | 7 | 3.0% |
| Slovak | 2 | 0.9% |
| Subsaharan African | 2 | 0.9% |
| Swedish | 8 | 3.4% | View All 18 Rows |
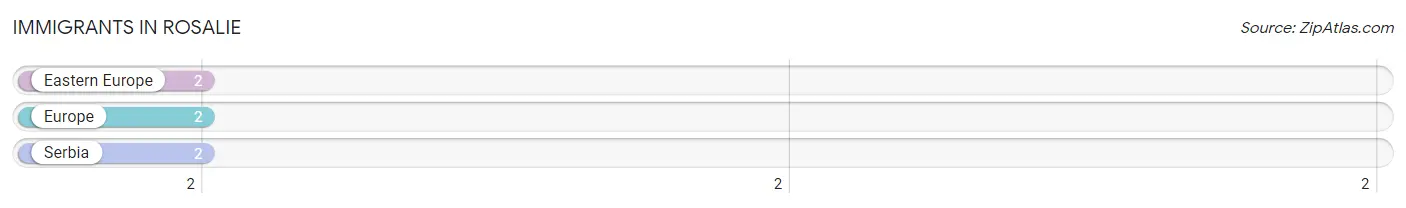
Immigrants in Rosalie
The most numerous immigrant groups reported in Rosalie came from Eastern Europe (2 | 0.9%), Europe (2 | 0.9%), and Serbia (2 | 0.9%), together accounting for 2.6% of all Rosalie residents.
| Immigration Origin | # Population | % Population |
| Eastern Europe | 2 | 0.9% |
| Europe | 2 | 0.9% |
| Serbia | 2 | 0.9% | View All 3 Rows |
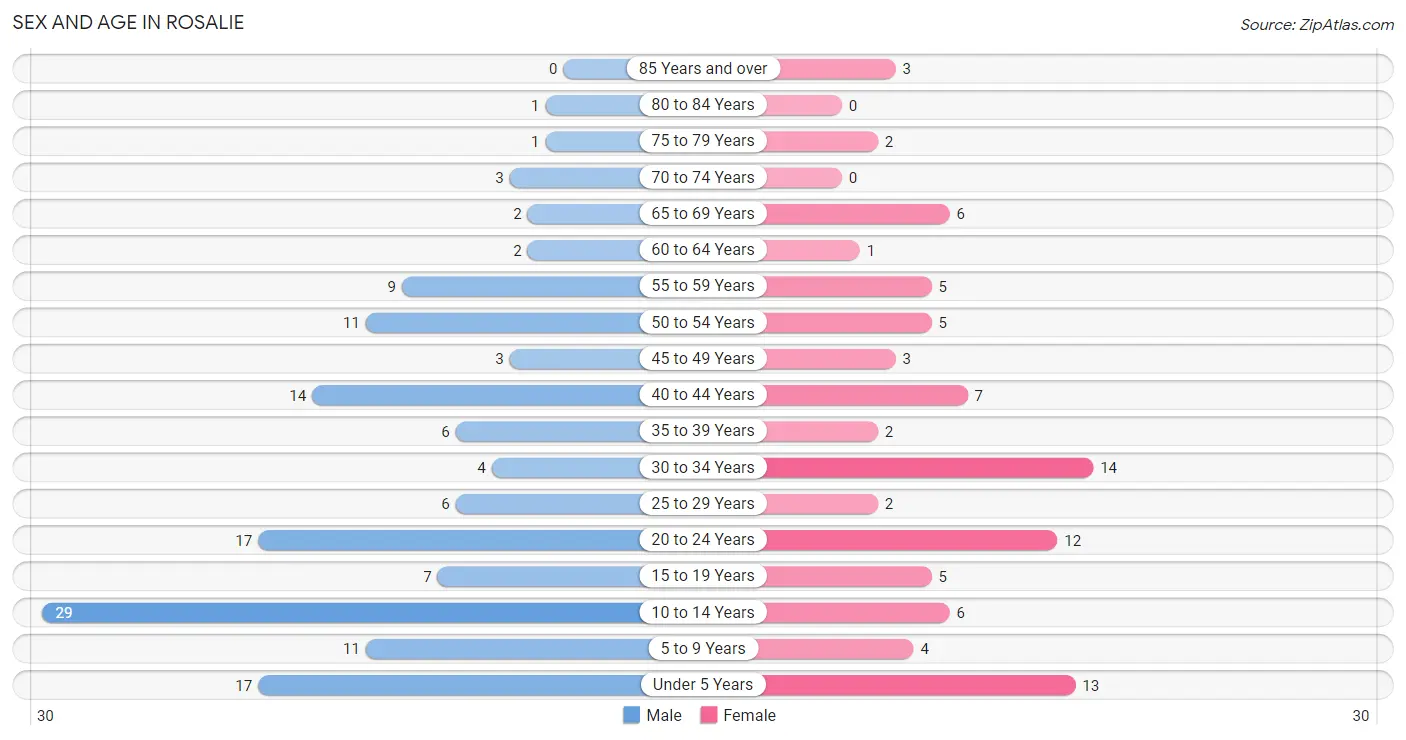
Sex and Age in Rosalie
Sex and Age in Rosalie
The most populous age groups in Rosalie are 10 to 14 Years (29 | 20.3%) for men and 30 to 34 Years (14 | 15.6%) for women.
| Age Bracket | Male | Female |
| Under 5 Years | 17 (11.9%) | 13 (14.4%) |
| 5 to 9 Years | 11 (7.7%) | 4 (4.4%) |
| 10 to 14 Years | 29 (20.3%) | 6 (6.7%) |
| 15 to 19 Years | 7 (4.9%) | 5 (5.6%) |
| 20 to 24 Years | 17 (11.9%) | 12 (13.3%) |
| 25 to 29 Years | 6 (4.2%) | 2 (2.2%) |
| 30 to 34 Years | 4 (2.8%) | 14 (15.6%) |
| 35 to 39 Years | 6 (4.2%) | 2 (2.2%) |
| 40 to 44 Years | 14 (9.8%) | 7 (7.8%) |
| 45 to 49 Years | 3 (2.1%) | 3 (3.3%) |
| 50 to 54 Years | 11 (7.7%) | 5 (5.6%) |
| 55 to 59 Years | 9 (6.3%) | 5 (5.6%) |
| 60 to 64 Years | 2 (1.4%) | 1 (1.1%) |
| 65 to 69 Years | 2 (1.4%) | 6 (6.7%) |
| 70 to 74 Years | 3 (2.1%) | 0 (0.0%) |
| 75 to 79 Years | 1 (0.7%) | 2 (2.2%) |
| 80 to 84 Years | 1 (0.7%) | 0 (0.0%) |
| 85 Years and over | 0 (0.0%) | 3 (3.3%) |
| Total | 143 (100.0%) | 90 (100.0%) |
Families and Households in Rosalie
Median Family Size in Rosalie
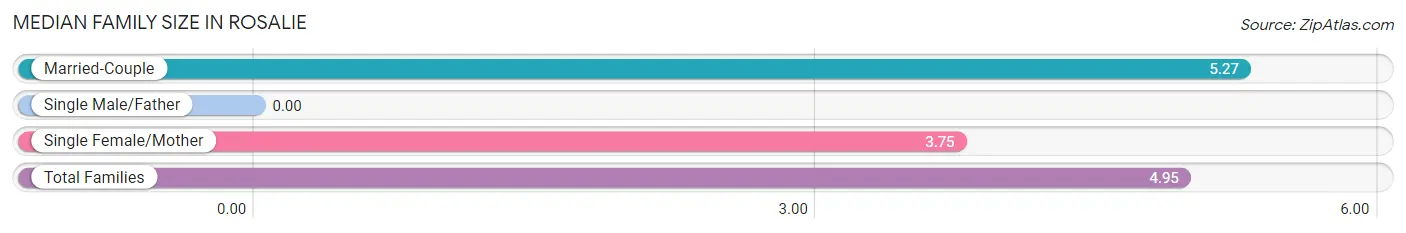
| Family Type | # Families | Family Size |
| Married-Couple | 30 (78.9%) | 5.27 |
| Single Male/Father | 0 (0.0%) | - |
| Single Female/Mother | 8 (21.0%) | 3.75 |
| Total Families | 38 (100.0%) | 4.95 |
Median Household Size in Rosalie
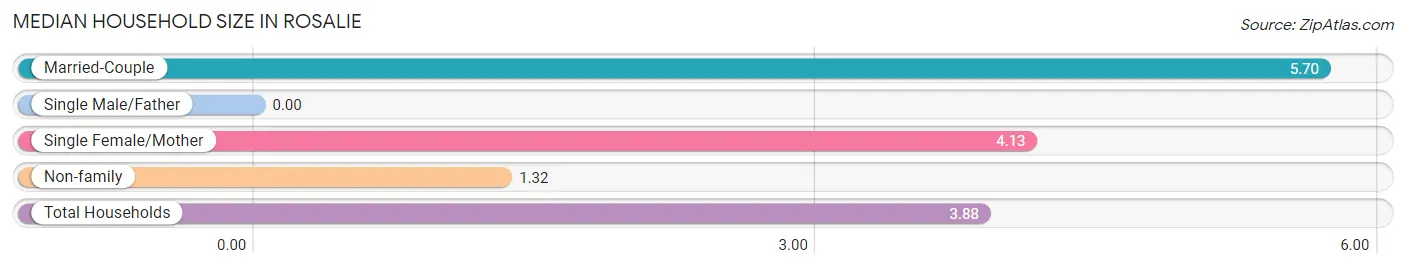
| Household Type | # Households | Household Size |
| Married-Couple | 30 (50.0%) | 5.70 |
| Single Male/Father | 0 (0.0%) | - |
| Single Female/Mother | 8 (13.3%) | 4.13 |
| Non-family | 22 (36.7%) | 1.32 |
| Total Households | 60 (100.0%) | 3.88 |
Household Size by Marriage Status in Rosalie
Out of a total of 60 households in Rosalie, 38 (63.3%) are family households, while 22 (36.7%) are nonfamily households. The most numerous type of family households are 2-person households, comprising 11, and the most common type of nonfamily households are 1-person households, comprising 17.
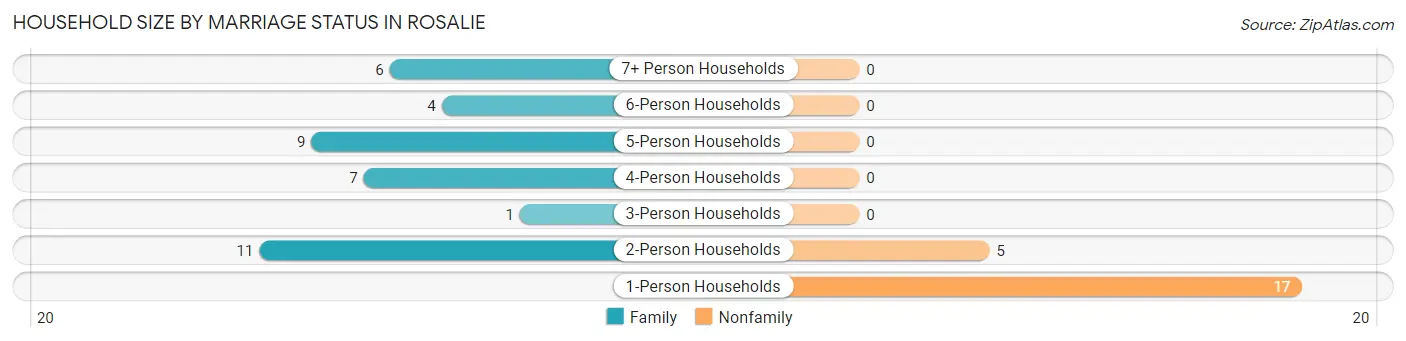
| Household Size | Family Households | Nonfamily Households |
| 1-Person Households | - | 17 (28.3%) |
| 2-Person Households | 11 (18.3%) | 5 (8.3%) |
| 3-Person Households | 1 (1.7%) | 0 (0.0%) |
| 4-Person Households | 7 (11.7%) | 0 (0.0%) |
| 5-Person Households | 9 (15.0%) | 0 (0.0%) |
| 6-Person Households | 4 (6.7%) | 0 (0.0%) |
| 7+ Person Households | 6 (10.0%) | 0 (0.0%) |
| Total | 38 (63.3%) | 22 (36.7%) |
Female Fertility in Rosalie
Fertility by Age in Rosalie
Average fertility rate in Rosalie is 178.0 births per 1,000 women. Women in the age bracket of 20 to 34 years have the highest fertility rate with 286.0 births per 1,000 women. Women in the age bracket of 20 to 34 years acount for 100.0% of all women with births.
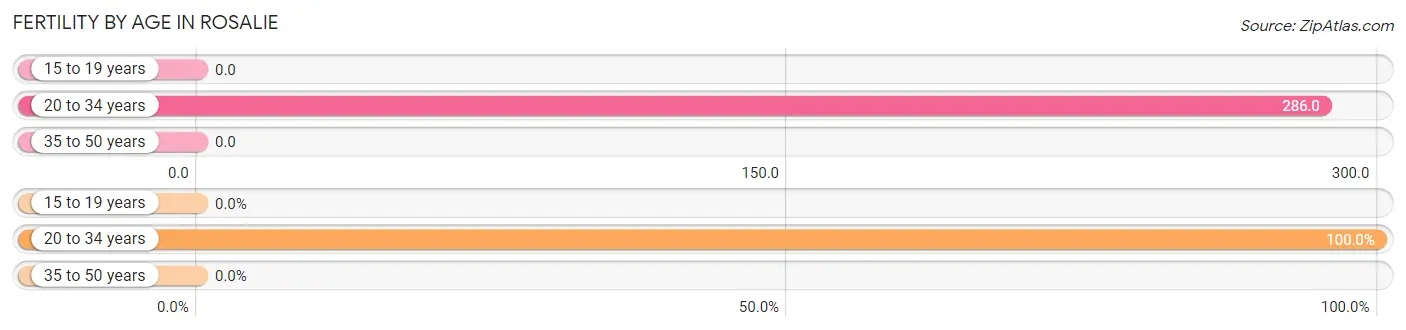
| Age Bracket | Women with Births | Births / 1,000 Women |
| 15 to 19 years | 0 (0.0%) | 0.0 |
| 20 to 34 years | 8 (100.0%) | 286.0 |
| 35 to 50 years | 0 (0.0%) | 0.0 |
| Total | 8 (100.0%) | 178.0 |
Fertility by Age by Marriage Status in Rosalie
25.0% of women with births (8) in Rosalie are married. The highest percentage of unmarried women with births falls into 20 to 34 years age bracket with 75.0% of them unmarried at the time of birth, while the lowest percentage of unmarried women with births belong to 20 to 34 years age bracket with 75.0% of them unmarried.
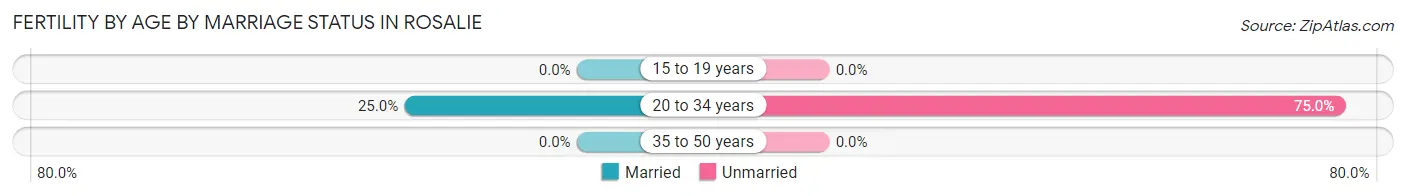
| Age Bracket | Married | Unmarried |
| 15 to 19 years | 0 (0.0%) | 0 (0.0%) |
| 20 to 34 years | 2 (25.0%) | 6 (75.0%) |
| 35 to 50 years | 0 (0.0%) | 0 (0.0%) |
| Total | 2 (25.0%) | 6 (75.0%) |
Fertility by Education in Rosalie
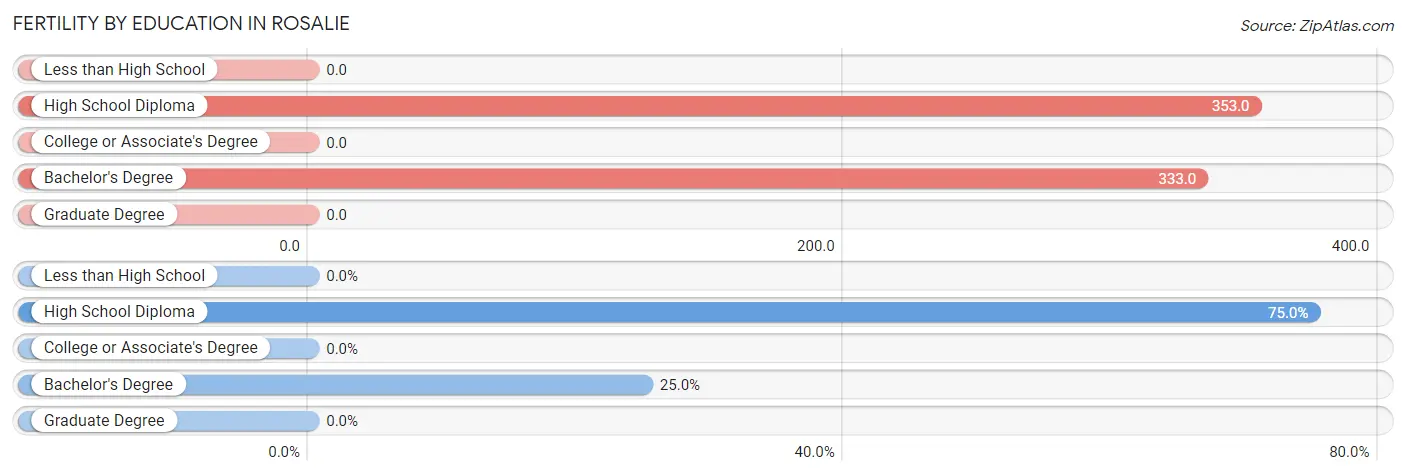
| Educational Attainment | Women with Births | Births / 1,000 Women |
| Less than High School | 0 (0.0%) | 0.0 |
| High School Diploma | 6 (75.0%) | 353.0 |
| College or Associate's Degree | 0 (0.0%) | 0.0 |
| Bachelor's Degree | 2 (25.0%) | 333.0 |
| Graduate Degree | 0 (0.0%) | 0.0 |
| Total | 8 (100.0%) | 178.0 |
Fertility by Education by Marriage Status in Rosalie
75.0% of women with births in Rosalie are unmarried. Women with the educational attainment of bachelor's degree are most likely to be married with 100.0% of them married at childbirth, while women with the educational attainment of high school diploma are least likely to be married with 100.0% of them unmarried at childbirth.
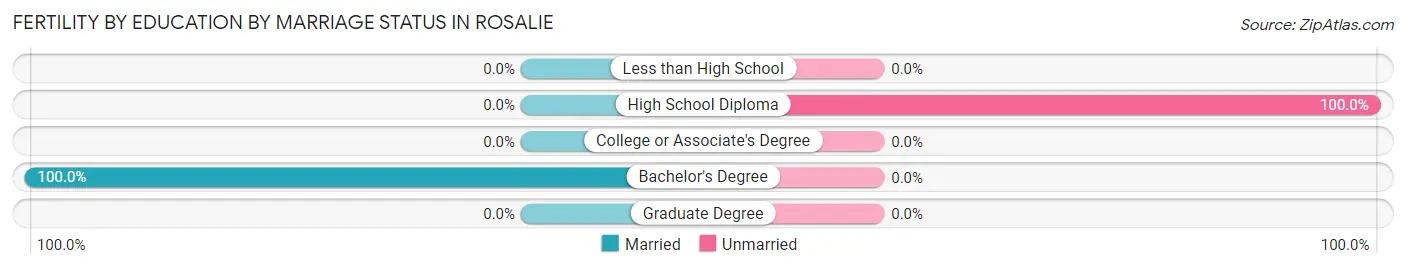
| Educational Attainment | Married | Unmarried |
| Less than High School | 0 (0.0%) | 0 (0.0%) |
| High School Diploma | 0 (0.0%) | 6 (100.0%) |
| College or Associate's Degree | 0 (0.0%) | 0 (0.0%) |
| Bachelor's Degree | 2 (100.0%) | 0 (0.0%) |
| Graduate Degree | 0 (0.0%) | 0 (0.0%) |
| Total | 2 (25.0%) | 6 (75.0%) |
Employment Characteristics in Rosalie
Employment by Class of Employer in Rosalie
Among the 93 employed individuals in Rosalie, private company employees (31 | 33.3%), local government employees (27 | 29.0%), and federal government employees (16 | 17.2%) make up the most common classes of employment.
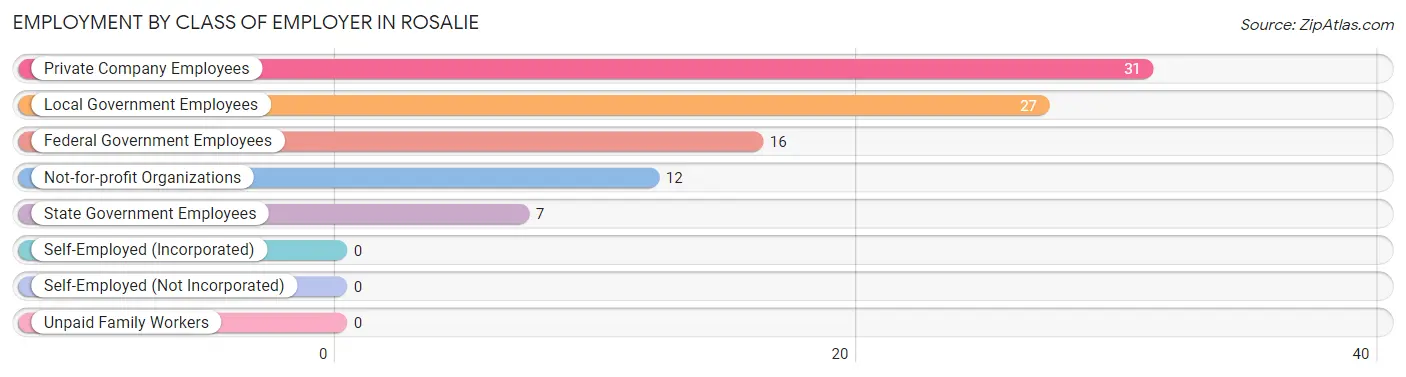
| Employer Class | # Employees | % Employees |
| Private Company Employees | 31 | 33.3% |
| Self-Employed (Incorporated) | 0 | 0.0% |
| Self-Employed (Not Incorporated) | 0 | 0.0% |
| Not-for-profit Organizations | 12 | 12.9% |
| Local Government Employees | 27 | 29.0% |
| State Government Employees | 7 | 7.5% |
| Federal Government Employees | 16 | 17.2% |
| Unpaid Family Workers | 0 | 0.0% |
| Total | 93 | 100.0% |
Employment Status by Age in Rosalie
According to the labor force statistics for Rosalie, out of the total population over 16 years of age (153), 70.6% or 108 individuals are in the labor force, with 12.0% or 13 of them unemployed. The age group with the highest labor force participation rate is 25 to 29 years, with 100.0% or 8 individuals in the labor force. Within the labor force, the 25 to 29 years age range has the highest percentage of unemployed individuals, with 37.5% or 3 of them being unemployed.
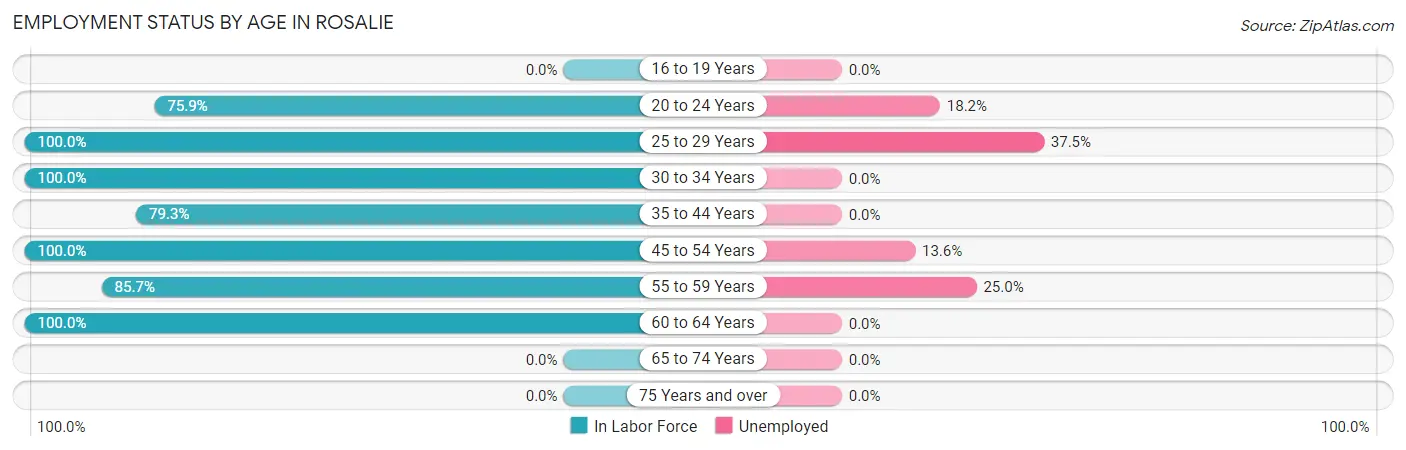
| Age Bracket | In Labor Force | Unemployed |
| 16 to 19 Years | 0 (0.0%) | 0 (0.0%) |
| 20 to 24 Years | 22 (75.9%) | 4 (18.2%) |
| 25 to 29 Years | 8 (100.0%) | 3 (37.5%) |
| 30 to 34 Years | 18 (100.0%) | 0 (0.0%) |
| 35 to 44 Years | 23 (79.3%) | 0 (0.0%) |
| 45 to 54 Years | 22 (100.0%) | 3 (13.6%) |
| 55 to 59 Years | 12 (85.7%) | 3 (25.0%) |
| 60 to 64 Years | 3 (100.0%) | 0 (0.0%) |
| 65 to 74 Years | 0 (0.0%) | 0 (0.0%) |
| 75 Years and over | 0 (0.0%) | 0 (0.0%) |
| Total | 108 (70.6%) | 13 (12.0%) |
Employment Status by Educational Attainment in Rosalie
According to labor force statistics for Rosalie, 91.5% of individuals (86) out of the total population between 25 and 64 years of age (94) are in the labor force, with 10.5% or 9 of them being unemployed. The group with the highest labor force participation rate are those with the educational attainment of college / associate degree, with 100.0% or 24 individuals in the labor force. Within the labor force, individuals with high school diploma education have the highest percentage of unemployment, with 29.0% or 9 of them being unemployed.
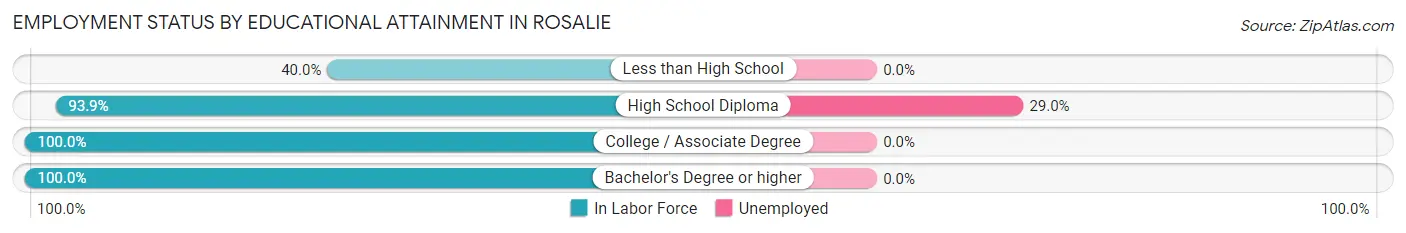
| Educational Attainment | In Labor Force | Unemployed |
| Less than High School | 4 (40.0%) | 0 (0.0%) |
| High School Diploma | 31 (93.9%) | 10 (29.0%) |
| College / Associate Degree | 24 (100.0%) | 0 (0.0%) |
| Bachelor's Degree or higher | 27 (100.0%) | 0 (0.0%) |
| Total | 86 (91.5%) | 10 (10.5%) |
Employment Occupations by Sex in Rosalie
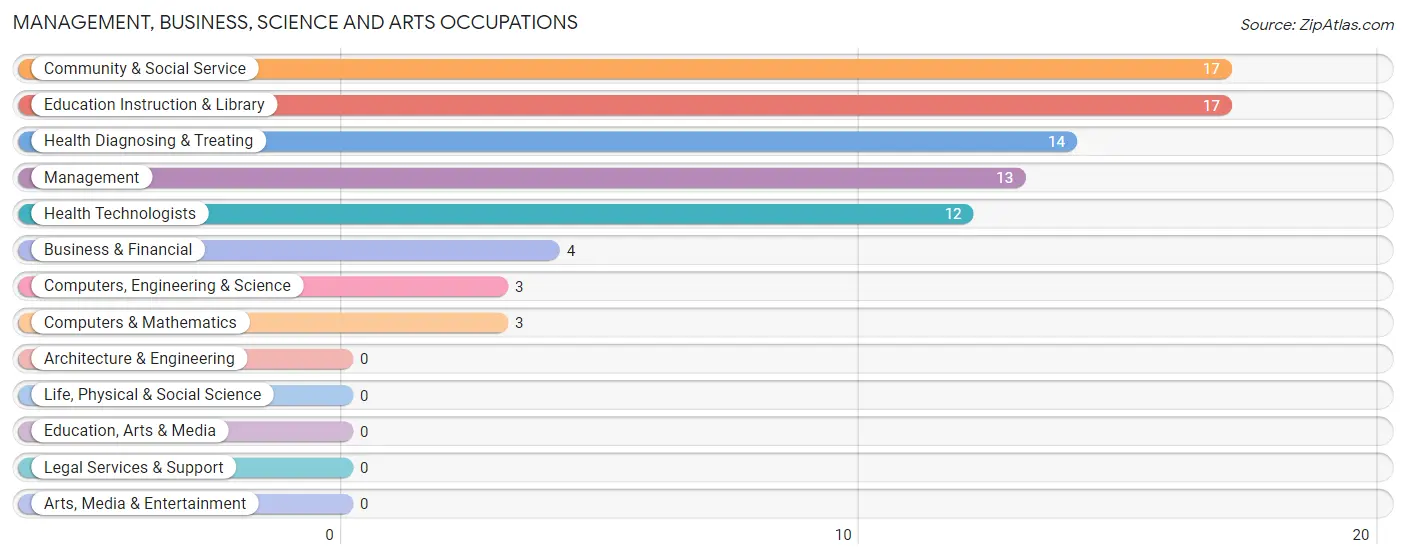
Management, Business, Science and Arts Occupations
The most common Management, Business, Science and Arts occupations in Rosalie are Community & Social Service (17 | 17.9%), Education Instruction & Library (17 | 17.9%), Health Diagnosing & Treating (14 | 14.7%), Management (13 | 13.7%), and Health Technologists (12 | 12.6%).
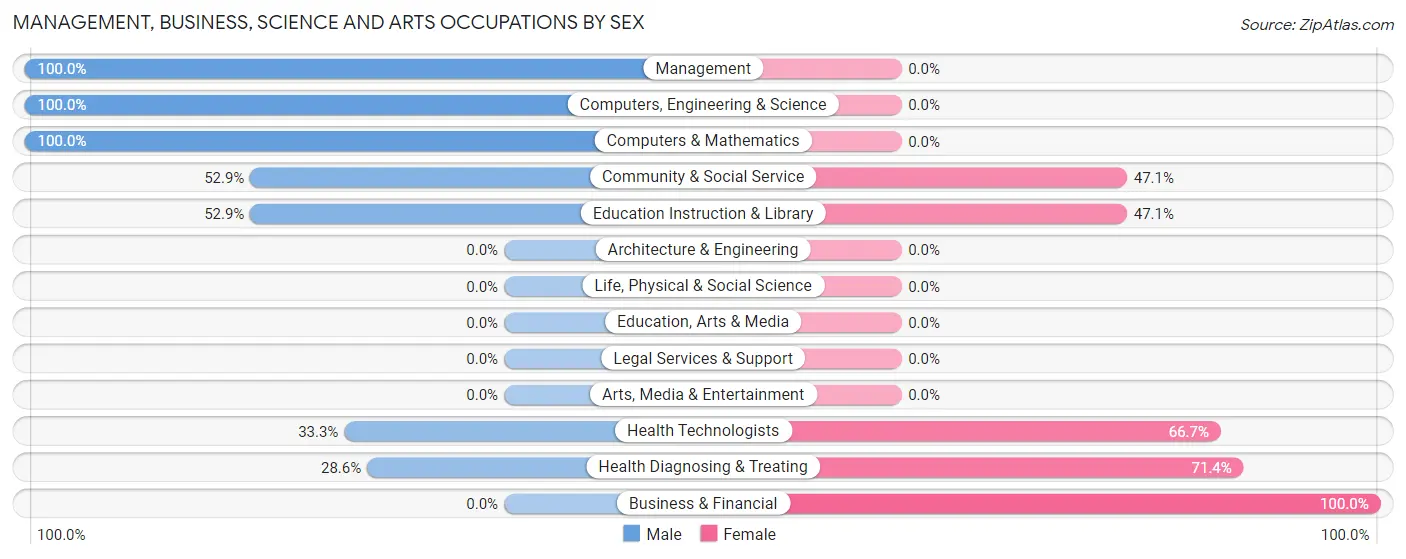
Management, Business, Science and Arts Occupations by Sex
Within the Management, Business, Science and Arts occupations in Rosalie, the most male-oriented occupations are Management (100.0%), Computers, Engineering & Science (100.0%), and Computers & Mathematics (100.0%), while the most female-oriented occupations are Business & Financial (100.0%), Health Diagnosing & Treating (71.4%), and Health Technologists (66.7%).
| Occupation | Male | Female |
| Management | 13 (100.0%) | 0 (0.0%) |
| Business & Financial | 0 (0.0%) | 4 (100.0%) |
| Computers, Engineering & Science | 3 (100.0%) | 0 (0.0%) |
| Computers & Mathematics | 3 (100.0%) | 0 (0.0%) |
| Architecture & Engineering | 0 (0.0%) | 0 (0.0%) |
| Life, Physical & Social Science | 0 (0.0%) | 0 (0.0%) |
| Community & Social Service | 9 (52.9%) | 8 (47.1%) |
| Education, Arts & Media | 0 (0.0%) | 0 (0.0%) |
| Legal Services & Support | 0 (0.0%) | 0 (0.0%) |
| Education Instruction & Library | 9 (52.9%) | 8 (47.1%) |
| Arts, Media & Entertainment | 0 (0.0%) | 0 (0.0%) |
| Health Diagnosing & Treating | 4 (28.6%) | 10 (71.4%) |
| Health Technologists | 4 (33.3%) | 8 (66.7%) |
| Total (Category) | 29 (56.9%) | 22 (43.1%) |
| Total (Overall) | 54 (56.8%) | 41 (43.2%) |
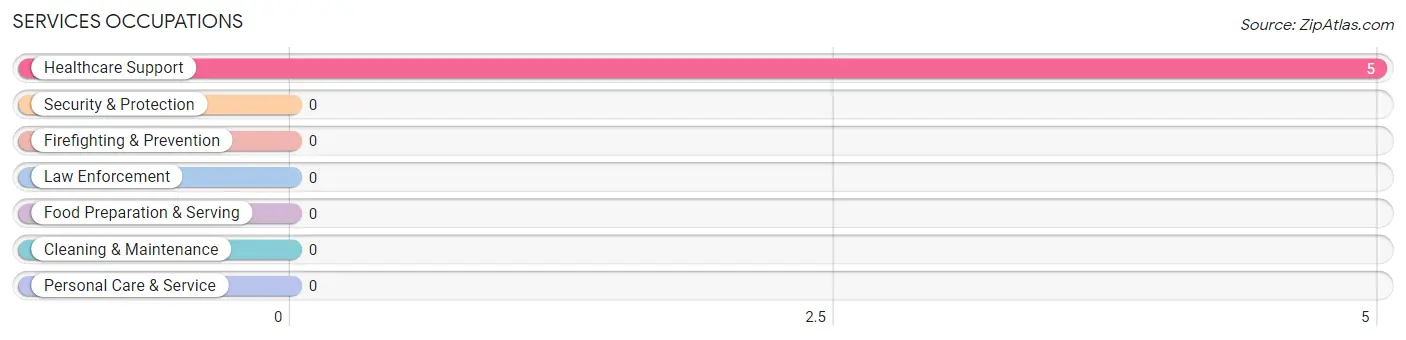
Services Occupations
The most common Services occupations in Rosalie are , and Healthcare Support (5 | 5.3%).
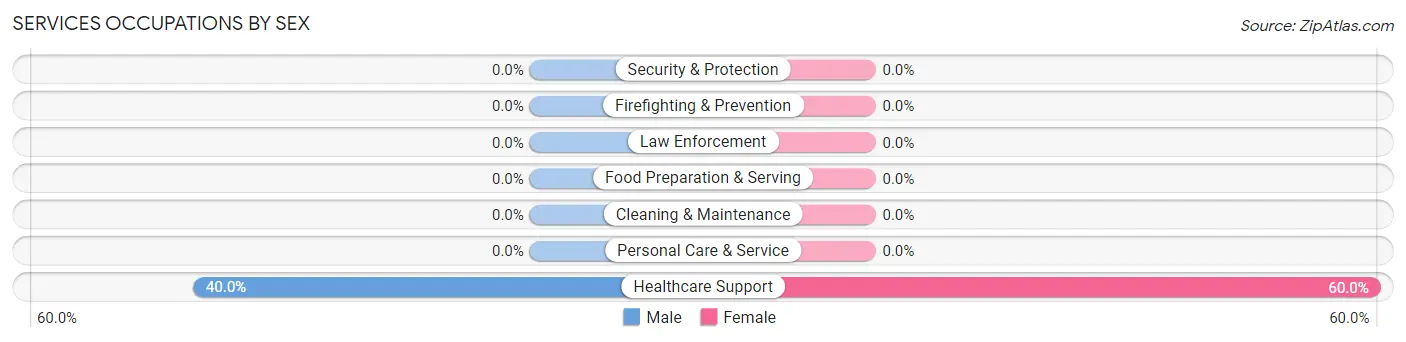
Services Occupations by Sex
| Occupation | Male | Female |
| Healthcare Support | 2 (40.0%) | 3 (60.0%) |
| Security & Protection | 0 (0.0%) | 0 (0.0%) |
| Firefighting & Prevention | 0 (0.0%) | 0 (0.0%) |
| Law Enforcement | 0 (0.0%) | 0 (0.0%) |
| Food Preparation & Serving | 0 (0.0%) | 0 (0.0%) |
| Cleaning & Maintenance | 0 (0.0%) | 0 (0.0%) |
| Personal Care & Service | 0 (0.0%) | 0 (0.0%) |
| Total (Category) | 2 (40.0%) | 3 (60.0%) |
| Total (Overall) | 54 (56.8%) | 41 (43.2%) |
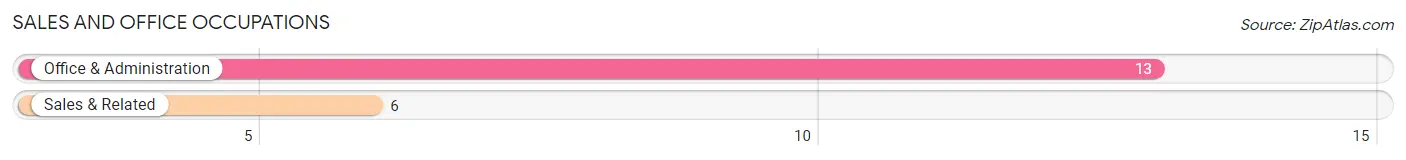
Sales and Office Occupations
The most common Sales and Office occupations in Rosalie are Office & Administration (13 | 13.7%), and Sales & Related (6 | 6.3%).
Sales and Office Occupations by Sex
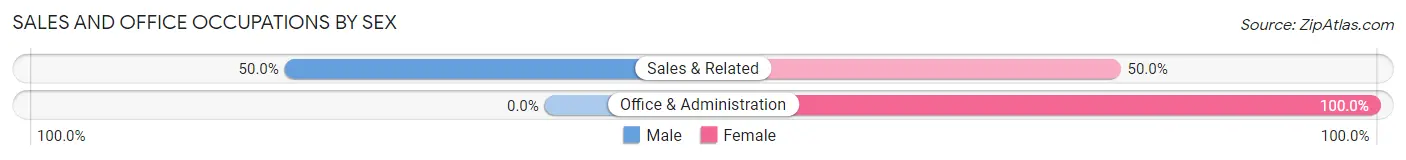
| Occupation | Male | Female |
| Sales & Related | 3 (50.0%) | 3 (50.0%) |
| Office & Administration | 0 (0.0%) | 13 (100.0%) |
| Total (Category) | 3 (15.8%) | 16 (84.2%) |
| Total (Overall) | 54 (56.8%) | 41 (43.2%) |
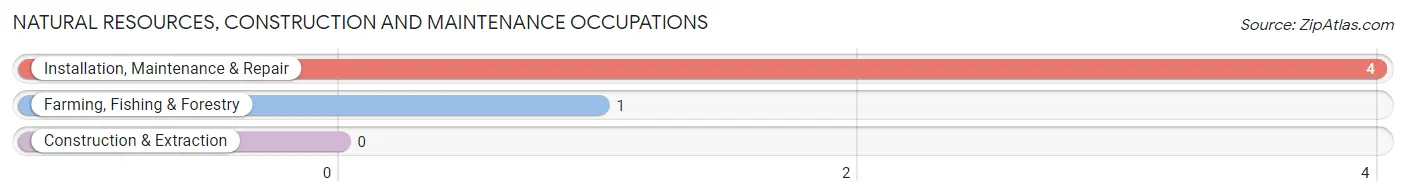
Natural Resources, Construction and Maintenance Occupations
The most common Natural Resources, Construction and Maintenance occupations in Rosalie are Installation, Maintenance & Repair (4 | 4.2%), and Farming, Fishing & Forestry (1 | 1.1%).
Natural Resources, Construction and Maintenance Occupations by Sex
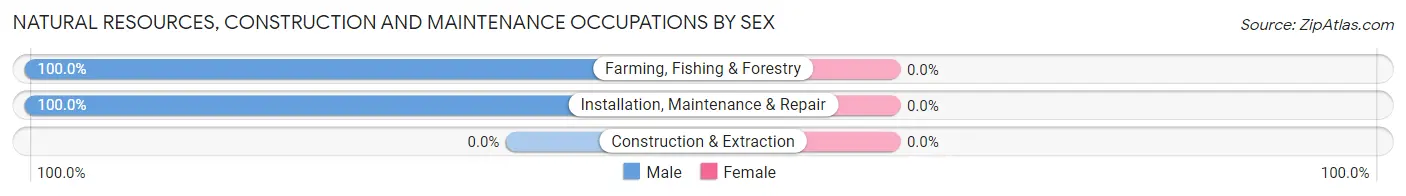
| Occupation | Male | Female |
| Farming, Fishing & Forestry | 1 (100.0%) | 0 (0.0%) |
| Construction & Extraction | 0 (0.0%) | 0 (0.0%) |
| Installation, Maintenance & Repair | 4 (100.0%) | 0 (0.0%) |
| Total (Category) | 5 (100.0%) | 0 (0.0%) |
| Total (Overall) | 54 (56.8%) | 41 (43.2%) |
Production, Transportation and Moving Occupations
The most common Production, Transportation and Moving occupations in Rosalie are Production (9 | 9.5%), Material Moving (4 | 4.2%), and Transportation (2 | 2.1%).
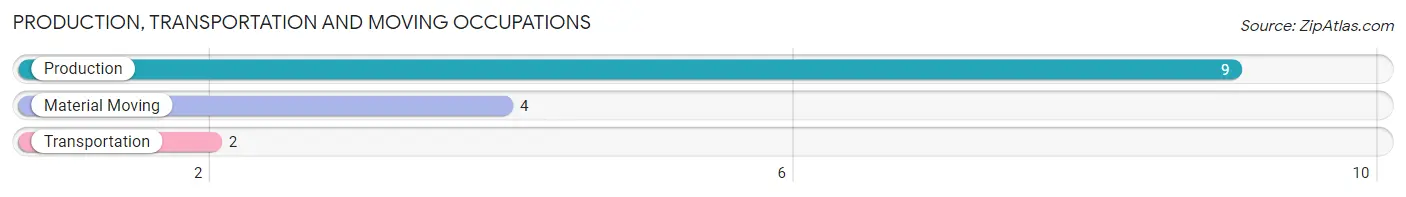
Production, Transportation and Moving Occupations by Sex
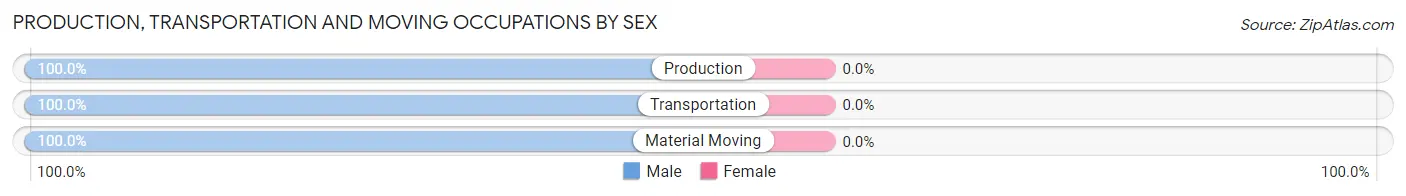
| Occupation | Male | Female |
| Production | 9 (100.0%) | 0 (0.0%) |
| Transportation | 2 (100.0%) | 0 (0.0%) |
| Material Moving | 4 (100.0%) | 0 (0.0%) |
| Total (Category) | 15 (100.0%) | 0 (0.0%) |
| Total (Overall) | 54 (56.8%) | 41 (43.2%) |
Employment Industries by Sex in Rosalie
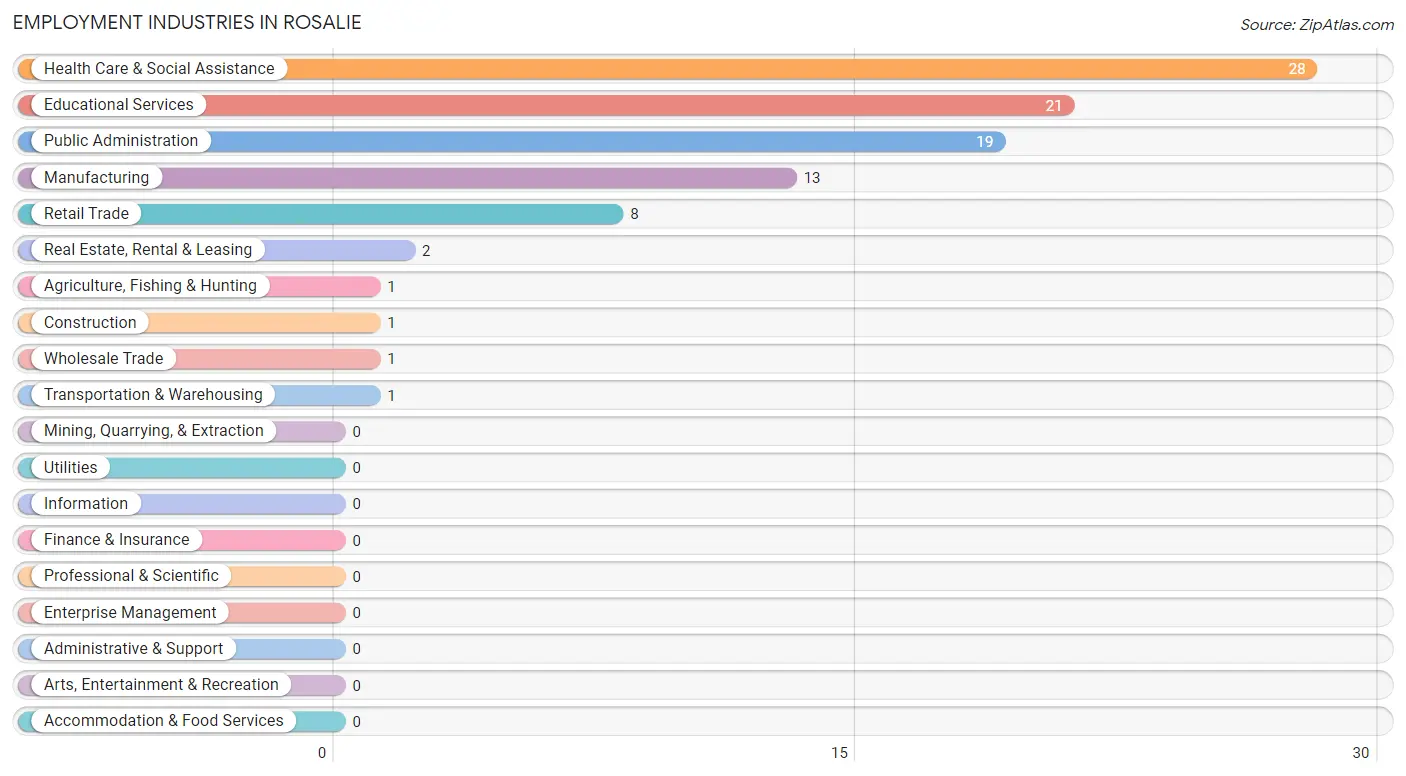
Employment Industries in Rosalie
The major employment industries in Rosalie include Health Care & Social Assistance (28 | 29.5%), Educational Services (21 | 22.1%), Public Administration (19 | 20.0%), Manufacturing (13 | 13.7%), and Retail Trade (8 | 8.4%).
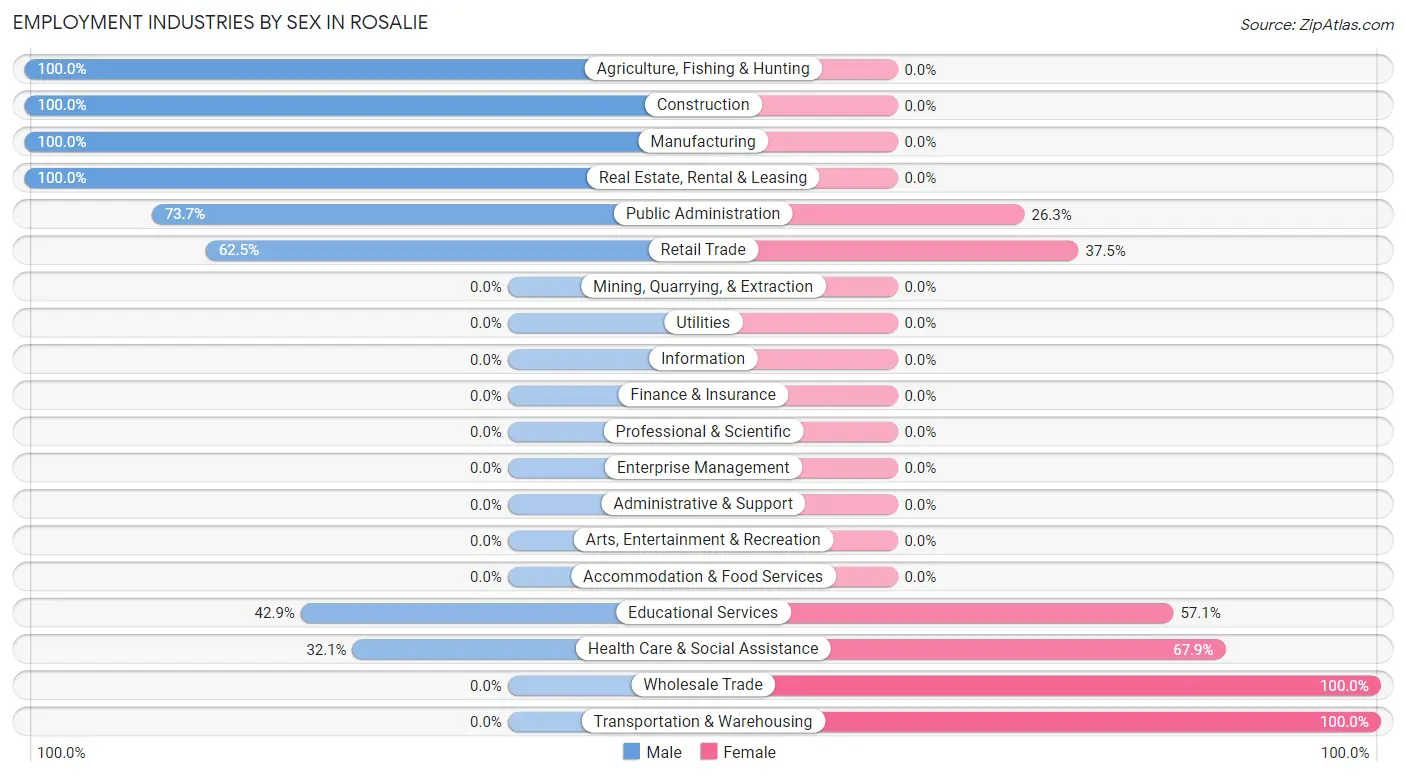
Employment Industries by Sex in Rosalie
The Rosalie industries that see more men than women are Agriculture, Fishing & Hunting (100.0%), Construction (100.0%), and Manufacturing (100.0%), whereas the industries that tend to have a higher number of women are Wholesale Trade (100.0%), Transportation & Warehousing (100.0%), and Health Care & Social Assistance (67.9%).
| Industry | Male | Female |
| Agriculture, Fishing & Hunting | 1 (100.0%) | 0 (0.0%) |
| Mining, Quarrying, & Extraction | 0 (0.0%) | 0 (0.0%) |
| Construction | 1 (100.0%) | 0 (0.0%) |
| Manufacturing | 13 (100.0%) | 0 (0.0%) |
| Wholesale Trade | 0 (0.0%) | 1 (100.0%) |
| Retail Trade | 5 (62.5%) | 3 (37.5%) |
| Transportation & Warehousing | 0 (0.0%) | 1 (100.0%) |
| Utilities | 0 (0.0%) | 0 (0.0%) |
| Information | 0 (0.0%) | 0 (0.0%) |
| Finance & Insurance | 0 (0.0%) | 0 (0.0%) |
| Real Estate, Rental & Leasing | 2 (100.0%) | 0 (0.0%) |
| Professional & Scientific | 0 (0.0%) | 0 (0.0%) |
| Enterprise Management | 0 (0.0%) | 0 (0.0%) |
| Administrative & Support | 0 (0.0%) | 0 (0.0%) |
| Educational Services | 9 (42.9%) | 12 (57.1%) |
| Health Care & Social Assistance | 9 (32.1%) | 19 (67.9%) |
| Arts, Entertainment & Recreation | 0 (0.0%) | 0 (0.0%) |
| Accommodation & Food Services | 0 (0.0%) | 0 (0.0%) |
| Public Administration | 14 (73.7%) | 5 (26.3%) |
| Total | 54 (56.8%) | 41 (43.2%) |
Education in Rosalie
School Enrollment in Rosalie
The most common levels of schooling among the 102 students in Rosalie are elementary school (28 | 27.5%), middle school (18 | 17.6%), and nursery / preschool (17 | 16.7%).
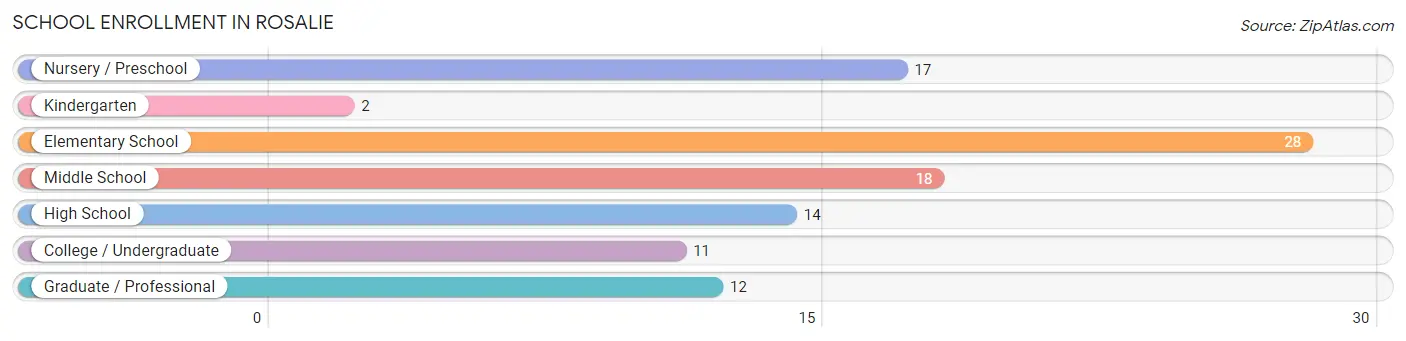
| School Level | # Students | % Students |
| Nursery / Preschool | 17 | 16.7% |
| Kindergarten | 2 | 2.0% |
| Elementary School | 28 | 27.5% |
| Middle School | 18 | 17.6% |
| High School | 14 | 13.7% |
| College / Undergraduate | 11 | 10.8% |
| Graduate / Professional | 12 | 11.8% |
| Total | 102 | 100.0% |
School Enrollment by Age by Funding Source in Rosalie
Out of a total of 102 students who are enrolled in schools in Rosalie, 8 (7.8%) attend a private institution, while the remaining 94 (92.2%) are enrolled in public schools. The age group of 35 years and over has the highest likelihood of being enrolled in private schools, with 4 (100.0% in the age bracket) enrolled. Conversely, the age group of 3 to 4 year olds has the lowest likelihood of being enrolled in a private school, with 17 (100.0% in the age bracket) attending a public institution.
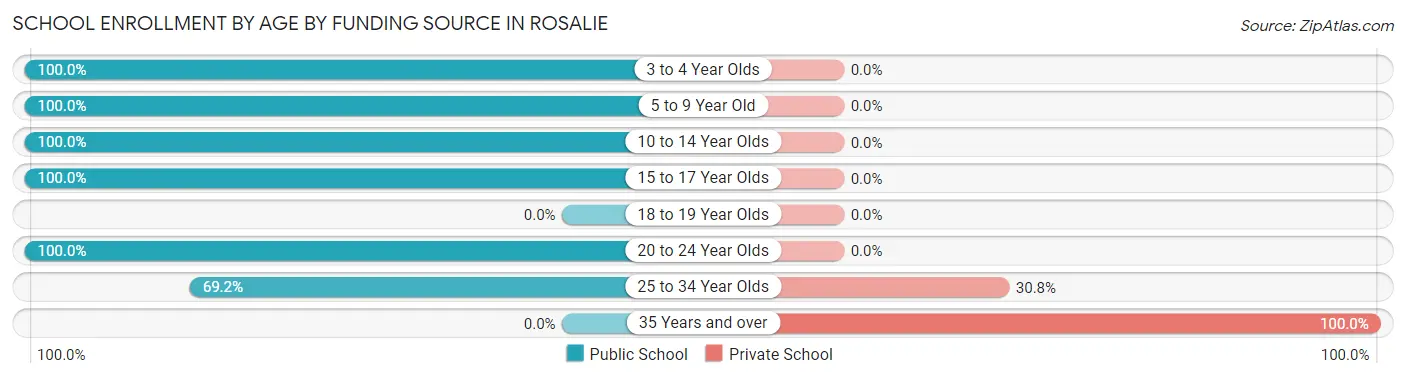
| Age Bracket | Public School | Private School |
| 3 to 4 Year Olds | 17 (100.0%) | 0 (0.0%) |
| 5 to 9 Year Old | 15 (100.0%) | 0 (0.0%) |
| 10 to 14 Year Olds | 35 (100.0%) | 0 (0.0%) |
| 15 to 17 Year Olds | 12 (100.0%) | 0 (0.0%) |
| 18 to 19 Year Olds | 0 (0.0%) | 0 (0.0%) |
| 20 to 24 Year Olds | 6 (100.0%) | 0 (0.0%) |
| 25 to 34 Year Olds | 9 (69.2%) | 4 (30.8%) |
| 35 Years and over | 0 (0.0%) | 4 (100.0%) |
| Total | 94 (92.2%) | 8 (7.8%) |
Educational Attainment by Field of Study in Rosalie
Science & technology (8 | 24.2%), social sciences (6 | 18.2%), business (6 | 18.2%), visual & performing arts (4 | 12.1%), and arts & humanities (4 | 12.1%) are the most common fields of study among 33 individuals in Rosalie who have obtained a bachelor's degree or higher.
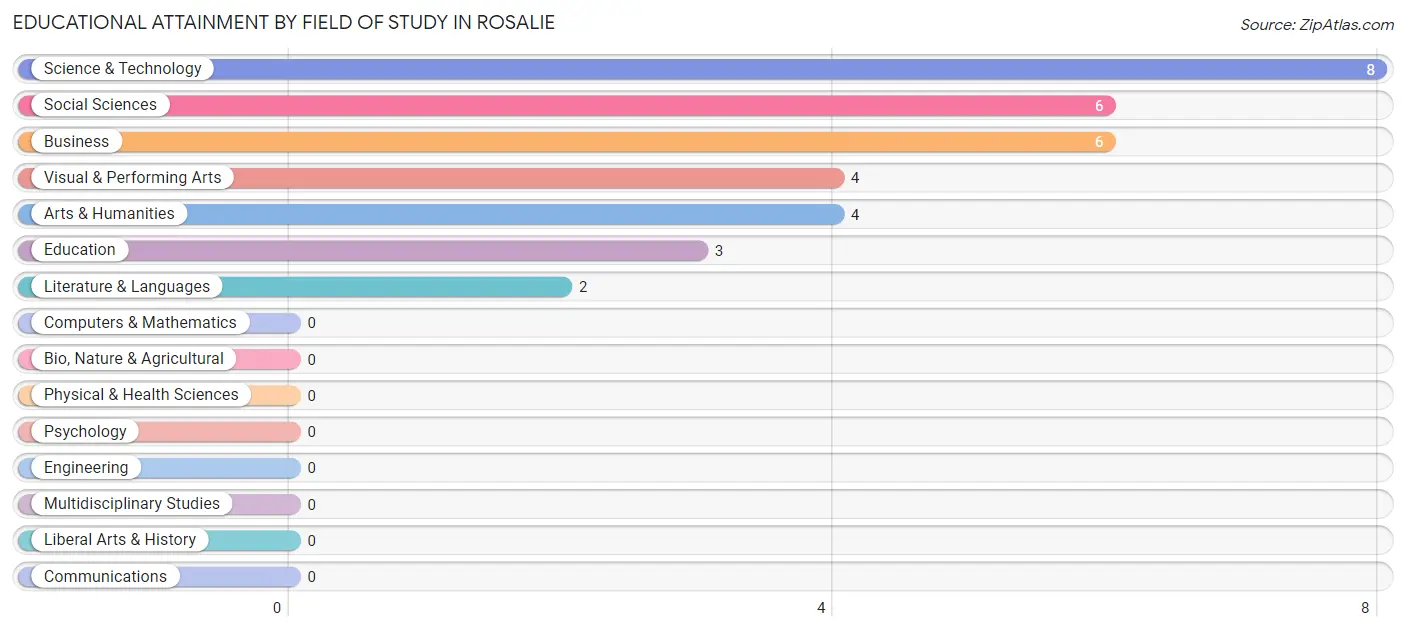
| Field of Study | # Graduates | % Graduates |
| Computers & Mathematics | 0 | 0.0% |
| Bio, Nature & Agricultural | 0 | 0.0% |
| Physical & Health Sciences | 0 | 0.0% |
| Psychology | 0 | 0.0% |
| Social Sciences | 6 | 18.2% |
| Engineering | 0 | 0.0% |
| Multidisciplinary Studies | 0 | 0.0% |
| Science & Technology | 8 | 24.2% |
| Business | 6 | 18.2% |
| Education | 3 | 9.1% |
| Literature & Languages | 2 | 6.1% |
| Liberal Arts & History | 0 | 0.0% |
| Visual & Performing Arts | 4 | 12.1% |
| Communications | 0 | 0.0% |
| Arts & Humanities | 4 | 12.1% |
| Total | 33 | 100.0% |
Transportation & Commute in Rosalie
Vehicle Availability by Sex in Rosalie
The most prevalent vehicle ownership categories in Rosalie are males with 3 vehicles (26, accounting for 48.1%) and females with 3 vehicles (19, making up 66.7%).
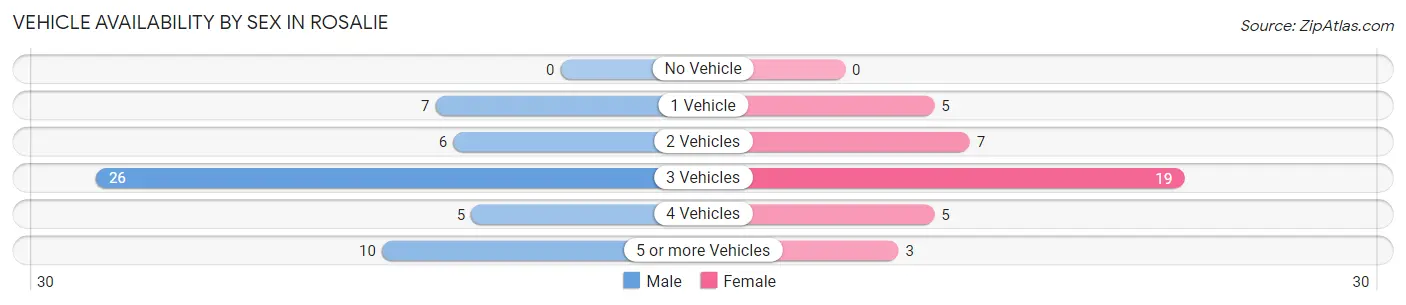
| Vehicles Available | Male | Female |
| No Vehicle | 0 (0.0%) | 0 (0.0%) |
| 1 Vehicle | 7 (13.0%) | 5 (12.8%) |
| 2 Vehicles | 6 (11.1%) | 7 (17.9%) |
| 3 Vehicles | 26 (48.1%) | 19 (48.7%) |
| 4 Vehicles | 5 (9.3%) | 5 (12.8%) |
| 5 or more Vehicles | 10 (18.5%) | 3 (7.7%) |
| Total | 54 (100.0%) | 39 (100.0%) |
Commute Time in Rosalie
The most frequently occuring commute durations in Rosalie are 20 to 24 minutes (38 commuters, 40.9%), 25 to 29 minutes (14 commuters, 15.0%), and 30 to 34 minutes (14 commuters, 15.0%).
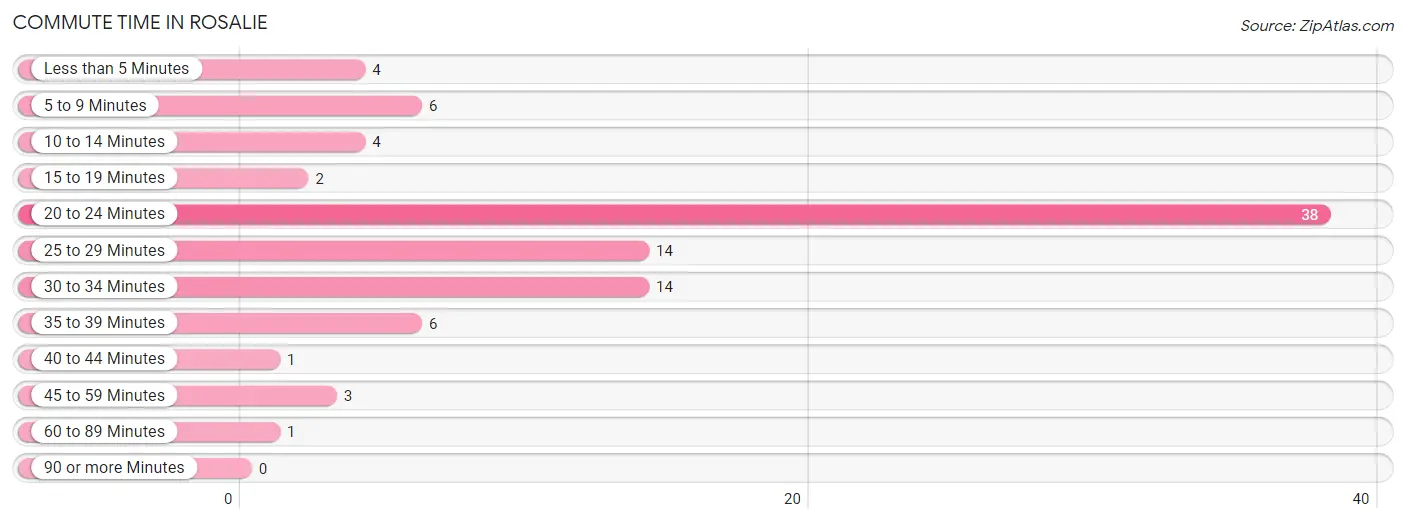
| Commute Time | # Commuters | % Commuters |
| Less than 5 Minutes | 4 | 4.3% |
| 5 to 9 Minutes | 6 | 6.5% |
| 10 to 14 Minutes | 4 | 4.3% |
| 15 to 19 Minutes | 2 | 2.1% |
| 20 to 24 Minutes | 38 | 40.9% |
| 25 to 29 Minutes | 14 | 15.0% |
| 30 to 34 Minutes | 14 | 15.0% |
| 35 to 39 Minutes | 6 | 6.5% |
| 40 to 44 Minutes | 1 | 1.1% |
| 45 to 59 Minutes | 3 | 3.2% |
| 60 to 89 Minutes | 1 | 1.1% |
| 90 or more Minutes | 0 | 0.0% |
Commute Time by Sex in Rosalie
The most common commute times in Rosalie are 20 to 24 minutes (24 commuters, 44.4%) for males and 20 to 24 minutes (14 commuters, 35.9%) for females.
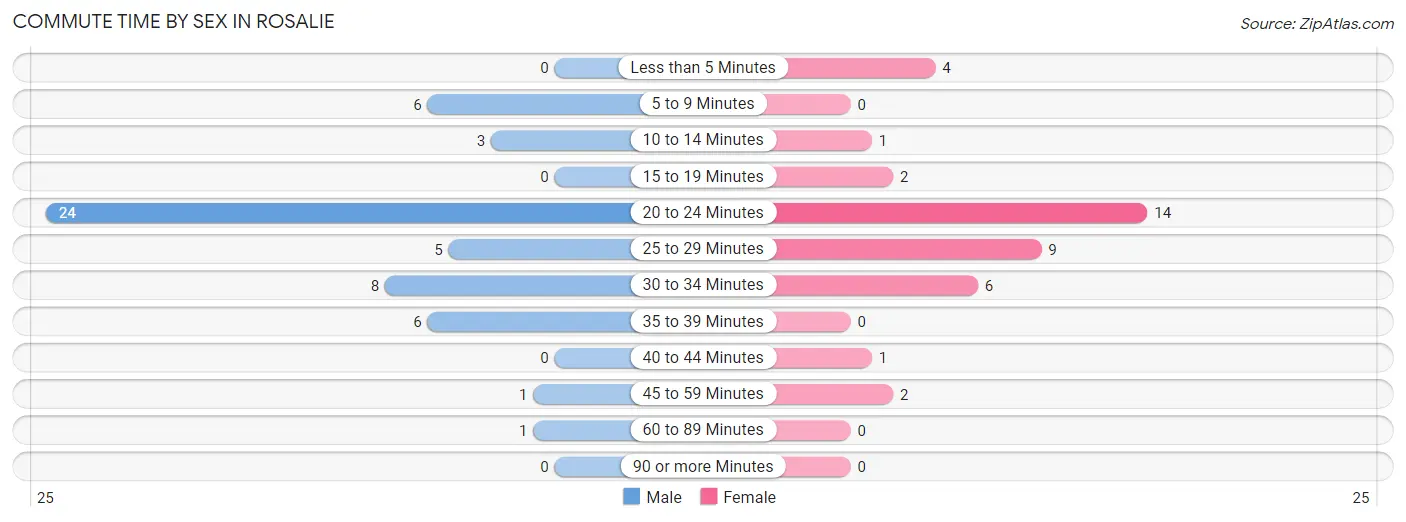
| Commute Time | Male | Female |
| Less than 5 Minutes | 0 (0.0%) | 4 (10.3%) |
| 5 to 9 Minutes | 6 (11.1%) | 0 (0.0%) |
| 10 to 14 Minutes | 3 (5.6%) | 1 (2.6%) |
| 15 to 19 Minutes | 0 (0.0%) | 2 (5.1%) |
| 20 to 24 Minutes | 24 (44.4%) | 14 (35.9%) |
| 25 to 29 Minutes | 5 (9.3%) | 9 (23.1%) |
| 30 to 34 Minutes | 8 (14.8%) | 6 (15.4%) |
| 35 to 39 Minutes | 6 (11.1%) | 0 (0.0%) |
| 40 to 44 Minutes | 0 (0.0%) | 1 (2.6%) |
| 45 to 59 Minutes | 1 (1.8%) | 2 (5.1%) |
| 60 to 89 Minutes | 1 (1.8%) | 0 (0.0%) |
| 90 or more Minutes | 0 (0.0%) | 0 (0.0%) |
Time of Departure to Work by Sex in Rosalie
The most frequent times of departure to work in Rosalie are 6:30 AM to 6:59 AM (18, 33.3%) for males and 7:30 AM to 7:59 AM (13, 33.3%) for females.
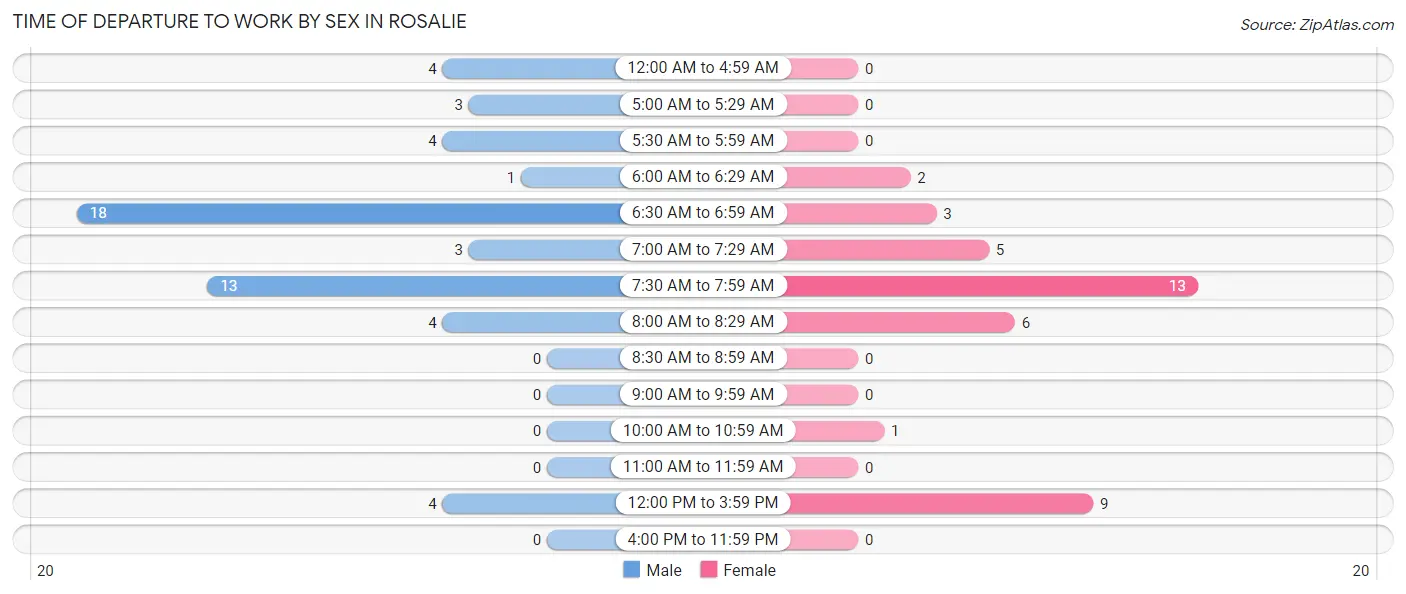
| Time of Departure | Male | Female |
| 12:00 AM to 4:59 AM | 4 (7.4%) | 0 (0.0%) |
| 5:00 AM to 5:29 AM | 3 (5.6%) | 0 (0.0%) |
| 5:30 AM to 5:59 AM | 4 (7.4%) | 0 (0.0%) |
| 6:00 AM to 6:29 AM | 1 (1.8%) | 2 (5.1%) |
| 6:30 AM to 6:59 AM | 18 (33.3%) | 3 (7.7%) |
| 7:00 AM to 7:29 AM | 3 (5.6%) | 5 (12.8%) |
| 7:30 AM to 7:59 AM | 13 (24.1%) | 13 (33.3%) |
| 8:00 AM to 8:29 AM | 4 (7.4%) | 6 (15.4%) |
| 8:30 AM to 8:59 AM | 0 (0.0%) | 0 (0.0%) |
| 9:00 AM to 9:59 AM | 0 (0.0%) | 0 (0.0%) |
| 10:00 AM to 10:59 AM | 0 (0.0%) | 1 (2.6%) |
| 11:00 AM to 11:59 AM | 0 (0.0%) | 0 (0.0%) |
| 12:00 PM to 3:59 PM | 4 (7.4%) | 9 (23.1%) |
| 4:00 PM to 11:59 PM | 0 (0.0%) | 0 (0.0%) |
| Total | 54 (100.0%) | 39 (100.0%) |
Housing Occupancy in Rosalie
Occupancy by Ownership in Rosalie
Of the total 60 dwellings in Rosalie, owner-occupied units account for 40 (66.7%), while renter-occupied units make up 20 (33.3%).
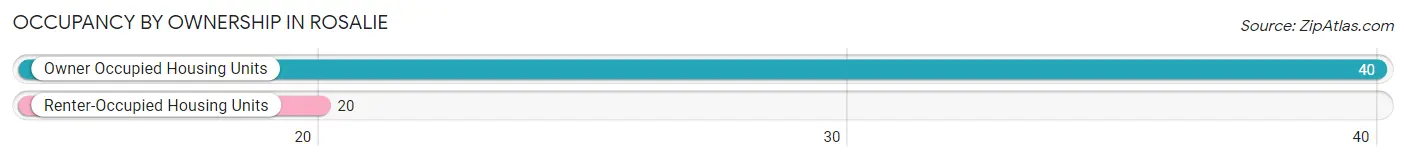
| Occupancy | # Housing Units | % Housing Units |
| Owner Occupied Housing Units | 40 | 66.7% |
| Renter-Occupied Housing Units | 20 | 33.3% |
| Total Occupied Housing Units | 60 | 100.0% |
Occupancy by Household Size in Rosalie
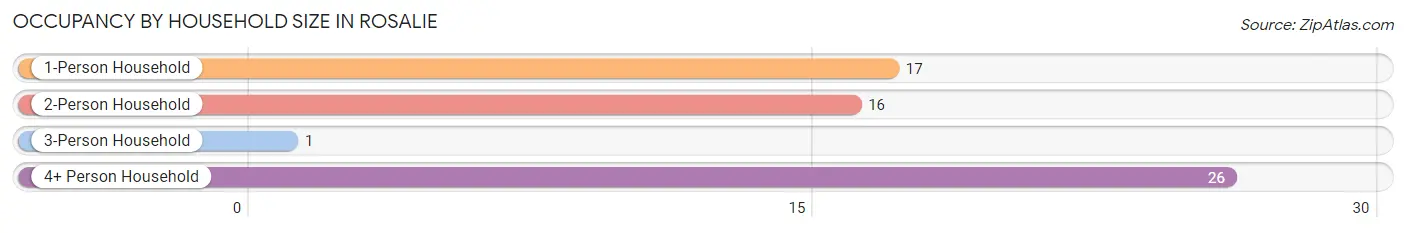
| Household Size | # Housing Units | % Housing Units |
| 1-Person Household | 17 | 28.3% |
| 2-Person Household | 16 | 26.7% |
| 3-Person Household | 1 | 1.7% |
| 4+ Person Household | 26 | 43.3% |
| Total Housing Units | 60 | 100.0% |
Occupancy by Ownership by Household Size in Rosalie
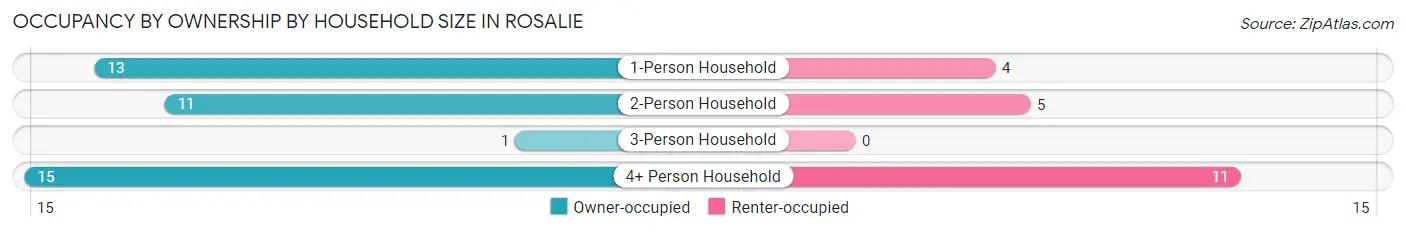
| Household Size | Owner-occupied | Renter-occupied |
| 1-Person Household | 13 (76.5%) | 4 (23.5%) |
| 2-Person Household | 11 (68.8%) | 5 (31.2%) |
| 3-Person Household | 1 (100.0%) | 0 (0.0%) |
| 4+ Person Household | 15 (57.7%) | 11 (42.3%) |
| Total Housing Units | 40 (66.7%) | 20 (33.3%) |
Occupancy by Educational Attainment in Rosalie
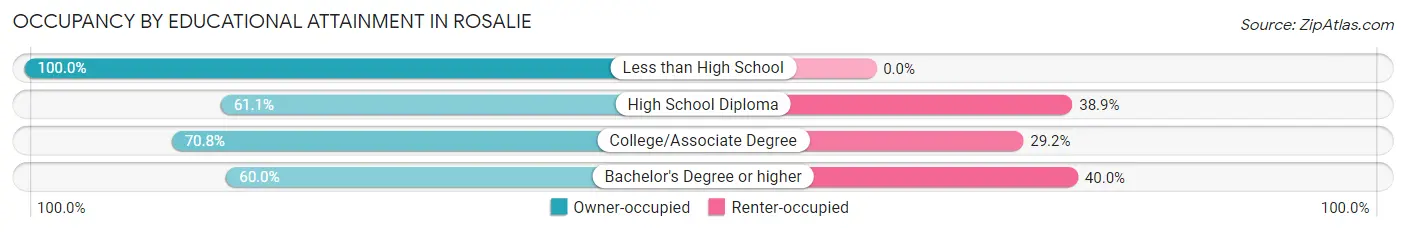
| Household Size | Owner-occupied | Renter-occupied |
| Less than High School | 3 (100.0%) | 0 (0.0%) |
| High School Diploma | 11 (61.1%) | 7 (38.9%) |
| College/Associate Degree | 17 (70.8%) | 7 (29.2%) |
| Bachelor's Degree or higher | 9 (60.0%) | 6 (40.0%) |
Occupancy by Age of Householder in Rosalie
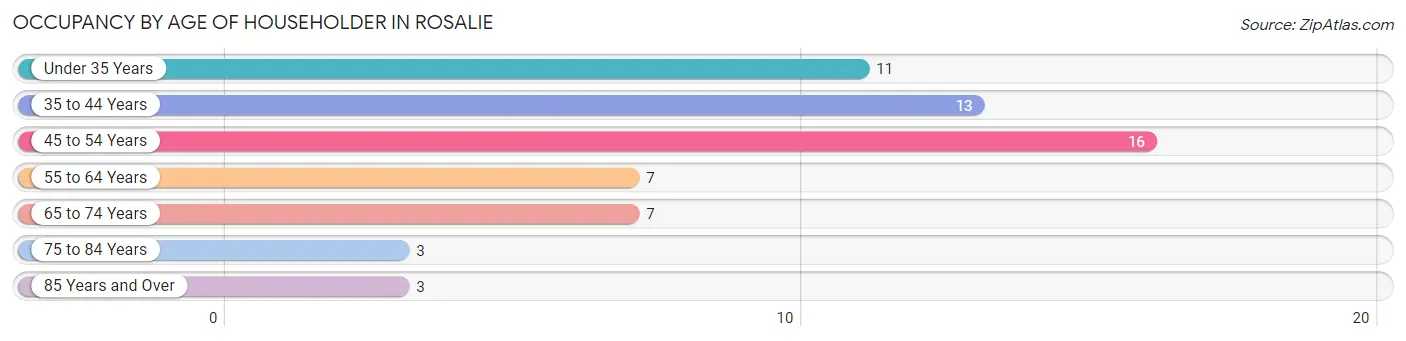
| Age Bracket | # Households | % Households |
| Under 35 Years | 11 | 18.3% |
| 35 to 44 Years | 13 | 21.7% |
| 45 to 54 Years | 16 | 26.7% |
| 55 to 64 Years | 7 | 11.7% |
| 65 to 74 Years | 7 | 11.7% |
| 75 to 84 Years | 3 | 5.0% |
| 85 Years and Over | 3 | 5.0% |
| Total | 60 | 100.0% |
Housing Finances in Rosalie
Median Income by Occupancy in Rosalie
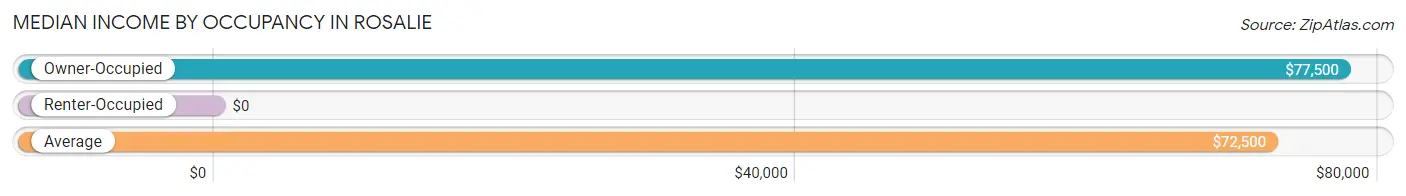
| Occupancy Type | # Households | Median Income |
| Owner-Occupied | 40 (66.7%) | $77,500 |
| Renter-Occupied | 20 (33.3%) | $0 |
| Average | 60 (100.0%) | $72,500 |
Occupancy by Householder Income Bracket in Rosalie
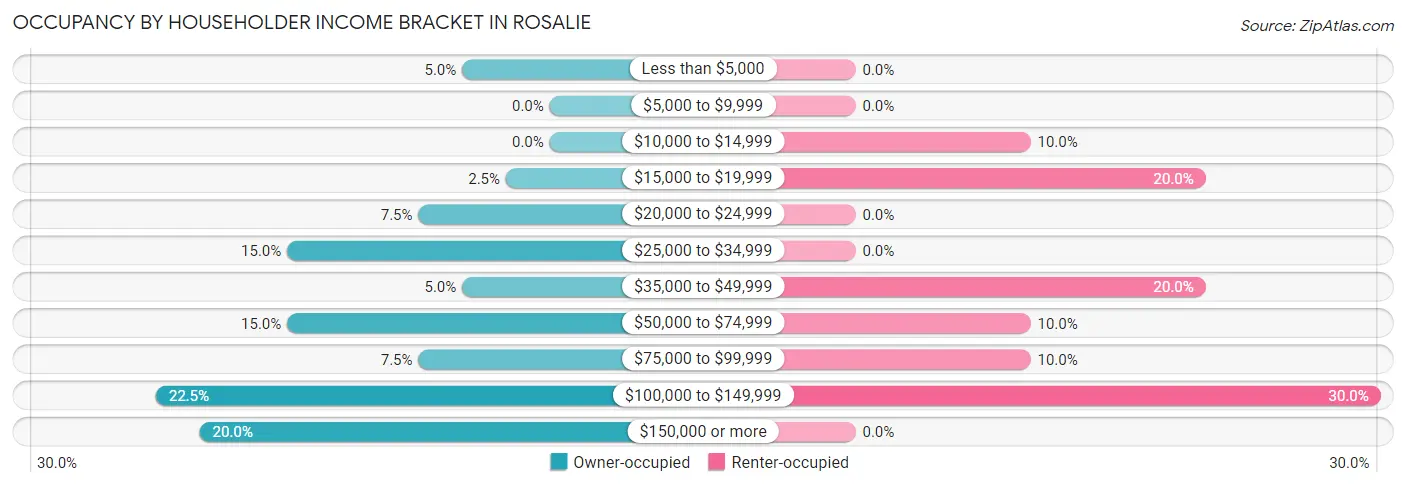
| Income Bracket | Owner-occupied | Renter-occupied |
| Less than $5,000 | 2 (5.0%) | 0 (0.0%) |
| $5,000 to $9,999 | 0 (0.0%) | 0 (0.0%) |
| $10,000 to $14,999 | 0 (0.0%) | 2 (10.0%) |
| $15,000 to $19,999 | 1 (2.5%) | 4 (20.0%) |
| $20,000 to $24,999 | 3 (7.5%) | 0 (0.0%) |
| $25,000 to $34,999 | 6 (15.0%) | 0 (0.0%) |
| $35,000 to $49,999 | 2 (5.0%) | 4 (20.0%) |
| $50,000 to $74,999 | 6 (15.0%) | 2 (10.0%) |
| $75,000 to $99,999 | 3 (7.5%) | 2 (10.0%) |
| $100,000 to $149,999 | 9 (22.5%) | 6 (30.0%) |
| $150,000 or more | 8 (20.0%) | 0 (0.0%) |
| Total | 40 (100.0%) | 20 (100.0%) |
Monthly Housing Cost Tiers in Rosalie
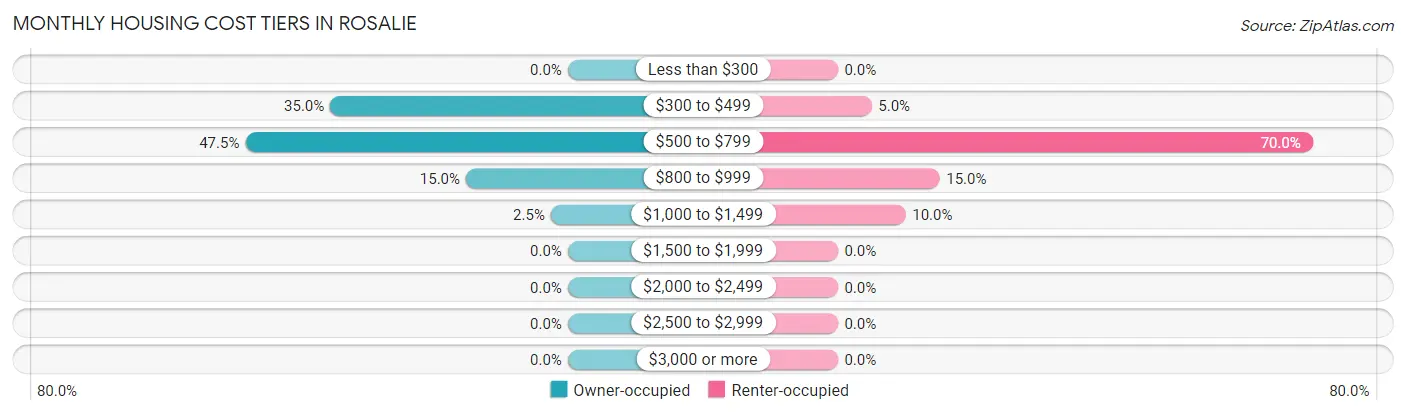
| Monthly Cost | Owner-occupied | Renter-occupied |
| Less than $300 | 0 (0.0%) | 0 (0.0%) |
| $300 to $499 | 14 (35.0%) | 1 (5.0%) |
| $500 to $799 | 19 (47.5%) | 14 (70.0%) |
| $800 to $999 | 6 (15.0%) | 3 (15.0%) |
| $1,000 to $1,499 | 1 (2.5%) | 2 (10.0%) |
| $1,500 to $1,999 | 0 (0.0%) | 0 (0.0%) |
| $2,000 to $2,499 | 0 (0.0%) | 0 (0.0%) |
| $2,500 to $2,999 | 0 (0.0%) | 0 (0.0%) |
| $3,000 or more | 0 (0.0%) | 0 (0.0%) |
| Total | 40 (100.0%) | 20 (100.0%) |
Physical Housing Characteristics in Rosalie
Housing Structures in Rosalie
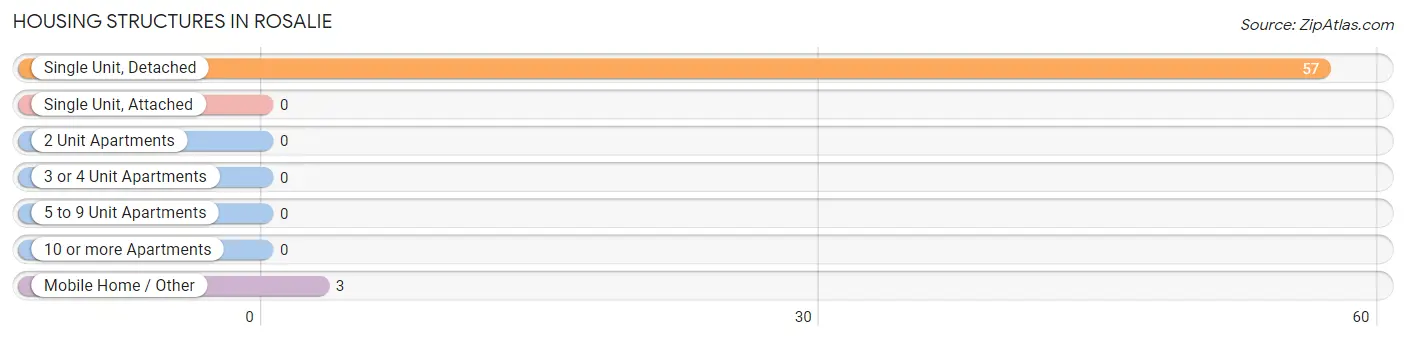
| Structure Type | # Housing Units | % Housing Units |
| Single Unit, Detached | 57 | 95.0% |
| Single Unit, Attached | 0 | 0.0% |
| 2 Unit Apartments | 0 | 0.0% |
| 3 or 4 Unit Apartments | 0 | 0.0% |
| 5 to 9 Unit Apartments | 0 | 0.0% |
| 10 or more Apartments | 0 | 0.0% |
| Mobile Home / Other | 3 | 5.0% |
| Total | 60 | 100.0% |
Housing Structures by Occupancy in Rosalie
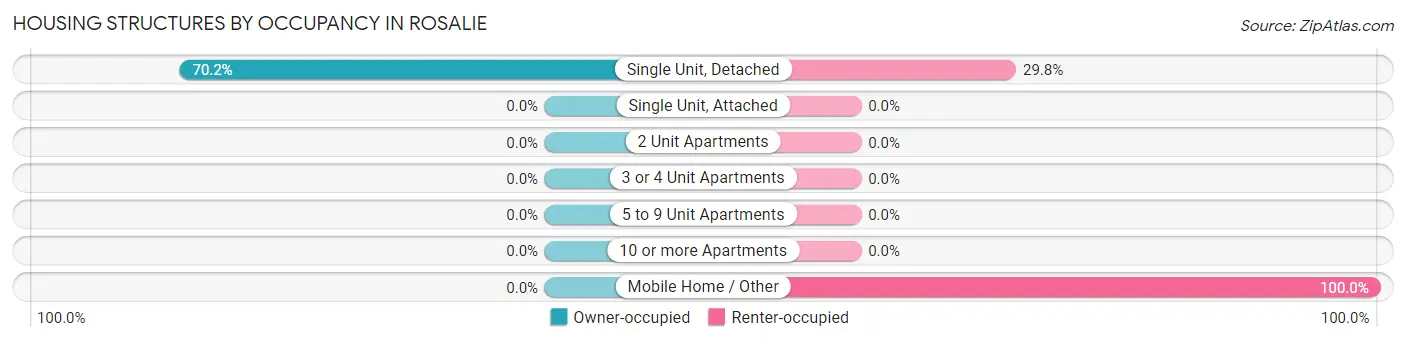
| Structure Type | Owner-occupied | Renter-occupied |
| Single Unit, Detached | 40 (70.2%) | 17 (29.8%) |
| Single Unit, Attached | 0 (0.0%) | 0 (0.0%) |
| 2 Unit Apartments | 0 (0.0%) | 0 (0.0%) |
| 3 or 4 Unit Apartments | 0 (0.0%) | 0 (0.0%) |
| 5 to 9 Unit Apartments | 0 (0.0%) | 0 (0.0%) |
| 10 or more Apartments | 0 (0.0%) | 0 (0.0%) |
| Mobile Home / Other | 0 (0.0%) | 3 (100.0%) |
| Total | 40 (66.7%) | 20 (33.3%) |
Housing Structures by Number of Rooms in Rosalie
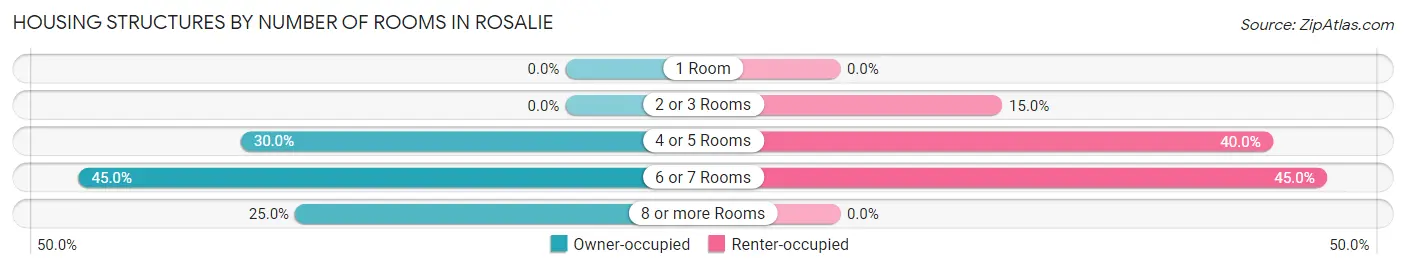
| Number of Rooms | Owner-occupied | Renter-occupied |
| 1 Room | 0 (0.0%) | 0 (0.0%) |
| 2 or 3 Rooms | 0 (0.0%) | 3 (15.0%) |
| 4 or 5 Rooms | 12 (30.0%) | 8 (40.0%) |
| 6 or 7 Rooms | 18 (45.0%) | 9 (45.0%) |
| 8 or more Rooms | 10 (25.0%) | 0 (0.0%) |
| Total | 40 (100.0%) | 20 (100.0%) |
Housing Structure by Heating Type in Rosalie
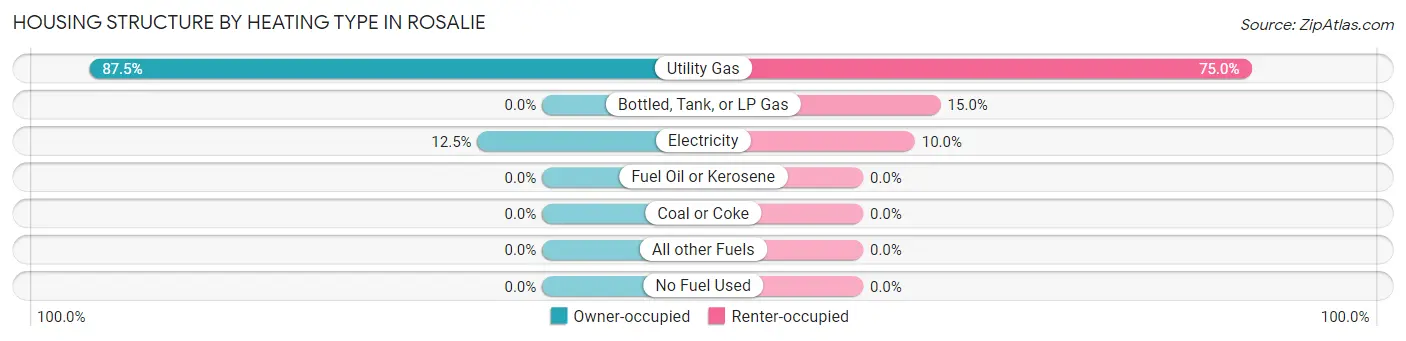
| Heating Type | Owner-occupied | Renter-occupied |
| Utility Gas | 35 (87.5%) | 15 (75.0%) |
| Bottled, Tank, or LP Gas | 0 (0.0%) | 3 (15.0%) |
| Electricity | 5 (12.5%) | 2 (10.0%) |
| Fuel Oil or Kerosene | 0 (0.0%) | 0 (0.0%) |
| Coal or Coke | 0 (0.0%) | 0 (0.0%) |
| All other Fuels | 0 (0.0%) | 0 (0.0%) |
| No Fuel Used | 0 (0.0%) | 0 (0.0%) |
| Total | 40 (100.0%) | 20 (100.0%) |
Household Vehicle Usage in Rosalie
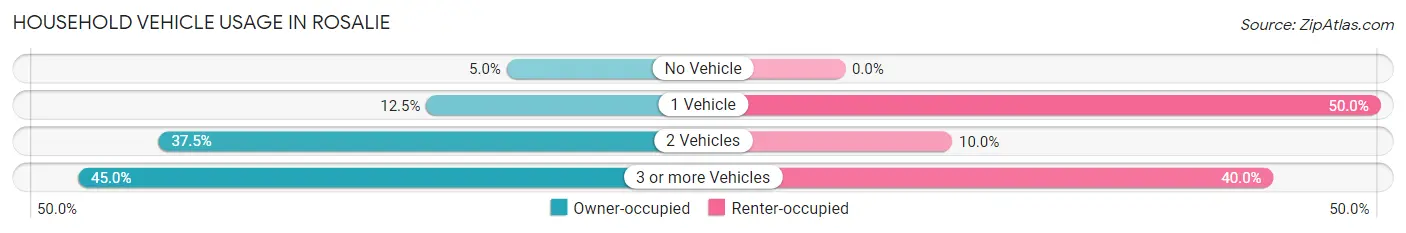
| Vehicles per Household | Owner-occupied | Renter-occupied |
| No Vehicle | 2 (5.0%) | 0 (0.0%) |
| 1 Vehicle | 5 (12.5%) | 10 (50.0%) |
| 2 Vehicles | 15 (37.5%) | 2 (10.0%) |
| 3 or more Vehicles | 18 (45.0%) | 8 (40.0%) |
| Total | 40 (100.0%) | 20 (100.0%) |
Real Estate & Mortgages in Rosalie
Real Estate and Mortgage Overview in Rosalie
| Characteristic | Without Mortgage | With Mortgage |
| Housing Units | 25 | 15 |
| Median Property Value | $47,500 | $51,700 |
| Median Household Income | - | - |
| Monthly Housing Costs | $450 | $0 |
| Real Estate Taxes | $1,000 | $0 |
Property Value by Mortgage Status in Rosalie
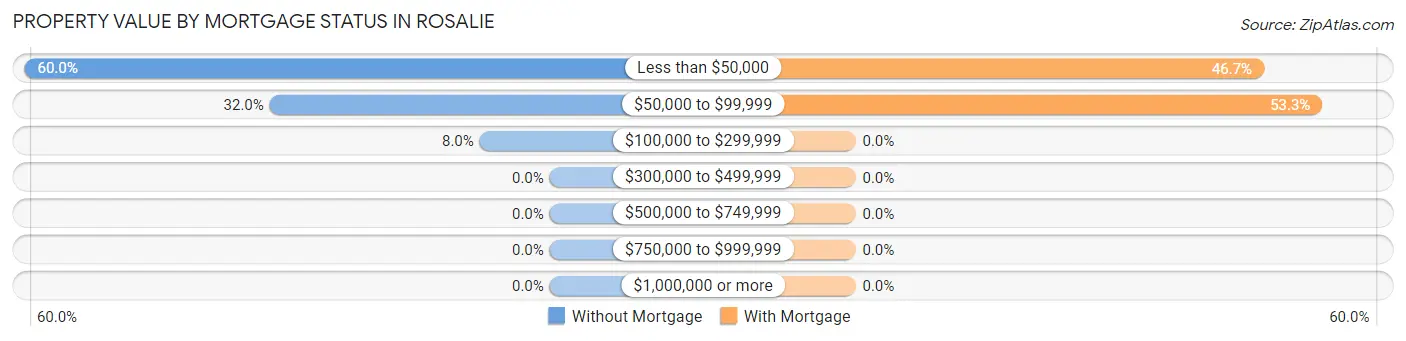
| Property Value | Without Mortgage | With Mortgage |
| Less than $50,000 | 15 (60.0%) | 7 (46.7%) |
| $50,000 to $99,999 | 8 (32.0%) | 8 (53.3%) |
| $100,000 to $299,999 | 2 (8.0%) | 0 (0.0%) |
| $300,000 to $499,999 | 0 (0.0%) | 0 (0.0%) |
| $500,000 to $749,999 | 0 (0.0%) | 0 (0.0%) |
| $750,000 to $999,999 | 0 (0.0%) | 0 (0.0%) |
| $1,000,000 or more | 0 (0.0%) | 0 (0.0%) |
| Total | 25 (100.0%) | 15 (100.0%) |
Household Income by Mortgage Status in Rosalie
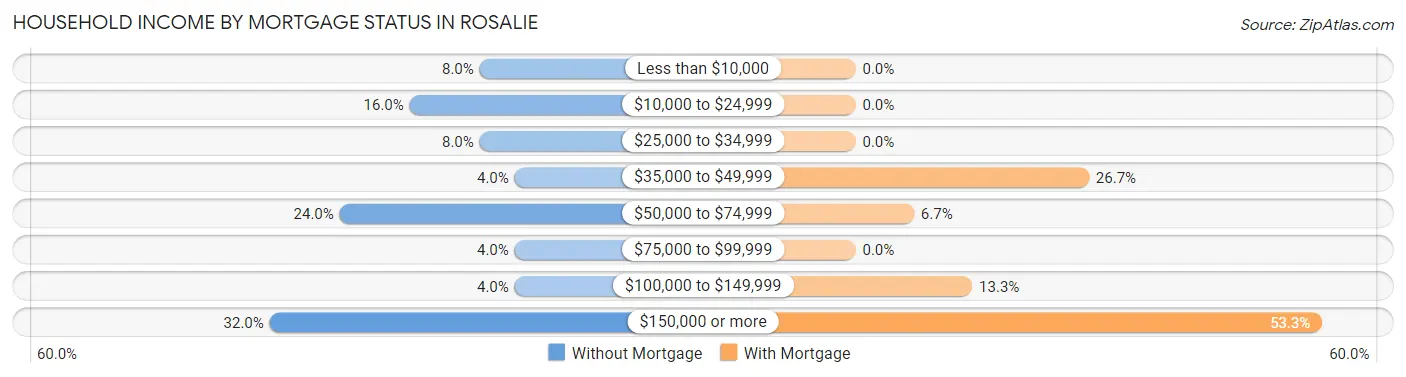
| Household Income | Without Mortgage | With Mortgage |
| Less than $10,000 | 2 (8.0%) | 0 (0.0%) |
| $10,000 to $24,999 | 4 (16.0%) | 0 (0.0%) |
| $25,000 to $34,999 | 2 (8.0%) | 0 (0.0%) |
| $35,000 to $49,999 | 1 (4.0%) | 4 (26.7%) |
| $50,000 to $74,999 | 6 (24.0%) | 1 (6.7%) |
| $75,000 to $99,999 | 1 (4.0%) | 0 (0.0%) |
| $100,000 to $149,999 | 1 (4.0%) | 2 (13.3%) |
| $150,000 or more | 8 (32.0%) | 8 (53.3%) |
| Total | 25 (100.0%) | 15 (100.0%) |
Property Value to Household Income Ratio in Rosalie
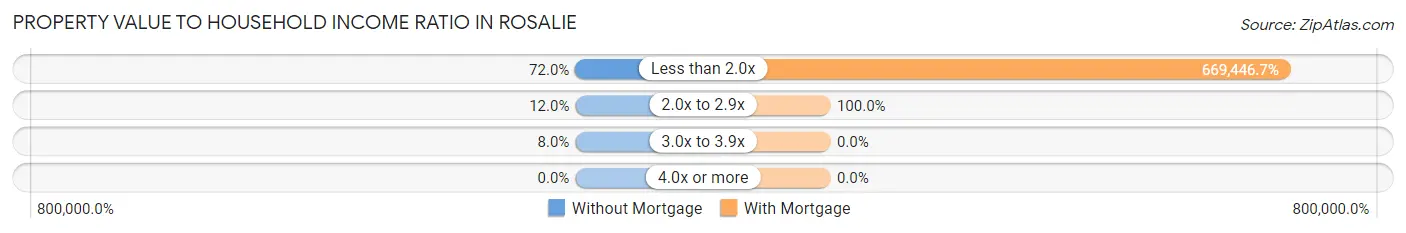
| Value-to-Income Ratio | Without Mortgage | With Mortgage |
| Less than 2.0x | 18 (72.0%) | 100,417 (669,446.7%) |
| 2.0x to 2.9x | 3 (12.0%) | 15 (100.0%) |
| 3.0x to 3.9x | 2 (8.0%) | 0 (0.0%) |
| 4.0x or more | 0 (0.0%) | 0 (0.0%) |
| Total | 25 (100.0%) | 15 (100.0%) |
Real Estate Taxes by Mortgage Status in Rosalie
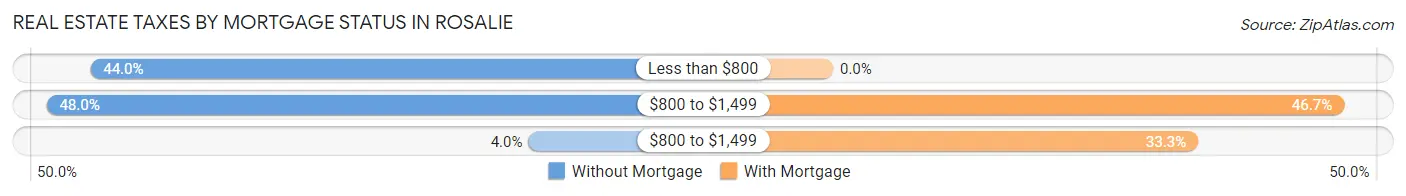
| Property Taxes | Without Mortgage | With Mortgage |
| Less than $800 | 11 (44.0%) | 0 (0.0%) |
| $800 to $1,499 | 12 (48.0%) | 7 (46.7%) |
| $800 to $1,499 | 1 (4.0%) | 5 (33.3%) |
| Total | 25 (100.0%) | 15 (100.0%) |
Health & Disability in Rosalie
Health Insurance Coverage by Age in Rosalie
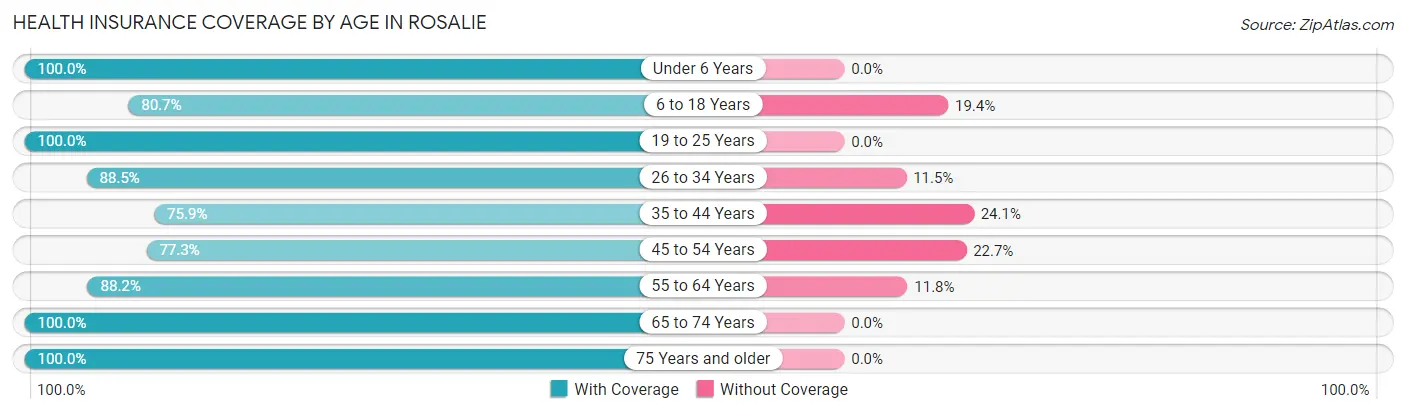
| Age Bracket | With Coverage | Without Coverage |
| Under 6 Years | 30 (100.0%) | 0 (0.0%) |
| 6 to 18 Years | 50 (80.6%) | 12 (19.4%) |
| 19 to 25 Years | 29 (100.0%) | 0 (0.0%) |
| 26 to 34 Years | 23 (88.5%) | 3 (11.5%) |
| 35 to 44 Years | 22 (75.9%) | 7 (24.1%) |
| 45 to 54 Years | 17 (77.3%) | 5 (22.7%) |
| 55 to 64 Years | 15 (88.2%) | 2 (11.8%) |
| 65 to 74 Years | 11 (100.0%) | 0 (0.0%) |
| 75 Years and older | 7 (100.0%) | 0 (0.0%) |
| Total | 204 (87.5%) | 29 (12.4%) |
Health Insurance Coverage by Citizenship Status in Rosalie
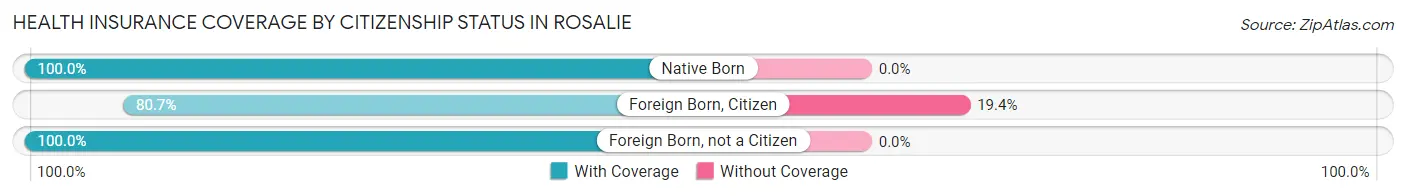
| Citizenship Status | With Coverage | Without Coverage |
| Native Born | 30 (100.0%) | 0 (0.0%) |
| Foreign Born, Citizen | 50 (80.6%) | 12 (19.4%) |
| Foreign Born, not a Citizen | 29 (100.0%) | 0 (0.0%) |
Health Insurance Coverage by Household Income in Rosalie
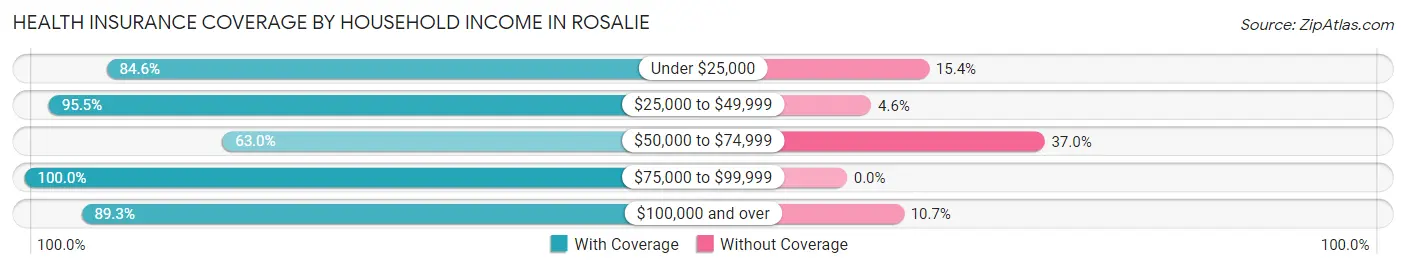
| Household Income | With Coverage | Without Coverage |
| Under $25,000 | 22 (84.6%) | 4 (15.4%) |
| $25,000 to $49,999 | 42 (95.5%) | 2 (4.5%) |
| $50,000 to $74,999 | 17 (63.0%) | 10 (37.0%) |
| $75,000 to $99,999 | 14 (100.0%) | 0 (0.0%) |
| $100,000 and over | 109 (89.3%) | 13 (10.7%) |
Public vs Private Health Insurance Coverage by Age in Rosalie
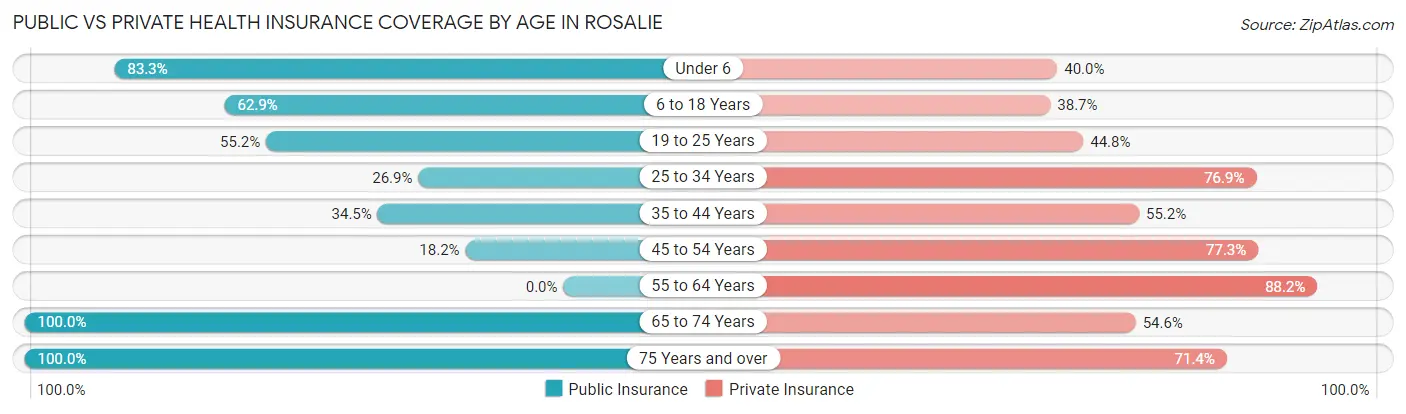
| Age Bracket | Public Insurance | Private Insurance |
| Under 6 | 25 (83.3%) | 12 (40.0%) |
| 6 to 18 Years | 39 (62.9%) | 24 (38.7%) |
| 19 to 25 Years | 16 (55.2%) | 13 (44.8%) |
| 25 to 34 Years | 7 (26.9%) | 20 (76.9%) |
| 35 to 44 Years | 10 (34.5%) | 16 (55.2%) |
| 45 to 54 Years | 4 (18.2%) | 17 (77.3%) |
| 55 to 64 Years | 0 (0.0%) | 15 (88.2%) |
| 65 to 74 Years | 11 (100.0%) | 6 (54.5%) |
| 75 Years and over | 7 (100.0%) | 5 (71.4%) |
| Total | 119 (51.1%) | 128 (54.9%) |
Disability Status by Sex by Age in Rosalie
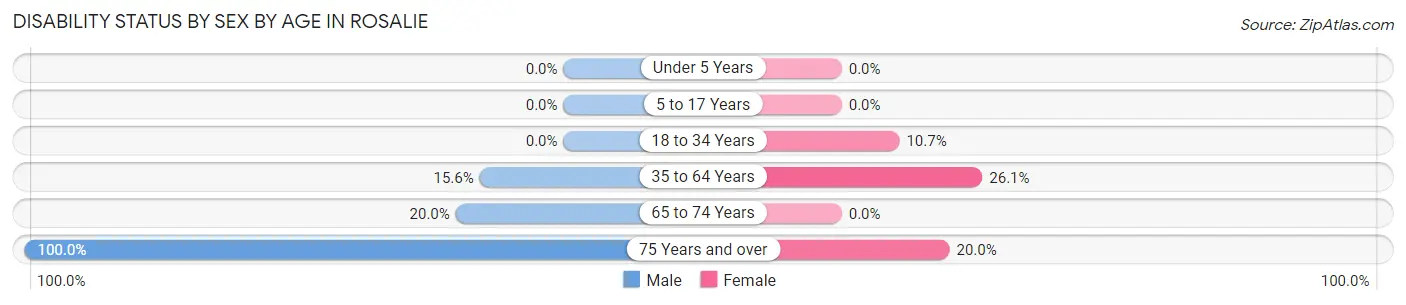
| Age Bracket | Male | Female |
| Under 5 Years | 0 (0.0%) | 0 (0.0%) |
| 5 to 17 Years | 0 (0.0%) | 0 (0.0%) |
| 18 to 34 Years | 0 (0.0%) | 3 (10.7%) |
| 35 to 64 Years | 7 (15.6%) | 6 (26.1%) |
| 65 to 74 Years | 1 (20.0%) | 0 (0.0%) |
| 75 Years and over | 2 (100.0%) | 1 (20.0%) |
Disability Class by Sex by Age in Rosalie
Disability Class: Hearing Difficulty
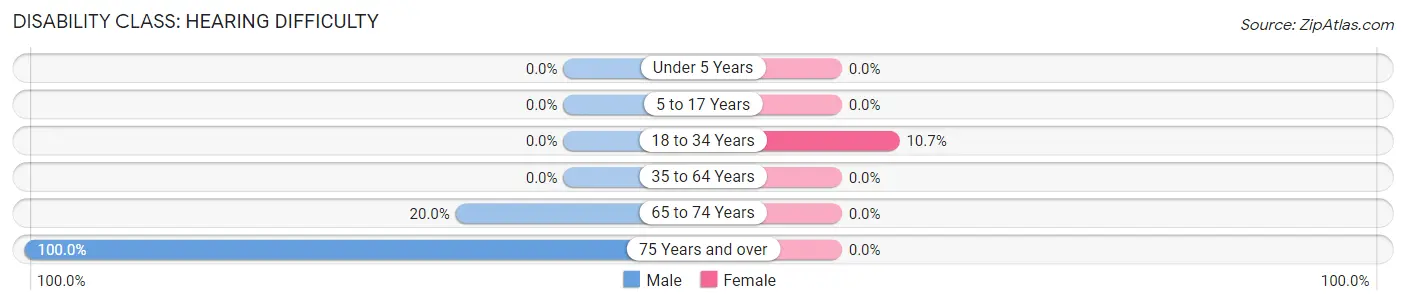
| Age Bracket | Male | Female |
| Under 5 Years | 0 (0.0%) | 0 (0.0%) |
| 5 to 17 Years | 0 (0.0%) | 0 (0.0%) |
| 18 to 34 Years | 0 (0.0%) | 3 (10.7%) |
| 35 to 64 Years | 0 (0.0%) | 0 (0.0%) |
| 65 to 74 Years | 1 (20.0%) | 0 (0.0%) |
| 75 Years and over | 2 (100.0%) | 0 (0.0%) |
Disability Class: Vision Difficulty
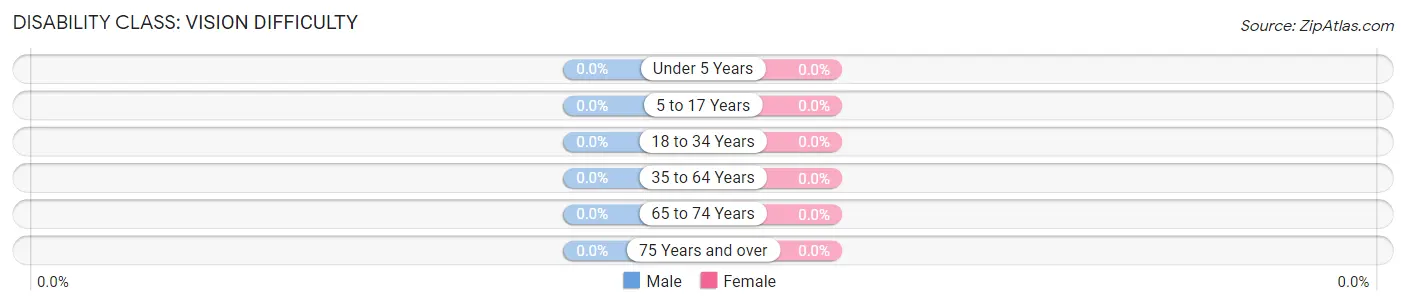
| Age Bracket | Male | Female |
| Under 5 Years | 0 (0.0%) | 0 (0.0%) |
| 5 to 17 Years | 0 (0.0%) | 0 (0.0%) |
| 18 to 34 Years | 0 (0.0%) | 0 (0.0%) |
| 35 to 64 Years | 0 (0.0%) | 0 (0.0%) |
| 65 to 74 Years | 0 (0.0%) | 0 (0.0%) |
| 75 Years and over | 0 (0.0%) | 0 (0.0%) |
Disability Class: Cognitive Difficulty
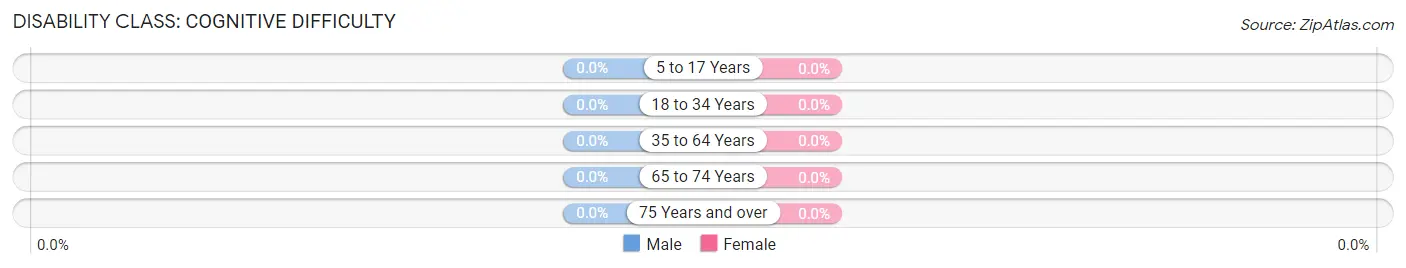
| Age Bracket | Male | Female |
| 5 to 17 Years | 0 (0.0%) | 0 (0.0%) |
| 18 to 34 Years | 0 (0.0%) | 0 (0.0%) |
| 35 to 64 Years | 0 (0.0%) | 0 (0.0%) |
| 65 to 74 Years | 0 (0.0%) | 0 (0.0%) |
| 75 Years and over | 0 (0.0%) | 0 (0.0%) |
Disability Class: Ambulatory Difficulty
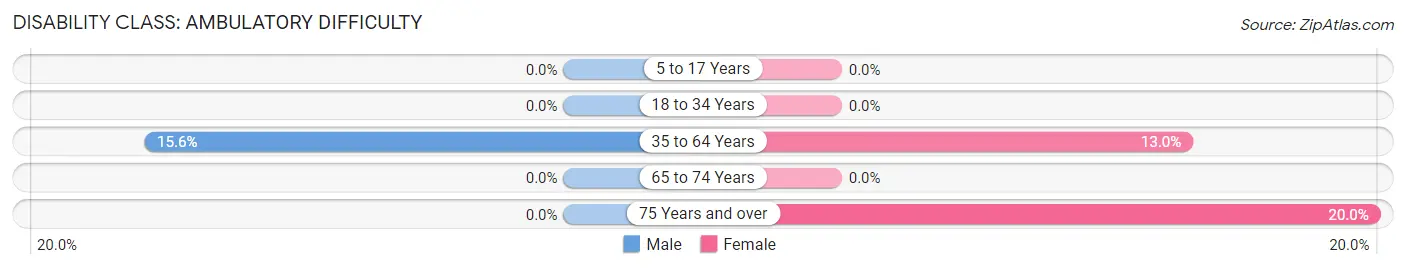
| Age Bracket | Male | Female |
| 5 to 17 Years | 0 (0.0%) | 0 (0.0%) |
| 18 to 34 Years | 0 (0.0%) | 0 (0.0%) |
| 35 to 64 Years | 7 (15.6%) | 3 (13.0%) |
| 65 to 74 Years | 0 (0.0%) | 0 (0.0%) |
| 75 Years and over | 0 (0.0%) | 1 (20.0%) |
Disability Class: Self-Care Difficulty
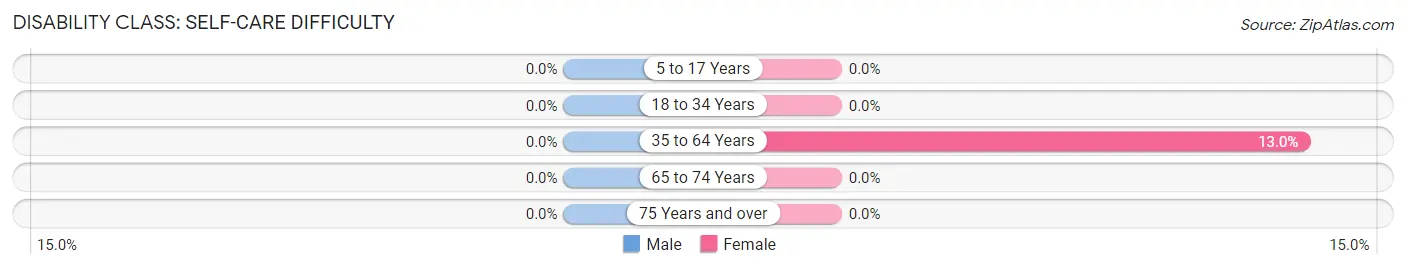
| Age Bracket | Male | Female |
| 5 to 17 Years | 0 (0.0%) | 0 (0.0%) |
| 18 to 34 Years | 0 (0.0%) | 0 (0.0%) |
| 35 to 64 Years | 0 (0.0%) | 3 (13.0%) |
| 65 to 74 Years | 0 (0.0%) | 0 (0.0%) |
| 75 Years and over | 0 (0.0%) | 0 (0.0%) |
Technology Access in Rosalie
Computing Device Access in Rosalie
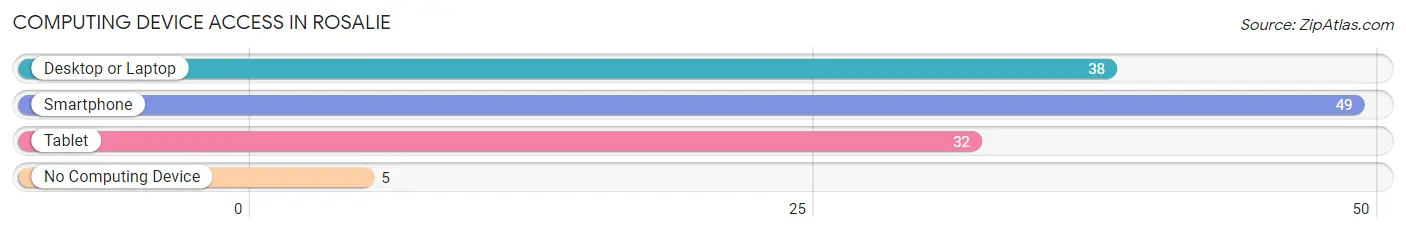
| Device Type | # Households | % Households |
| Desktop or Laptop | 38 | 63.3% |
| Smartphone | 49 | 81.7% |
| Tablet | 32 | 53.3% |
| No Computing Device | 5 | 8.3% |
| Total | 60 | 100.0% |
Internet Access in Rosalie
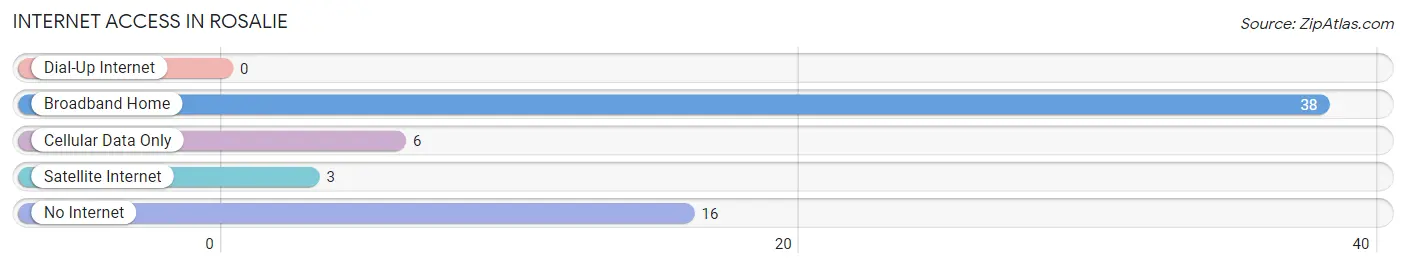
| Internet Type | # Households | % Households |
| Dial-Up Internet | 0 | 0.0% |
| Broadband Home | 38 | 63.3% |
| Cellular Data Only | 6 | 10.0% |
| Satellite Internet | 3 | 5.0% |
| No Internet | 16 | 26.7% |
| Total | 60 | 100.0% |
Rosalie Summary
Rosalie, Nebraska is a small village located in the northeastern corner of the state. It is situated in the rolling hills of the Missouri River Valley, and is surrounded by the towns of Tekamah, Lyons, and Decatur. The village has a population of just over 500 people, and is part of Burt County.
History
Rosalie was founded in 1871 by a group of settlers from Germany. The town was named after the daughter of one of the settlers, and was originally known as “Rosalie’s Town”. The settlers were attracted to the area due to its fertile soil and abundant natural resources.
The town quickly grew and by the early 1900s, Rosalie had become a thriving agricultural community. The town was home to several businesses, including a general store, a blacksmith, a hotel, and a post office.
In the 1920s, the town began to decline as many of the residents moved away in search of better economic opportunities. The Great Depression further exacerbated the decline, and by the 1940s, the population had dropped to just over 200 people.
Geography
Rosalie is located in the northeastern corner of Nebraska, in Burt County. It is situated in the rolling hills of the Missouri River Valley, and is surrounded by the towns of Tekamah, Lyons, and Decatur. The village is located at an elevation of 1,400 feet above sea level.
The climate in Rosalie is generally mild, with hot summers and cold winters. The average annual temperature is around 50 degrees Fahrenheit, and the average annual precipitation is around 30 inches.
Economy
The economy of Rosalie is largely based on agriculture. The town is home to several farms, which produce a variety of crops, including corn, soybeans, and wheat. The town also has a small manufacturing sector, which produces a variety of products, including furniture and clothing.
In addition to agriculture and manufacturing, Rosalie also has a small tourism industry. The town is home to several historic sites, including the Rosalie Museum and the Rosalie Cemetery. The town also hosts several annual events, such as the Rosalie Days Festival and the Rosalie Rodeo.
Demographics
As of the 2010 census, the population of Rosalie was 514 people. The racial makeup of the town was 97.3% White, 0.6% African American, 0.2% Native American, 0.2% Asian, 0.4% from other races, and 1.3% from two or more races.
The median household income in Rosalie was $41,250, and the median family income was $45,625. The per capita income was $19,845. About 8.3% of families and 10.2% of the population were below the poverty line.
Rosalie is a small, rural community with a rich history and a strong agricultural economy. The town is home to a diverse population, and offers a variety of activities and attractions for visitors and residents alike.
Common Questions
What is Per Capita Income in Rosalie?
Per Capita income in Rosalie is $24,282.
What is the Median Family Income in Rosalie?
Median Family Income in Rosalie is $101,667.
What is the Median Household income in Rosalie?
Median Household Income in Rosalie is $72,500.
What is Income or Wage Gap in Rosalie?
Income or Wage Gap in Rosalie is 7.4%.
Women in Rosalie earn 92.6 cents for every dollar earned by a man.
What is Inequality or Gini Index in Rosalie?
Inequality or Gini Index in Rosalie is 0.42.
What is the Total Population of Rosalie?
Total Population of Rosalie is 233.
What is the Total Male Population of Rosalie?
Total Male Population of Rosalie is 143.
What is the Total Female Population of Rosalie?
Total Female Population of Rosalie is 90.
What is the Ratio of Males per 100 Females in Rosalie?
There are 158.89 Males per 100 Females in Rosalie.
What is the Ratio of Females per 100 Males in Rosalie?
There are 62.94 Females per 100 Males in Rosalie.
What is the Median Population Age in Rosalie?
Median Population Age in Rosalie is 24.4 Years.
What is the Average Family Size in Rosalie
Average Family Size in Rosalie is 5.0 People.
What is the Average Household Size in Rosalie
Average Household Size in Rosalie is 3.9 People.
How Large is the Labor Force in Rosalie?
There are 108 People in the Labor Forcein in Rosalie.
What is the Percentage of People in the Labor Force in Rosalie?
70.6% of People are in the Labor Force in Rosalie.
What is the Unemployment Rate in Rosalie?
Unemployment Rate in Rosalie is 12.0%.