Richland, NE Map & Demographics
Richland Map
Richland Overview
$19,502
PER CAPITA INCOME
$40,500
AVG HOUSEHOLD INCOME
0.46
INEQUALITY / GINI INDEX
50
TOTAL POPULATION
26
MALE POPULATION
24
FEMALE POPULATION
108.33
MALES / 100 FEMALES
92.31
FEMALES / 100 MALES
50.5
MEDIAN AGE
2.8
AVG FAMILY SIZE
1.8
AVG HOUSEHOLD SIZE
19
LABOR FORCE [ PEOPLE ]
43.2%
PERCENT IN LABOR FORCE
Richland Area Codes
Income in Richland
Income Overview in Richland
| Characteristic | Number | Measure |
| Per Capita Income | 50 | $19,502 |
| Median Family Income | 9 | $0 |
| Mean Family Income | 9 | $50,178 |
| Median Household Income | 28 | $40,500 |
| Mean Household Income | 28 | $39,082 |
| Income Deficit | 9 | $0 |
| Wage / Income Gap (%) | 50 | 0.00% |
| Wage / Income Gap ($) | 50 | 100.00¢ per $1 |
| Gini / Inequality Index | 50 | 0.46 |
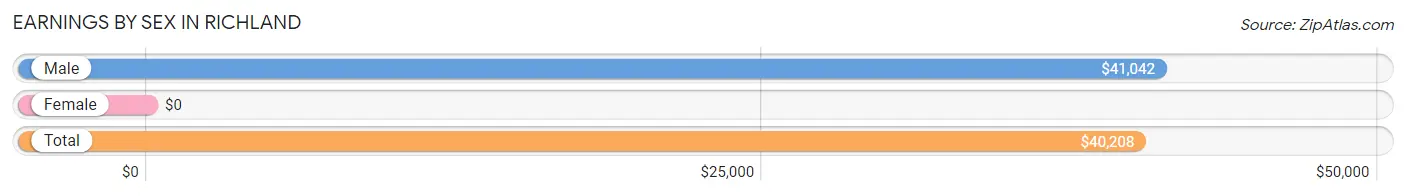
Earnings by Sex in Richland
| Sex | Number | Average Earnings |
| Male | 15 (78.9%) | $41,042 |
| Female | 4 (21.0%) | $0 |
| Total | 19 (100.0%) | $40,208 |
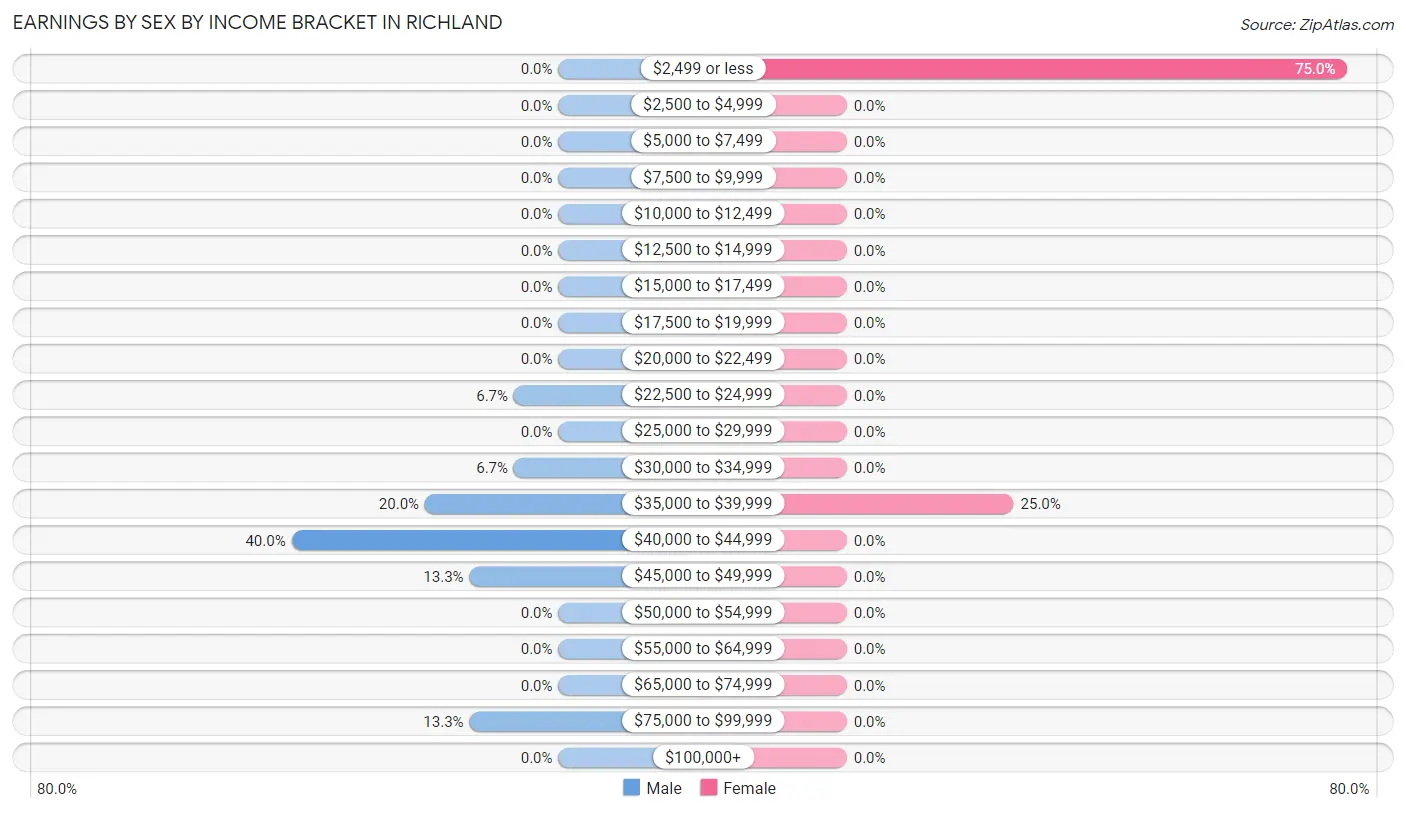
Earnings by Sex by Income Bracket in Richland
The most common earnings brackets in Richland are $40,000 to $44,999 for men (6 | 40.0%) and $2,499 or less for women (3 | 75.0%).
| Income | Male | Female |
| $2,499 or less | 0 (0.0%) | 3 (75.0%) |
| $2,500 to $4,999 | 0 (0.0%) | 0 (0.0%) |
| $5,000 to $7,499 | 0 (0.0%) | 0 (0.0%) |
| $7,500 to $9,999 | 0 (0.0%) | 0 (0.0%) |
| $10,000 to $12,499 | 0 (0.0%) | 0 (0.0%) |
| $12,500 to $14,999 | 0 (0.0%) | 0 (0.0%) |
| $15,000 to $17,499 | 0 (0.0%) | 0 (0.0%) |
| $17,500 to $19,999 | 0 (0.0%) | 0 (0.0%) |
| $20,000 to $22,499 | 0 (0.0%) | 0 (0.0%) |
| $22,500 to $24,999 | 1 (6.7%) | 0 (0.0%) |
| $25,000 to $29,999 | 0 (0.0%) | 0 (0.0%) |
| $30,000 to $34,999 | 1 (6.7%) | 0 (0.0%) |
| $35,000 to $39,999 | 3 (20.0%) | 1 (25.0%) |
| $40,000 to $44,999 | 6 (40.0%) | 0 (0.0%) |
| $45,000 to $49,999 | 2 (13.3%) | 0 (0.0%) |
| $50,000 to $54,999 | 0 (0.0%) | 0 (0.0%) |
| $55,000 to $64,999 | 0 (0.0%) | 0 (0.0%) |
| $65,000 to $74,999 | 0 (0.0%) | 0 (0.0%) |
| $75,000 to $99,999 | 2 (13.3%) | 0 (0.0%) |
| $100,000+ | 0 (0.0%) | 0 (0.0%) |
| Total | 15 (100.0%) | 4 (100.0%) |
Earnings by Sex by Educational Attainment in Richland
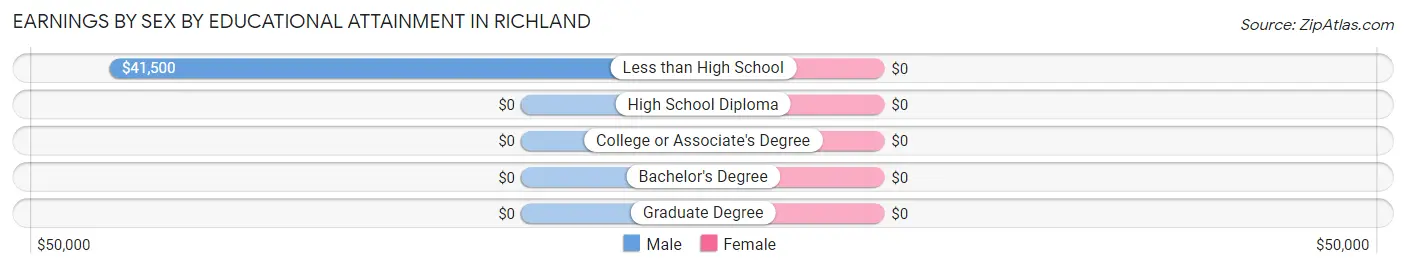
| Educational Attainment | Male Income | Female Income |
| Less than High School | $41,500 | $0 |
| High School Diploma | - | - |
| College or Associate's Degree | - | - |
| Bachelor's Degree | - | - |
| Graduate Degree | - | - |
| Total | $41,042 | $0 |
Family Income in Richland
Family Income Brackets in Richland
According to the Richland family income data, there are 3 families falling into the $15,000 to $24,999 income range, which is the most common income bracket and makes up 33.3% of all families.
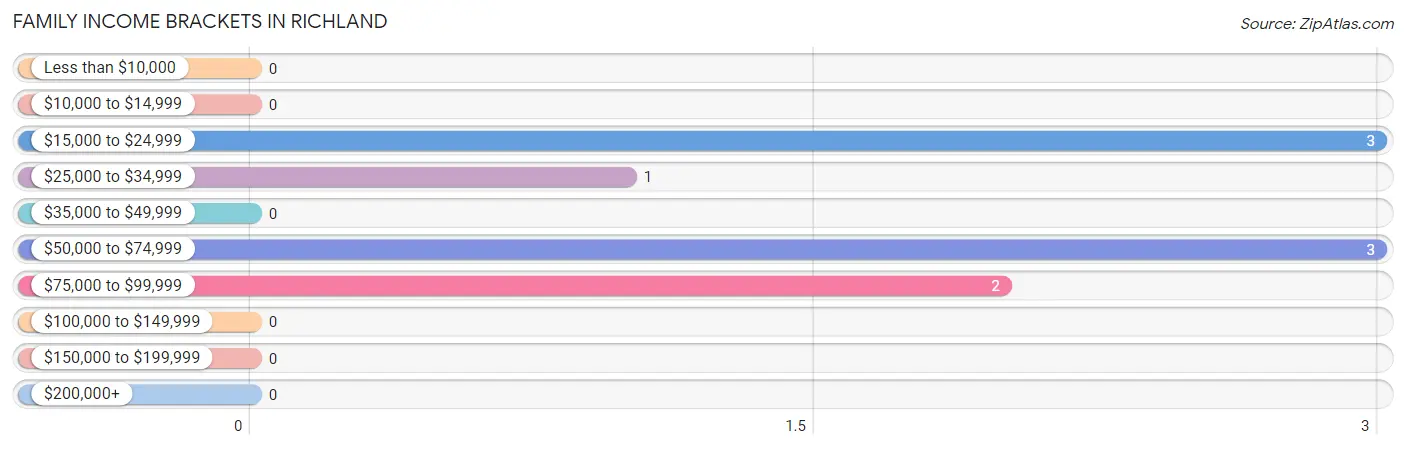
| Income Bracket | # Families | % Families |
| Less than $10,000 | 0 | 0.0% |
| $10,000 to $14,999 | 0 | 0.0% |
| $15,000 to $24,999 | 3 | 33.3% |
| $25,000 to $34,999 | 1 | 11.1% |
| $35,000 to $49,999 | 0 | 0.0% |
| $50,000 to $74,999 | 3 | 33.3% |
| $75,000 to $99,999 | 2 | 22.2% |
| $100,000 to $149,999 | 0 | 0.0% |
| $150,000 to $199,999 | 0 | 0.0% |
| $200,000+ | 0 | 0.0% |
Family Income by Famaliy Size in Richland
2-person families (6 | 66.7%) account for the highest median family income in Richland with $48,750 per family, while 2-person families (6 | 66.7%) have the highest median income of $24,375 per family member.
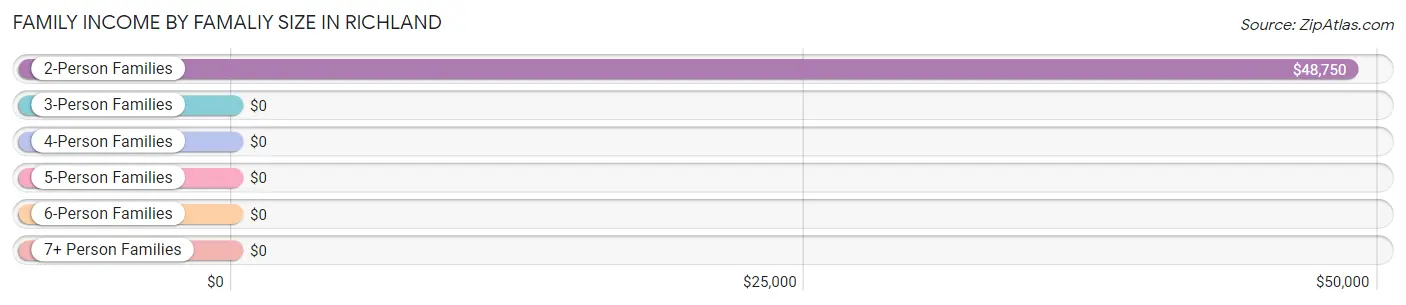
| Income Bracket | # Families | Median Income |
| 2-Person Families | 6 (66.7%) | $48,750 |
| 3-Person Families | 1 (11.1%) | $0 |
| 4-Person Families | 0 (0.0%) | $0 |
| 5-Person Families | 2 (22.2%) | $0 |
| 6-Person Families | 0 (0.0%) | $0 |
| 7+ Person Families | 0 (0.0%) | $0 |
| Total | 9 (100.0%) | $0 |
Family Income by Number of Earners in Richland
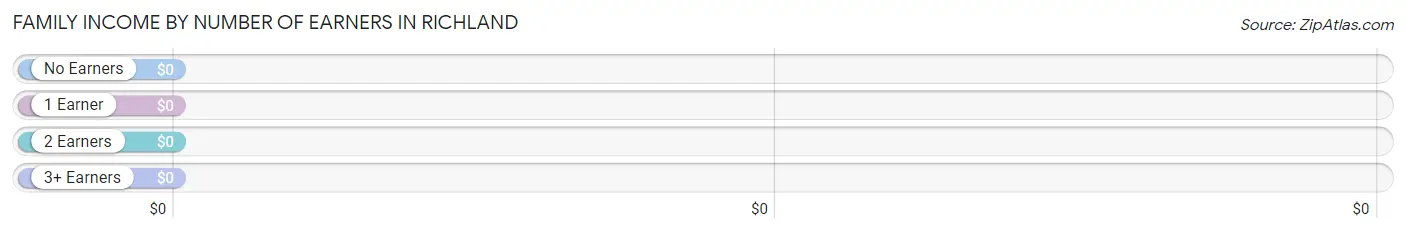
| Number of Earners | # Families | Median Income |
| No Earners | 4 (44.4%) | $0 |
| 1 Earner | 3 (33.3%) | $0 |
| 2 Earners | 2 (22.2%) | $0 |
| 3+ Earners | 0 (0.0%) | $0 |
| Total | 9 (100.0%) | $0 |
Household Income in Richland
Household Income Brackets in Richland
With 7 households falling in the category, the less than $10,000 income range is the most frequent in Richland, accounting for 25.0% of all households.
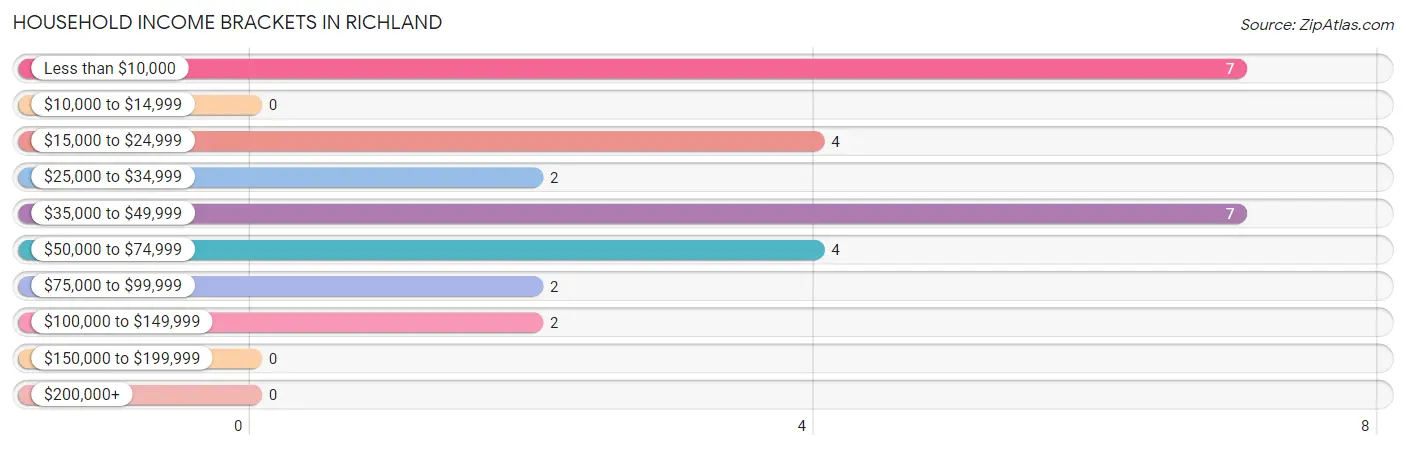
| Income Bracket | # Households | % Households |
| Less than $10,000 | 7 | 25.0% |
| $10,000 to $14,999 | 0 | 0.0% |
| $15,000 to $24,999 | 4 | 14.3% |
| $25,000 to $34,999 | 2 | 7.1% |
| $35,000 to $49,999 | 7 | 25.0% |
| $50,000 to $74,999 | 4 | 14.3% |
| $75,000 to $99,999 | 2 | 7.1% |
| $100,000 to $149,999 | 2 | 7.1% |
| $150,000 to $199,999 | 0 | 0.0% |
| $200,000+ | 0 | 0.0% |
Household Income by Householder Age in Richland
| Income Bracket | # Households | Median Income |
| 15 to 24 Years | 3 (10.7%) | $0 |
| 25 to 44 Years | 7 (25.0%) | $0 |
| 45 to 64 Years | 3 (10.7%) | $0 |
| 65+ Years | 15 (53.6%) | $0 |
| Total | 28 (100.0%) | $40,500 |
Poverty in Richland
Income Below Poverty by Sex and Age in Richland
With 7.7% poverty level for males and 41.7% for females among the residents of Richland, 15 year old males and 16 and 17 year old females are the most vulnerable to poverty, with 2 males (100.0%) and 3 females (100.0%) in their respective age groups living below the poverty level.
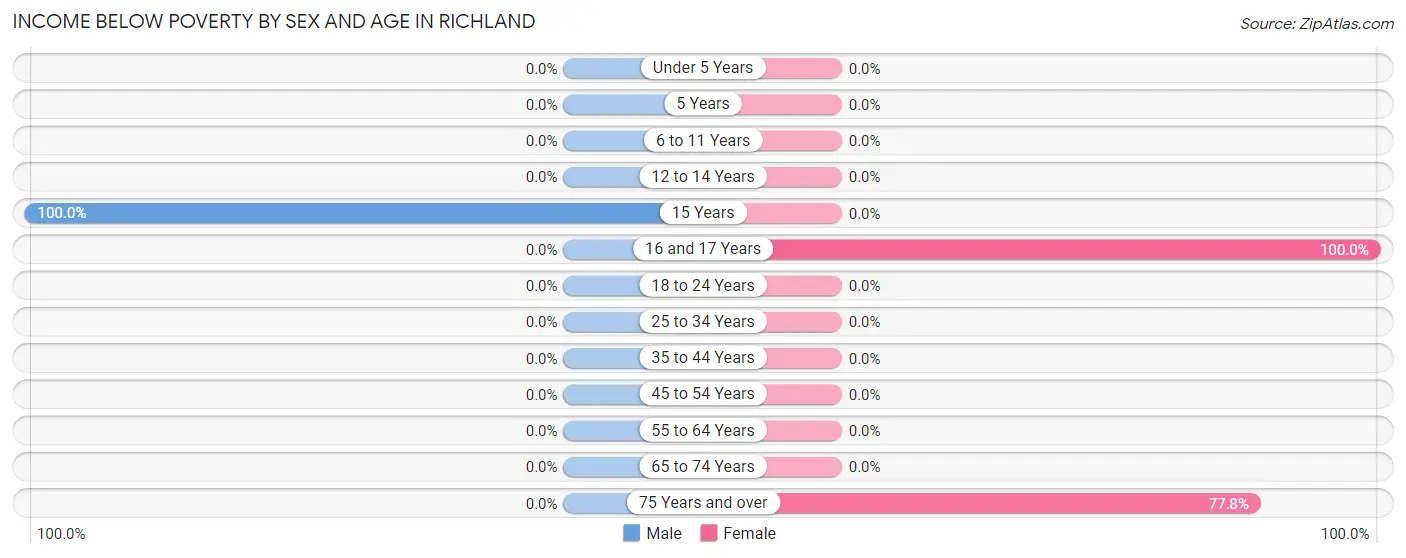
| Age Bracket | Male | Female |
| Under 5 Years | 0 (0.0%) | 0 (0.0%) |
| 5 Years | 0 (0.0%) | 0 (0.0%) |
| 6 to 11 Years | 0 (0.0%) | 0 (0.0%) |
| 12 to 14 Years | 0 (0.0%) | 0 (0.0%) |
| 15 Years | 2 (100.0%) | 0 (0.0%) |
| 16 and 17 Years | 0 (0.0%) | 3 (100.0%) |
| 18 to 24 Years | 0 (0.0%) | 0 (0.0%) |
| 25 to 34 Years | 0 (0.0%) | 0 (0.0%) |
| 35 to 44 Years | 0 (0.0%) | 0 (0.0%) |
| 45 to 54 Years | 0 (0.0%) | 0 (0.0%) |
| 55 to 64 Years | 0 (0.0%) | 0 (0.0%) |
| 65 to 74 Years | 0 (0.0%) | 0 (0.0%) |
| 75 Years and over | 0 (0.0%) | 7 (77.8%) |
| Total | 2 (7.7%) | 10 (41.7%) |
Income Above Poverty by Sex and Age in Richland
According to the poverty statistics in Richland, males aged 5 years and females aged under 5 years are the age groups that are most secure financially, with 100.0% of males and 100.0% of females in these age groups living above the poverty line.
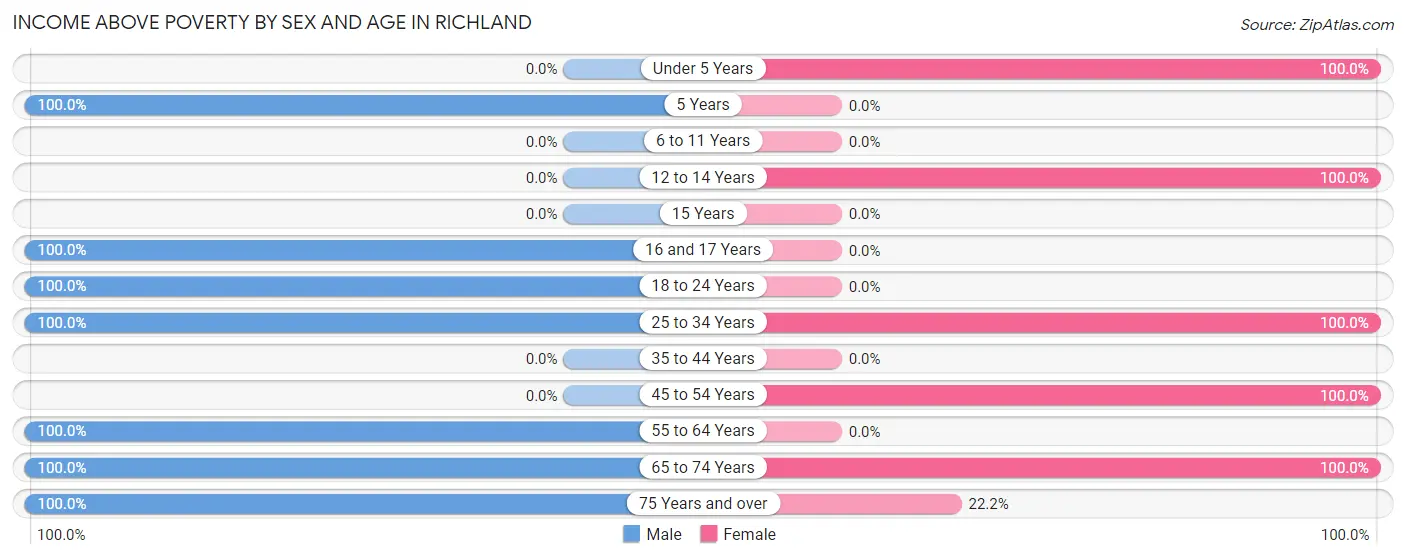
| Age Bracket | Male | Female |
| Under 5 Years | 0 (0.0%) | 1 (100.0%) |
| 5 Years | 1 (100.0%) | 0 (0.0%) |
| 6 to 11 Years | 0 (0.0%) | 0 (0.0%) |
| 12 to 14 Years | 0 (0.0%) | 2 (100.0%) |
| 15 Years | 0 (0.0%) | 0 (0.0%) |
| 16 and 17 Years | 3 (100.0%) | 0 (0.0%) |
| 18 to 24 Years | 4 (100.0%) | 0 (0.0%) |
| 25 to 34 Years | 7 (100.0%) | 1 (100.0%) |
| 35 to 44 Years | 0 (0.0%) | 0 (0.0%) |
| 45 to 54 Years | 0 (0.0%) | 2 (100.0%) |
| 55 to 64 Years | 3 (100.0%) | 0 (0.0%) |
| 65 to 74 Years | 1 (100.0%) | 6 (100.0%) |
| 75 Years and over | 5 (100.0%) | 2 (22.2%) |
| Total | 24 (92.3%) | 14 (58.3%) |
Income Below Poverty Among Married-Couple Families in Richland
| Children | Above Poverty | Below Poverty |
| No Children | 6 (100.0%) | 0 (0.0%) |
| 1 or 2 Children | 1 (100.0%) | 0 (0.0%) |
| 3 or 4 Children | 2 (100.0%) | 0 (0.0%) |
| 5 or more Children | 0 (0.0%) | 0 (0.0%) |
| Total | 9 (100.0%) | 0 (0.0%) |
Income Below Poverty Among Single-Parent Households in Richland
| Children | Single Father | Single Mother |
| No Children | 0 (0.0%) | 0 (0.0%) |
| 1 or 2 Children | 0 (0.0%) | 0 (0.0%) |
| 3 or 4 Children | 0 (0.0%) | 0 (0.0%) |
| 5 or more Children | 0 (0.0%) | 0 (0.0%) |
| Total | 0 (0.0%) | 0 (0.0%) |
Income Below Poverty Among Married-Couple vs Single-Parent Households in Richland
| Children | Married-Couple Families | Single-Parent Households |
| No Children | 0 (0.0%) | 0 (0.0%) |
| 1 or 2 Children | 0 (0.0%) | 0 (0.0%) |
| 3 or 4 Children | 0 (0.0%) | 0 (0.0%) |
| 5 or more Children | 0 (0.0%) | 0 (0.0%) |
| Total | 0 (0.0%) | 0 (0.0%) |
Race in Richland
The most populous races in Richland are White / Caucasian (45 | 90.0%), Hispanic or Latino (13 | 26.0%), and Native / Alaskan (5 | 10.0%).
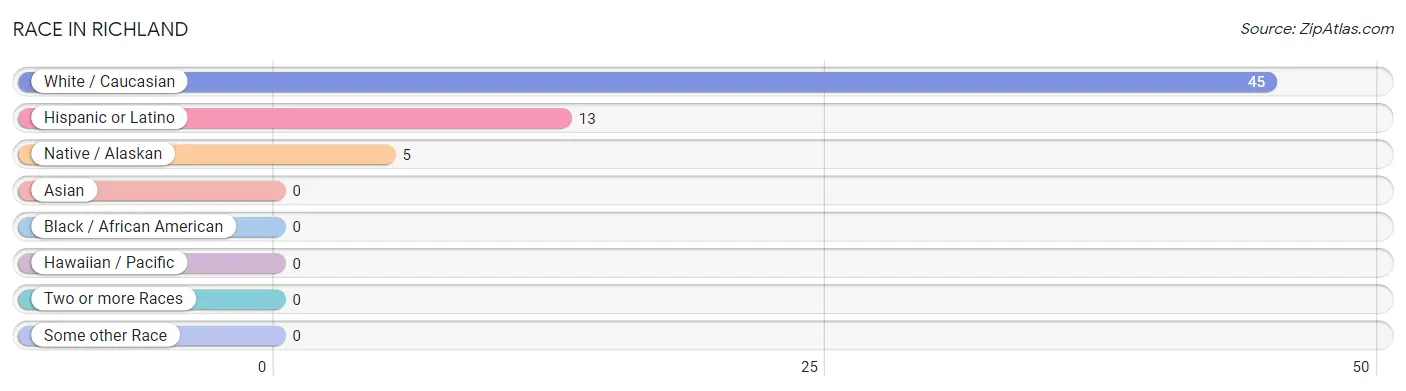
| Race | # Population | % Population |
| Asian | 0 | 0.0% |
| Black / African American | 0 | 0.0% |
| Hawaiian / Pacific | 0 | 0.0% |
| Hispanic or Latino | 13 | 26.0% |
| Native / Alaskan | 5 | 10.0% |
| White / Caucasian | 45 | 90.0% |
| Two or more Races | 0 | 0.0% |
| Some other Race | 0 | 0.0% |
| Total | 50 | 100.0% |
Ancestry in Richland
The most populous ancestries reported in Richland are German (19 | 38.0%), Mexican (13 | 26.0%), Czech (8 | 16.0%), American (7 | 14.0%), and French (6 | 12.0%), together accounting for 106.0% of all Richland residents.
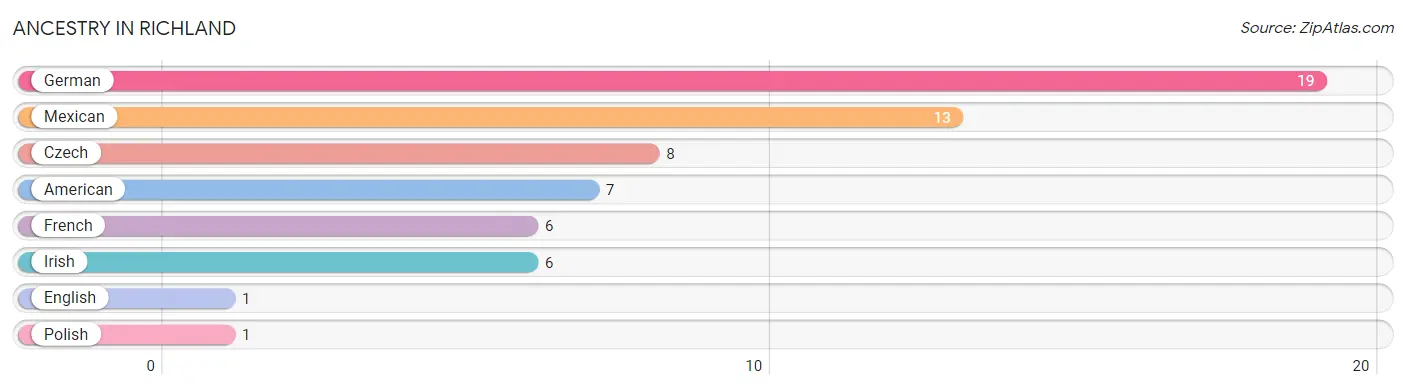
| Ancestry | # Population | % Population |
| American | 7 | 14.0% |
| Czech | 8 | 16.0% |
| English | 1 | 2.0% |
| French | 6 | 12.0% |
| German | 19 | 38.0% |
| Irish | 6 | 12.0% |
| Mexican | 13 | 26.0% |
| Polish | 1 | 2.0% | View All 8 Rows |
Immigrants in Richland
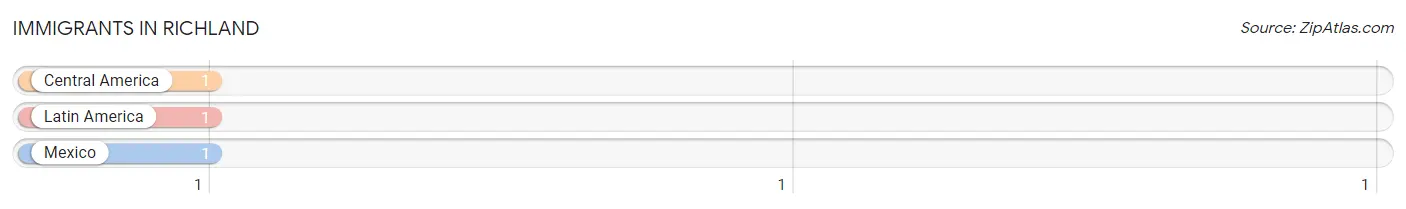
The most numerous immigrant groups reported in Richland came from Central America (1 | 2.0%), Latin America (1 | 2.0%), and Mexico (1 | 2.0%), together accounting for 6.0% of all Richland residents.
| Immigration Origin | # Population | % Population |
| Central America | 1 | 2.0% |
| Latin America | 1 | 2.0% |
| Mexico | 1 | 2.0% | View All 3 Rows |
Sex and Age in Richland
Sex and Age in Richland
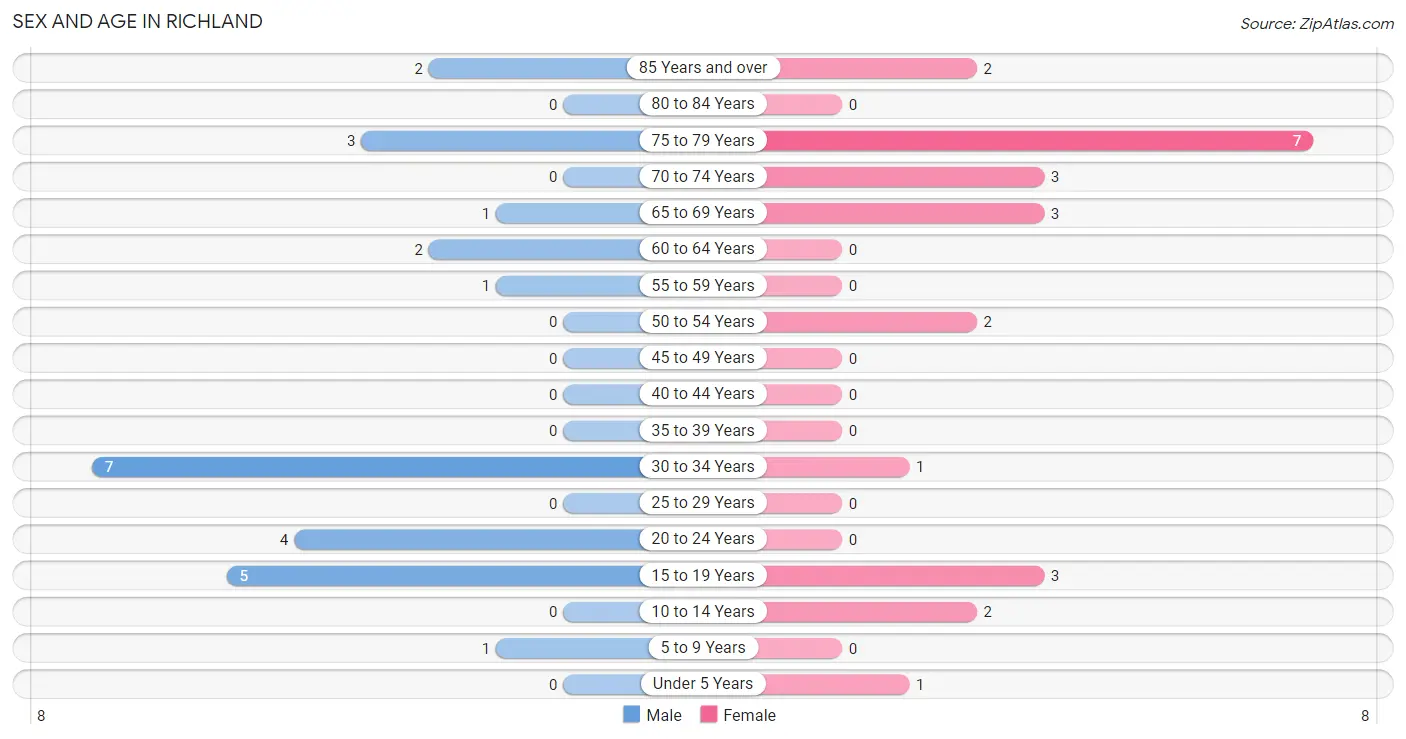
The most populous age groups in Richland are 30 to 34 Years (7 | 26.9%) for men and 75 to 79 Years (7 | 29.2%) for women.
| Age Bracket | Male | Female |
| Under 5 Years | 0 (0.0%) | 1 (4.2%) |
| 5 to 9 Years | 1 (3.8%) | 0 (0.0%) |
| 10 to 14 Years | 0 (0.0%) | 2 (8.3%) |
| 15 to 19 Years | 5 (19.2%) | 3 (12.5%) |
| 20 to 24 Years | 4 (15.4%) | 0 (0.0%) |
| 25 to 29 Years | 0 (0.0%) | 0 (0.0%) |
| 30 to 34 Years | 7 (26.9%) | 1 (4.2%) |
| 35 to 39 Years | 0 (0.0%) | 0 (0.0%) |
| 40 to 44 Years | 0 (0.0%) | 0 (0.0%) |
| 45 to 49 Years | 0 (0.0%) | 0 (0.0%) |
| 50 to 54 Years | 0 (0.0%) | 2 (8.3%) |
| 55 to 59 Years | 1 (3.8%) | 0 (0.0%) |
| 60 to 64 Years | 2 (7.7%) | 0 (0.0%) |
| 65 to 69 Years | 1 (3.8%) | 3 (12.5%) |
| 70 to 74 Years | 0 (0.0%) | 3 (12.5%) |
| 75 to 79 Years | 3 (11.5%) | 7 (29.2%) |
| 80 to 84 Years | 0 (0.0%) | 0 (0.0%) |
| 85 Years and over | 2 (7.7%) | 2 (8.3%) |
| Total | 26 (100.0%) | 24 (100.0%) |
Families and Households in Richland
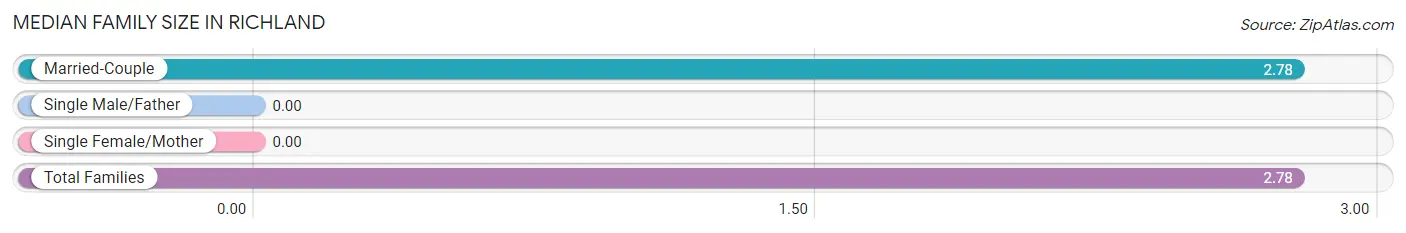
Median Family Size in Richland
| Family Type | # Families | Family Size |
| Married-Couple | 9 (100.0%) | 2.78 |
| Single Male/Father | 0 (0.0%) | - |
| Single Female/Mother | 0 (0.0%) | - |
| Total Families | 9 (100.0%) | 2.78 |
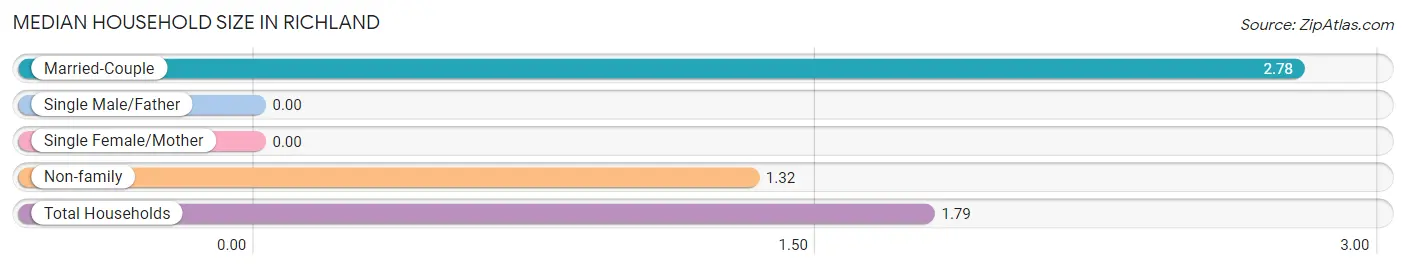
Median Household Size in Richland
| Household Type | # Households | Household Size |
| Married-Couple | 9 (32.1%) | 2.78 |
| Single Male/Father | 0 (0.0%) | - |
| Single Female/Mother | 0 (0.0%) | - |
| Non-family | 19 (67.9%) | 1.32 |
| Total Households | 28 (100.0%) | 1.79 |
Household Size by Marriage Status in Richland
Out of a total of 28 households in Richland, 9 (32.1%) are family households, while 19 (67.9%) are nonfamily households. The most numerous type of family households are 2-person households, comprising 6, and the most common type of nonfamily households are 1-person households, comprising 12.
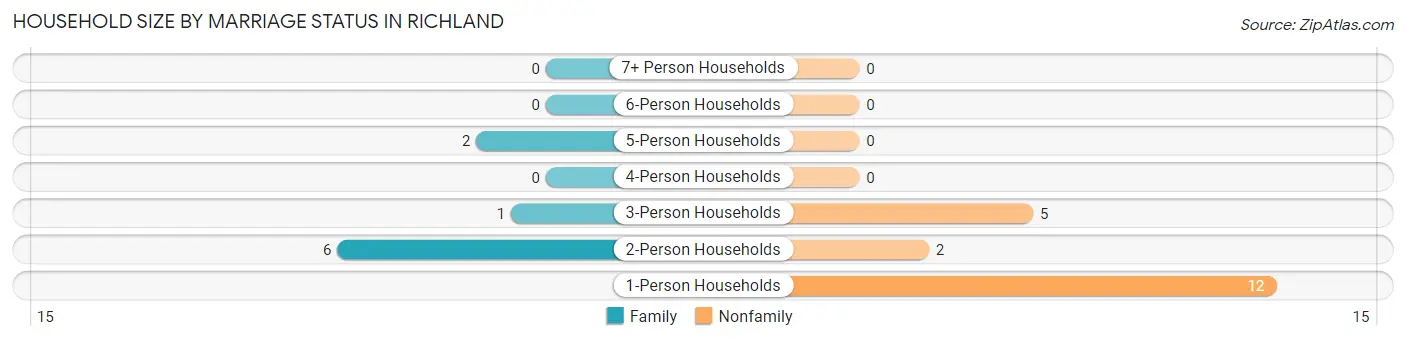
| Household Size | Family Households | Nonfamily Households |
| 1-Person Households | - | 12 (42.9%) |
| 2-Person Households | 6 (21.4%) | 2 (7.1%) |
| 3-Person Households | 1 (3.6%) | 5 (17.9%) |
| 4-Person Households | 0 (0.0%) | 0 (0.0%) |
| 5-Person Households | 2 (7.1%) | 0 (0.0%) |
| 6-Person Households | 0 (0.0%) | 0 (0.0%) |
| 7+ Person Households | 0 (0.0%) | 0 (0.0%) |
| Total | 9 (32.1%) | 19 (67.9%) |
Female Fertility in Richland
Fertility by Age in Richland
| Age Bracket | Women with Births | Births / 1,000 Women |
| 15 to 19 years | 0 (0.0%) | 0.0 |
| 20 to 34 years | 0 (0.0%) | 0.0 |
| 35 to 50 years | 0 (0.0%) | 0.0 |
| Total | 0 (0.0%) | 0.0 |
Fertility by Age by Marriage Status in Richland
| Age Bracket | Married | Unmarried |
| 15 to 19 years | 0 (0.0%) | 0 (0.0%) |
| 20 to 34 years | 0 (0.0%) | 0 (0.0%) |
| 35 to 50 years | 0 (0.0%) | 0 (0.0%) |
| Total | 0 (0.0%) | 0 (0.0%) |
Fertility by Education in Richland
| Educational Attainment | Women with Births | Births / 1,000 Women |
| Less than High School | 0 (0.0%) | 0.0 |
| High School Diploma | 0 (0.0%) | 0.0 |
| College or Associate's Degree | 0 (0.0%) | 0.0 |
| Bachelor's Degree | 0 (0.0%) | 0.0 |
| Graduate Degree | 0 (0.0%) | 0.0 |
| Total | 0 (0.0%) | 0.0 |
Fertility by Education by Marriage Status in Richland
| Educational Attainment | Married | Unmarried |
| Less than High School | 0 (0.0%) | 0 (0.0%) |
| High School Diploma | 0 (0.0%) | 0 (0.0%) |
| College or Associate's Degree | 0 (0.0%) | 0 (0.0%) |
| Bachelor's Degree | 0 (0.0%) | 0 (0.0%) |
| Graduate Degree | 0 (0.0%) | 0 (0.0%) |
| Total | 0 (0.0%) | 0 (0.0%) |
Employment Characteristics in Richland
Employment by Class of Employer in Richland
Among the 19 employed individuals in Richland, private company employees (15 | 78.9%), self-employed (not incorporated) (2 | 10.5%), and federal government employees (2 | 10.5%) make up the most common classes of employment.
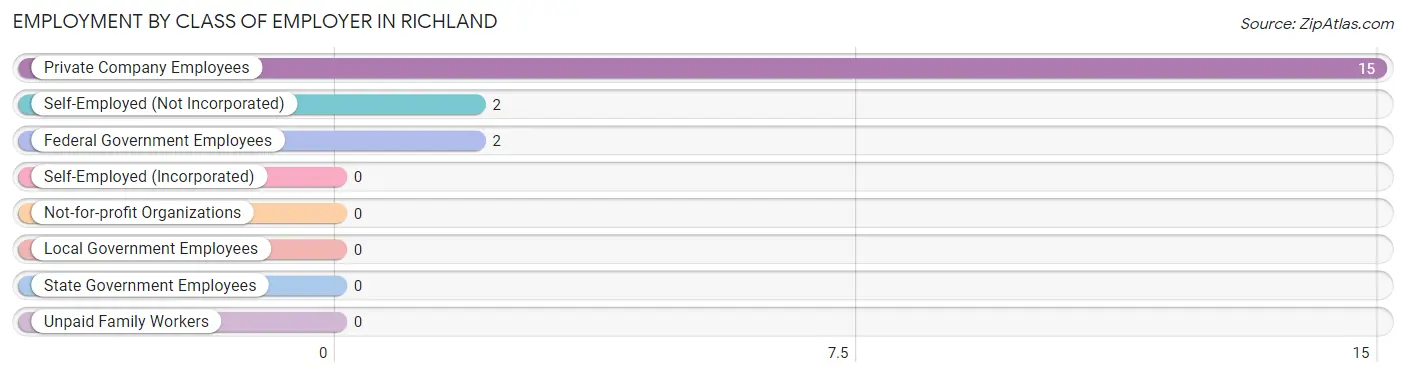
| Employer Class | # Employees | % Employees |
| Private Company Employees | 15 | 78.9% |
| Self-Employed (Incorporated) | 0 | 0.0% |
| Self-Employed (Not Incorporated) | 2 | 10.5% |
| Not-for-profit Organizations | 0 | 0.0% |
| Local Government Employees | 0 | 0.0% |
| State Government Employees | 0 | 0.0% |
| Federal Government Employees | 2 | 10.5% |
| Unpaid Family Workers | 0 | 0.0% |
| Total | 19 | 100.0% |
Employment Status by Age in Richland
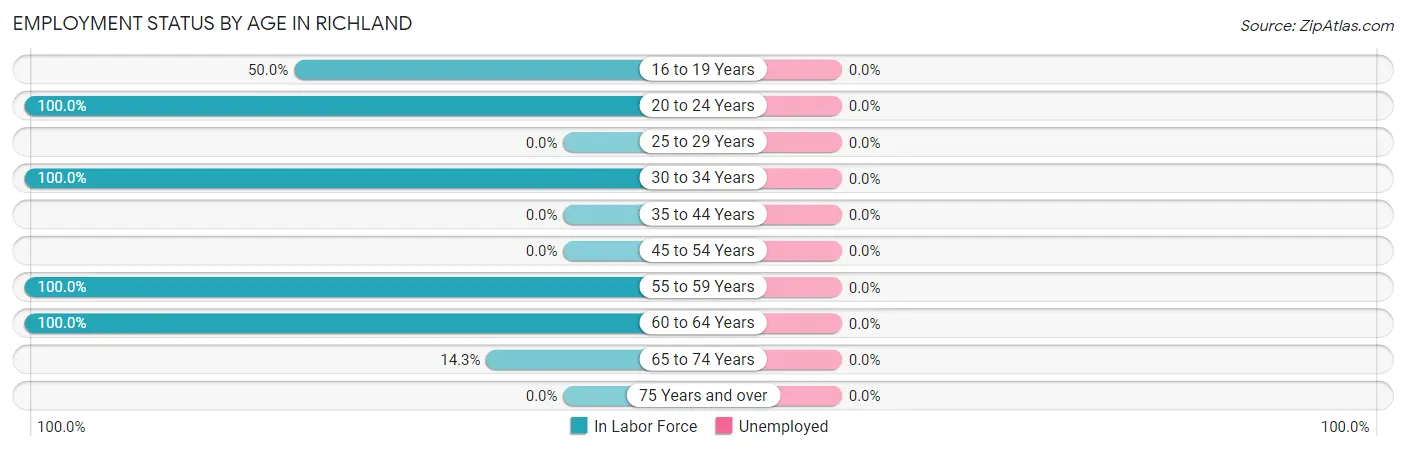
| Age Bracket | In Labor Force | Unemployed |
| 16 to 19 Years | 3 (50.0%) | 0 (0.0%) |
| 20 to 24 Years | 4 (100.0%) | 0 (0.0%) |
| 25 to 29 Years | 0 (0.0%) | 0 (0.0%) |
| 30 to 34 Years | 8 (100.0%) | 0 (0.0%) |
| 35 to 44 Years | 0 (0.0%) | 0 (0.0%) |
| 45 to 54 Years | 0 (0.0%) | 0 (0.0%) |
| 55 to 59 Years | 1 (100.0%) | 0 (0.0%) |
| 60 to 64 Years | 2 (100.0%) | 0 (0.0%) |
| 65 to 74 Years | 1 (14.3%) | 0 (0.0%) |
| 75 Years and over | 0 (0.0%) | 0 (0.0%) |
| Total | 19 (43.2%) | 0 (0.0%) |
Employment Status by Educational Attainment in Richland
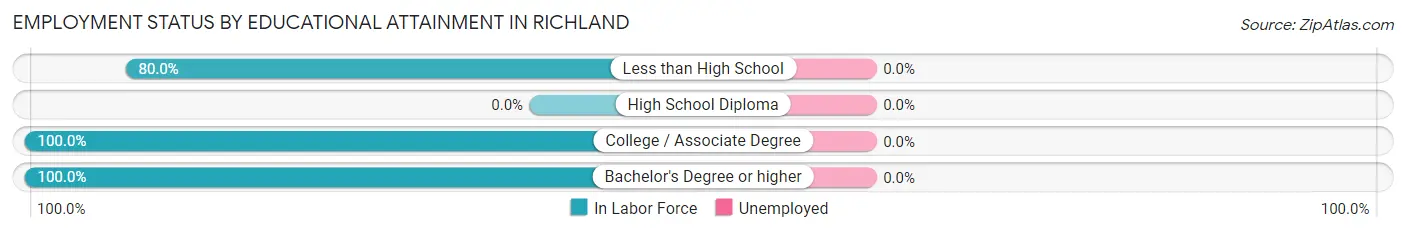
| Educational Attainment | In Labor Force | Unemployed |
| Less than High School | 8 (80.0%) | 0 (0.0%) |
| High School Diploma | 0 (0.0%) | 0 (0.0%) |
| College / Associate Degree | 1 (100.0%) | 0 (0.0%) |
| Bachelor's Degree or higher | 2 (100.0%) | 0 (0.0%) |
| Total | 11 (84.6%) | 0 (0.0%) |
Employment Occupations by Sex in Richland
Management, Business, Science and Arts Occupations
The most common Management, Business, Science and Arts occupations in Richland are , and Management (2 | 10.5%).
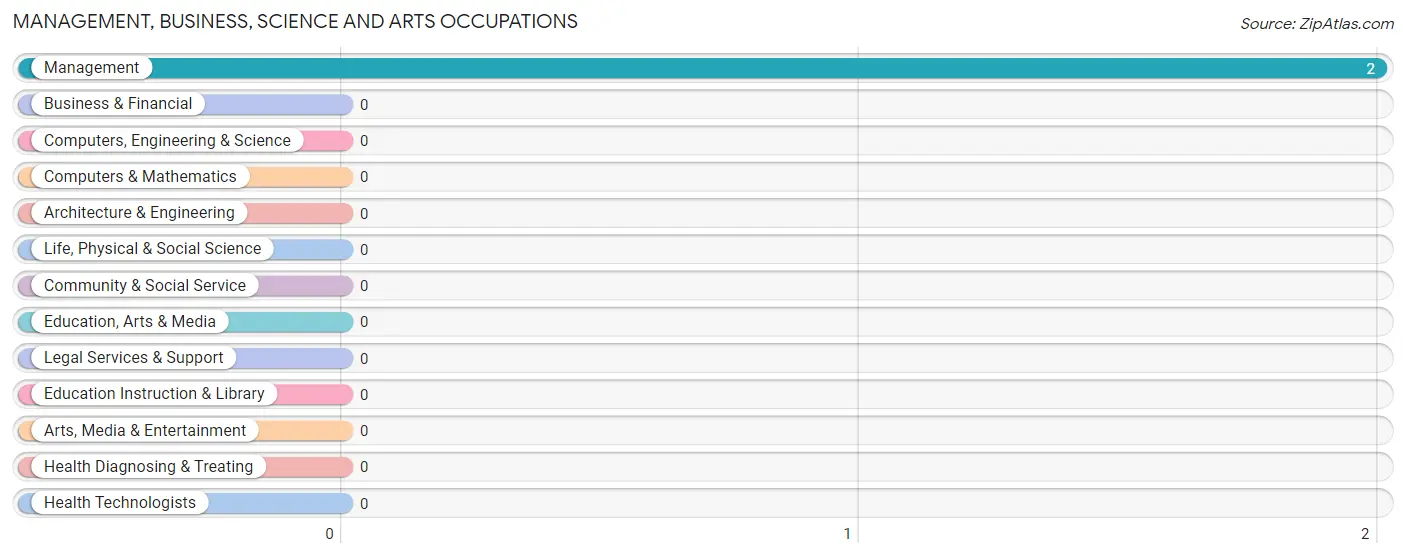
Management, Business, Science and Arts Occupations by Sex
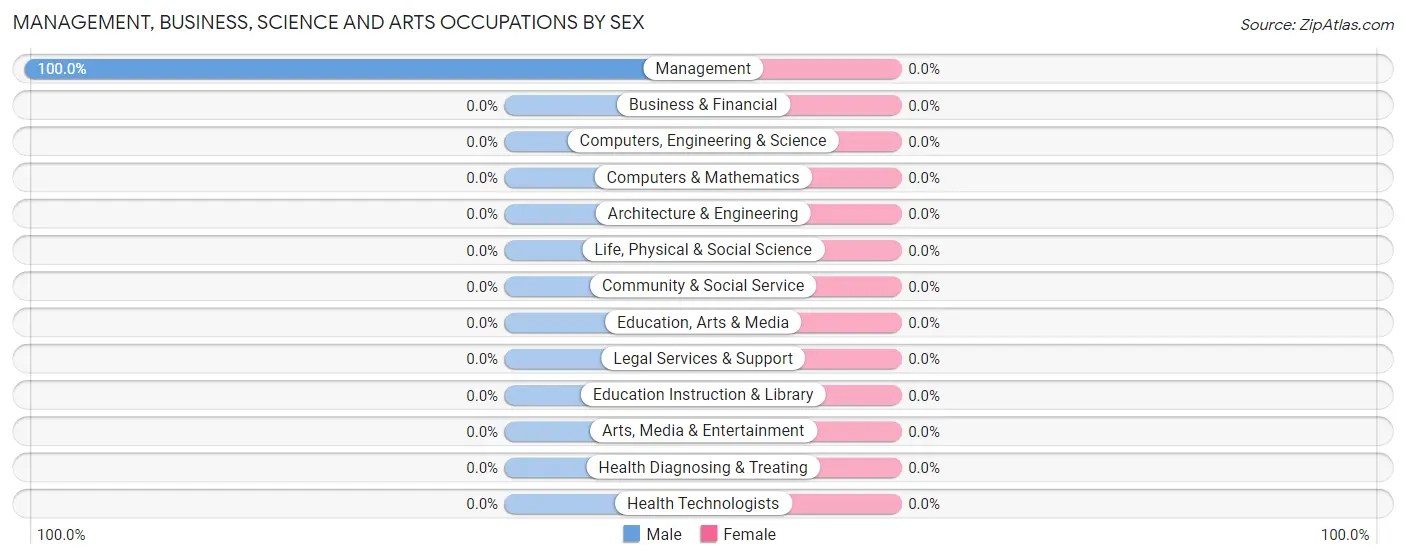
| Occupation | Male | Female |
| Management | 2 (100.0%) | 0 (0.0%) |
| Business & Financial | 0 (0.0%) | 0 (0.0%) |
| Computers, Engineering & Science | 0 (0.0%) | 0 (0.0%) |
| Computers & Mathematics | 0 (0.0%) | 0 (0.0%) |
| Architecture & Engineering | 0 (0.0%) | 0 (0.0%) |
| Life, Physical & Social Science | 0 (0.0%) | 0 (0.0%) |
| Community & Social Service | 0 (0.0%) | 0 (0.0%) |
| Education, Arts & Media | 0 (0.0%) | 0 (0.0%) |
| Legal Services & Support | 0 (0.0%) | 0 (0.0%) |
| Education Instruction & Library | 0 (0.0%) | 0 (0.0%) |
| Arts, Media & Entertainment | 0 (0.0%) | 0 (0.0%) |
| Health Diagnosing & Treating | 0 (0.0%) | 0 (0.0%) |
| Health Technologists | 0 (0.0%) | 0 (0.0%) |
| Total (Category) | 2 (100.0%) | 0 (0.0%) |
| Total (Overall) | 15 (78.9%) | 4 (21.0%) |
Services Occupations
The most common Services occupations in Richland are Food Preparation & Serving (3 | 15.8%), and Cleaning & Maintenance (1 | 5.3%).
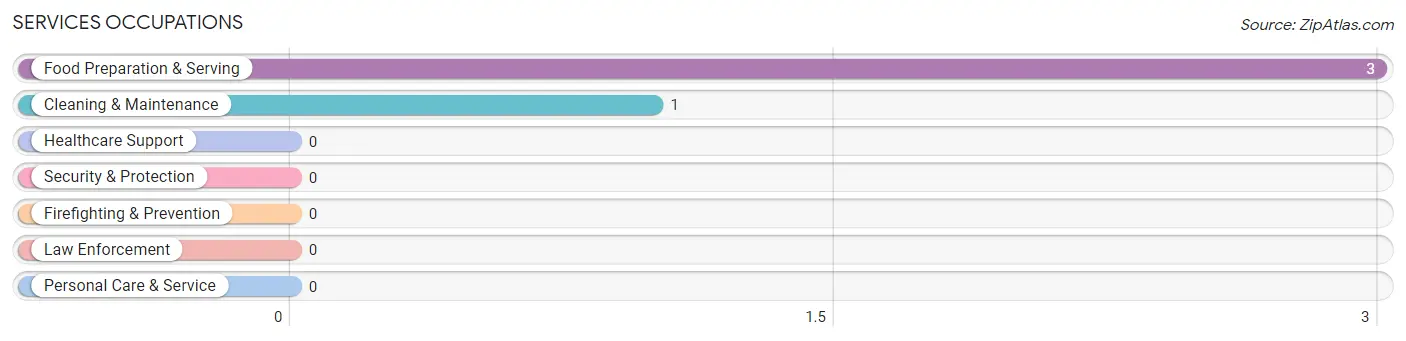
Services Occupations by Sex
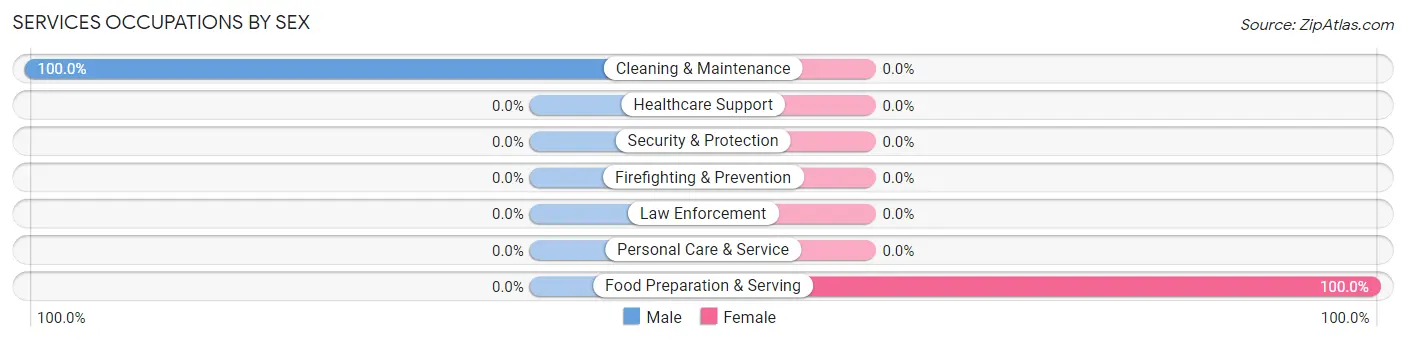
| Occupation | Male | Female |
| Healthcare Support | 0 (0.0%) | 0 (0.0%) |
| Security & Protection | 0 (0.0%) | 0 (0.0%) |
| Firefighting & Prevention | 0 (0.0%) | 0 (0.0%) |
| Law Enforcement | 0 (0.0%) | 0 (0.0%) |
| Food Preparation & Serving | 0 (0.0%) | 3 (100.0%) |
| Cleaning & Maintenance | 1 (100.0%) | 0 (0.0%) |
| Personal Care & Service | 0 (0.0%) | 0 (0.0%) |
| Total (Category) | 1 (25.0%) | 3 (75.0%) |
| Total (Overall) | 15 (78.9%) | 4 (21.0%) |
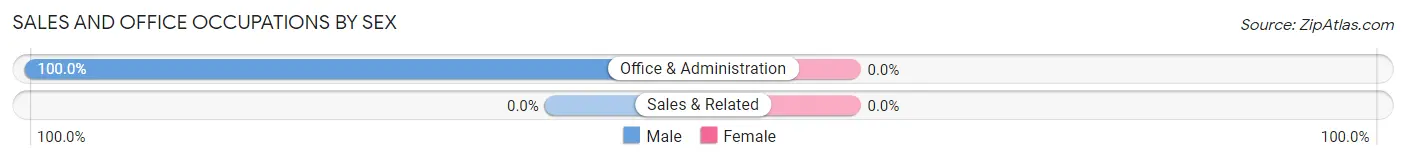
Sales and Office Occupations
The most common Sales and Office occupations in Richland are , and Office & Administration (2 | 10.5%).
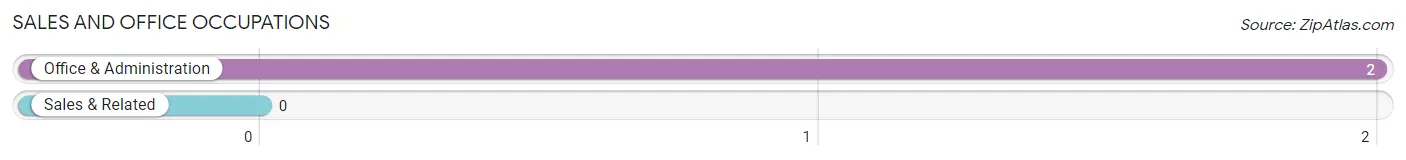
Sales and Office Occupations by Sex
| Occupation | Male | Female |
| Sales & Related | 0 (0.0%) | 0 (0.0%) |
| Office & Administration | 2 (100.0%) | 0 (0.0%) |
| Total (Category) | 2 (100.0%) | 0 (0.0%) |
| Total (Overall) | 15 (78.9%) | 4 (21.0%) |
Natural Resources, Construction and Maintenance Occupations
The most common Natural Resources, Construction and Maintenance occupations in Richland are Installation, Maintenance & Repair (2 | 10.5%), and Construction & Extraction (1 | 5.3%).
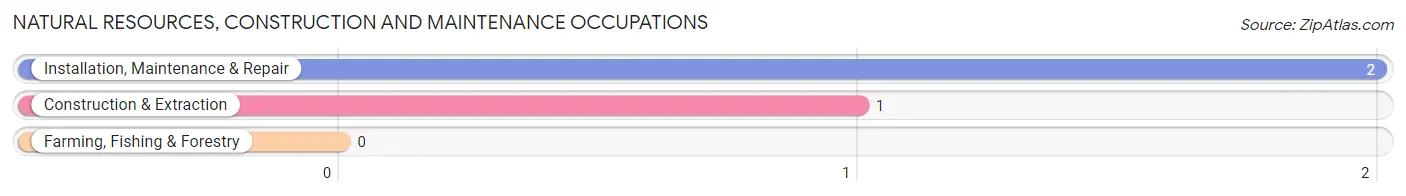
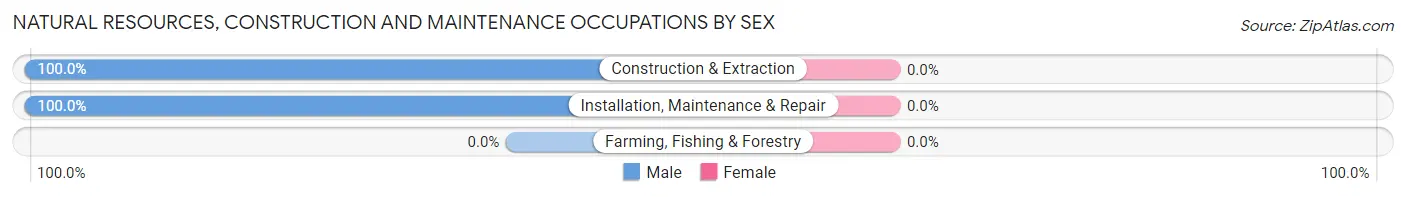
Natural Resources, Construction and Maintenance Occupations by Sex
| Occupation | Male | Female |
| Farming, Fishing & Forestry | 0 (0.0%) | 0 (0.0%) |
| Construction & Extraction | 1 (100.0%) | 0 (0.0%) |
| Installation, Maintenance & Repair | 2 (100.0%) | 0 (0.0%) |
| Total (Category) | 3 (100.0%) | 0 (0.0%) |
| Total (Overall) | 15 (78.9%) | 4 (21.0%) |
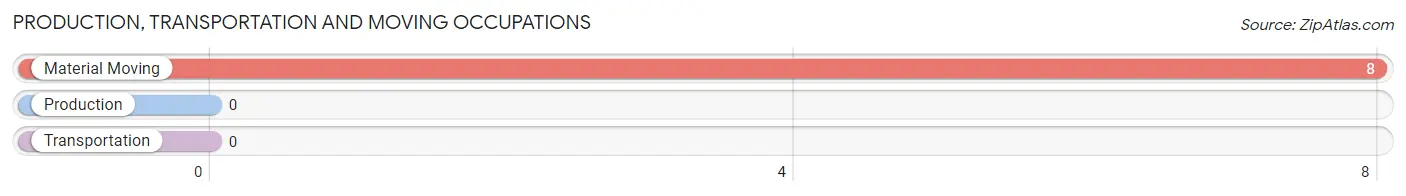
Production, Transportation and Moving Occupations
The most common Production, Transportation and Moving occupations in Richland are , and Material Moving (8 | 42.1%).
Production, Transportation and Moving Occupations by Sex
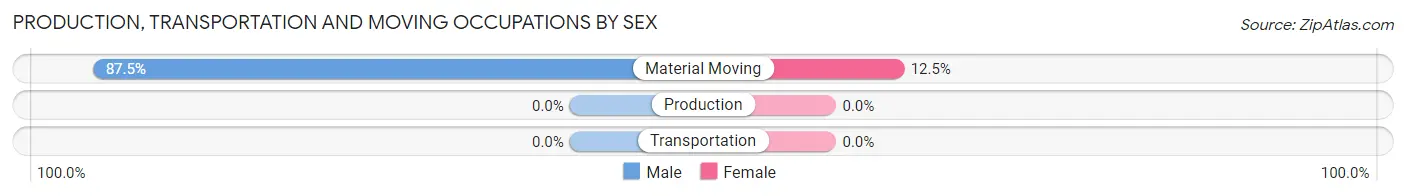
| Occupation | Male | Female |
| Production | 0 (0.0%) | 0 (0.0%) |
| Transportation | 0 (0.0%) | 0 (0.0%) |
| Material Moving | 7 (87.5%) | 1 (12.5%) |
| Total (Category) | 7 (87.5%) | 1 (12.5%) |
| Total (Overall) | 15 (78.9%) | 4 (21.0%) |
Employment Industries by Sex in Richland
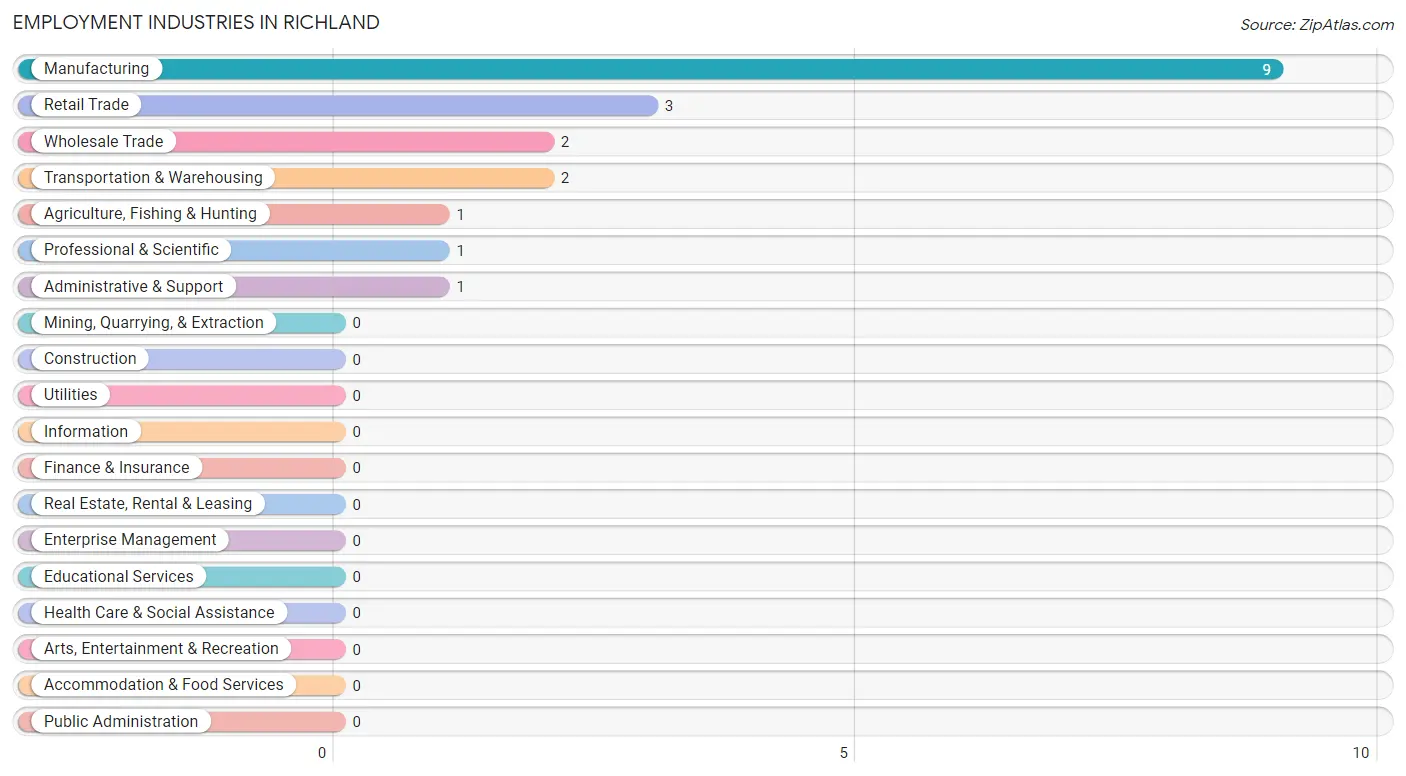
Employment Industries in Richland
The major employment industries in Richland include Manufacturing (9 | 47.4%), Retail Trade (3 | 15.8%), Wholesale Trade (2 | 10.5%), Transportation & Warehousing (2 | 10.5%), and Agriculture, Fishing & Hunting (1 | 5.3%).
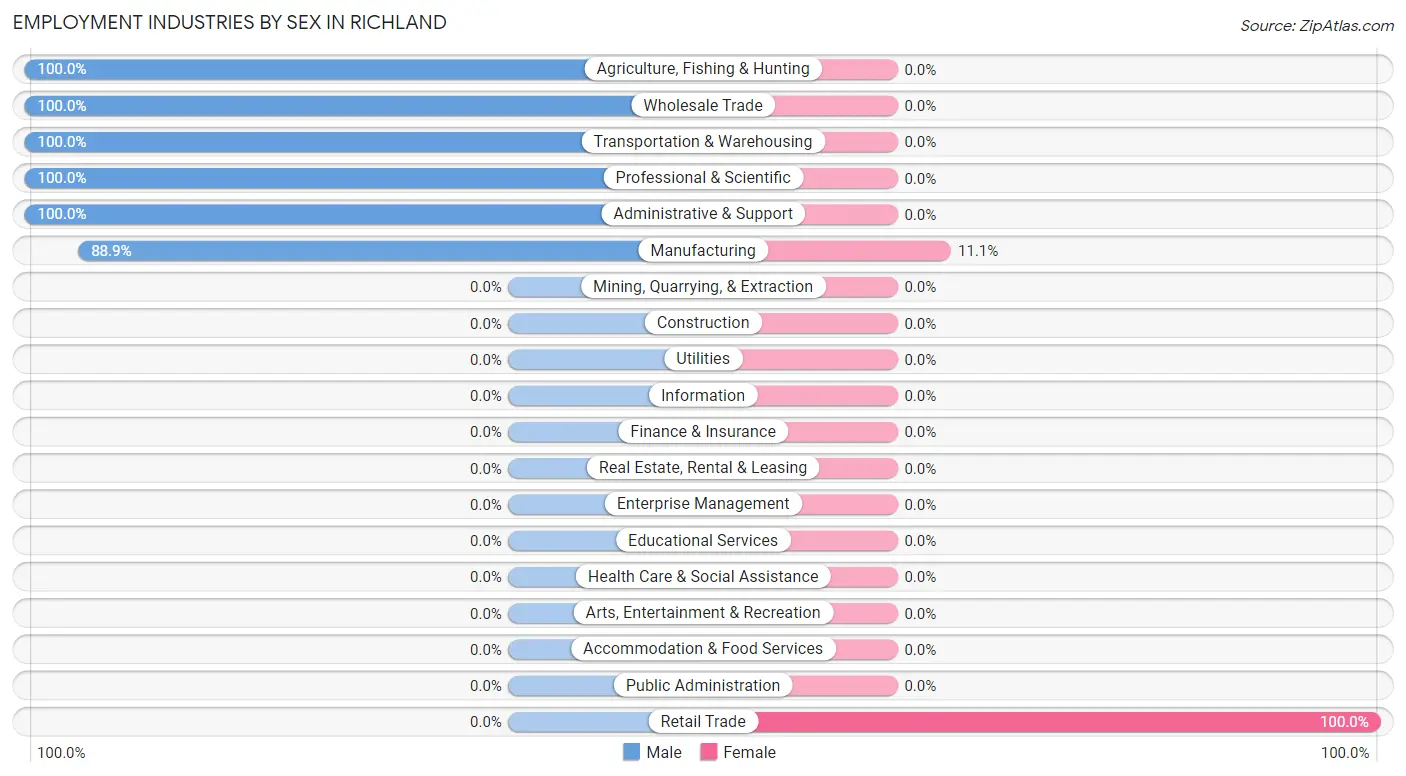
Employment Industries by Sex in Richland
The Richland industries that see more men than women are Agriculture, Fishing & Hunting (100.0%), Wholesale Trade (100.0%), and Transportation & Warehousing (100.0%), whereas the industries that tend to have a higher number of women are Retail Trade (100.0%), and Manufacturing (11.1%).
| Industry | Male | Female |
| Agriculture, Fishing & Hunting | 1 (100.0%) | 0 (0.0%) |
| Mining, Quarrying, & Extraction | 0 (0.0%) | 0 (0.0%) |
| Construction | 0 (0.0%) | 0 (0.0%) |
| Manufacturing | 8 (88.9%) | 1 (11.1%) |
| Wholesale Trade | 2 (100.0%) | 0 (0.0%) |
| Retail Trade | 0 (0.0%) | 3 (100.0%) |
| Transportation & Warehousing | 2 (100.0%) | 0 (0.0%) |
| Utilities | 0 (0.0%) | 0 (0.0%) |
| Information | 0 (0.0%) | 0 (0.0%) |
| Finance & Insurance | 0 (0.0%) | 0 (0.0%) |
| Real Estate, Rental & Leasing | 0 (0.0%) | 0 (0.0%) |
| Professional & Scientific | 1 (100.0%) | 0 (0.0%) |
| Enterprise Management | 0 (0.0%) | 0 (0.0%) |
| Administrative & Support | 1 (100.0%) | 0 (0.0%) |
| Educational Services | 0 (0.0%) | 0 (0.0%) |
| Health Care & Social Assistance | 0 (0.0%) | 0 (0.0%) |
| Arts, Entertainment & Recreation | 0 (0.0%) | 0 (0.0%) |
| Accommodation & Food Services | 0 (0.0%) | 0 (0.0%) |
| Public Administration | 0 (0.0%) | 0 (0.0%) |
| Total | 15 (78.9%) | 4 (21.0%) |
Education in Richland
School Enrollment in Richland
The most common levels of schooling among the 14 students in Richland are high school (8 | 57.1%), college / undergraduate (3 | 21.4%), and middle school (2 | 14.3%).
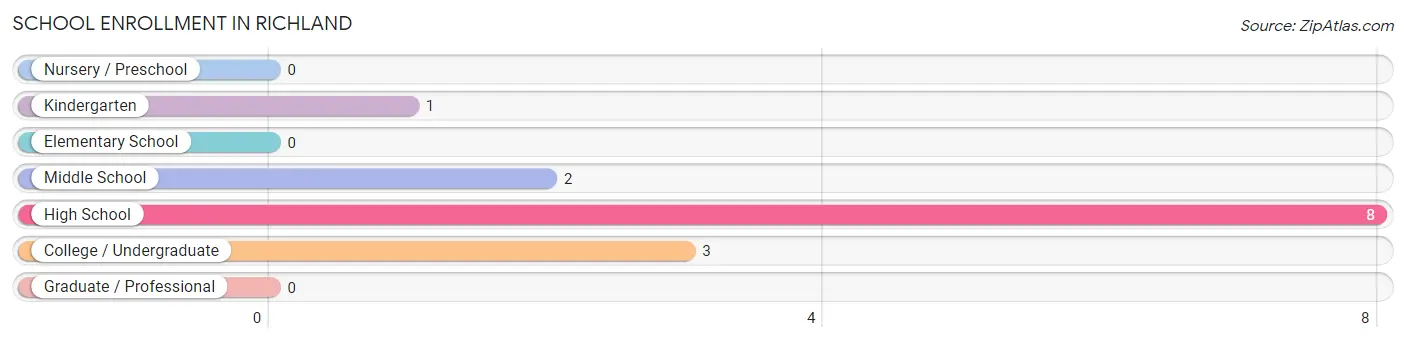
| School Level | # Students | % Students |
| Nursery / Preschool | 0 | 0.0% |
| Kindergarten | 1 | 7.1% |
| Elementary School | 0 | 0.0% |
| Middle School | 2 | 14.3% |
| High School | 8 | 57.1% |
| College / Undergraduate | 3 | 21.4% |
| Graduate / Professional | 0 | 0.0% |
| Total | 14 | 100.0% |
School Enrollment by Age by Funding Source in Richland
Out of a total of 14 students who are enrolled in schools in Richland, 8 (57.1%) attend a private institution, while the remaining 6 (42.9%) are enrolled in public schools. The age group of 5 to 9 year old has the highest likelihood of being enrolled in private schools, with 1 (100.0% in the age bracket) enrolled. Conversely, the age group of 20 to 24 year olds has the lowest likelihood of being enrolled in a private school, with 2 (100.0% in the age bracket) attending a public institution.
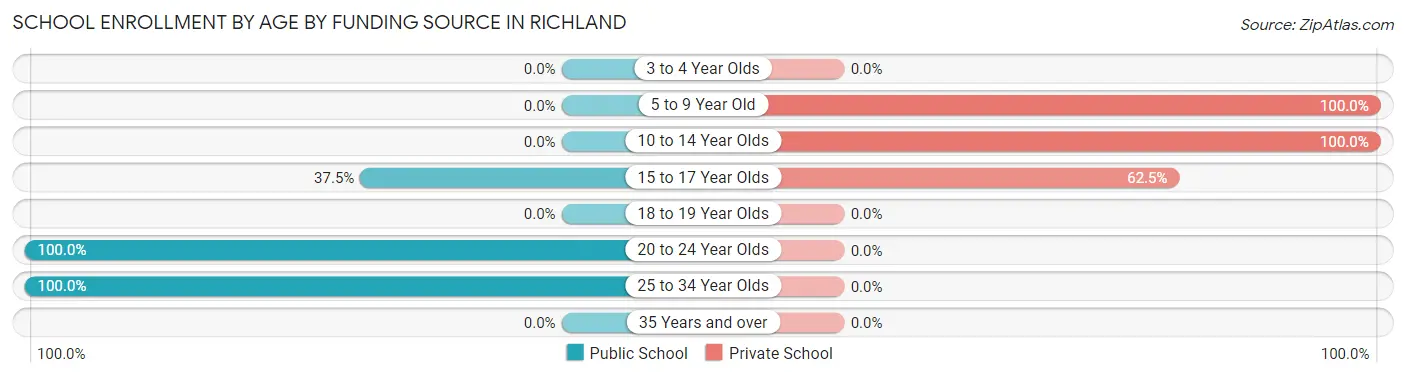
| Age Bracket | Public School | Private School |
| 3 to 4 Year Olds | 0 (0.0%) | 0 (0.0%) |
| 5 to 9 Year Old | 0 (0.0%) | 1 (100.0%) |
| 10 to 14 Year Olds | 0 (0.0%) | 2 (100.0%) |
| 15 to 17 Year Olds | 3 (37.5%) | 5 (62.5%) |
| 18 to 19 Year Olds | 0 (0.0%) | 0 (0.0%) |
| 20 to 24 Year Olds | 2 (100.0%) | 0 (0.0%) |
| 25 to 34 Year Olds | 1 (100.0%) | 0 (0.0%) |
| 35 Years and over | 0 (0.0%) | 0 (0.0%) |
| Total | 6 (42.9%) | 8 (57.1%) |
Educational Attainment by Field of Study in Richland
Business (2 | 50.0%), and education (2 | 50.0%) are the most common fields of study among 4 individuals in Richland who have obtained a bachelor's degree or higher.
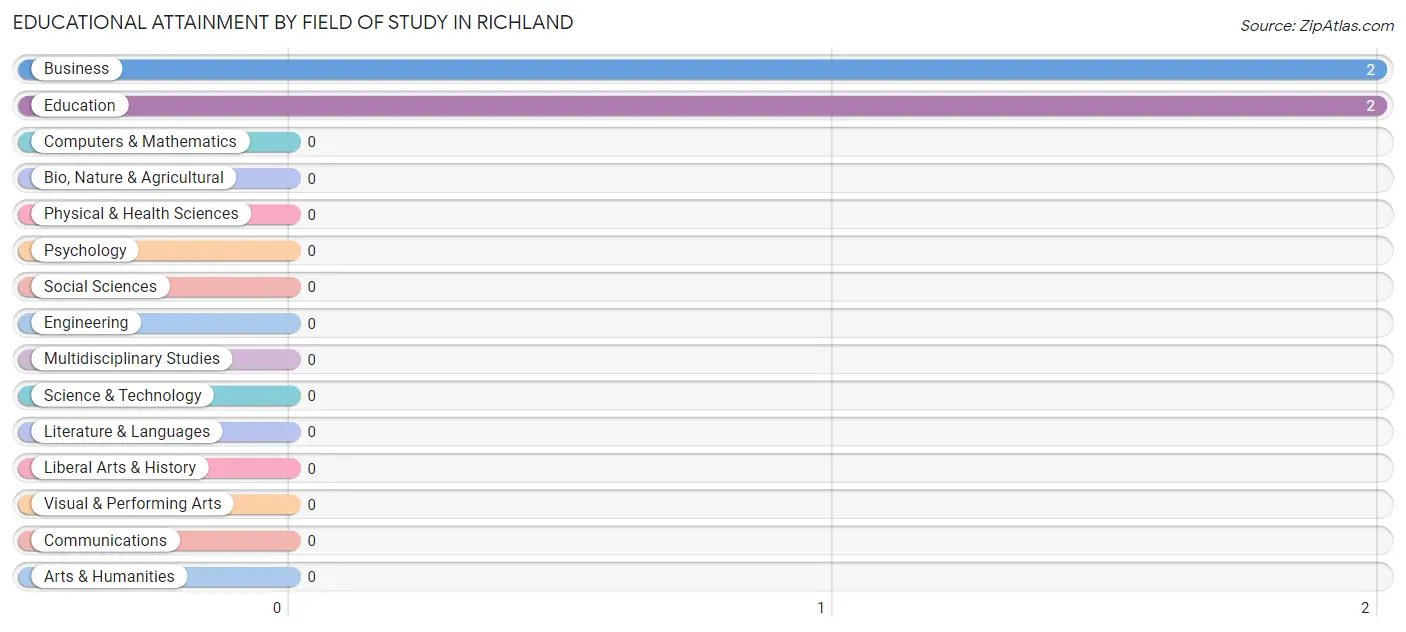
| Field of Study | # Graduates | % Graduates |
| Computers & Mathematics | 0 | 0.0% |
| Bio, Nature & Agricultural | 0 | 0.0% |
| Physical & Health Sciences | 0 | 0.0% |
| Psychology | 0 | 0.0% |
| Social Sciences | 0 | 0.0% |
| Engineering | 0 | 0.0% |
| Multidisciplinary Studies | 0 | 0.0% |
| Science & Technology | 0 | 0.0% |
| Business | 2 | 50.0% |
| Education | 2 | 50.0% |
| Literature & Languages | 0 | 0.0% |
| Liberal Arts & History | 0 | 0.0% |
| Visual & Performing Arts | 0 | 0.0% |
| Communications | 0 | 0.0% |
| Arts & Humanities | 0 | 0.0% |
| Total | 4 | 100.0% |
Transportation & Commute in Richland
Vehicle Availability by Sex in Richland
The most prevalent vehicle ownership categories in Richland are males with 1 vehicle (7, accounting for 46.7%) and females with 1 vehicle (0, making up 175.0%).
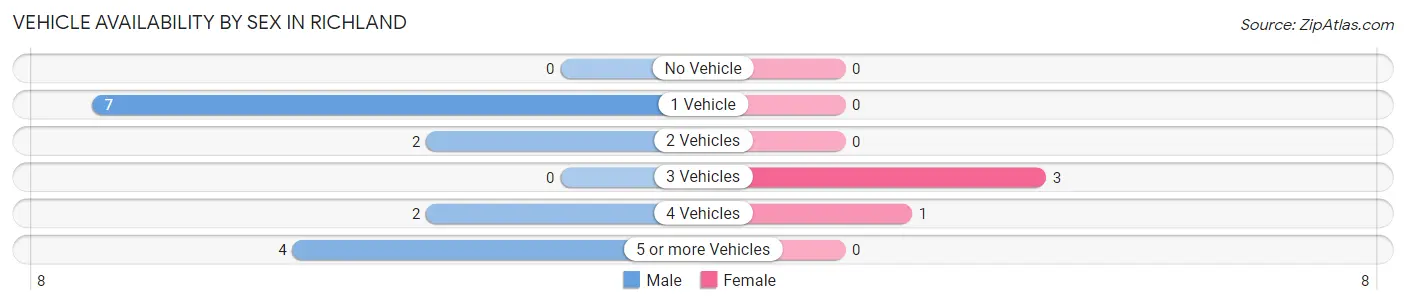
| Vehicles Available | Male | Female |
| No Vehicle | 0 (0.0%) | 0 (0.0%) |
| 1 Vehicle | 7 (46.7%) | 0 (0.0%) |
| 2 Vehicles | 2 (13.3%) | 0 (0.0%) |
| 3 Vehicles | 0 (0.0%) | 3 (75.0%) |
| 4 Vehicles | 2 (13.3%) | 1 (25.0%) |
| 5 or more Vehicles | 4 (26.7%) | 0 (0.0%) |
| Total | 15 (100.0%) | 4 (100.0%) |
Commute Time in Richland
The most frequently occuring commute durations in Richland are 5 to 9 minutes (8 commuters, 42.1%), 15 to 19 minutes (4 commuters, 21.0%), and 10 to 14 minutes (3 commuters, 15.8%).
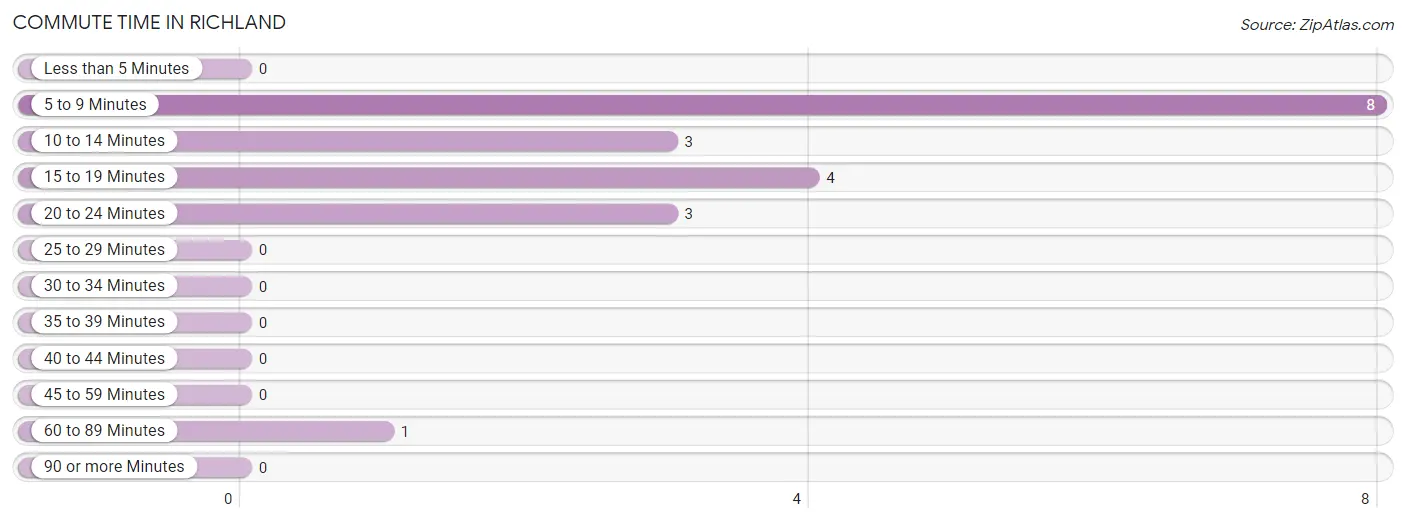
| Commute Time | # Commuters | % Commuters |
| Less than 5 Minutes | 0 | 0.0% |
| 5 to 9 Minutes | 8 | 42.1% |
| 10 to 14 Minutes | 3 | 15.8% |
| 15 to 19 Minutes | 4 | 21.0% |
| 20 to 24 Minutes | 3 | 15.8% |
| 25 to 29 Minutes | 0 | 0.0% |
| 30 to 34 Minutes | 0 | 0.0% |
| 35 to 39 Minutes | 0 | 0.0% |
| 40 to 44 Minutes | 0 | 0.0% |
| 45 to 59 Minutes | 0 | 0.0% |
| 60 to 89 Minutes | 1 | 5.3% |
| 90 or more Minutes | 0 | 0.0% |
Commute Time by Sex in Richland
The most common commute times in Richland are 5 to 9 minutes (8 commuters, 53.3%) for males and 20 to 24 minutes (3 commuters, 75.0%) for females.
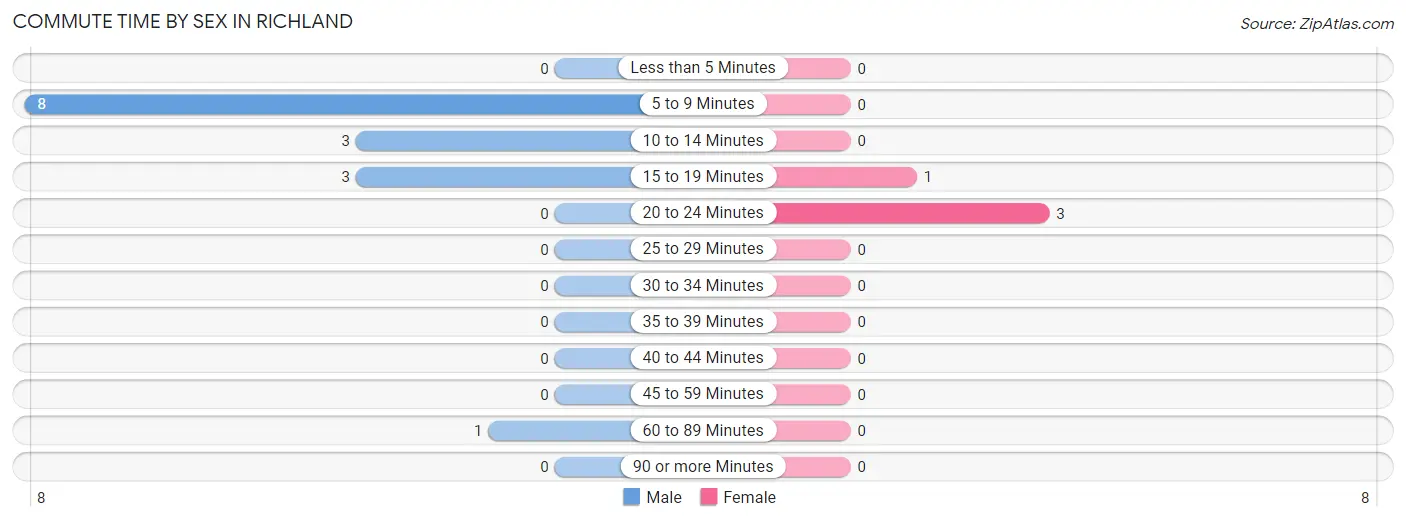
| Commute Time | Male | Female |
| Less than 5 Minutes | 0 (0.0%) | 0 (0.0%) |
| 5 to 9 Minutes | 8 (53.3%) | 0 (0.0%) |
| 10 to 14 Minutes | 3 (20.0%) | 0 (0.0%) |
| 15 to 19 Minutes | 3 (20.0%) | 1 (25.0%) |
| 20 to 24 Minutes | 0 (0.0%) | 3 (75.0%) |
| 25 to 29 Minutes | 0 (0.0%) | 0 (0.0%) |
| 30 to 34 Minutes | 0 (0.0%) | 0 (0.0%) |
| 35 to 39 Minutes | 0 (0.0%) | 0 (0.0%) |
| 40 to 44 Minutes | 0 (0.0%) | 0 (0.0%) |
| 45 to 59 Minutes | 0 (0.0%) | 0 (0.0%) |
| 60 to 89 Minutes | 1 (6.7%) | 0 (0.0%) |
| 90 or more Minutes | 0 (0.0%) | 0 (0.0%) |
Time of Departure to Work by Sex in Richland
The most frequent times of departure to work in Richland are 12:00 AM to 4:59 AM (6, 40.0%) for males and 7:30 AM to 7:59 AM (3, 75.0%) for females.
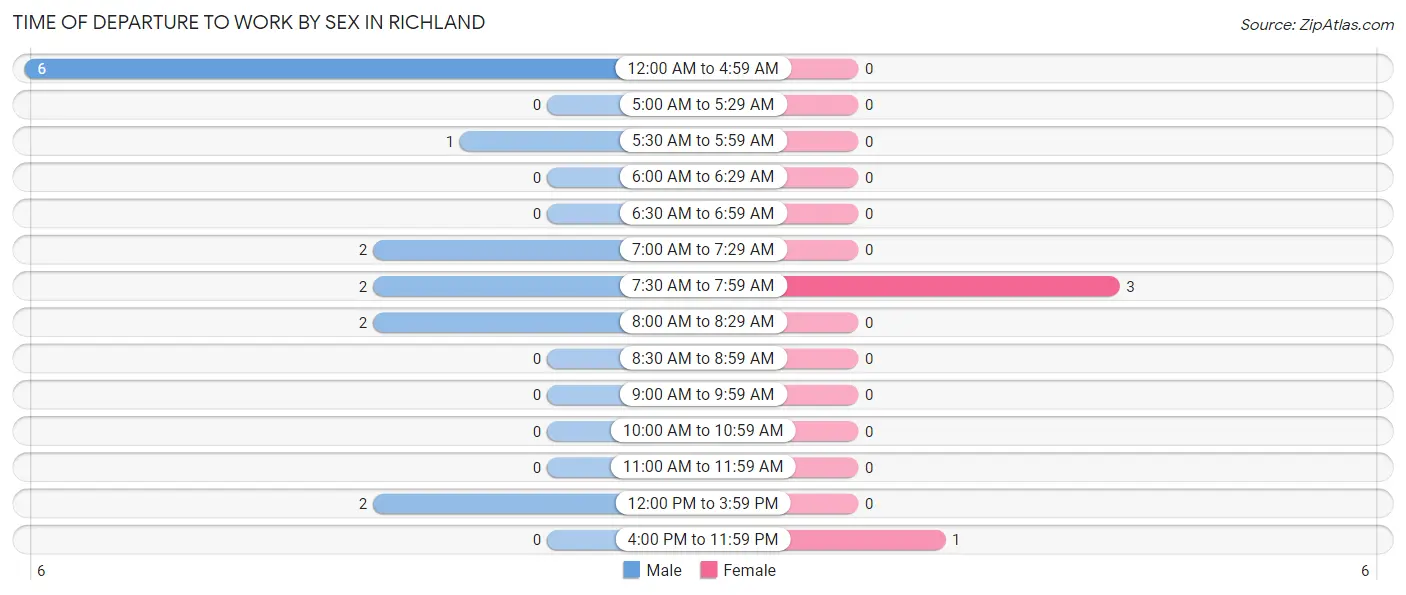
| Time of Departure | Male | Female |
| 12:00 AM to 4:59 AM | 6 (40.0%) | 0 (0.0%) |
| 5:00 AM to 5:29 AM | 0 (0.0%) | 0 (0.0%) |
| 5:30 AM to 5:59 AM | 1 (6.7%) | 0 (0.0%) |
| 6:00 AM to 6:29 AM | 0 (0.0%) | 0 (0.0%) |
| 6:30 AM to 6:59 AM | 0 (0.0%) | 0 (0.0%) |
| 7:00 AM to 7:29 AM | 2 (13.3%) | 0 (0.0%) |
| 7:30 AM to 7:59 AM | 2 (13.3%) | 3 (75.0%) |
| 8:00 AM to 8:29 AM | 2 (13.3%) | 0 (0.0%) |
| 8:30 AM to 8:59 AM | 0 (0.0%) | 0 (0.0%) |
| 9:00 AM to 9:59 AM | 0 (0.0%) | 0 (0.0%) |
| 10:00 AM to 10:59 AM | 0 (0.0%) | 0 (0.0%) |
| 11:00 AM to 11:59 AM | 0 (0.0%) | 0 (0.0%) |
| 12:00 PM to 3:59 PM | 2 (13.3%) | 0 (0.0%) |
| 4:00 PM to 11:59 PM | 0 (0.0%) | 1 (25.0%) |
| Total | 15 (100.0%) | 4 (100.0%) |
Housing Occupancy in Richland
Occupancy by Ownership in Richland
Of the total 28 dwellings in Richland, owner-occupied units account for 20 (71.4%), while renter-occupied units make up 8 (28.6%).
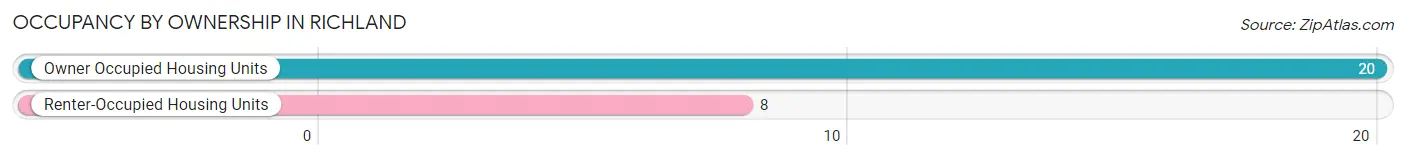
| Occupancy | # Housing Units | % Housing Units |
| Owner Occupied Housing Units | 20 | 71.4% |
| Renter-Occupied Housing Units | 8 | 28.6% |
| Total Occupied Housing Units | 28 | 100.0% |
Occupancy by Household Size in Richland
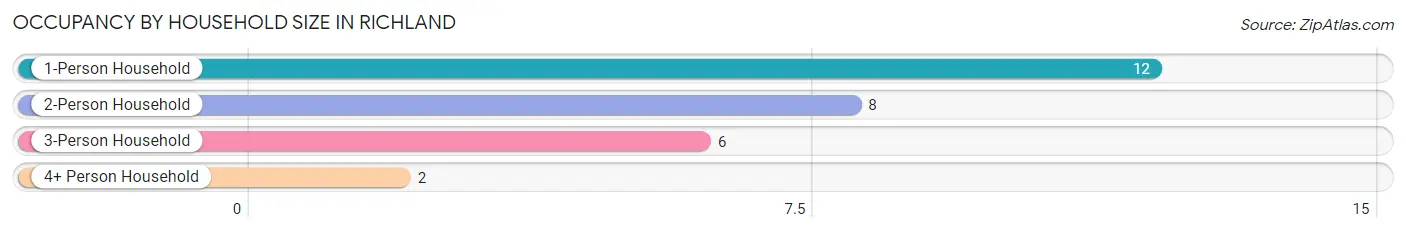
| Household Size | # Housing Units | % Housing Units |
| 1-Person Household | 12 | 42.9% |
| 2-Person Household | 8 | 28.6% |
| 3-Person Household | 6 | 21.4% |
| 4+ Person Household | 2 | 7.1% |
| Total Housing Units | 28 | 100.0% |
Occupancy by Ownership by Household Size in Richland
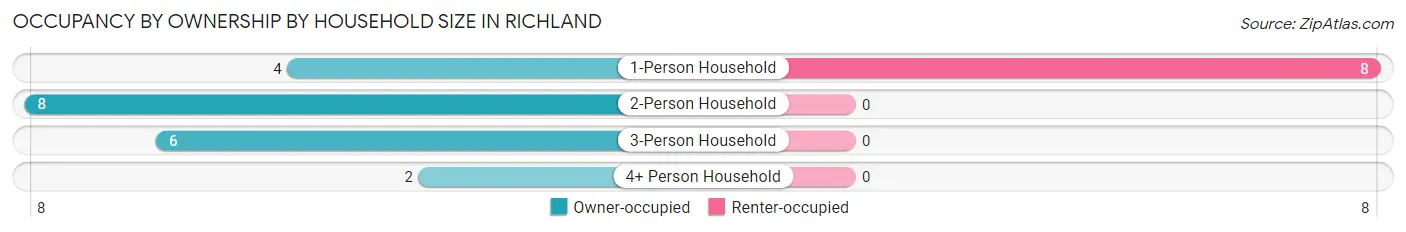
| Household Size | Owner-occupied | Renter-occupied |
| 1-Person Household | 4 (33.3%) | 8 (66.7%) |
| 2-Person Household | 8 (100.0%) | 0 (0.0%) |
| 3-Person Household | 6 (100.0%) | 0 (0.0%) |
| 4+ Person Household | 2 (100.0%) | 0 (0.0%) |
| Total Housing Units | 20 (71.4%) | 8 (28.6%) |
Occupancy by Educational Attainment in Richland
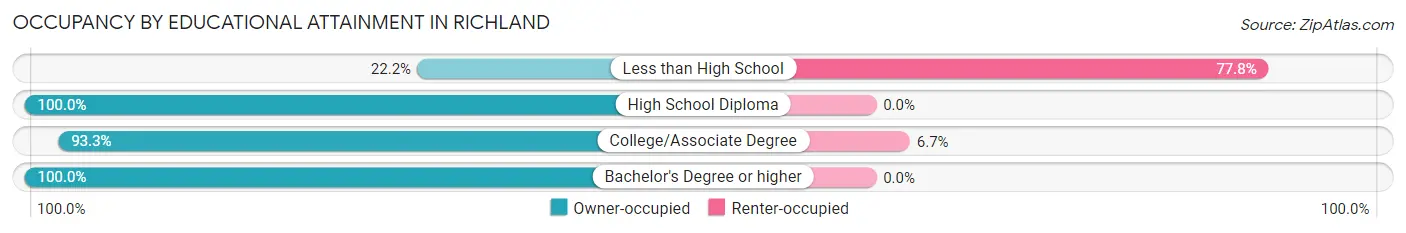
| Household Size | Owner-occupied | Renter-occupied |
| Less than High School | 2 (22.2%) | 7 (77.8%) |
| High School Diploma | 2 (100.0%) | 0 (0.0%) |
| College/Associate Degree | 14 (93.3%) | 1 (6.7%) |
| Bachelor's Degree or higher | 2 (100.0%) | 0 (0.0%) |
Occupancy by Age of Householder in Richland
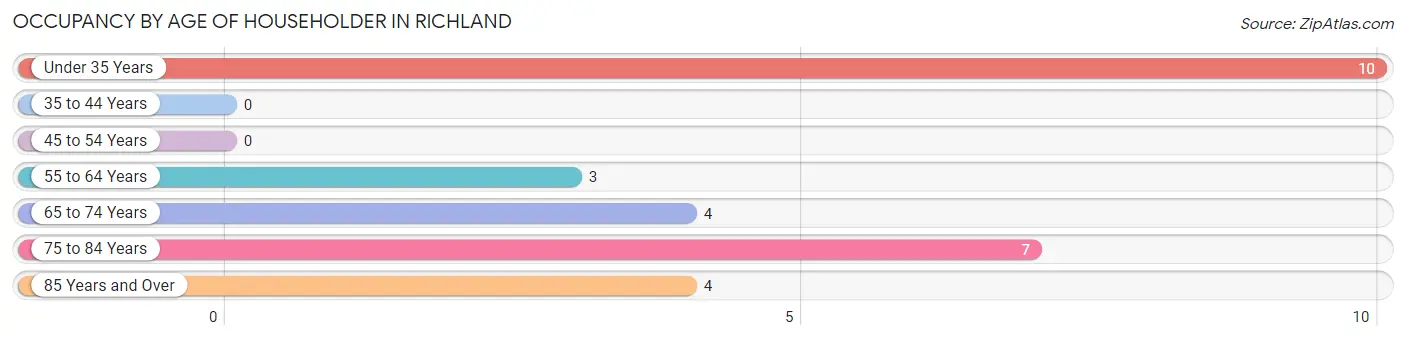
| Age Bracket | # Households | % Households |
| Under 35 Years | 10 | 35.7% |
| 35 to 44 Years | 0 | 0.0% |
| 45 to 54 Years | 0 | 0.0% |
| 55 to 64 Years | 3 | 10.7% |
| 65 to 74 Years | 4 | 14.3% |
| 75 to 84 Years | 7 | 25.0% |
| 85 Years and Over | 4 | 14.3% |
| Total | 28 | 100.0% |
Housing Finances in Richland
Median Income by Occupancy in Richland
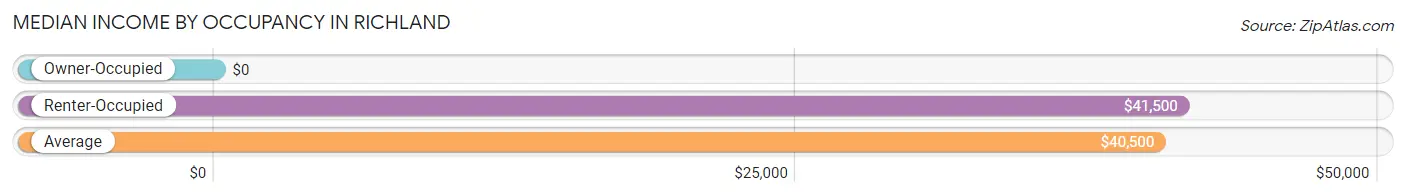
| Occupancy Type | # Households | Median Income |
| Owner-Occupied | 20 (71.4%) | $0 |
| Renter-Occupied | 8 (28.6%) | $41,500 |
| Average | 28 (100.0%) | $40,500 |
Occupancy by Householder Income Bracket in Richland
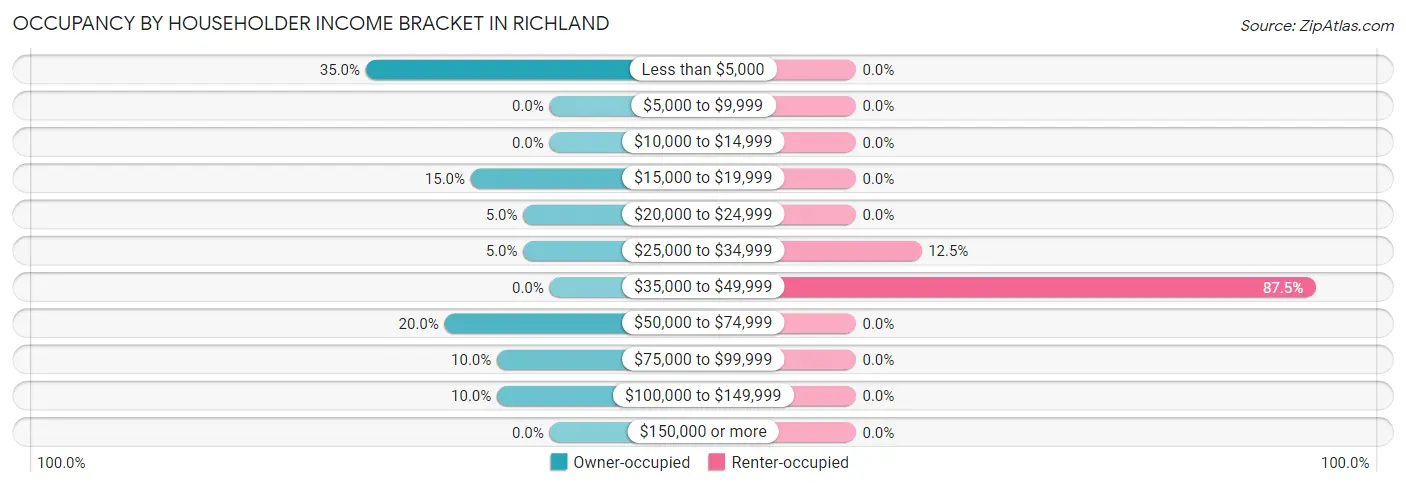
| Income Bracket | Owner-occupied | Renter-occupied |
| Less than $5,000 | 7 (35.0%) | 0 (0.0%) |
| $5,000 to $9,999 | 0 (0.0%) | 0 (0.0%) |
| $10,000 to $14,999 | 0 (0.0%) | 0 (0.0%) |
| $15,000 to $19,999 | 3 (15.0%) | 0 (0.0%) |
| $20,000 to $24,999 | 1 (5.0%) | 0 (0.0%) |
| $25,000 to $34,999 | 1 (5.0%) | 1 (12.5%) |
| $35,000 to $49,999 | 0 (0.0%) | 7 (87.5%) |
| $50,000 to $74,999 | 4 (20.0%) | 0 (0.0%) |
| $75,000 to $99,999 | 2 (10.0%) | 0 (0.0%) |
| $100,000 to $149,999 | 2 (10.0%) | 0 (0.0%) |
| $150,000 or more | 0 (0.0%) | 0 (0.0%) |
| Total | 20 (100.0%) | 8 (100.0%) |
Monthly Housing Cost Tiers in Richland
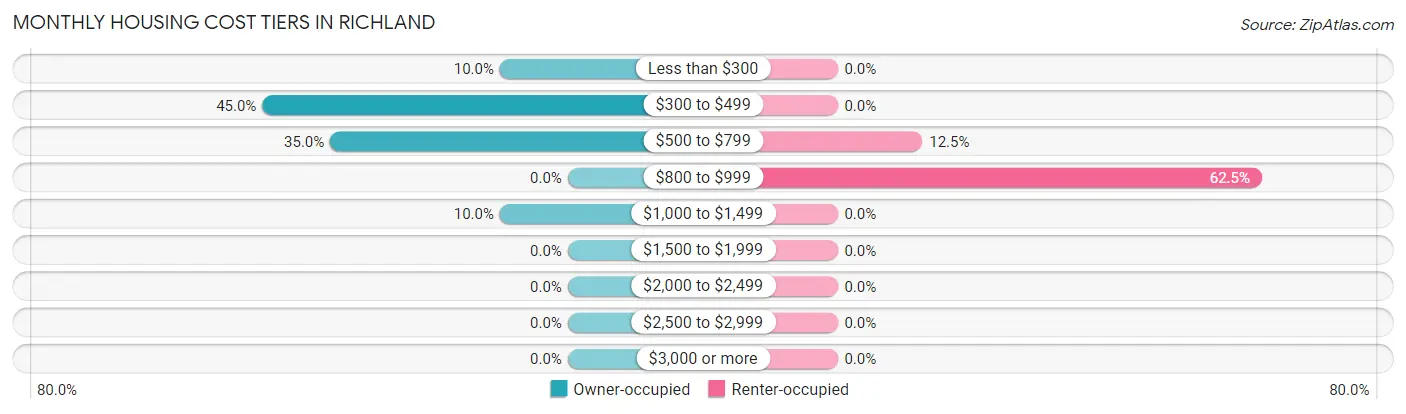
| Monthly Cost | Owner-occupied | Renter-occupied |
| Less than $300 | 2 (10.0%) | 0 (0.0%) |
| $300 to $499 | 9 (45.0%) | 0 (0.0%) |
| $500 to $799 | 7 (35.0%) | 1 (12.5%) |
| $800 to $999 | 0 (0.0%) | 5 (62.5%) |
| $1,000 to $1,499 | 2 (10.0%) | 0 (0.0%) |
| $1,500 to $1,999 | 0 (0.0%) | 0 (0.0%) |
| $2,000 to $2,499 | 0 (0.0%) | 0 (0.0%) |
| $2,500 to $2,999 | 0 (0.0%) | 0 (0.0%) |
| $3,000 or more | 0 (0.0%) | 0 (0.0%) |
| Total | 20 (100.0%) | 8 (100.0%) |
Physical Housing Characteristics in Richland
Housing Structures in Richland
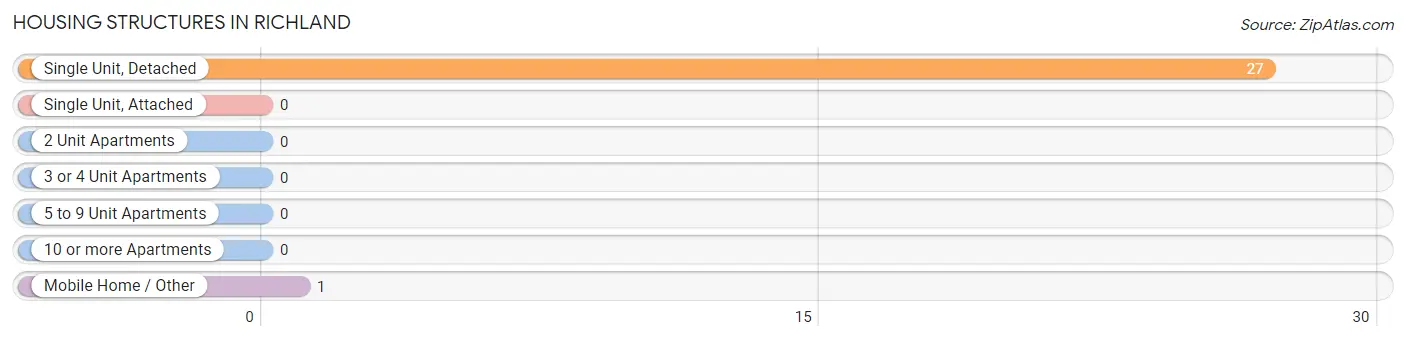
| Structure Type | # Housing Units | % Housing Units |
| Single Unit, Detached | 27 | 96.4% |
| Single Unit, Attached | 0 | 0.0% |
| 2 Unit Apartments | 0 | 0.0% |
| 3 or 4 Unit Apartments | 0 | 0.0% |
| 5 to 9 Unit Apartments | 0 | 0.0% |
| 10 or more Apartments | 0 | 0.0% |
| Mobile Home / Other | 1 | 3.6% |
| Total | 28 | 100.0% |
Housing Structures by Occupancy in Richland
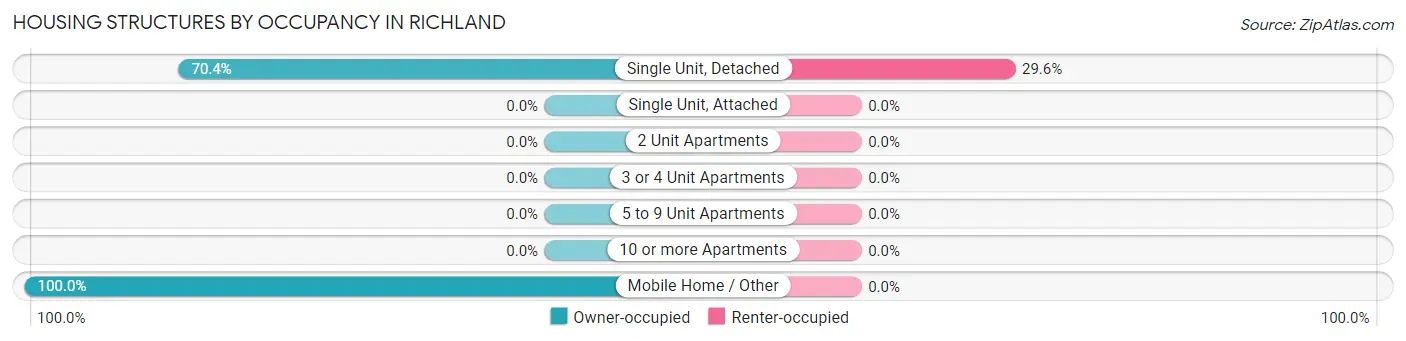
| Structure Type | Owner-occupied | Renter-occupied |
| Single Unit, Detached | 19 (70.4%) | 8 (29.6%) |
| Single Unit, Attached | 0 (0.0%) | 0 (0.0%) |
| 2 Unit Apartments | 0 (0.0%) | 0 (0.0%) |
| 3 or 4 Unit Apartments | 0 (0.0%) | 0 (0.0%) |
| 5 to 9 Unit Apartments | 0 (0.0%) | 0 (0.0%) |
| 10 or more Apartments | 0 (0.0%) | 0 (0.0%) |
| Mobile Home / Other | 1 (100.0%) | 0 (0.0%) |
| Total | 20 (71.4%) | 8 (28.6%) |
Housing Structures by Number of Rooms in Richland
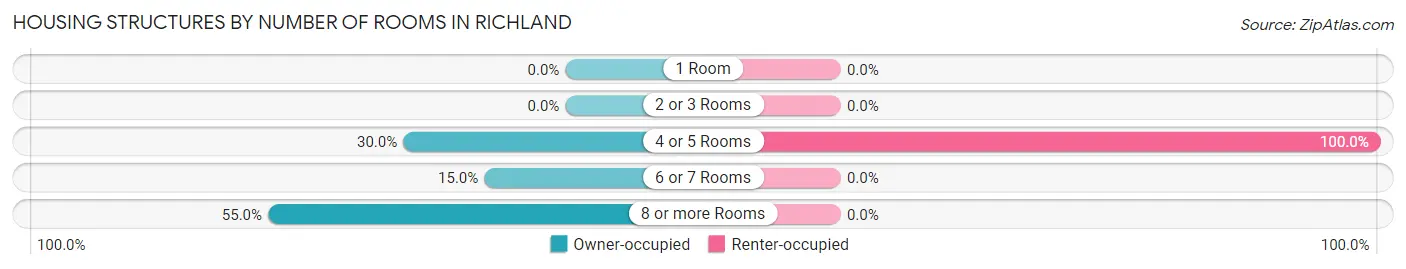
| Number of Rooms | Owner-occupied | Renter-occupied |
| 1 Room | 0 (0.0%) | 0 (0.0%) |
| 2 or 3 Rooms | 0 (0.0%) | 0 (0.0%) |
| 4 or 5 Rooms | 6 (30.0%) | 8 (100.0%) |
| 6 or 7 Rooms | 3 (15.0%) | 0 (0.0%) |
| 8 or more Rooms | 11 (55.0%) | 0 (0.0%) |
| Total | 20 (100.0%) | 8 (100.0%) |
Housing Structure by Heating Type in Richland
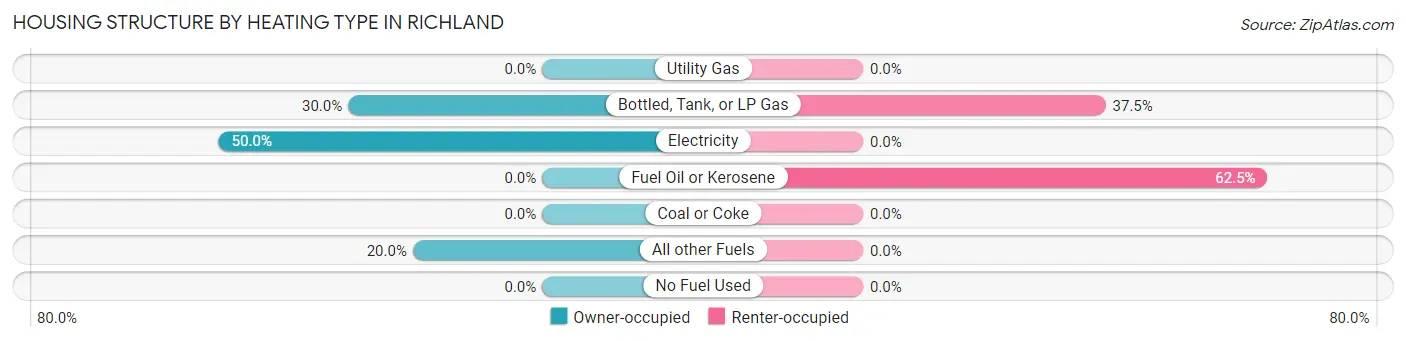
| Heating Type | Owner-occupied | Renter-occupied |
| Utility Gas | 0 (0.0%) | 0 (0.0%) |
| Bottled, Tank, or LP Gas | 6 (30.0%) | 3 (37.5%) |
| Electricity | 10 (50.0%) | 0 (0.0%) |
| Fuel Oil or Kerosene | 0 (0.0%) | 5 (62.5%) |
| Coal or Coke | 0 (0.0%) | 0 (0.0%) |
| All other Fuels | 4 (20.0%) | 0 (0.0%) |
| No Fuel Used | 0 (0.0%) | 0 (0.0%) |
| Total | 20 (100.0%) | 8 (100.0%) |
Household Vehicle Usage in Richland
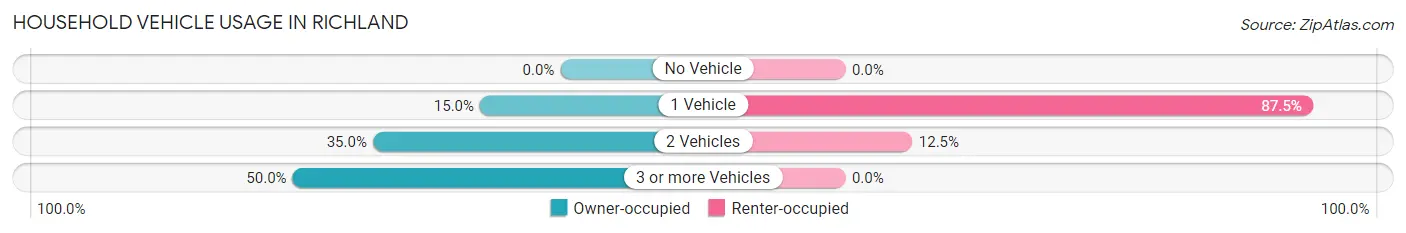
| Vehicles per Household | Owner-occupied | Renter-occupied |
| No Vehicle | 0 (0.0%) | 0 (0.0%) |
| 1 Vehicle | 3 (15.0%) | 7 (87.5%) |
| 2 Vehicles | 7 (35.0%) | 1 (12.5%) |
| 3 or more Vehicles | 10 (50.0%) | 0 (0.0%) |
| Total | 20 (100.0%) | 8 (100.0%) |
Real Estate & Mortgages in Richland
Real Estate and Mortgage Overview in Richland
| Characteristic | Without Mortgage | With Mortgage |
| Housing Units | 15 | 5 |
| Median Property Value | $131,900 | $48,300 |
| Median Household Income | - | - |
| Monthly Housing Costs | $417 | $0 |
| Real Estate Taxes | $1,357 | $0 |
Property Value by Mortgage Status in Richland
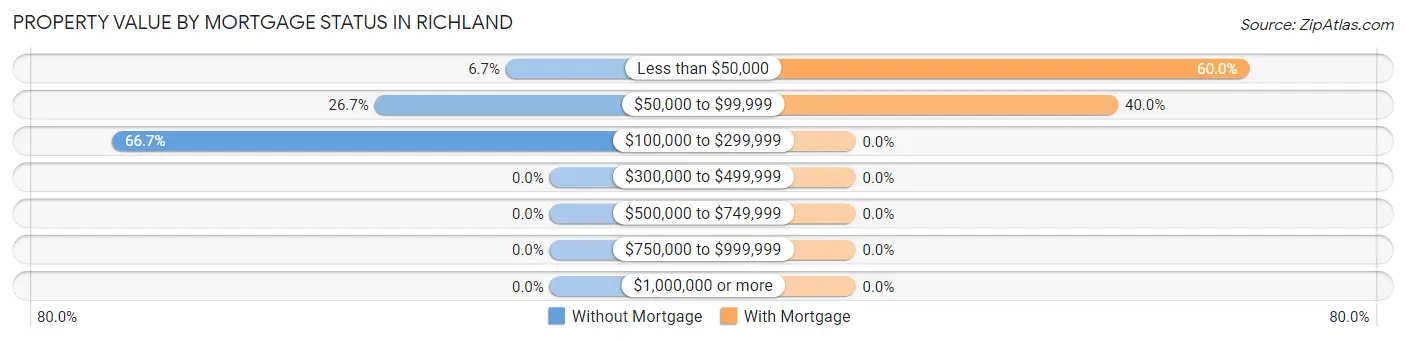
| Property Value | Without Mortgage | With Mortgage |
| Less than $50,000 | 1 (6.7%) | 3 (60.0%) |
| $50,000 to $99,999 | 4 (26.7%) | 2 (40.0%) |
| $100,000 to $299,999 | 10 (66.7%) | 0 (0.0%) |
| $300,000 to $499,999 | 0 (0.0%) | 0 (0.0%) |
| $500,000 to $749,999 | 0 (0.0%) | 0 (0.0%) |
| $750,000 to $999,999 | 0 (0.0%) | 0 (0.0%) |
| $1,000,000 or more | 0 (0.0%) | 0 (0.0%) |
| Total | 15 (100.0%) | 5 (100.0%) |
Household Income by Mortgage Status in Richland
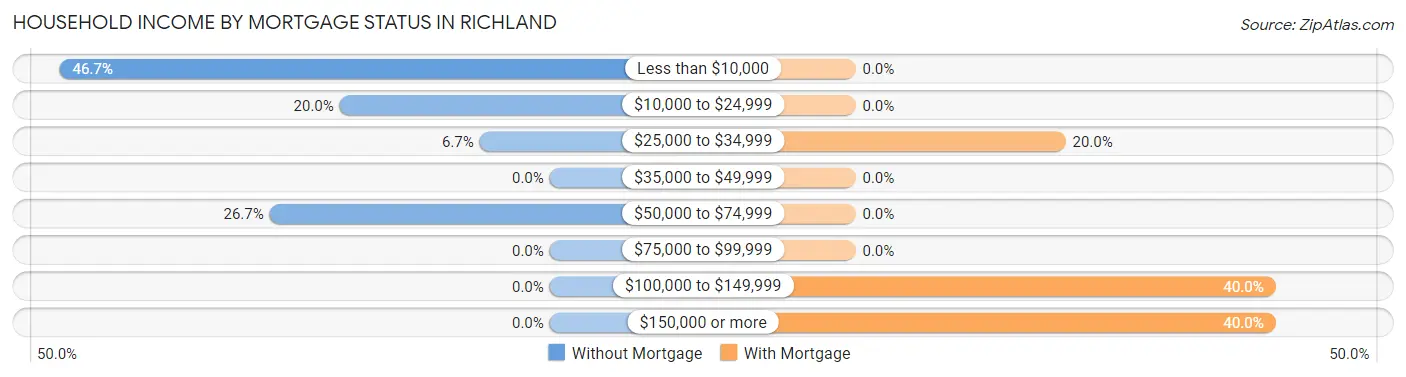
| Household Income | Without Mortgage | With Mortgage |
| Less than $10,000 | 7 (46.7%) | 0 (0.0%) |
| $10,000 to $24,999 | 3 (20.0%) | 0 (0.0%) |
| $25,000 to $34,999 | 1 (6.7%) | 1 (20.0%) |
| $35,000 to $49,999 | 0 (0.0%) | 0 (0.0%) |
| $50,000 to $74,999 | 4 (26.7%) | 0 (0.0%) |
| $75,000 to $99,999 | 0 (0.0%) | 0 (0.0%) |
| $100,000 to $149,999 | 0 (0.0%) | 2 (40.0%) |
| $150,000 or more | 0 (0.0%) | 2 (40.0%) |
| Total | 15 (100.0%) | 5 (100.0%) |
Property Value to Household Income Ratio in Richland
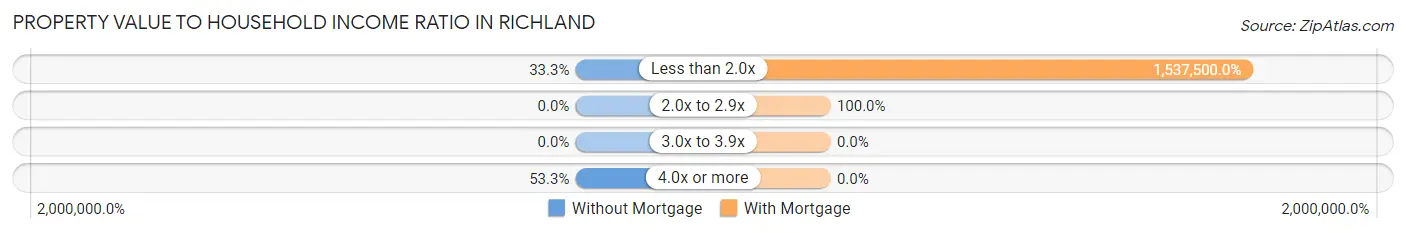
| Value-to-Income Ratio | Without Mortgage | With Mortgage |
| Less than 2.0x | 5 (33.3%) | 76,875 (1,537,500.0%) |
| 2.0x to 2.9x | 0 (0.0%) | 5 (100.0%) |
| 3.0x to 3.9x | 0 (0.0%) | 0 (0.0%) |
| 4.0x or more | 8 (53.3%) | 0 (0.0%) |
| Total | 15 (100.0%) | 5 (100.0%) |
Real Estate Taxes by Mortgage Status in Richland
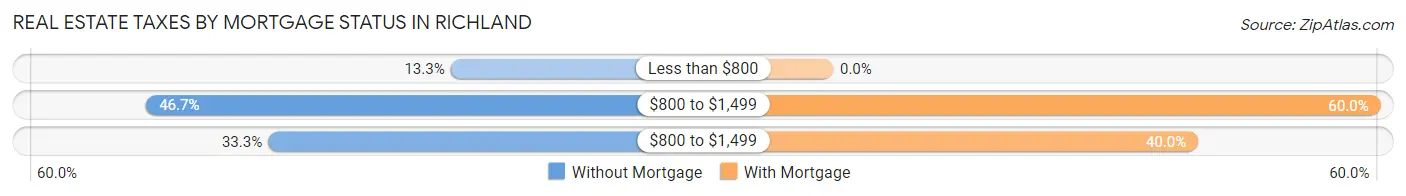
| Property Taxes | Without Mortgage | With Mortgage |
| Less than $800 | 2 (13.3%) | 0 (0.0%) |
| $800 to $1,499 | 7 (46.7%) | 3 (60.0%) |
| $800 to $1,499 | 5 (33.3%) | 2 (40.0%) |
| Total | 15 (100.0%) | 5 (100.0%) |
Health & Disability in Richland
Health Insurance Coverage by Age in Richland
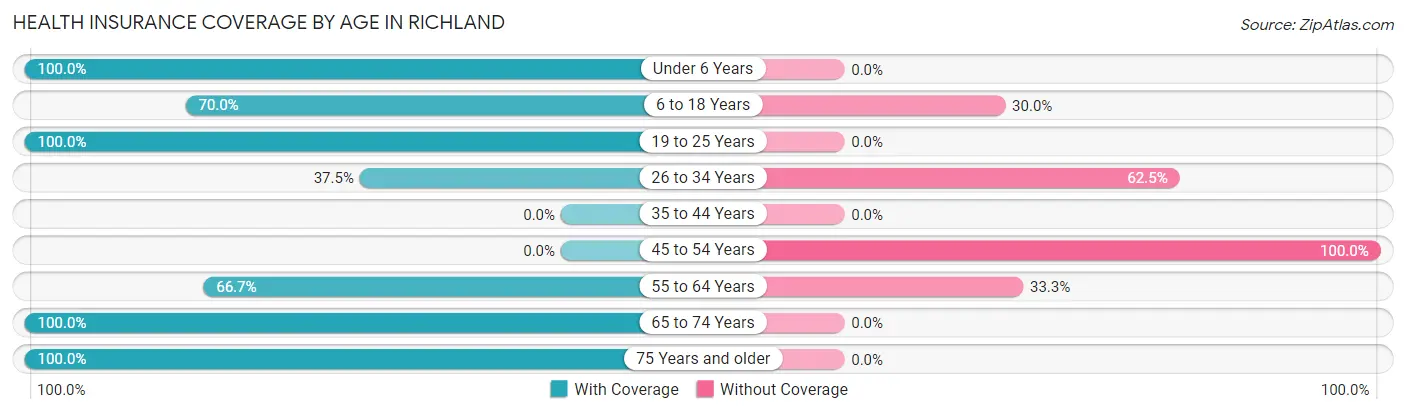
| Age Bracket | With Coverage | Without Coverage |
| Under 6 Years | 2 (100.0%) | 0 (0.0%) |
| 6 to 18 Years | 7 (70.0%) | 3 (30.0%) |
| 19 to 25 Years | 4 (100.0%) | 0 (0.0%) |
| 26 to 34 Years | 3 (37.5%) | 5 (62.5%) |
| 35 to 44 Years | 0 (0.0%) | 0 (0.0%) |
| 45 to 54 Years | 0 (0.0%) | 2 (100.0%) |
| 55 to 64 Years | 2 (66.7%) | 1 (33.3%) |
| 65 to 74 Years | 7 (100.0%) | 0 (0.0%) |
| 75 Years and older | 14 (100.0%) | 0 (0.0%) |
| Total | 39 (78.0%) | 11 (22.0%) |
Health Insurance Coverage by Citizenship Status in Richland
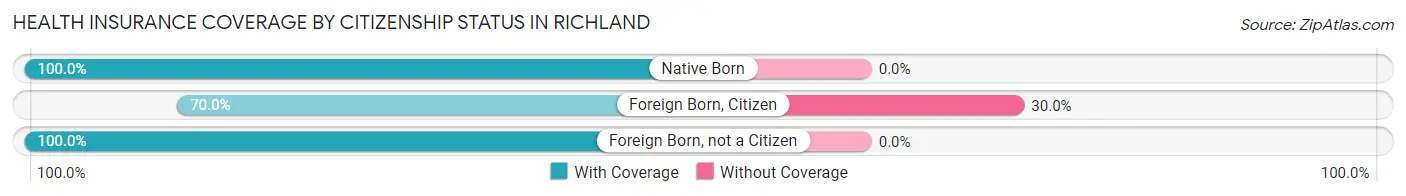
| Citizenship Status | With Coverage | Without Coverage |
| Native Born | 2 (100.0%) | 0 (0.0%) |
| Foreign Born, Citizen | 7 (70.0%) | 3 (30.0%) |
| Foreign Born, not a Citizen | 4 (100.0%) | 0 (0.0%) |
Health Insurance Coverage by Household Income in Richland
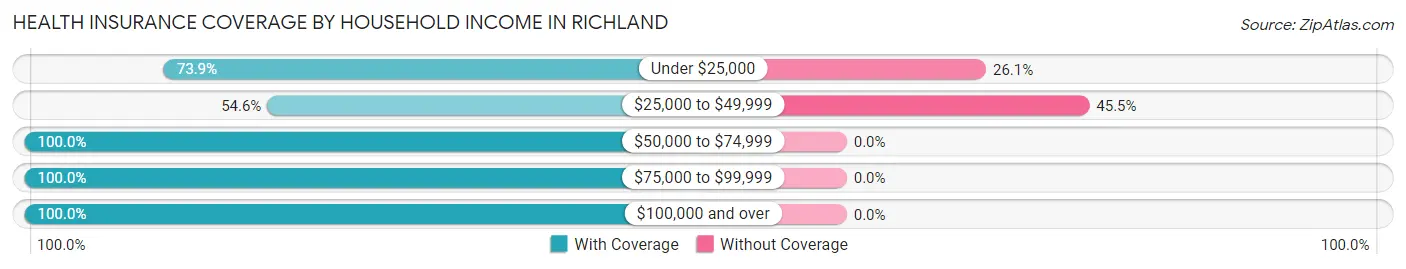
| Household Income | With Coverage | Without Coverage |
| Under $25,000 | 17 (73.9%) | 6 (26.1%) |
| $25,000 to $49,999 | 6 (54.5%) | 5 (45.5%) |
| $50,000 to $74,999 | 6 (100.0%) | 0 (0.0%) |
| $75,000 to $99,999 | 7 (100.0%) | 0 (0.0%) |
| $100,000 and over | 3 (100.0%) | 0 (0.0%) |
Public vs Private Health Insurance Coverage by Age in Richland
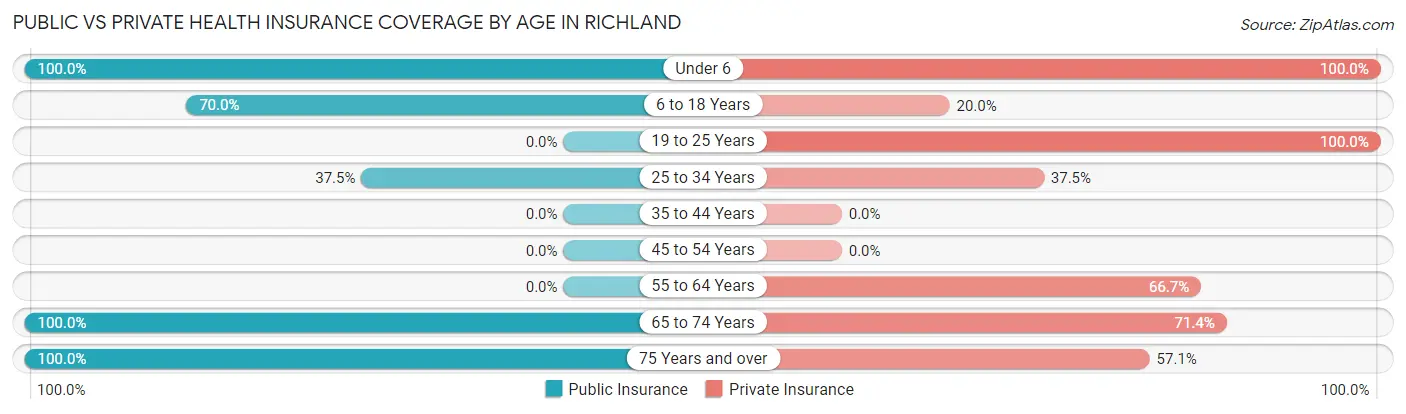
| Age Bracket | Public Insurance | Private Insurance |
| Under 6 | 2 (100.0%) | 2 (100.0%) |
| 6 to 18 Years | 7 (70.0%) | 2 (20.0%) |
| 19 to 25 Years | 0 (0.0%) | 4 (100.0%) |
| 25 to 34 Years | 3 (37.5%) | 3 (37.5%) |
| 35 to 44 Years | 0 (0.0%) | 0 (0.0%) |
| 45 to 54 Years | 0 (0.0%) | 0 (0.0%) |
| 55 to 64 Years | 0 (0.0%) | 2 (66.7%) |
| 65 to 74 Years | 7 (100.0%) | 5 (71.4%) |
| 75 Years and over | 14 (100.0%) | 8 (57.1%) |
| Total | 33 (66.0%) | 26 (52.0%) |
Disability Status by Sex by Age in Richland
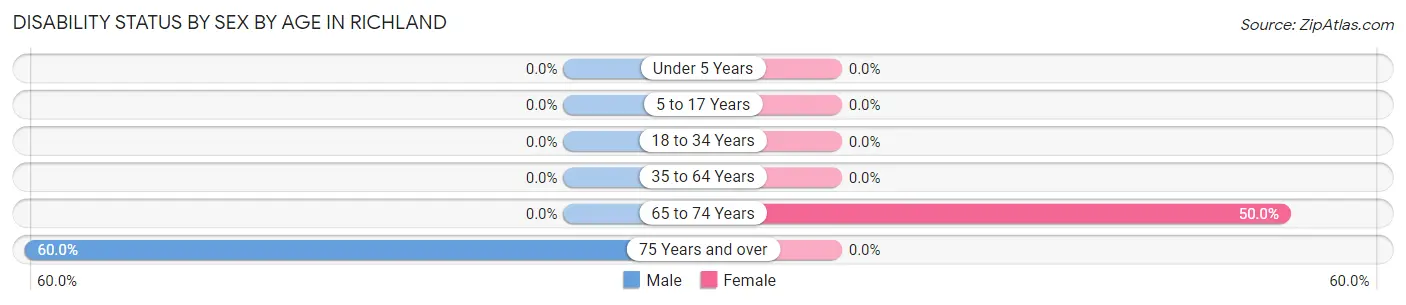
| Age Bracket | Male | Female |
| Under 5 Years | 0 (0.0%) | 0 (0.0%) |
| 5 to 17 Years | 0 (0.0%) | 0 (0.0%) |
| 18 to 34 Years | 0 (0.0%) | 0 (0.0%) |
| 35 to 64 Years | 0 (0.0%) | 0 (0.0%) |
| 65 to 74 Years | 0 (0.0%) | 3 (50.0%) |
| 75 Years and over | 3 (60.0%) | 0 (0.0%) |
Disability Class by Sex by Age in Richland
Disability Class: Hearing Difficulty
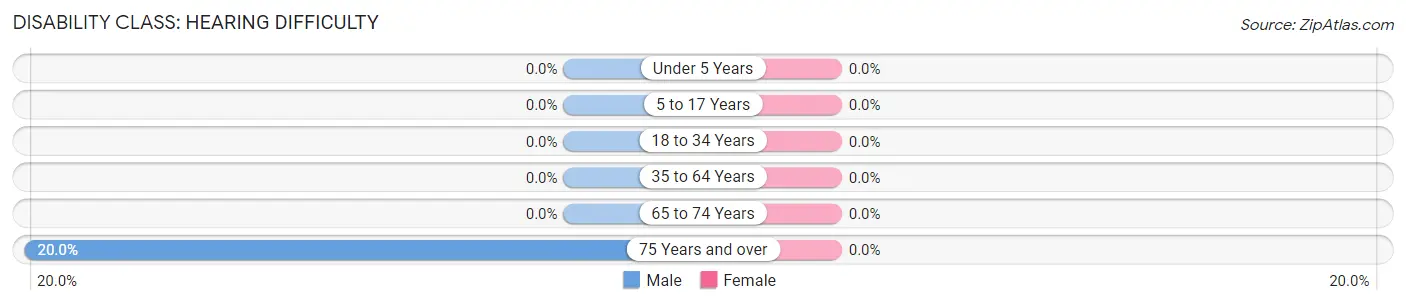
| Age Bracket | Male | Female |
| Under 5 Years | 0 (0.0%) | 0 (0.0%) |
| 5 to 17 Years | 0 (0.0%) | 0 (0.0%) |
| 18 to 34 Years | 0 (0.0%) | 0 (0.0%) |
| 35 to 64 Years | 0 (0.0%) | 0 (0.0%) |
| 65 to 74 Years | 0 (0.0%) | 0 (0.0%) |
| 75 Years and over | 1 (20.0%) | 0 (0.0%) |
Disability Class: Vision Difficulty
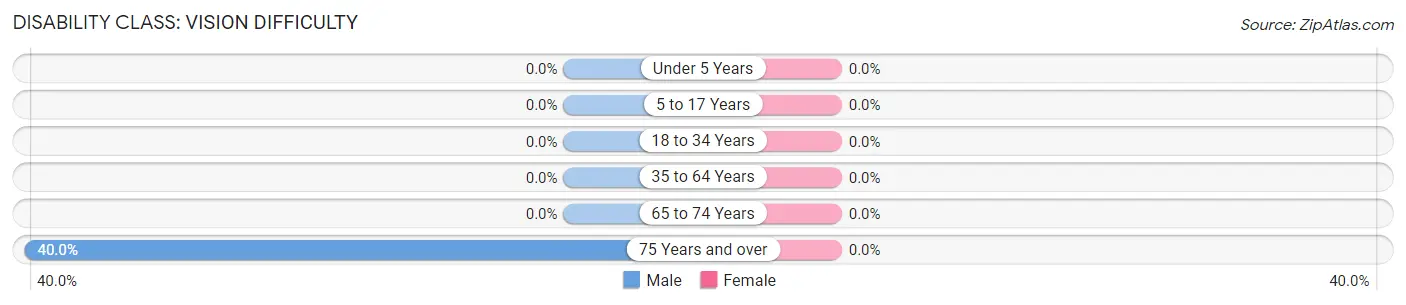
| Age Bracket | Male | Female |
| Under 5 Years | 0 (0.0%) | 0 (0.0%) |
| 5 to 17 Years | 0 (0.0%) | 0 (0.0%) |
| 18 to 34 Years | 0 (0.0%) | 0 (0.0%) |
| 35 to 64 Years | 0 (0.0%) | 0 (0.0%) |
| 65 to 74 Years | 0 (0.0%) | 0 (0.0%) |
| 75 Years and over | 2 (40.0%) | 0 (0.0%) |
Disability Class: Cognitive Difficulty
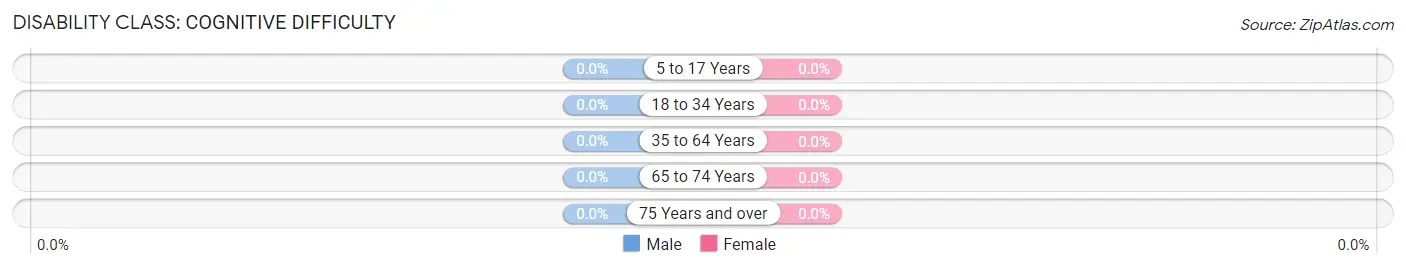
| Age Bracket | Male | Female |
| 5 to 17 Years | 0 (0.0%) | 0 (0.0%) |
| 18 to 34 Years | 0 (0.0%) | 0 (0.0%) |
| 35 to 64 Years | 0 (0.0%) | 0 (0.0%) |
| 65 to 74 Years | 0 (0.0%) | 0 (0.0%) |
| 75 Years and over | 0 (0.0%) | 0 (0.0%) |
Disability Class: Ambulatory Difficulty
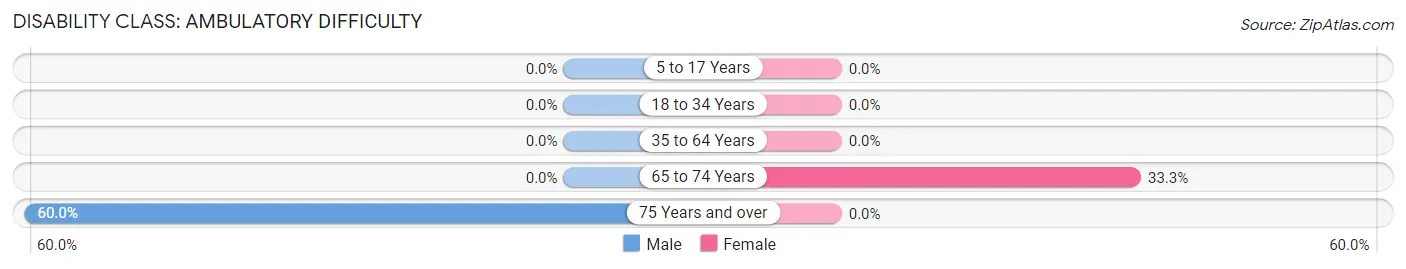
| Age Bracket | Male | Female |
| 5 to 17 Years | 0 (0.0%) | 0 (0.0%) |
| 18 to 34 Years | 0 (0.0%) | 0 (0.0%) |
| 35 to 64 Years | 0 (0.0%) | 0 (0.0%) |
| 65 to 74 Years | 0 (0.0%) | 2 (33.3%) |
| 75 Years and over | 3 (60.0%) | 0 (0.0%) |
Disability Class: Self-Care Difficulty
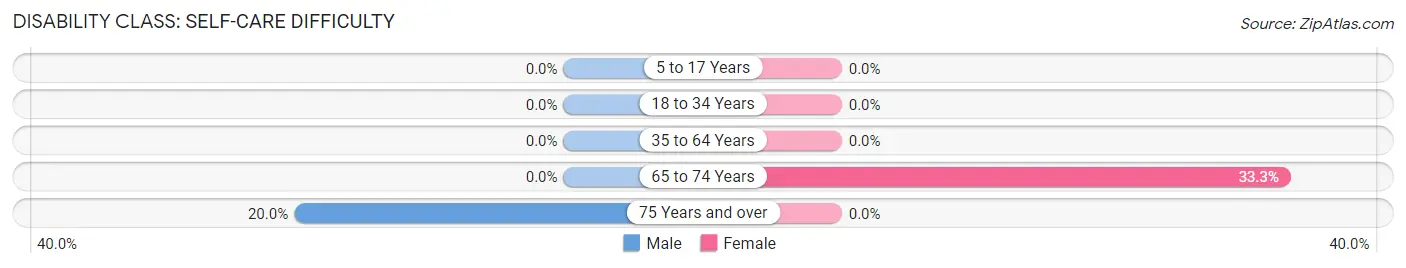
| Age Bracket | Male | Female |
| 5 to 17 Years | 0 (0.0%) | 0 (0.0%) |
| 18 to 34 Years | 0 (0.0%) | 0 (0.0%) |
| 35 to 64 Years | 0 (0.0%) | 0 (0.0%) |
| 65 to 74 Years | 0 (0.0%) | 2 (33.3%) |
| 75 Years and over | 1 (20.0%) | 0 (0.0%) |
Technology Access in Richland
Computing Device Access in Richland
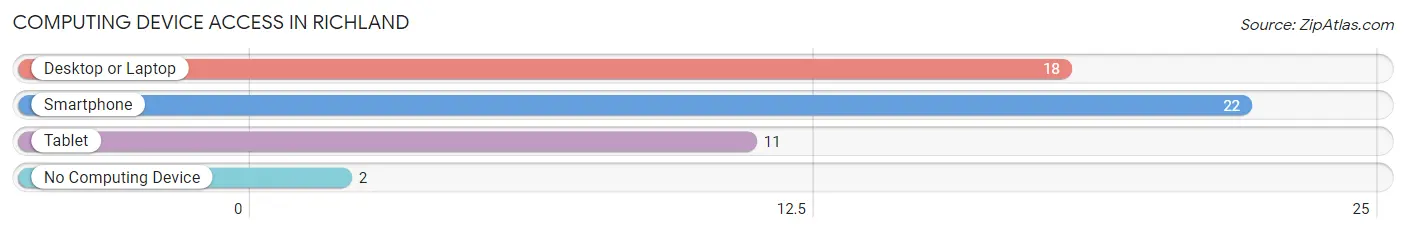
| Device Type | # Households | % Households |
| Desktop or Laptop | 18 | 64.3% |
| Smartphone | 22 | 78.6% |
| Tablet | 11 | 39.3% |
| No Computing Device | 2 | 7.1% |
| Total | 28 | 100.0% |
Internet Access in Richland
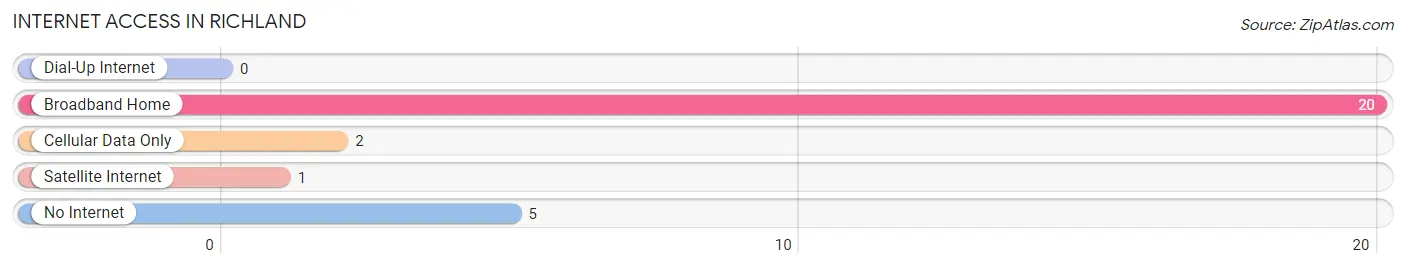
| Internet Type | # Households | % Households |
| Dial-Up Internet | 0 | 0.0% |
| Broadband Home | 20 | 71.4% |
| Cellular Data Only | 2 | 7.1% |
| Satellite Internet | 1 | 3.6% |
| No Internet | 5 | 17.9% |
| Total | 28 | 100.0% |
Richland Summary
Richland, Nebraska is a small village located in Saunders County, Nebraska. It is situated on the banks of the Platte River, approximately 25 miles west of Omaha. The village has a population of approximately 500 people and is part of the Omaha-Council Bluffs metropolitan area.
History
Richland was founded in 1856 by a group of settlers from Ohio. The village was named after the nearby Richland Creek, which was named by the settlers for its abundance of rich soil. The village was incorporated in 1887 and has remained a small, rural community ever since.
The village was originally a farming community, with many of the settlers growing corn, wheat, and other crops. In the early 1900s, the village began to diversify its economy, with the opening of a brickyard, a creamery, and a lumberyard. The village also had a hotel, a bank, and a post office.
In the 1950s, Richland began to experience a population decline as many of the younger residents moved away to larger cities. This trend continued until the late 1980s, when the village began to experience a resurgence in population growth. This was due in part to the village's proximity to Omaha, which has become a major economic center in the region.
Geography
Richland is located in Saunders County, Nebraska, approximately 25 miles west of Omaha. The village is situated on the banks of the Platte River, which is a major tributary of the Missouri River. The village is surrounded by rolling hills and farmland, with the nearest major city being Omaha.
The climate in Richland is typical of the Midwest, with hot summers and cold winters. The average temperature in the summer is around 80 degrees Fahrenheit, while the average temperature in the winter is around 20 degrees Fahrenheit. The village receives an average of 36 inches of precipitation per year.
Economy
The economy of Richland is largely based on agriculture. The village is home to several farms, which produce corn, wheat, and other crops. The village also has a few small businesses, including a grocery store, a hardware store, and a restaurant.
The village is also home to a few manufacturing companies, including a furniture factory and a plastics factory. These companies provide employment for many of the village's residents.
Demographics
As of the 2010 census, the population of Richland was 498. The village is predominantly white, with 92.2% of the population identifying as white. The remaining population is made up of African Americans (2.2%), Hispanics (2.2%), and other races (3.4%).
The median household income in Richland is $45,000, which is slightly lower than the national average. The median age of the village's residents is 43.3 years, which is slightly higher than the national average.
Conclusion
Richland, Nebraska is a small village located in Saunders County, Nebraska. It is situated on the banks of the Platte River, approximately 25 miles west of Omaha. The village has a population of approximately 500 people and is part of the Omaha-Council Bluffs metropolitan area. The village was founded in 1856 by a group of settlers from Ohio and has remained a small, rural community ever since. The economy of Richland is largely based on agriculture, with the village also home to a few small businesses and manufacturing companies. The population of Richland is predominantly white, with the median household income being slightly lower than the national average.
Common Questions
What is Per Capita Income in Richland?
Per Capita income in Richland is $19,502.
What is the Median Household income in Richland?
Median Household Income in Richland is $40,500.
What is Inequality or Gini Index in Richland?
Inequality or Gini Index in Richland is 0.46.
What is the Total Population of Richland?
Total Population of Richland is 50.
What is the Total Male Population of Richland?
Total Male Population of Richland is 26.
What is the Total Female Population of Richland?
Total Female Population of Richland is 24.
What is the Ratio of Males per 100 Females in Richland?
There are 108.33 Males per 100 Females in Richland.
What is the Ratio of Females per 100 Males in Richland?
There are 92.31 Females per 100 Males in Richland.
What is the Median Population Age in Richland?
Median Population Age in Richland is 50.5 Years.
What is the Average Family Size in Richland
Average Family Size in Richland is 2.8 People.
What is the Average Household Size in Richland
Average Household Size in Richland is 1.8 People.
How Large is the Labor Force in Richland?
There are 19 People in the Labor Forcein in Richland.
What is the Percentage of People in the Labor Force in Richland?
43.2% of People are in the Labor Force in Richland.