Primrose, NE Map & Demographics
Primrose Map
Primrose Overview
$25,824
PER CAPITA INCOME
$53,750
AVG FAMILY INCOME
$38,542
AVG HOUSEHOLD INCOME
26.8%
WAGE / INCOME GAP [ % ]
73.2¢/ $1
WAGE / INCOME GAP [ $ ]
0.35
INEQUALITY / GINI INDEX
50
TOTAL POPULATION
35
MALE POPULATION
15
FEMALE POPULATION
233.33
MALES / 100 FEMALES
42.86
FEMALES / 100 MALES
50.5
MEDIAN AGE
2.4
AVG FAMILY SIZE
2.0
AVG HOUSEHOLD SIZE
19
LABOR FORCE [ PEOPLE ]
44.2%
PERCENT IN LABOR FORCE
Primrose Zip Codes
Primrose Area Codes
Income in Primrose
Income Overview in Primrose
Per Capita Income in Primrose is $25,824, while median incomes of families and households are $53,750 and $38,542 respectively.
| Characteristic | Number | Measure |
| Per Capita Income | 50 | $25,824 |
| Median Family Income | 14 | $53,750 |
| Mean Family Income | 14 | $69,407 |
| Median Household Income | 25 | $38,542 |
| Mean Household Income | 25 | $58,720 |
| Income Deficit | 14 | $0 |
| Wage / Income Gap (%) | 50 | 26.84% |
| Wage / Income Gap ($) | 50 | 73.16¢ per $1 |
| Gini / Inequality Index | 50 | 0.35 |
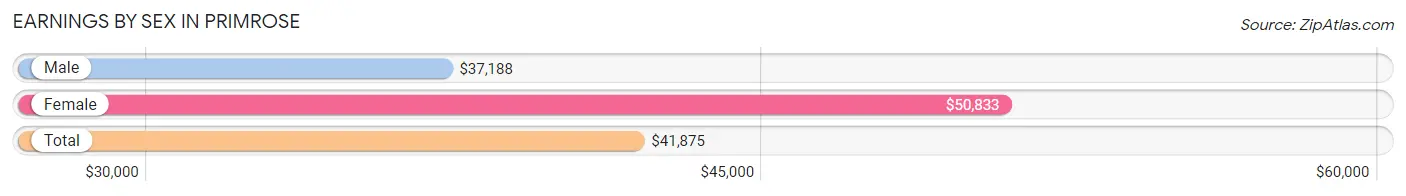
Earnings by Sex in Primrose
Average Earnings in Primrose are $41,875, $37,188 for men and $50,833 for women, a difference of 26.8%.
| Sex | Number | Average Earnings |
| Male | 13 (61.9%) | $37,188 |
| Female | 8 (38.1%) | $50,833 |
| Total | 21 (100.0%) | $41,875 |
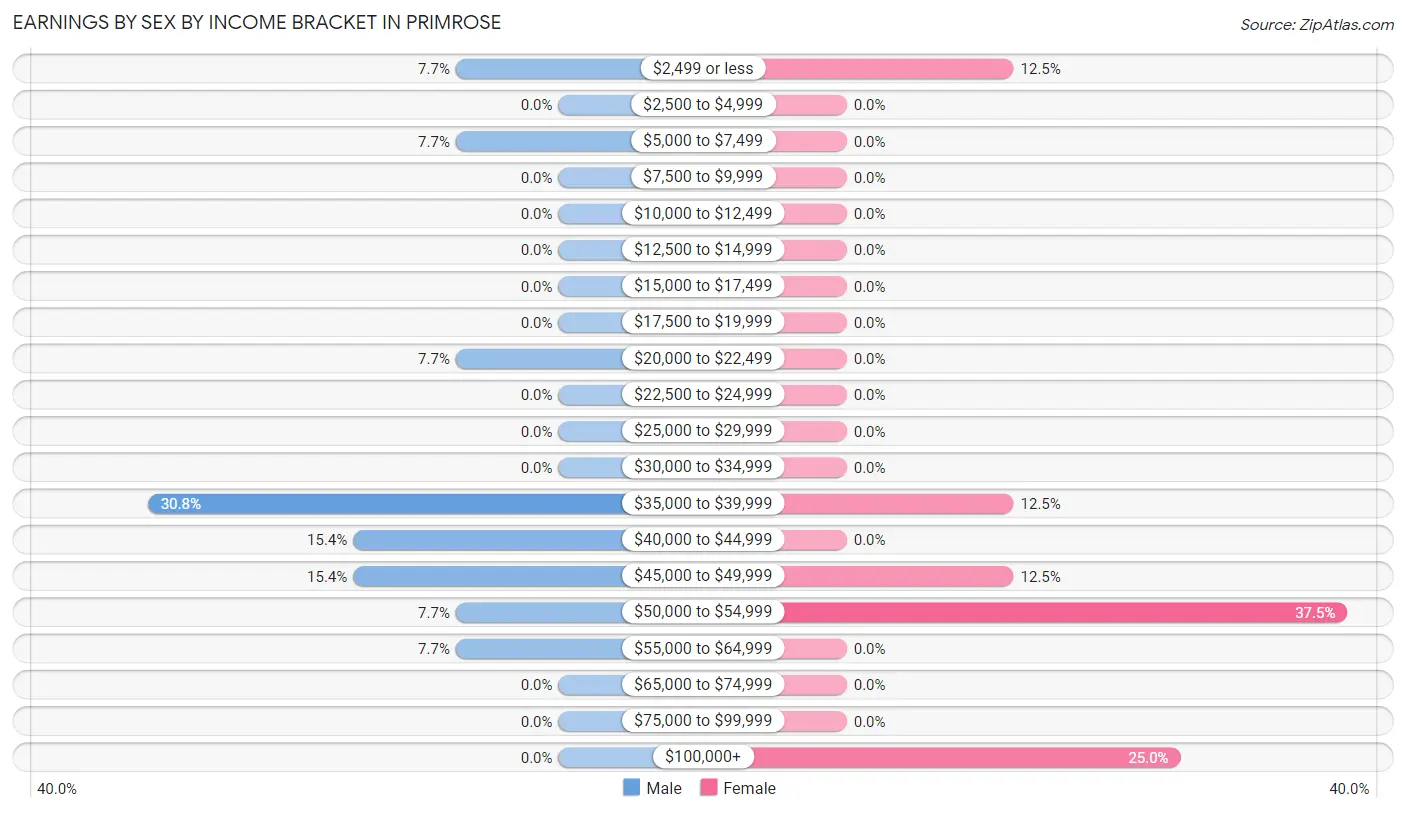
Earnings by Sex by Income Bracket in Primrose
The most common earnings brackets in Primrose are $35,000 to $39,999 for men (4 | 30.8%) and $50,000 to $54,999 for women (3 | 37.5%).
| Income | Male | Female |
| $2,499 or less | 1 (7.7%) | 1 (12.5%) |
| $2,500 to $4,999 | 0 (0.0%) | 0 (0.0%) |
| $5,000 to $7,499 | 1 (7.7%) | 0 (0.0%) |
| $7,500 to $9,999 | 0 (0.0%) | 0 (0.0%) |
| $10,000 to $12,499 | 0 (0.0%) | 0 (0.0%) |
| $12,500 to $14,999 | 0 (0.0%) | 0 (0.0%) |
| $15,000 to $17,499 | 0 (0.0%) | 0 (0.0%) |
| $17,500 to $19,999 | 0 (0.0%) | 0 (0.0%) |
| $20,000 to $22,499 | 1 (7.7%) | 0 (0.0%) |
| $22,500 to $24,999 | 0 (0.0%) | 0 (0.0%) |
| $25,000 to $29,999 | 0 (0.0%) | 0 (0.0%) |
| $30,000 to $34,999 | 0 (0.0%) | 0 (0.0%) |
| $35,000 to $39,999 | 4 (30.8%) | 1 (12.5%) |
| $40,000 to $44,999 | 2 (15.4%) | 0 (0.0%) |
| $45,000 to $49,999 | 2 (15.4%) | 1 (12.5%) |
| $50,000 to $54,999 | 1 (7.7%) | 3 (37.5%) |
| $55,000 to $64,999 | 1 (7.7%) | 0 (0.0%) |
| $65,000 to $74,999 | 0 (0.0%) | 0 (0.0%) |
| $75,000 to $99,999 | 0 (0.0%) | 0 (0.0%) |
| $100,000+ | 0 (0.0%) | 2 (25.0%) |
| Total | 13 (100.0%) | 8 (100.0%) |
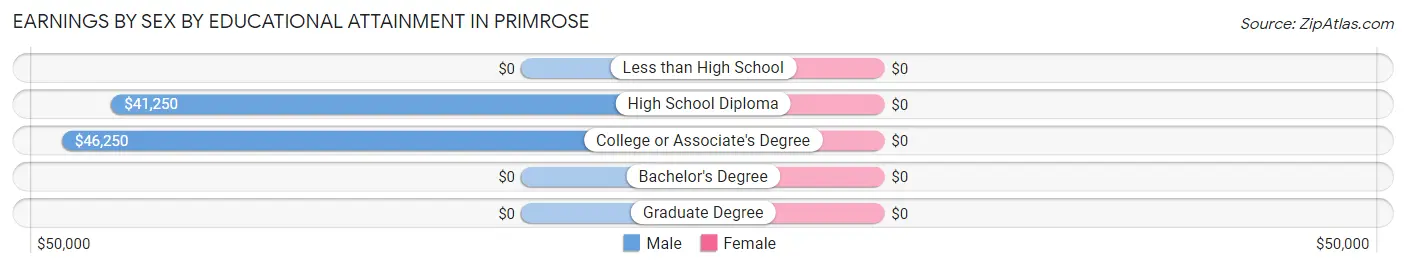
Earnings by Sex by Educational Attainment in Primrose
| Educational Attainment | Male Income | Female Income |
| Less than High School | - | - |
| High School Diploma | $41,250 | $0 |
| College or Associate's Degree | $46,250 | $0 |
| Bachelor's Degree | - | - |
| Graduate Degree | - | - |
| Total | $40,625 | $50,833 |
Family Income in Primrose
Family Income Brackets in Primrose
According to the Primrose family income data, there are 5 families falling into the $35,000 to $49,999 income range, which is the most common income bracket and makes up 35.7% of all families.
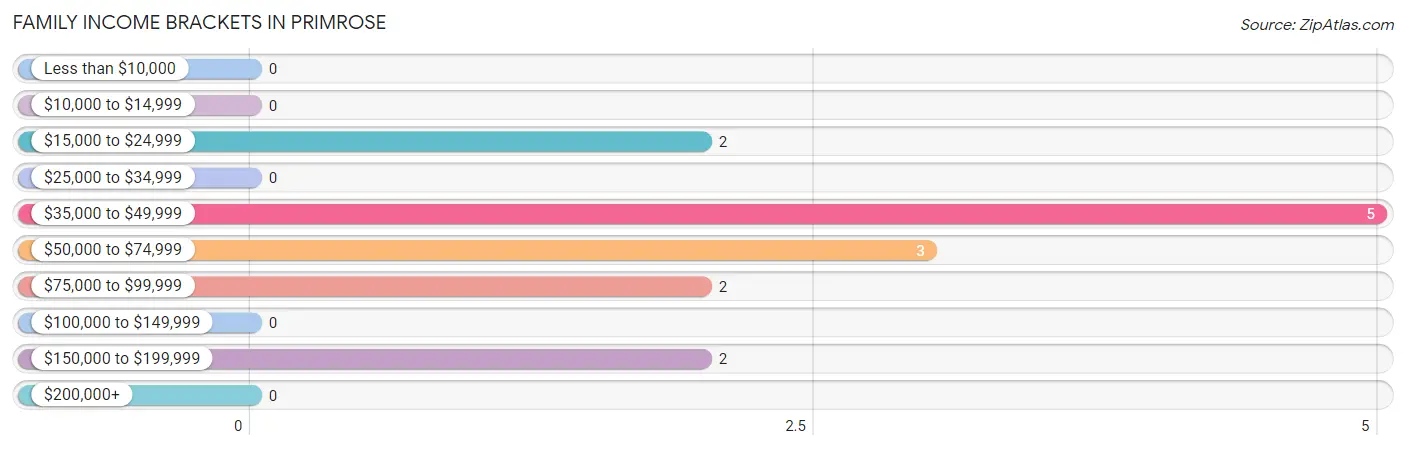
| Income Bracket | # Families | % Families |
| Less than $10,000 | 0 | 0.0% |
| $10,000 to $14,999 | 0 | 0.0% |
| $15,000 to $24,999 | 2 | 14.3% |
| $25,000 to $34,999 | 0 | 0.0% |
| $35,000 to $49,999 | 5 | 35.7% |
| $50,000 to $74,999 | 3 | 21.4% |
| $75,000 to $99,999 | 2 | 14.3% |
| $100,000 to $149,999 | 0 | 0.0% |
| $150,000 to $199,999 | 2 | 14.3% |
| $200,000+ | 0 | 0.0% |
Family Income by Famaliy Size in Primrose
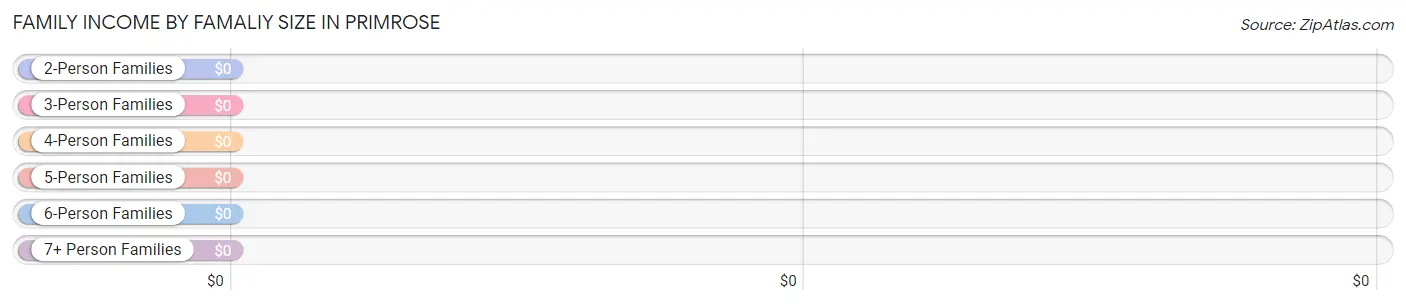
| Income Bracket | # Families | Median Income |
| 2-Person Families | 5 (35.7%) | $0 |
| 3-Person Families | 7 (50.0%) | $0 |
| 4-Person Families | 2 (14.3%) | $0 |
| 5-Person Families | 0 (0.0%) | $0 |
| 6-Person Families | 0 (0.0%) | $0 |
| 7+ Person Families | 0 (0.0%) | $0 |
| Total | 14 (100.0%) | $53,750 |
Family Income by Number of Earners in Primrose
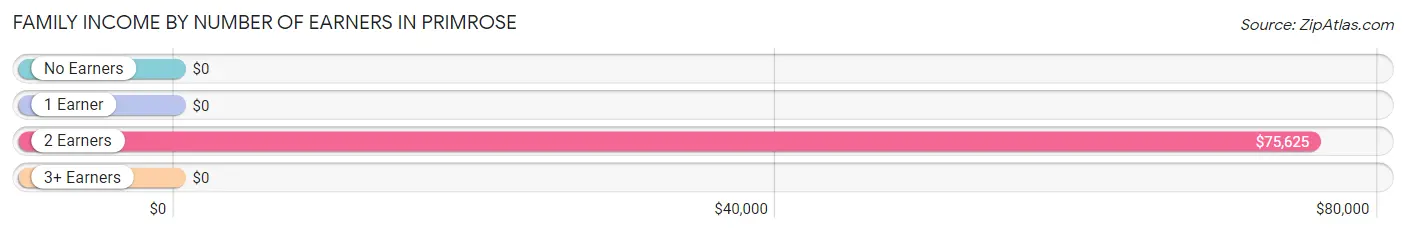
| Number of Earners | # Families | Median Income |
| No Earners | 0 (0.0%) | $0 |
| 1 Earner | 7 (50.0%) | $0 |
| 2 Earners | 7 (50.0%) | $75,625 |
| 3+ Earners | 0 (0.0%) | $0 |
| Total | 14 (100.0%) | $53,750 |
Household Income in Primrose
Household Income Brackets in Primrose
With 12 households falling in the category, the $35,000 to $49,999 income range is the most frequent in Primrose, accounting for 48.0% of all households.
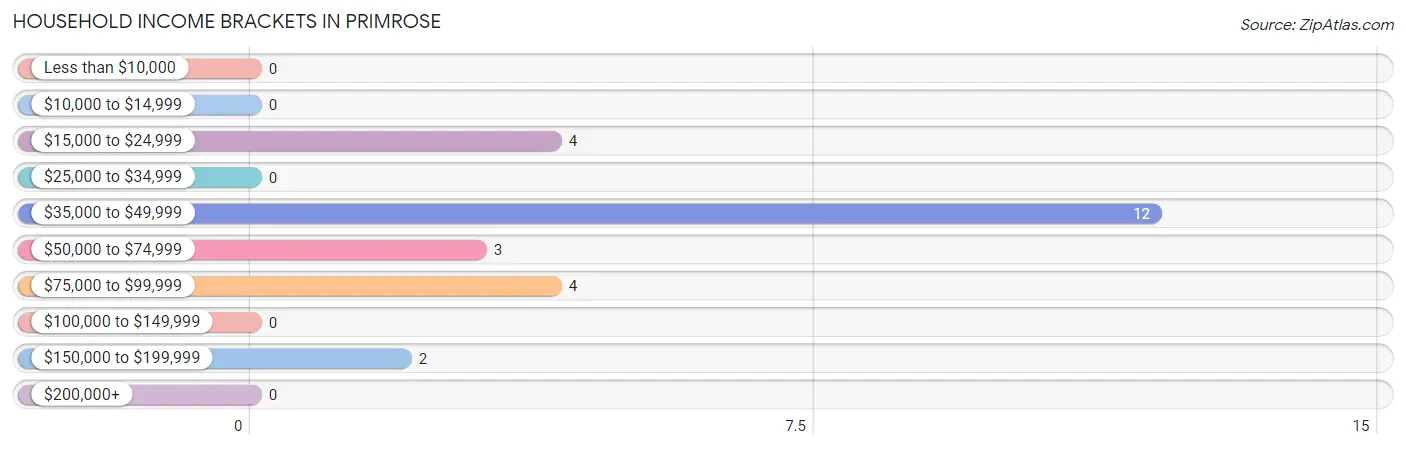
| Income Bracket | # Households | % Households |
| Less than $10,000 | 0 | 0.0% |
| $10,000 to $14,999 | 0 | 0.0% |
| $15,000 to $24,999 | 4 | 16.0% |
| $25,000 to $34,999 | 0 | 0.0% |
| $35,000 to $49,999 | 12 | 48.0% |
| $50,000 to $74,999 | 3 | 12.0% |
| $75,000 to $99,999 | 4 | 16.0% |
| $100,000 to $149,999 | 0 | 0.0% |
| $150,000 to $199,999 | 2 | 8.0% |
| $200,000+ | 0 | 0.0% |
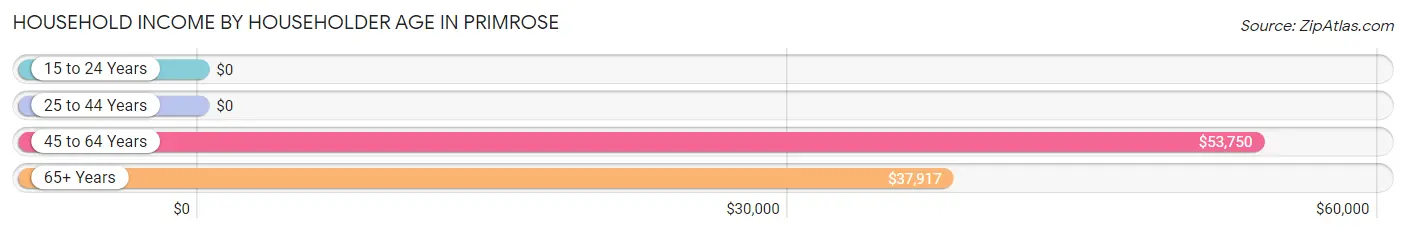
Household Income by Householder Age in Primrose
The median household income in Primrose is $38,542, with the highest median household income of $53,750 found in the 45 to 64 years age bracket for the primary householder. A total of 12 households (48.0%) fall into this category.
| Income Bracket | # Households | Median Income |
| 15 to 24 Years | 0 (0.0%) | $0 |
| 25 to 44 Years | 3 (12.0%) | $0 |
| 45 to 64 Years | 12 (48.0%) | $53,750 |
| 65+ Years | 10 (40.0%) | $37,917 |
| Total | 25 (100.0%) | $38,542 |
Poverty in Primrose
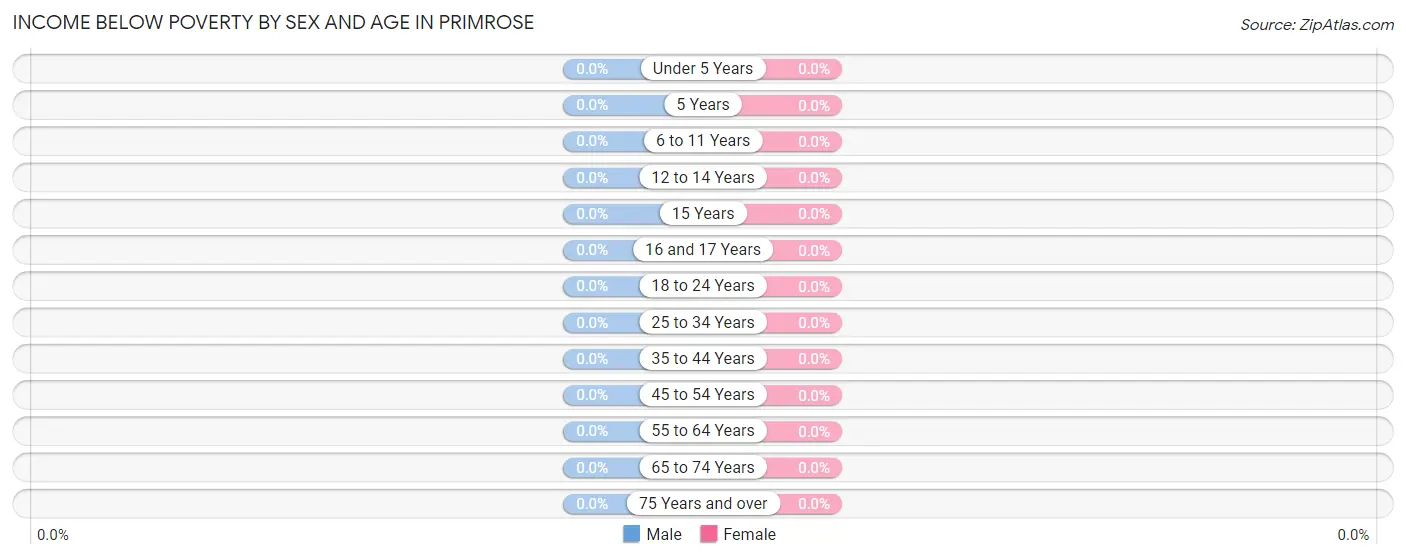
Income Below Poverty by Sex and Age in Primrose
| Age Bracket | Male | Female |
| Under 5 Years | 0 (0.0%) | 0 (0.0%) |
| 5 Years | 0 (0.0%) | 0 (0.0%) |
| 6 to 11 Years | 0 (0.0%) | 0 (0.0%) |
| 12 to 14 Years | 0 (0.0%) | 0 (0.0%) |
| 15 Years | 0 (0.0%) | 0 (0.0%) |
| 16 and 17 Years | 0 (0.0%) | 0 (0.0%) |
| 18 to 24 Years | 0 (0.0%) | 0 (0.0%) |
| 25 to 34 Years | 0 (0.0%) | 0 (0.0%) |
| 35 to 44 Years | 0 (0.0%) | 0 (0.0%) |
| 45 to 54 Years | 0 (0.0%) | 0 (0.0%) |
| 55 to 64 Years | 0 (0.0%) | 0 (0.0%) |
| 65 to 74 Years | 0 (0.0%) | 0 (0.0%) |
| 75 Years and over | 0 (0.0%) | 0 (0.0%) |
| Total | 0 (0.0%) | 0 (0.0%) |
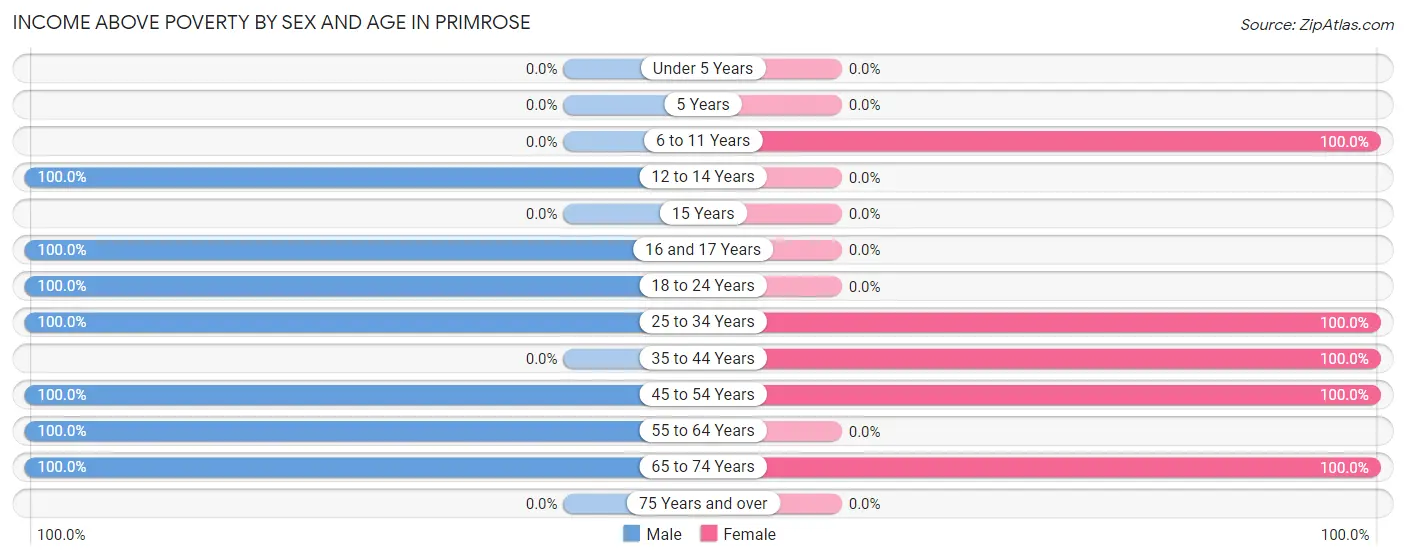
Income Above Poverty by Sex and Age in Primrose
According to the poverty statistics in Primrose, males aged 12 to 14 years and females aged 6 to 11 years are the age groups that are most secure financially, with 100.0% of males and 100.0% of females in these age groups living above the poverty line.
| Age Bracket | Male | Female |
| Under 5 Years | 0 (0.0%) | 0 (0.0%) |
| 5 Years | 0 (0.0%) | 0 (0.0%) |
| 6 to 11 Years | 0 (0.0%) | 1 (100.0%) |
| 12 to 14 Years | 2 (100.0%) | 0 (0.0%) |
| 15 Years | 0 (0.0%) | 0 (0.0%) |
| 16 and 17 Years | 2 (100.0%) | 0 (0.0%) |
| 18 to 24 Years | 5 (100.0%) | 0 (0.0%) |
| 25 to 34 Years | 3 (100.0%) | 2 (100.0%) |
| 35 to 44 Years | 0 (0.0%) | 2 (100.0%) |
| 45 to 54 Years | 7 (100.0%) | 9 (100.0%) |
| 55 to 64 Years | 1 (100.0%) | 0 (0.0%) |
| 65 to 74 Years | 11 (100.0%) | 1 (100.0%) |
| 75 Years and over | 0 (0.0%) | 0 (0.0%) |
| Total | 31 (100.0%) | 15 (100.0%) |
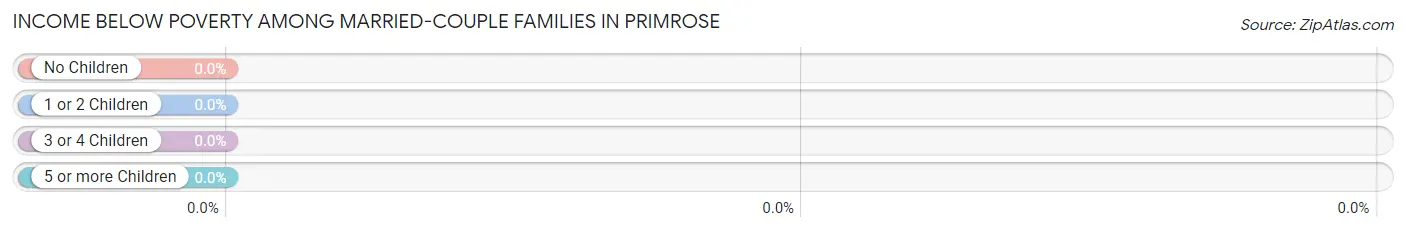
Income Below Poverty Among Married-Couple Families in Primrose
| Children | Above Poverty | Below Poverty |
| No Children | 10 (100.0%) | 0 (0.0%) |
| 1 or 2 Children | 4 (100.0%) | 0 (0.0%) |
| 3 or 4 Children | 0 (0.0%) | 0 (0.0%) |
| 5 or more Children | 0 (0.0%) | 0 (0.0%) |
| Total | 14 (100.0%) | 0 (0.0%) |
Income Below Poverty Among Single-Parent Households in Primrose
| Children | Single Father | Single Mother |
| No Children | 0 (0.0%) | 0 (0.0%) |
| 1 or 2 Children | 0 (0.0%) | 0 (0.0%) |
| 3 or 4 Children | 0 (0.0%) | 0 (0.0%) |
| 5 or more Children | 0 (0.0%) | 0 (0.0%) |
| Total | 0 (0.0%) | 0 (0.0%) |
Income Below Poverty Among Married-Couple vs Single-Parent Households in Primrose
| Children | Married-Couple Families | Single-Parent Households |
| No Children | 0 (0.0%) | 0 (0.0%) |
| 1 or 2 Children | 0 (0.0%) | 0 (0.0%) |
| 3 or 4 Children | 0 (0.0%) | 0 (0.0%) |
| 5 or more Children | 0 (0.0%) | 0 (0.0%) |
| Total | 0 (0.0%) | 0 (0.0%) |
Race in Primrose
The most populous races in Primrose are White / Caucasian (47 | 94.0%), and Two or more Races (3 | 6.0%).
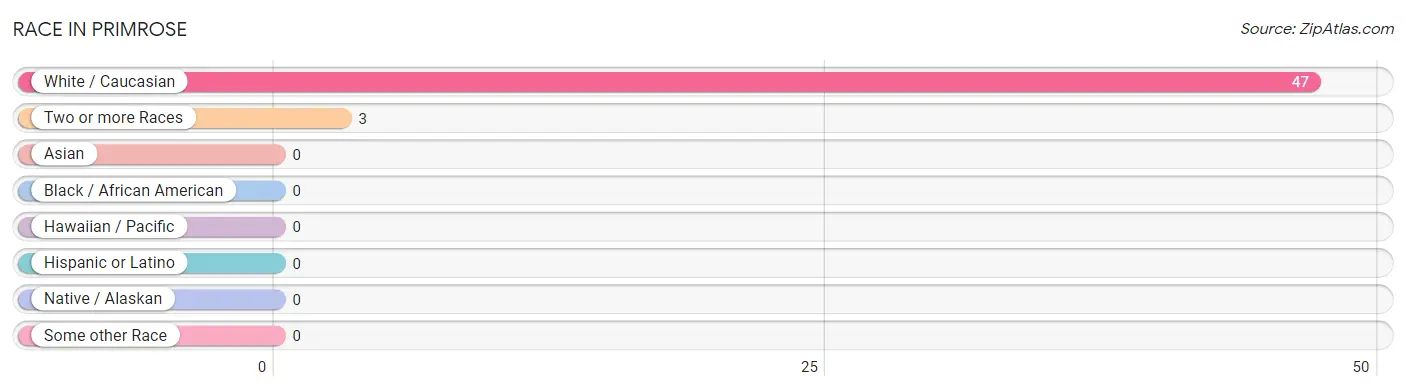
| Race | # Population | % Population |
| Asian | 0 | 0.0% |
| Black / African American | 0 | 0.0% |
| Hawaiian / Pacific | 0 | 0.0% |
| Hispanic or Latino | 0 | 0.0% |
| Native / Alaskan | 0 | 0.0% |
| White / Caucasian | 47 | 94.0% |
| Two or more Races | 3 | 6.0% |
| Some other Race | 0 | 0.0% |
| Total | 50 | 100.0% |
Ancestry in Primrose
The most populous ancestries reported in Primrose are German (14 | 28.0%), Irish (3 | 6.0%), Polish (3 | 6.0%), Danish (2 | 4.0%), and Scotch-Irish (2 | 4.0%), together accounting for 48.0% of all Primrose residents.
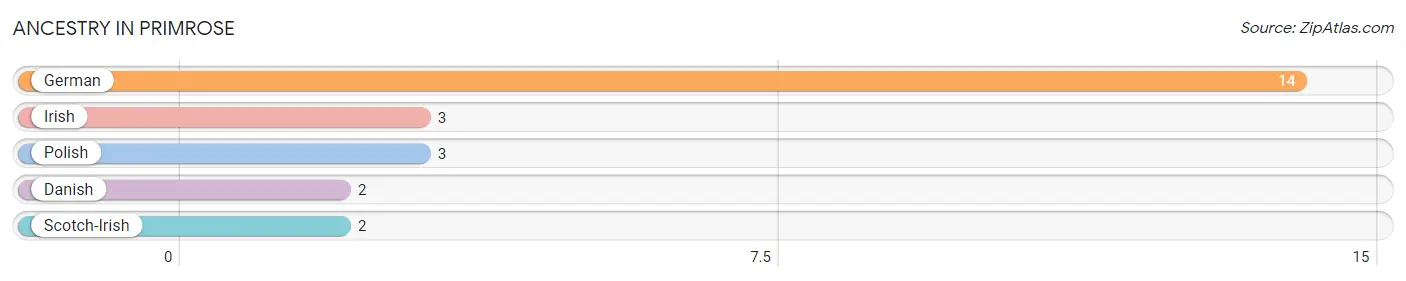
| Ancestry | # Population | % Population |
| Danish | 2 | 4.0% |
| German | 14 | 28.0% |
| Irish | 3 | 6.0% |
| Polish | 3 | 6.0% |
| Scotch-Irish | 2 | 4.0% | View All 5 Rows |
Immigrants in Primrose

| Immigration Origin | # Population | % Population | View All 0 Rows |
Sex and Age in Primrose
Sex and Age in Primrose
The most populous age groups in Primrose are 70 to 74 Years (8 | 22.9%) for men and 50 to 54 Years (8 | 53.3%) for women.
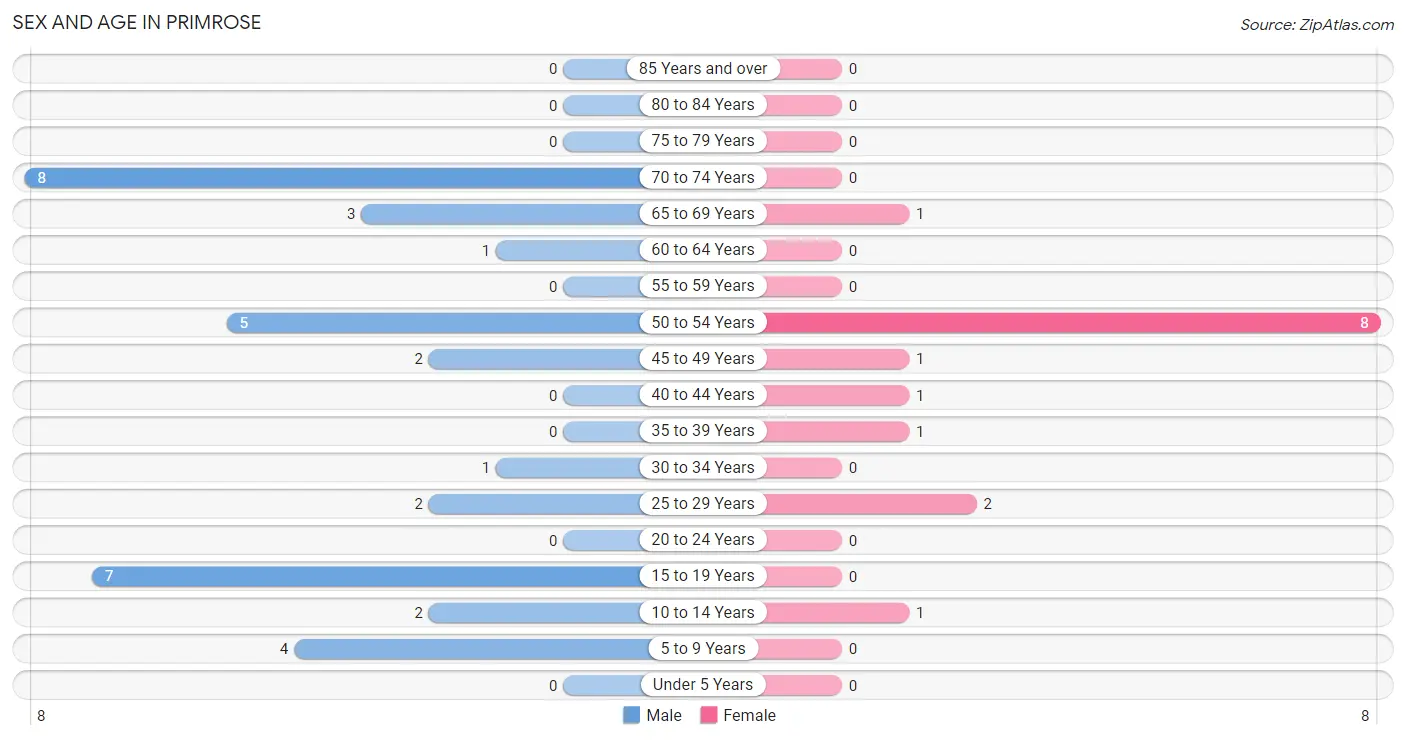
| Age Bracket | Male | Female |
| Under 5 Years | 0 (0.0%) | 0 (0.0%) |
| 5 to 9 Years | 4 (11.4%) | 0 (0.0%) |
| 10 to 14 Years | 2 (5.7%) | 1 (6.7%) |
| 15 to 19 Years | 7 (20.0%) | 0 (0.0%) |
| 20 to 24 Years | 0 (0.0%) | 0 (0.0%) |
| 25 to 29 Years | 2 (5.7%) | 2 (13.3%) |
| 30 to 34 Years | 1 (2.9%) | 0 (0.0%) |
| 35 to 39 Years | 0 (0.0%) | 1 (6.7%) |
| 40 to 44 Years | 0 (0.0%) | 1 (6.7%) |
| 45 to 49 Years | 2 (5.7%) | 1 (6.7%) |
| 50 to 54 Years | 5 (14.3%) | 8 (53.3%) |
| 55 to 59 Years | 0 (0.0%) | 0 (0.0%) |
| 60 to 64 Years | 1 (2.9%) | 0 (0.0%) |
| 65 to 69 Years | 3 (8.6%) | 1 (6.7%) |
| 70 to 74 Years | 8 (22.9%) | 0 (0.0%) |
| 75 to 79 Years | 0 (0.0%) | 0 (0.0%) |
| 80 to 84 Years | 0 (0.0%) | 0 (0.0%) |
| 85 Years and over | 0 (0.0%) | 0 (0.0%) |
| Total | 35 (100.0%) | 15 (100.0%) |
Families and Households in Primrose
Median Family Size in Primrose
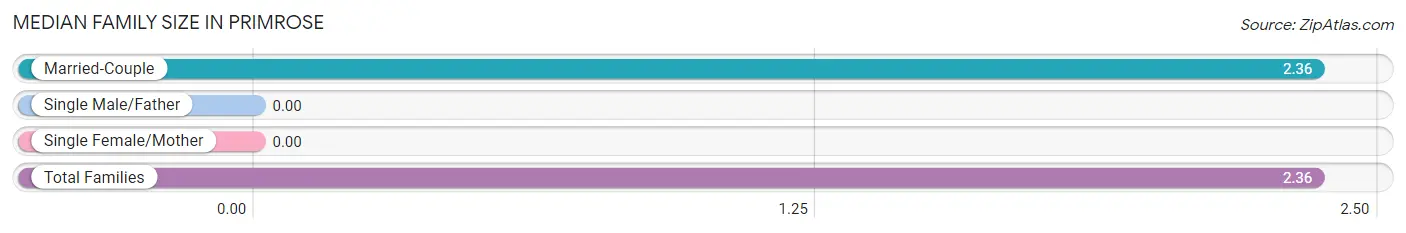
| Family Type | # Families | Family Size |
| Married-Couple | 14 (100.0%) | 2.36 |
| Single Male/Father | 0 (0.0%) | - |
| Single Female/Mother | 0 (0.0%) | - |
| Total Families | 14 (100.0%) | 2.36 |
Median Household Size in Primrose
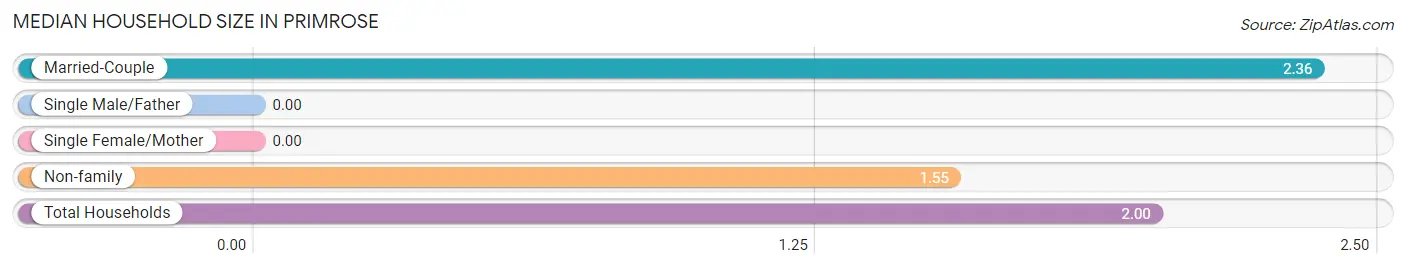
| Household Type | # Households | Household Size |
| Married-Couple | 14 (56.0%) | 2.36 |
| Single Male/Father | 0 (0.0%) | - |
| Single Female/Mother | 0 (0.0%) | - |
| Non-family | 11 (44.0%) | 1.55 |
| Total Households | 25 (100.0%) | 2.00 |
Household Size by Marriage Status in Primrose
Out of a total of 25 households in Primrose, 14 (56.0%) are family households, while 11 (44.0%) are nonfamily households. The most numerous type of family households are 3-person households, comprising 7, and the most common type of nonfamily households are 2-person households, comprising 8.
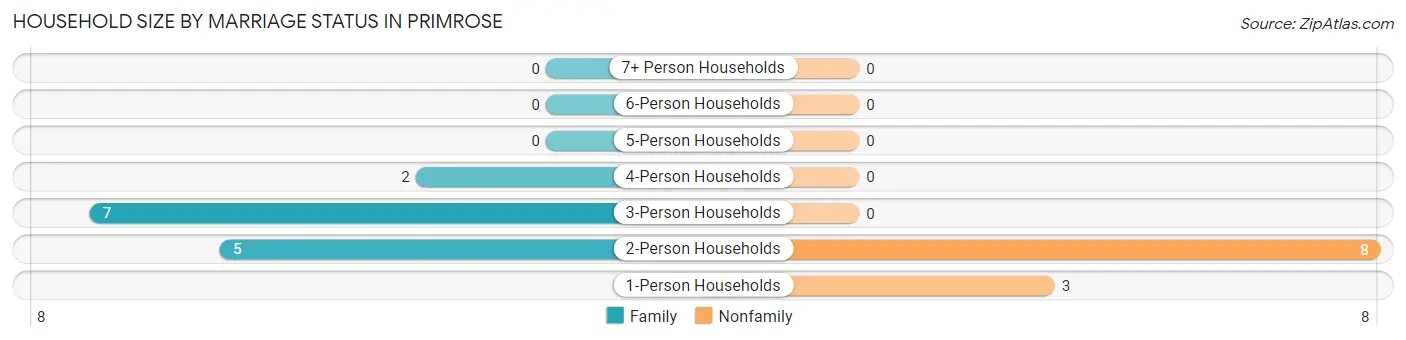
| Household Size | Family Households | Nonfamily Households |
| 1-Person Households | - | 3 (12.0%) |
| 2-Person Households | 5 (20.0%) | 8 (32.0%) |
| 3-Person Households | 7 (28.0%) | 0 (0.0%) |
| 4-Person Households | 2 (8.0%) | 0 (0.0%) |
| 5-Person Households | 0 (0.0%) | 0 (0.0%) |
| 6-Person Households | 0 (0.0%) | 0 (0.0%) |
| 7+ Person Households | 0 (0.0%) | 0 (0.0%) |
| Total | 14 (56.0%) | 11 (44.0%) |
Female Fertility in Primrose
Fertility by Age in Primrose
| Age Bracket | Women with Births | Births / 1,000 Women |
| 15 to 19 years | 0 (0.0%) | 0.0 |
| 20 to 34 years | 0 (0.0%) | 0.0 |
| 35 to 50 years | 0 (0.0%) | 0.0 |
| Total | 0 (0.0%) | 0.0 |
Fertility by Age by Marriage Status in Primrose
| Age Bracket | Married | Unmarried |
| 15 to 19 years | 0 (0.0%) | 0 (0.0%) |
| 20 to 34 years | 0 (0.0%) | 0 (0.0%) |
| 35 to 50 years | 0 (0.0%) | 0 (0.0%) |
| Total | 0 (0.0%) | 0 (0.0%) |
Fertility by Education in Primrose
| Educational Attainment | Women with Births | Births / 1,000 Women |
| Less than High School | 0 (0.0%) | 0.0 |
| High School Diploma | 0 (0.0%) | 0.0 |
| College or Associate's Degree | 0 (0.0%) | 0.0 |
| Bachelor's Degree | 0 (0.0%) | 0.0 |
| Graduate Degree | 0 (0.0%) | 0.0 |
| Total | 0 (0.0%) | 0.0 |
Fertility by Education by Marriage Status in Primrose
| Educational Attainment | Married | Unmarried |
| Less than High School | 0 (0.0%) | 0 (0.0%) |
| High School Diploma | 0 (0.0%) | 0 (0.0%) |
| College or Associate's Degree | 0 (0.0%) | 0 (0.0%) |
| Bachelor's Degree | 0 (0.0%) | 0 (0.0%) |
| Graduate Degree | 0 (0.0%) | 0 (0.0%) |
| Total | 0 (0.0%) | 0 (0.0%) |
Employment Characteristics in Primrose
Employment by Class of Employer in Primrose
Among the 19 employed individuals in Primrose, private company employees (14 | 73.7%), self-employed (not incorporated) (4 | 21.0%), and local government employees (1 | 5.3%) make up the most common classes of employment.
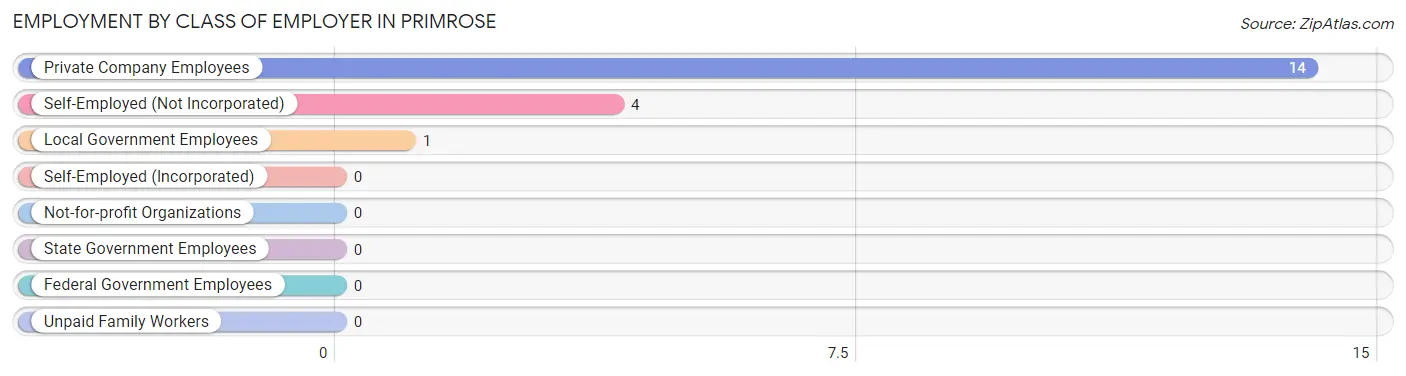
| Employer Class | # Employees | % Employees |
| Private Company Employees | 14 | 73.7% |
| Self-Employed (Incorporated) | 0 | 0.0% |
| Self-Employed (Not Incorporated) | 4 | 21.0% |
| Not-for-profit Organizations | 0 | 0.0% |
| Local Government Employees | 1 | 5.3% |
| State Government Employees | 0 | 0.0% |
| Federal Government Employees | 0 | 0.0% |
| Unpaid Family Workers | 0 | 0.0% |
| Total | 19 | 100.0% |
Employment Status by Age in Primrose
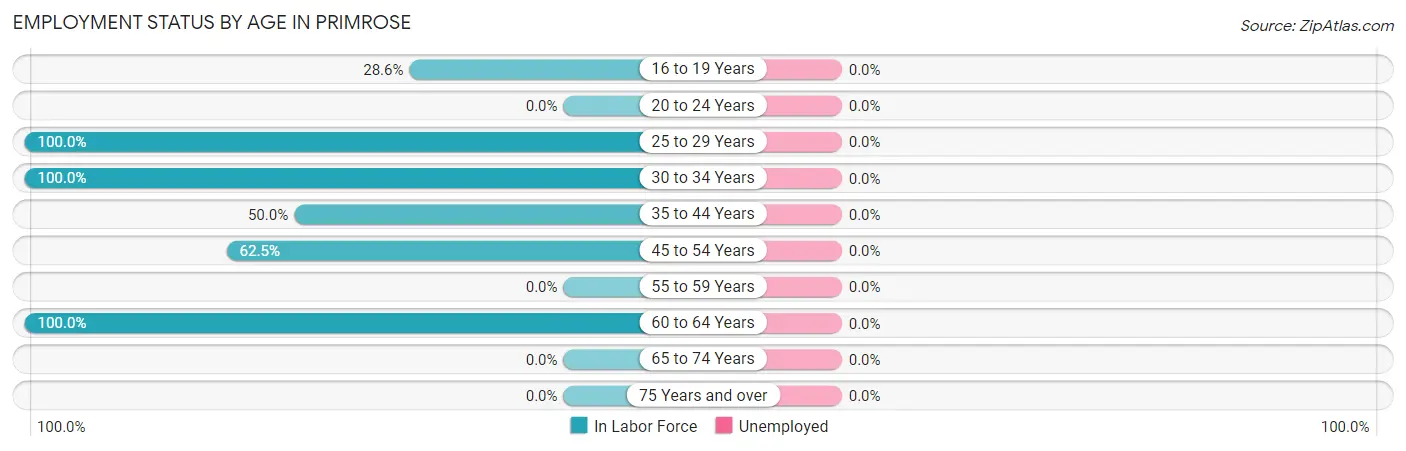
| Age Bracket | In Labor Force | Unemployed |
| 16 to 19 Years | 2 (28.6%) | 0 (0.0%) |
| 20 to 24 Years | 0 (0.0%) | 0 (0.0%) |
| 25 to 29 Years | 4 (100.0%) | 0 (0.0%) |
| 30 to 34 Years | 1 (100.0%) | 0 (0.0%) |
| 35 to 44 Years | 1 (50.0%) | 0 (0.0%) |
| 45 to 54 Years | 10 (62.5%) | 0 (0.0%) |
| 55 to 59 Years | 0 (0.0%) | 0 (0.0%) |
| 60 to 64 Years | 1 (100.0%) | 0 (0.0%) |
| 65 to 74 Years | 0 (0.0%) | 0 (0.0%) |
| 75 Years and over | 0 (0.0%) | 0 (0.0%) |
| Total | 19 (44.2%) | 0 (0.0%) |
Employment Status by Educational Attainment in Primrose
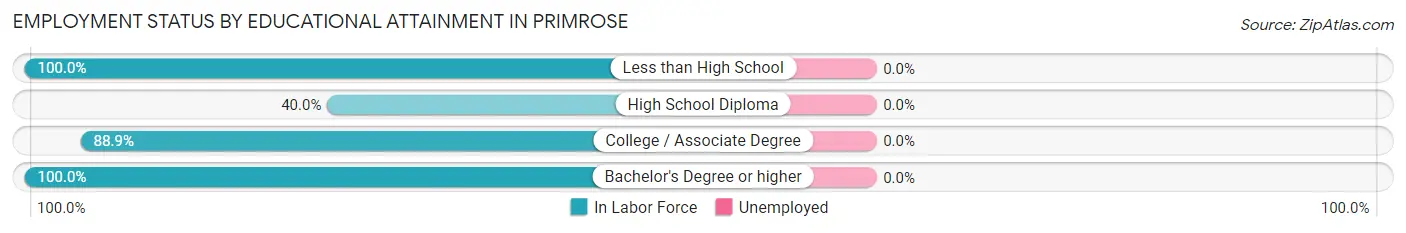
| Educational Attainment | In Labor Force | Unemployed |
| Less than High School | 3 (100.0%) | 0 (0.0%) |
| High School Diploma | 4 (40.0%) | 0 (0.0%) |
| College / Associate Degree | 8 (88.9%) | 0 (0.0%) |
| Bachelor's Degree or higher | 2 (100.0%) | 0 (0.0%) |
| Total | 17 (70.8%) | 0 (0.0%) |
Employment Occupations by Sex in Primrose
Management, Business, Science and Arts Occupations
The most common Management, Business, Science and Arts occupations in Primrose are Management (2 | 10.5%), Community & Social Service (2 | 10.5%), Education Instruction & Library (2 | 10.5%), and Health Diagnosing & Treating (1 | 5.3%).
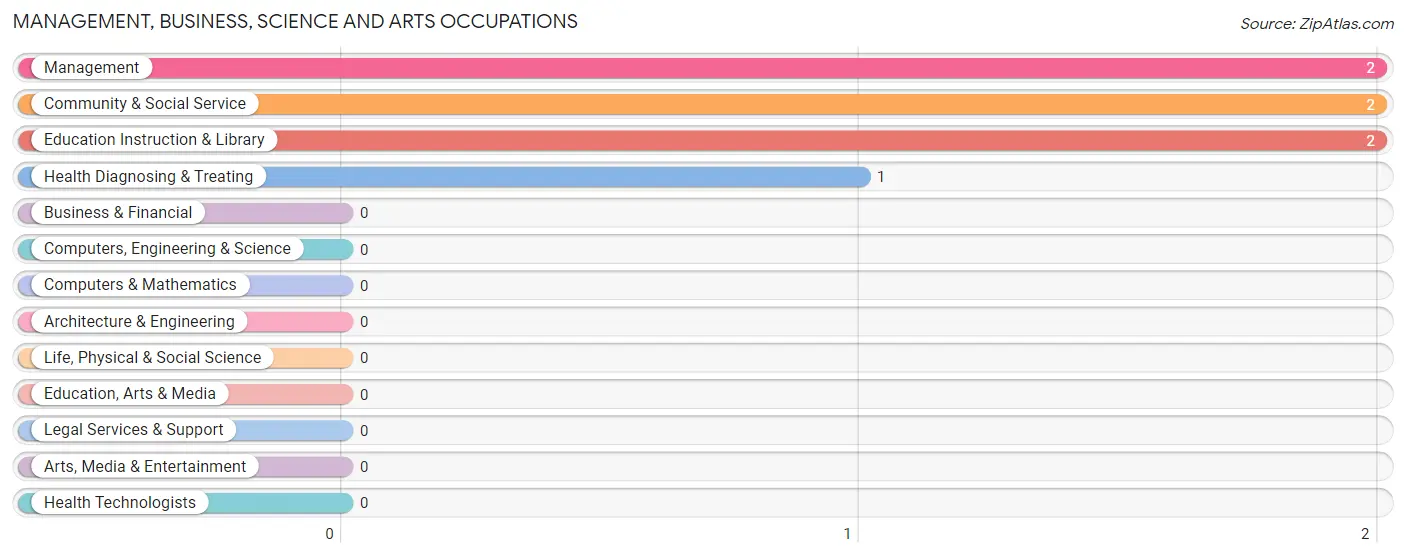
Management, Business, Science and Arts Occupations by Sex
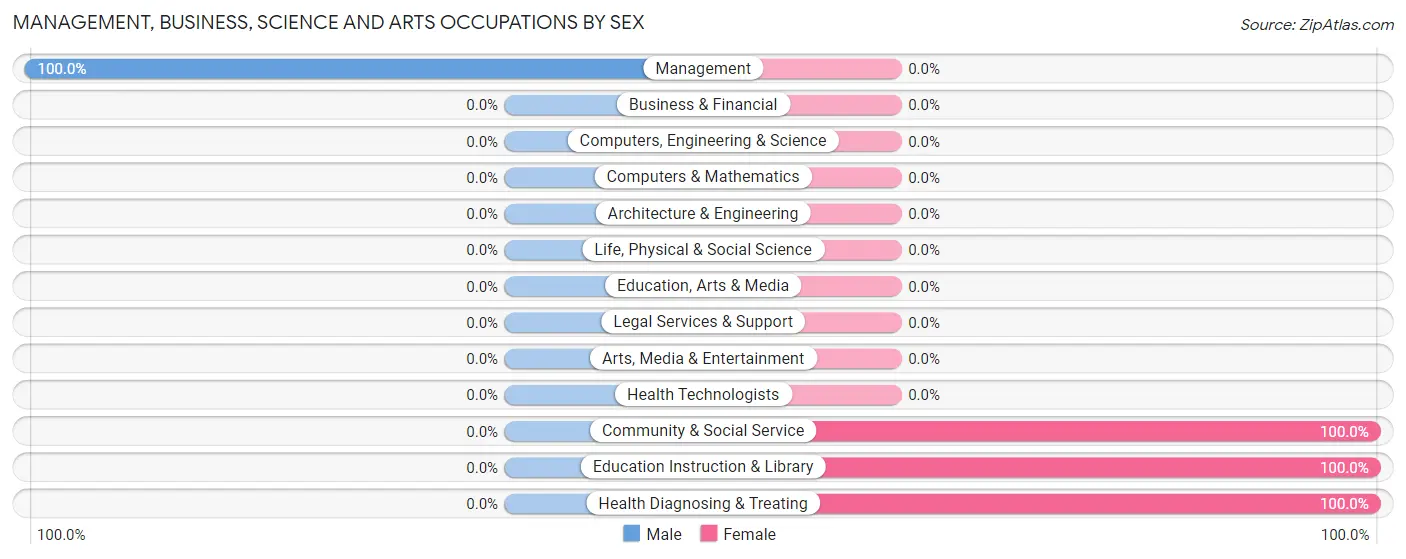
| Occupation | Male | Female |
| Management | 2 (100.0%) | 0 (0.0%) |
| Business & Financial | 0 (0.0%) | 0 (0.0%) |
| Computers, Engineering & Science | 0 (0.0%) | 0 (0.0%) |
| Computers & Mathematics | 0 (0.0%) | 0 (0.0%) |
| Architecture & Engineering | 0 (0.0%) | 0 (0.0%) |
| Life, Physical & Social Science | 0 (0.0%) | 0 (0.0%) |
| Community & Social Service | 0 (0.0%) | 2 (100.0%) |
| Education, Arts & Media | 0 (0.0%) | 0 (0.0%) |
| Legal Services & Support | 0 (0.0%) | 0 (0.0%) |
| Education Instruction & Library | 0 (0.0%) | 2 (100.0%) |
| Arts, Media & Entertainment | 0 (0.0%) | 0 (0.0%) |
| Health Diagnosing & Treating | 0 (0.0%) | 1 (100.0%) |
| Health Technologists | 0 (0.0%) | 0 (0.0%) |
| Total (Category) | 2 (40.0%) | 3 (60.0%) |
| Total (Overall) | 12 (63.2%) | 7 (36.8%) |
Services Occupations
Services Occupations by Sex
| Occupation | Male | Female |
| Healthcare Support | 0 (0.0%) | 0 (0.0%) |
| Security & Protection | 0 (0.0%) | 0 (0.0%) |
| Firefighting & Prevention | 0 (0.0%) | 0 (0.0%) |
| Law Enforcement | 0 (0.0%) | 0 (0.0%) |
| Food Preparation & Serving | 0 (0.0%) | 0 (0.0%) |
| Cleaning & Maintenance | 0 (0.0%) | 0 (0.0%) |
| Personal Care & Service | 0 (0.0%) | 0 (0.0%) |
| Total (Category) | 0 (0.0%) | 0 (0.0%) |
| Total (Overall) | 12 (63.2%) | 7 (36.8%) |
Sales and Office Occupations
The most common Sales and Office occupations in Primrose are , and Office & Administration (4 | 21.0%).
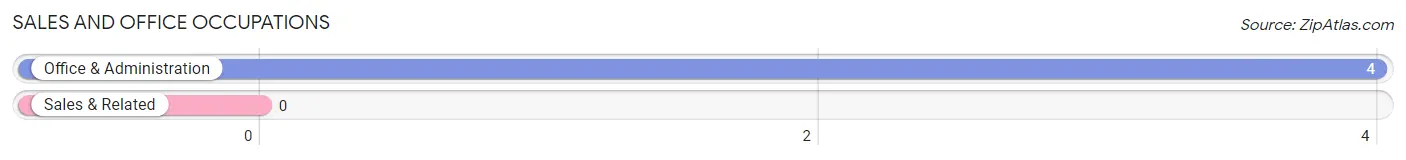
Sales and Office Occupations by Sex
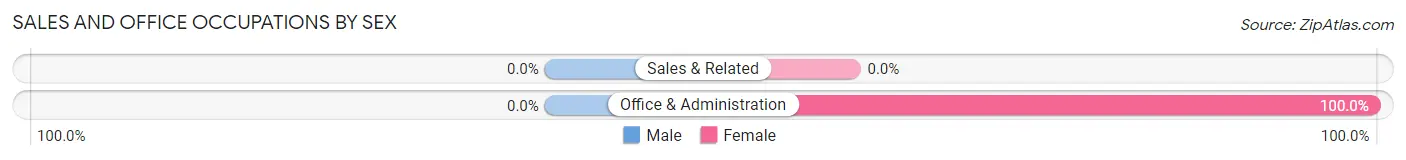
| Occupation | Male | Female |
| Sales & Related | 0 (0.0%) | 0 (0.0%) |
| Office & Administration | 0 (0.0%) | 4 (100.0%) |
| Total (Category) | 0 (0.0%) | 4 (100.0%) |
| Total (Overall) | 12 (63.2%) | 7 (36.8%) |
Natural Resources, Construction and Maintenance Occupations
The most common Natural Resources, Construction and Maintenance occupations in Primrose are Farming, Fishing & Forestry (4 | 21.0%), Construction & Extraction (1 | 5.3%), and Installation, Maintenance & Repair (1 | 5.3%).
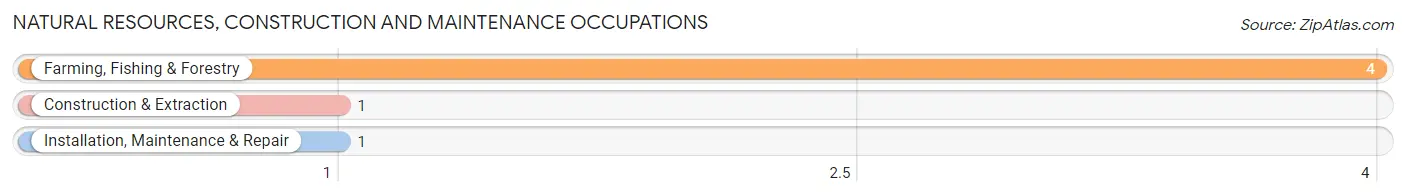
Natural Resources, Construction and Maintenance Occupations by Sex
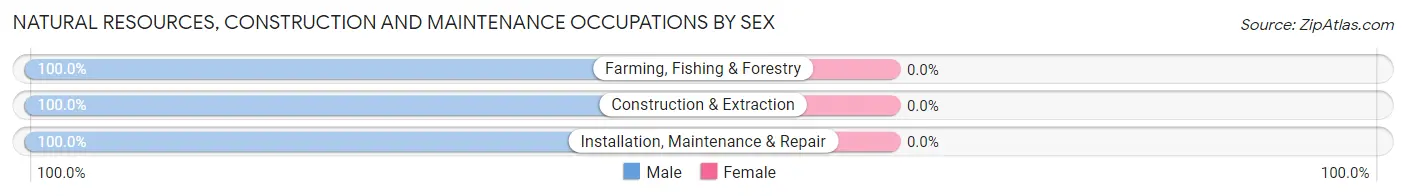
| Occupation | Male | Female |
| Farming, Fishing & Forestry | 4 (100.0%) | 0 (0.0%) |
| Construction & Extraction | 1 (100.0%) | 0 (0.0%) |
| Installation, Maintenance & Repair | 1 (100.0%) | 0 (0.0%) |
| Total (Category) | 6 (100.0%) | 0 (0.0%) |
| Total (Overall) | 12 (63.2%) | 7 (36.8%) |
Production, Transportation and Moving Occupations
The most common Production, Transportation and Moving occupations in Primrose are , and Production (4 | 21.0%).
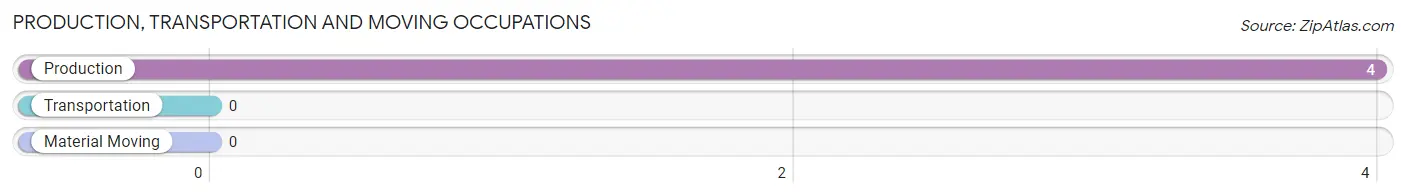
Production, Transportation and Moving Occupations by Sex
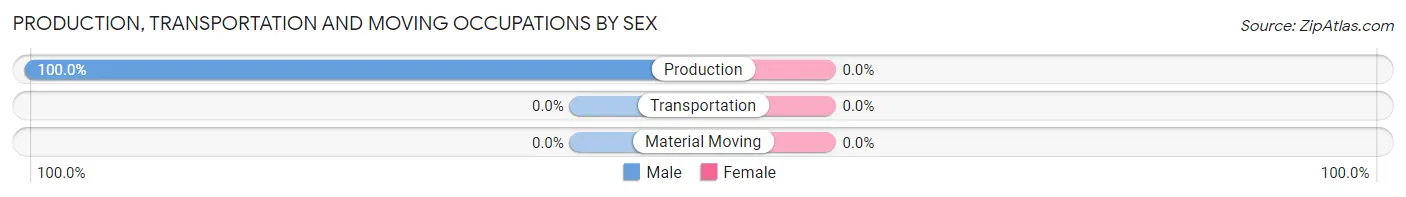
| Occupation | Male | Female |
| Production | 4 (100.0%) | 0 (0.0%) |
| Transportation | 0 (0.0%) | 0 (0.0%) |
| Material Moving | 0 (0.0%) | 0 (0.0%) |
| Total (Category) | 4 (100.0%) | 0 (0.0%) |
| Total (Overall) | 12 (63.2%) | 7 (36.8%) |
Employment Industries by Sex in Primrose
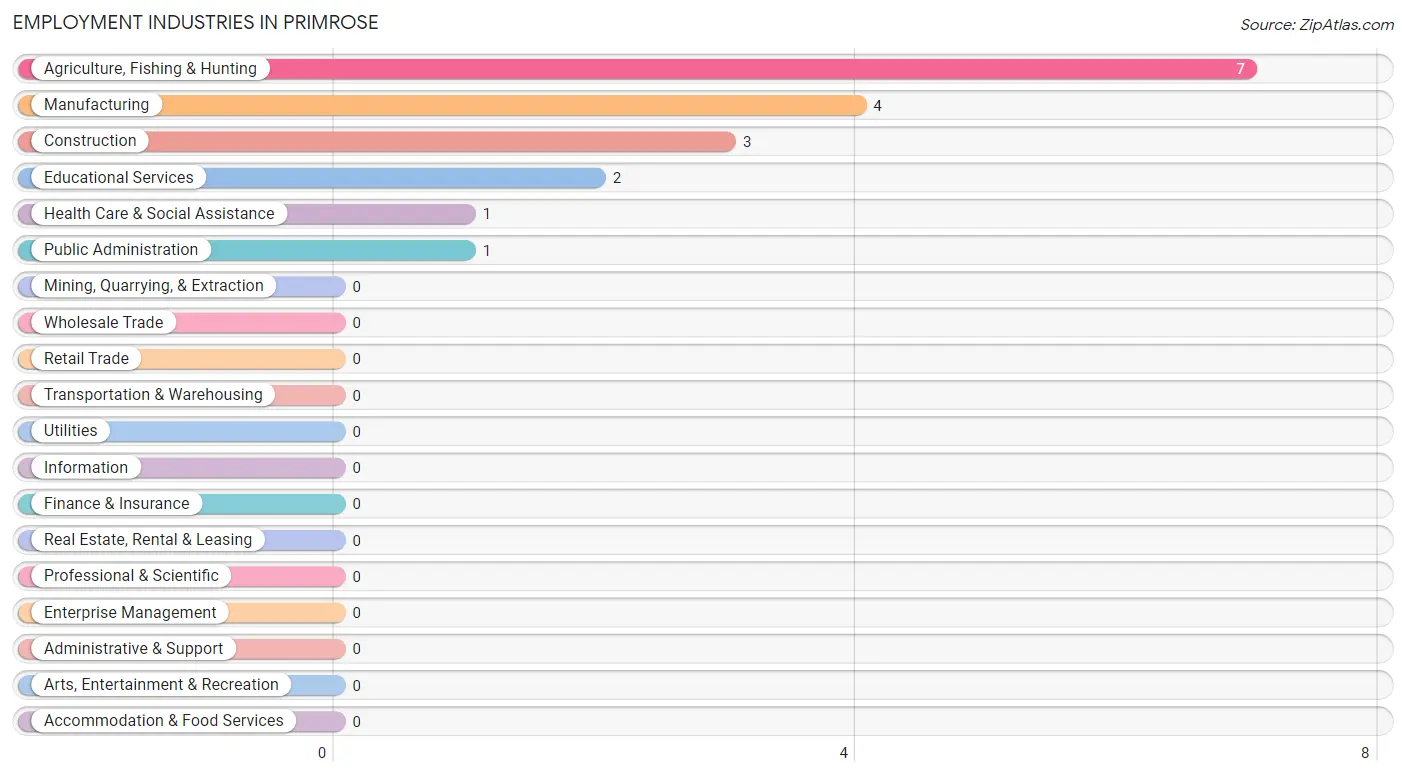
Employment Industries in Primrose
The major employment industries in Primrose include Agriculture, Fishing & Hunting (7 | 36.8%), Manufacturing (4 | 21.0%), Construction (3 | 15.8%), Educational Services (2 | 10.5%), and Health Care & Social Assistance (1 | 5.3%).
Employment Industries by Sex in Primrose
The Primrose industries that see more men than women are Manufacturing (100.0%), Agriculture, Fishing & Hunting (85.7%), and Construction (33.3%), whereas the industries that tend to have a higher number of women are Educational Services (100.0%), Health Care & Social Assistance (100.0%), and Public Administration (100.0%).
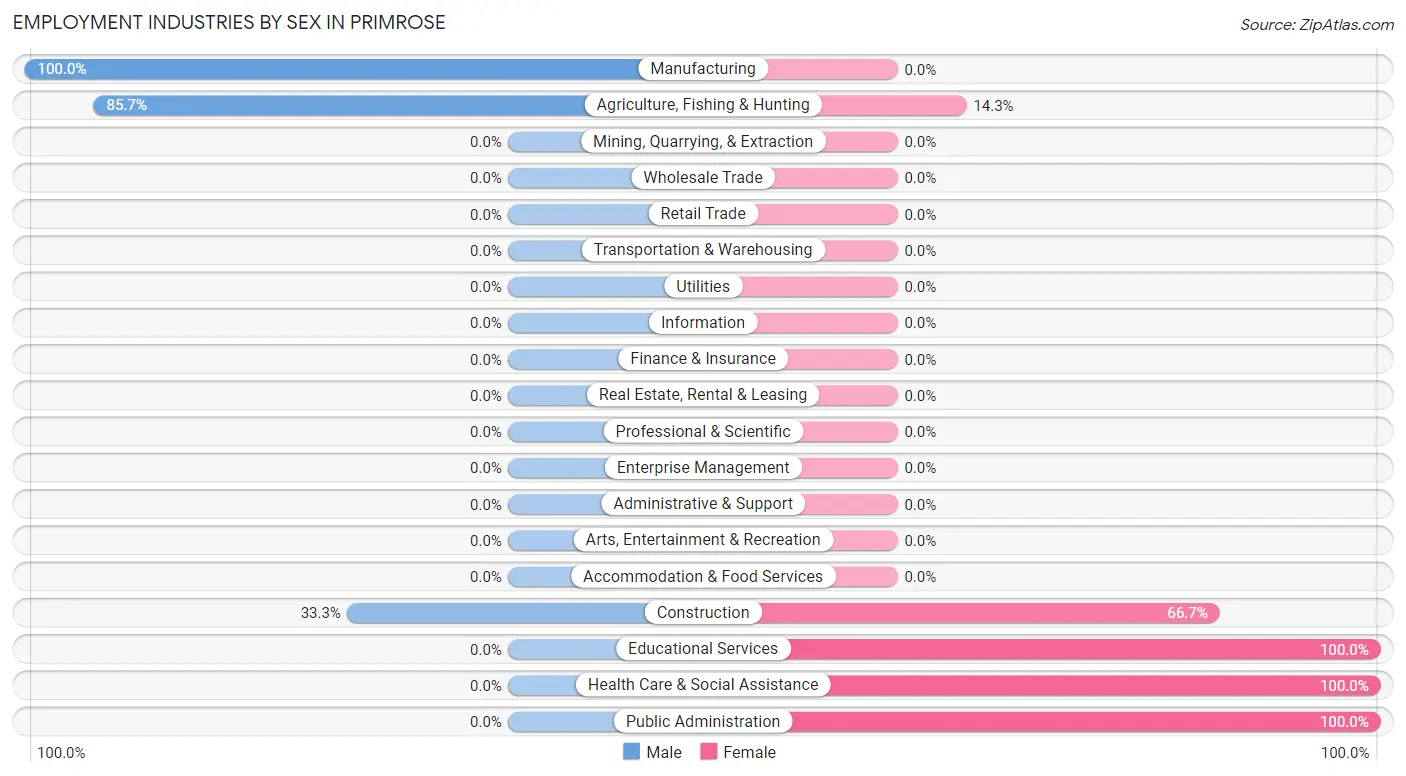
| Industry | Male | Female |
| Agriculture, Fishing & Hunting | 6 (85.7%) | 1 (14.3%) |
| Mining, Quarrying, & Extraction | 0 (0.0%) | 0 (0.0%) |
| Construction | 1 (33.3%) | 2 (66.7%) |
| Manufacturing | 4 (100.0%) | 0 (0.0%) |
| Wholesale Trade | 0 (0.0%) | 0 (0.0%) |
| Retail Trade | 0 (0.0%) | 0 (0.0%) |
| Transportation & Warehousing | 0 (0.0%) | 0 (0.0%) |
| Utilities | 0 (0.0%) | 0 (0.0%) |
| Information | 0 (0.0%) | 0 (0.0%) |
| Finance & Insurance | 0 (0.0%) | 0 (0.0%) |
| Real Estate, Rental & Leasing | 0 (0.0%) | 0 (0.0%) |
| Professional & Scientific | 0 (0.0%) | 0 (0.0%) |
| Enterprise Management | 0 (0.0%) | 0 (0.0%) |
| Administrative & Support | 0 (0.0%) | 0 (0.0%) |
| Educational Services | 0 (0.0%) | 2 (100.0%) |
| Health Care & Social Assistance | 0 (0.0%) | 1 (100.0%) |
| Arts, Entertainment & Recreation | 0 (0.0%) | 0 (0.0%) |
| Accommodation & Food Services | 0 (0.0%) | 0 (0.0%) |
| Public Administration | 0 (0.0%) | 1 (100.0%) |
| Total | 12 (63.2%) | 7 (36.8%) |
Education in Primrose
School Enrollment in Primrose
The most common levels of schooling among the 10 students in Primrose are high school (7 | 70.0%), and middle school (3 | 30.0%).
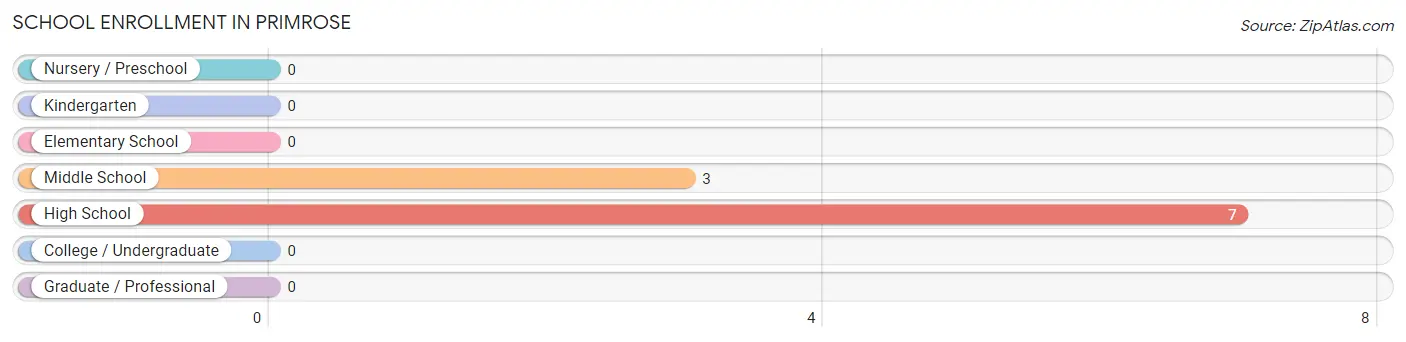
| School Level | # Students | % Students |
| Nursery / Preschool | 0 | 0.0% |
| Kindergarten | 0 | 0.0% |
| Elementary School | 0 | 0.0% |
| Middle School | 3 | 30.0% |
| High School | 7 | 70.0% |
| College / Undergraduate | 0 | 0.0% |
| Graduate / Professional | 0 | 0.0% |
| Total | 10 | 100.0% |
School Enrollment by Age by Funding Source in Primrose
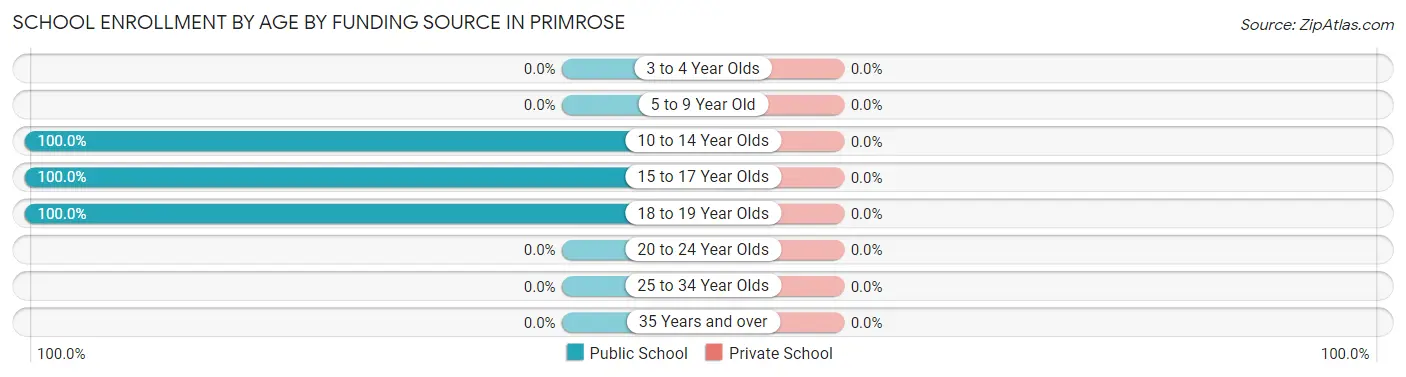
| Age Bracket | Public School | Private School |
| 3 to 4 Year Olds | 0 (0.0%) | 0 (0.0%) |
| 5 to 9 Year Old | 0 (0.0%) | 0 (0.0%) |
| 10 to 14 Year Olds | 3 (100.0%) | 0 (0.0%) |
| 15 to 17 Year Olds | 2 (100.0%) | 0 (0.0%) |
| 18 to 19 Year Olds | 5 (100.0%) | 0 (0.0%) |
| 20 to 24 Year Olds | 0 (0.0%) | 0 (0.0%) |
| 25 to 34 Year Olds | 0 (0.0%) | 0 (0.0%) |
| 35 Years and over | 0 (0.0%) | 0 (0.0%) |
| Total | 10 (100.0%) | 0 (0.0%) |
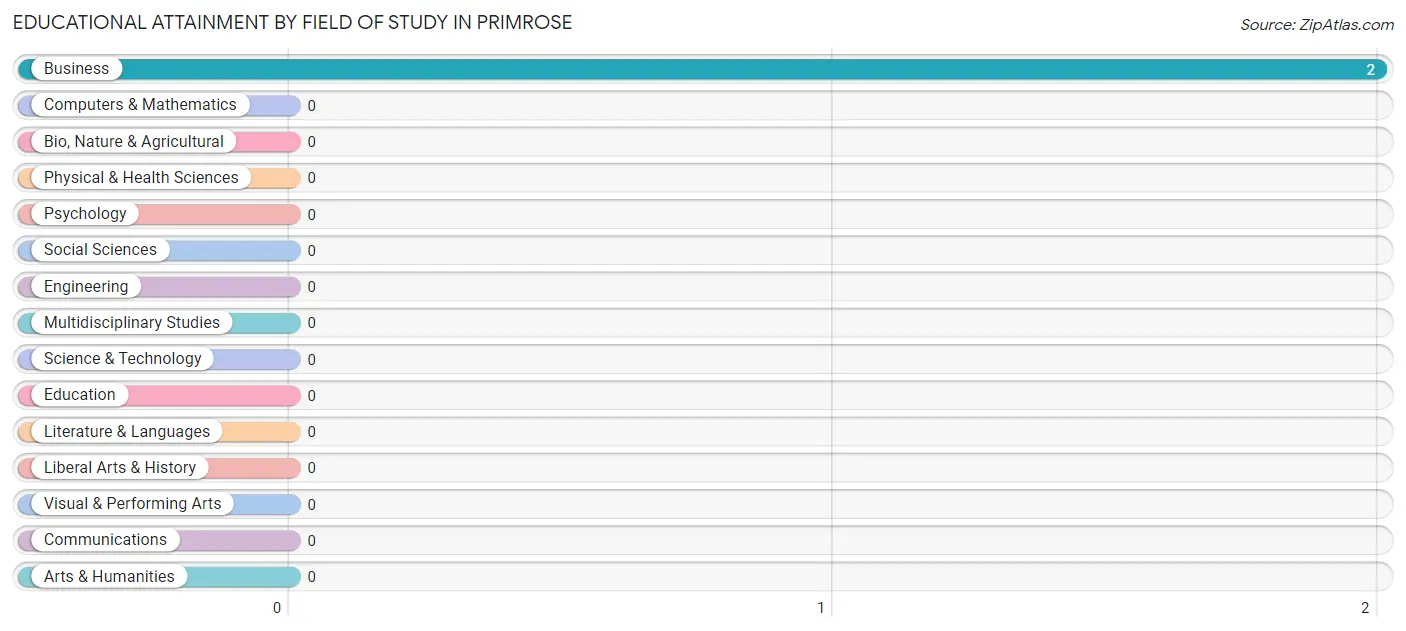
Educational Attainment by Field of Study in Primrose
, and business (2 | 100.0%) are the most common fields of study among 2 individuals in Primrose who have obtained a bachelor's degree or higher.
| Field of Study | # Graduates | % Graduates |
| Computers & Mathematics | 0 | 0.0% |
| Bio, Nature & Agricultural | 0 | 0.0% |
| Physical & Health Sciences | 0 | 0.0% |
| Psychology | 0 | 0.0% |
| Social Sciences | 0 | 0.0% |
| Engineering | 0 | 0.0% |
| Multidisciplinary Studies | 0 | 0.0% |
| Science & Technology | 0 | 0.0% |
| Business | 2 | 100.0% |
| Education | 0 | 0.0% |
| Literature & Languages | 0 | 0.0% |
| Liberal Arts & History | 0 | 0.0% |
| Visual & Performing Arts | 0 | 0.0% |
| Communications | 0 | 0.0% |
| Arts & Humanities | 0 | 0.0% |
| Total | 2 | 100.0% |
Transportation & Commute in Primrose
Vehicle Availability by Sex in Primrose
The most prevalent vehicle ownership categories in Primrose are males with 3 vehicles (5, accounting for 41.7%) and females with 3 vehicles (5, making up 71.4%).
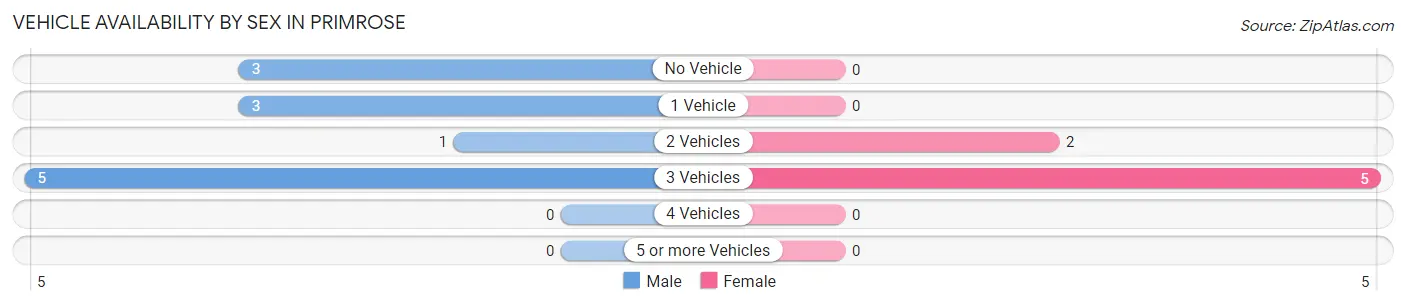
| Vehicles Available | Male | Female |
| No Vehicle | 3 (25.0%) | 0 (0.0%) |
| 1 Vehicle | 3 (25.0%) | 0 (0.0%) |
| 2 Vehicles | 1 (8.3%) | 2 (28.6%) |
| 3 Vehicles | 5 (41.7%) | 5 (71.4%) |
| 4 Vehicles | 0 (0.0%) | 0 (0.0%) |
| 5 or more Vehicles | 0 (0.0%) | 0 (0.0%) |
| Total | 12 (100.0%) | 7 (100.0%) |
Commute Time in Primrose
The most frequently occuring commute durations in Primrose are 10 to 14 minutes (5 commuters, 26.3%), 5 to 9 minutes (3 commuters, 15.8%), and 20 to 24 minutes (3 commuters, 15.8%).
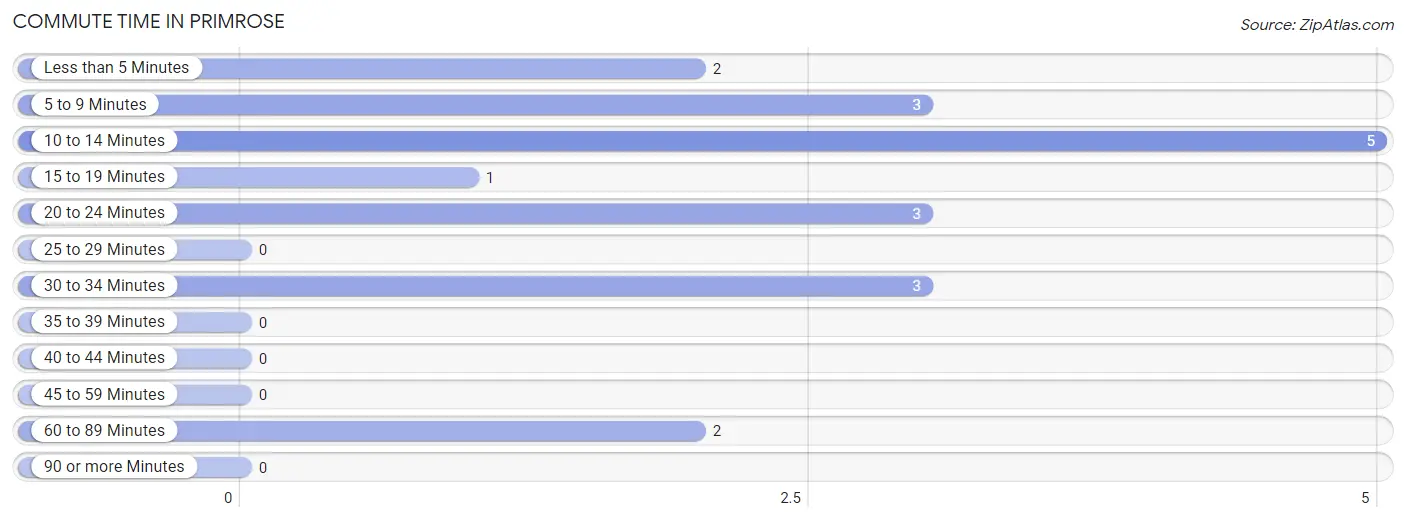
| Commute Time | # Commuters | % Commuters |
| Less than 5 Minutes | 2 | 10.5% |
| 5 to 9 Minutes | 3 | 15.8% |
| 10 to 14 Minutes | 5 | 26.3% |
| 15 to 19 Minutes | 1 | 5.3% |
| 20 to 24 Minutes | 3 | 15.8% |
| 25 to 29 Minutes | 0 | 0.0% |
| 30 to 34 Minutes | 3 | 15.8% |
| 35 to 39 Minutes | 0 | 0.0% |
| 40 to 44 Minutes | 0 | 0.0% |
| 45 to 59 Minutes | 0 | 0.0% |
| 60 to 89 Minutes | 2 | 10.5% |
| 90 or more Minutes | 0 | 0.0% |
Commute Time by Sex in Primrose
The most common commute times in Primrose are 10 to 14 minutes (5 commuters, 41.7%) for males and 20 to 24 minutes (3 commuters, 42.9%) for females.
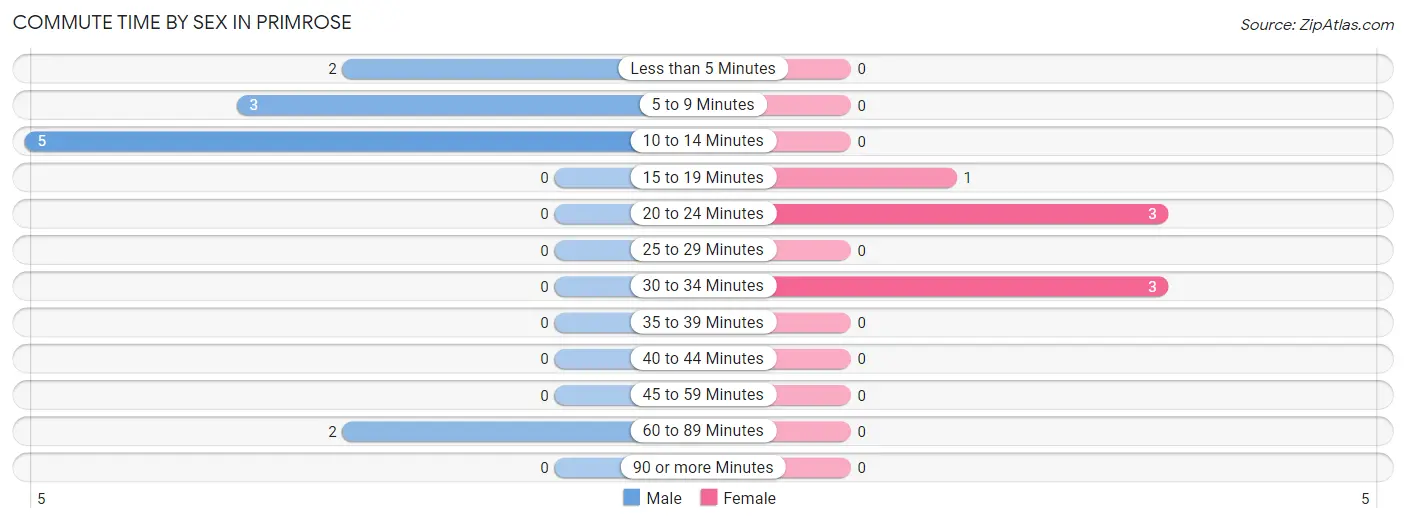
| Commute Time | Male | Female |
| Less than 5 Minutes | 2 (16.7%) | 0 (0.0%) |
| 5 to 9 Minutes | 3 (25.0%) | 0 (0.0%) |
| 10 to 14 Minutes | 5 (41.7%) | 0 (0.0%) |
| 15 to 19 Minutes | 0 (0.0%) | 1 (14.3%) |
| 20 to 24 Minutes | 0 (0.0%) | 3 (42.9%) |
| 25 to 29 Minutes | 0 (0.0%) | 0 (0.0%) |
| 30 to 34 Minutes | 0 (0.0%) | 3 (42.9%) |
| 35 to 39 Minutes | 0 (0.0%) | 0 (0.0%) |
| 40 to 44 Minutes | 0 (0.0%) | 0 (0.0%) |
| 45 to 59 Minutes | 0 (0.0%) | 0 (0.0%) |
| 60 to 89 Minutes | 2 (16.7%) | 0 (0.0%) |
| 90 or more Minutes | 0 (0.0%) | 0 (0.0%) |
Time of Departure to Work by Sex in Primrose
The most frequent times of departure to work in Primrose are 7:30 AM to 7:59 AM (5, 41.7%) for males and 5:00 AM to 5:29 AM (3, 42.9%) for females.
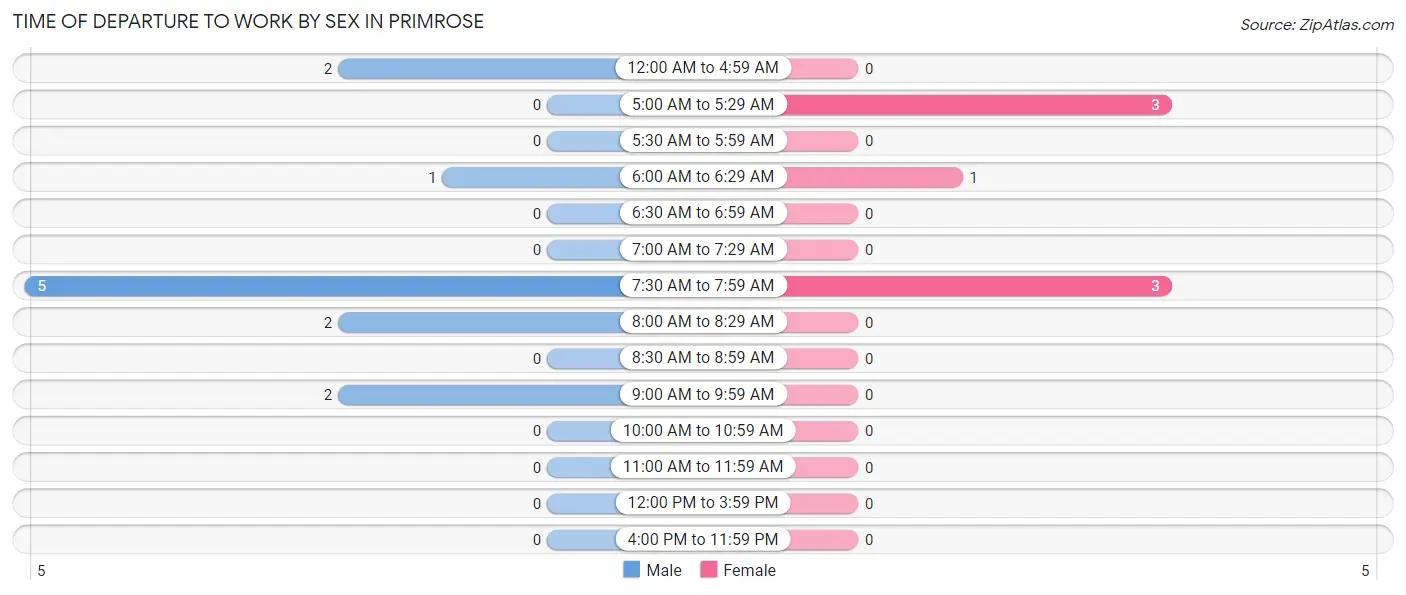
| Time of Departure | Male | Female |
| 12:00 AM to 4:59 AM | 2 (16.7%) | 0 (0.0%) |
| 5:00 AM to 5:29 AM | 0 (0.0%) | 3 (42.9%) |
| 5:30 AM to 5:59 AM | 0 (0.0%) | 0 (0.0%) |
| 6:00 AM to 6:29 AM | 1 (8.3%) | 1 (14.3%) |
| 6:30 AM to 6:59 AM | 0 (0.0%) | 0 (0.0%) |
| 7:00 AM to 7:29 AM | 0 (0.0%) | 0 (0.0%) |
| 7:30 AM to 7:59 AM | 5 (41.7%) | 3 (42.9%) |
| 8:00 AM to 8:29 AM | 2 (16.7%) | 0 (0.0%) |
| 8:30 AM to 8:59 AM | 0 (0.0%) | 0 (0.0%) |
| 9:00 AM to 9:59 AM | 2 (16.7%) | 0 (0.0%) |
| 10:00 AM to 10:59 AM | 0 (0.0%) | 0 (0.0%) |
| 11:00 AM to 11:59 AM | 0 (0.0%) | 0 (0.0%) |
| 12:00 PM to 3:59 PM | 0 (0.0%) | 0 (0.0%) |
| 4:00 PM to 11:59 PM | 0 (0.0%) | 0 (0.0%) |
| Total | 12 (100.0%) | 7 (100.0%) |
Housing Occupancy in Primrose
Occupancy by Ownership in Primrose
Of the total 25 dwellings in Primrose, owner-occupied units account for 23 (92.0%), while renter-occupied units make up 2 (8.0%).
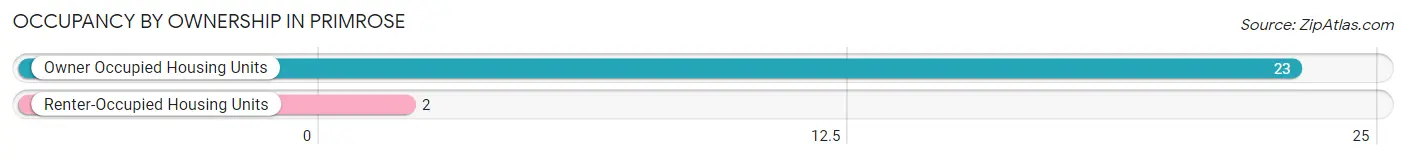
| Occupancy | # Housing Units | % Housing Units |
| Owner Occupied Housing Units | 23 | 92.0% |
| Renter-Occupied Housing Units | 2 | 8.0% |
| Total Occupied Housing Units | 25 | 100.0% |
Occupancy by Household Size in Primrose
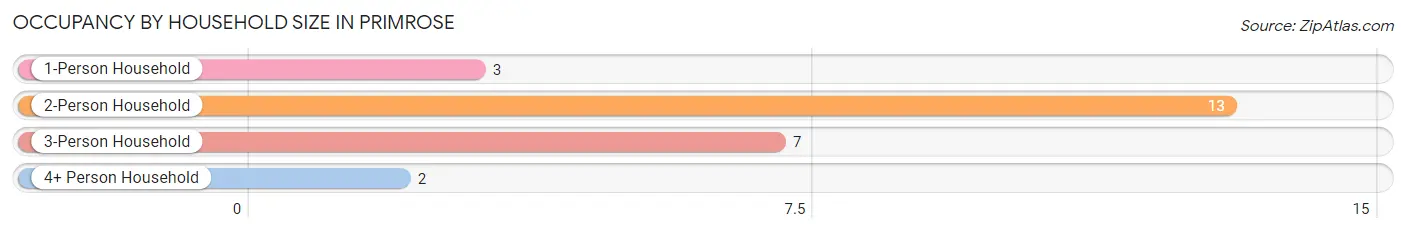
| Household Size | # Housing Units | % Housing Units |
| 1-Person Household | 3 | 12.0% |
| 2-Person Household | 13 | 52.0% |
| 3-Person Household | 7 | 28.0% |
| 4+ Person Household | 2 | 8.0% |
| Total Housing Units | 25 | 100.0% |
Occupancy by Ownership by Household Size in Primrose
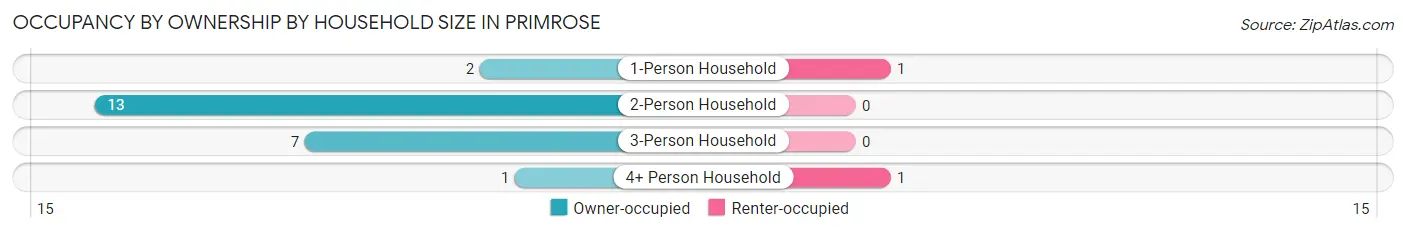
| Household Size | Owner-occupied | Renter-occupied |
| 1-Person Household | 2 (66.7%) | 1 (33.3%) |
| 2-Person Household | 13 (100.0%) | 0 (0.0%) |
| 3-Person Household | 7 (100.0%) | 0 (0.0%) |
| 4+ Person Household | 1 (50.0%) | 1 (50.0%) |
| Total Housing Units | 23 (92.0%) | 2 (8.0%) |
Occupancy by Educational Attainment in Primrose
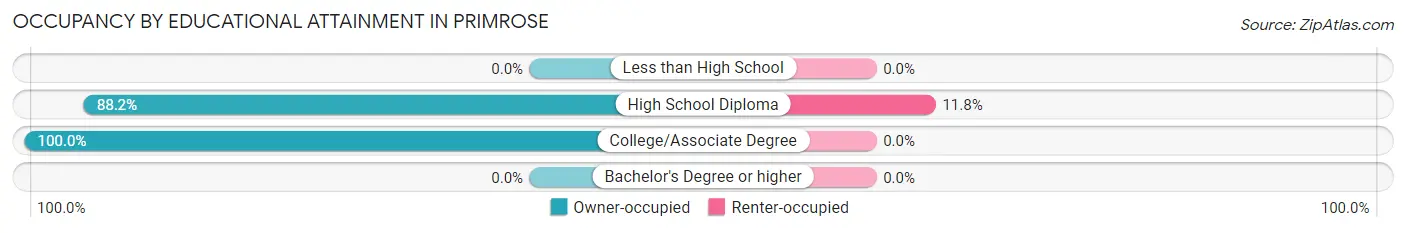
| Household Size | Owner-occupied | Renter-occupied |
| Less than High School | 0 (0.0%) | 0 (0.0%) |
| High School Diploma | 15 (88.2%) | 2 (11.8%) |
| College/Associate Degree | 8 (100.0%) | 0 (0.0%) |
| Bachelor's Degree or higher | 0 (0.0%) | 0 (0.0%) |
Occupancy by Age of Householder in Primrose
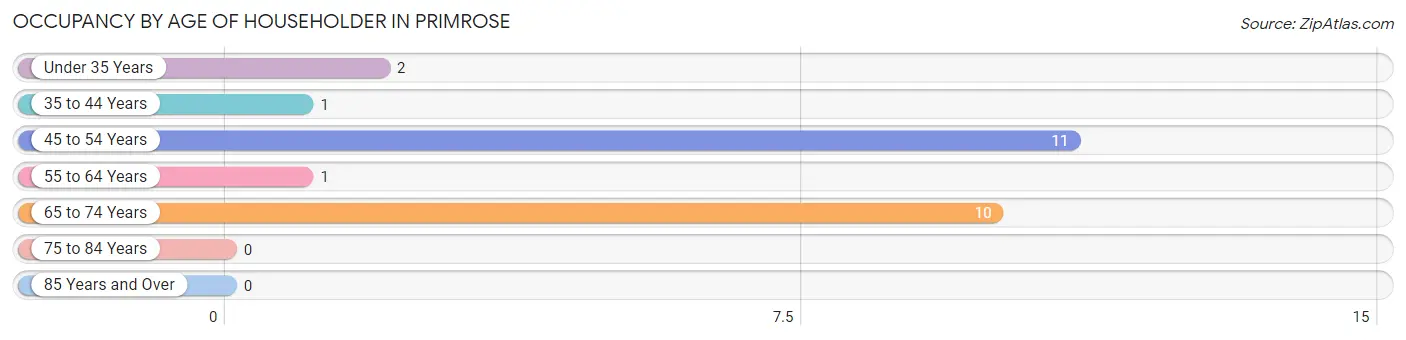
| Age Bracket | # Households | % Households |
| Under 35 Years | 2 | 8.0% |
| 35 to 44 Years | 1 | 4.0% |
| 45 to 54 Years | 11 | 44.0% |
| 55 to 64 Years | 1 | 4.0% |
| 65 to 74 Years | 10 | 40.0% |
| 75 to 84 Years | 0 | 0.0% |
| 85 Years and Over | 0 | 0.0% |
| Total | 25 | 100.0% |
Housing Finances in Primrose
Median Income by Occupancy in Primrose
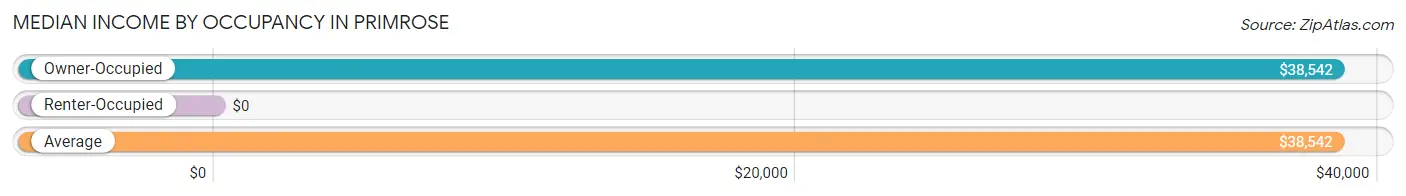
| Occupancy Type | # Households | Median Income |
| Owner-Occupied | 23 (92.0%) | $38,542 |
| Renter-Occupied | 2 (8.0%) | $0 |
| Average | 25 (100.0%) | $38,542 |
Occupancy by Householder Income Bracket in Primrose
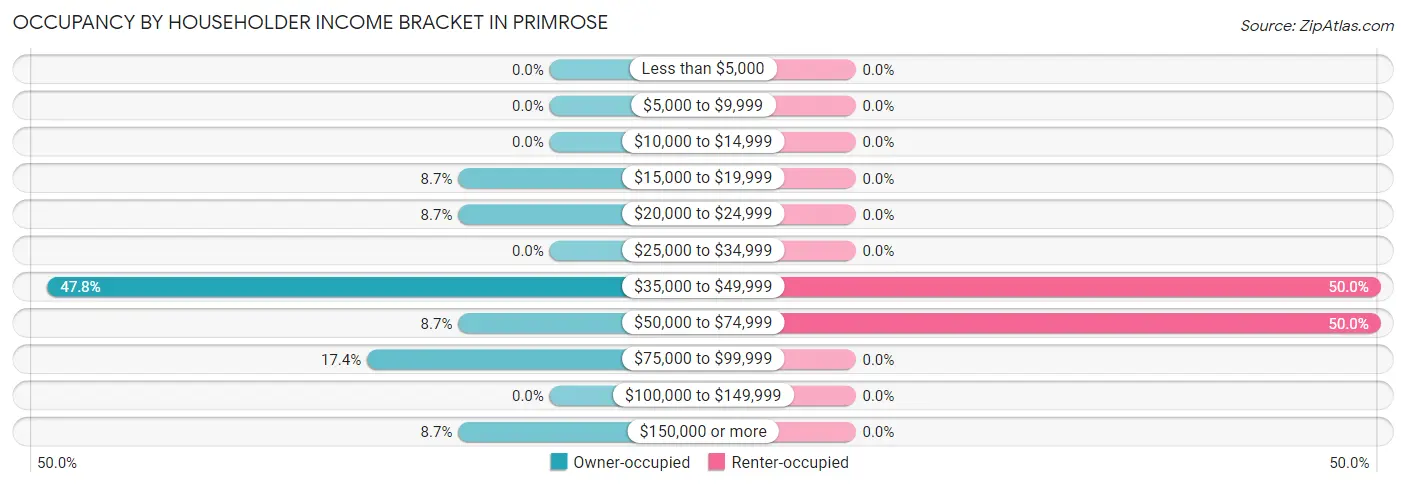
| Income Bracket | Owner-occupied | Renter-occupied |
| Less than $5,000 | 0 (0.0%) | 0 (0.0%) |
| $5,000 to $9,999 | 0 (0.0%) | 0 (0.0%) |
| $10,000 to $14,999 | 0 (0.0%) | 0 (0.0%) |
| $15,000 to $19,999 | 2 (8.7%) | 0 (0.0%) |
| $20,000 to $24,999 | 2 (8.7%) | 0 (0.0%) |
| $25,000 to $34,999 | 0 (0.0%) | 0 (0.0%) |
| $35,000 to $49,999 | 11 (47.8%) | 1 (50.0%) |
| $50,000 to $74,999 | 2 (8.7%) | 1 (50.0%) |
| $75,000 to $99,999 | 4 (17.4%) | 0 (0.0%) |
| $100,000 to $149,999 | 0 (0.0%) | 0 (0.0%) |
| $150,000 or more | 2 (8.7%) | 0 (0.0%) |
| Total | 23 (100.0%) | 2 (100.0%) |
Monthly Housing Cost Tiers in Primrose
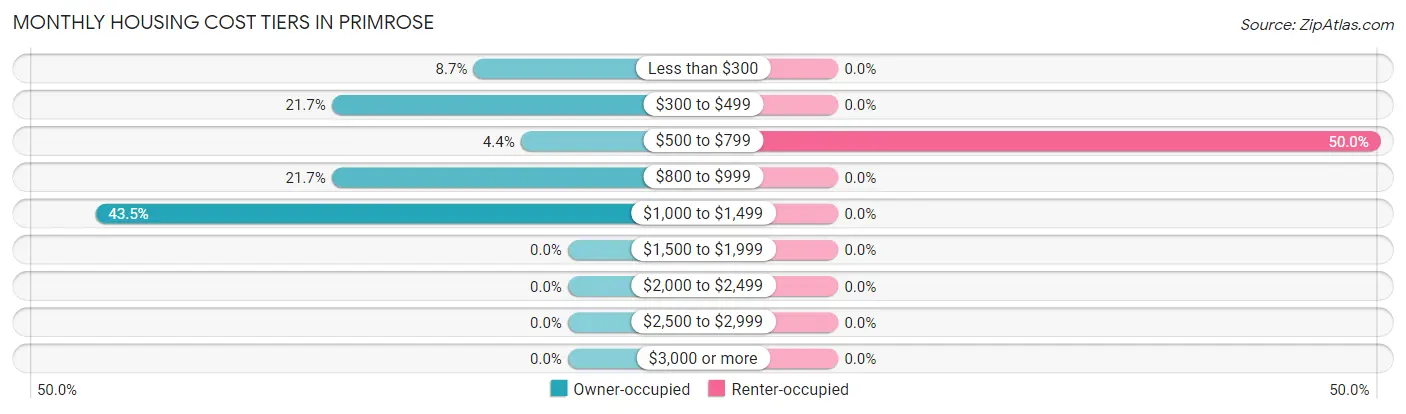
| Monthly Cost | Owner-occupied | Renter-occupied |
| Less than $300 | 2 (8.7%) | 0 (0.0%) |
| $300 to $499 | 5 (21.7%) | 0 (0.0%) |
| $500 to $799 | 1 (4.3%) | 1 (50.0%) |
| $800 to $999 | 5 (21.7%) | 0 (0.0%) |
| $1,000 to $1,499 | 10 (43.5%) | 0 (0.0%) |
| $1,500 to $1,999 | 0 (0.0%) | 0 (0.0%) |
| $2,000 to $2,499 | 0 (0.0%) | 0 (0.0%) |
| $2,500 to $2,999 | 0 (0.0%) | 0 (0.0%) |
| $3,000 or more | 0 (0.0%) | 0 (0.0%) |
| Total | 23 (100.0%) | 2 (100.0%) |
Physical Housing Characteristics in Primrose
Housing Structures in Primrose
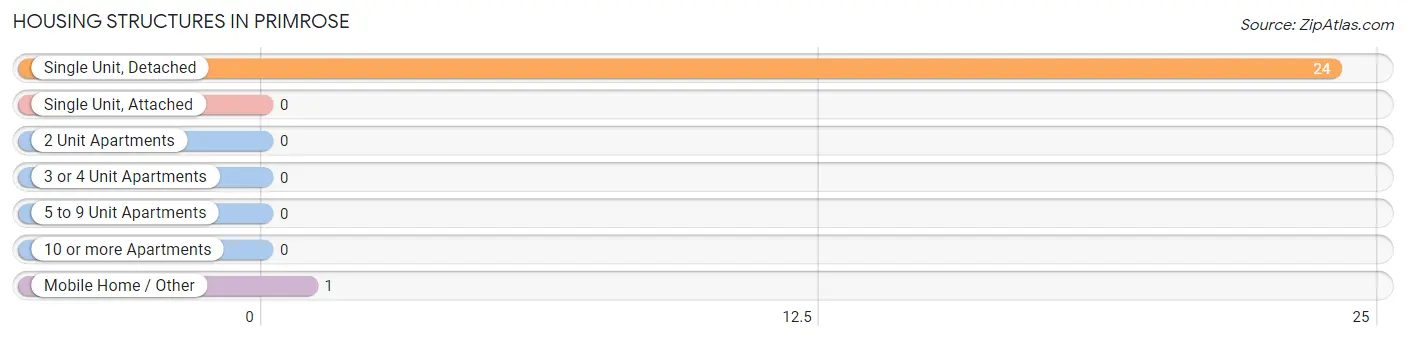
| Structure Type | # Housing Units | % Housing Units |
| Single Unit, Detached | 24 | 96.0% |
| Single Unit, Attached | 0 | 0.0% |
| 2 Unit Apartments | 0 | 0.0% |
| 3 or 4 Unit Apartments | 0 | 0.0% |
| 5 to 9 Unit Apartments | 0 | 0.0% |
| 10 or more Apartments | 0 | 0.0% |
| Mobile Home / Other | 1 | 4.0% |
| Total | 25 | 100.0% |
Housing Structures by Occupancy in Primrose
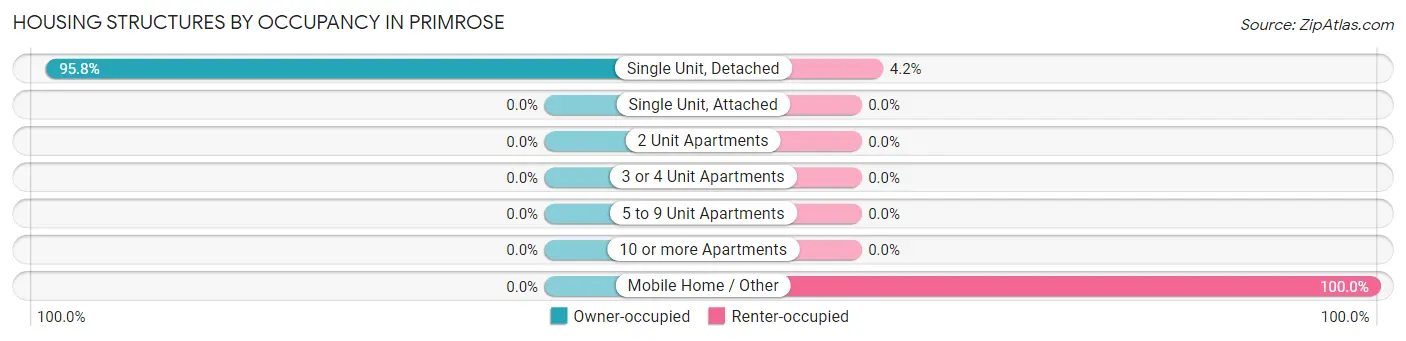
| Structure Type | Owner-occupied | Renter-occupied |
| Single Unit, Detached | 23 (95.8%) | 1 (4.2%) |
| Single Unit, Attached | 0 (0.0%) | 0 (0.0%) |
| 2 Unit Apartments | 0 (0.0%) | 0 (0.0%) |
| 3 or 4 Unit Apartments | 0 (0.0%) | 0 (0.0%) |
| 5 to 9 Unit Apartments | 0 (0.0%) | 0 (0.0%) |
| 10 or more Apartments | 0 (0.0%) | 0 (0.0%) |
| Mobile Home / Other | 0 (0.0%) | 1 (100.0%) |
| Total | 23 (92.0%) | 2 (8.0%) |
Housing Structures by Number of Rooms in Primrose
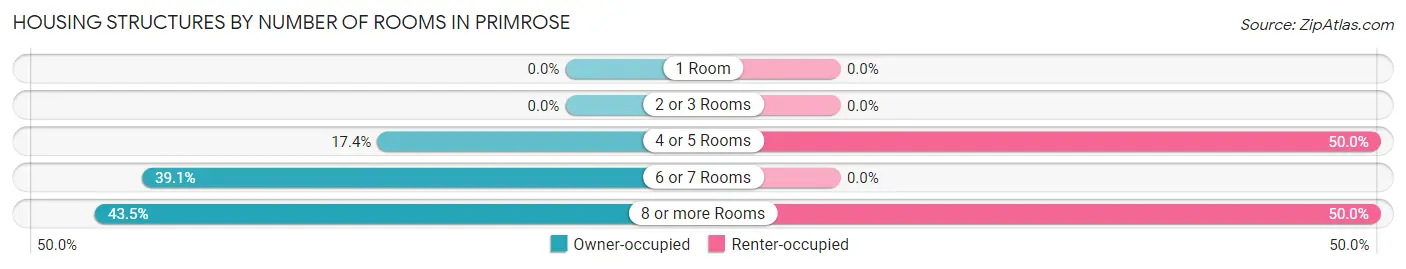
| Number of Rooms | Owner-occupied | Renter-occupied |
| 1 Room | 0 (0.0%) | 0 (0.0%) |
| 2 or 3 Rooms | 0 (0.0%) | 0 (0.0%) |
| 4 or 5 Rooms | 4 (17.4%) | 1 (50.0%) |
| 6 or 7 Rooms | 9 (39.1%) | 0 (0.0%) |
| 8 or more Rooms | 10 (43.5%) | 1 (50.0%) |
| Total | 23 (100.0%) | 2 (100.0%) |
Housing Structure by Heating Type in Primrose
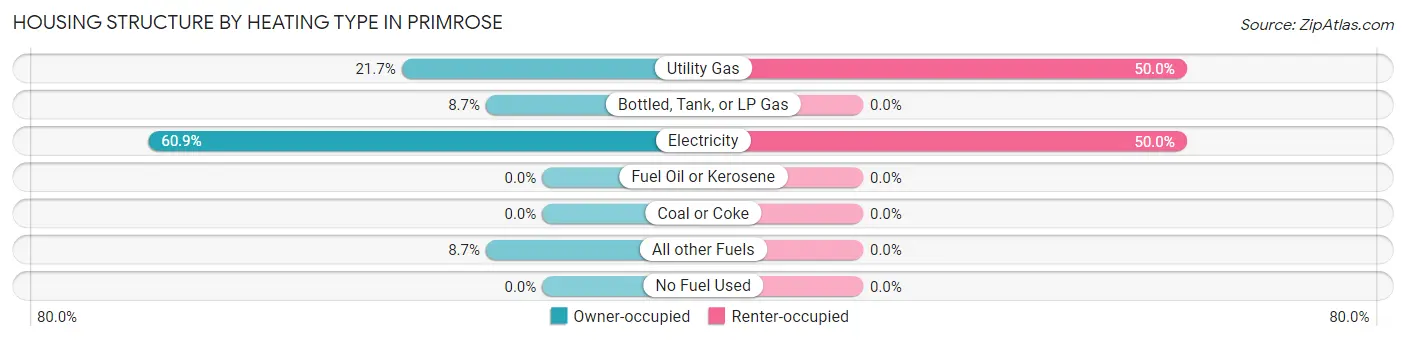
| Heating Type | Owner-occupied | Renter-occupied |
| Utility Gas | 5 (21.7%) | 1 (50.0%) |
| Bottled, Tank, or LP Gas | 2 (8.7%) | 0 (0.0%) |
| Electricity | 14 (60.9%) | 1 (50.0%) |
| Fuel Oil or Kerosene | 0 (0.0%) | 0 (0.0%) |
| Coal or Coke | 0 (0.0%) | 0 (0.0%) |
| All other Fuels | 2 (8.7%) | 0 (0.0%) |
| No Fuel Used | 0 (0.0%) | 0 (0.0%) |
| Total | 23 (100.0%) | 2 (100.0%) |
Household Vehicle Usage in Primrose
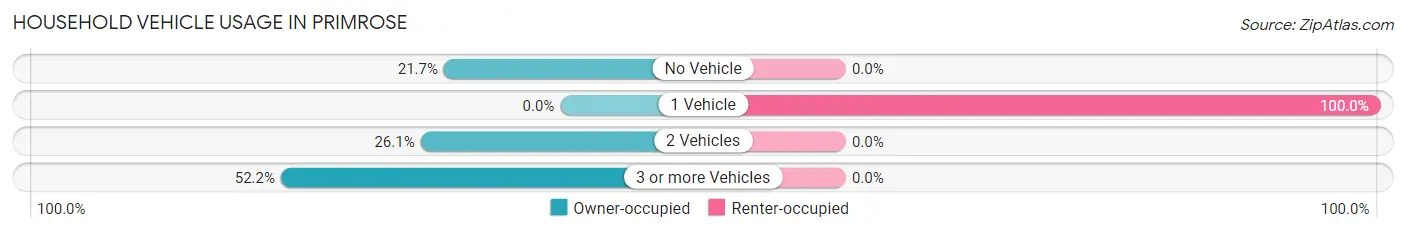
| Vehicles per Household | Owner-occupied | Renter-occupied |
| No Vehicle | 5 (21.7%) | 0 (0.0%) |
| 1 Vehicle | 0 (0.0%) | 2 (100.0%) |
| 2 Vehicles | 6 (26.1%) | 0 (0.0%) |
| 3 or more Vehicles | 12 (52.2%) | 0 (0.0%) |
| Total | 23 (100.0%) | 2 (100.0%) |
Real Estate & Mortgages in Primrose
Real Estate and Mortgage Overview in Primrose
| Characteristic | Without Mortgage | With Mortgage |
| Housing Units | 16 | 7 |
| Median Property Value | - | - |
| Median Household Income | $37,000 | $2 |
| Monthly Housing Costs | - | - |
| Real Estate Taxes | - | - |
Property Value by Mortgage Status in Primrose
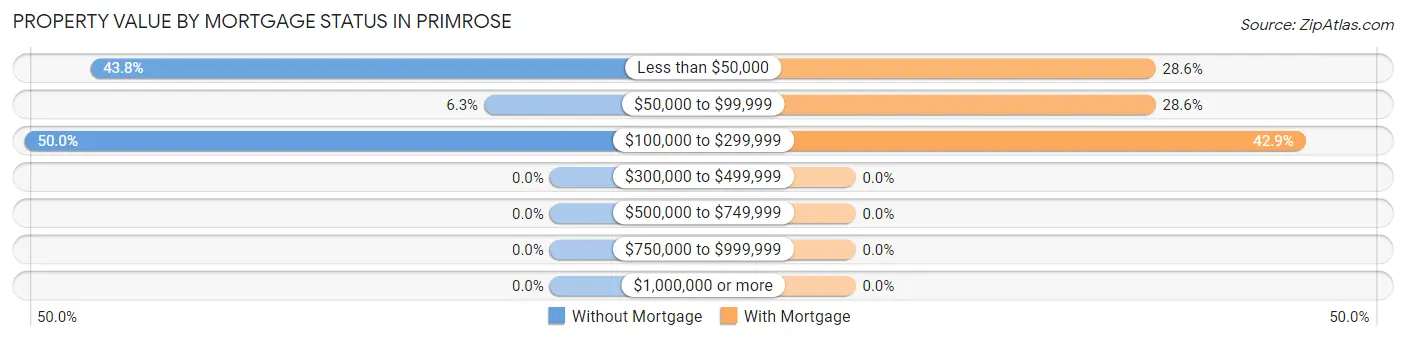
| Property Value | Without Mortgage | With Mortgage |
| Less than $50,000 | 7 (43.8%) | 2 (28.6%) |
| $50,000 to $99,999 | 1 (6.2%) | 2 (28.6%) |
| $100,000 to $299,999 | 8 (50.0%) | 3 (42.9%) |
| $300,000 to $499,999 | 0 (0.0%) | 0 (0.0%) |
| $500,000 to $749,999 | 0 (0.0%) | 0 (0.0%) |
| $750,000 to $999,999 | 0 (0.0%) | 0 (0.0%) |
| $1,000,000 or more | 0 (0.0%) | 0 (0.0%) |
| Total | 16 (100.0%) | 7 (100.0%) |
Household Income by Mortgage Status in Primrose
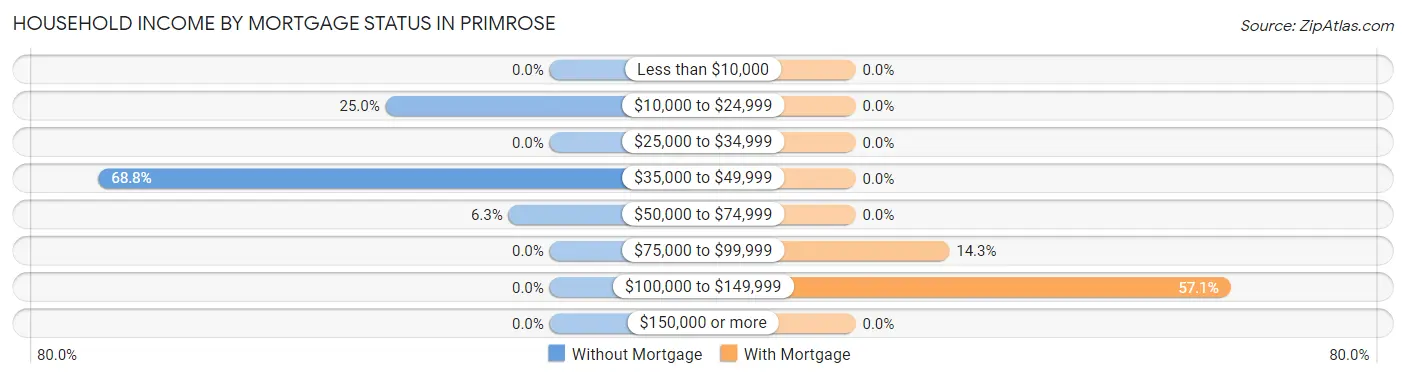
| Household Income | Without Mortgage | With Mortgage |
| Less than $10,000 | 0 (0.0%) | 0 (0.0%) |
| $10,000 to $24,999 | 4 (25.0%) | 0 (0.0%) |
| $25,000 to $34,999 | 0 (0.0%) | 0 (0.0%) |
| $35,000 to $49,999 | 11 (68.8%) | 0 (0.0%) |
| $50,000 to $74,999 | 1 (6.2%) | 0 (0.0%) |
| $75,000 to $99,999 | 0 (0.0%) | 1 (14.3%) |
| $100,000 to $149,999 | 0 (0.0%) | 4 (57.1%) |
| $150,000 or more | 0 (0.0%) | 0 (0.0%) |
| Total | 16 (100.0%) | 7 (100.0%) |
Property Value to Household Income Ratio in Primrose
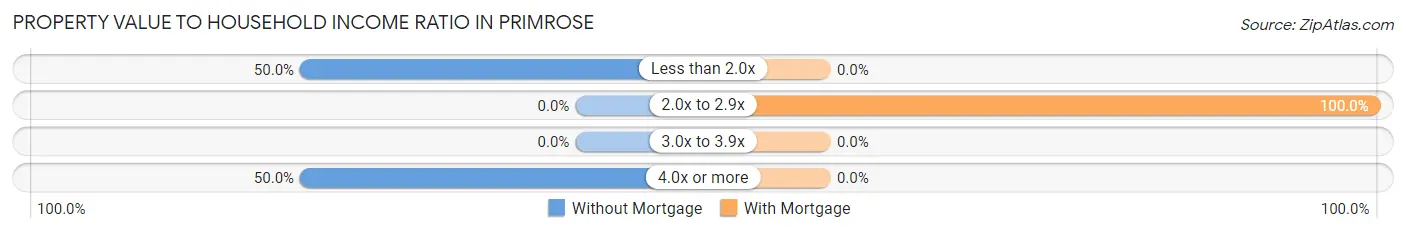
| Value-to-Income Ratio | Without Mortgage | With Mortgage |
| Less than 2.0x | 8 (50.0%) | 0 (0.0%) |
| 2.0x to 2.9x | 0 (0.0%) | 7 (100.0%) |
| 3.0x to 3.9x | 0 (0.0%) | 0 (0.0%) |
| 4.0x or more | 8 (50.0%) | 0 (0.0%) |
| Total | 16 (100.0%) | 7 (100.0%) |
Real Estate Taxes by Mortgage Status in Primrose
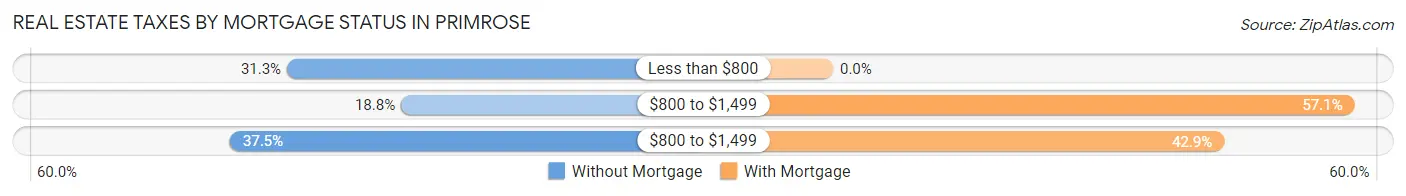
| Property Taxes | Without Mortgage | With Mortgage |
| Less than $800 | 5 (31.2%) | 0 (0.0%) |
| $800 to $1,499 | 3 (18.8%) | 4 (57.1%) |
| $800 to $1,499 | 6 (37.5%) | 3 (42.9%) |
| Total | 16 (100.0%) | 7 (100.0%) |
Health & Disability in Primrose
Health Insurance Coverage by Age in Primrose
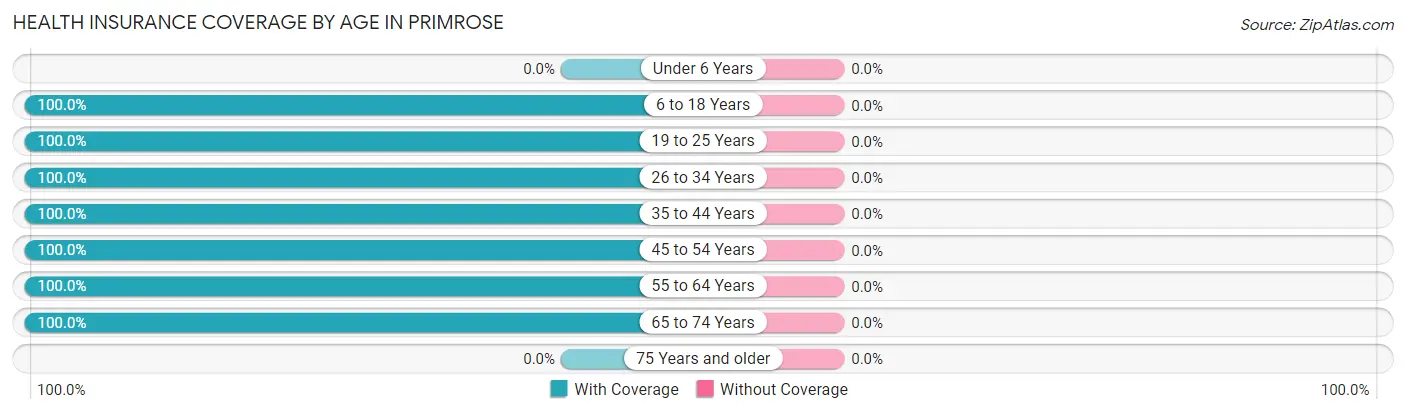
| Age Bracket | With Coverage | Without Coverage |
| Under 6 Years | 0 (0.0%) | 0 (0.0%) |
| 6 to 18 Years | 14 (100.0%) | 0 (0.0%) |
| 19 to 25 Years | 2 (100.0%) | 0 (0.0%) |
| 26 to 34 Years | 3 (100.0%) | 0 (0.0%) |
| 35 to 44 Years | 2 (100.0%) | 0 (0.0%) |
| 45 to 54 Years | 16 (100.0%) | 0 (0.0%) |
| 55 to 64 Years | 1 (100.0%) | 0 (0.0%) |
| 65 to 74 Years | 12 (100.0%) | 0 (0.0%) |
| 75 Years and older | 0 (0.0%) | 0 (0.0%) |
| Total | 50 (100.0%) | 0 (0.0%) |
Health Insurance Coverage by Citizenship Status in Primrose
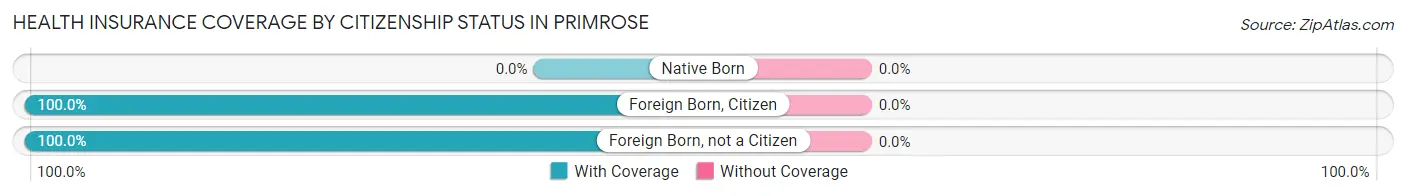
| Citizenship Status | With Coverage | Without Coverage |
| Native Born | 0 (0.0%) | 0 (0.0%) |
| Foreign Born, Citizen | 14 (100.0%) | 0 (0.0%) |
| Foreign Born, not a Citizen | 2 (100.0%) | 0 (0.0%) |
Health Insurance Coverage by Household Income in Primrose
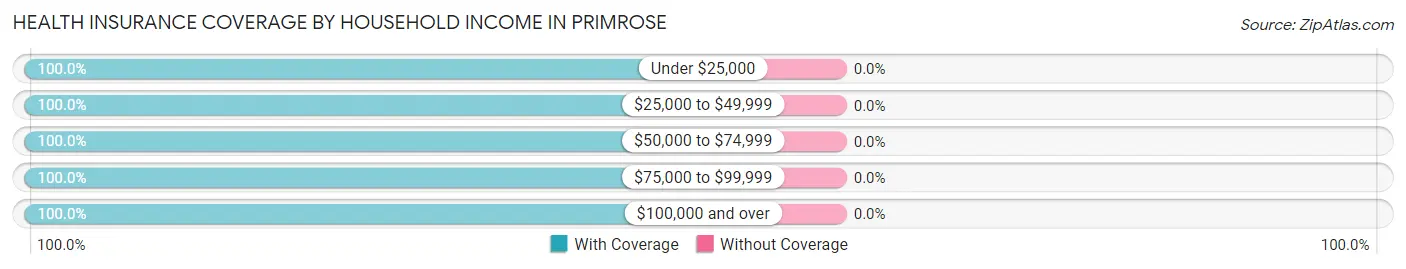
| Household Income | With Coverage | Without Coverage |
| Under $25,000 | 5 (100.0%) | 0 (0.0%) |
| $25,000 to $49,999 | 24 (100.0%) | 0 (0.0%) |
| $50,000 to $74,999 | 10 (100.0%) | 0 (0.0%) |
| $75,000 to $99,999 | 8 (100.0%) | 0 (0.0%) |
| $100,000 and over | 3 (100.0%) | 0 (0.0%) |
Public vs Private Health Insurance Coverage by Age in Primrose
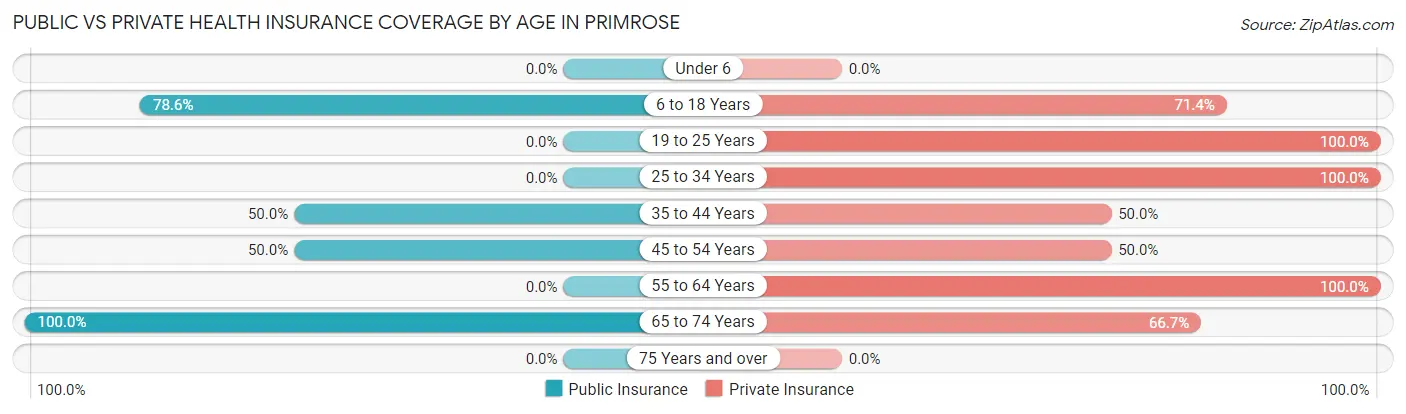
| Age Bracket | Public Insurance | Private Insurance |
| Under 6 | 0 (0.0%) | 0 (0.0%) |
| 6 to 18 Years | 11 (78.6%) | 10 (71.4%) |
| 19 to 25 Years | 0 (0.0%) | 2 (100.0%) |
| 25 to 34 Years | 0 (0.0%) | 3 (100.0%) |
| 35 to 44 Years | 1 (50.0%) | 1 (50.0%) |
| 45 to 54 Years | 8 (50.0%) | 8 (50.0%) |
| 55 to 64 Years | 0 (0.0%) | 1 (100.0%) |
| 65 to 74 Years | 12 (100.0%) | 8 (66.7%) |
| 75 Years and over | 0 (0.0%) | 0 (0.0%) |
| Total | 32 (64.0%) | 33 (66.0%) |
Disability Status by Sex by Age in Primrose
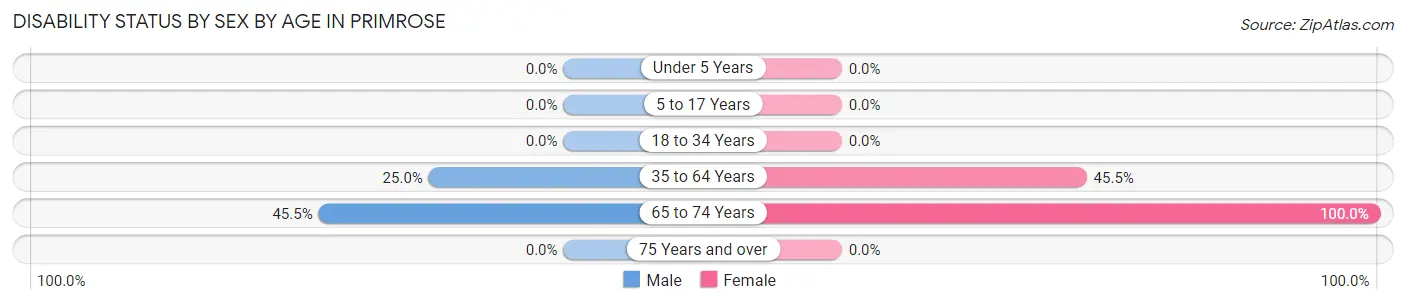
| Age Bracket | Male | Female |
| Under 5 Years | 0 (0.0%) | 0 (0.0%) |
| 5 to 17 Years | 0 (0.0%) | 0 (0.0%) |
| 18 to 34 Years | 0 (0.0%) | 0 (0.0%) |
| 35 to 64 Years | 2 (25.0%) | 5 (45.5%) |
| 65 to 74 Years | 5 (45.5%) | 1 (100.0%) |
| 75 Years and over | 0 (0.0%) | 0 (0.0%) |
Disability Class by Sex by Age in Primrose
Disability Class: Hearing Difficulty
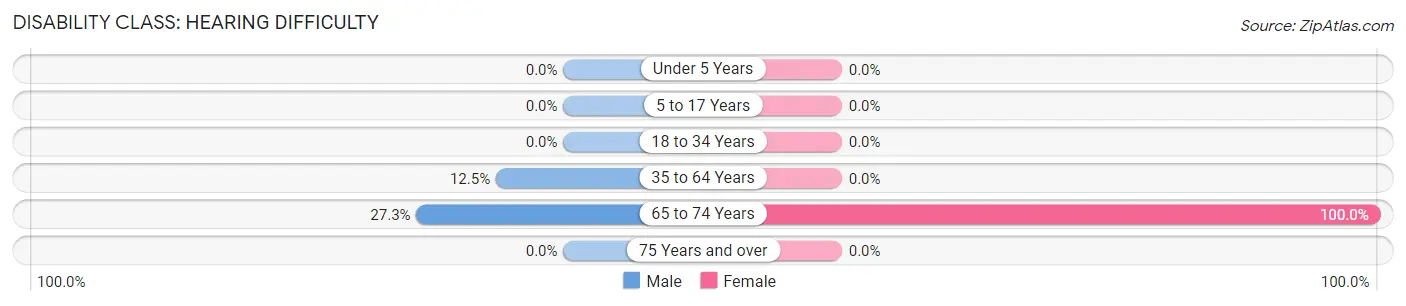
| Age Bracket | Male | Female |
| Under 5 Years | 0 (0.0%) | 0 (0.0%) |
| 5 to 17 Years | 0 (0.0%) | 0 (0.0%) |
| 18 to 34 Years | 0 (0.0%) | 0 (0.0%) |
| 35 to 64 Years | 1 (12.5%) | 0 (0.0%) |
| 65 to 74 Years | 3 (27.3%) | 1 (100.0%) |
| 75 Years and over | 0 (0.0%) | 0 (0.0%) |
Disability Class: Vision Difficulty
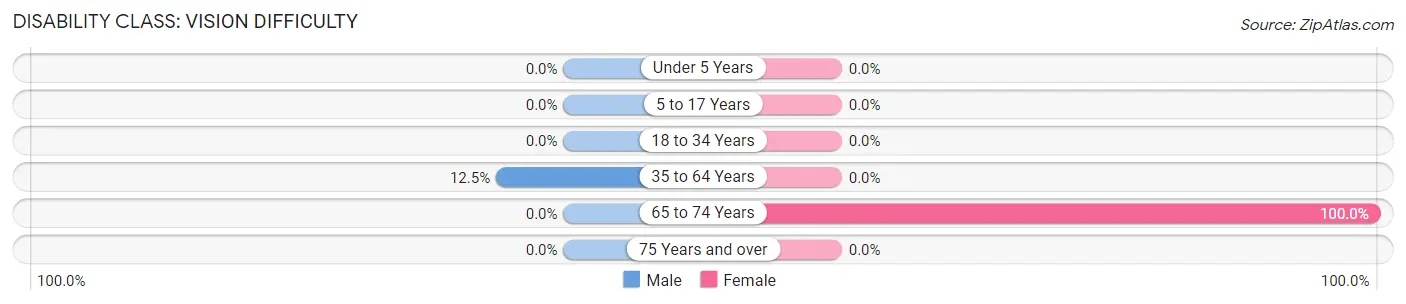
| Age Bracket | Male | Female |
| Under 5 Years | 0 (0.0%) | 0 (0.0%) |
| 5 to 17 Years | 0 (0.0%) | 0 (0.0%) |
| 18 to 34 Years | 0 (0.0%) | 0 (0.0%) |
| 35 to 64 Years | 1 (12.5%) | 0 (0.0%) |
| 65 to 74 Years | 0 (0.0%) | 1 (100.0%) |
| 75 Years and over | 0 (0.0%) | 0 (0.0%) |
Disability Class: Cognitive Difficulty
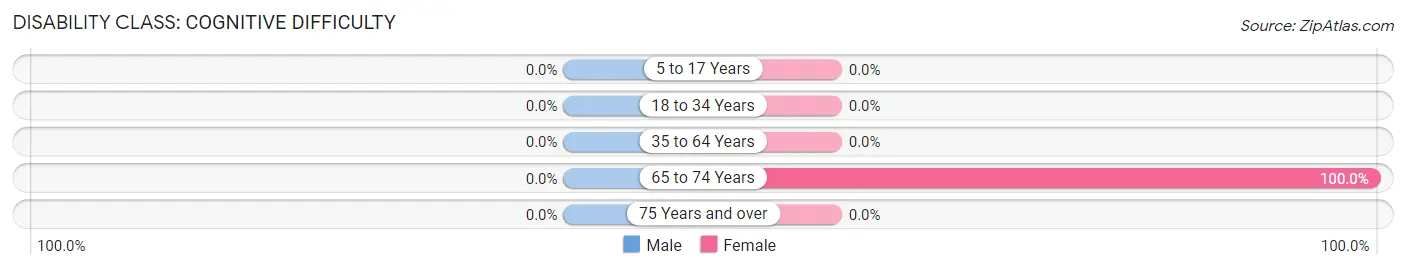
| Age Bracket | Male | Female |
| 5 to 17 Years | 0 (0.0%) | 0 (0.0%) |
| 18 to 34 Years | 0 (0.0%) | 0 (0.0%) |
| 35 to 64 Years | 0 (0.0%) | 0 (0.0%) |
| 65 to 74 Years | 0 (0.0%) | 1 (100.0%) |
| 75 Years and over | 0 (0.0%) | 0 (0.0%) |
Disability Class: Ambulatory Difficulty
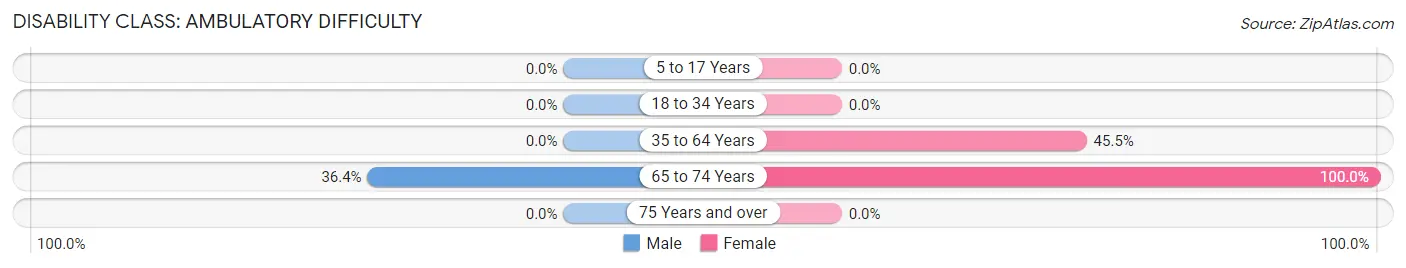
| Age Bracket | Male | Female |
| 5 to 17 Years | 0 (0.0%) | 0 (0.0%) |
| 18 to 34 Years | 0 (0.0%) | 0 (0.0%) |
| 35 to 64 Years | 0 (0.0%) | 5 (45.5%) |
| 65 to 74 Years | 4 (36.4%) | 1 (100.0%) |
| 75 Years and over | 0 (0.0%) | 0 (0.0%) |
Disability Class: Self-Care Difficulty
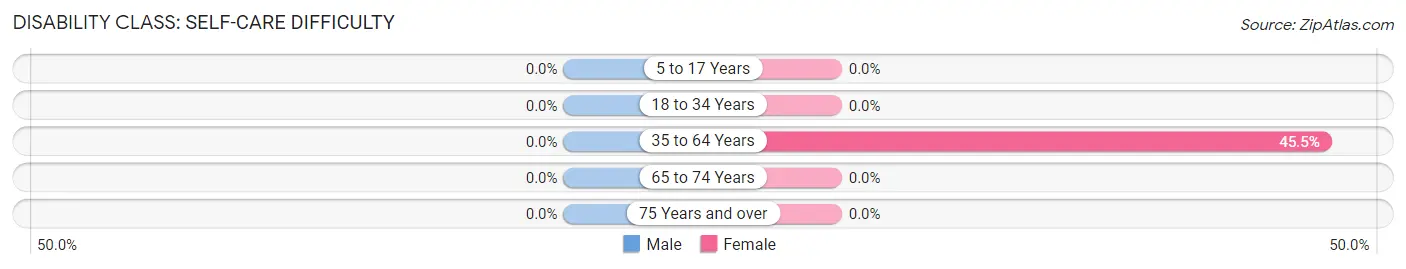
| Age Bracket | Male | Female |
| 5 to 17 Years | 0 (0.0%) | 0 (0.0%) |
| 18 to 34 Years | 0 (0.0%) | 0 (0.0%) |
| 35 to 64 Years | 0 (0.0%) | 5 (45.5%) |
| 65 to 74 Years | 0 (0.0%) | 0 (0.0%) |
| 75 Years and over | 0 (0.0%) | 0 (0.0%) |
Technology Access in Primrose
Computing Device Access in Primrose
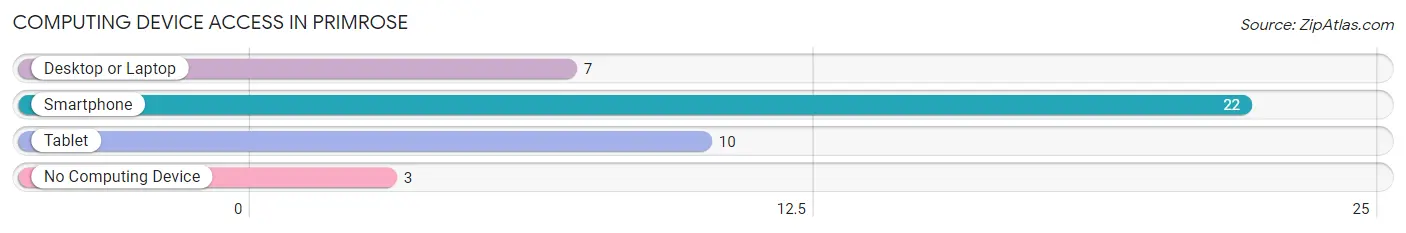
| Device Type | # Households | % Households |
| Desktop or Laptop | 7 | 28.0% |
| Smartphone | 22 | 88.0% |
| Tablet | 10 | 40.0% |
| No Computing Device | 3 | 12.0% |
| Total | 25 | 100.0% |
Internet Access in Primrose
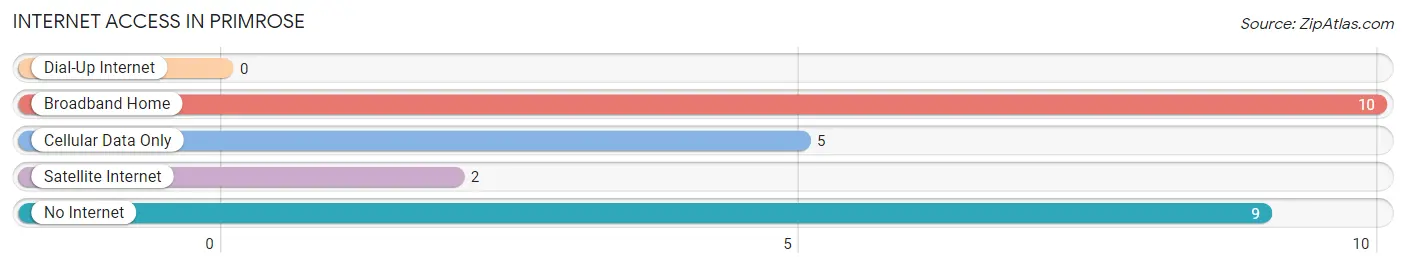
| Internet Type | # Households | % Households |
| Dial-Up Internet | 0 | 0.0% |
| Broadband Home | 10 | 40.0% |
| Cellular Data Only | 5 | 20.0% |
| Satellite Internet | 2 | 8.0% |
| No Internet | 9 | 36.0% |
| Total | 25 | 100.0% |
Primrose Summary
Primrose, Nebraska is a small town located in the southeastern corner of the state. It is situated in the heart of the Great Plains, and is surrounded by rolling hills and farmland. The town has a population of just over 1,000 people, and is the county seat of Gage County.
Primrose was founded in 1871 by a group of settlers from Ohio. The town was named after the primrose flower, which was abundant in the area. The town was originally a farming community, and the main crops grown were wheat, corn, and hay. As the town grew, it became a center for commerce and industry. The railroad arrived in 1887, and the town soon became a hub for shipping and receiving goods.
The economy of Primrose is largely based on agriculture. The town is home to several large farms, and the surrounding area is known for its production of corn, soybeans, and wheat. The town also has a few small businesses, including a grocery store, a hardware store, and a few restaurants.
The geography of Primrose is typical of the Great Plains. The town is located in a flat, open area, with rolling hills in the distance. The town is surrounded by farmland, and the nearby Platte River provides a source of water for the area. The climate is generally mild, with hot summers and cold winters.
The demographics of Primrose are fairly typical of a small town in the Midwest. The population is mostly white, with a small percentage of African Americans and Hispanics. The median household income is slightly below the national average, and the poverty rate is slightly higher than the national average.
Primrose is a small town with a rich history and a bright future. The town is home to a diverse population, and the economy is largely based on agriculture. The town is surrounded by beautiful scenery, and the nearby Platte River provides a source of recreation for the area. Primrose is a great place to live, work, and raise a family.
Common Questions
What is Per Capita Income in Primrose?
Per Capita income in Primrose is $25,824.
What is the Median Family Income in Primrose?
Median Family Income in Primrose is $53,750.
What is the Median Household income in Primrose?
Median Household Income in Primrose is $38,542.
What is Income or Wage Gap in Primrose?
Income or Wage Gap in Primrose is 26.8%.
Women in Primrose earn 73.2 cents for every dollar earned by a man.
What is Inequality or Gini Index in Primrose?
Inequality or Gini Index in Primrose is 0.35.
What is the Total Population of Primrose?
Total Population of Primrose is 50.
What is the Total Male Population of Primrose?
Total Male Population of Primrose is 35.
What is the Total Female Population of Primrose?
Total Female Population of Primrose is 15.
What is the Ratio of Males per 100 Females in Primrose?
There are 233.33 Males per 100 Females in Primrose.
What is the Ratio of Females per 100 Males in Primrose?
There are 42.86 Females per 100 Males in Primrose.
What is the Median Population Age in Primrose?
Median Population Age in Primrose is 50.5 Years.
What is the Average Family Size in Primrose
Average Family Size in Primrose is 2.4 People.
What is the Average Household Size in Primrose
Average Household Size in Primrose is 2.0 People.
How Large is the Labor Force in Primrose?
There are 19 People in the Labor Forcein in Primrose.
What is the Percentage of People in the Labor Force in Primrose?
44.2% of People are in the Labor Force in Primrose.