Osmond, NE Map & Demographics
Osmond Map
Osmond Overview
$33,132
PER CAPITA INCOME
$79,792
AVG FAMILY INCOME
$68,611
AVG HOUSEHOLD INCOME
32.4%
WAGE / INCOME GAP [ % ]
67.6¢/ $1
WAGE / INCOME GAP [ $ ]
0.37
INEQUALITY / GINI INDEX
678
TOTAL POPULATION
353
MALE POPULATION
325
FEMALE POPULATION
108.62
MALES / 100 FEMALES
92.07
FEMALES / 100 MALES
41.7
MEDIAN AGE
3.2
AVG FAMILY SIZE
2.5
AVG HOUSEHOLD SIZE
325
LABOR FORCE [ PEOPLE ]
67.0%
PERCENT IN LABOR FORCE
Osmond Zip Codes
Osmond Area Codes
Income in Osmond
Income Overview in Osmond
Per Capita Income in Osmond is $33,132, while median incomes of families and households are $79,792 and $68,611 respectively.
| Characteristic | Number | Measure |
| Per Capita Income | 678 | $33,132 |
| Median Family Income | 159 | $79,792 |
| Mean Family Income | 159 | $85,864 |
| Median Household Income | 262 | $68,611 |
| Mean Household Income | 262 | $80,398 |
| Income Deficit | 159 | $0 |
| Wage / Income Gap (%) | 678 | 32.36% |
| Wage / Income Gap ($) | 678 | 67.64¢ per $1 |
| Gini / Inequality Index | 678 | 0.37 |
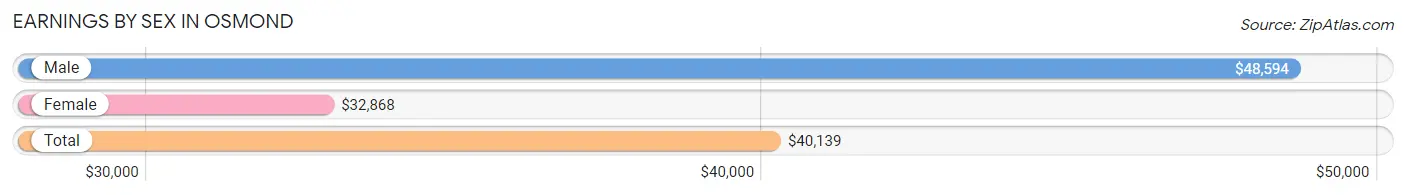
Earnings by Sex in Osmond
Average Earnings in Osmond are $40,139, $48,594 for men and $32,868 for women, a difference of 32.4%.
| Sex | Number | Average Earnings |
| Male | 189 (56.6%) | $48,594 |
| Female | 145 (43.4%) | $32,868 |
| Total | 334 (100.0%) | $40,139 |
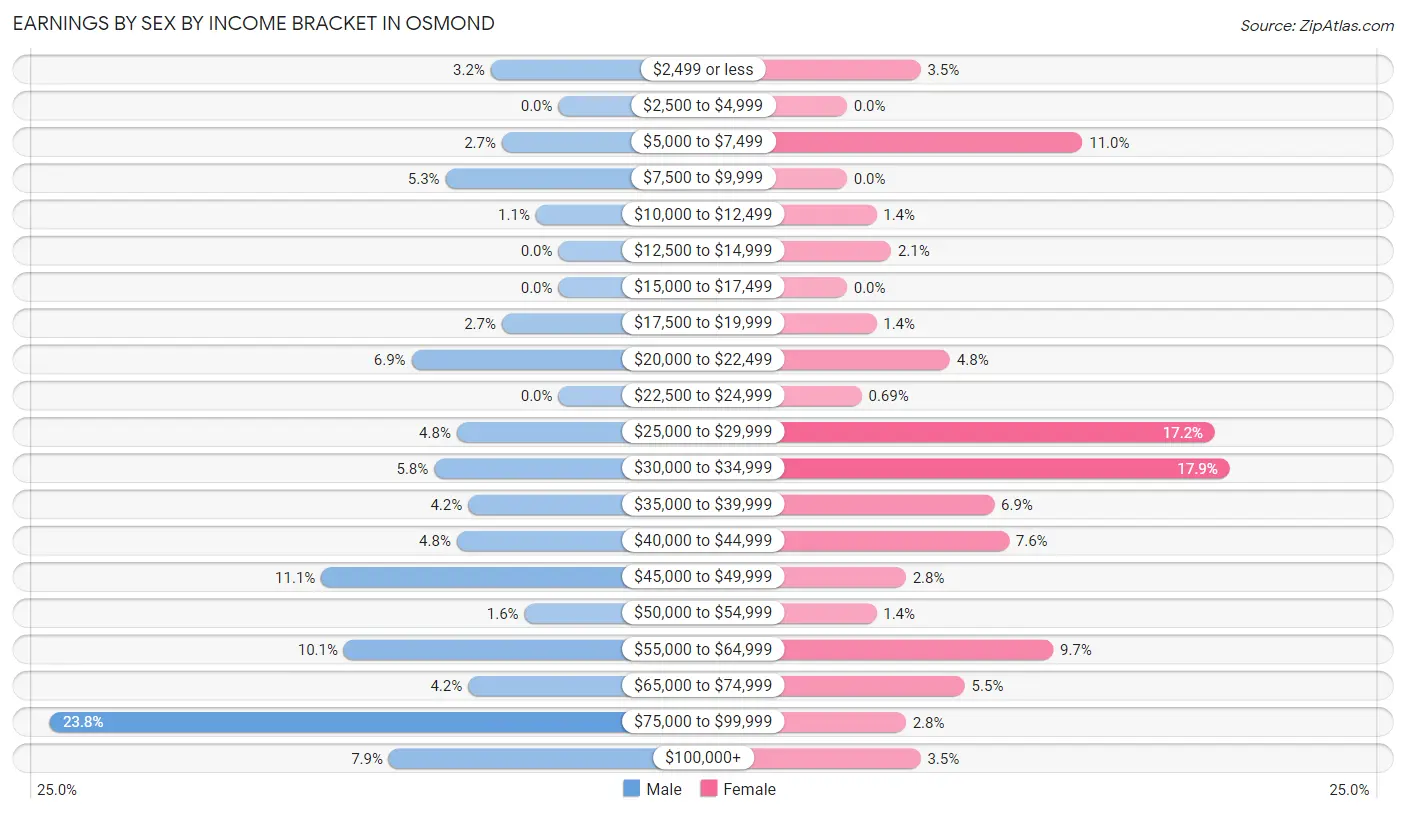
Earnings by Sex by Income Bracket in Osmond
The most common earnings brackets in Osmond are $75,000 to $99,999 for men (45 | 23.8%) and $30,000 to $34,999 for women (26 | 17.9%).
| Income | Male | Female |
| $2,499 or less | 6 (3.2%) | 5 (3.5%) |
| $2,500 to $4,999 | 0 (0.0%) | 0 (0.0%) |
| $5,000 to $7,499 | 5 (2.6%) | 16 (11.0%) |
| $7,500 to $9,999 | 10 (5.3%) | 0 (0.0%) |
| $10,000 to $12,499 | 2 (1.1%) | 2 (1.4%) |
| $12,500 to $14,999 | 0 (0.0%) | 3 (2.1%) |
| $15,000 to $17,499 | 0 (0.0%) | 0 (0.0%) |
| $17,500 to $19,999 | 5 (2.6%) | 2 (1.4%) |
| $20,000 to $22,499 | 13 (6.9%) | 7 (4.8%) |
| $22,500 to $24,999 | 0 (0.0%) | 1 (0.7%) |
| $25,000 to $29,999 | 9 (4.8%) | 25 (17.2%) |
| $30,000 to $34,999 | 11 (5.8%) | 26 (17.9%) |
| $35,000 to $39,999 | 8 (4.2%) | 10 (6.9%) |
| $40,000 to $44,999 | 9 (4.8%) | 11 (7.6%) |
| $45,000 to $49,999 | 21 (11.1%) | 4 (2.8%) |
| $50,000 to $54,999 | 3 (1.6%) | 2 (1.4%) |
| $55,000 to $64,999 | 19 (10.1%) | 14 (9.7%) |
| $65,000 to $74,999 | 8 (4.2%) | 8 (5.5%) |
| $75,000 to $99,999 | 45 (23.8%) | 4 (2.8%) |
| $100,000+ | 15 (7.9%) | 5 (3.5%) |
| Total | 189 (100.0%) | 145 (100.0%) |
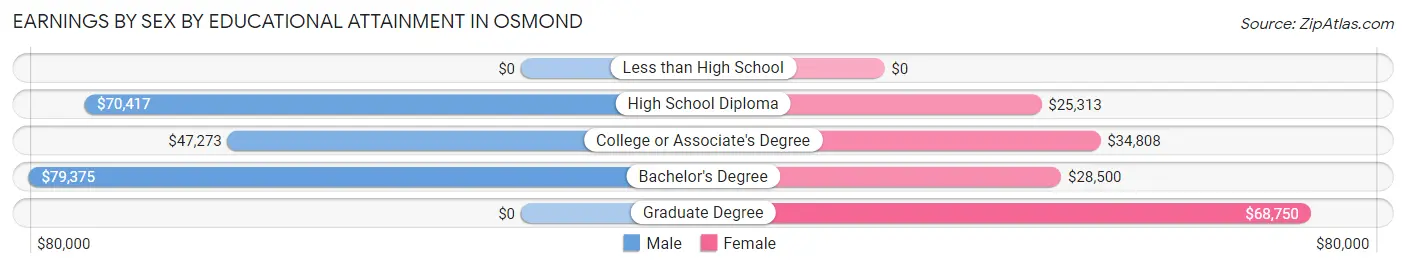
Earnings by Sex by Educational Attainment in Osmond
Average earnings in Osmond are $58,750 for men and $33,304 for women, a difference of 43.3%. Men with an educational attainment of bachelor's degree enjoy the highest average annual earnings of $79,375, while those with college or associate's degree education earn the least with $47,273. Women with an educational attainment of graduate degree earn the most with the average annual earnings of $68,750, while those with high school diploma education have the smallest earnings of $25,313.
| Educational Attainment | Male Income | Female Income |
| Less than High School | - | - |
| High School Diploma | $70,417 | $25,313 |
| College or Associate's Degree | $47,273 | $34,808 |
| Bachelor's Degree | $79,375 | $28,500 |
| Graduate Degree | - | - |
| Total | $58,750 | $33,304 |
Family Income in Osmond
Family Income Brackets in Osmond
According to the Osmond family income data, there are 48 families falling into the $75,000 to $99,999 income range, which is the most common income bracket and makes up 30.2% of all families.
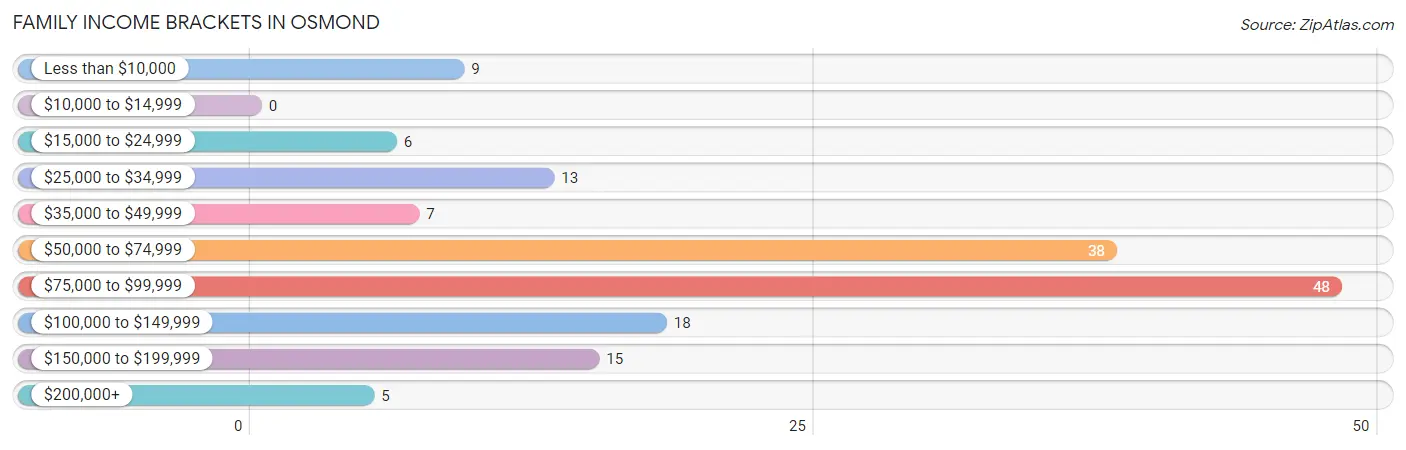
| Income Bracket | # Families | % Families |
| Less than $10,000 | 9 | 5.7% |
| $10,000 to $14,999 | 0 | 0.0% |
| $15,000 to $24,999 | 6 | 3.8% |
| $25,000 to $34,999 | 13 | 8.2% |
| $35,000 to $49,999 | 7 | 4.4% |
| $50,000 to $74,999 | 38 | 23.9% |
| $75,000 to $99,999 | 48 | 30.2% |
| $100,000 to $149,999 | 18 | 11.3% |
| $150,000 to $199,999 | 15 | 9.4% |
| $200,000+ | 5 | 3.1% |
Family Income by Famaliy Size in Osmond
3-person families (29 | 18.2%) account for the highest median family income in Osmond with $98,125 per family, while 2-person families (87 | 54.7%) have the highest median income of $40,938 per family member.
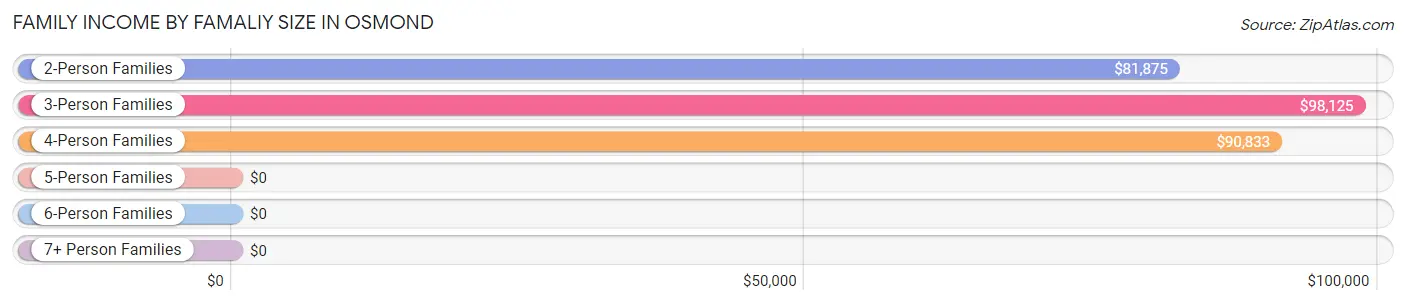
| Income Bracket | # Families | Median Income |
| 2-Person Families | 87 (54.7%) | $81,875 |
| 3-Person Families | 29 (18.2%) | $98,125 |
| 4-Person Families | 14 (8.8%) | $90,833 |
| 5-Person Families | 18 (11.3%) | $0 |
| 6-Person Families | 11 (6.9%) | $0 |
| 7+ Person Families | 0 (0.0%) | $0 |
| Total | 159 (100.0%) | $79,792 |
Family Income by Number of Earners in Osmond
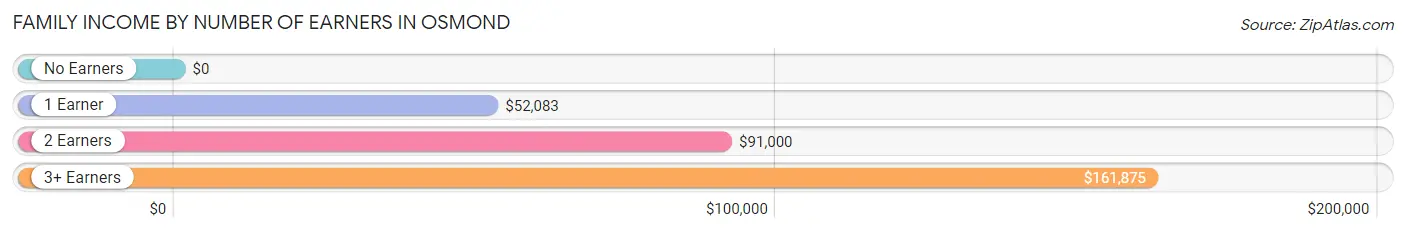
| Number of Earners | # Families | Median Income |
| No Earners | 29 (18.2%) | $0 |
| 1 Earner | 41 (25.8%) | $52,083 |
| 2 Earners | 82 (51.6%) | $91,000 |
| 3+ Earners | 7 (4.4%) | $161,875 |
| Total | 159 (100.0%) | $79,792 |
Household Income in Osmond
Household Income Brackets in Osmond
With 59 households falling in the category, the $75,000 to $99,999 income range is the most frequent in Osmond, accounting for 22.5% of all households. In contrast, only 4 households (1.5%) fall into the $10,000 to $14,999 income bracket, making it the least populous group.
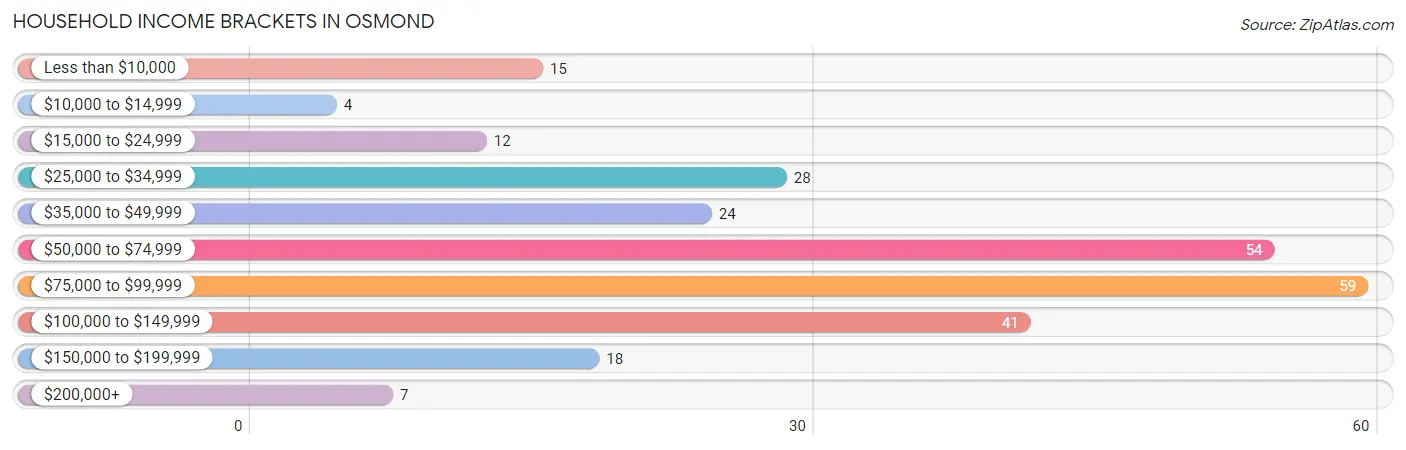
| Income Bracket | # Households | % Households |
| Less than $10,000 | 15 | 5.7% |
| $10,000 to $14,999 | 4 | 1.5% |
| $15,000 to $24,999 | 12 | 4.6% |
| $25,000 to $34,999 | 28 | 10.7% |
| $35,000 to $49,999 | 24 | 9.2% |
| $50,000 to $74,999 | 54 | 20.6% |
| $75,000 to $99,999 | 59 | 22.5% |
| $100,000 to $149,999 | 41 | 15.6% |
| $150,000 to $199,999 | 18 | 6.9% |
| $200,000+ | 7 | 2.7% |
Household Income by Householder Age in Osmond
The median household income in Osmond is $68,611, with the highest median household income of $82,000 found in the 45 to 64 years age bracket for the primary householder. A total of 84 households (32.1%) fall into this category. Meanwhile, the 15 to 24 years age bracket for the primary householder has the lowest median household income of $0, with 15 households (5.7%) in this group.
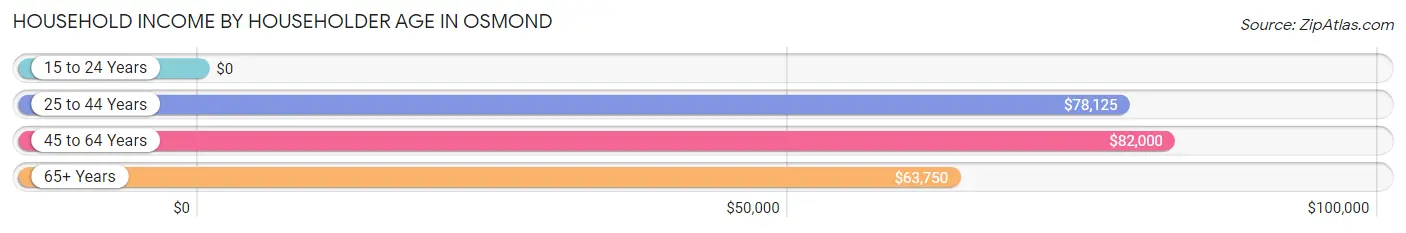
| Income Bracket | # Households | Median Income |
| 15 to 24 Years | 15 (5.7%) | $0 |
| 25 to 44 Years | 67 (25.6%) | $78,125 |
| 45 to 64 Years | 84 (32.1%) | $82,000 |
| 65+ Years | 96 (36.6%) | $63,750 |
| Total | 262 (100.0%) | $68,611 |
Poverty in Osmond
Income Below Poverty by Sex and Age in Osmond
With 12.0% poverty level for males and 21.0% for females among the residents of Osmond, under 5 year old males and under 5 year old females are the most vulnerable to poverty, with 25 males (89.3%) and 27 females (71.1%) in their respective age groups living below the poverty level.
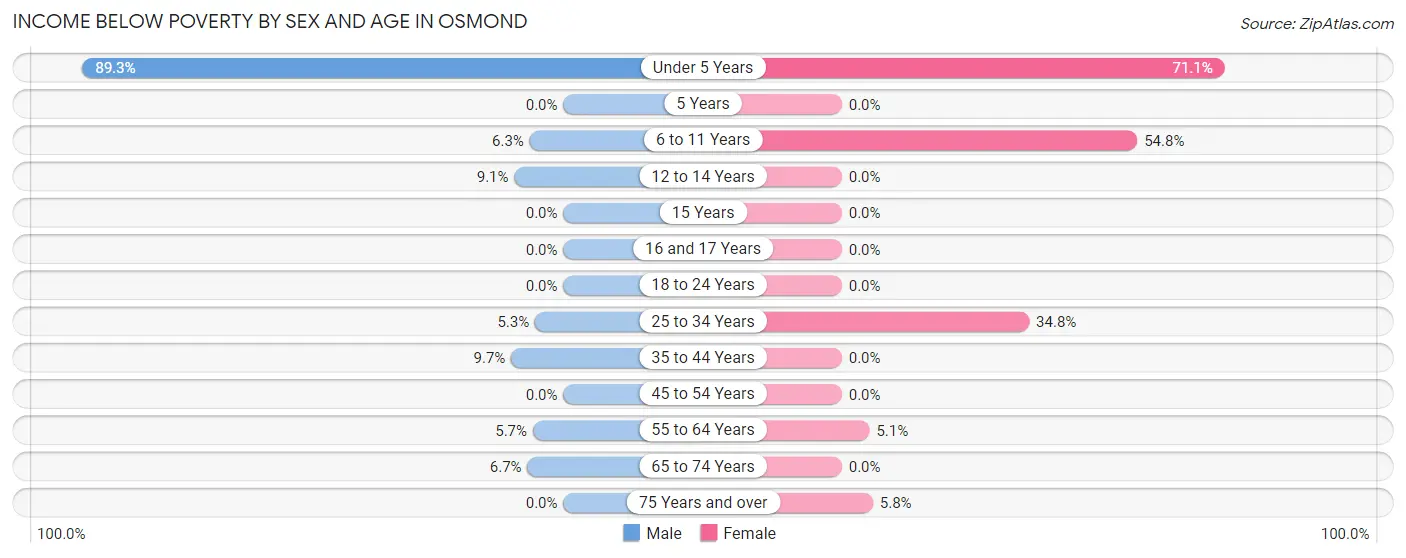
| Age Bracket | Male | Female |
| Under 5 Years | 25 (89.3%) | 27 (71.1%) |
| 5 Years | 0 (0.0%) | 0 (0.0%) |
| 6 to 11 Years | 2 (6.2%) | 17 (54.8%) |
| 12 to 14 Years | 2 (9.1%) | 0 (0.0%) |
| 15 Years | 0 (0.0%) | 0 (0.0%) |
| 16 and 17 Years | 0 (0.0%) | 0 (0.0%) |
| 18 to 24 Years | 0 (0.0%) | 0 (0.0%) |
| 25 to 34 Years | 1 (5.3%) | 16 (34.8%) |
| 35 to 44 Years | 3 (9.7%) | 0 (0.0%) |
| 45 to 54 Years | 0 (0.0%) | 0 (0.0%) |
| 55 to 64 Years | 3 (5.7%) | 2 (5.1%) |
| 65 to 74 Years | 3 (6.7%) | 0 (0.0%) |
| 75 Years and over | 0 (0.0%) | 3 (5.8%) |
| Total | 39 (12.0%) | 65 (21.0%) |
Income Above Poverty by Sex and Age in Osmond
According to the poverty statistics in Osmond, males aged 5 years and females aged 5 years are the age groups that are most secure financially, with 100.0% of males and 100.0% of females in these age groups living above the poverty line.
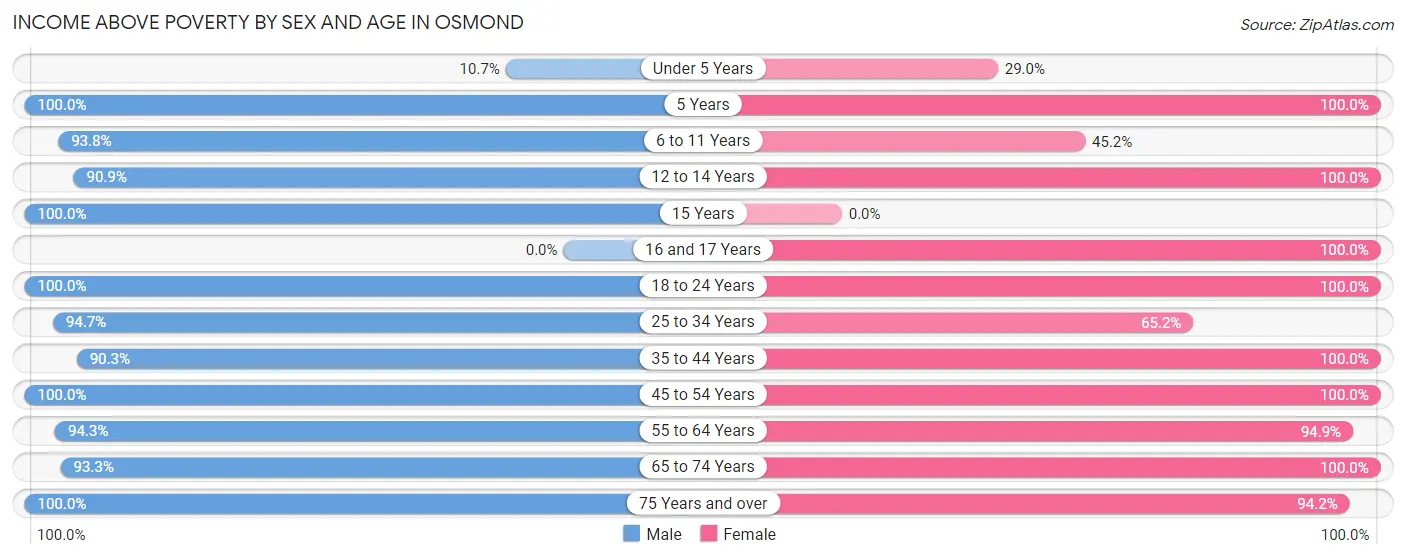
| Age Bracket | Male | Female |
| Under 5 Years | 3 (10.7%) | 11 (28.9%) |
| 5 Years | 5 (100.0%) | 2 (100.0%) |
| 6 to 11 Years | 30 (93.8%) | 14 (45.2%) |
| 12 to 14 Years | 20 (90.9%) | 4 (100.0%) |
| 15 Years | 5 (100.0%) | 0 (0.0%) |
| 16 and 17 Years | 0 (0.0%) | 12 (100.0%) |
| 18 to 24 Years | 24 (100.0%) | 10 (100.0%) |
| 25 to 34 Years | 18 (94.7%) | 30 (65.2%) |
| 35 to 44 Years | 28 (90.3%) | 20 (100.0%) |
| 45 to 54 Years | 35 (100.0%) | 33 (100.0%) |
| 55 to 64 Years | 50 (94.3%) | 37 (94.9%) |
| 65 to 74 Years | 42 (93.3%) | 23 (100.0%) |
| 75 Years and over | 26 (100.0%) | 49 (94.2%) |
| Total | 286 (88.0%) | 245 (79.0%) |
Income Below Poverty Among Married-Couple Families in Osmond
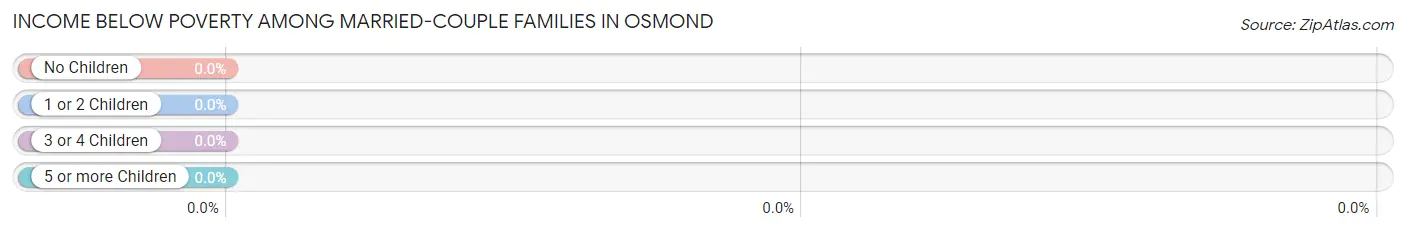
| Children | Above Poverty | Below Poverty |
| No Children | 95 (100.0%) | 0 (0.0%) |
| 1 or 2 Children | 24 (100.0%) | 0 (0.0%) |
| 3 or 4 Children | 6 (100.0%) | 0 (0.0%) |
| 5 or more Children | 0 (0.0%) | 0 (0.0%) |
| Total | 125 (100.0%) | 0 (0.0%) |
Income Below Poverty Among Single-Parent Households in Osmond
According to the poverty data in Osmond, 33.3% or 1 single-father households and 51.6% or 16 single-mother households are living below the poverty line. Among single-father households, those with 3 or 4 children have the highest poverty rate, with 1 households (100.0%) experiencing poverty. Likewise, among single-mother households, those with 5 or more children have the highest poverty rate, with 8 households (100.0%) falling below the poverty line.
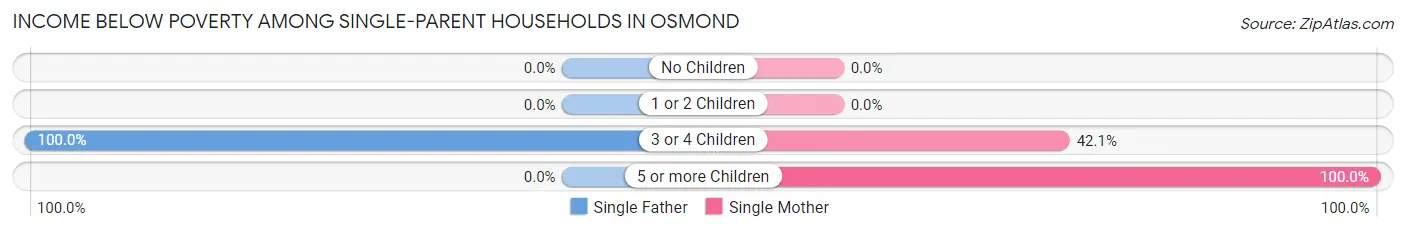
| Children | Single Father | Single Mother |
| No Children | 0 (0.0%) | 0 (0.0%) |
| 1 or 2 Children | 0 (0.0%) | 0 (0.0%) |
| 3 or 4 Children | 1 (100.0%) | 8 (42.1%) |
| 5 or more Children | 0 (0.0%) | 8 (100.0%) |
| Total | 1 (33.3%) | 16 (51.6%) |
Income Below Poverty Among Married-Couple vs Single-Parent Households in Osmond
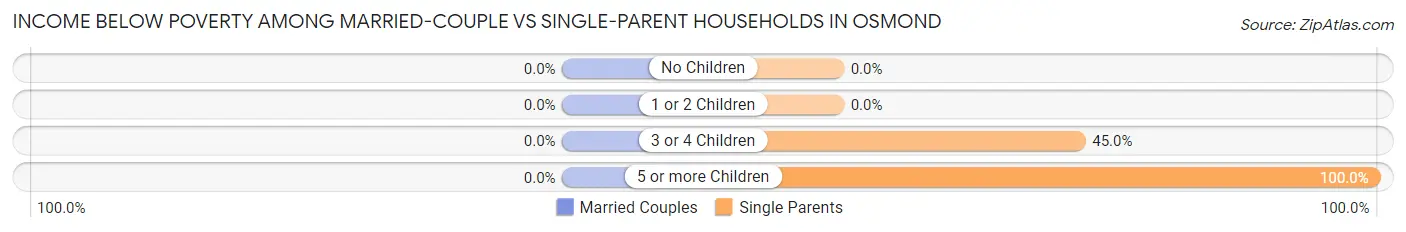
| Children | Married-Couple Families | Single-Parent Households |
| No Children | 0 (0.0%) | 0 (0.0%) |
| 1 or 2 Children | 0 (0.0%) | 0 (0.0%) |
| 3 or 4 Children | 0 (0.0%) | 9 (45.0%) |
| 5 or more Children | 0 (0.0%) | 8 (100.0%) |
| Total | 0 (0.0%) | 17 (50.0%) |
Race in Osmond
The most populous races in Osmond are , and White / Caucasian (678 | 100.0%).
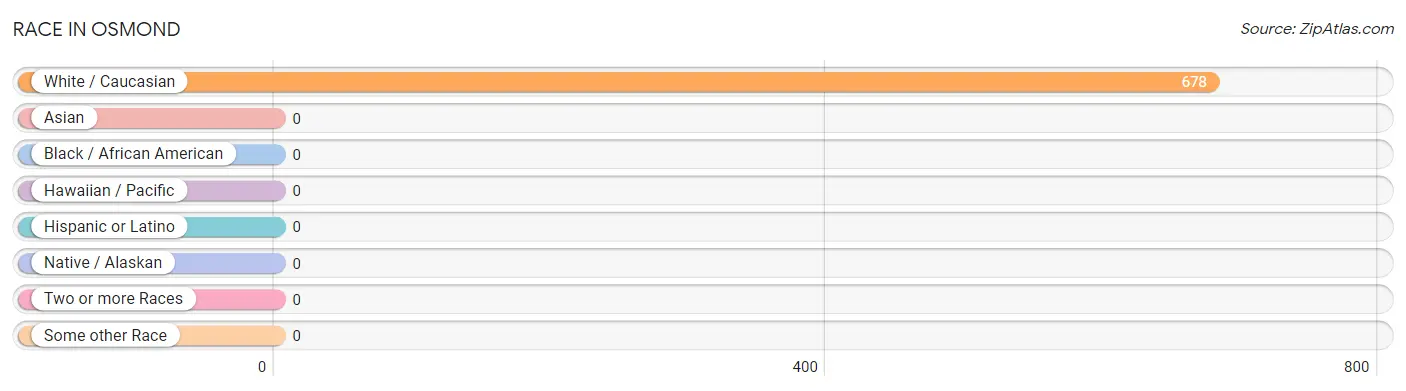
| Race | # Population | % Population |
| Asian | 0 | 0.0% |
| Black / African American | 0 | 0.0% |
| Hawaiian / Pacific | 0 | 0.0% |
| Hispanic or Latino | 0 | 0.0% |
| Native / Alaskan | 0 | 0.0% |
| White / Caucasian | 678 | 100.0% |
| Two or more Races | 0 | 0.0% |
| Some other Race | 0 | 0.0% |
| Total | 678 | 100.0% |
Ancestry in Osmond
The most populous ancestries reported in Osmond are German (335 | 49.4%), English (90 | 13.3%), Irish (61 | 9.0%), American (32 | 4.7%), and Swedish (20 | 2.9%), together accounting for 79.3% of all Osmond residents.
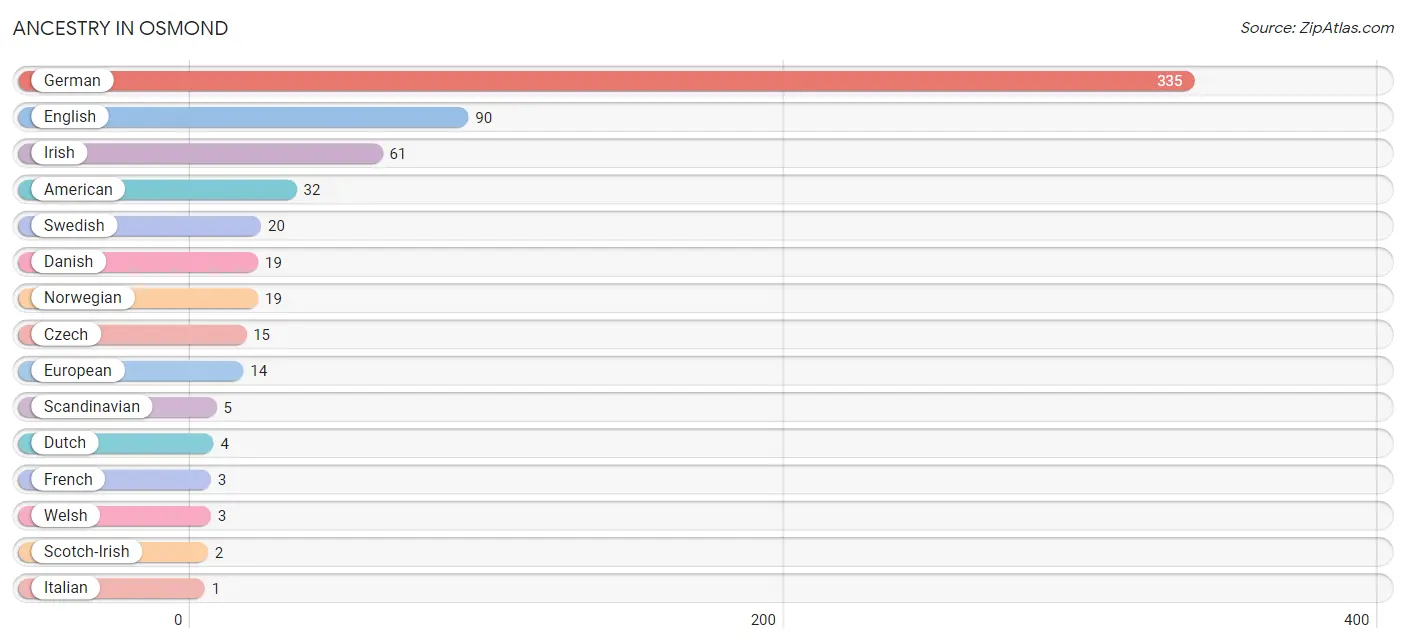
| Ancestry | # Population | % Population |
| American | 32 | 4.7% |
| Czech | 15 | 2.2% |
| Danish | 19 | 2.8% |
| Dutch | 4 | 0.6% |
| English | 90 | 13.3% |
| European | 14 | 2.1% |
| French | 3 | 0.4% |
| German | 335 | 49.4% |
| Irish | 61 | 9.0% |
| Italian | 1 | 0.2% |
| Norwegian | 19 | 2.8% |
| Scandinavian | 5 | 0.7% |
| Scotch-Irish | 2 | 0.3% |
| Swedish | 20 | 2.9% |
| Welsh | 3 | 0.4% | View All 15 Rows |
Immigrants in Osmond
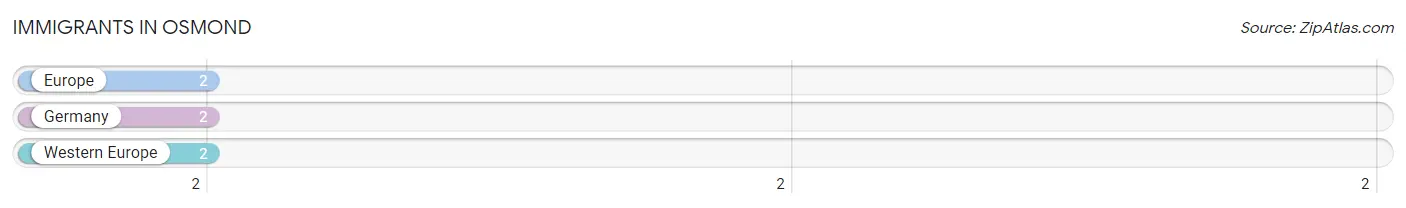
The most numerous immigrant groups reported in Osmond came from Europe (2 | 0.3%), Germany (2 | 0.3%), and Western Europe (2 | 0.3%), together accounting for 0.9% of all Osmond residents.
| Immigration Origin | # Population | % Population |
| Europe | 2 | 0.3% |
| Germany | 2 | 0.3% |
| Western Europe | 2 | 0.3% | View All 3 Rows |
Sex and Age in Osmond
Sex and Age in Osmond
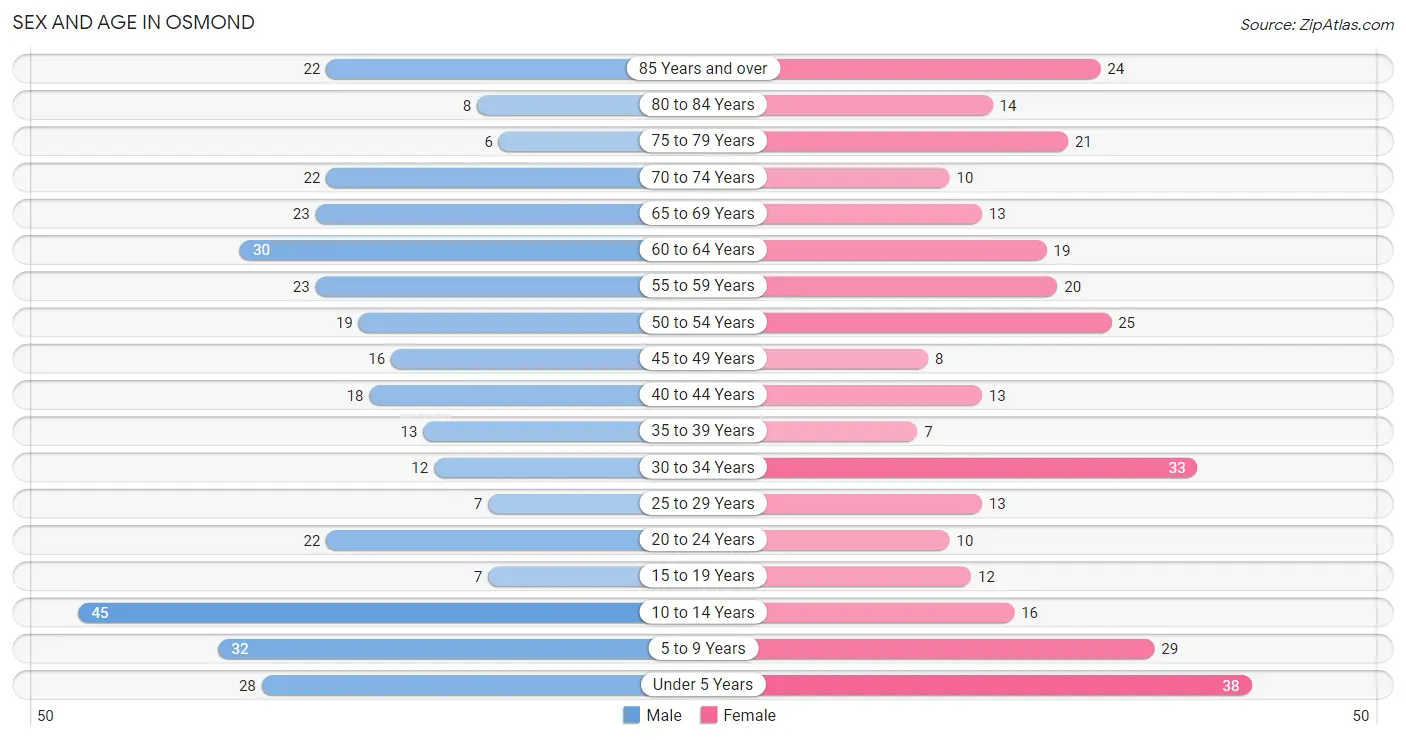
The most populous age groups in Osmond are 10 to 14 Years (45 | 12.8%) for men and Under 5 Years (38 | 11.7%) for women.
| Age Bracket | Male | Female |
| Under 5 Years | 28 (7.9%) | 38 (11.7%) |
| 5 to 9 Years | 32 (9.1%) | 29 (8.9%) |
| 10 to 14 Years | 45 (12.8%) | 16 (4.9%) |
| 15 to 19 Years | 7 (2.0%) | 12 (3.7%) |
| 20 to 24 Years | 22 (6.2%) | 10 (3.1%) |
| 25 to 29 Years | 7 (2.0%) | 13 (4.0%) |
| 30 to 34 Years | 12 (3.4%) | 33 (10.2%) |
| 35 to 39 Years | 13 (3.7%) | 7 (2.1%) |
| 40 to 44 Years | 18 (5.1%) | 13 (4.0%) |
| 45 to 49 Years | 16 (4.5%) | 8 (2.5%) |
| 50 to 54 Years | 19 (5.4%) | 25 (7.7%) |
| 55 to 59 Years | 23 (6.5%) | 20 (6.1%) |
| 60 to 64 Years | 30 (8.5%) | 19 (5.9%) |
| 65 to 69 Years | 23 (6.5%) | 13 (4.0%) |
| 70 to 74 Years | 22 (6.2%) | 10 (3.1%) |
| 75 to 79 Years | 6 (1.7%) | 21 (6.5%) |
| 80 to 84 Years | 8 (2.3%) | 14 (4.3%) |
| 85 Years and over | 22 (6.2%) | 24 (7.4%) |
| Total | 353 (100.0%) | 325 (100.0%) |
Families and Households in Osmond
Median Family Size in Osmond
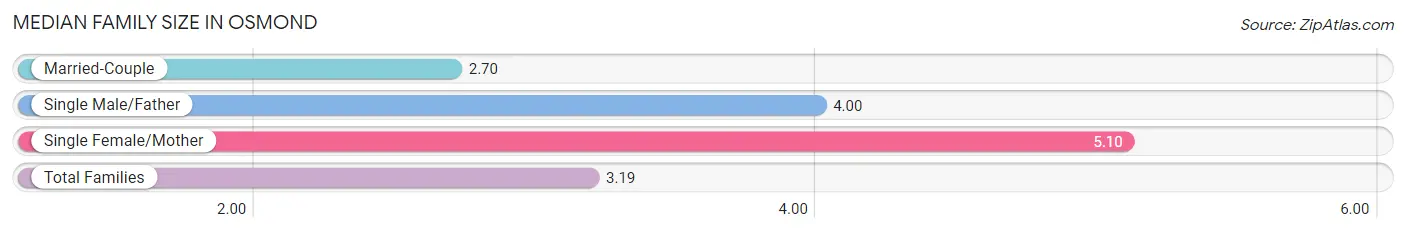
The median family size in Osmond is 3.19 persons per family, with single female/mother families (31 | 19.5%) accounting for the largest median family size of 5.1 persons per family. On the other hand, married-couple families (125 | 78.6%) represent the smallest median family size with 2.70 persons per family.
| Family Type | # Families | Family Size |
| Married-Couple | 125 (78.6%) | 2.70 |
| Single Male/Father | 3 (1.9%) | 4.00 |
| Single Female/Mother | 31 (19.5%) | 5.10 |
| Total Families | 159 (100.0%) | 3.19 |
Median Household Size in Osmond
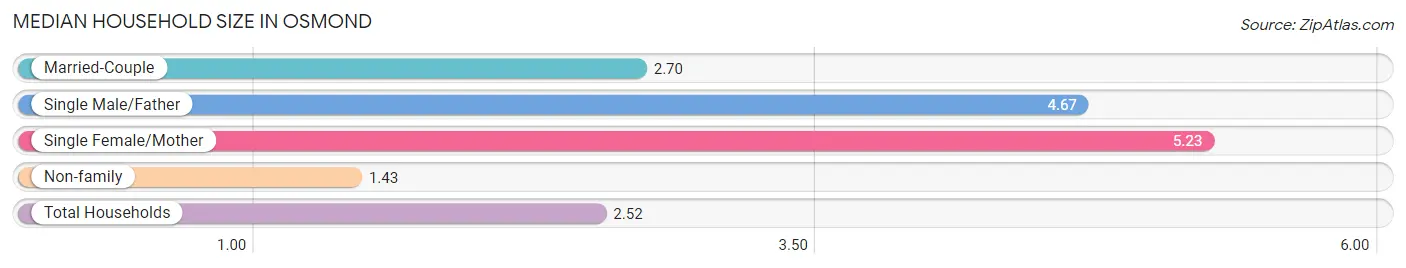
The median household size in Osmond is 2.52 persons per household, with single female/mother households (31 | 11.8%) accounting for the largest median household size of 5.23 persons per household. non-family households (103 | 39.3%) represent the smallest median household size with 1.43 persons per household.
| Household Type | # Households | Household Size |
| Married-Couple | 125 (47.7%) | 2.70 |
| Single Male/Father | 3 (1.1%) | 4.67 |
| Single Female/Mother | 31 (11.8%) | 5.23 |
| Non-family | 103 (39.3%) | 1.43 |
| Total Households | 262 (100.0%) | 2.52 |
Household Size by Marriage Status in Osmond
Out of a total of 262 households in Osmond, 159 (60.7%) are family households, while 103 (39.3%) are nonfamily households. The most numerous type of family households are 2-person households, comprising 87, and the most common type of nonfamily households are 1-person households, comprising 87.
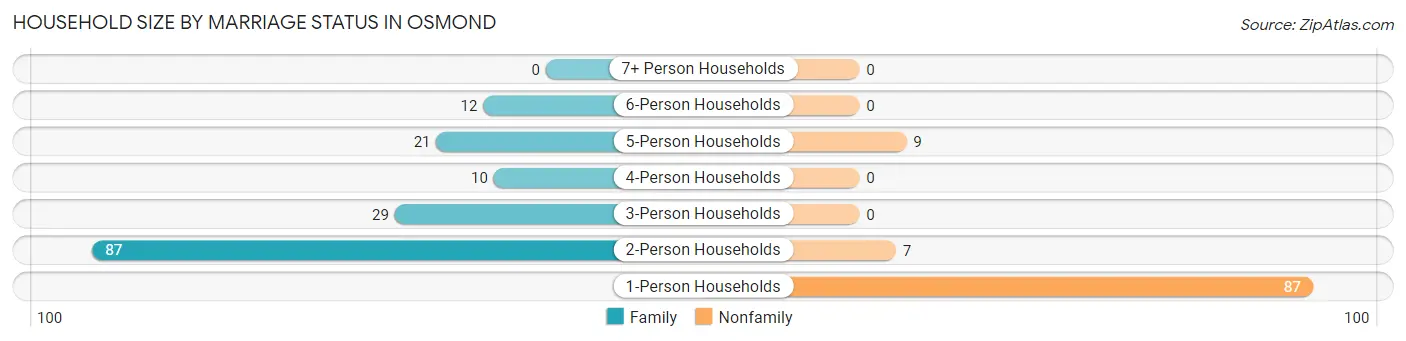
| Household Size | Family Households | Nonfamily Households |
| 1-Person Households | - | 87 (33.2%) |
| 2-Person Households | 87 (33.2%) | 7 (2.7%) |
| 3-Person Households | 29 (11.1%) | 0 (0.0%) |
| 4-Person Households | 10 (3.8%) | 0 (0.0%) |
| 5-Person Households | 21 (8.0%) | 9 (3.4%) |
| 6-Person Households | 12 (4.6%) | 0 (0.0%) |
| 7+ Person Households | 0 (0.0%) | 0 (0.0%) |
| Total | 159 (60.7%) | 103 (39.3%) |
Female Fertility in Osmond
Fertility by Age in Osmond
Average fertility rate in Osmond is 144.0 births per 1,000 women. Women in the age bracket of 20 to 34 years have the highest fertility rate with 250.0 births per 1,000 women. Women in the age bracket of 20 to 34 years acount for 100.0% of all women with births.
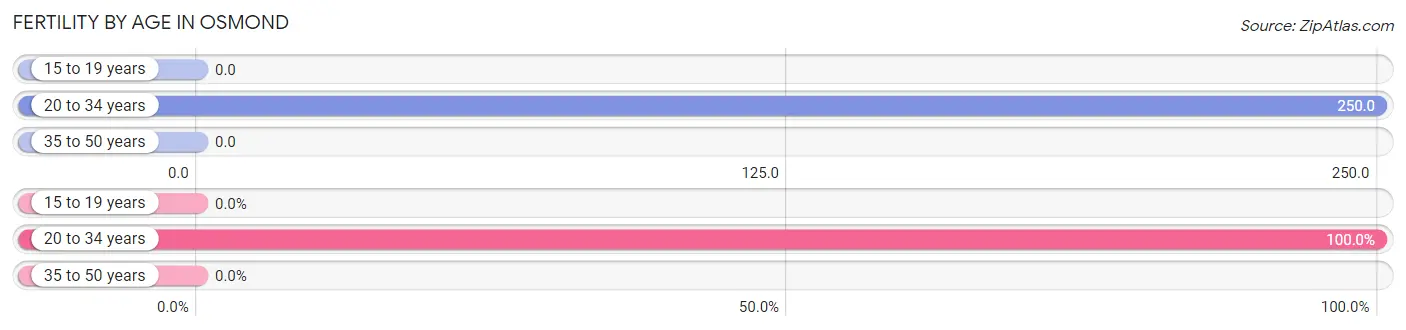
| Age Bracket | Women with Births | Births / 1,000 Women |
| 15 to 19 years | 0 (0.0%) | 0.0 |
| 20 to 34 years | 14 (100.0%) | 250.0 |
| 35 to 50 years | 0 (0.0%) | 0.0 |
| Total | 14 (100.0%) | 144.0 |
Fertility by Age by Marriage Status in Osmond
42.9% of women with births (14) in Osmond are married. The highest percentage of unmarried women with births falls into 20 to 34 years age bracket with 57.1% of them unmarried at the time of birth, while the lowest percentage of unmarried women with births belong to 20 to 34 years age bracket with 57.1% of them unmarried.
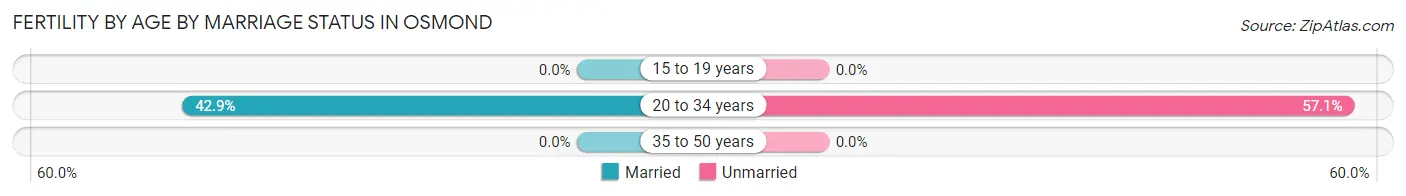
| Age Bracket | Married | Unmarried |
| 15 to 19 years | 0 (0.0%) | 0 (0.0%) |
| 20 to 34 years | 6 (42.9%) | 8 (57.1%) |
| 35 to 50 years | 0 (0.0%) | 0 (0.0%) |
| Total | 6 (42.9%) | 8 (57.1%) |
Fertility by Education in Osmond
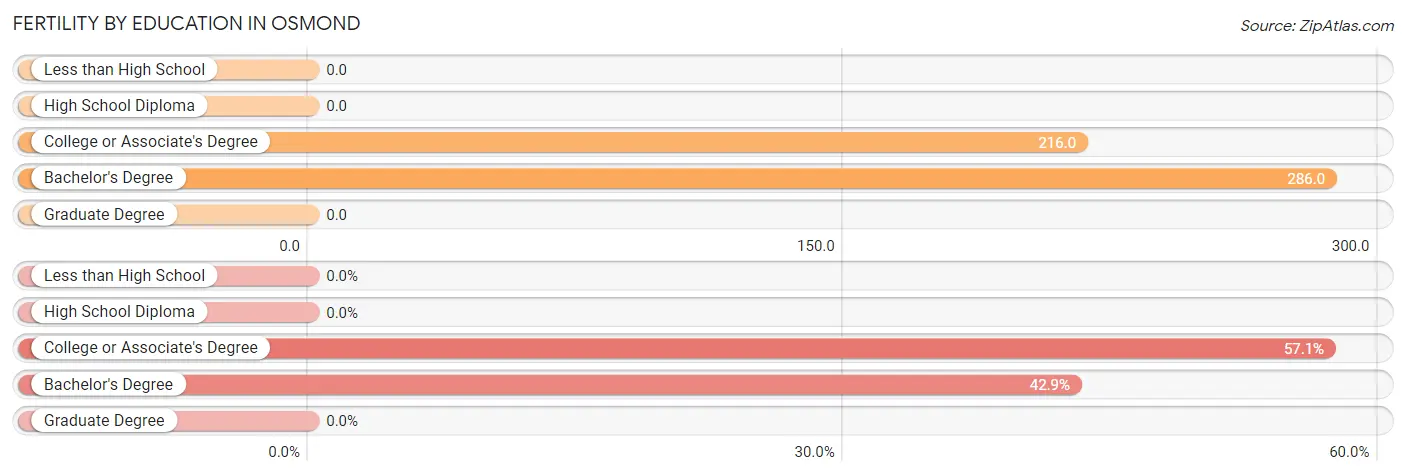
| Educational Attainment | Women with Births | Births / 1,000 Women |
| Less than High School | 0 (0.0%) | 0.0 |
| High School Diploma | 0 (0.0%) | 0.0 |
| College or Associate's Degree | 8 (57.1%) | 216.0 |
| Bachelor's Degree | 6 (42.9%) | 286.0 |
| Graduate Degree | 0 (0.0%) | 0.0 |
| Total | 14 (100.0%) | 144.0 |
Fertility by Education by Marriage Status in Osmond
57.1% of women with births in Osmond are unmarried. Women with the educational attainment of bachelor's degree are most likely to be married with 100.0% of them married at childbirth, while women with the educational attainment of college or associate's degree are least likely to be married with 100.0% of them unmarried at childbirth.
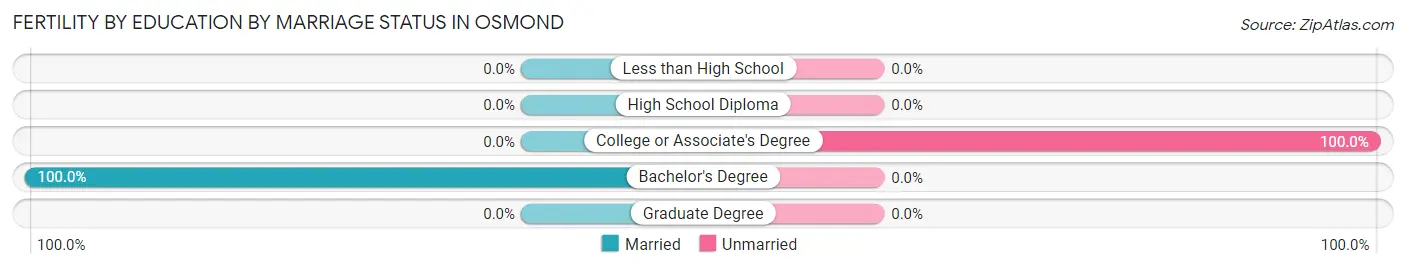
| Educational Attainment | Married | Unmarried |
| Less than High School | 0 (0.0%) | 0 (0.0%) |
| High School Diploma | 0 (0.0%) | 0 (0.0%) |
| College or Associate's Degree | 0 (0.0%) | 8 (100.0%) |
| Bachelor's Degree | 6 (100.0%) | 0 (0.0%) |
| Graduate Degree | 0 (0.0%) | 0 (0.0%) |
| Total | 6 (42.9%) | 8 (57.1%) |
Employment Characteristics in Osmond
Employment by Class of Employer in Osmond
Among the 323 employed individuals in Osmond, private company employees (196 | 60.7%), local government employees (33 | 10.2%), and self-employed (incorporated) (31 | 9.6%) make up the most common classes of employment.
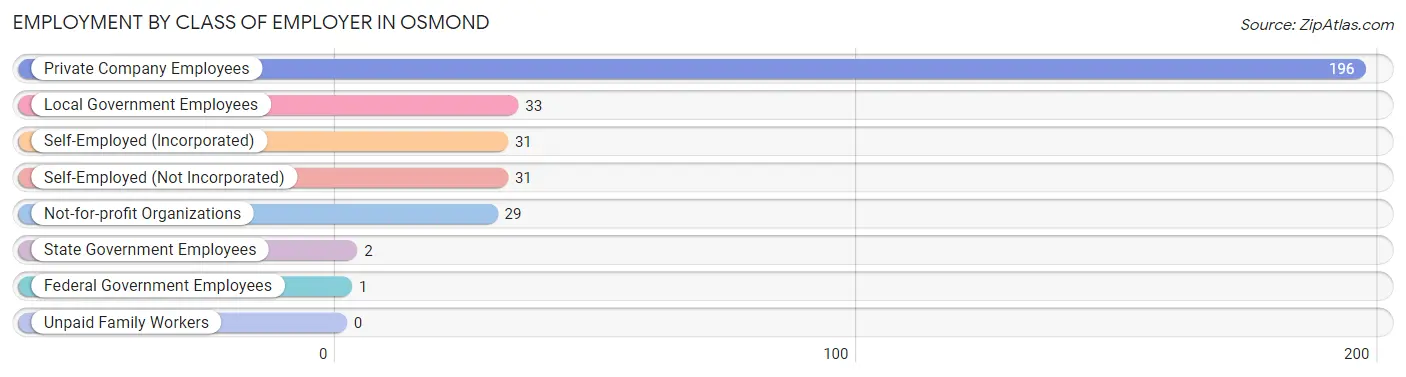
| Employer Class | # Employees | % Employees |
| Private Company Employees | 196 | 60.7% |
| Self-Employed (Incorporated) | 31 | 9.6% |
| Self-Employed (Not Incorporated) | 31 | 9.6% |
| Not-for-profit Organizations | 29 | 9.0% |
| Local Government Employees | 33 | 10.2% |
| State Government Employees | 2 | 0.6% |
| Federal Government Employees | 1 | 0.3% |
| Unpaid Family Workers | 0 | 0.0% |
| Total | 323 | 100.0% |
Employment Status by Age in Osmond
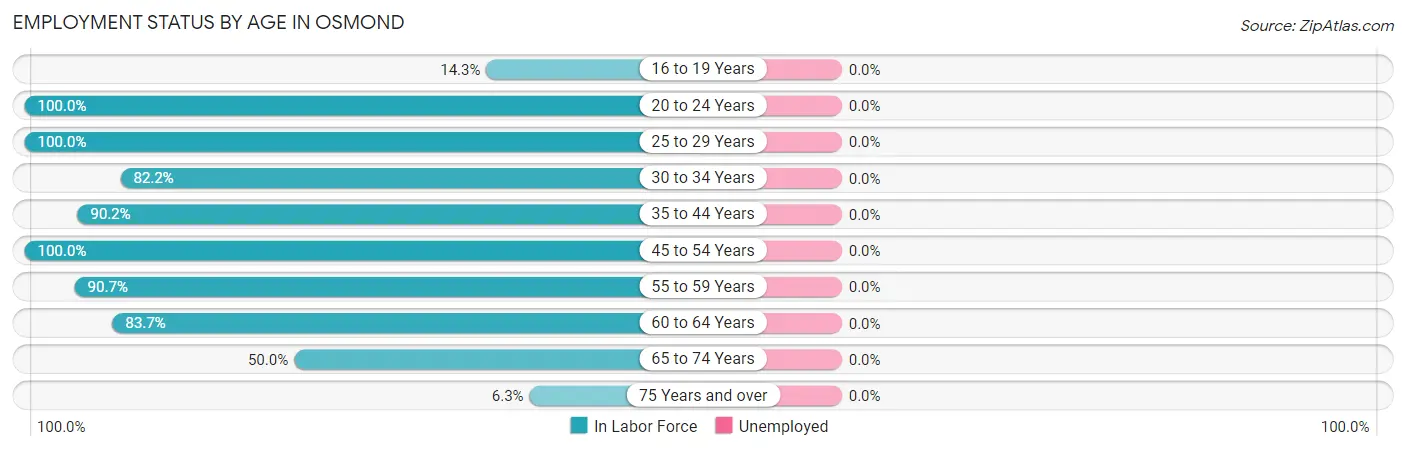
| Age Bracket | In Labor Force | Unemployed |
| 16 to 19 Years | 2 (14.3%) | 0 (0.0%) |
| 20 to 24 Years | 32 (100.0%) | 0 (0.0%) |
| 25 to 29 Years | 20 (100.0%) | 0 (0.0%) |
| 30 to 34 Years | 37 (82.2%) | 0 (0.0%) |
| 35 to 44 Years | 46 (90.2%) | 0 (0.0%) |
| 45 to 54 Years | 68 (100.0%) | 0 (0.0%) |
| 55 to 59 Years | 39 (90.7%) | 0 (0.0%) |
| 60 to 64 Years | 41 (83.7%) | 0 (0.0%) |
| 65 to 74 Years | 34 (50.0%) | 0 (0.0%) |
| 75 Years and over | 6 (6.3%) | 0 (0.0%) |
| Total | 325 (67.0%) | 0 (0.0%) |
Employment Status by Educational Attainment in Osmond
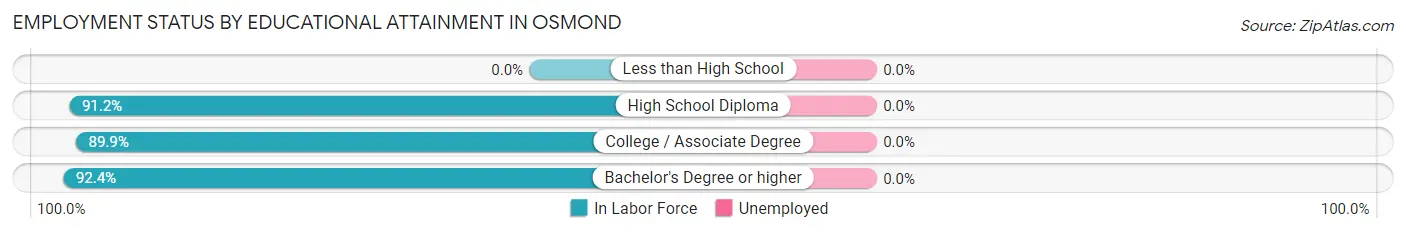
| Educational Attainment | In Labor Force | Unemployed |
| Less than High School | 0 (0.0%) | 0 (0.0%) |
| High School Diploma | 83 (91.2%) | 0 (0.0%) |
| College / Associate Degree | 107 (89.9%) | 0 (0.0%) |
| Bachelor's Degree or higher | 61 (92.4%) | 0 (0.0%) |
| Total | 251 (90.9%) | 0 (0.0%) |
Employment Occupations by Sex in Osmond
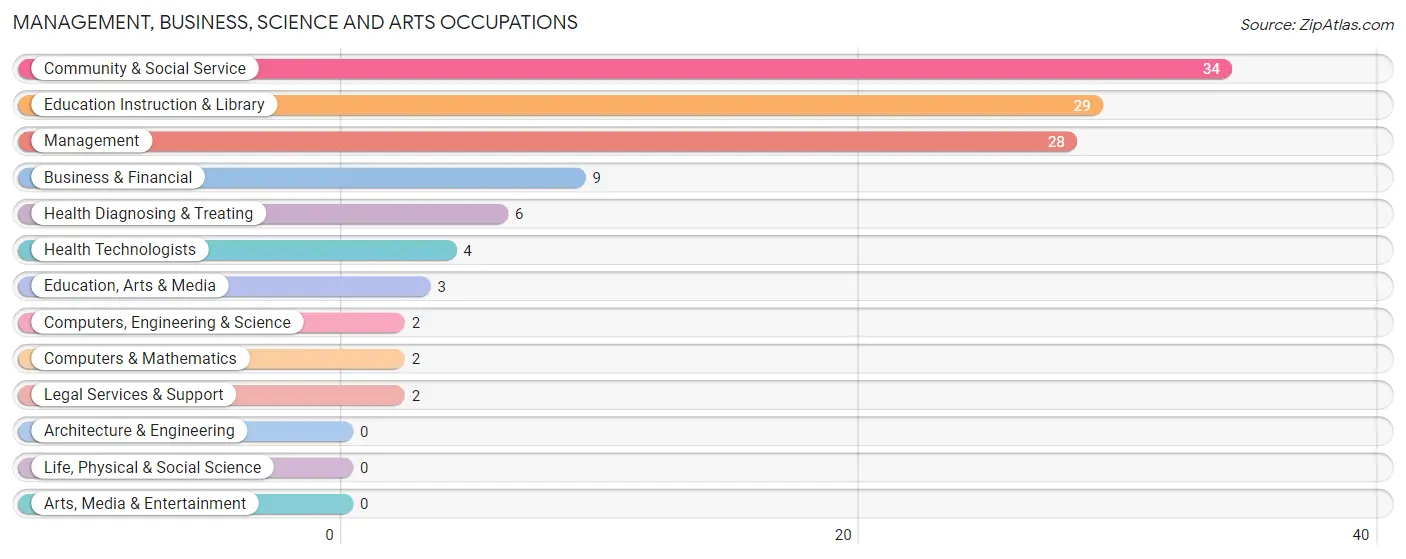
Management, Business, Science and Arts Occupations
The most common Management, Business, Science and Arts occupations in Osmond are Community & Social Service (34 | 10.5%), Education Instruction & Library (29 | 8.9%), Management (28 | 8.6%), Business & Financial (9 | 2.8%), and Health Diagnosing & Treating (6 | 1.8%).
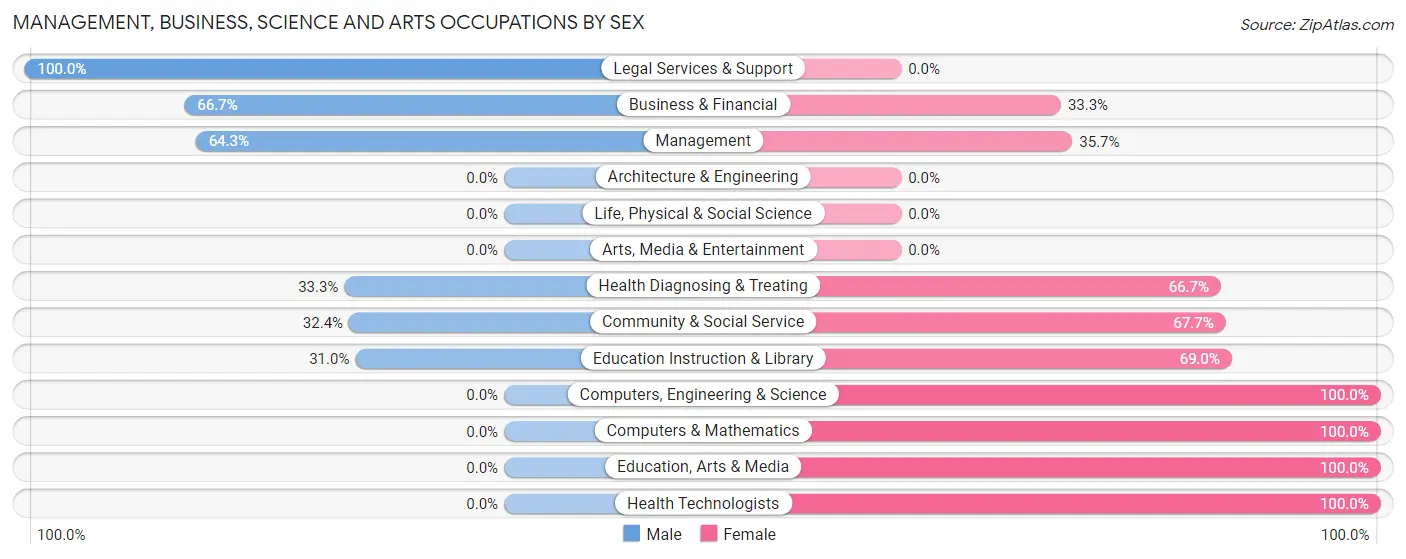
Management, Business, Science and Arts Occupations by Sex
Within the Management, Business, Science and Arts occupations in Osmond, the most male-oriented occupations are Legal Services & Support (100.0%), Business & Financial (66.7%), and Management (64.3%), while the most female-oriented occupations are Computers, Engineering & Science (100.0%), Computers & Mathematics (100.0%), and Education, Arts & Media (100.0%).
| Occupation | Male | Female |
| Management | 18 (64.3%) | 10 (35.7%) |
| Business & Financial | 6 (66.7%) | 3 (33.3%) |
| Computers, Engineering & Science | 0 (0.0%) | 2 (100.0%) |
| Computers & Mathematics | 0 (0.0%) | 2 (100.0%) |
| Architecture & Engineering | 0 (0.0%) | 0 (0.0%) |
| Life, Physical & Social Science | 0 (0.0%) | 0 (0.0%) |
| Community & Social Service | 11 (32.4%) | 23 (67.6%) |
| Education, Arts & Media | 0 (0.0%) | 3 (100.0%) |
| Legal Services & Support | 2 (100.0%) | 0 (0.0%) |
| Education Instruction & Library | 9 (31.0%) | 20 (69.0%) |
| Arts, Media & Entertainment | 0 (0.0%) | 0 (0.0%) |
| Health Diagnosing & Treating | 2 (33.3%) | 4 (66.7%) |
| Health Technologists | 0 (0.0%) | 4 (100.0%) |
| Total (Category) | 37 (46.8%) | 42 (53.2%) |
| Total (Overall) | 182 (56.0%) | 143 (44.0%) |
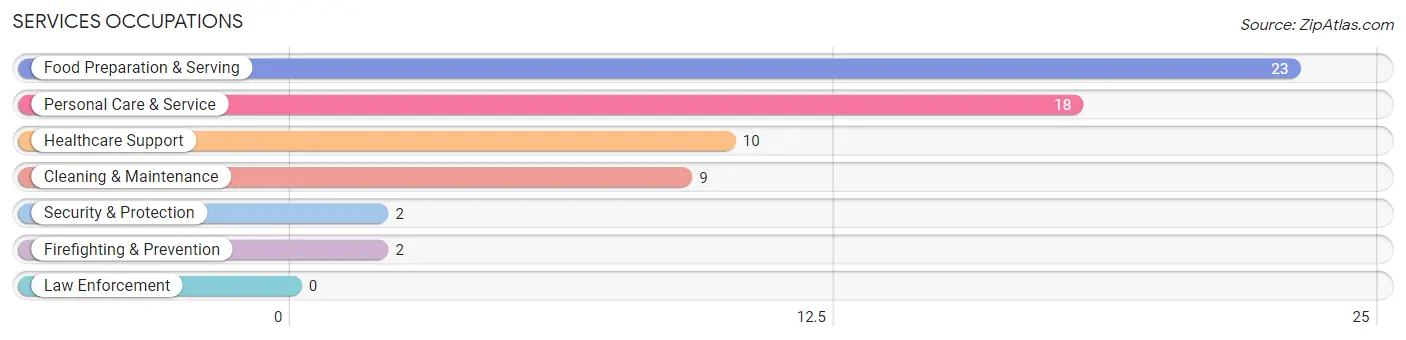
Services Occupations
The most common Services occupations in Osmond are Food Preparation & Serving (23 | 7.1%), Personal Care & Service (18 | 5.5%), Healthcare Support (10 | 3.1%), Cleaning & Maintenance (9 | 2.8%), and Security & Protection (2 | 0.6%).
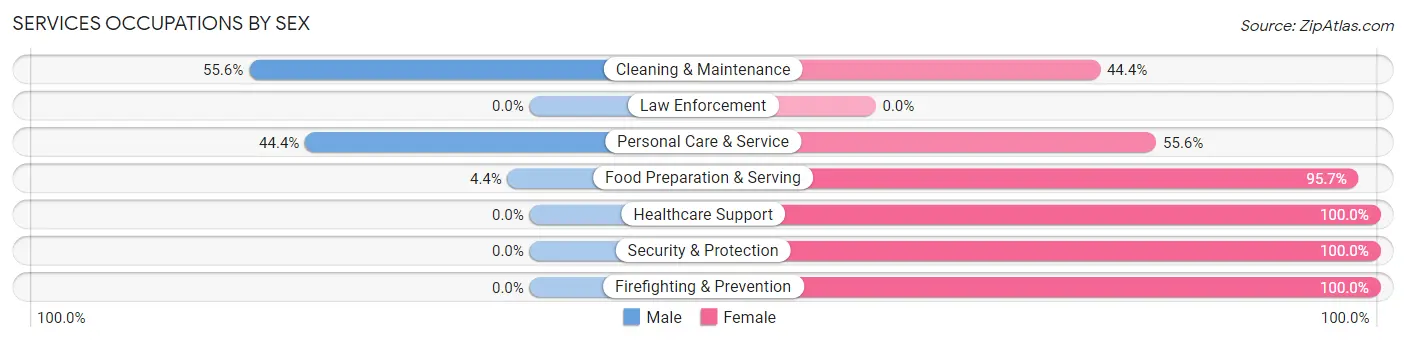
Services Occupations by Sex
Within the Services occupations in Osmond, the most male-oriented occupations are Cleaning & Maintenance (55.6%), Personal Care & Service (44.4%), and Food Preparation & Serving (4.3%), while the most female-oriented occupations are Healthcare Support (100.0%), Security & Protection (100.0%), and Firefighting & Prevention (100.0%).
| Occupation | Male | Female |
| Healthcare Support | 0 (0.0%) | 10 (100.0%) |
| Security & Protection | 0 (0.0%) | 2 (100.0%) |
| Firefighting & Prevention | 0 (0.0%) | 2 (100.0%) |
| Law Enforcement | 0 (0.0%) | 0 (0.0%) |
| Food Preparation & Serving | 1 (4.3%) | 22 (95.7%) |
| Cleaning & Maintenance | 5 (55.6%) | 4 (44.4%) |
| Personal Care & Service | 8 (44.4%) | 10 (55.6%) |
| Total (Category) | 14 (22.6%) | 48 (77.4%) |
| Total (Overall) | 182 (56.0%) | 143 (44.0%) |
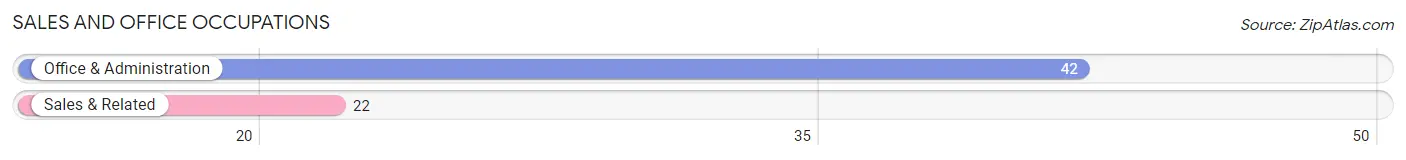
Sales and Office Occupations
The most common Sales and Office occupations in Osmond are Office & Administration (42 | 12.9%), and Sales & Related (22 | 6.8%).
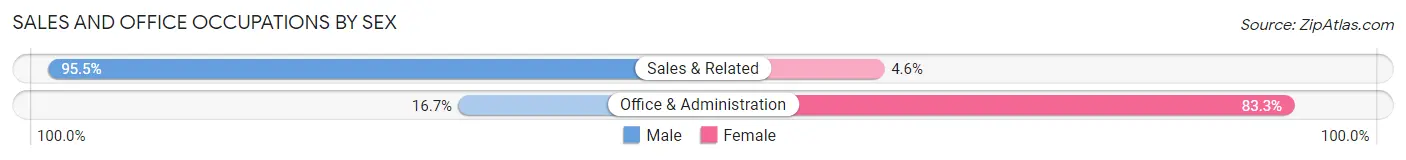
Sales and Office Occupations by Sex
| Occupation | Male | Female |
| Sales & Related | 21 (95.5%) | 1 (4.5%) |
| Office & Administration | 7 (16.7%) | 35 (83.3%) |
| Total (Category) | 28 (43.8%) | 36 (56.2%) |
| Total (Overall) | 182 (56.0%) | 143 (44.0%) |
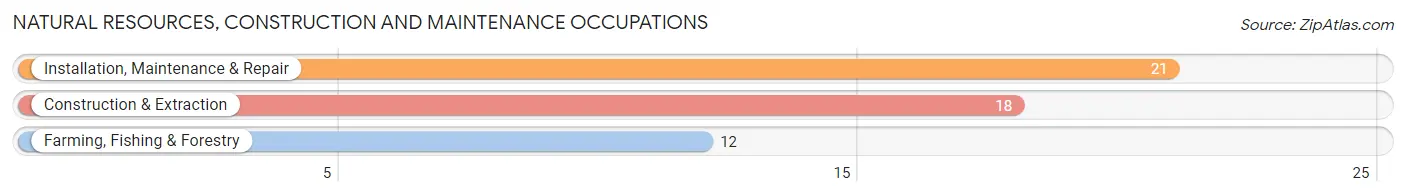
Natural Resources, Construction and Maintenance Occupations
The most common Natural Resources, Construction and Maintenance occupations in Osmond are Installation, Maintenance & Repair (21 | 6.5%), Construction & Extraction (18 | 5.5%), and Farming, Fishing & Forestry (12 | 3.7%).
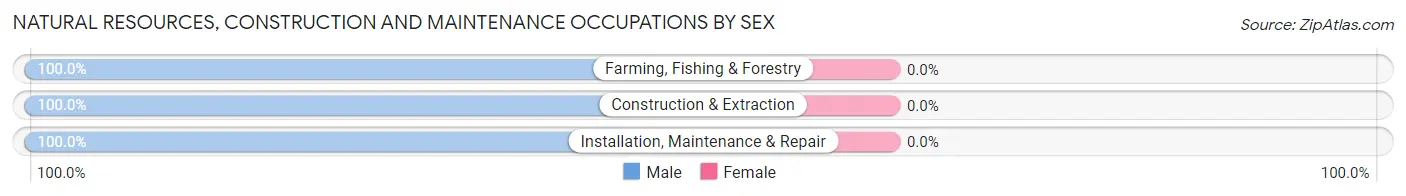
Natural Resources, Construction and Maintenance Occupations by Sex
| Occupation | Male | Female |
| Farming, Fishing & Forestry | 12 (100.0%) | 0 (0.0%) |
| Construction & Extraction | 18 (100.0%) | 0 (0.0%) |
| Installation, Maintenance & Repair | 21 (100.0%) | 0 (0.0%) |
| Total (Category) | 51 (100.0%) | 0 (0.0%) |
| Total (Overall) | 182 (56.0%) | 143 (44.0%) |
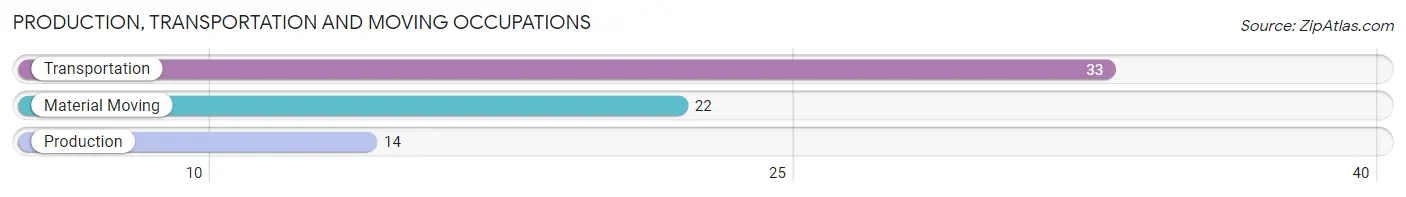
Production, Transportation and Moving Occupations
The most common Production, Transportation and Moving occupations in Osmond are Transportation (33 | 10.2%), Material Moving (22 | 6.8%), and Production (14 | 4.3%).
Production, Transportation and Moving Occupations by Sex
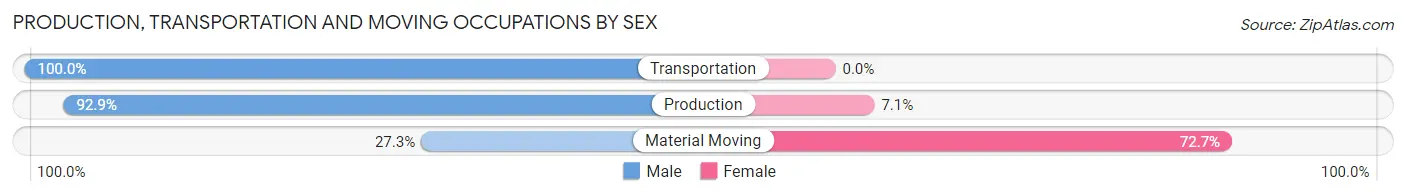
| Occupation | Male | Female |
| Production | 13 (92.9%) | 1 (7.1%) |
| Transportation | 33 (100.0%) | 0 (0.0%) |
| Material Moving | 6 (27.3%) | 16 (72.7%) |
| Total (Category) | 52 (75.4%) | 17 (24.6%) |
| Total (Overall) | 182 (56.0%) | 143 (44.0%) |
Employment Industries by Sex in Osmond
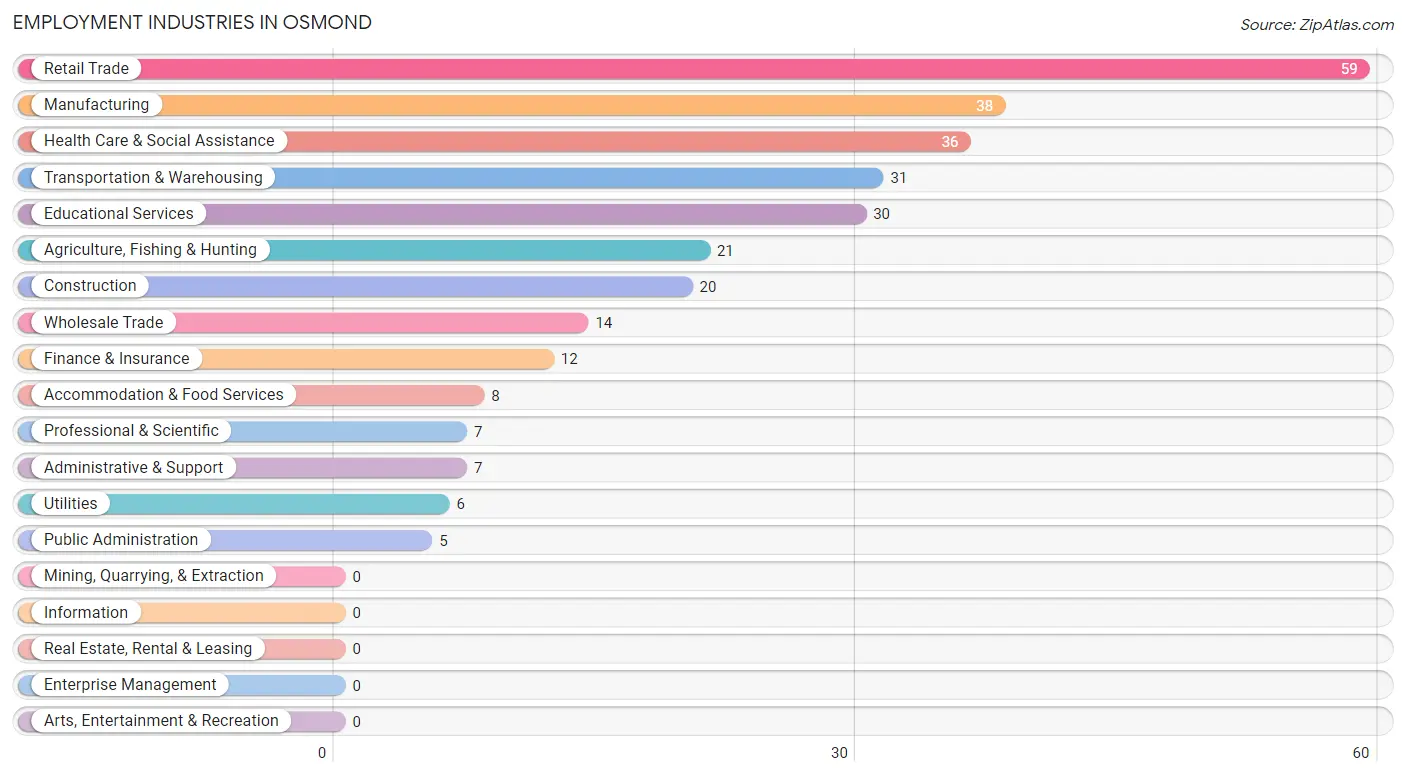
Employment Industries in Osmond
The major employment industries in Osmond include Retail Trade (59 | 18.1%), Manufacturing (38 | 11.7%), Health Care & Social Assistance (36 | 11.1%), Transportation & Warehousing (31 | 9.5%), and Educational Services (30 | 9.2%).
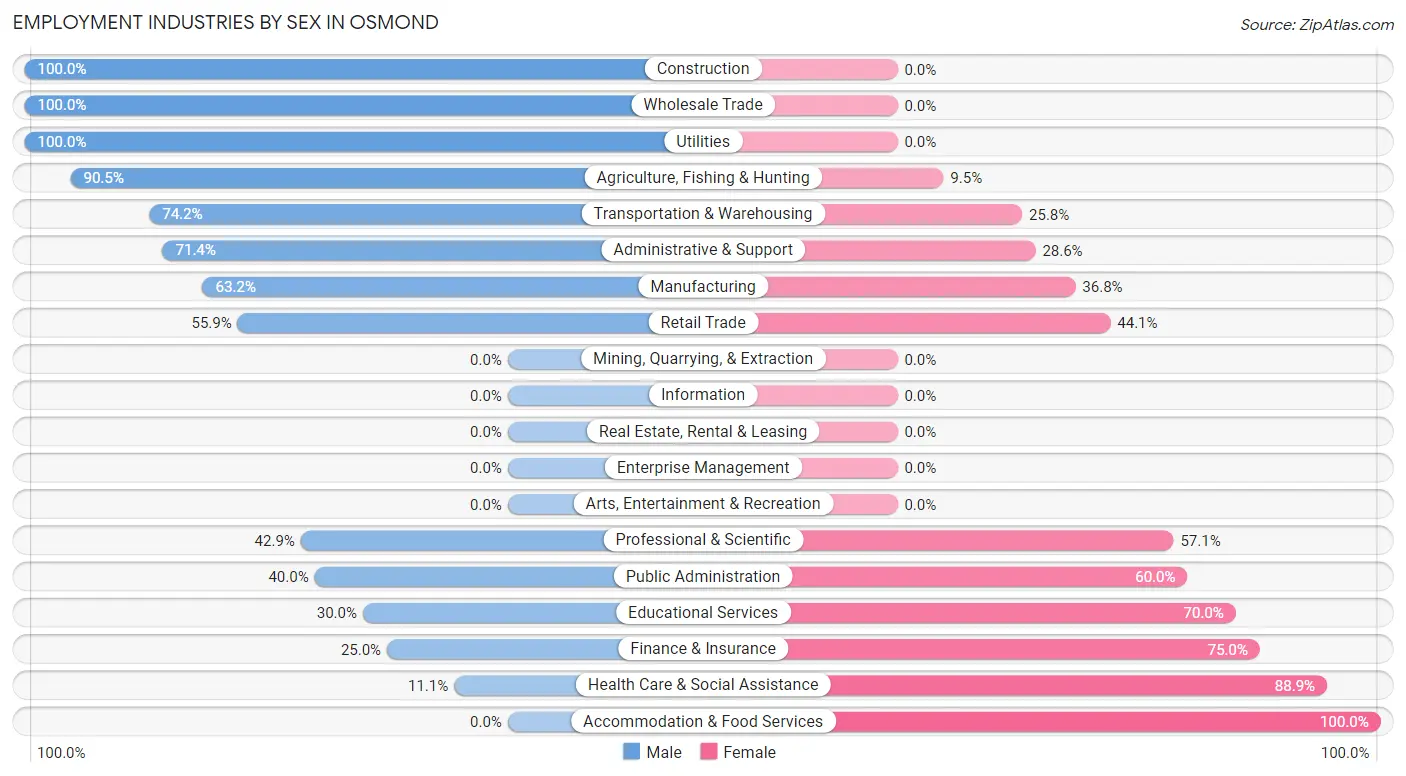
Employment Industries by Sex in Osmond
The Osmond industries that see more men than women are Construction (100.0%), Wholesale Trade (100.0%), and Utilities (100.0%), whereas the industries that tend to have a higher number of women are Accommodation & Food Services (100.0%), Health Care & Social Assistance (88.9%), and Finance & Insurance (75.0%).
| Industry | Male | Female |
| Agriculture, Fishing & Hunting | 19 (90.5%) | 2 (9.5%) |
| Mining, Quarrying, & Extraction | 0 (0.0%) | 0 (0.0%) |
| Construction | 20 (100.0%) | 0 (0.0%) |
| Manufacturing | 24 (63.2%) | 14 (36.8%) |
| Wholesale Trade | 14 (100.0%) | 0 (0.0%) |
| Retail Trade | 33 (55.9%) | 26 (44.1%) |
| Transportation & Warehousing | 23 (74.2%) | 8 (25.8%) |
| Utilities | 6 (100.0%) | 0 (0.0%) |
| Information | 0 (0.0%) | 0 (0.0%) |
| Finance & Insurance | 3 (25.0%) | 9 (75.0%) |
| Real Estate, Rental & Leasing | 0 (0.0%) | 0 (0.0%) |
| Professional & Scientific | 3 (42.9%) | 4 (57.1%) |
| Enterprise Management | 0 (0.0%) | 0 (0.0%) |
| Administrative & Support | 5 (71.4%) | 2 (28.6%) |
| Educational Services | 9 (30.0%) | 21 (70.0%) |
| Health Care & Social Assistance | 4 (11.1%) | 32 (88.9%) |
| Arts, Entertainment & Recreation | 0 (0.0%) | 0 (0.0%) |
| Accommodation & Food Services | 0 (0.0%) | 8 (100.0%) |
| Public Administration | 2 (40.0%) | 3 (60.0%) |
| Total | 182 (56.0%) | 143 (44.0%) |
Education in Osmond
School Enrollment in Osmond
The most common levels of schooling among the 167 students in Osmond are elementary school (58 | 34.7%), middle school (51 | 30.5%), and nursery / preschool (23 | 13.8%).
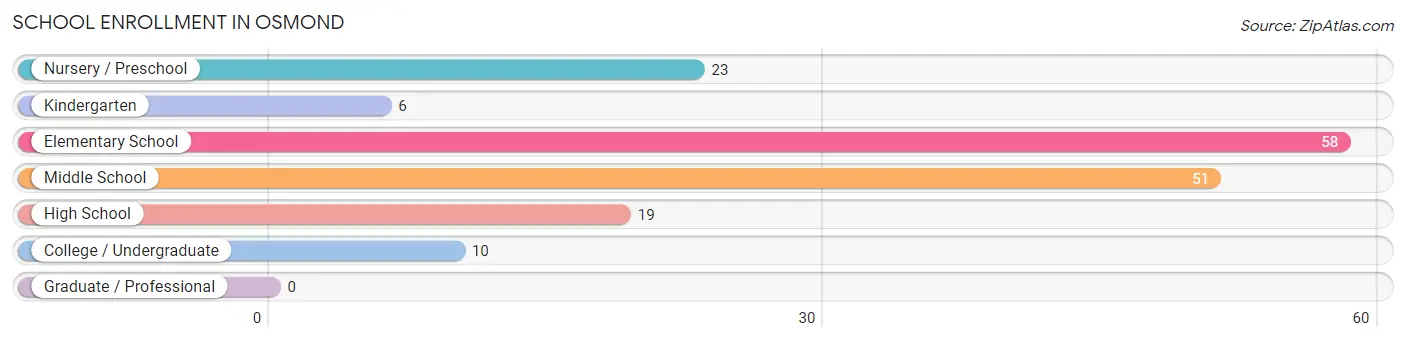
| School Level | # Students | % Students |
| Nursery / Preschool | 23 | 13.8% |
| Kindergarten | 6 | 3.6% |
| Elementary School | 58 | 34.7% |
| Middle School | 51 | 30.5% |
| High School | 19 | 11.4% |
| College / Undergraduate | 10 | 6.0% |
| Graduate / Professional | 0 | 0.0% |
| Total | 167 | 100.0% |
School Enrollment by Age by Funding Source in Osmond
Out of a total of 167 students who are enrolled in schools in Osmond, 22 (13.2%) attend a private institution, while the remaining 145 (86.8%) are enrolled in public schools. The age group of 3 to 4 year olds has the highest likelihood of being enrolled in private schools, with 15 (93.8% in the age bracket) enrolled. Conversely, the age group of 15 to 17 year olds has the lowest likelihood of being enrolled in a private school, with 17 (100.0% in the age bracket) attending a public institution.
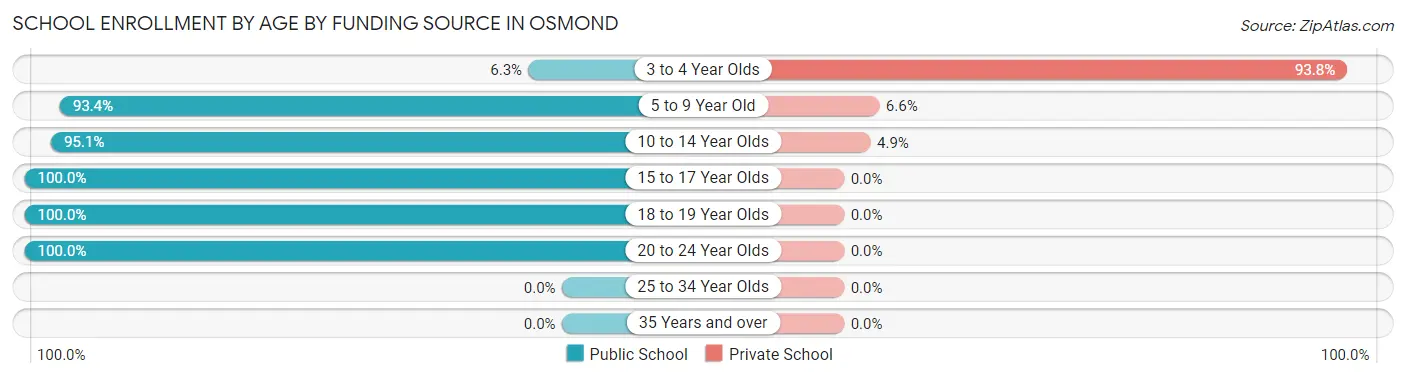
| Age Bracket | Public School | Private School |
| 3 to 4 Year Olds | 1 (6.2%) | 15 (93.8%) |
| 5 to 9 Year Old | 57 (93.4%) | 4 (6.6%) |
| 10 to 14 Year Olds | 58 (95.1%) | 3 (4.9%) |
| 15 to 17 Year Olds | 17 (100.0%) | 0 (0.0%) |
| 18 to 19 Year Olds | 2 (100.0%) | 0 (0.0%) |
| 20 to 24 Year Olds | 10 (100.0%) | 0 (0.0%) |
| 25 to 34 Year Olds | 0 (0.0%) | 0 (0.0%) |
| 35 Years and over | 0 (0.0%) | 0 (0.0%) |
| Total | 145 (86.8%) | 22 (13.2%) |
Educational Attainment by Field of Study in Osmond
Education (35 | 39.3%), business (31 | 34.8%), science & technology (9 | 10.1%), computers & mathematics (5 | 5.6%), and communications (3 | 3.4%) are the most common fields of study among 89 individuals in Osmond who have obtained a bachelor's degree or higher.
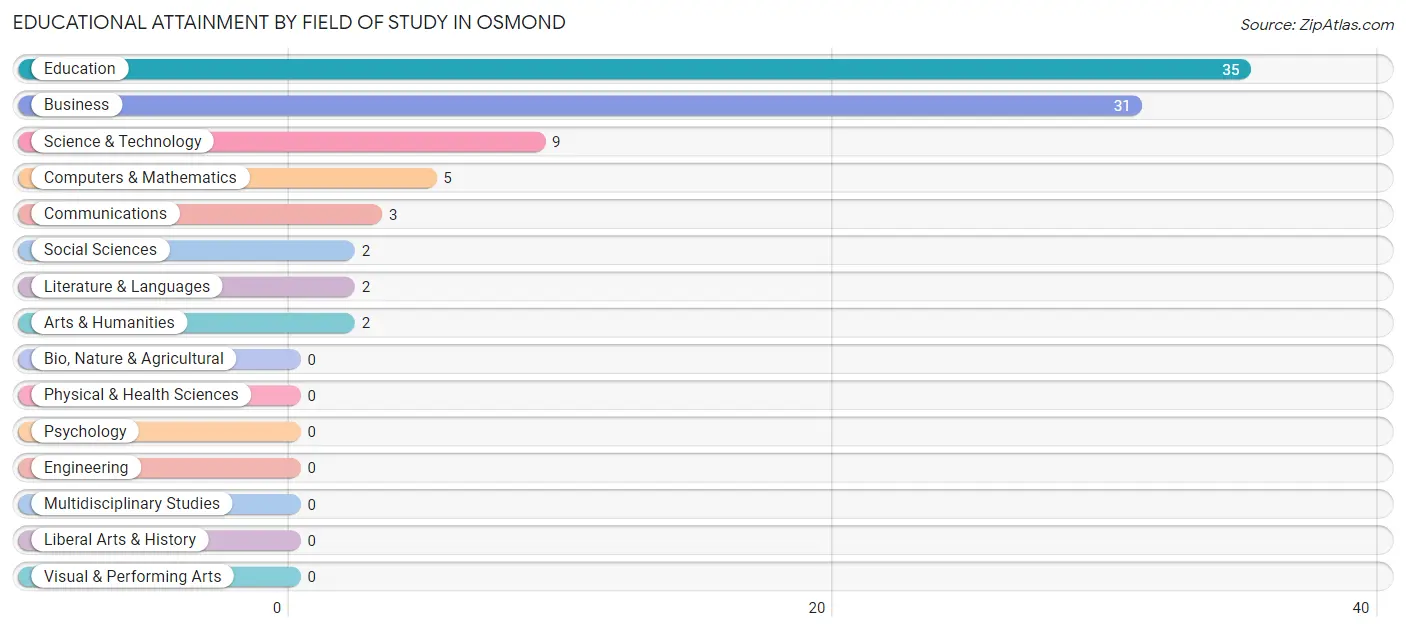
| Field of Study | # Graduates | % Graduates |
| Computers & Mathematics | 5 | 5.6% |
| Bio, Nature & Agricultural | 0 | 0.0% |
| Physical & Health Sciences | 0 | 0.0% |
| Psychology | 0 | 0.0% |
| Social Sciences | 2 | 2.2% |
| Engineering | 0 | 0.0% |
| Multidisciplinary Studies | 0 | 0.0% |
| Science & Technology | 9 | 10.1% |
| Business | 31 | 34.8% |
| Education | 35 | 39.3% |
| Literature & Languages | 2 | 2.2% |
| Liberal Arts & History | 0 | 0.0% |
| Visual & Performing Arts | 0 | 0.0% |
| Communications | 3 | 3.4% |
| Arts & Humanities | 2 | 2.2% |
| Total | 89 | 100.0% |
Transportation & Commute in Osmond
Vehicle Availability by Sex in Osmond
The most prevalent vehicle ownership categories in Osmond are males with 2 vehicles (61, accounting for 33.5%) and females with 2 vehicles (39, making up 43.3%).
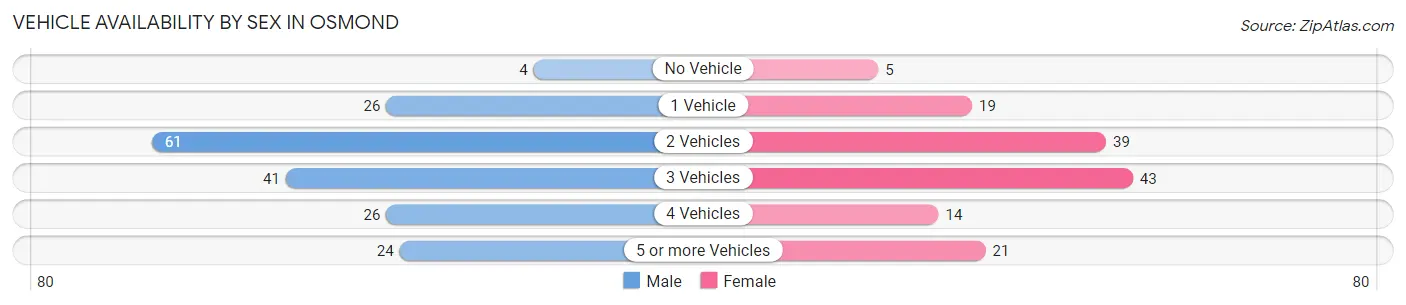
| Vehicles Available | Male | Female |
| No Vehicle | 4 (2.2%) | 5 (3.5%) |
| 1 Vehicle | 26 (14.3%) | 19 (13.5%) |
| 2 Vehicles | 61 (33.5%) | 39 (27.7%) |
| 3 Vehicles | 41 (22.5%) | 43 (30.5%) |
| 4 Vehicles | 26 (14.3%) | 14 (9.9%) |
| 5 or more Vehicles | 24 (13.2%) | 21 (14.9%) |
| Total | 182 (100.0%) | 141 (100.0%) |
Commute Time in Osmond
The most frequently occuring commute durations in Osmond are 5 to 9 minutes (71 commuters, 24.1%), less than 5 minutes (51 commuters, 17.3%), and 30 to 34 minutes (45 commuters, 15.3%).
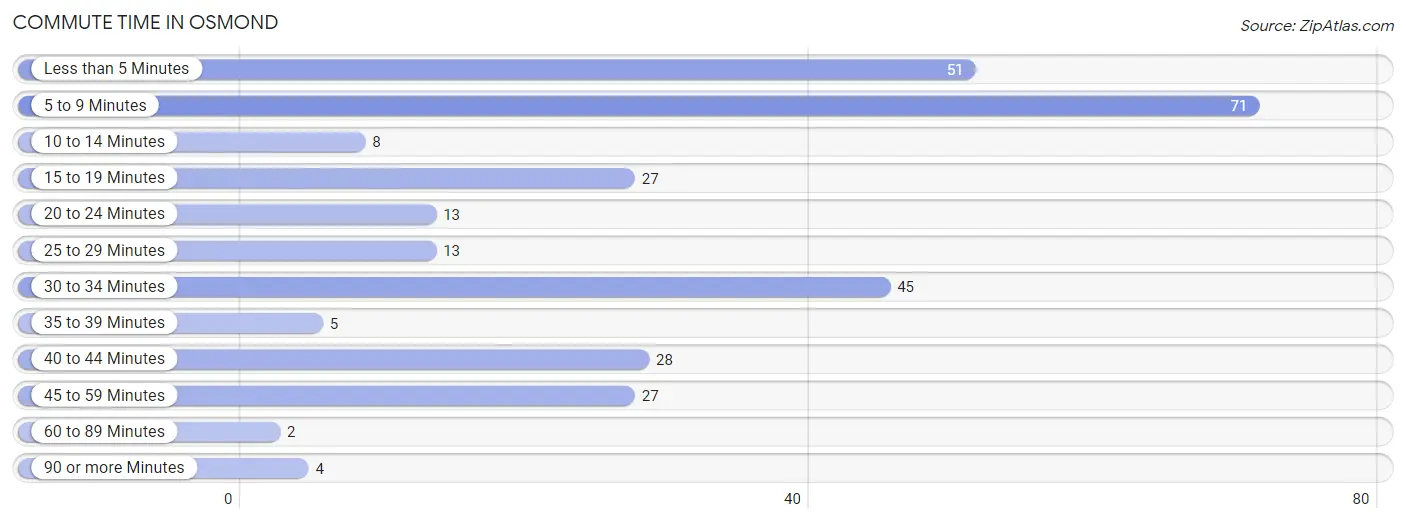
| Commute Time | # Commuters | % Commuters |
| Less than 5 Minutes | 51 | 17.3% |
| 5 to 9 Minutes | 71 | 24.1% |
| 10 to 14 Minutes | 8 | 2.7% |
| 15 to 19 Minutes | 27 | 9.2% |
| 20 to 24 Minutes | 13 | 4.4% |
| 25 to 29 Minutes | 13 | 4.4% |
| 30 to 34 Minutes | 45 | 15.3% |
| 35 to 39 Minutes | 5 | 1.7% |
| 40 to 44 Minutes | 28 | 9.5% |
| 45 to 59 Minutes | 27 | 9.2% |
| 60 to 89 Minutes | 2 | 0.7% |
| 90 or more Minutes | 4 | 1.4% |
Commute Time by Sex in Osmond
The most common commute times in Osmond are less than 5 minutes (35 commuters, 19.8%) for males and 5 to 9 minutes (37 commuters, 31.6%) for females.
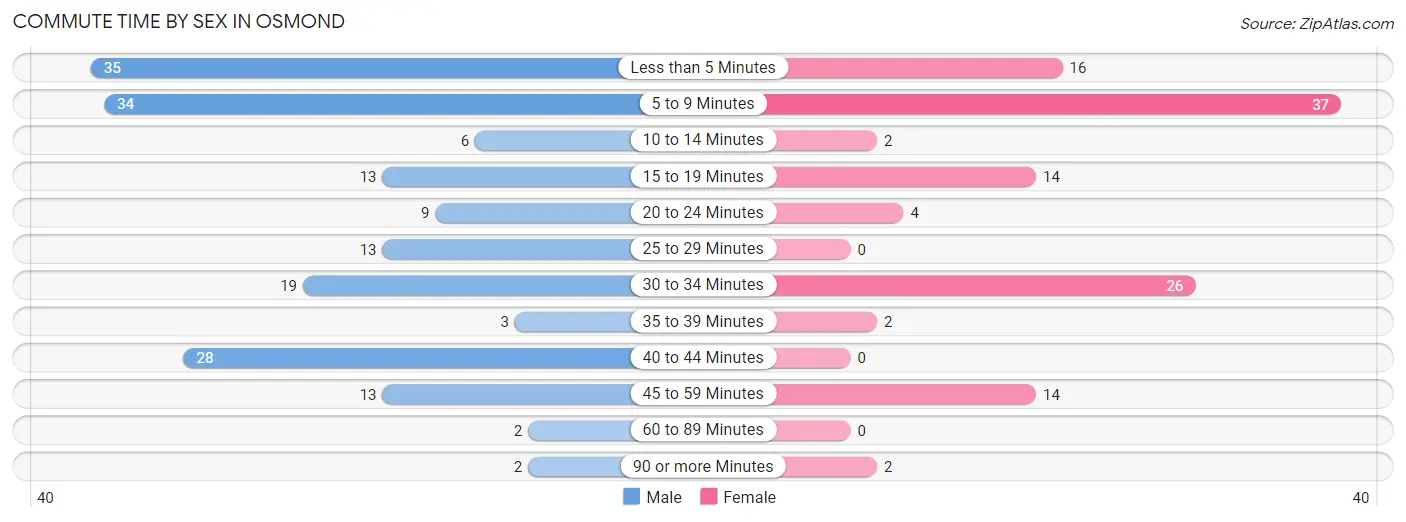
| Commute Time | Male | Female |
| Less than 5 Minutes | 35 (19.8%) | 16 (13.7%) |
| 5 to 9 Minutes | 34 (19.2%) | 37 (31.6%) |
| 10 to 14 Minutes | 6 (3.4%) | 2 (1.7%) |
| 15 to 19 Minutes | 13 (7.3%) | 14 (12.0%) |
| 20 to 24 Minutes | 9 (5.1%) | 4 (3.4%) |
| 25 to 29 Minutes | 13 (7.3%) | 0 (0.0%) |
| 30 to 34 Minutes | 19 (10.7%) | 26 (22.2%) |
| 35 to 39 Minutes | 3 (1.7%) | 2 (1.7%) |
| 40 to 44 Minutes | 28 (15.8%) | 0 (0.0%) |
| 45 to 59 Minutes | 13 (7.3%) | 14 (12.0%) |
| 60 to 89 Minutes | 2 (1.1%) | 0 (0.0%) |
| 90 or more Minutes | 2 (1.1%) | 2 (1.7%) |
Time of Departure to Work by Sex in Osmond
The most frequent times of departure to work in Osmond are 6:30 AM to 6:59 AM (34, 19.2%) for males and 7:30 AM to 7:59 AM (49, 41.9%) for females.
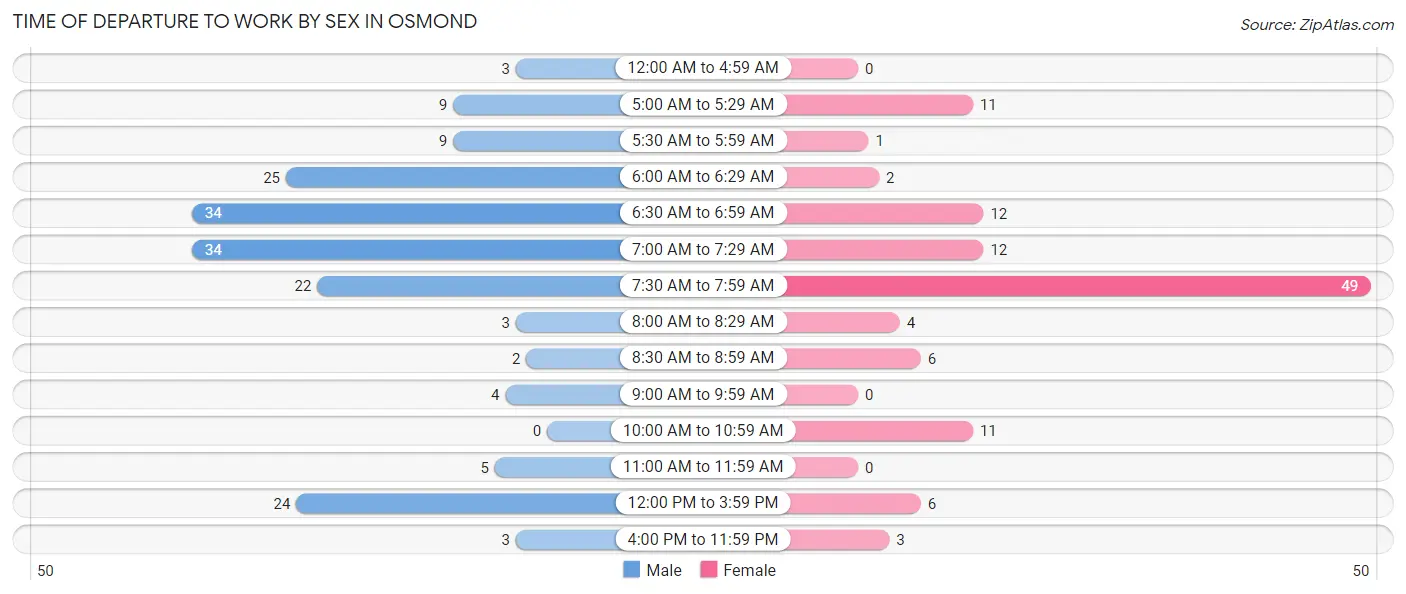
| Time of Departure | Male | Female |
| 12:00 AM to 4:59 AM | 3 (1.7%) | 0 (0.0%) |
| 5:00 AM to 5:29 AM | 9 (5.1%) | 11 (9.4%) |
| 5:30 AM to 5:59 AM | 9 (5.1%) | 1 (0.9%) |
| 6:00 AM to 6:29 AM | 25 (14.1%) | 2 (1.7%) |
| 6:30 AM to 6:59 AM | 34 (19.2%) | 12 (10.3%) |
| 7:00 AM to 7:29 AM | 34 (19.2%) | 12 (10.3%) |
| 7:30 AM to 7:59 AM | 22 (12.4%) | 49 (41.9%) |
| 8:00 AM to 8:29 AM | 3 (1.7%) | 4 (3.4%) |
| 8:30 AM to 8:59 AM | 2 (1.1%) | 6 (5.1%) |
| 9:00 AM to 9:59 AM | 4 (2.3%) | 0 (0.0%) |
| 10:00 AM to 10:59 AM | 0 (0.0%) | 11 (9.4%) |
| 11:00 AM to 11:59 AM | 5 (2.8%) | 0 (0.0%) |
| 12:00 PM to 3:59 PM | 24 (13.6%) | 6 (5.1%) |
| 4:00 PM to 11:59 PM | 3 (1.7%) | 3 (2.6%) |
| Total | 177 (100.0%) | 117 (100.0%) |
Housing Occupancy in Osmond
Occupancy by Ownership in Osmond
Of the total 262 dwellings in Osmond, owner-occupied units account for 208 (79.4%), while renter-occupied units make up 54 (20.6%).
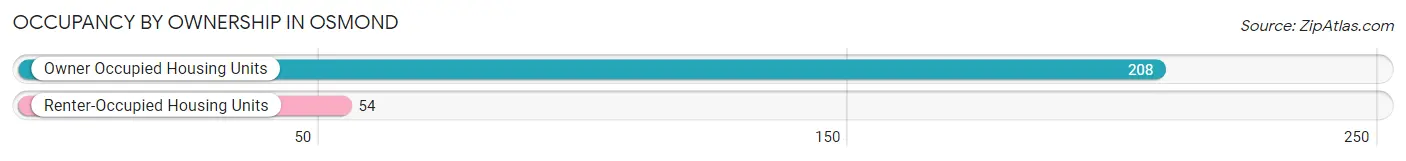
| Occupancy | # Housing Units | % Housing Units |
| Owner Occupied Housing Units | 208 | 79.4% |
| Renter-Occupied Housing Units | 54 | 20.6% |
| Total Occupied Housing Units | 262 | 100.0% |
Occupancy by Household Size in Osmond
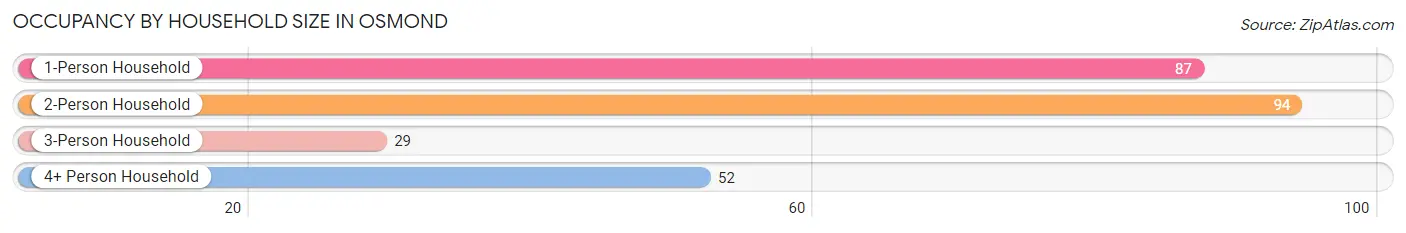
| Household Size | # Housing Units | % Housing Units |
| 1-Person Household | 87 | 33.2% |
| 2-Person Household | 94 | 35.9% |
| 3-Person Household | 29 | 11.1% |
| 4+ Person Household | 52 | 19.9% |
| Total Housing Units | 262 | 100.0% |
Occupancy by Ownership by Household Size in Osmond
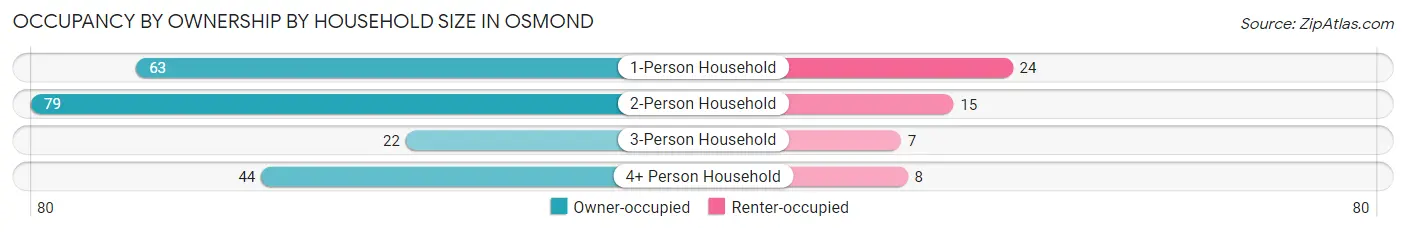
| Household Size | Owner-occupied | Renter-occupied |
| 1-Person Household | 63 (72.4%) | 24 (27.6%) |
| 2-Person Household | 79 (84.0%) | 15 (16.0%) |
| 3-Person Household | 22 (75.9%) | 7 (24.1%) |
| 4+ Person Household | 44 (84.6%) | 8 (15.4%) |
| Total Housing Units | 208 (79.4%) | 54 (20.6%) |
Occupancy by Educational Attainment in Osmond
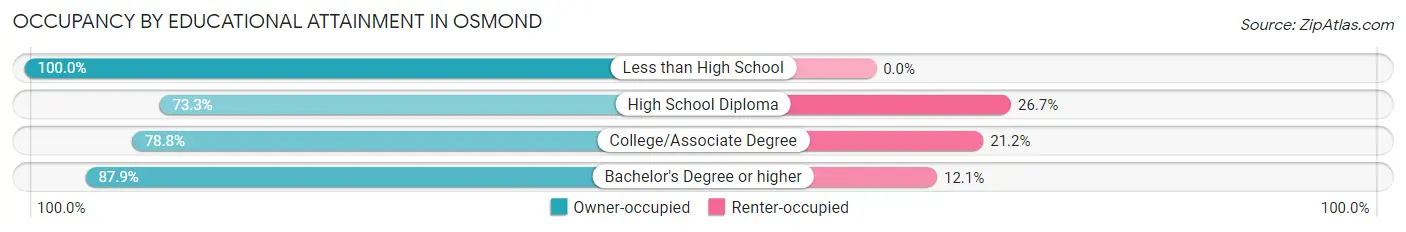
| Household Size | Owner-occupied | Renter-occupied |
| Less than High School | 5 (100.0%) | 0 (0.0%) |
| High School Diploma | 63 (73.3%) | 23 (26.7%) |
| College/Associate Degree | 89 (78.8%) | 24 (21.2%) |
| Bachelor's Degree or higher | 51 (87.9%) | 7 (12.1%) |
Occupancy by Age of Householder in Osmond
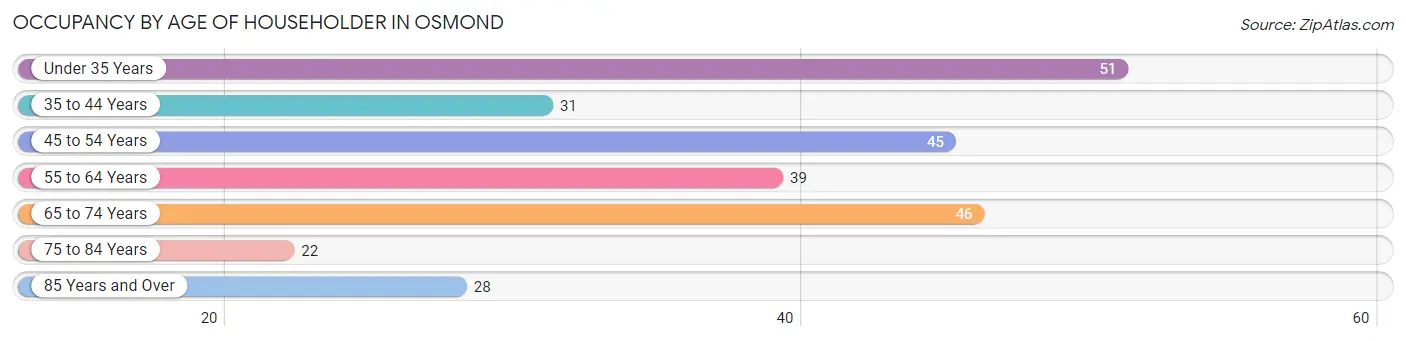
| Age Bracket | # Households | % Households |
| Under 35 Years | 51 | 19.5% |
| 35 to 44 Years | 31 | 11.8% |
| 45 to 54 Years | 45 | 17.2% |
| 55 to 64 Years | 39 | 14.9% |
| 65 to 74 Years | 46 | 17.6% |
| 75 to 84 Years | 22 | 8.4% |
| 85 Years and Over | 28 | 10.7% |
| Total | 262 | 100.0% |
Housing Finances in Osmond
Median Income by Occupancy in Osmond
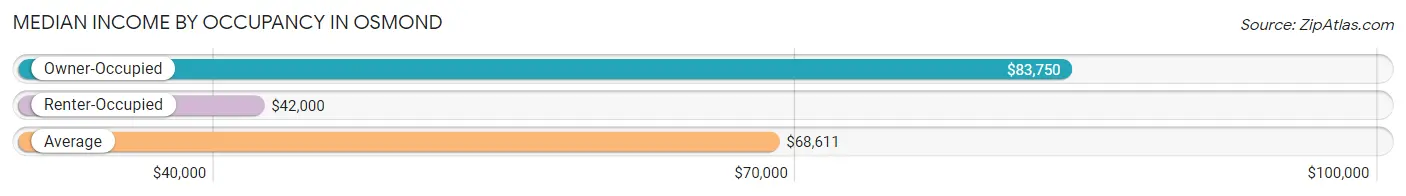
| Occupancy Type | # Households | Median Income |
| Owner-Occupied | 208 (79.4%) | $83,750 |
| Renter-Occupied | 54 (20.6%) | $42,000 |
| Average | 262 (100.0%) | $68,611 |
Occupancy by Householder Income Bracket in Osmond
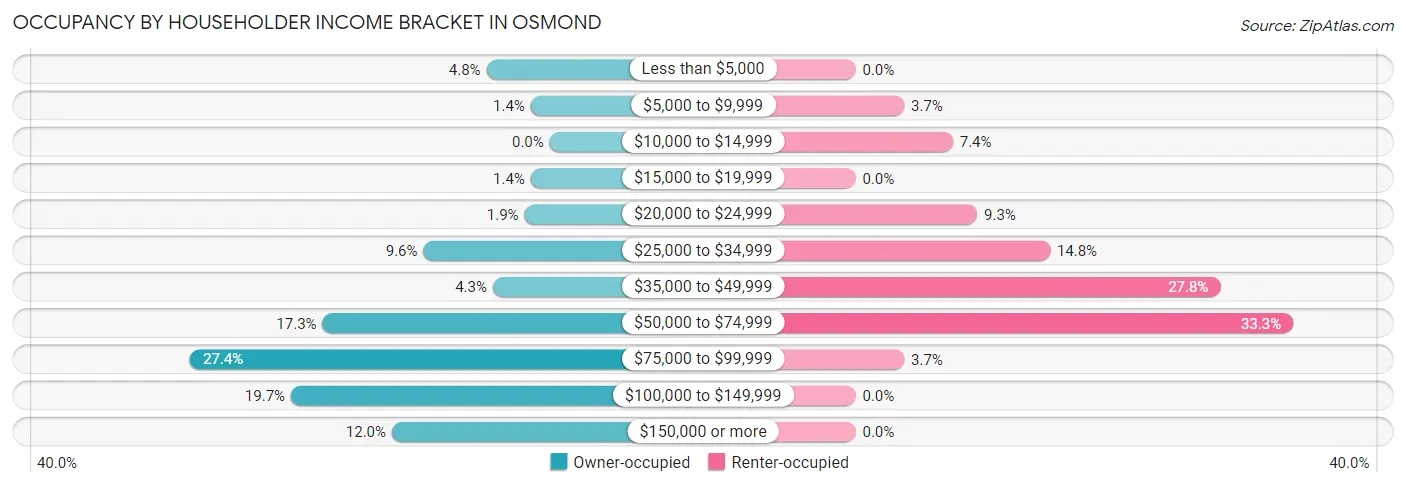
| Income Bracket | Owner-occupied | Renter-occupied |
| Less than $5,000 | 10 (4.8%) | 0 (0.0%) |
| $5,000 to $9,999 | 3 (1.4%) | 2 (3.7%) |
| $10,000 to $14,999 | 0 (0.0%) | 4 (7.4%) |
| $15,000 to $19,999 | 3 (1.4%) | 0 (0.0%) |
| $20,000 to $24,999 | 4 (1.9%) | 5 (9.3%) |
| $25,000 to $34,999 | 20 (9.6%) | 8 (14.8%) |
| $35,000 to $49,999 | 9 (4.3%) | 15 (27.8%) |
| $50,000 to $74,999 | 36 (17.3%) | 18 (33.3%) |
| $75,000 to $99,999 | 57 (27.4%) | 2 (3.7%) |
| $100,000 to $149,999 | 41 (19.7%) | 0 (0.0%) |
| $150,000 or more | 25 (12.0%) | 0 (0.0%) |
| Total | 208 (100.0%) | 54 (100.0%) |
Monthly Housing Cost Tiers in Osmond
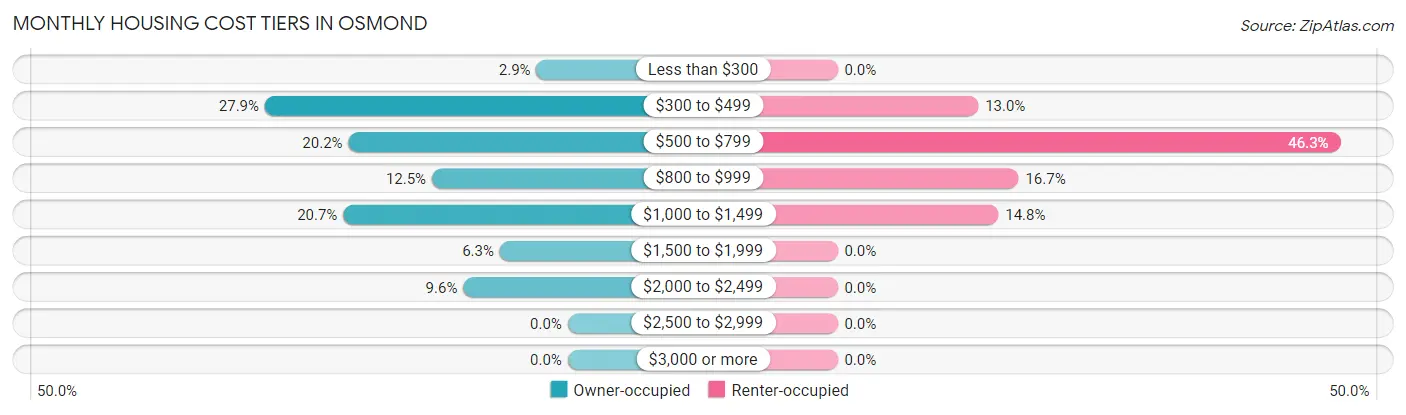
| Monthly Cost | Owner-occupied | Renter-occupied |
| Less than $300 | 6 (2.9%) | 0 (0.0%) |
| $300 to $499 | 58 (27.9%) | 7 (13.0%) |
| $500 to $799 | 42 (20.2%) | 25 (46.3%) |
| $800 to $999 | 26 (12.5%) | 9 (16.7%) |
| $1,000 to $1,499 | 43 (20.7%) | 8 (14.8%) |
| $1,500 to $1,999 | 13 (6.2%) | 0 (0.0%) |
| $2,000 to $2,499 | 20 (9.6%) | 0 (0.0%) |
| $2,500 to $2,999 | 0 (0.0%) | 0 (0.0%) |
| $3,000 or more | 0 (0.0%) | 0 (0.0%) |
| Total | 208 (100.0%) | 54 (100.0%) |
Physical Housing Characteristics in Osmond
Housing Structures in Osmond
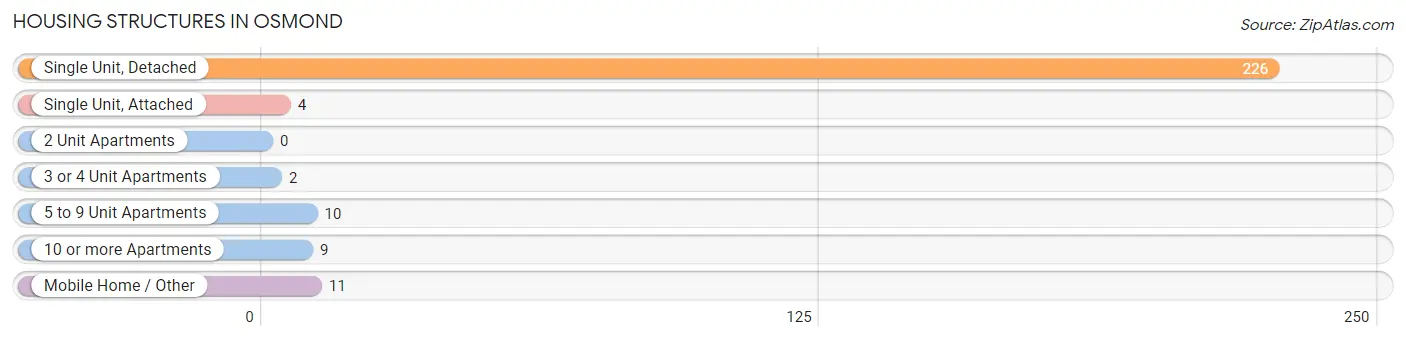
| Structure Type | # Housing Units | % Housing Units |
| Single Unit, Detached | 226 | 86.3% |
| Single Unit, Attached | 4 | 1.5% |
| 2 Unit Apartments | 0 | 0.0% |
| 3 or 4 Unit Apartments | 2 | 0.8% |
| 5 to 9 Unit Apartments | 10 | 3.8% |
| 10 or more Apartments | 9 | 3.4% |
| Mobile Home / Other | 11 | 4.2% |
| Total | 262 | 100.0% |
Housing Structures by Occupancy in Osmond
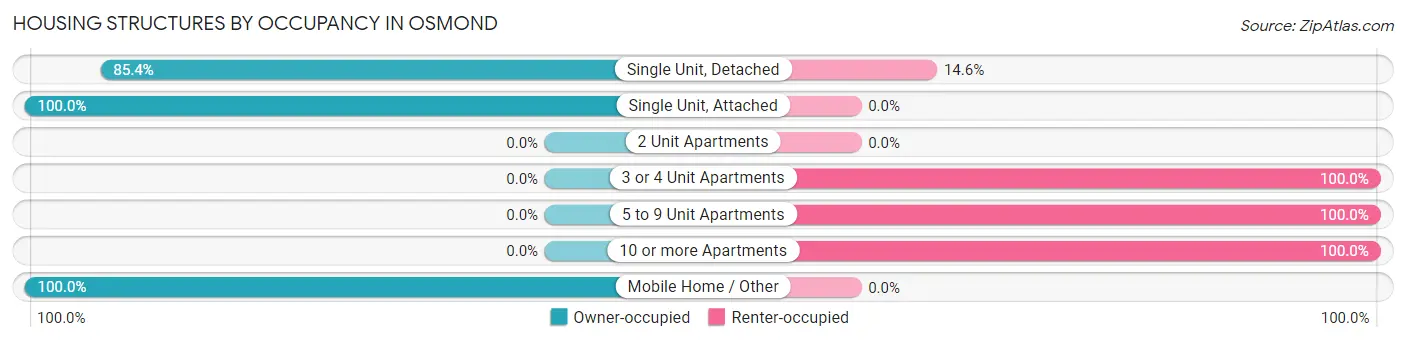
| Structure Type | Owner-occupied | Renter-occupied |
| Single Unit, Detached | 193 (85.4%) | 33 (14.6%) |
| Single Unit, Attached | 4 (100.0%) | 0 (0.0%) |
| 2 Unit Apartments | 0 (0.0%) | 0 (0.0%) |
| 3 or 4 Unit Apartments | 0 (0.0%) | 2 (100.0%) |
| 5 to 9 Unit Apartments | 0 (0.0%) | 10 (100.0%) |
| 10 or more Apartments | 0 (0.0%) | 9 (100.0%) |
| Mobile Home / Other | 11 (100.0%) | 0 (0.0%) |
| Total | 208 (79.4%) | 54 (20.6%) |
Housing Structures by Number of Rooms in Osmond
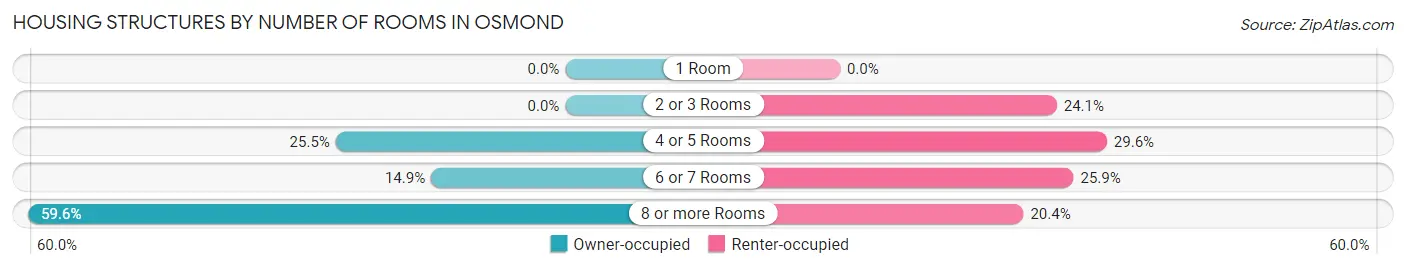
| Number of Rooms | Owner-occupied | Renter-occupied |
| 1 Room | 0 (0.0%) | 0 (0.0%) |
| 2 or 3 Rooms | 0 (0.0%) | 13 (24.1%) |
| 4 or 5 Rooms | 53 (25.5%) | 16 (29.6%) |
| 6 or 7 Rooms | 31 (14.9%) | 14 (25.9%) |
| 8 or more Rooms | 124 (59.6%) | 11 (20.4%) |
| Total | 208 (100.0%) | 54 (100.0%) |
Housing Structure by Heating Type in Osmond
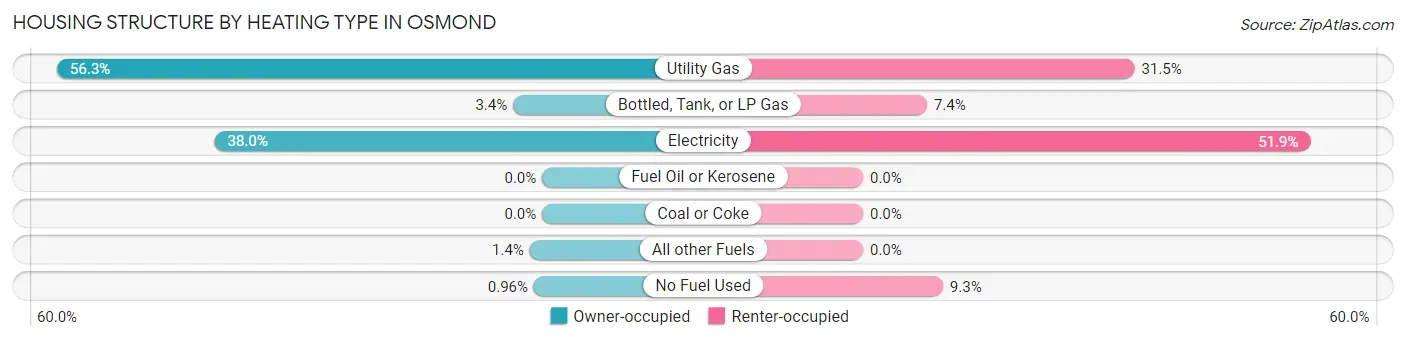
| Heating Type | Owner-occupied | Renter-occupied |
| Utility Gas | 117 (56.2%) | 17 (31.5%) |
| Bottled, Tank, or LP Gas | 7 (3.4%) | 4 (7.4%) |
| Electricity | 79 (38.0%) | 28 (51.8%) |
| Fuel Oil or Kerosene | 0 (0.0%) | 0 (0.0%) |
| Coal or Coke | 0 (0.0%) | 0 (0.0%) |
| All other Fuels | 3 (1.4%) | 0 (0.0%) |
| No Fuel Used | 2 (1.0%) | 5 (9.3%) |
| Total | 208 (100.0%) | 54 (100.0%) |
Household Vehicle Usage in Osmond
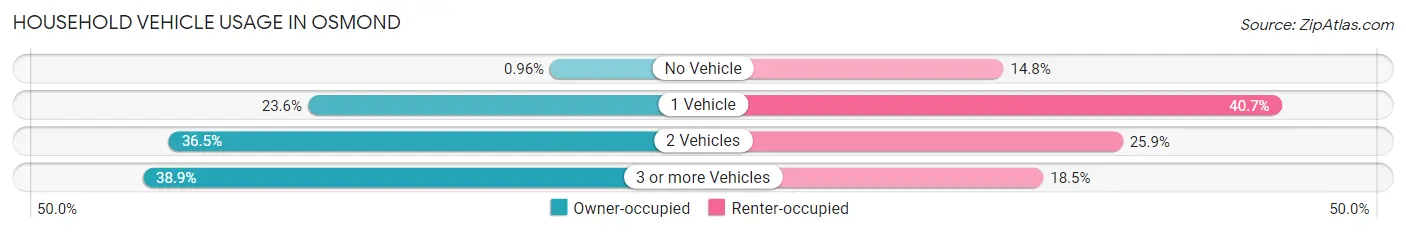
| Vehicles per Household | Owner-occupied | Renter-occupied |
| No Vehicle | 2 (1.0%) | 8 (14.8%) |
| 1 Vehicle | 49 (23.6%) | 22 (40.7%) |
| 2 Vehicles | 76 (36.5%) | 14 (25.9%) |
| 3 or more Vehicles | 81 (38.9%) | 10 (18.5%) |
| Total | 208 (100.0%) | 54 (100.0%) |
Real Estate & Mortgages in Osmond
Real Estate and Mortgage Overview in Osmond
| Characteristic | Without Mortgage | With Mortgage |
| Housing Units | 111 | 97 |
| Median Property Value | $97,500 | $162,500 |
| Median Household Income | $78,125 | $17 |
| Monthly Housing Costs | $480 | $0 |
| Real Estate Taxes | $1,629 | $3 |
Property Value by Mortgage Status in Osmond
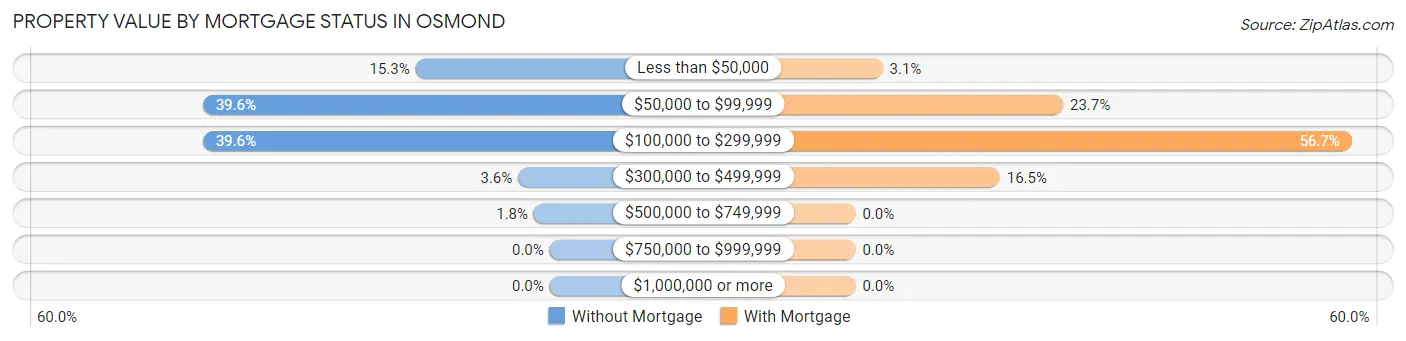
| Property Value | Without Mortgage | With Mortgage |
| Less than $50,000 | 17 (15.3%) | 3 (3.1%) |
| $50,000 to $99,999 | 44 (39.6%) | 23 (23.7%) |
| $100,000 to $299,999 | 44 (39.6%) | 55 (56.7%) |
| $300,000 to $499,999 | 4 (3.6%) | 16 (16.5%) |
| $500,000 to $749,999 | 2 (1.8%) | 0 (0.0%) |
| $750,000 to $999,999 | 0 (0.0%) | 0 (0.0%) |
| $1,000,000 or more | 0 (0.0%) | 0 (0.0%) |
| Total | 111 (100.0%) | 97 (100.0%) |
Household Income by Mortgage Status in Osmond
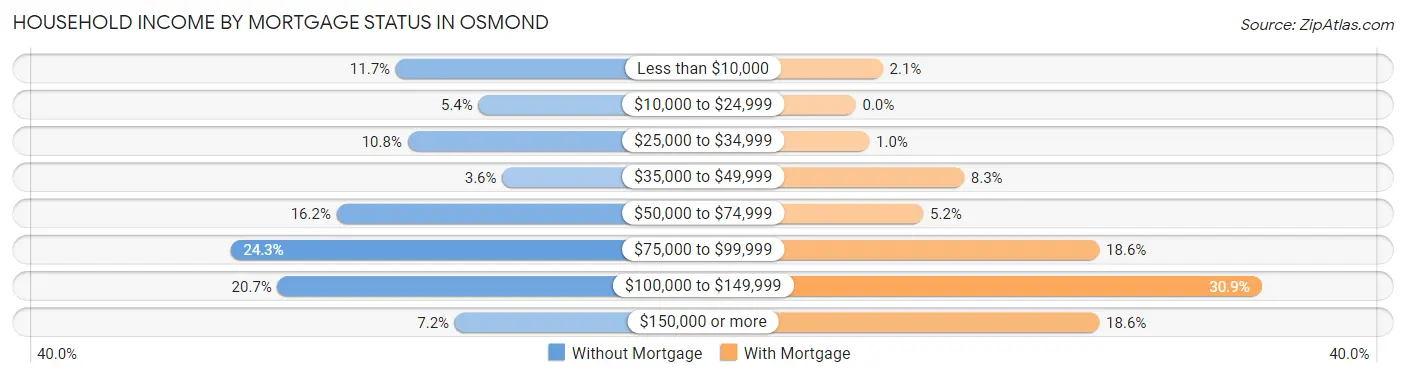
| Household Income | Without Mortgage | With Mortgage |
| Less than $10,000 | 13 (11.7%) | 2 (2.1%) |
| $10,000 to $24,999 | 6 (5.4%) | 0 (0.0%) |
| $25,000 to $34,999 | 12 (10.8%) | 1 (1.0%) |
| $35,000 to $49,999 | 4 (3.6%) | 8 (8.3%) |
| $50,000 to $74,999 | 18 (16.2%) | 5 (5.1%) |
| $75,000 to $99,999 | 27 (24.3%) | 18 (18.6%) |
| $100,000 to $149,999 | 23 (20.7%) | 30 (30.9%) |
| $150,000 or more | 8 (7.2%) | 18 (18.6%) |
| Total | 111 (100.0%) | 97 (100.0%) |
Property Value to Household Income Ratio in Osmond
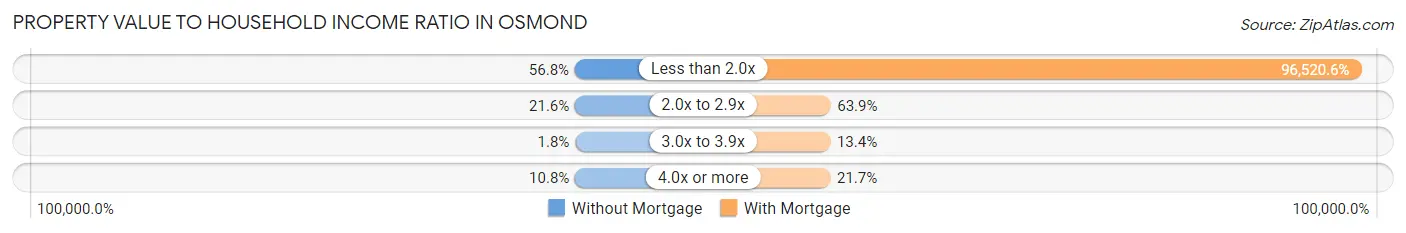
| Value-to-Income Ratio | Without Mortgage | With Mortgage |
| Less than 2.0x | 63 (56.8%) | 93,625 (96,520.6%) |
| 2.0x to 2.9x | 24 (21.6%) | 62 (63.9%) |
| 3.0x to 3.9x | 2 (1.8%) | 13 (13.4%) |
| 4.0x or more | 12 (10.8%) | 21 (21.6%) |
| Total | 111 (100.0%) | 97 (100.0%) |
Real Estate Taxes by Mortgage Status in Osmond
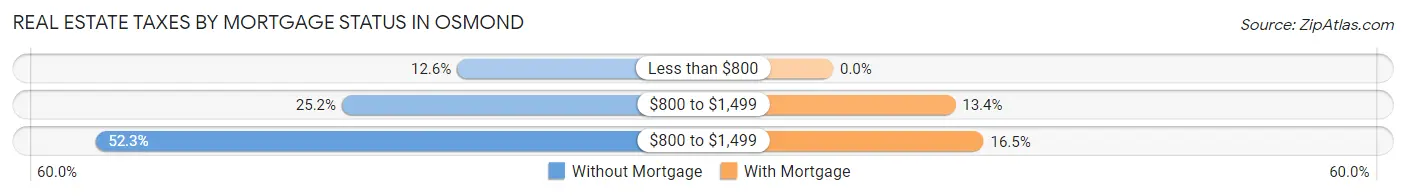
| Property Taxes | Without Mortgage | With Mortgage |
| Less than $800 | 14 (12.6%) | 0 (0.0%) |
| $800 to $1,499 | 28 (25.2%) | 13 (13.4%) |
| $800 to $1,499 | 58 (52.2%) | 16 (16.5%) |
| Total | 111 (100.0%) | 97 (100.0%) |
Health & Disability in Osmond
Health Insurance Coverage by Age in Osmond
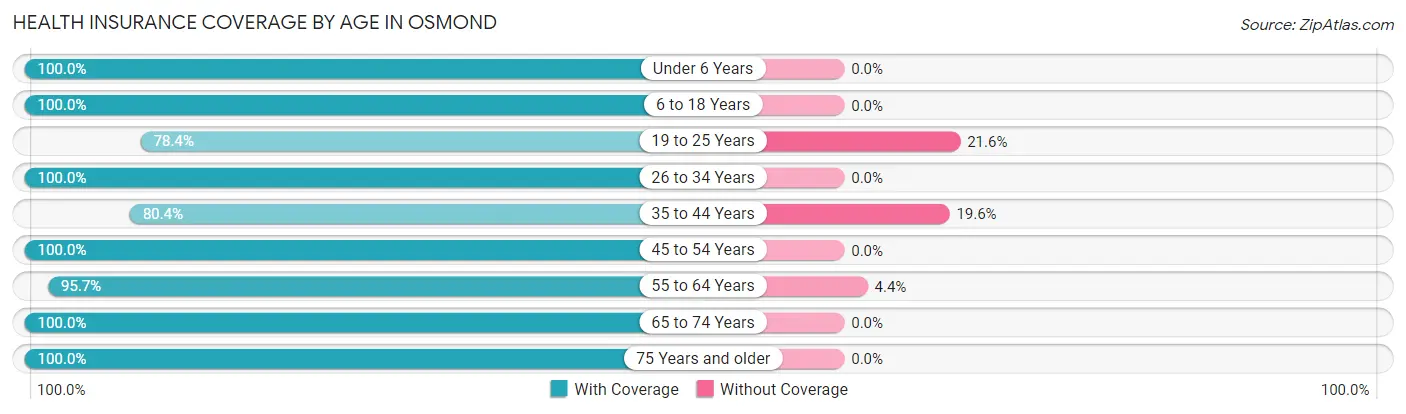
| Age Bracket | With Coverage | Without Coverage |
| Under 6 Years | 73 (100.0%) | 0 (0.0%) |
| 6 to 18 Years | 134 (100.0%) | 0 (0.0%) |
| 19 to 25 Years | 29 (78.4%) | 8 (21.6%) |
| 26 to 34 Years | 60 (100.0%) | 0 (0.0%) |
| 35 to 44 Years | 41 (80.4%) | 10 (19.6%) |
| 45 to 54 Years | 68 (100.0%) | 0 (0.0%) |
| 55 to 64 Years | 88 (95.7%) | 4 (4.3%) |
| 65 to 74 Years | 68 (100.0%) | 0 (0.0%) |
| 75 Years and older | 78 (100.0%) | 0 (0.0%) |
| Total | 639 (96.7%) | 22 (3.3%) |
Health Insurance Coverage by Citizenship Status in Osmond
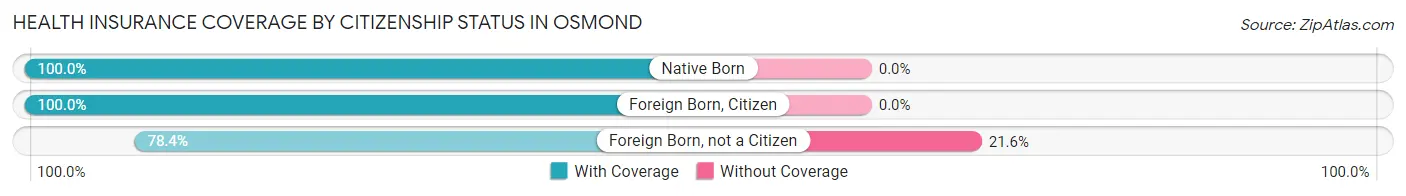
| Citizenship Status | With Coverage | Without Coverage |
| Native Born | 73 (100.0%) | 0 (0.0%) |
| Foreign Born, Citizen | 134 (100.0%) | 0 (0.0%) |
| Foreign Born, not a Citizen | 29 (78.4%) | 8 (21.6%) |
Health Insurance Coverage by Household Income in Osmond
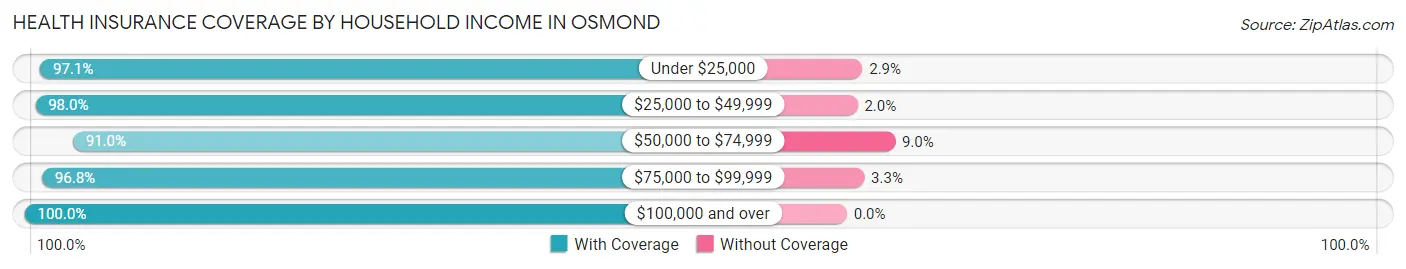
| Household Income | With Coverage | Without Coverage |
| Under $25,000 | 67 (97.1%) | 2 (2.9%) |
| $25,000 to $49,999 | 98 (98.0%) | 2 (2.0%) |
| $50,000 to $74,999 | 131 (91.0%) | 13 (9.0%) |
| $75,000 to $99,999 | 149 (96.8%) | 5 (3.3%) |
| $100,000 and over | 194 (100.0%) | 0 (0.0%) |
Public vs Private Health Insurance Coverage by Age in Osmond
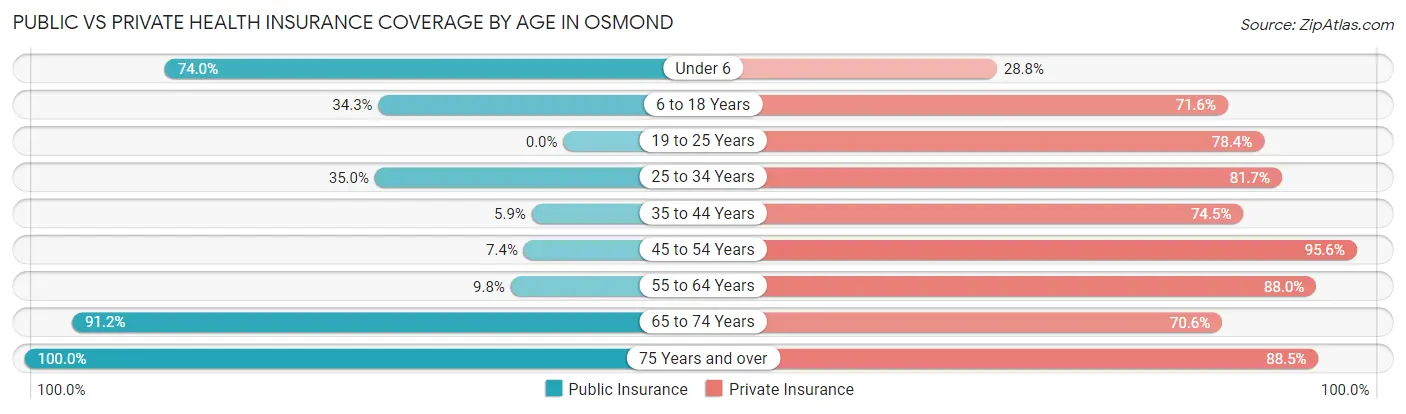
| Age Bracket | Public Insurance | Private Insurance |
| Under 6 | 54 (74.0%) | 21 (28.8%) |
| 6 to 18 Years | 46 (34.3%) | 96 (71.6%) |
| 19 to 25 Years | 0 (0.0%) | 29 (78.4%) |
| 25 to 34 Years | 21 (35.0%) | 49 (81.7%) |
| 35 to 44 Years | 3 (5.9%) | 38 (74.5%) |
| 45 to 54 Years | 5 (7.3%) | 65 (95.6%) |
| 55 to 64 Years | 9 (9.8%) | 81 (88.0%) |
| 65 to 74 Years | 62 (91.2%) | 48 (70.6%) |
| 75 Years and over | 78 (100.0%) | 69 (88.5%) |
| Total | 278 (42.1%) | 496 (75.0%) |
Disability Status by Sex by Age in Osmond
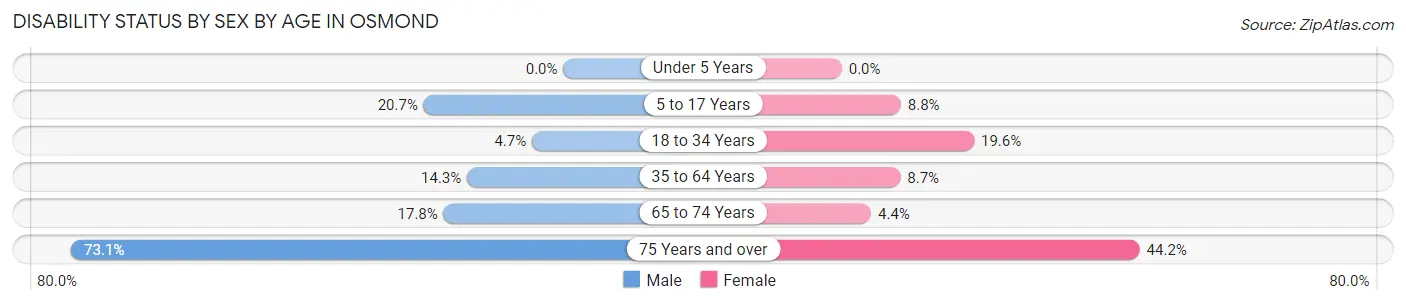
| Age Bracket | Male | Female |
| Under 5 Years | 0 (0.0%) | 0 (0.0%) |
| 5 to 17 Years | 17 (20.7%) | 5 (8.8%) |
| 18 to 34 Years | 2 (4.6%) | 11 (19.6%) |
| 35 to 64 Years | 17 (14.3%) | 8 (8.7%) |
| 65 to 74 Years | 8 (17.8%) | 1 (4.3%) |
| 75 Years and over | 19 (73.1%) | 23 (44.2%) |
Disability Class by Sex by Age in Osmond
Disability Class: Hearing Difficulty
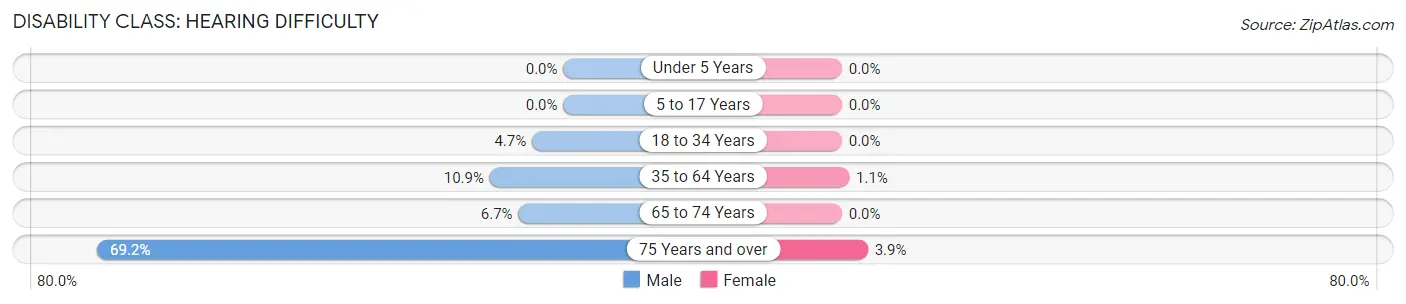
| Age Bracket | Male | Female |
| Under 5 Years | 0 (0.0%) | 0 (0.0%) |
| 5 to 17 Years | 0 (0.0%) | 0 (0.0%) |
| 18 to 34 Years | 2 (4.6%) | 0 (0.0%) |
| 35 to 64 Years | 13 (10.9%) | 1 (1.1%) |
| 65 to 74 Years | 3 (6.7%) | 0 (0.0%) |
| 75 Years and over | 18 (69.2%) | 2 (3.8%) |
Disability Class: Vision Difficulty
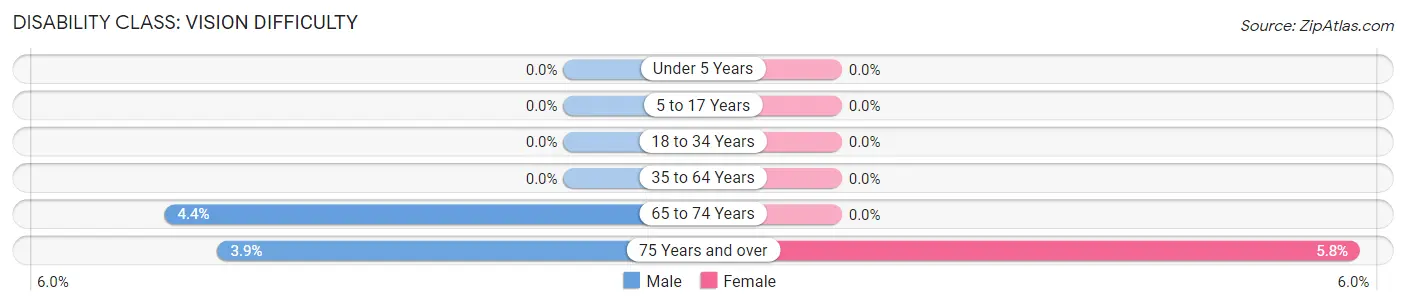
| Age Bracket | Male | Female |
| Under 5 Years | 0 (0.0%) | 0 (0.0%) |
| 5 to 17 Years | 0 (0.0%) | 0 (0.0%) |
| 18 to 34 Years | 0 (0.0%) | 0 (0.0%) |
| 35 to 64 Years | 0 (0.0%) | 0 (0.0%) |
| 65 to 74 Years | 2 (4.4%) | 0 (0.0%) |
| 75 Years and over | 1 (3.8%) | 3 (5.8%) |
Disability Class: Cognitive Difficulty
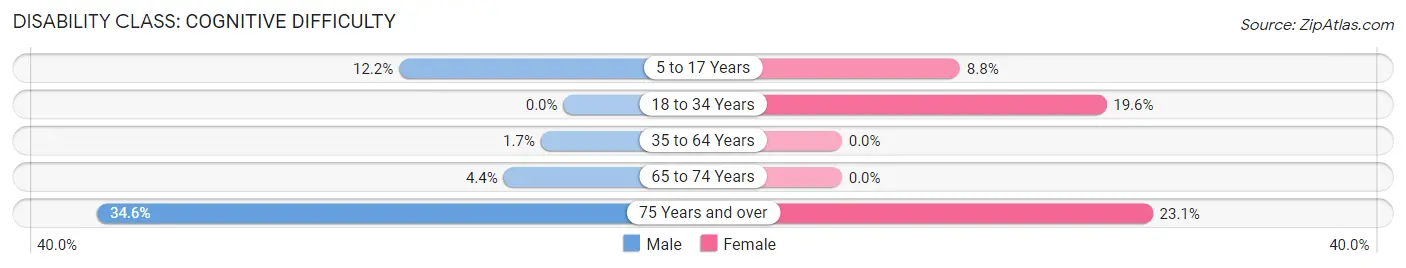
| Age Bracket | Male | Female |
| 5 to 17 Years | 10 (12.2%) | 5 (8.8%) |
| 18 to 34 Years | 0 (0.0%) | 11 (19.6%) |
| 35 to 64 Years | 2 (1.7%) | 0 (0.0%) |
| 65 to 74 Years | 2 (4.4%) | 0 (0.0%) |
| 75 Years and over | 9 (34.6%) | 12 (23.1%) |
Disability Class: Ambulatory Difficulty
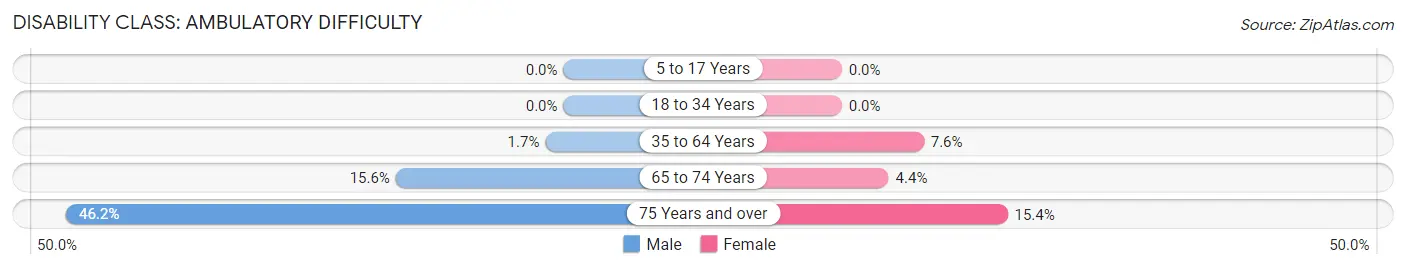
| Age Bracket | Male | Female |
| 5 to 17 Years | 0 (0.0%) | 0 (0.0%) |
| 18 to 34 Years | 0 (0.0%) | 0 (0.0%) |
| 35 to 64 Years | 2 (1.7%) | 7 (7.6%) |
| 65 to 74 Years | 7 (15.6%) | 1 (4.3%) |
| 75 Years and over | 12 (46.2%) | 8 (15.4%) |
Disability Class: Self-Care Difficulty
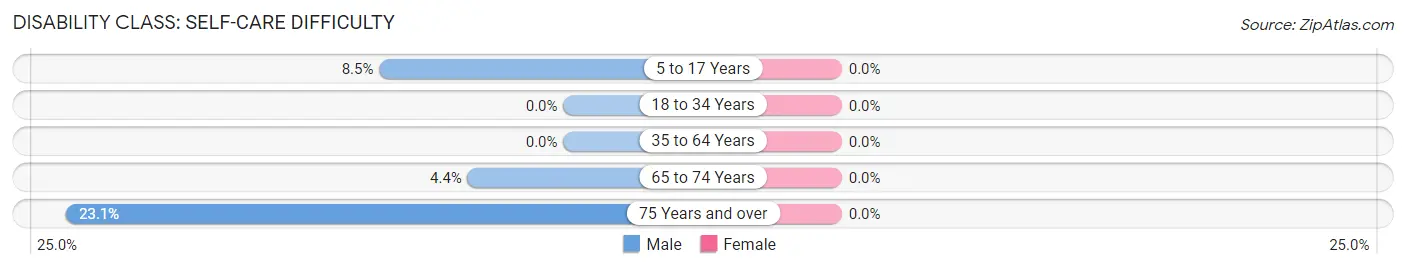
| Age Bracket | Male | Female |
| 5 to 17 Years | 7 (8.5%) | 0 (0.0%) |
| 18 to 34 Years | 0 (0.0%) | 0 (0.0%) |
| 35 to 64 Years | 0 (0.0%) | 0 (0.0%) |
| 65 to 74 Years | 2 (4.4%) | 0 (0.0%) |
| 75 Years and over | 6 (23.1%) | 0 (0.0%) |
Technology Access in Osmond
Computing Device Access in Osmond
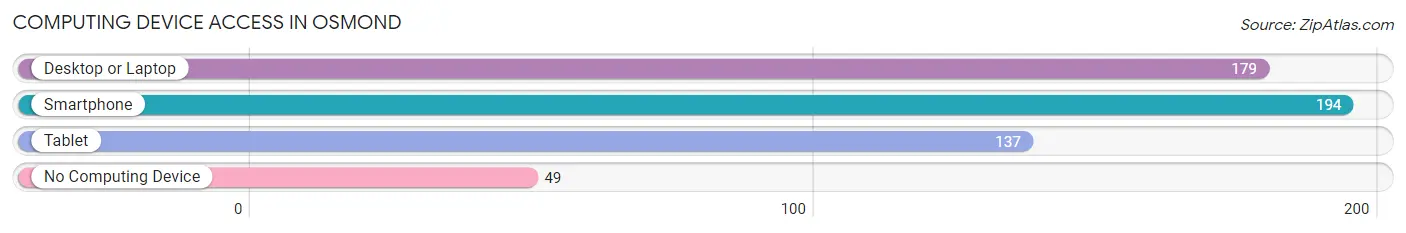
| Device Type | # Households | % Households |
| Desktop or Laptop | 179 | 68.3% |
| Smartphone | 194 | 74.1% |
| Tablet | 137 | 52.3% |
| No Computing Device | 49 | 18.7% |
| Total | 262 | 100.0% |
Internet Access in Osmond
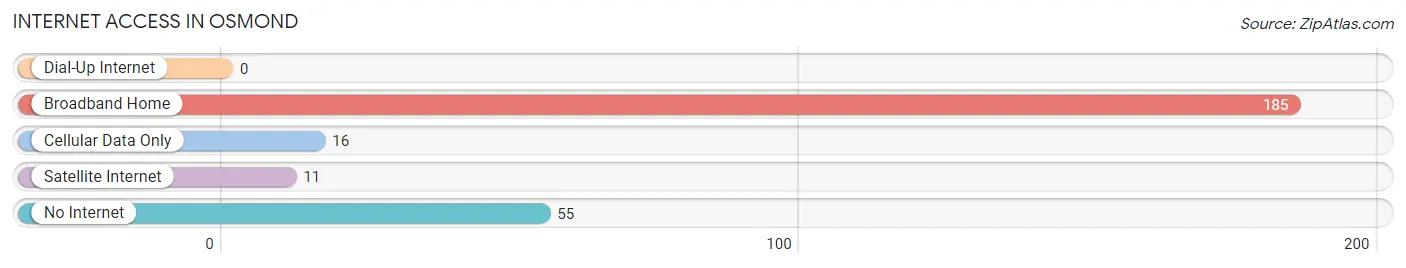
| Internet Type | # Households | % Households |
| Dial-Up Internet | 0 | 0.0% |
| Broadband Home | 185 | 70.6% |
| Cellular Data Only | 16 | 6.1% |
| Satellite Internet | 11 | 4.2% |
| No Internet | 55 | 21.0% |
| Total | 262 | 100.0% |
Osmond Summary
Osmond is a city located in Pierce County, Nebraska, United States. The population was 1,717 at the 2010 census. It is the county seat of Pierce County.
History
Osmond was founded in 1871 by a group of German immigrants led by John Osmond. The city was named after John Osmond, who was the first settler in the area. The city was incorporated in 1887.
In the early days, Osmond was a farming community, with many of the settlers growing wheat, corn, and other crops. The city also had a number of businesses, including a bank, a hotel, a blacksmith shop, and a general store.
In the late 19th century, Osmond began to grow and develop. The city was connected to the railroad in 1887, which allowed for the transportation of goods and people. This helped to spur the growth of the city.
In the early 20th century, Osmond continued to grow and develop. The city was home to a number of businesses, including a flour mill, a creamery, a lumber yard, and a furniture store. The city also had a number of churches, including the First Presbyterian Church, the First Methodist Church, and the First Lutheran Church.
In the mid-20th century, Osmond began to decline. The railroad was abandoned in the 1950s, and many of the businesses in the city closed. The population of the city also began to decline.
Geography
Osmond is located at 42°17'25" North, 97°45'17" West (42.290278, -97.754722). The city is situated in the rolling hills of the Loess Hills region of Nebraska.
The city has a total area of 1 2 square miles all of which is land
Economy
The economy of Osmond is largely based on agriculture. The city is home to a number of farms, which produce a variety of crops, including corn, soybeans, wheat, and hay.
The city also has a number of businesses, including a grocery store, a hardware store, a bank, and a number of restaurants.
Demographics
As of the 2010 census, there were 1,717 people, 690 households, and 463 families residing in the city. The population density was 1,427.5 people per square mile. The racial makeup of the city was 97.2% White, 0.2% African American, 0.2% Native American, 0.2% Asian, 0.2% from other races, and 1.9% from two or more races. Hispanic or Latino of any race were 1.2% of the population.
The median age in the city was 43.2 years. The gender makeup of the city was 49.2% male and 50.8% female.
The median income for a household in the city was $41,250, and the median income for a family was $50,000. The per capita income for the city was $20,845. About 8.2% of families and 10.2% of the population were below the poverty line, including 14.2% of those under age 18 and 8.2% of those age 65 or over.
Common Questions
What is Per Capita Income in Osmond?
Per Capita income in Osmond is $33,132.
What is the Median Family Income in Osmond?
Median Family Income in Osmond is $79,792.
What is the Median Household income in Osmond?
Median Household Income in Osmond is $68,611.
What is Income or Wage Gap in Osmond?
Income or Wage Gap in Osmond is 32.4%.
Women in Osmond earn 67.6 cents for every dollar earned by a man.
What is Inequality or Gini Index in Osmond?
Inequality or Gini Index in Osmond is 0.37.
What is the Total Population of Osmond?
Total Population of Osmond is 678.
What is the Total Male Population of Osmond?
Total Male Population of Osmond is 353.
What is the Total Female Population of Osmond?
Total Female Population of Osmond is 325.
What is the Ratio of Males per 100 Females in Osmond?
There are 108.62 Males per 100 Females in Osmond.
What is the Ratio of Females per 100 Males in Osmond?
There are 92.07 Females per 100 Males in Osmond.
What is the Median Population Age in Osmond?
Median Population Age in Osmond is 41.7 Years.
What is the Average Family Size in Osmond
Average Family Size in Osmond is 3.2 People.
What is the Average Household Size in Osmond
Average Household Size in Osmond is 2.5 People.
How Large is the Labor Force in Osmond?
There are 325 People in the Labor Forcein in Osmond.
What is the Percentage of People in the Labor Force in Osmond?
67.0% of People are in the Labor Force in Osmond.