Ogallala, NE Map & Demographics
Ogallala Map
Ogallala Overview
$30,778
PER CAPITA INCOME
$75,361
AVG FAMILY INCOME
$57,045
AVG HOUSEHOLD INCOME
41.1%
WAGE / INCOME GAP [ % ]
58.9¢/ $1
WAGE / INCOME GAP [ $ ]
0.42
INEQUALITY / GINI INDEX
4,835
TOTAL POPULATION
2,377
MALE POPULATION
2,458
FEMALE POPULATION
96.70
MALES / 100 FEMALES
103.41
FEMALES / 100 MALES
46.6
MEDIAN AGE
2.9
AVG FAMILY SIZE
2.1
AVG HOUSEHOLD SIZE
2,383
LABOR FORCE [ PEOPLE ]
60.8%
PERCENT IN LABOR FORCE
3.5%
UNEMPLOYMENT RATE
Ogallala Zip Codes
Ogallala Area Codes
Income in Ogallala
Income Overview in Ogallala
Per Capita Income in Ogallala is $30,778, while median incomes of families and households are $75,361 and $57,045 respectively.
| Characteristic | Number | Measure |
| Per Capita Income | 4,835 | $30,778 |
| Median Family Income | 1,115 | $75,361 |
| Mean Family Income | 1,115 | $88,501 |
| Median Household Income | 2,268 | $57,045 |
| Mean Household Income | 2,268 | $65,495 |
| Income Deficit | 1,115 | $0 |
| Wage / Income Gap (%) | 4,835 | 41.08% |
| Wage / Income Gap ($) | 4,835 | 58.92¢ per $1 |
| Gini / Inequality Index | 4,835 | 0.42 |
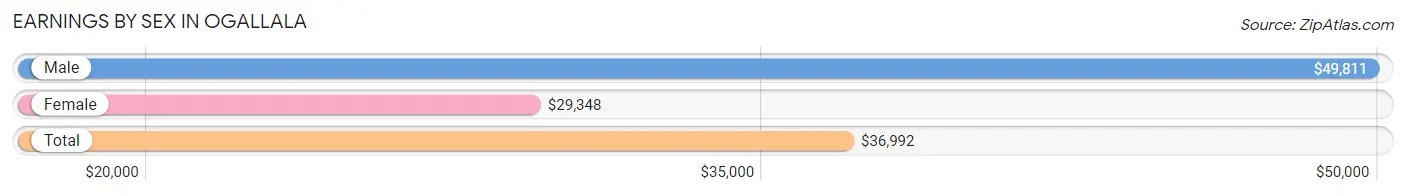
Earnings by Sex in Ogallala
Average Earnings in Ogallala are $36,992, $49,811 for men and $29,348 for women, a difference of 41.1%.
| Sex | Number | Average Earnings |
| Male | 1,337 (53.2%) | $49,811 |
| Female | 1,174 (46.8%) | $29,348 |
| Total | 2,511 (100.0%) | $36,992 |
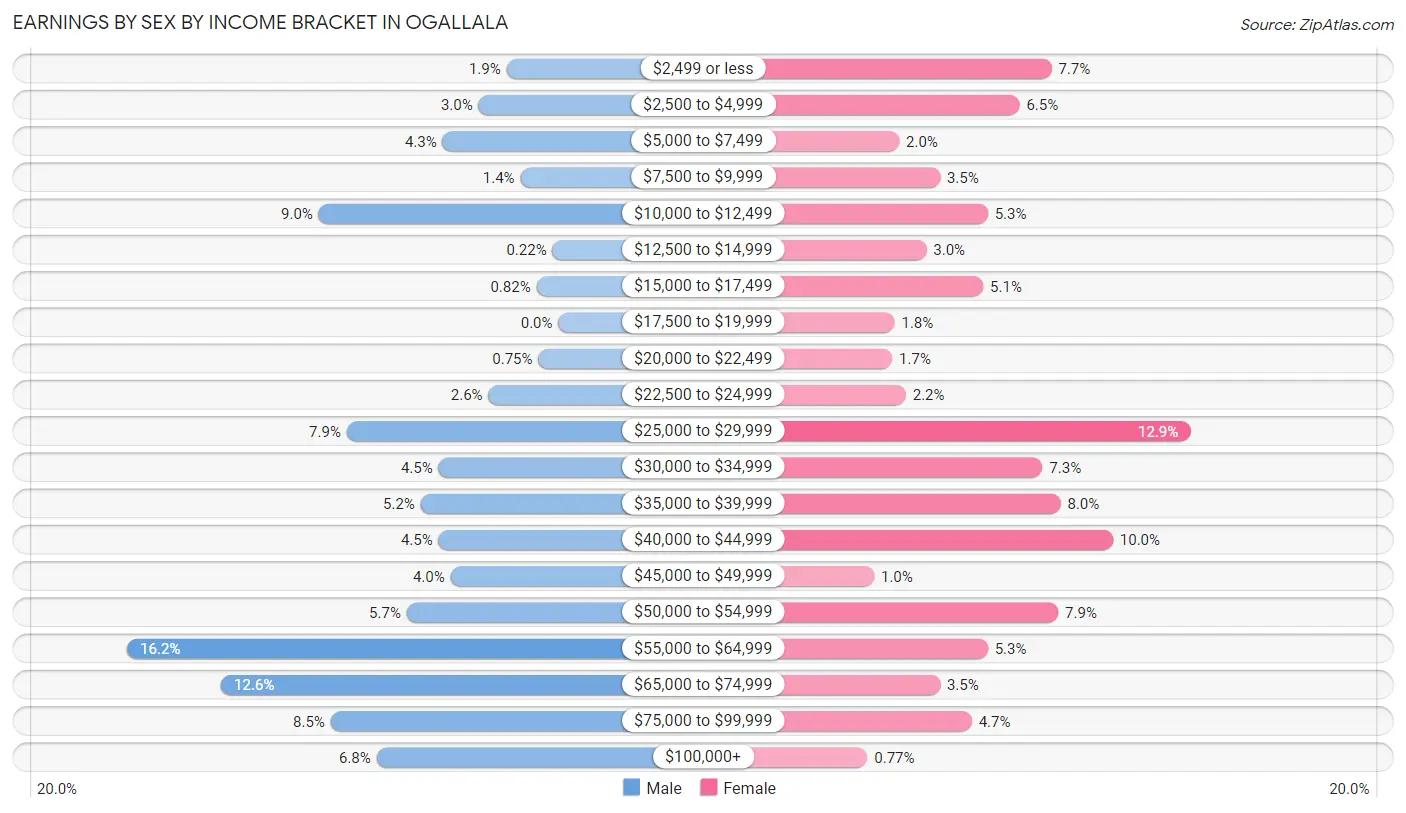
Earnings by Sex by Income Bracket in Ogallala
The most common earnings brackets in Ogallala are $55,000 to $64,999 for men (216 | 16.2%) and $25,000 to $29,999 for women (151 | 12.9%).
| Income | Male | Female |
| $2,499 or less | 26 (1.9%) | 90 (7.7%) |
| $2,500 to $4,999 | 40 (3.0%) | 76 (6.5%) |
| $5,000 to $7,499 | 58 (4.3%) | 23 (2.0%) |
| $7,500 to $9,999 | 19 (1.4%) | 41 (3.5%) |
| $10,000 to $12,499 | 120 (9.0%) | 62 (5.3%) |
| $12,500 to $14,999 | 3 (0.2%) | 35 (3.0%) |
| $15,000 to $17,499 | 11 (0.8%) | 60 (5.1%) |
| $17,500 to $19,999 | 0 (0.0%) | 21 (1.8%) |
| $20,000 to $22,499 | 10 (0.7%) | 20 (1.7%) |
| $22,500 to $24,999 | 35 (2.6%) | 26 (2.2%) |
| $25,000 to $29,999 | 106 (7.9%) | 151 (12.9%) |
| $30,000 to $34,999 | 60 (4.5%) | 86 (7.3%) |
| $35,000 to $39,999 | 69 (5.2%) | 94 (8.0%) |
| $40,000 to $44,999 | 60 (4.5%) | 117 (10.0%) |
| $45,000 to $49,999 | 54 (4.0%) | 12 (1.0%) |
| $50,000 to $54,999 | 76 (5.7%) | 93 (7.9%) |
| $55,000 to $64,999 | 216 (16.2%) | 62 (5.3%) |
| $65,000 to $74,999 | 169 (12.6%) | 41 (3.5%) |
| $75,000 to $99,999 | 114 (8.5%) | 55 (4.7%) |
| $100,000+ | 91 (6.8%) | 9 (0.8%) |
| Total | 1,337 (100.0%) | 1,174 (100.0%) |
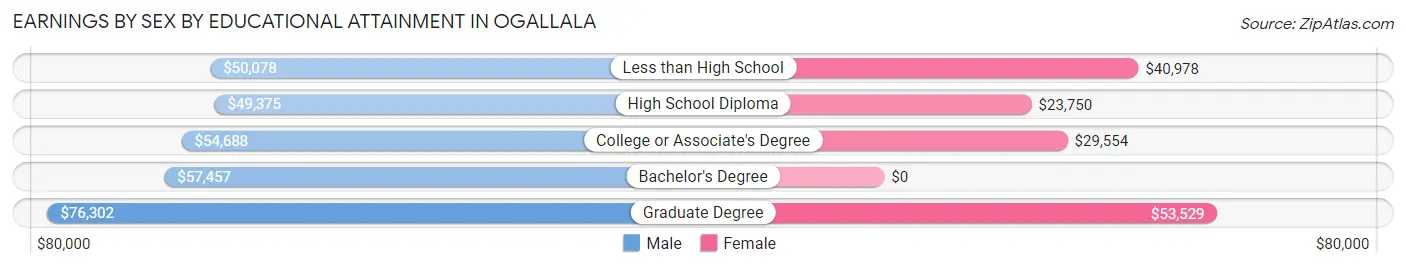
Earnings by Sex by Educational Attainment in Ogallala
Average earnings in Ogallala are $54,038 for men and $30,333 for women, a difference of 43.9%. Men with an educational attainment of graduate degree enjoy the highest average annual earnings of $76,302, while those with high school diploma education earn the least with $49,375. Women with an educational attainment of graduate degree earn the most with the average annual earnings of $53,529, while those with high school diploma education have the smallest earnings of $23,750.
| Educational Attainment | Male Income | Female Income |
| Less than High School | $50,078 | $40,978 |
| High School Diploma | $49,375 | $23,750 |
| College or Associate's Degree | $54,688 | $29,554 |
| Bachelor's Degree | $57,457 | $0 |
| Graduate Degree | $76,302 | $53,529 |
| Total | $54,038 | $30,333 |
Family Income in Ogallala
Family Income Brackets in Ogallala
According to the Ogallala family income data, there are 285 families falling into the $50,000 to $74,999 income range, which is the most common income bracket and makes up 25.6% of all families. Conversely, the $15,000 to $24,999 income bracket is the least frequent group with only 4 families (0.4%) belonging to this category.
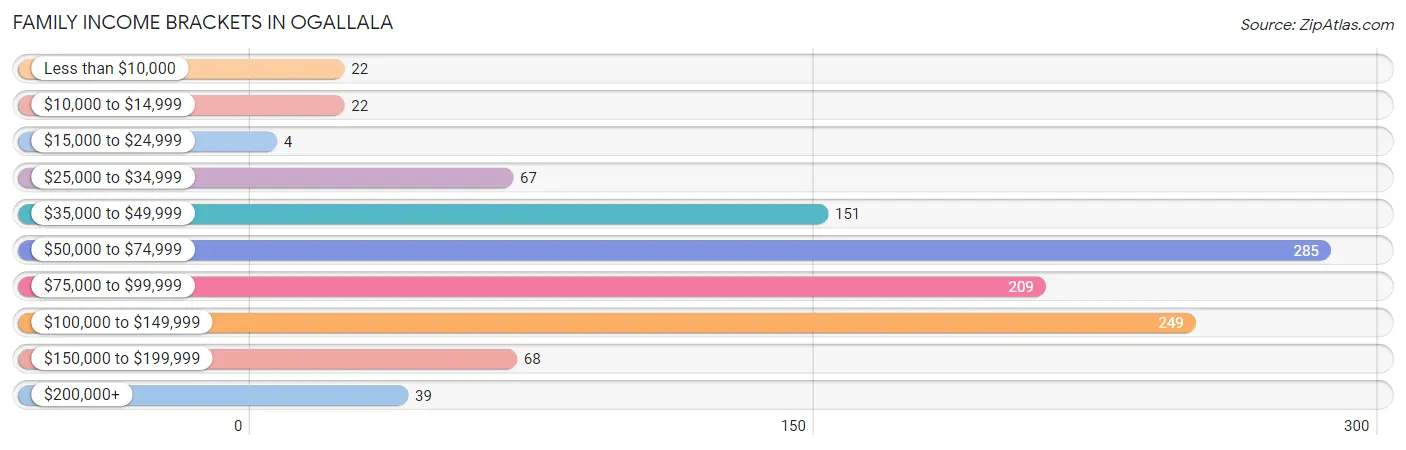
| Income Bracket | # Families | % Families |
| Less than $10,000 | 22 | 2.0% |
| $10,000 to $14,999 | 22 | 2.0% |
| $15,000 to $24,999 | 4 | 0.4% |
| $25,000 to $34,999 | 67 | 6.0% |
| $35,000 to $49,999 | 151 | 13.5% |
| $50,000 to $74,999 | 285 | 25.6% |
| $75,000 to $99,999 | 209 | 18.7% |
| $100,000 to $149,999 | 249 | 22.3% |
| $150,000 to $199,999 | 68 | 6.1% |
| $200,000+ | 39 | 3.5% |
Family Income by Famaliy Size in Ogallala
5-person families (136 | 12.2%) account for the highest median family income in Ogallala with $140,213 per family, while 2-person families (670 | 60.1%) have the highest median income of $35,390 per family member.
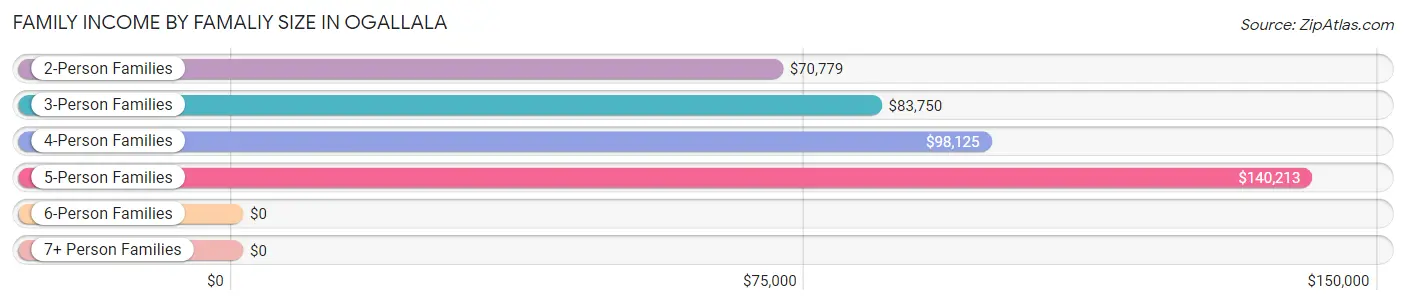
| Income Bracket | # Families | Median Income |
| 2-Person Families | 670 (60.1%) | $70,779 |
| 3-Person Families | 181 (16.2%) | $83,750 |
| 4-Person Families | 103 (9.2%) | $98,125 |
| 5-Person Families | 136 (12.2%) | $140,213 |
| 6-Person Families | 18 (1.6%) | $0 |
| 7+ Person Families | 7 (0.6%) | $0 |
| Total | 1,115 (100.0%) | $75,361 |
Family Income by Number of Earners in Ogallala
The median family income in Ogallala is $75,361, with families comprising 3+ earners (93) having the highest median family income of $138,036, while families with 1 earner (481) have the lowest median family income of $62,784, accounting for 8.3% and 43.1% of families, respectively.
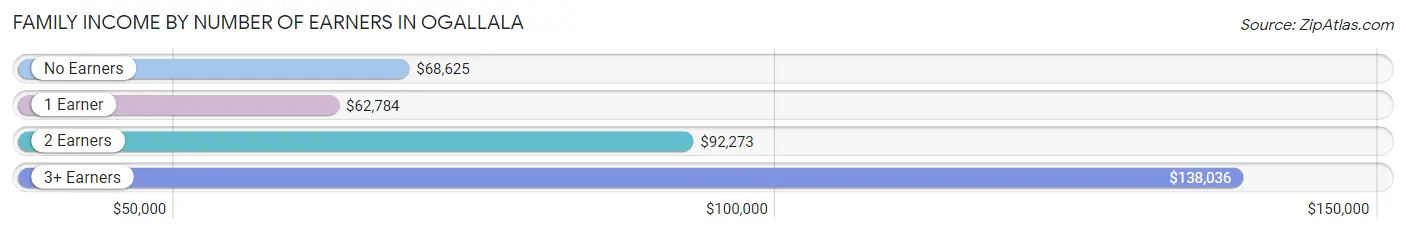
| Number of Earners | # Families | Median Income |
| No Earners | 123 (11.0%) | $68,625 |
| 1 Earner | 481 (43.1%) | $62,784 |
| 2 Earners | 418 (37.5%) | $92,273 |
| 3+ Earners | 93 (8.3%) | $138,036 |
| Total | 1,115 (100.0%) | $75,361 |
Household Income in Ogallala
Household Income Brackets in Ogallala
With 524 households falling in the category, the $50,000 to $74,999 income range is the most frequent in Ogallala, accounting for 23.1% of all households. In contrast, only 45 households (2.0%) fall into the $200,000+ income bracket, making it the least populous group.
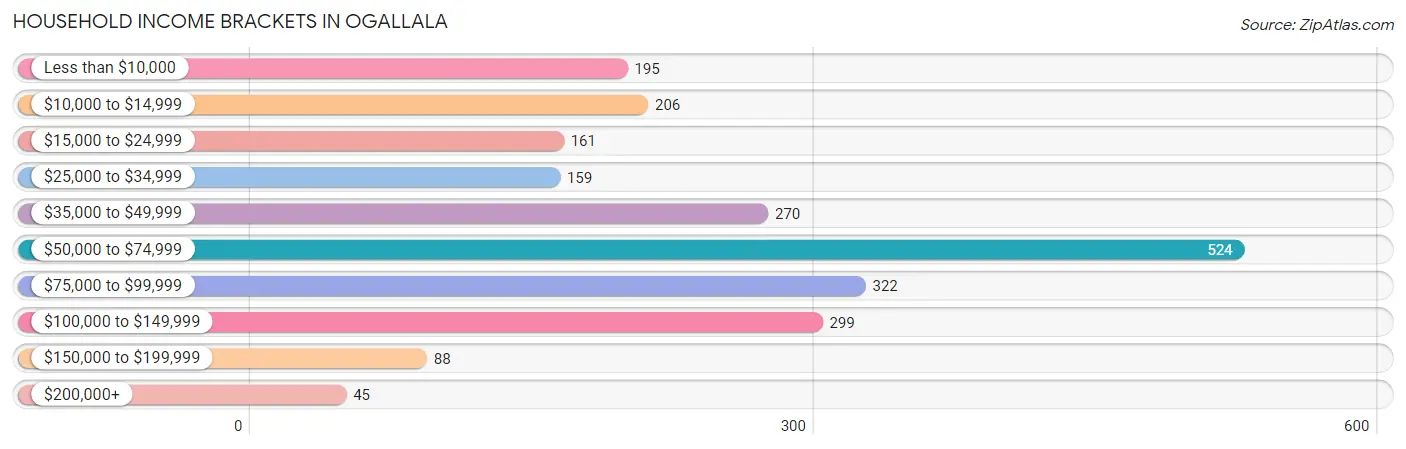
| Income Bracket | # Households | % Households |
| Less than $10,000 | 195 | 8.6% |
| $10,000 to $14,999 | 206 | 9.1% |
| $15,000 to $24,999 | 161 | 7.1% |
| $25,000 to $34,999 | 159 | 7.0% |
| $35,000 to $49,999 | 270 | 11.9% |
| $50,000 to $74,999 | 524 | 23.1% |
| $75,000 to $99,999 | 322 | 14.2% |
| $100,000 to $149,999 | 299 | 13.2% |
| $150,000 to $199,999 | 88 | 3.9% |
| $200,000+ | 45 | 2.0% |
Household Income by Householder Age in Ogallala
The median household income in Ogallala is $57,045, with the highest median household income of $70,278 found in the 25 to 44 years age bracket for the primary householder. A total of 588 households (25.9%) fall into this category. Meanwhile, the 65+ years age bracket for the primary householder has the lowest median household income of $36,389, with 832 households (36.7%) in this group.
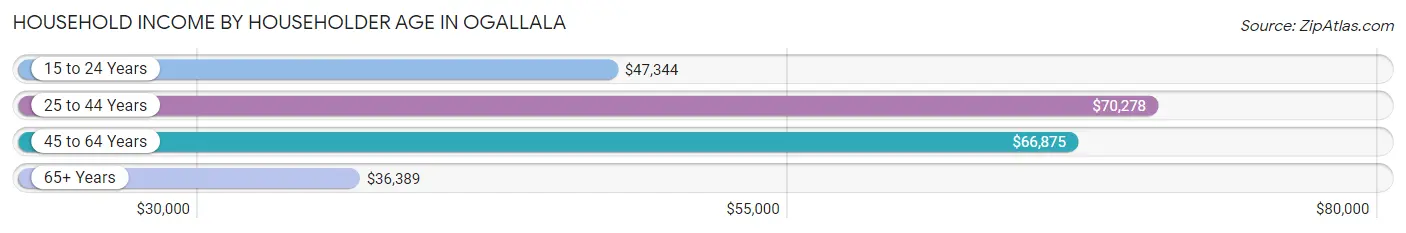
| Income Bracket | # Households | Median Income |
| 15 to 24 Years | 88 (3.9%) | $47,344 |
| 25 to 44 Years | 588 (25.9%) | $70,278 |
| 45 to 64 Years | 760 (33.5%) | $66,875 |
| 65+ Years | 832 (36.7%) | $36,389 |
| Total | 2,268 (100.0%) | $57,045 |
Poverty in Ogallala
Income Below Poverty by Sex and Age in Ogallala
With 13.7% poverty level for males and 16.9% for females among the residents of Ogallala, 16 and 17 year old males and 12 to 14 year old females are the most vulnerable to poverty, with 34 males (40.0%) and 22 females (47.8%) in their respective age groups living below the poverty level.
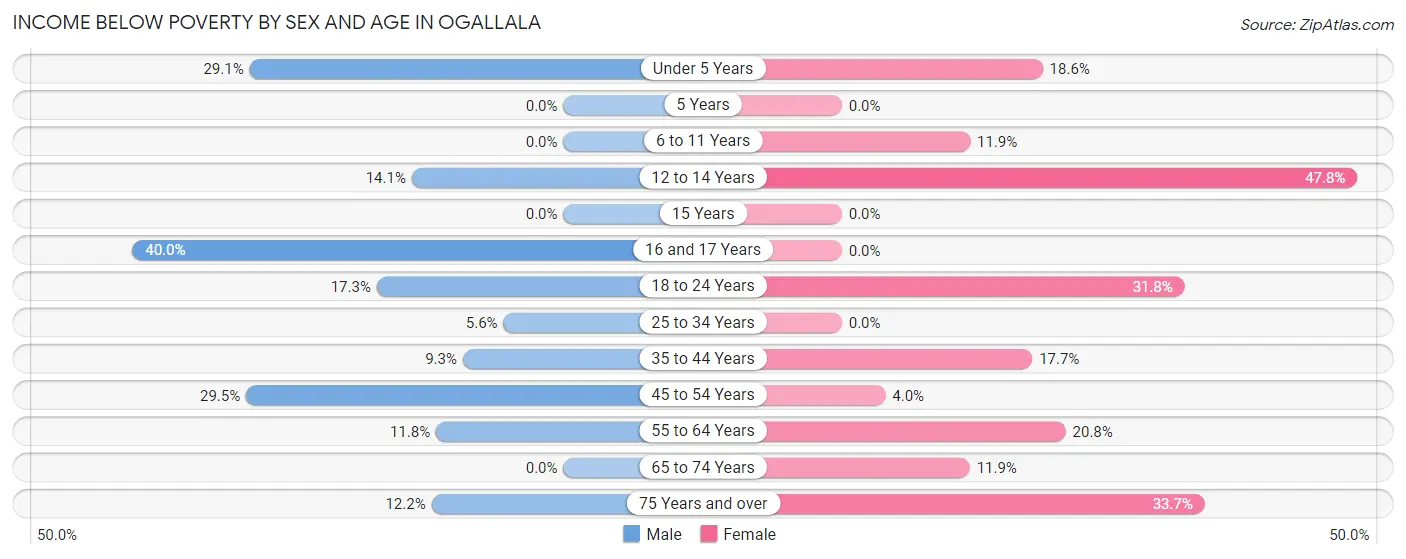
| Age Bracket | Male | Female |
| Under 5 Years | 37 (29.1%) | 22 (18.6%) |
| 5 Years | 0 (0.0%) | 0 (0.0%) |
| 6 to 11 Years | 0 (0.0%) | 30 (11.9%) |
| 12 to 14 Years | 19 (14.1%) | 22 (47.8%) |
| 15 Years | 0 (0.0%) | 0 (0.0%) |
| 16 and 17 Years | 34 (40.0%) | 0 (0.0%) |
| 18 to 24 Years | 22 (17.3%) | 42 (31.8%) |
| 25 to 34 Years | 13 (5.6%) | 0 (0.0%) |
| 35 to 44 Years | 25 (9.3%) | 44 (17.7%) |
| 45 to 54 Years | 101 (29.4%) | 8 (4.0%) |
| 55 to 64 Years | 41 (11.8%) | 76 (20.8%) |
| 65 to 74 Years | 0 (0.0%) | 33 (11.9%) |
| 75 Years and over | 30 (12.2%) | 129 (33.7%) |
| Total | 322 (13.7%) | 406 (16.9%) |
Income Above Poverty by Sex and Age in Ogallala
According to the poverty statistics in Ogallala, males aged 5 years and females aged 15 years are the age groups that are most secure financially, with 100.0% of males and 100.0% of females in these age groups living above the poverty line.
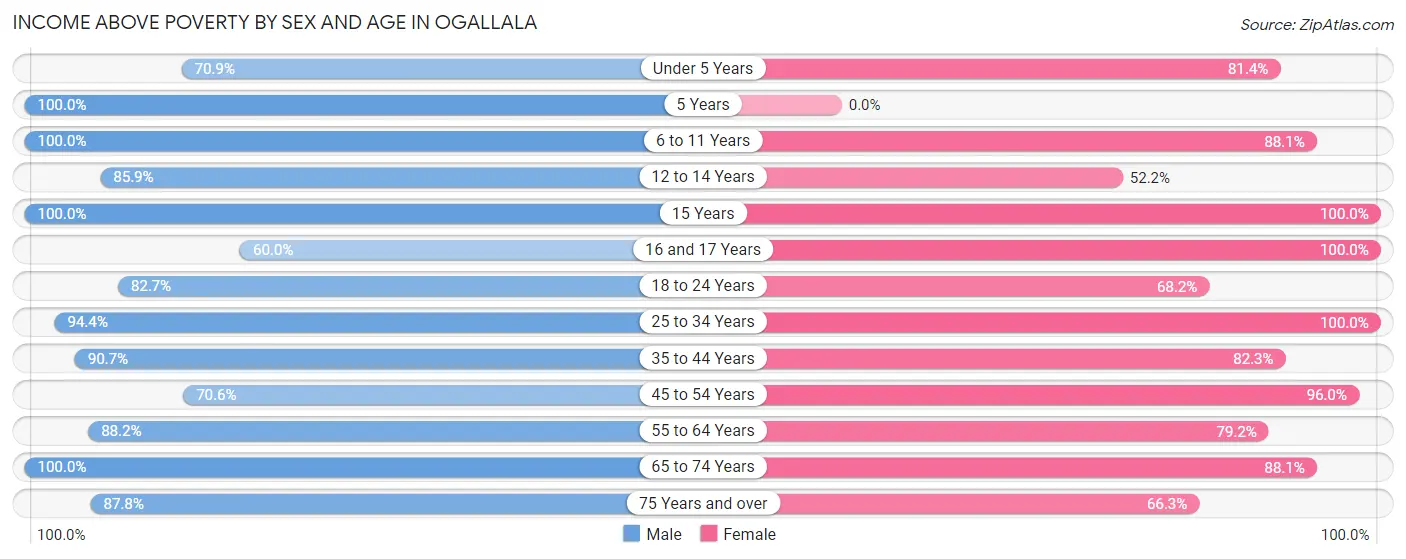
| Age Bracket | Male | Female |
| Under 5 Years | 90 (70.9%) | 96 (81.4%) |
| 5 Years | 45 (100.0%) | 0 (0.0%) |
| 6 to 11 Years | 121 (100.0%) | 222 (88.1%) |
| 12 to 14 Years | 116 (85.9%) | 24 (52.2%) |
| 15 Years | 12 (100.0%) | 45 (100.0%) |
| 16 and 17 Years | 51 (60.0%) | 50 (100.0%) |
| 18 to 24 Years | 105 (82.7%) | 90 (68.2%) |
| 25 to 34 Years | 221 (94.4%) | 290 (100.0%) |
| 35 to 44 Years | 243 (90.7%) | 205 (82.3%) |
| 45 to 54 Years | 242 (70.6%) | 190 (96.0%) |
| 55 to 64 Years | 306 (88.2%) | 290 (79.2%) |
| 65 to 74 Years | 255 (100.0%) | 245 (88.1%) |
| 75 Years and over | 215 (87.8%) | 254 (66.3%) |
| Total | 2,022 (86.3%) | 2,001 (83.1%) |
Income Below Poverty Among Married-Couple Families in Ogallala
The poverty statistics for married-couple families in Ogallala show that 2.4% or 22 of the total 901 families live below the poverty line. Families with 3 or 4 children have the highest poverty rate of 14.2%, comprising of 18 families. On the other hand, families with 1 or 2 children have the lowest poverty rate of 0.0%, which includes 0 families.
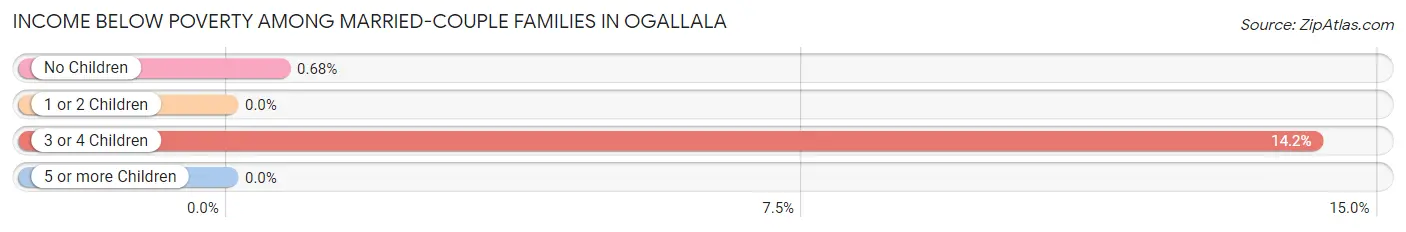
| Children | Above Poverty | Below Poverty |
| No Children | 583 (99.3%) | 4 (0.7%) |
| 1 or 2 Children | 181 (100.0%) | 0 (0.0%) |
| 3 or 4 Children | 109 (85.8%) | 18 (14.2%) |
| 5 or more Children | 6 (100.0%) | 0 (0.0%) |
| Total | 879 (97.6%) | 22 (2.4%) |
Income Below Poverty Among Single-Parent Households in Ogallala
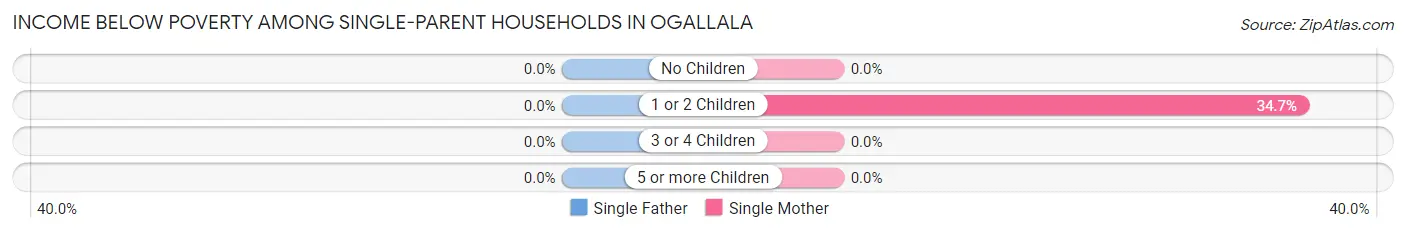
| Children | Single Father | Single Mother |
| No Children | 0 (0.0%) | 0 (0.0%) |
| 1 or 2 Children | 0 (0.0%) | 44 (34.6%) |
| 3 or 4 Children | 0 (0.0%) | 0 (0.0%) |
| 5 or more Children | 0 (0.0%) | 0 (0.0%) |
| Total | 0 (0.0%) | 44 (26.5%) |
Income Below Poverty Among Married-Couple vs Single-Parent Households in Ogallala
The poverty data for Ogallala shows that 22 of the married-couple family households (2.4%) and 44 of the single-parent households (20.6%) are living below the poverty level. Within the married-couple family households, those with 3 or 4 children have the highest poverty rate, with 18 households (14.2%) falling below the poverty line. Among the single-parent households, those with 1 or 2 children have the highest poverty rate, with 44 household (26.5%) living below poverty.
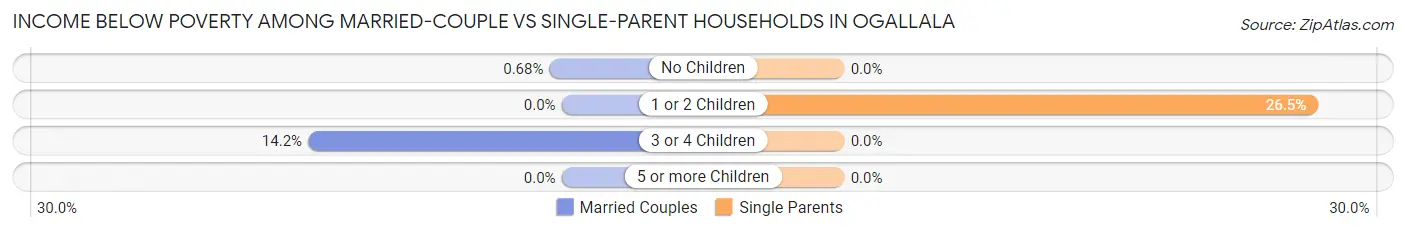
| Children | Married-Couple Families | Single-Parent Households |
| No Children | 4 (0.7%) | 0 (0.0%) |
| 1 or 2 Children | 0 (0.0%) | 44 (26.5%) |
| 3 or 4 Children | 18 (14.2%) | 0 (0.0%) |
| 5 or more Children | 0 (0.0%) | 0 (0.0%) |
| Total | 22 (2.4%) | 44 (20.6%) |
Race in Ogallala
The most populous races in Ogallala are White / Caucasian (4,207 | 87.0%), Hispanic or Latino (509 | 10.5%), and Two or more Races (263 | 5.4%).
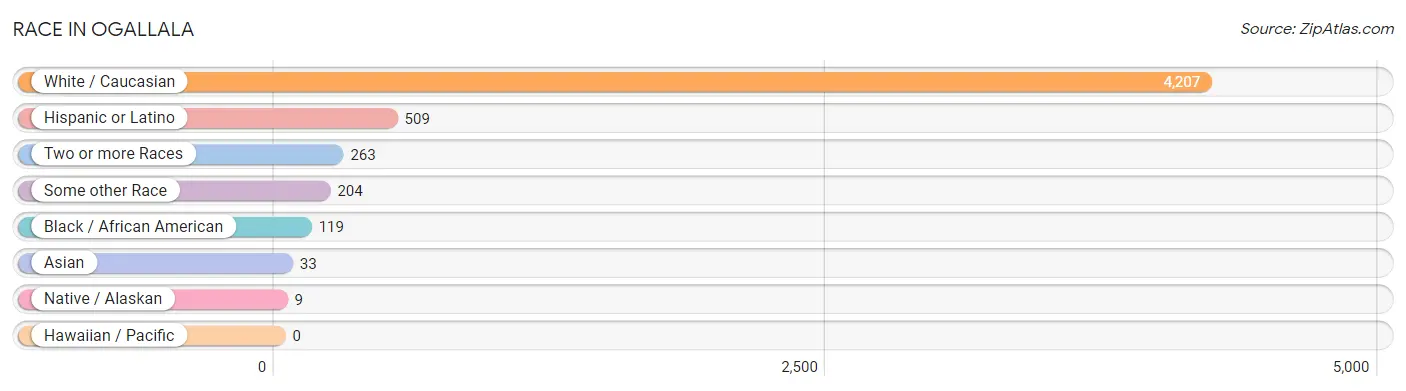
| Race | # Population | % Population |
| Asian | 33 | 0.7% |
| Black / African American | 119 | 2.5% |
| Hawaiian / Pacific | 0 | 0.0% |
| Hispanic or Latino | 509 | 10.5% |
| Native / Alaskan | 9 | 0.2% |
| White / Caucasian | 4,207 | 87.0% |
| Two or more Races | 263 | 5.4% |
| Some other Race | 204 | 4.2% |
| Total | 4,835 | 100.0% |
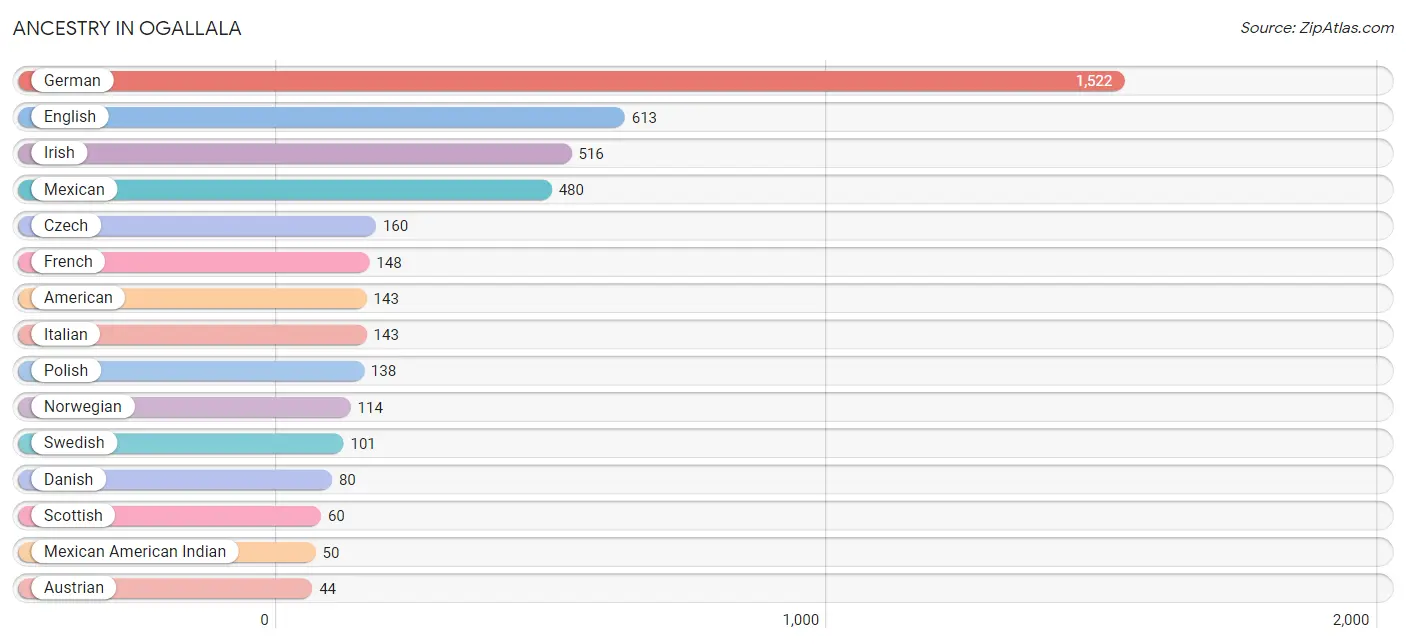
Ancestry in Ogallala
The most populous ancestries reported in Ogallala are German (1,522 | 31.5%), English (613 | 12.7%), Irish (516 | 10.7%), Mexican (480 | 9.9%), and Czech (160 | 3.3%), together accounting for 68.1% of all Ogallala residents.
| Ancestry | # Population | % Population |
| American | 143 | 3.0% |
| Austrian | 44 | 0.9% |
| Belgian | 39 | 0.8% |
| Bhutanese | 11 | 0.2% |
| British | 9 | 0.2% |
| Burmese | 14 | 0.3% |
| Canadian | 7 | 0.1% |
| Central American | 6 | 0.1% |
| Chippewa | 7 | 0.1% |
| Czech | 160 | 3.3% |
| Czechoslovakian | 13 | 0.3% |
| Danish | 80 | 1.7% |
| Delaware | 12 | 0.3% |
| Dutch | 39 | 0.8% |
| English | 613 | 12.7% |
| European | 17 | 0.4% |
| French | 148 | 3.1% |
| French Canadian | 3 | 0.1% |
| German | 1,522 | 31.5% |
| Greek | 11 | 0.2% |
| Guatemalan | 6 | 0.1% |
| Indian (Asian) | 3 | 0.1% |
| Irish | 516 | 10.7% |
| Italian | 143 | 3.0% |
| Korean | 17 | 0.4% |
| Mexican | 480 | 9.9% |
| Mexican American Indian | 50 | 1.0% |
| Norwegian | 114 | 2.4% |
| Polish | 138 | 2.9% |
| Portuguese | 5 | 0.1% |
| Russian | 37 | 0.8% |
| Scandinavian | 20 | 0.4% |
| Scotch-Irish | 38 | 0.8% |
| Scottish | 60 | 1.2% |
| Spaniard | 10 | 0.2% |
| Sri Lankan | 16 | 0.3% |
| Subsaharan African | 1 | 0.0% |
| Sudanese | 1 | 0.0% |
| Swedish | 101 | 2.1% |
| Swiss | 21 | 0.4% |
| Ukrainian | 9 | 0.2% |
| Welsh | 19 | 0.4% | View All 42 Rows |
Immigrants in Ogallala
The most numerous immigrant groups reported in Ogallala came from Central America (110 | 2.3%), Latin America (110 | 2.3%), Mexico (106 | 2.2%), Europe (51 | 1.1%), and Czechoslovakia (29 | 0.6%), together accounting for 8.4% of all Ogallala residents.
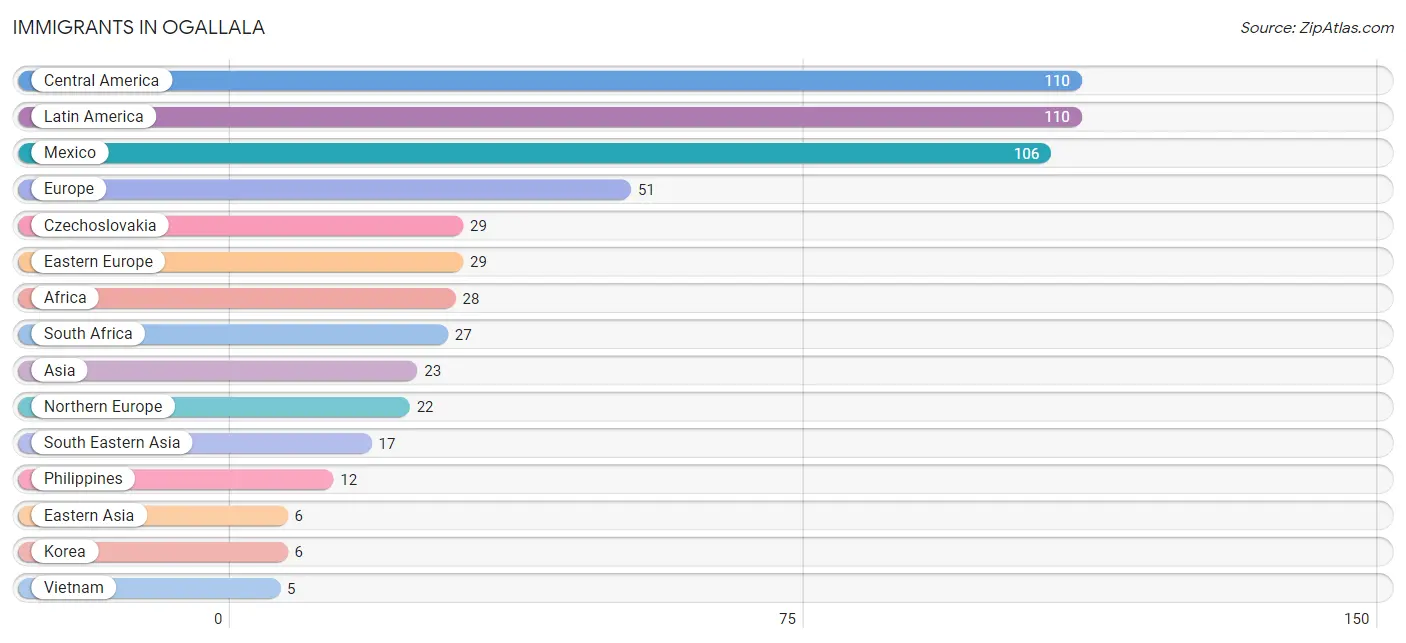
| Immigration Origin | # Population | % Population |
| Africa | 28 | 0.6% |
| Asia | 23 | 0.5% |
| Central America | 110 | 2.3% |
| Czechoslovakia | 29 | 0.6% |
| Eastern Africa | 1 | 0.0% |
| Eastern Asia | 6 | 0.1% |
| Eastern Europe | 29 | 0.6% |
| El Salvador | 1 | 0.0% |
| Ethiopia | 1 | 0.0% |
| Europe | 51 | 1.1% |
| Guatemala | 3 | 0.1% |
| Korea | 6 | 0.1% |
| Latin America | 110 | 2.3% |
| Mexico | 106 | 2.2% |
| Northern Europe | 22 | 0.5% |
| Philippines | 12 | 0.3% |
| South Africa | 27 | 0.6% |
| South Eastern Asia | 17 | 0.4% |
| Vietnam | 5 | 0.1% | View All 19 Rows |
Sex and Age in Ogallala
Sex and Age in Ogallala
The most populous age groups in Ogallala are 50 to 54 Years (220 | 9.3%) for men and 85 Years and over (256 | 10.4%) for women.
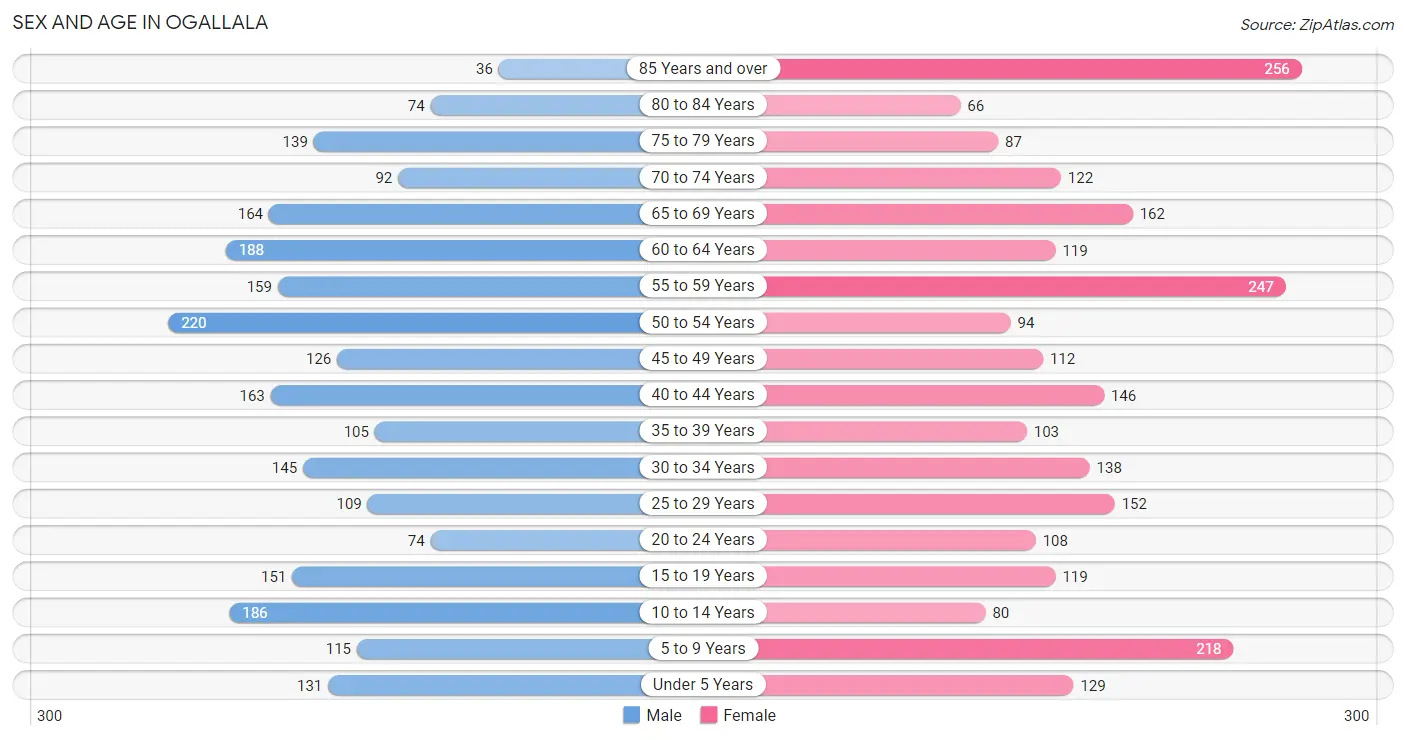
| Age Bracket | Male | Female |
| Under 5 Years | 131 (5.5%) | 129 (5.2%) |
| 5 to 9 Years | 115 (4.8%) | 218 (8.9%) |
| 10 to 14 Years | 186 (7.8%) | 80 (3.3%) |
| 15 to 19 Years | 151 (6.4%) | 119 (4.8%) |
| 20 to 24 Years | 74 (3.1%) | 108 (4.4%) |
| 25 to 29 Years | 109 (4.6%) | 152 (6.2%) |
| 30 to 34 Years | 145 (6.1%) | 138 (5.6%) |
| 35 to 39 Years | 105 (4.4%) | 103 (4.2%) |
| 40 to 44 Years | 163 (6.9%) | 146 (5.9%) |
| 45 to 49 Years | 126 (5.3%) | 112 (4.6%) |
| 50 to 54 Years | 220 (9.3%) | 94 (3.8%) |
| 55 to 59 Years | 159 (6.7%) | 247 (10.1%) |
| 60 to 64 Years | 188 (7.9%) | 119 (4.8%) |
| 65 to 69 Years | 164 (6.9%) | 162 (6.6%) |
| 70 to 74 Years | 92 (3.9%) | 122 (5.0%) |
| 75 to 79 Years | 139 (5.9%) | 87 (3.5%) |
| 80 to 84 Years | 74 (3.1%) | 66 (2.7%) |
| 85 Years and over | 36 (1.5%) | 256 (10.4%) |
| Total | 2,377 (100.0%) | 2,458 (100.0%) |
Families and Households in Ogallala
Median Family Size in Ogallala
The median family size in Ogallala is 2.93 persons per family, with married-couple families (901 | 80.8%) accounting for the largest median family size of 3.01 persons per family. On the other hand, single male/father families (48 | 4.3%) represent the smallest median family size with 2.46 persons per family.
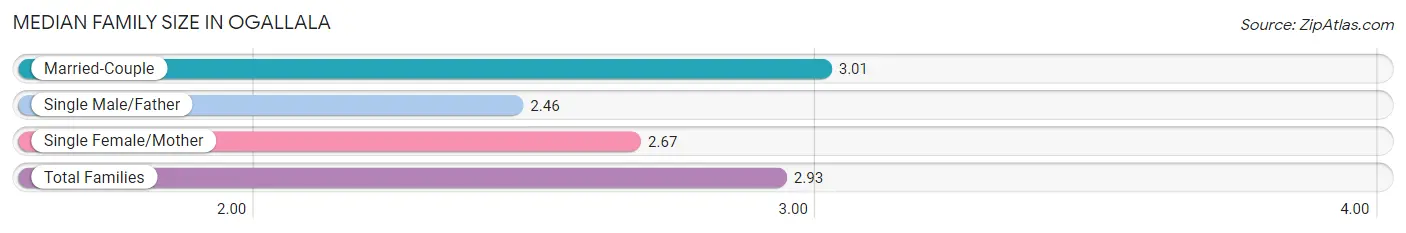
| Family Type | # Families | Family Size |
| Married-Couple | 901 (80.8%) | 3.01 |
| Single Male/Father | 48 (4.3%) | 2.46 |
| Single Female/Mother | 166 (14.9%) | 2.67 |
| Total Families | 1,115 (100.0%) | 2.93 |
Median Household Size in Ogallala
The median household size in Ogallala is 2.10 persons per household, with married-couple households (901 | 39.7%) accounting for the largest median household size of 3.01 persons per household. non-family households (1,153 | 50.8%) represent the smallest median household size with 1.27 persons per household.
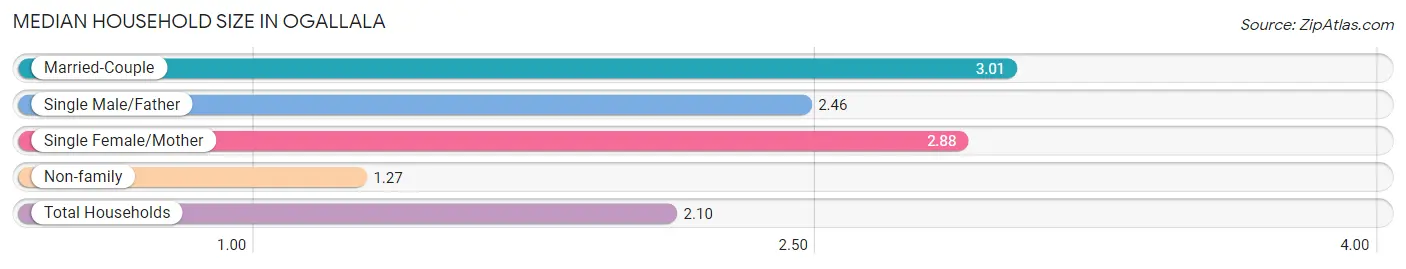
| Household Type | # Households | Household Size |
| Married-Couple | 901 (39.7%) | 3.01 |
| Single Male/Father | 48 (2.1%) | 2.46 |
| Single Female/Mother | 166 (7.3%) | 2.88 |
| Non-family | 1,153 (50.8%) | 1.27 |
| Total Households | 2,268 (100.0%) | 2.10 |
Household Size by Marriage Status in Ogallala
Out of a total of 2,268 households in Ogallala, 1,115 (49.2%) are family households, while 1,153 (50.8%) are nonfamily households. The most numerous type of family households are 2-person households, comprising 641, and the most common type of nonfamily households are 1-person households, comprising 978.
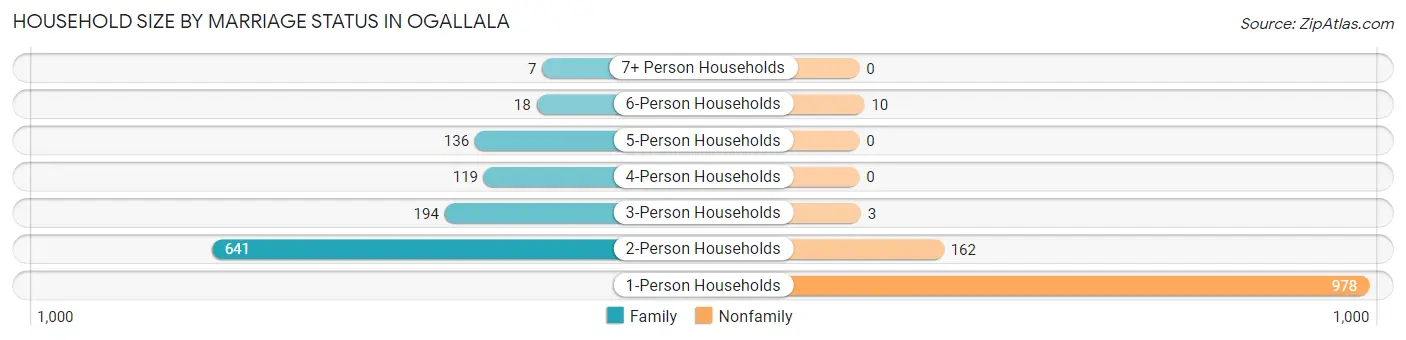
| Household Size | Family Households | Nonfamily Households |
| 1-Person Households | - | 978 (43.1%) |
| 2-Person Households | 641 (28.3%) | 162 (7.1%) |
| 3-Person Households | 194 (8.6%) | 3 (0.1%) |
| 4-Person Households | 119 (5.2%) | 0 (0.0%) |
| 5-Person Households | 136 (6.0%) | 0 (0.0%) |
| 6-Person Households | 18 (0.8%) | 10 (0.4%) |
| 7+ Person Households | 7 (0.3%) | 0 (0.0%) |
| Total | 1,115 (49.2%) | 1,153 (50.8%) |
Female Fertility in Ogallala
Fertility by Age in Ogallala
Average fertility rate in Ogallala is 89.0 births per 1,000 women. Women in the age bracket of 20 to 34 years have the highest fertility rate with 198.0 births per 1,000 women. Women in the age bracket of 20 to 34 years acount for 100.0% of all women with births.
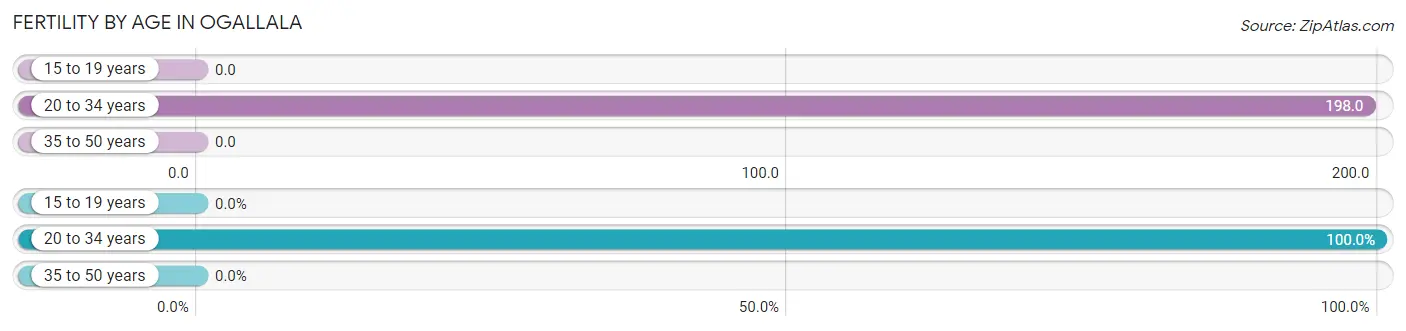
| Age Bracket | Women with Births | Births / 1,000 Women |
| 15 to 19 years | 0 (0.0%) | 0.0 |
| 20 to 34 years | 79 (100.0%) | 198.0 |
| 35 to 50 years | 0 (0.0%) | 0.0 |
| Total | 79 (100.0%) | 89.0 |
Fertility by Age by Marriage Status in Ogallala
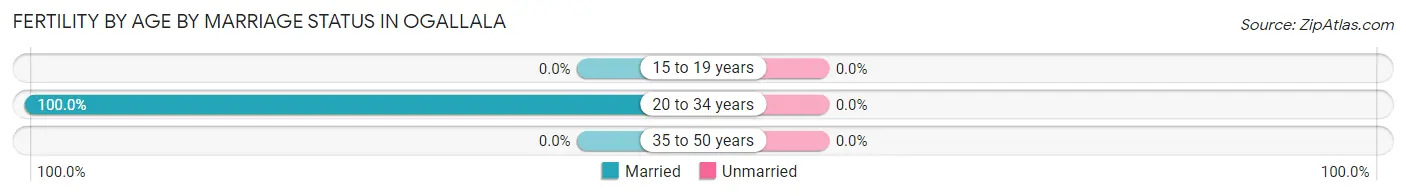
| Age Bracket | Married | Unmarried |
| 15 to 19 years | 0 (0.0%) | 0 (0.0%) |
| 20 to 34 years | 79 (100.0%) | 0 (0.0%) |
| 35 to 50 years | 0 (0.0%) | 0 (0.0%) |
| Total | 79 (100.0%) | 0 (0.0%) |
Fertility by Education in Ogallala
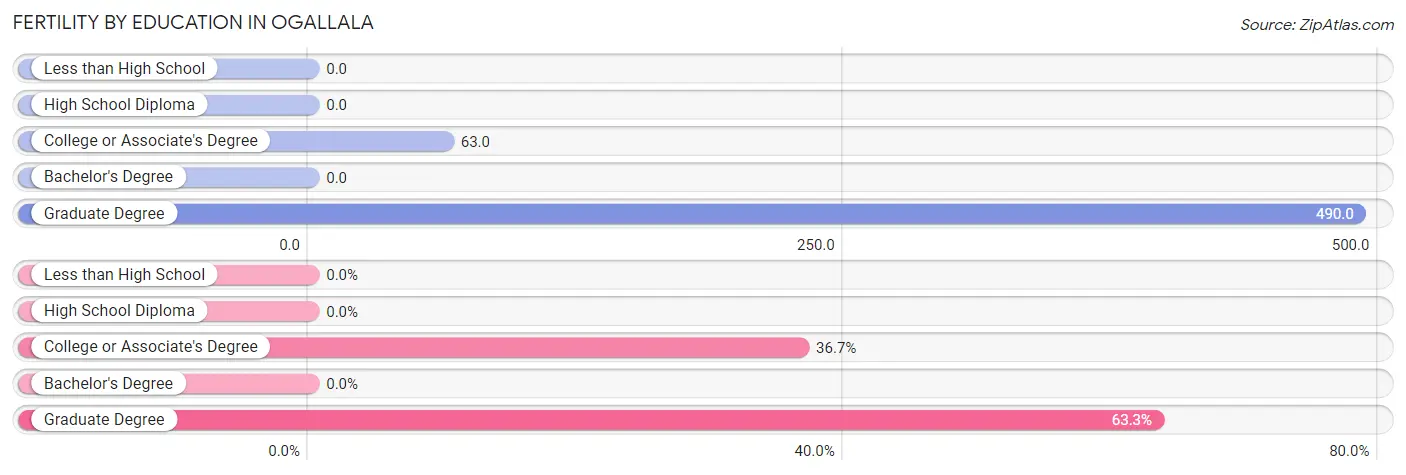
| Educational Attainment | Women with Births | Births / 1,000 Women |
| Less than High School | 0 (0.0%) | 0.0 |
| High School Diploma | 0 (0.0%) | 0.0 |
| College or Associate's Degree | 29 (36.7%) | 63.0 |
| Bachelor's Degree | 0 (0.0%) | 0.0 |
| Graduate Degree | 50 (63.3%) | 490.0 |
| Total | 79 (100.0%) | 89.0 |
Fertility by Education by Marriage Status in Ogallala
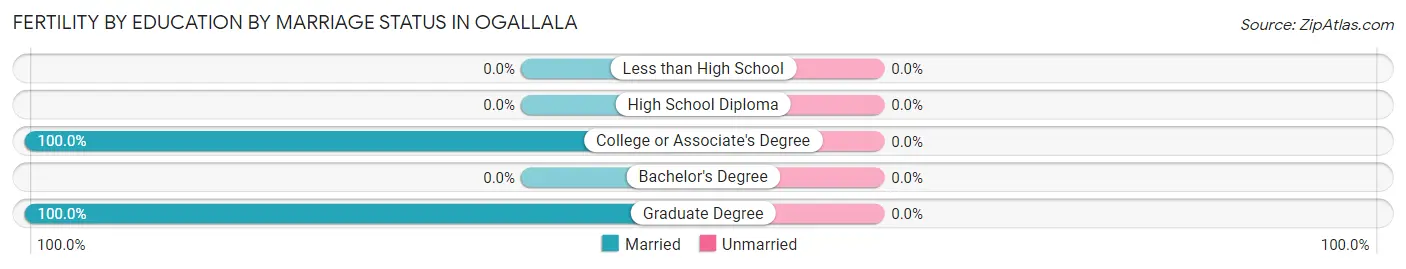
| Educational Attainment | Married | Unmarried |
| Less than High School | 0 (0.0%) | 0 (0.0%) |
| High School Diploma | 0 (0.0%) | 0 (0.0%) |
| College or Associate's Degree | 29 (100.0%) | 0 (0.0%) |
| Bachelor's Degree | 0 (0.0%) | 0 (0.0%) |
| Graduate Degree | 50 (100.0%) | 0 (0.0%) |
| Total | 79 (100.0%) | 0 (0.0%) |
Employment Characteristics in Ogallala
Employment by Class of Employer in Ogallala
Among the 2,262 employed individuals in Ogallala, private company employees (1,448 | 64.0%), local government employees (206 | 9.1%), and self-employed (incorporated) (185 | 8.2%) make up the most common classes of employment.
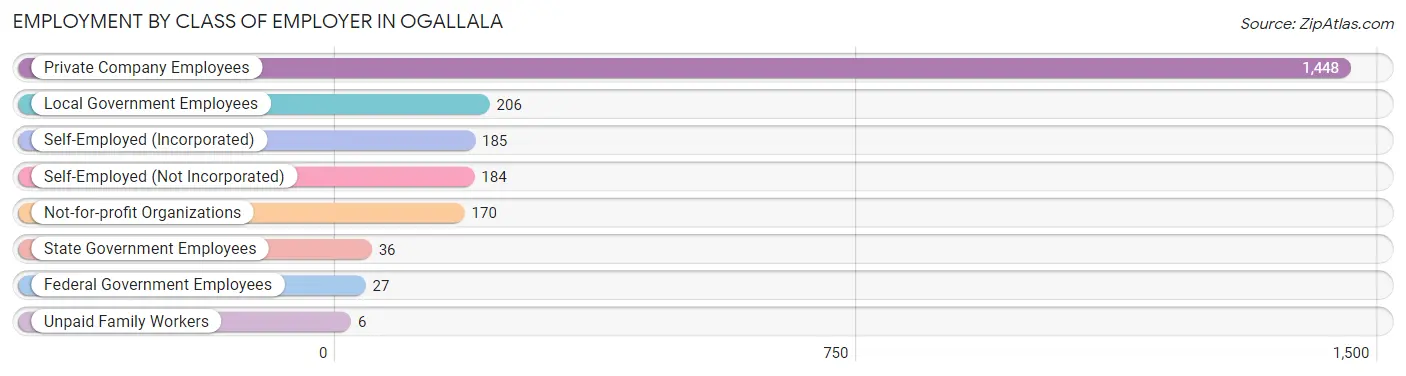
| Employer Class | # Employees | % Employees |
| Private Company Employees | 1,448 | 64.0% |
| Self-Employed (Incorporated) | 185 | 8.2% |
| Self-Employed (Not Incorporated) | 184 | 8.1% |
| Not-for-profit Organizations | 170 | 7.5% |
| Local Government Employees | 206 | 9.1% |
| State Government Employees | 36 | 1.6% |
| Federal Government Employees | 27 | 1.2% |
| Unpaid Family Workers | 6 | 0.3% |
| Total | 2,262 | 100.0% |
Employment Status by Age in Ogallala
According to the labor force statistics for Ogallala, out of the total population over 16 years of age (3,919), 60.8% or 2,383 individuals are in the labor force, with 3.5% or 83 of them unemployed. The age group with the highest labor force participation rate is 25 to 29 years, with 90.0% or 235 individuals in the labor force. Within the labor force, the 20 to 24 years age range has the highest percentage of unemployed individuals, with 10.5% or 16 of them being unemployed.
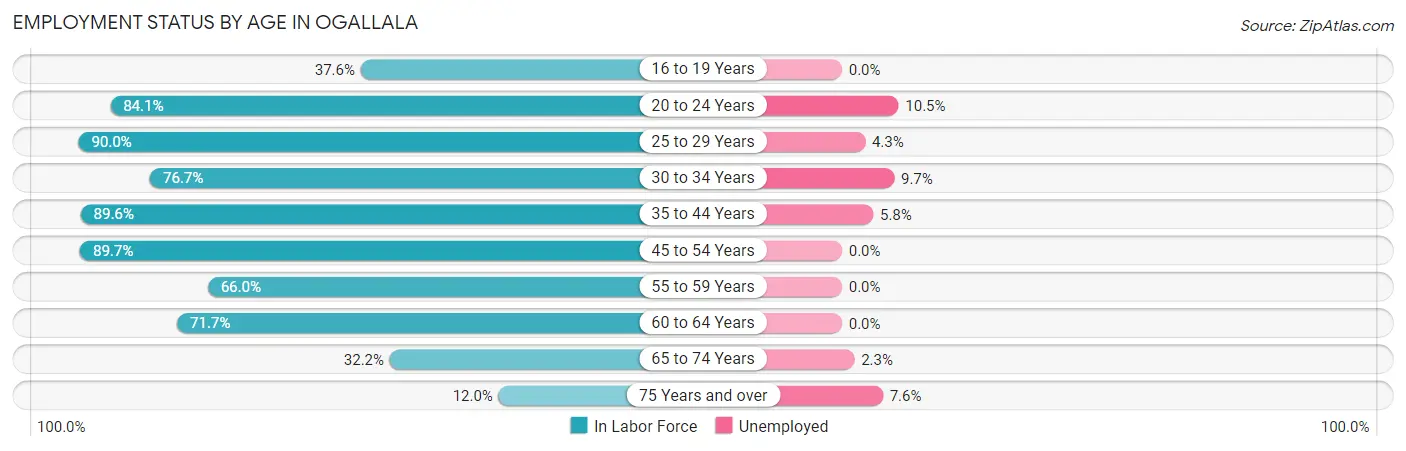
| Age Bracket | In Labor Force | Unemployed |
| 16 to 19 Years | 80 (37.6%) | 0 (0.0%) |
| 20 to 24 Years | 153 (84.1%) | 16 (10.5%) |
| 25 to 29 Years | 235 (90.0%) | 10 (4.3%) |
| 30 to 34 Years | 217 (76.7%) | 21 (9.7%) |
| 35 to 44 Years | 463 (89.6%) | 27 (5.8%) |
| 45 to 54 Years | 495 (89.7%) | 0 (0.0%) |
| 55 to 59 Years | 268 (66.0%) | 0 (0.0%) |
| 60 to 64 Years | 220 (71.7%) | 0 (0.0%) |
| 65 to 74 Years | 174 (32.2%) | 4 (2.3%) |
| 75 Years and over | 79 (12.0%) | 6 (7.6%) |
| Total | 2,383 (60.8%) | 83 (3.5%) |
Employment Status by Educational Attainment in Ogallala
According to labor force statistics for Ogallala, 81.6% of individuals (1,898) out of the total population between 25 and 64 years of age (2,326) are in the labor force, with 3.1% or 59 of them being unemployed. The group with the highest labor force participation rate are those with the educational attainment of college / associate degree, with 88.4% or 941 individuals in the labor force. Within the labor force, individuals with less than high school education have the highest percentage of unemployment, with 23.2% or 22 of them being unemployed.
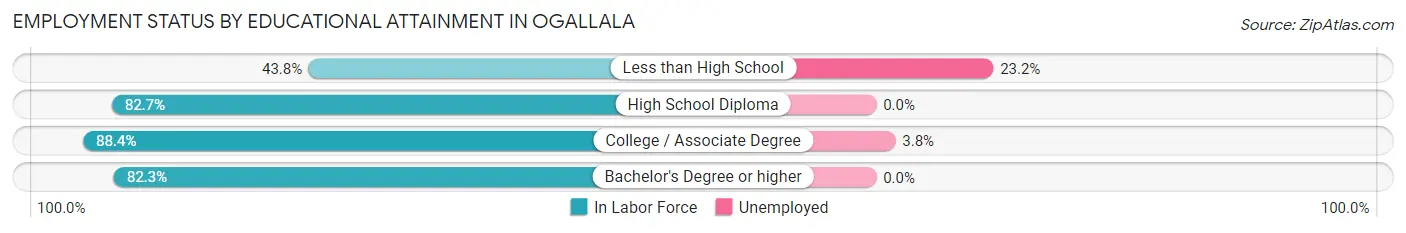
| Educational Attainment | In Labor Force | Unemployed |
| Less than High School | 95 (43.8%) | 50 (23.2%) |
| High School Diploma | 489 (82.7%) | 0 (0.0%) |
| College / Associate Degree | 941 (88.4%) | 40 (3.8%) |
| Bachelor's Degree or higher | 373 (82.3%) | 0 (0.0%) |
| Total | 1,898 (81.6%) | 72 (3.1%) |
Employment Occupations by Sex in Ogallala
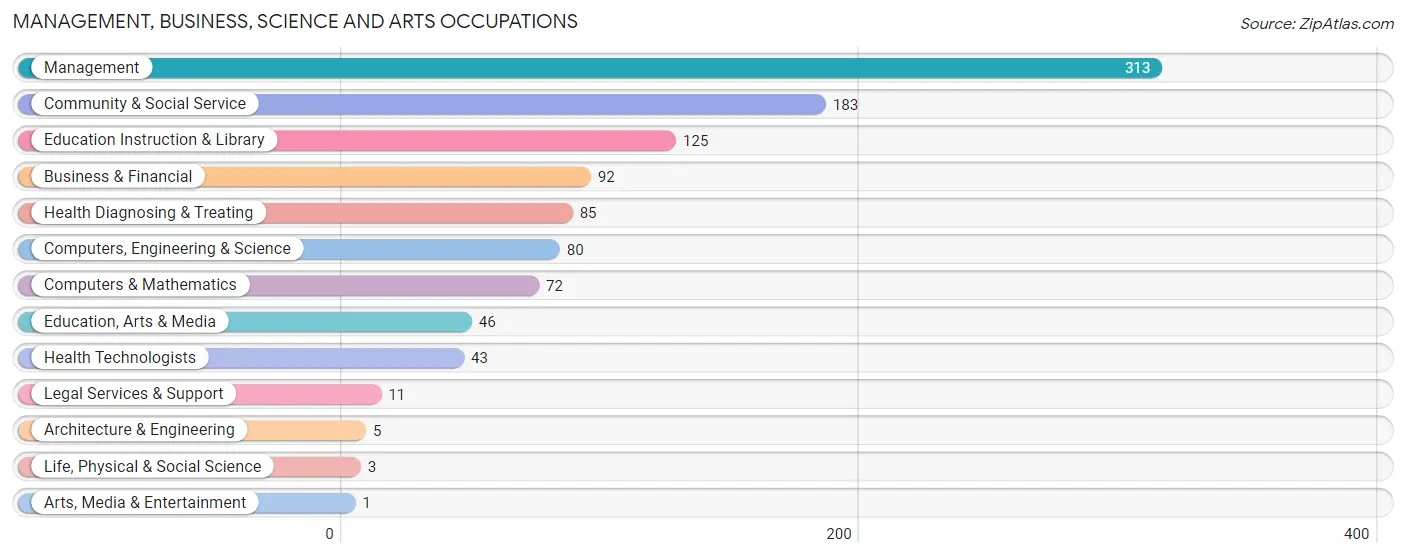
Management, Business, Science and Arts Occupations
The most common Management, Business, Science and Arts occupations in Ogallala are Management (313 | 13.6%), Community & Social Service (183 | 8.0%), Education Instruction & Library (125 | 5.4%), Business & Financial (92 | 4.0%), and Health Diagnosing & Treating (85 | 3.7%).
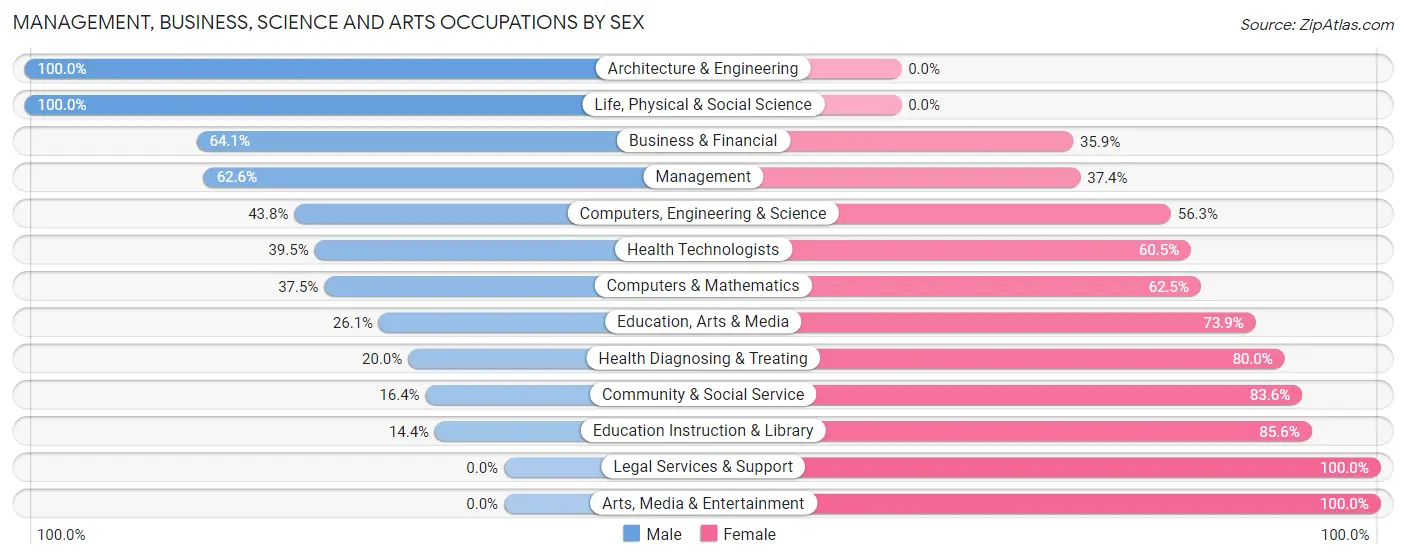
Management, Business, Science and Arts Occupations by Sex
Within the Management, Business, Science and Arts occupations in Ogallala, the most male-oriented occupations are Architecture & Engineering (100.0%), Life, Physical & Social Science (100.0%), and Business & Financial (64.1%), while the most female-oriented occupations are Legal Services & Support (100.0%), Arts, Media & Entertainment (100.0%), and Education Instruction & Library (85.6%).
| Occupation | Male | Female |
| Management | 196 (62.6%) | 117 (37.4%) |
| Business & Financial | 59 (64.1%) | 33 (35.9%) |
| Computers, Engineering & Science | 35 (43.8%) | 45 (56.2%) |
| Computers & Mathematics | 27 (37.5%) | 45 (62.5%) |
| Architecture & Engineering | 5 (100.0%) | 0 (0.0%) |
| Life, Physical & Social Science | 3 (100.0%) | 0 (0.0%) |
| Community & Social Service | 30 (16.4%) | 153 (83.6%) |
| Education, Arts & Media | 12 (26.1%) | 34 (73.9%) |
| Legal Services & Support | 0 (0.0%) | 11 (100.0%) |
| Education Instruction & Library | 18 (14.4%) | 107 (85.6%) |
| Arts, Media & Entertainment | 0 (0.0%) | 1 (100.0%) |
| Health Diagnosing & Treating | 17 (20.0%) | 68 (80.0%) |
| Health Technologists | 17 (39.5%) | 26 (60.5%) |
| Total (Category) | 337 (44.8%) | 416 (55.2%) |
| Total (Overall) | 1,278 (55.6%) | 1,022 (44.4%) |
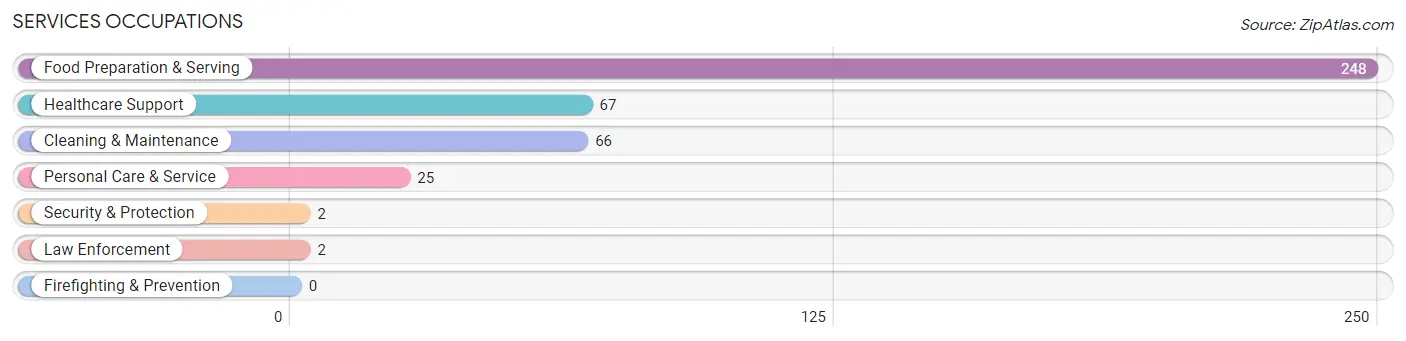
Services Occupations
The most common Services occupations in Ogallala are Food Preparation & Serving (248 | 10.8%), Healthcare Support (67 | 2.9%), Cleaning & Maintenance (66 | 2.9%), Personal Care & Service (25 | 1.1%), and Security & Protection (2 | 0.1%).
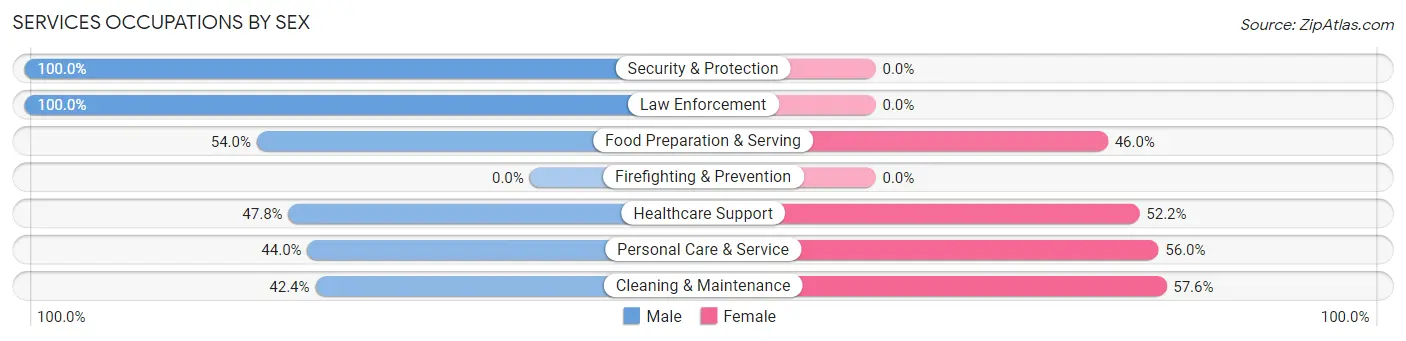
Services Occupations by Sex
Within the Services occupations in Ogallala, the most male-oriented occupations are Security & Protection (100.0%), Law Enforcement (100.0%), and Food Preparation & Serving (54.0%), while the most female-oriented occupations are Cleaning & Maintenance (57.6%), Personal Care & Service (56.0%), and Healthcare Support (52.2%).
| Occupation | Male | Female |
| Healthcare Support | 32 (47.8%) | 35 (52.2%) |
| Security & Protection | 2 (100.0%) | 0 (0.0%) |
| Firefighting & Prevention | 0 (0.0%) | 0 (0.0%) |
| Law Enforcement | 2 (100.0%) | 0 (0.0%) |
| Food Preparation & Serving | 134 (54.0%) | 114 (46.0%) |
| Cleaning & Maintenance | 28 (42.4%) | 38 (57.6%) |
| Personal Care & Service | 11 (44.0%) | 14 (56.0%) |
| Total (Category) | 207 (50.7%) | 201 (49.3%) |
| Total (Overall) | 1,278 (55.6%) | 1,022 (44.4%) |
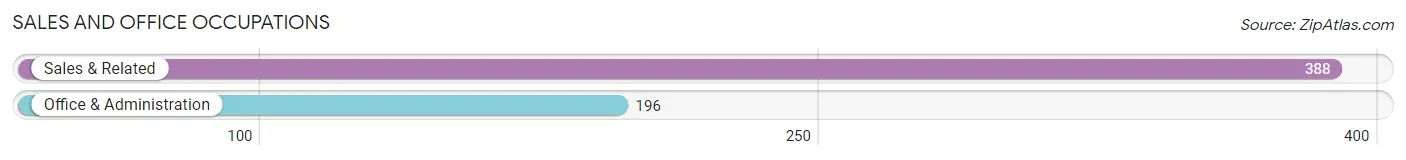
Sales and Office Occupations
The most common Sales and Office occupations in Ogallala are Sales & Related (388 | 16.9%), and Office & Administration (196 | 8.5%).
Sales and Office Occupations by Sex
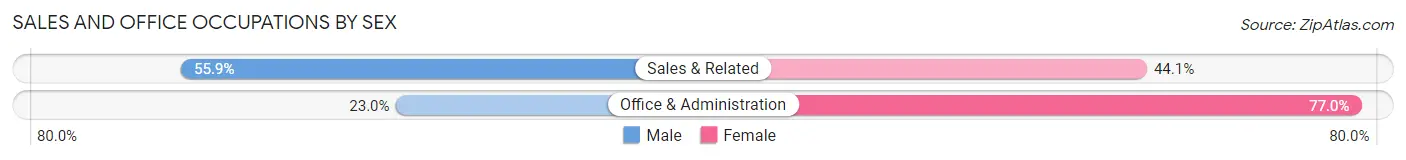
| Occupation | Male | Female |
| Sales & Related | 217 (55.9%) | 171 (44.1%) |
| Office & Administration | 45 (23.0%) | 151 (77.0%) |
| Total (Category) | 262 (44.9%) | 322 (55.1%) |
| Total (Overall) | 1,278 (55.6%) | 1,022 (44.4%) |
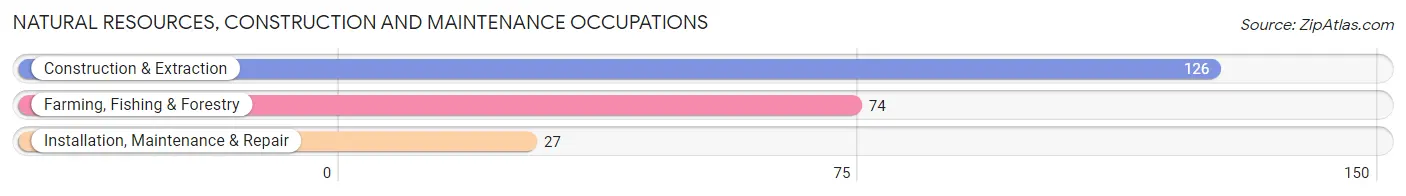
Natural Resources, Construction and Maintenance Occupations
The most common Natural Resources, Construction and Maintenance occupations in Ogallala are Construction & Extraction (126 | 5.5%), Farming, Fishing & Forestry (74 | 3.2%), and Installation, Maintenance & Repair (27 | 1.2%).
Natural Resources, Construction and Maintenance Occupations by Sex
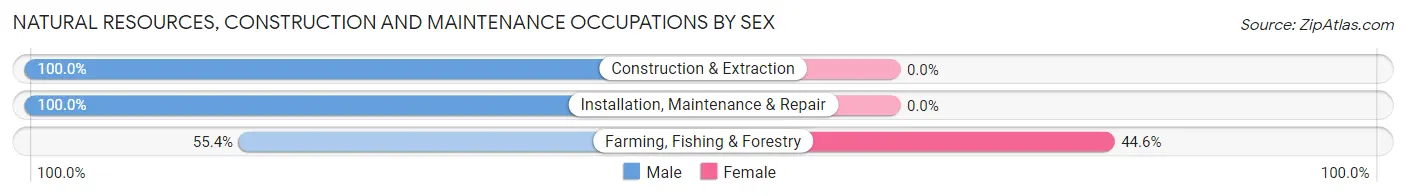
| Occupation | Male | Female |
| Farming, Fishing & Forestry | 41 (55.4%) | 33 (44.6%) |
| Construction & Extraction | 126 (100.0%) | 0 (0.0%) |
| Installation, Maintenance & Repair | 27 (100.0%) | 0 (0.0%) |
| Total (Category) | 194 (85.5%) | 33 (14.5%) |
| Total (Overall) | 1,278 (55.6%) | 1,022 (44.4%) |
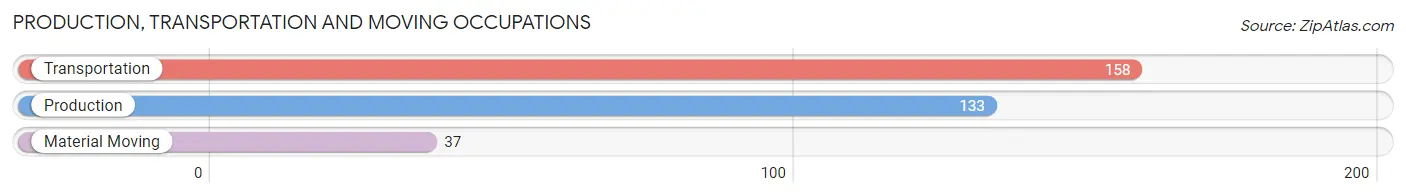
Production, Transportation and Moving Occupations
The most common Production, Transportation and Moving occupations in Ogallala are Transportation (158 | 6.9%), Production (133 | 5.8%), and Material Moving (37 | 1.6%).
Production, Transportation and Moving Occupations by Sex
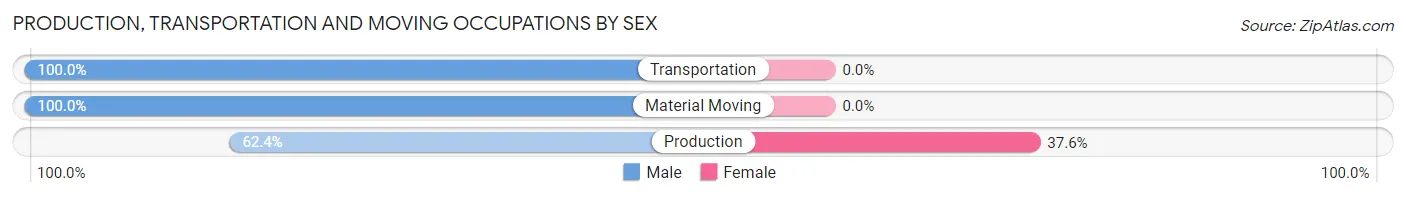
| Occupation | Male | Female |
| Production | 83 (62.4%) | 50 (37.6%) |
| Transportation | 158 (100.0%) | 0 (0.0%) |
| Material Moving | 37 (100.0%) | 0 (0.0%) |
| Total (Category) | 278 (84.8%) | 50 (15.2%) |
| Total (Overall) | 1,278 (55.6%) | 1,022 (44.4%) |
Employment Industries by Sex in Ogallala
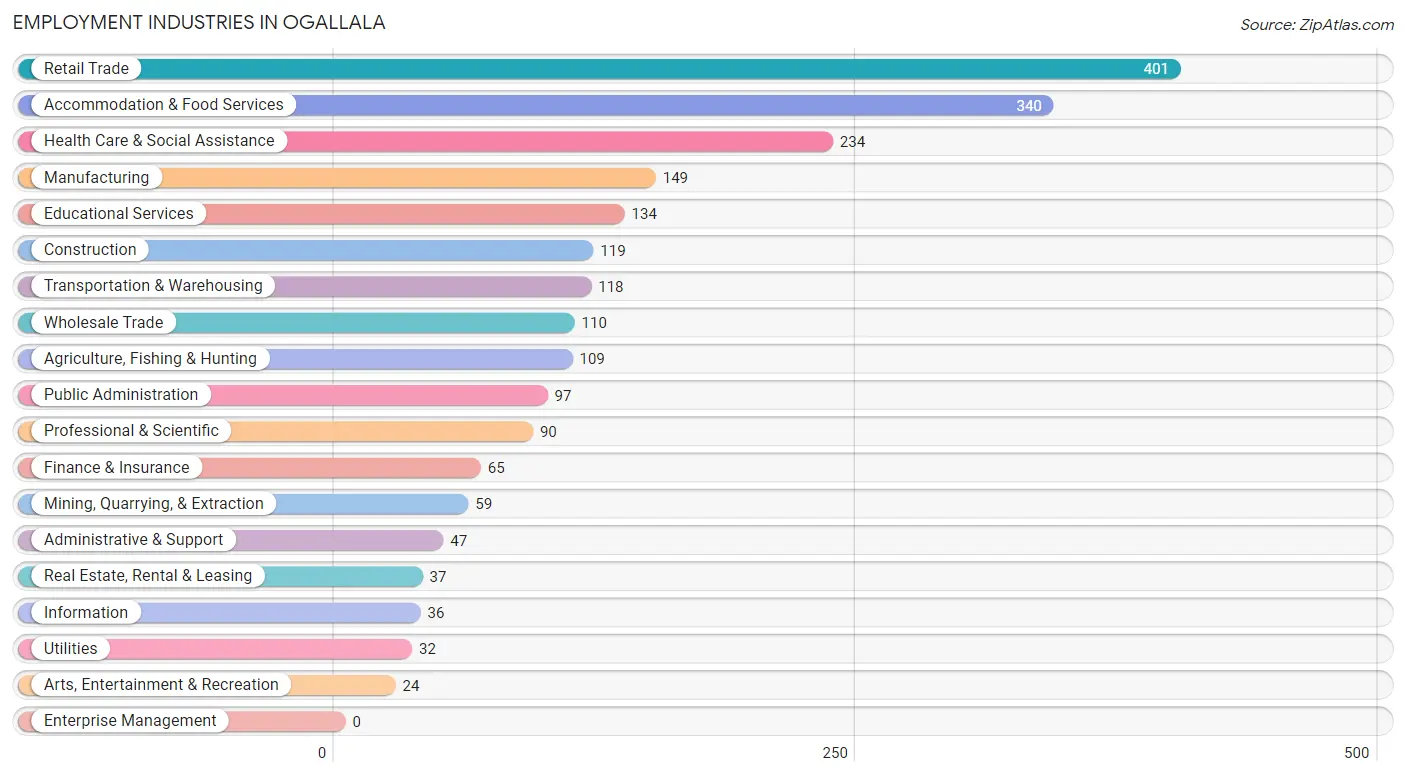
Employment Industries in Ogallala
The major employment industries in Ogallala include Retail Trade (401 | 17.4%), Accommodation & Food Services (340 | 14.8%), Health Care & Social Assistance (234 | 10.2%), Manufacturing (149 | 6.5%), and Educational Services (134 | 5.8%).
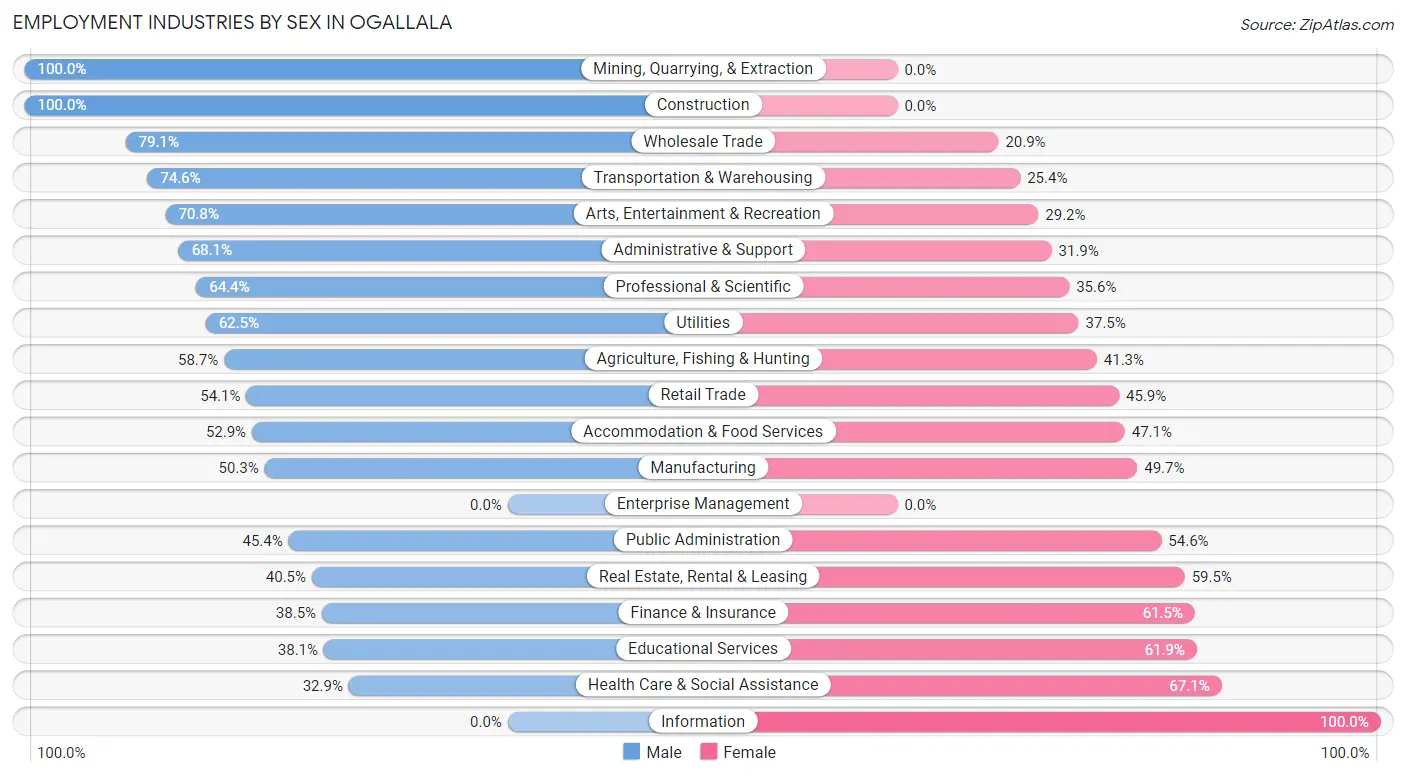
Employment Industries by Sex in Ogallala
The Ogallala industries that see more men than women are Mining, Quarrying, & Extraction (100.0%), Construction (100.0%), and Wholesale Trade (79.1%), whereas the industries that tend to have a higher number of women are Information (100.0%), Health Care & Social Assistance (67.1%), and Educational Services (61.9%).
| Industry | Male | Female |
| Agriculture, Fishing & Hunting | 64 (58.7%) | 45 (41.3%) |
| Mining, Quarrying, & Extraction | 59 (100.0%) | 0 (0.0%) |
| Construction | 119 (100.0%) | 0 (0.0%) |
| Manufacturing | 75 (50.3%) | 74 (49.7%) |
| Wholesale Trade | 87 (79.1%) | 23 (20.9%) |
| Retail Trade | 217 (54.1%) | 184 (45.9%) |
| Transportation & Warehousing | 88 (74.6%) | 30 (25.4%) |
| Utilities | 20 (62.5%) | 12 (37.5%) |
| Information | 0 (0.0%) | 36 (100.0%) |
| Finance & Insurance | 25 (38.5%) | 40 (61.5%) |
| Real Estate, Rental & Leasing | 15 (40.5%) | 22 (59.5%) |
| Professional & Scientific | 58 (64.4%) | 32 (35.6%) |
| Enterprise Management | 0 (0.0%) | 0 (0.0%) |
| Administrative & Support | 32 (68.1%) | 15 (31.9%) |
| Educational Services | 51 (38.1%) | 83 (61.9%) |
| Health Care & Social Assistance | 77 (32.9%) | 157 (67.1%) |
| Arts, Entertainment & Recreation | 17 (70.8%) | 7 (29.2%) |
| Accommodation & Food Services | 180 (52.9%) | 160 (47.1%) |
| Public Administration | 44 (45.4%) | 53 (54.6%) |
| Total | 1,278 (55.6%) | 1,022 (44.4%) |
Education in Ogallala
School Enrollment in Ogallala
The most common levels of schooling among the 986 students in Ogallala are elementary school (297 | 30.1%), high school (229 | 23.2%), and middle school (195 | 19.8%).
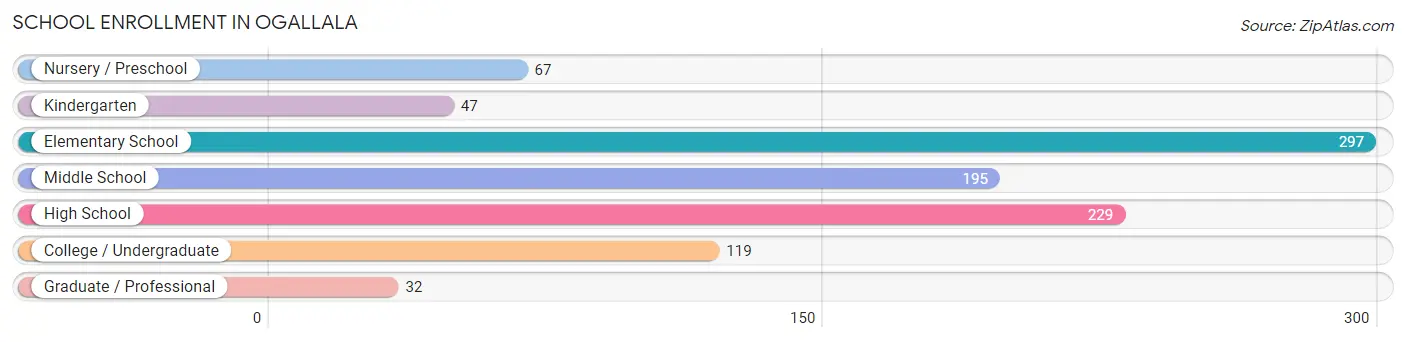
| School Level | # Students | % Students |
| Nursery / Preschool | 67 | 6.8% |
| Kindergarten | 47 | 4.8% |
| Elementary School | 297 | 30.1% |
| Middle School | 195 | 19.8% |
| High School | 229 | 23.2% |
| College / Undergraduate | 119 | 12.1% |
| Graduate / Professional | 32 | 3.3% |
| Total | 986 | 100.0% |
School Enrollment by Age by Funding Source in Ogallala
Out of a total of 986 students who are enrolled in schools in Ogallala, 229 (23.2%) attend a private institution, while the remaining 757 (76.8%) are enrolled in public schools. The age group of 3 to 4 year olds has the highest likelihood of being enrolled in private schools, with 56 (100.0% in the age bracket) enrolled. Conversely, the age group of 10 to 14 year olds has the lowest likelihood of being enrolled in a private school, with 256 (100.0% in the age bracket) attending a public institution.
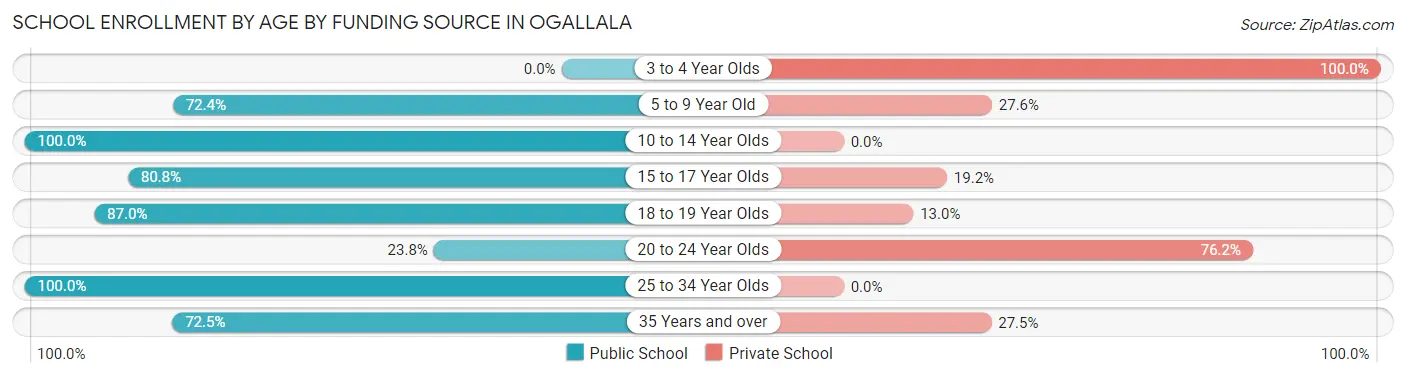
| Age Bracket | Public School | Private School |
| 3 to 4 Year Olds | 0 (0.0%) | 56 (100.0%) |
| 5 to 9 Year Old | 202 (72.4%) | 77 (27.6%) |
| 10 to 14 Year Olds | 256 (100.0%) | 0 (0.0%) |
| 15 to 17 Year Olds | 147 (80.8%) | 35 (19.2%) |
| 18 to 19 Year Olds | 47 (87.0%) | 7 (13.0%) |
| 20 to 24 Year Olds | 10 (23.8%) | 32 (76.2%) |
| 25 to 34 Year Olds | 37 (100.0%) | 0 (0.0%) |
| 35 Years and over | 58 (72.5%) | 22 (27.5%) |
| Total | 757 (76.8%) | 229 (23.2%) |
Educational Attainment by Field of Study in Ogallala
Education (236 | 28.8%), business (134 | 16.3%), bio, nature & agricultural (108 | 13.2%), science & technology (92 | 11.2%), and liberal arts & history (80 | 9.8%) are the most common fields of study among 820 individuals in Ogallala who have obtained a bachelor's degree or higher.
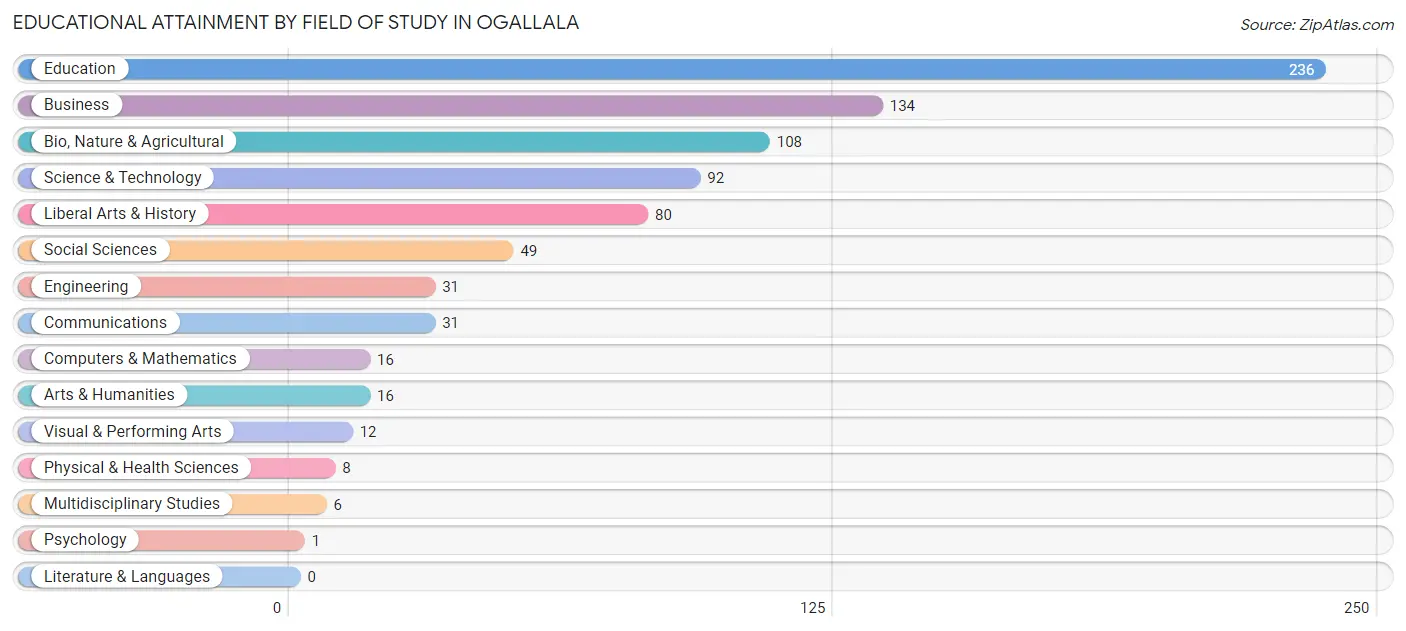
| Field of Study | # Graduates | % Graduates |
| Computers & Mathematics | 16 | 1.9% |
| Bio, Nature & Agricultural | 108 | 13.2% |
| Physical & Health Sciences | 8 | 1.0% |
| Psychology | 1 | 0.1% |
| Social Sciences | 49 | 6.0% |
| Engineering | 31 | 3.8% |
| Multidisciplinary Studies | 6 | 0.7% |
| Science & Technology | 92 | 11.2% |
| Business | 134 | 16.3% |
| Education | 236 | 28.8% |
| Literature & Languages | 0 | 0.0% |
| Liberal Arts & History | 80 | 9.8% |
| Visual & Performing Arts | 12 | 1.5% |
| Communications | 31 | 3.8% |
| Arts & Humanities | 16 | 1.9% |
| Total | 820 | 100.0% |
Transportation & Commute in Ogallala
Vehicle Availability by Sex in Ogallala
The most prevalent vehicle ownership categories in Ogallala are males with 2 vehicles (666, accounting for 52.2%) and females with 2 vehicles (531, making up 67.5%).
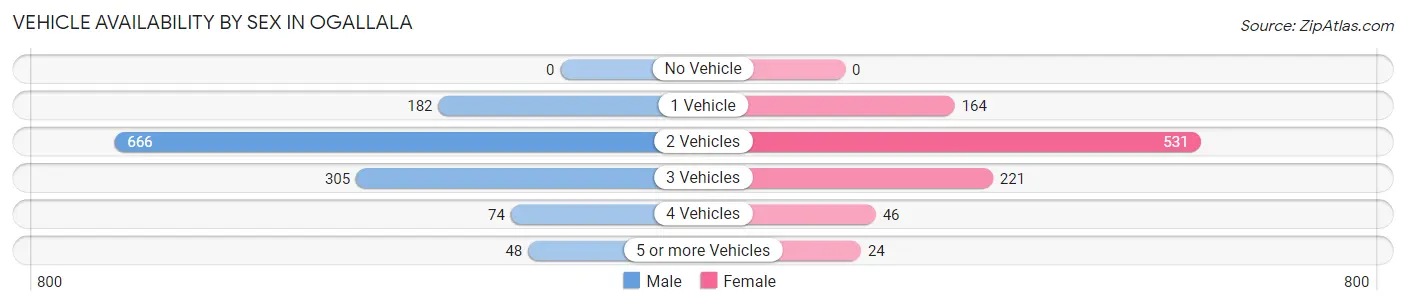
| Vehicles Available | Male | Female |
| No Vehicle | 0 (0.0%) | 0 (0.0%) |
| 1 Vehicle | 182 (14.3%) | 164 (16.6%) |
| 2 Vehicles | 666 (52.2%) | 531 (53.8%) |
| 3 Vehicles | 305 (23.9%) | 221 (22.4%) |
| 4 Vehicles | 74 (5.8%) | 46 (4.7%) |
| 5 or more Vehicles | 48 (3.8%) | 24 (2.4%) |
| Total | 1,275 (100.0%) | 986 (100.0%) |
Commute Time in Ogallala
The most frequently occuring commute durations in Ogallala are 5 to 9 minutes (766 commuters, 34.8%), less than 5 minutes (481 commuters, 21.9%), and 10 to 14 minutes (412 commuters, 18.7%).
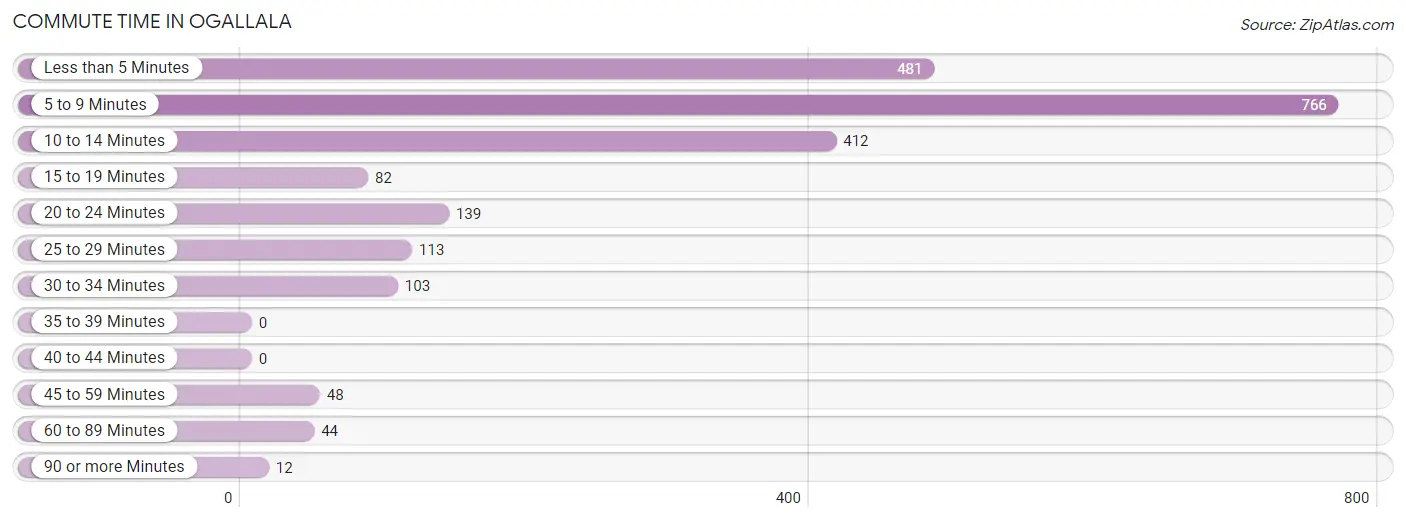
| Commute Time | # Commuters | % Commuters |
| Less than 5 Minutes | 481 | 21.9% |
| 5 to 9 Minutes | 766 | 34.8% |
| 10 to 14 Minutes | 412 | 18.7% |
| 15 to 19 Minutes | 82 | 3.7% |
| 20 to 24 Minutes | 139 | 6.3% |
| 25 to 29 Minutes | 113 | 5.1% |
| 30 to 34 Minutes | 103 | 4.7% |
| 35 to 39 Minutes | 0 | 0.0% |
| 40 to 44 Minutes | 0 | 0.0% |
| 45 to 59 Minutes | 48 | 2.2% |
| 60 to 89 Minutes | 44 | 2.0% |
| 90 or more Minutes | 12 | 0.5% |
Commute Time by Sex in Ogallala
The most common commute times in Ogallala are 5 to 9 minutes (430 commuters, 35.0%) for males and 5 to 9 minutes (336 commuters, 34.6%) for females.
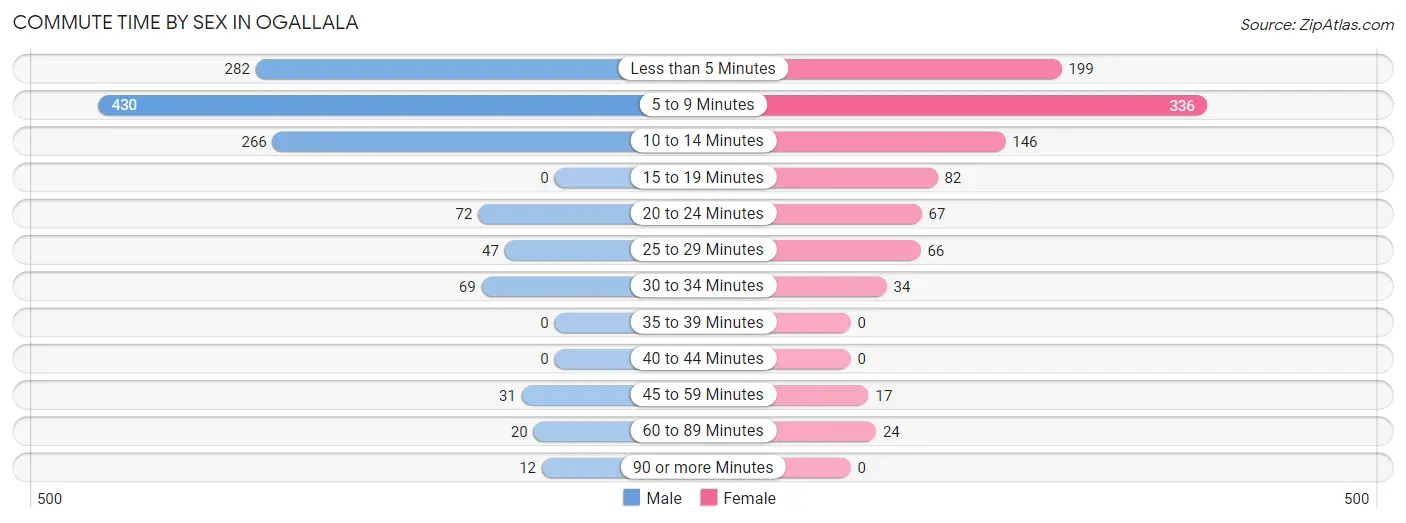
| Commute Time | Male | Female |
| Less than 5 Minutes | 282 (23.0%) | 199 (20.5%) |
| 5 to 9 Minutes | 430 (35.0%) | 336 (34.6%) |
| 10 to 14 Minutes | 266 (21.6%) | 146 (15.0%) |
| 15 to 19 Minutes | 0 (0.0%) | 82 (8.4%) |
| 20 to 24 Minutes | 72 (5.9%) | 67 (6.9%) |
| 25 to 29 Minutes | 47 (3.8%) | 66 (6.8%) |
| 30 to 34 Minutes | 69 (5.6%) | 34 (3.5%) |
| 35 to 39 Minutes | 0 (0.0%) | 0 (0.0%) |
| 40 to 44 Minutes | 0 (0.0%) | 0 (0.0%) |
| 45 to 59 Minutes | 31 (2.5%) | 17 (1.8%) |
| 60 to 89 Minutes | 20 (1.6%) | 24 (2.5%) |
| 90 or more Minutes | 12 (1.0%) | 0 (0.0%) |
Time of Departure to Work by Sex in Ogallala
The most frequent times of departure to work in Ogallala are 7:30 AM to 7:59 AM (267, 21.7%) for males and 7:30 AM to 7:59 AM (263, 27.1%) for females.
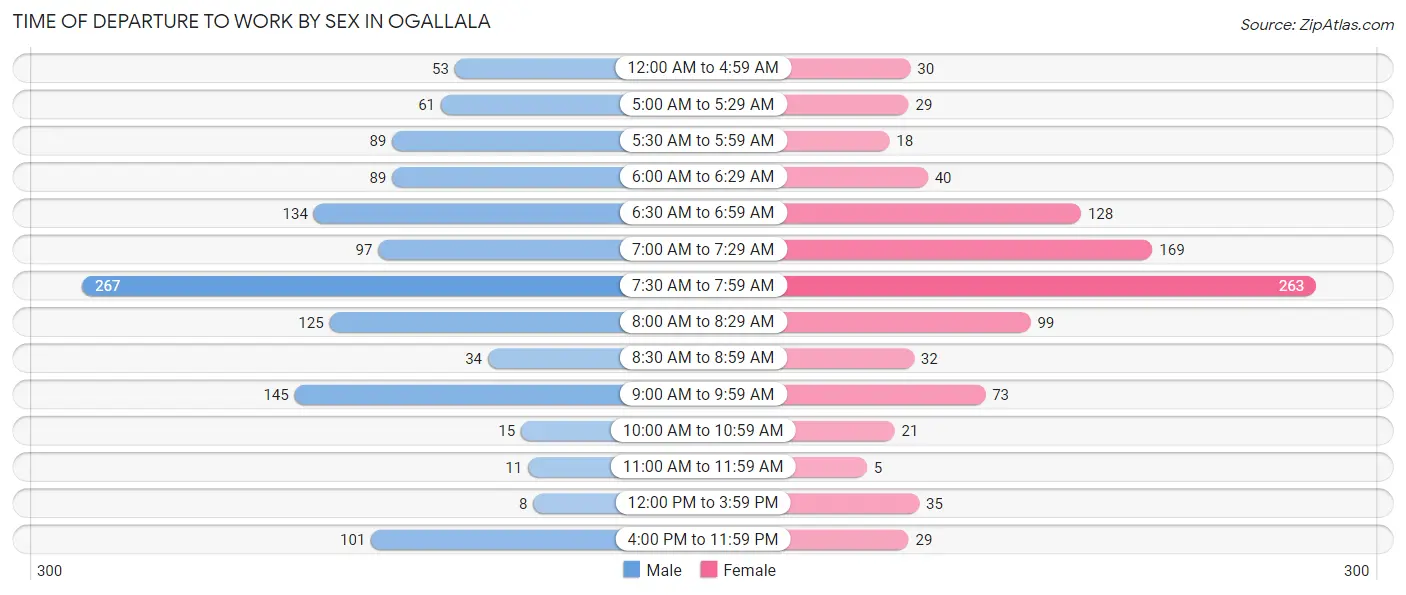
| Time of Departure | Male | Female |
| 12:00 AM to 4:59 AM | 53 (4.3%) | 30 (3.1%) |
| 5:00 AM to 5:29 AM | 61 (5.0%) | 29 (3.0%) |
| 5:30 AM to 5:59 AM | 89 (7.2%) | 18 (1.8%) |
| 6:00 AM to 6:29 AM | 89 (7.2%) | 40 (4.1%) |
| 6:30 AM to 6:59 AM | 134 (10.9%) | 128 (13.2%) |
| 7:00 AM to 7:29 AM | 97 (7.9%) | 169 (17.4%) |
| 7:30 AM to 7:59 AM | 267 (21.7%) | 263 (27.1%) |
| 8:00 AM to 8:29 AM | 125 (10.2%) | 99 (10.2%) |
| 8:30 AM to 8:59 AM | 34 (2.8%) | 32 (3.3%) |
| 9:00 AM to 9:59 AM | 145 (11.8%) | 73 (7.5%) |
| 10:00 AM to 10:59 AM | 15 (1.2%) | 21 (2.2%) |
| 11:00 AM to 11:59 AM | 11 (0.9%) | 5 (0.5%) |
| 12:00 PM to 3:59 PM | 8 (0.6%) | 35 (3.6%) |
| 4:00 PM to 11:59 PM | 101 (8.2%) | 29 (3.0%) |
| Total | 1,229 (100.0%) | 971 (100.0%) |
Housing Occupancy in Ogallala
Occupancy by Ownership in Ogallala
Of the total 2,268 dwellings in Ogallala, owner-occupied units account for 1,564 (69.0%), while renter-occupied units make up 704 (31.0%).
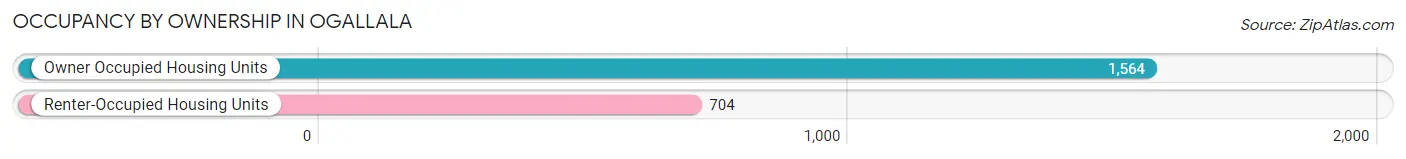
| Occupancy | # Housing Units | % Housing Units |
| Owner Occupied Housing Units | 1,564 | 69.0% |
| Renter-Occupied Housing Units | 704 | 31.0% |
| Total Occupied Housing Units | 2,268 | 100.0% |
Occupancy by Household Size in Ogallala
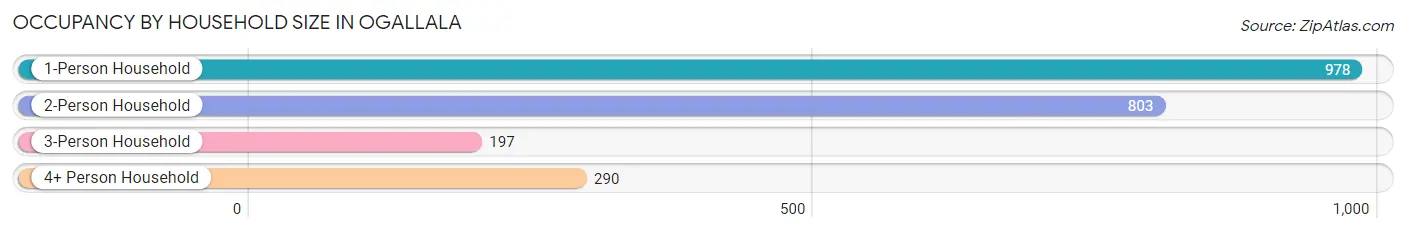
| Household Size | # Housing Units | % Housing Units |
| 1-Person Household | 978 | 43.1% |
| 2-Person Household | 803 | 35.4% |
| 3-Person Household | 197 | 8.7% |
| 4+ Person Household | 290 | 12.8% |
| Total Housing Units | 2,268 | 100.0% |
Occupancy by Ownership by Household Size in Ogallala
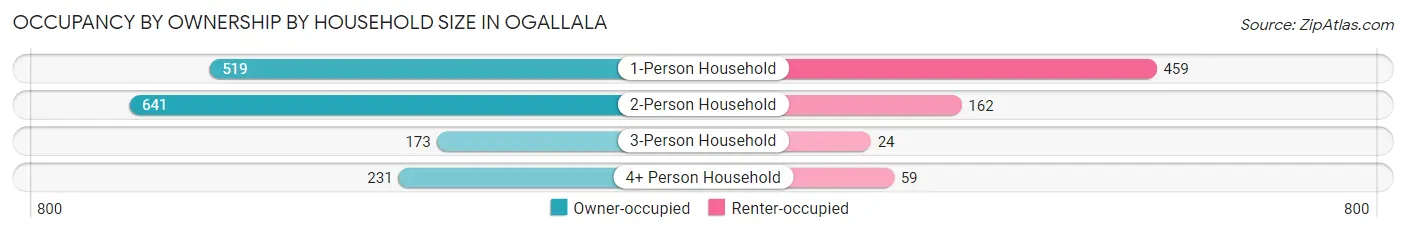
| Household Size | Owner-occupied | Renter-occupied |
| 1-Person Household | 519 (53.1%) | 459 (46.9%) |
| 2-Person Household | 641 (79.8%) | 162 (20.2%) |
| 3-Person Household | 173 (87.8%) | 24 (12.2%) |
| 4+ Person Household | 231 (79.7%) | 59 (20.3%) |
| Total Housing Units | 1,564 (69.0%) | 704 (31.0%) |
Occupancy by Educational Attainment in Ogallala
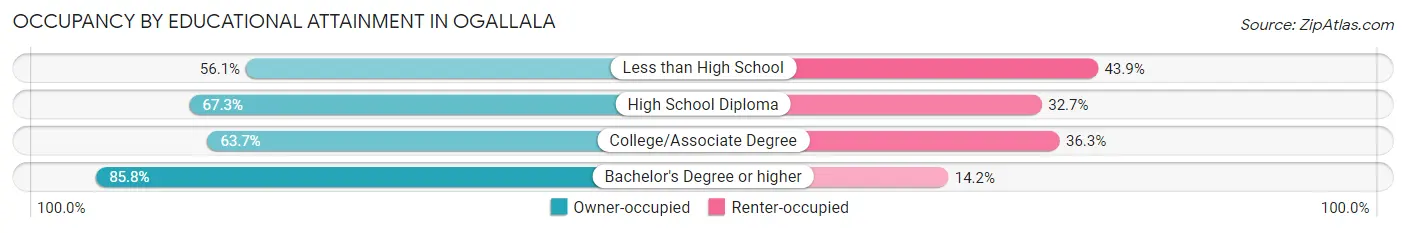
| Household Size | Owner-occupied | Renter-occupied |
| Less than High School | 133 (56.1%) | 104 (43.9%) |
| High School Diploma | 411 (67.3%) | 200 (32.7%) |
| College/Associate Degree | 573 (63.7%) | 326 (36.3%) |
| Bachelor's Degree or higher | 447 (85.8%) | 74 (14.2%) |
Occupancy by Age of Householder in Ogallala
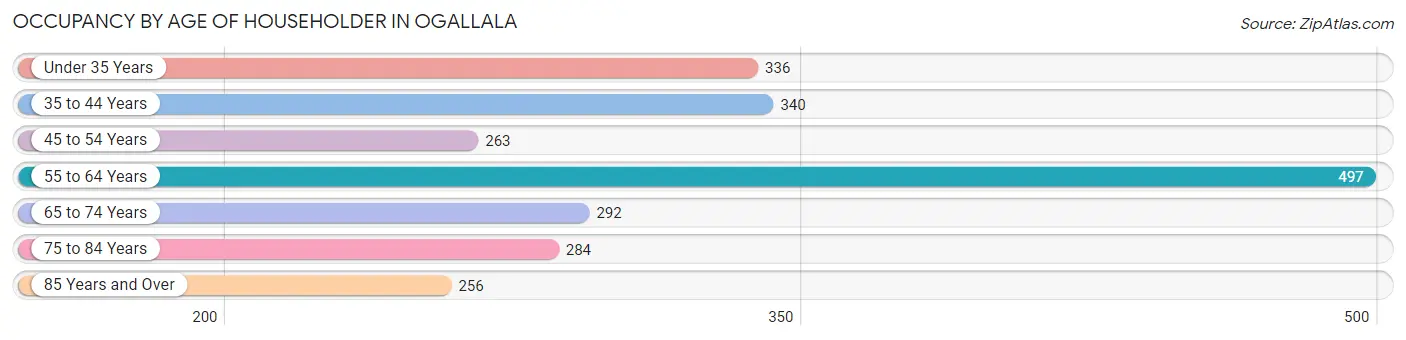
| Age Bracket | # Households | % Households |
| Under 35 Years | 336 | 14.8% |
| 35 to 44 Years | 340 | 15.0% |
| 45 to 54 Years | 263 | 11.6% |
| 55 to 64 Years | 497 | 21.9% |
| 65 to 74 Years | 292 | 12.9% |
| 75 to 84 Years | 284 | 12.5% |
| 85 Years and Over | 256 | 11.3% |
| Total | 2,268 | 100.0% |
Housing Finances in Ogallala
Median Income by Occupancy in Ogallala
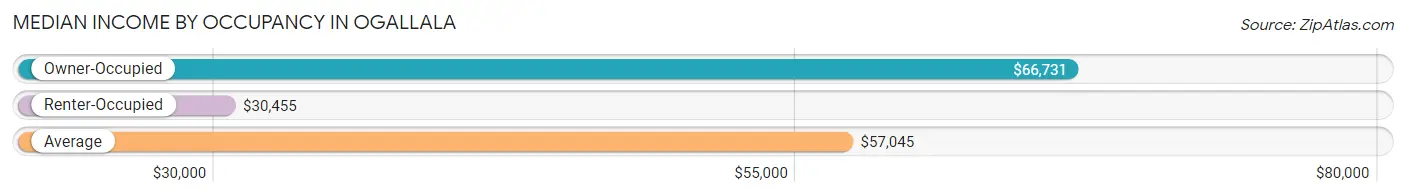
| Occupancy Type | # Households | Median Income |
| Owner-Occupied | 1,564 (69.0%) | $66,731 |
| Renter-Occupied | 704 (31.0%) | $30,455 |
| Average | 2,268 (100.0%) | $57,045 |
Occupancy by Householder Income Bracket in Ogallala
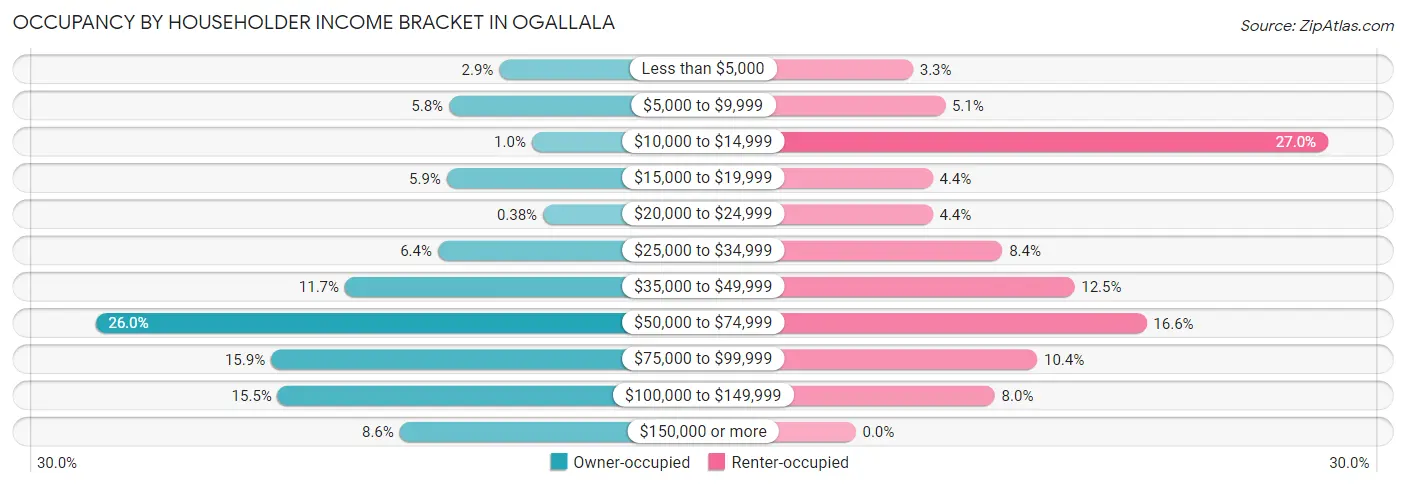
| Income Bracket | Owner-occupied | Renter-occupied |
| Less than $5,000 | 45 (2.9%) | 23 (3.3%) |
| $5,000 to $9,999 | 90 (5.8%) | 36 (5.1%) |
| $10,000 to $14,999 | 16 (1.0%) | 190 (27.0%) |
| $15,000 to $19,999 | 92 (5.9%) | 31 (4.4%) |
| $20,000 to $24,999 | 6 (0.4%) | 31 (4.4%) |
| $25,000 to $34,999 | 100 (6.4%) | 59 (8.4%) |
| $35,000 to $49,999 | 183 (11.7%) | 88 (12.5%) |
| $50,000 to $74,999 | 406 (26.0%) | 117 (16.6%) |
| $75,000 to $99,999 | 249 (15.9%) | 73 (10.4%) |
| $100,000 to $149,999 | 243 (15.5%) | 56 (8.0%) |
| $150,000 or more | 134 (8.6%) | 0 (0.0%) |
| Total | 1,564 (100.0%) | 704 (100.0%) |
Monthly Housing Cost Tiers in Ogallala
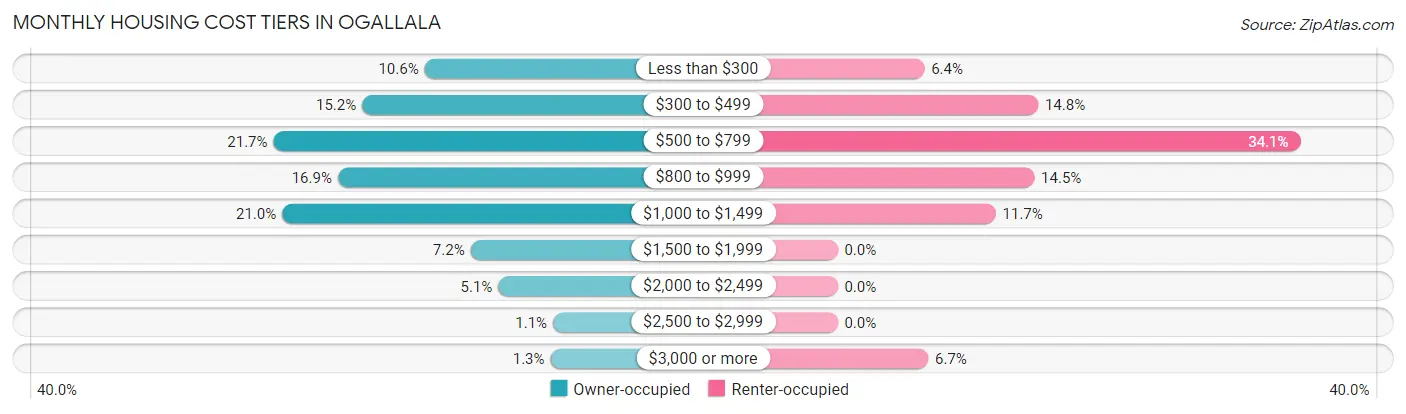
| Monthly Cost | Owner-occupied | Renter-occupied |
| Less than $300 | 165 (10.5%) | 45 (6.4%) |
| $300 to $499 | 237 (15.1%) | 104 (14.8%) |
| $500 to $799 | 339 (21.7%) | 240 (34.1%) |
| $800 to $999 | 265 (16.9%) | 102 (14.5%) |
| $1,000 to $1,499 | 329 (21.0%) | 82 (11.7%) |
| $1,500 to $1,999 | 112 (7.2%) | 0 (0.0%) |
| $2,000 to $2,499 | 80 (5.1%) | 0 (0.0%) |
| $2,500 to $2,999 | 17 (1.1%) | 0 (0.0%) |
| $3,000 or more | 20 (1.3%) | 47 (6.7%) |
| Total | 1,564 (100.0%) | 704 (100.0%) |
Physical Housing Characteristics in Ogallala
Housing Structures in Ogallala
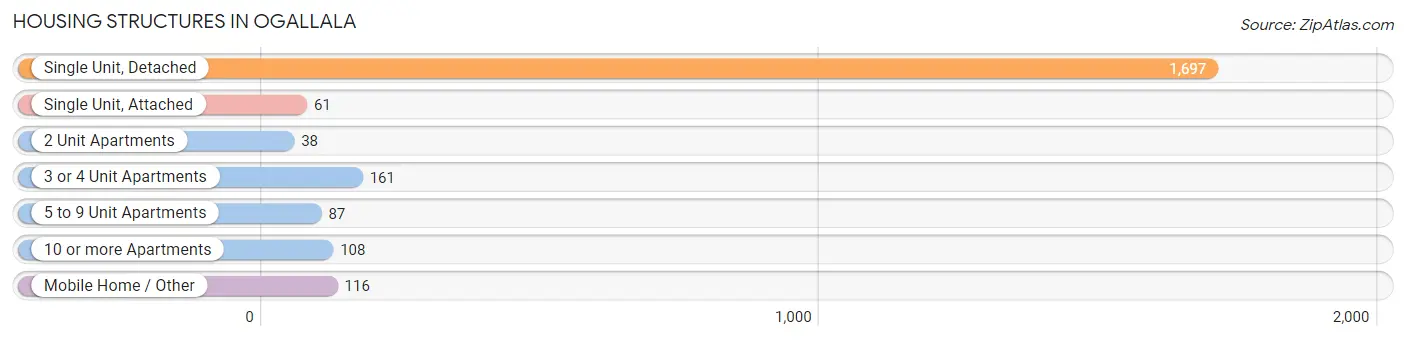
| Structure Type | # Housing Units | % Housing Units |
| Single Unit, Detached | 1,697 | 74.8% |
| Single Unit, Attached | 61 | 2.7% |
| 2 Unit Apartments | 38 | 1.7% |
| 3 or 4 Unit Apartments | 161 | 7.1% |
| 5 to 9 Unit Apartments | 87 | 3.8% |
| 10 or more Apartments | 108 | 4.8% |
| Mobile Home / Other | 116 | 5.1% |
| Total | 2,268 | 100.0% |
Housing Structures by Occupancy in Ogallala
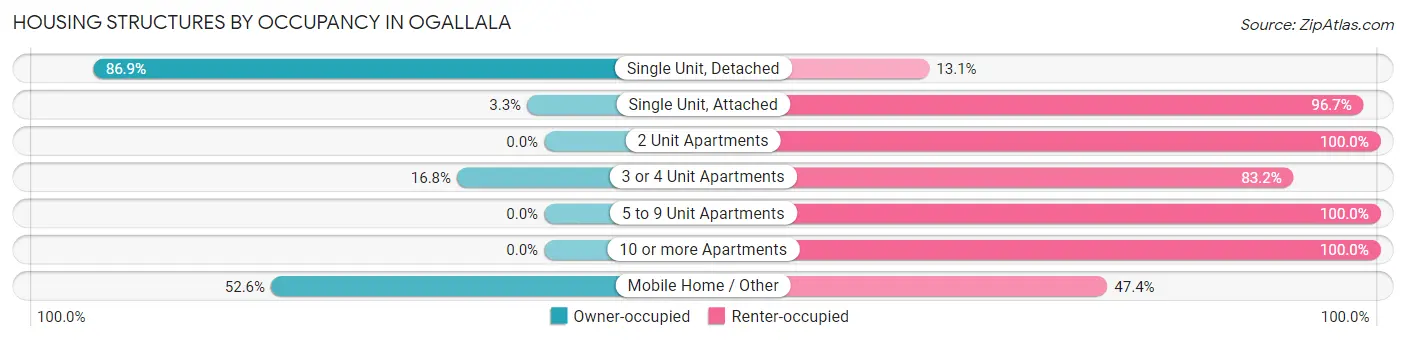
| Structure Type | Owner-occupied | Renter-occupied |
| Single Unit, Detached | 1,474 (86.9%) | 223 (13.1%) |
| Single Unit, Attached | 2 (3.3%) | 59 (96.7%) |
| 2 Unit Apartments | 0 (0.0%) | 38 (100.0%) |
| 3 or 4 Unit Apartments | 27 (16.8%) | 134 (83.2%) |
| 5 to 9 Unit Apartments | 0 (0.0%) | 87 (100.0%) |
| 10 or more Apartments | 0 (0.0%) | 108 (100.0%) |
| Mobile Home / Other | 61 (52.6%) | 55 (47.4%) |
| Total | 1,564 (69.0%) | 704 (31.0%) |
Housing Structures by Number of Rooms in Ogallala
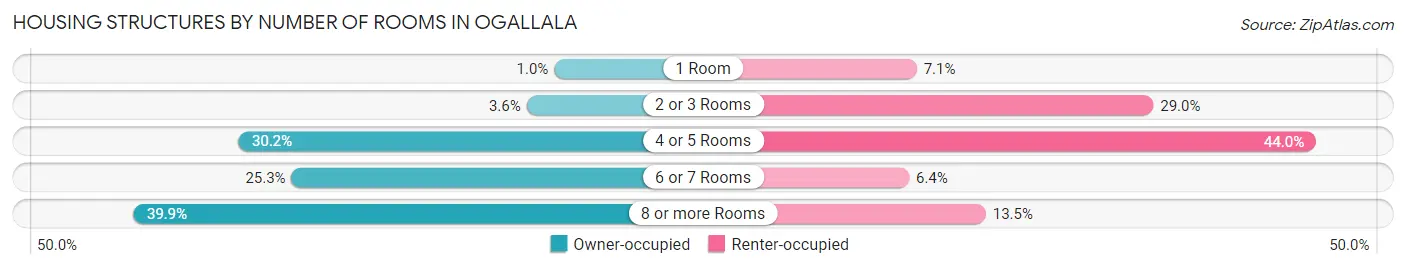
| Number of Rooms | Owner-occupied | Renter-occupied |
| 1 Room | 16 (1.0%) | 50 (7.1%) |
| 2 or 3 Rooms | 56 (3.6%) | 204 (29.0%) |
| 4 or 5 Rooms | 472 (30.2%) | 310 (44.0%) |
| 6 or 7 Rooms | 396 (25.3%) | 45 (6.4%) |
| 8 or more Rooms | 624 (39.9%) | 95 (13.5%) |
| Total | 1,564 (100.0%) | 704 (100.0%) |
Housing Structure by Heating Type in Ogallala
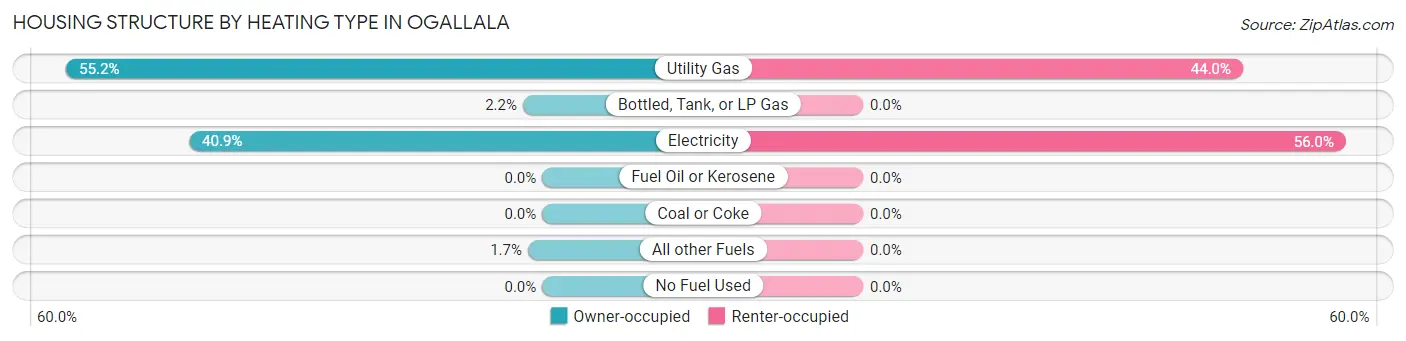
| Heating Type | Owner-occupied | Renter-occupied |
| Utility Gas | 863 (55.2%) | 310 (44.0%) |
| Bottled, Tank, or LP Gas | 35 (2.2%) | 0 (0.0%) |
| Electricity | 640 (40.9%) | 394 (56.0%) |
| Fuel Oil or Kerosene | 0 (0.0%) | 0 (0.0%) |
| Coal or Coke | 0 (0.0%) | 0 (0.0%) |
| All other Fuels | 26 (1.7%) | 0 (0.0%) |
| No Fuel Used | 0 (0.0%) | 0 (0.0%) |
| Total | 1,564 (100.0%) | 704 (100.0%) |
Household Vehicle Usage in Ogallala
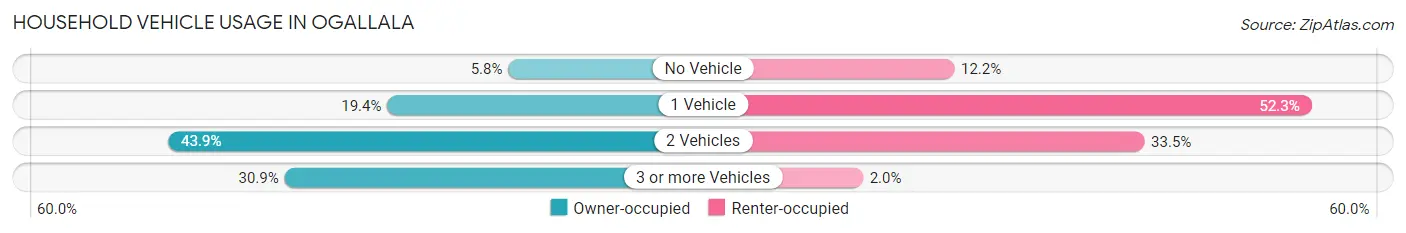
| Vehicles per Household | Owner-occupied | Renter-occupied |
| No Vehicle | 91 (5.8%) | 86 (12.2%) |
| 1 Vehicle | 303 (19.4%) | 368 (52.3%) |
| 2 Vehicles | 687 (43.9%) | 236 (33.5%) |
| 3 or more Vehicles | 483 (30.9%) | 14 (2.0%) |
| Total | 1,564 (100.0%) | 704 (100.0%) |
Real Estate & Mortgages in Ogallala
Real Estate and Mortgage Overview in Ogallala
| Characteristic | Without Mortgage | With Mortgage |
| Housing Units | 787 | 777 |
| Median Property Value | $111,300 | $150,100 |
| Median Household Income | $53,558 | $79 |
| Monthly Housing Costs | $494 | $20 |
| Real Estate Taxes | $2,117 | $0 |
Property Value by Mortgage Status in Ogallala
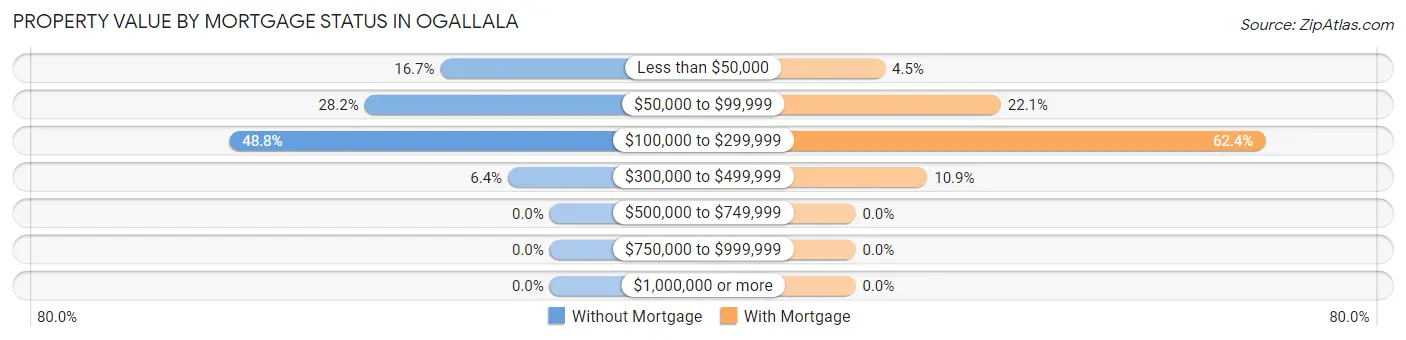
| Property Value | Without Mortgage | With Mortgage |
| Less than $50,000 | 131 (16.7%) | 35 (4.5%) |
| $50,000 to $99,999 | 222 (28.2%) | 172 (22.1%) |
| $100,000 to $299,999 | 384 (48.8%) | 485 (62.4%) |
| $300,000 to $499,999 | 50 (6.4%) | 85 (10.9%) |
| $500,000 to $749,999 | 0 (0.0%) | 0 (0.0%) |
| $750,000 to $999,999 | 0 (0.0%) | 0 (0.0%) |
| $1,000,000 or more | 0 (0.0%) | 0 (0.0%) |
| Total | 787 (100.0%) | 777 (100.0%) |
Household Income by Mortgage Status in Ogallala
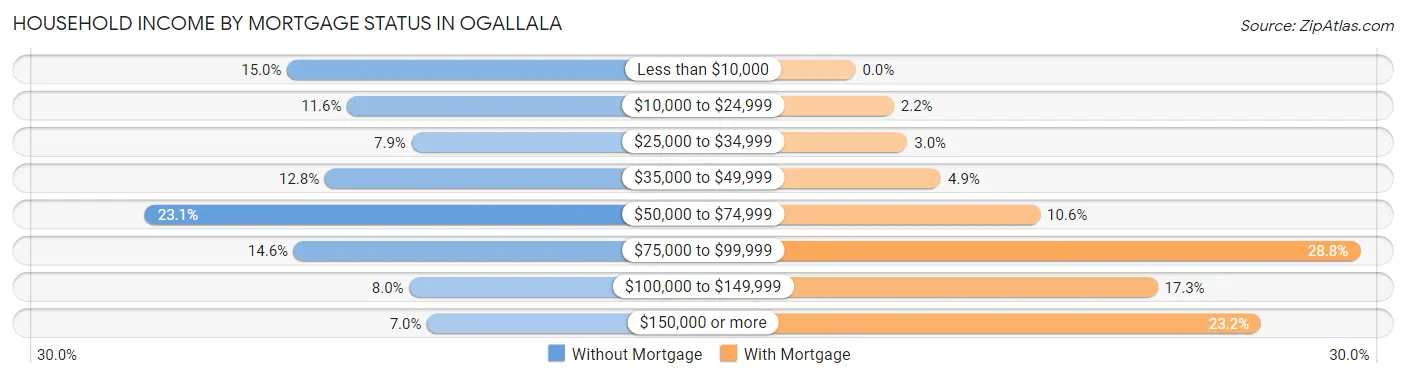
| Household Income | Without Mortgage | With Mortgage |
| Less than $10,000 | 118 (15.0%) | 0 (0.0%) |
| $10,000 to $24,999 | 91 (11.6%) | 17 (2.2%) |
| $25,000 to $34,999 | 62 (7.9%) | 23 (3.0%) |
| $35,000 to $49,999 | 101 (12.8%) | 38 (4.9%) |
| $50,000 to $74,999 | 182 (23.1%) | 82 (10.5%) |
| $75,000 to $99,999 | 115 (14.6%) | 224 (28.8%) |
| $100,000 to $149,999 | 63 (8.0%) | 134 (17.2%) |
| $150,000 or more | 55 (7.0%) | 180 (23.2%) |
| Total | 787 (100.0%) | 777 (100.0%) |
Property Value to Household Income Ratio in Ogallala
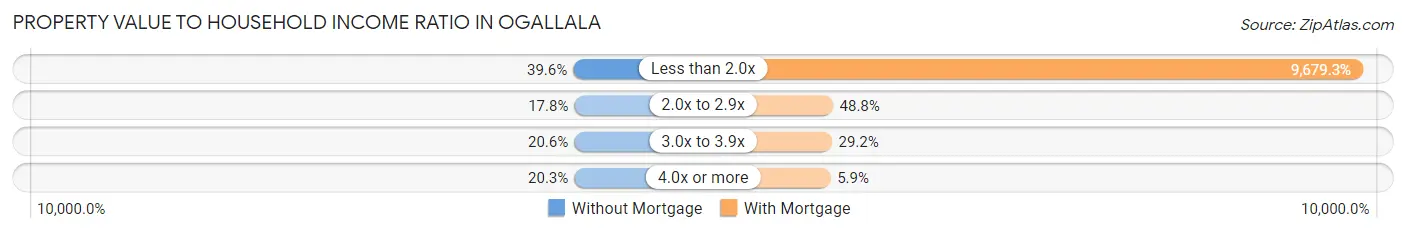
| Value-to-Income Ratio | Without Mortgage | With Mortgage |
| Less than 2.0x | 312 (39.6%) | 75,208 (9,679.3%) |
| 2.0x to 2.9x | 140 (17.8%) | 379 (48.8%) |
| 3.0x to 3.9x | 162 (20.6%) | 227 (29.2%) |
| 4.0x or more | 160 (20.3%) | 46 (5.9%) |
| Total | 787 (100.0%) | 777 (100.0%) |
Real Estate Taxes by Mortgage Status in Ogallala
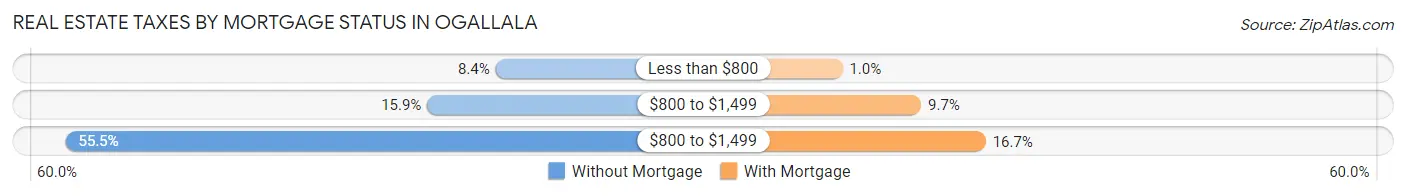
| Property Taxes | Without Mortgage | With Mortgage |
| Less than $800 | 66 (8.4%) | 8 (1.0%) |
| $800 to $1,499 | 125 (15.9%) | 75 (9.7%) |
| $800 to $1,499 | 437 (55.5%) | 130 (16.7%) |
| Total | 787 (100.0%) | 777 (100.0%) |
Health & Disability in Ogallala
Health Insurance Coverage by Age in Ogallala
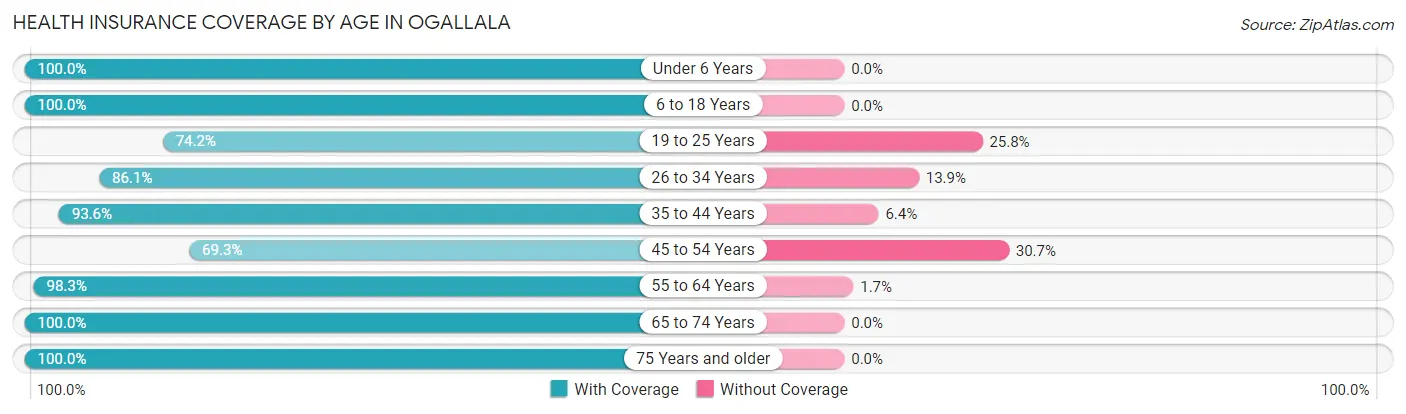
| Age Bracket | With Coverage | Without Coverage |
| Under 6 Years | 305 (100.0%) | 0 (0.0%) |
| 6 to 18 Years | 797 (100.0%) | 0 (0.0%) |
| 19 to 25 Years | 196 (74.2%) | 68 (25.8%) |
| 26 to 34 Years | 403 (86.1%) | 65 (13.9%) |
| 35 to 44 Years | 484 (93.6%) | 33 (6.4%) |
| 45 to 54 Years | 375 (69.3%) | 166 (30.7%) |
| 55 to 64 Years | 701 (98.3%) | 12 (1.7%) |
| 65 to 74 Years | 533 (100.0%) | 0 (0.0%) |
| 75 Years and older | 628 (100.0%) | 0 (0.0%) |
| Total | 4,422 (92.8%) | 344 (7.2%) |
Health Insurance Coverage by Citizenship Status in Ogallala
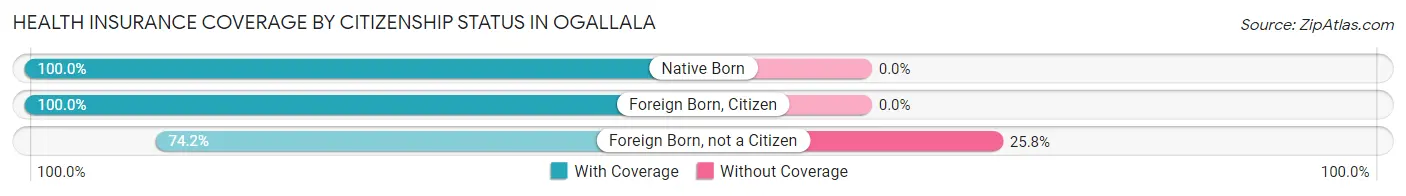
| Citizenship Status | With Coverage | Without Coverage |
| Native Born | 305 (100.0%) | 0 (0.0%) |
| Foreign Born, Citizen | 797 (100.0%) | 0 (0.0%) |
| Foreign Born, not a Citizen | 196 (74.2%) | 68 (25.8%) |
Health Insurance Coverage by Household Income in Ogallala
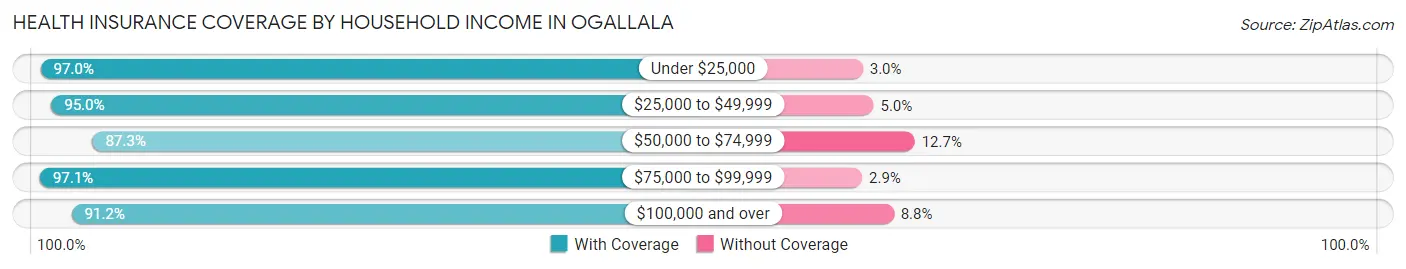
| Household Income | With Coverage | Without Coverage |
| Under $25,000 | 648 (97.0%) | 20 (3.0%) |
| $25,000 to $49,999 | 721 (95.0%) | 38 (5.0%) |
| $50,000 to $74,999 | 980 (87.3%) | 143 (12.7%) |
| $75,000 to $99,999 | 847 (97.1%) | 25 (2.9%) |
| $100,000 and over | 1,225 (91.2%) | 118 (8.8%) |
Public vs Private Health Insurance Coverage by Age in Ogallala
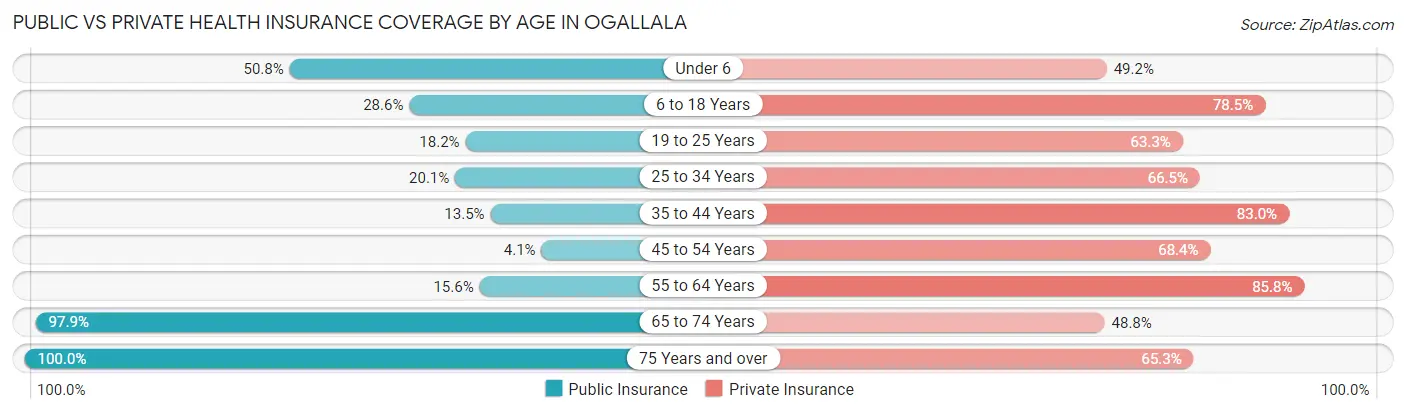
| Age Bracket | Public Insurance | Private Insurance |
| Under 6 | 155 (50.8%) | 150 (49.2%) |
| 6 to 18 Years | 228 (28.6%) | 626 (78.5%) |
| 19 to 25 Years | 48 (18.2%) | 167 (63.3%) |
| 25 to 34 Years | 94 (20.1%) | 311 (66.4%) |
| 35 to 44 Years | 70 (13.5%) | 429 (83.0%) |
| 45 to 54 Years | 22 (4.1%) | 370 (68.4%) |
| 55 to 64 Years | 111 (15.6%) | 612 (85.8%) |
| 65 to 74 Years | 522 (97.9%) | 260 (48.8%) |
| 75 Years and over | 628 (100.0%) | 410 (65.3%) |
| Total | 1,878 (39.4%) | 3,335 (70.0%) |
Disability Status by Sex by Age in Ogallala
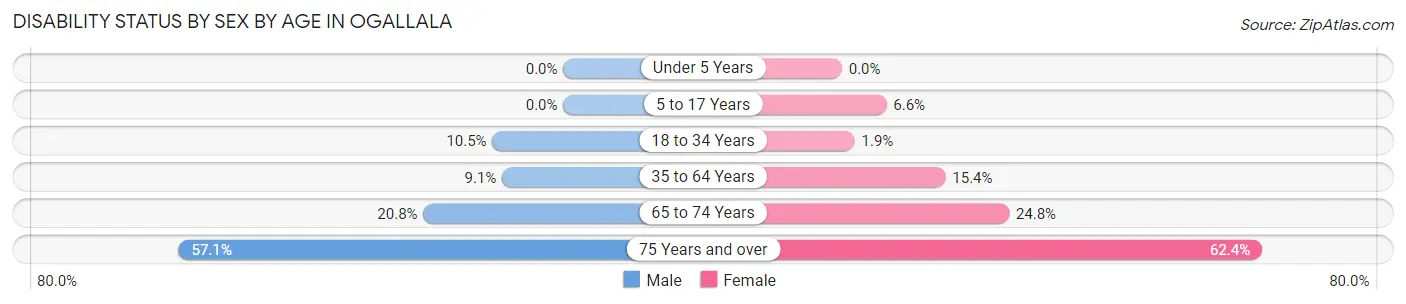
| Age Bracket | Male | Female |
| Under 5 Years | 0 (0.0%) | 0 (0.0%) |
| 5 to 17 Years | 0 (0.0%) | 26 (6.6%) |
| 18 to 34 Years | 38 (10.5%) | 8 (1.9%) |
| 35 to 64 Years | 87 (9.1%) | 125 (15.4%) |
| 65 to 74 Years | 53 (20.8%) | 69 (24.8%) |
| 75 Years and over | 140 (57.1%) | 239 (62.4%) |
Disability Class by Sex by Age in Ogallala
Disability Class: Hearing Difficulty
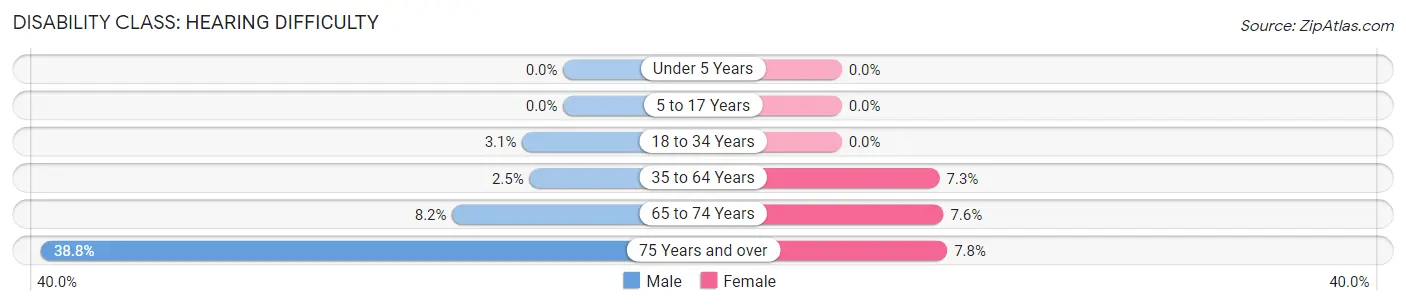
| Age Bracket | Male | Female |
| Under 5 Years | 0 (0.0%) | 0 (0.0%) |
| 5 to 17 Years | 0 (0.0%) | 0 (0.0%) |
| 18 to 34 Years | 11 (3.0%) | 0 (0.0%) |
| 35 to 64 Years | 24 (2.5%) | 59 (7.3%) |
| 65 to 74 Years | 21 (8.2%) | 21 (7.5%) |
| 75 Years and over | 95 (38.8%) | 30 (7.8%) |
Disability Class: Vision Difficulty
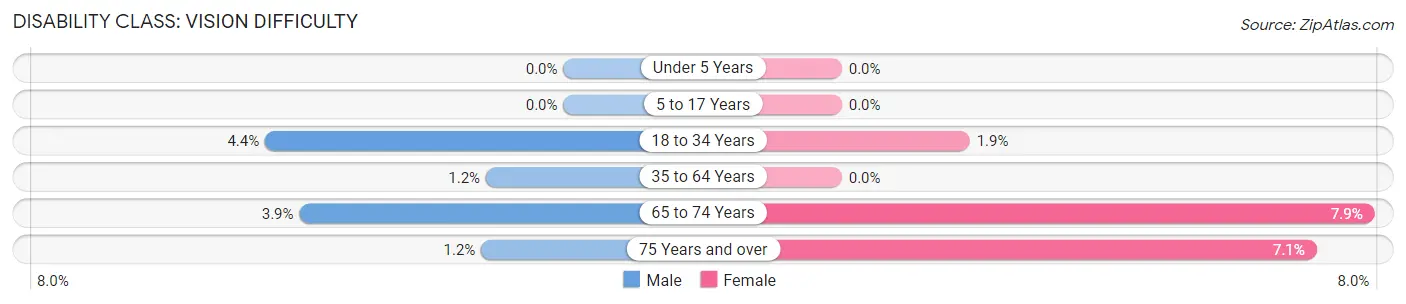
| Age Bracket | Male | Female |
| Under 5 Years | 0 (0.0%) | 0 (0.0%) |
| 5 to 17 Years | 0 (0.0%) | 0 (0.0%) |
| 18 to 34 Years | 16 (4.4%) | 8 (1.9%) |
| 35 to 64 Years | 11 (1.1%) | 0 (0.0%) |
| 65 to 74 Years | 10 (3.9%) | 22 (7.9%) |
| 75 Years and over | 3 (1.2%) | 27 (7.0%) |
Disability Class: Cognitive Difficulty
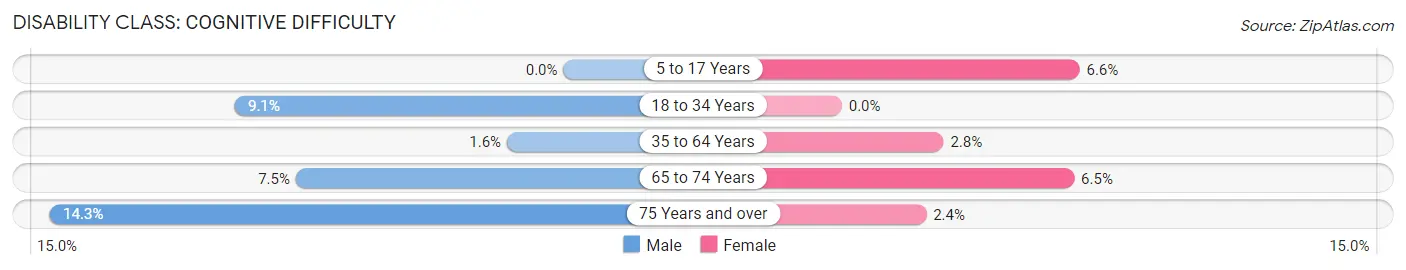
| Age Bracket | Male | Female |
| 5 to 17 Years | 0 (0.0%) | 26 (6.6%) |
| 18 to 34 Years | 33 (9.1%) | 0 (0.0%) |
| 35 to 64 Years | 15 (1.6%) | 23 (2.8%) |
| 65 to 74 Years | 19 (7.4%) | 18 (6.5%) |
| 75 Years and over | 35 (14.3%) | 9 (2.4%) |
Disability Class: Ambulatory Difficulty
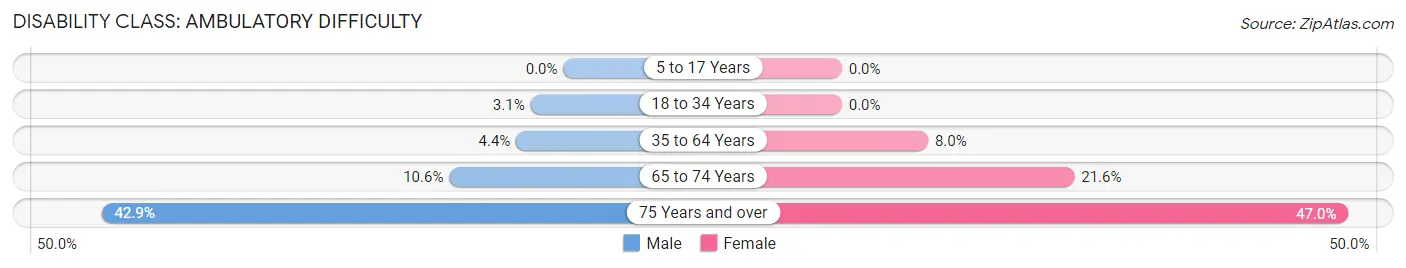
| Age Bracket | Male | Female |
| 5 to 17 Years | 0 (0.0%) | 0 (0.0%) |
| 18 to 34 Years | 11 (3.0%) | 0 (0.0%) |
| 35 to 64 Years | 42 (4.4%) | 65 (8.0%) |
| 65 to 74 Years | 27 (10.6%) | 60 (21.6%) |
| 75 Years and over | 105 (42.9%) | 180 (47.0%) |
Disability Class: Self-Care Difficulty
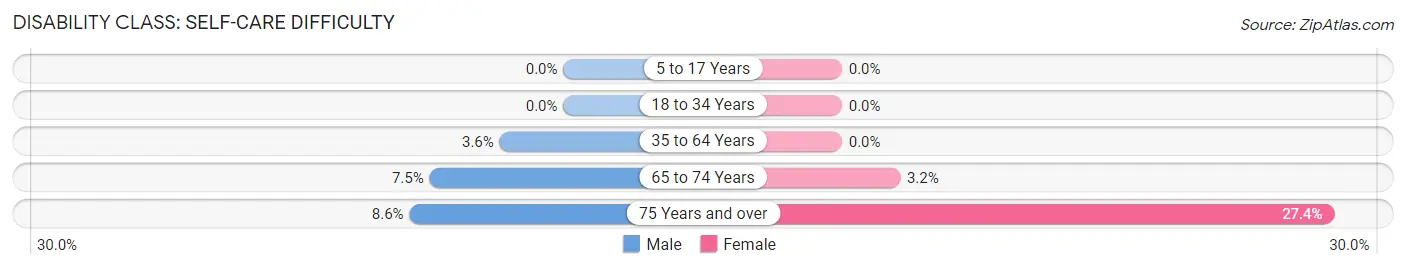
| Age Bracket | Male | Female |
| 5 to 17 Years | 0 (0.0%) | 0 (0.0%) |
| 18 to 34 Years | 0 (0.0%) | 0 (0.0%) |
| 35 to 64 Years | 34 (3.5%) | 0 (0.0%) |
| 65 to 74 Years | 19 (7.4%) | 9 (3.2%) |
| 75 Years and over | 21 (8.6%) | 105 (27.4%) |
Technology Access in Ogallala
Computing Device Access in Ogallala
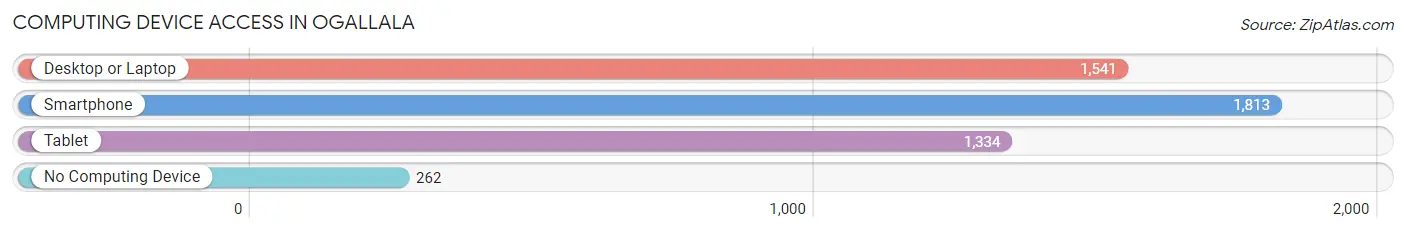
| Device Type | # Households | % Households |
| Desktop or Laptop | 1,541 | 67.9% |
| Smartphone | 1,813 | 79.9% |
| Tablet | 1,334 | 58.8% |
| No Computing Device | 262 | 11.6% |
| Total | 2,268 | 100.0% |
Internet Access in Ogallala
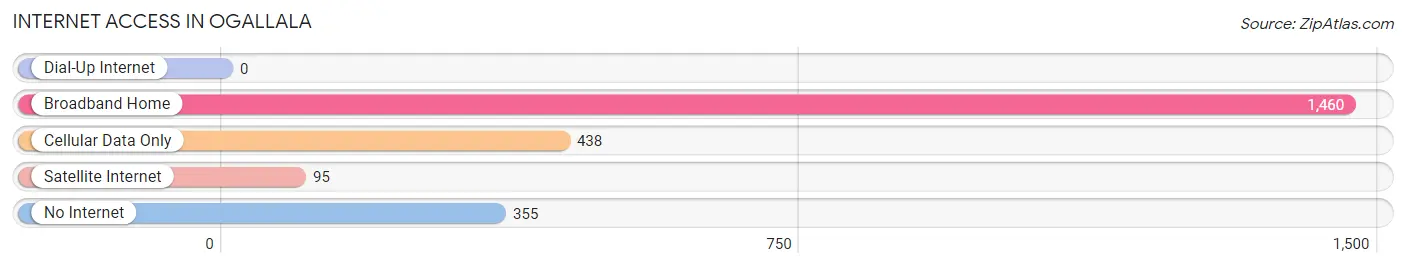
| Internet Type | # Households | % Households |
| Dial-Up Internet | 0 | 0.0% |
| Broadband Home | 1,460 | 64.4% |
| Cellular Data Only | 438 | 19.3% |
| Satellite Internet | 95 | 4.2% |
| No Internet | 355 | 15.7% |
| Total | 2,268 | 100.0% |
Ogallala Summary
Ogallala, Nebraska is a small city located in Keith County in the western part of the state. It is situated on the banks of the North Platte River and is the county seat of Keith County. The city has a population of 4,737 as of the 2010 census and is part of the North Platte Micropolitan Statistical Area.
History
Ogallala was founded in 1875 by the Union Pacific Railroad. The city was named after the Oglala Sioux tribe, which had a large presence in the area. The city was originally a stop on the Union Pacific Railroad and was used as a supply point for the railroad. The city was incorporated in 1887 and has since grown to become the largest city in Keith County.
Geography
Ogallala is located in western Nebraska, in Keith County. It is situated on the banks of the North Platte River and is the county seat of Keith County. The city has a total area of 4.2 square miles, all of which is land. The city is located at an elevation of 3,845 feet above sea level.
Climate
Ogallala has a semi-arid climate, with hot summers and cold winters. The average annual temperature is 54.3°F, with an average high of 79.2°F in July and an average low of 28.7°F in January. The average annual precipitation is 17.2 inches, with the wettest month being May, with an average of 2.9 inches of precipitation.
Economy
Ogallala’s economy is largely based on agriculture and tourism. The city is home to several large agricultural operations, including cattle ranches, grain farms, and feedlots. The city is also home to several tourist attractions, including the North Platte River, Lake McConaughy, and the Ogallala Aquifer.
Demographics
As of the 2010 census, there were 4,737 people, 1,945 households, and 1,232 families residing in the city. The population density was 1,133.3 people per square mile. The racial makeup of the city was 94.2% White, 0.3% African American, 0.7% Native American, 0.4% Asian, 0.1% Pacific Islander, 2.3% from other races, and 2.0% from two or more races. Hispanic or Latino of any race were 5.3% of the population.
The median income for a household in the city was $37,917, and the median income for a family was $45,938. The per capita income for the city was $19,845. About 11.2% of families and 14.2% of the population were below the poverty line, including 19.2% of those under age 18 and 8.2% of those age 65 or over.
Ogallala is a small city with a rich history and a diverse economy. It is home to several large agricultural operations and tourist attractions, and has a population that is largely white and Hispanic. The city has a semi-arid climate and is situated on the banks of the North Platte River. The city has a median income that is slightly below the national average, and a poverty rate that is slightly above the national average.
Common Questions
What is Per Capita Income in Ogallala?
Per Capita income in Ogallala is $30,778.
What is the Median Family Income in Ogallala?
Median Family Income in Ogallala is $75,361.
What is the Median Household income in Ogallala?
Median Household Income in Ogallala is $57,045.
What is Income or Wage Gap in Ogallala?
Income or Wage Gap in Ogallala is 41.1%.
Women in Ogallala earn 58.9 cents for every dollar earned by a man.
What is Inequality or Gini Index in Ogallala?
Inequality or Gini Index in Ogallala is 0.42.
What is the Total Population of Ogallala?
Total Population of Ogallala is 4,835.
What is the Total Male Population of Ogallala?
Total Male Population of Ogallala is 2,377.
What is the Total Female Population of Ogallala?
Total Female Population of Ogallala is 2,458.
What is the Ratio of Males per 100 Females in Ogallala?
There are 96.70 Males per 100 Females in Ogallala.
What is the Ratio of Females per 100 Males in Ogallala?
There are 103.41 Females per 100 Males in Ogallala.
What is the Median Population Age in Ogallala?
Median Population Age in Ogallala is 46.6 Years.
What is the Average Family Size in Ogallala
Average Family Size in Ogallala is 2.9 People.
What is the Average Household Size in Ogallala
Average Household Size in Ogallala is 2.1 People.
How Large is the Labor Force in Ogallala?
There are 2,383 People in the Labor Forcein in Ogallala.
What is the Percentage of People in the Labor Force in Ogallala?
60.8% of People are in the Labor Force in Ogallala.
What is the Unemployment Rate in Ogallala?
Unemployment Rate in Ogallala is 3.5%.