North Loup, NE Map & Demographics
North Loup Map
North Loup Overview
$32,379
PER CAPITA INCOME
$78,438
AVG FAMILY INCOME
$46,146
AVG HOUSEHOLD INCOME
7.0%
WAGE / INCOME GAP [ % ]
93.0¢/ $1
WAGE / INCOME GAP [ $ ]
0.38
INEQUALITY / GINI INDEX
221
TOTAL POPULATION
100
MALE POPULATION
121
FEMALE POPULATION
82.64
MALES / 100 FEMALES
121.00
FEMALES / 100 MALES
56.4
MEDIAN AGE
2.5
AVG FAMILY SIZE
1.8
AVG HOUSEHOLD SIZE
118
LABOR FORCE [ PEOPLE ]
59.9%
PERCENT IN LABOR FORCE
0.8%
UNEMPLOYMENT RATE
North Loup Zip Codes
North Loup Area Codes
Income in North Loup
Income Overview in North Loup
Per Capita Income in North Loup is $32,379, while median incomes of families and households are $78,438 and $46,146 respectively.
| Characteristic | Number | Measure |
| Per Capita Income | 221 | $32,379 |
| Median Family Income | 61 | $78,438 |
| Mean Family Income | 61 | $77,616 |
| Median Household Income | 123 | $46,146 |
| Mean Household Income | 123 | $56,953 |
| Income Deficit | 61 | $0 |
| Wage / Income Gap (%) | 221 | 7.04% |
| Wage / Income Gap ($) | 221 | 92.96¢ per $1 |
| Gini / Inequality Index | 221 | 0.38 |
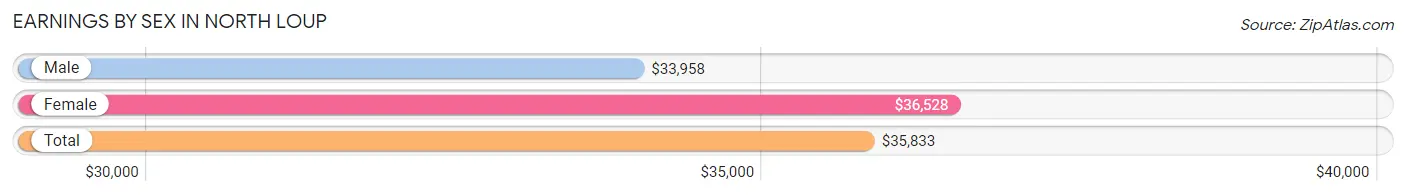
Earnings by Sex in North Loup
Average Earnings in North Loup are $35,833, $33,958 for men and $36,528 for women, a difference of 7.0%.
| Sex | Number | Average Earnings |
| Male | 61 (46.2%) | $33,958 |
| Female | 71 (53.8%) | $36,528 |
| Total | 132 (100.0%) | $35,833 |
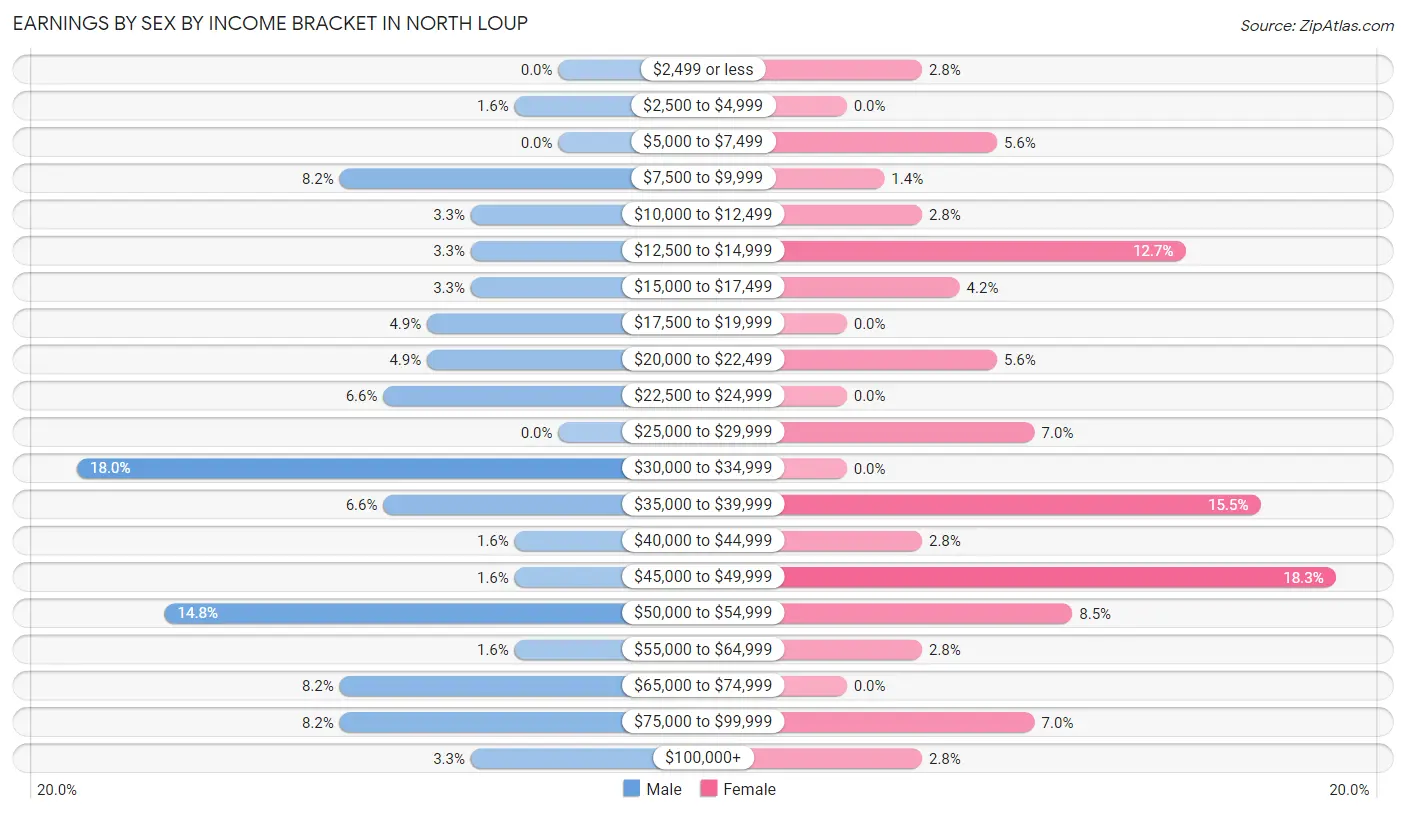
Earnings by Sex by Income Bracket in North Loup
The most common earnings brackets in North Loup are $30,000 to $34,999 for men (11 | 18.0%) and $45,000 to $49,999 for women (13 | 18.3%).
| Income | Male | Female |
| $2,499 or less | 0 (0.0%) | 2 (2.8%) |
| $2,500 to $4,999 | 1 (1.6%) | 0 (0.0%) |
| $5,000 to $7,499 | 0 (0.0%) | 4 (5.6%) |
| $7,500 to $9,999 | 5 (8.2%) | 1 (1.4%) |
| $10,000 to $12,499 | 2 (3.3%) | 2 (2.8%) |
| $12,500 to $14,999 | 2 (3.3%) | 9 (12.7%) |
| $15,000 to $17,499 | 2 (3.3%) | 3 (4.2%) |
| $17,500 to $19,999 | 3 (4.9%) | 0 (0.0%) |
| $20,000 to $22,499 | 3 (4.9%) | 4 (5.6%) |
| $22,500 to $24,999 | 4 (6.6%) | 0 (0.0%) |
| $25,000 to $29,999 | 0 (0.0%) | 5 (7.0%) |
| $30,000 to $34,999 | 11 (18.0%) | 0 (0.0%) |
| $35,000 to $39,999 | 4 (6.6%) | 11 (15.5%) |
| $40,000 to $44,999 | 1 (1.6%) | 2 (2.8%) |
| $45,000 to $49,999 | 1 (1.6%) | 13 (18.3%) |
| $50,000 to $54,999 | 9 (14.7%) | 6 (8.5%) |
| $55,000 to $64,999 | 1 (1.6%) | 2 (2.8%) |
| $65,000 to $74,999 | 5 (8.2%) | 0 (0.0%) |
| $75,000 to $99,999 | 5 (8.2%) | 5 (7.0%) |
| $100,000+ | 2 (3.3%) | 2 (2.8%) |
| Total | 61 (100.0%) | 71 (100.0%) |
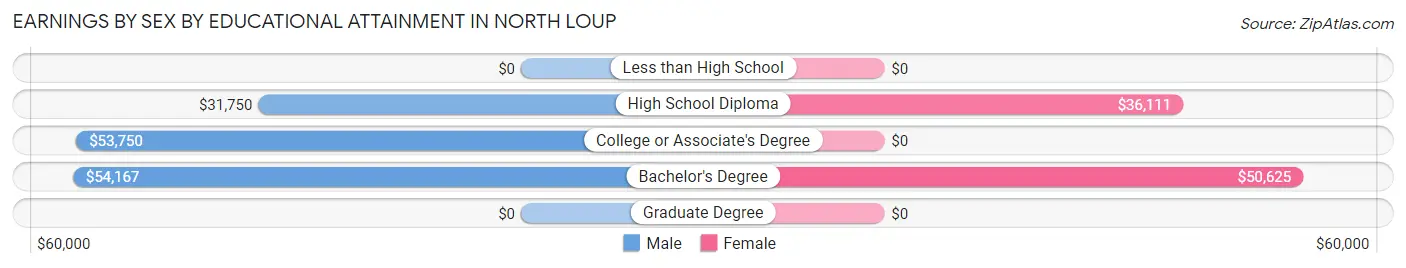
Earnings by Sex by Educational Attainment in North Loup
Average earnings in North Loup are $33,958 for men and $38,750 for women, a difference of 12.4%. Men with an educational attainment of bachelor's degree enjoy the highest average annual earnings of $54,167, while those with high school diploma education earn the least with $31,750. Women with an educational attainment of bachelor's degree earn the most with the average annual earnings of $50,625, while those with high school diploma education have the smallest earnings of $36,111.
| Educational Attainment | Male Income | Female Income |
| Less than High School | - | - |
| High School Diploma | $31,750 | $36,111 |
| College or Associate's Degree | $53,750 | $0 |
| Bachelor's Degree | $54,167 | $50,625 |
| Graduate Degree | - | - |
| Total | $33,958 | $38,750 |
Family Income in North Loup
Family Income Brackets in North Loup
According to the North Loup family income data, there are 16 families falling into the $100,000 to $149,999 income range, which is the most common income bracket and makes up 26.2% of all families.
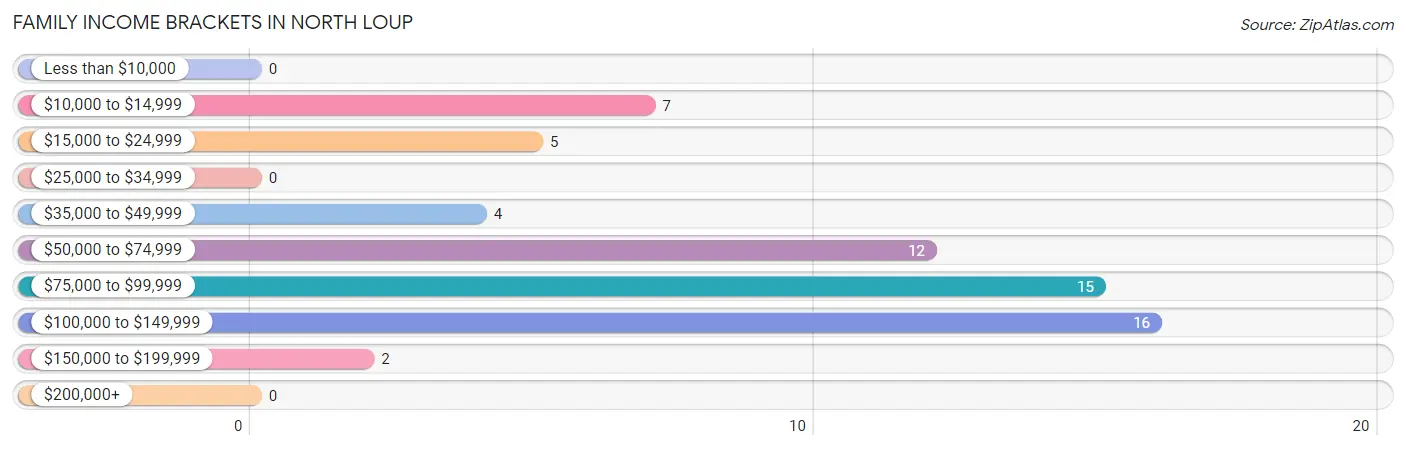
| Income Bracket | # Families | % Families |
| Less than $10,000 | 0 | 0.0% |
| $10,000 to $14,999 | 7 | 11.5% |
| $15,000 to $24,999 | 5 | 8.2% |
| $25,000 to $34,999 | 0 | 0.0% |
| $35,000 to $49,999 | 4 | 6.6% |
| $50,000 to $74,999 | 12 | 19.7% |
| $75,000 to $99,999 | 15 | 24.6% |
| $100,000 to $149,999 | 16 | 26.2% |
| $150,000 to $199,999 | 2 | 3.3% |
| $200,000+ | 0 | 0.0% |
Family Income by Famaliy Size in North Loup
3-person families (10 | 16.4%) account for the highest median family income in North Loup with $81,250 per family, while 2-person families (42 | 68.9%) have the highest median income of $28,542 per family member.
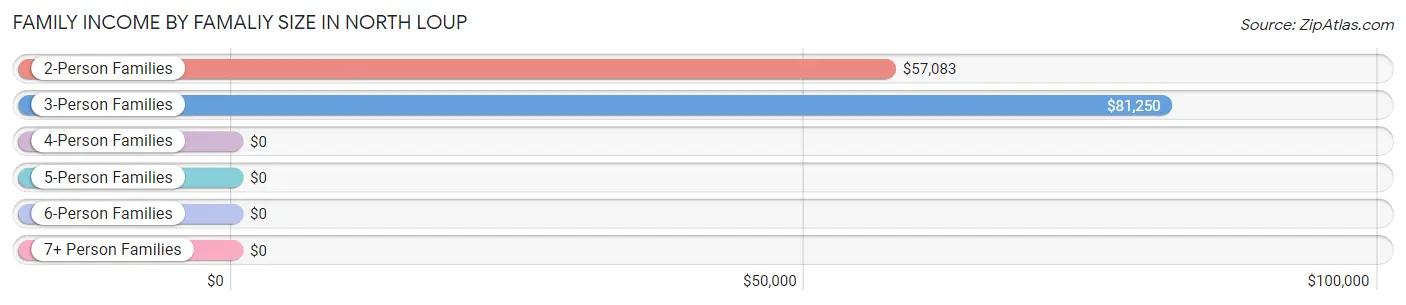
| Income Bracket | # Families | Median Income |
| 2-Person Families | 42 (68.9%) | $57,083 |
| 3-Person Families | 10 (16.4%) | $81,250 |
| 4-Person Families | 6 (9.8%) | $0 |
| 5-Person Families | 2 (3.3%) | $0 |
| 6-Person Families | 1 (1.6%) | $0 |
| 7+ Person Families | 0 (0.0%) | $0 |
| Total | 61 (100.0%) | $78,438 |
Family Income by Number of Earners in North Loup
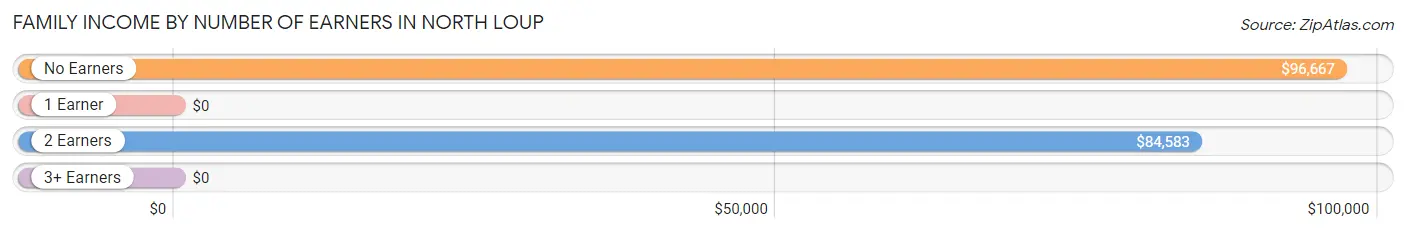
| Number of Earners | # Families | Median Income |
| No Earners | 4 (6.6%) | $96,667 |
| 1 Earner | 25 (41.0%) | $0 |
| 2 Earners | 31 (50.8%) | $84,583 |
| 3+ Earners | 1 (1.6%) | $0 |
| Total | 61 (100.0%) | $78,438 |
Household Income in North Loup
Household Income Brackets in North Loup
With 35 households falling in the category, the $35,000 to $49,999 income range is the most frequent in North Loup, accounting for 28.5% of all households.
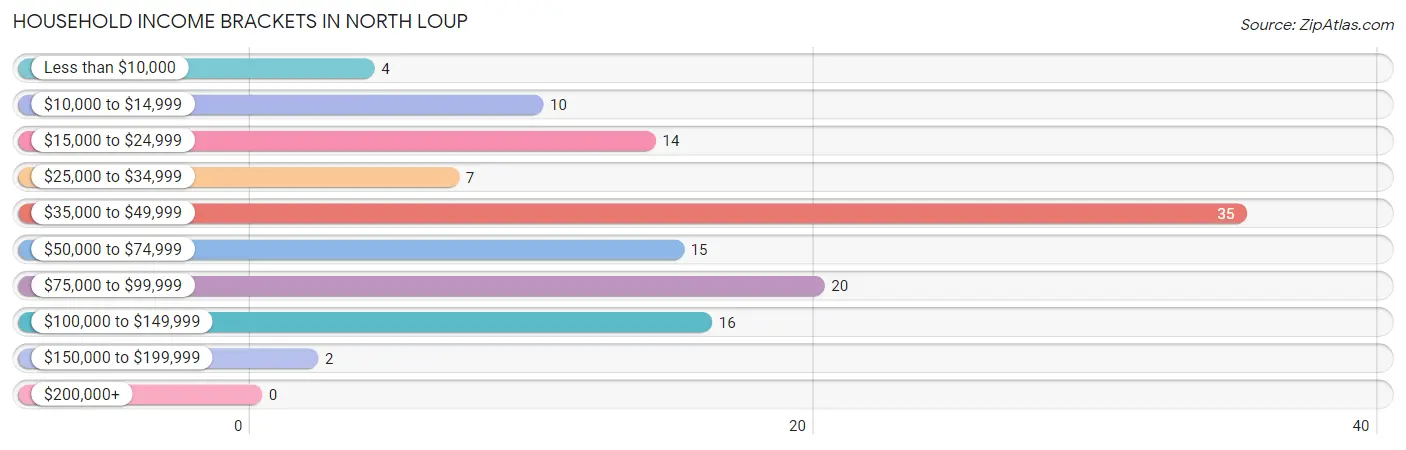
| Income Bracket | # Households | % Households |
| Less than $10,000 | 4 | 3.3% |
| $10,000 to $14,999 | 10 | 8.1% |
| $15,000 to $24,999 | 14 | 11.4% |
| $25,000 to $34,999 | 7 | 5.7% |
| $35,000 to $49,999 | 35 | 28.5% |
| $50,000 to $74,999 | 15 | 12.2% |
| $75,000 to $99,999 | 20 | 16.3% |
| $100,000 to $149,999 | 16 | 13.0% |
| $150,000 to $199,999 | 2 | 1.6% |
| $200,000+ | 0 | 0.0% |
Household Income by Householder Age in North Loup
The median household income in North Loup is $46,146, with the highest median household income of $71,250 found in the 25 to 44 years age bracket for the primary householder. A total of 22 households (17.9%) fall into this category. Meanwhile, the 15 to 24 years age bracket for the primary householder has the lowest median household income of $0, with 7 households (5.7%) in this group.
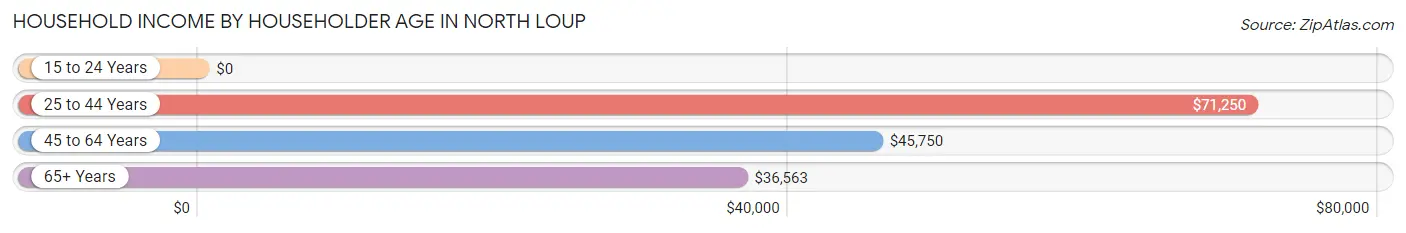
| Income Bracket | # Households | Median Income |
| 15 to 24 Years | 7 (5.7%) | $0 |
| 25 to 44 Years | 22 (17.9%) | $71,250 |
| 45 to 64 Years | 39 (31.7%) | $45,750 |
| 65+ Years | 55 (44.7%) | $36,563 |
| Total | 123 (100.0%) | $46,146 |
Poverty in North Loup
Income Below Poverty by Sex and Age in North Loup
With 7.0% poverty level for males and 16.5% for females among the residents of North Loup, 75 year old and over males and 18 to 24 year old females are the most vulnerable to poverty, with 6 males (33.3%) and 7 females (77.8%) in their respective age groups living below the poverty level.
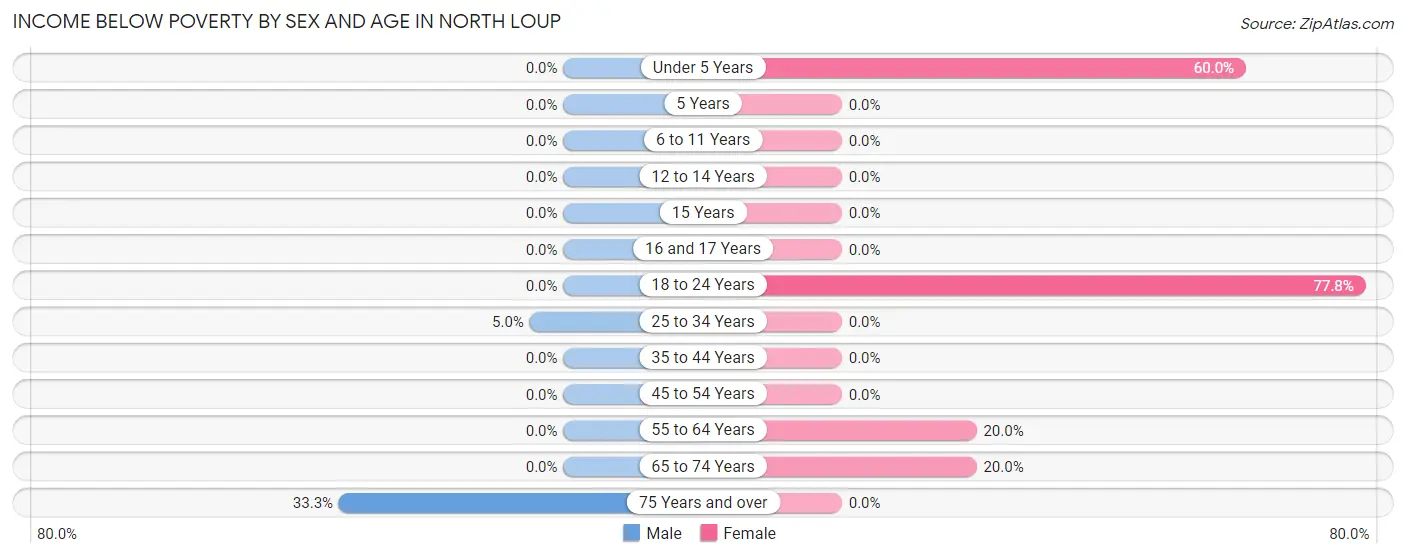
| Age Bracket | Male | Female |
| Under 5 Years | 0 (0.0%) | 3 (60.0%) |
| 5 Years | 0 (0.0%) | 0 (0.0%) |
| 6 to 11 Years | 0 (0.0%) | 0 (0.0%) |
| 12 to 14 Years | 0 (0.0%) | 0 (0.0%) |
| 15 Years | 0 (0.0%) | 0 (0.0%) |
| 16 and 17 Years | 0 (0.0%) | 0 (0.0%) |
| 18 to 24 Years | 0 (0.0%) | 7 (77.8%) |
| 25 to 34 Years | 1 (5.0%) | 0 (0.0%) |
| 35 to 44 Years | 0 (0.0%) | 0 (0.0%) |
| 45 to 54 Years | 0 (0.0%) | 0 (0.0%) |
| 55 to 64 Years | 0 (0.0%) | 6 (20.0%) |
| 65 to 74 Years | 0 (0.0%) | 4 (20.0%) |
| 75 Years and over | 6 (33.3%) | 0 (0.0%) |
| Total | 7 (7.0%) | 20 (16.5%) |
Income Above Poverty by Sex and Age in North Loup
According to the poverty statistics in North Loup, males aged under 5 years and females aged 5 years are the age groups that are most secure financially, with 100.0% of males and 100.0% of females in these age groups living above the poverty line.
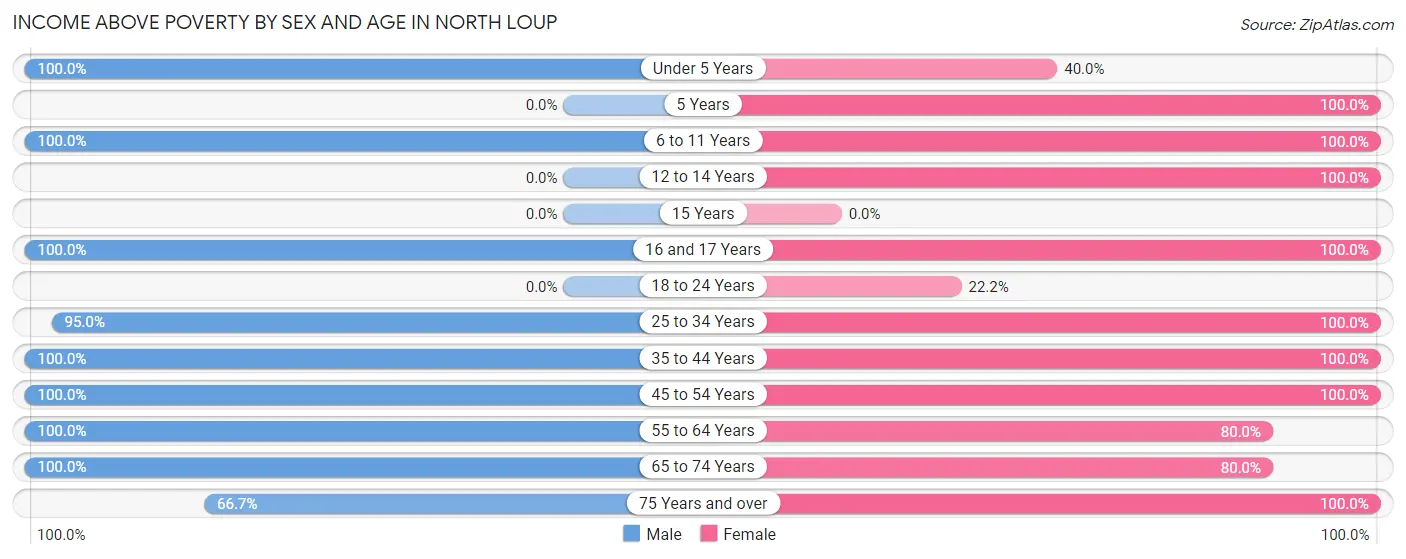
| Age Bracket | Male | Female |
| Under 5 Years | 11 (100.0%) | 2 (40.0%) |
| 5 Years | 0 (0.0%) | 1 (100.0%) |
| 6 to 11 Years | 5 (100.0%) | 1 (100.0%) |
| 12 to 14 Years | 0 (0.0%) | 1 (100.0%) |
| 15 Years | 0 (0.0%) | 0 (0.0%) |
| 16 and 17 Years | 1 (100.0%) | 2 (100.0%) |
| 18 to 24 Years | 0 (0.0%) | 2 (22.2%) |
| 25 to 34 Years | 19 (95.0%) | 9 (100.0%) |
| 35 to 44 Years | 10 (100.0%) | 9 (100.0%) |
| 45 to 54 Years | 6 (100.0%) | 13 (100.0%) |
| 55 to 64 Years | 12 (100.0%) | 24 (80.0%) |
| 65 to 74 Years | 17 (100.0%) | 16 (80.0%) |
| 75 Years and over | 12 (66.7%) | 21 (100.0%) |
| Total | 93 (93.0%) | 101 (83.5%) |
Income Below Poverty Among Married-Couple Families in North Loup
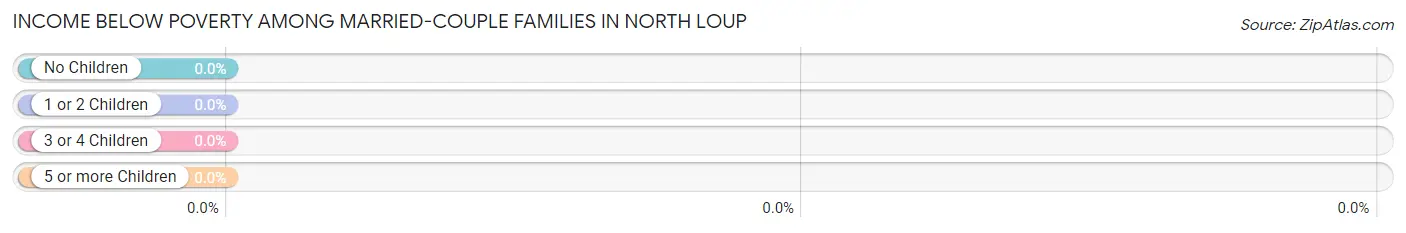
| Children | Above Poverty | Below Poverty |
| No Children | 35 (100.0%) | 0 (0.0%) |
| 1 or 2 Children | 16 (100.0%) | 0 (0.0%) |
| 3 or 4 Children | 1 (100.0%) | 0 (0.0%) |
| 5 or more Children | 0 (0.0%) | 0 (0.0%) |
| Total | 52 (100.0%) | 0 (0.0%) |
Income Below Poverty Among Single-Parent Households in North Loup
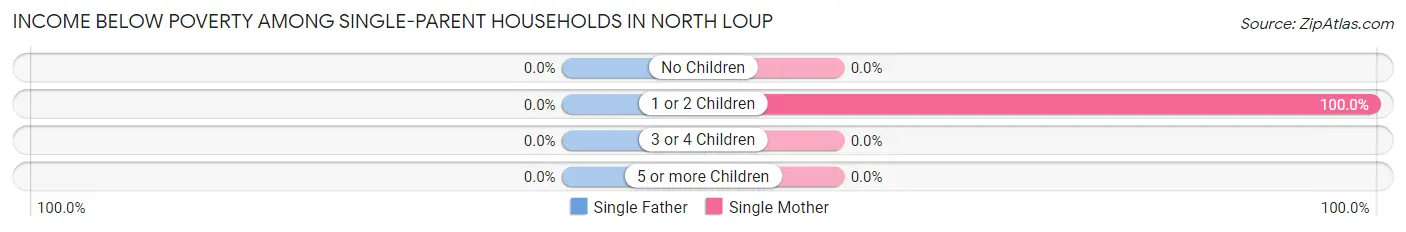
| Children | Single Father | Single Mother |
| No Children | 0 (0.0%) | 0 (0.0%) |
| 1 or 2 Children | 0 (0.0%) | 7 (100.0%) |
| 3 or 4 Children | 0 (0.0%) | 0 (0.0%) |
| 5 or more Children | 0 (0.0%) | 0 (0.0%) |
| Total | 0 (0.0%) | 7 (77.8%) |
Income Below Poverty Among Married-Couple vs Single-Parent Households in North Loup
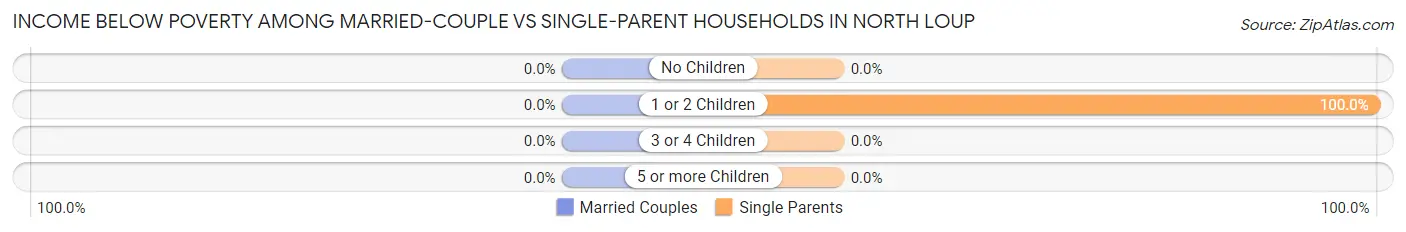
| Children | Married-Couple Families | Single-Parent Households |
| No Children | 0 (0.0%) | 0 (0.0%) |
| 1 or 2 Children | 0 (0.0%) | 7 (100.0%) |
| 3 or 4 Children | 0 (0.0%) | 0 (0.0%) |
| 5 or more Children | 0 (0.0%) | 0 (0.0%) |
| Total | 0 (0.0%) | 7 (77.8%) |
Race in North Loup
The most populous races in North Loup are White / Caucasian (205 | 92.8%), Hispanic or Latino (8 | 3.6%), and Some other Race (8 | 3.6%).
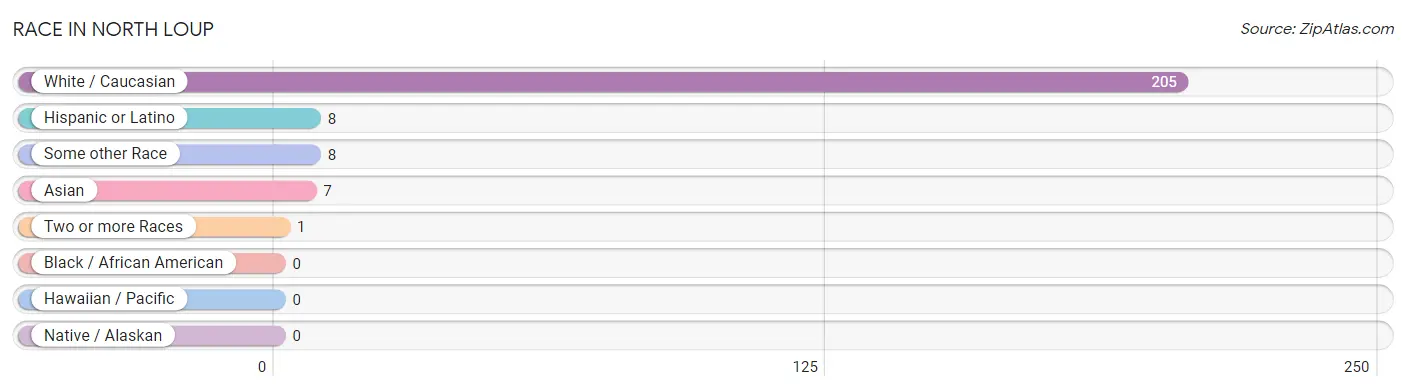
| Race | # Population | % Population |
| Asian | 7 | 3.2% |
| Black / African American | 0 | 0.0% |
| Hawaiian / Pacific | 0 | 0.0% |
| Hispanic or Latino | 8 | 3.6% |
| Native / Alaskan | 0 | 0.0% |
| White / Caucasian | 205 | 92.8% |
| Two or more Races | 1 | 0.4% |
| Some other Race | 8 | 3.6% |
| Total | 221 | 100.0% |
Ancestry in North Loup
The most populous ancestries reported in North Loup are German (93 | 42.1%), English (28 | 12.7%), Irish (25 | 11.3%), Danish (20 | 9.0%), and Czech (19 | 8.6%), together accounting for 83.7% of all North Loup residents.
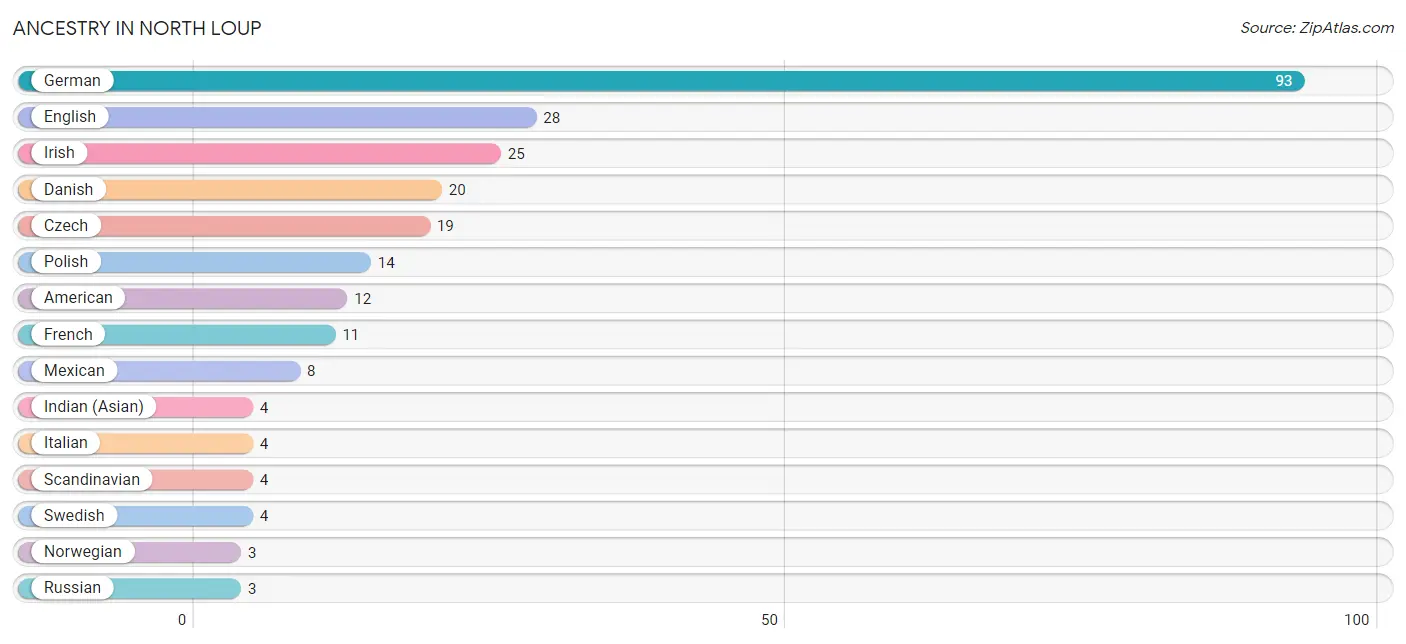
| Ancestry | # Population | % Population |
| American | 12 | 5.4% |
| Cherokee | 1 | 0.4% |
| Czech | 19 | 8.6% |
| Danish | 20 | 9.0% |
| English | 28 | 12.7% |
| French | 11 | 5.0% |
| German | 93 | 42.1% |
| Indian (Asian) | 4 | 1.8% |
| Irish | 25 | 11.3% |
| Italian | 4 | 1.8% |
| Mexican | 8 | 3.6% |
| Norwegian | 3 | 1.4% |
| Polish | 14 | 6.3% |
| Russian | 3 | 1.4% |
| Scandinavian | 4 | 1.8% |
| Scottish | 2 | 0.9% |
| Sri Lankan | 3 | 1.4% |
| Swedish | 4 | 1.8% | View All 18 Rows |
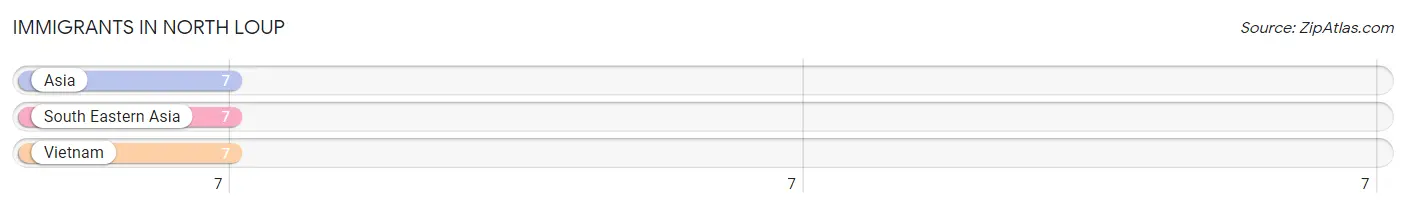
Immigrants in North Loup
The most numerous immigrant groups reported in North Loup came from Asia (7 | 3.2%), South Eastern Asia (7 | 3.2%), and Vietnam (7 | 3.2%), together accounting for 9.5% of all North Loup residents.
| Immigration Origin | # Population | % Population |
| Asia | 7 | 3.2% |
| South Eastern Asia | 7 | 3.2% |
| Vietnam | 7 | 3.2% | View All 3 Rows |
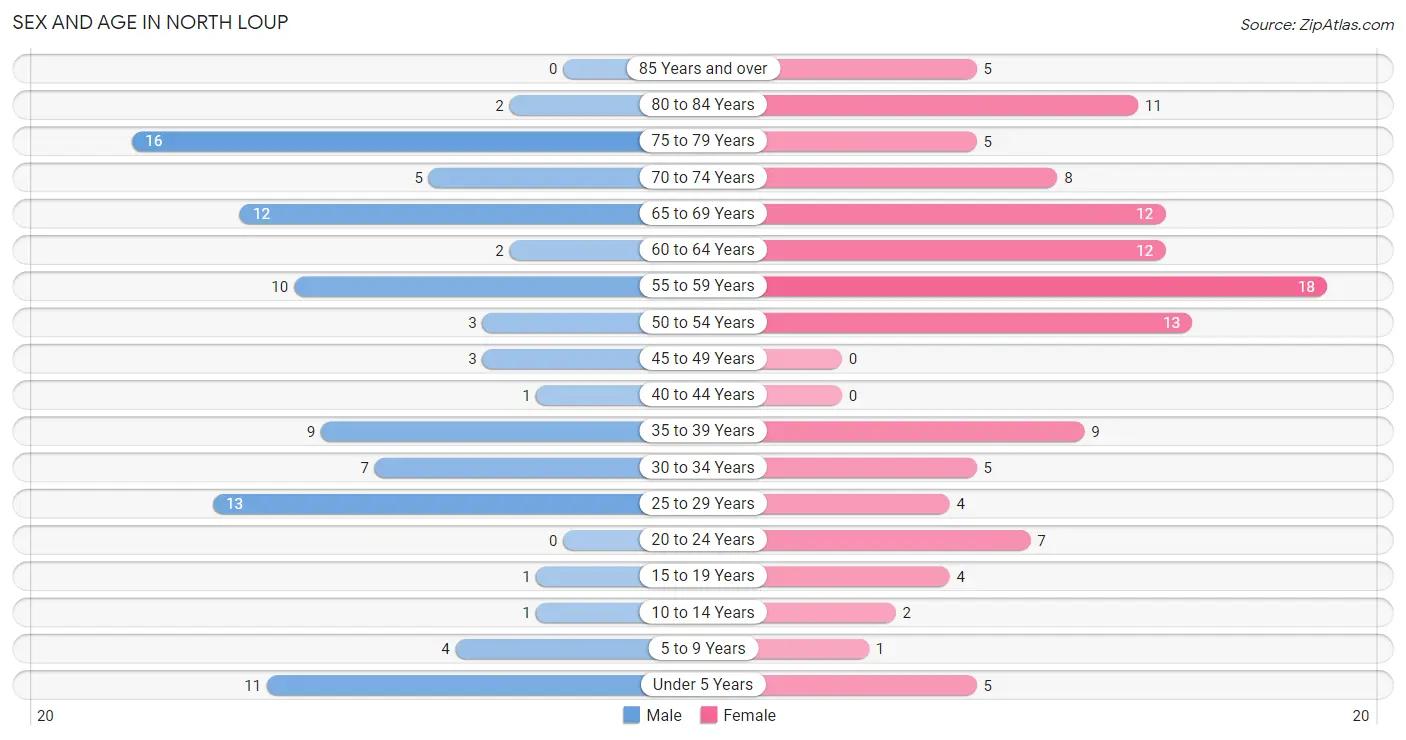
Sex and Age in North Loup
Sex and Age in North Loup
The most populous age groups in North Loup are 75 to 79 Years (16 | 16.0%) for men and 55 to 59 Years (18 | 14.9%) for women.
| Age Bracket | Male | Female |
| Under 5 Years | 11 (11.0%) | 5 (4.1%) |
| 5 to 9 Years | 4 (4.0%) | 1 (0.8%) |
| 10 to 14 Years | 1 (1.0%) | 2 (1.7%) |
| 15 to 19 Years | 1 (1.0%) | 4 (3.3%) |
| 20 to 24 Years | 0 (0.0%) | 7 (5.8%) |
| 25 to 29 Years | 13 (13.0%) | 4 (3.3%) |
| 30 to 34 Years | 7 (7.0%) | 5 (4.1%) |
| 35 to 39 Years | 9 (9.0%) | 9 (7.4%) |
| 40 to 44 Years | 1 (1.0%) | 0 (0.0%) |
| 45 to 49 Years | 3 (3.0%) | 0 (0.0%) |
| 50 to 54 Years | 3 (3.0%) | 13 (10.7%) |
| 55 to 59 Years | 10 (10.0%) | 18 (14.9%) |
| 60 to 64 Years | 2 (2.0%) | 12 (9.9%) |
| 65 to 69 Years | 12 (12.0%) | 12 (9.9%) |
| 70 to 74 Years | 5 (5.0%) | 8 (6.6%) |
| 75 to 79 Years | 16 (16.0%) | 5 (4.1%) |
| 80 to 84 Years | 2 (2.0%) | 11 (9.1%) |
| 85 Years and over | 0 (0.0%) | 5 (4.1%) |
| Total | 100 (100.0%) | 121 (100.0%) |
Families and Households in North Loup
Median Family Size in North Loup
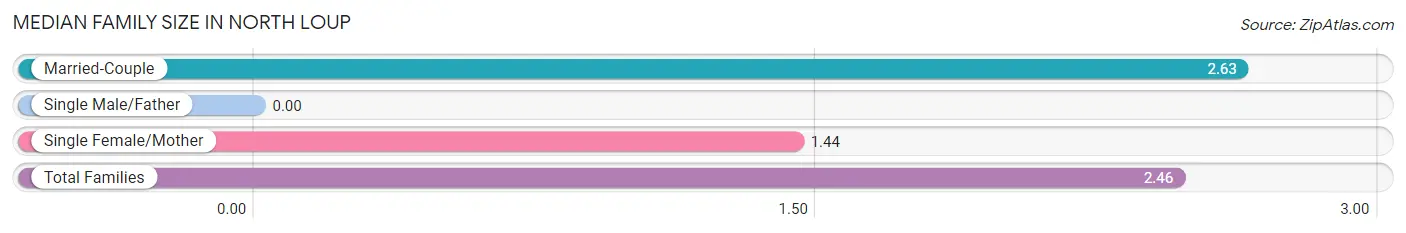
| Family Type | # Families | Family Size |
| Married-Couple | 52 (85.3%) | 2.63 |
| Single Male/Father | 0 (0.0%) | - |
| Single Female/Mother | 9 (14.7%) | 1.44 |
| Total Families | 61 (100.0%) | 2.46 |
Median Household Size in North Loup
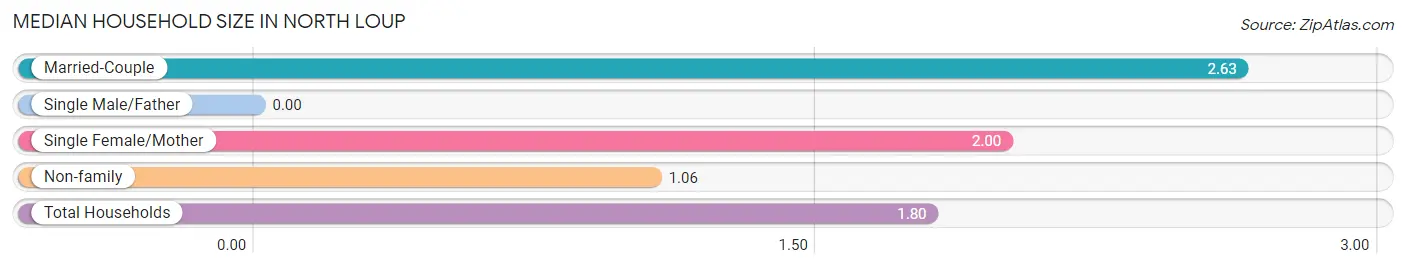
| Household Type | # Households | Household Size |
| Married-Couple | 52 (42.3%) | 2.63 |
| Single Male/Father | 0 (0.0%) | - |
| Single Female/Mother | 9 (7.3%) | 2.00 |
| Non-family | 62 (50.4%) | 1.06 |
| Total Households | 123 (100.0%) | 1.80 |
Household Size by Marriage Status in North Loup
Out of a total of 123 households in North Loup, 61 (49.6%) are family households, while 62 (50.4%) are nonfamily households. The most numerous type of family households are 2-person households, comprising 35, and the most common type of nonfamily households are 1-person households, comprising 57.
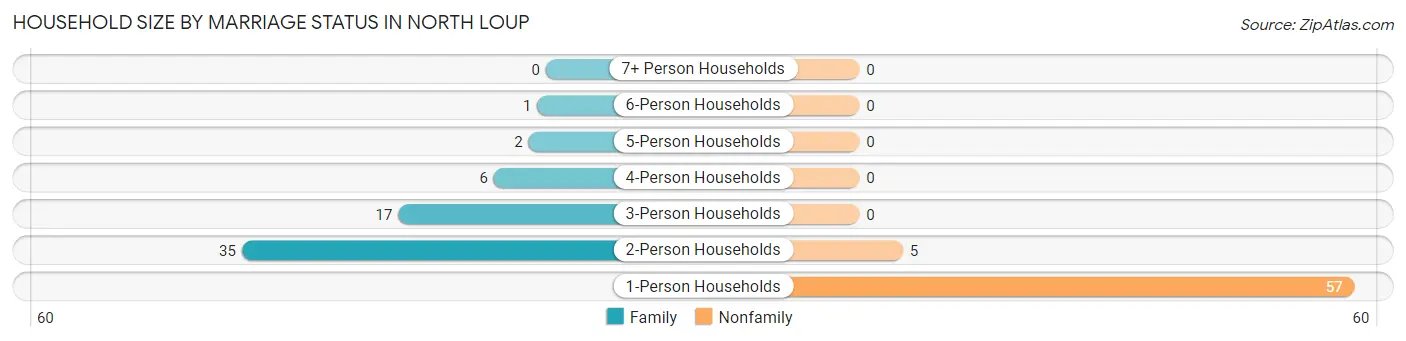
| Household Size | Family Households | Nonfamily Households |
| 1-Person Households | - | 57 (46.3%) |
| 2-Person Households | 35 (28.5%) | 5 (4.1%) |
| 3-Person Households | 17 (13.8%) | 0 (0.0%) |
| 4-Person Households | 6 (4.9%) | 0 (0.0%) |
| 5-Person Households | 2 (1.6%) | 0 (0.0%) |
| 6-Person Households | 1 (0.8%) | 0 (0.0%) |
| 7+ Person Households | 0 (0.0%) | 0 (0.0%) |
| Total | 61 (49.6%) | 62 (50.4%) |
Female Fertility in North Loup
Fertility by Age in North Loup
| Age Bracket | Women with Births | Births / 1,000 Women |
| 15 to 19 years | 0 (0.0%) | 0.0 |
| 20 to 34 years | 0 (0.0%) | 0.0 |
| 35 to 50 years | 0 (0.0%) | 0.0 |
| Total | 0 (0.0%) | 0.0 |
Fertility by Age by Marriage Status in North Loup
| Age Bracket | Married | Unmarried |
| 15 to 19 years | 0 (0.0%) | 0 (0.0%) |
| 20 to 34 years | 0 (0.0%) | 0 (0.0%) |
| 35 to 50 years | 0 (0.0%) | 0 (0.0%) |
| Total | 0 (0.0%) | 0 (0.0%) |
Fertility by Education in North Loup
| Educational Attainment | Women with Births | Births / 1,000 Women |
| Less than High School | 0 (0.0%) | 0.0 |
| High School Diploma | 0 (0.0%) | 0.0 |
| College or Associate's Degree | 0 (0.0%) | 0.0 |
| Bachelor's Degree | 0 (0.0%) | 0.0 |
| Graduate Degree | 0 (0.0%) | 0.0 |
| Total | 0 (0.0%) | 0.0 |
Fertility by Education by Marriage Status in North Loup
| Educational Attainment | Married | Unmarried |
| Less than High School | 0 (0.0%) | 0 (0.0%) |
| High School Diploma | 0 (0.0%) | 0 (0.0%) |
| College or Associate's Degree | 0 (0.0%) | 0 (0.0%) |
| Bachelor's Degree | 0 (0.0%) | 0 (0.0%) |
| Graduate Degree | 0 (0.0%) | 0 (0.0%) |
| Total | 0 (0.0%) | 0 (0.0%) |
Employment Characteristics in North Loup
Employment by Class of Employer in North Loup
Among the 107 employed individuals in North Loup, private company employees (60 | 56.1%), local government employees (16 | 14.9%), and self-employed (incorporated) (12 | 11.2%) make up the most common classes of employment.
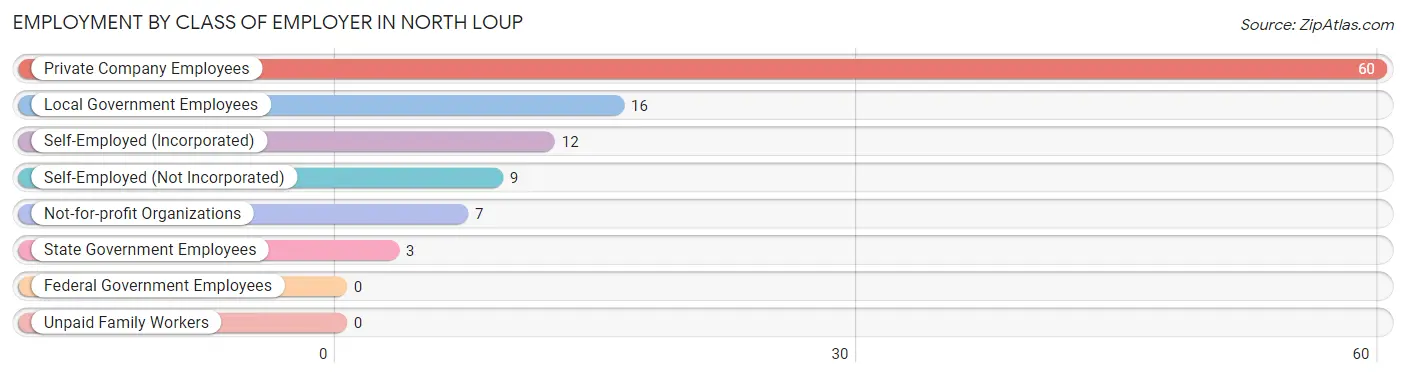
| Employer Class | # Employees | % Employees |
| Private Company Employees | 60 | 56.1% |
| Self-Employed (Incorporated) | 12 | 11.2% |
| Self-Employed (Not Incorporated) | 9 | 8.4% |
| Not-for-profit Organizations | 7 | 6.5% |
| Local Government Employees | 16 | 14.9% |
| State Government Employees | 3 | 2.8% |
| Federal Government Employees | 0 | 0.0% |
| Unpaid Family Workers | 0 | 0.0% |
| Total | 107 | 100.0% |
Employment Status by Age in North Loup
According to the labor force statistics for North Loup, out of the total population over 16 years of age (197), 59.9% or 118 individuals are in the labor force, with 0.8% or 1 of them unemployed. The age group with the highest labor force participation rate is 20 to 24 years, with 100.0% or 7 individuals in the labor force. Within the labor force, the 30 to 34 years age range has the highest percentage of unemployed individuals, with 8.3% or 1 of them being unemployed.
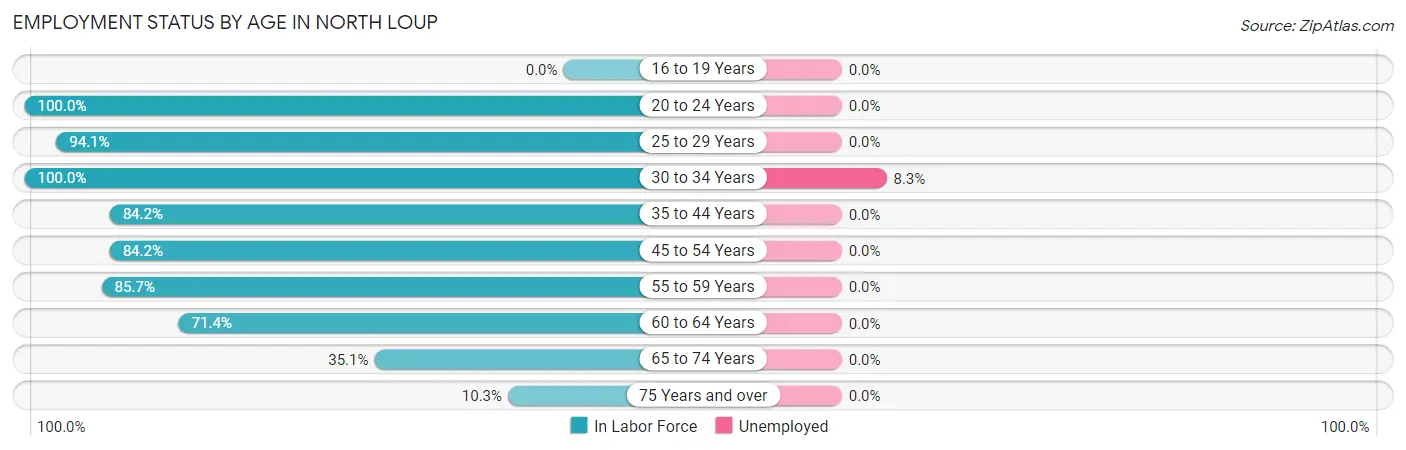
| Age Bracket | In Labor Force | Unemployed |
| 16 to 19 Years | 0 (0.0%) | 0 (0.0%) |
| 20 to 24 Years | 7 (100.0%) | 0 (0.0%) |
| 25 to 29 Years | 16 (94.1%) | 0 (0.0%) |
| 30 to 34 Years | 12 (100.0%) | 1 (8.3%) |
| 35 to 44 Years | 16 (84.2%) | 0 (0.0%) |
| 45 to 54 Years | 16 (84.2%) | 0 (0.0%) |
| 55 to 59 Years | 24 (85.7%) | 0 (0.0%) |
| 60 to 64 Years | 10 (71.4%) | 0 (0.0%) |
| 65 to 74 Years | 13 (35.1%) | 0 (0.0%) |
| 75 Years and over | 4 (10.3%) | 0 (0.0%) |
| Total | 118 (59.9%) | 1 (0.8%) |
Employment Status by Educational Attainment in North Loup
According to labor force statistics for North Loup, 86.2% of individuals (94) out of the total population between 25 and 64 years of age (109) are in the labor force, with 1.1% or 1 of them being unemployed. The group with the highest labor force participation rate are those with the educational attainment of bachelor's degree or higher, with 96.7% or 29 individuals in the labor force. Within the labor force, individuals with high school diploma education have the highest percentage of unemployment, with 3.0% or 1 of them being unemployed.
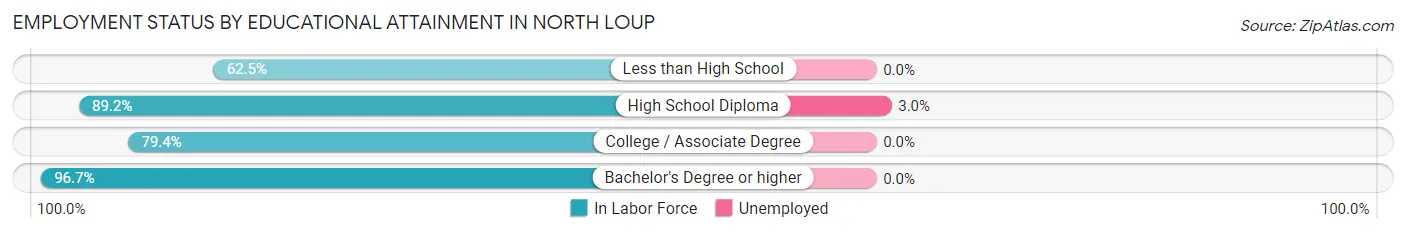
| Educational Attainment | In Labor Force | Unemployed |
| Less than High School | 5 (62.5%) | 0 (0.0%) |
| High School Diploma | 33 (89.2%) | 1 (3.0%) |
| College / Associate Degree | 27 (79.4%) | 0 (0.0%) |
| Bachelor's Degree or higher | 29 (96.7%) | 0 (0.0%) |
| Total | 94 (86.2%) | 1 (1.1%) |
Employment Occupations by Sex in North Loup
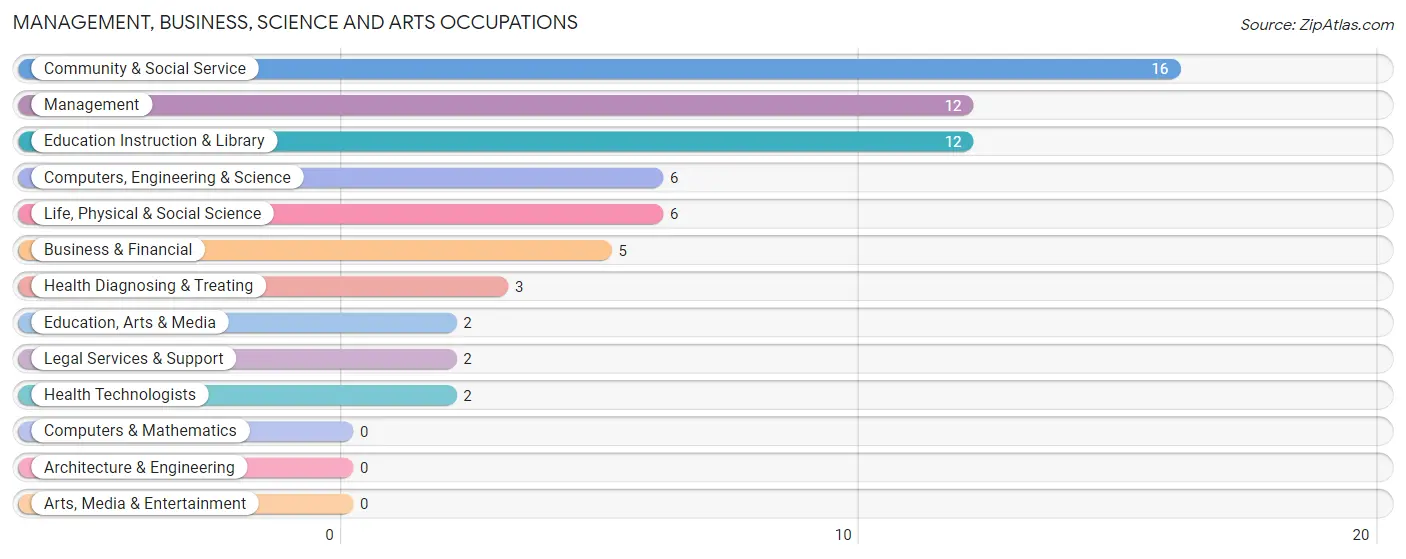
Management, Business, Science and Arts Occupations
The most common Management, Business, Science and Arts occupations in North Loup are Community & Social Service (16 | 13.7%), Management (12 | 10.3%), Education Instruction & Library (12 | 10.3%), Computers, Engineering & Science (6 | 5.1%), and Life, Physical & Social Science (6 | 5.1%).
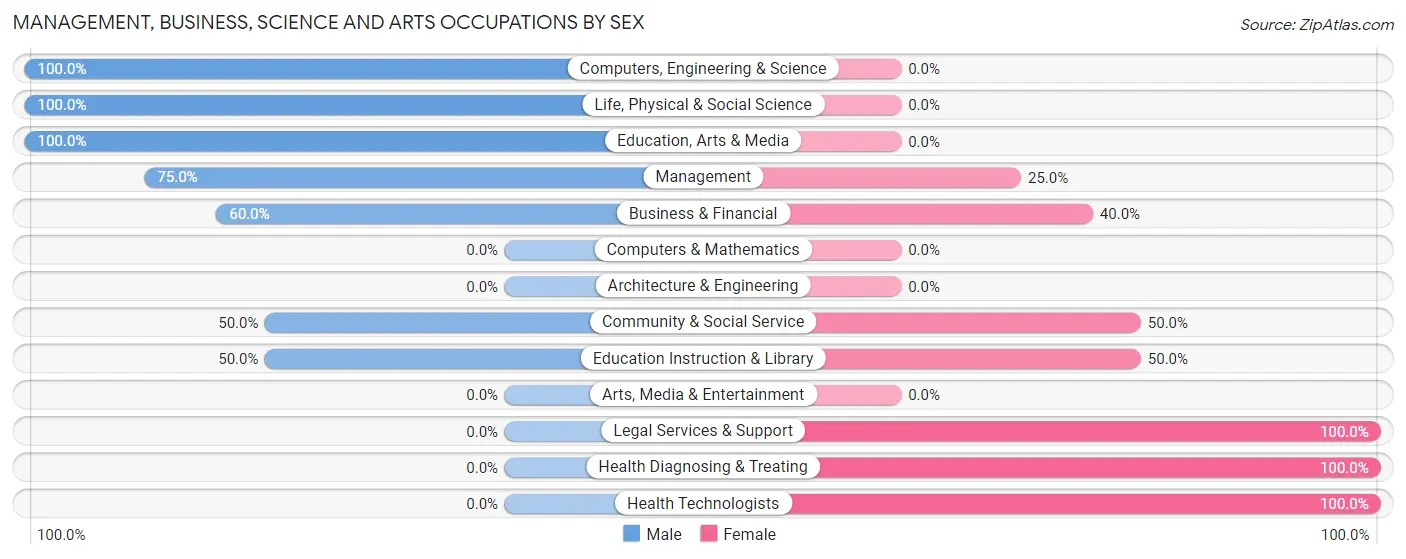
Management, Business, Science and Arts Occupations by Sex
Within the Management, Business, Science and Arts occupations in North Loup, the most male-oriented occupations are Computers, Engineering & Science (100.0%), Life, Physical & Social Science (100.0%), and Education, Arts & Media (100.0%), while the most female-oriented occupations are Legal Services & Support (100.0%), Health Diagnosing & Treating (100.0%), and Health Technologists (100.0%).
| Occupation | Male | Female |
| Management | 9 (75.0%) | 3 (25.0%) |
| Business & Financial | 3 (60.0%) | 2 (40.0%) |
| Computers, Engineering & Science | 6 (100.0%) | 0 (0.0%) |
| Computers & Mathematics | 0 (0.0%) | 0 (0.0%) |
| Architecture & Engineering | 0 (0.0%) | 0 (0.0%) |
| Life, Physical & Social Science | 6 (100.0%) | 0 (0.0%) |
| Community & Social Service | 8 (50.0%) | 8 (50.0%) |
| Education, Arts & Media | 2 (100.0%) | 0 (0.0%) |
| Legal Services & Support | 0 (0.0%) | 2 (100.0%) |
| Education Instruction & Library | 6 (50.0%) | 6 (50.0%) |
| Arts, Media & Entertainment | 0 (0.0%) | 0 (0.0%) |
| Health Diagnosing & Treating | 0 (0.0%) | 3 (100.0%) |
| Health Technologists | 0 (0.0%) | 2 (100.0%) |
| Total (Category) | 26 (61.9%) | 16 (38.1%) |
| Total (Overall) | 52 (44.4%) | 65 (55.6%) |
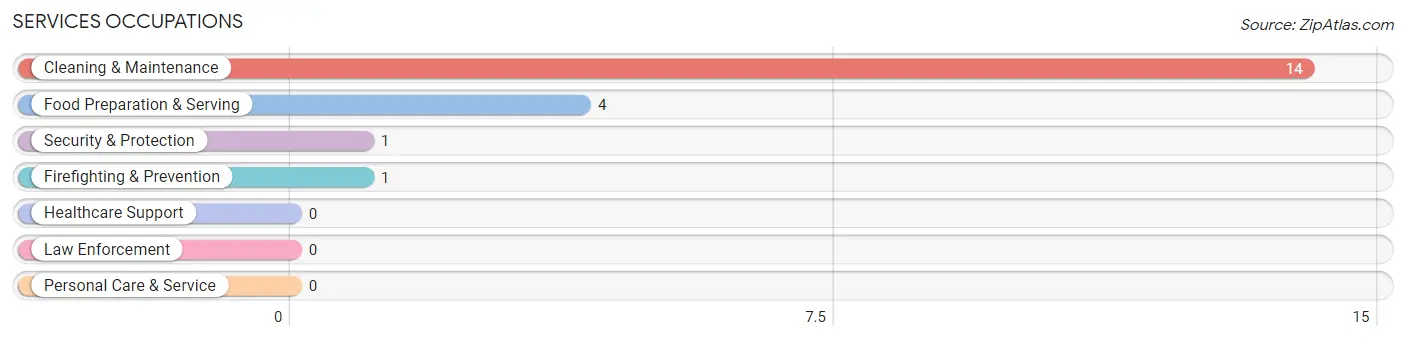
Services Occupations
The most common Services occupations in North Loup are Cleaning & Maintenance (14 | 12.0%), Food Preparation & Serving (4 | 3.4%), Security & Protection (1 | 0.9%), and Firefighting & Prevention (1 | 0.9%).
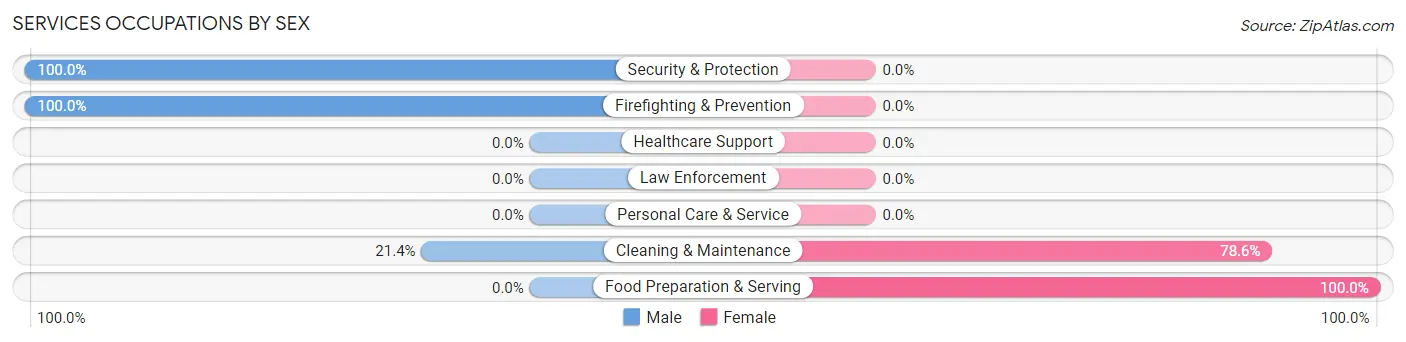
Services Occupations by Sex
Within the Services occupations in North Loup, the most male-oriented occupations are Security & Protection (100.0%), Firefighting & Prevention (100.0%), and Cleaning & Maintenance (21.4%), while the most female-oriented occupations are Food Preparation & Serving (100.0%), and Cleaning & Maintenance (78.6%).
| Occupation | Male | Female |
| Healthcare Support | 0 (0.0%) | 0 (0.0%) |
| Security & Protection | 1 (100.0%) | 0 (0.0%) |
| Firefighting & Prevention | 1 (100.0%) | 0 (0.0%) |
| Law Enforcement | 0 (0.0%) | 0 (0.0%) |
| Food Preparation & Serving | 0 (0.0%) | 4 (100.0%) |
| Cleaning & Maintenance | 3 (21.4%) | 11 (78.6%) |
| Personal Care & Service | 0 (0.0%) | 0 (0.0%) |
| Total (Category) | 4 (21.0%) | 15 (78.9%) |
| Total (Overall) | 52 (44.4%) | 65 (55.6%) |
Sales and Office Occupations
The most common Sales and Office occupations in North Loup are Office & Administration (19 | 16.2%), and Sales & Related (10 | 8.6%).
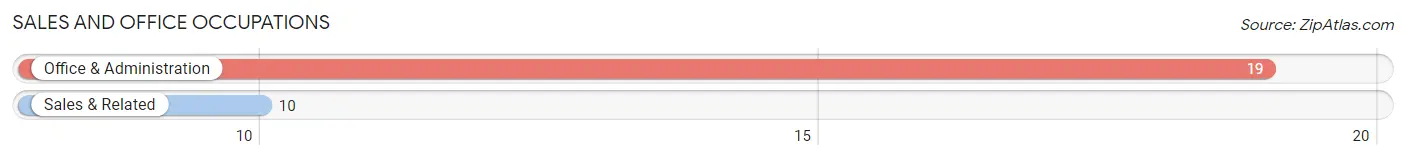
Sales and Office Occupations by Sex
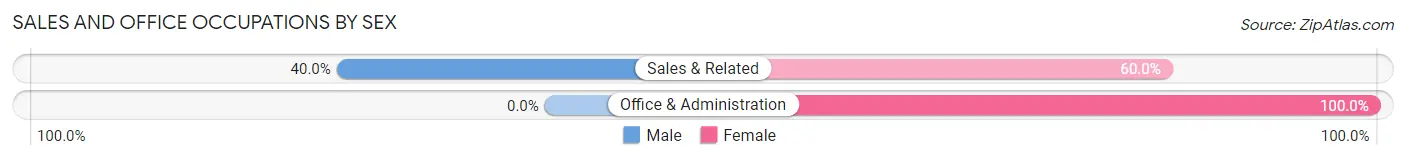
| Occupation | Male | Female |
| Sales & Related | 4 (40.0%) | 6 (60.0%) |
| Office & Administration | 0 (0.0%) | 19 (100.0%) |
| Total (Category) | 4 (13.8%) | 25 (86.2%) |
| Total (Overall) | 52 (44.4%) | 65 (55.6%) |
Natural Resources, Construction and Maintenance Occupations
The most common Natural Resources, Construction and Maintenance occupations in North Loup are , and Construction & Extraction (7 | 6.0%).
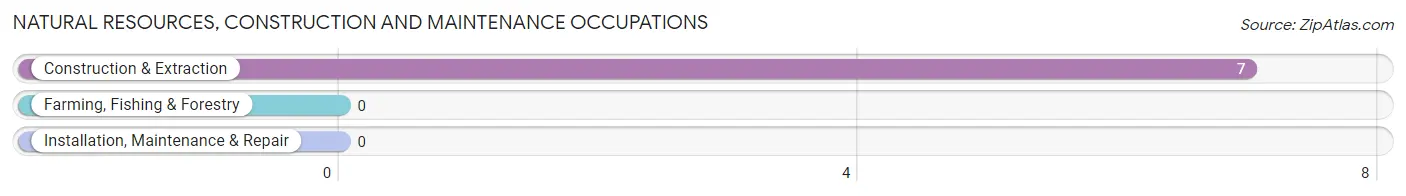
Natural Resources, Construction and Maintenance Occupations by Sex
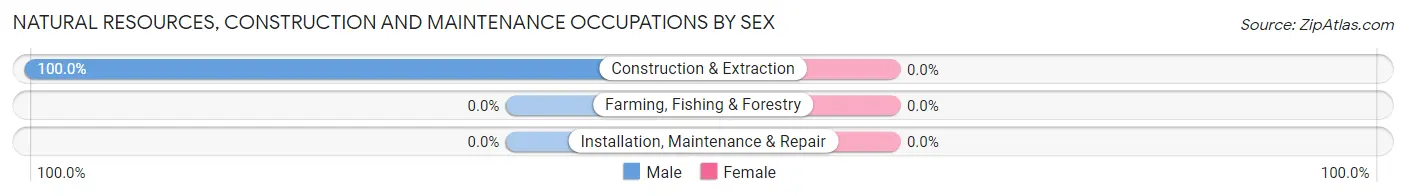
| Occupation | Male | Female |
| Farming, Fishing & Forestry | 0 (0.0%) | 0 (0.0%) |
| Construction & Extraction | 7 (100.0%) | 0 (0.0%) |
| Installation, Maintenance & Repair | 0 (0.0%) | 0 (0.0%) |
| Total (Category) | 7 (100.0%) | 0 (0.0%) |
| Total (Overall) | 52 (44.4%) | 65 (55.6%) |
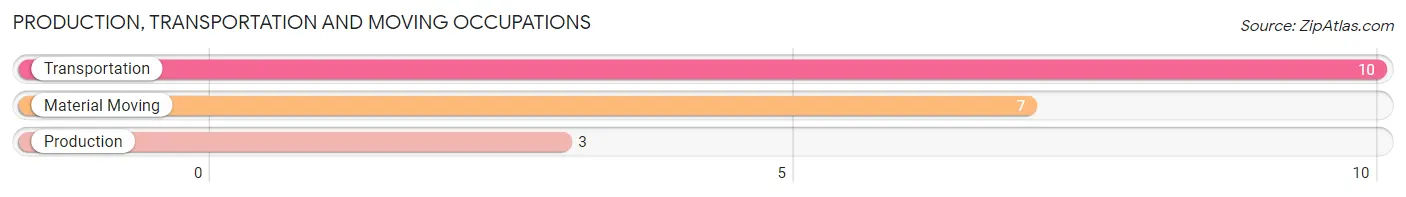
Production, Transportation and Moving Occupations
The most common Production, Transportation and Moving occupations in North Loup are Transportation (10 | 8.6%), Material Moving (7 | 6.0%), and Production (3 | 2.6%).
Production, Transportation and Moving Occupations by Sex
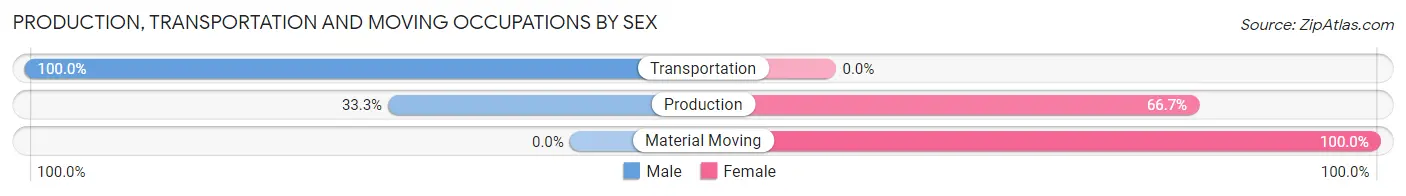
| Occupation | Male | Female |
| Production | 1 (33.3%) | 2 (66.7%) |
| Transportation | 10 (100.0%) | 0 (0.0%) |
| Material Moving | 0 (0.0%) | 7 (100.0%) |
| Total (Category) | 11 (55.0%) | 9 (45.0%) |
| Total (Overall) | 52 (44.4%) | 65 (55.6%) |
Employment Industries by Sex in North Loup
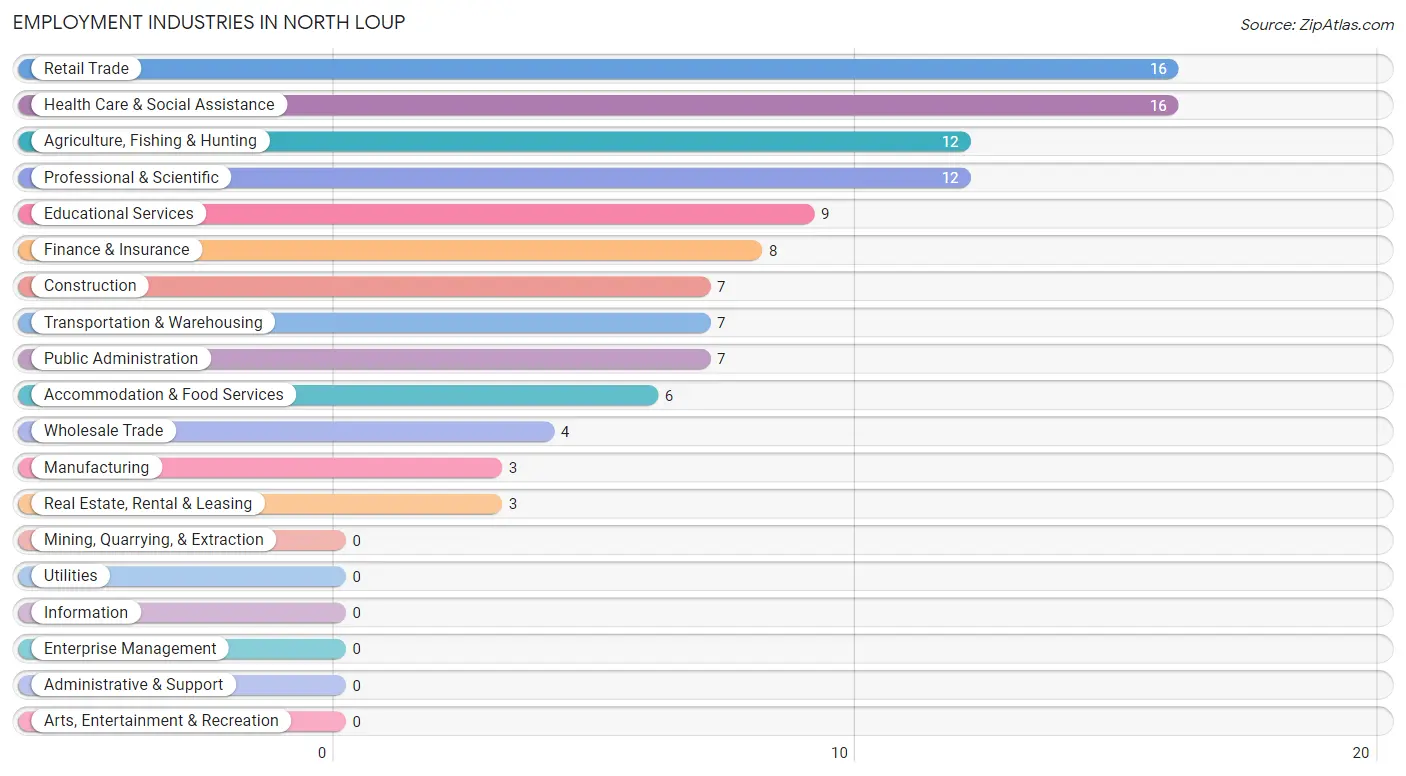
Employment Industries in North Loup
The major employment industries in North Loup include Retail Trade (16 | 13.7%), Health Care & Social Assistance (16 | 13.7%), Agriculture, Fishing & Hunting (12 | 10.3%), Professional & Scientific (12 | 10.3%), and Educational Services (9 | 7.7%).
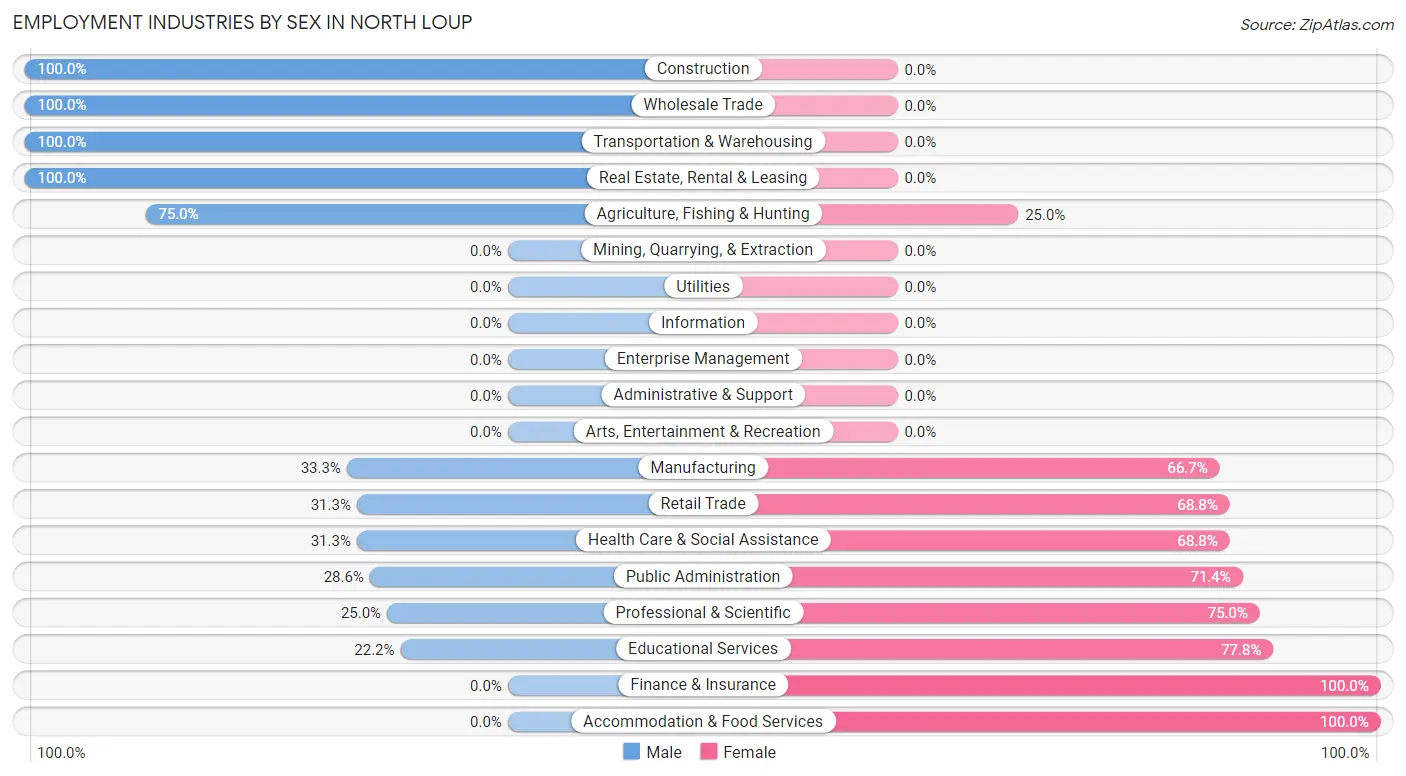
Employment Industries by Sex in North Loup
The North Loup industries that see more men than women are Construction (100.0%), Wholesale Trade (100.0%), and Transportation & Warehousing (100.0%), whereas the industries that tend to have a higher number of women are Finance & Insurance (100.0%), Accommodation & Food Services (100.0%), and Educational Services (77.8%).
| Industry | Male | Female |
| Agriculture, Fishing & Hunting | 9 (75.0%) | 3 (25.0%) |
| Mining, Quarrying, & Extraction | 0 (0.0%) | 0 (0.0%) |
| Construction | 7 (100.0%) | 0 (0.0%) |
| Manufacturing | 1 (33.3%) | 2 (66.7%) |
| Wholesale Trade | 4 (100.0%) | 0 (0.0%) |
| Retail Trade | 5 (31.2%) | 11 (68.8%) |
| Transportation & Warehousing | 7 (100.0%) | 0 (0.0%) |
| Utilities | 0 (0.0%) | 0 (0.0%) |
| Information | 0 (0.0%) | 0 (0.0%) |
| Finance & Insurance | 0 (0.0%) | 8 (100.0%) |
| Real Estate, Rental & Leasing | 3 (100.0%) | 0 (0.0%) |
| Professional & Scientific | 3 (25.0%) | 9 (75.0%) |
| Enterprise Management | 0 (0.0%) | 0 (0.0%) |
| Administrative & Support | 0 (0.0%) | 0 (0.0%) |
| Educational Services | 2 (22.2%) | 7 (77.8%) |
| Health Care & Social Assistance | 5 (31.2%) | 11 (68.8%) |
| Arts, Entertainment & Recreation | 0 (0.0%) | 0 (0.0%) |
| Accommodation & Food Services | 0 (0.0%) | 6 (100.0%) |
| Public Administration | 2 (28.6%) | 5 (71.4%) |
| Total | 52 (44.4%) | 65 (55.6%) |
Education in North Loup
School Enrollment in North Loup
The most common levels of schooling among the 24 students in North Loup are college / undergraduate (9 | 37.5%), elementary school (5 | 20.8%), and high school (4 | 16.7%).
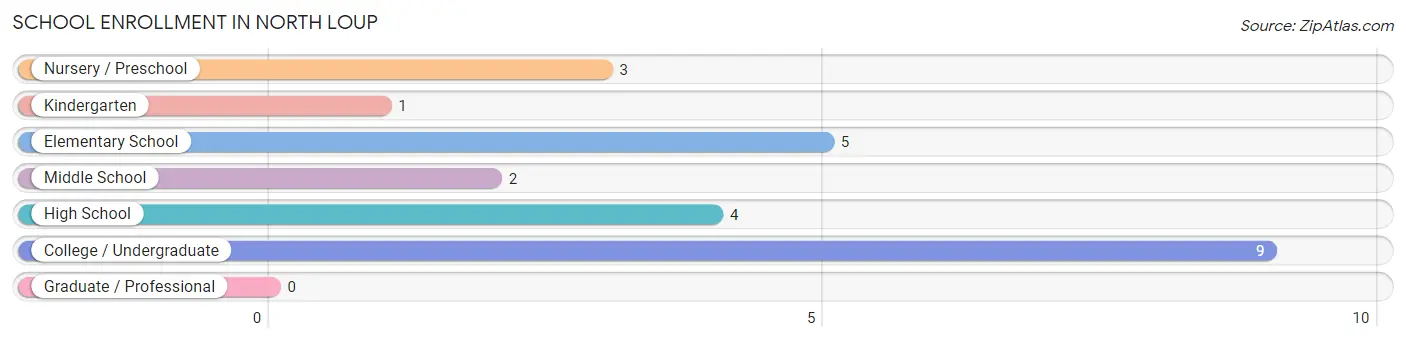
| School Level | # Students | % Students |
| Nursery / Preschool | 3 | 12.5% |
| Kindergarten | 1 | 4.2% |
| Elementary School | 5 | 20.8% |
| Middle School | 2 | 8.3% |
| High School | 4 | 16.7% |
| College / Undergraduate | 9 | 37.5% |
| Graduate / Professional | 0 | 0.0% |
| Total | 24 | 100.0% |
School Enrollment by Age by Funding Source in North Loup
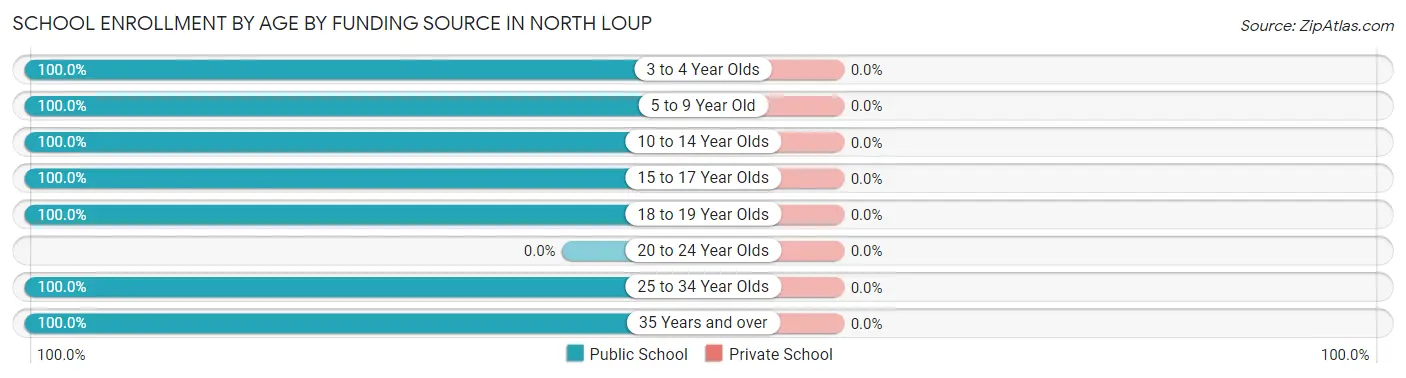
| Age Bracket | Public School | Private School |
| 3 to 4 Year Olds | 3 (100.0%) | 0 (0.0%) |
| 5 to 9 Year Old | 5 (100.0%) | 0 (0.0%) |
| 10 to 14 Year Olds | 3 (100.0%) | 0 (0.0%) |
| 15 to 17 Year Olds | 2 (100.0%) | 0 (0.0%) |
| 18 to 19 Year Olds | 2 (100.0%) | 0 (0.0%) |
| 20 to 24 Year Olds | 0 (0.0%) | 0 (0.0%) |
| 25 to 34 Year Olds | 3 (100.0%) | 0 (0.0%) |
| 35 Years and over | 6 (100.0%) | 0 (0.0%) |
| Total | 24 (100.0%) | 0 (0.0%) |
Educational Attainment by Field of Study in North Loup
Education (17 | 39.5%), business (9 | 20.9%), literature & languages (8 | 18.6%), bio, nature & agricultural (6 | 14.0%), and psychology (2 | 4.6%) are the most common fields of study among 43 individuals in North Loup who have obtained a bachelor's degree or higher.
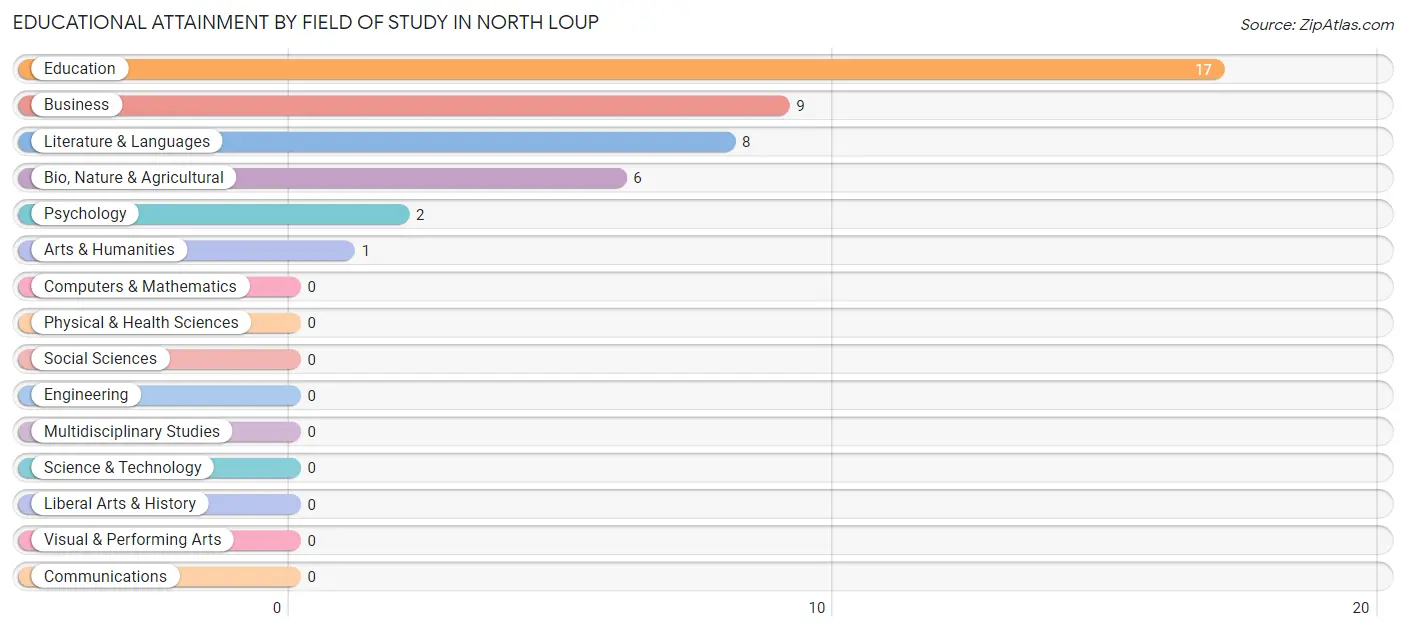
| Field of Study | # Graduates | % Graduates |
| Computers & Mathematics | 0 | 0.0% |
| Bio, Nature & Agricultural | 6 | 14.0% |
| Physical & Health Sciences | 0 | 0.0% |
| Psychology | 2 | 4.6% |
| Social Sciences | 0 | 0.0% |
| Engineering | 0 | 0.0% |
| Multidisciplinary Studies | 0 | 0.0% |
| Science & Technology | 0 | 0.0% |
| Business | 9 | 20.9% |
| Education | 17 | 39.5% |
| Literature & Languages | 8 | 18.6% |
| Liberal Arts & History | 0 | 0.0% |
| Visual & Performing Arts | 0 | 0.0% |
| Communications | 0 | 0.0% |
| Arts & Humanities | 1 | 2.3% |
| Total | 43 | 100.0% |
Transportation & Commute in North Loup
Vehicle Availability by Sex in North Loup
The most prevalent vehicle ownership categories in North Loup are males with 2 vehicles (24, accounting for 46.2%) and females with 2 vehicles (23, making up 43.6%).
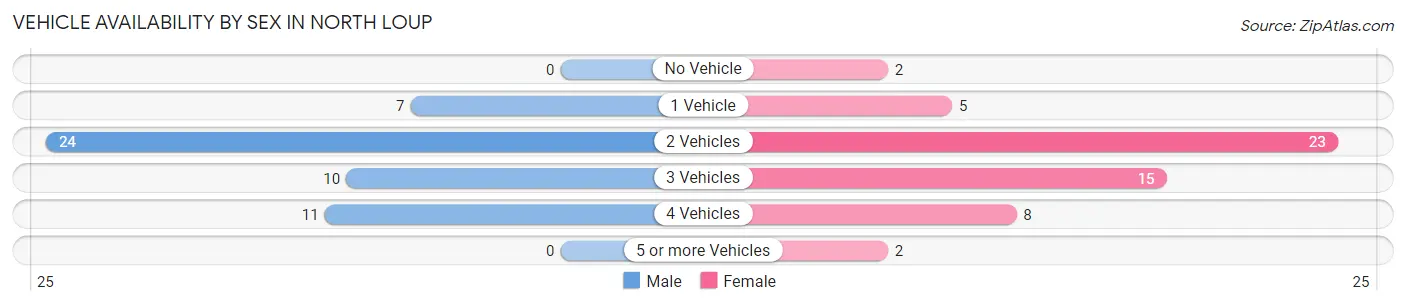
| Vehicles Available | Male | Female |
| No Vehicle | 0 (0.0%) | 2 (3.6%) |
| 1 Vehicle | 7 (13.5%) | 5 (9.1%) |
| 2 Vehicles | 24 (46.2%) | 23 (41.8%) |
| 3 Vehicles | 10 (19.2%) | 15 (27.3%) |
| 4 Vehicles | 11 (21.1%) | 8 (14.5%) |
| 5 or more Vehicles | 0 (0.0%) | 2 (3.6%) |
| Total | 52 (100.0%) | 55 (100.0%) |
Commute Time in North Loup
The most frequently occuring commute durations in North Loup are 15 to 19 minutes (33 commuters, 33.3%), 5 to 9 minutes (20 commuters, 20.2%), and less than 5 minutes (15 commuters, 15.1%).

| Commute Time | # Commuters | % Commuters |
| Less than 5 Minutes | 15 | 15.1% |
| 5 to 9 Minutes | 20 | 20.2% |
| 10 to 14 Minutes | 7 | 7.1% |
| 15 to 19 Minutes | 33 | 33.3% |
| 20 to 24 Minutes | 12 | 12.1% |
| 25 to 29 Minutes | 3 | 3.0% |
| 30 to 34 Minutes | 0 | 0.0% |
| 35 to 39 Minutes | 0 | 0.0% |
| 40 to 44 Minutes | 4 | 4.0% |
| 45 to 59 Minutes | 0 | 0.0% |
| 60 to 89 Minutes | 4 | 4.0% |
| 90 or more Minutes | 1 | 1.0% |
Commute Time by Sex in North Loup
The most common commute times in North Loup are less than 5 minutes (10 commuters, 21.7%) for males and 15 to 19 minutes (23 commuters, 43.4%) for females.
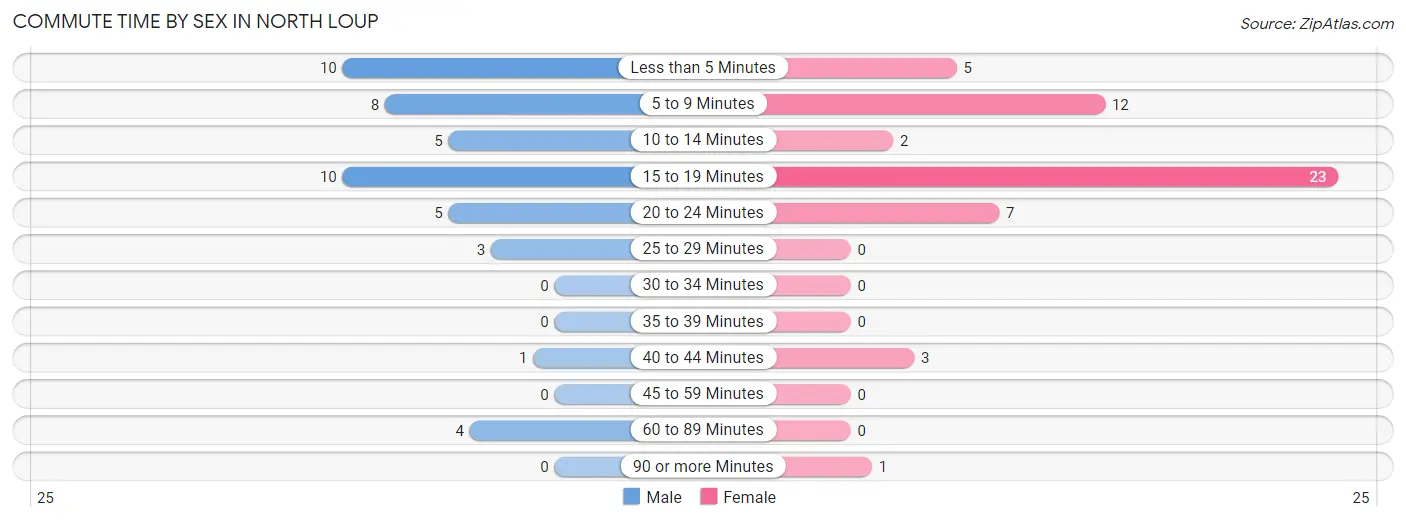
| Commute Time | Male | Female |
| Less than 5 Minutes | 10 (21.7%) | 5 (9.4%) |
| 5 to 9 Minutes | 8 (17.4%) | 12 (22.6%) |
| 10 to 14 Minutes | 5 (10.9%) | 2 (3.8%) |
| 15 to 19 Minutes | 10 (21.7%) | 23 (43.4%) |
| 20 to 24 Minutes | 5 (10.9%) | 7 (13.2%) |
| 25 to 29 Minutes | 3 (6.5%) | 0 (0.0%) |
| 30 to 34 Minutes | 0 (0.0%) | 0 (0.0%) |
| 35 to 39 Minutes | 0 (0.0%) | 0 (0.0%) |
| 40 to 44 Minutes | 1 (2.2%) | 3 (5.7%) |
| 45 to 59 Minutes | 0 (0.0%) | 0 (0.0%) |
| 60 to 89 Minutes | 4 (8.7%) | 0 (0.0%) |
| 90 or more Minutes | 0 (0.0%) | 1 (1.9%) |
Time of Departure to Work by Sex in North Loup
The most frequent times of departure to work in North Loup are 7:30 AM to 7:59 AM (21, 45.7%) for males and 7:30 AM to 7:59 AM (19, 35.8%) for females.
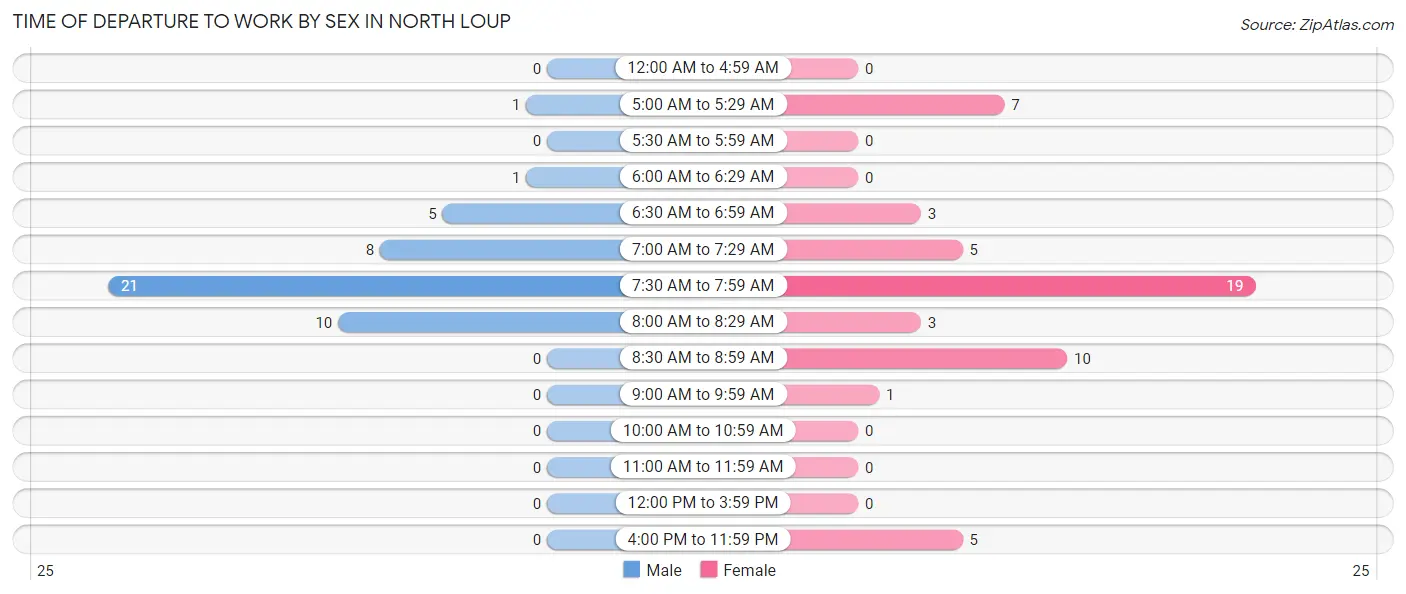
| Time of Departure | Male | Female |
| 12:00 AM to 4:59 AM | 0 (0.0%) | 0 (0.0%) |
| 5:00 AM to 5:29 AM | 1 (2.2%) | 7 (13.2%) |
| 5:30 AM to 5:59 AM | 0 (0.0%) | 0 (0.0%) |
| 6:00 AM to 6:29 AM | 1 (2.2%) | 0 (0.0%) |
| 6:30 AM to 6:59 AM | 5 (10.9%) | 3 (5.7%) |
| 7:00 AM to 7:29 AM | 8 (17.4%) | 5 (9.4%) |
| 7:30 AM to 7:59 AM | 21 (45.7%) | 19 (35.8%) |
| 8:00 AM to 8:29 AM | 10 (21.7%) | 3 (5.7%) |
| 8:30 AM to 8:59 AM | 0 (0.0%) | 10 (18.9%) |
| 9:00 AM to 9:59 AM | 0 (0.0%) | 1 (1.9%) |
| 10:00 AM to 10:59 AM | 0 (0.0%) | 0 (0.0%) |
| 11:00 AM to 11:59 AM | 0 (0.0%) | 0 (0.0%) |
| 12:00 PM to 3:59 PM | 0 (0.0%) | 0 (0.0%) |
| 4:00 PM to 11:59 PM | 0 (0.0%) | 5 (9.4%) |
| Total | 46 (100.0%) | 53 (100.0%) |
Housing Occupancy in North Loup
Occupancy by Ownership in North Loup
Of the total 123 dwellings in North Loup, owner-occupied units account for 100 (81.3%), while renter-occupied units make up 23 (18.7%).
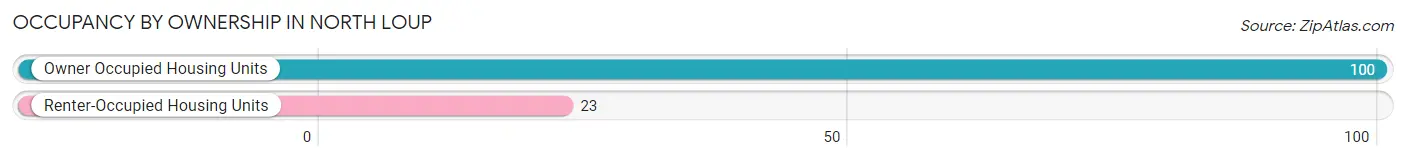
| Occupancy | # Housing Units | % Housing Units |
| Owner Occupied Housing Units | 100 | 81.3% |
| Renter-Occupied Housing Units | 23 | 18.7% |
| Total Occupied Housing Units | 123 | 100.0% |
Occupancy by Household Size in North Loup
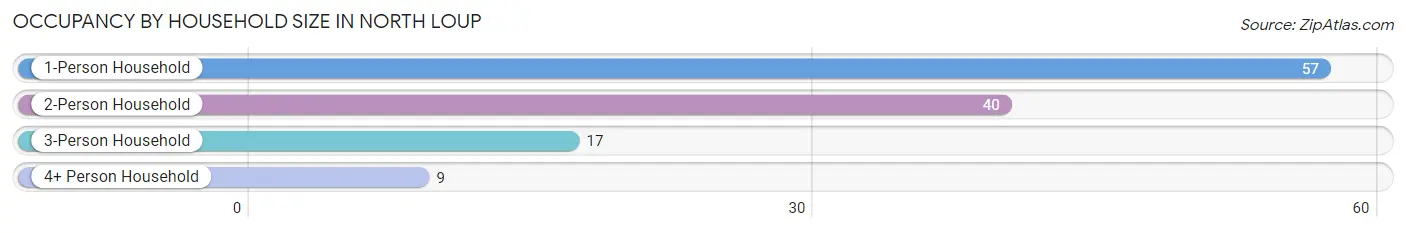
| Household Size | # Housing Units | % Housing Units |
| 1-Person Household | 57 | 46.3% |
| 2-Person Household | 40 | 32.5% |
| 3-Person Household | 17 | 13.8% |
| 4+ Person Household | 9 | 7.3% |
| Total Housing Units | 123 | 100.0% |
Occupancy by Ownership by Household Size in North Loup
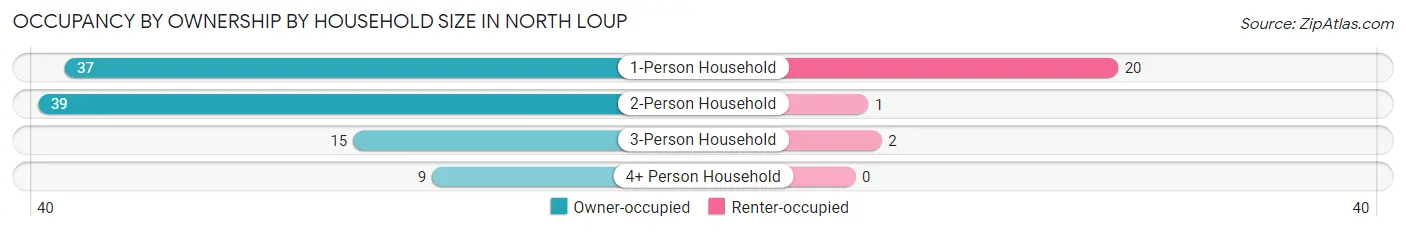
| Household Size | Owner-occupied | Renter-occupied |
| 1-Person Household | 37 (64.9%) | 20 (35.1%) |
| 2-Person Household | 39 (97.5%) | 1 (2.5%) |
| 3-Person Household | 15 (88.2%) | 2 (11.8%) |
| 4+ Person Household | 9 (100.0%) | 0 (0.0%) |
| Total Housing Units | 100 (81.3%) | 23 (18.7%) |
Occupancy by Educational Attainment in North Loup
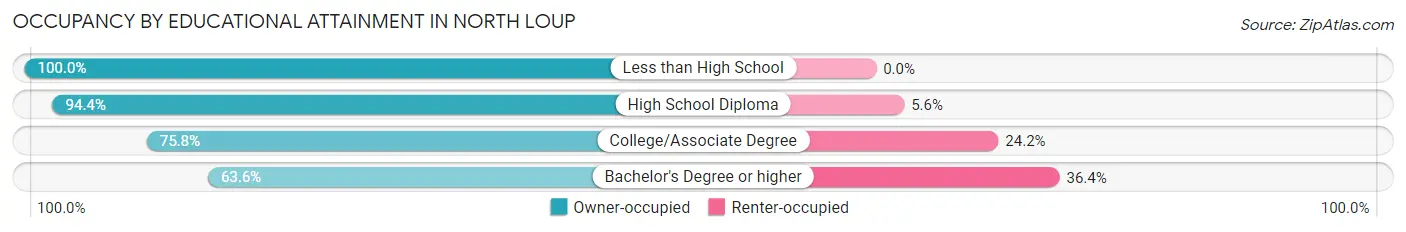
| Household Size | Owner-occupied | Renter-occupied |
| Less than High School | 3 (100.0%) | 0 (0.0%) |
| High School Diploma | 51 (94.4%) | 3 (5.6%) |
| College/Associate Degree | 25 (75.8%) | 8 (24.2%) |
| Bachelor's Degree or higher | 21 (63.6%) | 12 (36.4%) |
Occupancy by Age of Householder in North Loup
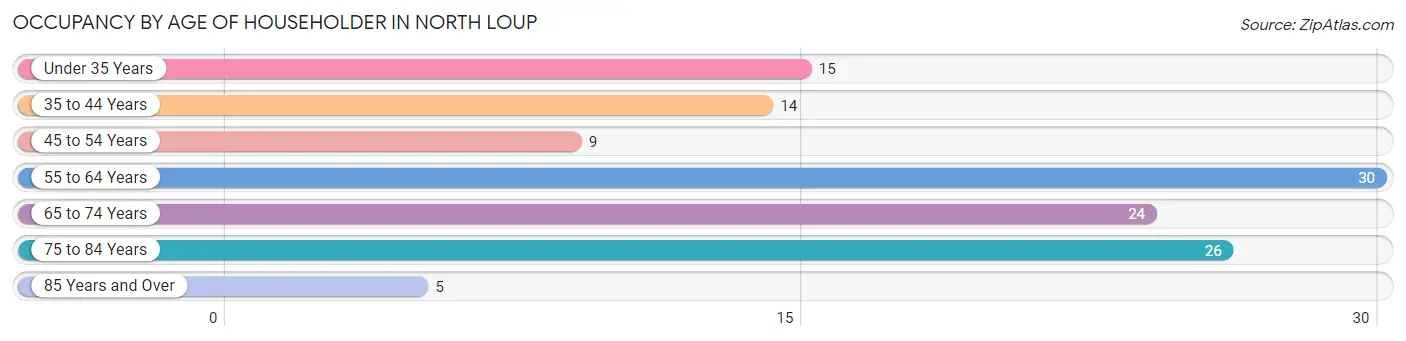
| Age Bracket | # Households | % Households |
| Under 35 Years | 15 | 12.2% |
| 35 to 44 Years | 14 | 11.4% |
| 45 to 54 Years | 9 | 7.3% |
| 55 to 64 Years | 30 | 24.4% |
| 65 to 74 Years | 24 | 19.5% |
| 75 to 84 Years | 26 | 21.1% |
| 85 Years and Over | 5 | 4.1% |
| Total | 123 | 100.0% |
Housing Finances in North Loup
Median Income by Occupancy in North Loup
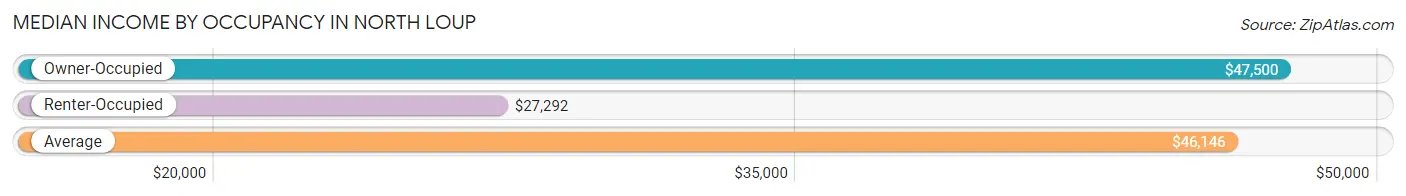
| Occupancy Type | # Households | Median Income |
| Owner-Occupied | 100 (81.3%) | $47,500 |
| Renter-Occupied | 23 (18.7%) | $27,292 |
| Average | 123 (100.0%) | $46,146 |
Occupancy by Householder Income Bracket in North Loup
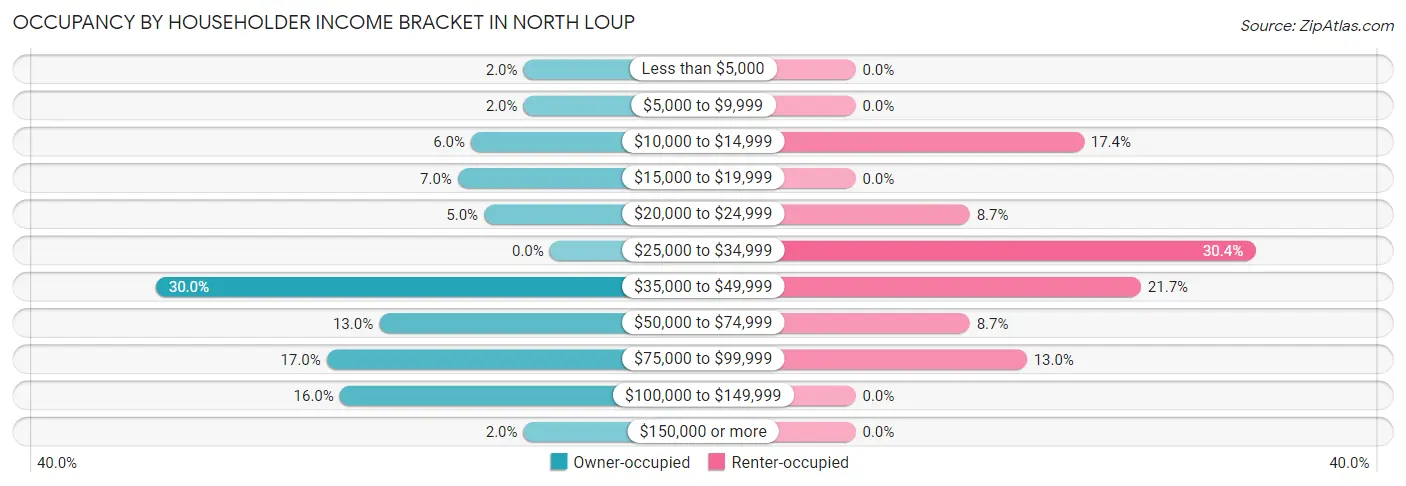
| Income Bracket | Owner-occupied | Renter-occupied |
| Less than $5,000 | 2 (2.0%) | 0 (0.0%) |
| $5,000 to $9,999 | 2 (2.0%) | 0 (0.0%) |
| $10,000 to $14,999 | 6 (6.0%) | 4 (17.4%) |
| $15,000 to $19,999 | 7 (7.0%) | 0 (0.0%) |
| $20,000 to $24,999 | 5 (5.0%) | 2 (8.7%) |
| $25,000 to $34,999 | 0 (0.0%) | 7 (30.4%) |
| $35,000 to $49,999 | 30 (30.0%) | 5 (21.7%) |
| $50,000 to $74,999 | 13 (13.0%) | 2 (8.7%) |
| $75,000 to $99,999 | 17 (17.0%) | 3 (13.0%) |
| $100,000 to $149,999 | 16 (16.0%) | 0 (0.0%) |
| $150,000 or more | 2 (2.0%) | 0 (0.0%) |
| Total | 100 (100.0%) | 23 (100.0%) |
Monthly Housing Cost Tiers in North Loup
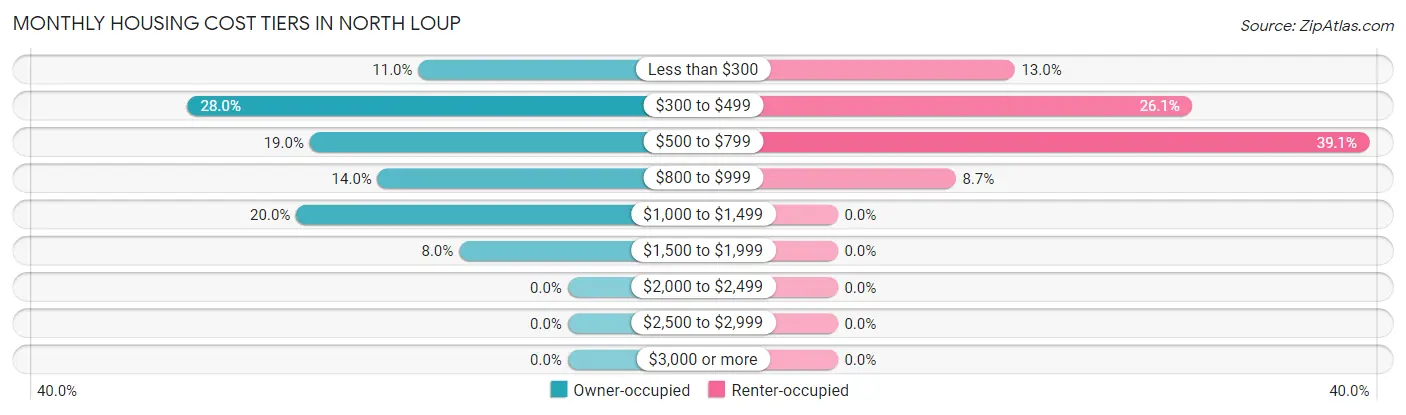
| Monthly Cost | Owner-occupied | Renter-occupied |
| Less than $300 | 11 (11.0%) | 3 (13.0%) |
| $300 to $499 | 28 (28.0%) | 6 (26.1%) |
| $500 to $799 | 19 (19.0%) | 9 (39.1%) |
| $800 to $999 | 14 (14.0%) | 2 (8.7%) |
| $1,000 to $1,499 | 20 (20.0%) | 0 (0.0%) |
| $1,500 to $1,999 | 8 (8.0%) | 0 (0.0%) |
| $2,000 to $2,499 | 0 (0.0%) | 0 (0.0%) |
| $2,500 to $2,999 | 0 (0.0%) | 0 (0.0%) |
| $3,000 or more | 0 (0.0%) | 0 (0.0%) |
| Total | 100 (100.0%) | 23 (100.0%) |
Physical Housing Characteristics in North Loup
Housing Structures in North Loup
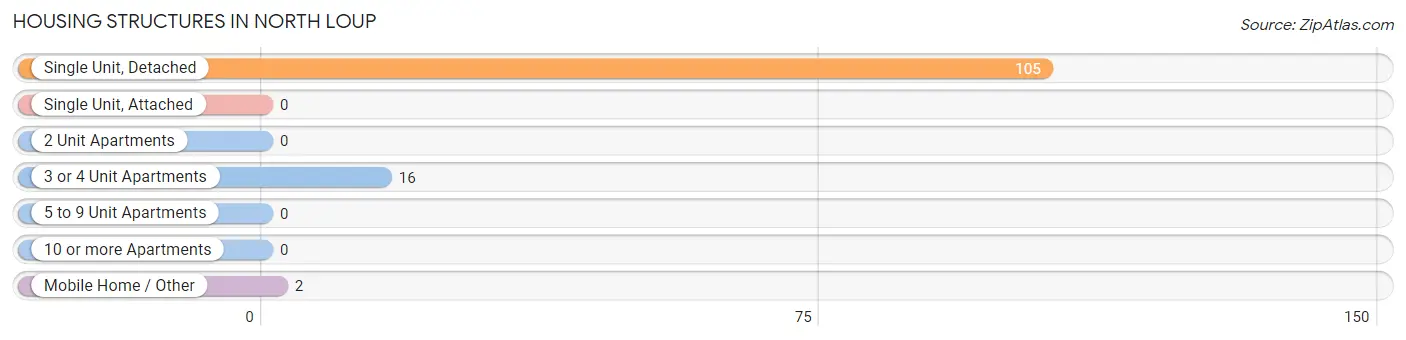
| Structure Type | # Housing Units | % Housing Units |
| Single Unit, Detached | 105 | 85.4% |
| Single Unit, Attached | 0 | 0.0% |
| 2 Unit Apartments | 0 | 0.0% |
| 3 or 4 Unit Apartments | 16 | 13.0% |
| 5 to 9 Unit Apartments | 0 | 0.0% |
| 10 or more Apartments | 0 | 0.0% |
| Mobile Home / Other | 2 | 1.6% |
| Total | 123 | 100.0% |
Housing Structures by Occupancy in North Loup
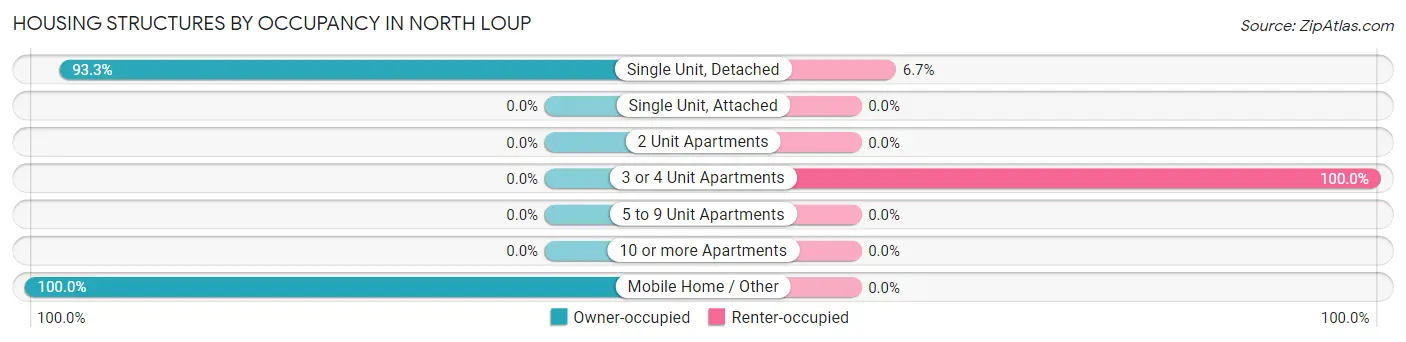
| Structure Type | Owner-occupied | Renter-occupied |
| Single Unit, Detached | 98 (93.3%) | 7 (6.7%) |
| Single Unit, Attached | 0 (0.0%) | 0 (0.0%) |
| 2 Unit Apartments | 0 (0.0%) | 0 (0.0%) |
| 3 or 4 Unit Apartments | 0 (0.0%) | 16 (100.0%) |
| 5 to 9 Unit Apartments | 0 (0.0%) | 0 (0.0%) |
| 10 or more Apartments | 0 (0.0%) | 0 (0.0%) |
| Mobile Home / Other | 2 (100.0%) | 0 (0.0%) |
| Total | 100 (81.3%) | 23 (18.7%) |
Housing Structures by Number of Rooms in North Loup
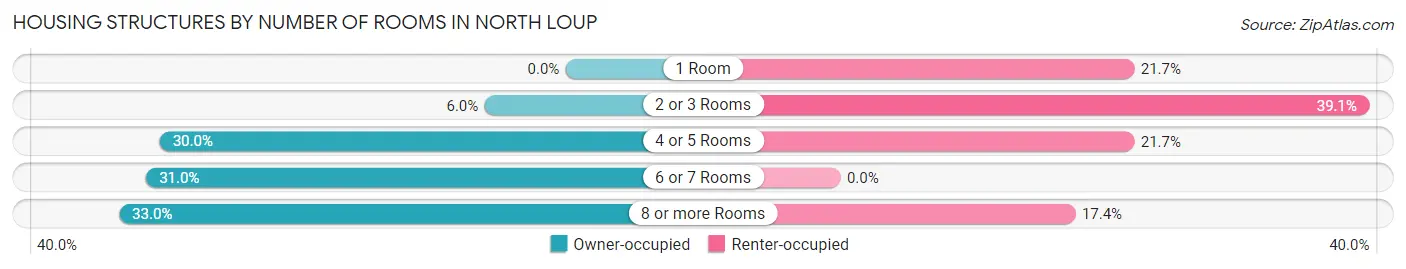
| Number of Rooms | Owner-occupied | Renter-occupied |
| 1 Room | 0 (0.0%) | 5 (21.7%) |
| 2 or 3 Rooms | 6 (6.0%) | 9 (39.1%) |
| 4 or 5 Rooms | 30 (30.0%) | 5 (21.7%) |
| 6 or 7 Rooms | 31 (31.0%) | 0 (0.0%) |
| 8 or more Rooms | 33 (33.0%) | 4 (17.4%) |
| Total | 100 (100.0%) | 23 (100.0%) |
Housing Structure by Heating Type in North Loup
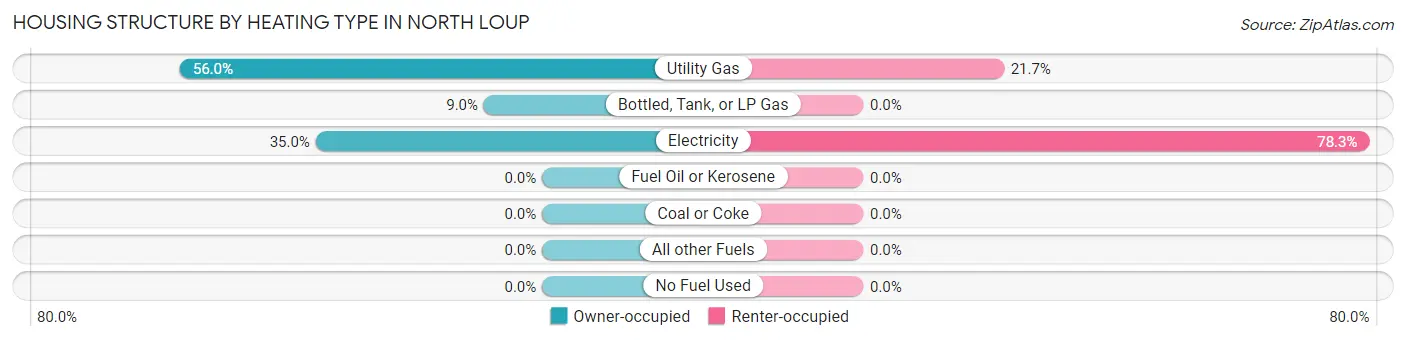
| Heating Type | Owner-occupied | Renter-occupied |
| Utility Gas | 56 (56.0%) | 5 (21.7%) |
| Bottled, Tank, or LP Gas | 9 (9.0%) | 0 (0.0%) |
| Electricity | 35 (35.0%) | 18 (78.3%) |
| Fuel Oil or Kerosene | 0 (0.0%) | 0 (0.0%) |
| Coal or Coke | 0 (0.0%) | 0 (0.0%) |
| All other Fuels | 0 (0.0%) | 0 (0.0%) |
| No Fuel Used | 0 (0.0%) | 0 (0.0%) |
| Total | 100 (100.0%) | 23 (100.0%) |
Household Vehicle Usage in North Loup
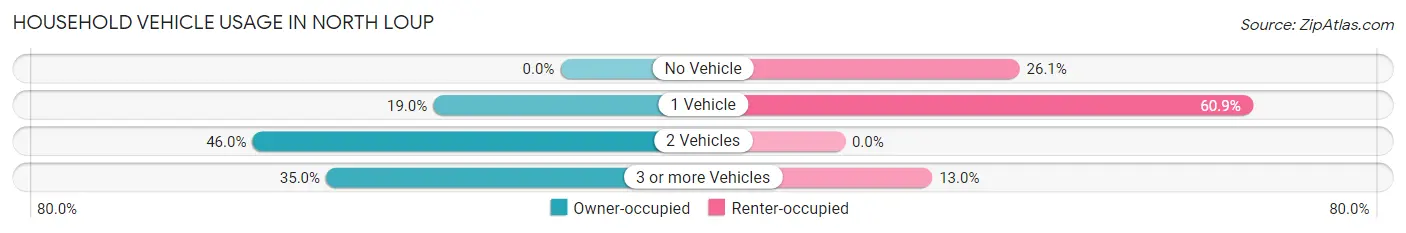
| Vehicles per Household | Owner-occupied | Renter-occupied |
| No Vehicle | 0 (0.0%) | 6 (26.1%) |
| 1 Vehicle | 19 (19.0%) | 14 (60.9%) |
| 2 Vehicles | 46 (46.0%) | 0 (0.0%) |
| 3 or more Vehicles | 35 (35.0%) | 3 (13.0%) |
| Total | 100 (100.0%) | 23 (100.0%) |
Real Estate & Mortgages in North Loup
Real Estate and Mortgage Overview in North Loup
| Characteristic | Without Mortgage | With Mortgage |
| Housing Units | 55 | 45 |
| Median Property Value | $50,600 | $88,300 |
| Median Household Income | $44,688 | $2 |
| Monthly Housing Costs | $447 | $0 |
| Real Estate Taxes | $950 | $0 |
Property Value by Mortgage Status in North Loup
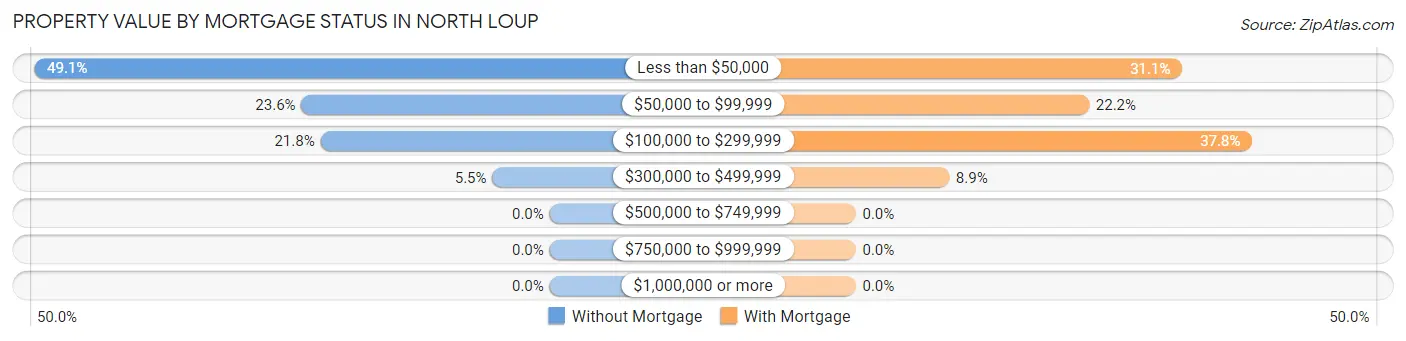
| Property Value | Without Mortgage | With Mortgage |
| Less than $50,000 | 27 (49.1%) | 14 (31.1%) |
| $50,000 to $99,999 | 13 (23.6%) | 10 (22.2%) |
| $100,000 to $299,999 | 12 (21.8%) | 17 (37.8%) |
| $300,000 to $499,999 | 3 (5.4%) | 4 (8.9%) |
| $500,000 to $749,999 | 0 (0.0%) | 0 (0.0%) |
| $750,000 to $999,999 | 0 (0.0%) | 0 (0.0%) |
| $1,000,000 or more | 0 (0.0%) | 0 (0.0%) |
| Total | 55 (100.0%) | 45 (100.0%) |
Household Income by Mortgage Status in North Loup
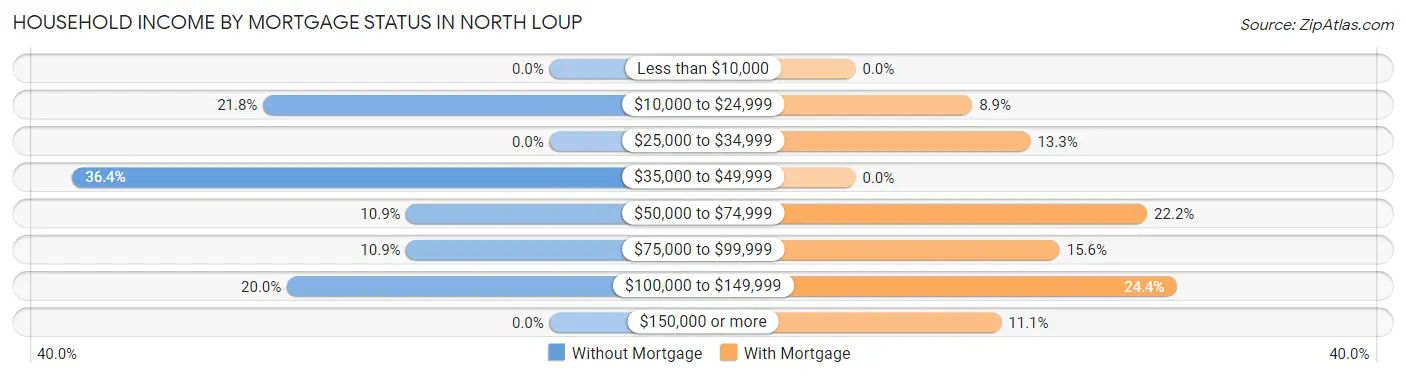
| Household Income | Without Mortgage | With Mortgage |
| Less than $10,000 | 0 (0.0%) | 0 (0.0%) |
| $10,000 to $24,999 | 12 (21.8%) | 4 (8.9%) |
| $25,000 to $34,999 | 0 (0.0%) | 6 (13.3%) |
| $35,000 to $49,999 | 20 (36.4%) | 0 (0.0%) |
| $50,000 to $74,999 | 6 (10.9%) | 10 (22.2%) |
| $75,000 to $99,999 | 6 (10.9%) | 7 (15.6%) |
| $100,000 to $149,999 | 11 (20.0%) | 11 (24.4%) |
| $150,000 or more | 0 (0.0%) | 5 (11.1%) |
| Total | 55 (100.0%) | 45 (100.0%) |
Property Value to Household Income Ratio in North Loup
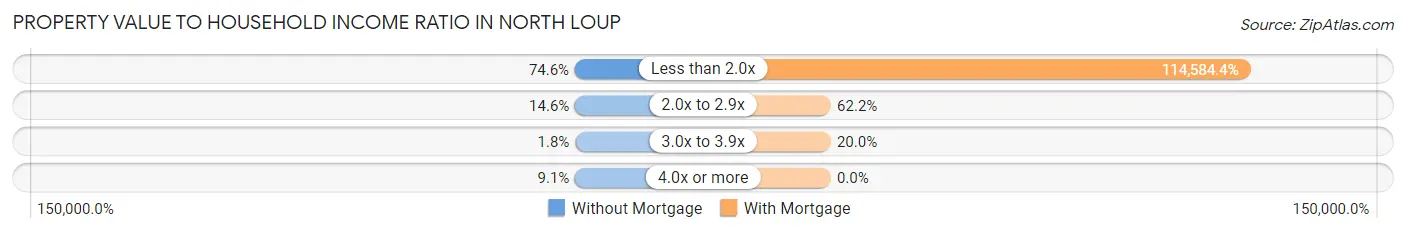
| Value-to-Income Ratio | Without Mortgage | With Mortgage |
| Less than 2.0x | 41 (74.6%) | 51,563 (114,584.4%) |
| 2.0x to 2.9x | 8 (14.5%) | 28 (62.2%) |
| 3.0x to 3.9x | 1 (1.8%) | 9 (20.0%) |
| 4.0x or more | 5 (9.1%) | 0 (0.0%) |
| Total | 55 (100.0%) | 45 (100.0%) |
Real Estate Taxes by Mortgage Status in North Loup
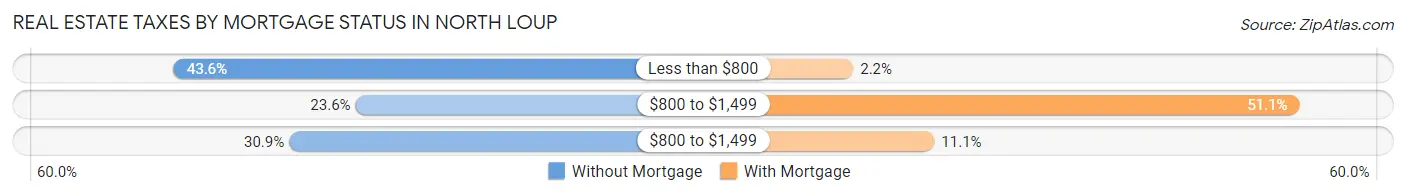
| Property Taxes | Without Mortgage | With Mortgage |
| Less than $800 | 24 (43.6%) | 1 (2.2%) |
| $800 to $1,499 | 13 (23.6%) | 23 (51.1%) |
| $800 to $1,499 | 17 (30.9%) | 5 (11.1%) |
| Total | 55 (100.0%) | 45 (100.0%) |
Health & Disability in North Loup
Health Insurance Coverage by Age in North Loup
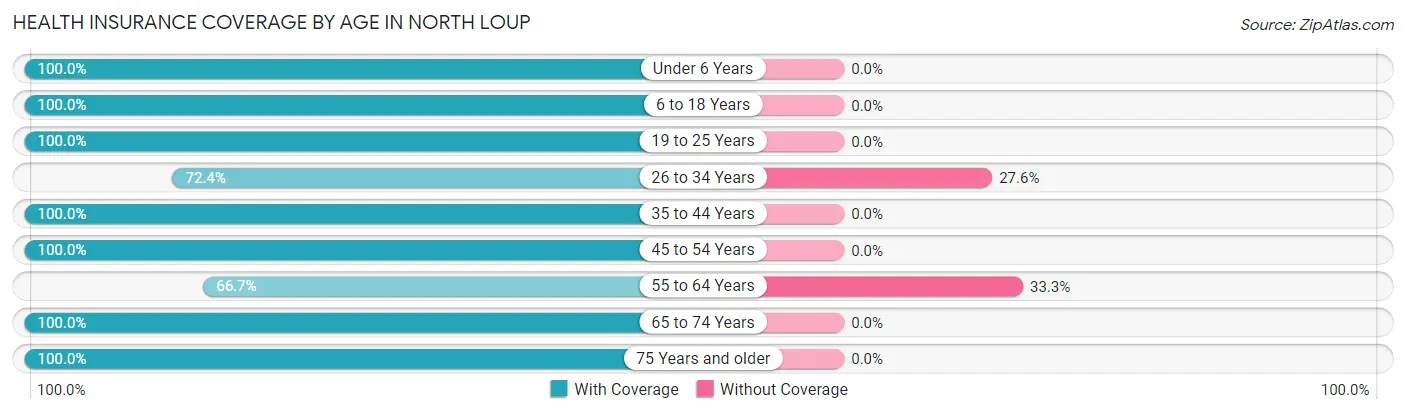
| Age Bracket | With Coverage | Without Coverage |
| Under 6 Years | 17 (100.0%) | 0 (0.0%) |
| 6 to 18 Years | 12 (100.0%) | 0 (0.0%) |
| 19 to 25 Years | 7 (100.0%) | 0 (0.0%) |
| 26 to 34 Years | 21 (72.4%) | 8 (27.6%) |
| 35 to 44 Years | 19 (100.0%) | 0 (0.0%) |
| 45 to 54 Years | 19 (100.0%) | 0 (0.0%) |
| 55 to 64 Years | 28 (66.7%) | 14 (33.3%) |
| 65 to 74 Years | 37 (100.0%) | 0 (0.0%) |
| 75 Years and older | 39 (100.0%) | 0 (0.0%) |
| Total | 199 (90.0%) | 22 (10.0%) |
Health Insurance Coverage by Citizenship Status in North Loup
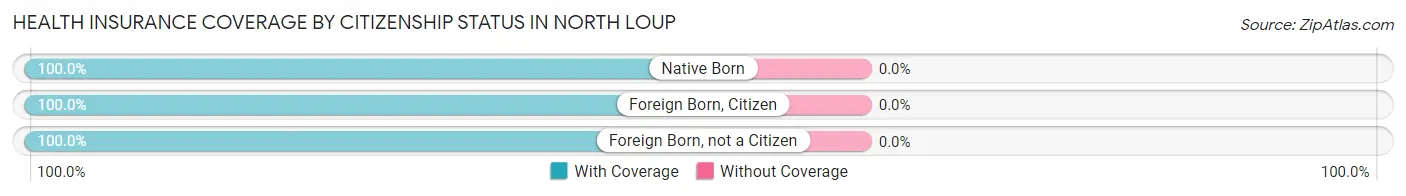
| Citizenship Status | With Coverage | Without Coverage |
| Native Born | 17 (100.0%) | 0 (0.0%) |
| Foreign Born, Citizen | 12 (100.0%) | 0 (0.0%) |
| Foreign Born, not a Citizen | 7 (100.0%) | 0 (0.0%) |
Health Insurance Coverage by Household Income in North Loup
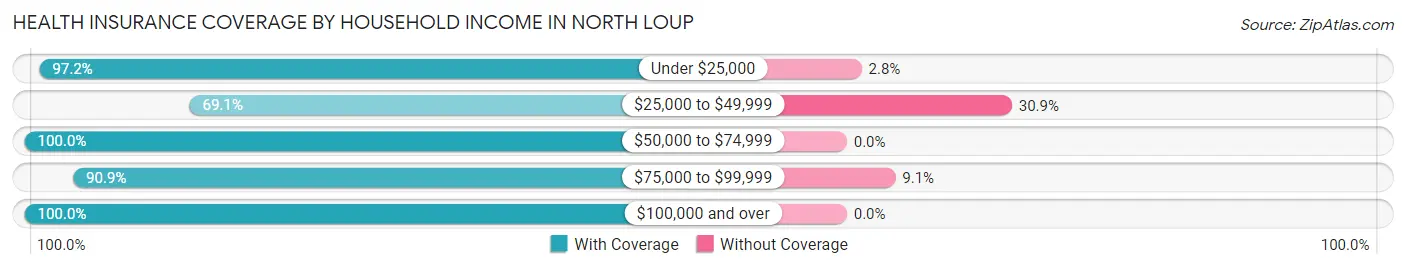
| Household Income | With Coverage | Without Coverage |
| Under $25,000 | 35 (97.2%) | 1 (2.8%) |
| $25,000 to $49,999 | 38 (69.1%) | 17 (30.9%) |
| $50,000 to $74,999 | 40 (100.0%) | 0 (0.0%) |
| $75,000 to $99,999 | 40 (90.9%) | 4 (9.1%) |
| $100,000 and over | 46 (100.0%) | 0 (0.0%) |
Public vs Private Health Insurance Coverage by Age in North Loup
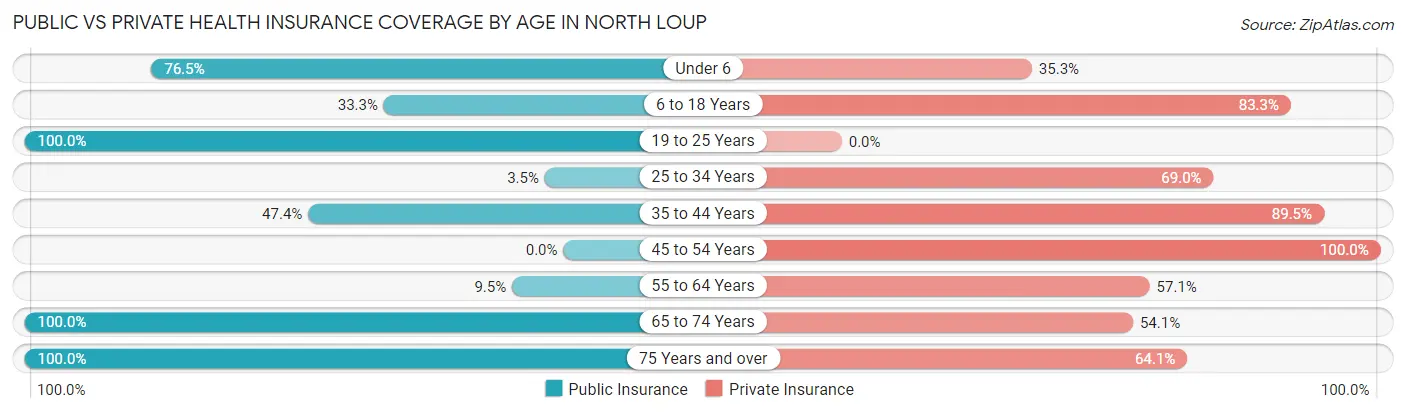
| Age Bracket | Public Insurance | Private Insurance |
| Under 6 | 13 (76.5%) | 6 (35.3%) |
| 6 to 18 Years | 4 (33.3%) | 10 (83.3%) |
| 19 to 25 Years | 7 (100.0%) | 0 (0.0%) |
| 25 to 34 Years | 1 (3.5%) | 20 (69.0%) |
| 35 to 44 Years | 9 (47.4%) | 17 (89.5%) |
| 45 to 54 Years | 0 (0.0%) | 19 (100.0%) |
| 55 to 64 Years | 4 (9.5%) | 24 (57.1%) |
| 65 to 74 Years | 37 (100.0%) | 20 (54.0%) |
| 75 Years and over | 39 (100.0%) | 25 (64.1%) |
| Total | 114 (51.6%) | 141 (63.8%) |
Disability Status by Sex by Age in North Loup
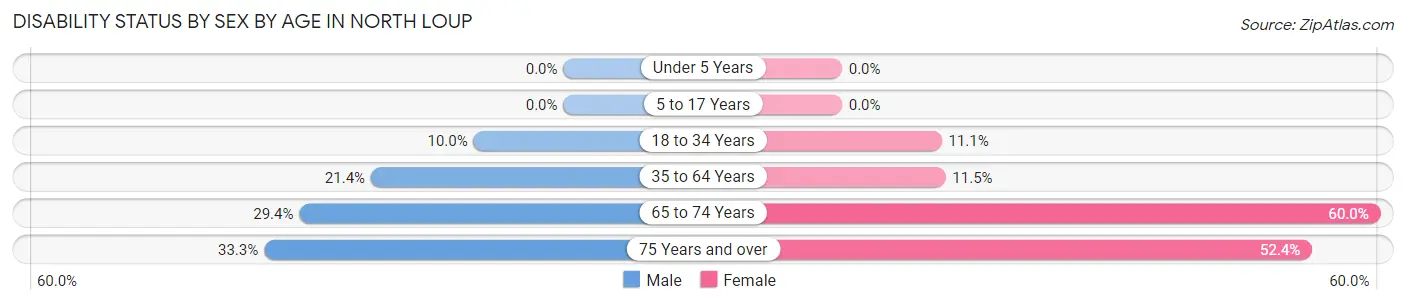
| Age Bracket | Male | Female |
| Under 5 Years | 0 (0.0%) | 0 (0.0%) |
| 5 to 17 Years | 0 (0.0%) | 0 (0.0%) |
| 18 to 34 Years | 2 (10.0%) | 2 (11.1%) |
| 35 to 64 Years | 6 (21.4%) | 6 (11.5%) |
| 65 to 74 Years | 5 (29.4%) | 12 (60.0%) |
| 75 Years and over | 6 (33.3%) | 11 (52.4%) |
Disability Class by Sex by Age in North Loup
Disability Class: Hearing Difficulty
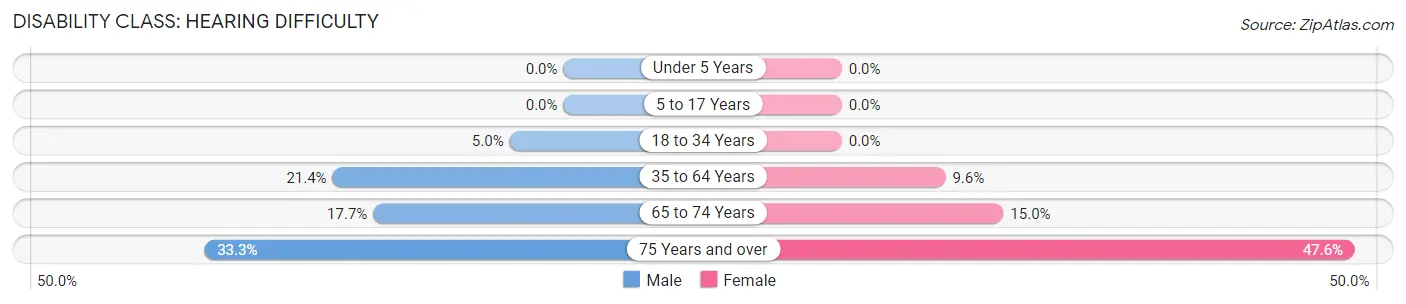
| Age Bracket | Male | Female |
| Under 5 Years | 0 (0.0%) | 0 (0.0%) |
| 5 to 17 Years | 0 (0.0%) | 0 (0.0%) |
| 18 to 34 Years | 1 (5.0%) | 0 (0.0%) |
| 35 to 64 Years | 6 (21.4%) | 5 (9.6%) |
| 65 to 74 Years | 3 (17.6%) | 3 (15.0%) |
| 75 Years and over | 6 (33.3%) | 10 (47.6%) |
Disability Class: Vision Difficulty
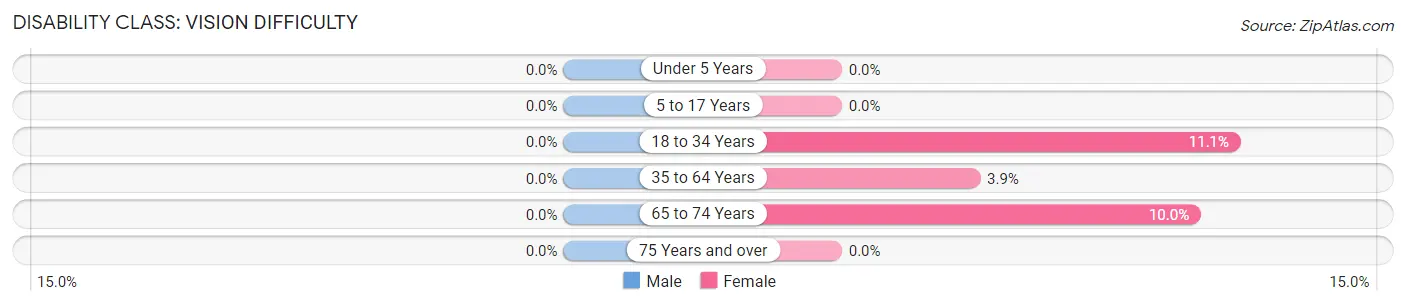
| Age Bracket | Male | Female |
| Under 5 Years | 0 (0.0%) | 0 (0.0%) |
| 5 to 17 Years | 0 (0.0%) | 0 (0.0%) |
| 18 to 34 Years | 0 (0.0%) | 2 (11.1%) |
| 35 to 64 Years | 0 (0.0%) | 2 (3.8%) |
| 65 to 74 Years | 0 (0.0%) | 2 (10.0%) |
| 75 Years and over | 0 (0.0%) | 0 (0.0%) |
Disability Class: Cognitive Difficulty
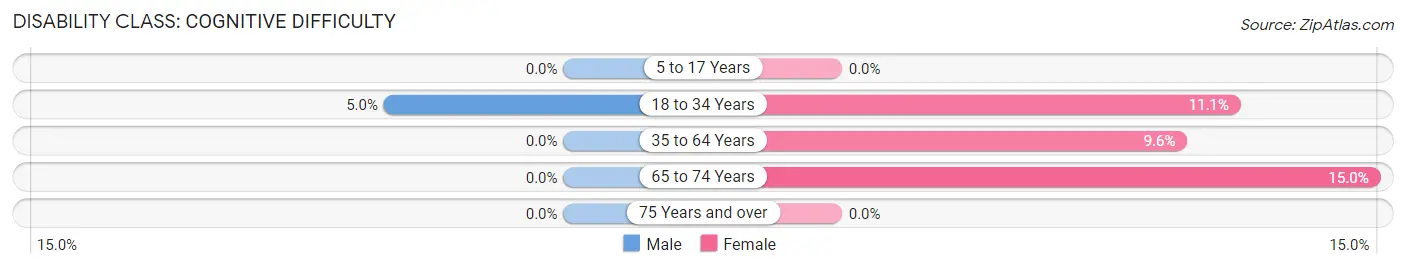
| Age Bracket | Male | Female |
| 5 to 17 Years | 0 (0.0%) | 0 (0.0%) |
| 18 to 34 Years | 1 (5.0%) | 2 (11.1%) |
| 35 to 64 Years | 0 (0.0%) | 5 (9.6%) |
| 65 to 74 Years | 0 (0.0%) | 3 (15.0%) |
| 75 Years and over | 0 (0.0%) | 0 (0.0%) |
Disability Class: Ambulatory Difficulty
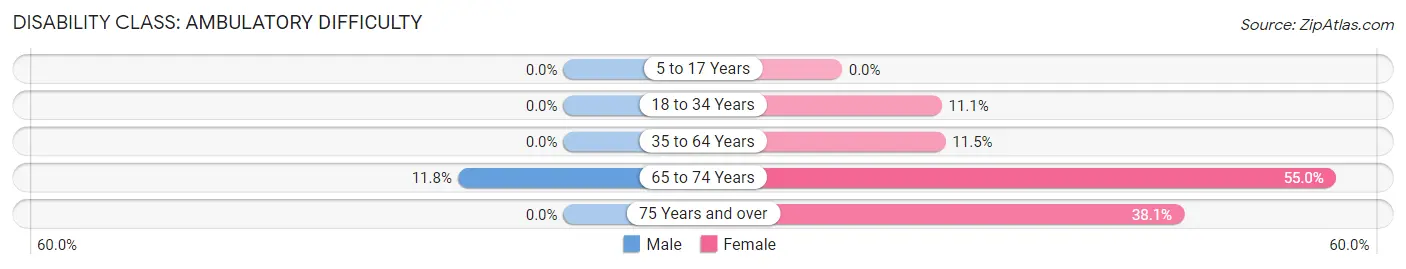
| Age Bracket | Male | Female |
| 5 to 17 Years | 0 (0.0%) | 0 (0.0%) |
| 18 to 34 Years | 0 (0.0%) | 2 (11.1%) |
| 35 to 64 Years | 0 (0.0%) | 6 (11.5%) |
| 65 to 74 Years | 2 (11.8%) | 11 (55.0%) |
| 75 Years and over | 0 (0.0%) | 8 (38.1%) |
Disability Class: Self-Care Difficulty
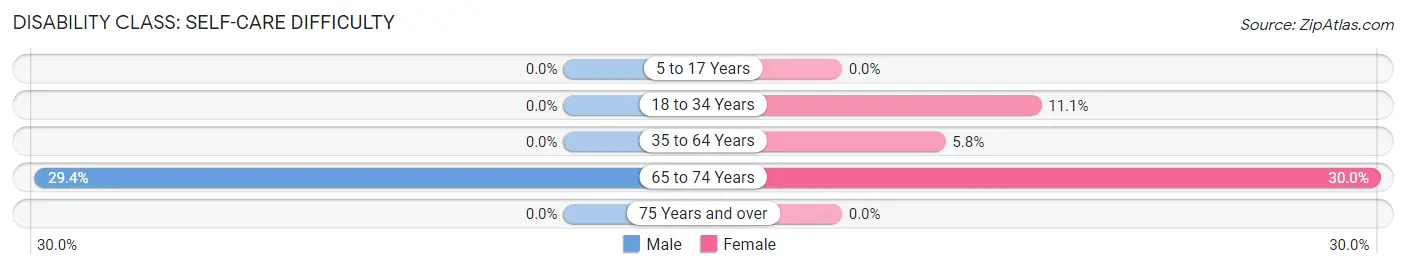
| Age Bracket | Male | Female |
| 5 to 17 Years | 0 (0.0%) | 0 (0.0%) |
| 18 to 34 Years | 0 (0.0%) | 2 (11.1%) |
| 35 to 64 Years | 0 (0.0%) | 3 (5.8%) |
| 65 to 74 Years | 5 (29.4%) | 6 (30.0%) |
| 75 Years and over | 0 (0.0%) | 0 (0.0%) |
Technology Access in North Loup
Computing Device Access in North Loup
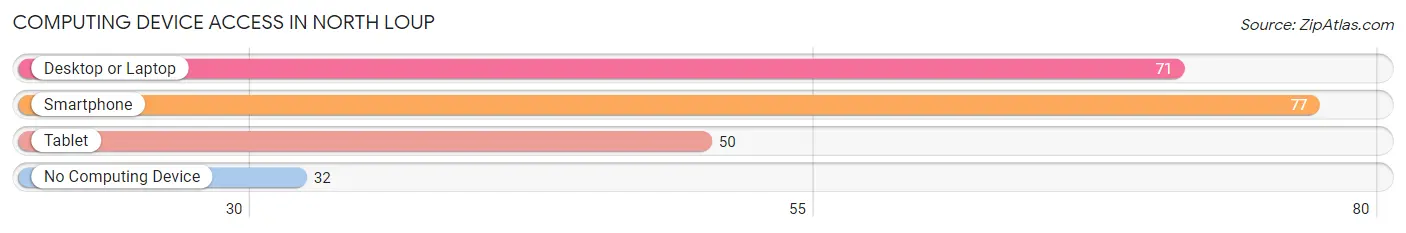
| Device Type | # Households | % Households |
| Desktop or Laptop | 71 | 57.7% |
| Smartphone | 77 | 62.6% |
| Tablet | 50 | 40.6% |
| No Computing Device | 32 | 26.0% |
| Total | 123 | 100.0% |
Internet Access in North Loup
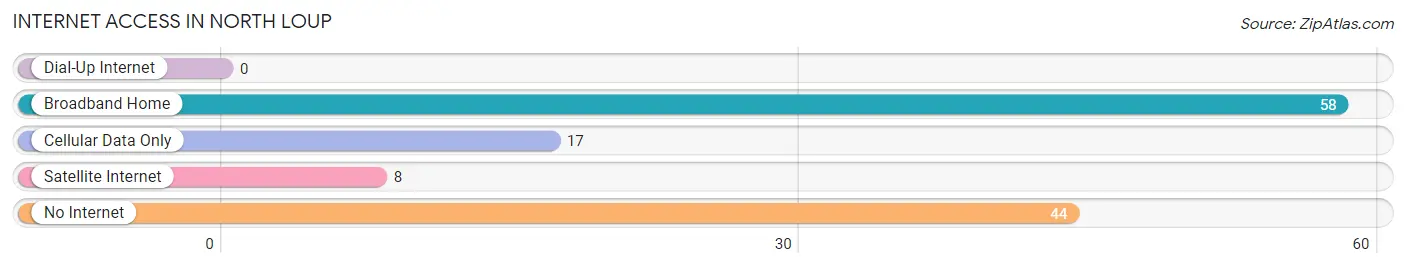
| Internet Type | # Households | % Households |
| Dial-Up Internet | 0 | 0.0% |
| Broadband Home | 58 | 47.1% |
| Cellular Data Only | 17 | 13.8% |
| Satellite Internet | 8 | 6.5% |
| No Internet | 44 | 35.8% |
| Total | 123 | 100.0% |
North Loup Summary
Loup is a small village located in Valley County, Nebraska, United States. It is situated on the banks of the North Loup River, which is a tributary of the Platte River. The population of the village was estimated to be around 200 people in 2020.
History
The area around North Loup was first settled in the late 1800s by settlers from Germany, Ireland, and Scandinavia. The village was originally known as "Loup City" and was established in 1887. The name was changed to North Loup in 1895.
The village was a major stop on the Union Pacific Railroad, which ran through the area. The railroad provided a major source of employment for the residents of North Loup. The village also had a post office, a general store, a blacksmith shop, and a hotel.
In the early 1900s, the village was a popular destination for tourists. The North Loup River was a popular spot for fishing and swimming. The village also had a movie theater and a bowling alley.
Geography
North Loup is located in Valley County, Nebraska, United States. It is situated on the banks of the North Loup River, which is a tributary of the Platte River. The village is located about 25 miles (40 km) northwest of Ord, Nebraska.
The village is located in a rural area and is surrounded by rolling hills and farmland. The nearest major city is Grand Island, which is about 50 miles (80 km) to the south.
Economy
The economy of North Loup is largely based on agriculture. The village is surrounded by farmland and many of the residents are involved in farming and ranching. The village also has a few small businesses, including a general store, a gas station, and a restaurant.
Demographics
The population of North Loup was estimated to be around 200 people in 2020. The village is predominantly white, with a small Hispanic population. The median household income is around $35,000. The village has a high rate of poverty, with around 25% of the population living below the poverty line.
Conclusion
North Loup is a small village located in Valley County, Nebraska, United States. It is situated on the banks of the North Loup River, which is a tributary of the Platte River. The village has a long history, dating back to the late 1800s. The economy of North Loup is largely based on agriculture, with many of the residents involved in farming and ranching. The population of the village was estimated to be around 200 people in 2020. The village is predominantly white, with a small Hispanic population. The median household income is around $35,000 and the village has a high rate of poverty.
Common Questions
What is Per Capita Income in North Loup?
Per Capita income in North Loup is $32,379.
What is the Median Family Income in North Loup?
Median Family Income in North Loup is $78,438.
What is the Median Household income in North Loup?
Median Household Income in North Loup is $46,146.
What is Income or Wage Gap in North Loup?
Income or Wage Gap in North Loup is 7.0%.
Women in North Loup earn 93.0 cents for every dollar earned by a man.
What is Inequality or Gini Index in North Loup?
Inequality or Gini Index in North Loup is 0.38.
What is the Total Population of North Loup?
Total Population of North Loup is 221.
What is the Total Male Population of North Loup?
Total Male Population of North Loup is 100.
What is the Total Female Population of North Loup?
Total Female Population of North Loup is 121.
What is the Ratio of Males per 100 Females in North Loup?
There are 82.64 Males per 100 Females in North Loup.
What is the Ratio of Females per 100 Males in North Loup?
There are 121.00 Females per 100 Males in North Loup.
What is the Median Population Age in North Loup?
Median Population Age in North Loup is 56.4 Years.
What is the Average Family Size in North Loup
Average Family Size in North Loup is 2.5 People.
What is the Average Household Size in North Loup
Average Household Size in North Loup is 1.8 People.
How Large is the Labor Force in North Loup?
There are 118 People in the Labor Forcein in North Loup.
What is the Percentage of People in the Labor Force in North Loup?
59.9% of People are in the Labor Force in North Loup.
What is the Unemployment Rate in North Loup?
Unemployment Rate in North Loup is 0.8%.