Newcastle, NE Map & Demographics
Newcastle Map
Newcastle Overview
$43,531
PER CAPITA INCOME
$71,250
AVG HOUSEHOLD INCOME
0.38
INEQUALITY / GINI INDEX
384
TOTAL POPULATION
211
MALE POPULATION
173
FEMALE POPULATION
121.97
MALES / 100 FEMALES
81.99
FEMALES / 100 MALES
57.2
MEDIAN AGE
2.5
AVG FAMILY SIZE
2.2
AVG HOUSEHOLD SIZE
213
LABOR FORCE [ PEOPLE ]
70.1%
PERCENT IN LABOR FORCE
Newcastle Zip Codes
Newcastle Area Codes
Income in Newcastle
Income Overview in Newcastle
| Characteristic | Number | Measure |
| Per Capita Income | 384 | $43,531 |
| Median Family Income | 128 | $0 |
| Mean Family Income | 128 | $122,839 |
| Median Household Income | 172 | $71,250 |
| Mean Household Income | 172 | $100,942 |
| Income Deficit | 128 | $0 |
| Wage / Income Gap (%) | 384 | 0.00% |
| Wage / Income Gap ($) | 384 | 100.00¢ per $1 |
| Gini / Inequality Index | 384 | 0.38 |
Earnings by Sex in Newcastle
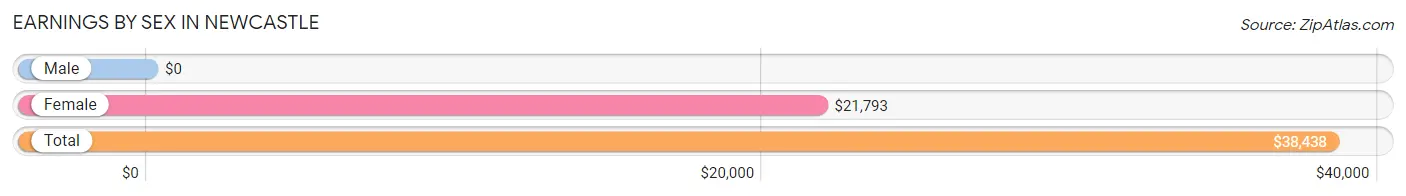
| Sex | Number | Average Earnings |
| Male | 111 (50.2%) | $0 |
| Female | 110 (49.8%) | $21,793 |
| Total | 221 (100.0%) | $38,438 |
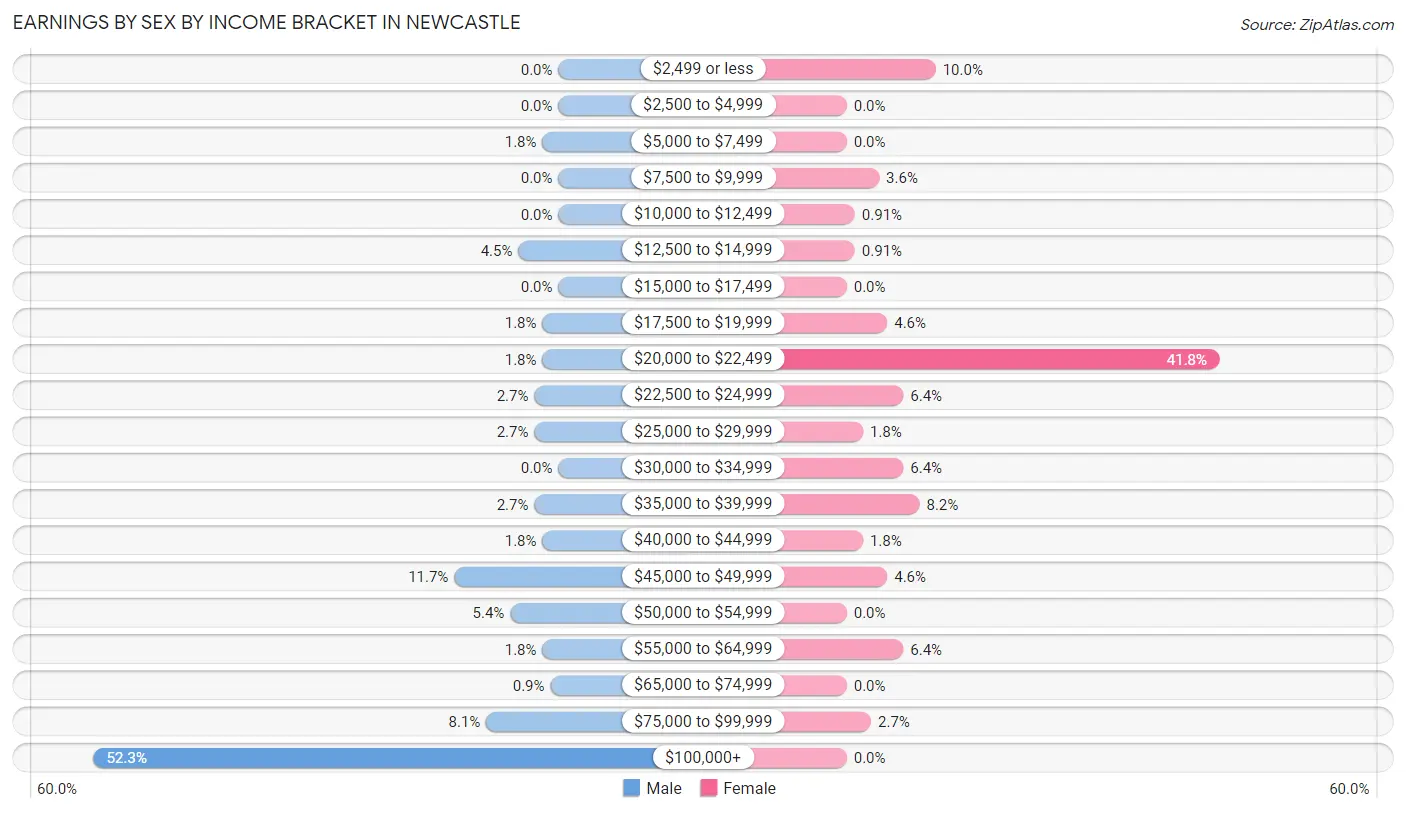
Earnings by Sex by Income Bracket in Newcastle
The most common earnings brackets in Newcastle are $100,000+ for men (58 | 52.2%) and $20,000 to $22,499 for women (46 | 41.8%).
| Income | Male | Female |
| $2,499 or less | 0 (0.0%) | 11 (10.0%) |
| $2,500 to $4,999 | 0 (0.0%) | 0 (0.0%) |
| $5,000 to $7,499 | 2 (1.8%) | 0 (0.0%) |
| $7,500 to $9,999 | 0 (0.0%) | 4 (3.6%) |
| $10,000 to $12,499 | 0 (0.0%) | 1 (0.9%) |
| $12,500 to $14,999 | 5 (4.5%) | 1 (0.9%) |
| $15,000 to $17,499 | 0 (0.0%) | 0 (0.0%) |
| $17,500 to $19,999 | 2 (1.8%) | 5 (4.5%) |
| $20,000 to $22,499 | 2 (1.8%) | 46 (41.8%) |
| $22,500 to $24,999 | 3 (2.7%) | 7 (6.4%) |
| $25,000 to $29,999 | 3 (2.7%) | 2 (1.8%) |
| $30,000 to $34,999 | 0 (0.0%) | 7 (6.4%) |
| $35,000 to $39,999 | 3 (2.7%) | 9 (8.2%) |
| $40,000 to $44,999 | 2 (1.8%) | 2 (1.8%) |
| $45,000 to $49,999 | 13 (11.7%) | 5 (4.5%) |
| $50,000 to $54,999 | 6 (5.4%) | 0 (0.0%) |
| $55,000 to $64,999 | 2 (1.8%) | 7 (6.4%) |
| $65,000 to $74,999 | 1 (0.9%) | 0 (0.0%) |
| $75,000 to $99,999 | 9 (8.1%) | 3 (2.7%) |
| $100,000+ | 58 (52.2%) | 0 (0.0%) |
| Total | 111 (100.0%) | 110 (100.0%) |
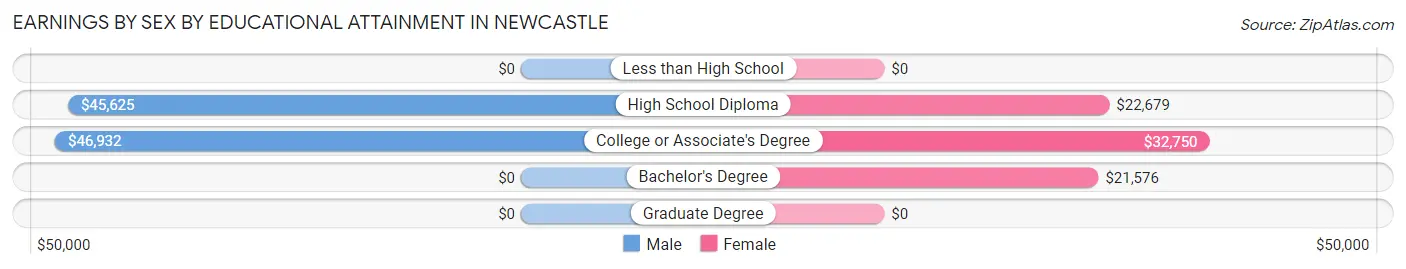
Earnings by Sex by Educational Attainment in Newcastle
Average earnings in Newcastle are $152,700 for men and $21,848 for women, a difference of 85.7%. Men with an educational attainment of college or associate's degree enjoy the highest average annual earnings of $46,932, while those with high school diploma education earn the least with $45,625. Women with an educational attainment of college or associate's degree earn the most with the average annual earnings of $32,750, while those with bachelor's degree education have the smallest earnings of $21,576.
| Educational Attainment | Male Income | Female Income |
| Less than High School | - | - |
| High School Diploma | $45,625 | $22,679 |
| College or Associate's Degree | $46,932 | $32,750 |
| Bachelor's Degree | - | - |
| Graduate Degree | - | - |
| Total | $152,700 | $21,848 |
Family Income in Newcastle
Family Income Brackets in Newcastle
According to the Newcastle family income data, there are 53 families falling into the $150,000 to $199,999 income range, which is the most common income bracket and makes up 41.4% of all families.
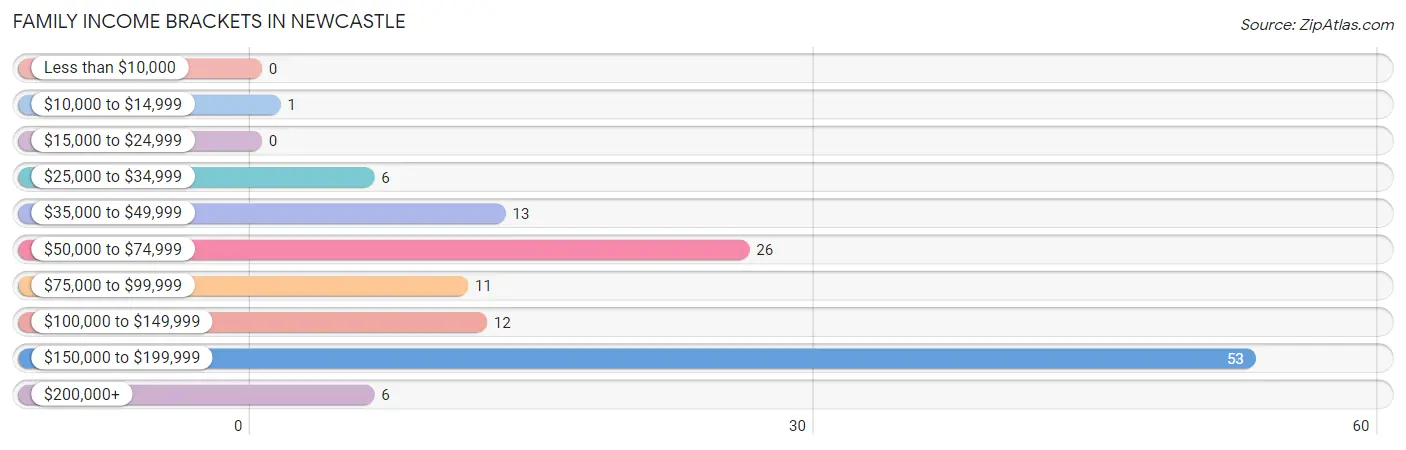
| Income Bracket | # Families | % Families |
| Less than $10,000 | 0 | 0.0% |
| $10,000 to $14,999 | 1 | 0.8% |
| $15,000 to $24,999 | 0 | 0.0% |
| $25,000 to $34,999 | 6 | 4.7% |
| $35,000 to $49,999 | 13 | 10.2% |
| $50,000 to $74,999 | 26 | 20.3% |
| $75,000 to $99,999 | 11 | 8.6% |
| $100,000 to $149,999 | 12 | 9.4% |
| $150,000 to $199,999 | 53 | 41.4% |
| $200,000+ | 6 | 4.7% |
Family Income by Famaliy Size in Newcastle
2-person families (81 | 63.3%) account for the highest median family income in Newcastle with $175,475 per family, while 2-person families (81 | 63.3%) have the highest median income of $87,738 per family member.
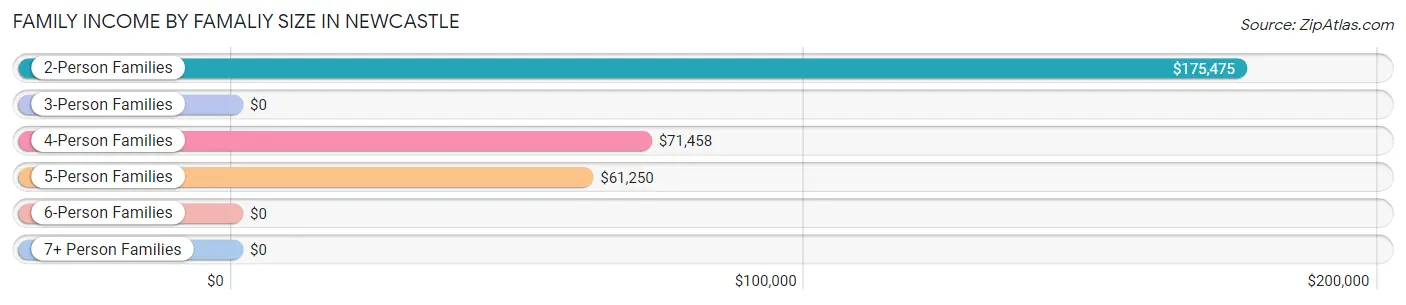
| Income Bracket | # Families | Median Income |
| 2-Person Families | 81 (63.3%) | $175,475 |
| 3-Person Families | 28 (21.9%) | $0 |
| 4-Person Families | 9 (7.0%) | $71,458 |
| 5-Person Families | 10 (7.8%) | $61,250 |
| 6-Person Families | 0 (0.0%) | $0 |
| 7+ Person Families | 0 (0.0%) | $0 |
| Total | 128 (100.0%) | $0 |
Family Income by Number of Earners in Newcastle
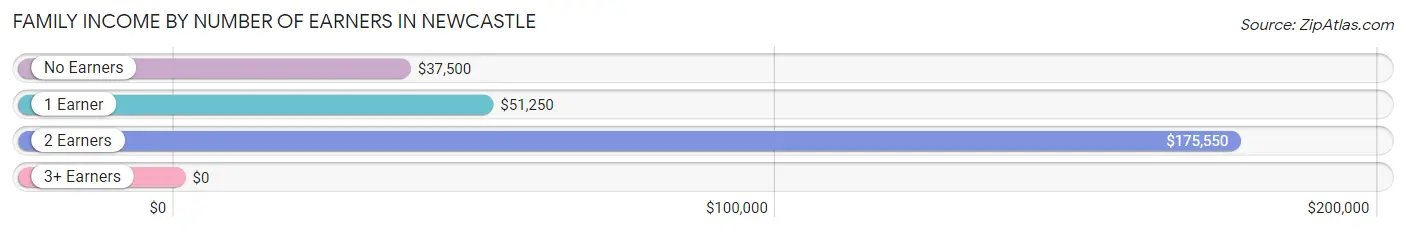
| Number of Earners | # Families | Median Income |
| No Earners | 8 (6.2%) | $37,500 |
| 1 Earner | 27 (21.1%) | $51,250 |
| 2 Earners | 90 (70.3%) | $175,550 |
| 3+ Earners | 3 (2.3%) | $0 |
| Total | 128 (100.0%) | $0 |
Household Income in Newcastle
Household Income Brackets in Newcastle
With 53 households falling in the category, the $150,000 to $199,999 income range is the most frequent in Newcastle, accounting for 30.8% of all households.
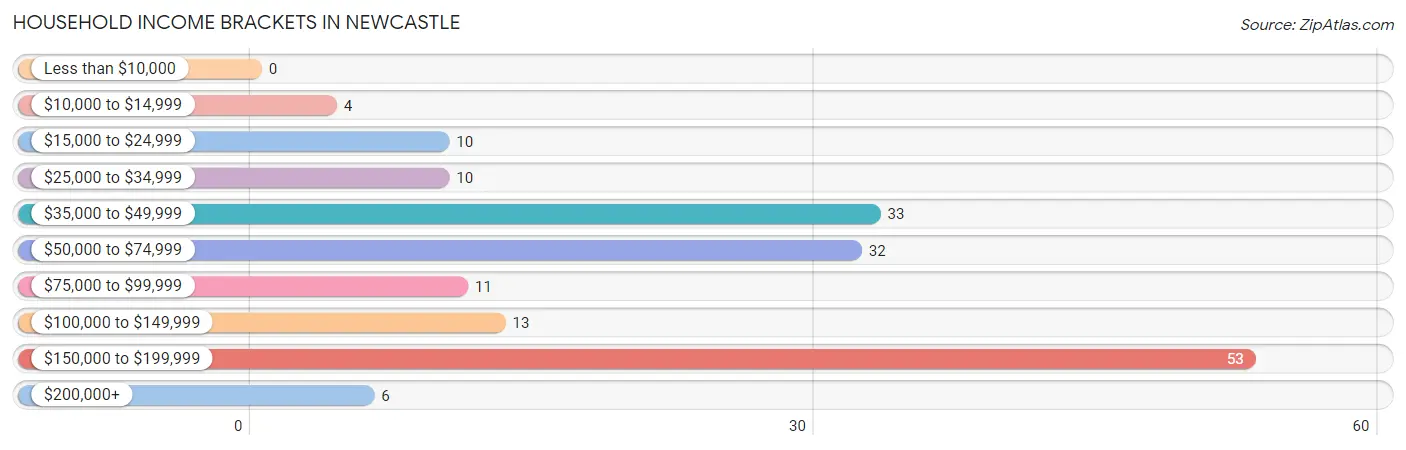
| Income Bracket | # Households | % Households |
| Less than $10,000 | 0 | 0.0% |
| $10,000 to $14,999 | 4 | 2.3% |
| $15,000 to $24,999 | 10 | 5.8% |
| $25,000 to $34,999 | 10 | 5.8% |
| $35,000 to $49,999 | 33 | 19.2% |
| $50,000 to $74,999 | 32 | 18.6% |
| $75,000 to $99,999 | 11 | 6.4% |
| $100,000 to $149,999 | 13 | 7.6% |
| $150,000 to $199,999 | 53 | 30.8% |
| $200,000+ | 6 | 3.5% |
Household Income by Householder Age in Newcastle
The median household income in Newcastle is $71,250, with the highest median household income of $175,575 found in the 45 to 64 years age bracket for the primary householder. A total of 89 households (51.7%) fall into this category.
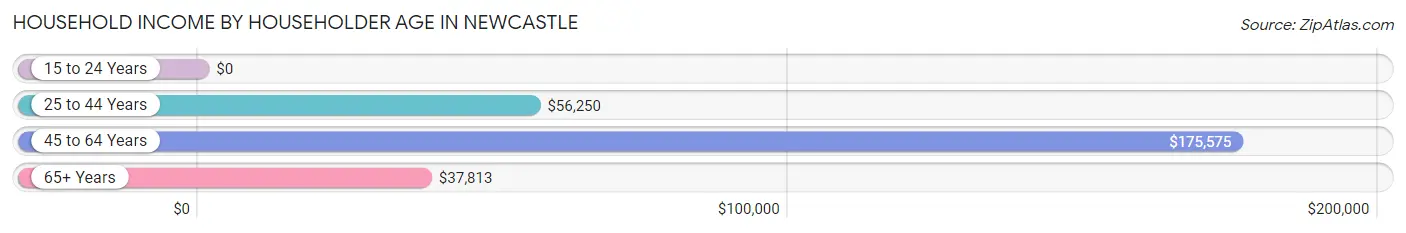
| Income Bracket | # Households | Median Income |
| 15 to 24 Years | 0 (0.0%) | $0 |
| 25 to 44 Years | 22 (12.8%) | $56,250 |
| 45 to 64 Years | 89 (51.7%) | $175,575 |
| 65+ Years | 61 (35.5%) | $37,813 |
| Total | 172 (100.0%) | $71,250 |
Poverty in Newcastle
Income Below Poverty by Sex and Age in Newcastle
With 1.9% poverty level for males and 9.2% for females among the residents of Newcastle, 35 to 44 year old males and 5 year old females are the most vulnerable to poverty, with 1 males (11.1%) and 1 females (100.0%) in their respective age groups living below the poverty level.
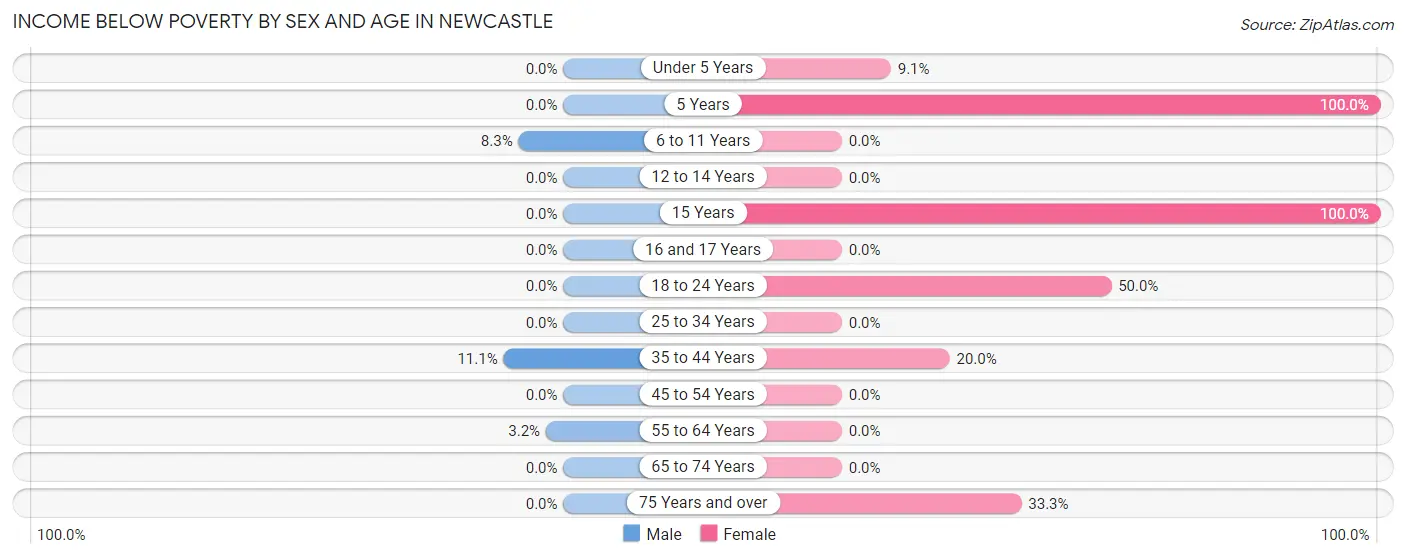
| Age Bracket | Male | Female |
| Under 5 Years | 0 (0.0%) | 1 (9.1%) |
| 5 Years | 0 (0.0%) | 1 (100.0%) |
| 6 to 11 Years | 1 (8.3%) | 0 (0.0%) |
| 12 to 14 Years | 0 (0.0%) | 0 (0.0%) |
| 15 Years | 0 (0.0%) | 3 (100.0%) |
| 16 and 17 Years | 0 (0.0%) | 0 (0.0%) |
| 18 to 24 Years | 0 (0.0%) | 6 (50.0%) |
| 25 to 34 Years | 0 (0.0%) | 0 (0.0%) |
| 35 to 44 Years | 1 (11.1%) | 1 (20.0%) |
| 45 to 54 Years | 0 (0.0%) | 0 (0.0%) |
| 55 to 64 Years | 2 (3.2%) | 0 (0.0%) |
| 65 to 74 Years | 0 (0.0%) | 0 (0.0%) |
| 75 Years and over | 0 (0.0%) | 4 (33.3%) |
| Total | 4 (1.9%) | 16 (9.2%) |
Income Above Poverty by Sex and Age in Newcastle
According to the poverty statistics in Newcastle, males aged under 5 years and females aged 6 to 11 years are the age groups that are most secure financially, with 100.0% of males and 100.0% of females in these age groups living above the poverty line.
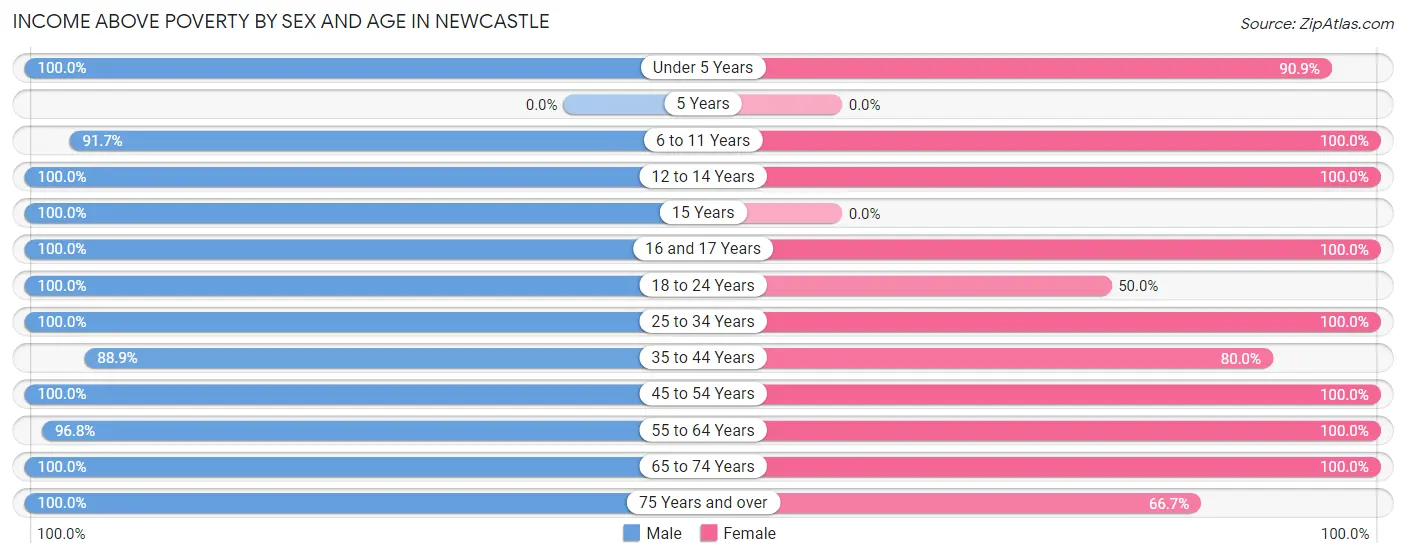
| Age Bracket | Male | Female |
| Under 5 Years | 13 (100.0%) | 10 (90.9%) |
| 5 Years | 0 (0.0%) | 0 (0.0%) |
| 6 to 11 Years | 11 (91.7%) | 4 (100.0%) |
| 12 to 14 Years | 10 (100.0%) | 8 (100.0%) |
| 15 Years | 12 (100.0%) | 0 (0.0%) |
| 16 and 17 Years | 2 (100.0%) | 4 (100.0%) |
| 18 to 24 Years | 7 (100.0%) | 6 (50.0%) |
| 25 to 34 Years | 10 (100.0%) | 9 (100.0%) |
| 35 to 44 Years | 8 (88.9%) | 4 (80.0%) |
| 45 to 54 Years | 17 (100.0%) | 19 (100.0%) |
| 55 to 64 Years | 60 (96.8%) | 58 (100.0%) |
| 65 to 74 Years | 38 (100.0%) | 27 (100.0%) |
| 75 Years and over | 13 (100.0%) | 8 (66.7%) |
| Total | 201 (98.1%) | 157 (90.7%) |
Income Below Poverty Among Married-Couple Families in Newcastle
The poverty statistics for married-couple families in Newcastle show that 1.0% or 1 of the total 104 families live below the poverty line. Families with 1 or 2 children have the highest poverty rate of 5.6%, comprising of 1 families. On the other hand, families with no children have the lowest poverty rate of 0.0%, which includes 0 families.
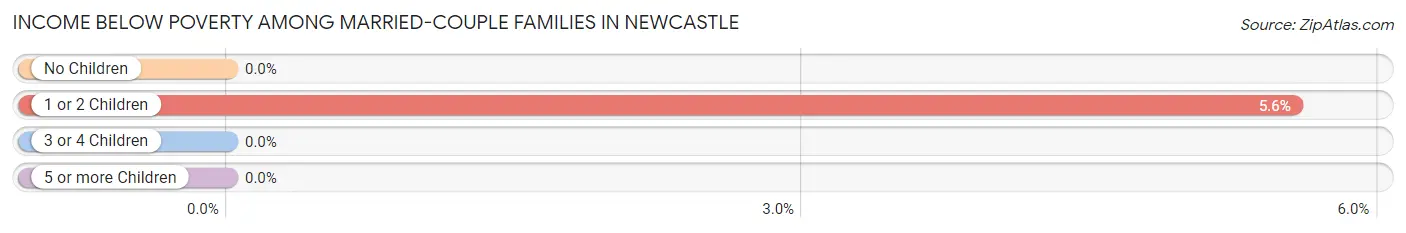
| Children | Above Poverty | Below Poverty |
| No Children | 80 (100.0%) | 0 (0.0%) |
| 1 or 2 Children | 17 (94.4%) | 1 (5.6%) |
| 3 or 4 Children | 6 (100.0%) | 0 (0.0%) |
| 5 or more Children | 0 (0.0%) | 0 (0.0%) |
| Total | 103 (99.0%) | 1 (1.0%) |
Income Below Poverty Among Single-Parent Households in Newcastle
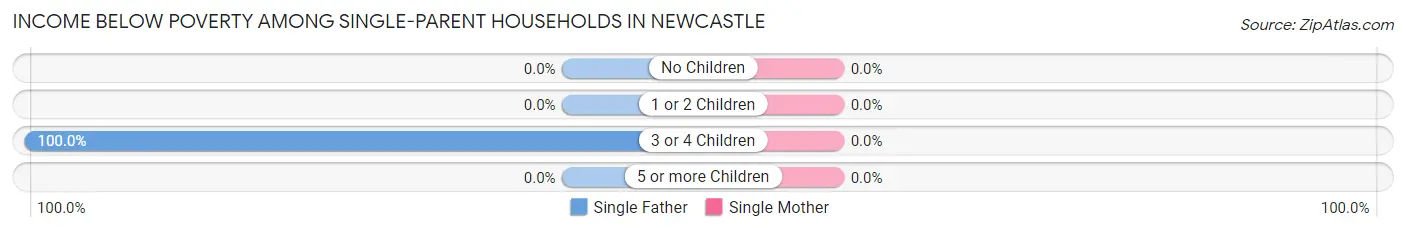
| Children | Single Father | Single Mother |
| No Children | 0 (0.0%) | 0 (0.0%) |
| 1 or 2 Children | 0 (0.0%) | 0 (0.0%) |
| 3 or 4 Children | 1 (100.0%) | 0 (0.0%) |
| 5 or more Children | 0 (0.0%) | 0 (0.0%) |
| Total | 1 (7.7%) | 0 (0.0%) |
Income Below Poverty Among Married-Couple vs Single-Parent Households in Newcastle
The poverty data for Newcastle shows that 1 of the married-couple family households (1.0%) and 1 of the single-parent households (4.2%) are living below the poverty level. Within the married-couple family households, those with 1 or 2 children have the highest poverty rate, with 1 households (5.6%) falling below the poverty line. Among the single-parent households, those with 3 or 4 children have the highest poverty rate, with 1 household (50.0%) living below poverty.
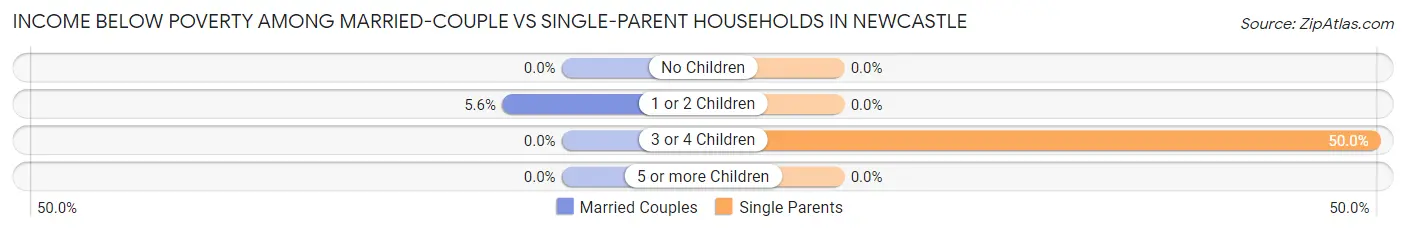
| Children | Married-Couple Families | Single-Parent Households |
| No Children | 0 (0.0%) | 0 (0.0%) |
| 1 or 2 Children | 1 (5.6%) | 0 (0.0%) |
| 3 or 4 Children | 0 (0.0%) | 1 (50.0%) |
| 5 or more Children | 0 (0.0%) | 0 (0.0%) |
| Total | 1 (1.0%) | 1 (4.2%) |
Race in Newcastle
The most populous races in Newcastle are White / Caucasian (376 | 97.9%), and Two or more Races (8 | 2.1%).
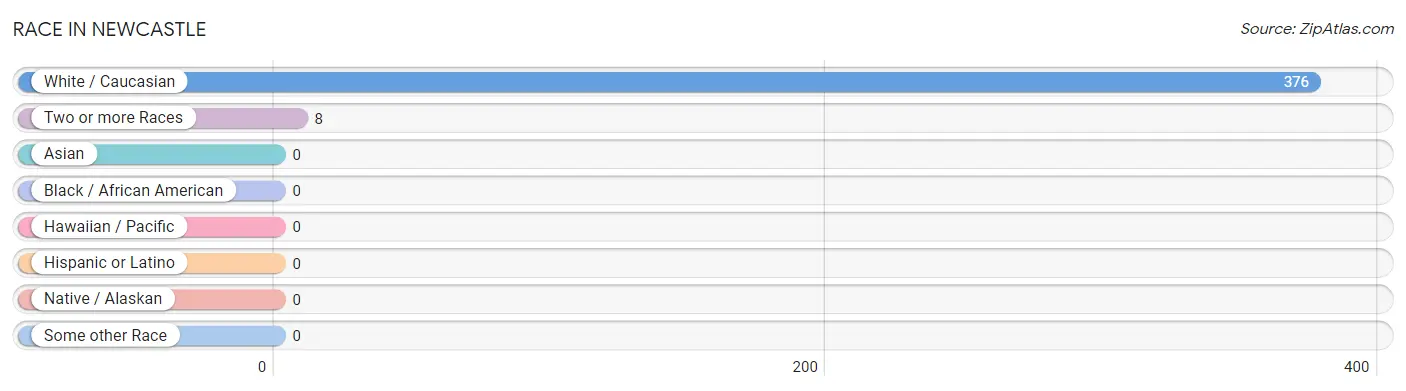
| Race | # Population | % Population |
| Asian | 0 | 0.0% |
| Black / African American | 0 | 0.0% |
| Hawaiian / Pacific | 0 | 0.0% |
| Hispanic or Latino | 0 | 0.0% |
| Native / Alaskan | 0 | 0.0% |
| White / Caucasian | 376 | 97.9% |
| Two or more Races | 8 | 2.1% |
| Some other Race | 0 | 0.0% |
| Total | 384 | 100.0% |
Ancestry in Newcastle
The most populous ancestries reported in Newcastle are German (183 | 47.7%), Norwegian (71 | 18.5%), Irish (65 | 16.9%), Scandinavian (26 | 6.8%), and British (21 | 5.5%), together accounting for 95.3% of all Newcastle residents.
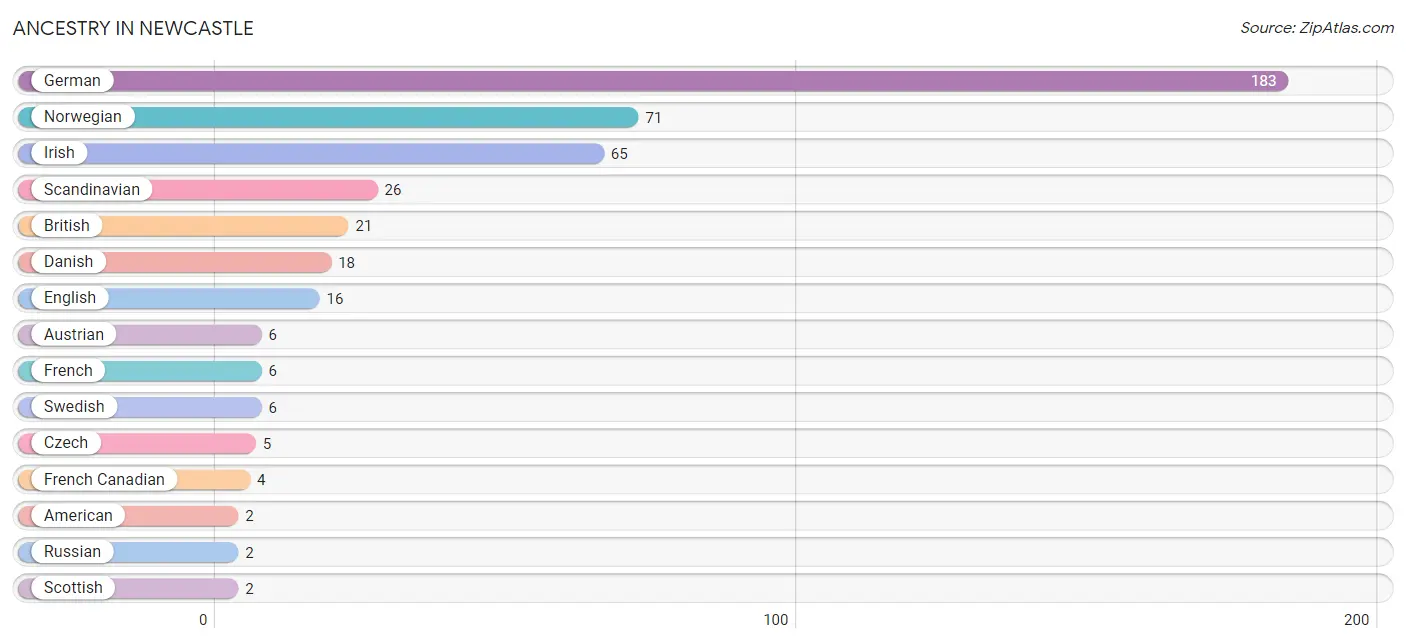
| Ancestry | # Population | % Population |
| American | 2 | 0.5% |
| Austrian | 6 | 1.6% |
| British | 21 | 5.5% |
| Czech | 5 | 1.3% |
| Danish | 18 | 4.7% |
| Dutch | 1 | 0.3% |
| English | 16 | 4.2% |
| French | 6 | 1.6% |
| French Canadian | 4 | 1.0% |
| German | 183 | 47.7% |
| Irish | 65 | 16.9% |
| Norwegian | 71 | 18.5% |
| Polish | 1 | 0.3% |
| Russian | 2 | 0.5% |
| Scandinavian | 26 | 6.8% |
| Scotch-Irish | 1 | 0.3% |
| Scottish | 2 | 0.5% |
| Swedish | 6 | 1.6% |
| Swiss | 2 | 0.5% | View All 19 Rows |
Immigrants in Newcastle

| Immigration Origin | # Population | % Population | View All 0 Rows |
Sex and Age in Newcastle
Sex and Age in Newcastle
The most populous age groups in Newcastle are 55 to 59 Years (52 | 24.6%) for men and 55 to 59 Years (56 | 32.4%) for women.
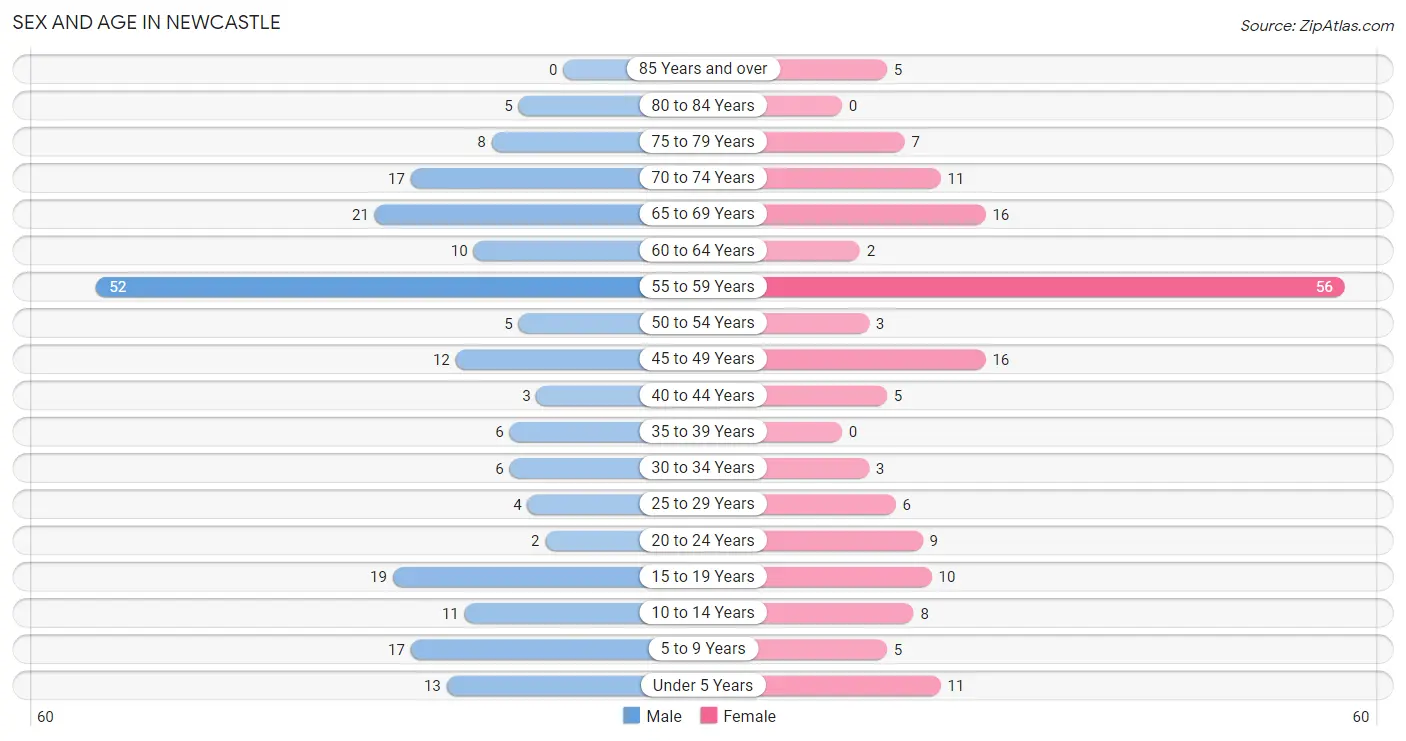
| Age Bracket | Male | Female |
| Under 5 Years | 13 (6.2%) | 11 (6.4%) |
| 5 to 9 Years | 17 (8.1%) | 5 (2.9%) |
| 10 to 14 Years | 11 (5.2%) | 8 (4.6%) |
| 15 to 19 Years | 19 (9.0%) | 10 (5.8%) |
| 20 to 24 Years | 2 (0.9%) | 9 (5.2%) |
| 25 to 29 Years | 4 (1.9%) | 6 (3.5%) |
| 30 to 34 Years | 6 (2.8%) | 3 (1.7%) |
| 35 to 39 Years | 6 (2.8%) | 0 (0.0%) |
| 40 to 44 Years | 3 (1.4%) | 5 (2.9%) |
| 45 to 49 Years | 12 (5.7%) | 16 (9.2%) |
| 50 to 54 Years | 5 (2.4%) | 3 (1.7%) |
| 55 to 59 Years | 52 (24.6%) | 56 (32.4%) |
| 60 to 64 Years | 10 (4.7%) | 2 (1.2%) |
| 65 to 69 Years | 21 (10.0%) | 16 (9.2%) |
| 70 to 74 Years | 17 (8.1%) | 11 (6.4%) |
| 75 to 79 Years | 8 (3.8%) | 7 (4.1%) |
| 80 to 84 Years | 5 (2.4%) | 0 (0.0%) |
| 85 Years and over | 0 (0.0%) | 5 (2.9%) |
| Total | 211 (100.0%) | 173 (100.0%) |
Families and Households in Newcastle
Median Family Size in Newcastle
The median family size in Newcastle is 2.50 persons per family, with single female/mother families (11 | 8.6%) accounting for the largest median family size of 3.64 persons per family. On the other hand, married-couple families (104 | 81.2%) represent the smallest median family size with 2.30 persons per family.
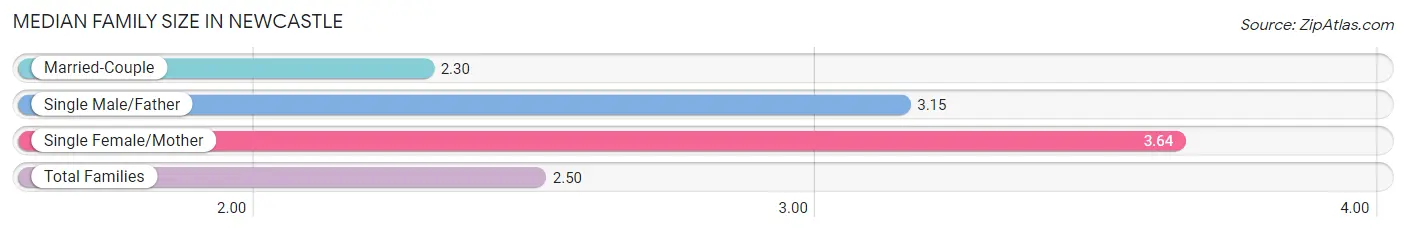
| Family Type | # Families | Family Size |
| Married-Couple | 104 (81.2%) | 2.30 |
| Single Male/Father | 13 (10.2%) | 3.15 |
| Single Female/Mother | 11 (8.6%) | 3.64 |
| Total Families | 128 (100.0%) | 2.50 |
Median Household Size in Newcastle
The median household size in Newcastle is 2.23 persons per household, with single male/father households (13 | 7.6%) accounting for the largest median household size of 4.23 persons per household. non-family households (44 | 25.6%) represent the smallest median household size with 1.11 persons per household.
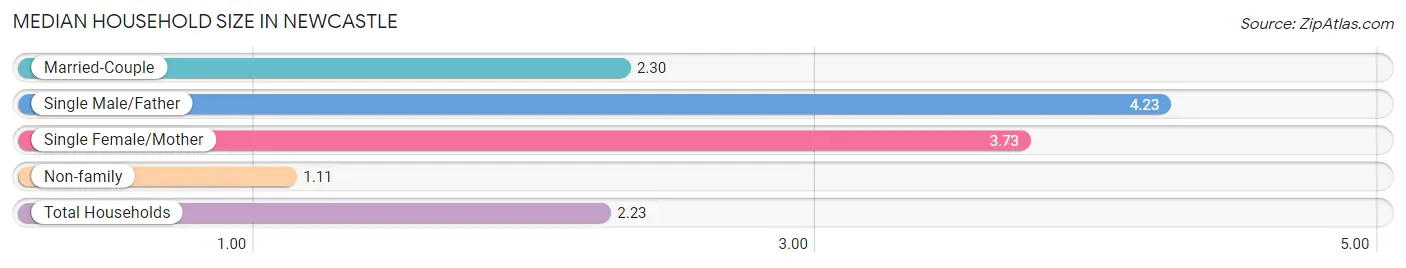
| Household Type | # Households | Household Size |
| Married-Couple | 104 (60.5%) | 2.30 |
| Single Male/Father | 13 (7.6%) | 4.23 |
| Single Female/Mother | 11 (6.4%) | 3.73 |
| Non-family | 44 (25.6%) | 1.11 |
| Total Households | 172 (100.0%) | 2.23 |
Household Size by Marriage Status in Newcastle
Out of a total of 172 households in Newcastle, 128 (74.4%) are family households, while 44 (25.6%) are nonfamily households. The most numerous type of family households are 2-person households, comprising 80, and the most common type of nonfamily households are 1-person households, comprising 35.
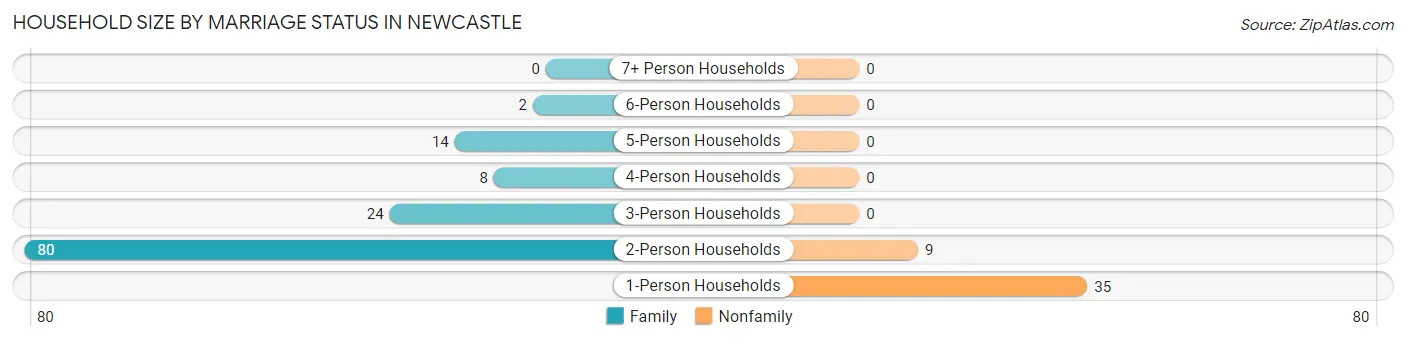
| Household Size | Family Households | Nonfamily Households |
| 1-Person Households | - | 35 (20.3%) |
| 2-Person Households | 80 (46.5%) | 9 (5.2%) |
| 3-Person Households | 24 (14.0%) | 0 (0.0%) |
| 4-Person Households | 8 (4.6%) | 0 (0.0%) |
| 5-Person Households | 14 (8.1%) | 0 (0.0%) |
| 6-Person Households | 2 (1.2%) | 0 (0.0%) |
| 7+ Person Households | 0 (0.0%) | 0 (0.0%) |
| Total | 128 (74.4%) | 44 (25.6%) |
Female Fertility in Newcastle
Fertility by Age in Newcastle
| Age Bracket | Women with Births | Births / 1,000 Women |
| 15 to 19 years | 0 (0.0%) | 0.0 |
| 20 to 34 years | 0 (0.0%) | 0.0 |
| 35 to 50 years | 0 (0.0%) | 0.0 |
| Total | 0 (0.0%) | 0.0 |
Fertility by Age by Marriage Status in Newcastle
| Age Bracket | Married | Unmarried |
| 15 to 19 years | 0 (0.0%) | 0 (0.0%) |
| 20 to 34 years | 0 (0.0%) | 0 (0.0%) |
| 35 to 50 years | 0 (0.0%) | 0 (0.0%) |
| Total | 0 (0.0%) | 0 (0.0%) |
Fertility by Education in Newcastle
| Educational Attainment | Women with Births | Births / 1,000 Women |
| Less than High School | 0 (0.0%) | 0.0 |
| High School Diploma | 0 (0.0%) | 0.0 |
| College or Associate's Degree | 0 (0.0%) | 0.0 |
| Bachelor's Degree | 0 (0.0%) | 0.0 |
| Graduate Degree | 0 (0.0%) | 0.0 |
| Total | 0 (0.0%) | 0.0 |
Fertility by Education by Marriage Status in Newcastle
| Educational Attainment | Married | Unmarried |
| Less than High School | 0 (0.0%) | 0 (0.0%) |
| High School Diploma | 0 (0.0%) | 0 (0.0%) |
| College or Associate's Degree | 0 (0.0%) | 0 (0.0%) |
| Bachelor's Degree | 0 (0.0%) | 0 (0.0%) |
| Graduate Degree | 0 (0.0%) | 0 (0.0%) |
| Total | 0 (0.0%) | 0 (0.0%) |
Employment Characteristics in Newcastle
Employment by Class of Employer in Newcastle
Among the 213 employed individuals in Newcastle, private company employees (158 | 74.2%), state government employees (18 | 8.5%), and self-employed (not incorporated) (13 | 6.1%) make up the most common classes of employment.
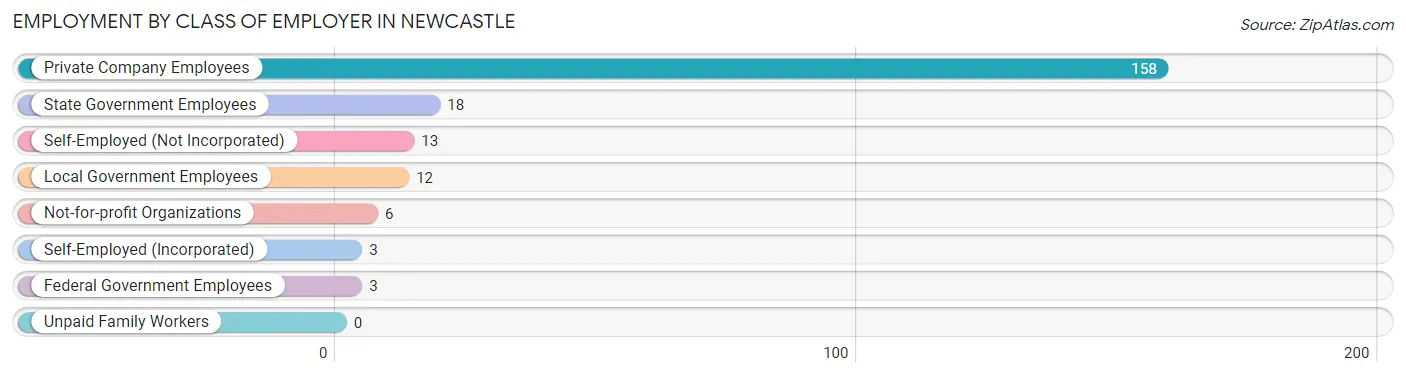
| Employer Class | # Employees | % Employees |
| Private Company Employees | 158 | 74.2% |
| Self-Employed (Incorporated) | 3 | 1.4% |
| Self-Employed (Not Incorporated) | 13 | 6.1% |
| Not-for-profit Organizations | 6 | 2.8% |
| Local Government Employees | 12 | 5.6% |
| State Government Employees | 18 | 8.5% |
| Federal Government Employees | 3 | 1.4% |
| Unpaid Family Workers | 0 | 0.0% |
| Total | 213 | 100.0% |
Employment Status by Age in Newcastle
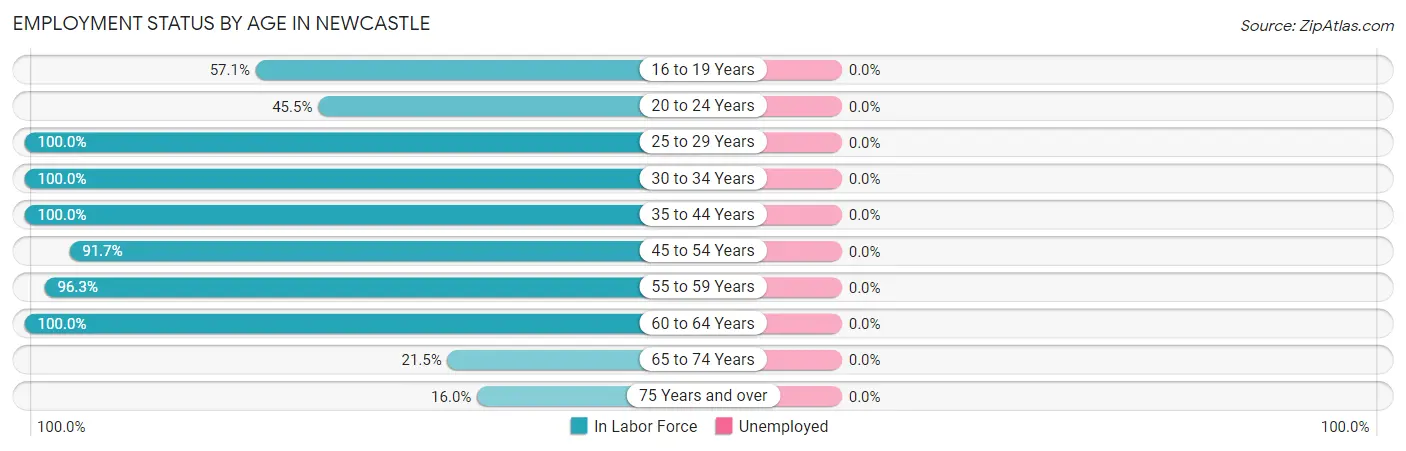
| Age Bracket | In Labor Force | Unemployed |
| 16 to 19 Years | 8 (57.1%) | 0 (0.0%) |
| 20 to 24 Years | 5 (45.5%) | 0 (0.0%) |
| 25 to 29 Years | 10 (100.0%) | 0 (0.0%) |
| 30 to 34 Years | 9 (100.0%) | 0 (0.0%) |
| 35 to 44 Years | 14 (100.0%) | 0 (0.0%) |
| 45 to 54 Years | 33 (91.7%) | 0 (0.0%) |
| 55 to 59 Years | 104 (96.3%) | 0 (0.0%) |
| 60 to 64 Years | 12 (100.0%) | 0 (0.0%) |
| 65 to 74 Years | 14 (21.5%) | 0 (0.0%) |
| 75 Years and over | 4 (16.0%) | 0 (0.0%) |
| Total | 213 (70.1%) | 0 (0.0%) |
Employment Status by Educational Attainment in Newcastle
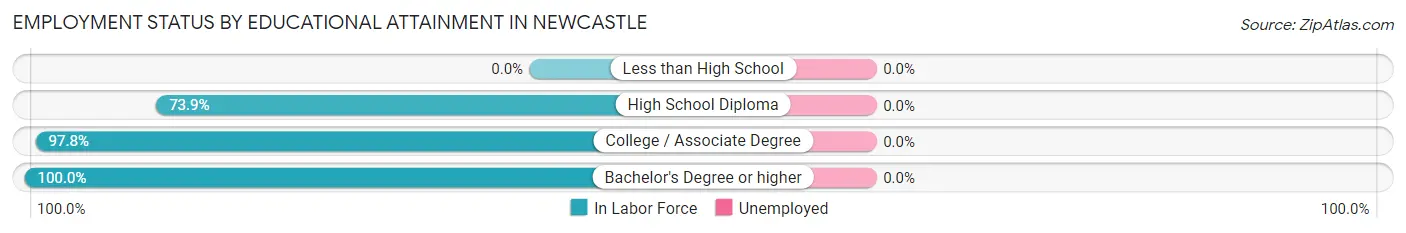
| Educational Attainment | In Labor Force | Unemployed |
| Less than High School | 0 (0.0%) | 0 (0.0%) |
| High School Diploma | 17 (73.9%) | 0 (0.0%) |
| College / Associate Degree | 45 (97.8%) | 0 (0.0%) |
| Bachelor's Degree or higher | 120 (100.0%) | 0 (0.0%) |
| Total | 182 (96.3%) | 0 (0.0%) |
Employment Occupations by Sex in Newcastle
Management, Business, Science and Arts Occupations
The most common Management, Business, Science and Arts occupations in Newcastle are Management (66 | 31.0%), Community & Social Service (21 | 9.9%), Education Instruction & Library (12 | 5.6%), Education, Arts & Media (7 | 3.3%), and Business & Financial (2 | 0.9%).
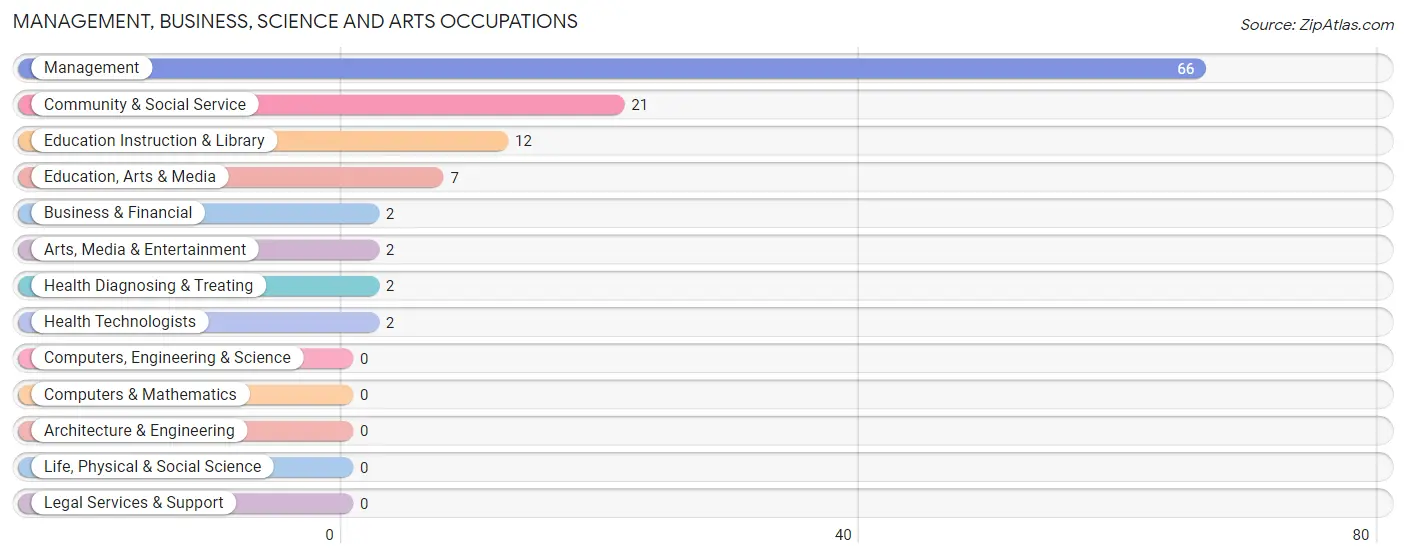
Management, Business, Science and Arts Occupations by Sex
Within the Management, Business, Science and Arts occupations in Newcastle, the most male-oriented occupations are Management (95.5%), Education, Arts & Media (85.7%), and Business & Financial (50.0%), while the most female-oriented occupations are Education Instruction & Library (100.0%), Arts, Media & Entertainment (100.0%), and Health Diagnosing & Treating (100.0%).
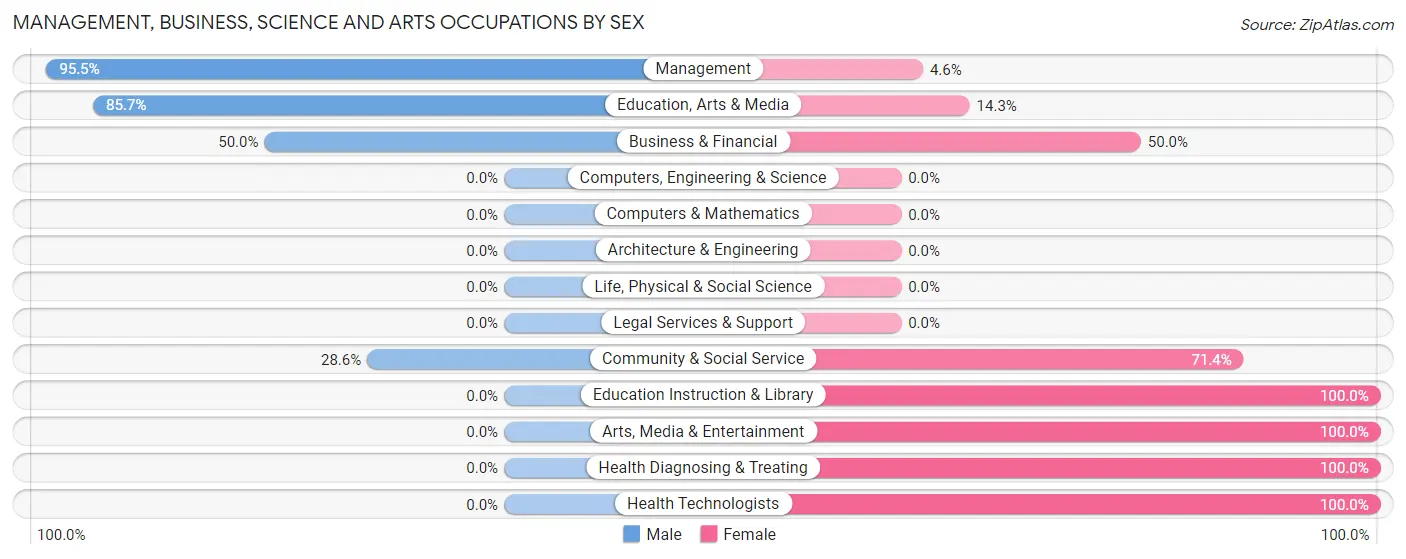
| Occupation | Male | Female |
| Management | 63 (95.5%) | 3 (4.5%) |
| Business & Financial | 1 (50.0%) | 1 (50.0%) |
| Computers, Engineering & Science | 0 (0.0%) | 0 (0.0%) |
| Computers & Mathematics | 0 (0.0%) | 0 (0.0%) |
| Architecture & Engineering | 0 (0.0%) | 0 (0.0%) |
| Life, Physical & Social Science | 0 (0.0%) | 0 (0.0%) |
| Community & Social Service | 6 (28.6%) | 15 (71.4%) |
| Education, Arts & Media | 6 (85.7%) | 1 (14.3%) |
| Legal Services & Support | 0 (0.0%) | 0 (0.0%) |
| Education Instruction & Library | 0 (0.0%) | 12 (100.0%) |
| Arts, Media & Entertainment | 0 (0.0%) | 2 (100.0%) |
| Health Diagnosing & Treating | 0 (0.0%) | 2 (100.0%) |
| Health Technologists | 0 (0.0%) | 2 (100.0%) |
| Total (Category) | 70 (76.9%) | 21 (23.1%) |
| Total (Overall) | 111 (52.1%) | 102 (47.9%) |
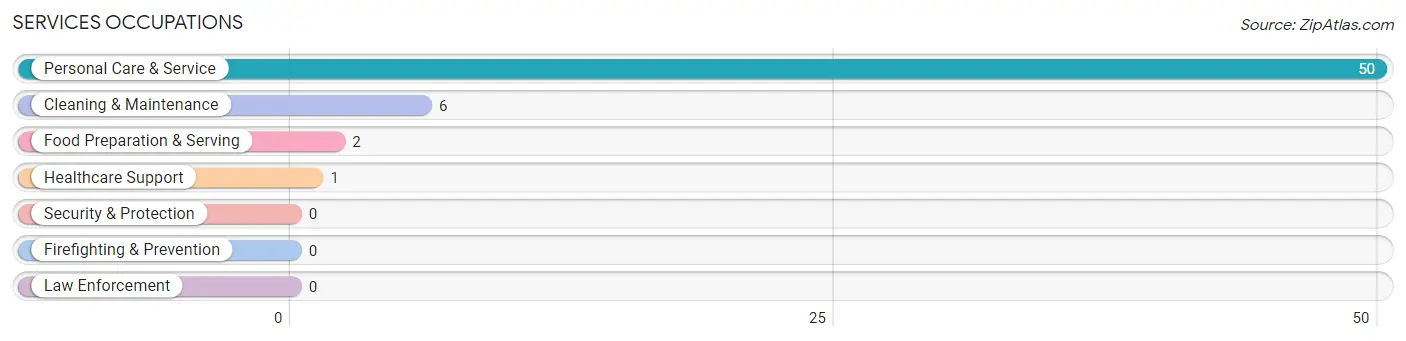
Services Occupations
The most common Services occupations in Newcastle are Personal Care & Service (50 | 23.5%), Cleaning & Maintenance (6 | 2.8%), Food Preparation & Serving (2 | 0.9%), and Healthcare Support (1 | 0.5%).
Services Occupations by Sex
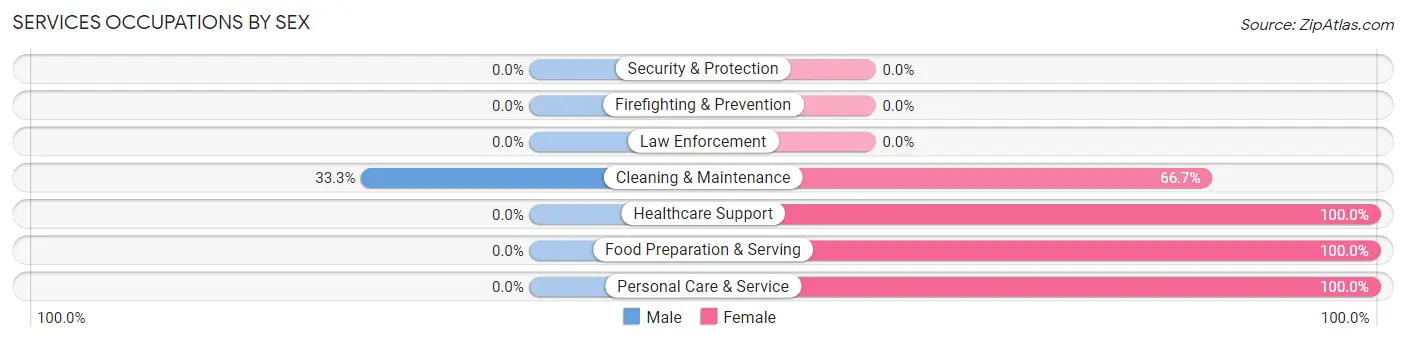
| Occupation | Male | Female |
| Healthcare Support | 0 (0.0%) | 1 (100.0%) |
| Security & Protection | 0 (0.0%) | 0 (0.0%) |
| Firefighting & Prevention | 0 (0.0%) | 0 (0.0%) |
| Law Enforcement | 0 (0.0%) | 0 (0.0%) |
| Food Preparation & Serving | 0 (0.0%) | 2 (100.0%) |
| Cleaning & Maintenance | 2 (33.3%) | 4 (66.7%) |
| Personal Care & Service | 0 (0.0%) | 50 (100.0%) |
| Total (Category) | 2 (3.4%) | 57 (96.6%) |
| Total (Overall) | 111 (52.1%) | 102 (47.9%) |
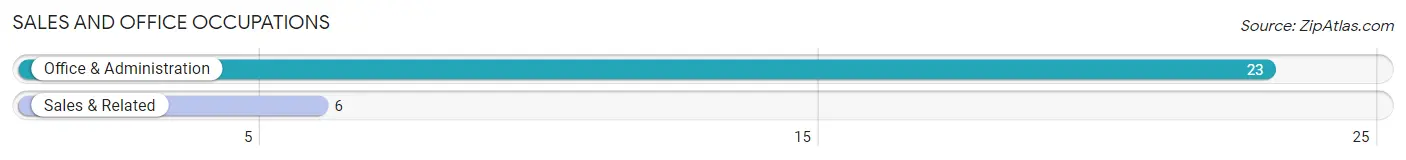
Sales and Office Occupations
The most common Sales and Office occupations in Newcastle are Office & Administration (23 | 10.8%), and Sales & Related (6 | 2.8%).
Sales and Office Occupations by Sex
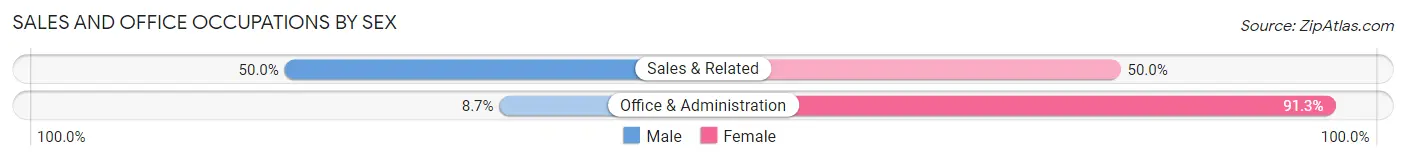
| Occupation | Male | Female |
| Sales & Related | 3 (50.0%) | 3 (50.0%) |
| Office & Administration | 2 (8.7%) | 21 (91.3%) |
| Total (Category) | 5 (17.2%) | 24 (82.8%) |
| Total (Overall) | 111 (52.1%) | 102 (47.9%) |
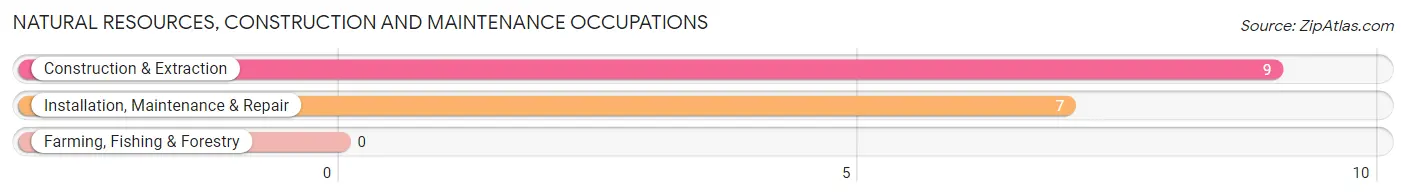
Natural Resources, Construction and Maintenance Occupations
The most common Natural Resources, Construction and Maintenance occupations in Newcastle are Construction & Extraction (9 | 4.2%), and Installation, Maintenance & Repair (7 | 3.3%).
Natural Resources, Construction and Maintenance Occupations by Sex
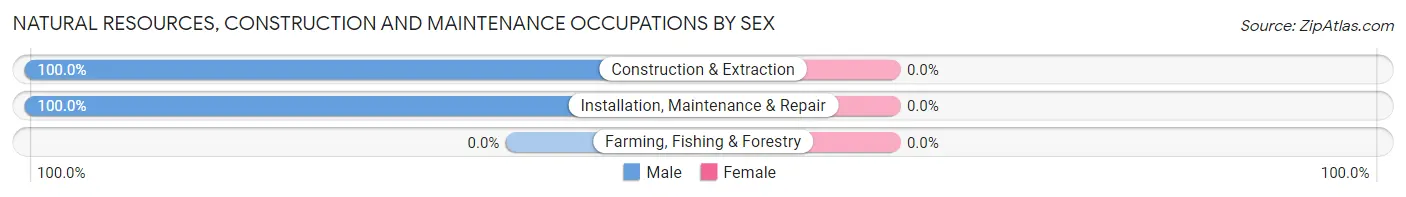
| Occupation | Male | Female |
| Farming, Fishing & Forestry | 0 (0.0%) | 0 (0.0%) |
| Construction & Extraction | 9 (100.0%) | 0 (0.0%) |
| Installation, Maintenance & Repair | 7 (100.0%) | 0 (0.0%) |
| Total (Category) | 16 (100.0%) | 0 (0.0%) |
| Total (Overall) | 111 (52.1%) | 102 (47.9%) |
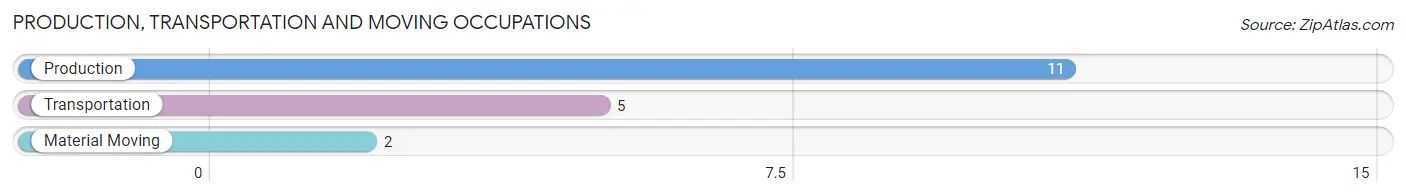
Production, Transportation and Moving Occupations
The most common Production, Transportation and Moving occupations in Newcastle are Production (11 | 5.2%), Transportation (5 | 2.4%), and Material Moving (2 | 0.9%).
Production, Transportation and Moving Occupations by Sex
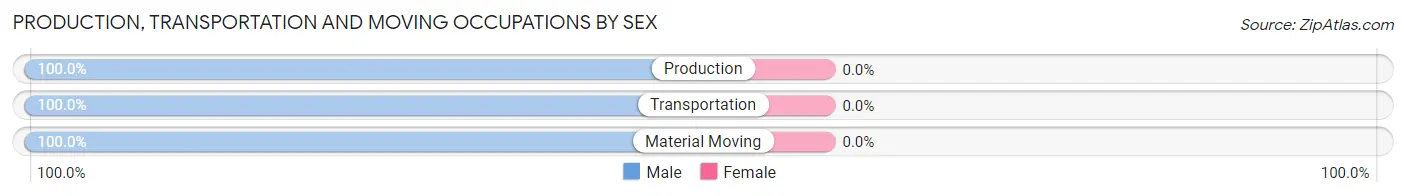
| Occupation | Male | Female |
| Production | 11 (100.0%) | 0 (0.0%) |
| Transportation | 5 (100.0%) | 0 (0.0%) |
| Material Moving | 2 (100.0%) | 0 (0.0%) |
| Total (Category) | 18 (100.0%) | 0 (0.0%) |
| Total (Overall) | 111 (52.1%) | 102 (47.9%) |
Employment Industries by Sex in Newcastle
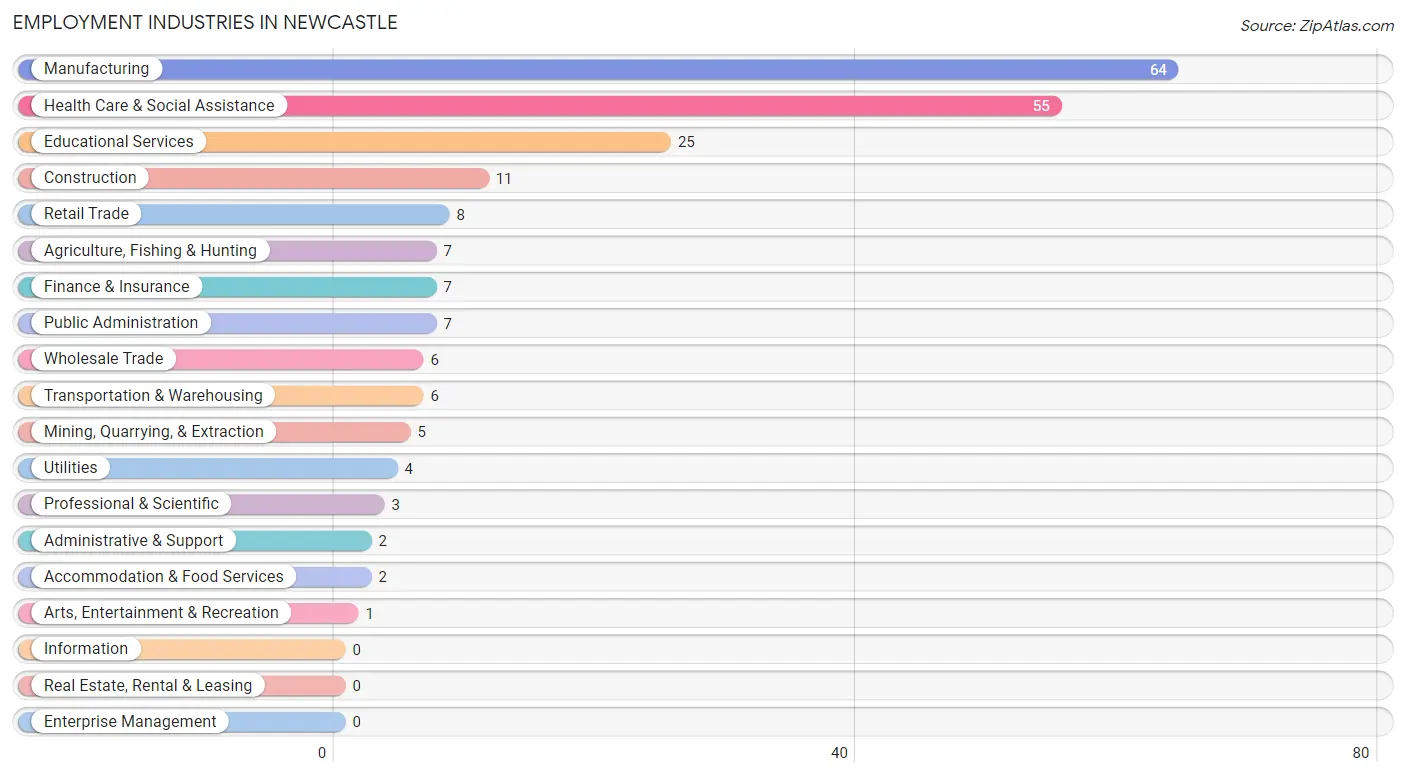
Employment Industries in Newcastle
The major employment industries in Newcastle include Manufacturing (64 | 30.0%), Health Care & Social Assistance (55 | 25.8%), Educational Services (25 | 11.7%), Construction (11 | 5.2%), and Retail Trade (8 | 3.8%).
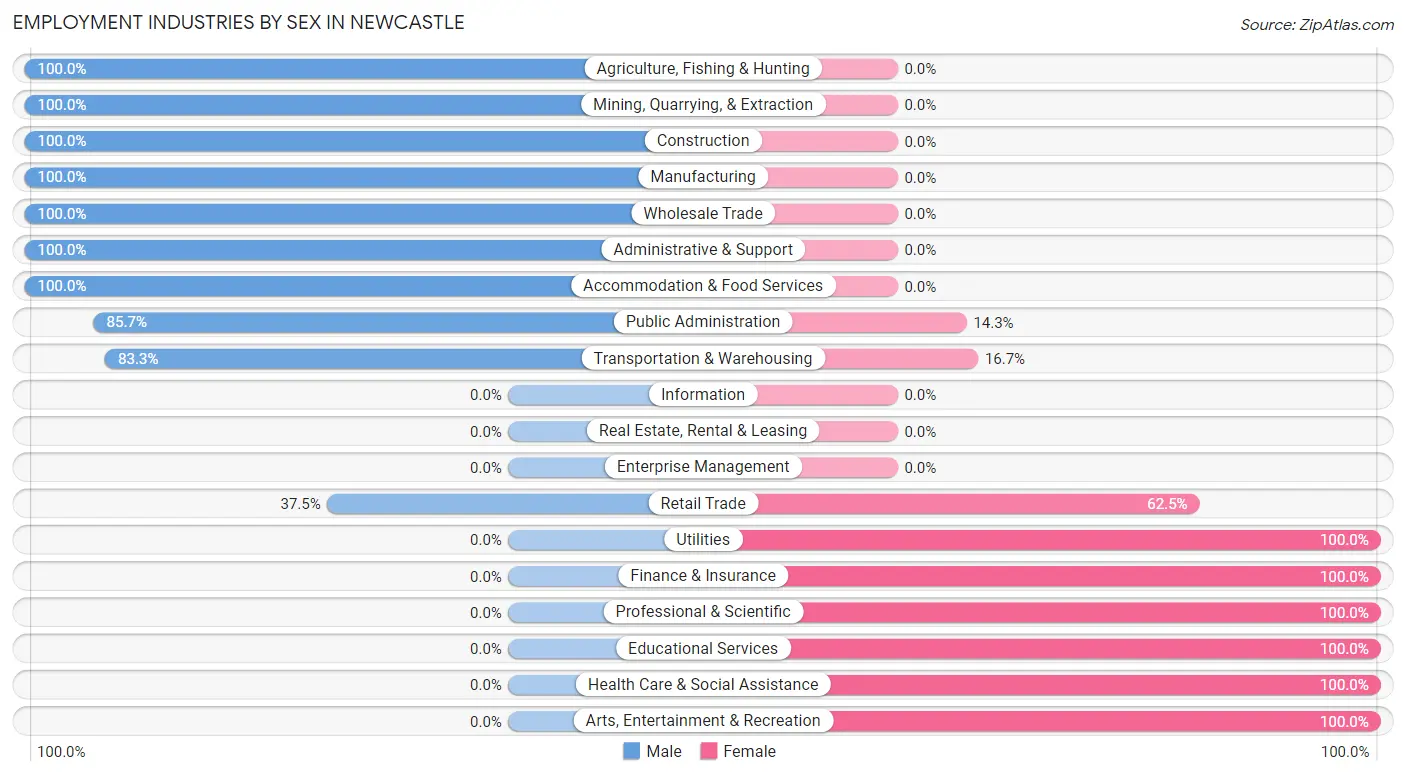
Employment Industries by Sex in Newcastle
The Newcastle industries that see more men than women are Agriculture, Fishing & Hunting (100.0%), Mining, Quarrying, & Extraction (100.0%), and Construction (100.0%), whereas the industries that tend to have a higher number of women are Utilities (100.0%), Finance & Insurance (100.0%), and Professional & Scientific (100.0%).
| Industry | Male | Female |
| Agriculture, Fishing & Hunting | 7 (100.0%) | 0 (0.0%) |
| Mining, Quarrying, & Extraction | 5 (100.0%) | 0 (0.0%) |
| Construction | 11 (100.0%) | 0 (0.0%) |
| Manufacturing | 64 (100.0%) | 0 (0.0%) |
| Wholesale Trade | 6 (100.0%) | 0 (0.0%) |
| Retail Trade | 3 (37.5%) | 5 (62.5%) |
| Transportation & Warehousing | 5 (83.3%) | 1 (16.7%) |
| Utilities | 0 (0.0%) | 4 (100.0%) |
| Information | 0 (0.0%) | 0 (0.0%) |
| Finance & Insurance | 0 (0.0%) | 7 (100.0%) |
| Real Estate, Rental & Leasing | 0 (0.0%) | 0 (0.0%) |
| Professional & Scientific | 0 (0.0%) | 3 (100.0%) |
| Enterprise Management | 0 (0.0%) | 0 (0.0%) |
| Administrative & Support | 2 (100.0%) | 0 (0.0%) |
| Educational Services | 0 (0.0%) | 25 (100.0%) |
| Health Care & Social Assistance | 0 (0.0%) | 55 (100.0%) |
| Arts, Entertainment & Recreation | 0 (0.0%) | 1 (100.0%) |
| Accommodation & Food Services | 2 (100.0%) | 0 (0.0%) |
| Public Administration | 6 (85.7%) | 1 (14.3%) |
| Total | 111 (52.1%) | 102 (47.9%) |
Education in Newcastle
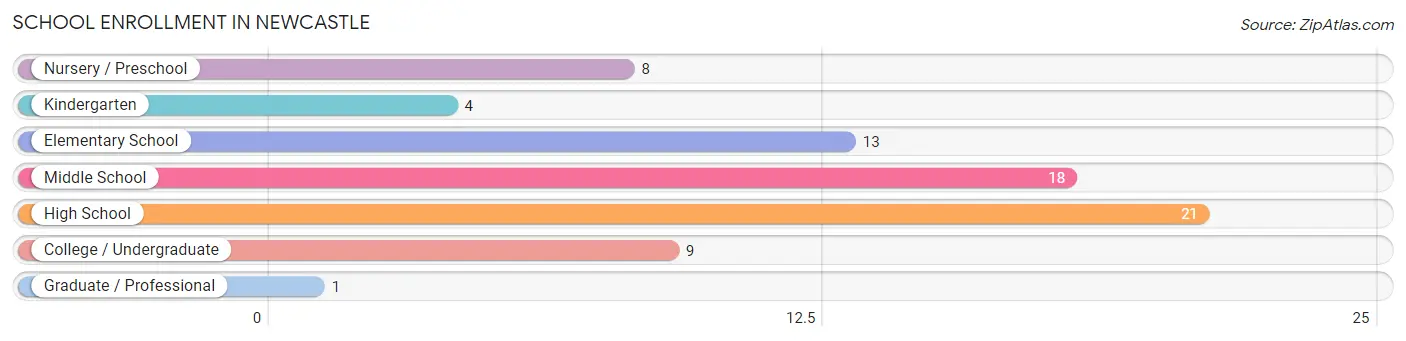
School Enrollment in Newcastle
The most common levels of schooling among the 74 students in Newcastle are high school (21 | 28.4%), middle school (18 | 24.3%), and elementary school (13 | 17.6%).
| School Level | # Students | % Students |
| Nursery / Preschool | 8 | 10.8% |
| Kindergarten | 4 | 5.4% |
| Elementary School | 13 | 17.6% |
| Middle School | 18 | 24.3% |
| High School | 21 | 28.4% |
| College / Undergraduate | 9 | 12.2% |
| Graduate / Professional | 1 | 1.3% |
| Total | 74 | 100.0% |
School Enrollment by Age by Funding Source in Newcastle
Out of a total of 74 students who are enrolled in schools in Newcastle, 18 (24.3%) attend a private institution, while the remaining 56 (75.7%) are enrolled in public schools. The age group of 35 years and over has the highest likelihood of being enrolled in private schools, with 1 (100.0% in the age bracket) enrolled. Conversely, the age group of 3 to 4 year olds has the lowest likelihood of being enrolled in a private school, with 2 (100.0% in the age bracket) attending a public institution.
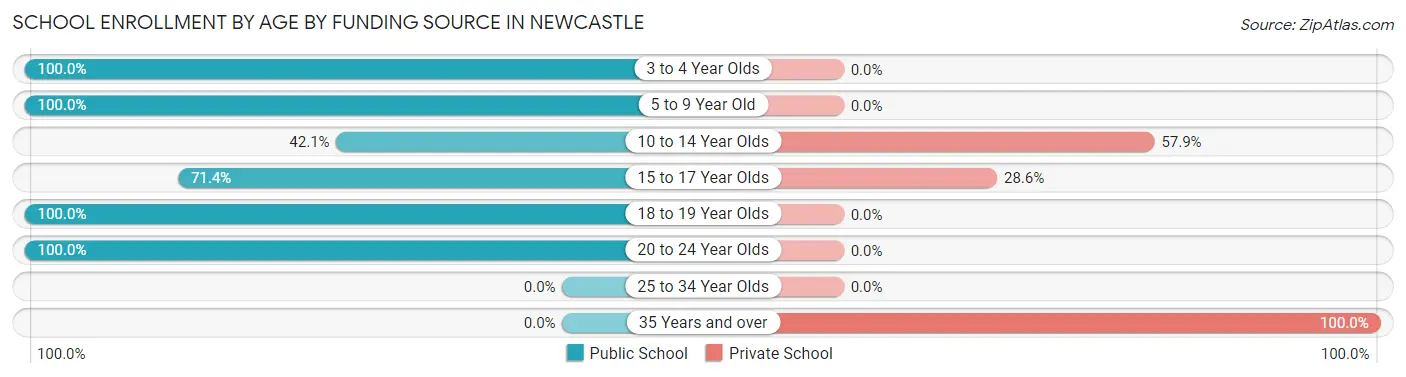
| Age Bracket | Public School | Private School |
| 3 to 4 Year Olds | 2 (100.0%) | 0 (0.0%) |
| 5 to 9 Year Old | 22 (100.0%) | 0 (0.0%) |
| 10 to 14 Year Olds | 8 (42.1%) | 11 (57.9%) |
| 15 to 17 Year Olds | 15 (71.4%) | 6 (28.6%) |
| 18 to 19 Year Olds | 3 (100.0%) | 0 (0.0%) |
| 20 to 24 Year Olds | 6 (100.0%) | 0 (0.0%) |
| 25 to 34 Year Olds | 0 (0.0%) | 0 (0.0%) |
| 35 Years and over | 0 (0.0%) | 1 (100.0%) |
| Total | 56 (75.7%) | 18 (24.3%) |
Educational Attainment by Field of Study in Newcastle
Business (50 | 28.2%), psychology (49 | 27.7%), arts & humanities (47 | 26.6%), education (18 | 10.2%), and bio, nature & agricultural (3 | 1.7%) are the most common fields of study among 177 individuals in Newcastle who have obtained a bachelor's degree or higher.
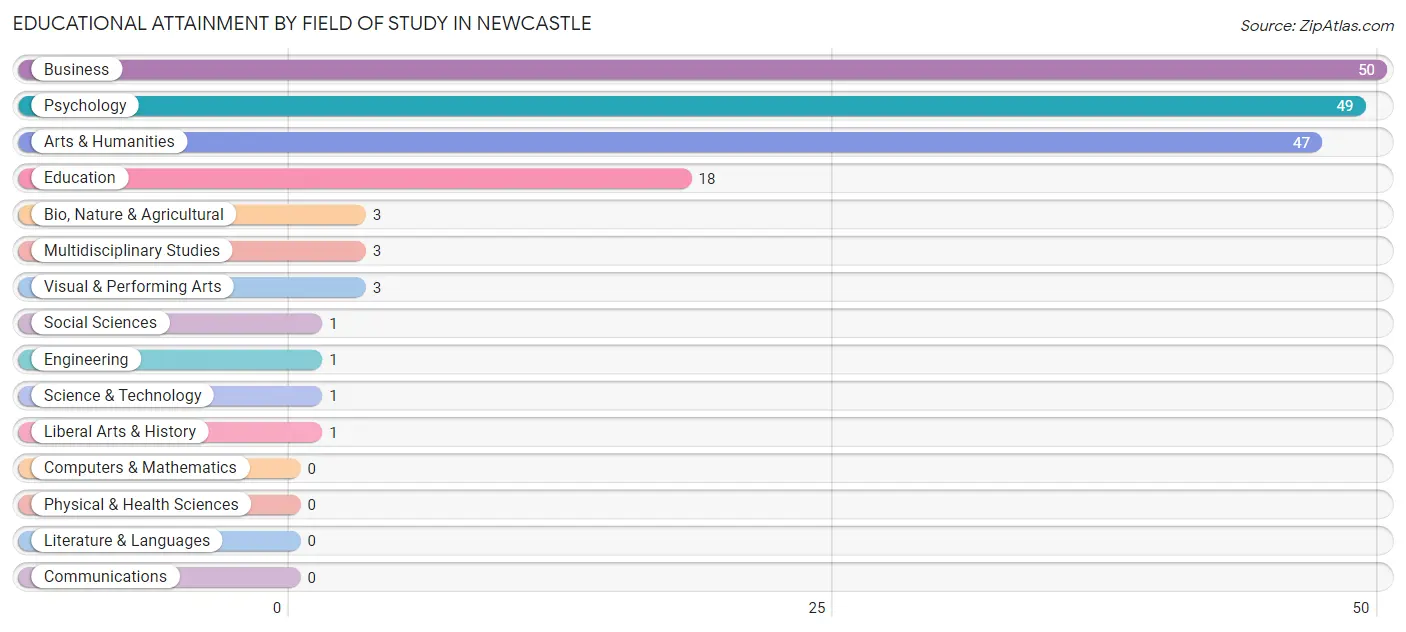
| Field of Study | # Graduates | % Graduates |
| Computers & Mathematics | 0 | 0.0% |
| Bio, Nature & Agricultural | 3 | 1.7% |
| Physical & Health Sciences | 0 | 0.0% |
| Psychology | 49 | 27.7% |
| Social Sciences | 1 | 0.6% |
| Engineering | 1 | 0.6% |
| Multidisciplinary Studies | 3 | 1.7% |
| Science & Technology | 1 | 0.6% |
| Business | 50 | 28.2% |
| Education | 18 | 10.2% |
| Literature & Languages | 0 | 0.0% |
| Liberal Arts & History | 1 | 0.6% |
| Visual & Performing Arts | 3 | 1.7% |
| Communications | 0 | 0.0% |
| Arts & Humanities | 47 | 26.6% |
| Total | 177 | 100.0% |
Transportation & Commute in Newcastle
Vehicle Availability by Sex in Newcastle
The most prevalent vehicle ownership categories in Newcastle are males with 3 vehicles (62, accounting for 55.9%) and females with 3 vehicles (60, making up 60.8%).
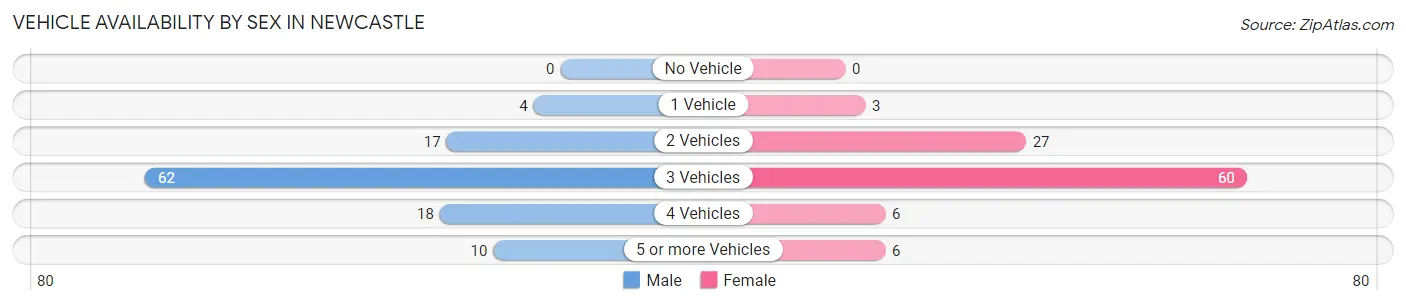
| Vehicles Available | Male | Female |
| No Vehicle | 0 (0.0%) | 0 (0.0%) |
| 1 Vehicle | 4 (3.6%) | 3 (2.9%) |
| 2 Vehicles | 17 (15.3%) | 27 (26.5%) |
| 3 Vehicles | 62 (55.9%) | 60 (58.8%) |
| 4 Vehicles | 18 (16.2%) | 6 (5.9%) |
| 5 or more Vehicles | 10 (9.0%) | 6 (5.9%) |
| Total | 111 (100.0%) | 102 (100.0%) |
Commute Time in Newcastle
The most frequently occuring commute durations in Newcastle are 20 to 24 minutes (58 commuters, 28.3%), 25 to 29 minutes (52 commuters, 25.4%), and 40 to 44 minutes (18 commuters, 8.8%).
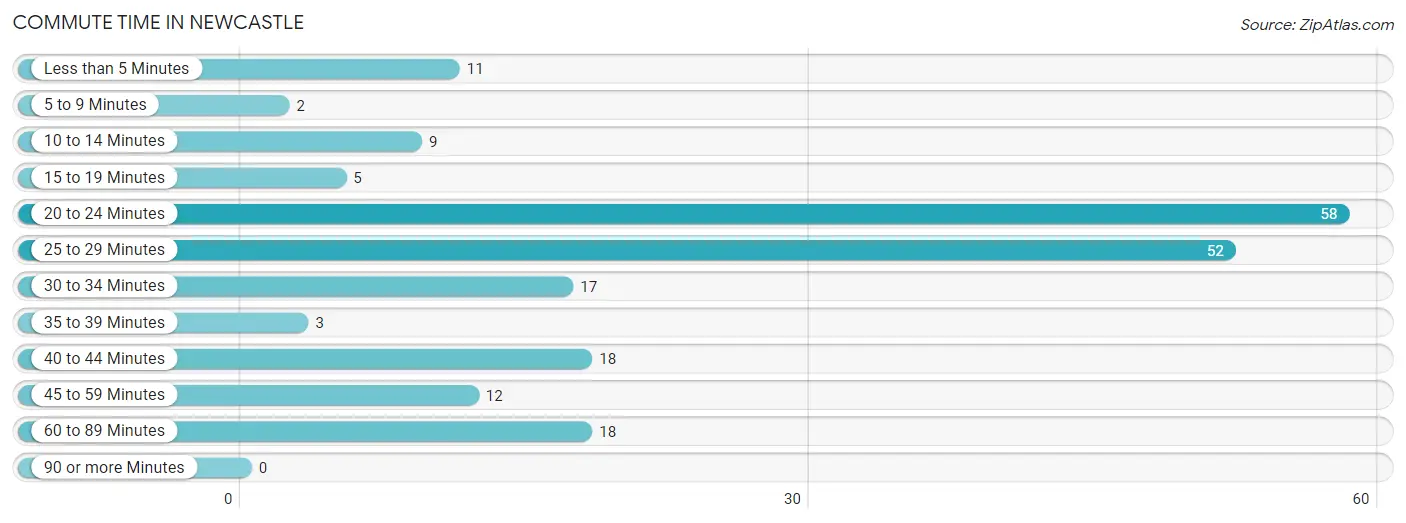
| Commute Time | # Commuters | % Commuters |
| Less than 5 Minutes | 11 | 5.4% |
| 5 to 9 Minutes | 2 | 1.0% |
| 10 to 14 Minutes | 9 | 4.4% |
| 15 to 19 Minutes | 5 | 2.4% |
| 20 to 24 Minutes | 58 | 28.3% |
| 25 to 29 Minutes | 52 | 25.4% |
| 30 to 34 Minutes | 17 | 8.3% |
| 35 to 39 Minutes | 3 | 1.5% |
| 40 to 44 Minutes | 18 | 8.8% |
| 45 to 59 Minutes | 12 | 5.9% |
| 60 to 89 Minutes | 18 | 8.8% |
| 90 or more Minutes | 0 | 0.0% |
Commute Time by Sex in Newcastle
The most common commute times in Newcastle are 25 to 29 minutes (52 commuters, 46.9%) for males and 20 to 24 minutes (58 commuters, 61.7%) for females.
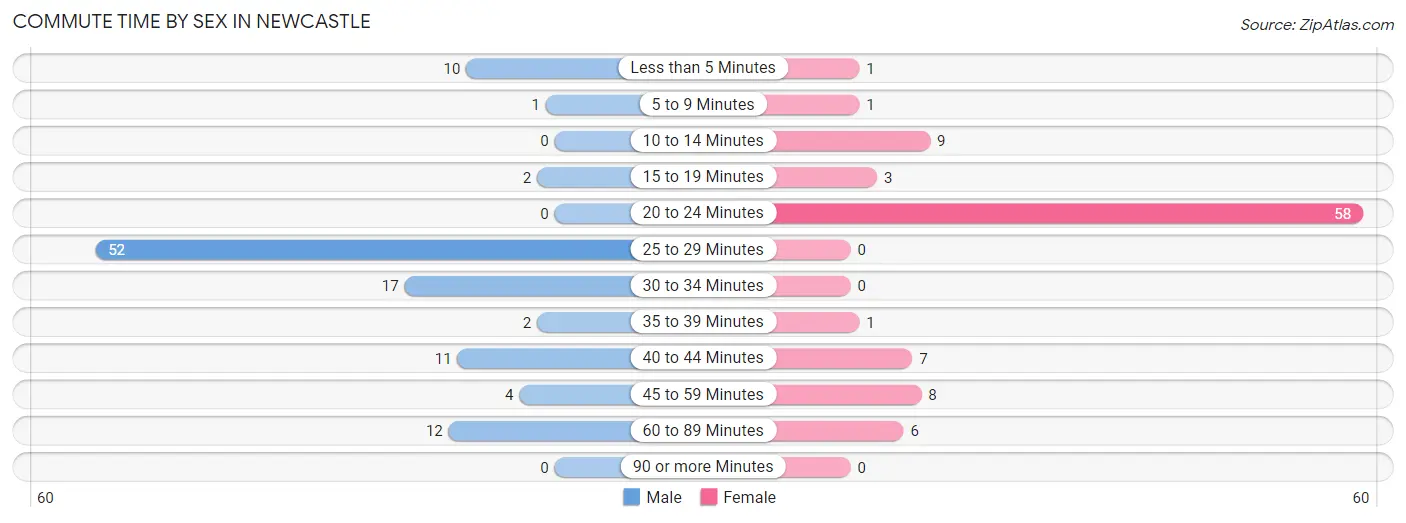
| Commute Time | Male | Female |
| Less than 5 Minutes | 10 (9.0%) | 1 (1.1%) |
| 5 to 9 Minutes | 1 (0.9%) | 1 (1.1%) |
| 10 to 14 Minutes | 0 (0.0%) | 9 (9.6%) |
| 15 to 19 Minutes | 2 (1.8%) | 3 (3.2%) |
| 20 to 24 Minutes | 0 (0.0%) | 58 (61.7%) |
| 25 to 29 Minutes | 52 (46.9%) | 0 (0.0%) |
| 30 to 34 Minutes | 17 (15.3%) | 0 (0.0%) |
| 35 to 39 Minutes | 2 (1.8%) | 1 (1.1%) |
| 40 to 44 Minutes | 11 (9.9%) | 7 (7.4%) |
| 45 to 59 Minutes | 4 (3.6%) | 8 (8.5%) |
| 60 to 89 Minutes | 12 (10.8%) | 6 (6.4%) |
| 90 or more Minutes | 0 (0.0%) | 0 (0.0%) |
Time of Departure to Work by Sex in Newcastle
The most frequent times of departure to work in Newcastle are 7:00 AM to 7:29 AM (53, 47.7%) for males and 7:30 AM to 7:59 AM (55, 58.5%) for females.
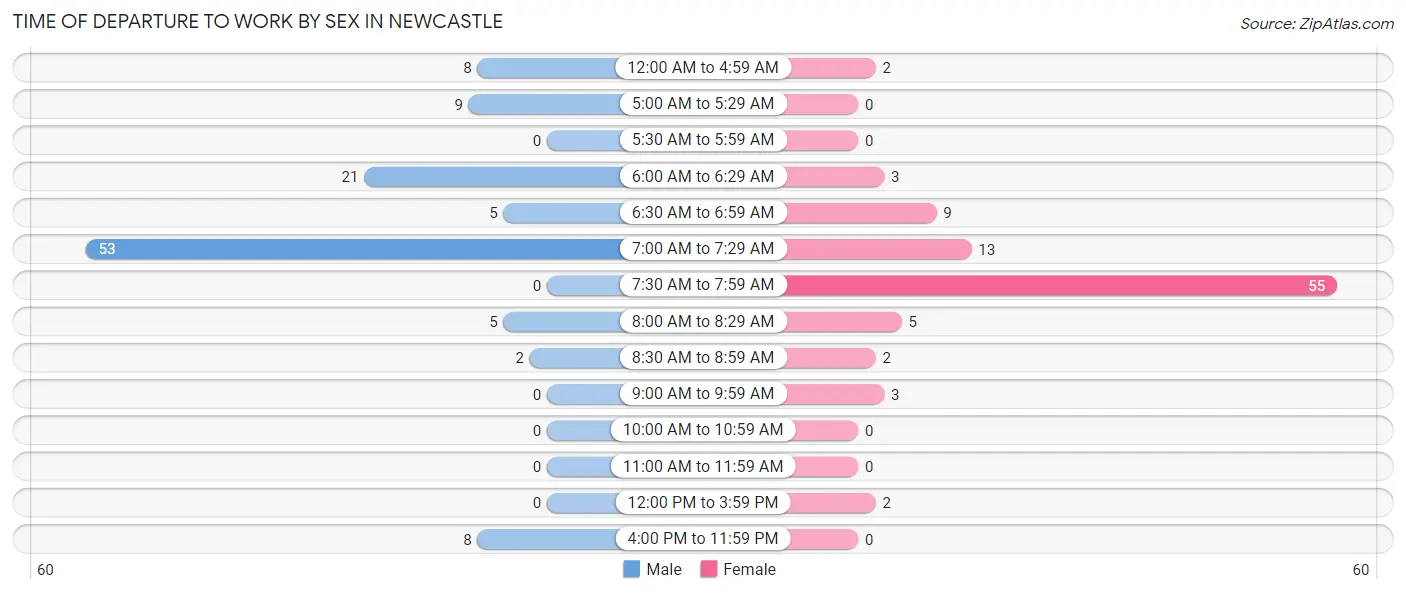
| Time of Departure | Male | Female |
| 12:00 AM to 4:59 AM | 8 (7.2%) | 2 (2.1%) |
| 5:00 AM to 5:29 AM | 9 (8.1%) | 0 (0.0%) |
| 5:30 AM to 5:59 AM | 0 (0.0%) | 0 (0.0%) |
| 6:00 AM to 6:29 AM | 21 (18.9%) | 3 (3.2%) |
| 6:30 AM to 6:59 AM | 5 (4.5%) | 9 (9.6%) |
| 7:00 AM to 7:29 AM | 53 (47.7%) | 13 (13.8%) |
| 7:30 AM to 7:59 AM | 0 (0.0%) | 55 (58.5%) |
| 8:00 AM to 8:29 AM | 5 (4.5%) | 5 (5.3%) |
| 8:30 AM to 8:59 AM | 2 (1.8%) | 2 (2.1%) |
| 9:00 AM to 9:59 AM | 0 (0.0%) | 3 (3.2%) |
| 10:00 AM to 10:59 AM | 0 (0.0%) | 0 (0.0%) |
| 11:00 AM to 11:59 AM | 0 (0.0%) | 0 (0.0%) |
| 12:00 PM to 3:59 PM | 0 (0.0%) | 2 (2.1%) |
| 4:00 PM to 11:59 PM | 8 (7.2%) | 0 (0.0%) |
| Total | 111 (100.0%) | 94 (100.0%) |
Housing Occupancy in Newcastle
Occupancy by Ownership in Newcastle
Of the total 172 dwellings in Newcastle, owner-occupied units account for 141 (82.0%), while renter-occupied units make up 31 (18.0%).
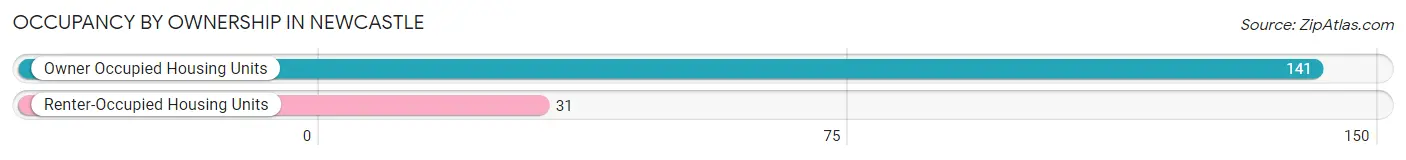
| Occupancy | # Housing Units | % Housing Units |
| Owner Occupied Housing Units | 141 | 82.0% |
| Renter-Occupied Housing Units | 31 | 18.0% |
| Total Occupied Housing Units | 172 | 100.0% |
Occupancy by Household Size in Newcastle
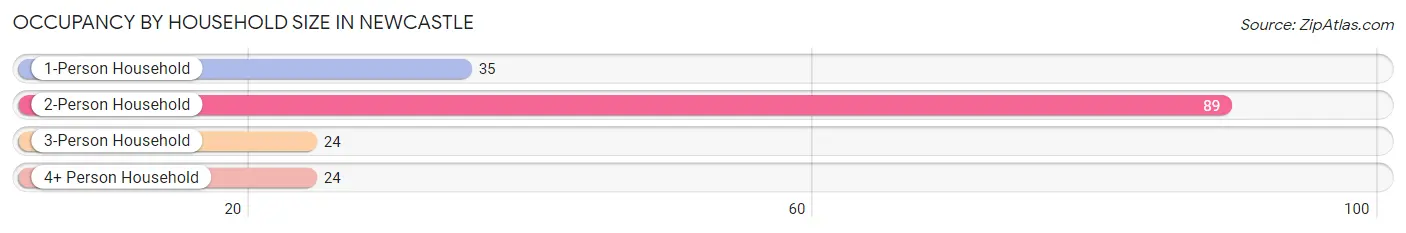
| Household Size | # Housing Units | % Housing Units |
| 1-Person Household | 35 | 20.3% |
| 2-Person Household | 89 | 51.7% |
| 3-Person Household | 24 | 14.0% |
| 4+ Person Household | 24 | 14.0% |
| Total Housing Units | 172 | 100.0% |
Occupancy by Ownership by Household Size in Newcastle
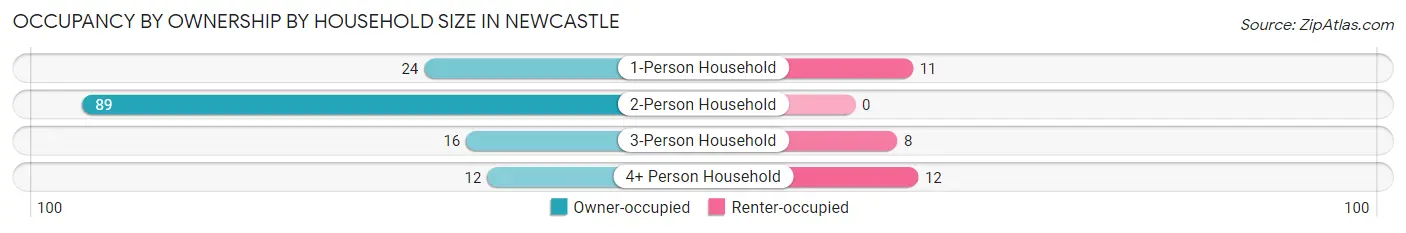
| Household Size | Owner-occupied | Renter-occupied |
| 1-Person Household | 24 (68.6%) | 11 (31.4%) |
| 2-Person Household | 89 (100.0%) | 0 (0.0%) |
| 3-Person Household | 16 (66.7%) | 8 (33.3%) |
| 4+ Person Household | 12 (50.0%) | 12 (50.0%) |
| Total Housing Units | 141 (82.0%) | 31 (18.0%) |
Occupancy by Educational Attainment in Newcastle
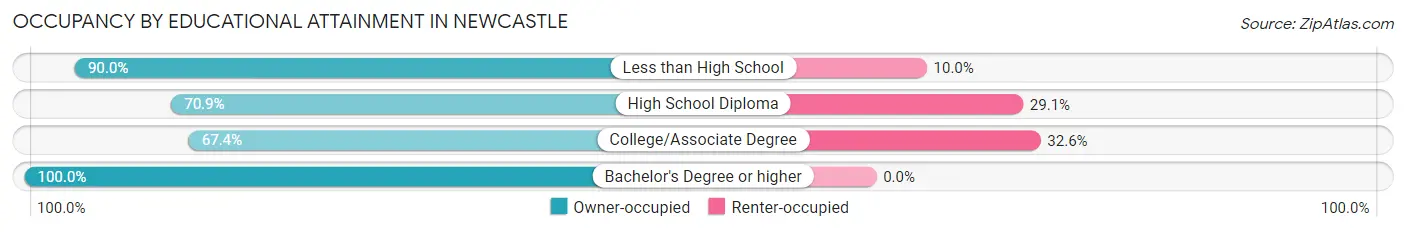
| Household Size | Owner-occupied | Renter-occupied |
| Less than High School | 9 (90.0%) | 1 (10.0%) |
| High School Diploma | 39 (70.9%) | 16 (29.1%) |
| College/Associate Degree | 29 (67.4%) | 14 (32.6%) |
| Bachelor's Degree or higher | 64 (100.0%) | 0 (0.0%) |
Occupancy by Age of Householder in Newcastle
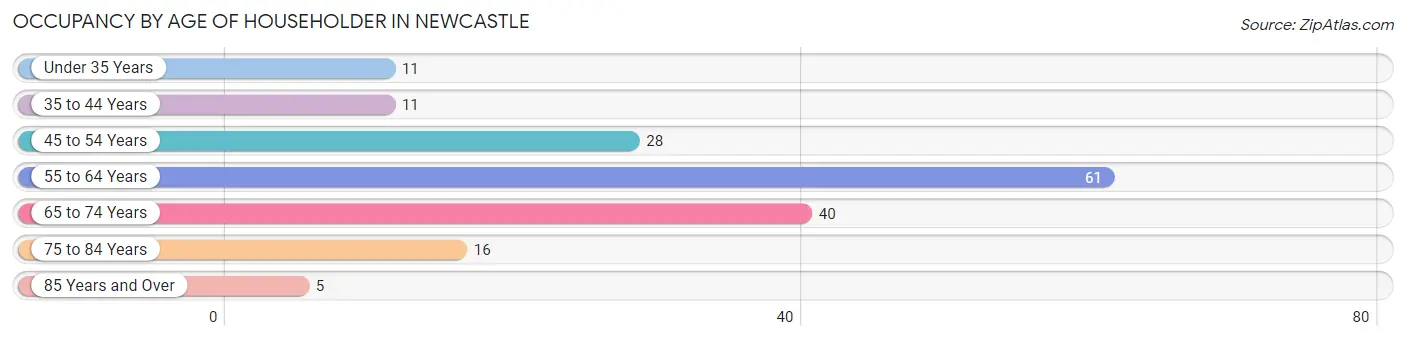
| Age Bracket | # Households | % Households |
| Under 35 Years | 11 | 6.4% |
| 35 to 44 Years | 11 | 6.4% |
| 45 to 54 Years | 28 | 16.3% |
| 55 to 64 Years | 61 | 35.5% |
| 65 to 74 Years | 40 | 23.3% |
| 75 to 84 Years | 16 | 9.3% |
| 85 Years and Over | 5 | 2.9% |
| Total | 172 | 100.0% |
Housing Finances in Newcastle
Median Income by Occupancy in Newcastle
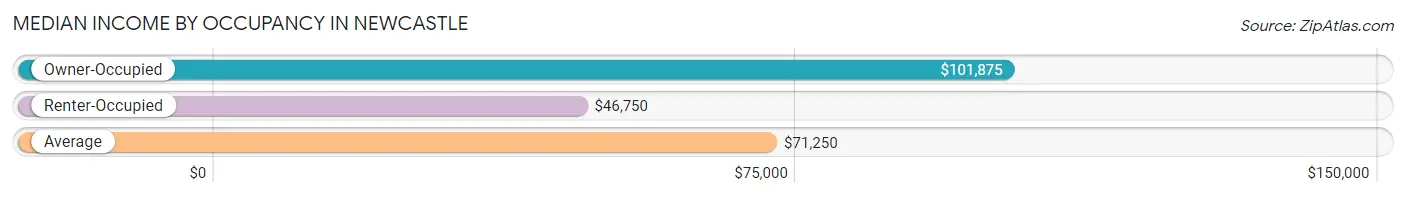
| Occupancy Type | # Households | Median Income |
| Owner-Occupied | 141 (82.0%) | $101,875 |
| Renter-Occupied | 31 (18.0%) | $46,750 |
| Average | 172 (100.0%) | $71,250 |
Occupancy by Householder Income Bracket in Newcastle
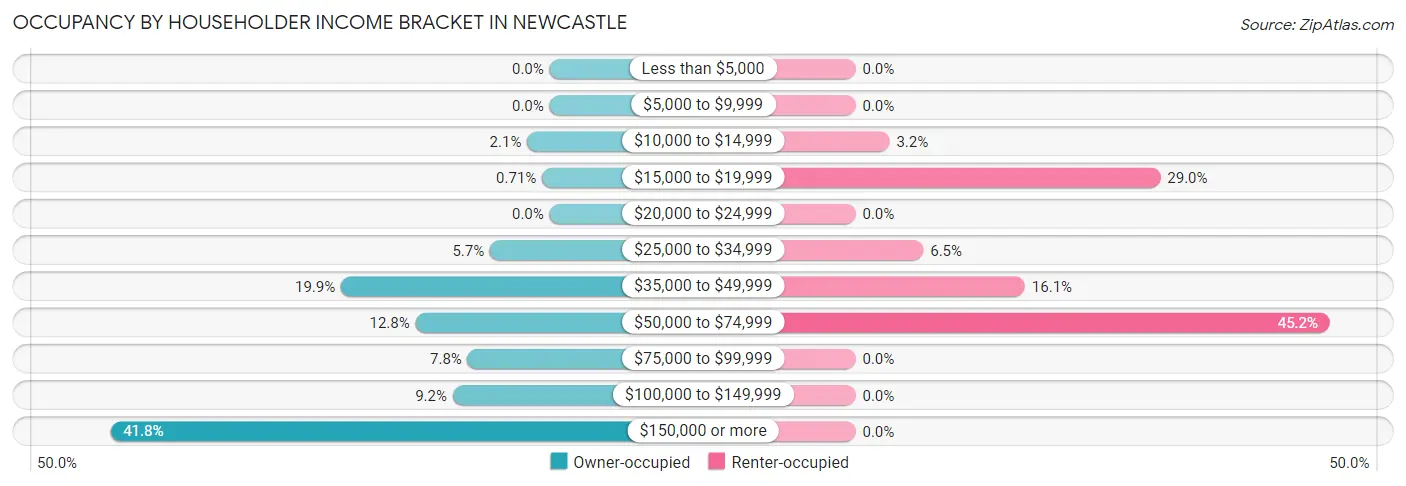
| Income Bracket | Owner-occupied | Renter-occupied |
| Less than $5,000 | 0 (0.0%) | 0 (0.0%) |
| $5,000 to $9,999 | 0 (0.0%) | 0 (0.0%) |
| $10,000 to $14,999 | 3 (2.1%) | 1 (3.2%) |
| $15,000 to $19,999 | 1 (0.7%) | 9 (29.0%) |
| $20,000 to $24,999 | 0 (0.0%) | 0 (0.0%) |
| $25,000 to $34,999 | 8 (5.7%) | 2 (6.5%) |
| $35,000 to $49,999 | 28 (19.9%) | 5 (16.1%) |
| $50,000 to $74,999 | 18 (12.8%) | 14 (45.2%) |
| $75,000 to $99,999 | 11 (7.8%) | 0 (0.0%) |
| $100,000 to $149,999 | 13 (9.2%) | 0 (0.0%) |
| $150,000 or more | 59 (41.8%) | 0 (0.0%) |
| Total | 141 (100.0%) | 31 (100.0%) |
Monthly Housing Cost Tiers in Newcastle
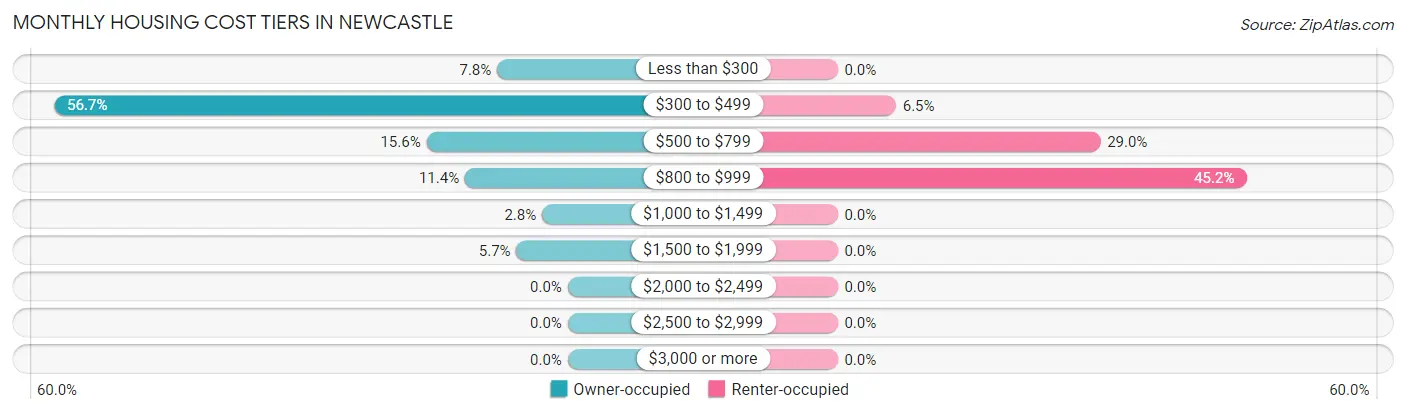
| Monthly Cost | Owner-occupied | Renter-occupied |
| Less than $300 | 11 (7.8%) | 0 (0.0%) |
| $300 to $499 | 80 (56.7%) | 2 (6.5%) |
| $500 to $799 | 22 (15.6%) | 9 (29.0%) |
| $800 to $999 | 16 (11.4%) | 14 (45.2%) |
| $1,000 to $1,499 | 4 (2.8%) | 0 (0.0%) |
| $1,500 to $1,999 | 8 (5.7%) | 0 (0.0%) |
| $2,000 to $2,499 | 0 (0.0%) | 0 (0.0%) |
| $2,500 to $2,999 | 0 (0.0%) | 0 (0.0%) |
| $3,000 or more | 0 (0.0%) | 0 (0.0%) |
| Total | 141 (100.0%) | 31 (100.0%) |
Physical Housing Characteristics in Newcastle
Housing Structures in Newcastle
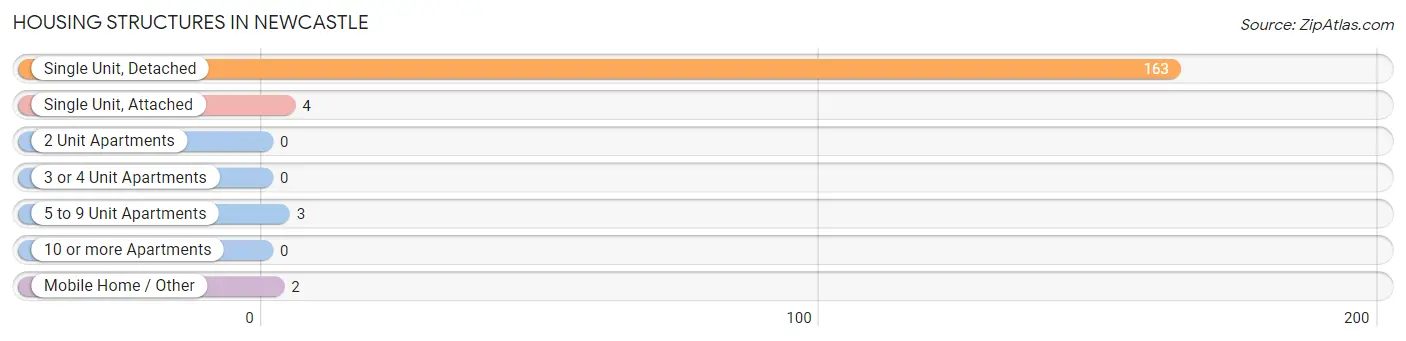
| Structure Type | # Housing Units | % Housing Units |
| Single Unit, Detached | 163 | 94.8% |
| Single Unit, Attached | 4 | 2.3% |
| 2 Unit Apartments | 0 | 0.0% |
| 3 or 4 Unit Apartments | 0 | 0.0% |
| 5 to 9 Unit Apartments | 3 | 1.7% |
| 10 or more Apartments | 0 | 0.0% |
| Mobile Home / Other | 2 | 1.2% |
| Total | 172 | 100.0% |
Housing Structures by Occupancy in Newcastle
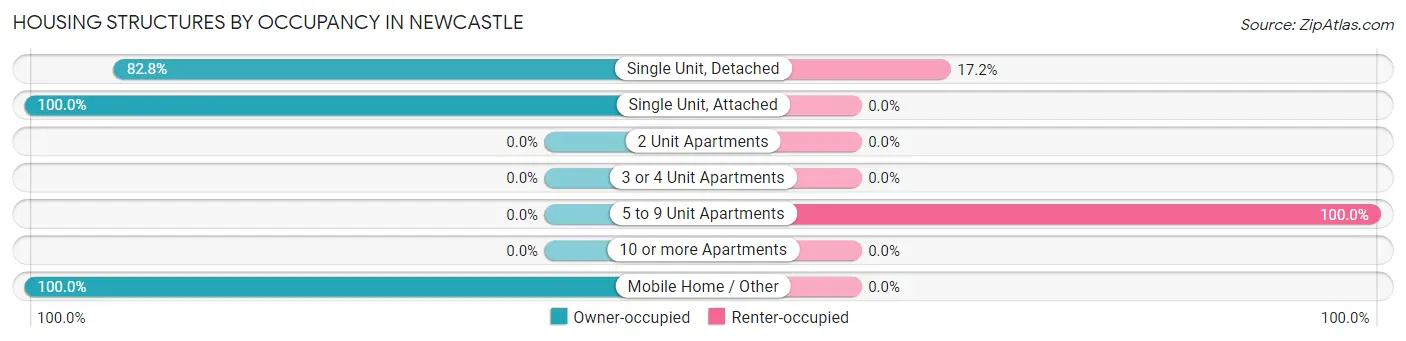
| Structure Type | Owner-occupied | Renter-occupied |
| Single Unit, Detached | 135 (82.8%) | 28 (17.2%) |
| Single Unit, Attached | 4 (100.0%) | 0 (0.0%) |
| 2 Unit Apartments | 0 (0.0%) | 0 (0.0%) |
| 3 or 4 Unit Apartments | 0 (0.0%) | 0 (0.0%) |
| 5 to 9 Unit Apartments | 0 (0.0%) | 3 (100.0%) |
| 10 or more Apartments | 0 (0.0%) | 0 (0.0%) |
| Mobile Home / Other | 2 (100.0%) | 0 (0.0%) |
| Total | 141 (82.0%) | 31 (18.0%) |
Housing Structures by Number of Rooms in Newcastle
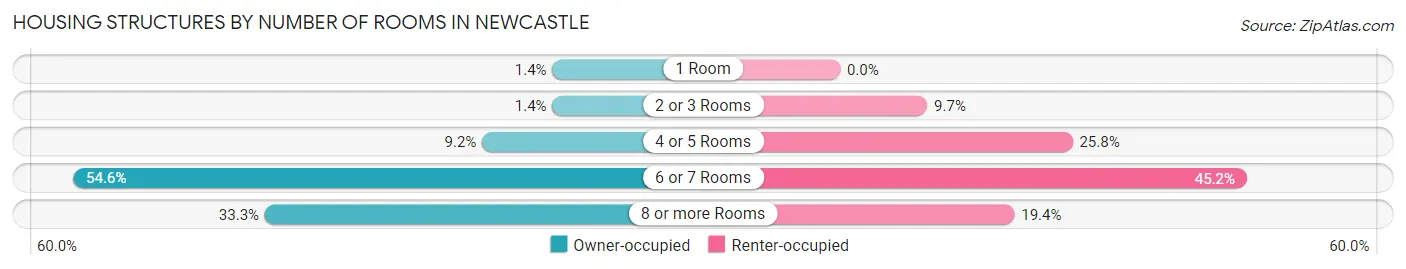
| Number of Rooms | Owner-occupied | Renter-occupied |
| 1 Room | 2 (1.4%) | 0 (0.0%) |
| 2 or 3 Rooms | 2 (1.4%) | 3 (9.7%) |
| 4 or 5 Rooms | 13 (9.2%) | 8 (25.8%) |
| 6 or 7 Rooms | 77 (54.6%) | 14 (45.2%) |
| 8 or more Rooms | 47 (33.3%) | 6 (19.4%) |
| Total | 141 (100.0%) | 31 (100.0%) |
Housing Structure by Heating Type in Newcastle
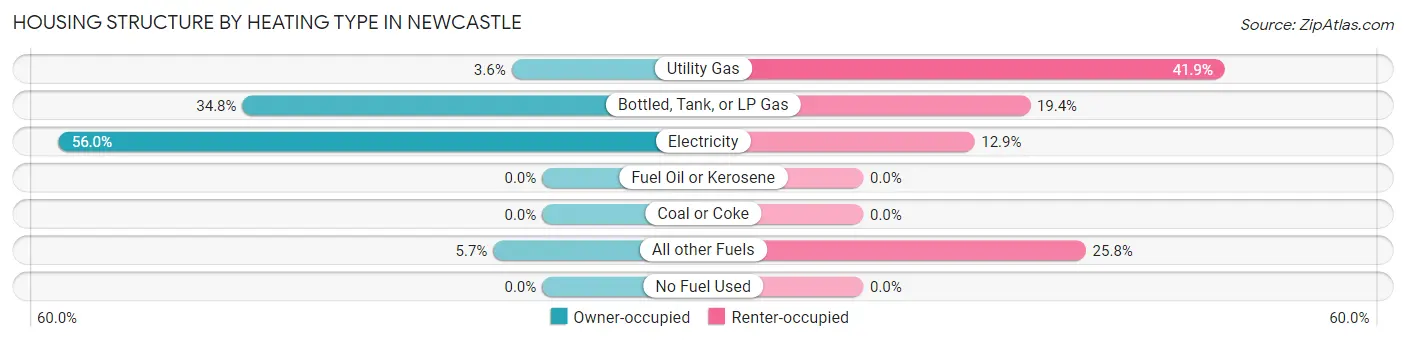
| Heating Type | Owner-occupied | Renter-occupied |
| Utility Gas | 5 (3.5%) | 13 (41.9%) |
| Bottled, Tank, or LP Gas | 49 (34.7%) | 6 (19.4%) |
| Electricity | 79 (56.0%) | 4 (12.9%) |
| Fuel Oil or Kerosene | 0 (0.0%) | 0 (0.0%) |
| Coal or Coke | 0 (0.0%) | 0 (0.0%) |
| All other Fuels | 8 (5.7%) | 8 (25.8%) |
| No Fuel Used | 0 (0.0%) | 0 (0.0%) |
| Total | 141 (100.0%) | 31 (100.0%) |
Household Vehicle Usage in Newcastle
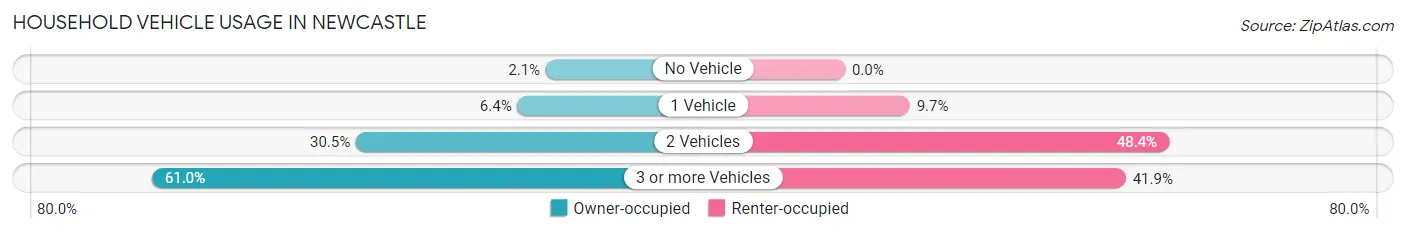
| Vehicles per Household | Owner-occupied | Renter-occupied |
| No Vehicle | 3 (2.1%) | 0 (0.0%) |
| 1 Vehicle | 9 (6.4%) | 3 (9.7%) |
| 2 Vehicles | 43 (30.5%) | 15 (48.4%) |
| 3 or more Vehicles | 86 (61.0%) | 13 (41.9%) |
| Total | 141 (100.0%) | 31 (100.0%) |
Real Estate & Mortgages in Newcastle
Real Estate and Mortgage Overview in Newcastle
| Characteristic | Without Mortgage | With Mortgage |
| Housing Units | 111 | 30 |
| Median Property Value | $112,500 | $78,600 |
| Median Household Income | - | - |
| Monthly Housing Costs | $384 | $0 |
| Real Estate Taxes | $1,180 | $2 |
Property Value by Mortgage Status in Newcastle
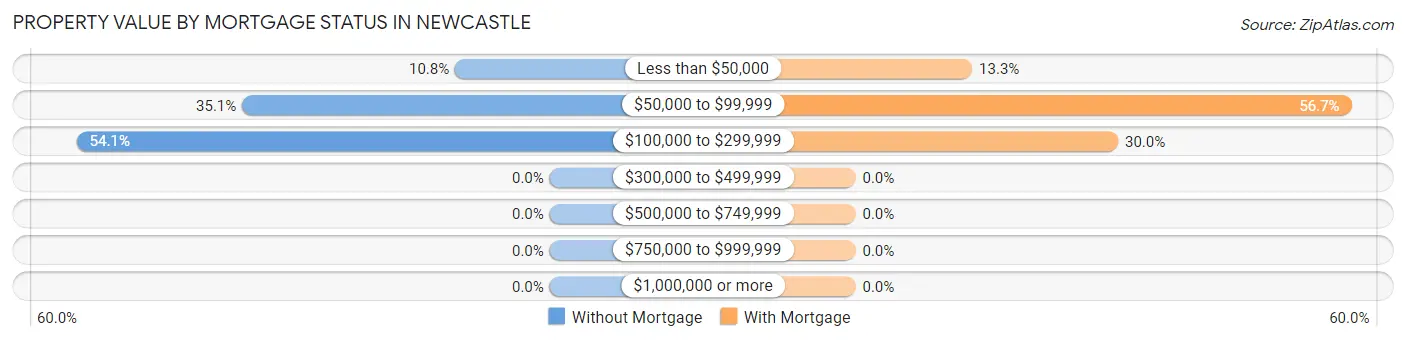
| Property Value | Without Mortgage | With Mortgage |
| Less than $50,000 | 12 (10.8%) | 4 (13.3%) |
| $50,000 to $99,999 | 39 (35.1%) | 17 (56.7%) |
| $100,000 to $299,999 | 60 (54.0%) | 9 (30.0%) |
| $300,000 to $499,999 | 0 (0.0%) | 0 (0.0%) |
| $500,000 to $749,999 | 0 (0.0%) | 0 (0.0%) |
| $750,000 to $999,999 | 0 (0.0%) | 0 (0.0%) |
| $1,000,000 or more | 0 (0.0%) | 0 (0.0%) |
| Total | 111 (100.0%) | 30 (100.0%) |
Household Income by Mortgage Status in Newcastle
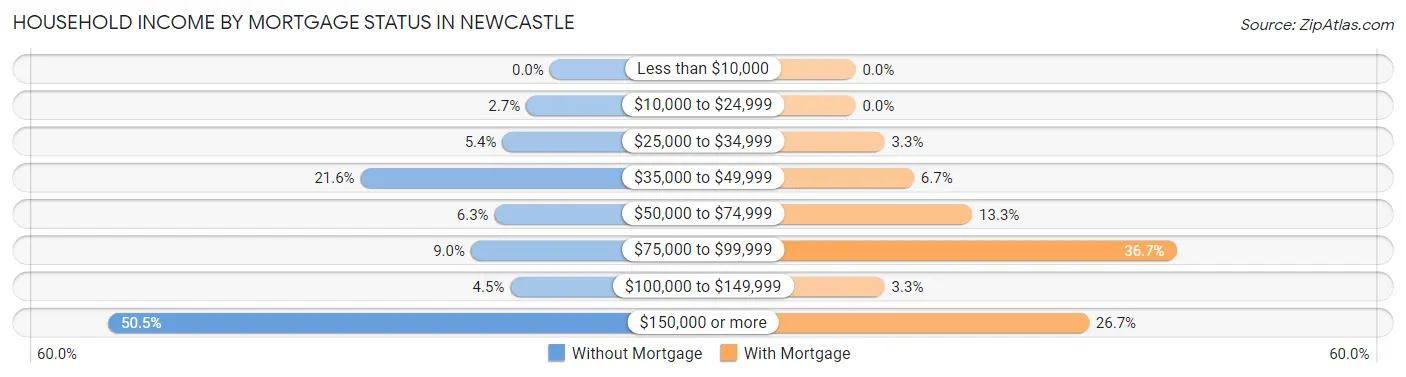
| Household Income | Without Mortgage | With Mortgage |
| Less than $10,000 | 0 (0.0%) | 0 (0.0%) |
| $10,000 to $24,999 | 3 (2.7%) | 0 (0.0%) |
| $25,000 to $34,999 | 6 (5.4%) | 1 (3.3%) |
| $35,000 to $49,999 | 24 (21.6%) | 2 (6.7%) |
| $50,000 to $74,999 | 7 (6.3%) | 4 (13.3%) |
| $75,000 to $99,999 | 10 (9.0%) | 11 (36.7%) |
| $100,000 to $149,999 | 5 (4.5%) | 1 (3.3%) |
| $150,000 or more | 56 (50.4%) | 8 (26.7%) |
| Total | 111 (100.0%) | 30 (100.0%) |
Property Value to Household Income Ratio in Newcastle
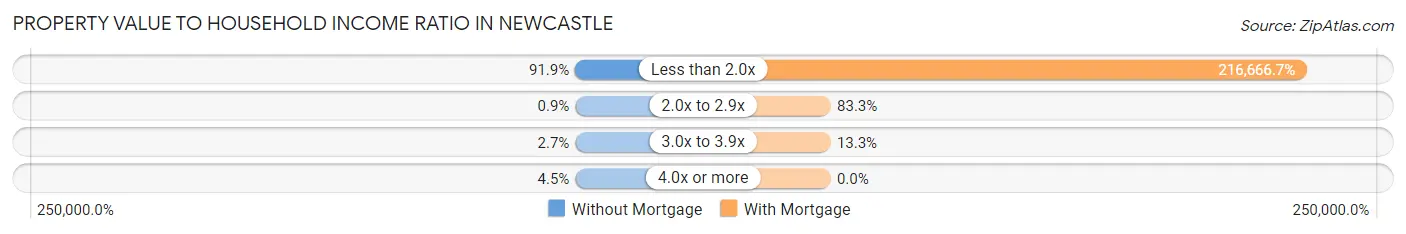
| Value-to-Income Ratio | Without Mortgage | With Mortgage |
| Less than 2.0x | 102 (91.9%) | 65,000 (216,666.7%) |
| 2.0x to 2.9x | 1 (0.9%) | 25 (83.3%) |
| 3.0x to 3.9x | 3 (2.7%) | 4 (13.3%) |
| 4.0x or more | 5 (4.5%) | 0 (0.0%) |
| Total | 111 (100.0%) | 30 (100.0%) |
Real Estate Taxes by Mortgage Status in Newcastle
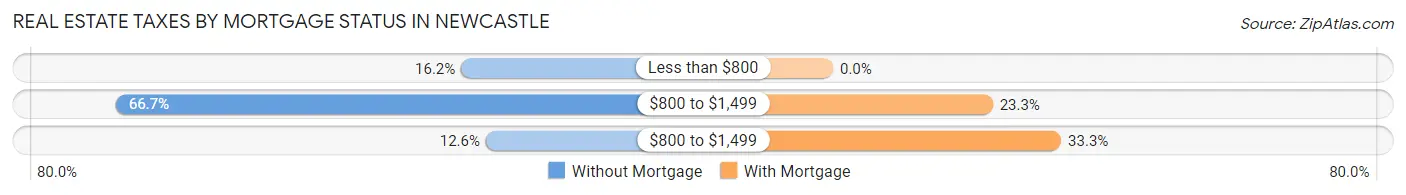
| Property Taxes | Without Mortgage | With Mortgage |
| Less than $800 | 18 (16.2%) | 0 (0.0%) |
| $800 to $1,499 | 74 (66.7%) | 7 (23.3%) |
| $800 to $1,499 | 14 (12.6%) | 10 (33.3%) |
| Total | 111 (100.0%) | 30 (100.0%) |
Health & Disability in Newcastle
Health Insurance Coverage by Age in Newcastle
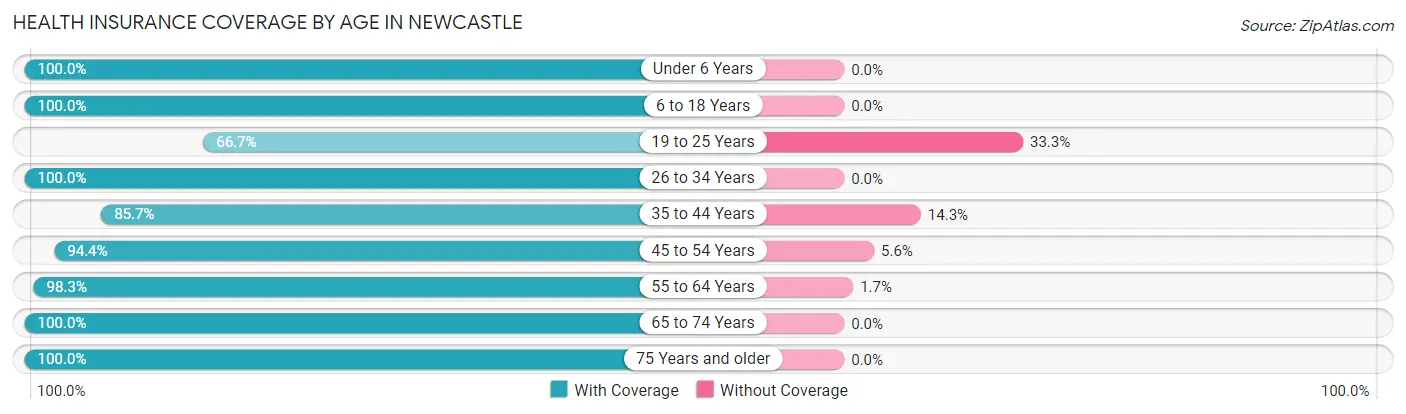
| Age Bracket | With Coverage | Without Coverage |
| Under 6 Years | 30 (100.0%) | 0 (0.0%) |
| 6 to 18 Years | 61 (100.0%) | 0 (0.0%) |
| 19 to 25 Years | 12 (66.7%) | 6 (33.3%) |
| 26 to 34 Years | 15 (100.0%) | 0 (0.0%) |
| 35 to 44 Years | 12 (85.7%) | 2 (14.3%) |
| 45 to 54 Years | 34 (94.4%) | 2 (5.6%) |
| 55 to 64 Years | 118 (98.3%) | 2 (1.7%) |
| 65 to 74 Years | 65 (100.0%) | 0 (0.0%) |
| 75 Years and older | 25 (100.0%) | 0 (0.0%) |
| Total | 372 (96.9%) | 12 (3.1%) |
Health Insurance Coverage by Citizenship Status in Newcastle
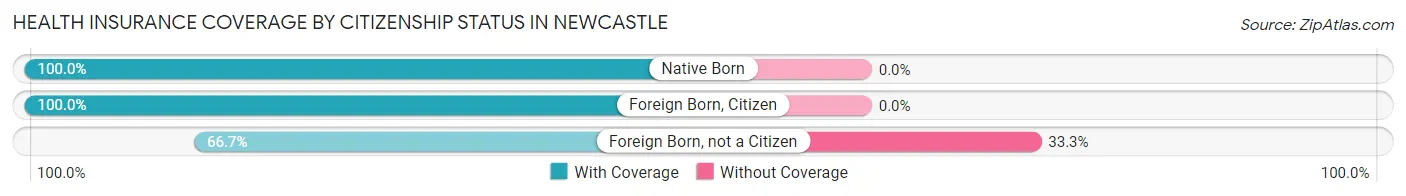
| Citizenship Status | With Coverage | Without Coverage |
| Native Born | 30 (100.0%) | 0 (0.0%) |
| Foreign Born, Citizen | 61 (100.0%) | 0 (0.0%) |
| Foreign Born, not a Citizen | 12 (66.7%) | 6 (33.3%) |
Health Insurance Coverage by Household Income in Newcastle
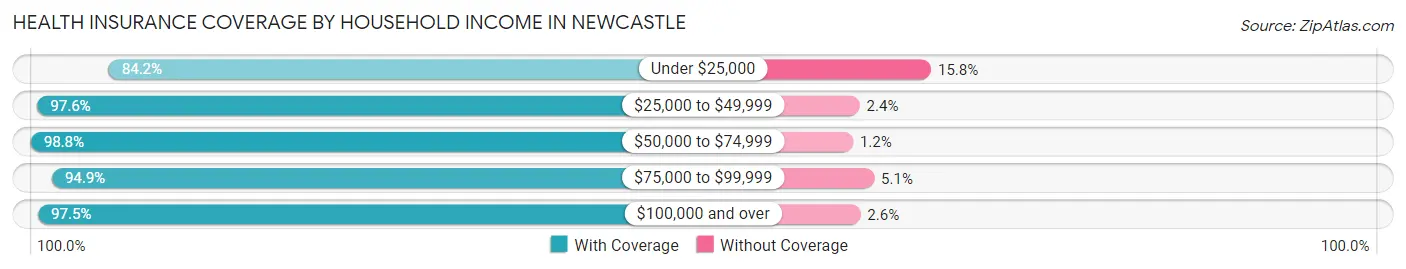
| Household Income | With Coverage | Without Coverage |
| Under $25,000 | 16 (84.2%) | 3 (15.8%) |
| $25,000 to $49,999 | 81 (97.6%) | 2 (2.4%) |
| $50,000 to $74,999 | 85 (98.8%) | 1 (1.2%) |
| $75,000 to $99,999 | 37 (94.9%) | 2 (5.1%) |
| $100,000 and over | 153 (97.5%) | 4 (2.5%) |
Public vs Private Health Insurance Coverage by Age in Newcastle
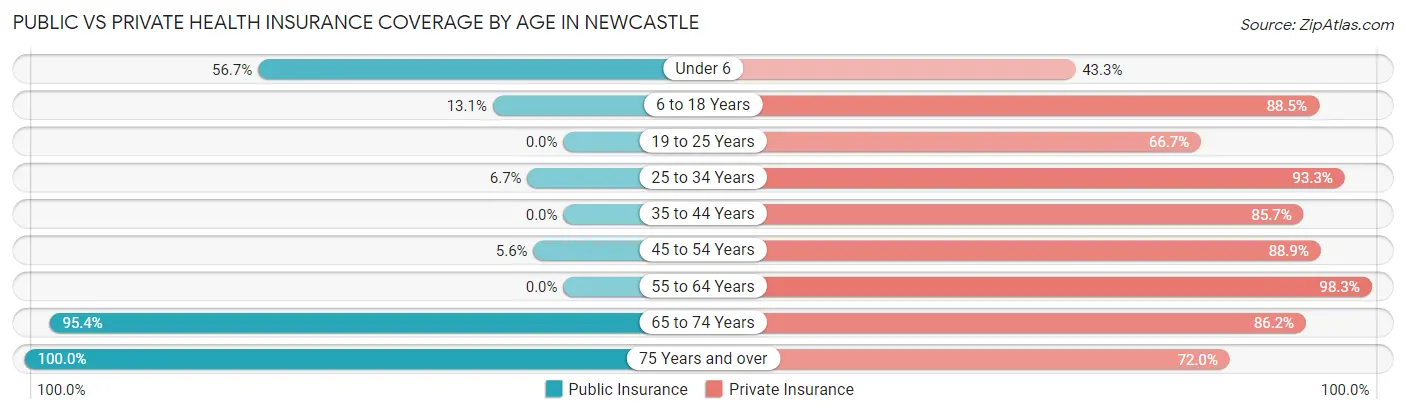
| Age Bracket | Public Insurance | Private Insurance |
| Under 6 | 17 (56.7%) | 13 (43.3%) |
| 6 to 18 Years | 8 (13.1%) | 54 (88.5%) |
| 19 to 25 Years | 0 (0.0%) | 12 (66.7%) |
| 25 to 34 Years | 1 (6.7%) | 14 (93.3%) |
| 35 to 44 Years | 0 (0.0%) | 12 (85.7%) |
| 45 to 54 Years | 2 (5.6%) | 32 (88.9%) |
| 55 to 64 Years | 0 (0.0%) | 118 (98.3%) |
| 65 to 74 Years | 62 (95.4%) | 56 (86.2%) |
| 75 Years and over | 25 (100.0%) | 18 (72.0%) |
| Total | 115 (29.9%) | 329 (85.7%) |
Disability Status by Sex by Age in Newcastle
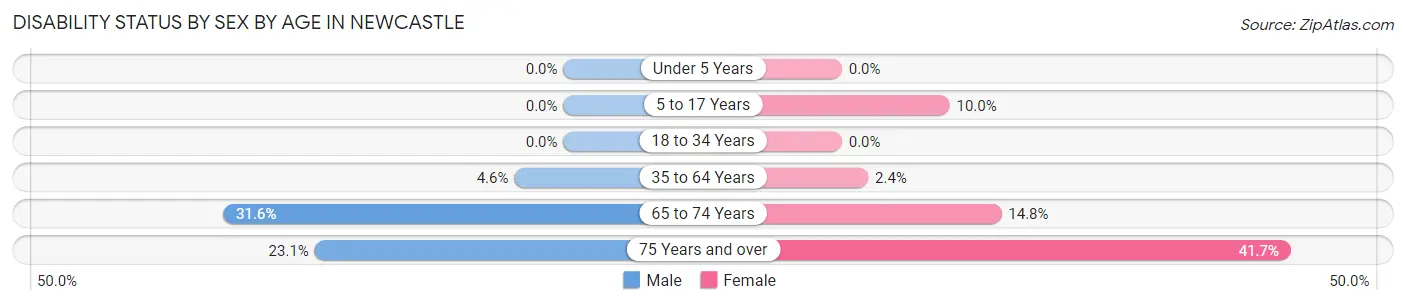
| Age Bracket | Male | Female |
| Under 5 Years | 0 (0.0%) | 0 (0.0%) |
| 5 to 17 Years | 0 (0.0%) | 2 (10.0%) |
| 18 to 34 Years | 0 (0.0%) | 0 (0.0%) |
| 35 to 64 Years | 4 (4.5%) | 2 (2.4%) |
| 65 to 74 Years | 12 (31.6%) | 4 (14.8%) |
| 75 Years and over | 3 (23.1%) | 5 (41.7%) |
Disability Class by Sex by Age in Newcastle
Disability Class: Hearing Difficulty
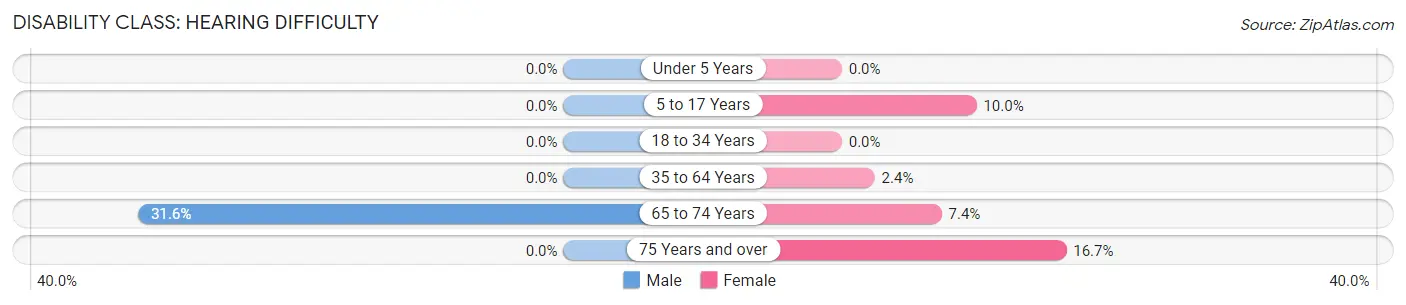
| Age Bracket | Male | Female |
| Under 5 Years | 0 (0.0%) | 0 (0.0%) |
| 5 to 17 Years | 0 (0.0%) | 2 (10.0%) |
| 18 to 34 Years | 0 (0.0%) | 0 (0.0%) |
| 35 to 64 Years | 0 (0.0%) | 2 (2.4%) |
| 65 to 74 Years | 12 (31.6%) | 2 (7.4%) |
| 75 Years and over | 0 (0.0%) | 2 (16.7%) |
Disability Class: Vision Difficulty
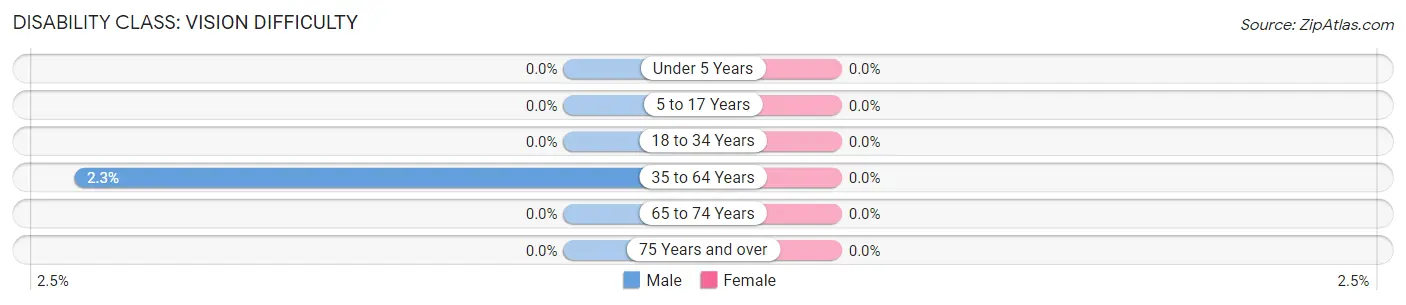
| Age Bracket | Male | Female |
| Under 5 Years | 0 (0.0%) | 0 (0.0%) |
| 5 to 17 Years | 0 (0.0%) | 0 (0.0%) |
| 18 to 34 Years | 0 (0.0%) | 0 (0.0%) |
| 35 to 64 Years | 2 (2.3%) | 0 (0.0%) |
| 65 to 74 Years | 0 (0.0%) | 0 (0.0%) |
| 75 Years and over | 0 (0.0%) | 0 (0.0%) |
Disability Class: Cognitive Difficulty
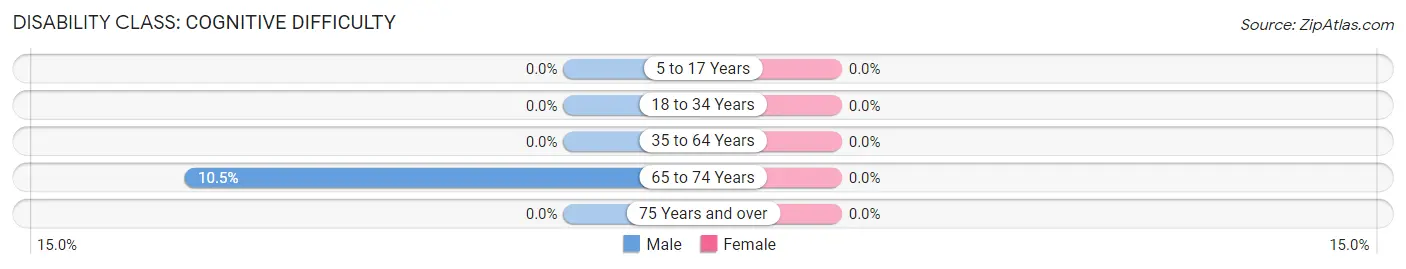
| Age Bracket | Male | Female |
| 5 to 17 Years | 0 (0.0%) | 0 (0.0%) |
| 18 to 34 Years | 0 (0.0%) | 0 (0.0%) |
| 35 to 64 Years | 0 (0.0%) | 0 (0.0%) |
| 65 to 74 Years | 4 (10.5%) | 0 (0.0%) |
| 75 Years and over | 0 (0.0%) | 0 (0.0%) |
Disability Class: Ambulatory Difficulty
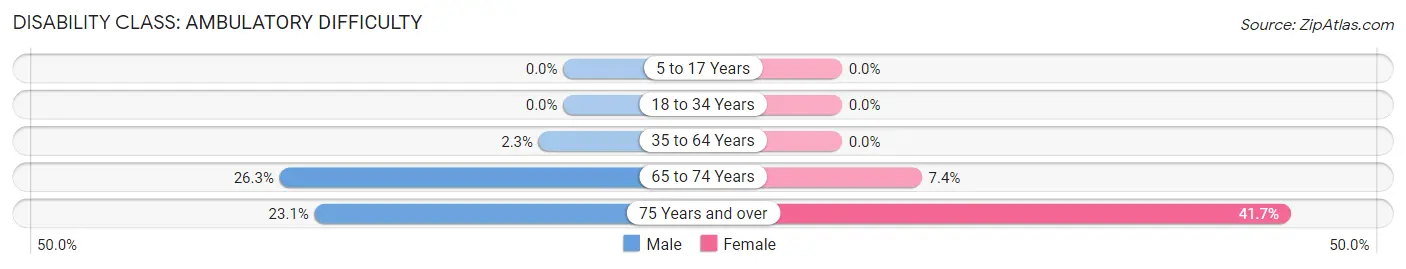
| Age Bracket | Male | Female |
| 5 to 17 Years | 0 (0.0%) | 0 (0.0%) |
| 18 to 34 Years | 0 (0.0%) | 0 (0.0%) |
| 35 to 64 Years | 2 (2.3%) | 0 (0.0%) |
| 65 to 74 Years | 10 (26.3%) | 2 (7.4%) |
| 75 Years and over | 3 (23.1%) | 5 (41.7%) |
Disability Class: Self-Care Difficulty
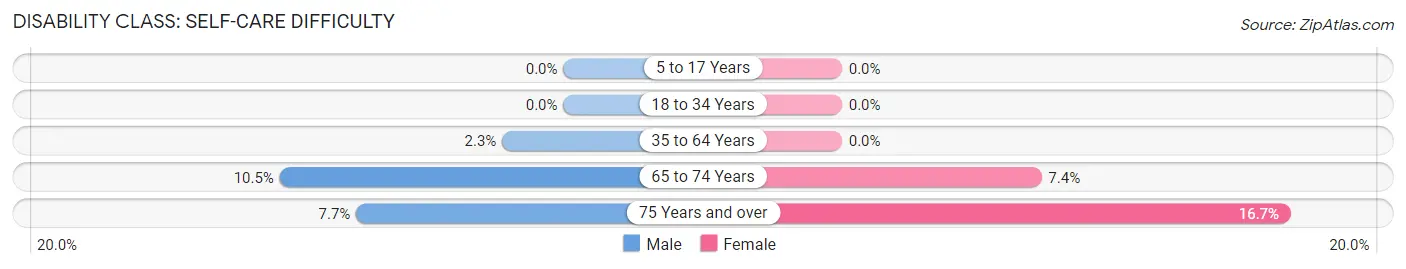
| Age Bracket | Male | Female |
| 5 to 17 Years | 0 (0.0%) | 0 (0.0%) |
| 18 to 34 Years | 0 (0.0%) | 0 (0.0%) |
| 35 to 64 Years | 2 (2.3%) | 0 (0.0%) |
| 65 to 74 Years | 4 (10.5%) | 2 (7.4%) |
| 75 Years and over | 1 (7.7%) | 2 (16.7%) |
Technology Access in Newcastle
Computing Device Access in Newcastle
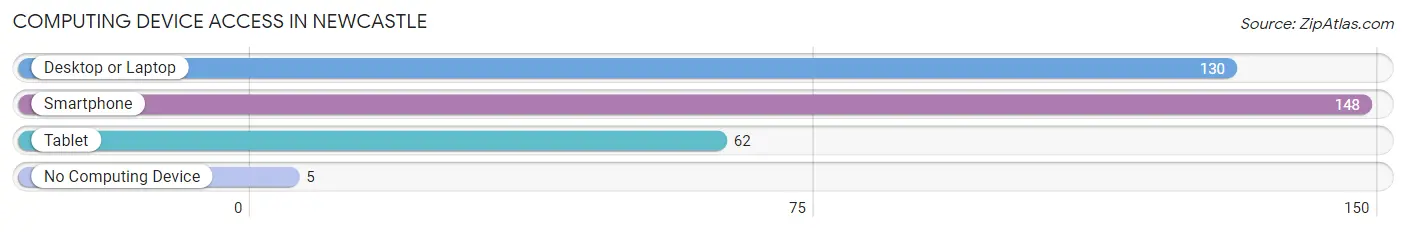
| Device Type | # Households | % Households |
| Desktop or Laptop | 130 | 75.6% |
| Smartphone | 148 | 86.1% |
| Tablet | 62 | 36.0% |
| No Computing Device | 5 | 2.9% |
| Total | 172 | 100.0% |
Internet Access in Newcastle
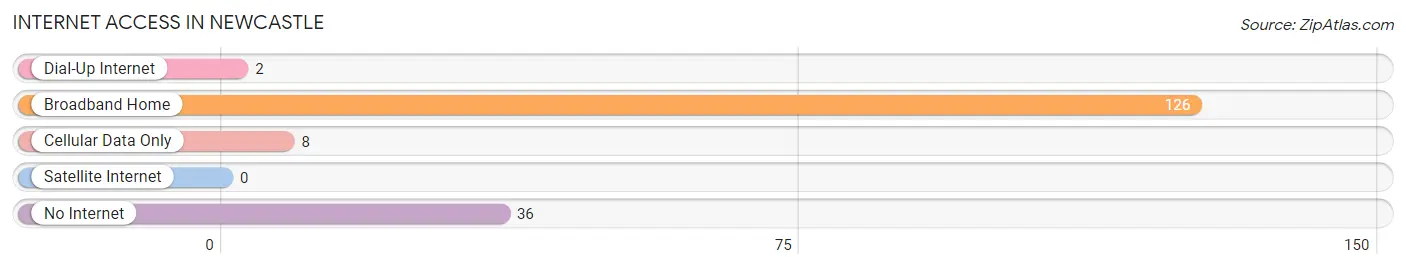
| Internet Type | # Households | % Households |
| Dial-Up Internet | 2 | 1.2% |
| Broadband Home | 126 | 73.3% |
| Cellular Data Only | 8 | 4.6% |
| Satellite Internet | 0 | 0.0% |
| No Internet | 36 | 20.9% |
| Total | 172 | 100.0% |
Newcastle Summary
Newcastle is a city located in the northeast corner of Nebraska, in the United States. It is the county seat of Dixon County and is located on the Missouri River. The city has a population of approximately 1,400 people and is part of the Sioux City, IA-NE-SD Metropolitan Statistical Area.
History
The area that is now Newcastle was first settled in 1856 by a group of settlers from the nearby town of Ponca. The settlement was originally known as “Ponca’s Point” and was located on the Missouri River. In 1858, the settlement was renamed “Newcastle” after the city of Newcastle-upon-Tyne in England.
The city was officially incorporated in 1873 and was named the county seat of Dixon County in 1876. In the late 19th century, Newcastle was a thriving agricultural and commercial center. The city was home to several businesses, including a flour mill, a sawmill, a brickyard, and a creamery.
In the early 20th century, Newcastle experienced a period of growth and development. The city was home to several banks, a hotel, a movie theater, and a variety of other businesses. The city also had a public library, a hospital, and a number of churches.
Geography
Newcastle is located in the northeast corner of Nebraska, in the United States. It is situated on the Missouri River, approximately 25 miles south of Sioux City, Iowa. The city has a total area of 1.3 square miles, all of which is land.
The city is located in a region of rolling hills and prairies. The climate is characterized by hot summers and cold winters. The average annual temperature is 50°F, and the average annual precipitation is 28 inches.
Economy
The economy of Newcastle is largely based on agriculture and manufacturing. The city is home to several manufacturing companies, including a plastics manufacturer, a metal fabricator, and a food processing plant.
The city is also home to several agricultural businesses, including a grain elevator, a feed mill, and a dairy. The city is also home to a number of retail stores, restaurants, and other businesses.
Demographics
As of the 2010 census, the population of Newcastle was 1,400. The racial makeup of the city was 95.3% White, 0.7% African American, 0.3% Native American, 0.3% Asian, 0.1% Pacific Islander, and 2.3% from other races. Hispanic or Latino of any race were 3.3% of the population.
The median household income in Newcastle was $41,250, and the median family income was $48,750. The per capita income for the city was $19,945. About 11.2% of families and 13.3% of the population were below the poverty line, including 17.2% of those under age 18 and 8.3% of those age 65 or over.
Newcastle is served by the Newcastle Public Schools, which includes an elementary school, a middle school, and a high school. The city is also home to a number of churches, including the First Presbyterian Church, the First United Methodist Church, and the St. John’s Lutheran Church.
Common Questions
What is Per Capita Income in Newcastle?
Per Capita income in Newcastle is $43,531.
What is the Median Household income in Newcastle?
Median Household Income in Newcastle is $71,250.
What is Inequality or Gini Index in Newcastle?
Inequality or Gini Index in Newcastle is 0.38.
What is the Total Population of Newcastle?
Total Population of Newcastle is 384.
What is the Total Male Population of Newcastle?
Total Male Population of Newcastle is 211.
What is the Total Female Population of Newcastle?
Total Female Population of Newcastle is 173.
What is the Ratio of Males per 100 Females in Newcastle?
There are 121.97 Males per 100 Females in Newcastle.
What is the Ratio of Females per 100 Males in Newcastle?
There are 81.99 Females per 100 Males in Newcastle.
What is the Median Population Age in Newcastle?
Median Population Age in Newcastle is 57.2 Years.
What is the Average Family Size in Newcastle
Average Family Size in Newcastle is 2.5 People.
What is the Average Household Size in Newcastle
Average Household Size in Newcastle is 2.2 People.
How Large is the Labor Force in Newcastle?
There are 213 People in the Labor Forcein in Newcastle.
What is the Percentage of People in the Labor Force in Newcastle?
70.1% of People are in the Labor Force in Newcastle.