Mullen, NE Map & Demographics
Mullen Map
Mullen Overview
$31,771
PER CAPITA INCOME
$102,171
AVG FAMILY INCOME
$41,944
AVG HOUSEHOLD INCOME
27.9%
WAGE / INCOME GAP [ % ]
72.1¢/ $1
WAGE / INCOME GAP [ $ ]
0.42
INEQUALITY / GINI INDEX
453
TOTAL POPULATION
192
MALE POPULATION
261
FEMALE POPULATION
73.56
MALES / 100 FEMALES
135.94
FEMALES / 100 MALES
41.3
MEDIAN AGE
3.5
AVG FAMILY SIZE
2.0
AVG HOUSEHOLD SIZE
236
LABOR FORCE [ PEOPLE ]
61.6%
PERCENT IN LABOR FORCE
Mullen Zip Codes
Mullen Area Codes
Income in Mullen
Income Overview in Mullen
Per Capita Income in Mullen is $31,771, while median incomes of families and households are $102,171 and $41,944 respectively.
| Characteristic | Number | Measure |
| Per Capita Income | 453 | $31,771 |
| Median Family Income | 73 | $102,171 |
| Mean Family Income | 73 | $117,152 |
| Median Household Income | 210 | $41,944 |
| Mean Household Income | 210 | $62,629 |
| Income Deficit | 73 | $0 |
| Wage / Income Gap (%) | 453 | 27.89% |
| Wage / Income Gap ($) | 453 | 72.11¢ per $1 |
| Gini / Inequality Index | 453 | 0.42 |
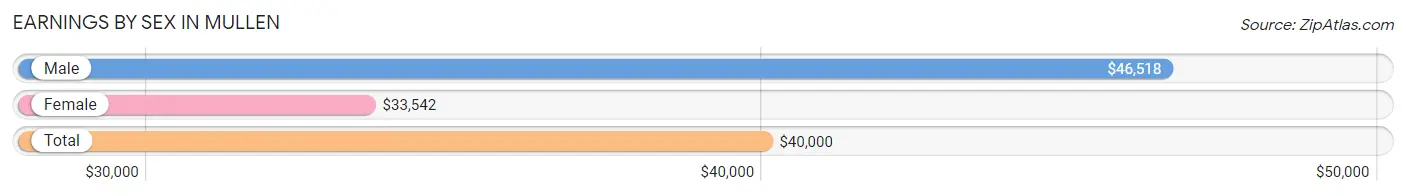
Earnings by Sex in Mullen
Average Earnings in Mullen are $40,000, $46,518 for men and $33,542 for women, a difference of 27.9%.
| Sex | Number | Average Earnings |
| Male | 127 (48.1%) | $46,518 |
| Female | 137 (51.9%) | $33,542 |
| Total | 264 (100.0%) | $40,000 |
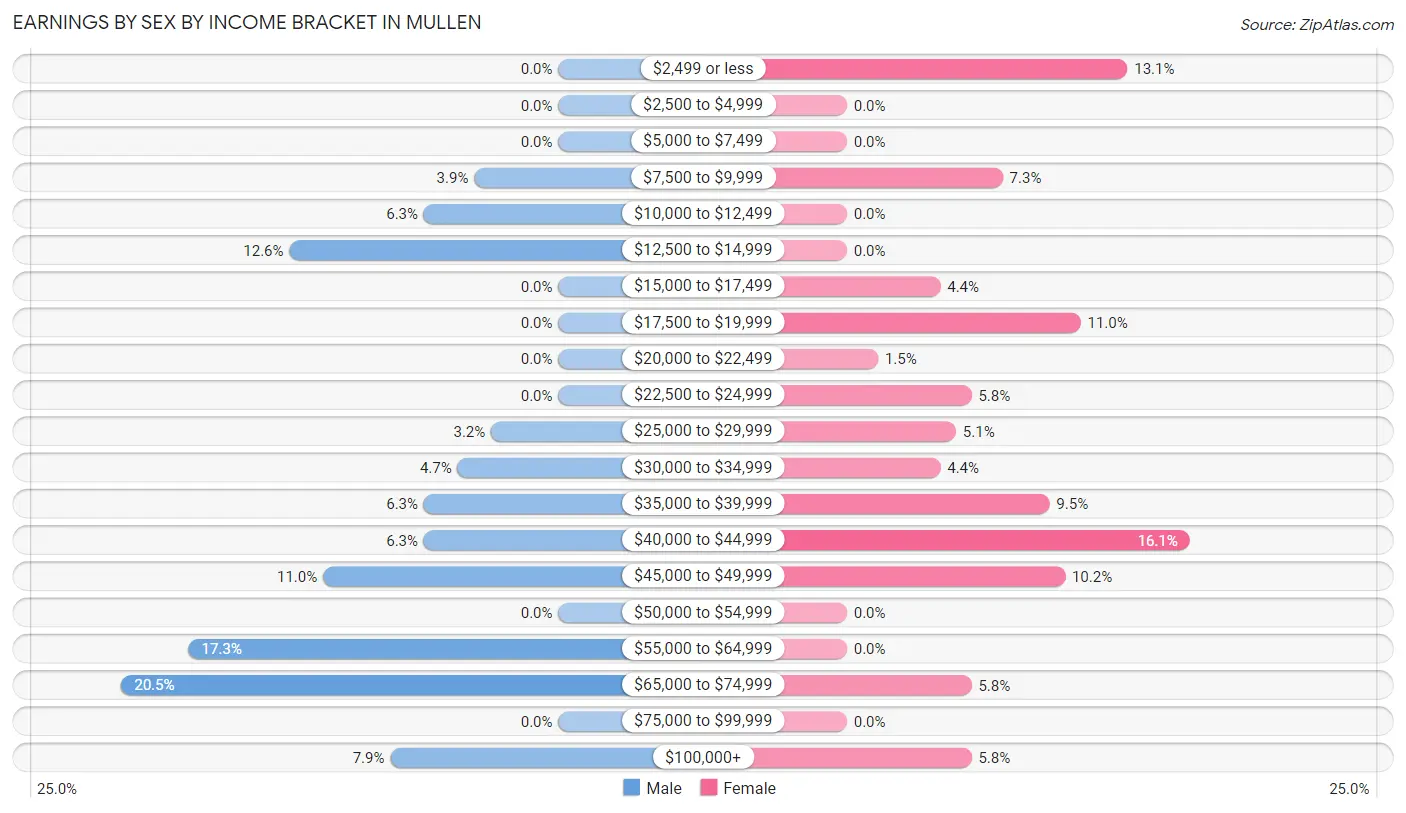
Earnings by Sex by Income Bracket in Mullen
The most common earnings brackets in Mullen are $65,000 to $74,999 for men (26 | 20.5%) and $40,000 to $44,999 for women (22 | 16.1%).
| Income | Male | Female |
| $2,499 or less | 0 (0.0%) | 18 (13.1%) |
| $2,500 to $4,999 | 0 (0.0%) | 0 (0.0%) |
| $5,000 to $7,499 | 0 (0.0%) | 0 (0.0%) |
| $7,500 to $9,999 | 5 (3.9%) | 10 (7.3%) |
| $10,000 to $12,499 | 8 (6.3%) | 0 (0.0%) |
| $12,500 to $14,999 | 16 (12.6%) | 0 (0.0%) |
| $15,000 to $17,499 | 0 (0.0%) | 6 (4.4%) |
| $17,500 to $19,999 | 0 (0.0%) | 15 (11.0%) |
| $20,000 to $22,499 | 0 (0.0%) | 2 (1.5%) |
| $22,500 to $24,999 | 0 (0.0%) | 8 (5.8%) |
| $25,000 to $29,999 | 4 (3.2%) | 7 (5.1%) |
| $30,000 to $34,999 | 6 (4.7%) | 6 (4.4%) |
| $35,000 to $39,999 | 8 (6.3%) | 13 (9.5%) |
| $40,000 to $44,999 | 8 (6.3%) | 22 (16.1%) |
| $45,000 to $49,999 | 14 (11.0%) | 14 (10.2%) |
| $50,000 to $54,999 | 0 (0.0%) | 0 (0.0%) |
| $55,000 to $64,999 | 22 (17.3%) | 0 (0.0%) |
| $65,000 to $74,999 | 26 (20.5%) | 8 (5.8%) |
| $75,000 to $99,999 | 0 (0.0%) | 0 (0.0%) |
| $100,000+ | 10 (7.9%) | 8 (5.8%) |
| Total | 127 (100.0%) | 137 (100.0%) |
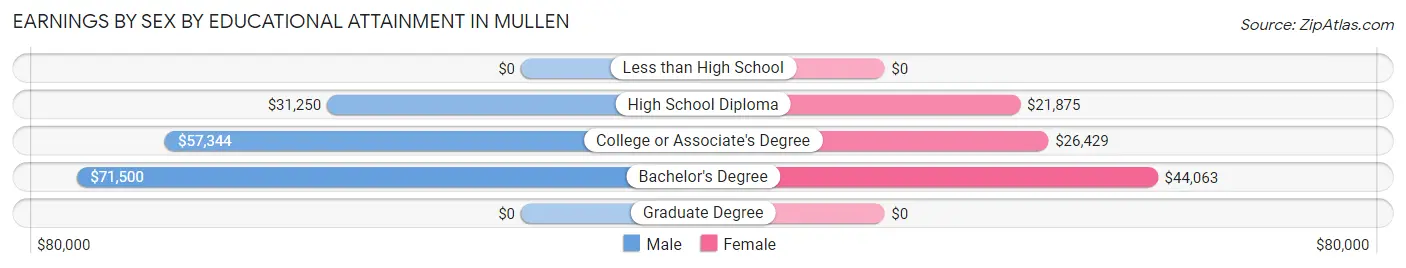
Earnings by Sex by Educational Attainment in Mullen
Average earnings in Mullen are $56,023 for men and $39,231 for women, a difference of 30.0%. Men with an educational attainment of bachelor's degree enjoy the highest average annual earnings of $71,500, while those with high school diploma education earn the least with $31,250. Women with an educational attainment of bachelor's degree earn the most with the average annual earnings of $44,063, while those with high school diploma education have the smallest earnings of $21,875.
| Educational Attainment | Male Income | Female Income |
| Less than High School | - | - |
| High School Diploma | $31,250 | $21,875 |
| College or Associate's Degree | $57,344 | $26,429 |
| Bachelor's Degree | $71,500 | $44,063 |
| Graduate Degree | - | - |
| Total | $56,023 | $39,231 |
Family Income in Mullen
Family Income Brackets in Mullen
According to the Mullen family income data, there are 37 families falling into the $100,000 to $149,999 income range, which is the most common income bracket and makes up 50.7% of all families.
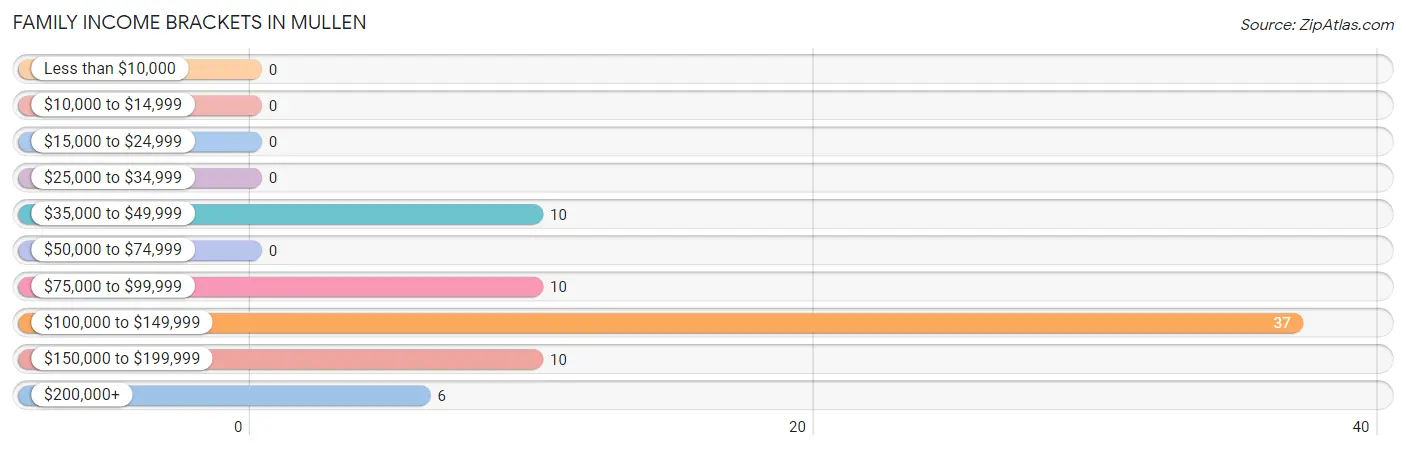
| Income Bracket | # Families | % Families |
| Less than $10,000 | 0 | 0.0% |
| $10,000 to $14,999 | 0 | 0.0% |
| $15,000 to $24,999 | 0 | 0.0% |
| $25,000 to $34,999 | 0 | 0.0% |
| $35,000 to $49,999 | 10 | 13.7% |
| $50,000 to $74,999 | 0 | 0.0% |
| $75,000 to $99,999 | 10 | 13.7% |
| $100,000 to $149,999 | 37 | 50.7% |
| $150,000 to $199,999 | 10 | 13.7% |
| $200,000+ | 6 | 8.2% |
Family Income by Famaliy Size in Mullen
4-person families (25 | 34.3%) account for the highest median family income in Mullen with $108,750 per family, while 2-person families (26 | 35.6%) have the highest median income of $48,125 per family member.
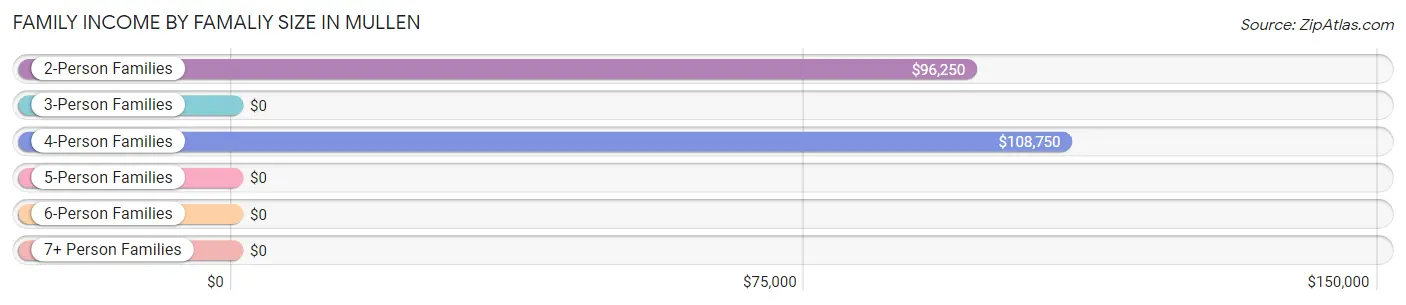
| Income Bracket | # Families | Median Income |
| 2-Person Families | 26 (35.6%) | $96,250 |
| 3-Person Families | 12 (16.4%) | $0 |
| 4-Person Families | 25 (34.3%) | $108,750 |
| 5-Person Families | 10 (13.7%) | $0 |
| 6-Person Families | 0 (0.0%) | $0 |
| 7+ Person Families | 0 (0.0%) | $0 |
| Total | 73 (100.0%) | $102,171 |
Family Income by Number of Earners in Mullen
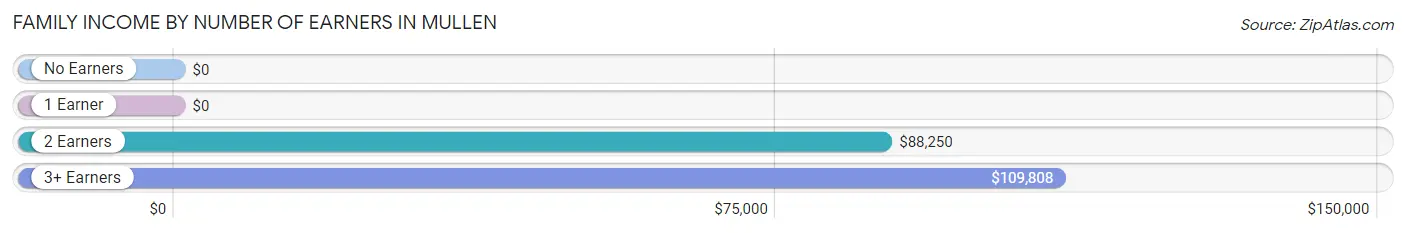
| Number of Earners | # Families | Median Income |
| No Earners | 0 (0.0%) | $0 |
| 1 Earner | 18 (24.7%) | $0 |
| 2 Earners | 31 (42.5%) | $88,250 |
| 3+ Earners | 24 (32.9%) | $109,808 |
| Total | 73 (100.0%) | $102,171 |
Household Income in Mullen
Household Income Brackets in Mullen
With 58 households falling in the category, the $35,000 to $49,999 income range is the most frequent in Mullen, accounting for 27.6% of all households.
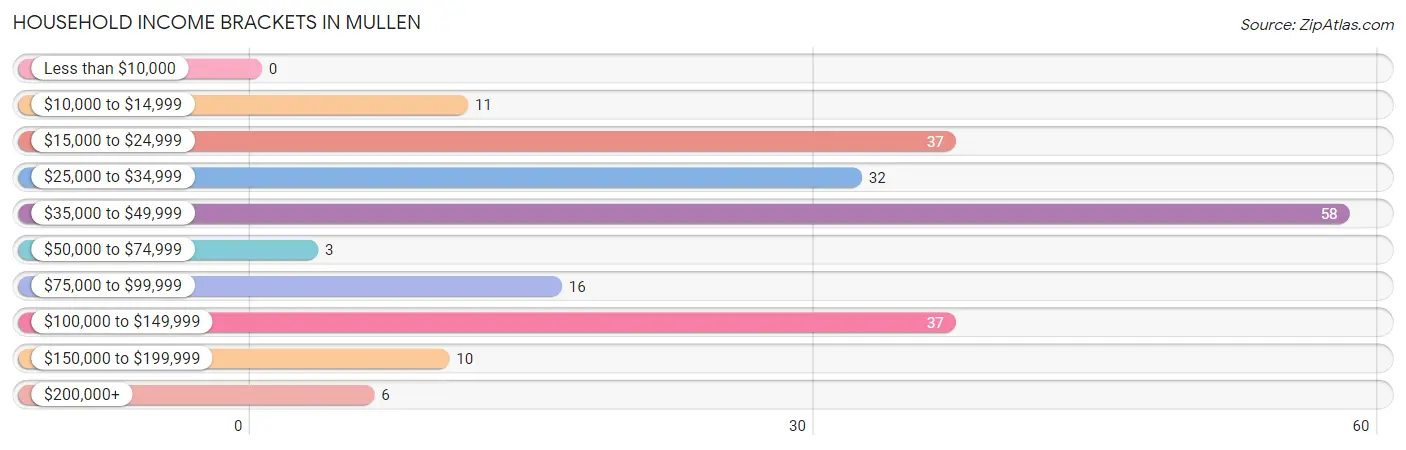
| Income Bracket | # Households | % Households |
| Less than $10,000 | 0 | 0.0% |
| $10,000 to $14,999 | 11 | 5.2% |
| $15,000 to $24,999 | 37 | 17.6% |
| $25,000 to $34,999 | 32 | 15.2% |
| $35,000 to $49,999 | 58 | 27.6% |
| $50,000 to $74,999 | 3 | 1.4% |
| $75,000 to $99,999 | 16 | 7.6% |
| $100,000 to $149,999 | 37 | 17.6% |
| $150,000 to $199,999 | 10 | 4.8% |
| $200,000+ | 6 | 2.9% |
Household Income by Householder Age in Mullen
The median household income in Mullen is $41,944, with the highest median household income of $102,232 found in the 25 to 44 years age bracket for the primary householder. A total of 61 households (29.0%) fall into this category. Meanwhile, the 65+ years age bracket for the primary householder has the lowest median household income of $21,250, with 68 households (32.4%) in this group.
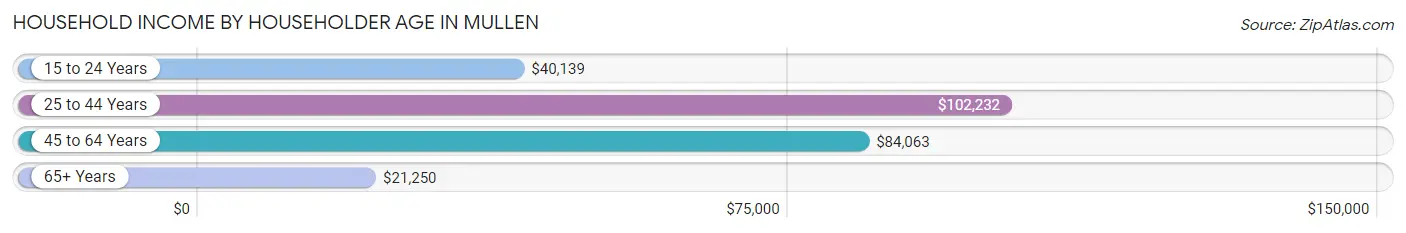
| Income Bracket | # Households | Median Income |
| 15 to 24 Years | 34 (16.2%) | $40,139 |
| 25 to 44 Years | 61 (29.0%) | $102,232 |
| 45 to 64 Years | 47 (22.4%) | $84,063 |
| 65+ Years | 68 (32.4%) | $21,250 |
| Total | 210 (100.0%) | $41,944 |
Poverty in Mullen
Income Below Poverty by Sex and Age in Mullen
With 4.3% poverty level for males and 6.0% for females among the residents of Mullen, 18 to 24 year old males and 65 to 74 year old females are the most vulnerable to poverty, with 8 males (27.6%) and 11 females (64.7%) in their respective age groups living below the poverty level.
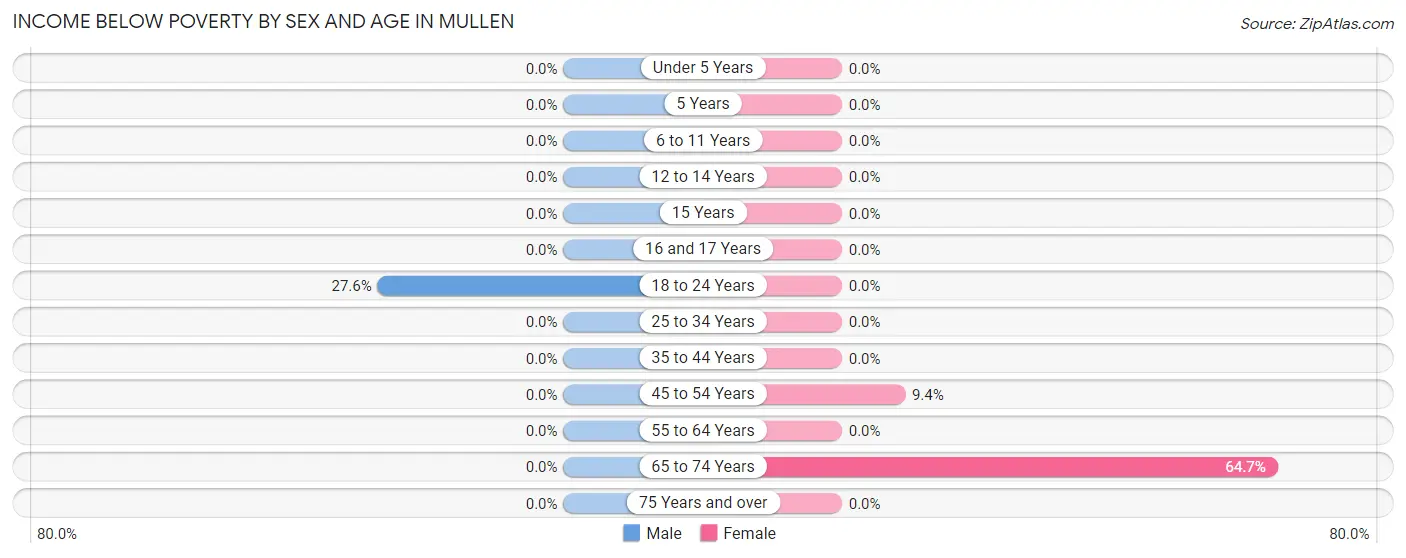
| Age Bracket | Male | Female |
| Under 5 Years | 0 (0.0%) | 0 (0.0%) |
| 5 Years | 0 (0.0%) | 0 (0.0%) |
| 6 to 11 Years | 0 (0.0%) | 0 (0.0%) |
| 12 to 14 Years | 0 (0.0%) | 0 (0.0%) |
| 15 Years | 0 (0.0%) | 0 (0.0%) |
| 16 and 17 Years | 0 (0.0%) | 0 (0.0%) |
| 18 to 24 Years | 8 (27.6%) | 0 (0.0%) |
| 25 to 34 Years | 0 (0.0%) | 0 (0.0%) |
| 35 to 44 Years | 0 (0.0%) | 0 (0.0%) |
| 45 to 54 Years | 0 (0.0%) | 3 (9.4%) |
| 55 to 64 Years | 0 (0.0%) | 0 (0.0%) |
| 65 to 74 Years | 0 (0.0%) | 11 (64.7%) |
| 75 Years and over | 0 (0.0%) | 0 (0.0%) |
| Total | 8 (4.3%) | 14 (6.0%) |
Income Above Poverty by Sex and Age in Mullen
According to the poverty statistics in Mullen, males aged under 5 years and females aged 6 to 11 years are the age groups that are most secure financially, with 100.0% of males and 100.0% of females in these age groups living above the poverty line.
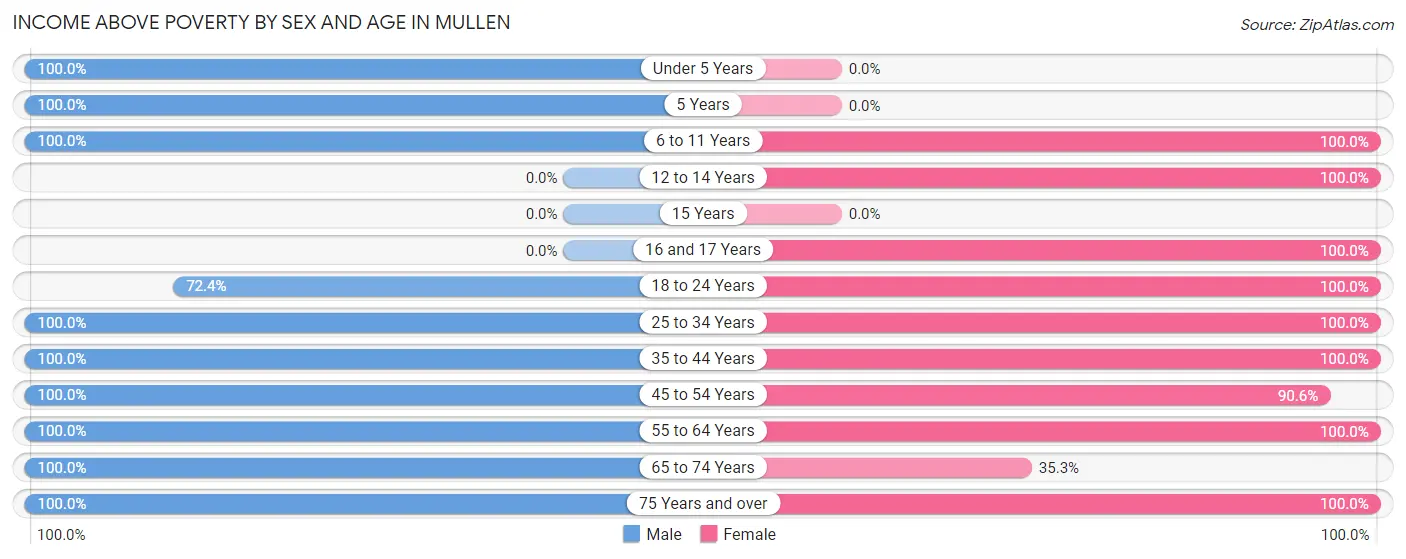
| Age Bracket | Male | Female |
| Under 5 Years | 19 (100.0%) | 0 (0.0%) |
| 5 Years | 8 (100.0%) | 0 (0.0%) |
| 6 to 11 Years | 4 (100.0%) | 7 (100.0%) |
| 12 to 14 Years | 0 (0.0%) | 24 (100.0%) |
| 15 Years | 0 (0.0%) | 0 (0.0%) |
| 16 and 17 Years | 0 (0.0%) | 30 (100.0%) |
| 18 to 24 Years | 21 (72.4%) | 27 (100.0%) |
| 25 to 34 Years | 15 (100.0%) | 12 (100.0%) |
| 35 to 44 Years | 43 (100.0%) | 39 (100.0%) |
| 45 to 54 Years | 26 (100.0%) | 29 (90.6%) |
| 55 to 64 Years | 23 (100.0%) | 14 (100.0%) |
| 65 to 74 Years | 10 (100.0%) | 6 (35.3%) |
| 75 Years and over | 9 (100.0%) | 32 (100.0%) |
| Total | 178 (95.7%) | 220 (94.0%) |
Income Below Poverty Among Married-Couple Families in Mullen
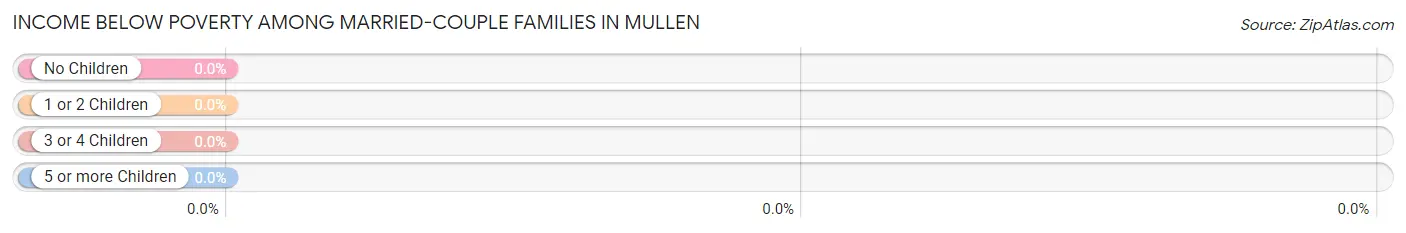
| Children | Above Poverty | Below Poverty |
| No Children | 30 (100.0%) | 0 (0.0%) |
| 1 or 2 Children | 25 (100.0%) | 0 (0.0%) |
| 3 or 4 Children | 10 (100.0%) | 0 (0.0%) |
| 5 or more Children | 0 (0.0%) | 0 (0.0%) |
| Total | 65 (100.0%) | 0 (0.0%) |
Income Below Poverty Among Single-Parent Households in Mullen
| Children | Single Father | Single Mother |
| No Children | 0 (0.0%) | 0 (0.0%) |
| 1 or 2 Children | 0 (0.0%) | 0 (0.0%) |
| 3 or 4 Children | 0 (0.0%) | 0 (0.0%) |
| 5 or more Children | 0 (0.0%) | 0 (0.0%) |
| Total | 0 (0.0%) | 0 (0.0%) |
Income Below Poverty Among Married-Couple vs Single-Parent Households in Mullen
| Children | Married-Couple Families | Single-Parent Households |
| No Children | 0 (0.0%) | 0 (0.0%) |
| 1 or 2 Children | 0 (0.0%) | 0 (0.0%) |
| 3 or 4 Children | 0 (0.0%) | 0 (0.0%) |
| 5 or more Children | 0 (0.0%) | 0 (0.0%) |
| Total | 0 (0.0%) | 0 (0.0%) |
Race in Mullen
The most populous races in Mullen are White / Caucasian (397 | 87.6%), Two or more Races (45 | 9.9%), and Some other Race (11 | 2.4%).
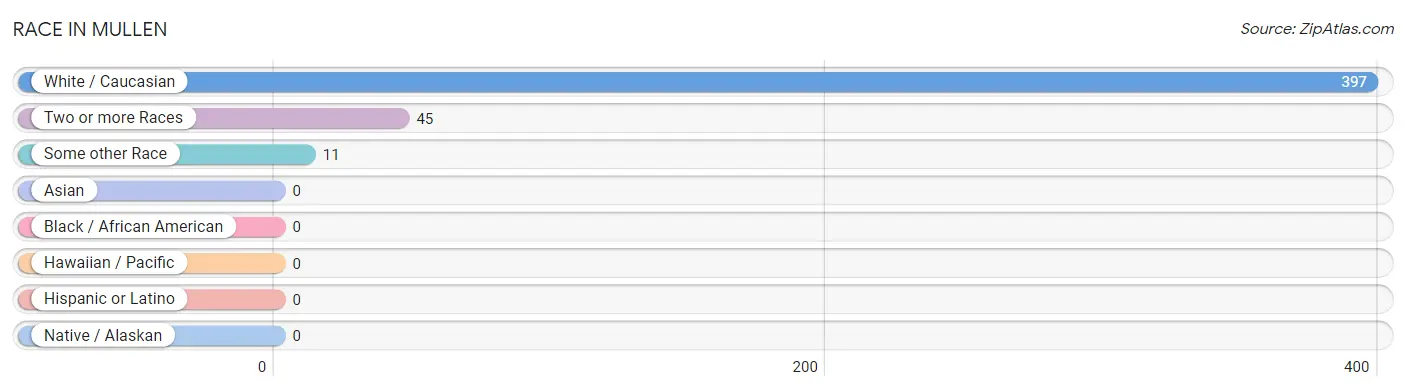
| Race | # Population | % Population |
| Asian | 0 | 0.0% |
| Black / African American | 0 | 0.0% |
| Hawaiian / Pacific | 0 | 0.0% |
| Hispanic or Latino | 0 | 0.0% |
| Native / Alaskan | 0 | 0.0% |
| White / Caucasian | 397 | 87.6% |
| Two or more Races | 45 | 9.9% |
| Some other Race | 11 | 2.4% |
| Total | 453 | 100.0% |
Ancestry in Mullen
The most populous ancestries reported in Mullen are German (126 | 27.8%), European (73 | 16.1%), English (71 | 15.7%), Irish (57 | 12.6%), and Italian (47 | 10.4%), together accounting for 82.6% of all Mullen residents.
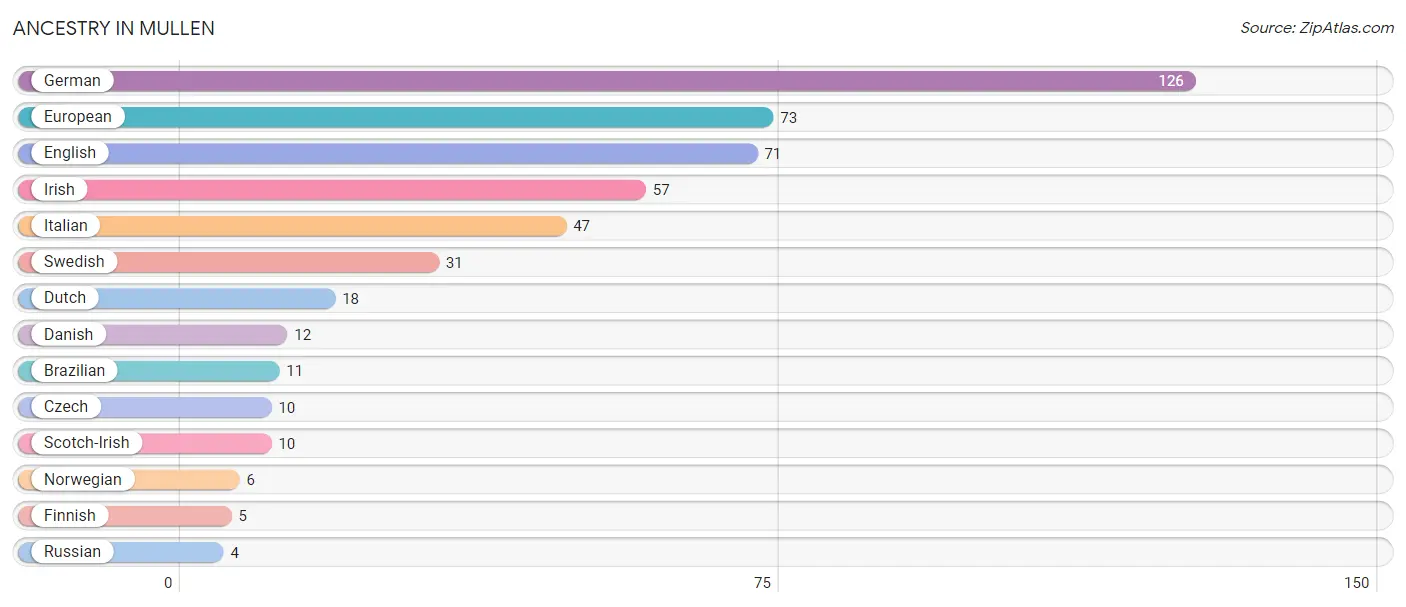
| Ancestry | # Population | % Population |
| Brazilian | 11 | 2.4% |
| Czech | 10 | 2.2% |
| Danish | 12 | 2.6% |
| Dutch | 18 | 4.0% |
| English | 71 | 15.7% |
| European | 73 | 16.1% |
| Finnish | 5 | 1.1% |
| German | 126 | 27.8% |
| Irish | 57 | 12.6% |
| Italian | 47 | 10.4% |
| Norwegian | 6 | 1.3% |
| Russian | 4 | 0.9% |
| Scotch-Irish | 10 | 2.2% |
| Swedish | 31 | 6.8% | View All 14 Rows |
Immigrants in Mullen

| Immigration Origin | # Population | % Population | View All 0 Rows |
Sex and Age in Mullen
Sex and Age in Mullen
The most populous age groups in Mullen are 40 to 44 Years (43 | 22.4%) for men and 85 Years and over (41 | 15.7%) for women.
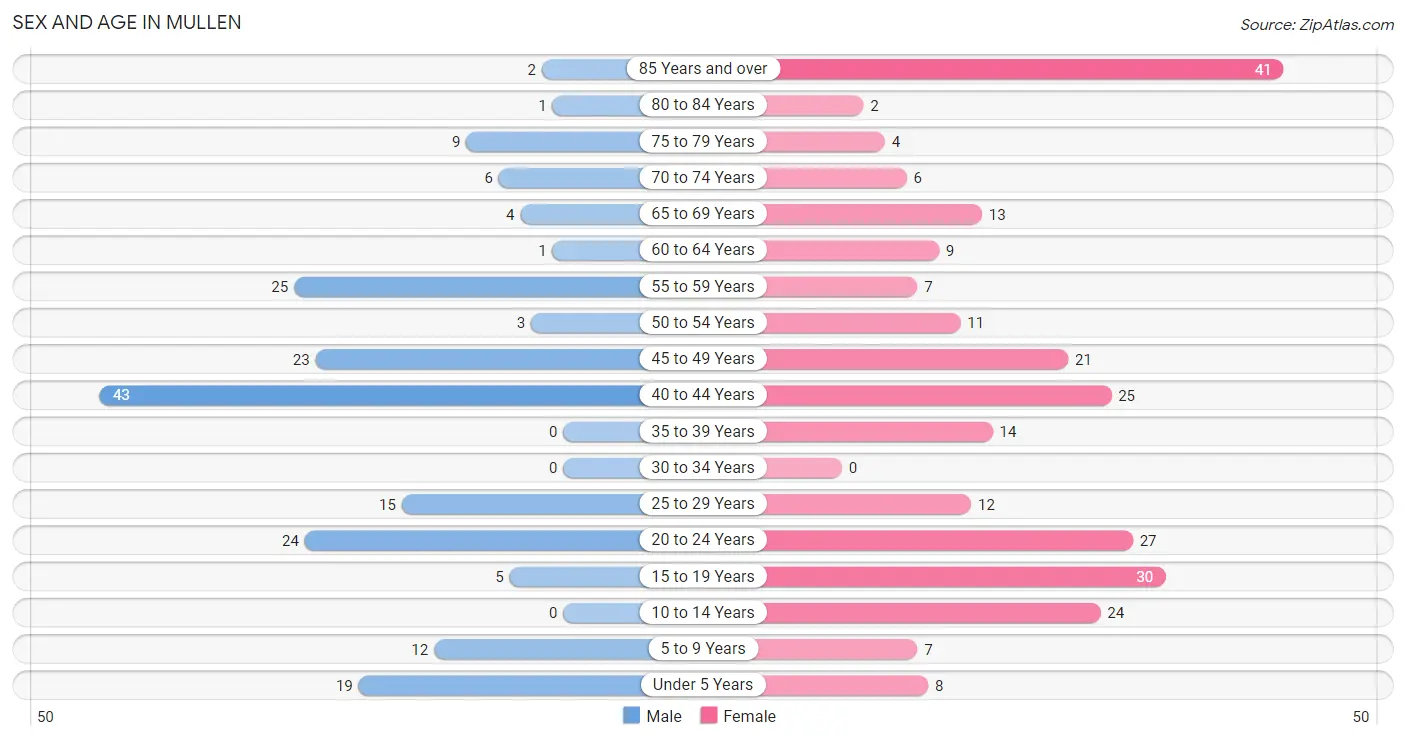
| Age Bracket | Male | Female |
| Under 5 Years | 19 (9.9%) | 8 (3.1%) |
| 5 to 9 Years | 12 (6.2%) | 7 (2.7%) |
| 10 to 14 Years | 0 (0.0%) | 24 (9.2%) |
| 15 to 19 Years | 5 (2.6%) | 30 (11.5%) |
| 20 to 24 Years | 24 (12.5%) | 27 (10.3%) |
| 25 to 29 Years | 15 (7.8%) | 12 (4.6%) |
| 30 to 34 Years | 0 (0.0%) | 0 (0.0%) |
| 35 to 39 Years | 0 (0.0%) | 14 (5.4%) |
| 40 to 44 Years | 43 (22.4%) | 25 (9.6%) |
| 45 to 49 Years | 23 (12.0%) | 21 (8.1%) |
| 50 to 54 Years | 3 (1.6%) | 11 (4.2%) |
| 55 to 59 Years | 25 (13.0%) | 7 (2.7%) |
| 60 to 64 Years | 1 (0.5%) | 9 (3.5%) |
| 65 to 69 Years | 4 (2.1%) | 13 (5.0%) |
| 70 to 74 Years | 6 (3.1%) | 6 (2.3%) |
| 75 to 79 Years | 9 (4.7%) | 4 (1.5%) |
| 80 to 84 Years | 1 (0.5%) | 2 (0.8%) |
| 85 Years and over | 2 (1.0%) | 41 (15.7%) |
| Total | 192 (100.0%) | 261 (100.0%) |
Families and Households in Mullen
Median Family Size in Mullen
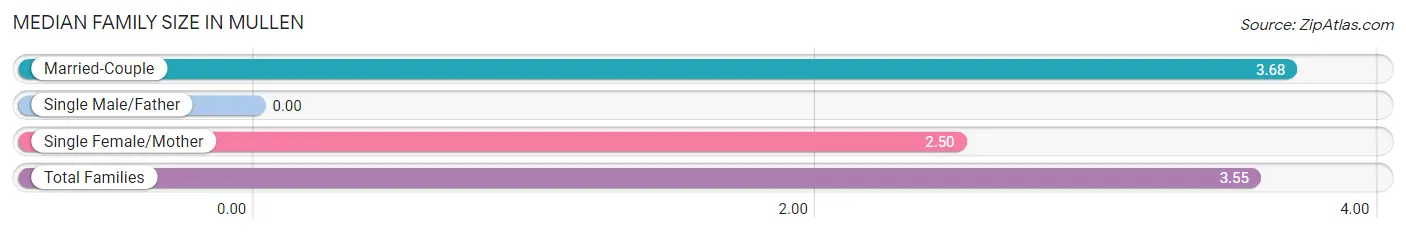
| Family Type | # Families | Family Size |
| Married-Couple | 65 (89.0%) | 3.68 |
| Single Male/Father | 0 (0.0%) | - |
| Single Female/Mother | 8 (11.0%) | 2.50 |
| Total Families | 73 (100.0%) | 3.55 |
Median Household Size in Mullen
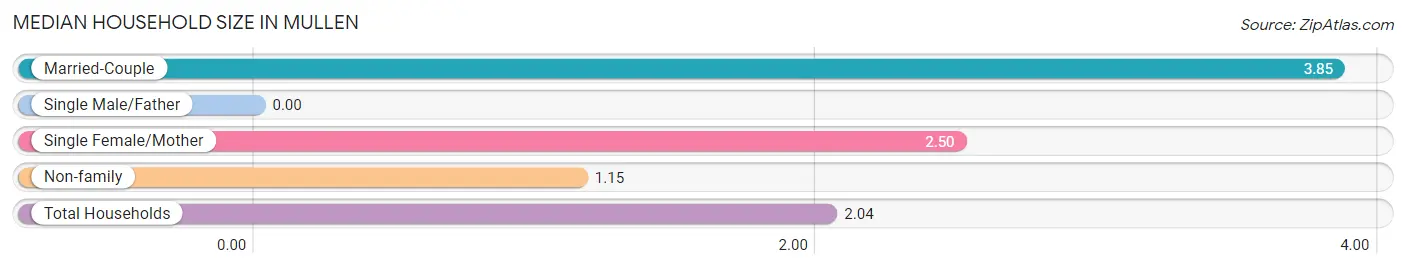
| Household Type | # Households | Household Size |
| Married-Couple | 65 (30.9%) | 3.85 |
| Single Male/Father | 0 (0.0%) | - |
| Single Female/Mother | 8 (3.8%) | 2.50 |
| Non-family | 137 (65.2%) | 1.15 |
| Total Households | 210 (100.0%) | 2.04 |
Household Size by Marriage Status in Mullen
Out of a total of 210 households in Mullen, 73 (34.8%) are family households, while 137 (65.2%) are nonfamily households. The most numerous type of family households are 4-person households, comprising 25, and the most common type of nonfamily households are 1-person households, comprising 123.
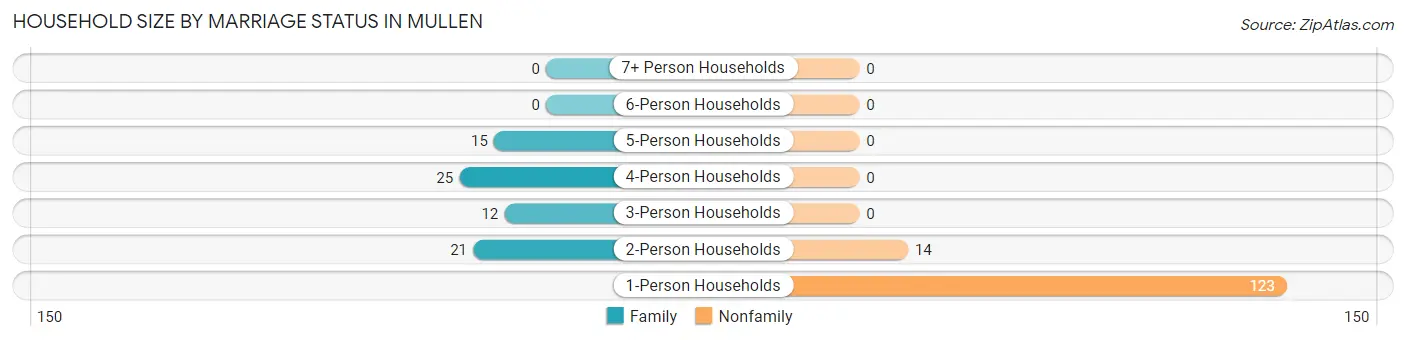
| Household Size | Family Households | Nonfamily Households |
| 1-Person Households | - | 123 (58.6%) |
| 2-Person Households | 21 (10.0%) | 14 (6.7%) |
| 3-Person Households | 12 (5.7%) | 0 (0.0%) |
| 4-Person Households | 25 (11.9%) | 0 (0.0%) |
| 5-Person Households | 15 (7.1%) | 0 (0.0%) |
| 6-Person Households | 0 (0.0%) | 0 (0.0%) |
| 7+ Person Households | 0 (0.0%) | 0 (0.0%) |
| Total | 73 (34.8%) | 137 (65.2%) |
Female Fertility in Mullen
Fertility by Age in Mullen
Average fertility rate in Mullen is 62.0 births per 1,000 women. Women in the age bracket of 35 to 50 years have the highest fertility rate with 133.0 births per 1,000 women. Women in the age bracket of 35 to 50 years acount for 100.0% of all women with births.
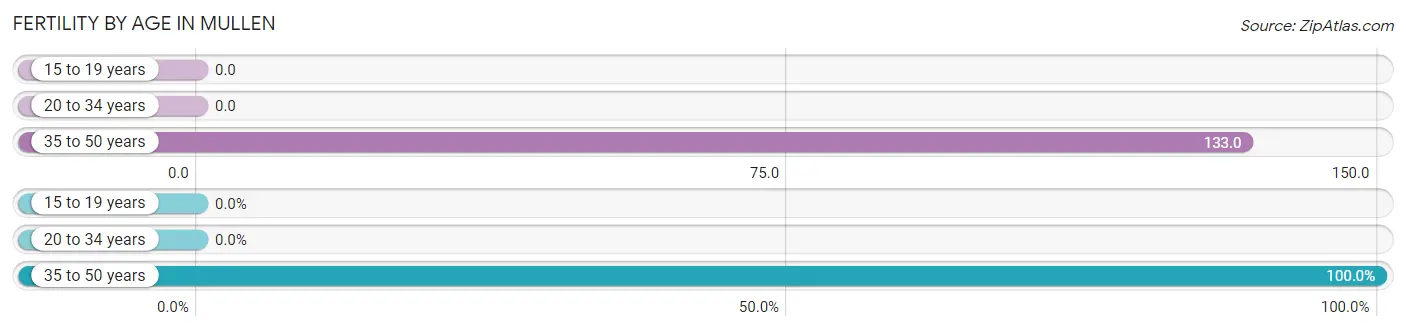
| Age Bracket | Women with Births | Births / 1,000 Women |
| 15 to 19 years | 0 (0.0%) | 0.0 |
| 20 to 34 years | 0 (0.0%) | 0.0 |
| 35 to 50 years | 8 (100.0%) | 133.0 |
| Total | 8 (100.0%) | 62.0 |
Fertility by Age by Marriage Status in Mullen
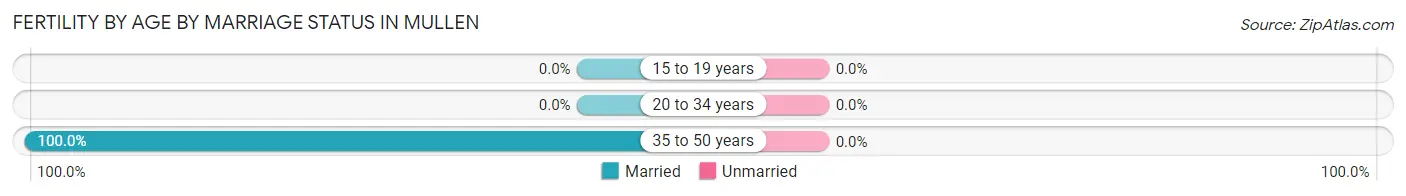
| Age Bracket | Married | Unmarried |
| 15 to 19 years | 0 (0.0%) | 0 (0.0%) |
| 20 to 34 years | 0 (0.0%) | 0 (0.0%) |
| 35 to 50 years | 8 (100.0%) | 0 (0.0%) |
| Total | 8 (100.0%) | 0 (0.0%) |
Fertility by Education in Mullen
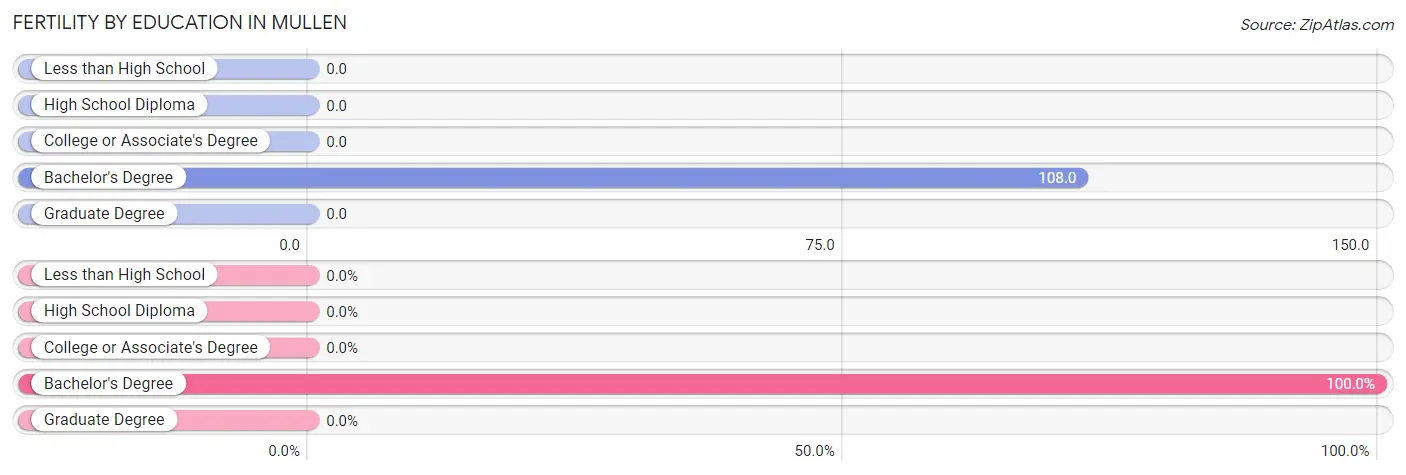
| Educational Attainment | Women with Births | Births / 1,000 Women |
| Less than High School | 0 (0.0%) | 0.0 |
| High School Diploma | 0 (0.0%) | 0.0 |
| College or Associate's Degree | 0 (0.0%) | 0.0 |
| Bachelor's Degree | 8 (100.0%) | 108.0 |
| Graduate Degree | 0 (0.0%) | 0.0 |
| Total | 8 (100.0%) | 62.0 |
Fertility by Education by Marriage Status in Mullen
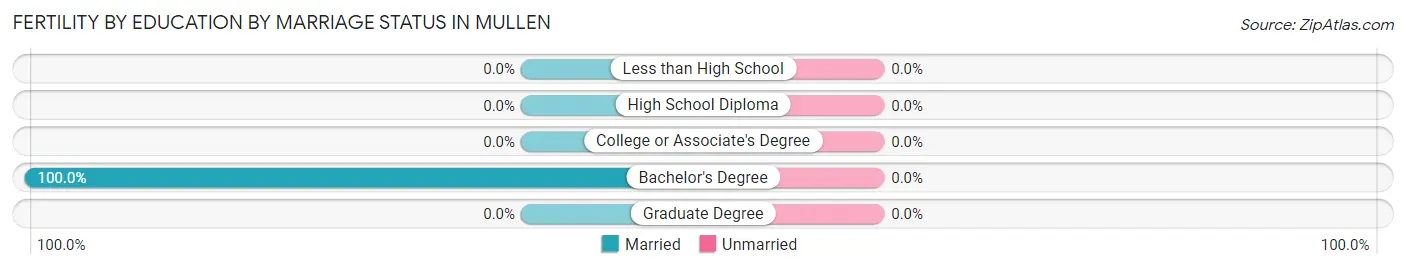
| Educational Attainment | Married | Unmarried |
| Less than High School | 0 (0.0%) | 0 (0.0%) |
| High School Diploma | 0 (0.0%) | 0 (0.0%) |
| College or Associate's Degree | 0 (0.0%) | 0 (0.0%) |
| Bachelor's Degree | 8 (100.0%) | 0 (0.0%) |
| Graduate Degree | 0 (0.0%) | 0 (0.0%) |
| Total | 8 (100.0%) | 0 (0.0%) |
Employment Characteristics in Mullen
Employment by Class of Employer in Mullen
Among the 206 employed individuals in Mullen, private company employees (136 | 66.0%), local government employees (37 | 18.0%), and not-for-profit organizations (10 | 4.9%) make up the most common classes of employment.
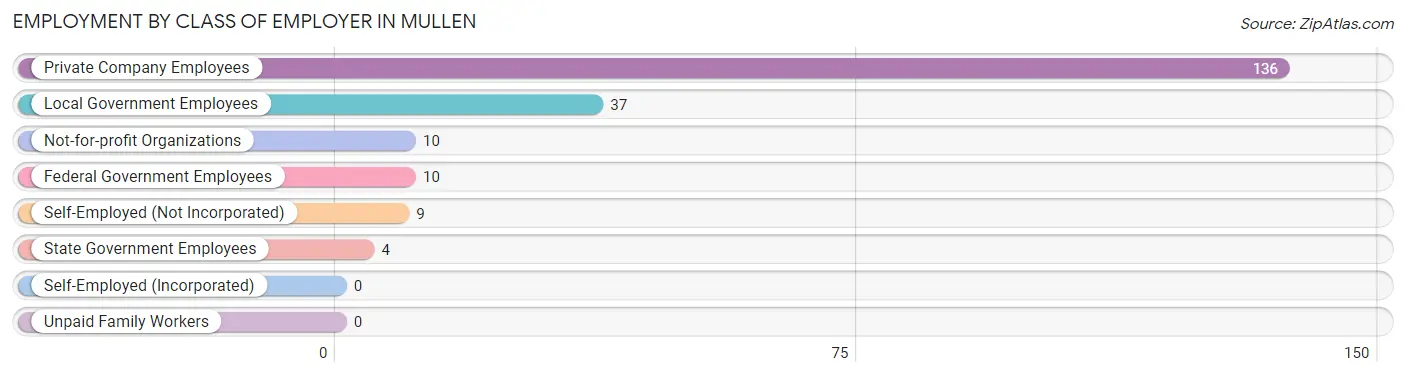
| Employer Class | # Employees | % Employees |
| Private Company Employees | 136 | 66.0% |
| Self-Employed (Incorporated) | 0 | 0.0% |
| Self-Employed (Not Incorporated) | 9 | 4.4% |
| Not-for-profit Organizations | 10 | 4.9% |
| Local Government Employees | 37 | 18.0% |
| State Government Employees | 4 | 1.9% |
| Federal Government Employees | 10 | 4.9% |
| Unpaid Family Workers | 0 | 0.0% |
| Total | 206 | 100.0% |
Employment Status by Age in Mullen
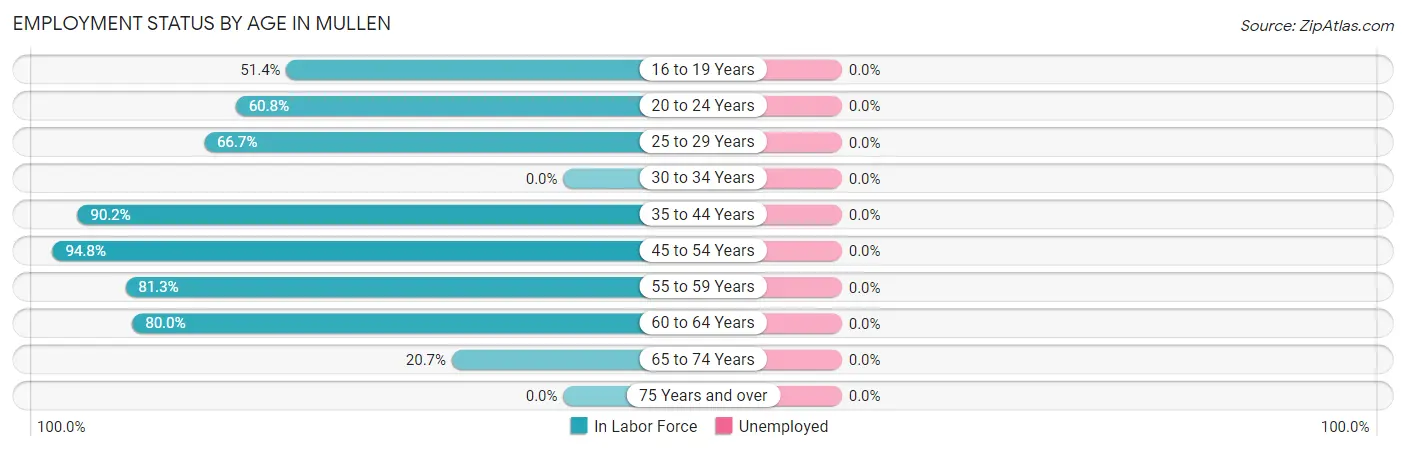
| Age Bracket | In Labor Force | Unemployed |
| 16 to 19 Years | 18 (51.4%) | 0 (0.0%) |
| 20 to 24 Years | 31 (60.8%) | 0 (0.0%) |
| 25 to 29 Years | 18 (66.7%) | 0 (0.0%) |
| 30 to 34 Years | 0 (0.0%) | 0 (0.0%) |
| 35 to 44 Years | 74 (90.2%) | 0 (0.0%) |
| 45 to 54 Years | 55 (94.8%) | 0 (0.0%) |
| 55 to 59 Years | 26 (81.3%) | 0 (0.0%) |
| 60 to 64 Years | 8 (80.0%) | 0 (0.0%) |
| 65 to 74 Years | 6 (20.7%) | 0 (0.0%) |
| 75 Years and over | 0 (0.0%) | 0 (0.0%) |
| Total | 236 (61.6%) | 0 (0.0%) |
Employment Status by Educational Attainment in Mullen
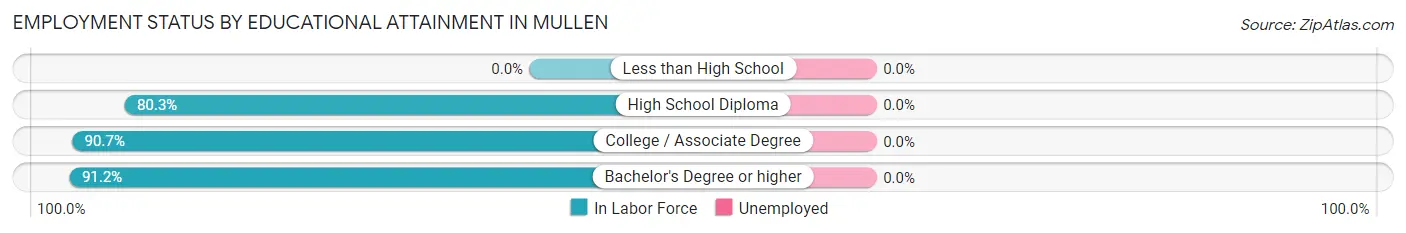
| Educational Attainment | In Labor Force | Unemployed |
| Less than High School | 0 (0.0%) | 0 (0.0%) |
| High School Diploma | 49 (80.3%) | 0 (0.0%) |
| College / Associate Degree | 49 (90.7%) | 0 (0.0%) |
| Bachelor's Degree or higher | 83 (91.2%) | 0 (0.0%) |
| Total | 181 (86.6%) | 0 (0.0%) |
Employment Occupations by Sex in Mullen
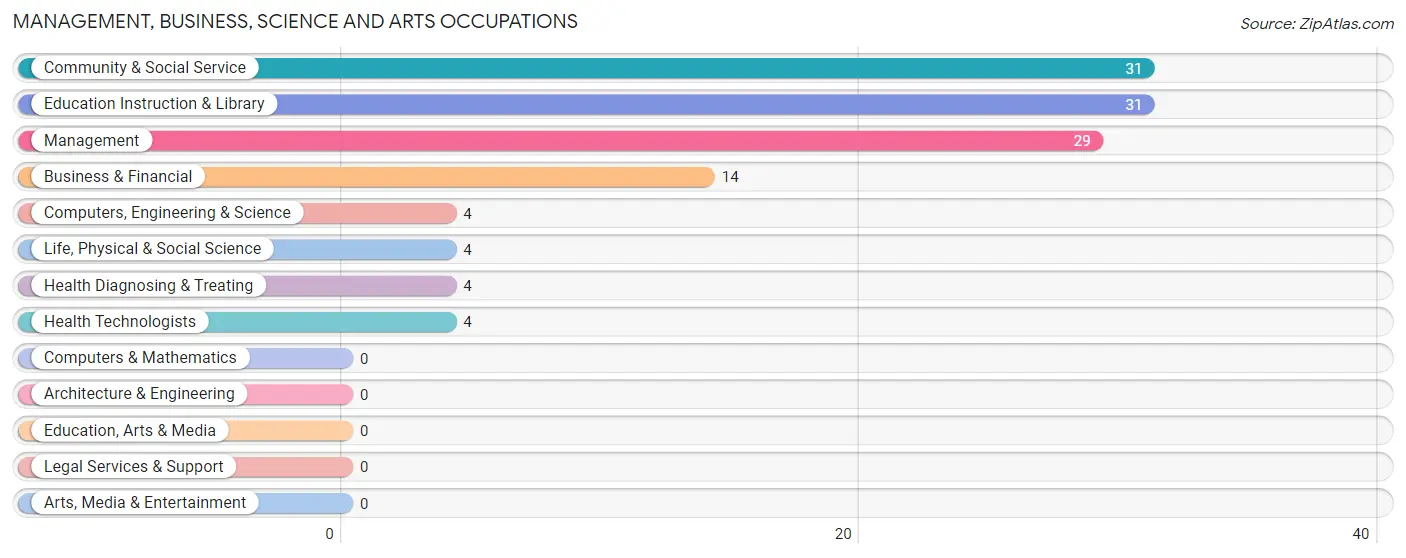
Management, Business, Science and Arts Occupations
The most common Management, Business, Science and Arts occupations in Mullen are Community & Social Service (31 | 13.1%), Education Instruction & Library (31 | 13.1%), Management (29 | 12.3%), Business & Financial (14 | 5.9%), and Computers, Engineering & Science (4 | 1.7%).
Management, Business, Science and Arts Occupations by Sex
Within the Management, Business, Science and Arts occupations in Mullen, the most male-oriented occupations are Computers, Engineering & Science (100.0%), Life, Physical & Social Science (100.0%), and Business & Financial (71.4%), while the most female-oriented occupations are Health Diagnosing & Treating (100.0%), Health Technologists (100.0%), and Community & Social Service (80.6%).
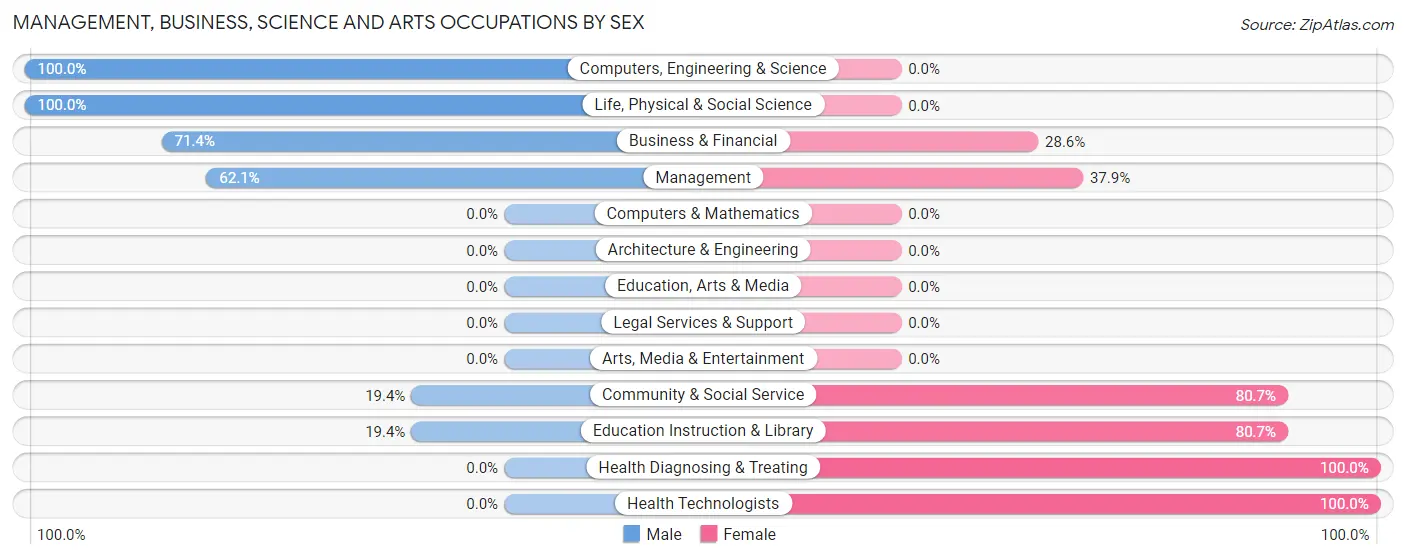
| Occupation | Male | Female |
| Management | 18 (62.1%) | 11 (37.9%) |
| Business & Financial | 10 (71.4%) | 4 (28.6%) |
| Computers, Engineering & Science | 4 (100.0%) | 0 (0.0%) |
| Computers & Mathematics | 0 (0.0%) | 0 (0.0%) |
| Architecture & Engineering | 0 (0.0%) | 0 (0.0%) |
| Life, Physical & Social Science | 4 (100.0%) | 0 (0.0%) |
| Community & Social Service | 6 (19.4%) | 25 (80.6%) |
| Education, Arts & Media | 0 (0.0%) | 0 (0.0%) |
| Legal Services & Support | 0 (0.0%) | 0 (0.0%) |
| Education Instruction & Library | 6 (19.4%) | 25 (80.6%) |
| Arts, Media & Entertainment | 0 (0.0%) | 0 (0.0%) |
| Health Diagnosing & Treating | 0 (0.0%) | 4 (100.0%) |
| Health Technologists | 0 (0.0%) | 4 (100.0%) |
| Total (Category) | 38 (46.3%) | 44 (53.7%) |
| Total (Overall) | 122 (51.7%) | 114 (48.3%) |
Services Occupations
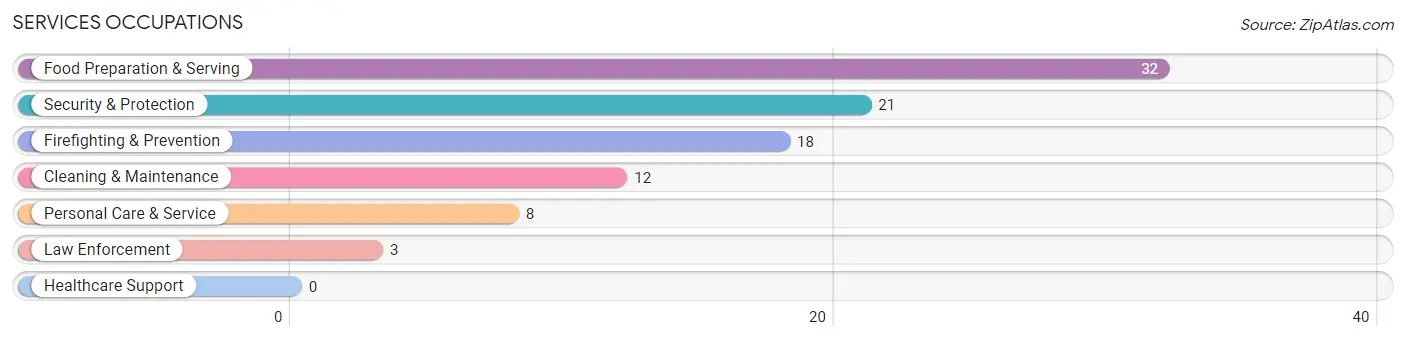
The most common Services occupations in Mullen are Food Preparation & Serving (32 | 13.6%), Security & Protection (21 | 8.9%), Firefighting & Prevention (18 | 7.6%), Cleaning & Maintenance (12 | 5.1%), and Personal Care & Service (8 | 3.4%).
Services Occupations by Sex
Within the Services occupations in Mullen, the most male-oriented occupations are Law Enforcement (100.0%), Cleaning & Maintenance (66.7%), and Food Preparation & Serving (59.4%), while the most female-oriented occupations are Firefighting & Prevention (100.0%), Personal Care & Service (100.0%), and Security & Protection (85.7%).
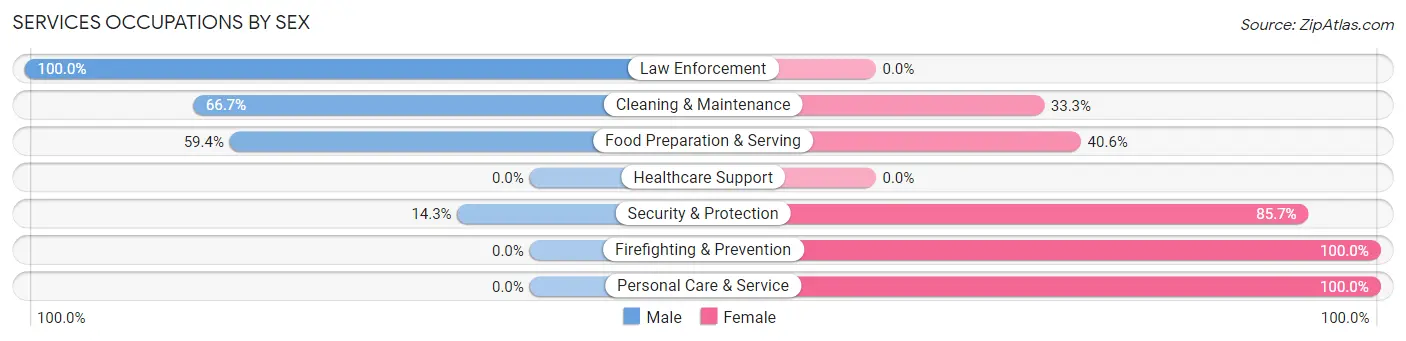
| Occupation | Male | Female |
| Healthcare Support | 0 (0.0%) | 0 (0.0%) |
| Security & Protection | 3 (14.3%) | 18 (85.7%) |
| Firefighting & Prevention | 0 (0.0%) | 18 (100.0%) |
| Law Enforcement | 3 (100.0%) | 0 (0.0%) |
| Food Preparation & Serving | 19 (59.4%) | 13 (40.6%) |
| Cleaning & Maintenance | 8 (66.7%) | 4 (33.3%) |
| Personal Care & Service | 0 (0.0%) | 8 (100.0%) |
| Total (Category) | 30 (41.1%) | 43 (58.9%) |
| Total (Overall) | 122 (51.7%) | 114 (48.3%) |
Sales and Office Occupations
The most common Sales and Office occupations in Mullen are Sales & Related (31 | 13.1%), and Office & Administration (13 | 5.5%).
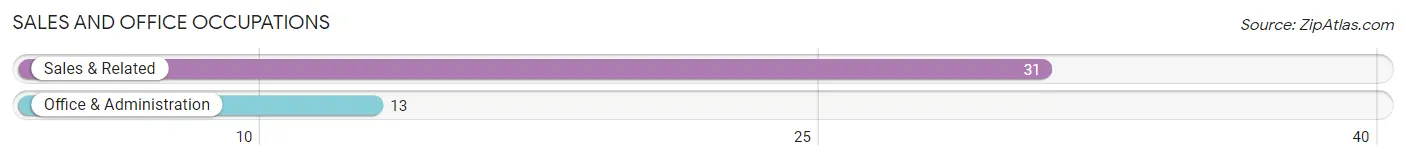
Sales and Office Occupations by Sex
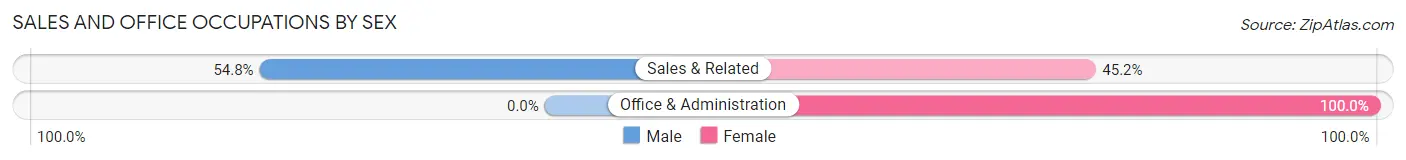
| Occupation | Male | Female |
| Sales & Related | 17 (54.8%) | 14 (45.2%) |
| Office & Administration | 0 (0.0%) | 13 (100.0%) |
| Total (Category) | 17 (38.6%) | 27 (61.4%) |
| Total (Overall) | 122 (51.7%) | 114 (48.3%) |
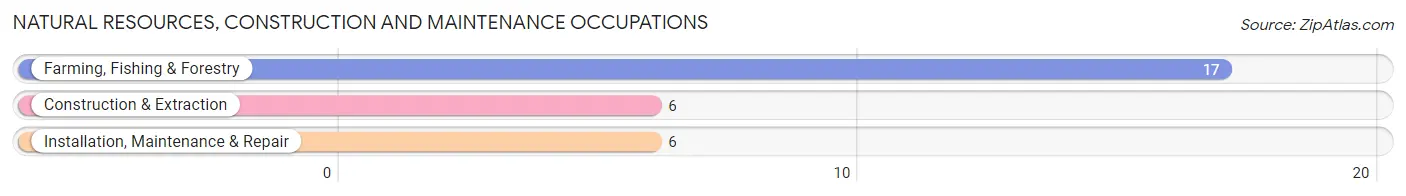
Natural Resources, Construction and Maintenance Occupations
The most common Natural Resources, Construction and Maintenance occupations in Mullen are Farming, Fishing & Forestry (17 | 7.2%), Construction & Extraction (6 | 2.5%), and Installation, Maintenance & Repair (6 | 2.5%).
Natural Resources, Construction and Maintenance Occupations by Sex
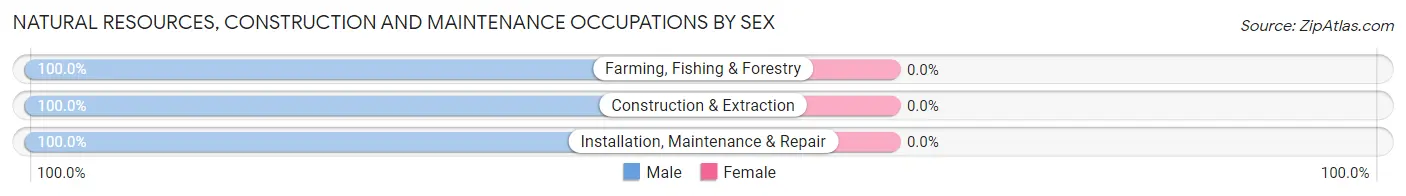
| Occupation | Male | Female |
| Farming, Fishing & Forestry | 17 (100.0%) | 0 (0.0%) |
| Construction & Extraction | 6 (100.0%) | 0 (0.0%) |
| Installation, Maintenance & Repair | 6 (100.0%) | 0 (0.0%) |
| Total (Category) | 29 (100.0%) | 0 (0.0%) |
| Total (Overall) | 122 (51.7%) | 114 (48.3%) |
Production, Transportation and Moving Occupations
The most common Production, Transportation and Moving occupations in Mullen are , and Transportation (8 | 3.4%).
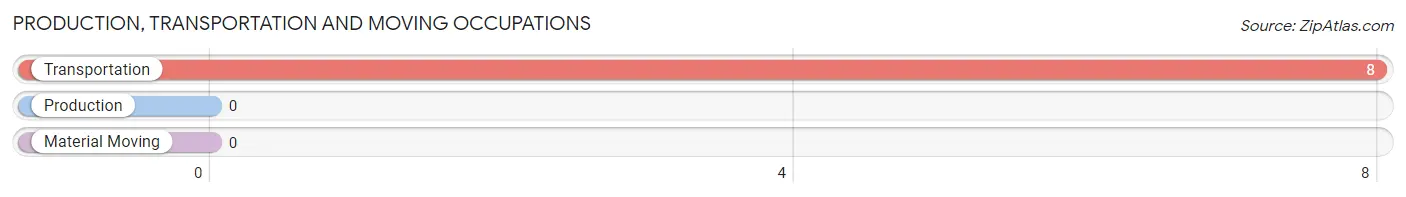
Production, Transportation and Moving Occupations by Sex
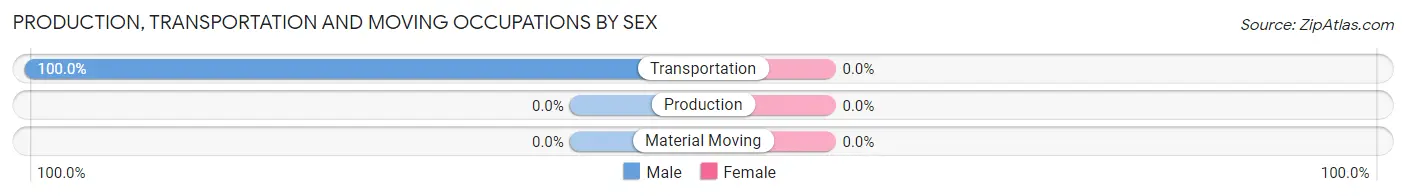
| Occupation | Male | Female |
| Production | 0 (0.0%) | 0 (0.0%) |
| Transportation | 8 (100.0%) | 0 (0.0%) |
| Material Moving | 0 (0.0%) | 0 (0.0%) |
| Total (Category) | 8 (100.0%) | 0 (0.0%) |
| Total (Overall) | 122 (51.7%) | 114 (48.3%) |
Employment Industries by Sex in Mullen
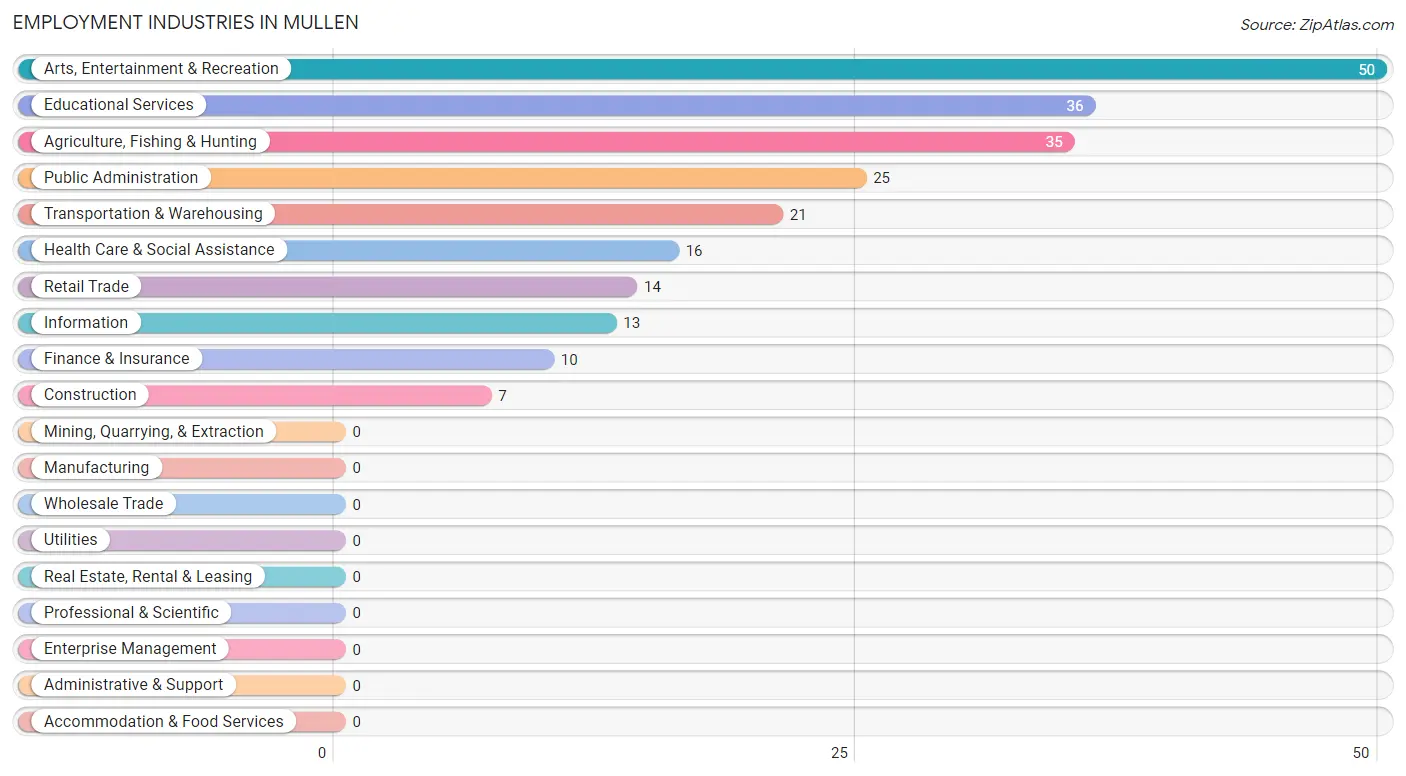
Employment Industries in Mullen
The major employment industries in Mullen include Arts, Entertainment & Recreation (50 | 21.2%), Educational Services (36 | 15.2%), Agriculture, Fishing & Hunting (35 | 14.8%), Public Administration (25 | 10.6%), and Transportation & Warehousing (21 | 8.9%).
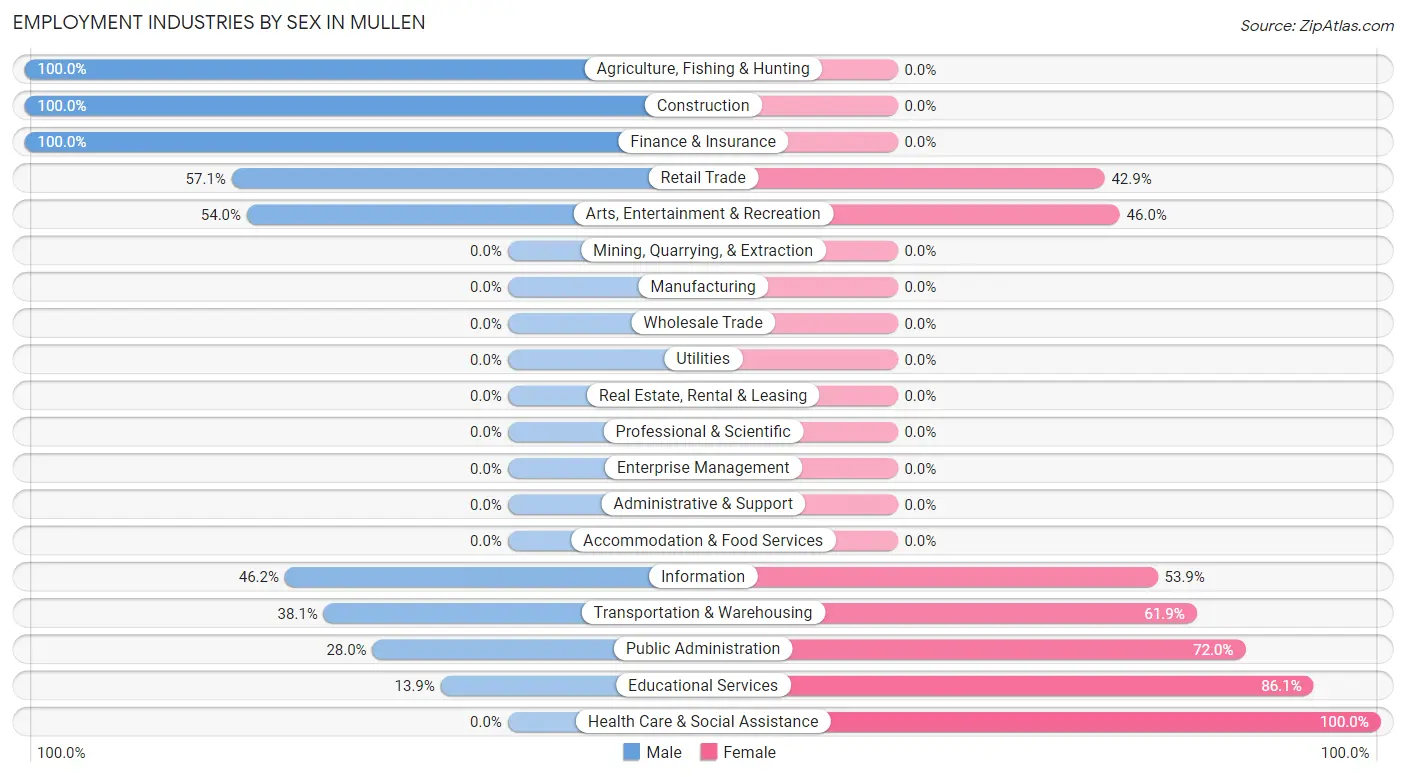
Employment Industries by Sex in Mullen
The Mullen industries that see more men than women are Agriculture, Fishing & Hunting (100.0%), Construction (100.0%), and Finance & Insurance (100.0%), whereas the industries that tend to have a higher number of women are Health Care & Social Assistance (100.0%), Educational Services (86.1%), and Public Administration (72.0%).
| Industry | Male | Female |
| Agriculture, Fishing & Hunting | 35 (100.0%) | 0 (0.0%) |
| Mining, Quarrying, & Extraction | 0 (0.0%) | 0 (0.0%) |
| Construction | 7 (100.0%) | 0 (0.0%) |
| Manufacturing | 0 (0.0%) | 0 (0.0%) |
| Wholesale Trade | 0 (0.0%) | 0 (0.0%) |
| Retail Trade | 8 (57.1%) | 6 (42.9%) |
| Transportation & Warehousing | 8 (38.1%) | 13 (61.9%) |
| Utilities | 0 (0.0%) | 0 (0.0%) |
| Information | 6 (46.2%) | 7 (53.8%) |
| Finance & Insurance | 10 (100.0%) | 0 (0.0%) |
| Real Estate, Rental & Leasing | 0 (0.0%) | 0 (0.0%) |
| Professional & Scientific | 0 (0.0%) | 0 (0.0%) |
| Enterprise Management | 0 (0.0%) | 0 (0.0%) |
| Administrative & Support | 0 (0.0%) | 0 (0.0%) |
| Educational Services | 5 (13.9%) | 31 (86.1%) |
| Health Care & Social Assistance | 0 (0.0%) | 16 (100.0%) |
| Arts, Entertainment & Recreation | 27 (54.0%) | 23 (46.0%) |
| Accommodation & Food Services | 0 (0.0%) | 0 (0.0%) |
| Public Administration | 7 (28.0%) | 18 (72.0%) |
| Total | 122 (51.7%) | 114 (48.3%) |
Education in Mullen
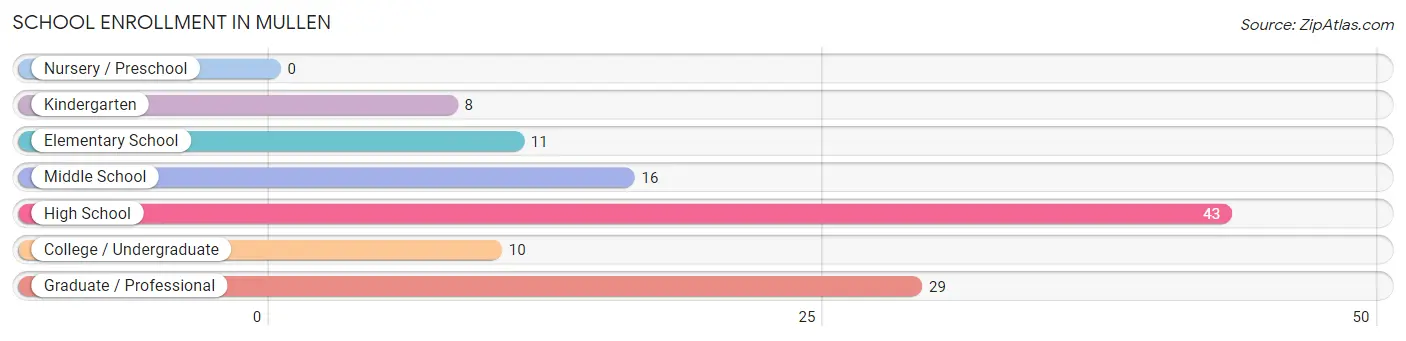
School Enrollment in Mullen
The most common levels of schooling among the 117 students in Mullen are high school (43 | 36.7%), graduate / professional (29 | 24.8%), and middle school (16 | 13.7%).
| School Level | # Students | % Students |
| Nursery / Preschool | 0 | 0.0% |
| Kindergarten | 8 | 6.8% |
| Elementary School | 11 | 9.4% |
| Middle School | 16 | 13.7% |
| High School | 43 | 36.7% |
| College / Undergraduate | 10 | 8.6% |
| Graduate / Professional | 29 | 24.8% |
| Total | 117 | 100.0% |
School Enrollment by Age by Funding Source in Mullen
Out of a total of 117 students who are enrolled in schools in Mullen, 7 (6.0%) attend a private institution, while the remaining 110 (94.0%) are enrolled in public schools. The age group of 20 to 24 year olds has the highest likelihood of being enrolled in private schools, with 7 (25.9% in the age bracket) enrolled. Conversely, the age group of 5 to 9 year old has the lowest likelihood of being enrolled in a private school, with 19 (100.0% in the age bracket) attending a public institution.
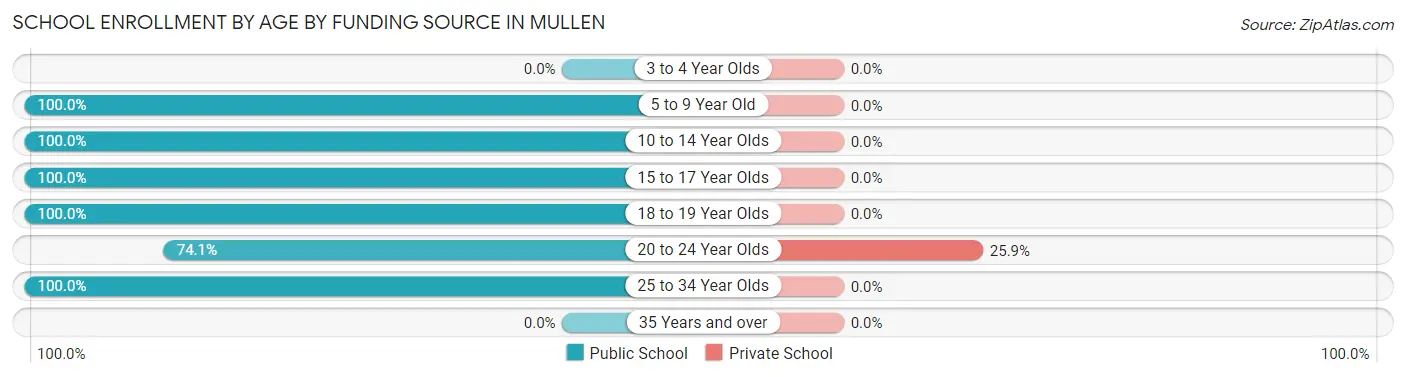
| Age Bracket | Public School | Private School |
| 3 to 4 Year Olds | 0 (0.0%) | 0 (0.0%) |
| 5 to 9 Year Old | 19 (100.0%) | 0 (0.0%) |
| 10 to 14 Year Olds | 24 (100.0%) | 0 (0.0%) |
| 15 to 17 Year Olds | 30 (100.0%) | 0 (0.0%) |
| 18 to 19 Year Olds | 5 (100.0%) | 0 (0.0%) |
| 20 to 24 Year Olds | 20 (74.1%) | 7 (25.9%) |
| 25 to 34 Year Olds | 12 (100.0%) | 0 (0.0%) |
| 35 Years and over | 0 (0.0%) | 0 (0.0%) |
| Total | 110 (94.0%) | 7 (6.0%) |
Educational Attainment by Field of Study in Mullen
Education (43 | 35.5%), arts & humanities (15 | 12.4%), psychology (13 | 10.7%), social sciences (13 | 10.7%), and liberal arts & history (12 | 9.9%) are the most common fields of study among 121 individuals in Mullen who have obtained a bachelor's degree or higher.
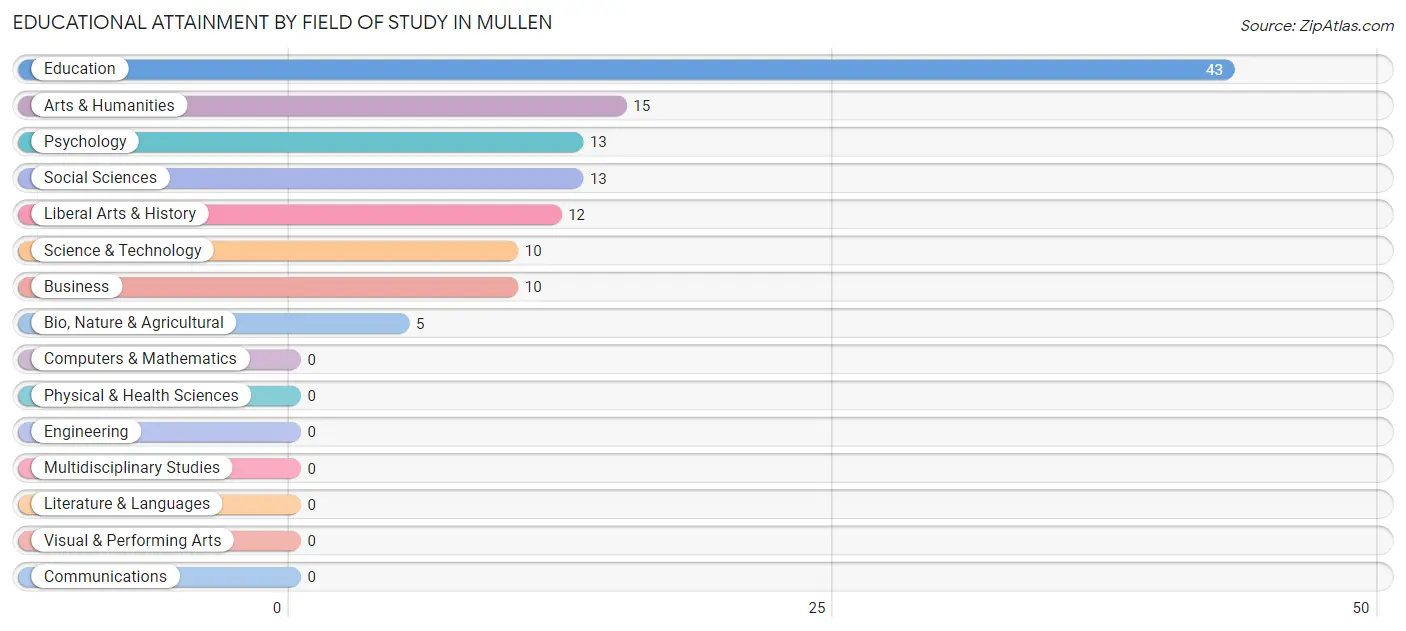
| Field of Study | # Graduates | % Graduates |
| Computers & Mathematics | 0 | 0.0% |
| Bio, Nature & Agricultural | 5 | 4.1% |
| Physical & Health Sciences | 0 | 0.0% |
| Psychology | 13 | 10.7% |
| Social Sciences | 13 | 10.7% |
| Engineering | 0 | 0.0% |
| Multidisciplinary Studies | 0 | 0.0% |
| Science & Technology | 10 | 8.3% |
| Business | 10 | 8.3% |
| Education | 43 | 35.5% |
| Literature & Languages | 0 | 0.0% |
| Liberal Arts & History | 12 | 9.9% |
| Visual & Performing Arts | 0 | 0.0% |
| Communications | 0 | 0.0% |
| Arts & Humanities | 15 | 12.4% |
| Total | 121 | 100.0% |
Transportation & Commute in Mullen
Vehicle Availability by Sex in Mullen
The most prevalent vehicle ownership categories in Mullen are males with 2 vehicles (35, accounting for 31.8%) and females with 2 vehicles (29, making up 36.5%).
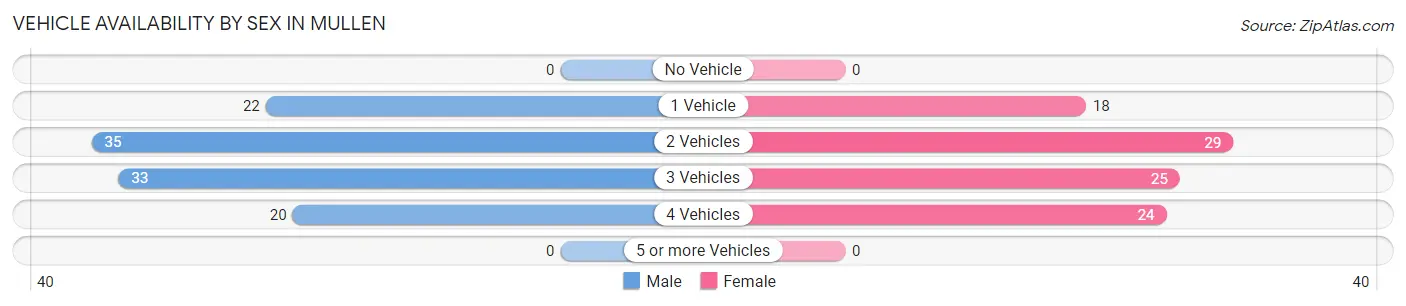
| Vehicles Available | Male | Female |
| No Vehicle | 0 (0.0%) | 0 (0.0%) |
| 1 Vehicle | 22 (20.0%) | 18 (18.8%) |
| 2 Vehicles | 35 (31.8%) | 29 (30.2%) |
| 3 Vehicles | 33 (30.0%) | 25 (26.0%) |
| 4 Vehicles | 20 (18.2%) | 24 (25.0%) |
| 5 or more Vehicles | 0 (0.0%) | 0 (0.0%) |
| Total | 110 (100.0%) | 96 (100.0%) |
Commute Time in Mullen
The most frequently occuring commute durations in Mullen are less than 5 minutes (56 commuters, 30.8%), 25 to 29 minutes (26 commuters, 14.3%), and 60 to 89 minutes (24 commuters, 13.2%).
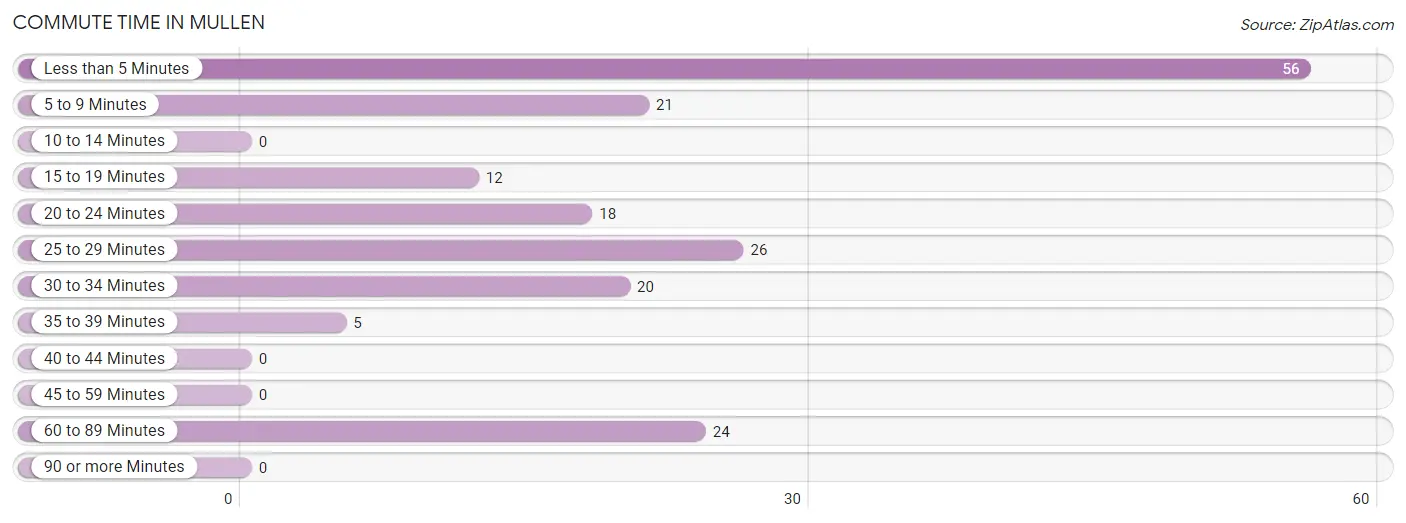
| Commute Time | # Commuters | % Commuters |
| Less than 5 Minutes | 56 | 30.8% |
| 5 to 9 Minutes | 21 | 11.5% |
| 10 to 14 Minutes | 0 | 0.0% |
| 15 to 19 Minutes | 12 | 6.6% |
| 20 to 24 Minutes | 18 | 9.9% |
| 25 to 29 Minutes | 26 | 14.3% |
| 30 to 34 Minutes | 20 | 11.0% |
| 35 to 39 Minutes | 5 | 2.8% |
| 40 to 44 Minutes | 0 | 0.0% |
| 45 to 59 Minutes | 0 | 0.0% |
| 60 to 89 Minutes | 24 | 13.2% |
| 90 or more Minutes | 0 | 0.0% |
Commute Time by Sex in Mullen
The most common commute times in Mullen are less than 5 minutes (39 commuters, 41.5%) for males and 25 to 29 minutes (26 commuters, 29.5%) for females.
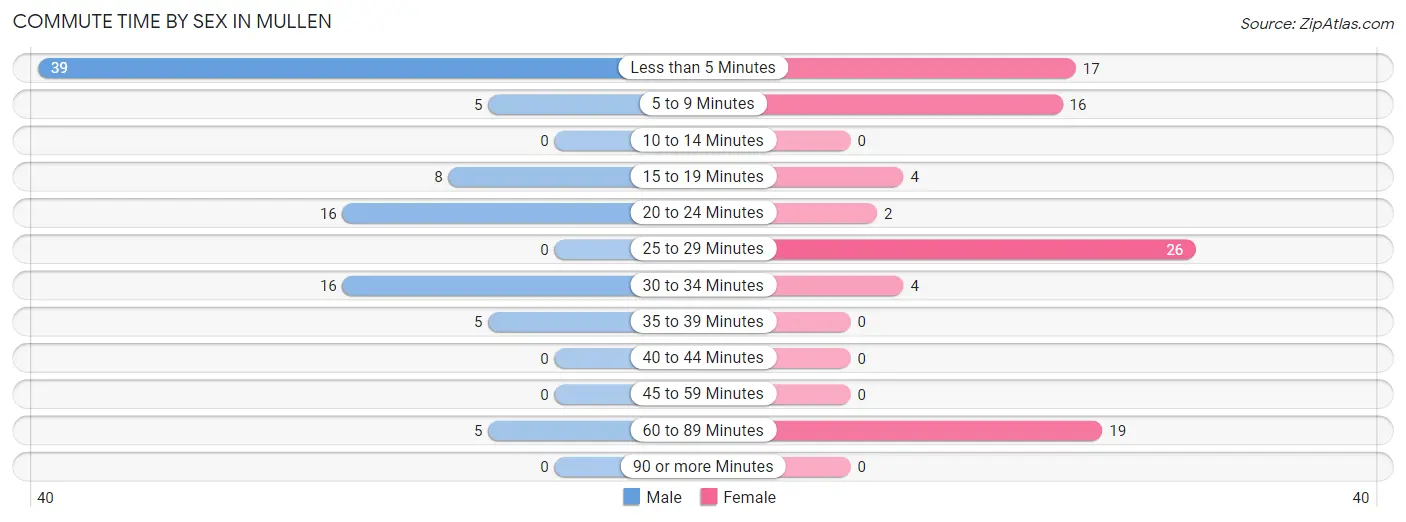
| Commute Time | Male | Female |
| Less than 5 Minutes | 39 (41.5%) | 17 (19.3%) |
| 5 to 9 Minutes | 5 (5.3%) | 16 (18.2%) |
| 10 to 14 Minutes | 0 (0.0%) | 0 (0.0%) |
| 15 to 19 Minutes | 8 (8.5%) | 4 (4.5%) |
| 20 to 24 Minutes | 16 (17.0%) | 2 (2.3%) |
| 25 to 29 Minutes | 0 (0.0%) | 26 (29.5%) |
| 30 to 34 Minutes | 16 (17.0%) | 4 (4.5%) |
| 35 to 39 Minutes | 5 (5.3%) | 0 (0.0%) |
| 40 to 44 Minutes | 0 (0.0%) | 0 (0.0%) |
| 45 to 59 Minutes | 0 (0.0%) | 0 (0.0%) |
| 60 to 89 Minutes | 5 (5.3%) | 19 (21.6%) |
| 90 or more Minutes | 0 (0.0%) | 0 (0.0%) |
Time of Departure to Work by Sex in Mullen
The most frequent times of departure to work in Mullen are 7:00 AM to 7:29 AM (35, 37.2%) for males and 5:30 AM to 5:59 AM (17, 19.3%) for females.
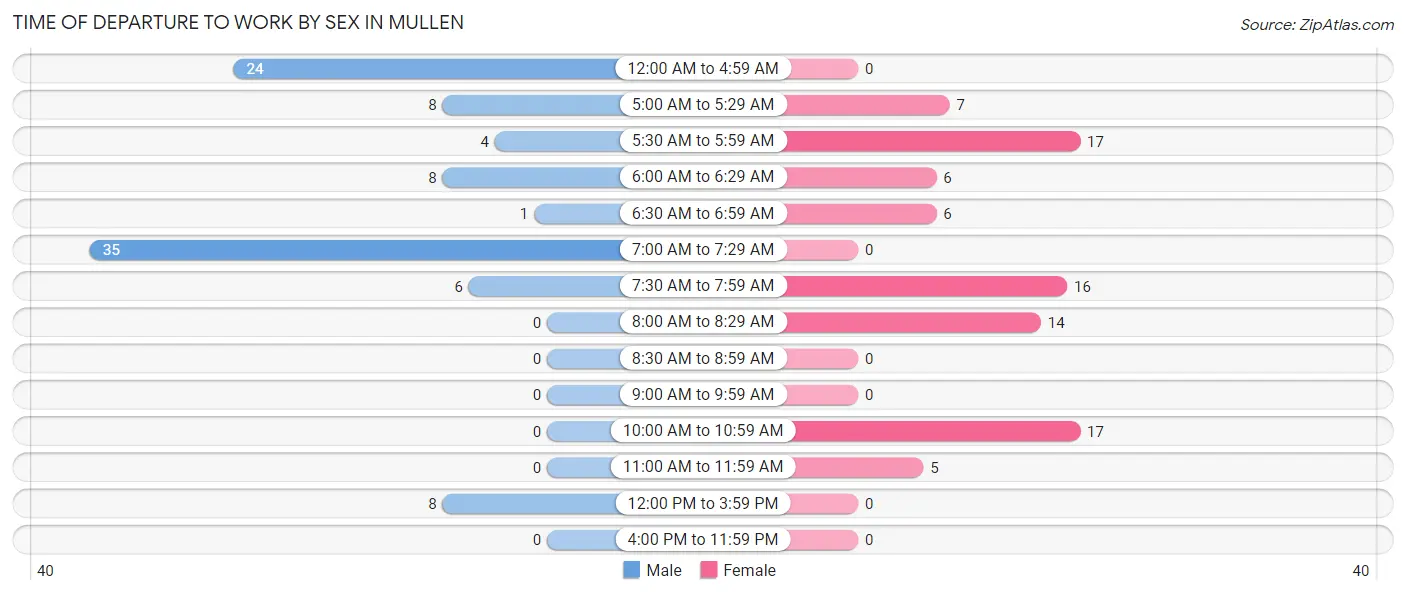
| Time of Departure | Male | Female |
| 12:00 AM to 4:59 AM | 24 (25.5%) | 0 (0.0%) |
| 5:00 AM to 5:29 AM | 8 (8.5%) | 7 (8.0%) |
| 5:30 AM to 5:59 AM | 4 (4.3%) | 17 (19.3%) |
| 6:00 AM to 6:29 AM | 8 (8.5%) | 6 (6.8%) |
| 6:30 AM to 6:59 AM | 1 (1.1%) | 6 (6.8%) |
| 7:00 AM to 7:29 AM | 35 (37.2%) | 0 (0.0%) |
| 7:30 AM to 7:59 AM | 6 (6.4%) | 16 (18.2%) |
| 8:00 AM to 8:29 AM | 0 (0.0%) | 14 (15.9%) |
| 8:30 AM to 8:59 AM | 0 (0.0%) | 0 (0.0%) |
| 9:00 AM to 9:59 AM | 0 (0.0%) | 0 (0.0%) |
| 10:00 AM to 10:59 AM | 0 (0.0%) | 17 (19.3%) |
| 11:00 AM to 11:59 AM | 0 (0.0%) | 5 (5.7%) |
| 12:00 PM to 3:59 PM | 8 (8.5%) | 0 (0.0%) |
| 4:00 PM to 11:59 PM | 0 (0.0%) | 0 (0.0%) |
| Total | 94 (100.0%) | 88 (100.0%) |
Housing Occupancy in Mullen
Occupancy by Ownership in Mullen
Of the total 210 dwellings in Mullen, owner-occupied units account for 96 (45.7%), while renter-occupied units make up 114 (54.3%).
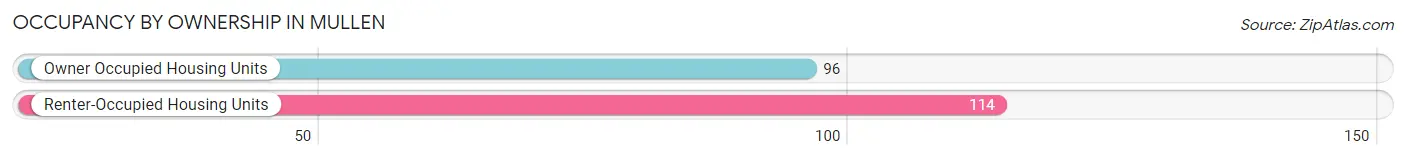
| Occupancy | # Housing Units | % Housing Units |
| Owner Occupied Housing Units | 96 | 45.7% |
| Renter-Occupied Housing Units | 114 | 54.3% |
| Total Occupied Housing Units | 210 | 100.0% |
Occupancy by Household Size in Mullen
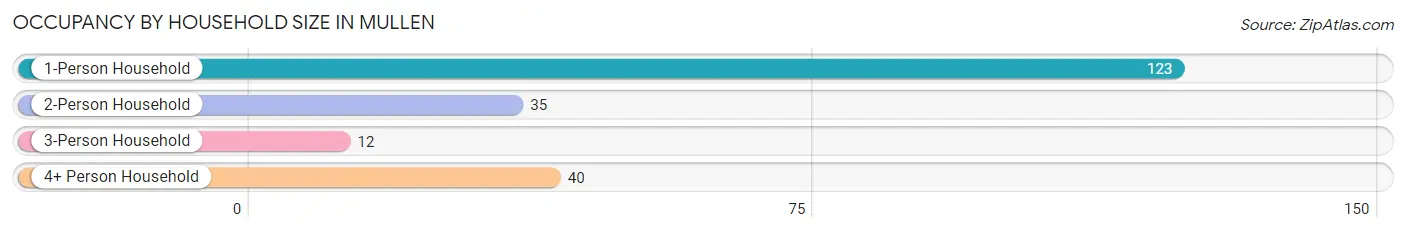
| Household Size | # Housing Units | % Housing Units |
| 1-Person Household | 123 | 58.6% |
| 2-Person Household | 35 | 16.7% |
| 3-Person Household | 12 | 5.7% |
| 4+ Person Household | 40 | 19.1% |
| Total Housing Units | 210 | 100.0% |
Occupancy by Ownership by Household Size in Mullen
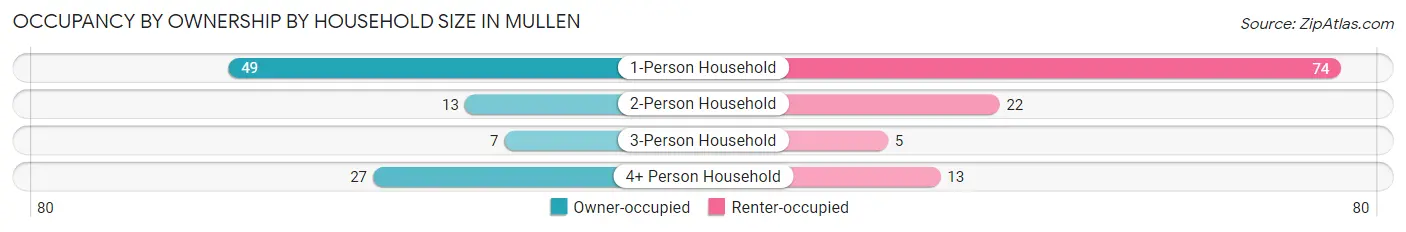
| Household Size | Owner-occupied | Renter-occupied |
| 1-Person Household | 49 (39.8%) | 74 (60.2%) |
| 2-Person Household | 13 (37.1%) | 22 (62.9%) |
| 3-Person Household | 7 (58.3%) | 5 (41.7%) |
| 4+ Person Household | 27 (67.5%) | 13 (32.5%) |
| Total Housing Units | 96 (45.7%) | 114 (54.3%) |
Occupancy by Educational Attainment in Mullen
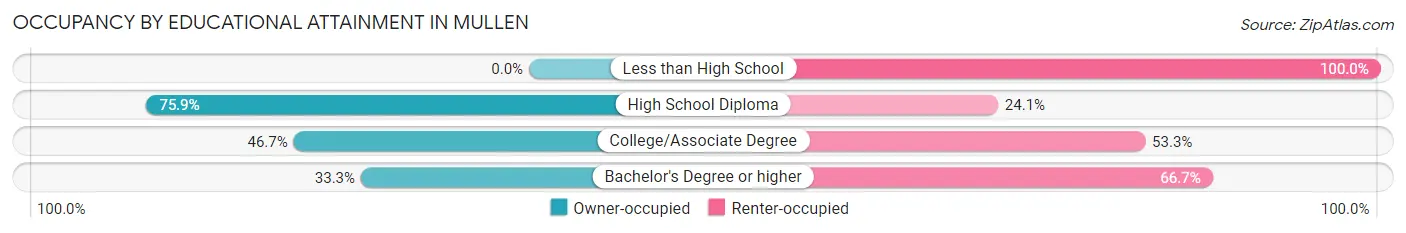
| Household Size | Owner-occupied | Renter-occupied |
| Less than High School | 0 (0.0%) | 14 (100.0%) |
| High School Diploma | 44 (75.9%) | 14 (24.1%) |
| College/Associate Degree | 21 (46.7%) | 24 (53.3%) |
| Bachelor's Degree or higher | 31 (33.3%) | 62 (66.7%) |
Occupancy by Age of Householder in Mullen
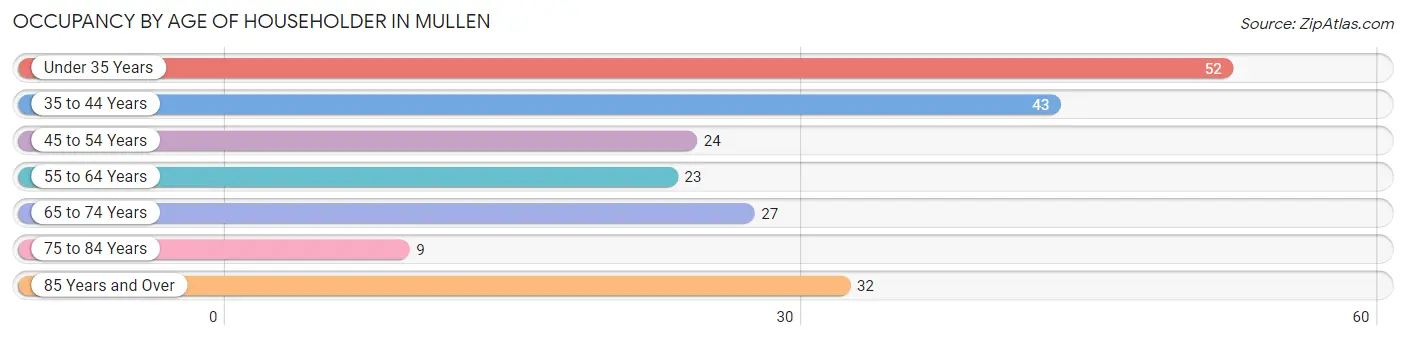
| Age Bracket | # Households | % Households |
| Under 35 Years | 52 | 24.8% |
| 35 to 44 Years | 43 | 20.5% |
| 45 to 54 Years | 24 | 11.4% |
| 55 to 64 Years | 23 | 11.0% |
| 65 to 74 Years | 27 | 12.9% |
| 75 to 84 Years | 9 | 4.3% |
| 85 Years and Over | 32 | 15.2% |
| Total | 210 | 100.0% |
Housing Finances in Mullen
Median Income by Occupancy in Mullen
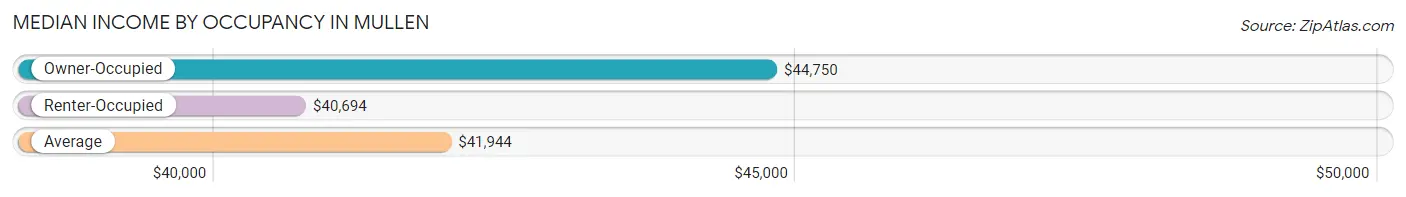
| Occupancy Type | # Households | Median Income |
| Owner-Occupied | 96 (45.7%) | $44,750 |
| Renter-Occupied | 114 (54.3%) | $40,694 |
| Average | 210 (100.0%) | $41,944 |
Occupancy by Householder Income Bracket in Mullen
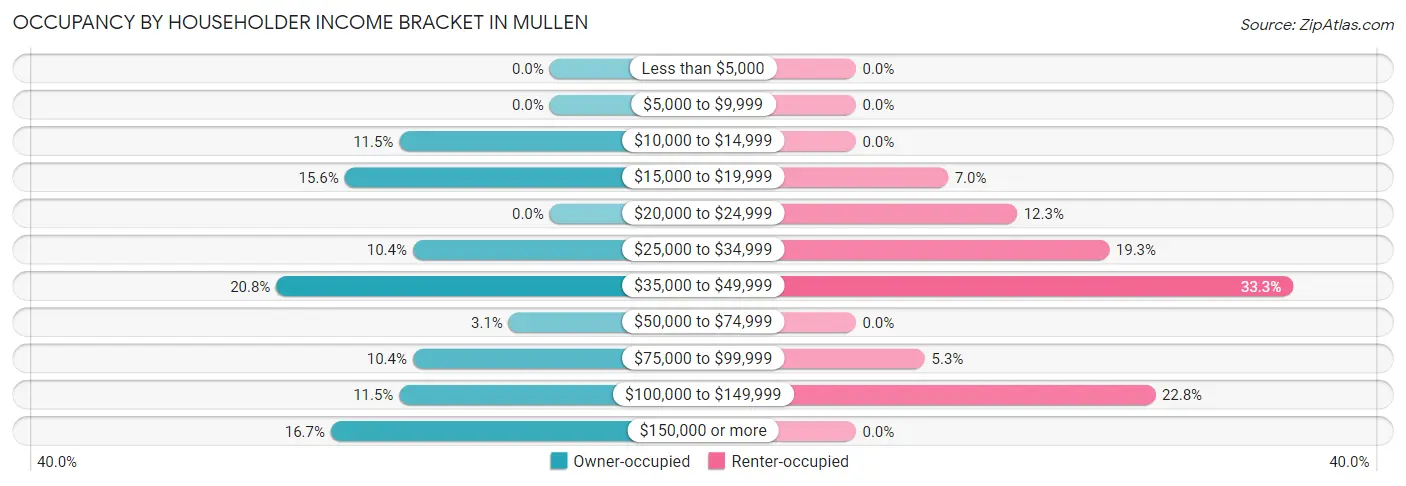
| Income Bracket | Owner-occupied | Renter-occupied |
| Less than $5,000 | 0 (0.0%) | 0 (0.0%) |
| $5,000 to $9,999 | 0 (0.0%) | 0 (0.0%) |
| $10,000 to $14,999 | 11 (11.5%) | 0 (0.0%) |
| $15,000 to $19,999 | 15 (15.6%) | 8 (7.0%) |
| $20,000 to $24,999 | 0 (0.0%) | 14 (12.3%) |
| $25,000 to $34,999 | 10 (10.4%) | 22 (19.3%) |
| $35,000 to $49,999 | 20 (20.8%) | 38 (33.3%) |
| $50,000 to $74,999 | 3 (3.1%) | 0 (0.0%) |
| $75,000 to $99,999 | 10 (10.4%) | 6 (5.3%) |
| $100,000 to $149,999 | 11 (11.5%) | 26 (22.8%) |
| $150,000 or more | 16 (16.7%) | 0 (0.0%) |
| Total | 96 (100.0%) | 114 (100.0%) |
Monthly Housing Cost Tiers in Mullen
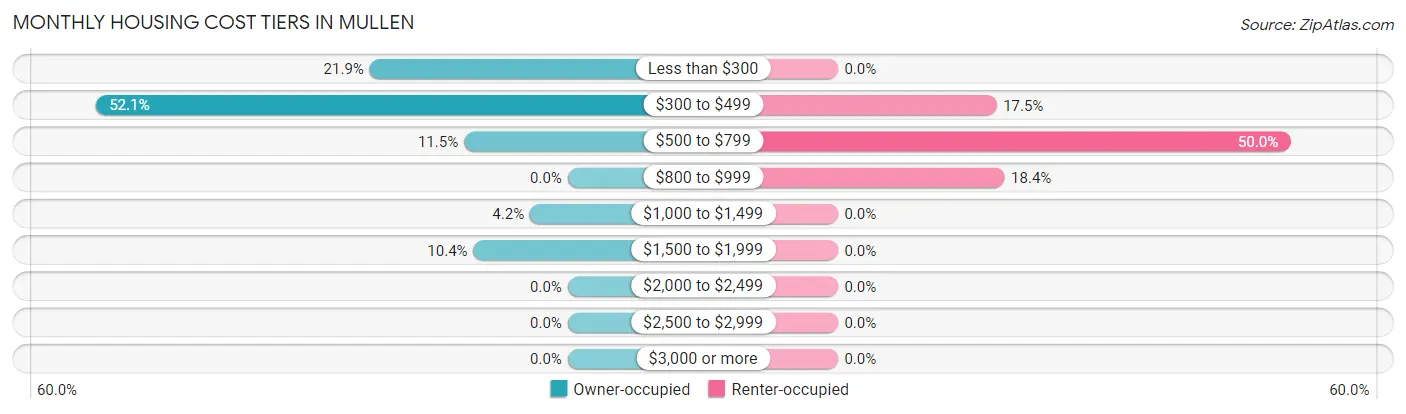
| Monthly Cost | Owner-occupied | Renter-occupied |
| Less than $300 | 21 (21.9%) | 0 (0.0%) |
| $300 to $499 | 50 (52.1%) | 20 (17.5%) |
| $500 to $799 | 11 (11.5%) | 57 (50.0%) |
| $800 to $999 | 0 (0.0%) | 21 (18.4%) |
| $1,000 to $1,499 | 4 (4.2%) | 0 (0.0%) |
| $1,500 to $1,999 | 10 (10.4%) | 0 (0.0%) |
| $2,000 to $2,499 | 0 (0.0%) | 0 (0.0%) |
| $2,500 to $2,999 | 0 (0.0%) | 0 (0.0%) |
| $3,000 or more | 0 (0.0%) | 0 (0.0%) |
| Total | 96 (100.0%) | 114 (100.0%) |
Physical Housing Characteristics in Mullen
Housing Structures in Mullen
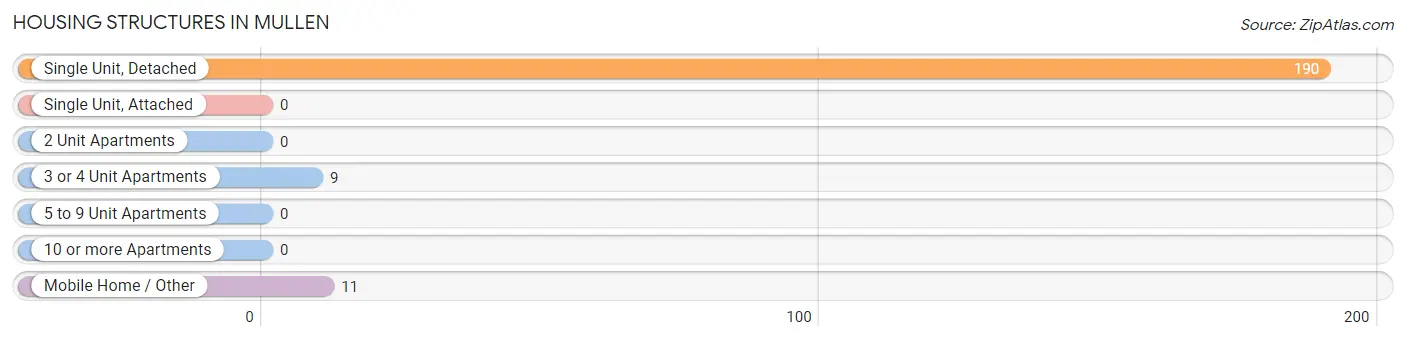
| Structure Type | # Housing Units | % Housing Units |
| Single Unit, Detached | 190 | 90.5% |
| Single Unit, Attached | 0 | 0.0% |
| 2 Unit Apartments | 0 | 0.0% |
| 3 or 4 Unit Apartments | 9 | 4.3% |
| 5 to 9 Unit Apartments | 0 | 0.0% |
| 10 or more Apartments | 0 | 0.0% |
| Mobile Home / Other | 11 | 5.2% |
| Total | 210 | 100.0% |
Housing Structures by Occupancy in Mullen
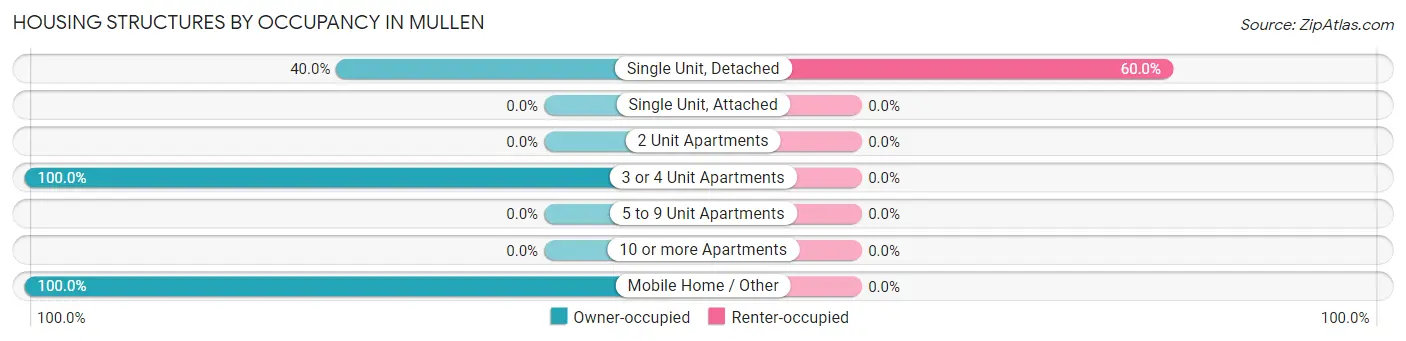
| Structure Type | Owner-occupied | Renter-occupied |
| Single Unit, Detached | 76 (40.0%) | 114 (60.0%) |
| Single Unit, Attached | 0 (0.0%) | 0 (0.0%) |
| 2 Unit Apartments | 0 (0.0%) | 0 (0.0%) |
| 3 or 4 Unit Apartments | 9 (100.0%) | 0 (0.0%) |
| 5 to 9 Unit Apartments | 0 (0.0%) | 0 (0.0%) |
| 10 or more Apartments | 0 (0.0%) | 0 (0.0%) |
| Mobile Home / Other | 11 (100.0%) | 0 (0.0%) |
| Total | 96 (45.7%) | 114 (54.3%) |
Housing Structures by Number of Rooms in Mullen
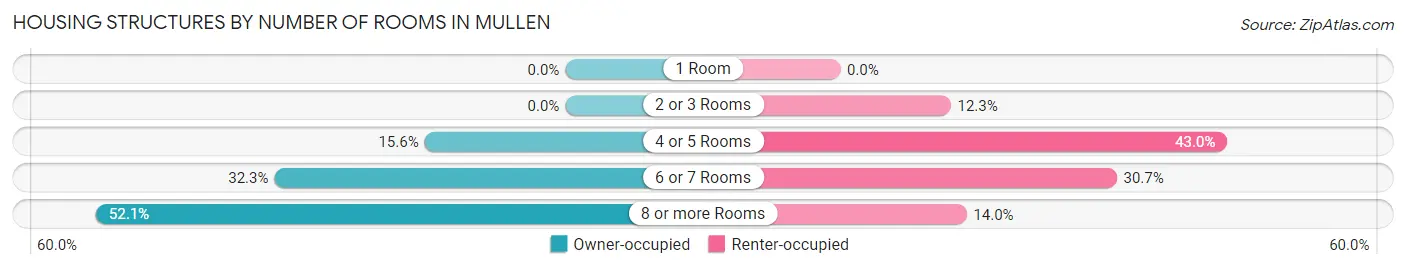
| Number of Rooms | Owner-occupied | Renter-occupied |
| 1 Room | 0 (0.0%) | 0 (0.0%) |
| 2 or 3 Rooms | 0 (0.0%) | 14 (12.3%) |
| 4 or 5 Rooms | 15 (15.6%) | 49 (43.0%) |
| 6 or 7 Rooms | 31 (32.3%) | 35 (30.7%) |
| 8 or more Rooms | 50 (52.1%) | 16 (14.0%) |
| Total | 96 (100.0%) | 114 (100.0%) |
Housing Structure by Heating Type in Mullen
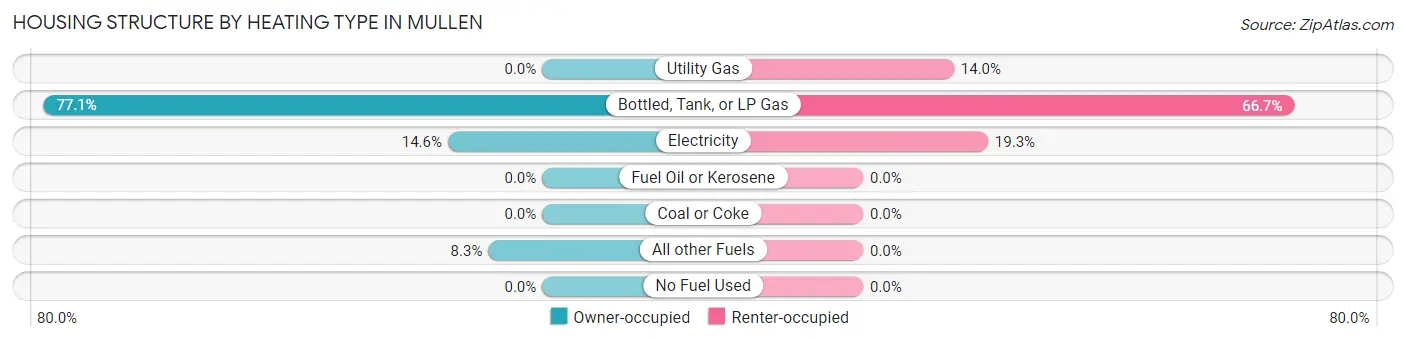
| Heating Type | Owner-occupied | Renter-occupied |
| Utility Gas | 0 (0.0%) | 16 (14.0%) |
| Bottled, Tank, or LP Gas | 74 (77.1%) | 76 (66.7%) |
| Electricity | 14 (14.6%) | 22 (19.3%) |
| Fuel Oil or Kerosene | 0 (0.0%) | 0 (0.0%) |
| Coal or Coke | 0 (0.0%) | 0 (0.0%) |
| All other Fuels | 8 (8.3%) | 0 (0.0%) |
| No Fuel Used | 0 (0.0%) | 0 (0.0%) |
| Total | 96 (100.0%) | 114 (100.0%) |
Household Vehicle Usage in Mullen
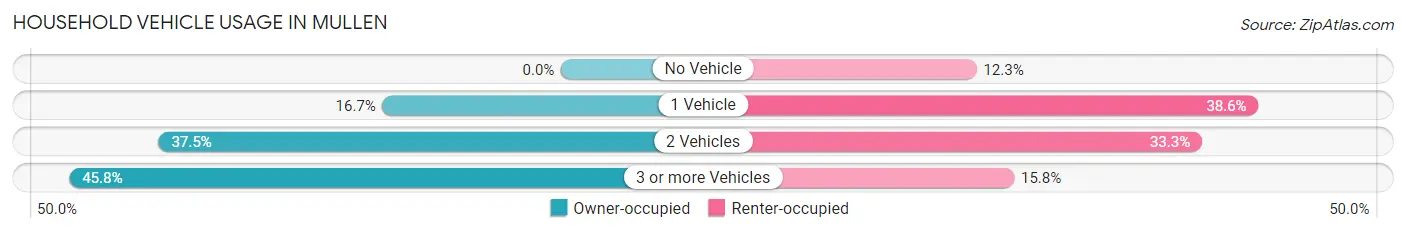
| Vehicles per Household | Owner-occupied | Renter-occupied |
| No Vehicle | 0 (0.0%) | 14 (12.3%) |
| 1 Vehicle | 16 (16.7%) | 44 (38.6%) |
| 2 Vehicles | 36 (37.5%) | 38 (33.3%) |
| 3 or more Vehicles | 44 (45.8%) | 18 (15.8%) |
| Total | 96 (100.0%) | 114 (100.0%) |
Real Estate & Mortgages in Mullen
Real Estate and Mortgage Overview in Mullen
| Characteristic | Without Mortgage | With Mortgage |
| Housing Units | 75 | 21 |
| Median Property Value | $71,700 | $0 |
| Median Household Income | $36,250 | $10 |
| Monthly Housing Costs | $399 | $0 |
| Real Estate Taxes | $569 | $0 |
Property Value by Mortgage Status in Mullen
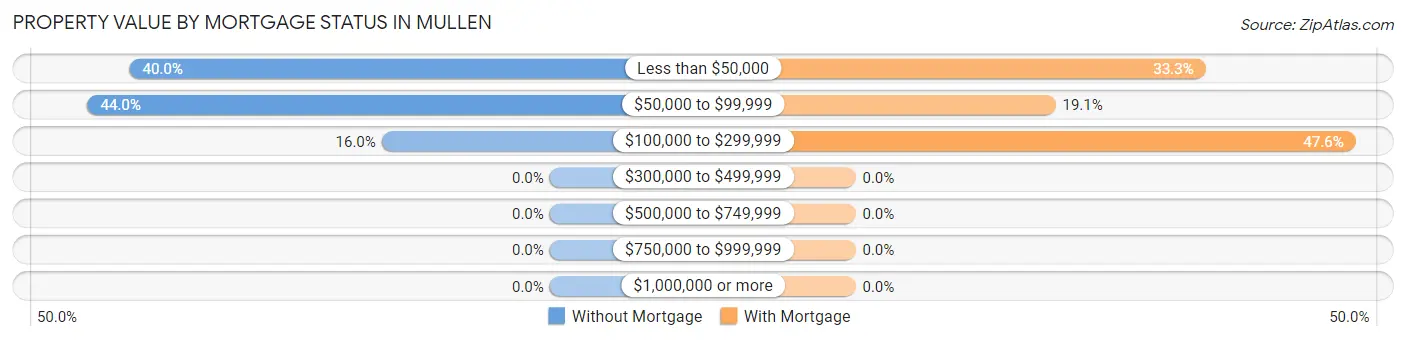
| Property Value | Without Mortgage | With Mortgage |
| Less than $50,000 | 30 (40.0%) | 7 (33.3%) |
| $50,000 to $99,999 | 33 (44.0%) | 4 (19.1%) |
| $100,000 to $299,999 | 12 (16.0%) | 10 (47.6%) |
| $300,000 to $499,999 | 0 (0.0%) | 0 (0.0%) |
| $500,000 to $749,999 | 0 (0.0%) | 0 (0.0%) |
| $750,000 to $999,999 | 0 (0.0%) | 0 (0.0%) |
| $1,000,000 or more | 0 (0.0%) | 0 (0.0%) |
| Total | 75 (100.0%) | 21 (100.0%) |
Household Income by Mortgage Status in Mullen
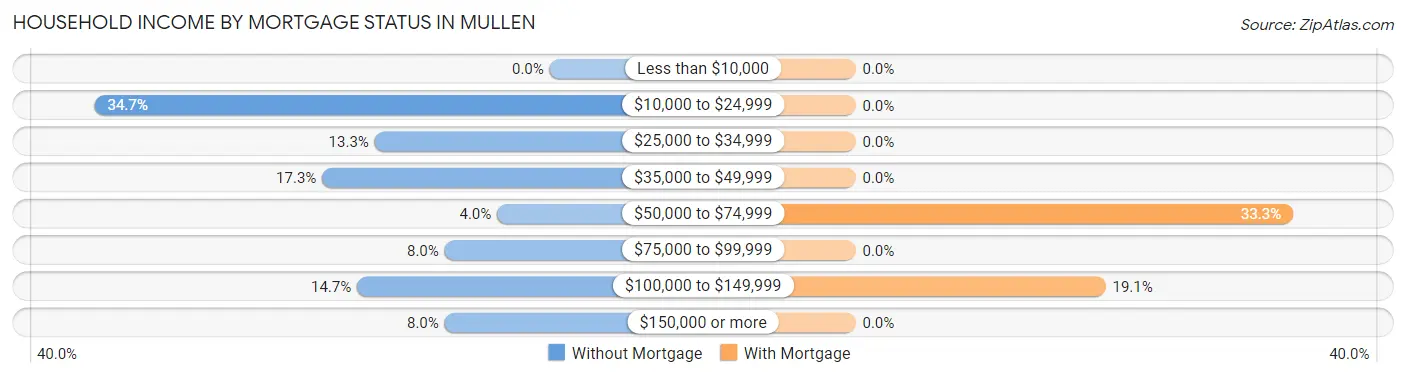
| Household Income | Without Mortgage | With Mortgage |
| Less than $10,000 | 0 (0.0%) | 0 (0.0%) |
| $10,000 to $24,999 | 26 (34.7%) | 0 (0.0%) |
| $25,000 to $34,999 | 10 (13.3%) | 0 (0.0%) |
| $35,000 to $49,999 | 13 (17.3%) | 0 (0.0%) |
| $50,000 to $74,999 | 3 (4.0%) | 7 (33.3%) |
| $75,000 to $99,999 | 6 (8.0%) | 0 (0.0%) |
| $100,000 to $149,999 | 11 (14.7%) | 4 (19.1%) |
| $150,000 or more | 6 (8.0%) | 0 (0.0%) |
| Total | 75 (100.0%) | 21 (100.0%) |
Property Value to Household Income Ratio in Mullen
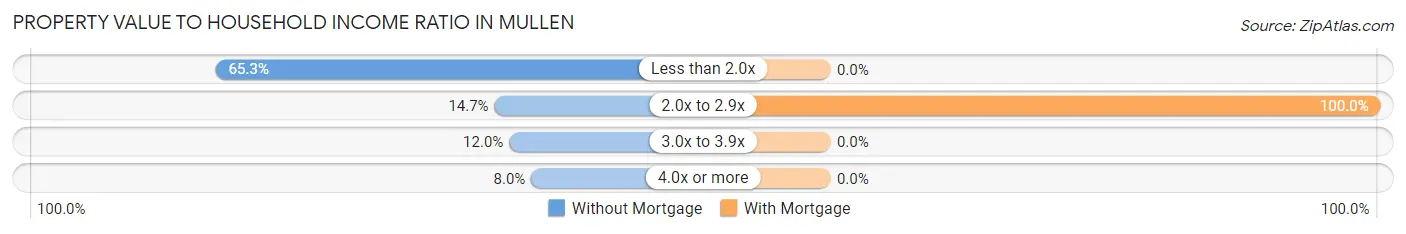
| Value-to-Income Ratio | Without Mortgage | With Mortgage |
| Less than 2.0x | 49 (65.3%) | 0 (0.0%) |
| 2.0x to 2.9x | 11 (14.7%) | 21 (100.0%) |
| 3.0x to 3.9x | 9 (12.0%) | 0 (0.0%) |
| 4.0x or more | 6 (8.0%) | 0 (0.0%) |
| Total | 75 (100.0%) | 21 (100.0%) |
Real Estate Taxes by Mortgage Status in Mullen
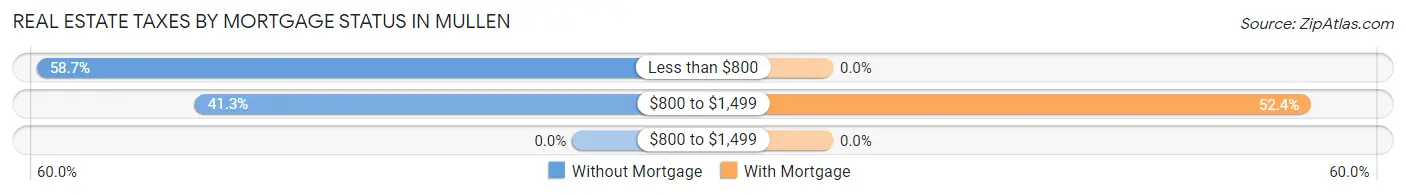
| Property Taxes | Without Mortgage | With Mortgage |
| Less than $800 | 44 (58.7%) | 0 (0.0%) |
| $800 to $1,499 | 31 (41.3%) | 11 (52.4%) |
| $800 to $1,499 | 0 (0.0%) | 0 (0.0%) |
| Total | 75 (100.0%) | 21 (100.0%) |
Health & Disability in Mullen
Health Insurance Coverage by Age in Mullen
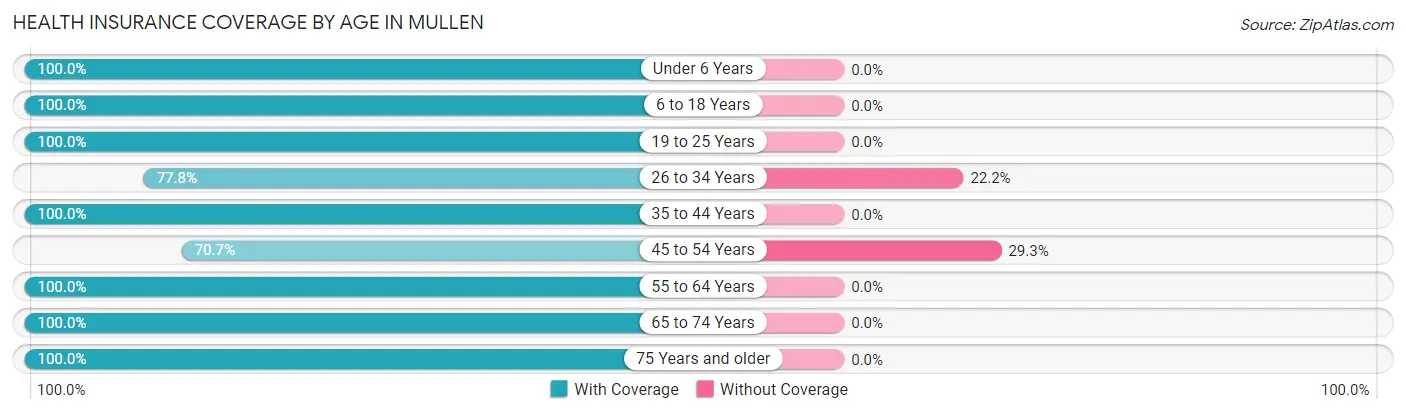
| Age Bracket | With Coverage | Without Coverage |
| Under 6 Years | 35 (100.0%) | 0 (0.0%) |
| 6 to 18 Years | 70 (100.0%) | 0 (0.0%) |
| 19 to 25 Years | 51 (100.0%) | 0 (0.0%) |
| 26 to 34 Years | 21 (77.8%) | 6 (22.2%) |
| 35 to 44 Years | 82 (100.0%) | 0 (0.0%) |
| 45 to 54 Years | 41 (70.7%) | 17 (29.3%) |
| 55 to 64 Years | 37 (100.0%) | 0 (0.0%) |
| 65 to 74 Years | 27 (100.0%) | 0 (0.0%) |
| 75 Years and older | 41 (100.0%) | 0 (0.0%) |
| Total | 405 (94.6%) | 23 (5.4%) |
Health Insurance Coverage by Citizenship Status in Mullen
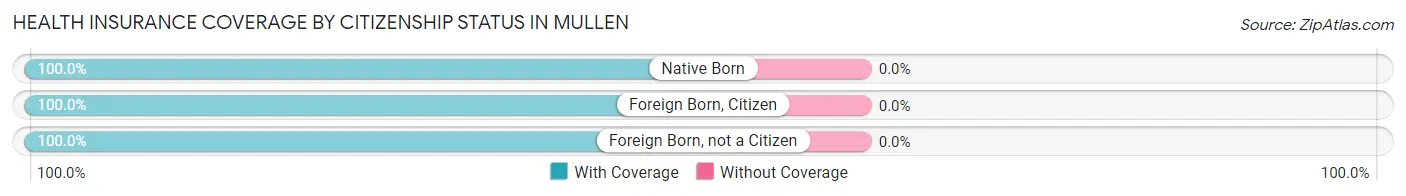
| Citizenship Status | With Coverage | Without Coverage |
| Native Born | 35 (100.0%) | 0 (0.0%) |
| Foreign Born, Citizen | 70 (100.0%) | 0 (0.0%) |
| Foreign Born, not a Citizen | 51 (100.0%) | 0 (0.0%) |
Health Insurance Coverage by Household Income in Mullen
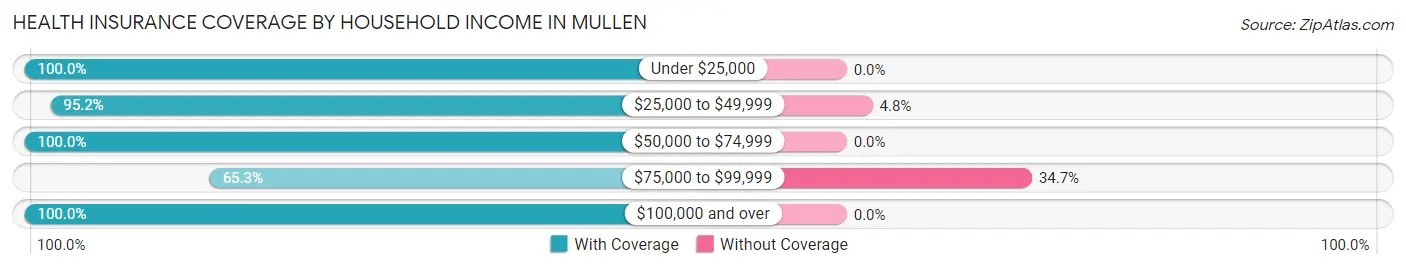
| Household Income | With Coverage | Without Coverage |
| Under $25,000 | 48 (100.0%) | 0 (0.0%) |
| $25,000 to $49,999 | 118 (95.2%) | 6 (4.8%) |
| $50,000 to $74,999 | 3 (100.0%) | 0 (0.0%) |
| $75,000 to $99,999 | 32 (65.3%) | 17 (34.7%) |
| $100,000 and over | 204 (100.0%) | 0 (0.0%) |
Public vs Private Health Insurance Coverage by Age in Mullen
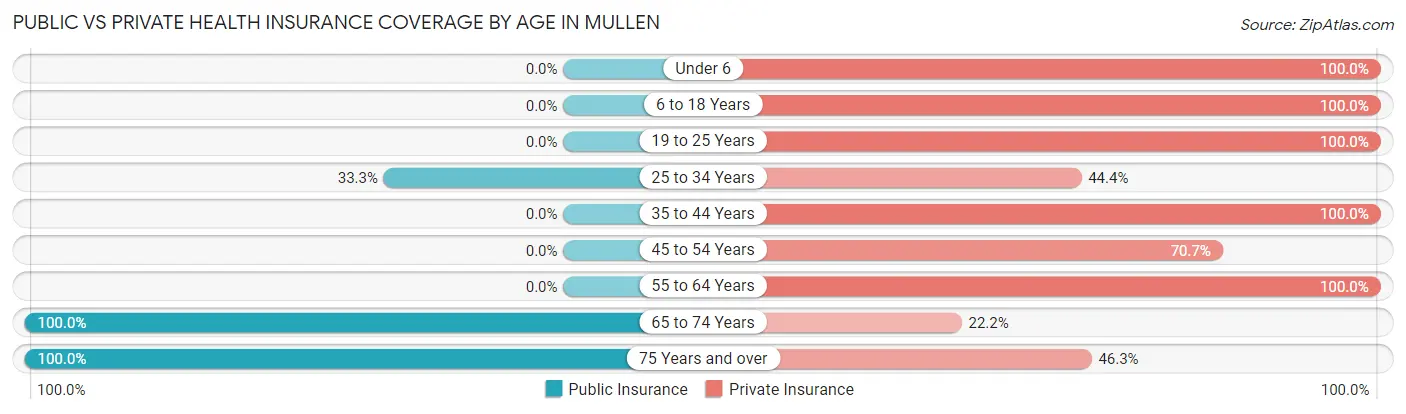
| Age Bracket | Public Insurance | Private Insurance |
| Under 6 | 0 (0.0%) | 35 (100.0%) |
| 6 to 18 Years | 0 (0.0%) | 70 (100.0%) |
| 19 to 25 Years | 0 (0.0%) | 51 (100.0%) |
| 25 to 34 Years | 9 (33.3%) | 12 (44.4%) |
| 35 to 44 Years | 0 (0.0%) | 82 (100.0%) |
| 45 to 54 Years | 0 (0.0%) | 41 (70.7%) |
| 55 to 64 Years | 0 (0.0%) | 37 (100.0%) |
| 65 to 74 Years | 27 (100.0%) | 6 (22.2%) |
| 75 Years and over | 41 (100.0%) | 19 (46.3%) |
| Total | 77 (18.0%) | 353 (82.5%) |
Disability Status by Sex by Age in Mullen
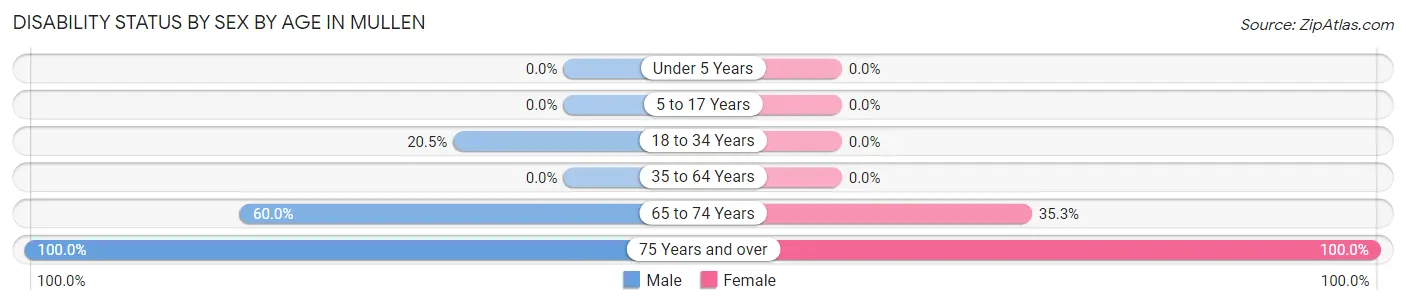
| Age Bracket | Male | Female |
| Under 5 Years | 0 (0.0%) | 0 (0.0%) |
| 5 to 17 Years | 0 (0.0%) | 0 (0.0%) |
| 18 to 34 Years | 9 (20.4%) | 0 (0.0%) |
| 35 to 64 Years | 0 (0.0%) | 0 (0.0%) |
| 65 to 74 Years | 6 (60.0%) | 6 (35.3%) |
| 75 Years and over | 9 (100.0%) | 32 (100.0%) |
Disability Class by Sex by Age in Mullen
Disability Class: Hearing Difficulty
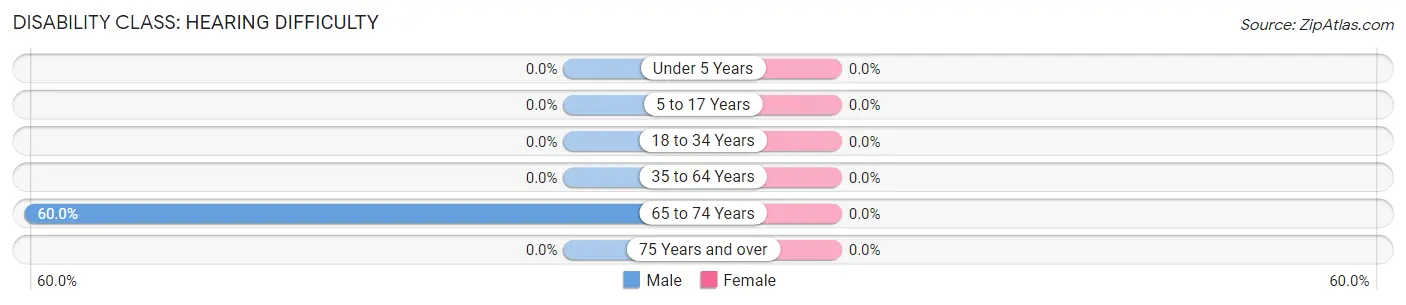
| Age Bracket | Male | Female |
| Under 5 Years | 0 (0.0%) | 0 (0.0%) |
| 5 to 17 Years | 0 (0.0%) | 0 (0.0%) |
| 18 to 34 Years | 0 (0.0%) | 0 (0.0%) |
| 35 to 64 Years | 0 (0.0%) | 0 (0.0%) |
| 65 to 74 Years | 6 (60.0%) | 0 (0.0%) |
| 75 Years and over | 0 (0.0%) | 0 (0.0%) |
Disability Class: Vision Difficulty
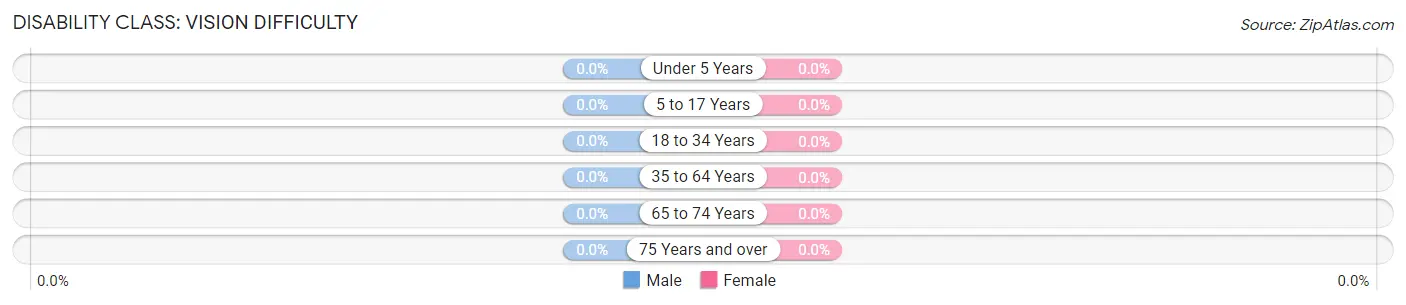
| Age Bracket | Male | Female |
| Under 5 Years | 0 (0.0%) | 0 (0.0%) |
| 5 to 17 Years | 0 (0.0%) | 0 (0.0%) |
| 18 to 34 Years | 0 (0.0%) | 0 (0.0%) |
| 35 to 64 Years | 0 (0.0%) | 0 (0.0%) |
| 65 to 74 Years | 0 (0.0%) | 0 (0.0%) |
| 75 Years and over | 0 (0.0%) | 0 (0.0%) |
Disability Class: Cognitive Difficulty
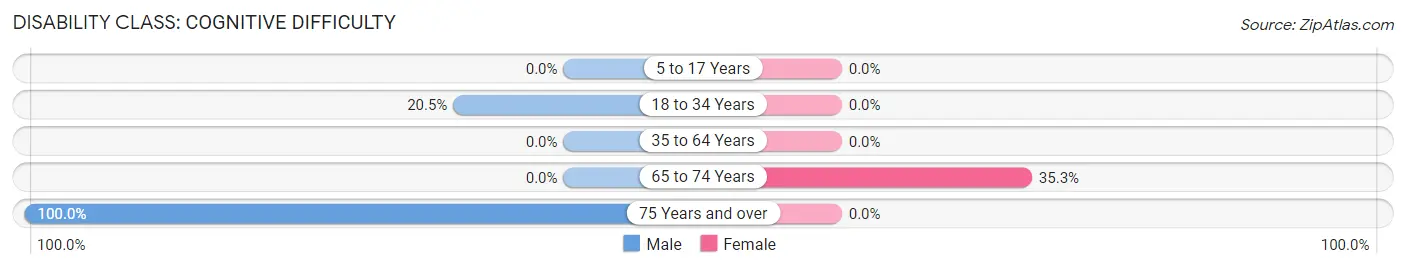
| Age Bracket | Male | Female |
| 5 to 17 Years | 0 (0.0%) | 0 (0.0%) |
| 18 to 34 Years | 9 (20.4%) | 0 (0.0%) |
| 35 to 64 Years | 0 (0.0%) | 0 (0.0%) |
| 65 to 74 Years | 0 (0.0%) | 6 (35.3%) |
| 75 Years and over | 9 (100.0%) | 0 (0.0%) |
Disability Class: Ambulatory Difficulty
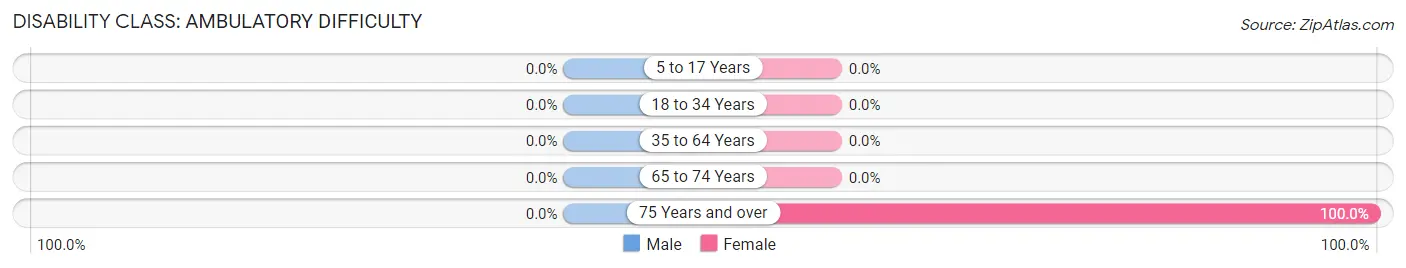
| Age Bracket | Male | Female |
| 5 to 17 Years | 0 (0.0%) | 0 (0.0%) |
| 18 to 34 Years | 0 (0.0%) | 0 (0.0%) |
| 35 to 64 Years | 0 (0.0%) | 0 (0.0%) |
| 65 to 74 Years | 0 (0.0%) | 0 (0.0%) |
| 75 Years and over | 0 (0.0%) | 32 (100.0%) |
Disability Class: Self-Care Difficulty
| Age Bracket | Male | Female |
| 5 to 17 Years | 0 (0.0%) | 0 (0.0%) |
| 18 to 34 Years | 0 (0.0%) | 0 (0.0%) |
| 35 to 64 Years | 0 (0.0%) | 0 (0.0%) |
| 65 to 74 Years | 0 (0.0%) | 0 (0.0%) |
| 75 Years and over | 0 (0.0%) | 0 (0.0%) |
Technology Access in Mullen
Computing Device Access in Mullen
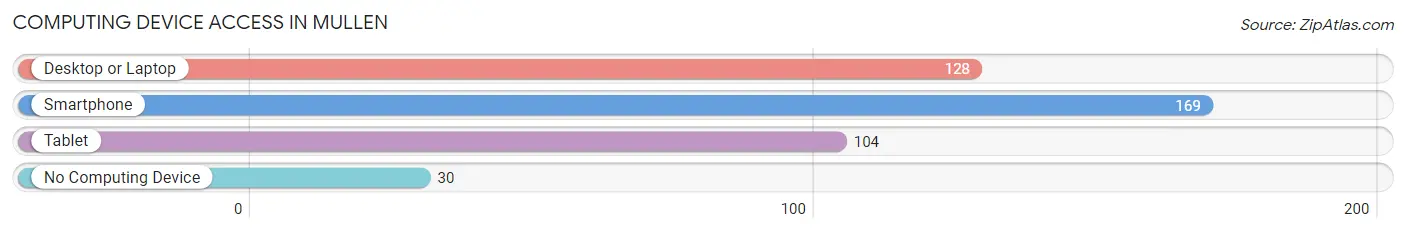
| Device Type | # Households | % Households |
| Desktop or Laptop | 128 | 61.0% |
| Smartphone | 169 | 80.5% |
| Tablet | 104 | 49.5% |
| No Computing Device | 30 | 14.3% |
| Total | 210 | 100.0% |
Internet Access in Mullen
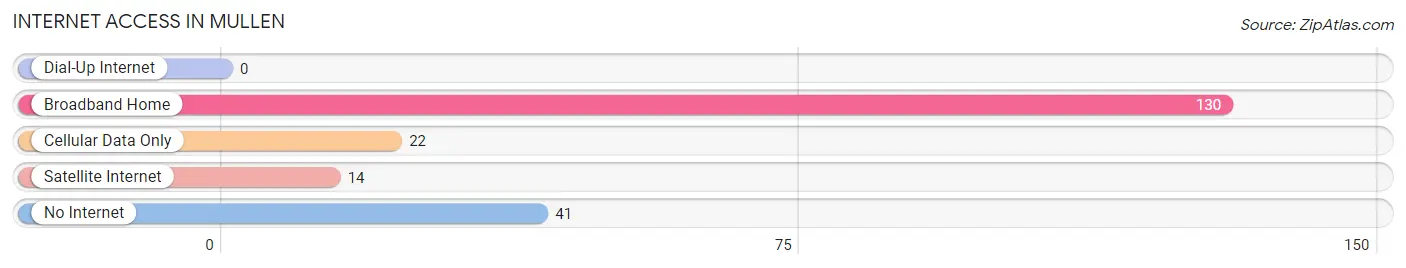
| Internet Type | # Households | % Households |
| Dial-Up Internet | 0 | 0.0% |
| Broadband Home | 130 | 61.9% |
| Cellular Data Only | 22 | 10.5% |
| Satellite Internet | 14 | 6.7% |
| No Internet | 41 | 19.5% |
| Total | 210 | 100.0% |
Mullen Summary
Mullen is a small town located in Hooker County, Nebraska. It is situated in the Sandhills region of the state, and is the county seat of Hooker County. The town was founded in 1887 and has a population of approximately 830 people.
Geography
Mullen is located in the Sandhills region of Nebraska, which is characterized by rolling hills and sandy soils. The town is situated in the northern part of Hooker County, and is bordered by the towns of Arnold, Thedford, and Tryon. The town is located at an elevation of 3,000 feet above sea level, and is situated on the banks of the Middle Loup River. The climate in Mullen is semi-arid, with hot summers and cold winters.
Economy
Mullen’s economy is largely based on agriculture and ranching. The town is home to several large cattle ranches, and the surrounding area is used for growing corn, wheat, and other crops. The town also has a small manufacturing sector, which produces a variety of products such as furniture, clothing, and other items.
Demographics
As of the 2010 census, the population of Mullen was 830 people. The racial makeup of the town was 97.2% White, 0.4% African American, 0.4% Native American, 0.4% Asian, 0.2% from other races, and 1.4% from two or more races. The median household income in Mullen was $37,500, and the median family income was $45,000.
History
Mullen was founded in 1887 by a group of settlers from Iowa. The town was named after the Mullen family, who were among the first settlers in the area. The town was incorporated in 1891, and the first post office was established in 1892. The town grew slowly over the years, and by the early 1900s, it had become a thriving agricultural center.
In the early 20th century, Mullen was a popular destination for tourists, who came to enjoy the area’s natural beauty and outdoor activities. The town was also home to several businesses, including a hotel, a bank, and a general store.
In the late 20th century, Mullen experienced a period of decline, as many of its businesses closed and the population began to decline. However, in recent years, the town has seen a resurgence in population and economic activity. Today, Mullen is a small but vibrant community, with a variety of businesses and attractions.
Common Questions
What is Per Capita Income in Mullen?
Per Capita income in Mullen is $31,771.
What is the Median Family Income in Mullen?
Median Family Income in Mullen is $102,171.
What is the Median Household income in Mullen?
Median Household Income in Mullen is $41,944.
What is Income or Wage Gap in Mullen?
Income or Wage Gap in Mullen is 27.9%.
Women in Mullen earn 72.1 cents for every dollar earned by a man.
What is Inequality or Gini Index in Mullen?
Inequality or Gini Index in Mullen is 0.42.
What is the Total Population of Mullen?
Total Population of Mullen is 453.
What is the Total Male Population of Mullen?
Total Male Population of Mullen is 192.
What is the Total Female Population of Mullen?
Total Female Population of Mullen is 261.
What is the Ratio of Males per 100 Females in Mullen?
There are 73.56 Males per 100 Females in Mullen.
What is the Ratio of Females per 100 Males in Mullen?
There are 135.94 Females per 100 Males in Mullen.
What is the Median Population Age in Mullen?
Median Population Age in Mullen is 41.3 Years.
What is the Average Family Size in Mullen
Average Family Size in Mullen is 3.5 People.
What is the Average Household Size in Mullen
Average Household Size in Mullen is 2.0 People.
How Large is the Labor Force in Mullen?
There are 236 People in the Labor Forcein in Mullen.
What is the Percentage of People in the Labor Force in Mullen?
61.6% of People are in the Labor Force in Mullen.