Morrill, NE Map & Demographics
Morrill Map
Morrill Overview
$31,250
PER CAPITA INCOME
$63,125
AVG FAMILY INCOME
$40,875
AVG HOUSEHOLD INCOME
47.3%
WAGE / INCOME GAP [ % ]
52.7¢/ $1
WAGE / INCOME GAP [ $ ]
0.47
INEQUALITY / GINI INDEX
773
TOTAL POPULATION
342
MALE POPULATION
431
FEMALE POPULATION
79.35
MALES / 100 FEMALES
126.02
FEMALES / 100 MALES
45.7
MEDIAN AGE
2.5
AVG FAMILY SIZE
1.8
AVG HOUSEHOLD SIZE
356
LABOR FORCE [ PEOPLE ]
56.2%
PERCENT IN LABOR FORCE
4.2%
UNEMPLOYMENT RATE
Morrill Zip Codes
Morrill Area Codes
Income in Morrill
Income Overview in Morrill
Per Capita Income in Morrill is $31,250, while median incomes of families and households are $63,125 and $40,875 respectively.
| Characteristic | Number | Measure |
| Per Capita Income | 773 | $31,250 |
| Median Family Income | 231 | $63,125 |
| Mean Family Income | 231 | $80,178 |
| Median Household Income | 423 | $40,875 |
| Mean Household Income | 423 | $58,594 |
| Income Deficit | 231 | $0 |
| Wage / Income Gap (%) | 773 | 47.31% |
| Wage / Income Gap ($) | 773 | 52.69¢ per $1 |
| Gini / Inequality Index | 773 | 0.47 |
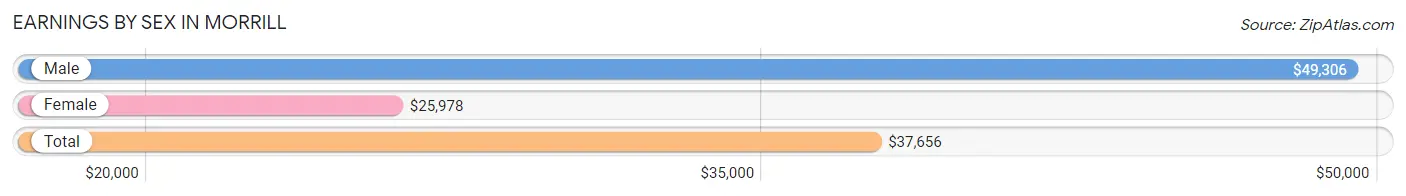
Earnings by Sex in Morrill
Average Earnings in Morrill are $37,656, $49,306 for men and $25,978 for women, a difference of 47.3%.
| Sex | Number | Average Earnings |
| Male | 157 (44.2%) | $49,306 |
| Female | 198 (55.8%) | $25,978 |
| Total | 355 (100.0%) | $37,656 |
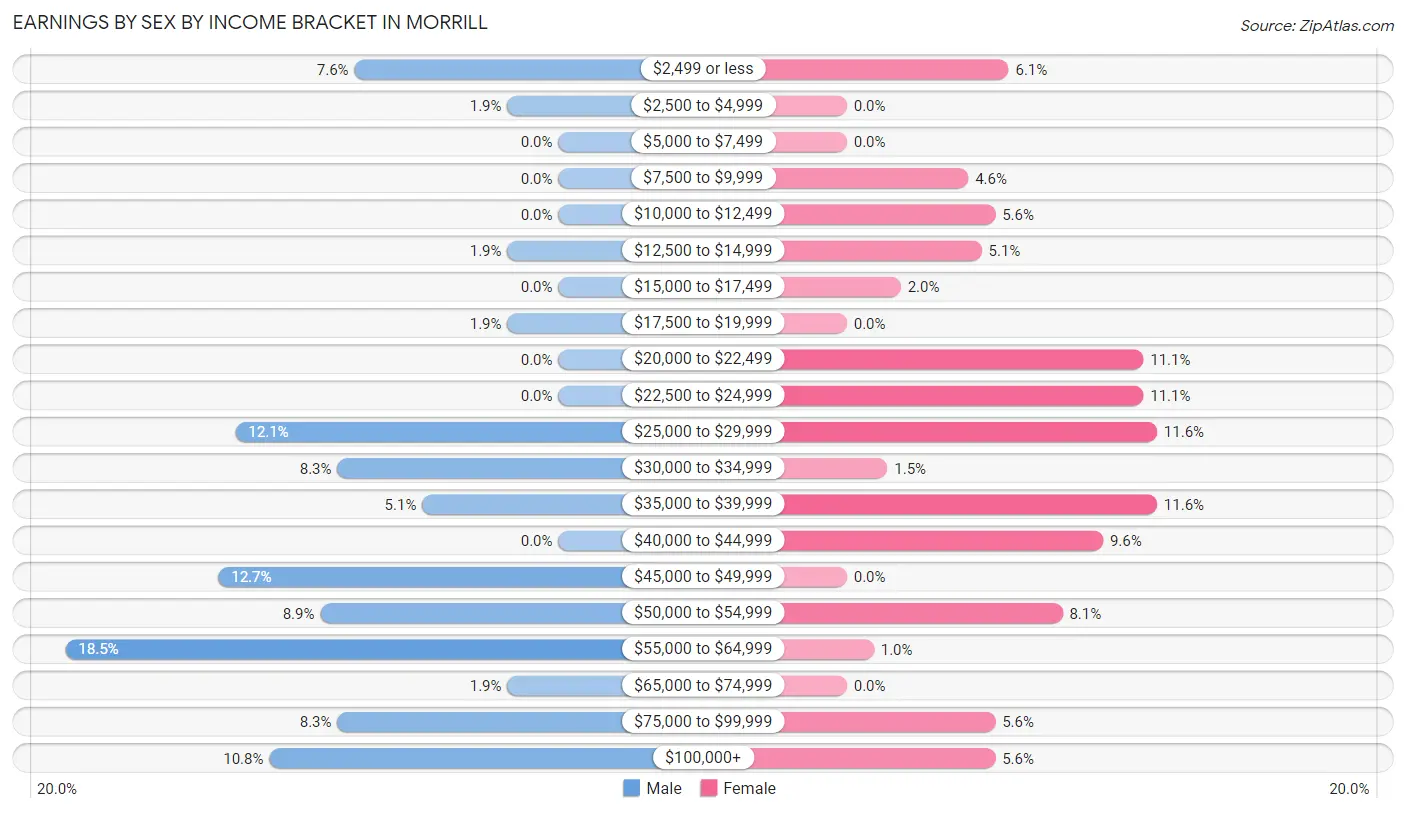
Earnings by Sex by Income Bracket in Morrill
The most common earnings brackets in Morrill are $55,000 to $64,999 for men (29 | 18.5%) and $25,000 to $29,999 for women (23 | 11.6%).
| Income | Male | Female |
| $2,499 or less | 12 (7.6%) | 12 (6.1%) |
| $2,500 to $4,999 | 3 (1.9%) | 0 (0.0%) |
| $5,000 to $7,499 | 0 (0.0%) | 0 (0.0%) |
| $7,500 to $9,999 | 0 (0.0%) | 9 (4.5%) |
| $10,000 to $12,499 | 0 (0.0%) | 11 (5.6%) |
| $12,500 to $14,999 | 3 (1.9%) | 10 (5.1%) |
| $15,000 to $17,499 | 0 (0.0%) | 4 (2.0%) |
| $17,500 to $19,999 | 3 (1.9%) | 0 (0.0%) |
| $20,000 to $22,499 | 0 (0.0%) | 22 (11.1%) |
| $22,500 to $24,999 | 0 (0.0%) | 22 (11.1%) |
| $25,000 to $29,999 | 19 (12.1%) | 23 (11.6%) |
| $30,000 to $34,999 | 13 (8.3%) | 3 (1.5%) |
| $35,000 to $39,999 | 8 (5.1%) | 23 (11.6%) |
| $40,000 to $44,999 | 0 (0.0%) | 19 (9.6%) |
| $45,000 to $49,999 | 20 (12.7%) | 0 (0.0%) |
| $50,000 to $54,999 | 14 (8.9%) | 16 (8.1%) |
| $55,000 to $64,999 | 29 (18.5%) | 2 (1.0%) |
| $65,000 to $74,999 | 3 (1.9%) | 0 (0.0%) |
| $75,000 to $99,999 | 13 (8.3%) | 11 (5.6%) |
| $100,000+ | 17 (10.8%) | 11 (5.6%) |
| Total | 157 (100.0%) | 198 (100.0%) |
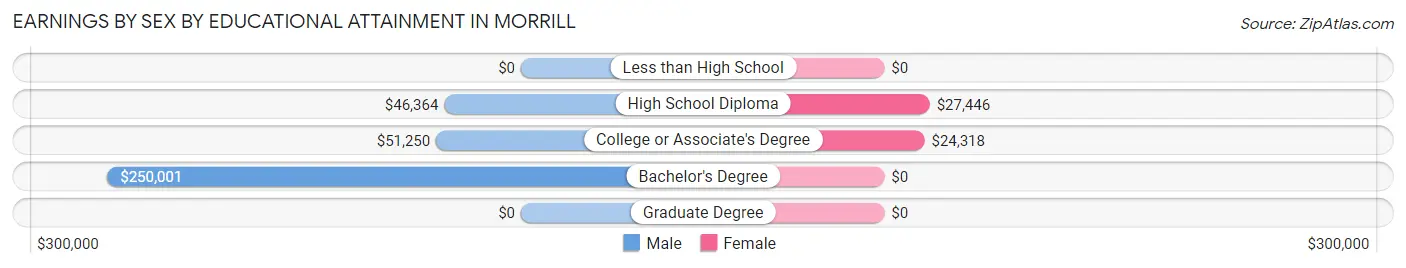
Earnings by Sex by Educational Attainment in Morrill
Average earnings in Morrill are $51,786 for men and $30,417 for women, a difference of 41.3%. Men with an educational attainment of bachelor's degree enjoy the highest average annual earnings of $250,001, while those with high school diploma education earn the least with $46,364. Women with an educational attainment of high school diploma earn the most with the average annual earnings of $27,446, while those with college or associate's degree education have the smallest earnings of $24,318.
| Educational Attainment | Male Income | Female Income |
| Less than High School | - | - |
| High School Diploma | $46,364 | $27,446 |
| College or Associate's Degree | $51,250 | $24,318 |
| Bachelor's Degree | $250,001 | $0 |
| Graduate Degree | - | - |
| Total | $51,786 | $30,417 |
Family Income in Morrill
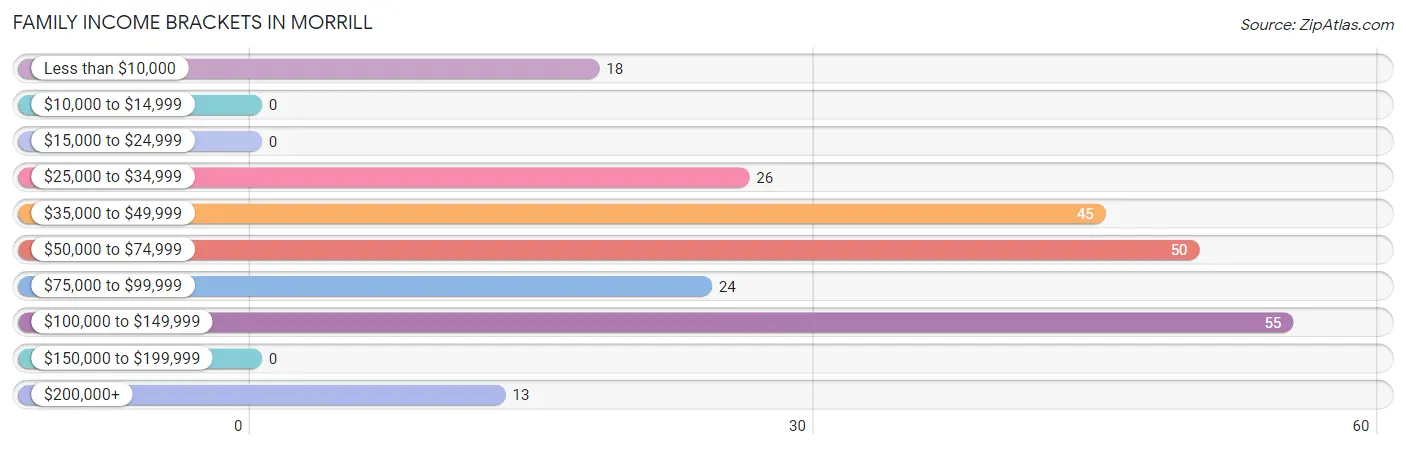
Family Income Brackets in Morrill
According to the Morrill family income data, there are 55 families falling into the $100,000 to $149,999 income range, which is the most common income bracket and makes up 23.8% of all families.
| Income Bracket | # Families | % Families |
| Less than $10,000 | 18 | 7.8% |
| $10,000 to $14,999 | 0 | 0.0% |
| $15,000 to $24,999 | 0 | 0.0% |
| $25,000 to $34,999 | 26 | 11.3% |
| $35,000 to $49,999 | 45 | 19.5% |
| $50,000 to $74,999 | 50 | 21.6% |
| $75,000 to $99,999 | 24 | 10.4% |
| $100,000 to $149,999 | 55 | 23.8% |
| $150,000 to $199,999 | 0 | 0.0% |
| $200,000+ | 13 | 5.6% |
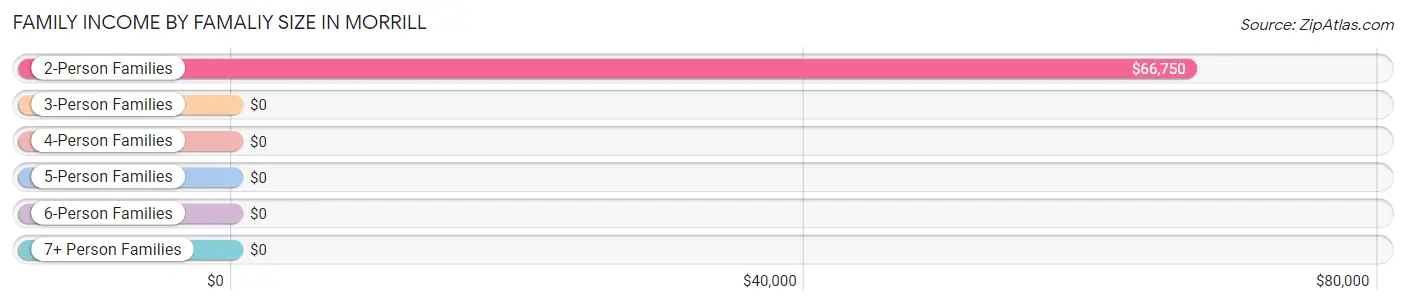
Family Income by Famaliy Size in Morrill
2-person families (124 | 53.7%) account for the highest median family income in Morrill with $66,750 per family, while 2-person families (124 | 53.7%) have the highest median income of $33,375 per family member.
| Income Bracket | # Families | Median Income |
| 2-Person Families | 124 (53.7%) | $66,750 |
| 3-Person Families | 72 (31.2%) | $0 |
| 4-Person Families | 19 (8.2%) | $0 |
| 5-Person Families | 16 (6.9%) | $0 |
| 6-Person Families | 0 (0.0%) | $0 |
| 7+ Person Families | 0 (0.0%) | $0 |
| Total | 231 (100.0%) | $63,125 |
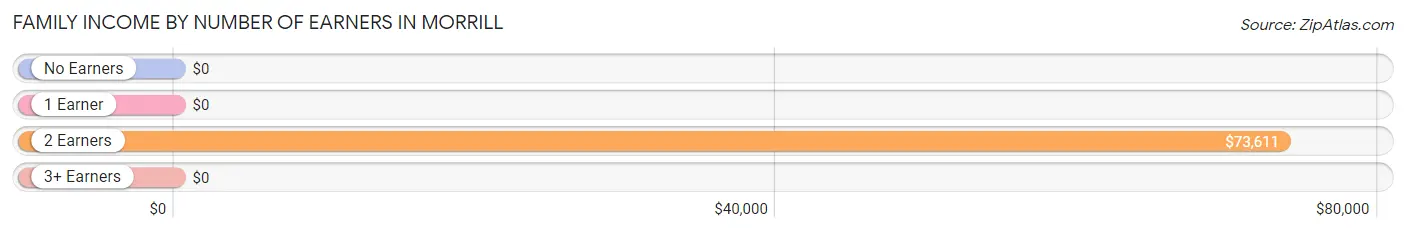
Family Income by Number of Earners in Morrill
| Number of Earners | # Families | Median Income |
| No Earners | 56 (24.2%) | $0 |
| 1 Earner | 65 (28.1%) | $0 |
| 2 Earners | 110 (47.6%) | $73,611 |
| 3+ Earners | 0 (0.0%) | $0 |
| Total | 231 (100.0%) | $63,125 |
Household Income in Morrill
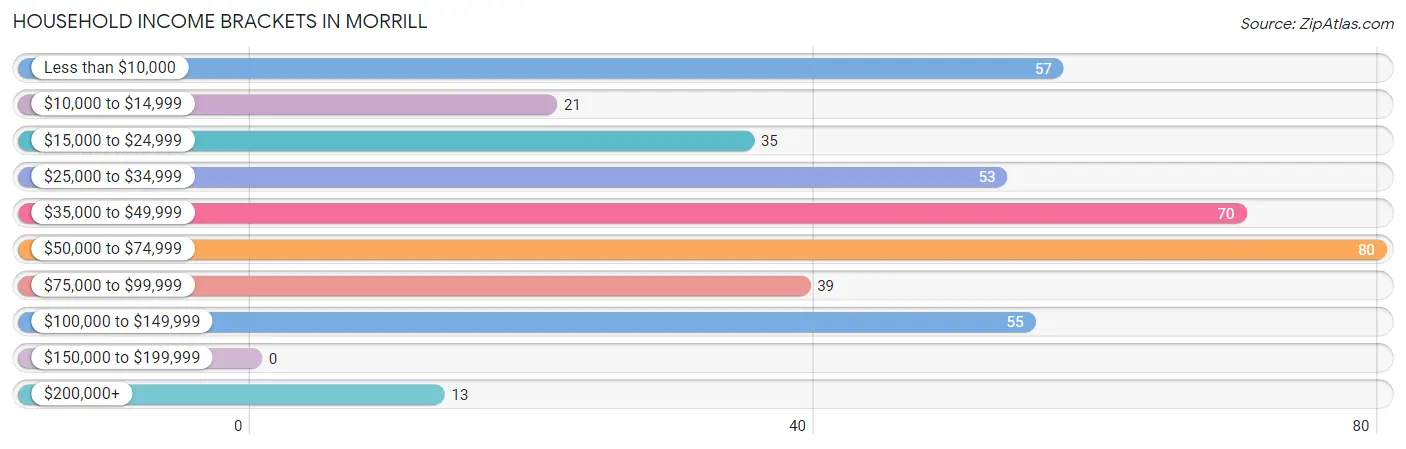
Household Income Brackets in Morrill
With 80 households falling in the category, the $50,000 to $74,999 income range is the most frequent in Morrill, accounting for 18.9% of all households.
| Income Bracket | # Households | % Households |
| Less than $10,000 | 57 | 13.5% |
| $10,000 to $14,999 | 21 | 5.0% |
| $15,000 to $24,999 | 35 | 8.3% |
| $25,000 to $34,999 | 53 | 12.5% |
| $35,000 to $49,999 | 70 | 16.5% |
| $50,000 to $74,999 | 80 | 18.9% |
| $75,000 to $99,999 | 39 | 9.2% |
| $100,000 to $149,999 | 55 | 13.0% |
| $150,000 to $199,999 | 0 | 0.0% |
| $200,000+ | 13 | 3.1% |
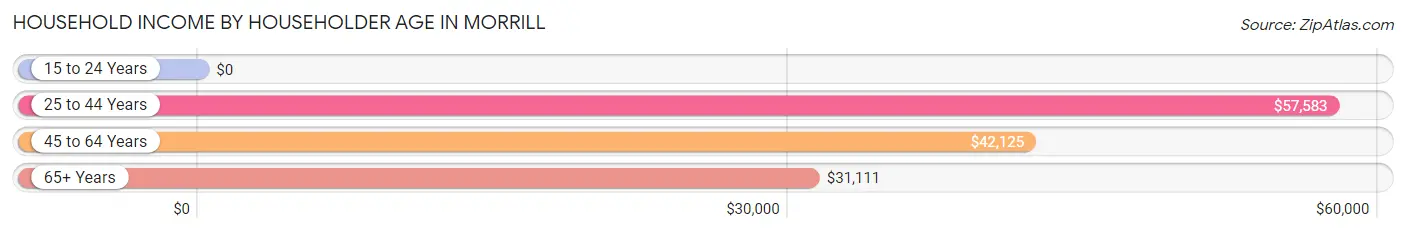
Household Income by Householder Age in Morrill
The median household income in Morrill is $40,875, with the highest median household income of $57,583 found in the 25 to 44 years age bracket for the primary householder. A total of 123 households (29.1%) fall into this category. Meanwhile, the 15 to 24 years age bracket for the primary householder has the lowest median household income of $0, with 13 households (3.1%) in this group.
| Income Bracket | # Households | Median Income |
| 15 to 24 Years | 13 (3.1%) | $0 |
| 25 to 44 Years | 123 (29.1%) | $57,583 |
| 45 to 64 Years | 177 (41.8%) | $42,125 |
| 65+ Years | 110 (26.0%) | $31,111 |
| Total | 423 (100.0%) | $40,875 |
Poverty in Morrill
Income Below Poverty by Sex and Age in Morrill
With 7.3% poverty level for males and 14.1% for females among the residents of Morrill, 25 to 34 year old males and 5 year old females are the most vulnerable to poverty, with 18 males (36.0%) and 9 females (42.9%) in their respective age groups living below the poverty level.
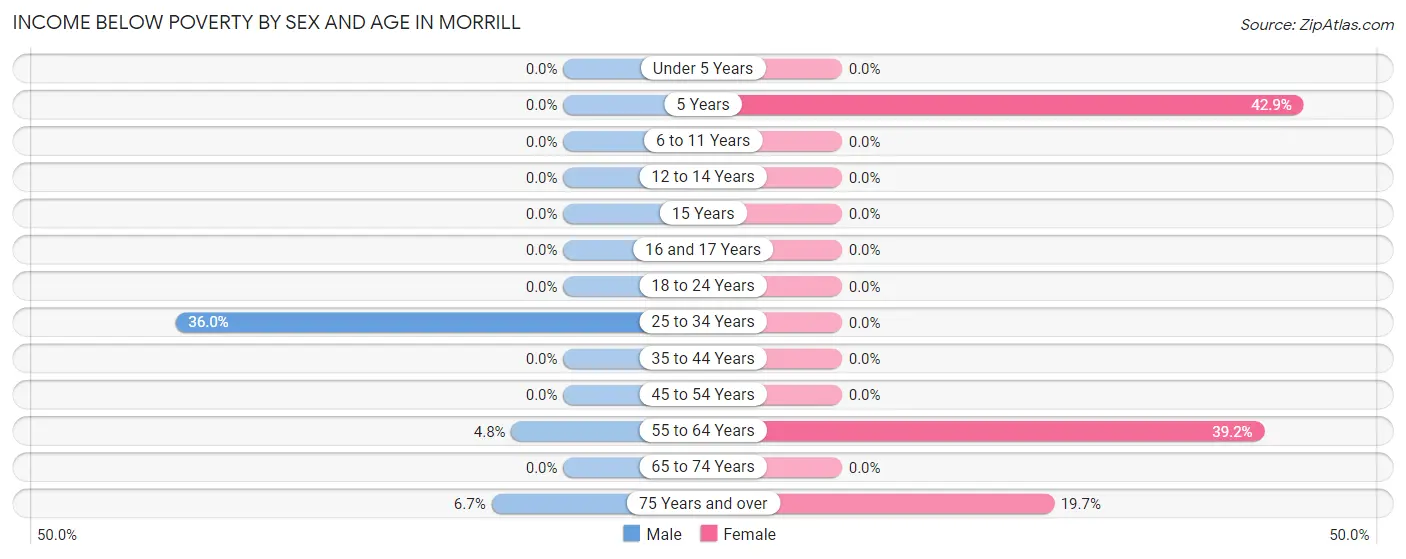
| Age Bracket | Male | Female |
| Under 5 Years | 0 (0.0%) | 0 (0.0%) |
| 5 Years | 0 (0.0%) | 9 (42.9%) |
| 6 to 11 Years | 0 (0.0%) | 0 (0.0%) |
| 12 to 14 Years | 0 (0.0%) | 0 (0.0%) |
| 15 Years | 0 (0.0%) | 0 (0.0%) |
| 16 and 17 Years | 0 (0.0%) | 0 (0.0%) |
| 18 to 24 Years | 0 (0.0%) | 0 (0.0%) |
| 25 to 34 Years | 18 (36.0%) | 0 (0.0%) |
| 35 to 44 Years | 0 (0.0%) | 0 (0.0%) |
| 45 to 54 Years | 0 (0.0%) | 0 (0.0%) |
| 55 to 64 Years | 4 (4.8%) | 40 (39.2%) |
| 65 to 74 Years | 0 (0.0%) | 0 (0.0%) |
| 75 Years and over | 3 (6.7%) | 12 (19.7%) |
| Total | 25 (7.3%) | 61 (14.1%) |
Income Above Poverty by Sex and Age in Morrill
According to the poverty statistics in Morrill, males aged under 5 years and females aged under 5 years are the age groups that are most secure financially, with 100.0% of males and 100.0% of females in these age groups living above the poverty line.
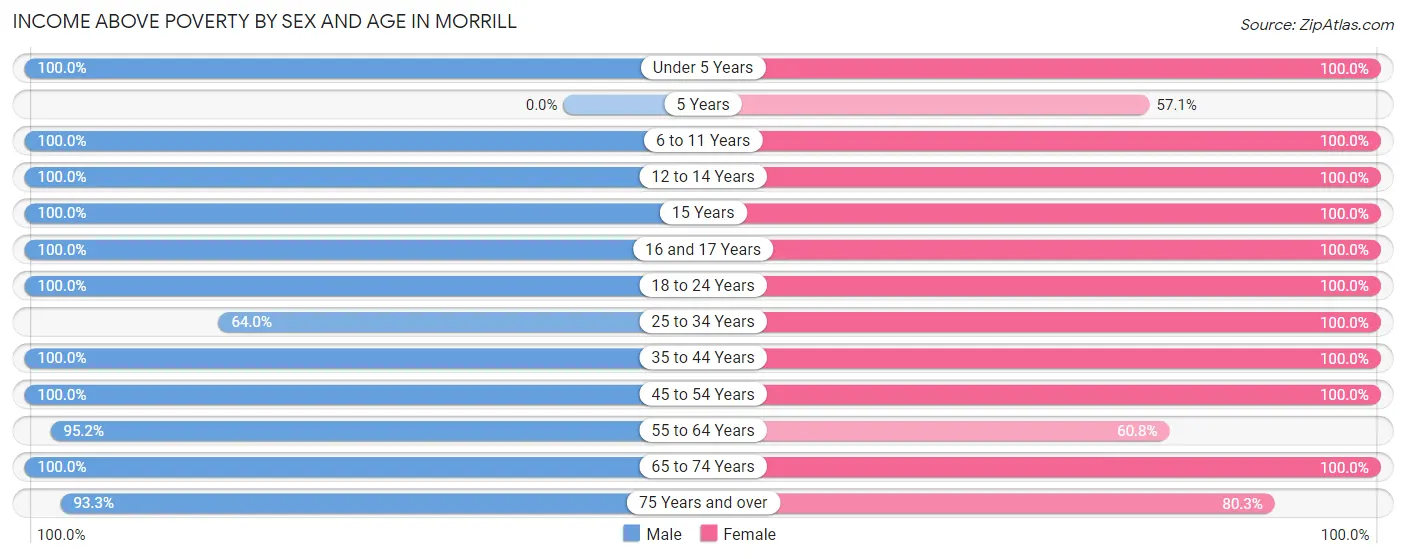
| Age Bracket | Male | Female |
| Under 5 Years | 20 (100.0%) | 28 (100.0%) |
| 5 Years | 0 (0.0%) | 12 (57.1%) |
| 6 to 11 Years | 21 (100.0%) | 21 (100.0%) |
| 12 to 14 Years | 4 (100.0%) | 4 (100.0%) |
| 15 Years | 16 (100.0%) | 4 (100.0%) |
| 16 and 17 Years | 15 (100.0%) | 23 (100.0%) |
| 18 to 24 Years | 13 (100.0%) | 17 (100.0%) |
| 25 to 34 Years | 32 (64.0%) | 51 (100.0%) |
| 35 to 44 Years | 41 (100.0%) | 31 (100.0%) |
| 45 to 54 Years | 6 (100.0%) | 33 (100.0%) |
| 55 to 64 Years | 79 (95.2%) | 62 (60.8%) |
| 65 to 74 Years | 28 (100.0%) | 35 (100.0%) |
| 75 Years and over | 42 (93.3%) | 49 (80.3%) |
| Total | 317 (92.7%) | 370 (85.9%) |
Income Below Poverty Among Married-Couple Families in Morrill
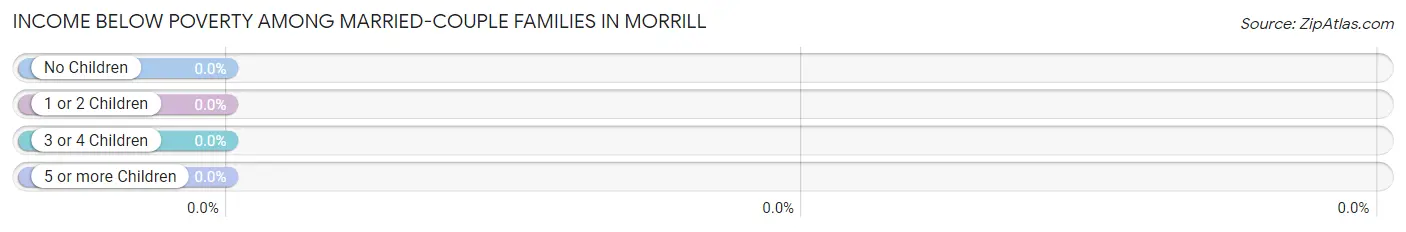
| Children | Above Poverty | Below Poverty |
| No Children | 80 (100.0%) | 0 (0.0%) |
| 1 or 2 Children | 48 (100.0%) | 0 (0.0%) |
| 3 or 4 Children | 16 (100.0%) | 0 (0.0%) |
| 5 or more Children | 0 (0.0%) | 0 (0.0%) |
| Total | 144 (100.0%) | 0 (0.0%) |
Income Below Poverty Among Single-Parent Households in Morrill
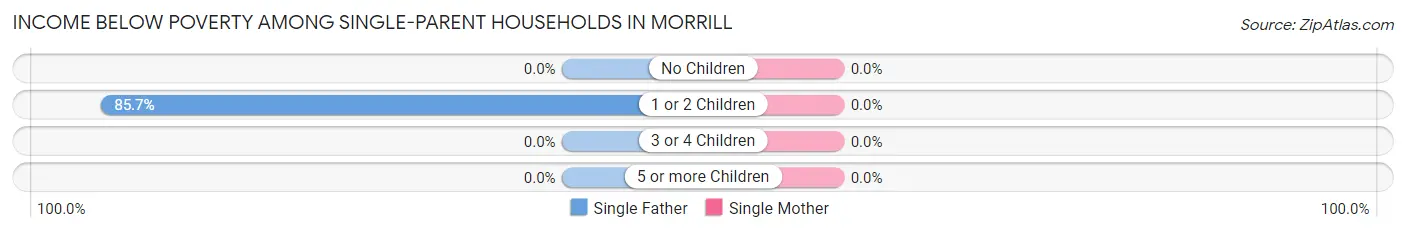
| Children | Single Father | Single Mother |
| No Children | 0 (0.0%) | 0 (0.0%) |
| 1 or 2 Children | 18 (85.7%) | 0 (0.0%) |
| 3 or 4 Children | 0 (0.0%) | 0 (0.0%) |
| 5 or more Children | 0 (0.0%) | 0 (0.0%) |
| Total | 18 (66.7%) | 0 (0.0%) |
Income Below Poverty Among Married-Couple vs Single-Parent Households in Morrill
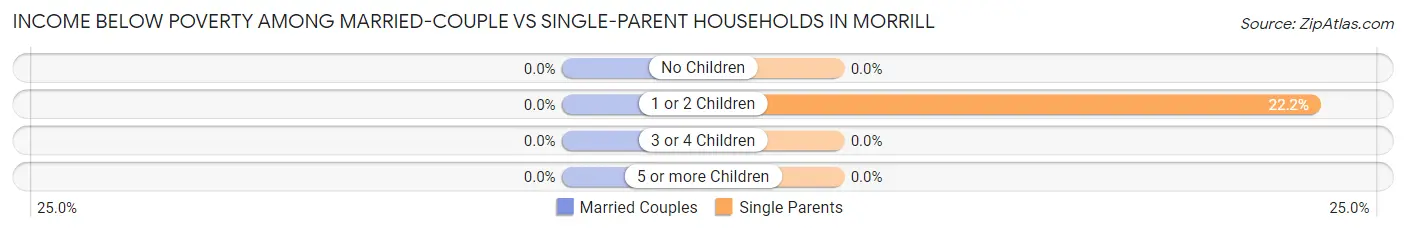
| Children | Married-Couple Families | Single-Parent Households |
| No Children | 0 (0.0%) | 0 (0.0%) |
| 1 or 2 Children | 0 (0.0%) | 18 (22.2%) |
| 3 or 4 Children | 0 (0.0%) | 0 (0.0%) |
| 5 or more Children | 0 (0.0%) | 0 (0.0%) |
| Total | 0 (0.0%) | 18 (20.7%) |
Race in Morrill
The most populous races in Morrill are White / Caucasian (636 | 82.3%), Hispanic or Latino (156 | 20.2%), and Native / Alaskan (70 | 9.1%).
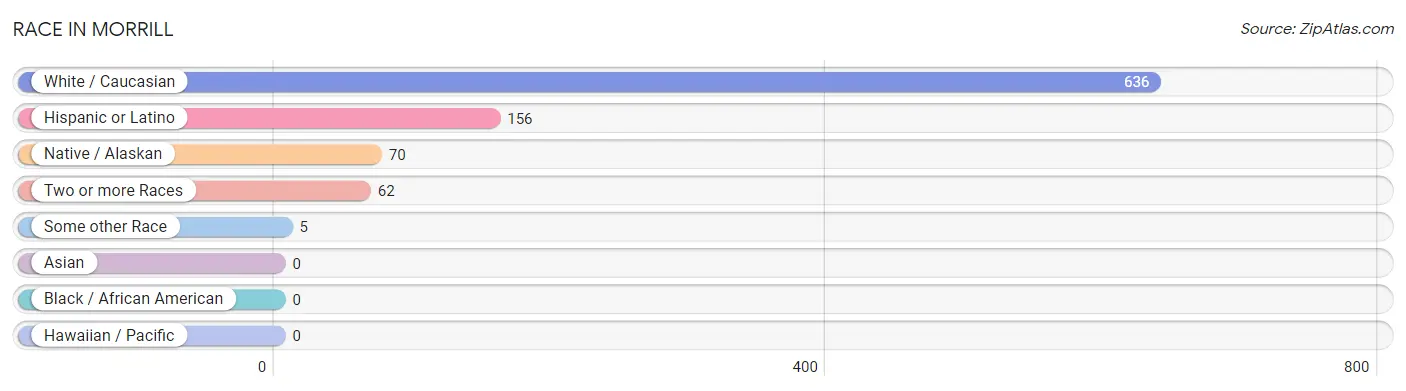
| Race | # Population | % Population |
| Asian | 0 | 0.0% |
| Black / African American | 0 | 0.0% |
| Hawaiian / Pacific | 0 | 0.0% |
| Hispanic or Latino | 156 | 20.2% |
| Native / Alaskan | 70 | 9.1% |
| White / Caucasian | 636 | 82.3% |
| Two or more Races | 62 | 8.0% |
| Some other Race | 5 | 0.6% |
| Total | 773 | 100.0% |
Ancestry in Morrill
The most populous ancestries reported in Morrill are German (246 | 31.8%), Mexican (134 | 17.3%), Irish (117 | 15.1%), English (95 | 12.3%), and Sioux (67 | 8.7%), together accounting for 85.3% of all Morrill residents.
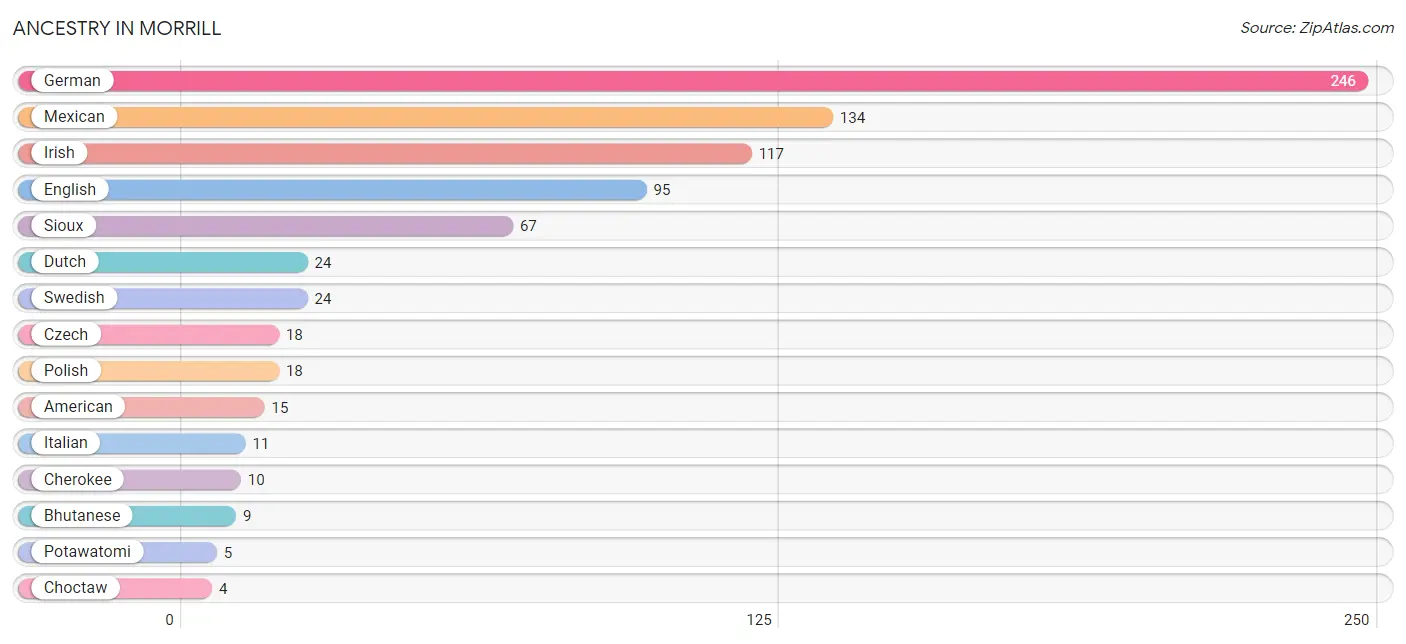
| Ancestry | # Population | % Population |
| American | 15 | 1.9% |
| Bhutanese | 9 | 1.2% |
| Cherokee | 10 | 1.3% |
| Choctaw | 4 | 0.5% |
| Czech | 18 | 2.3% |
| Danish | 3 | 0.4% |
| Dutch | 24 | 3.1% |
| English | 95 | 12.3% |
| European | 3 | 0.4% |
| French | 3 | 0.4% |
| French Canadian | 3 | 0.4% |
| German | 246 | 31.8% |
| German Russian | 3 | 0.4% |
| Irish | 117 | 15.1% |
| Italian | 11 | 1.4% |
| Mexican | 134 | 17.3% |
| Polish | 18 | 2.3% |
| Potawatomi | 5 | 0.6% |
| Scotch-Irish | 3 | 0.4% |
| Scottish | 4 | 0.5% |
| Sioux | 67 | 8.7% |
| Swedish | 24 | 3.1% | View All 22 Rows |
Immigrants in Morrill
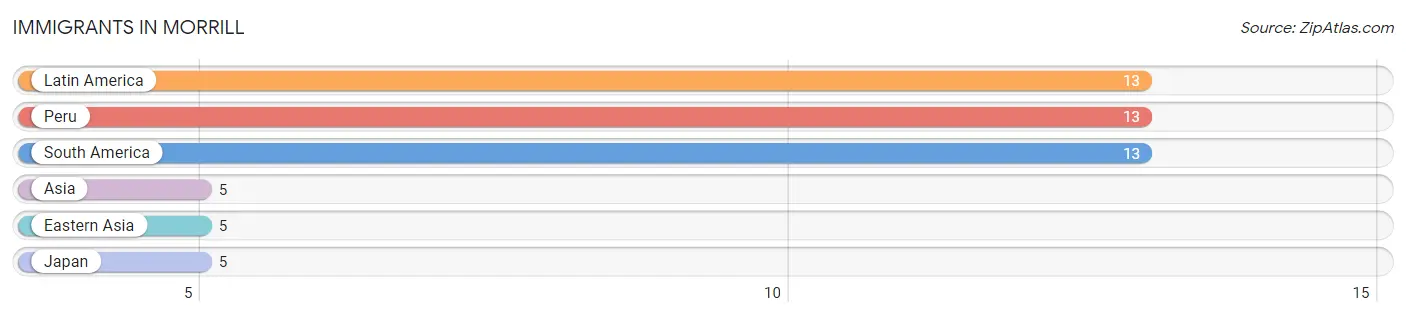
The most numerous immigrant groups reported in Morrill came from Latin America (13 | 1.7%), Peru (13 | 1.7%), South America (13 | 1.7%), Asia (5 | 0.6%), and Eastern Asia (5 | 0.6%), together accounting for 6.3% of all Morrill residents.
| Immigration Origin | # Population | % Population |
| Asia | 5 | 0.6% |
| Eastern Asia | 5 | 0.6% |
| Japan | 5 | 0.6% |
| Latin America | 13 | 1.7% |
| Peru | 13 | 1.7% |
| South America | 13 | 1.7% | View All 6 Rows |
Sex and Age in Morrill
Sex and Age in Morrill
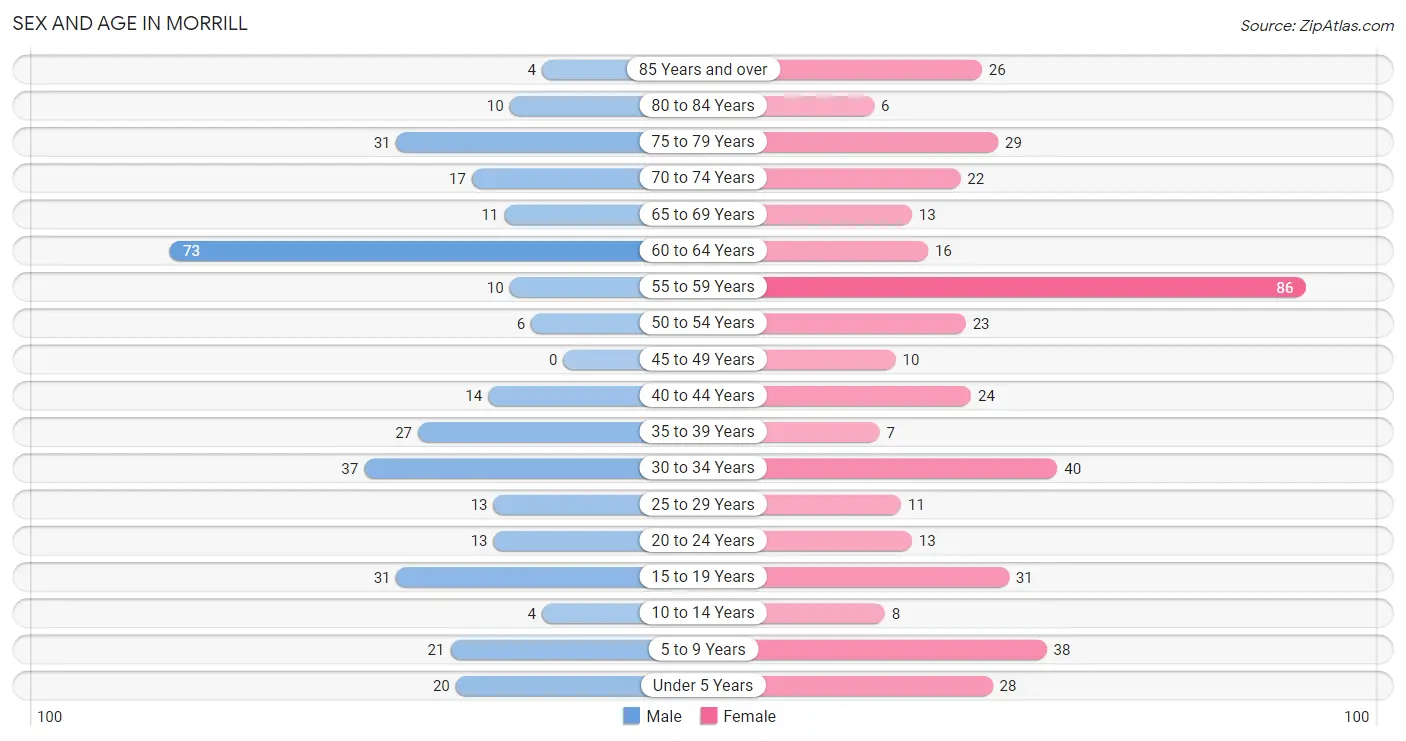
The most populous age groups in Morrill are 60 to 64 Years (73 | 21.3%) for men and 55 to 59 Years (86 | 20.0%) for women.
| Age Bracket | Male | Female |
| Under 5 Years | 20 (5.9%) | 28 (6.5%) |
| 5 to 9 Years | 21 (6.1%) | 38 (8.8%) |
| 10 to 14 Years | 4 (1.2%) | 8 (1.9%) |
| 15 to 19 Years | 31 (9.1%) | 31 (7.2%) |
| 20 to 24 Years | 13 (3.8%) | 13 (3.0%) |
| 25 to 29 Years | 13 (3.8%) | 11 (2.5%) |
| 30 to 34 Years | 37 (10.8%) | 40 (9.3%) |
| 35 to 39 Years | 27 (7.9%) | 7 (1.6%) |
| 40 to 44 Years | 14 (4.1%) | 24 (5.6%) |
| 45 to 49 Years | 0 (0.0%) | 10 (2.3%) |
| 50 to 54 Years | 6 (1.8%) | 23 (5.3%) |
| 55 to 59 Years | 10 (2.9%) | 86 (20.0%) |
| 60 to 64 Years | 73 (21.3%) | 16 (3.7%) |
| 65 to 69 Years | 11 (3.2%) | 13 (3.0%) |
| 70 to 74 Years | 17 (5.0%) | 22 (5.1%) |
| 75 to 79 Years | 31 (9.1%) | 29 (6.7%) |
| 80 to 84 Years | 10 (2.9%) | 6 (1.4%) |
| 85 Years and over | 4 (1.2%) | 26 (6.0%) |
| Total | 342 (100.0%) | 431 (100.0%) |
Families and Households in Morrill
Median Family Size in Morrill
The median family size in Morrill is 2.47 persons per family, with married-couple families (144 | 62.3%) accounting for the largest median family size of 2.67 persons per family. On the other hand, single male/father families (27 | 11.7%) represent the smallest median family size with 1.81 persons per family.
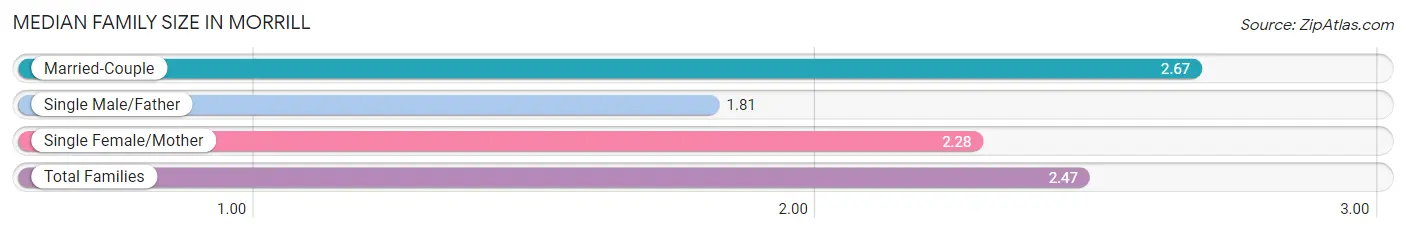
| Family Type | # Families | Family Size |
| Married-Couple | 144 (62.3%) | 2.67 |
| Single Male/Father | 27 (11.7%) | 1.81 |
| Single Female/Mother | 60 (26.0%) | 2.28 |
| Total Families | 231 (100.0%) | 2.47 |
Median Household Size in Morrill
The median household size in Morrill is 1.83 persons per household, with married-couple households (144 | 34.0%) accounting for the largest median household size of 2.67 persons per household. non-family households (192 | 45.4%) represent the smallest median household size with 1.05 persons per household.
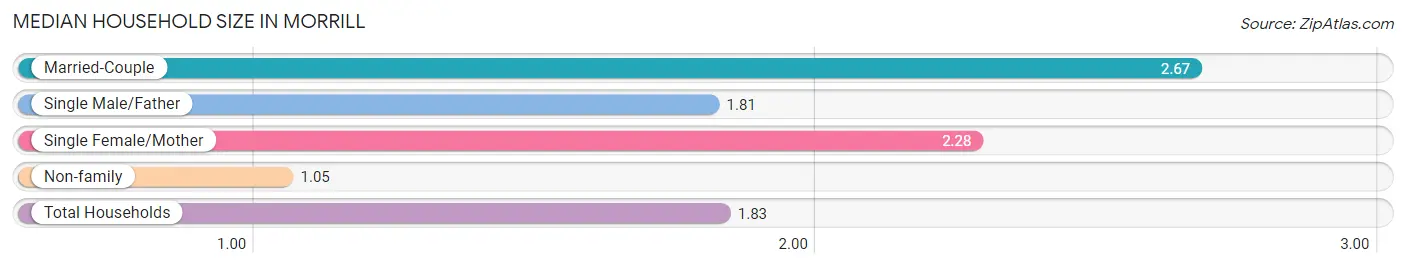
| Household Type | # Households | Household Size |
| Married-Couple | 144 (34.0%) | 2.67 |
| Single Male/Father | 27 (6.4%) | 1.81 |
| Single Female/Mother | 60 (14.2%) | 2.28 |
| Non-family | 192 (45.4%) | 1.05 |
| Total Households | 423 (100.0%) | 1.83 |
Household Size by Marriage Status in Morrill
Out of a total of 423 households in Morrill, 231 (54.6%) are family households, while 192 (45.4%) are nonfamily households. The most numerous type of family households are 2-person households, comprising 124, and the most common type of nonfamily households are 1-person households, comprising 181.
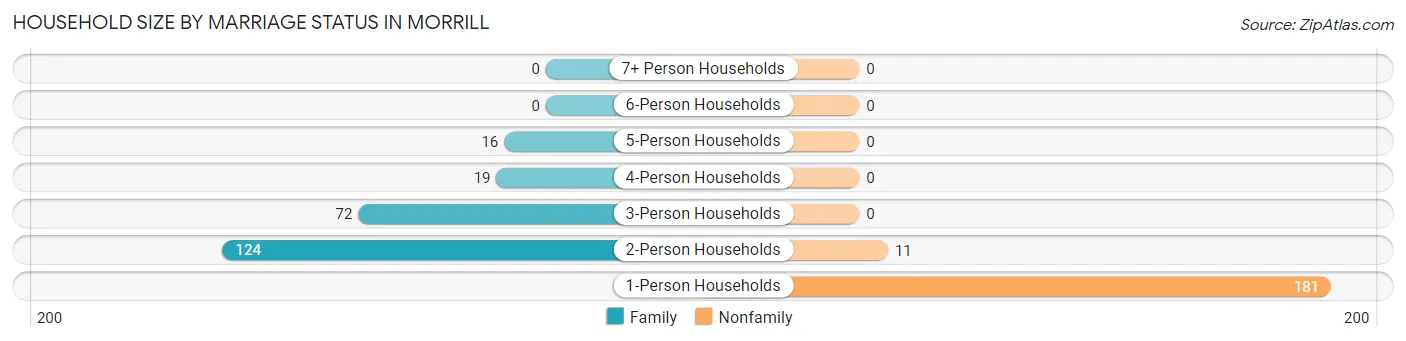
| Household Size | Family Households | Nonfamily Households |
| 1-Person Households | - | 181 (42.8%) |
| 2-Person Households | 124 (29.3%) | 11 (2.6%) |
| 3-Person Households | 72 (17.0%) | 0 (0.0%) |
| 4-Person Households | 19 (4.5%) | 0 (0.0%) |
| 5-Person Households | 16 (3.8%) | 0 (0.0%) |
| 6-Person Households | 0 (0.0%) | 0 (0.0%) |
| 7+ Person Households | 0 (0.0%) | 0 (0.0%) |
| Total | 231 (54.6%) | 192 (45.4%) |
Female Fertility in Morrill
Fertility by Age in Morrill
Average fertility rate in Morrill is 213.0 births per 1,000 women. Women in the age bracket of 20 to 34 years have the highest fertility rate with 469.0 births per 1,000 women. Women in the age bracket of 20 to 34 years acount for 100.0% of all women with births.
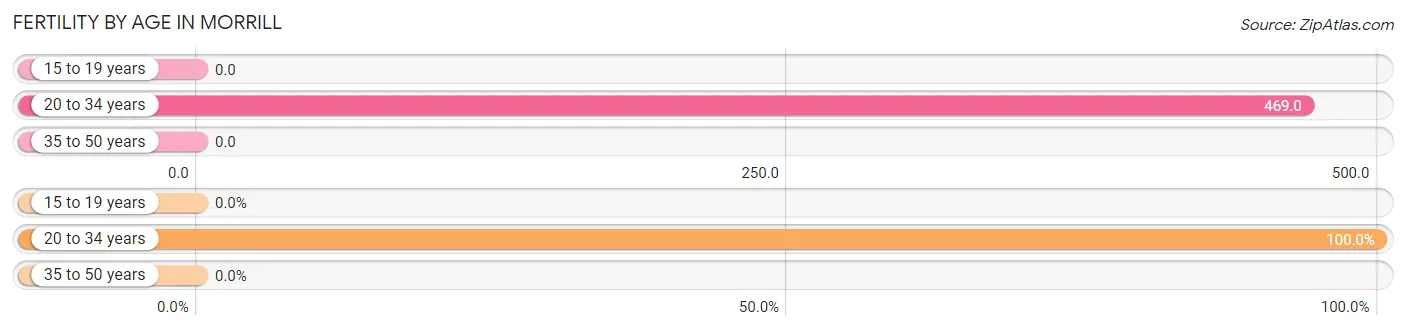
| Age Bracket | Women with Births | Births / 1,000 Women |
| 15 to 19 years | 0 (0.0%) | 0.0 |
| 20 to 34 years | 30 (100.0%) | 469.0 |
| 35 to 50 years | 0 (0.0%) | 0.0 |
| Total | 30 (100.0%) | 213.0 |
Fertility by Age by Marriage Status in Morrill
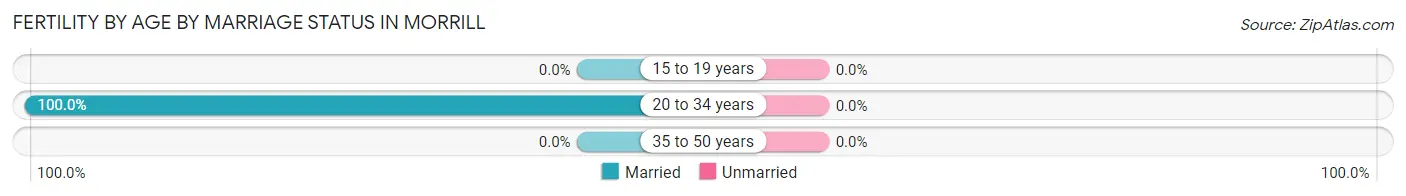
| Age Bracket | Married | Unmarried |
| 15 to 19 years | 0 (0.0%) | 0 (0.0%) |
| 20 to 34 years | 30 (100.0%) | 0 (0.0%) |
| 35 to 50 years | 0 (0.0%) | 0 (0.0%) |
| Total | 30 (100.0%) | 0 (0.0%) |
Fertility by Education in Morrill
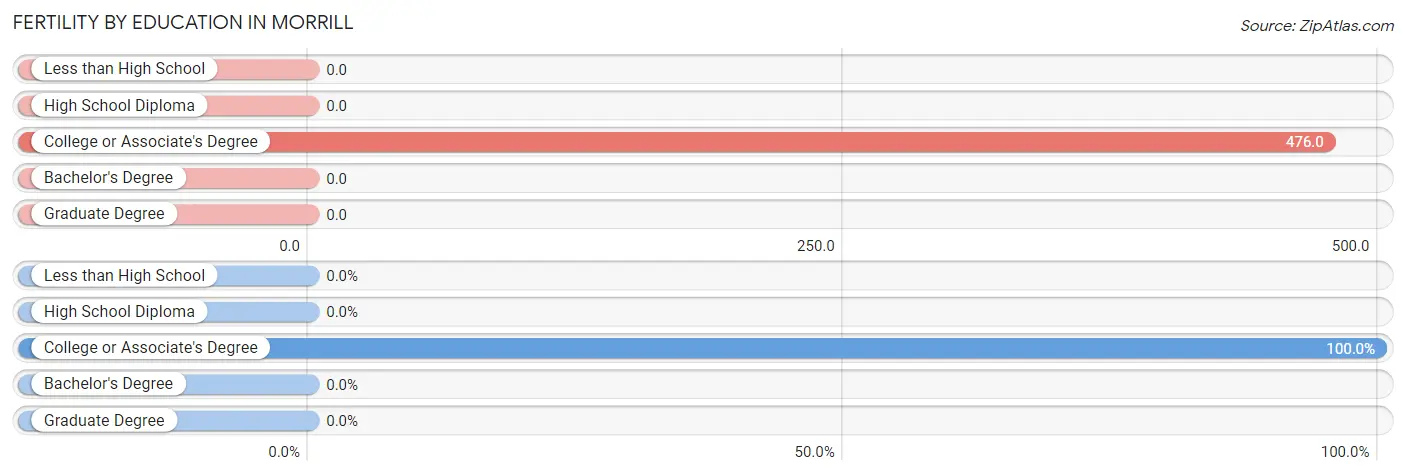
| Educational Attainment | Women with Births | Births / 1,000 Women |
| Less than High School | 0 (0.0%) | 0.0 |
| High School Diploma | 0 (0.0%) | 0.0 |
| College or Associate's Degree | 30 (100.0%) | 476.0 |
| Bachelor's Degree | 0 (0.0%) | 0.0 |
| Graduate Degree | 0 (0.0%) | 0.0 |
| Total | 30 (100.0%) | 213.0 |
Fertility by Education by Marriage Status in Morrill
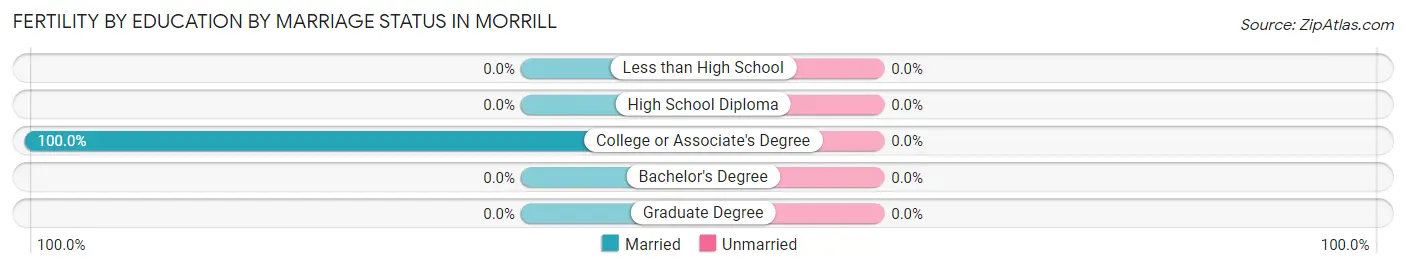
| Educational Attainment | Married | Unmarried |
| Less than High School | 0 (0.0%) | 0 (0.0%) |
| High School Diploma | 0 (0.0%) | 0 (0.0%) |
| College or Associate's Degree | 30 (100.0%) | 0 (0.0%) |
| Bachelor's Degree | 0 (0.0%) | 0 (0.0%) |
| Graduate Degree | 0 (0.0%) | 0 (0.0%) |
| Total | 30 (100.0%) | 0 (0.0%) |
Employment Characteristics in Morrill
Employment by Class of Employer in Morrill
Among the 329 employed individuals in Morrill, private company employees (190 | 57.8%), local government employees (52 | 15.8%), and self-employed (not incorporated) (32 | 9.7%) make up the most common classes of employment.
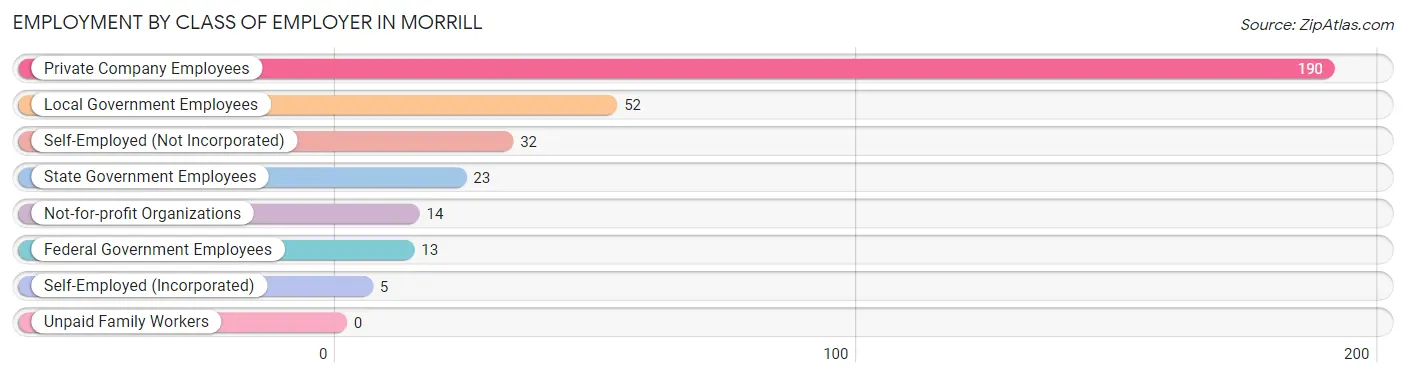
| Employer Class | # Employees | % Employees |
| Private Company Employees | 190 | 57.8% |
| Self-Employed (Incorporated) | 5 | 1.5% |
| Self-Employed (Not Incorporated) | 32 | 9.7% |
| Not-for-profit Organizations | 14 | 4.3% |
| Local Government Employees | 52 | 15.8% |
| State Government Employees | 23 | 7.0% |
| Federal Government Employees | 13 | 4.0% |
| Unpaid Family Workers | 0 | 0.0% |
| Total | 329 | 100.0% |
Employment Status by Age in Morrill
According to the labor force statistics for Morrill, out of the total population over 16 years of age (634), 56.2% or 356 individuals are in the labor force, with 4.2% or 15 of them unemployed. The age group with the highest labor force participation rate is 20 to 24 years, with 100.0% or 26 individuals in the labor force. Within the labor force, the 25 to 29 years age range has the highest percentage of unemployed individuals, with 54.2% or 13 of them being unemployed.
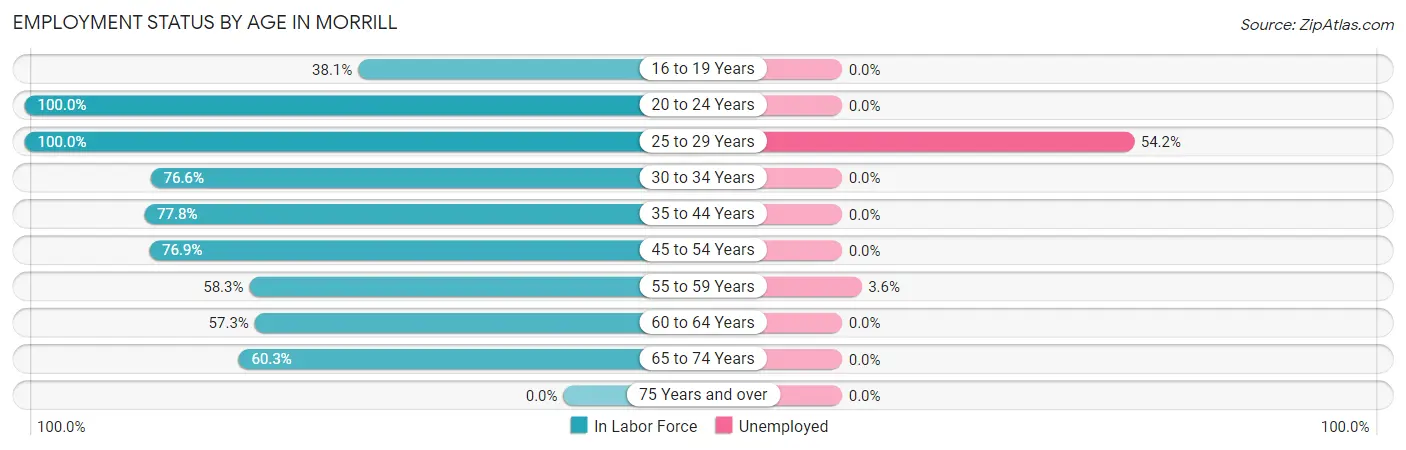
| Age Bracket | In Labor Force | Unemployed |
| 16 to 19 Years | 16 (38.1%) | 0 (0.0%) |
| 20 to 24 Years | 26 (100.0%) | 0 (0.0%) |
| 25 to 29 Years | 24 (100.0%) | 13 (54.2%) |
| 30 to 34 Years | 59 (76.6%) | 0 (0.0%) |
| 35 to 44 Years | 56 (77.8%) | 0 (0.0%) |
| 45 to 54 Years | 30 (76.9%) | 0 (0.0%) |
| 55 to 59 Years | 56 (58.3%) | 2 (3.6%) |
| 60 to 64 Years | 51 (57.3%) | 0 (0.0%) |
| 65 to 74 Years | 38 (60.3%) | 0 (0.0%) |
| 75 Years and over | 0 (0.0%) | 0 (0.0%) |
| Total | 356 (56.2%) | 15 (4.2%) |
Employment Status by Educational Attainment in Morrill
According to labor force statistics for Morrill, 69.5% of individuals (276) out of the total population between 25 and 64 years of age (397) are in the labor force, with 5.4% or 15 of them being unemployed. The group with the highest labor force participation rate are those with the educational attainment of less than high school, with 100.0% or 26 individuals in the labor force. Within the labor force, individuals with less than high school education have the highest percentage of unemployment, with 50.0% or 13 of them being unemployed.
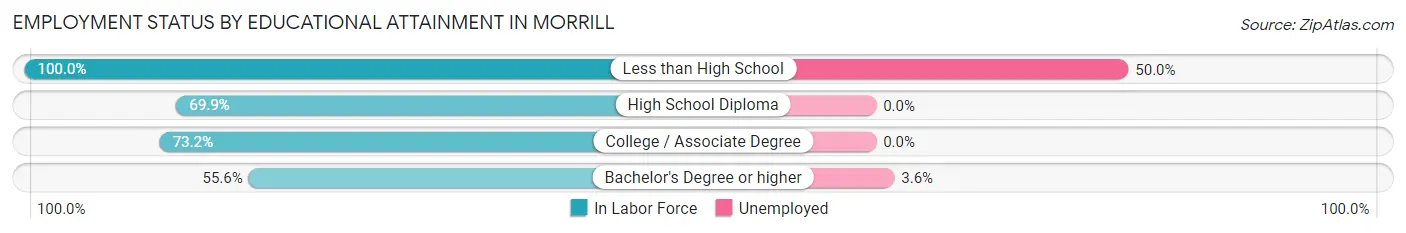
| Educational Attainment | In Labor Force | Unemployed |
| Less than High School | 26 (100.0%) | 13 (50.0%) |
| High School Diploma | 86 (69.9%) | 0 (0.0%) |
| College / Associate Degree | 109 (73.2%) | 0 (0.0%) |
| Bachelor's Degree or higher | 55 (55.6%) | 4 (3.6%) |
| Total | 276 (69.5%) | 21 (5.4%) |
Employment Occupations by Sex in Morrill
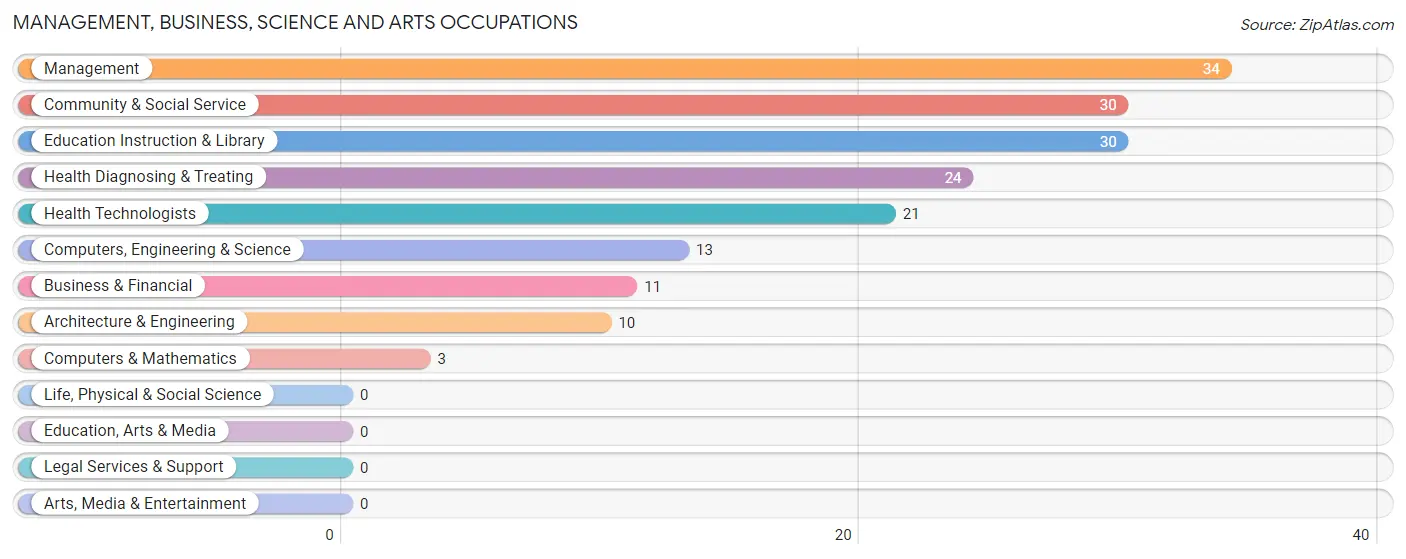
Management, Business, Science and Arts Occupations
The most common Management, Business, Science and Arts occupations in Morrill are Management (34 | 10.0%), Community & Social Service (30 | 8.8%), Education Instruction & Library (30 | 8.8%), Health Diagnosing & Treating (24 | 7.0%), and Health Technologists (21 | 6.2%).
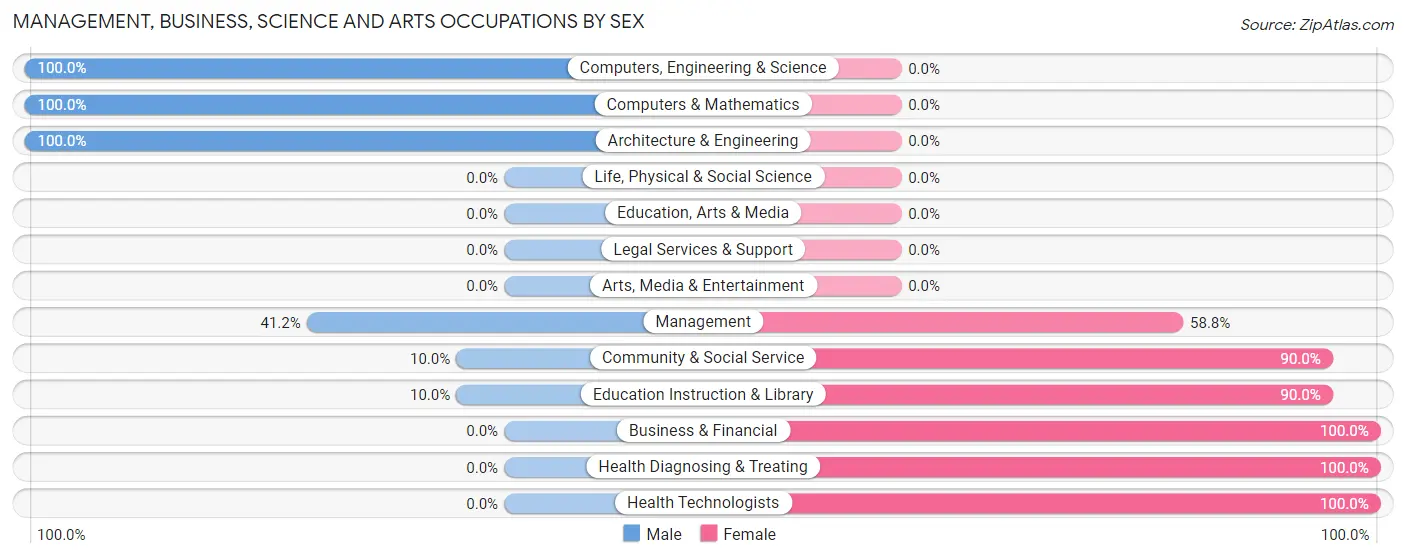
Management, Business, Science and Arts Occupations by Sex
Within the Management, Business, Science and Arts occupations in Morrill, the most male-oriented occupations are Computers, Engineering & Science (100.0%), Computers & Mathematics (100.0%), and Architecture & Engineering (100.0%), while the most female-oriented occupations are Business & Financial (100.0%), Health Diagnosing & Treating (100.0%), and Health Technologists (100.0%).
| Occupation | Male | Female |
| Management | 14 (41.2%) | 20 (58.8%) |
| Business & Financial | 0 (0.0%) | 11 (100.0%) |
| Computers, Engineering & Science | 13 (100.0%) | 0 (0.0%) |
| Computers & Mathematics | 3 (100.0%) | 0 (0.0%) |
| Architecture & Engineering | 10 (100.0%) | 0 (0.0%) |
| Life, Physical & Social Science | 0 (0.0%) | 0 (0.0%) |
| Community & Social Service | 3 (10.0%) | 27 (90.0%) |
| Education, Arts & Media | 0 (0.0%) | 0 (0.0%) |
| Legal Services & Support | 0 (0.0%) | 0 (0.0%) |
| Education Instruction & Library | 3 (10.0%) | 27 (90.0%) |
| Arts, Media & Entertainment | 0 (0.0%) | 0 (0.0%) |
| Health Diagnosing & Treating | 0 (0.0%) | 24 (100.0%) |
| Health Technologists | 0 (0.0%) | 21 (100.0%) |
| Total (Category) | 30 (26.8%) | 82 (73.2%) |
| Total (Overall) | 157 (46.0%) | 184 (54.0%) |
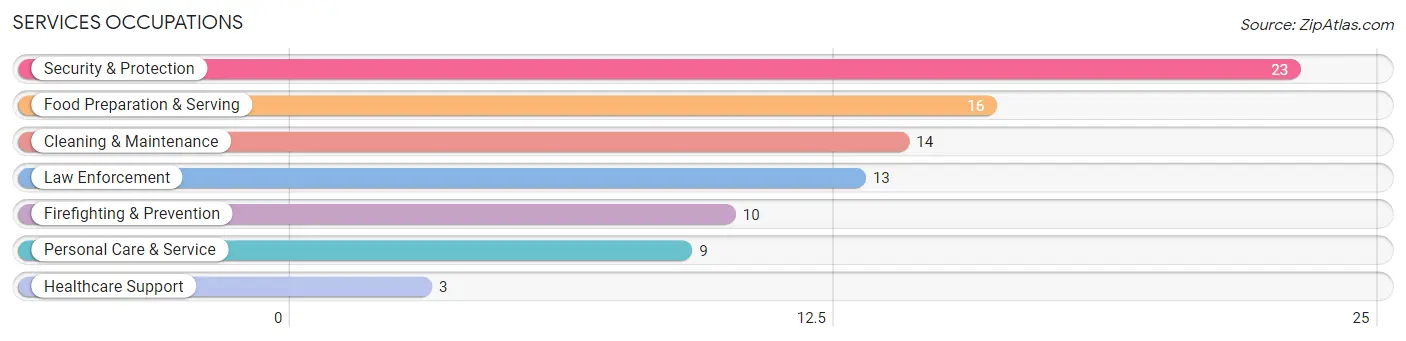
Services Occupations
The most common Services occupations in Morrill are Security & Protection (23 | 6.7%), Food Preparation & Serving (16 | 4.7%), Cleaning & Maintenance (14 | 4.1%), Law Enforcement (13 | 3.8%), and Firefighting & Prevention (10 | 2.9%).
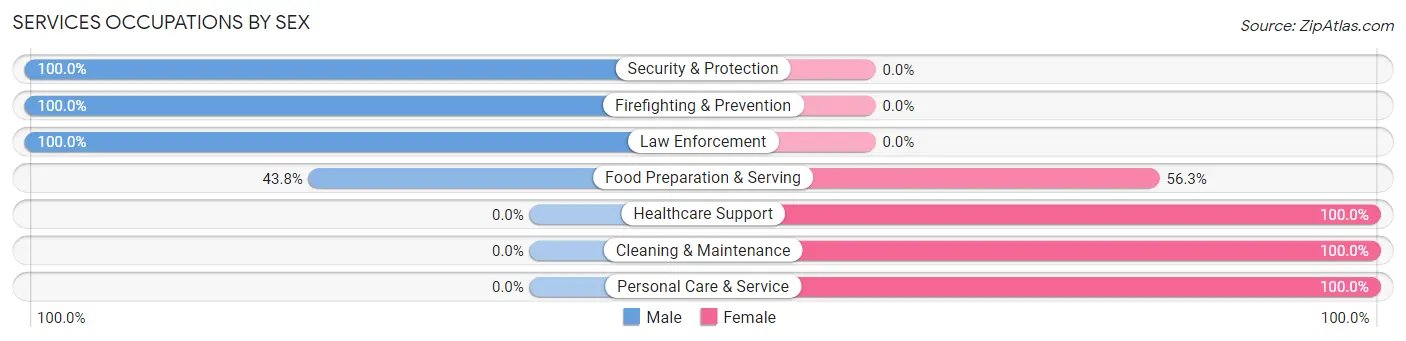
Services Occupations by Sex
Within the Services occupations in Morrill, the most male-oriented occupations are Security & Protection (100.0%), Firefighting & Prevention (100.0%), and Law Enforcement (100.0%), while the most female-oriented occupations are Healthcare Support (100.0%), Cleaning & Maintenance (100.0%), and Personal Care & Service (100.0%).
| Occupation | Male | Female |
| Healthcare Support | 0 (0.0%) | 3 (100.0%) |
| Security & Protection | 23 (100.0%) | 0 (0.0%) |
| Firefighting & Prevention | 10 (100.0%) | 0 (0.0%) |
| Law Enforcement | 13 (100.0%) | 0 (0.0%) |
| Food Preparation & Serving | 7 (43.8%) | 9 (56.2%) |
| Cleaning & Maintenance | 0 (0.0%) | 14 (100.0%) |
| Personal Care & Service | 0 (0.0%) | 9 (100.0%) |
| Total (Category) | 30 (46.2%) | 35 (53.8%) |
| Total (Overall) | 157 (46.0%) | 184 (54.0%) |
Sales and Office Occupations
The most common Sales and Office occupations in Morrill are Sales & Related (56 | 16.4%), and Office & Administration (20 | 5.9%).
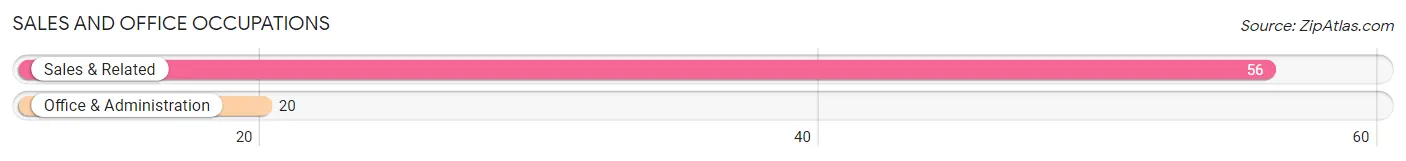
Sales and Office Occupations by Sex
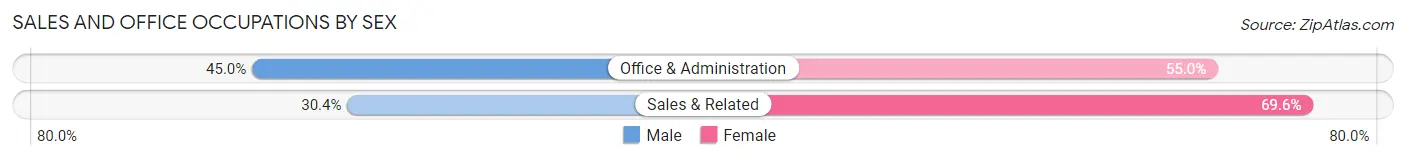
| Occupation | Male | Female |
| Sales & Related | 17 (30.4%) | 39 (69.6%) |
| Office & Administration | 9 (45.0%) | 11 (55.0%) |
| Total (Category) | 26 (34.2%) | 50 (65.8%) |
| Total (Overall) | 157 (46.0%) | 184 (54.0%) |
Natural Resources, Construction and Maintenance Occupations
The most common Natural Resources, Construction and Maintenance occupations in Morrill are Construction & Extraction (15 | 4.4%), and Installation, Maintenance & Repair (13 | 3.8%).
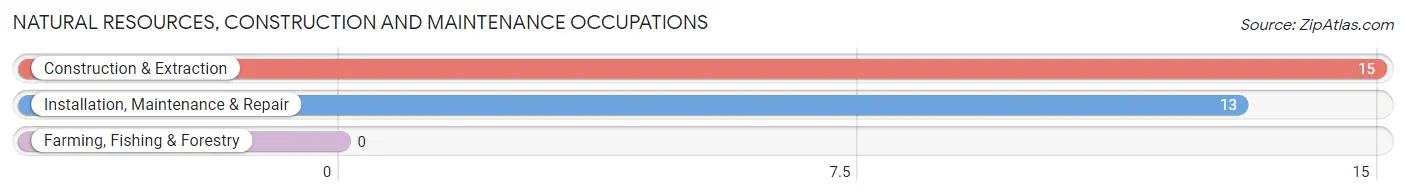
Natural Resources, Construction and Maintenance Occupations by Sex
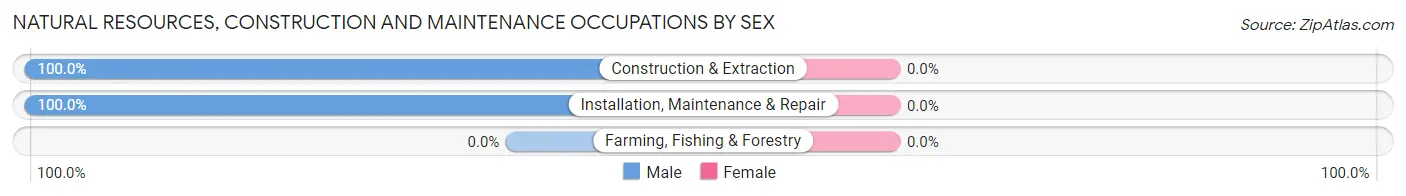
| Occupation | Male | Female |
| Farming, Fishing & Forestry | 0 (0.0%) | 0 (0.0%) |
| Construction & Extraction | 15 (100.0%) | 0 (0.0%) |
| Installation, Maintenance & Repair | 13 (100.0%) | 0 (0.0%) |
| Total (Category) | 28 (100.0%) | 0 (0.0%) |
| Total (Overall) | 157 (46.0%) | 184 (54.0%) |
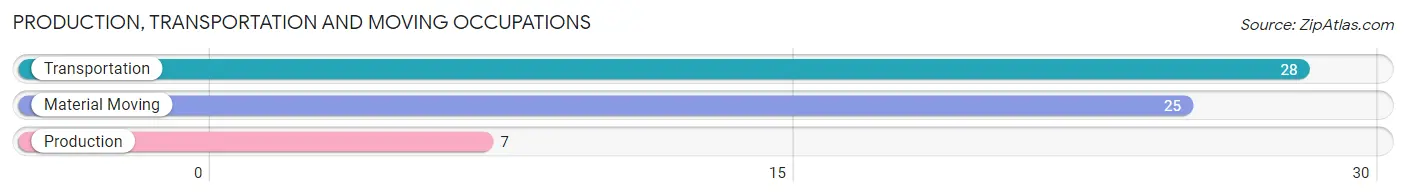
Production, Transportation and Moving Occupations
The most common Production, Transportation and Moving occupations in Morrill are Transportation (28 | 8.2%), Material Moving (25 | 7.3%), and Production (7 | 2.1%).
Production, Transportation and Moving Occupations by Sex
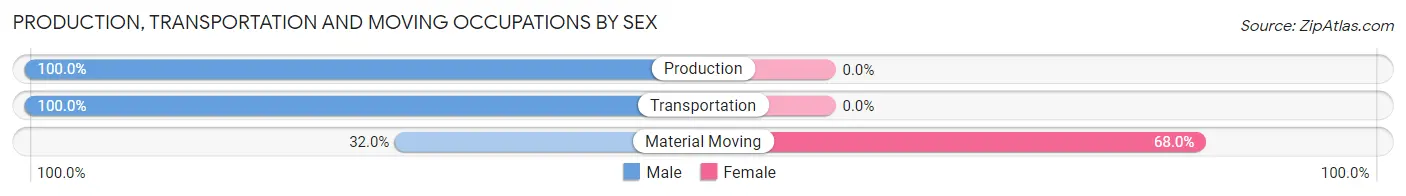
| Occupation | Male | Female |
| Production | 7 (100.0%) | 0 (0.0%) |
| Transportation | 28 (100.0%) | 0 (0.0%) |
| Material Moving | 8 (32.0%) | 17 (68.0%) |
| Total (Category) | 43 (71.7%) | 17 (28.3%) |
| Total (Overall) | 157 (46.0%) | 184 (54.0%) |
Employment Industries by Sex in Morrill
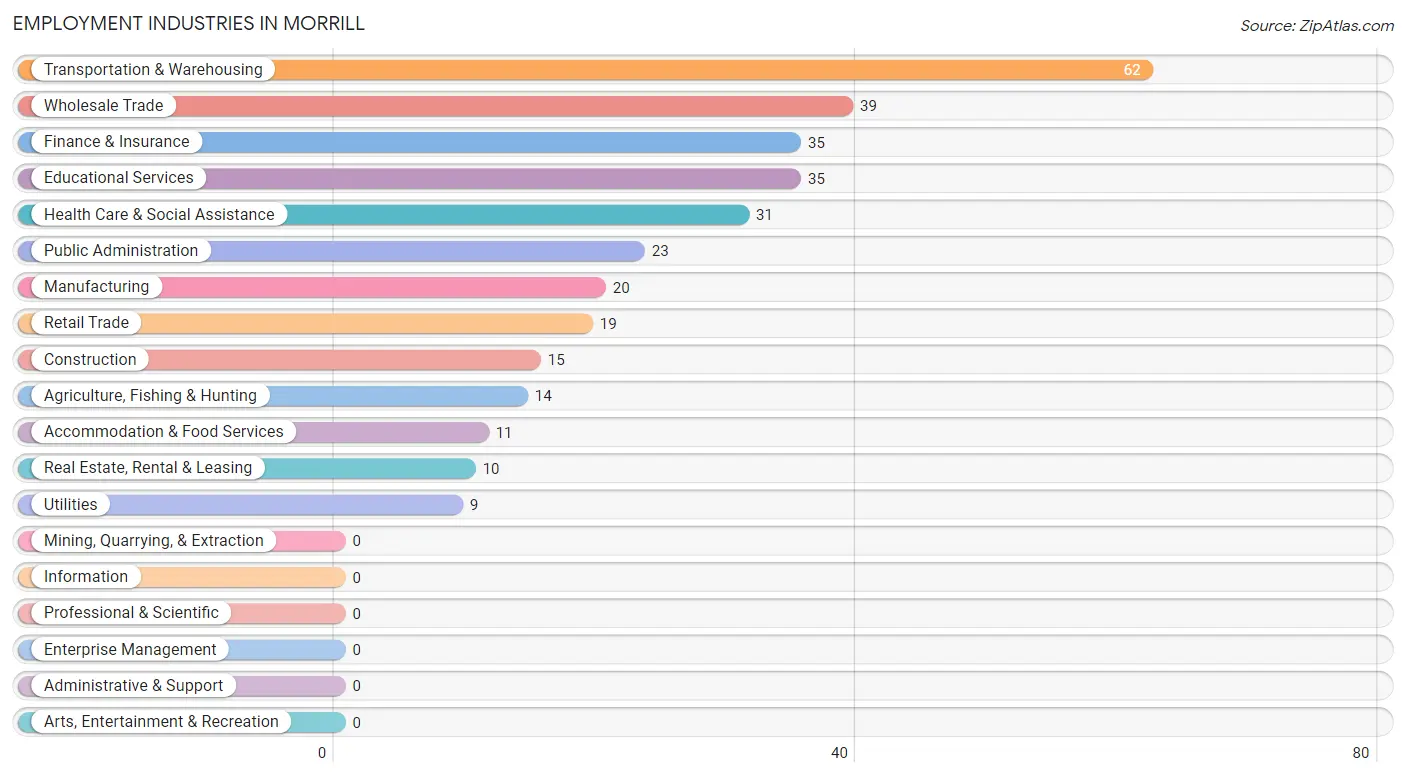
Employment Industries in Morrill
The major employment industries in Morrill include Transportation & Warehousing (62 | 18.2%), Wholesale Trade (39 | 11.4%), Finance & Insurance (35 | 10.3%), Educational Services (35 | 10.3%), and Health Care & Social Assistance (31 | 9.1%).
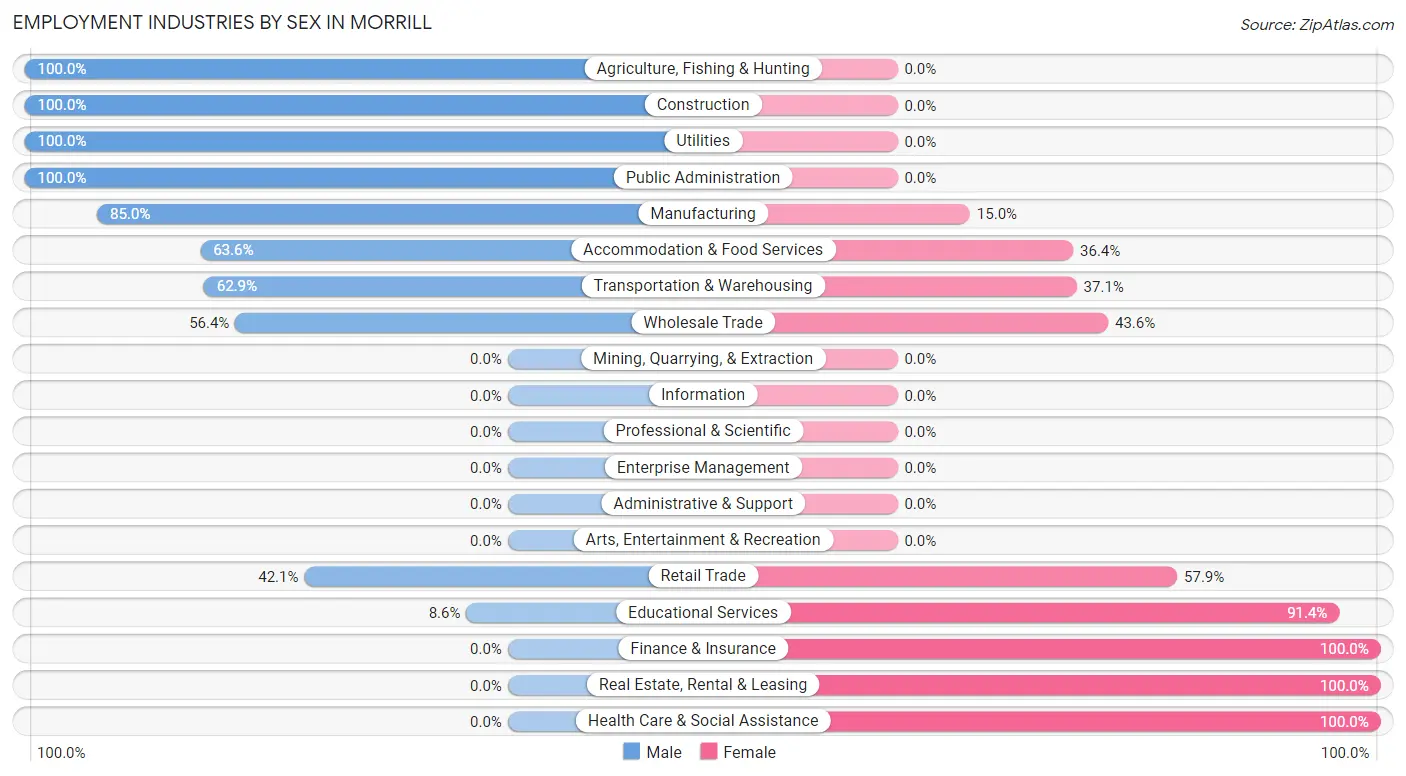
Employment Industries by Sex in Morrill
The Morrill industries that see more men than women are Agriculture, Fishing & Hunting (100.0%), Construction (100.0%), and Utilities (100.0%), whereas the industries that tend to have a higher number of women are Finance & Insurance (100.0%), Real Estate, Rental & Leasing (100.0%), and Health Care & Social Assistance (100.0%).
| Industry | Male | Female |
| Agriculture, Fishing & Hunting | 14 (100.0%) | 0 (0.0%) |
| Mining, Quarrying, & Extraction | 0 (0.0%) | 0 (0.0%) |
| Construction | 15 (100.0%) | 0 (0.0%) |
| Manufacturing | 17 (85.0%) | 3 (15.0%) |
| Wholesale Trade | 22 (56.4%) | 17 (43.6%) |
| Retail Trade | 8 (42.1%) | 11 (57.9%) |
| Transportation & Warehousing | 39 (62.9%) | 23 (37.1%) |
| Utilities | 9 (100.0%) | 0 (0.0%) |
| Information | 0 (0.0%) | 0 (0.0%) |
| Finance & Insurance | 0 (0.0%) | 35 (100.0%) |
| Real Estate, Rental & Leasing | 0 (0.0%) | 10 (100.0%) |
| Professional & Scientific | 0 (0.0%) | 0 (0.0%) |
| Enterprise Management | 0 (0.0%) | 0 (0.0%) |
| Administrative & Support | 0 (0.0%) | 0 (0.0%) |
| Educational Services | 3 (8.6%) | 32 (91.4%) |
| Health Care & Social Assistance | 0 (0.0%) | 31 (100.0%) |
| Arts, Entertainment & Recreation | 0 (0.0%) | 0 (0.0%) |
| Accommodation & Food Services | 7 (63.6%) | 4 (36.4%) |
| Public Administration | 23 (100.0%) | 0 (0.0%) |
| Total | 157 (46.0%) | 184 (54.0%) |
Education in Morrill
School Enrollment in Morrill
The most common levels of schooling among the 154 students in Morrill are high school (58 | 37.7%), elementary school (38 | 24.7%), and nursery / preschool (30 | 19.5%).
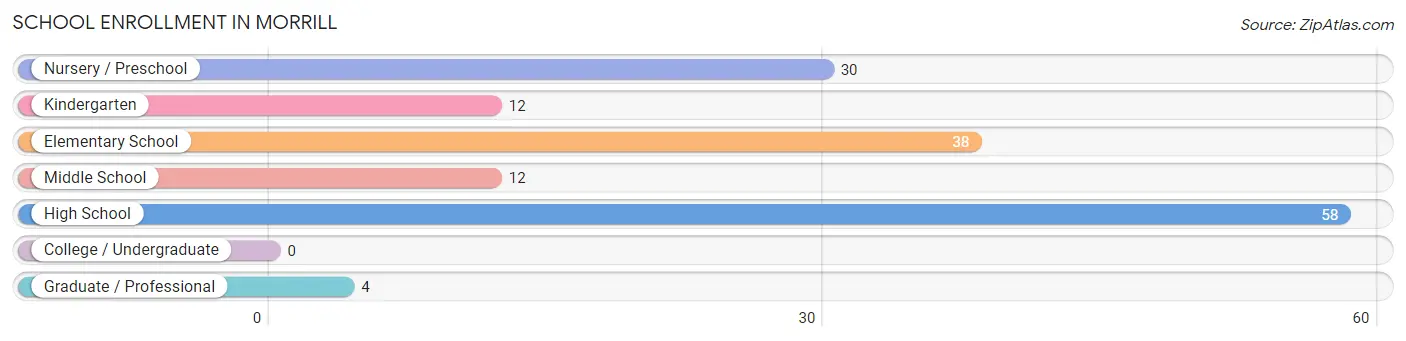
| School Level | # Students | % Students |
| Nursery / Preschool | 30 | 19.5% |
| Kindergarten | 12 | 7.8% |
| Elementary School | 38 | 24.7% |
| Middle School | 12 | 7.8% |
| High School | 58 | 37.7% |
| College / Undergraduate | 0 | 0.0% |
| Graduate / Professional | 4 | 2.6% |
| Total | 154 | 100.0% |
School Enrollment by Age by Funding Source in Morrill
Out of a total of 154 students who are enrolled in schools in Morrill, 12 (7.8%) attend a private institution, while the remaining 142 (92.2%) are enrolled in public schools. The age group of 5 to 9 year old has the highest likelihood of being enrolled in private schools, with 12 (20.3% in the age bracket) enrolled. Conversely, the age group of 3 to 4 year olds has the lowest likelihood of being enrolled in a private school, with 21 (100.0% in the age bracket) attending a public institution.
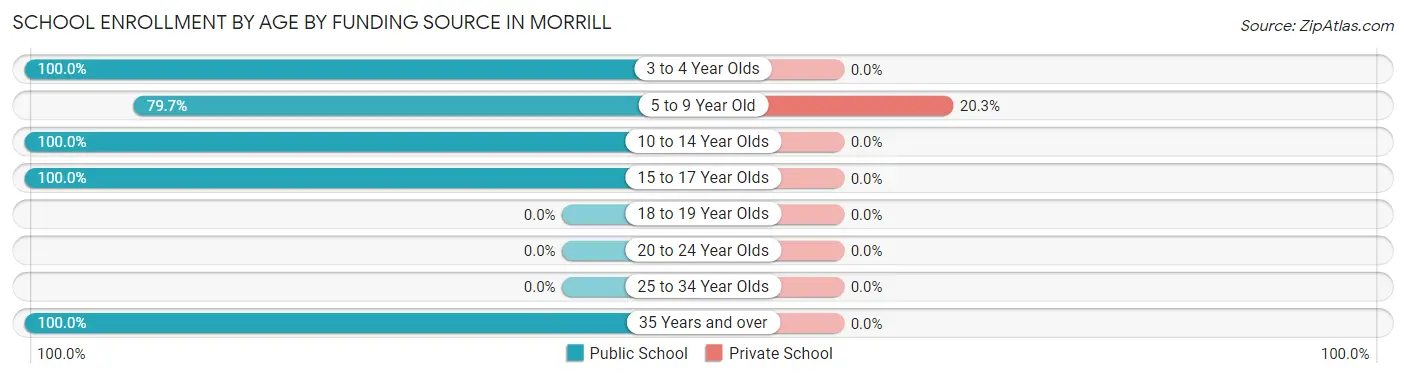
| Age Bracket | Public School | Private School |
| 3 to 4 Year Olds | 21 (100.0%) | 0 (0.0%) |
| 5 to 9 Year Old | 47 (79.7%) | 12 (20.3%) |
| 10 to 14 Year Olds | 12 (100.0%) | 0 (0.0%) |
| 15 to 17 Year Olds | 58 (100.0%) | 0 (0.0%) |
| 18 to 19 Year Olds | 0 (0.0%) | 0 (0.0%) |
| 20 to 24 Year Olds | 0 (0.0%) | 0 (0.0%) |
| 25 to 34 Year Olds | 0 (0.0%) | 0 (0.0%) |
| 35 Years and over | 4 (100.0%) | 0 (0.0%) |
| Total | 142 (92.2%) | 12 (7.8%) |
Educational Attainment by Field of Study in Morrill
Bio, nature & agricultural (49 | 32.0%), science & technology (22 | 14.4%), business (17 | 11.1%), physical & health sciences (14 | 9.1%), and liberal arts & history (11 | 7.2%) are the most common fields of study among 153 individuals in Morrill who have obtained a bachelor's degree or higher.
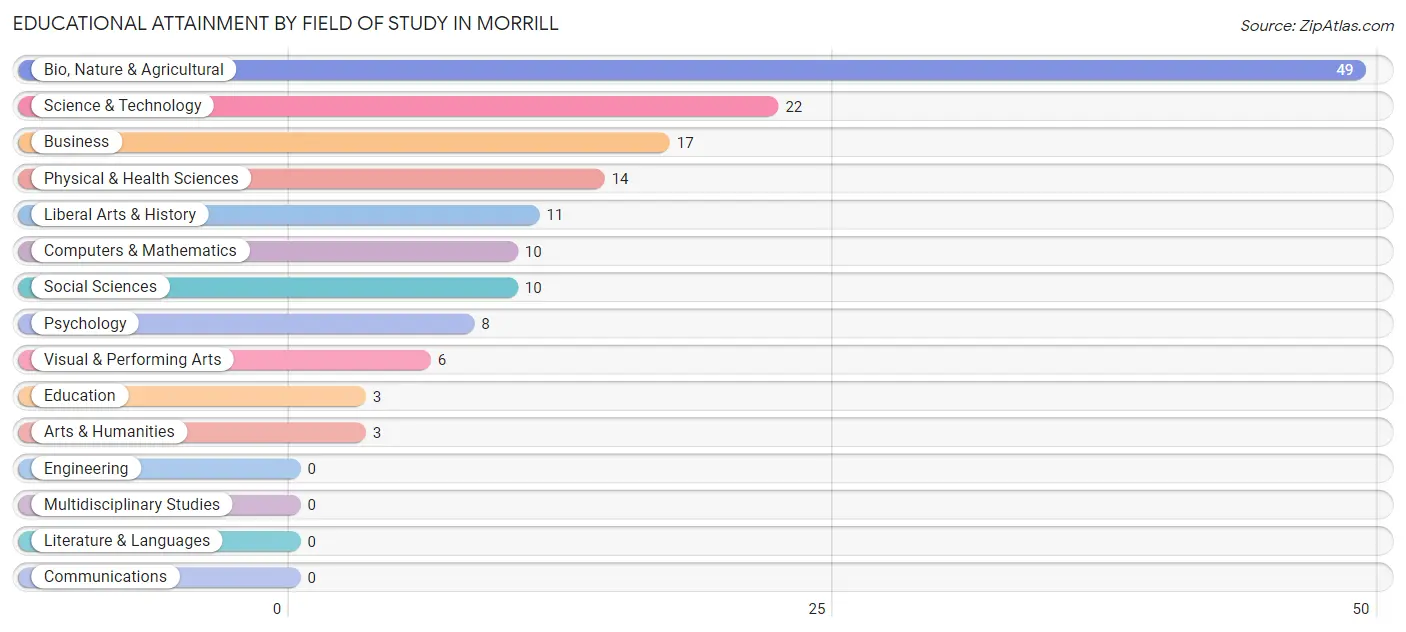
| Field of Study | # Graduates | % Graduates |
| Computers & Mathematics | 10 | 6.5% |
| Bio, Nature & Agricultural | 49 | 32.0% |
| Physical & Health Sciences | 14 | 9.1% |
| Psychology | 8 | 5.2% |
| Social Sciences | 10 | 6.5% |
| Engineering | 0 | 0.0% |
| Multidisciplinary Studies | 0 | 0.0% |
| Science & Technology | 22 | 14.4% |
| Business | 17 | 11.1% |
| Education | 3 | 2.0% |
| Literature & Languages | 0 | 0.0% |
| Liberal Arts & History | 11 | 7.2% |
| Visual & Performing Arts | 6 | 3.9% |
| Communications | 0 | 0.0% |
| Arts & Humanities | 3 | 2.0% |
| Total | 153 | 100.0% |
Transportation & Commute in Morrill
Vehicle Availability by Sex in Morrill
The most prevalent vehicle ownership categories in Morrill are males with 2 vehicles (72, accounting for 45.9%) and females with 2 vehicles (81, making up 41.9%).
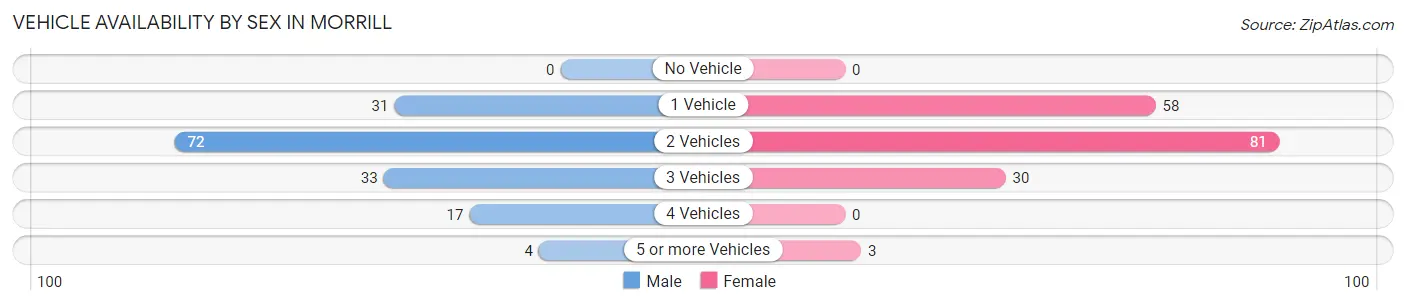
| Vehicles Available | Male | Female |
| No Vehicle | 0 (0.0%) | 0 (0.0%) |
| 1 Vehicle | 31 (19.8%) | 58 (33.7%) |
| 2 Vehicles | 72 (45.9%) | 81 (47.1%) |
| 3 Vehicles | 33 (21.0%) | 30 (17.4%) |
| 4 Vehicles | 17 (10.8%) | 0 (0.0%) |
| 5 or more Vehicles | 4 (2.5%) | 3 (1.7%) |
| Total | 157 (100.0%) | 172 (100.0%) |
Commute Time in Morrill
The most frequently occuring commute durations in Morrill are 20 to 24 minutes (73 commuters, 23.5%), 15 to 19 minutes (62 commuters, 20.0%), and less than 5 minutes (47 commuters, 15.2%).
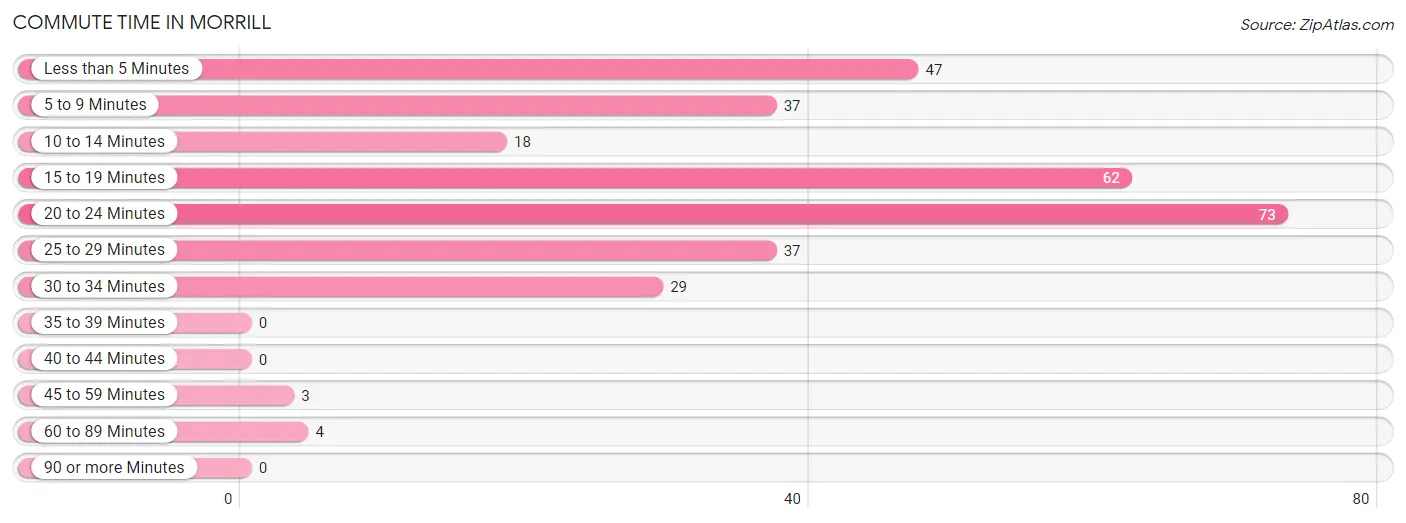
| Commute Time | # Commuters | % Commuters |
| Less than 5 Minutes | 47 | 15.2% |
| 5 to 9 Minutes | 37 | 11.9% |
| 10 to 14 Minutes | 18 | 5.8% |
| 15 to 19 Minutes | 62 | 20.0% |
| 20 to 24 Minutes | 73 | 23.5% |
| 25 to 29 Minutes | 37 | 11.9% |
| 30 to 34 Minutes | 29 | 9.3% |
| 35 to 39 Minutes | 0 | 0.0% |
| 40 to 44 Minutes | 0 | 0.0% |
| 45 to 59 Minutes | 3 | 1.0% |
| 60 to 89 Minutes | 4 | 1.3% |
| 90 or more Minutes | 0 | 0.0% |
Commute Time by Sex in Morrill
The most common commute times in Morrill are 20 to 24 minutes (46 commuters, 29.3%) for males and 15 to 19 minutes (42 commuters, 27.5%) for females.
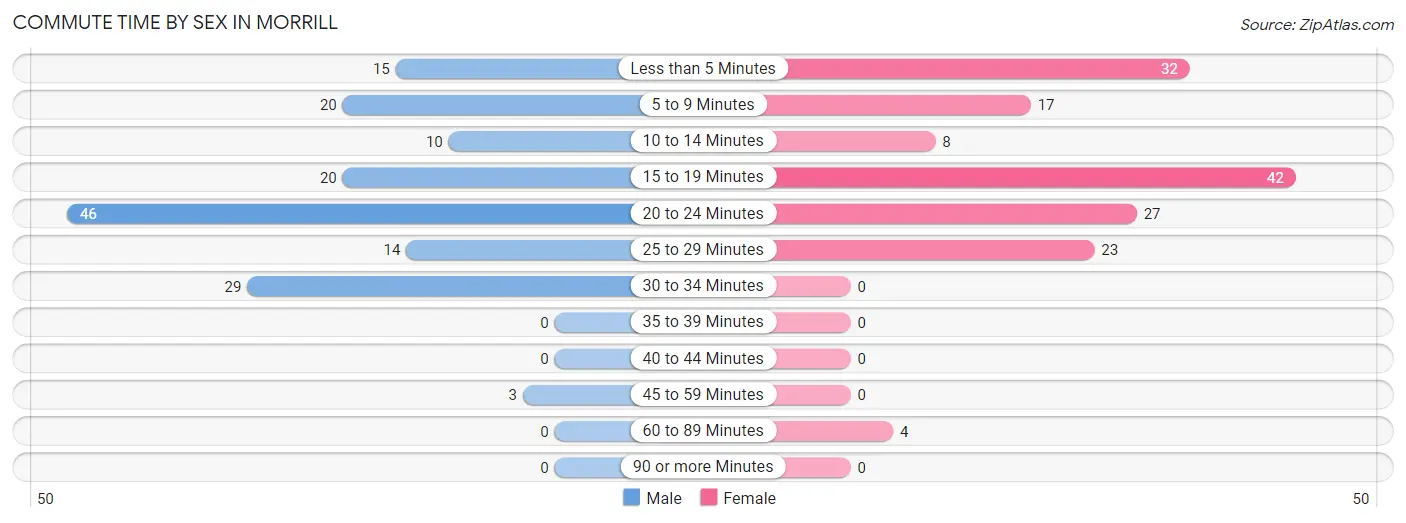
| Commute Time | Male | Female |
| Less than 5 Minutes | 15 (9.6%) | 32 (20.9%) |
| 5 to 9 Minutes | 20 (12.7%) | 17 (11.1%) |
| 10 to 14 Minutes | 10 (6.4%) | 8 (5.2%) |
| 15 to 19 Minutes | 20 (12.7%) | 42 (27.5%) |
| 20 to 24 Minutes | 46 (29.3%) | 27 (17.6%) |
| 25 to 29 Minutes | 14 (8.9%) | 23 (15.0%) |
| 30 to 34 Minutes | 29 (18.5%) | 0 (0.0%) |
| 35 to 39 Minutes | 0 (0.0%) | 0 (0.0%) |
| 40 to 44 Minutes | 0 (0.0%) | 0 (0.0%) |
| 45 to 59 Minutes | 3 (1.9%) | 0 (0.0%) |
| 60 to 89 Minutes | 0 (0.0%) | 4 (2.6%) |
| 90 or more Minutes | 0 (0.0%) | 0 (0.0%) |
Time of Departure to Work by Sex in Morrill
The most frequent times of departure to work in Morrill are 6:30 AM to 6:59 AM (38, 24.2%) for males and 7:00 AM to 7:29 AM (48, 31.4%) for females.
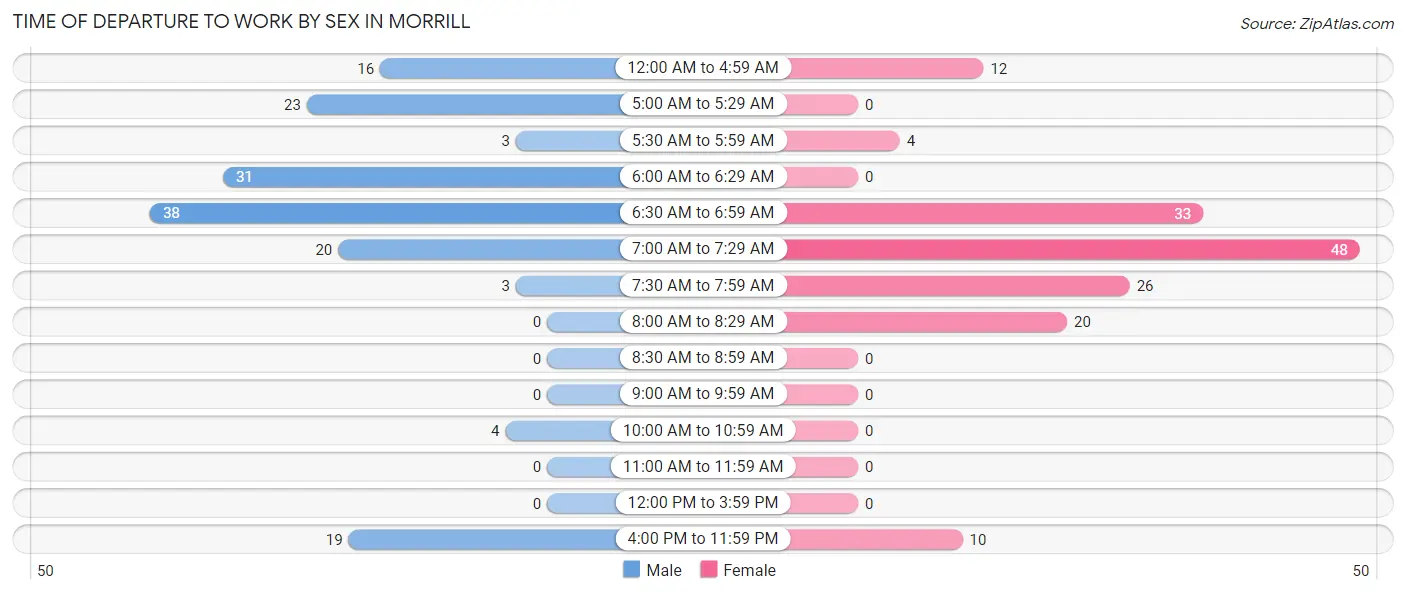
| Time of Departure | Male | Female |
| 12:00 AM to 4:59 AM | 16 (10.2%) | 12 (7.8%) |
| 5:00 AM to 5:29 AM | 23 (14.6%) | 0 (0.0%) |
| 5:30 AM to 5:59 AM | 3 (1.9%) | 4 (2.6%) |
| 6:00 AM to 6:29 AM | 31 (19.8%) | 0 (0.0%) |
| 6:30 AM to 6:59 AM | 38 (24.2%) | 33 (21.6%) |
| 7:00 AM to 7:29 AM | 20 (12.7%) | 48 (31.4%) |
| 7:30 AM to 7:59 AM | 3 (1.9%) | 26 (17.0%) |
| 8:00 AM to 8:29 AM | 0 (0.0%) | 20 (13.1%) |
| 8:30 AM to 8:59 AM | 0 (0.0%) | 0 (0.0%) |
| 9:00 AM to 9:59 AM | 0 (0.0%) | 0 (0.0%) |
| 10:00 AM to 10:59 AM | 4 (2.5%) | 0 (0.0%) |
| 11:00 AM to 11:59 AM | 0 (0.0%) | 0 (0.0%) |
| 12:00 PM to 3:59 PM | 0 (0.0%) | 0 (0.0%) |
| 4:00 PM to 11:59 PM | 19 (12.1%) | 10 (6.5%) |
| Total | 157 (100.0%) | 153 (100.0%) |
Housing Occupancy in Morrill
Occupancy by Ownership in Morrill
Of the total 423 dwellings in Morrill, owner-occupied units account for 278 (65.7%), while renter-occupied units make up 145 (34.3%).
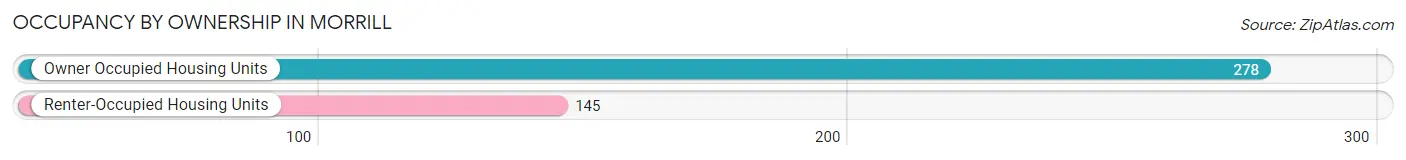
| Occupancy | # Housing Units | % Housing Units |
| Owner Occupied Housing Units | 278 | 65.7% |
| Renter-Occupied Housing Units | 145 | 34.3% |
| Total Occupied Housing Units | 423 | 100.0% |
Occupancy by Household Size in Morrill
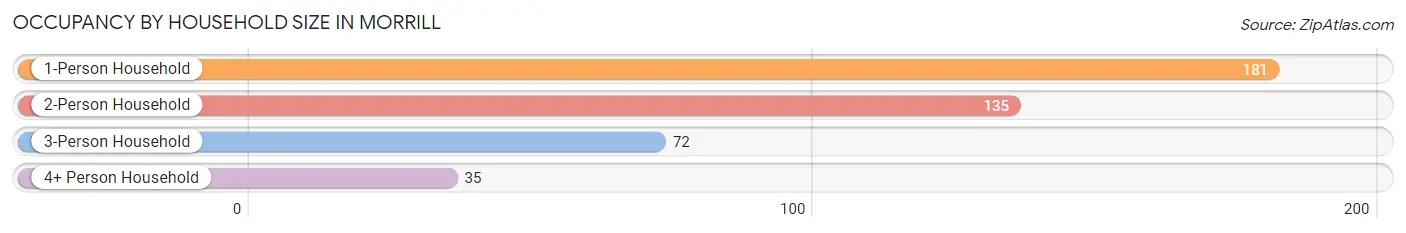
| Household Size | # Housing Units | % Housing Units |
| 1-Person Household | 181 | 42.8% |
| 2-Person Household | 135 | 31.9% |
| 3-Person Household | 72 | 17.0% |
| 4+ Person Household | 35 | 8.3% |
| Total Housing Units | 423 | 100.0% |
Occupancy by Ownership by Household Size in Morrill
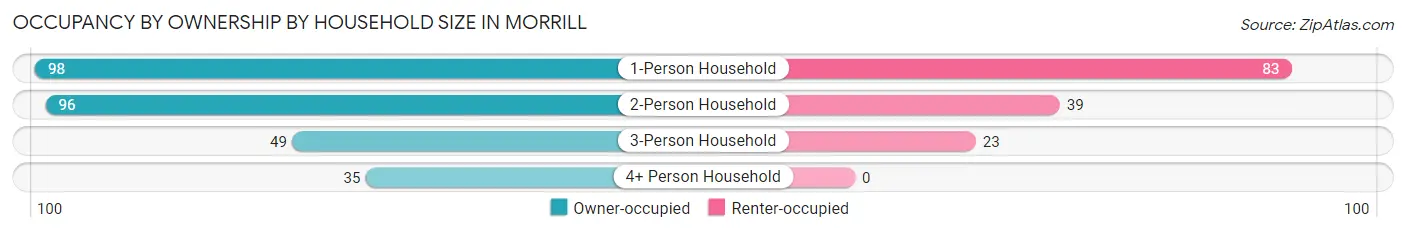
| Household Size | Owner-occupied | Renter-occupied |
| 1-Person Household | 98 (54.1%) | 83 (45.9%) |
| 2-Person Household | 96 (71.1%) | 39 (28.9%) |
| 3-Person Household | 49 (68.1%) | 23 (31.9%) |
| 4+ Person Household | 35 (100.0%) | 0 (0.0%) |
| Total Housing Units | 278 (65.7%) | 145 (34.3%) |
Occupancy by Educational Attainment in Morrill
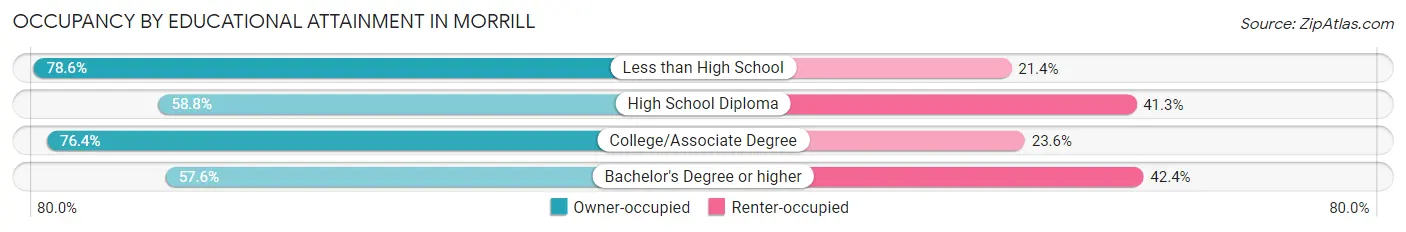
| Household Size | Owner-occupied | Renter-occupied |
| Less than High School | 11 (78.6%) | 3 (21.4%) |
| High School Diploma | 94 (58.8%) | 66 (41.2%) |
| College/Associate Degree | 120 (76.4%) | 37 (23.6%) |
| Bachelor's Degree or higher | 53 (57.6%) | 39 (42.4%) |
Occupancy by Age of Householder in Morrill
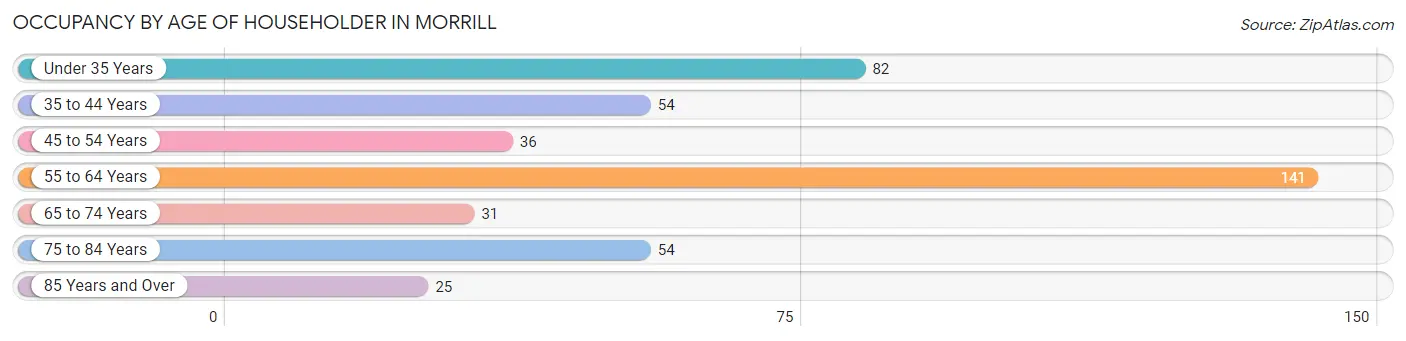
| Age Bracket | # Households | % Households |
| Under 35 Years | 82 | 19.4% |
| 35 to 44 Years | 54 | 12.8% |
| 45 to 54 Years | 36 | 8.5% |
| 55 to 64 Years | 141 | 33.3% |
| 65 to 74 Years | 31 | 7.3% |
| 75 to 84 Years | 54 | 12.8% |
| 85 Years and Over | 25 | 5.9% |
| Total | 423 | 100.0% |
Housing Finances in Morrill
Median Income by Occupancy in Morrill
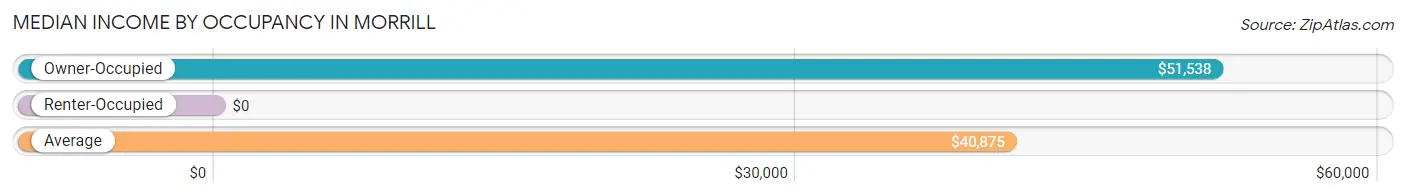
| Occupancy Type | # Households | Median Income |
| Owner-Occupied | 278 (65.7%) | $51,538 |
| Renter-Occupied | 145 (34.3%) | $0 |
| Average | 423 (100.0%) | $40,875 |
Occupancy by Householder Income Bracket in Morrill
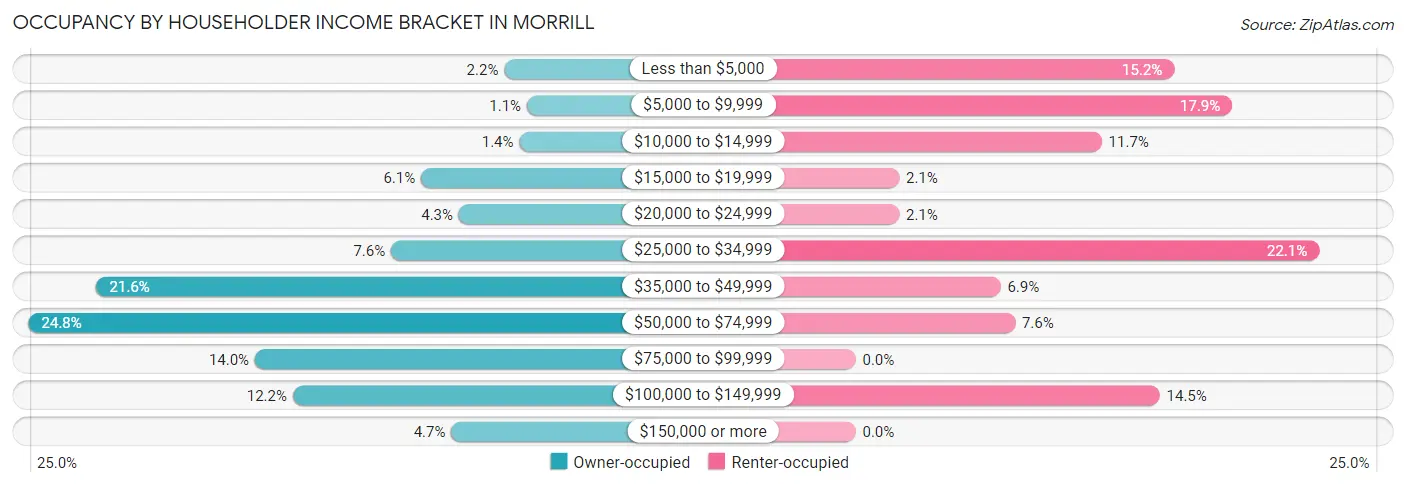
| Income Bracket | Owner-occupied | Renter-occupied |
| Less than $5,000 | 6 (2.2%) | 22 (15.2%) |
| $5,000 to $9,999 | 3 (1.1%) | 26 (17.9%) |
| $10,000 to $14,999 | 4 (1.4%) | 17 (11.7%) |
| $15,000 to $19,999 | 17 (6.1%) | 3 (2.1%) |
| $20,000 to $24,999 | 12 (4.3%) | 3 (2.1%) |
| $25,000 to $34,999 | 21 (7.5%) | 32 (22.1%) |
| $35,000 to $49,999 | 60 (21.6%) | 10 (6.9%) |
| $50,000 to $74,999 | 69 (24.8%) | 11 (7.6%) |
| $75,000 to $99,999 | 39 (14.0%) | 0 (0.0%) |
| $100,000 to $149,999 | 34 (12.2%) | 21 (14.5%) |
| $150,000 or more | 13 (4.7%) | 0 (0.0%) |
| Total | 278 (100.0%) | 145 (100.0%) |
Monthly Housing Cost Tiers in Morrill
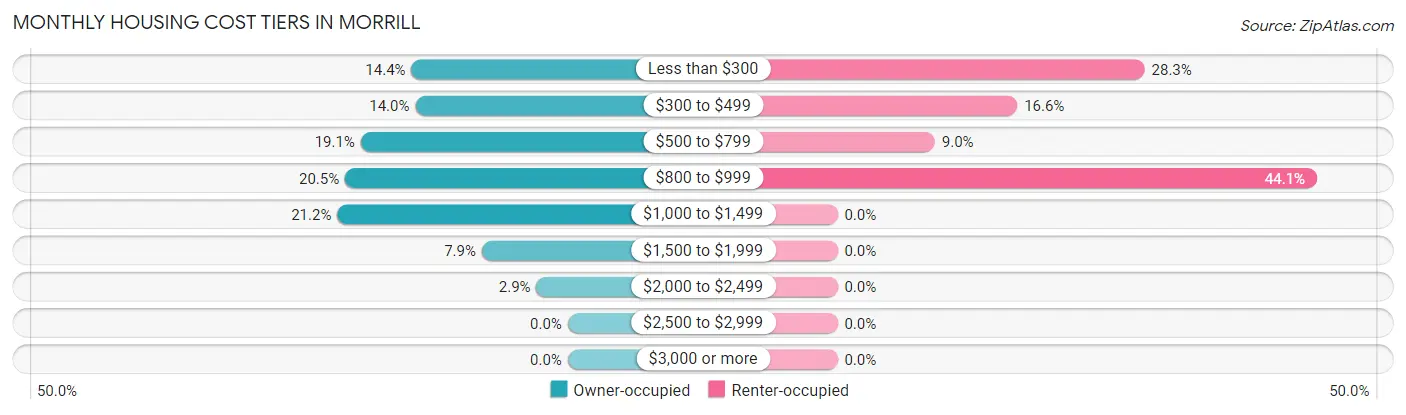
| Monthly Cost | Owner-occupied | Renter-occupied |
| Less than $300 | 40 (14.4%) | 41 (28.3%) |
| $300 to $499 | 39 (14.0%) | 24 (16.6%) |
| $500 to $799 | 53 (19.1%) | 13 (9.0%) |
| $800 to $999 | 57 (20.5%) | 64 (44.1%) |
| $1,000 to $1,499 | 59 (21.2%) | 0 (0.0%) |
| $1,500 to $1,999 | 22 (7.9%) | 0 (0.0%) |
| $2,000 to $2,499 | 8 (2.9%) | 0 (0.0%) |
| $2,500 to $2,999 | 0 (0.0%) | 0 (0.0%) |
| $3,000 or more | 0 (0.0%) | 0 (0.0%) |
| Total | 278 (100.0%) | 145 (100.0%) |
Physical Housing Characteristics in Morrill
Housing Structures in Morrill
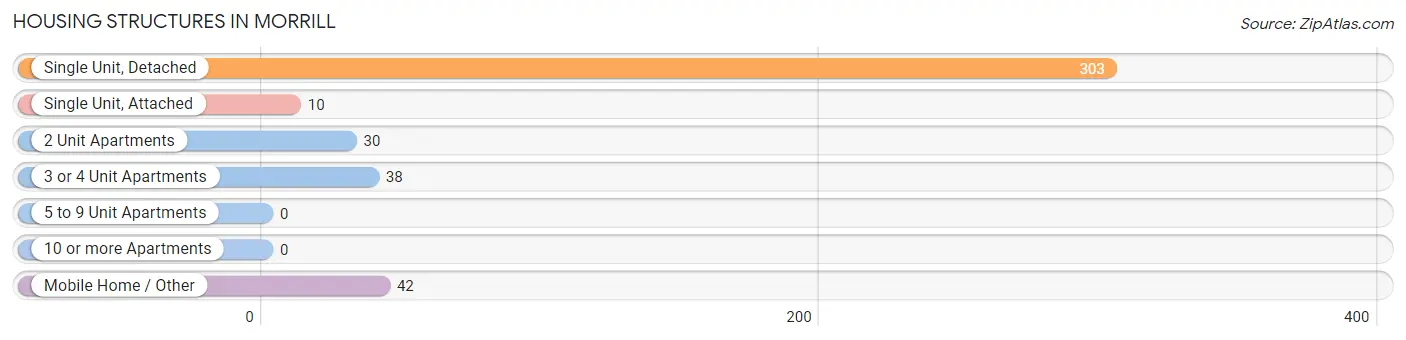
| Structure Type | # Housing Units | % Housing Units |
| Single Unit, Detached | 303 | 71.6% |
| Single Unit, Attached | 10 | 2.4% |
| 2 Unit Apartments | 30 | 7.1% |
| 3 or 4 Unit Apartments | 38 | 9.0% |
| 5 to 9 Unit Apartments | 0 | 0.0% |
| 10 or more Apartments | 0 | 0.0% |
| Mobile Home / Other | 42 | 9.9% |
| Total | 423 | 100.0% |
Housing Structures by Occupancy in Morrill
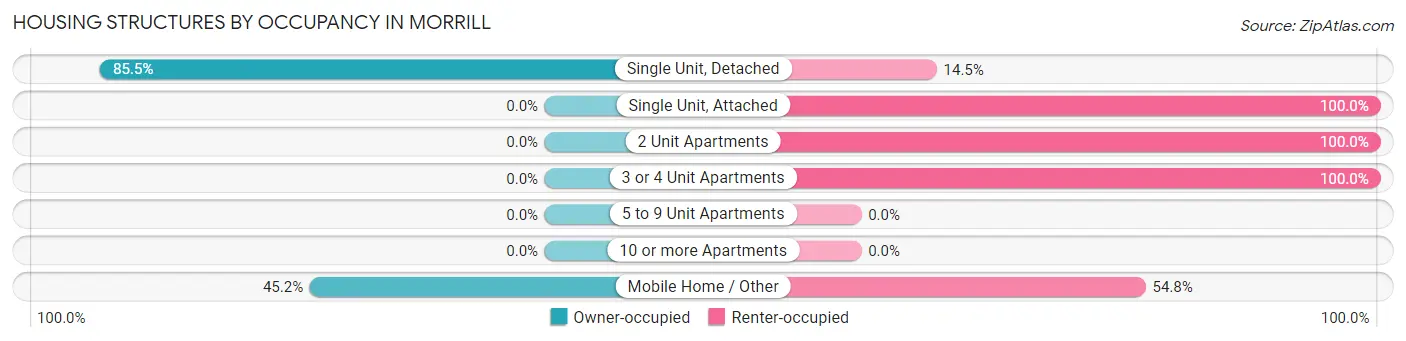
| Structure Type | Owner-occupied | Renter-occupied |
| Single Unit, Detached | 259 (85.5%) | 44 (14.5%) |
| Single Unit, Attached | 0 (0.0%) | 10 (100.0%) |
| 2 Unit Apartments | 0 (0.0%) | 30 (100.0%) |
| 3 or 4 Unit Apartments | 0 (0.0%) | 38 (100.0%) |
| 5 to 9 Unit Apartments | 0 (0.0%) | 0 (0.0%) |
| 10 or more Apartments | 0 (0.0%) | 0 (0.0%) |
| Mobile Home / Other | 19 (45.2%) | 23 (54.8%) |
| Total | 278 (65.7%) | 145 (34.3%) |
Housing Structures by Number of Rooms in Morrill
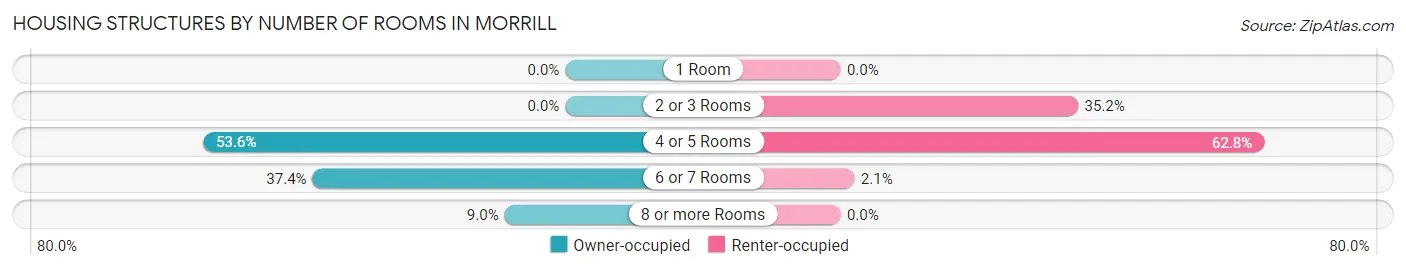
| Number of Rooms | Owner-occupied | Renter-occupied |
| 1 Room | 0 (0.0%) | 0 (0.0%) |
| 2 or 3 Rooms | 0 (0.0%) | 51 (35.2%) |
| 4 or 5 Rooms | 149 (53.6%) | 91 (62.8%) |
| 6 or 7 Rooms | 104 (37.4%) | 3 (2.1%) |
| 8 or more Rooms | 25 (9.0%) | 0 (0.0%) |
| Total | 278 (100.0%) | 145 (100.0%) |
Housing Structure by Heating Type in Morrill
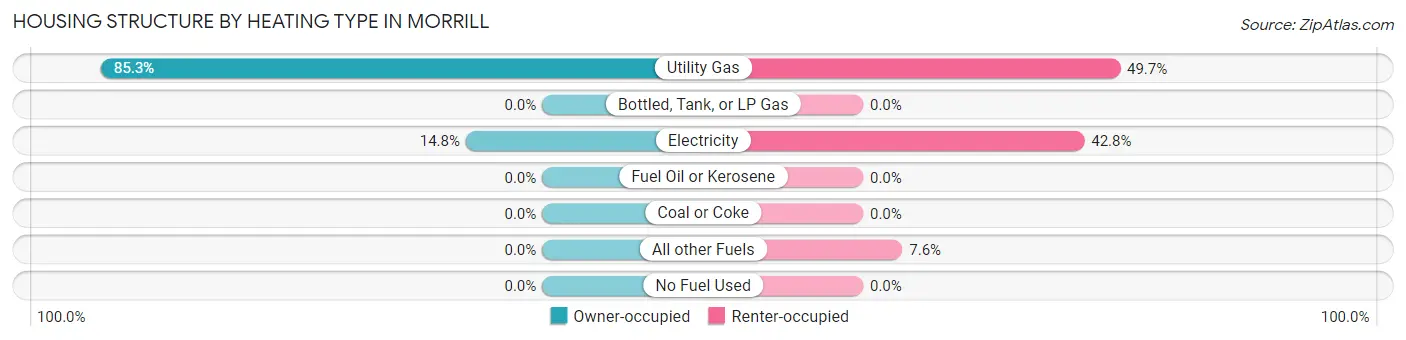
| Heating Type | Owner-occupied | Renter-occupied |
| Utility Gas | 237 (85.3%) | 72 (49.7%) |
| Bottled, Tank, or LP Gas | 0 (0.0%) | 0 (0.0%) |
| Electricity | 41 (14.7%) | 62 (42.8%) |
| Fuel Oil or Kerosene | 0 (0.0%) | 0 (0.0%) |
| Coal or Coke | 0 (0.0%) | 0 (0.0%) |
| All other Fuels | 0 (0.0%) | 11 (7.6%) |
| No Fuel Used | 0 (0.0%) | 0 (0.0%) |
| Total | 278 (100.0%) | 145 (100.0%) |
Household Vehicle Usage in Morrill
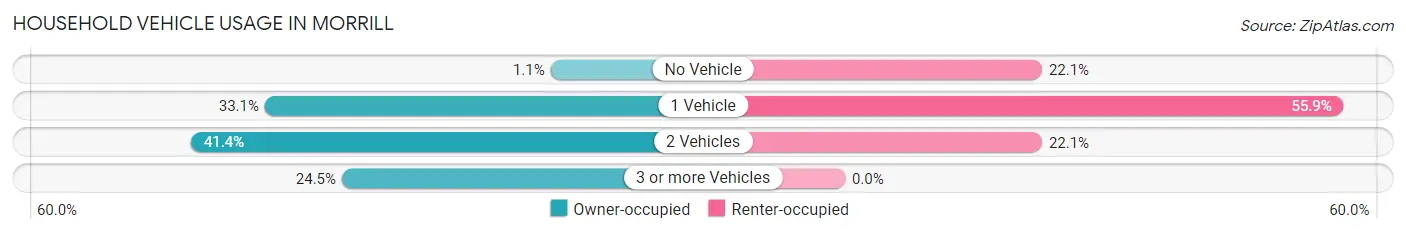
| Vehicles per Household | Owner-occupied | Renter-occupied |
| No Vehicle | 3 (1.1%) | 32 (22.1%) |
| 1 Vehicle | 92 (33.1%) | 81 (55.9%) |
| 2 Vehicles | 115 (41.4%) | 32 (22.1%) |
| 3 or more Vehicles | 68 (24.5%) | 0 (0.0%) |
| Total | 278 (100.0%) | 145 (100.0%) |
Real Estate & Mortgages in Morrill
Real Estate and Mortgage Overview in Morrill
| Characteristic | Without Mortgage | With Mortgage |
| Housing Units | 127 | 151 |
| Median Property Value | $133,700 | $133,200 |
| Median Household Income | $37,375 | $13 |
| Monthly Housing Costs | $452 | $0 |
| Real Estate Taxes | $1,667 | $0 |
Property Value by Mortgage Status in Morrill
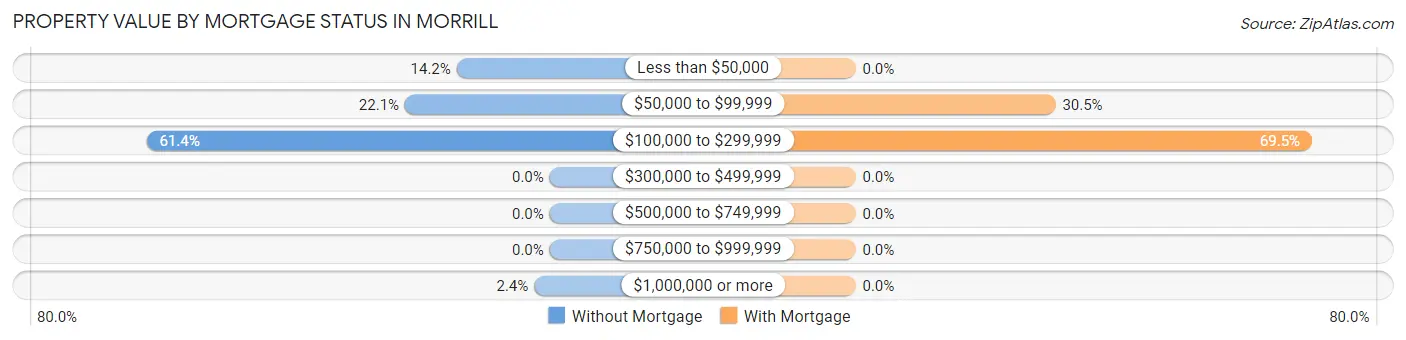
| Property Value | Without Mortgage | With Mortgage |
| Less than $50,000 | 18 (14.2%) | 0 (0.0%) |
| $50,000 to $99,999 | 28 (22.1%) | 46 (30.5%) |
| $100,000 to $299,999 | 78 (61.4%) | 105 (69.5%) |
| $300,000 to $499,999 | 0 (0.0%) | 0 (0.0%) |
| $500,000 to $749,999 | 0 (0.0%) | 0 (0.0%) |
| $750,000 to $999,999 | 0 (0.0%) | 0 (0.0%) |
| $1,000,000 or more | 3 (2.4%) | 0 (0.0%) |
| Total | 127 (100.0%) | 151 (100.0%) |
Household Income by Mortgage Status in Morrill
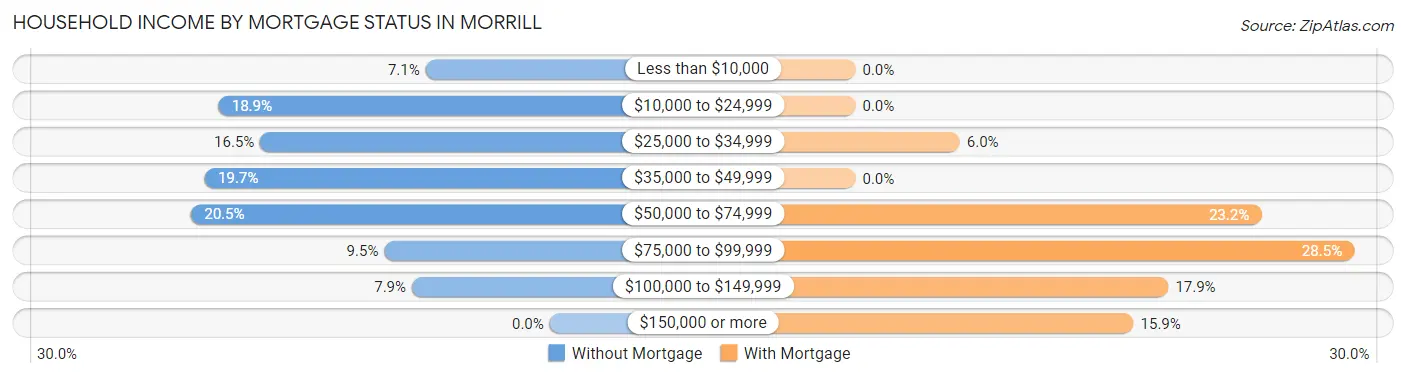
| Household Income | Without Mortgage | With Mortgage |
| Less than $10,000 | 9 (7.1%) | 0 (0.0%) |
| $10,000 to $24,999 | 24 (18.9%) | 0 (0.0%) |
| $25,000 to $34,999 | 21 (16.5%) | 9 (6.0%) |
| $35,000 to $49,999 | 25 (19.7%) | 0 (0.0%) |
| $50,000 to $74,999 | 26 (20.5%) | 35 (23.2%) |
| $75,000 to $99,999 | 12 (9.5%) | 43 (28.5%) |
| $100,000 to $149,999 | 10 (7.9%) | 27 (17.9%) |
| $150,000 or more | 0 (0.0%) | 24 (15.9%) |
| Total | 127 (100.0%) | 151 (100.0%) |
Property Value to Household Income Ratio in Morrill
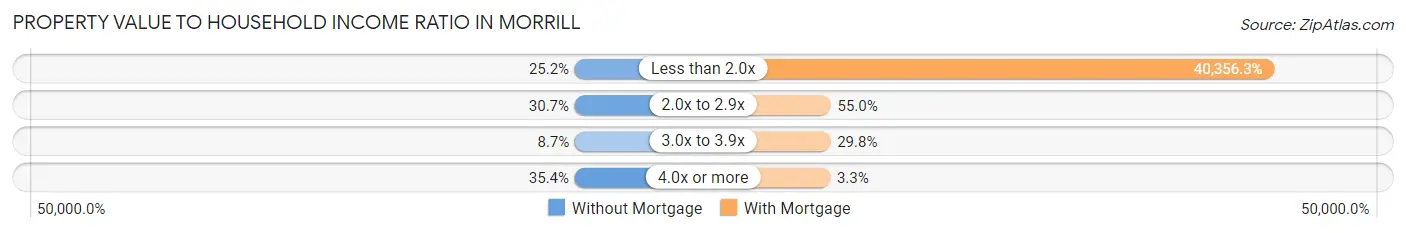
| Value-to-Income Ratio | Without Mortgage | With Mortgage |
| Less than 2.0x | 32 (25.2%) | 60,938 (40,356.3%) |
| 2.0x to 2.9x | 39 (30.7%) | 83 (55.0%) |
| 3.0x to 3.9x | 11 (8.7%) | 45 (29.8%) |
| 4.0x or more | 45 (35.4%) | 5 (3.3%) |
| Total | 127 (100.0%) | 151 (100.0%) |
Real Estate Taxes by Mortgage Status in Morrill
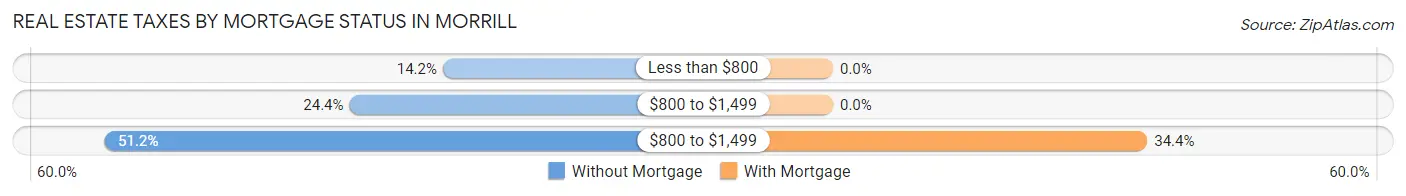
| Property Taxes | Without Mortgage | With Mortgage |
| Less than $800 | 18 (14.2%) | 0 (0.0%) |
| $800 to $1,499 | 31 (24.4%) | 0 (0.0%) |
| $800 to $1,499 | 65 (51.2%) | 52 (34.4%) |
| Total | 127 (100.0%) | 151 (100.0%) |
Health & Disability in Morrill
Health Insurance Coverage by Age in Morrill
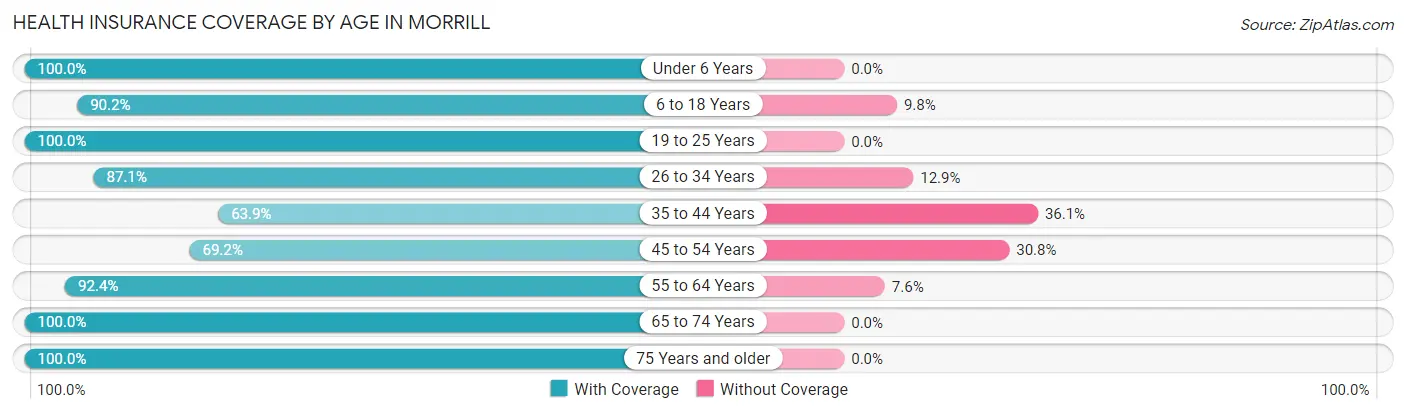
| Age Bracket | With Coverage | Without Coverage |
| Under 6 Years | 69 (100.0%) | 0 (0.0%) |
| 6 to 18 Years | 101 (90.2%) | 11 (9.8%) |
| 19 to 25 Years | 26 (100.0%) | 0 (0.0%) |
| 26 to 34 Years | 88 (87.1%) | 13 (12.9%) |
| 35 to 44 Years | 46 (63.9%) | 26 (36.1%) |
| 45 to 54 Years | 27 (69.2%) | 12 (30.8%) |
| 55 to 64 Years | 171 (92.4%) | 14 (7.6%) |
| 65 to 74 Years | 63 (100.0%) | 0 (0.0%) |
| 75 Years and older | 106 (100.0%) | 0 (0.0%) |
| Total | 697 (90.2%) | 76 (9.8%) |
Health Insurance Coverage by Citizenship Status in Morrill
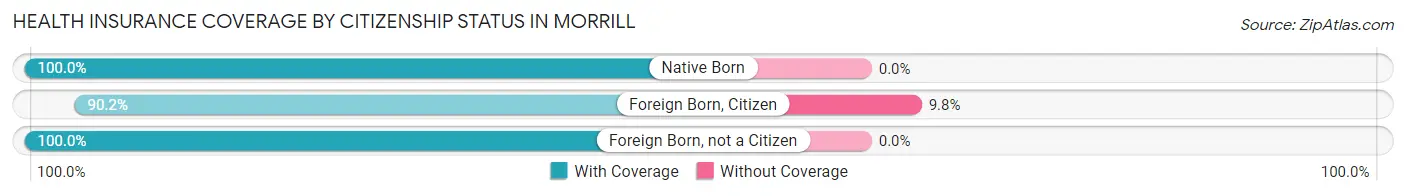
| Citizenship Status | With Coverage | Without Coverage |
| Native Born | 69 (100.0%) | 0 (0.0%) |
| Foreign Born, Citizen | 101 (90.2%) | 11 (9.8%) |
| Foreign Born, not a Citizen | 26 (100.0%) | 0 (0.0%) |
Health Insurance Coverage by Household Income in Morrill
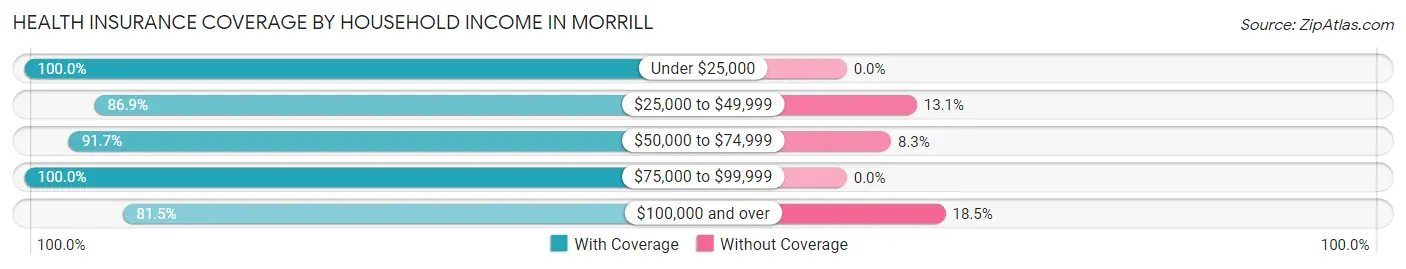
| Household Income | With Coverage | Without Coverage |
| Under $25,000 | 122 (100.0%) | 0 (0.0%) |
| $25,000 to $49,999 | 192 (86.9%) | 29 (13.1%) |
| $50,000 to $74,999 | 166 (91.7%) | 15 (8.3%) |
| $75,000 to $99,999 | 76 (100.0%) | 0 (0.0%) |
| $100,000 and over | 141 (81.5%) | 32 (18.5%) |
Public vs Private Health Insurance Coverage by Age in Morrill
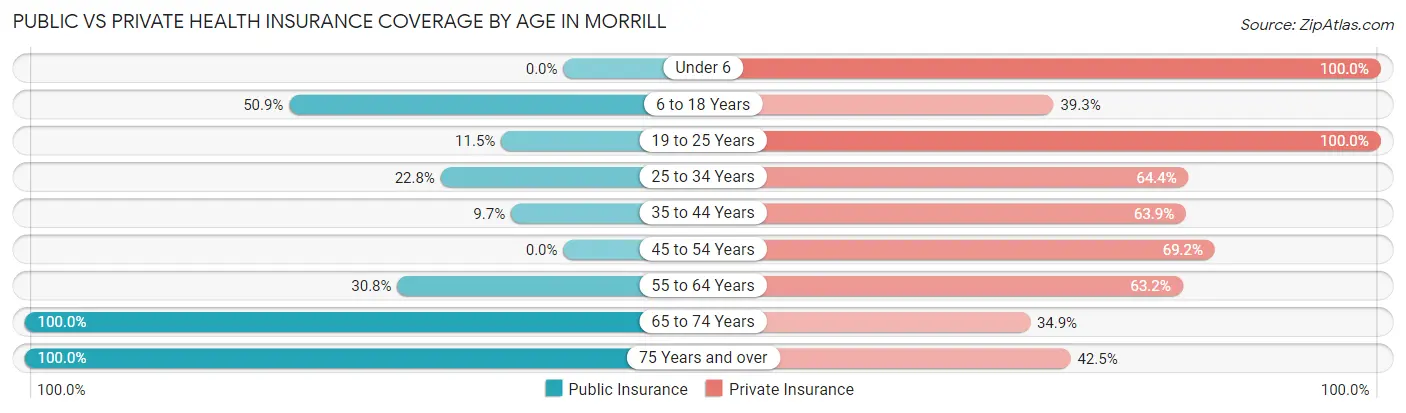
| Age Bracket | Public Insurance | Private Insurance |
| Under 6 | 0 (0.0%) | 69 (100.0%) |
| 6 to 18 Years | 57 (50.9%) | 44 (39.3%) |
| 19 to 25 Years | 3 (11.5%) | 26 (100.0%) |
| 25 to 34 Years | 23 (22.8%) | 65 (64.4%) |
| 35 to 44 Years | 7 (9.7%) | 46 (63.9%) |
| 45 to 54 Years | 0 (0.0%) | 27 (69.2%) |
| 55 to 64 Years | 57 (30.8%) | 117 (63.2%) |
| 65 to 74 Years | 63 (100.0%) | 22 (34.9%) |
| 75 Years and over | 106 (100.0%) | 45 (42.4%) |
| Total | 316 (40.9%) | 461 (59.6%) |
Disability Status by Sex by Age in Morrill
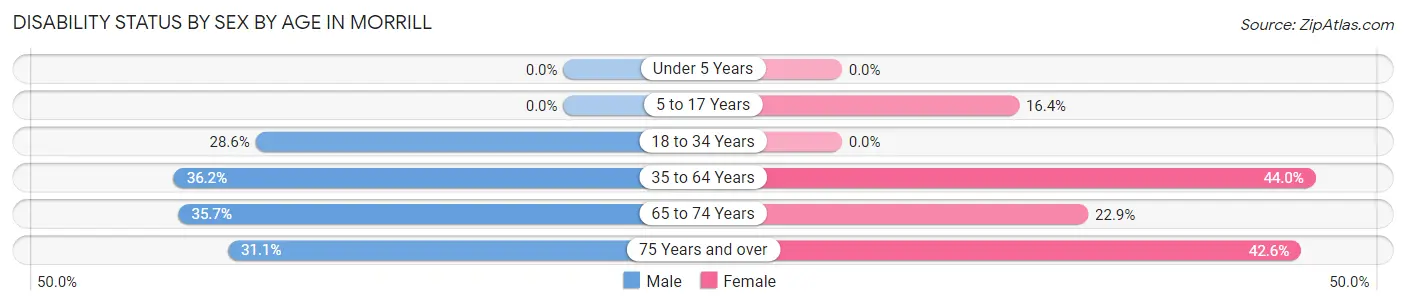
| Age Bracket | Male | Female |
| Under 5 Years | 0 (0.0%) | 0 (0.0%) |
| 5 to 17 Years | 0 (0.0%) | 12 (16.4%) |
| 18 to 34 Years | 18 (28.6%) | 0 (0.0%) |
| 35 to 64 Years | 47 (36.1%) | 73 (44.0%) |
| 65 to 74 Years | 10 (35.7%) | 8 (22.9%) |
| 75 Years and over | 14 (31.1%) | 26 (42.6%) |
Disability Class by Sex by Age in Morrill
Disability Class: Hearing Difficulty
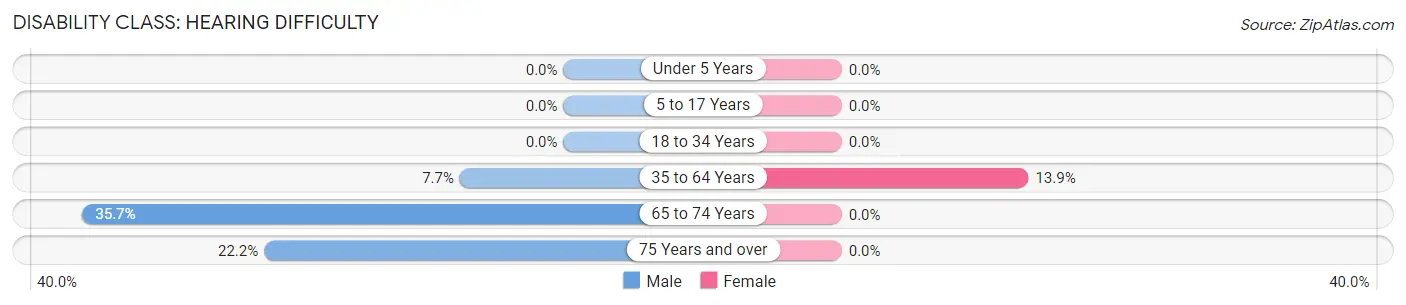
| Age Bracket | Male | Female |
| Under 5 Years | 0 (0.0%) | 0 (0.0%) |
| 5 to 17 Years | 0 (0.0%) | 0 (0.0%) |
| 18 to 34 Years | 0 (0.0%) | 0 (0.0%) |
| 35 to 64 Years | 10 (7.7%) | 23 (13.9%) |
| 65 to 74 Years | 10 (35.7%) | 0 (0.0%) |
| 75 Years and over | 10 (22.2%) | 0 (0.0%) |
Disability Class: Vision Difficulty
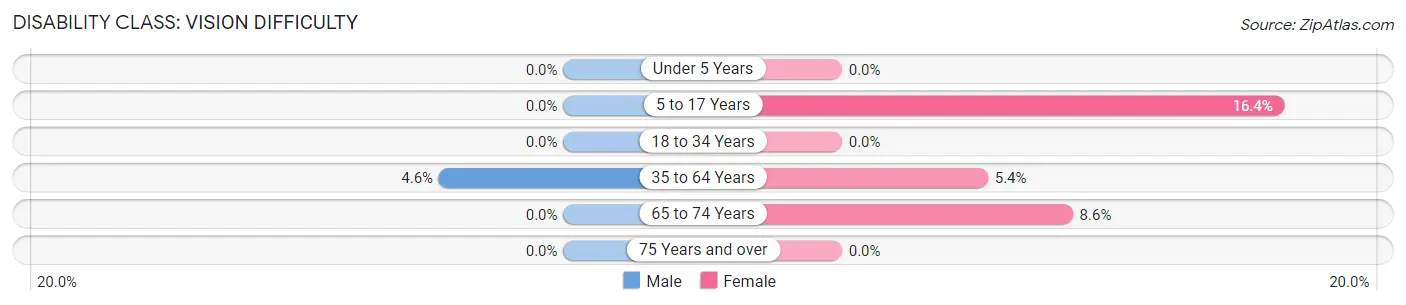
| Age Bracket | Male | Female |
| Under 5 Years | 0 (0.0%) | 0 (0.0%) |
| 5 to 17 Years | 0 (0.0%) | 12 (16.4%) |
| 18 to 34 Years | 0 (0.0%) | 0 (0.0%) |
| 35 to 64 Years | 6 (4.6%) | 9 (5.4%) |
| 65 to 74 Years | 0 (0.0%) | 3 (8.6%) |
| 75 Years and over | 0 (0.0%) | 0 (0.0%) |
Disability Class: Cognitive Difficulty
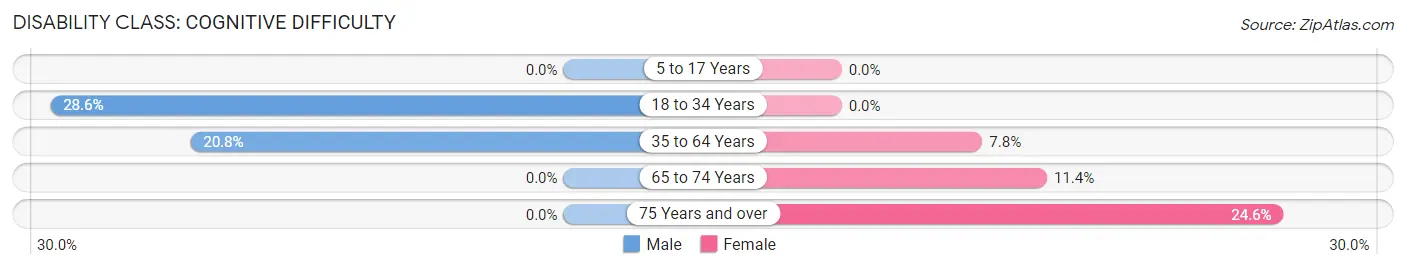
| Age Bracket | Male | Female |
| 5 to 17 Years | 0 (0.0%) | 0 (0.0%) |
| 18 to 34 Years | 18 (28.6%) | 0 (0.0%) |
| 35 to 64 Years | 27 (20.8%) | 13 (7.8%) |
| 65 to 74 Years | 0 (0.0%) | 4 (11.4%) |
| 75 Years and over | 0 (0.0%) | 15 (24.6%) |
Disability Class: Ambulatory Difficulty
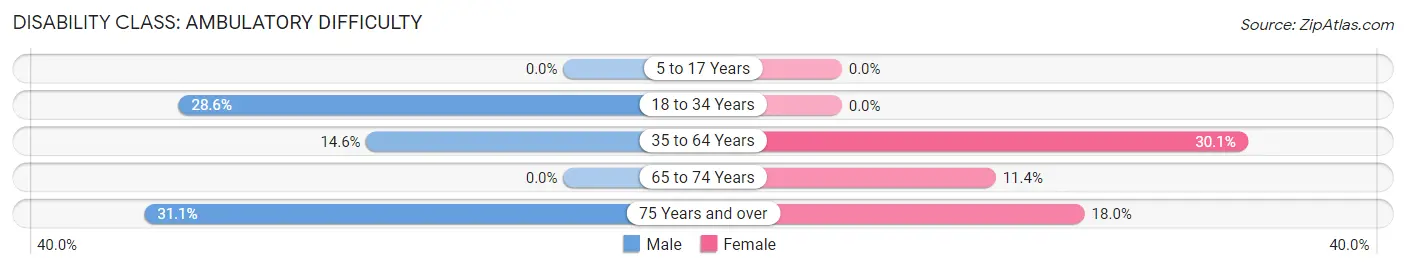
| Age Bracket | Male | Female |
| 5 to 17 Years | 0 (0.0%) | 0 (0.0%) |
| 18 to 34 Years | 18 (28.6%) | 0 (0.0%) |
| 35 to 64 Years | 19 (14.6%) | 50 (30.1%) |
| 65 to 74 Years | 0 (0.0%) | 4 (11.4%) |
| 75 Years and over | 14 (31.1%) | 11 (18.0%) |
Disability Class: Self-Care Difficulty
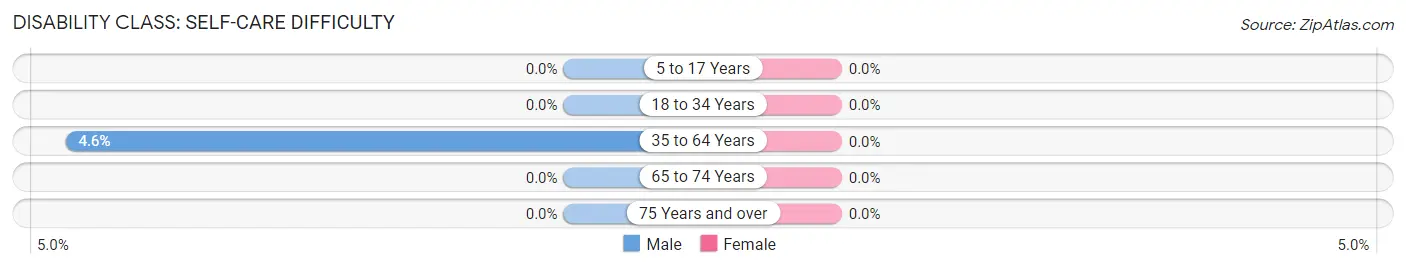
| Age Bracket | Male | Female |
| 5 to 17 Years | 0 (0.0%) | 0 (0.0%) |
| 18 to 34 Years | 0 (0.0%) | 0 (0.0%) |
| 35 to 64 Years | 6 (4.6%) | 0 (0.0%) |
| 65 to 74 Years | 0 (0.0%) | 0 (0.0%) |
| 75 Years and over | 0 (0.0%) | 0 (0.0%) |
Technology Access in Morrill
Computing Device Access in Morrill
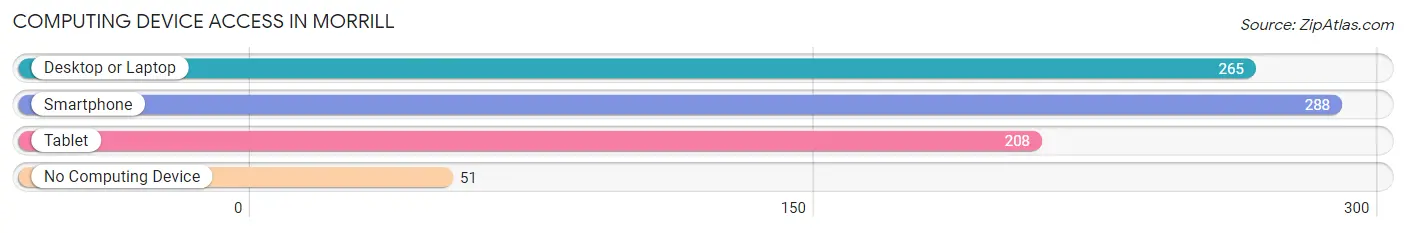
| Device Type | # Households | % Households |
| Desktop or Laptop | 265 | 62.6% |
| Smartphone | 288 | 68.1% |
| Tablet | 208 | 49.2% |
| No Computing Device | 51 | 12.1% |
| Total | 423 | 100.0% |
Internet Access in Morrill
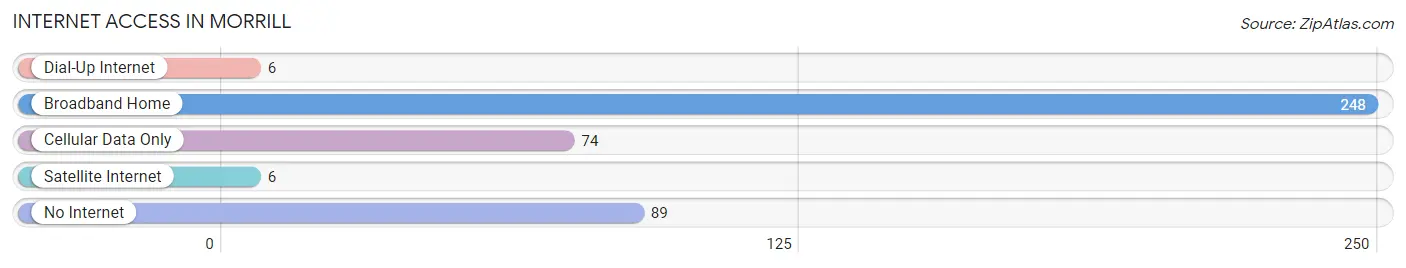
| Internet Type | # Households | % Households |
| Dial-Up Internet | 6 | 1.4% |
| Broadband Home | 248 | 58.6% |
| Cellular Data Only | 74 | 17.5% |
| Satellite Internet | 6 | 1.4% |
| No Internet | 89 | 21.0% |
| Total | 423 | 100.0% |
Morrill Summary
Morrill, Nebraska is a small town located in the western part of the state, in the panhandle region. It is situated in the county of Scotts Bluff, and is part of the Scottsbluff Micropolitan Statistical Area. The town has a population of 1,845 people, according to the 2010 census.
History
Morrill was founded in 1887 by the Union Pacific Railroad. The town was named after the railroad's president, Charles E. Morrill. The town was originally a stop on the railroad, and the railroad was the main source of employment for the town. The town grew slowly, and by the turn of the century, it had a population of just over 500 people.
In the early 1900s, the town began to grow more rapidly. The railroad was still the main source of employment, but other businesses began to open up, including a bank, a hotel, and a general store. The town also had a school, which was built in 1910.
In the 1920s, the town began to experience a period of growth. The population increased to over 1,000 people, and the town had a variety of businesses, including a movie theater, a bowling alley, and a variety of stores. The town also had a hospital, which was built in 1925.
In the 1950s, the town experienced a period of decline. The railroad began to reduce its operations in the area, and many of the businesses in town closed. The population began to decline, and by the 1970s, the population had dropped to just over 500 people.
Geography
Morrill is located in the western part of Nebraska, in the panhandle region. It is situated in the county of Scotts Bluff, and is part of the Scottsbluff Micropolitan Statistical Area. The town is located at the intersection of US Highway 26 and Nebraska Highway 71.
The town is located in a semi-arid climate, with hot summers and cold winters. The average temperature in the summer is around 80 degrees Fahrenheit, and the average temperature in the winter is around 20 degrees Fahrenheit. The town receives an average of 16 inches of precipitation per year.
Economy
The economy of Morrill is largely based on agriculture. The town is located in an area that is known for its production of corn, wheat, and other grains. The town also has a variety of businesses, including a bank, a hotel, and a variety of stores.
The town is also home to a variety of manufacturing businesses, including a furniture factory, a plastics factory, and a metal fabrication plant. The town also has a variety of service businesses, including a hospital, a movie theater, and a bowling alley.
Demographics
According to the 2010 census, the population of Morrill was 1,845 people. The town has a population that is predominantly white, with a small percentage of African Americans, Hispanics, and Native Americans. The median household income in the town is $41,000, and the median age is 37.
Conclusion
Morrill, Nebraska is a small town located in the western part of the state, in the panhandle region. It has a population of 1,845 people, according to the 2010 census. The town has a largely agricultural economy, and is home to a variety of businesses, including a bank, a hotel, and a variety of stores. The town has a predominantly white population, with a small percentage of African Americans, Hispanics, and Native Americans.
Common Questions
What is Per Capita Income in Morrill?
Per Capita income in Morrill is $31,250.
What is the Median Family Income in Morrill?
Median Family Income in Morrill is $63,125.
What is the Median Household income in Morrill?
Median Household Income in Morrill is $40,875.
What is Income or Wage Gap in Morrill?
Income or Wage Gap in Morrill is 47.3%.
Women in Morrill earn 52.7 cents for every dollar earned by a man.
What is Inequality or Gini Index in Morrill?
Inequality or Gini Index in Morrill is 0.47.
What is the Total Population of Morrill?
Total Population of Morrill is 773.
What is the Total Male Population of Morrill?
Total Male Population of Morrill is 342.
What is the Total Female Population of Morrill?
Total Female Population of Morrill is 431.
What is the Ratio of Males per 100 Females in Morrill?
There are 79.35 Males per 100 Females in Morrill.
What is the Ratio of Females per 100 Males in Morrill?
There are 126.02 Females per 100 Males in Morrill.
What is the Median Population Age in Morrill?
Median Population Age in Morrill is 45.7 Years.
What is the Average Family Size in Morrill
Average Family Size in Morrill is 2.5 People.
What is the Average Household Size in Morrill
Average Household Size in Morrill is 1.8 People.
How Large is the Labor Force in Morrill?
There are 356 People in the Labor Forcein in Morrill.
What is the Percentage of People in the Labor Force in Morrill?
56.2% of People are in the Labor Force in Morrill.
What is the Unemployment Rate in Morrill?
Unemployment Rate in Morrill is 4.2%.