Monroe, NE Map & Demographics
Monroe Map
Monroe Overview
$38,612
PER CAPITA INCOME
$83,500
AVG FAMILY INCOME
$71,806
AVG HOUSEHOLD INCOME
39.0%
WAGE / INCOME GAP [ % ]
61.0¢/ $1
WAGE / INCOME GAP [ $ ]
0.42
INEQUALITY / GINI INDEX
314
TOTAL POPULATION
162
MALE POPULATION
152
FEMALE POPULATION
106.58
MALES / 100 FEMALES
93.83
FEMALES / 100 MALES
33.0
MEDIAN AGE
3.1
AVG FAMILY SIZE
2.5
AVG HOUSEHOLD SIZE
160
LABOR FORCE [ PEOPLE ]
69.9%
PERCENT IN LABOR FORCE
1.9%
UNEMPLOYMENT RATE
Monroe Zip Codes
Monroe Area Codes
Income in Monroe
Income Overview in Monroe
Per Capita Income in Monroe is $38,612, while median incomes of families and households are $83,500 and $71,806 respectively.
| Characteristic | Number | Measure |
| Per Capita Income | 314 | $38,612 |
| Median Family Income | 80 | $83,500 |
| Mean Family Income | 80 | $81,229 |
| Median Household Income | 127 | $71,806 |
| Mean Household Income | 127 | $93,564 |
| Income Deficit | 80 | $0 |
| Wage / Income Gap (%) | 314 | 39.03% |
| Wage / Income Gap ($) | 314 | 60.97¢ per $1 |
| Gini / Inequality Index | 314 | 0.42 |
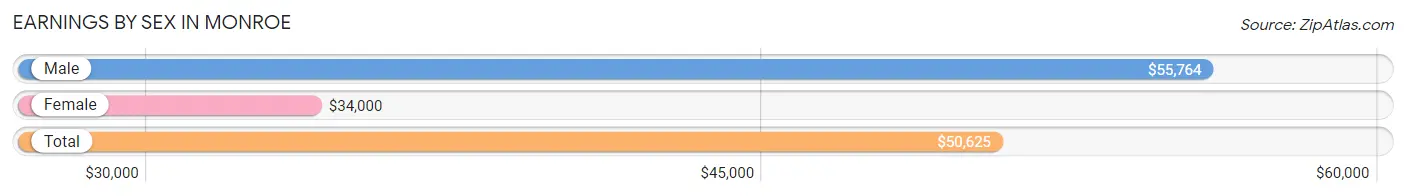
Earnings by Sex in Monroe
Average Earnings in Monroe are $50,625, $55,764 for men and $34,000 for women, a difference of 39.0%.
| Sex | Number | Average Earnings |
| Male | 95 (55.6%) | $55,764 |
| Female | 76 (44.4%) | $34,000 |
| Total | 171 (100.0%) | $50,625 |
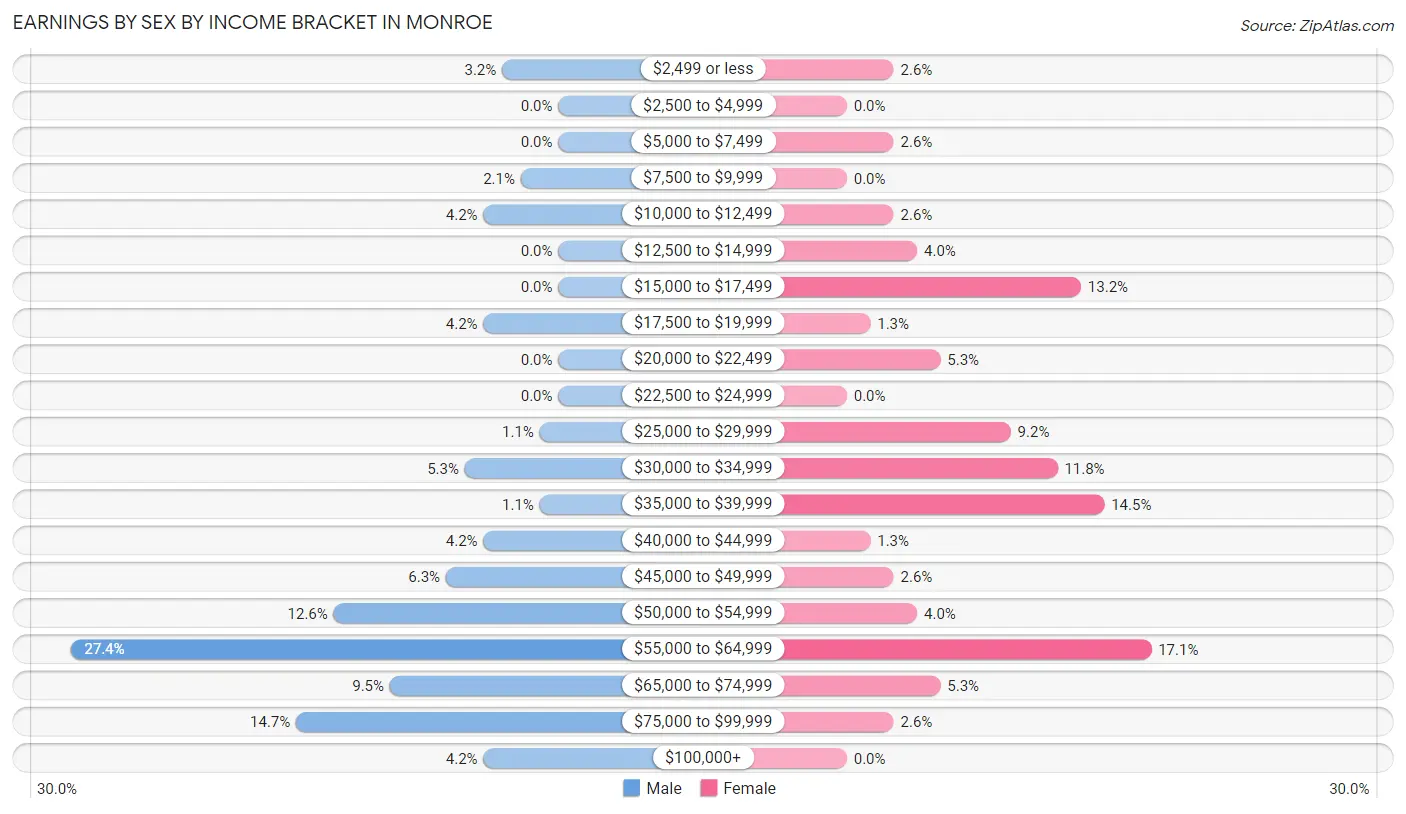
Earnings by Sex by Income Bracket in Monroe
The most common earnings brackets in Monroe are $55,000 to $64,999 for men (26 | 27.4%) and $55,000 to $64,999 for women (13 | 17.1%).
| Income | Male | Female |
| $2,499 or less | 3 (3.2%) | 2 (2.6%) |
| $2,500 to $4,999 | 0 (0.0%) | 0 (0.0%) |
| $5,000 to $7,499 | 0 (0.0%) | 2 (2.6%) |
| $7,500 to $9,999 | 2 (2.1%) | 0 (0.0%) |
| $10,000 to $12,499 | 4 (4.2%) | 2 (2.6%) |
| $12,500 to $14,999 | 0 (0.0%) | 3 (4.0%) |
| $15,000 to $17,499 | 0 (0.0%) | 10 (13.2%) |
| $17,500 to $19,999 | 4 (4.2%) | 1 (1.3%) |
| $20,000 to $22,499 | 0 (0.0%) | 4 (5.3%) |
| $22,500 to $24,999 | 0 (0.0%) | 0 (0.0%) |
| $25,000 to $29,999 | 1 (1.1%) | 7 (9.2%) |
| $30,000 to $34,999 | 5 (5.3%) | 9 (11.8%) |
| $35,000 to $39,999 | 1 (1.1%) | 11 (14.5%) |
| $40,000 to $44,999 | 4 (4.2%) | 1 (1.3%) |
| $45,000 to $49,999 | 6 (6.3%) | 2 (2.6%) |
| $50,000 to $54,999 | 12 (12.6%) | 3 (4.0%) |
| $55,000 to $64,999 | 26 (27.4%) | 13 (17.1%) |
| $65,000 to $74,999 | 9 (9.5%) | 4 (5.3%) |
| $75,000 to $99,999 | 14 (14.7%) | 2 (2.6%) |
| $100,000+ | 4 (4.2%) | 0 (0.0%) |
| Total | 95 (100.0%) | 76 (100.0%) |
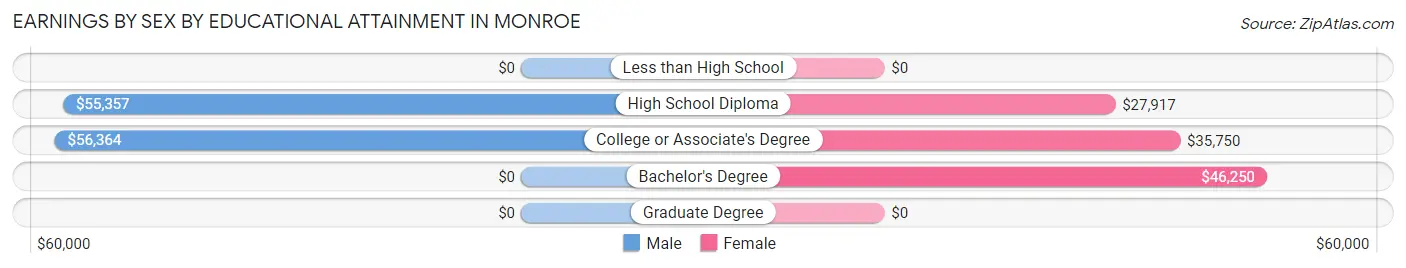
Earnings by Sex by Educational Attainment in Monroe
Average earnings in Monroe are $56,181 for men and $35,972 for women, a difference of 36.0%. Men with an educational attainment of college or associate's degree enjoy the highest average annual earnings of $56,364, while those with high school diploma education earn the least with $55,357. Women with an educational attainment of bachelor's degree earn the most with the average annual earnings of $46,250, while those with high school diploma education have the smallest earnings of $27,917.
| Educational Attainment | Male Income | Female Income |
| Less than High School | - | - |
| High School Diploma | $55,357 | $27,917 |
| College or Associate's Degree | $56,364 | $35,750 |
| Bachelor's Degree | - | - |
| Graduate Degree | - | - |
| Total | $56,181 | $35,972 |
Family Income in Monroe
Family Income Brackets in Monroe
According to the Monroe family income data, there are 21 families falling into the $75,000 to $99,999 income range, which is the most common income bracket and makes up 26.3% of all families.
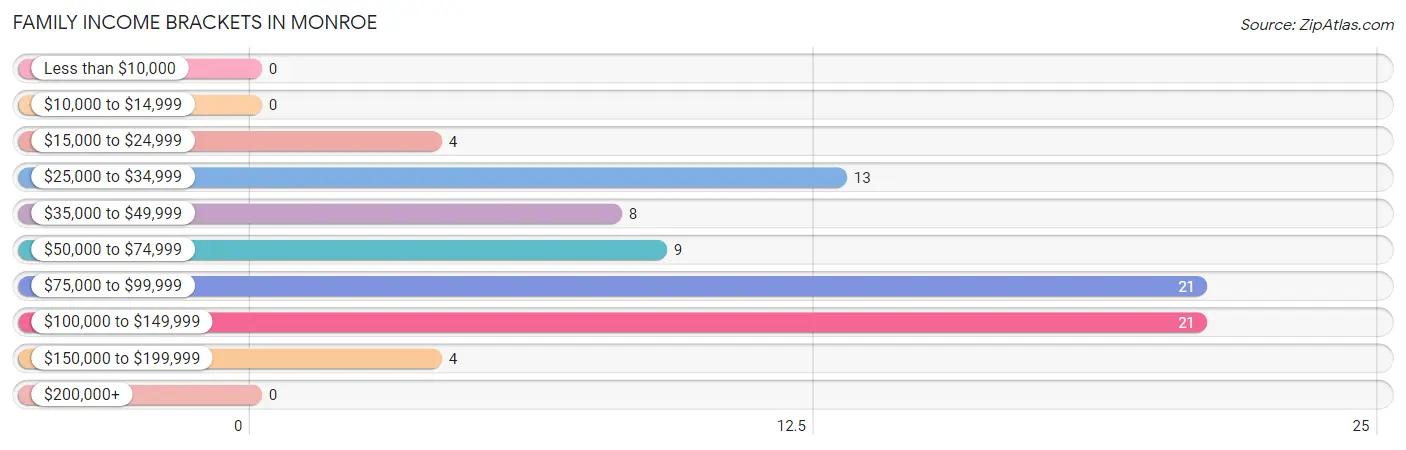
| Income Bracket | # Families | % Families |
| Less than $10,000 | 0 | 0.0% |
| $10,000 to $14,999 | 0 | 0.0% |
| $15,000 to $24,999 | 4 | 5.0% |
| $25,000 to $34,999 | 13 | 16.3% |
| $35,000 to $49,999 | 8 | 10.0% |
| $50,000 to $74,999 | 9 | 11.3% |
| $75,000 to $99,999 | 21 | 26.3% |
| $100,000 to $149,999 | 21 | 26.3% |
| $150,000 to $199,999 | 4 | 5.0% |
| $200,000+ | 0 | 0.0% |
Family Income by Famaliy Size in Monroe
2-person families (43 | 53.7%) account for the highest median family income in Monroe with $86,250 per family, while 2-person families (43 | 53.7%) have the highest median income of $43,125 per family member.
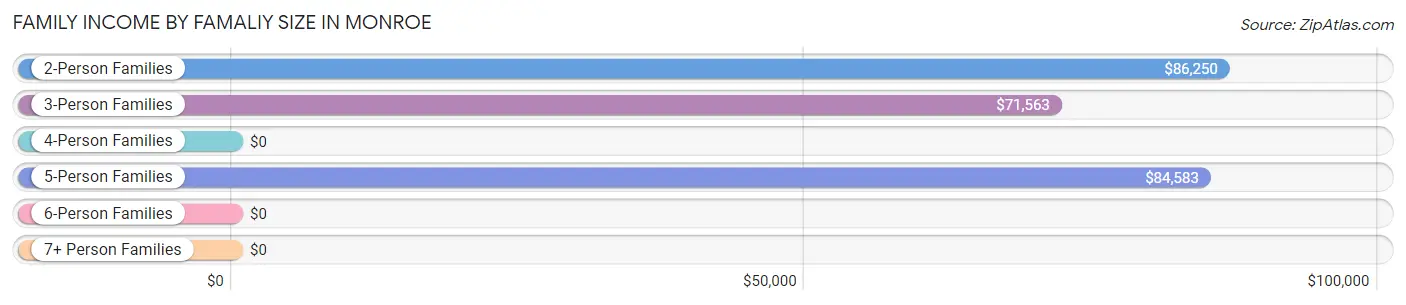
| Income Bracket | # Families | Median Income |
| 2-Person Families | 43 (53.7%) | $86,250 |
| 3-Person Families | 15 (18.8%) | $71,563 |
| 4-Person Families | 11 (13.8%) | $0 |
| 5-Person Families | 11 (13.8%) | $84,583 |
| 6-Person Families | 0 (0.0%) | $0 |
| 7+ Person Families | 0 (0.0%) | $0 |
| Total | 80 (100.0%) | $83,500 |
Family Income by Number of Earners in Monroe
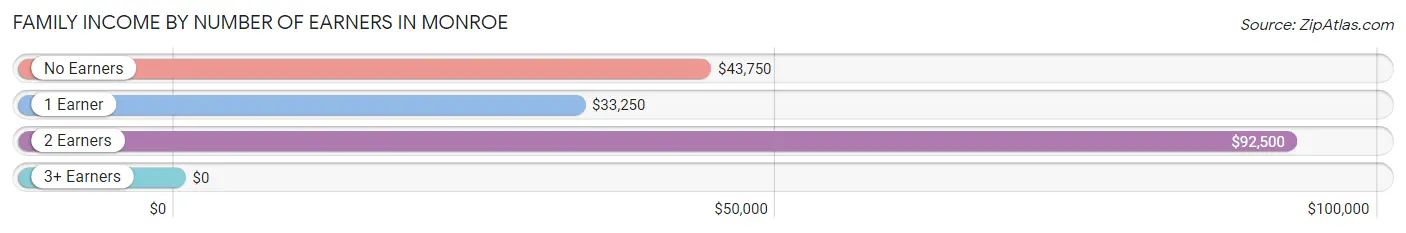
| Number of Earners | # Families | Median Income |
| No Earners | 16 (20.0%) | $43,750 |
| 1 Earner | 17 (21.2%) | $33,250 |
| 2 Earners | 46 (57.5%) | $92,500 |
| 3+ Earners | 1 (1.3%) | $0 |
| Total | 80 (100.0%) | $83,500 |
Household Income in Monroe
Household Income Brackets in Monroe
With 30 households falling in the category, the $100,000 to $149,999 income range is the most frequent in Monroe, accounting for 23.6% of all households. In contrast, only 1 households (0.8%) fall into the $15,000 to $24,999 income bracket, making it the least populous group.
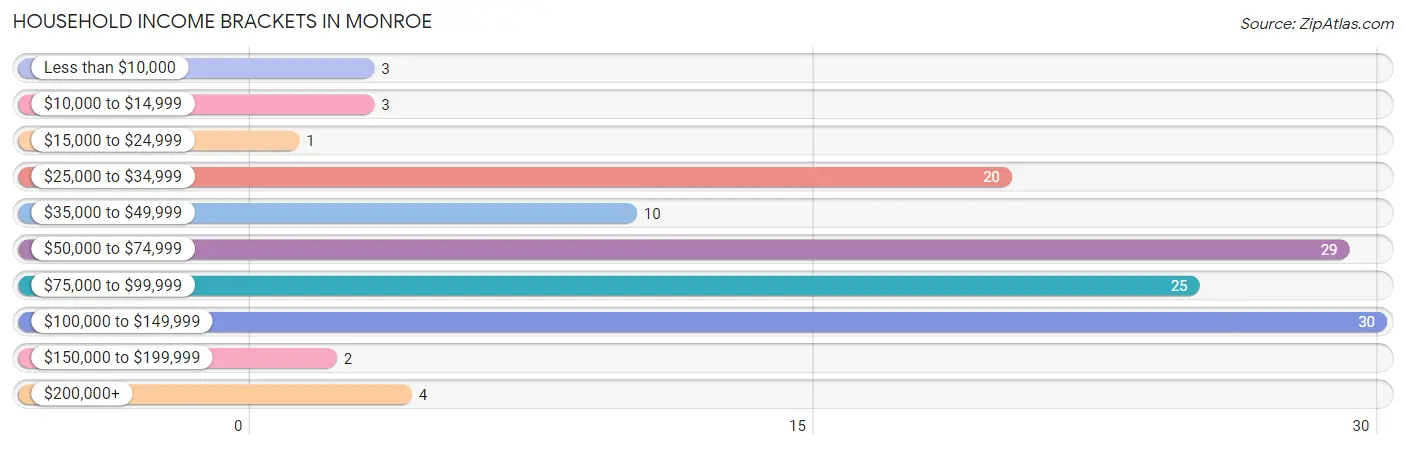
| Income Bracket | # Households | % Households |
| Less than $10,000 | 3 | 2.4% |
| $10,000 to $14,999 | 3 | 2.4% |
| $15,000 to $24,999 | 1 | 0.8% |
| $25,000 to $34,999 | 20 | 15.7% |
| $35,000 to $49,999 | 10 | 7.9% |
| $50,000 to $74,999 | 29 | 22.8% |
| $75,000 to $99,999 | 25 | 19.7% |
| $100,000 to $149,999 | 30 | 23.6% |
| $150,000 to $199,999 | 2 | 1.6% |
| $200,000+ | 4 | 3.1% |
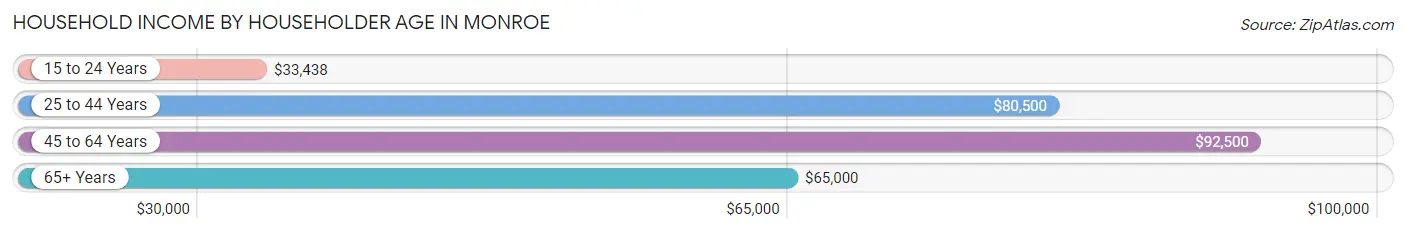
Household Income by Householder Age in Monroe
The median household income in Monroe is $71,806, with the highest median household income of $92,500 found in the 45 to 64 years age bracket for the primary householder. A total of 26 households (20.5%) fall into this category. Meanwhile, the 15 to 24 years age bracket for the primary householder has the lowest median household income of $33,438, with 7 households (5.5%) in this group.
| Income Bracket | # Households | Median Income |
| 15 to 24 Years | 7 (5.5%) | $33,438 |
| 25 to 44 Years | 60 (47.2%) | $80,500 |
| 45 to 64 Years | 26 (20.5%) | $92,500 |
| 65+ Years | 34 (26.8%) | $65,000 |
| Total | 127 (100.0%) | $71,806 |
Poverty in Monroe
Income Below Poverty by Sex and Age in Monroe
With 9.9% poverty level for males and 9.9% for females among the residents of Monroe, 18 to 24 year old males and 18 to 24 year old females are the most vulnerable to poverty, with 4 males (80.0%) and 6 females (66.7%) in their respective age groups living below the poverty level.
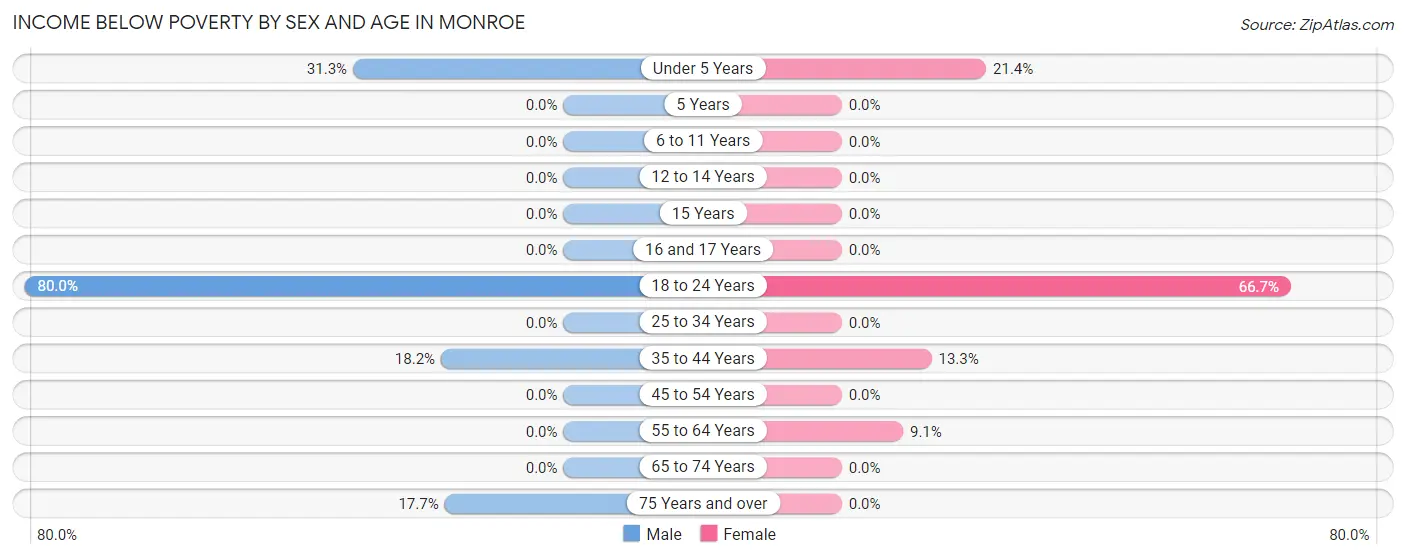
| Age Bracket | Male | Female |
| Under 5 Years | 5 (31.2%) | 6 (21.4%) |
| 5 Years | 0 (0.0%) | 0 (0.0%) |
| 6 to 11 Years | 0 (0.0%) | 0 (0.0%) |
| 12 to 14 Years | 0 (0.0%) | 0 (0.0%) |
| 15 Years | 0 (0.0%) | 0 (0.0%) |
| 16 and 17 Years | 0 (0.0%) | 0 (0.0%) |
| 18 to 24 Years | 4 (80.0%) | 6 (66.7%) |
| 25 to 34 Years | 0 (0.0%) | 0 (0.0%) |
| 35 to 44 Years | 4 (18.2%) | 2 (13.3%) |
| 45 to 54 Years | 0 (0.0%) | 0 (0.0%) |
| 55 to 64 Years | 0 (0.0%) | 1 (9.1%) |
| 65 to 74 Years | 0 (0.0%) | 0 (0.0%) |
| 75 Years and over | 3 (17.6%) | 0 (0.0%) |
| Total | 16 (9.9%) | 15 (9.9%) |
Income Above Poverty by Sex and Age in Monroe
According to the poverty statistics in Monroe, males aged 5 years and females aged 6 to 11 years are the age groups that are most secure financially, with 100.0% of males and 100.0% of females in these age groups living above the poverty line.
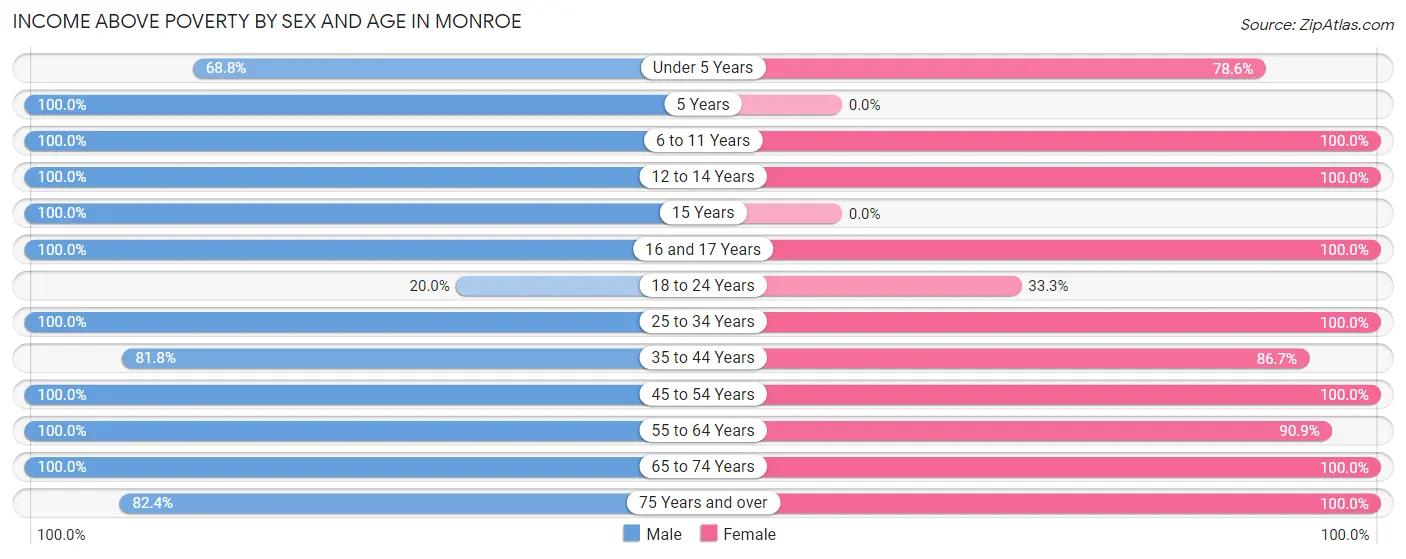
| Age Bracket | Male | Female |
| Under 5 Years | 11 (68.8%) | 22 (78.6%) |
| 5 Years | 2 (100.0%) | 0 (0.0%) |
| 6 to 11 Years | 6 (100.0%) | 2 (100.0%) |
| 12 to 14 Years | 6 (100.0%) | 23 (100.0%) |
| 15 Years | 2 (100.0%) | 0 (0.0%) |
| 16 and 17 Years | 3 (100.0%) | 2 (100.0%) |
| 18 to 24 Years | 1 (20.0%) | 3 (33.3%) |
| 25 to 34 Years | 33 (100.0%) | 32 (100.0%) |
| 35 to 44 Years | 18 (81.8%) | 13 (86.7%) |
| 45 to 54 Years | 14 (100.0%) | 13 (100.0%) |
| 55 to 64 Years | 14 (100.0%) | 10 (90.9%) |
| 65 to 74 Years | 22 (100.0%) | 13 (100.0%) |
| 75 Years and over | 14 (82.4%) | 4 (100.0%) |
| Total | 146 (90.1%) | 137 (90.1%) |
Income Below Poverty Among Married-Couple Families in Monroe
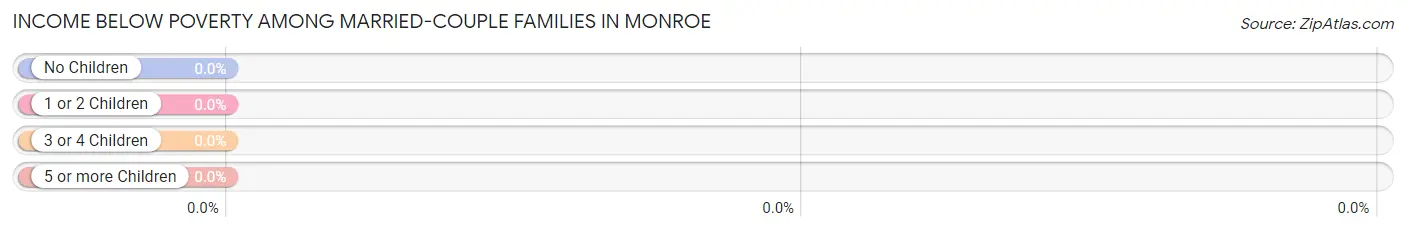
| Children | Above Poverty | Below Poverty |
| No Children | 43 (100.0%) | 0 (0.0%) |
| 1 or 2 Children | 15 (100.0%) | 0 (0.0%) |
| 3 or 4 Children | 8 (100.0%) | 0 (0.0%) |
| 5 or more Children | 0 (0.0%) | 0 (0.0%) |
| Total | 66 (100.0%) | 0 (0.0%) |
Income Below Poverty Among Single-Parent Households in Monroe
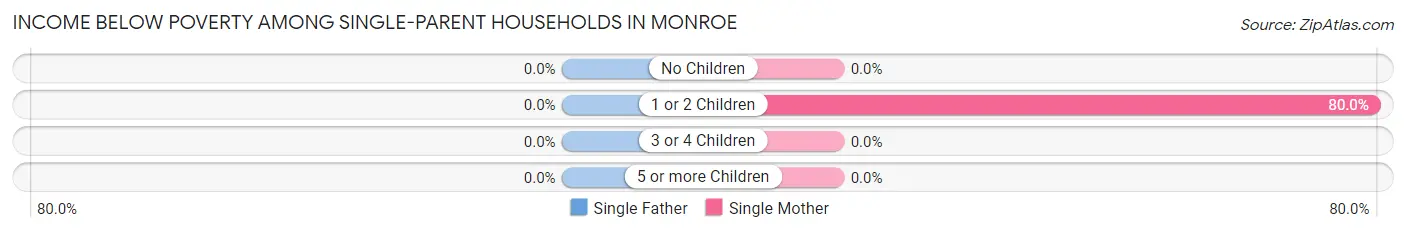
| Children | Single Father | Single Mother |
| No Children | 0 (0.0%) | 0 (0.0%) |
| 1 or 2 Children | 0 (0.0%) | 4 (80.0%) |
| 3 or 4 Children | 0 (0.0%) | 0 (0.0%) |
| 5 or more Children | 0 (0.0%) | 0 (0.0%) |
| Total | 0 (0.0%) | 4 (40.0%) |
Income Below Poverty Among Married-Couple vs Single-Parent Households in Monroe
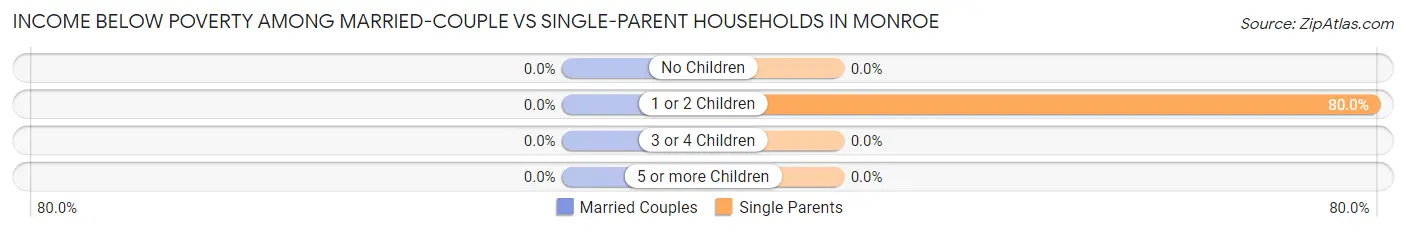
| Children | Married-Couple Families | Single-Parent Households |
| No Children | 0 (0.0%) | 0 (0.0%) |
| 1 or 2 Children | 0 (0.0%) | 4 (80.0%) |
| 3 or 4 Children | 0 (0.0%) | 0 (0.0%) |
| 5 or more Children | 0 (0.0%) | 0 (0.0%) |
| Total | 0 (0.0%) | 4 (28.6%) |
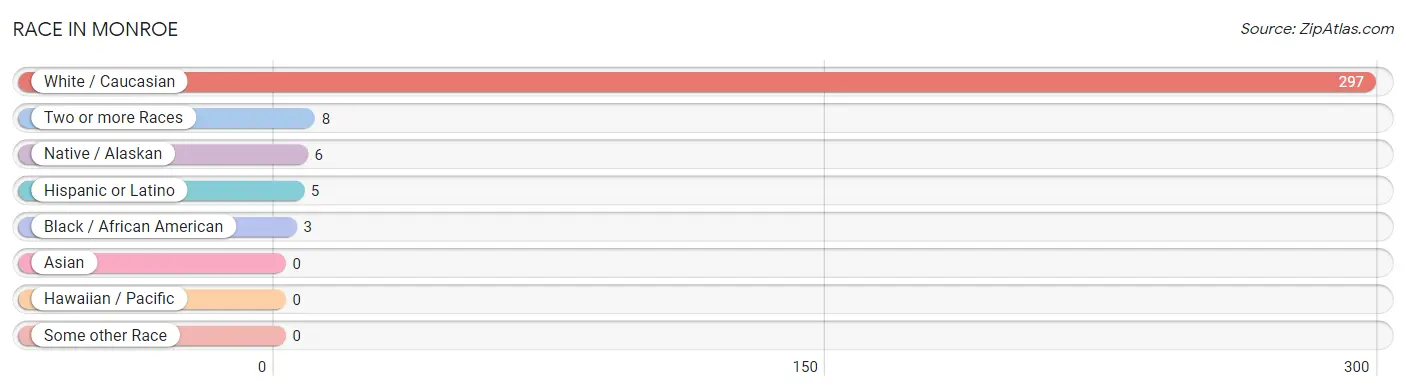
Race in Monroe
The most populous races in Monroe are White / Caucasian (297 | 94.6%), Two or more Races (8 | 2.5%), and Native / Alaskan (6 | 1.9%).
| Race | # Population | % Population |
| Asian | 0 | 0.0% |
| Black / African American | 3 | 1.0% |
| Hawaiian / Pacific | 0 | 0.0% |
| Hispanic or Latino | 5 | 1.6% |
| Native / Alaskan | 6 | 1.9% |
| White / Caucasian | 297 | 94.6% |
| Two or more Races | 8 | 2.5% |
| Some other Race | 0 | 0.0% |
| Total | 314 | 100.0% |
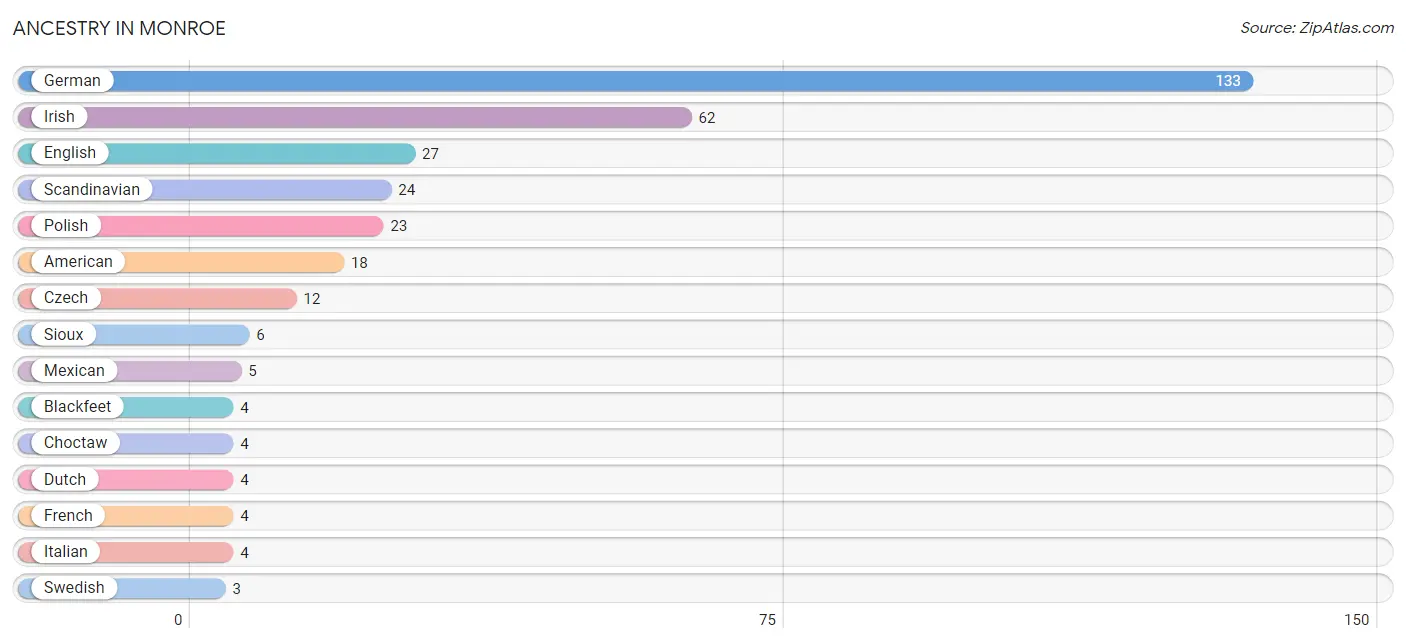
Ancestry in Monroe
The most populous ancestries reported in Monroe are German (133 | 42.4%), Irish (62 | 19.8%), English (27 | 8.6%), Scandinavian (24 | 7.6%), and Polish (23 | 7.3%), together accounting for 85.7% of all Monroe residents.
| Ancestry | # Population | % Population |
| American | 18 | 5.7% |
| Blackfeet | 4 | 1.3% |
| Choctaw | 4 | 1.3% |
| Czech | 12 | 3.8% |
| Danish | 1 | 0.3% |
| Dutch | 4 | 1.3% |
| English | 27 | 8.6% |
| European | 2 | 0.6% |
| French | 4 | 1.3% |
| French Canadian | 1 | 0.3% |
| German | 133 | 42.4% |
| Icelander | 2 | 0.6% |
| Irish | 62 | 19.8% |
| Italian | 4 | 1.3% |
| Mexican | 5 | 1.6% |
| Norwegian | 1 | 0.3% |
| Polish | 23 | 7.3% |
| Scandinavian | 24 | 7.6% |
| Sioux | 6 | 1.9% |
| Swedish | 3 | 1.0% |
| Swiss | 2 | 0.6% | View All 21 Rows |
Immigrants in Monroe
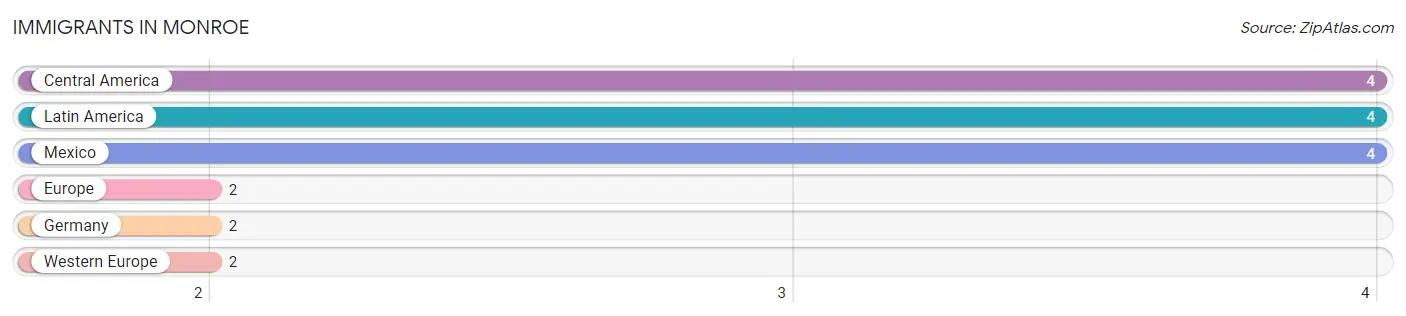
The most numerous immigrant groups reported in Monroe came from Central America (4 | 1.3%), Latin America (4 | 1.3%), Mexico (4 | 1.3%), Europe (2 | 0.6%), and Germany (2 | 0.6%), together accounting for 5.1% of all Monroe residents.
| Immigration Origin | # Population | % Population |
| Central America | 4 | 1.3% |
| Europe | 2 | 0.6% |
| Germany | 2 | 0.6% |
| Latin America | 4 | 1.3% |
| Mexico | 4 | 1.3% |
| Western Europe | 2 | 0.6% | View All 6 Rows |
Sex and Age in Monroe
Sex and Age in Monroe
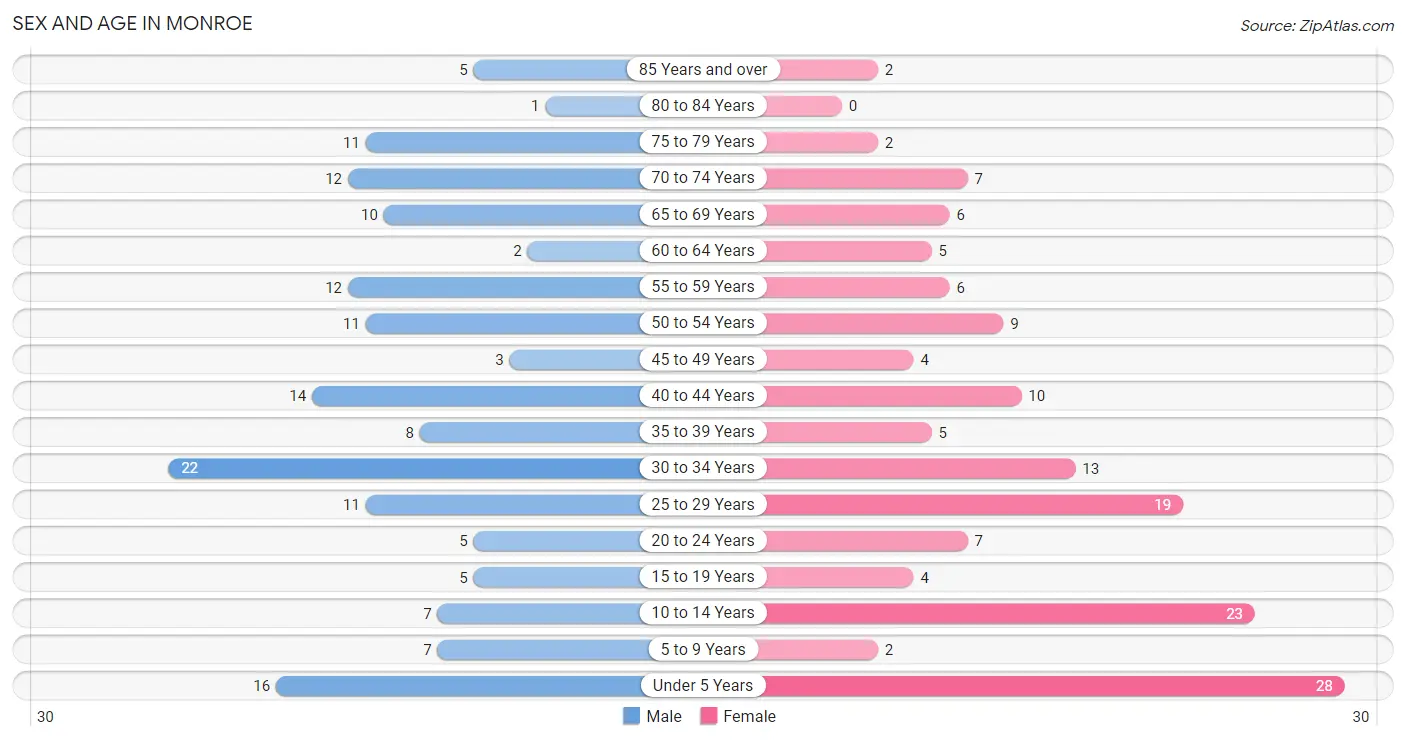
The most populous age groups in Monroe are 30 to 34 Years (22 | 13.6%) for men and Under 5 Years (28 | 18.4%) for women.
| Age Bracket | Male | Female |
| Under 5 Years | 16 (9.9%) | 28 (18.4%) |
| 5 to 9 Years | 7 (4.3%) | 2 (1.3%) |
| 10 to 14 Years | 7 (4.3%) | 23 (15.1%) |
| 15 to 19 Years | 5 (3.1%) | 4 (2.6%) |
| 20 to 24 Years | 5 (3.1%) | 7 (4.6%) |
| 25 to 29 Years | 11 (6.8%) | 19 (12.5%) |
| 30 to 34 Years | 22 (13.6%) | 13 (8.6%) |
| 35 to 39 Years | 8 (4.9%) | 5 (3.3%) |
| 40 to 44 Years | 14 (8.6%) | 10 (6.6%) |
| 45 to 49 Years | 3 (1.8%) | 4 (2.6%) |
| 50 to 54 Years | 11 (6.8%) | 9 (5.9%) |
| 55 to 59 Years | 12 (7.4%) | 6 (4.0%) |
| 60 to 64 Years | 2 (1.2%) | 5 (3.3%) |
| 65 to 69 Years | 10 (6.2%) | 6 (4.0%) |
| 70 to 74 Years | 12 (7.4%) | 7 (4.6%) |
| 75 to 79 Years | 11 (6.8%) | 2 (1.3%) |
| 80 to 84 Years | 1 (0.6%) | 0 (0.0%) |
| 85 Years and over | 5 (3.1%) | 2 (1.3%) |
| Total | 162 (100.0%) | 152 (100.0%) |
Families and Households in Monroe
Median Family Size in Monroe
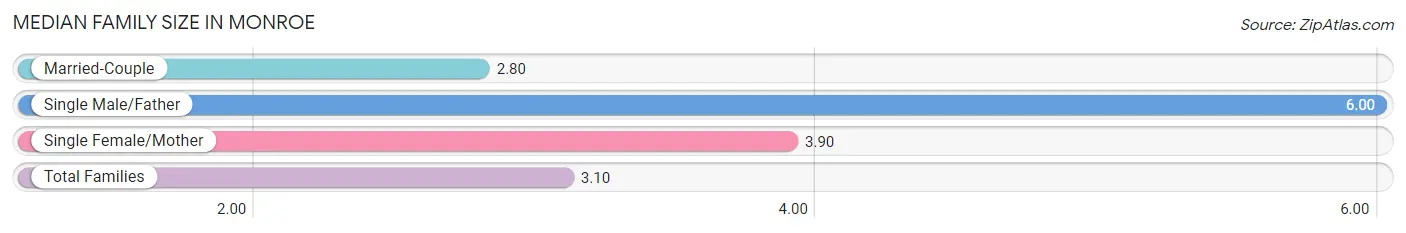
The median family size in Monroe is 3.10 persons per family, with single male/father families (4 | 5.0%) accounting for the largest median family size of 6 persons per family. On the other hand, married-couple families (66 | 82.5%) represent the smallest median family size with 2.80 persons per family.
| Family Type | # Families | Family Size |
| Married-Couple | 66 (82.5%) | 2.80 |
| Single Male/Father | 4 (5.0%) | 6.00 |
| Single Female/Mother | 10 (12.5%) | 3.90 |
| Total Families | 80 (100.0%) | 3.10 |
Median Household Size in Monroe
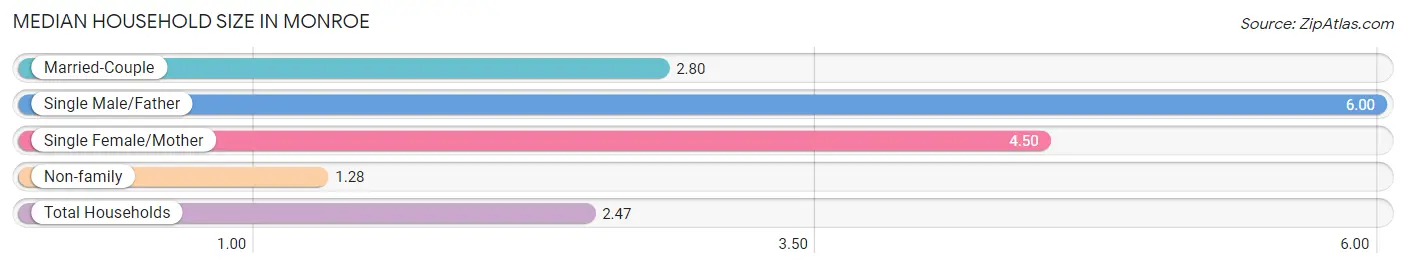
The median household size in Monroe is 2.47 persons per household, with single male/father households (4 | 3.2%) accounting for the largest median household size of 6 persons per household. non-family households (47 | 37.0%) represent the smallest median household size with 1.28 persons per household.
| Household Type | # Households | Household Size |
| Married-Couple | 66 (52.0%) | 2.80 |
| Single Male/Father | 4 (3.2%) | 6.00 |
| Single Female/Mother | 10 (7.9%) | 4.50 |
| Non-family | 47 (37.0%) | 1.28 |
| Total Households | 127 (100.0%) | 2.47 |
Household Size by Marriage Status in Monroe
Out of a total of 127 households in Monroe, 80 (63.0%) are family households, while 47 (37.0%) are nonfamily households. The most numerous type of family households are 2-person households, comprising 43, and the most common type of nonfamily households are 1-person households, comprising 35.
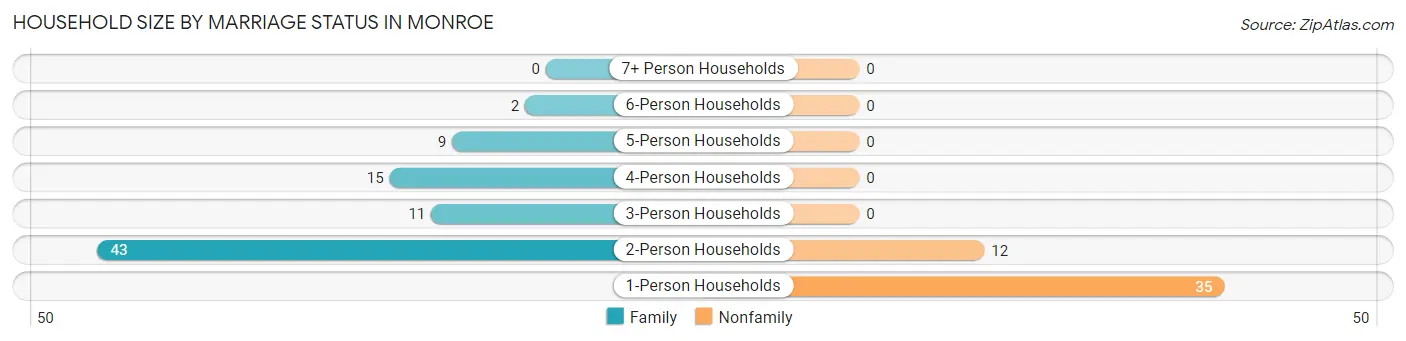
| Household Size | Family Households | Nonfamily Households |
| 1-Person Households | - | 35 (27.6%) |
| 2-Person Households | 43 (33.9%) | 12 (9.5%) |
| 3-Person Households | 11 (8.7%) | 0 (0.0%) |
| 4-Person Households | 15 (11.8%) | 0 (0.0%) |
| 5-Person Households | 9 (7.1%) | 0 (0.0%) |
| 6-Person Households | 2 (1.6%) | 0 (0.0%) |
| 7+ Person Households | 0 (0.0%) | 0 (0.0%) |
| Total | 80 (63.0%) | 47 (37.0%) |
Female Fertility in Monroe
Fertility by Age in Monroe
Average fertility rate in Monroe is 45.0 births per 1,000 women. Women in the age bracket of 20 to 34 years have the highest fertility rate with 77.0 births per 1,000 women. Women in the age bracket of 20 to 34 years acount for 100.0% of all women with births.
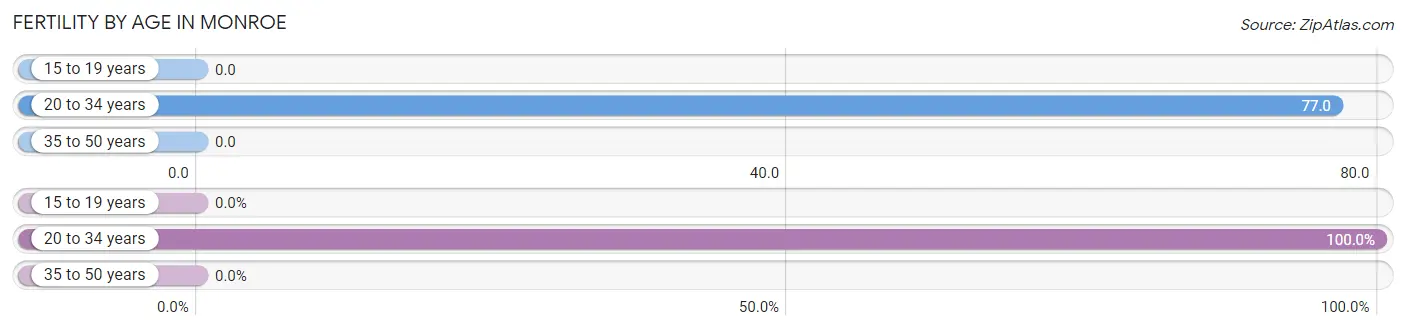
| Age Bracket | Women with Births | Births / 1,000 Women |
| 15 to 19 years | 0 (0.0%) | 0.0 |
| 20 to 34 years | 3 (100.0%) | 77.0 |
| 35 to 50 years | 0 (0.0%) | 0.0 |
| Total | 3 (100.0%) | 45.0 |
Fertility by Age by Marriage Status in Monroe
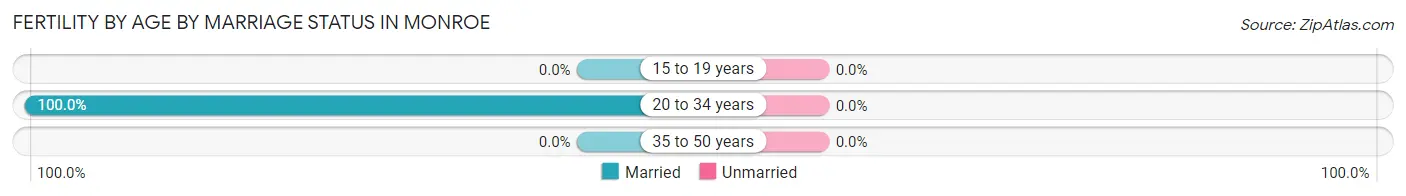
| Age Bracket | Married | Unmarried |
| 15 to 19 years | 0 (0.0%) | 0 (0.0%) |
| 20 to 34 years | 3 (100.0%) | 0 (0.0%) |
| 35 to 50 years | 0 (0.0%) | 0 (0.0%) |
| Total | 3 (100.0%) | 0 (0.0%) |
Fertility by Education in Monroe
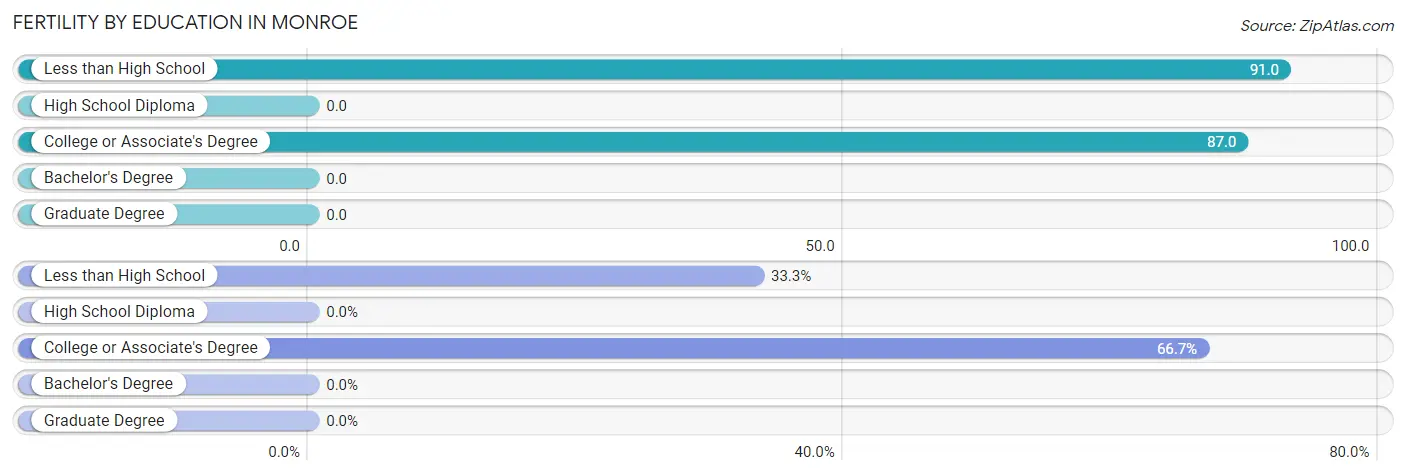
| Educational Attainment | Women with Births | Births / 1,000 Women |
| Less than High School | 1 (33.3%) | 91.0 |
| High School Diploma | 0 (0.0%) | 0.0 |
| College or Associate's Degree | 2 (66.7%) | 87.0 |
| Bachelor's Degree | 0 (0.0%) | 0.0 |
| Graduate Degree | 0 (0.0%) | 0.0 |
| Total | 3 (100.0%) | 45.0 |
Fertility by Education by Marriage Status in Monroe
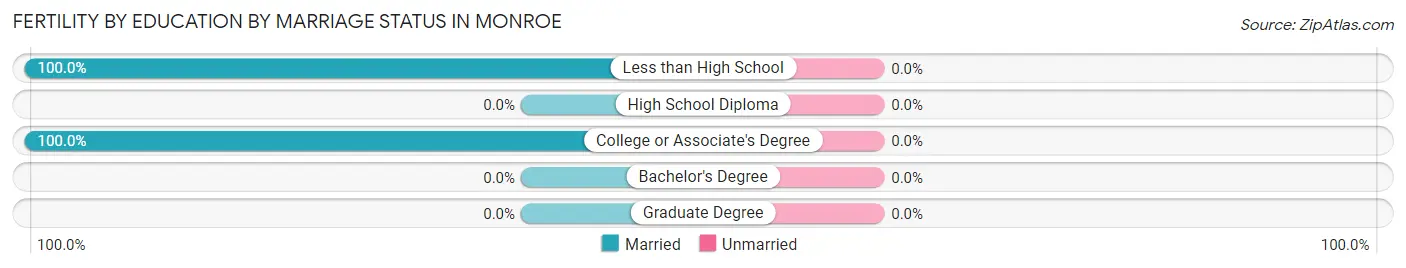
| Educational Attainment | Married | Unmarried |
| Less than High School | 1 (100.0%) | 0 (0.0%) |
| High School Diploma | 0 (0.0%) | 0 (0.0%) |
| College or Associate's Degree | 2 (100.0%) | 0 (0.0%) |
| Bachelor's Degree | 0 (0.0%) | 0 (0.0%) |
| Graduate Degree | 0 (0.0%) | 0 (0.0%) |
| Total | 3 (100.0%) | 0 (0.0%) |
Employment Characteristics in Monroe
Employment by Class of Employer in Monroe
Among the 148 employed individuals in Monroe, private company employees (107 | 72.3%), not-for-profit organizations (11 | 7.4%), and local government employees (11 | 7.4%) make up the most common classes of employment.
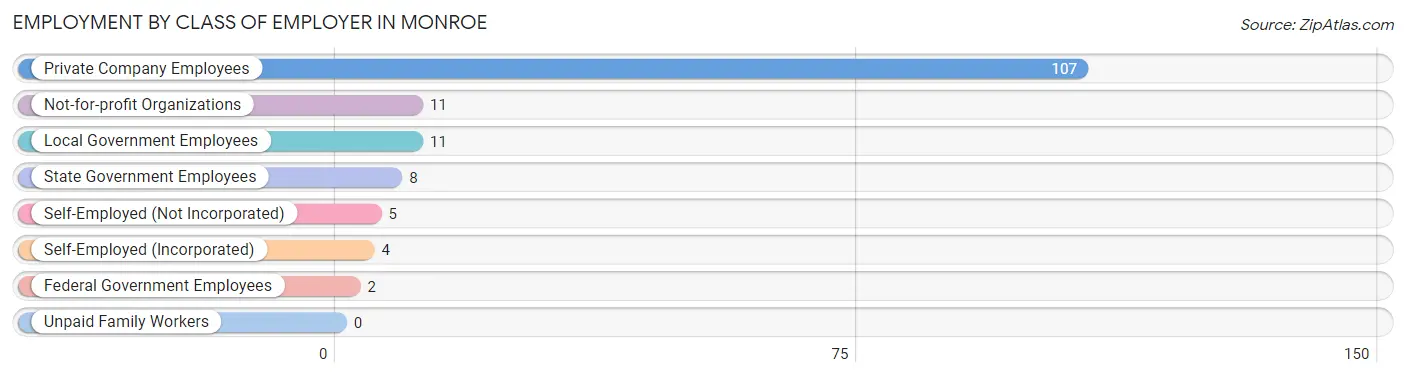
| Employer Class | # Employees | % Employees |
| Private Company Employees | 107 | 72.3% |
| Self-Employed (Incorporated) | 4 | 2.7% |
| Self-Employed (Not Incorporated) | 5 | 3.4% |
| Not-for-profit Organizations | 11 | 7.4% |
| Local Government Employees | 11 | 7.4% |
| State Government Employees | 8 | 5.4% |
| Federal Government Employees | 2 | 1.3% |
| Unpaid Family Workers | 0 | 0.0% |
| Total | 148 | 100.0% |
Employment Status by Age in Monroe
According to the labor force statistics for Monroe, out of the total population over 16 years of age (229), 69.9% or 160 individuals are in the labor force, with 1.9% or 3 of them unemployed. The age group with the highest labor force participation rate is 20 to 24 years, with 100.0% or 12 individuals in the labor force. Within the labor force, the 25 to 29 years age range has the highest percentage of unemployed individuals, with 11.5% or 3 of them being unemployed.
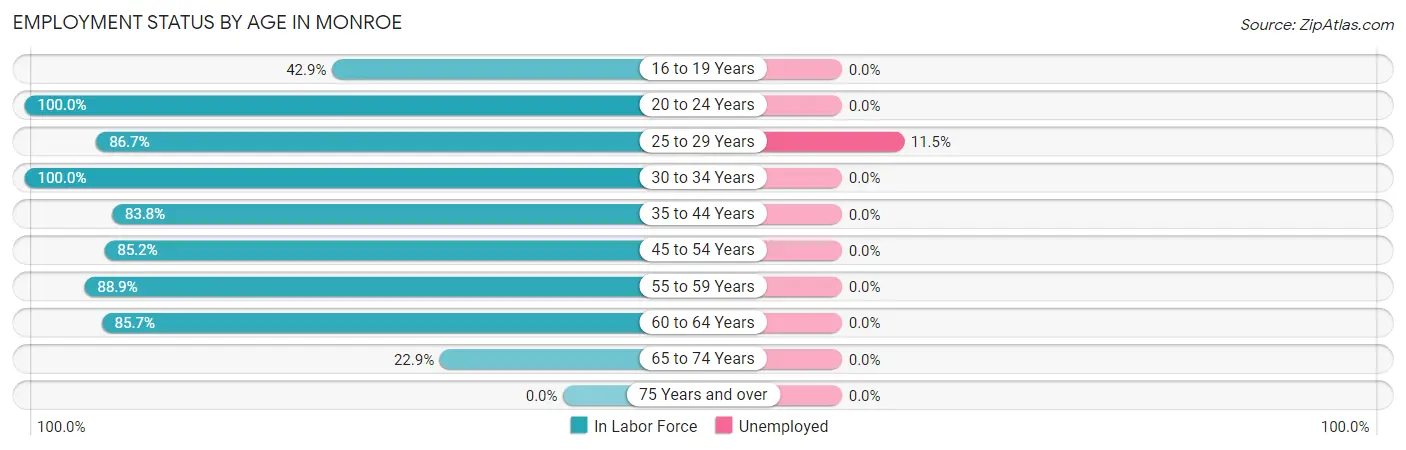
| Age Bracket | In Labor Force | Unemployed |
| 16 to 19 Years | 3 (42.9%) | 0 (0.0%) |
| 20 to 24 Years | 12 (100.0%) | 0 (0.0%) |
| 25 to 29 Years | 26 (86.7%) | 3 (11.5%) |
| 30 to 34 Years | 35 (100.0%) | 0 (0.0%) |
| 35 to 44 Years | 31 (83.8%) | 0 (0.0%) |
| 45 to 54 Years | 23 (85.2%) | 0 (0.0%) |
| 55 to 59 Years | 16 (88.9%) | 0 (0.0%) |
| 60 to 64 Years | 6 (85.7%) | 0 (0.0%) |
| 65 to 74 Years | 8 (22.9%) | 0 (0.0%) |
| 75 Years and over | 0 (0.0%) | 0 (0.0%) |
| Total | 160 (69.9%) | 3 (1.9%) |
Employment Status by Educational Attainment in Monroe
According to labor force statistics for Monroe, 89.0% of individuals (137) out of the total population between 25 and 64 years of age (154) are in the labor force, with 2.2% or 3 of them being unemployed. The group with the highest labor force participation rate are those with the educational attainment of high school diploma, with 96.4% or 53 individuals in the labor force. Within the labor force, individuals with high school diploma education have the highest percentage of unemployment, with 5.7% or 3 of them being unemployed.
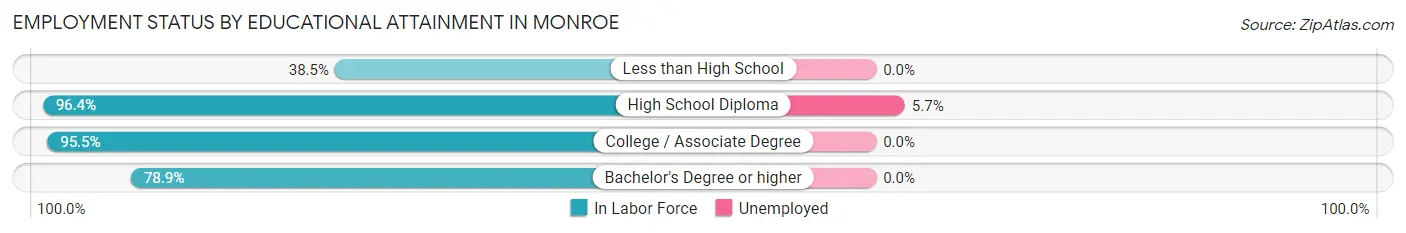
| Educational Attainment | In Labor Force | Unemployed |
| Less than High School | 5 (38.5%) | 0 (0.0%) |
| High School Diploma | 53 (96.4%) | 3 (5.7%) |
| College / Associate Degree | 64 (95.5%) | 0 (0.0%) |
| Bachelor's Degree or higher | 15 (78.9%) | 0 (0.0%) |
| Total | 137 (89.0%) | 3 (2.2%) |
Employment Occupations by Sex in Monroe
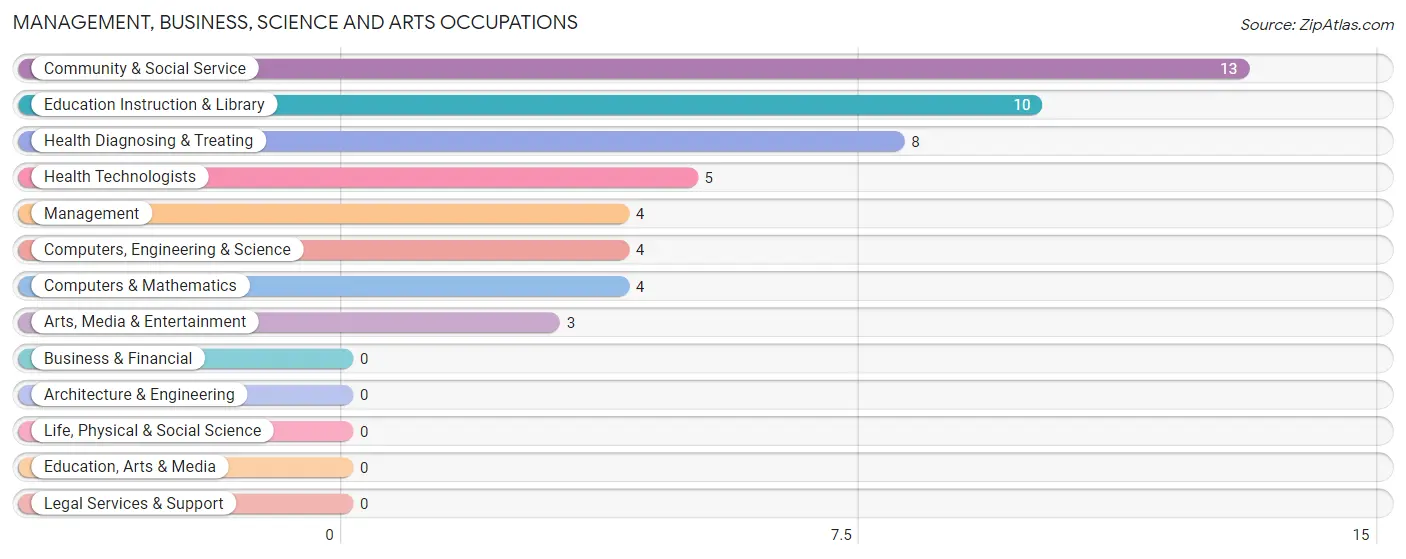
Management, Business, Science and Arts Occupations
The most common Management, Business, Science and Arts occupations in Monroe are Community & Social Service (13 | 8.3%), Education Instruction & Library (10 | 6.4%), Health Diagnosing & Treating (8 | 5.1%), Health Technologists (5 | 3.2%), and Management (4 | 2.5%).
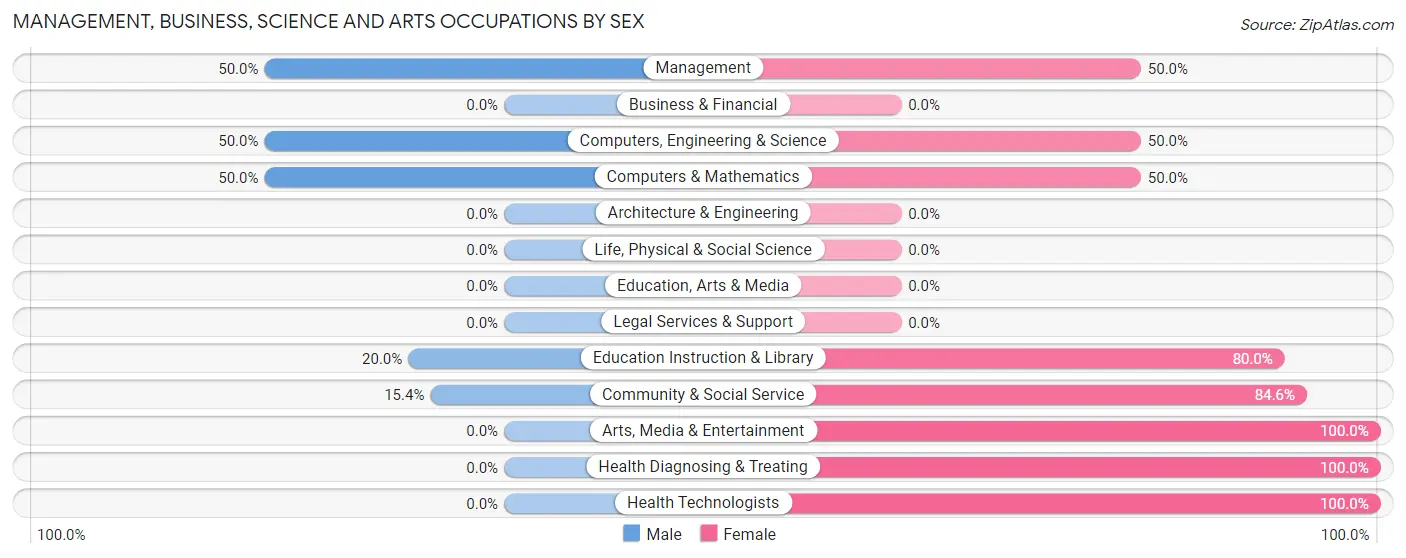
Management, Business, Science and Arts Occupations by Sex
Within the Management, Business, Science and Arts occupations in Monroe, the most male-oriented occupations are Management (50.0%), Computers, Engineering & Science (50.0%), and Computers & Mathematics (50.0%), while the most female-oriented occupations are Arts, Media & Entertainment (100.0%), Health Diagnosing & Treating (100.0%), and Health Technologists (100.0%).
| Occupation | Male | Female |
| Management | 2 (50.0%) | 2 (50.0%) |
| Business & Financial | 0 (0.0%) | 0 (0.0%) |
| Computers, Engineering & Science | 2 (50.0%) | 2 (50.0%) |
| Computers & Mathematics | 2 (50.0%) | 2 (50.0%) |
| Architecture & Engineering | 0 (0.0%) | 0 (0.0%) |
| Life, Physical & Social Science | 0 (0.0%) | 0 (0.0%) |
| Community & Social Service | 2 (15.4%) | 11 (84.6%) |
| Education, Arts & Media | 0 (0.0%) | 0 (0.0%) |
| Legal Services & Support | 0 (0.0%) | 0 (0.0%) |
| Education Instruction & Library | 2 (20.0%) | 8 (80.0%) |
| Arts, Media & Entertainment | 0 (0.0%) | 3 (100.0%) |
| Health Diagnosing & Treating | 0 (0.0%) | 8 (100.0%) |
| Health Technologists | 0 (0.0%) | 5 (100.0%) |
| Total (Category) | 6 (20.7%) | 23 (79.3%) |
| Total (Overall) | 83 (52.9%) | 74 (47.1%) |
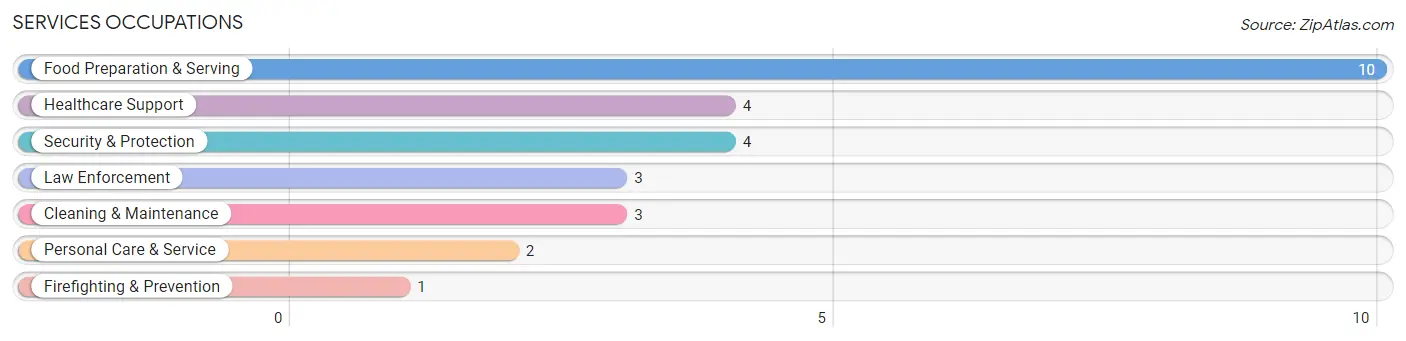
Services Occupations
The most common Services occupations in Monroe are Food Preparation & Serving (10 | 6.4%), Healthcare Support (4 | 2.5%), Security & Protection (4 | 2.5%), Law Enforcement (3 | 1.9%), and Cleaning & Maintenance (3 | 1.9%).
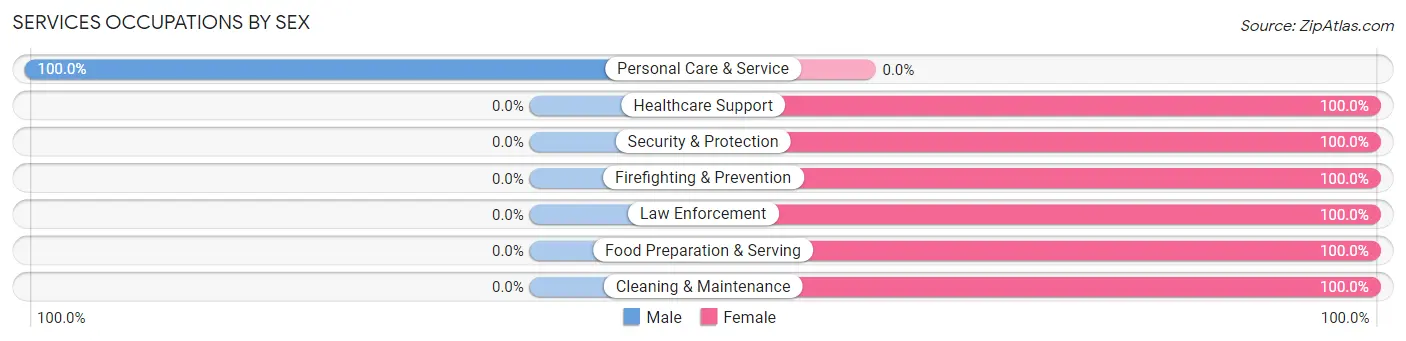
Services Occupations by Sex
| Occupation | Male | Female |
| Healthcare Support | 0 (0.0%) | 4 (100.0%) |
| Security & Protection | 0 (0.0%) | 4 (100.0%) |
| Firefighting & Prevention | 0 (0.0%) | 1 (100.0%) |
| Law Enforcement | 0 (0.0%) | 3 (100.0%) |
| Food Preparation & Serving | 0 (0.0%) | 10 (100.0%) |
| Cleaning & Maintenance | 0 (0.0%) | 3 (100.0%) |
| Personal Care & Service | 2 (100.0%) | 0 (0.0%) |
| Total (Category) | 2 (8.7%) | 21 (91.3%) |
| Total (Overall) | 83 (52.9%) | 74 (47.1%) |
Sales and Office Occupations
The most common Sales and Office occupations in Monroe are Sales & Related (13 | 8.3%), and Office & Administration (11 | 7.0%).
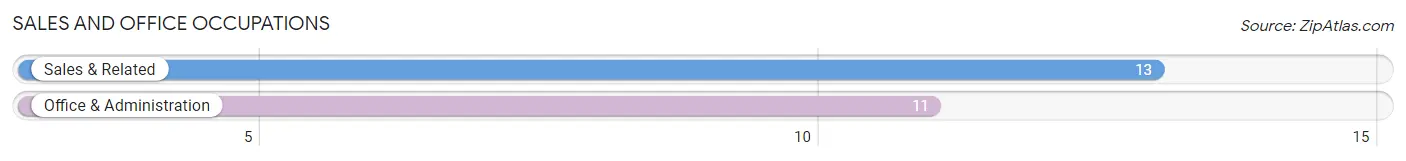
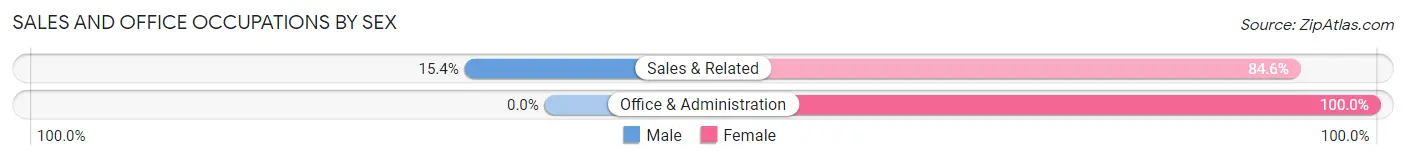
Sales and Office Occupations by Sex
| Occupation | Male | Female |
| Sales & Related | 2 (15.4%) | 11 (84.6%) |
| Office & Administration | 0 (0.0%) | 11 (100.0%) |
| Total (Category) | 2 (8.3%) | 22 (91.7%) |
| Total (Overall) | 83 (52.9%) | 74 (47.1%) |
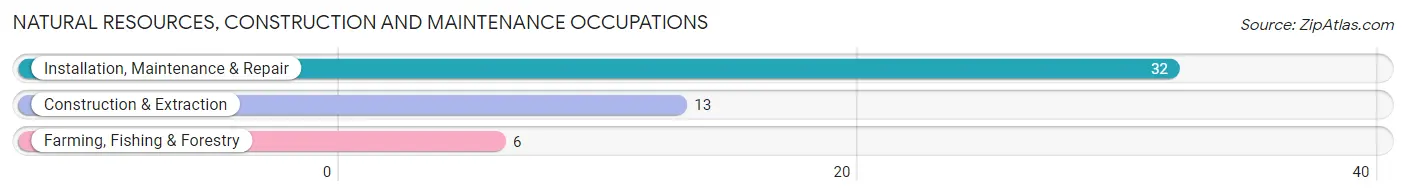
Natural Resources, Construction and Maintenance Occupations
The most common Natural Resources, Construction and Maintenance occupations in Monroe are Installation, Maintenance & Repair (32 | 20.4%), Construction & Extraction (13 | 8.3%), and Farming, Fishing & Forestry (6 | 3.8%).
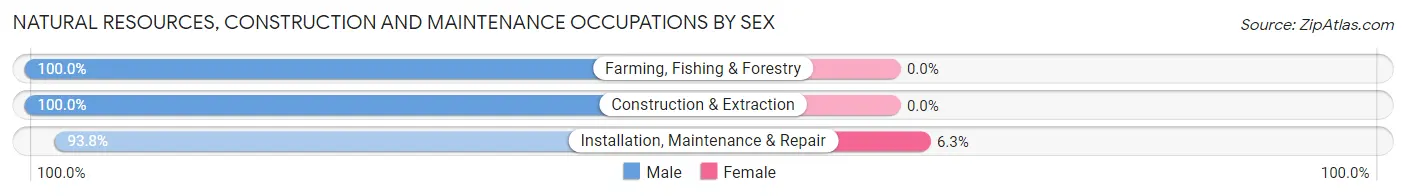
Natural Resources, Construction and Maintenance Occupations by Sex
| Occupation | Male | Female |
| Farming, Fishing & Forestry | 6 (100.0%) | 0 (0.0%) |
| Construction & Extraction | 13 (100.0%) | 0 (0.0%) |
| Installation, Maintenance & Repair | 30 (93.8%) | 2 (6.2%) |
| Total (Category) | 49 (96.1%) | 2 (3.9%) |
| Total (Overall) | 83 (52.9%) | 74 (47.1%) |
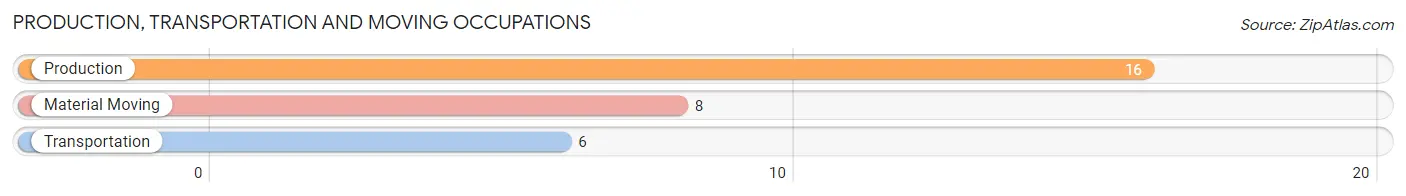
Production, Transportation and Moving Occupations
The most common Production, Transportation and Moving occupations in Monroe are Production (16 | 10.2%), Material Moving (8 | 5.1%), and Transportation (6 | 3.8%).
Production, Transportation and Moving Occupations by Sex
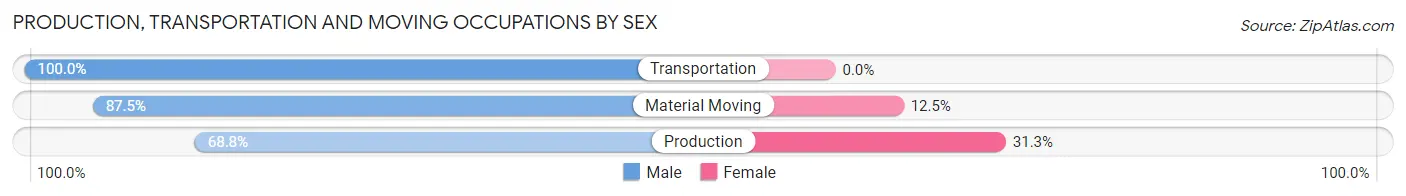
| Occupation | Male | Female |
| Production | 11 (68.8%) | 5 (31.2%) |
| Transportation | 6 (100.0%) | 0 (0.0%) |
| Material Moving | 7 (87.5%) | 1 (12.5%) |
| Total (Category) | 24 (80.0%) | 6 (20.0%) |
| Total (Overall) | 83 (52.9%) | 74 (47.1%) |
Employment Industries by Sex in Monroe
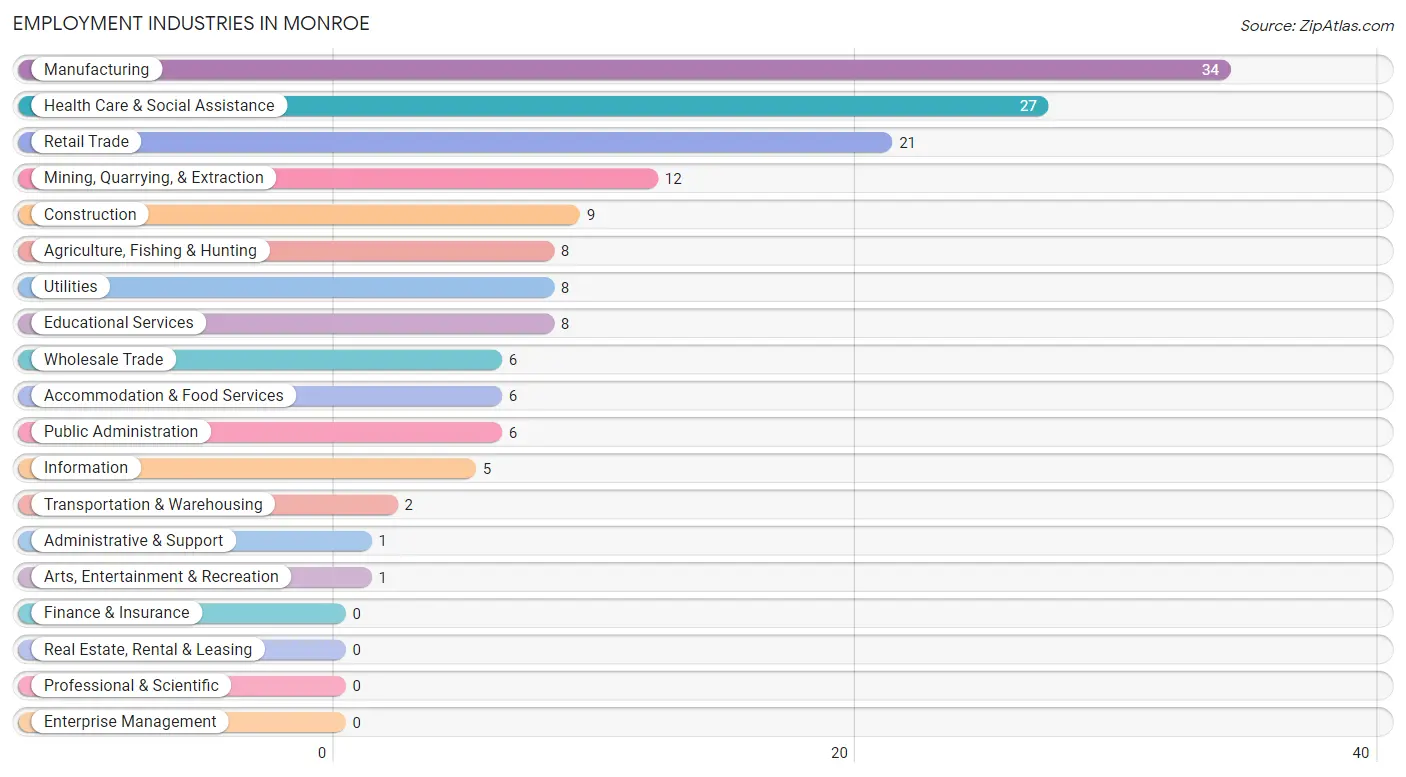
Employment Industries in Monroe
The major employment industries in Monroe include Manufacturing (34 | 21.7%), Health Care & Social Assistance (27 | 17.2%), Retail Trade (21 | 13.4%), Mining, Quarrying, & Extraction (12 | 7.6%), and Construction (9 | 5.7%).
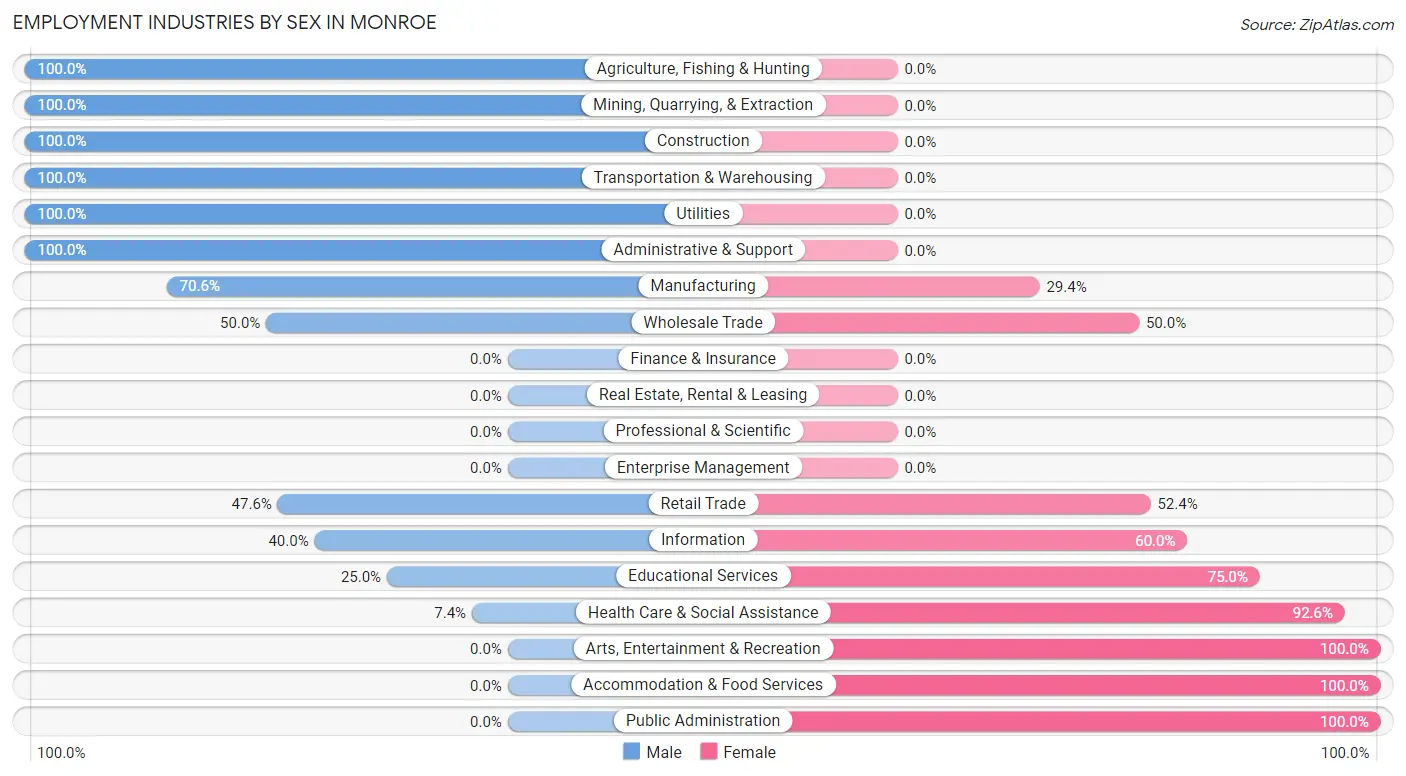
Employment Industries by Sex in Monroe
The Monroe industries that see more men than women are Agriculture, Fishing & Hunting (100.0%), Mining, Quarrying, & Extraction (100.0%), and Construction (100.0%), whereas the industries that tend to have a higher number of women are Arts, Entertainment & Recreation (100.0%), Accommodation & Food Services (100.0%), and Public Administration (100.0%).
| Industry | Male | Female |
| Agriculture, Fishing & Hunting | 8 (100.0%) | 0 (0.0%) |
| Mining, Quarrying, & Extraction | 12 (100.0%) | 0 (0.0%) |
| Construction | 9 (100.0%) | 0 (0.0%) |
| Manufacturing | 24 (70.6%) | 10 (29.4%) |
| Wholesale Trade | 3 (50.0%) | 3 (50.0%) |
| Retail Trade | 10 (47.6%) | 11 (52.4%) |
| Transportation & Warehousing | 2 (100.0%) | 0 (0.0%) |
| Utilities | 8 (100.0%) | 0 (0.0%) |
| Information | 2 (40.0%) | 3 (60.0%) |
| Finance & Insurance | 0 (0.0%) | 0 (0.0%) |
| Real Estate, Rental & Leasing | 0 (0.0%) | 0 (0.0%) |
| Professional & Scientific | 0 (0.0%) | 0 (0.0%) |
| Enterprise Management | 0 (0.0%) | 0 (0.0%) |
| Administrative & Support | 1 (100.0%) | 0 (0.0%) |
| Educational Services | 2 (25.0%) | 6 (75.0%) |
| Health Care & Social Assistance | 2 (7.4%) | 25 (92.6%) |
| Arts, Entertainment & Recreation | 0 (0.0%) | 1 (100.0%) |
| Accommodation & Food Services | 0 (0.0%) | 6 (100.0%) |
| Public Administration | 0 (0.0%) | 6 (100.0%) |
| Total | 83 (52.9%) | 74 (47.1%) |
Education in Monroe
School Enrollment in Monroe
The most common levels of schooling among the 67 students in Monroe are middle school (23 | 34.3%), nursery / preschool (16 | 23.9%), and high school (14 | 20.9%).
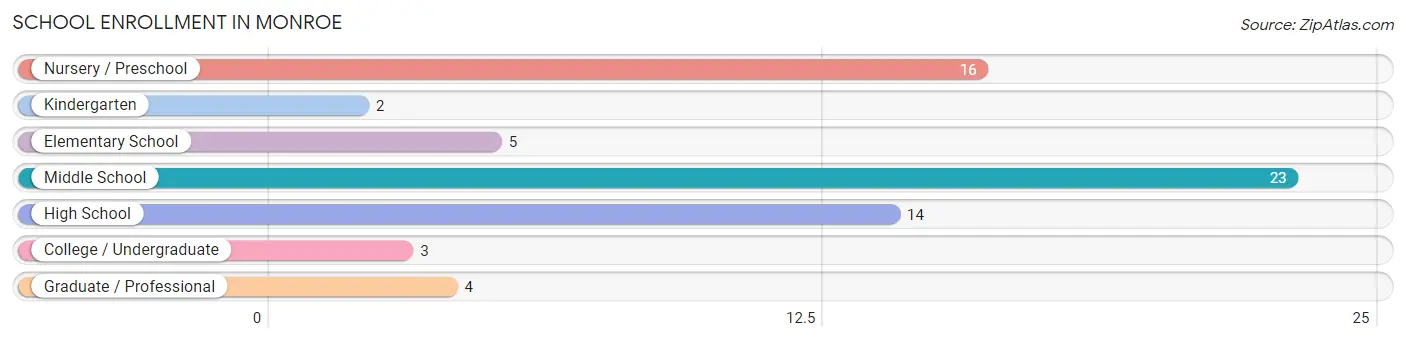
| School Level | # Students | % Students |
| Nursery / Preschool | 16 | 23.9% |
| Kindergarten | 2 | 3.0% |
| Elementary School | 5 | 7.5% |
| Middle School | 23 | 34.3% |
| High School | 14 | 20.9% |
| College / Undergraduate | 3 | 4.5% |
| Graduate / Professional | 4 | 6.0% |
| Total | 67 | 100.0% |
School Enrollment by Age by Funding Source in Monroe
Out of a total of 67 students who are enrolled in schools in Monroe, 33 (49.3%) attend a private institution, while the remaining 34 (50.7%) are enrolled in public schools. The age group of 35 years and over has the highest likelihood of being enrolled in private schools, with 2 (100.0% in the age bracket) enrolled. Conversely, the age group of 15 to 17 year olds has the lowest likelihood of being enrolled in a private school, with 7 (100.0% in the age bracket) attending a public institution.
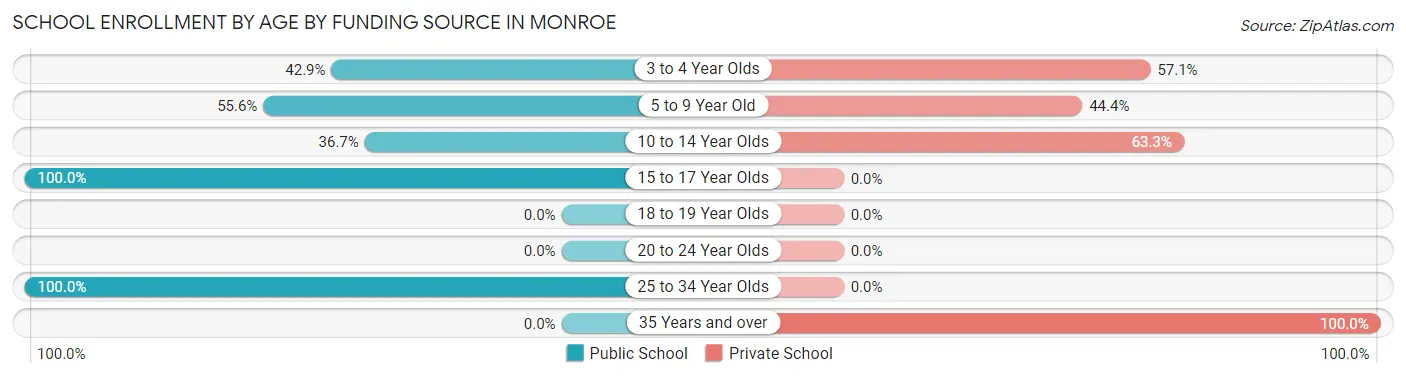
| Age Bracket | Public School | Private School |
| 3 to 4 Year Olds | 6 (42.9%) | 8 (57.1%) |
| 5 to 9 Year Old | 5 (55.6%) | 4 (44.4%) |
| 10 to 14 Year Olds | 11 (36.7%) | 19 (63.3%) |
| 15 to 17 Year Olds | 7 (100.0%) | 0 (0.0%) |
| 18 to 19 Year Olds | 0 (0.0%) | 0 (0.0%) |
| 20 to 24 Year Olds | 0 (0.0%) | 0 (0.0%) |
| 25 to 34 Year Olds | 5 (100.0%) | 0 (0.0%) |
| 35 Years and over | 0 (0.0%) | 2 (100.0%) |
| Total | 34 (50.7%) | 33 (49.3%) |
Educational Attainment by Field of Study in Monroe
Education (7 | 36.8%), arts & humanities (6 | 31.6%), science & technology (3 | 15.8%), business (2 | 10.5%), and psychology (1 | 5.3%) are the most common fields of study among 19 individuals in Monroe who have obtained a bachelor's degree or higher.
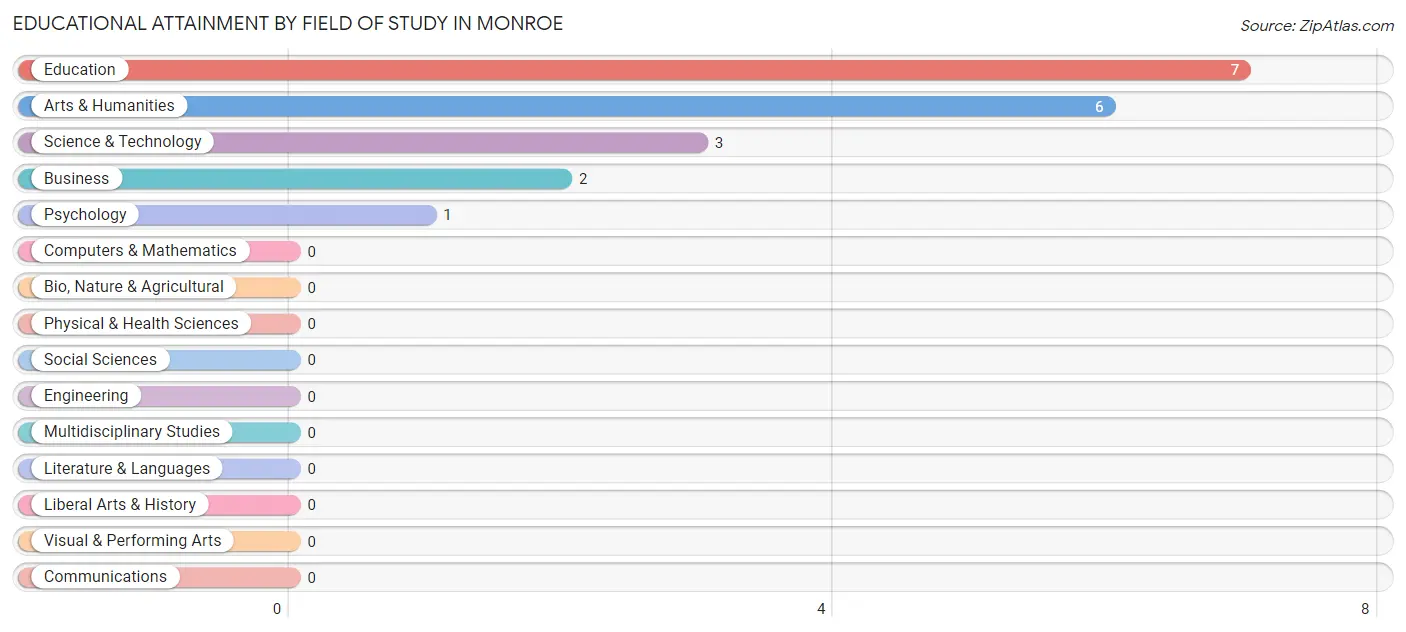
| Field of Study | # Graduates | % Graduates |
| Computers & Mathematics | 0 | 0.0% |
| Bio, Nature & Agricultural | 0 | 0.0% |
| Physical & Health Sciences | 0 | 0.0% |
| Psychology | 1 | 5.3% |
| Social Sciences | 0 | 0.0% |
| Engineering | 0 | 0.0% |
| Multidisciplinary Studies | 0 | 0.0% |
| Science & Technology | 3 | 15.8% |
| Business | 2 | 10.5% |
| Education | 7 | 36.8% |
| Literature & Languages | 0 | 0.0% |
| Liberal Arts & History | 0 | 0.0% |
| Visual & Performing Arts | 0 | 0.0% |
| Communications | 0 | 0.0% |
| Arts & Humanities | 6 | 31.6% |
| Total | 19 | 100.0% |
Transportation & Commute in Monroe
Vehicle Availability by Sex in Monroe
The most prevalent vehicle ownership categories in Monroe are males with 2 vehicles (37, accounting for 48.7%) and females with 2 vehicles (22, making up 51.4%).
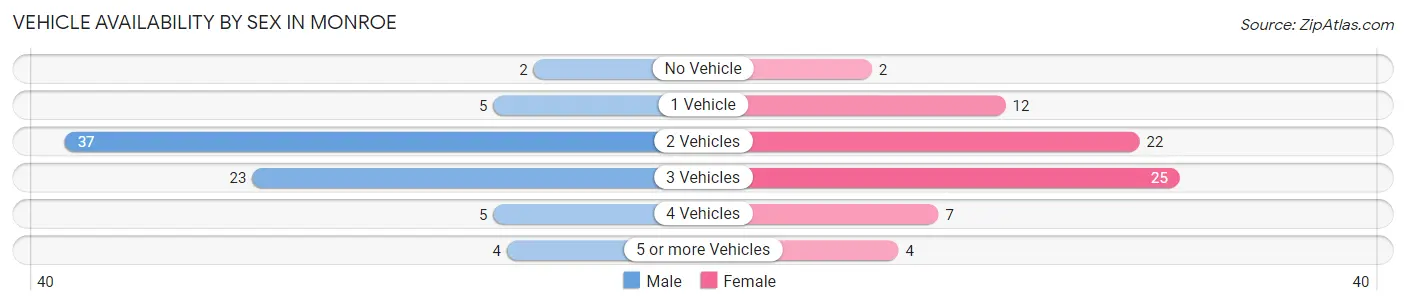
| Vehicles Available | Male | Female |
| No Vehicle | 2 (2.6%) | 2 (2.8%) |
| 1 Vehicle | 5 (6.6%) | 12 (16.7%) |
| 2 Vehicles | 37 (48.7%) | 22 (30.6%) |
| 3 Vehicles | 23 (30.3%) | 25 (34.7%) |
| 4 Vehicles | 5 (6.6%) | 7 (9.7%) |
| 5 or more Vehicles | 4 (5.3%) | 4 (5.6%) |
| Total | 76 (100.0%) | 72 (100.0%) |
Commute Time in Monroe
The most frequently occuring commute durations in Monroe are 20 to 24 minutes (46 commuters, 32.4%), 15 to 19 minutes (34 commuters, 23.9%), and less than 5 minutes (15 commuters, 10.6%).
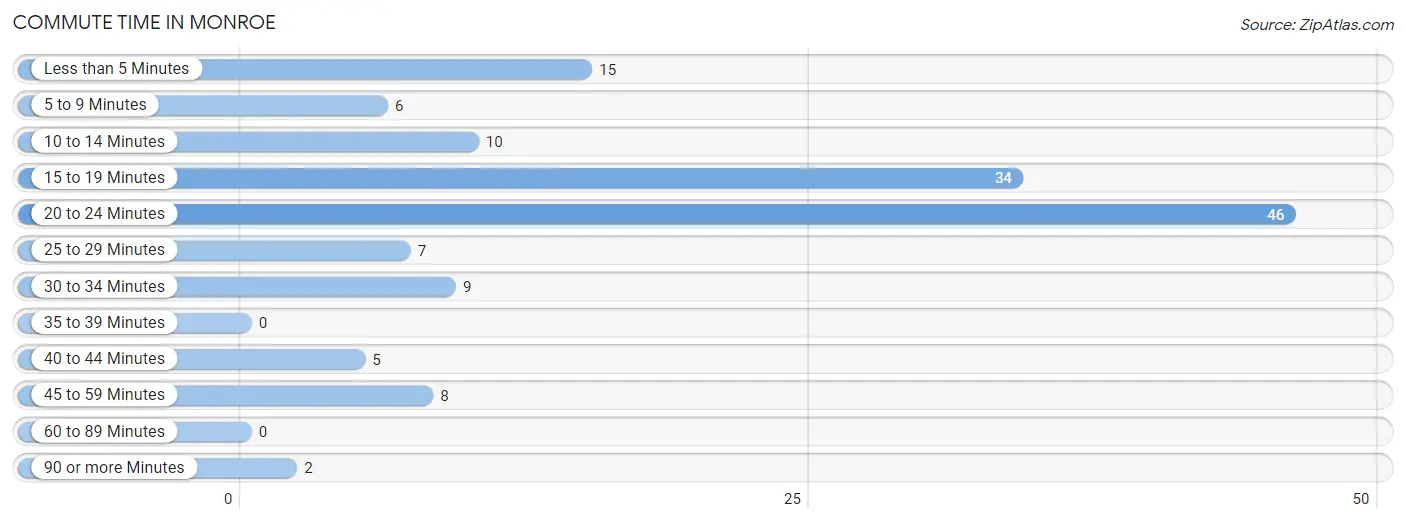
| Commute Time | # Commuters | % Commuters |
| Less than 5 Minutes | 15 | 10.6% |
| 5 to 9 Minutes | 6 | 4.2% |
| 10 to 14 Minutes | 10 | 7.0% |
| 15 to 19 Minutes | 34 | 23.9% |
| 20 to 24 Minutes | 46 | 32.4% |
| 25 to 29 Minutes | 7 | 4.9% |
| 30 to 34 Minutes | 9 | 6.3% |
| 35 to 39 Minutes | 0 | 0.0% |
| 40 to 44 Minutes | 5 | 3.5% |
| 45 to 59 Minutes | 8 | 5.6% |
| 60 to 89 Minutes | 0 | 0.0% |
| 90 or more Minutes | 2 | 1.4% |
Commute Time by Sex in Monroe
The most common commute times in Monroe are 20 to 24 minutes (25 commuters, 34.3%) for males and 20 to 24 minutes (21 commuters, 30.4%) for females.
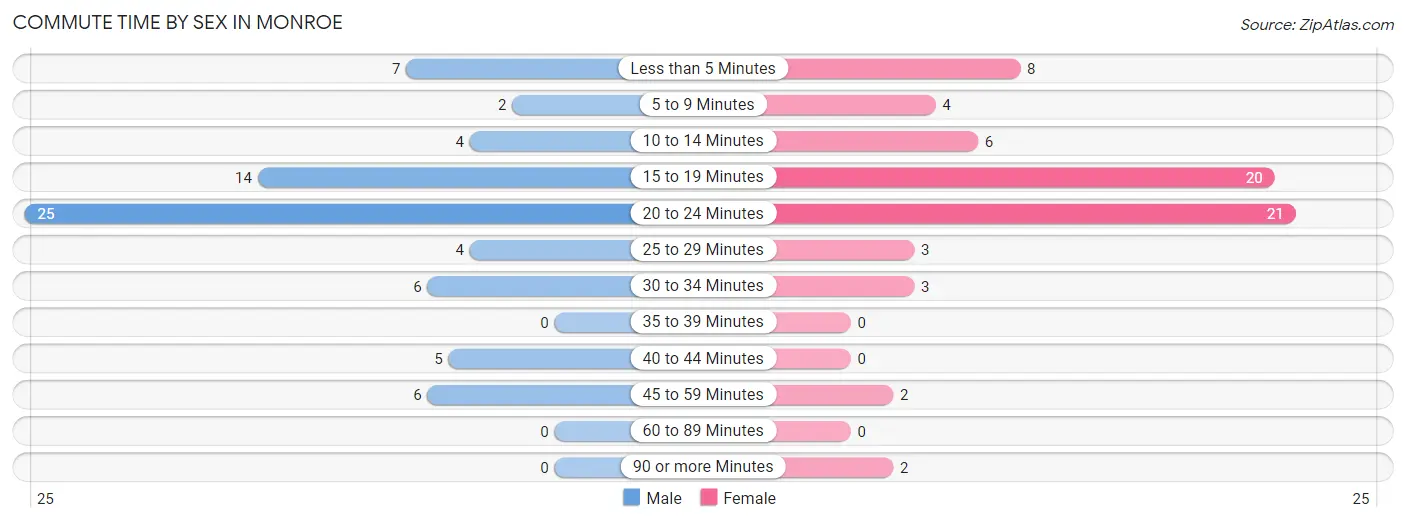
| Commute Time | Male | Female |
| Less than 5 Minutes | 7 (9.6%) | 8 (11.6%) |
| 5 to 9 Minutes | 2 (2.7%) | 4 (5.8%) |
| 10 to 14 Minutes | 4 (5.5%) | 6 (8.7%) |
| 15 to 19 Minutes | 14 (19.2%) | 20 (29.0%) |
| 20 to 24 Minutes | 25 (34.3%) | 21 (30.4%) |
| 25 to 29 Minutes | 4 (5.5%) | 3 (4.3%) |
| 30 to 34 Minutes | 6 (8.2%) | 3 (4.3%) |
| 35 to 39 Minutes | 0 (0.0%) | 0 (0.0%) |
| 40 to 44 Minutes | 5 (6.9%) | 0 (0.0%) |
| 45 to 59 Minutes | 6 (8.2%) | 2 (2.9%) |
| 60 to 89 Minutes | 0 (0.0%) | 0 (0.0%) |
| 90 or more Minutes | 0 (0.0%) | 2 (2.9%) |
Time of Departure to Work by Sex in Monroe
The most frequent times of departure to work in Monroe are 6:00 AM to 6:29 AM (13, 17.8%) for males and 4:00 PM to 11:59 PM (13, 18.8%) for females.
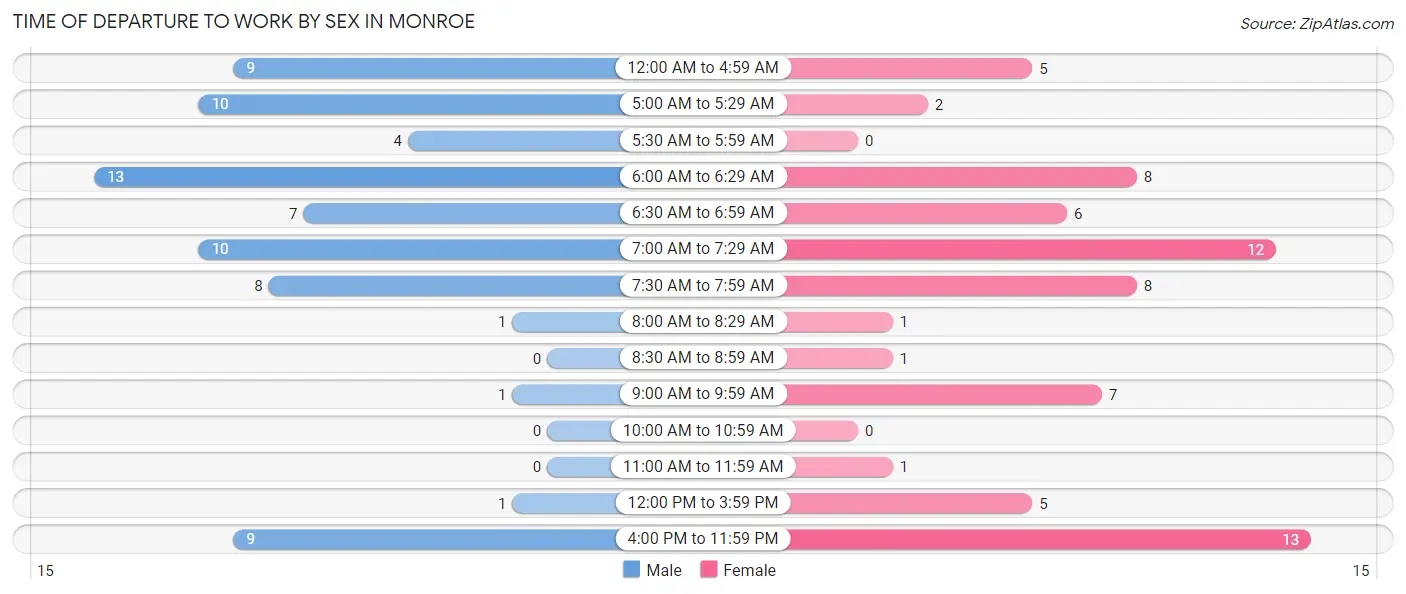
| Time of Departure | Male | Female |
| 12:00 AM to 4:59 AM | 9 (12.3%) | 5 (7.2%) |
| 5:00 AM to 5:29 AM | 10 (13.7%) | 2 (2.9%) |
| 5:30 AM to 5:59 AM | 4 (5.5%) | 0 (0.0%) |
| 6:00 AM to 6:29 AM | 13 (17.8%) | 8 (11.6%) |
| 6:30 AM to 6:59 AM | 7 (9.6%) | 6 (8.7%) |
| 7:00 AM to 7:29 AM | 10 (13.7%) | 12 (17.4%) |
| 7:30 AM to 7:59 AM | 8 (11.0%) | 8 (11.6%) |
| 8:00 AM to 8:29 AM | 1 (1.4%) | 1 (1.5%) |
| 8:30 AM to 8:59 AM | 0 (0.0%) | 1 (1.5%) |
| 9:00 AM to 9:59 AM | 1 (1.4%) | 7 (10.1%) |
| 10:00 AM to 10:59 AM | 0 (0.0%) | 0 (0.0%) |
| 11:00 AM to 11:59 AM | 0 (0.0%) | 1 (1.5%) |
| 12:00 PM to 3:59 PM | 1 (1.4%) | 5 (7.2%) |
| 4:00 PM to 11:59 PM | 9 (12.3%) | 13 (18.8%) |
| Total | 73 (100.0%) | 69 (100.0%) |
Housing Occupancy in Monroe
Occupancy by Ownership in Monroe
Of the total 127 dwellings in Monroe, owner-occupied units account for 99 (77.9%), while renter-occupied units make up 28 (22.1%).
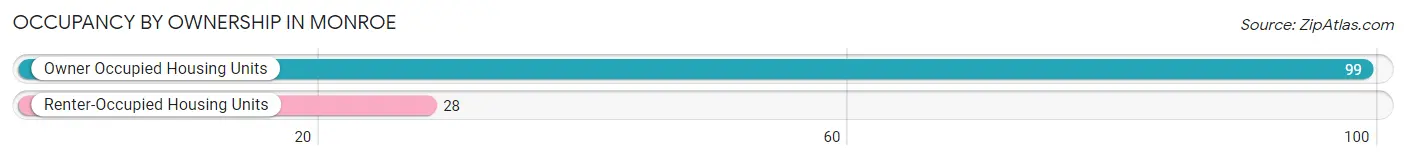
| Occupancy | # Housing Units | % Housing Units |
| Owner Occupied Housing Units | 99 | 77.9% |
| Renter-Occupied Housing Units | 28 | 22.1% |
| Total Occupied Housing Units | 127 | 100.0% |
Occupancy by Household Size in Monroe
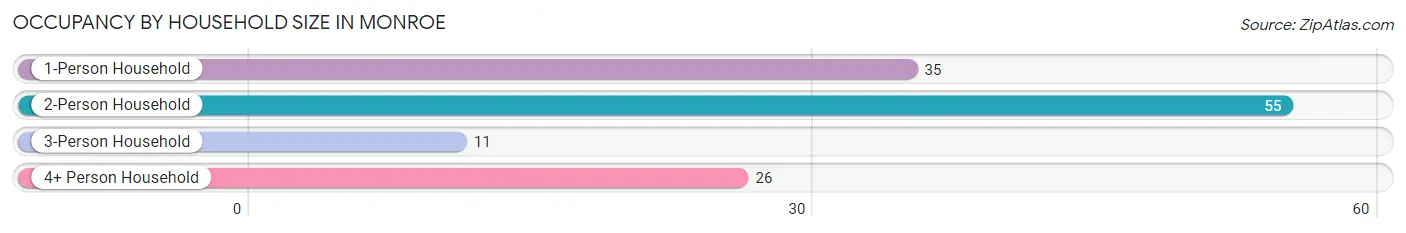
| Household Size | # Housing Units | % Housing Units |
| 1-Person Household | 35 | 27.6% |
| 2-Person Household | 55 | 43.3% |
| 3-Person Household | 11 | 8.7% |
| 4+ Person Household | 26 | 20.5% |
| Total Housing Units | 127 | 100.0% |
Occupancy by Ownership by Household Size in Monroe
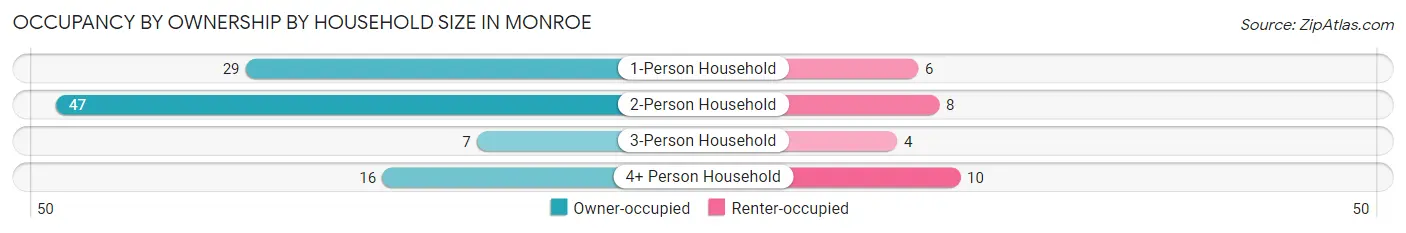
| Household Size | Owner-occupied | Renter-occupied |
| 1-Person Household | 29 (82.9%) | 6 (17.1%) |
| 2-Person Household | 47 (85.5%) | 8 (14.5%) |
| 3-Person Household | 7 (63.6%) | 4 (36.4%) |
| 4+ Person Household | 16 (61.5%) | 10 (38.5%) |
| Total Housing Units | 99 (77.9%) | 28 (22.1%) |
Occupancy by Educational Attainment in Monroe
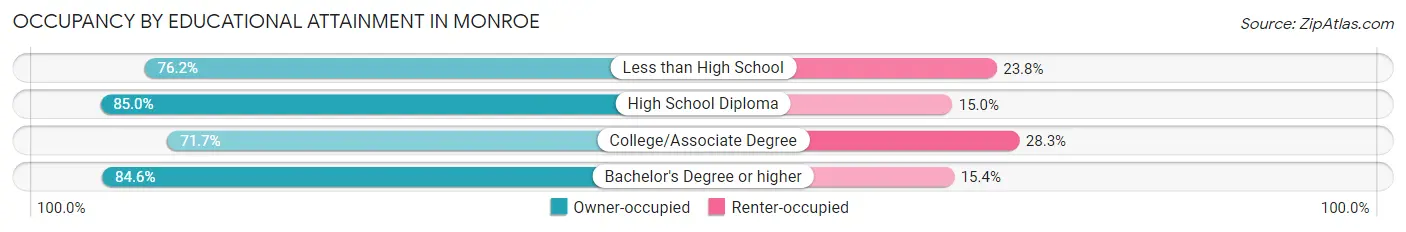
| Household Size | Owner-occupied | Renter-occupied |
| Less than High School | 16 (76.2%) | 5 (23.8%) |
| High School Diploma | 34 (85.0%) | 6 (15.0%) |
| College/Associate Degree | 38 (71.7%) | 15 (28.3%) |
| Bachelor's Degree or higher | 11 (84.6%) | 2 (15.4%) |
Occupancy by Age of Householder in Monroe
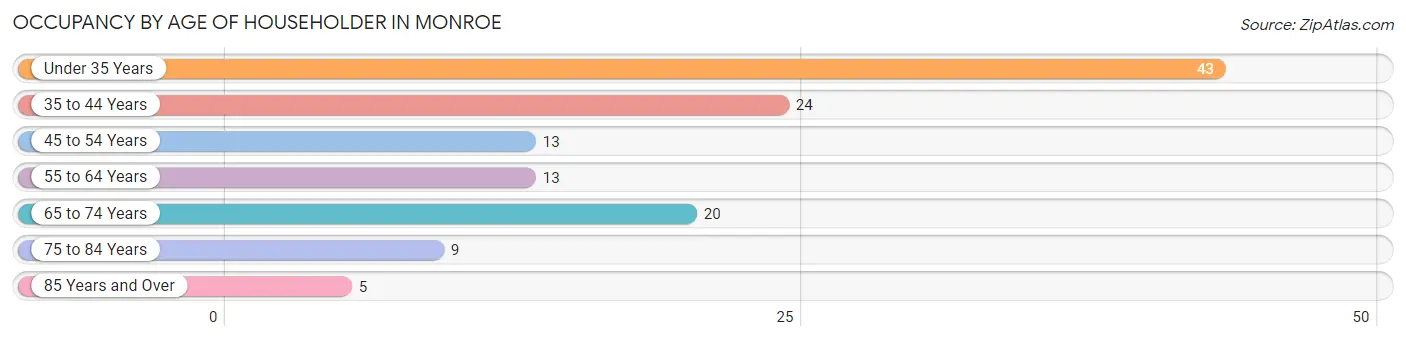
| Age Bracket | # Households | % Households |
| Under 35 Years | 43 | 33.9% |
| 35 to 44 Years | 24 | 18.9% |
| 45 to 54 Years | 13 | 10.2% |
| 55 to 64 Years | 13 | 10.2% |
| 65 to 74 Years | 20 | 15.8% |
| 75 to 84 Years | 9 | 7.1% |
| 85 Years and Over | 5 | 3.9% |
| Total | 127 | 100.0% |
Housing Finances in Monroe
Median Income by Occupancy in Monroe
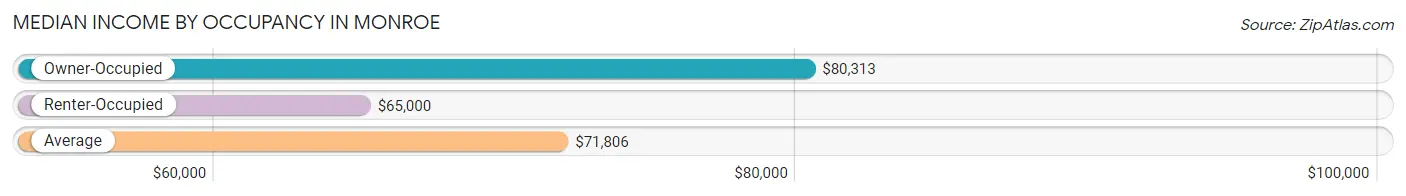
| Occupancy Type | # Households | Median Income |
| Owner-Occupied | 99 (77.9%) | $80,313 |
| Renter-Occupied | 28 (22.1%) | $65,000 |
| Average | 127 (100.0%) | $71,806 |
Occupancy by Householder Income Bracket in Monroe
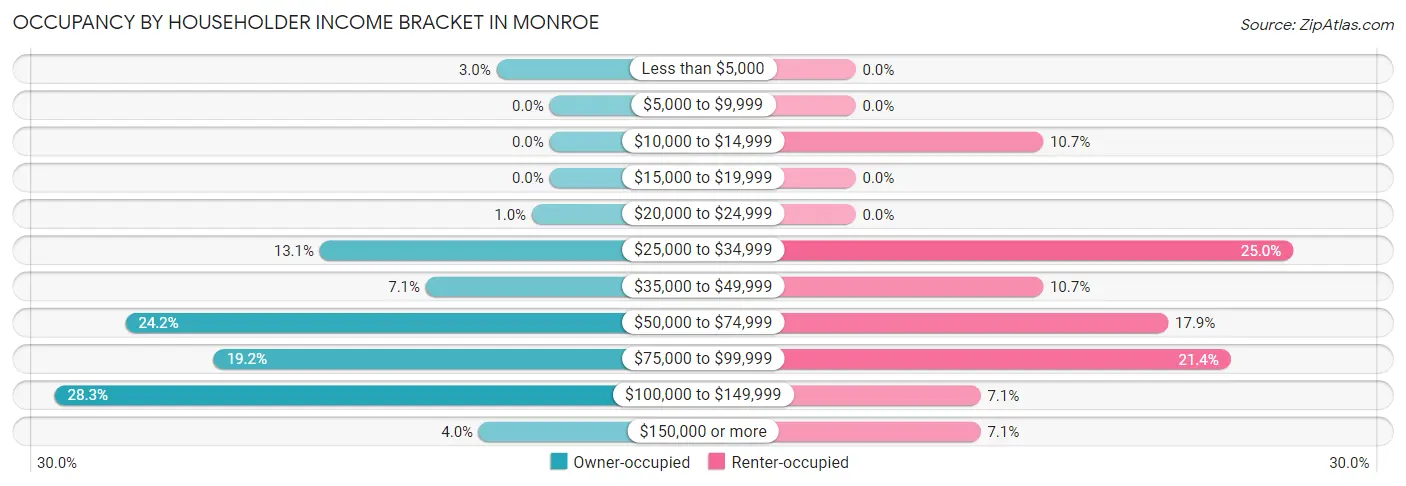
| Income Bracket | Owner-occupied | Renter-occupied |
| Less than $5,000 | 3 (3.0%) | 0 (0.0%) |
| $5,000 to $9,999 | 0 (0.0%) | 0 (0.0%) |
| $10,000 to $14,999 | 0 (0.0%) | 3 (10.7%) |
| $15,000 to $19,999 | 0 (0.0%) | 0 (0.0%) |
| $20,000 to $24,999 | 1 (1.0%) | 0 (0.0%) |
| $25,000 to $34,999 | 13 (13.1%) | 7 (25.0%) |
| $35,000 to $49,999 | 7 (7.1%) | 3 (10.7%) |
| $50,000 to $74,999 | 24 (24.2%) | 5 (17.9%) |
| $75,000 to $99,999 | 19 (19.2%) | 6 (21.4%) |
| $100,000 to $149,999 | 28 (28.3%) | 2 (7.1%) |
| $150,000 or more | 4 (4.0%) | 2 (7.1%) |
| Total | 99 (100.0%) | 28 (100.0%) |
Monthly Housing Cost Tiers in Monroe
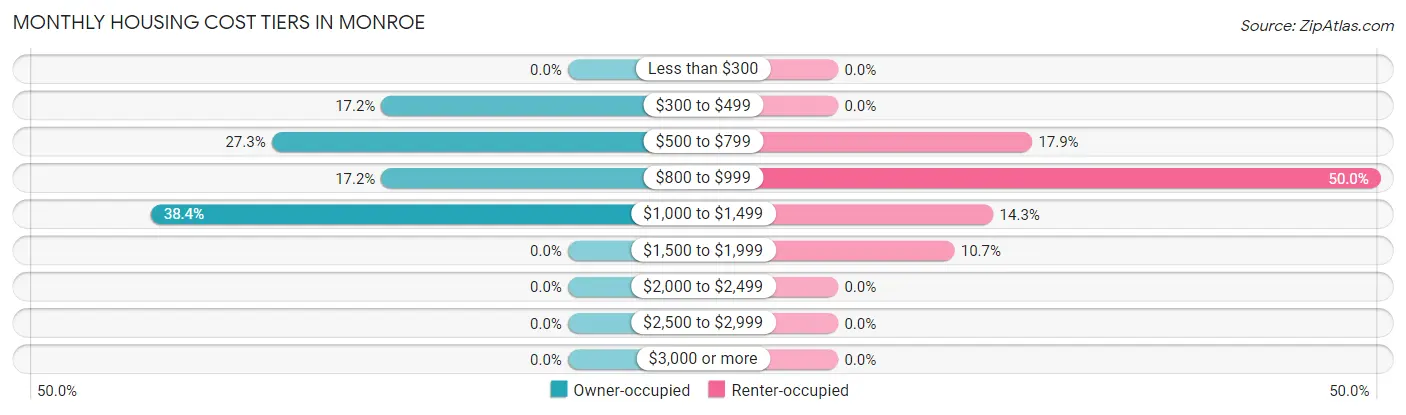
| Monthly Cost | Owner-occupied | Renter-occupied |
| Less than $300 | 0 (0.0%) | 0 (0.0%) |
| $300 to $499 | 17 (17.2%) | 0 (0.0%) |
| $500 to $799 | 27 (27.3%) | 5 (17.9%) |
| $800 to $999 | 17 (17.2%) | 14 (50.0%) |
| $1,000 to $1,499 | 38 (38.4%) | 4 (14.3%) |
| $1,500 to $1,999 | 0 (0.0%) | 3 (10.7%) |
| $2,000 to $2,499 | 0 (0.0%) | 0 (0.0%) |
| $2,500 to $2,999 | 0 (0.0%) | 0 (0.0%) |
| $3,000 or more | 0 (0.0%) | 0 (0.0%) |
| Total | 99 (100.0%) | 28 (100.0%) |
Physical Housing Characteristics in Monroe
Housing Structures in Monroe
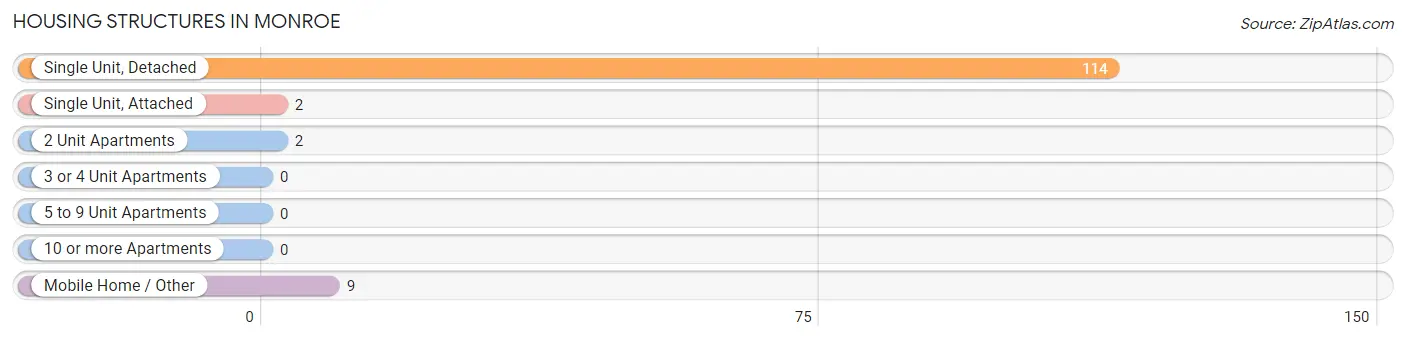
| Structure Type | # Housing Units | % Housing Units |
| Single Unit, Detached | 114 | 89.8% |
| Single Unit, Attached | 2 | 1.6% |
| 2 Unit Apartments | 2 | 1.6% |
| 3 or 4 Unit Apartments | 0 | 0.0% |
| 5 to 9 Unit Apartments | 0 | 0.0% |
| 10 or more Apartments | 0 | 0.0% |
| Mobile Home / Other | 9 | 7.1% |
| Total | 127 | 100.0% |
Housing Structures by Occupancy in Monroe
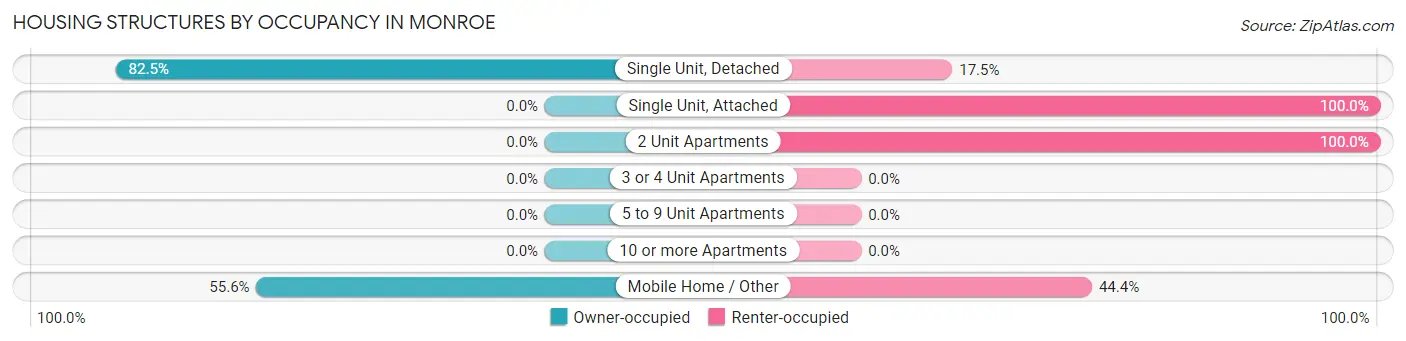
| Structure Type | Owner-occupied | Renter-occupied |
| Single Unit, Detached | 94 (82.5%) | 20 (17.5%) |
| Single Unit, Attached | 0 (0.0%) | 2 (100.0%) |
| 2 Unit Apartments | 0 (0.0%) | 2 (100.0%) |
| 3 or 4 Unit Apartments | 0 (0.0%) | 0 (0.0%) |
| 5 to 9 Unit Apartments | 0 (0.0%) | 0 (0.0%) |
| 10 or more Apartments | 0 (0.0%) | 0 (0.0%) |
| Mobile Home / Other | 5 (55.6%) | 4 (44.4%) |
| Total | 99 (77.9%) | 28 (22.1%) |
Housing Structures by Number of Rooms in Monroe
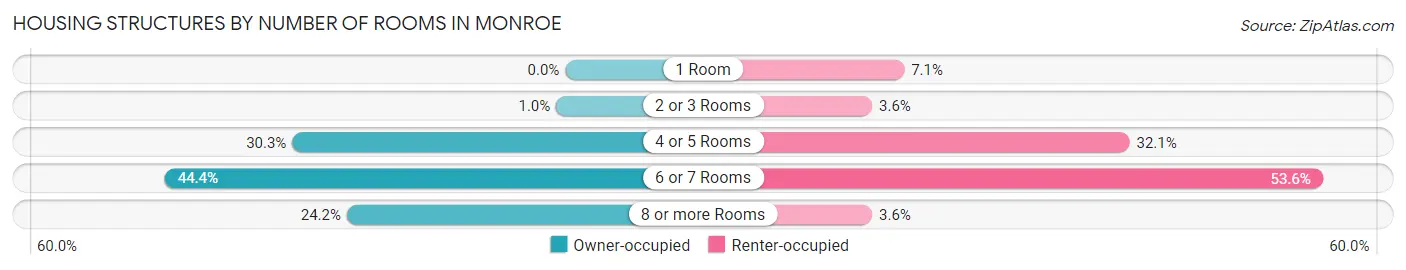
| Number of Rooms | Owner-occupied | Renter-occupied |
| 1 Room | 0 (0.0%) | 2 (7.1%) |
| 2 or 3 Rooms | 1 (1.0%) | 1 (3.6%) |
| 4 or 5 Rooms | 30 (30.3%) | 9 (32.1%) |
| 6 or 7 Rooms | 44 (44.4%) | 15 (53.6%) |
| 8 or more Rooms | 24 (24.2%) | 1 (3.6%) |
| Total | 99 (100.0%) | 28 (100.0%) |
Housing Structure by Heating Type in Monroe
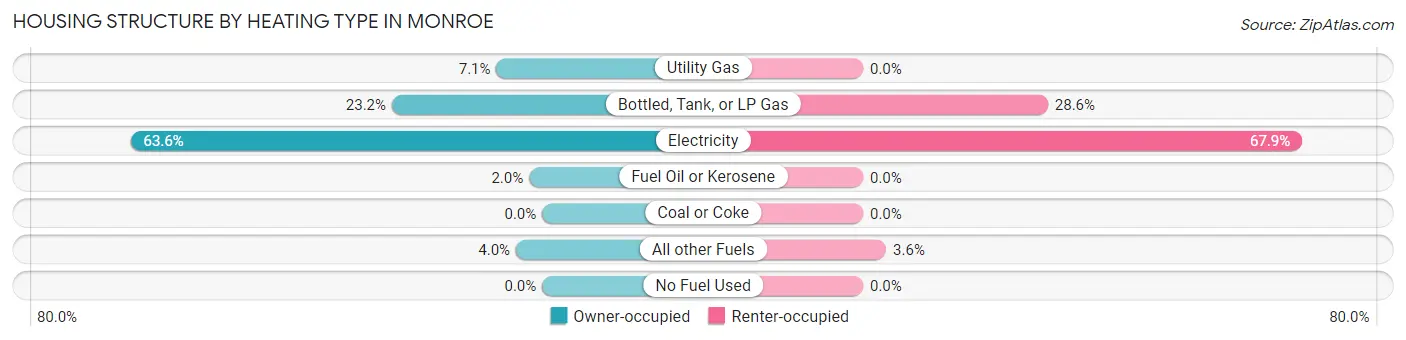
| Heating Type | Owner-occupied | Renter-occupied |
| Utility Gas | 7 (7.1%) | 0 (0.0%) |
| Bottled, Tank, or LP Gas | 23 (23.2%) | 8 (28.6%) |
| Electricity | 63 (63.6%) | 19 (67.9%) |
| Fuel Oil or Kerosene | 2 (2.0%) | 0 (0.0%) |
| Coal or Coke | 0 (0.0%) | 0 (0.0%) |
| All other Fuels | 4 (4.0%) | 1 (3.6%) |
| No Fuel Used | 0 (0.0%) | 0 (0.0%) |
| Total | 99 (100.0%) | 28 (100.0%) |
Household Vehicle Usage in Monroe
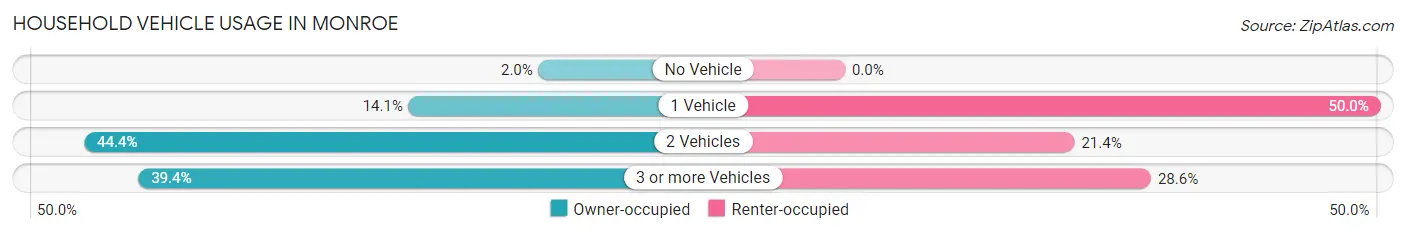
| Vehicles per Household | Owner-occupied | Renter-occupied |
| No Vehicle | 2 (2.0%) | 0 (0.0%) |
| 1 Vehicle | 14 (14.1%) | 14 (50.0%) |
| 2 Vehicles | 44 (44.4%) | 6 (21.4%) |
| 3 or more Vehicles | 39 (39.4%) | 8 (28.6%) |
| Total | 99 (100.0%) | 28 (100.0%) |
Real Estate & Mortgages in Monroe
Real Estate and Mortgage Overview in Monroe
| Characteristic | Without Mortgage | With Mortgage |
| Housing Units | 41 | 58 |
| Median Property Value | $99,000 | $85,000 |
| Median Household Income | $62,083 | $4 |
| Monthly Housing Costs | $518 | $0 |
| Real Estate Taxes | $1,725 | $0 |
Property Value by Mortgage Status in Monroe
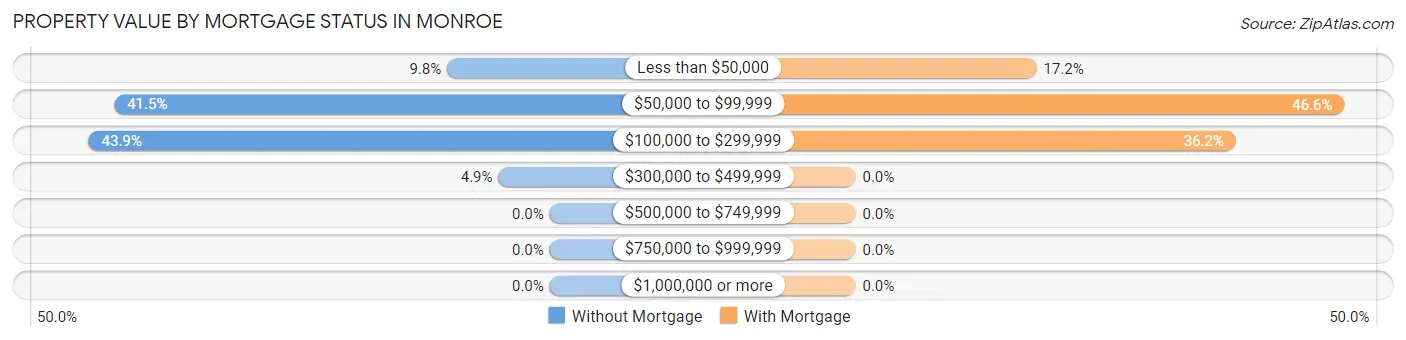
| Property Value | Without Mortgage | With Mortgage |
| Less than $50,000 | 4 (9.8%) | 10 (17.2%) |
| $50,000 to $99,999 | 17 (41.5%) | 27 (46.6%) |
| $100,000 to $299,999 | 18 (43.9%) | 21 (36.2%) |
| $300,000 to $499,999 | 2 (4.9%) | 0 (0.0%) |
| $500,000 to $749,999 | 0 (0.0%) | 0 (0.0%) |
| $750,000 to $999,999 | 0 (0.0%) | 0 (0.0%) |
| $1,000,000 or more | 0 (0.0%) | 0 (0.0%) |
| Total | 41 (100.0%) | 58 (100.0%) |
Household Income by Mortgage Status in Monroe
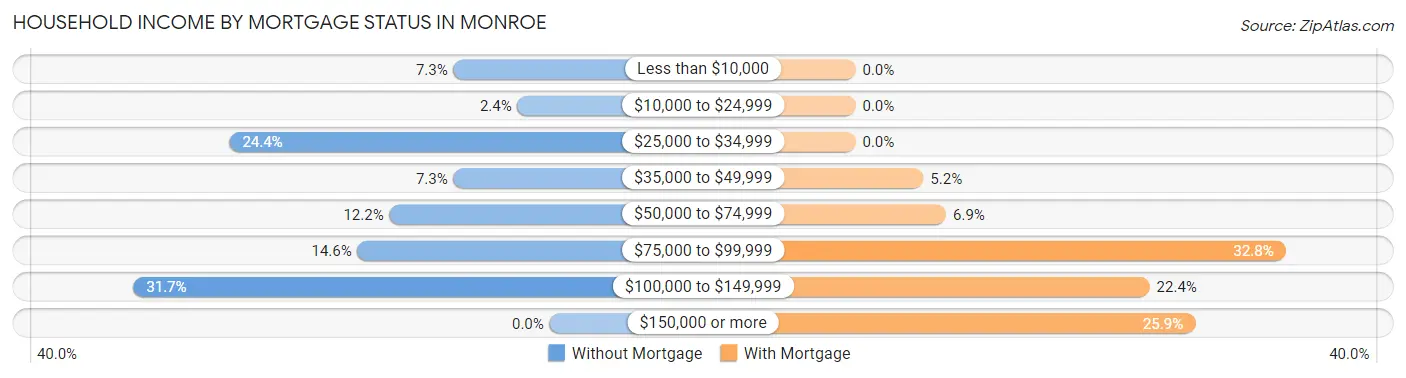
| Household Income | Without Mortgage | With Mortgage |
| Less than $10,000 | 3 (7.3%) | 0 (0.0%) |
| $10,000 to $24,999 | 1 (2.4%) | 0 (0.0%) |
| $25,000 to $34,999 | 10 (24.4%) | 0 (0.0%) |
| $35,000 to $49,999 | 3 (7.3%) | 3 (5.2%) |
| $50,000 to $74,999 | 5 (12.2%) | 4 (6.9%) |
| $75,000 to $99,999 | 6 (14.6%) | 19 (32.8%) |
| $100,000 to $149,999 | 13 (31.7%) | 13 (22.4%) |
| $150,000 or more | 0 (0.0%) | 15 (25.9%) |
| Total | 41 (100.0%) | 58 (100.0%) |
Property Value to Household Income Ratio in Monroe
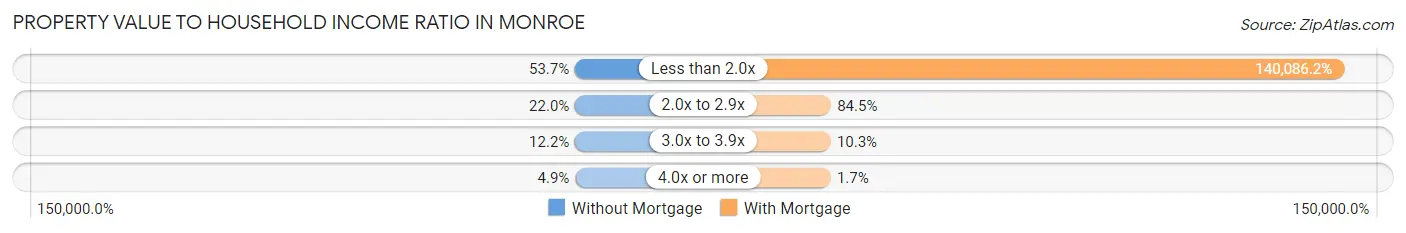
| Value-to-Income Ratio | Without Mortgage | With Mortgage |
| Less than 2.0x | 22 (53.7%) | 81,250 (140,086.2%) |
| 2.0x to 2.9x | 9 (22.0%) | 49 (84.5%) |
| 3.0x to 3.9x | 5 (12.2%) | 6 (10.3%) |
| 4.0x or more | 2 (4.9%) | 1 (1.7%) |
| Total | 41 (100.0%) | 58 (100.0%) |
Real Estate Taxes by Mortgage Status in Monroe
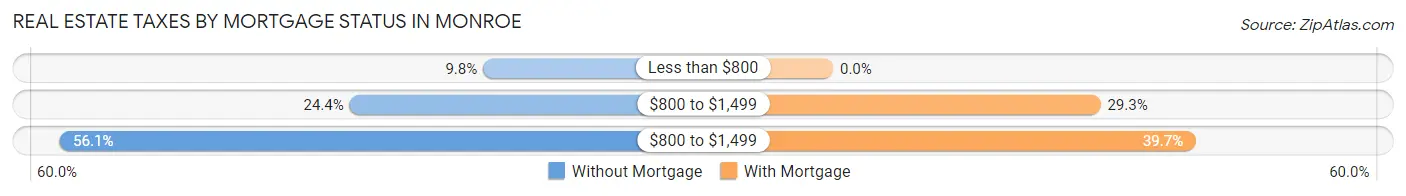
| Property Taxes | Without Mortgage | With Mortgage |
| Less than $800 | 4 (9.8%) | 0 (0.0%) |
| $800 to $1,499 | 10 (24.4%) | 17 (29.3%) |
| $800 to $1,499 | 23 (56.1%) | 23 (39.7%) |
| Total | 41 (100.0%) | 58 (100.0%) |
Health & Disability in Monroe
Health Insurance Coverage by Age in Monroe
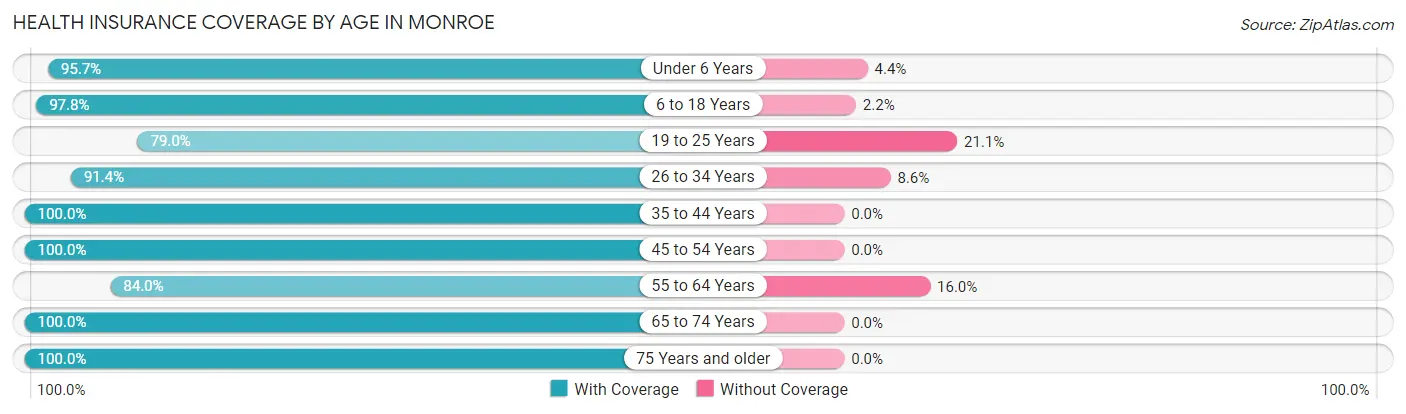
| Age Bracket | With Coverage | Without Coverage |
| Under 6 Years | 44 (95.7%) | 2 (4.3%) |
| 6 to 18 Years | 45 (97.8%) | 1 (2.2%) |
| 19 to 25 Years | 15 (78.9%) | 4 (21.0%) |
| 26 to 34 Years | 53 (91.4%) | 5 (8.6%) |
| 35 to 44 Years | 37 (100.0%) | 0 (0.0%) |
| 45 to 54 Years | 27 (100.0%) | 0 (0.0%) |
| 55 to 64 Years | 21 (84.0%) | 4 (16.0%) |
| 65 to 74 Years | 35 (100.0%) | 0 (0.0%) |
| 75 Years and older | 21 (100.0%) | 0 (0.0%) |
| Total | 298 (94.9%) | 16 (5.1%) |
Health Insurance Coverage by Citizenship Status in Monroe
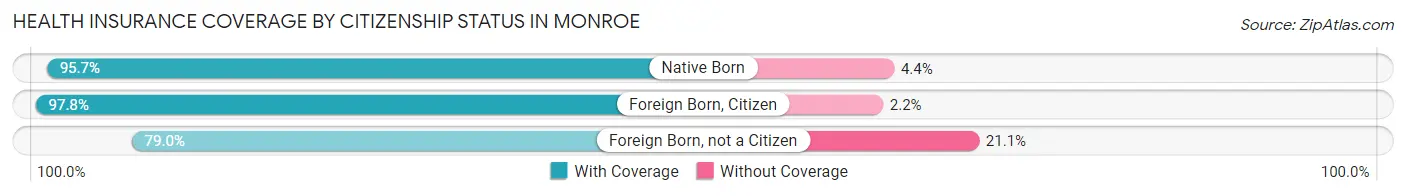
| Citizenship Status | With Coverage | Without Coverage |
| Native Born | 44 (95.7%) | 2 (4.3%) |
| Foreign Born, Citizen | 45 (97.8%) | 1 (2.2%) |
| Foreign Born, not a Citizen | 15 (78.9%) | 4 (21.0%) |
Health Insurance Coverage by Household Income in Monroe
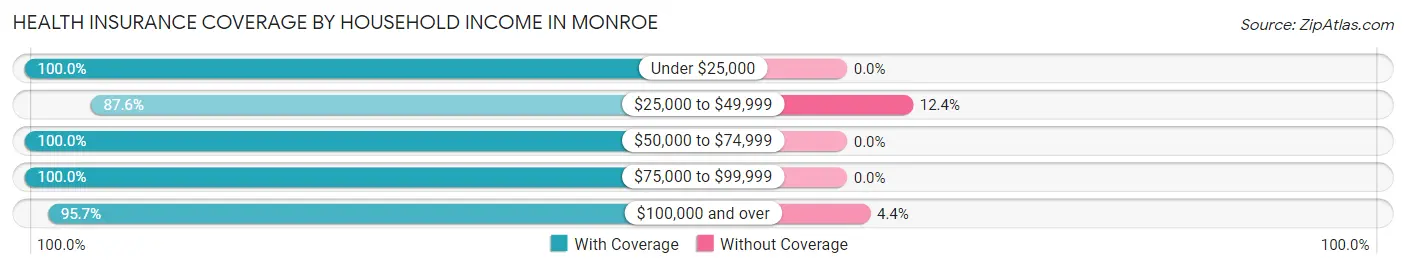
| Household Income | With Coverage | Without Coverage |
| Under $25,000 | 7 (100.0%) | 0 (0.0%) |
| $25,000 to $49,999 | 85 (87.6%) | 12 (12.4%) |
| $50,000 to $74,999 | 48 (100.0%) | 0 (0.0%) |
| $75,000 to $99,999 | 70 (100.0%) | 0 (0.0%) |
| $100,000 and over | 88 (95.7%) | 4 (4.3%) |
Public vs Private Health Insurance Coverage by Age in Monroe
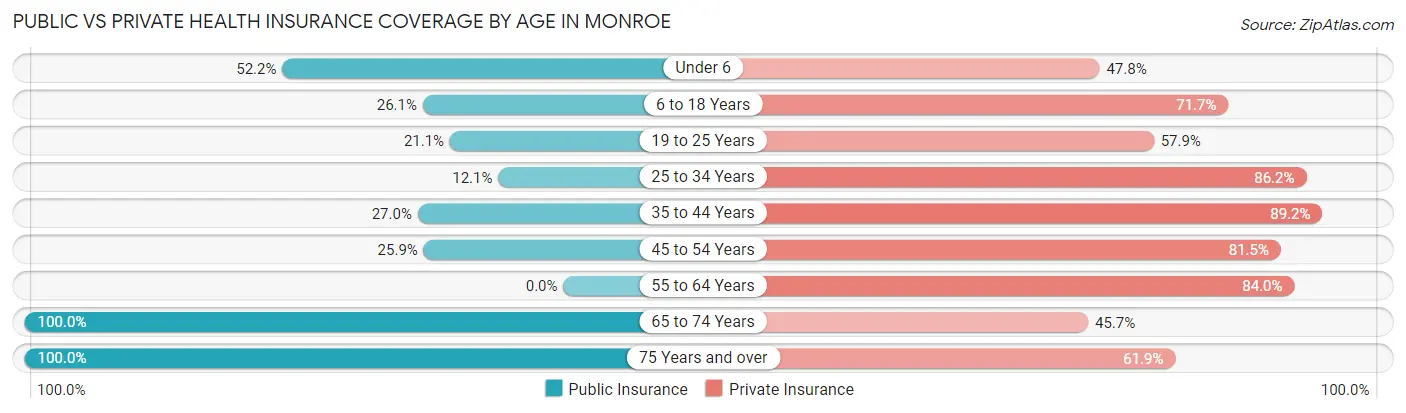
| Age Bracket | Public Insurance | Private Insurance |
| Under 6 | 24 (52.2%) | 22 (47.8%) |
| 6 to 18 Years | 12 (26.1%) | 33 (71.7%) |
| 19 to 25 Years | 4 (21.0%) | 11 (57.9%) |
| 25 to 34 Years | 7 (12.1%) | 50 (86.2%) |
| 35 to 44 Years | 10 (27.0%) | 33 (89.2%) |
| 45 to 54 Years | 7 (25.9%) | 22 (81.5%) |
| 55 to 64 Years | 0 (0.0%) | 21 (84.0%) |
| 65 to 74 Years | 35 (100.0%) | 16 (45.7%) |
| 75 Years and over | 21 (100.0%) | 13 (61.9%) |
| Total | 120 (38.2%) | 221 (70.4%) |
Disability Status by Sex by Age in Monroe
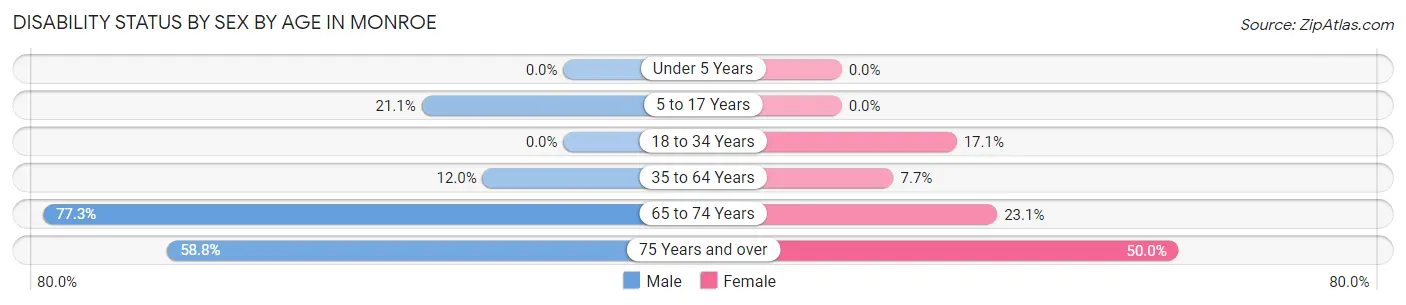
| Age Bracket | Male | Female |
| Under 5 Years | 0 (0.0%) | 0 (0.0%) |
| 5 to 17 Years | 4 (21.0%) | 0 (0.0%) |
| 18 to 34 Years | 0 (0.0%) | 7 (17.1%) |
| 35 to 64 Years | 6 (12.0%) | 3 (7.7%) |
| 65 to 74 Years | 17 (77.3%) | 3 (23.1%) |
| 75 Years and over | 10 (58.8%) | 2 (50.0%) |
Disability Class by Sex by Age in Monroe
Disability Class: Hearing Difficulty
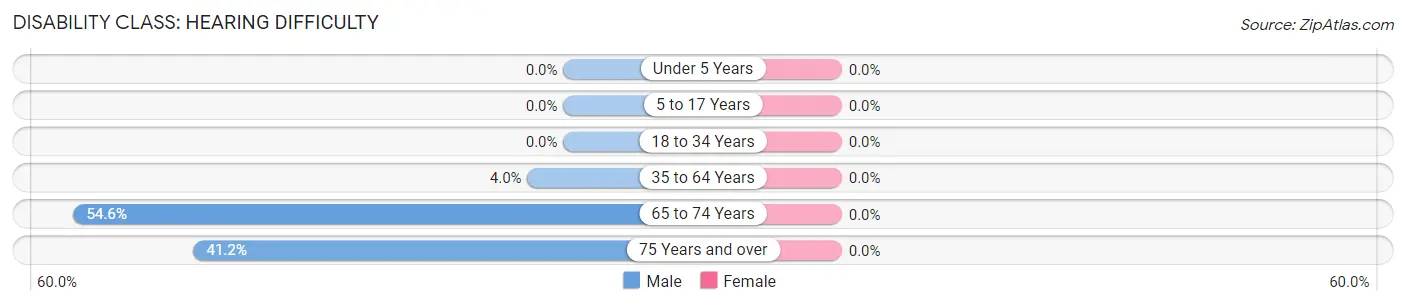
| Age Bracket | Male | Female |
| Under 5 Years | 0 (0.0%) | 0 (0.0%) |
| 5 to 17 Years | 0 (0.0%) | 0 (0.0%) |
| 18 to 34 Years | 0 (0.0%) | 0 (0.0%) |
| 35 to 64 Years | 2 (4.0%) | 0 (0.0%) |
| 65 to 74 Years | 12 (54.5%) | 0 (0.0%) |
| 75 Years and over | 7 (41.2%) | 0 (0.0%) |
Disability Class: Vision Difficulty
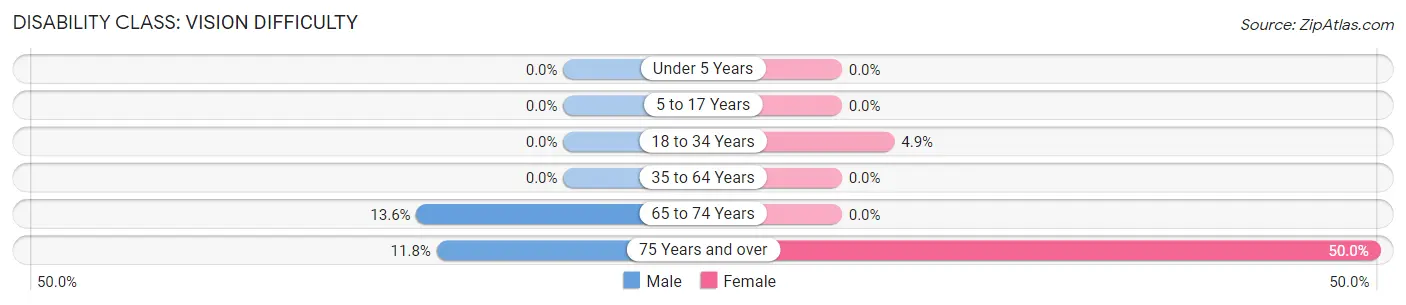
| Age Bracket | Male | Female |
| Under 5 Years | 0 (0.0%) | 0 (0.0%) |
| 5 to 17 Years | 0 (0.0%) | 0 (0.0%) |
| 18 to 34 Years | 0 (0.0%) | 2 (4.9%) |
| 35 to 64 Years | 0 (0.0%) | 0 (0.0%) |
| 65 to 74 Years | 3 (13.6%) | 0 (0.0%) |
| 75 Years and over | 2 (11.8%) | 2 (50.0%) |
Disability Class: Cognitive Difficulty
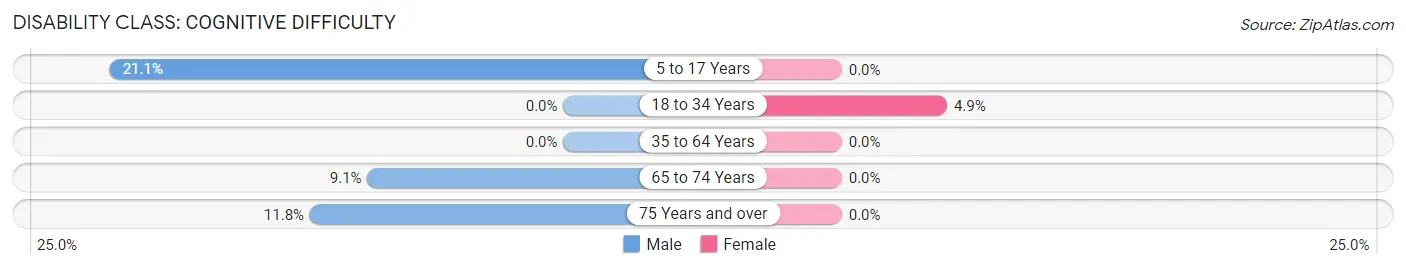
| Age Bracket | Male | Female |
| 5 to 17 Years | 4 (21.0%) | 0 (0.0%) |
| 18 to 34 Years | 0 (0.0%) | 2 (4.9%) |
| 35 to 64 Years | 0 (0.0%) | 0 (0.0%) |
| 65 to 74 Years | 2 (9.1%) | 0 (0.0%) |
| 75 Years and over | 2 (11.8%) | 0 (0.0%) |
Disability Class: Ambulatory Difficulty
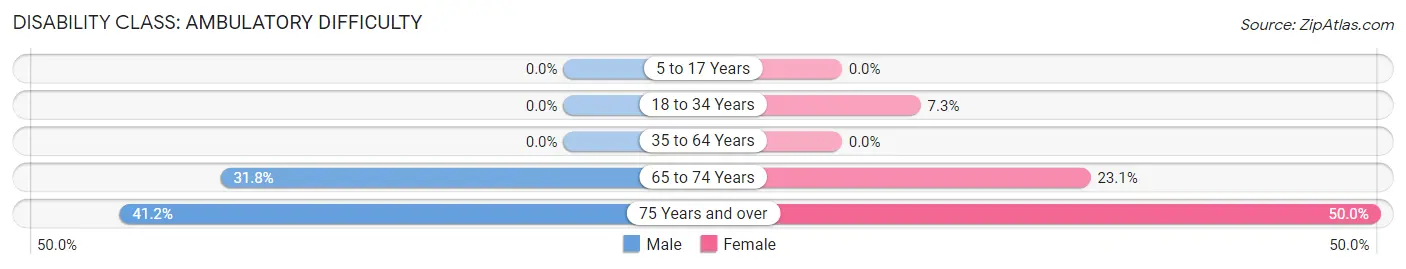
| Age Bracket | Male | Female |
| 5 to 17 Years | 0 (0.0%) | 0 (0.0%) |
| 18 to 34 Years | 0 (0.0%) | 3 (7.3%) |
| 35 to 64 Years | 0 (0.0%) | 0 (0.0%) |
| 65 to 74 Years | 7 (31.8%) | 3 (23.1%) |
| 75 Years and over | 7 (41.2%) | 2 (50.0%) |
Disability Class: Self-Care Difficulty
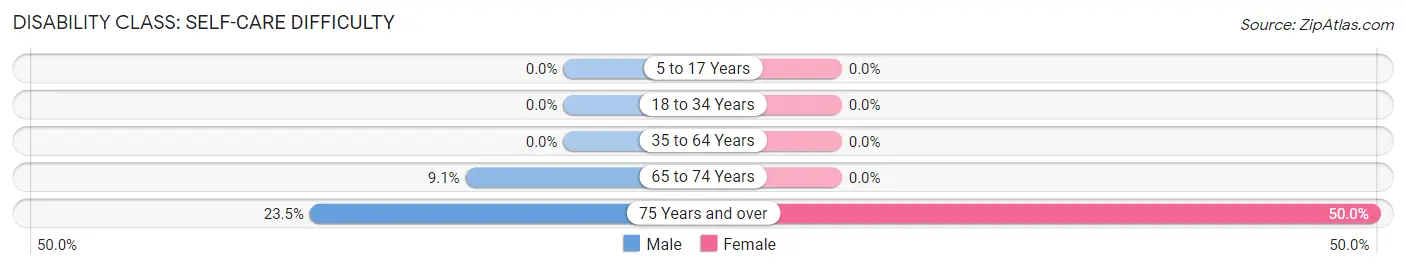
| Age Bracket | Male | Female |
| 5 to 17 Years | 0 (0.0%) | 0 (0.0%) |
| 18 to 34 Years | 0 (0.0%) | 0 (0.0%) |
| 35 to 64 Years | 0 (0.0%) | 0 (0.0%) |
| 65 to 74 Years | 2 (9.1%) | 0 (0.0%) |
| 75 Years and over | 4 (23.5%) | 2 (50.0%) |
Technology Access in Monroe
Computing Device Access in Monroe
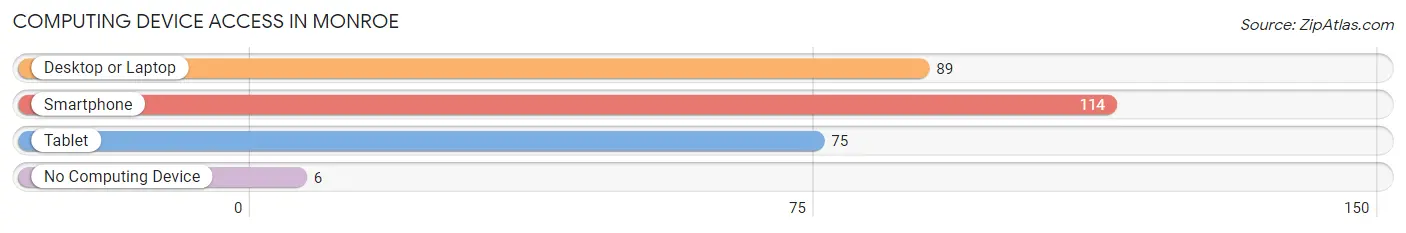
| Device Type | # Households | % Households |
| Desktop or Laptop | 89 | 70.1% |
| Smartphone | 114 | 89.8% |
| Tablet | 75 | 59.1% |
| No Computing Device | 6 | 4.7% |
| Total | 127 | 100.0% |
Internet Access in Monroe
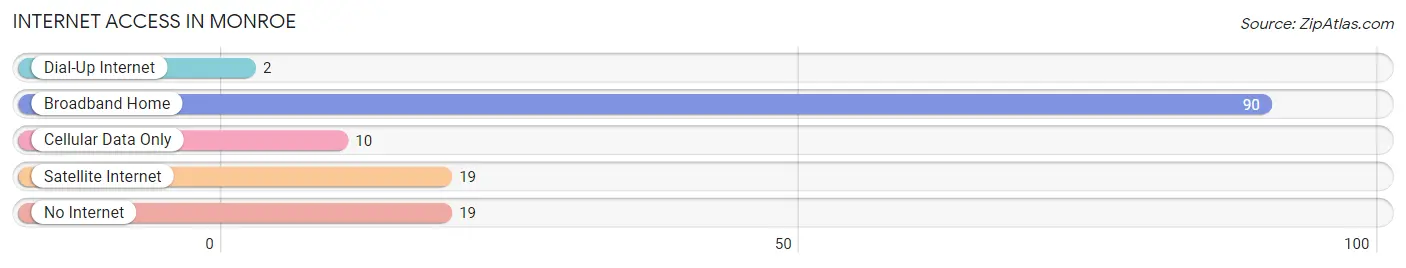
| Internet Type | # Households | % Households |
| Dial-Up Internet | 2 | 1.6% |
| Broadband Home | 90 | 70.9% |
| Cellular Data Only | 10 | 7.9% |
| Satellite Internet | 19 | 15.0% |
| No Internet | 19 | 15.0% |
| Total | 127 | 100.0% |
Monroe Summary
Monroe, Nebraska is a small town located in the southeastern corner of the state, in Nemaha County. It is situated on the banks of the Missouri River, and is surrounded by rolling hills and farmland. The town has a population of just over 1,000 people, and is known for its small-town charm and friendly atmosphere.
History
Monroe was founded in 1856 by a group of settlers from Ohio. The town was named after James Monroe, the fifth President of the United States. The settlers were attracted to the area due to its fertile soil and abundant natural resources. The town quickly grew, and by the late 1800s, it had become a thriving agricultural center.
In the early 1900s, the town began to diversify its economy. A number of businesses, including a flour mill, a creamery, and a brickyard, were established. The town also became a popular tourist destination, with visitors coming to enjoy the scenic beauty of the area.
Geography
Monroe is located in the southeastern corner of Nebraska, in Nemaha County. It is situated on the banks of the Missouri River, and is surrounded by rolling hills and farmland. The town is located approximately 30 miles south of Omaha, and is easily accessible by car or train.
The climate in Monroe is generally mild, with hot summers and cold winters. The average temperature in the summer is around 80 degrees Fahrenheit, and in the winter it is around 30 degrees Fahrenheit. The town receives an average of 30 inches of precipitation each year.
Economy
Monroe’s economy is largely based on agriculture. The town is home to a number of farms, which produce a variety of crops, including corn, soybeans, and wheat. The town also has a number of businesses, including a flour mill, a creamery, and a brickyard.
In addition to agriculture, Monroe is also home to a number of small businesses, including restaurants, shops, and other services. The town is also home to a number of manufacturing companies, which produce a variety of products, including furniture, clothing, and electronics.
Demographics
As of the 2010 census, Monroe had a population of 1,072 people. The town is predominantly white, with a small Hispanic population. The median household income in Monroe is $45,000, and the median home value is $90,000. The town has a low unemployment rate, and a high rate of homeownership.
Monroe is a small town with a big heart. It is a place where people come together to celebrate the town’s history and culture, and to enjoy the beauty of the surrounding area. The town is a great place to live, work, and raise a family.
Common Questions
What is Per Capita Income in Monroe?
Per Capita income in Monroe is $38,612.
What is the Median Family Income in Monroe?
Median Family Income in Monroe is $83,500.
What is the Median Household income in Monroe?
Median Household Income in Monroe is $71,806.
What is Income or Wage Gap in Monroe?
Income or Wage Gap in Monroe is 39.0%.
Women in Monroe earn 61.0 cents for every dollar earned by a man.
What is Inequality or Gini Index in Monroe?
Inequality or Gini Index in Monroe is 0.42.
What is the Total Population of Monroe?
Total Population of Monroe is 314.
What is the Total Male Population of Monroe?
Total Male Population of Monroe is 162.
What is the Total Female Population of Monroe?
Total Female Population of Monroe is 152.
What is the Ratio of Males per 100 Females in Monroe?
There are 106.58 Males per 100 Females in Monroe.
What is the Ratio of Females per 100 Males in Monroe?
There are 93.83 Females per 100 Males in Monroe.
What is the Median Population Age in Monroe?
Median Population Age in Monroe is 33.0 Years.
What is the Average Family Size in Monroe
Average Family Size in Monroe is 3.1 People.
What is the Average Household Size in Monroe
Average Household Size in Monroe is 2.5 People.
How Large is the Labor Force in Monroe?
There are 160 People in the Labor Forcein in Monroe.
What is the Percentage of People in the Labor Force in Monroe?
69.9% of People are in the Labor Force in Monroe.
What is the Unemployment Rate in Monroe?
Unemployment Rate in Monroe is 1.9%.