Milligan, NE Map & Demographics
Milligan Map
Milligan Overview
$31,061
PER CAPITA INCOME
$86,875
AVG FAMILY INCOME
$53,000
AVG HOUSEHOLD INCOME
0.41
INEQUALITY / GINI INDEX
256
TOTAL POPULATION
104
MALE POPULATION
152
FEMALE POPULATION
68.42
MALES / 100 FEMALES
146.15
FEMALES / 100 MALES
54.3
MEDIAN AGE
2.8
AVG FAMILY SIZE
2.2
AVG HOUSEHOLD SIZE
127
LABOR FORCE [ PEOPLE ]
59.6%
PERCENT IN LABOR FORCE
Milligan Zip Codes
Milligan Area Codes
Income in Milligan
Income Overview in Milligan
Per Capita Income in Milligan is $31,061, while median incomes of families and households are $86,875 and $53,000 respectively.
| Characteristic | Number | Measure |
| Per Capita Income | 256 | $31,061 |
| Median Family Income | 65 | $86,875 |
| Mean Family Income | 65 | $92,642 |
| Median Household Income | 118 | $53,000 |
| Mean Household Income | 118 | $67,935 |
| Income Deficit | 65 | $0 |
| Wage / Income Gap (%) | 256 | 0.00% |
| Wage / Income Gap ($) | 256 | 100.00¢ per $1 |
| Gini / Inequality Index | 256 | 0.41 |
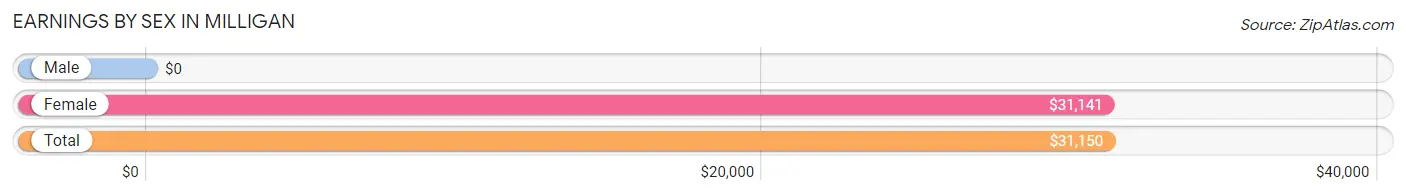
Earnings by Sex in Milligan
| Sex | Number | Average Earnings |
| Male | 66 (47.5%) | $0 |
| Female | 73 (52.5%) | $31,141 |
| Total | 139 (100.0%) | $31,150 |
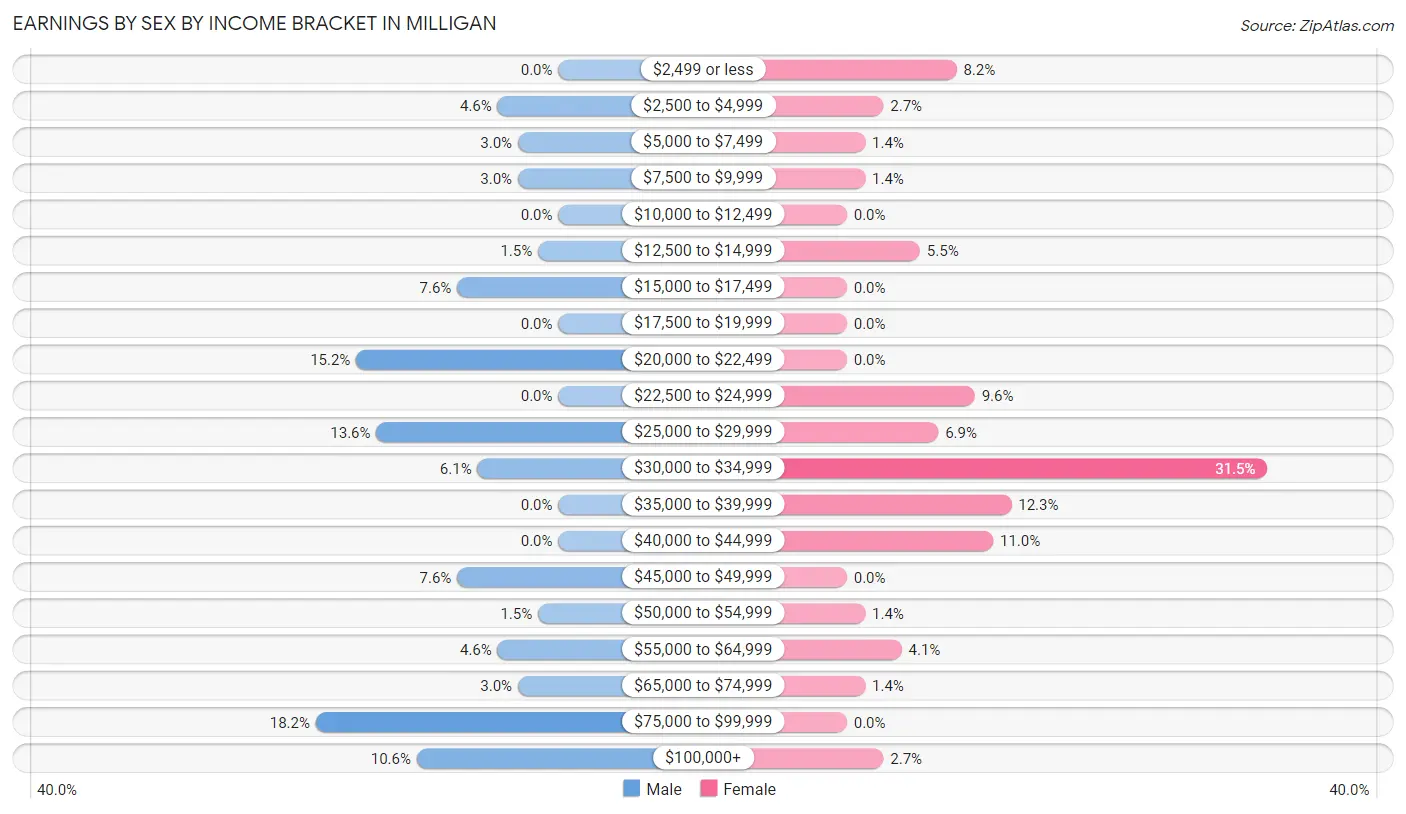
Earnings by Sex by Income Bracket in Milligan
The most common earnings brackets in Milligan are $75,000 to $99,999 for men (12 | 18.2%) and $30,000 to $34,999 for women (23 | 31.5%).
| Income | Male | Female |
| $2,499 or less | 0 (0.0%) | 6 (8.2%) |
| $2,500 to $4,999 | 3 (4.5%) | 2 (2.7%) |
| $5,000 to $7,499 | 2 (3.0%) | 1 (1.4%) |
| $7,500 to $9,999 | 2 (3.0%) | 1 (1.4%) |
| $10,000 to $12,499 | 0 (0.0%) | 0 (0.0%) |
| $12,500 to $14,999 | 1 (1.5%) | 4 (5.5%) |
| $15,000 to $17,499 | 5 (7.6%) | 0 (0.0%) |
| $17,500 to $19,999 | 0 (0.0%) | 0 (0.0%) |
| $20,000 to $22,499 | 10 (15.1%) | 0 (0.0%) |
| $22,500 to $24,999 | 0 (0.0%) | 7 (9.6%) |
| $25,000 to $29,999 | 9 (13.6%) | 5 (6.9%) |
| $30,000 to $34,999 | 4 (6.1%) | 23 (31.5%) |
| $35,000 to $39,999 | 0 (0.0%) | 9 (12.3%) |
| $40,000 to $44,999 | 0 (0.0%) | 8 (11.0%) |
| $45,000 to $49,999 | 5 (7.6%) | 0 (0.0%) |
| $50,000 to $54,999 | 1 (1.5%) | 1 (1.4%) |
| $55,000 to $64,999 | 3 (4.5%) | 3 (4.1%) |
| $65,000 to $74,999 | 2 (3.0%) | 1 (1.4%) |
| $75,000 to $99,999 | 12 (18.2%) | 0 (0.0%) |
| $100,000+ | 7 (10.6%) | 2 (2.7%) |
| Total | 66 (100.0%) | 73 (100.0%) |
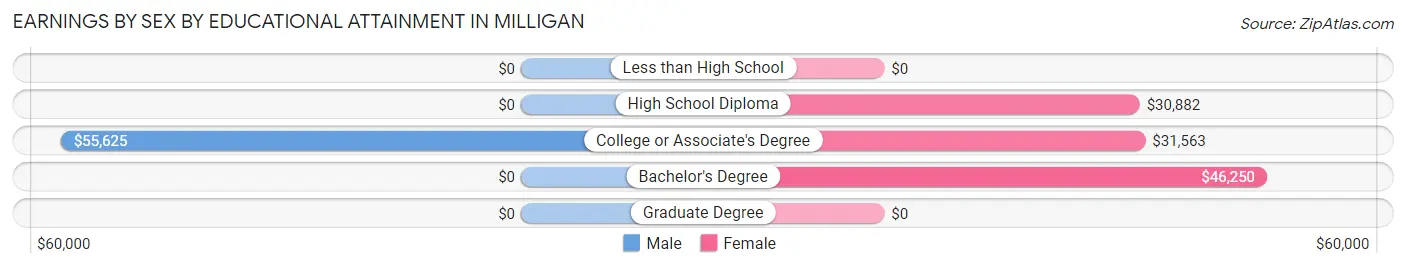
Earnings by Sex by Educational Attainment in Milligan
| Educational Attainment | Male Income | Female Income |
| Less than High School | - | - |
| High School Diploma | - | - |
| College or Associate's Degree | $55,625 | $31,563 |
| Bachelor's Degree | - | - |
| Graduate Degree | - | - |
| Total | - | - |
Family Income in Milligan
Family Income Brackets in Milligan
According to the Milligan family income data, there are 24 families falling into the $100,000 to $149,999 income range, which is the most common income bracket and makes up 36.9% of all families.
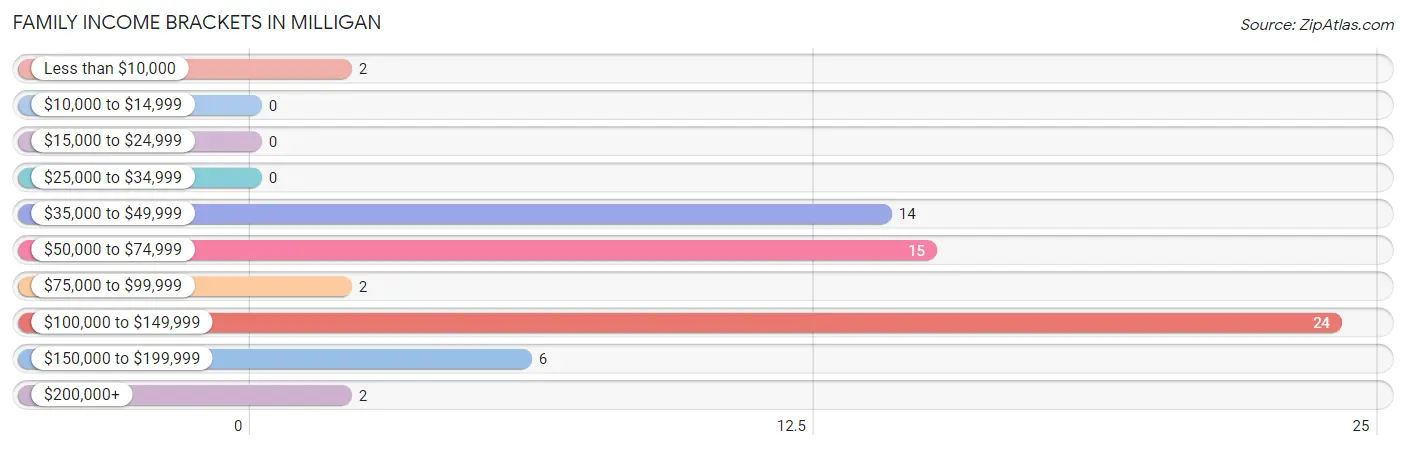
| Income Bracket | # Families | % Families |
| Less than $10,000 | 2 | 3.1% |
| $10,000 to $14,999 | 0 | 0.0% |
| $15,000 to $24,999 | 0 | 0.0% |
| $25,000 to $34,999 | 0 | 0.0% |
| $35,000 to $49,999 | 14 | 21.5% |
| $50,000 to $74,999 | 15 | 23.1% |
| $75,000 to $99,999 | 2 | 3.1% |
| $100,000 to $149,999 | 24 | 36.9% |
| $150,000 to $199,999 | 6 | 9.2% |
| $200,000+ | 2 | 3.1% |
Family Income by Famaliy Size in Milligan
3-person families (9 | 13.9%) account for the highest median family income in Milligan with $153,542 per family, while 3-person families (9 | 13.9%) have the highest median income of $51,181 per family member.
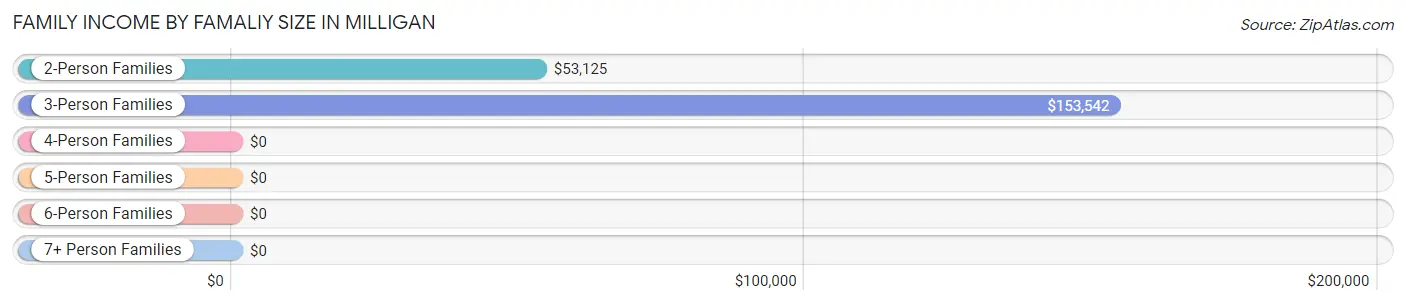
| Income Bracket | # Families | Median Income |
| 2-Person Families | 41 (63.1%) | $53,125 |
| 3-Person Families | 9 (13.9%) | $153,542 |
| 4-Person Families | 1 (1.5%) | $0 |
| 5-Person Families | 9 (13.9%) | $0 |
| 6-Person Families | 4 (6.1%) | $0 |
| 7+ Person Families | 1 (1.5%) | $0 |
| Total | 65 (100.0%) | $86,875 |
Family Income by Number of Earners in Milligan
The median family income in Milligan is $86,875, with families comprising 3+ earners (8) having the highest median family income of $153,750, while families with no earners (15) have the lowest median family income of $38,393, accounting for 12.3% and 23.1% of families, respectively.
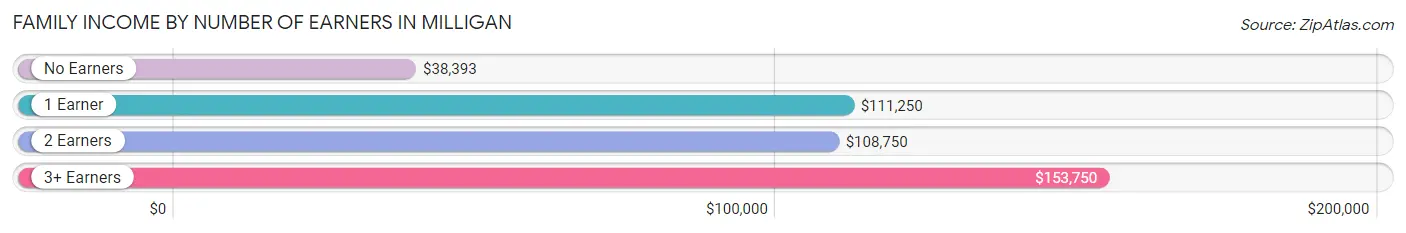
| Number of Earners | # Families | Median Income |
| No Earners | 15 (23.1%) | $38,393 |
| 1 Earner | 12 (18.5%) | $111,250 |
| 2 Earners | 30 (46.2%) | $108,750 |
| 3+ Earners | 8 (12.3%) | $153,750 |
| Total | 65 (100.0%) | $86,875 |
Household Income in Milligan
Household Income Brackets in Milligan
With 31 households falling in the category, the $50,000 to $74,999 income range is the most frequent in Milligan, accounting for 26.3% of all households.
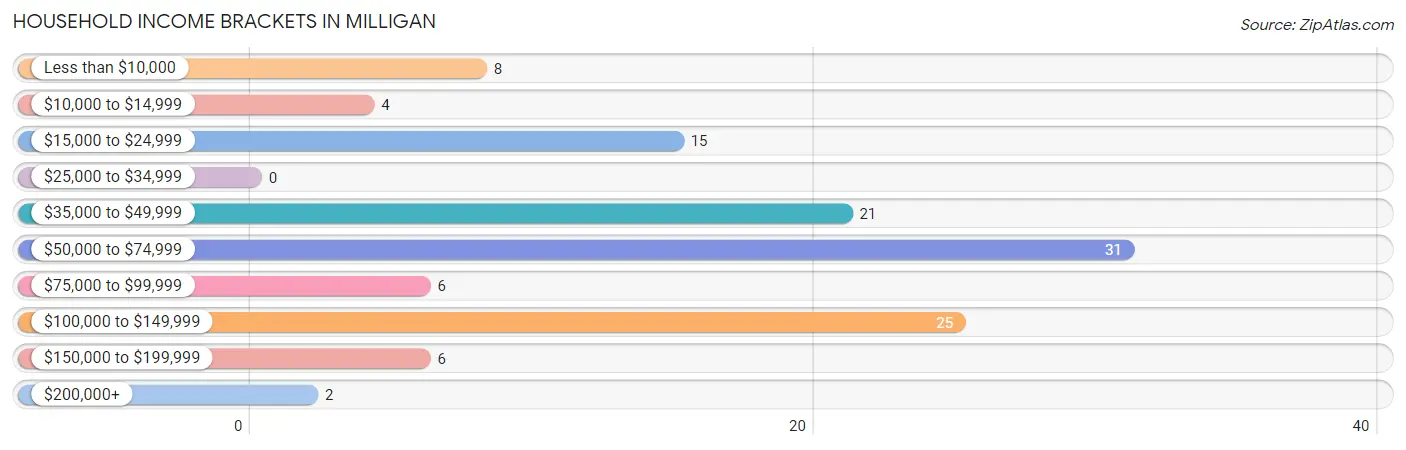
| Income Bracket | # Households | % Households |
| Less than $10,000 | 8 | 6.8% |
| $10,000 to $14,999 | 4 | 3.4% |
| $15,000 to $24,999 | 15 | 12.7% |
| $25,000 to $34,999 | 0 | 0.0% |
| $35,000 to $49,999 | 21 | 17.8% |
| $50,000 to $74,999 | 31 | 26.3% |
| $75,000 to $99,999 | 6 | 5.1% |
| $100,000 to $149,999 | 25 | 21.2% |
| $150,000 to $199,999 | 6 | 5.1% |
| $200,000+ | 2 | 1.7% |
Household Income by Householder Age in Milligan
The median household income in Milligan is $53,000, with the highest median household income of $111,250 found in the 25 to 44 years age bracket for the primary householder. A total of 27 households (22.9%) fall into this category. Meanwhile, the 15 to 24 years age bracket for the primary householder has the lowest median household income of $0, with 2 households (1.7%) in this group.
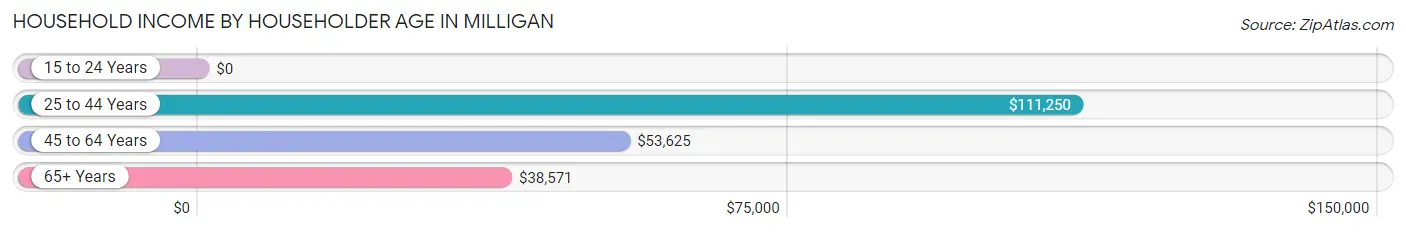
| Income Bracket | # Households | Median Income |
| 15 to 24 Years | 2 (1.7%) | $0 |
| 25 to 44 Years | 27 (22.9%) | $111,250 |
| 45 to 64 Years | 55 (46.6%) | $53,625 |
| 65+ Years | 34 (28.8%) | $38,571 |
| Total | 118 (100.0%) | $53,000 |
Poverty in Milligan
Income Below Poverty by Sex and Age in Milligan
With 1.9% poverty level for males and 8.1% for females among the residents of Milligan, 15 year old males and 12 to 14 year old females are the most vulnerable to poverty, with 1 males (100.0%) and 1 females (50.0%) in their respective age groups living below the poverty level.
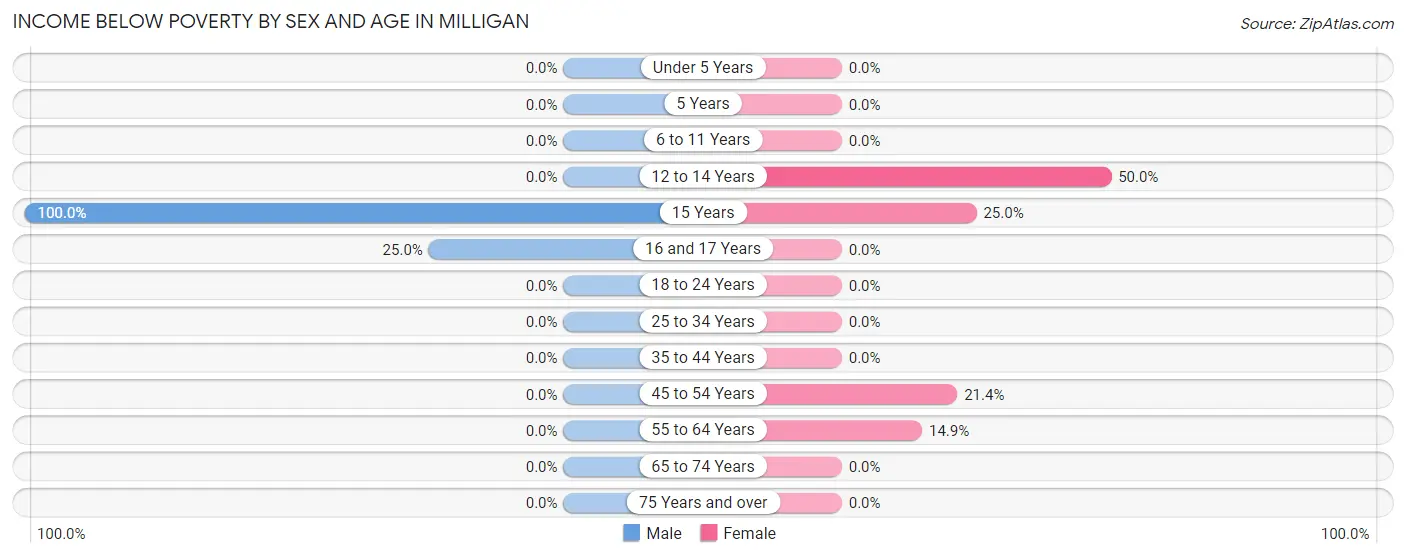
| Age Bracket | Male | Female |
| Under 5 Years | 0 (0.0%) | 0 (0.0%) |
| 5 Years | 0 (0.0%) | 0 (0.0%) |
| 6 to 11 Years | 0 (0.0%) | 0 (0.0%) |
| 12 to 14 Years | 0 (0.0%) | 1 (50.0%) |
| 15 Years | 1 (100.0%) | 1 (25.0%) |
| 16 and 17 Years | 1 (25.0%) | 0 (0.0%) |
| 18 to 24 Years | 0 (0.0%) | 0 (0.0%) |
| 25 to 34 Years | 0 (0.0%) | 0 (0.0%) |
| 35 to 44 Years | 0 (0.0%) | 0 (0.0%) |
| 45 to 54 Years | 0 (0.0%) | 3 (21.4%) |
| 55 to 64 Years | 0 (0.0%) | 7 (14.9%) |
| 65 to 74 Years | 0 (0.0%) | 0 (0.0%) |
| 75 Years and over | 0 (0.0%) | 0 (0.0%) |
| Total | 2 (1.9%) | 12 (8.1%) |
Income Above Poverty by Sex and Age in Milligan
According to the poverty statistics in Milligan, males aged under 5 years and females aged under 5 years are the age groups that are most secure financially, with 100.0% of males and 100.0% of females in these age groups living above the poverty line.
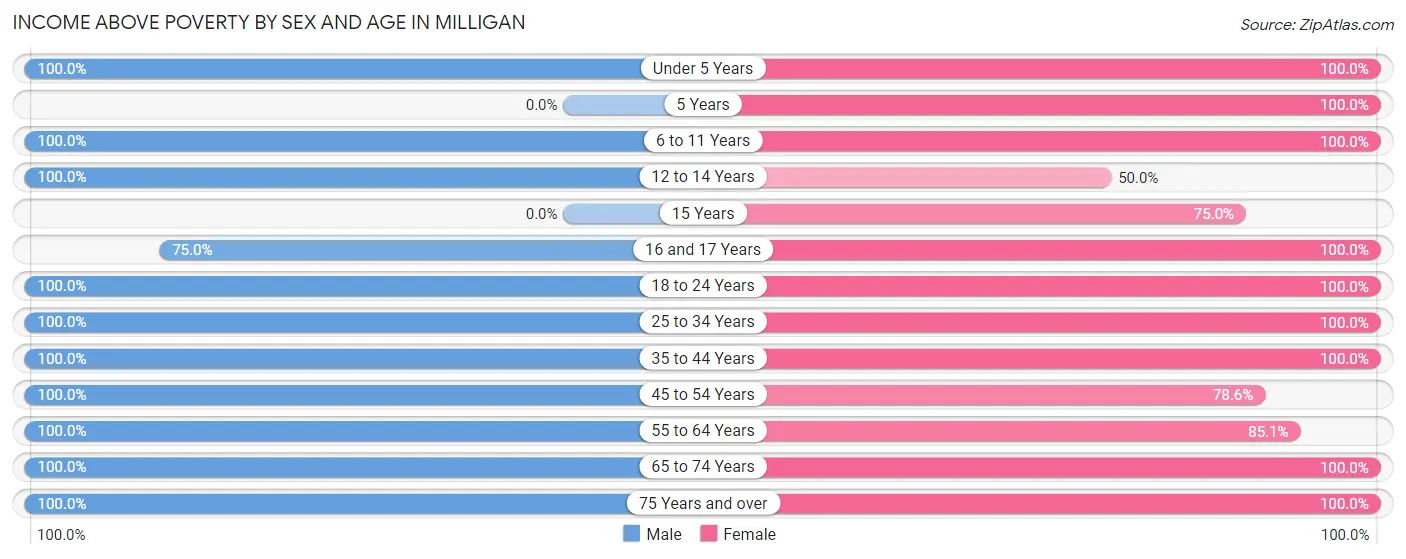
| Age Bracket | Male | Female |
| Under 5 Years | 1 (100.0%) | 11 (100.0%) |
| 5 Years | 0 (0.0%) | 1 (100.0%) |
| 6 to 11 Years | 8 (100.0%) | 10 (100.0%) |
| 12 to 14 Years | 1 (100.0%) | 1 (50.0%) |
| 15 Years | 0 (0.0%) | 3 (75.0%) |
| 16 and 17 Years | 3 (75.0%) | 1 (100.0%) |
| 18 to 24 Years | 2 (100.0%) | 1 (100.0%) |
| 25 to 34 Years | 8 (100.0%) | 19 (100.0%) |
| 35 to 44 Years | 16 (100.0%) | 8 (100.0%) |
| 45 to 54 Years | 17 (100.0%) | 11 (78.6%) |
| 55 to 64 Years | 31 (100.0%) | 40 (85.1%) |
| 65 to 74 Years | 4 (100.0%) | 3 (100.0%) |
| 75 Years and over | 11 (100.0%) | 27 (100.0%) |
| Total | 102 (98.1%) | 136 (91.9%) |
Income Below Poverty Among Married-Couple Families in Milligan
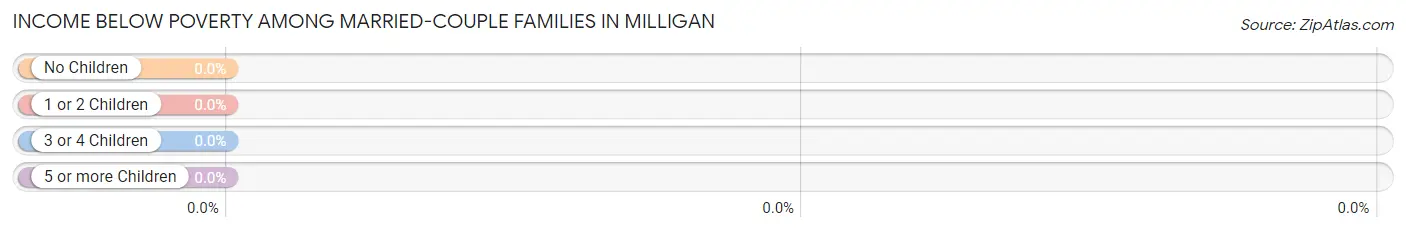
| Children | Above Poverty | Below Poverty |
| No Children | 33 (100.0%) | 0 (0.0%) |
| 1 or 2 Children | 6 (100.0%) | 0 (0.0%) |
| 3 or 4 Children | 13 (100.0%) | 0 (0.0%) |
| 5 or more Children | 1 (100.0%) | 0 (0.0%) |
| Total | 53 (100.0%) | 0 (0.0%) |
Income Below Poverty Among Single-Parent Households in Milligan
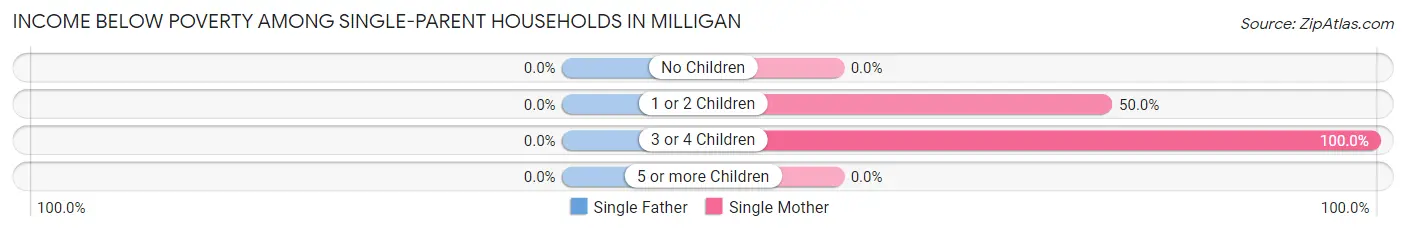
| Children | Single Father | Single Mother |
| No Children | 0 (0.0%) | 0 (0.0%) |
| 1 or 2 Children | 0 (0.0%) | 1 (50.0%) |
| 3 or 4 Children | 0 (0.0%) | 1 (100.0%) |
| 5 or more Children | 0 (0.0%) | 0 (0.0%) |
| Total | 0 (0.0%) | 2 (18.2%) |
Income Below Poverty Among Married-Couple vs Single-Parent Households in Milligan
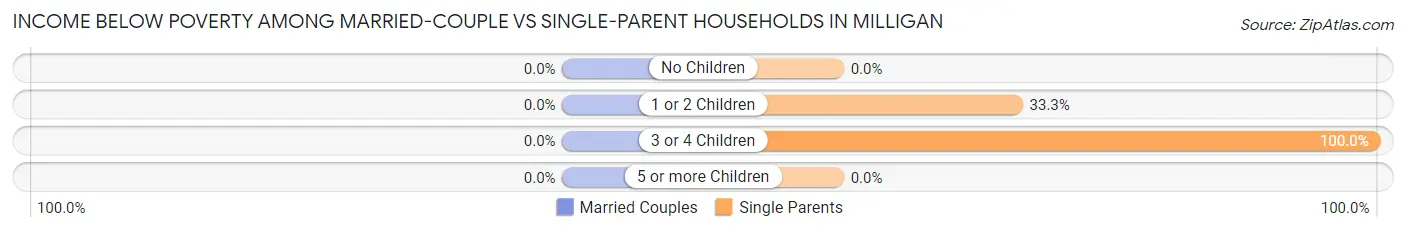
| Children | Married-Couple Families | Single-Parent Households |
| No Children | 0 (0.0%) | 0 (0.0%) |
| 1 or 2 Children | 0 (0.0%) | 1 (33.3%) |
| 3 or 4 Children | 0 (0.0%) | 1 (100.0%) |
| 5 or more Children | 0 (0.0%) | 0 (0.0%) |
| Total | 0 (0.0%) | 2 (16.7%) |
Race in Milligan
The most populous races in Milligan are White / Caucasian (246 | 96.1%), Hispanic or Latino (9 | 3.5%), and Two or more Races (9 | 3.5%).
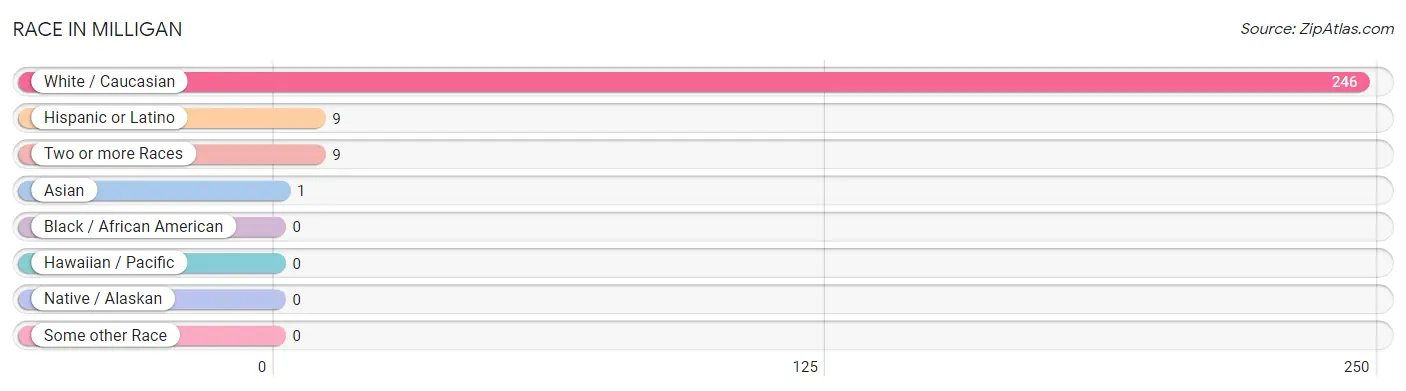
| Race | # Population | % Population |
| Asian | 1 | 0.4% |
| Black / African American | 0 | 0.0% |
| Hawaiian / Pacific | 0 | 0.0% |
| Hispanic or Latino | 9 | 3.5% |
| Native / Alaskan | 0 | 0.0% |
| White / Caucasian | 246 | 96.1% |
| Two or more Races | 9 | 3.5% |
| Some other Race | 0 | 0.0% |
| Total | 256 | 100.0% |
Ancestry in Milligan
The most populous ancestries reported in Milligan are German (119 | 46.5%), Czech (92 | 35.9%), Irish (28 | 10.9%), English (25 | 9.8%), and Polish (24 | 9.4%), together accounting for 112.5% of all Milligan residents.
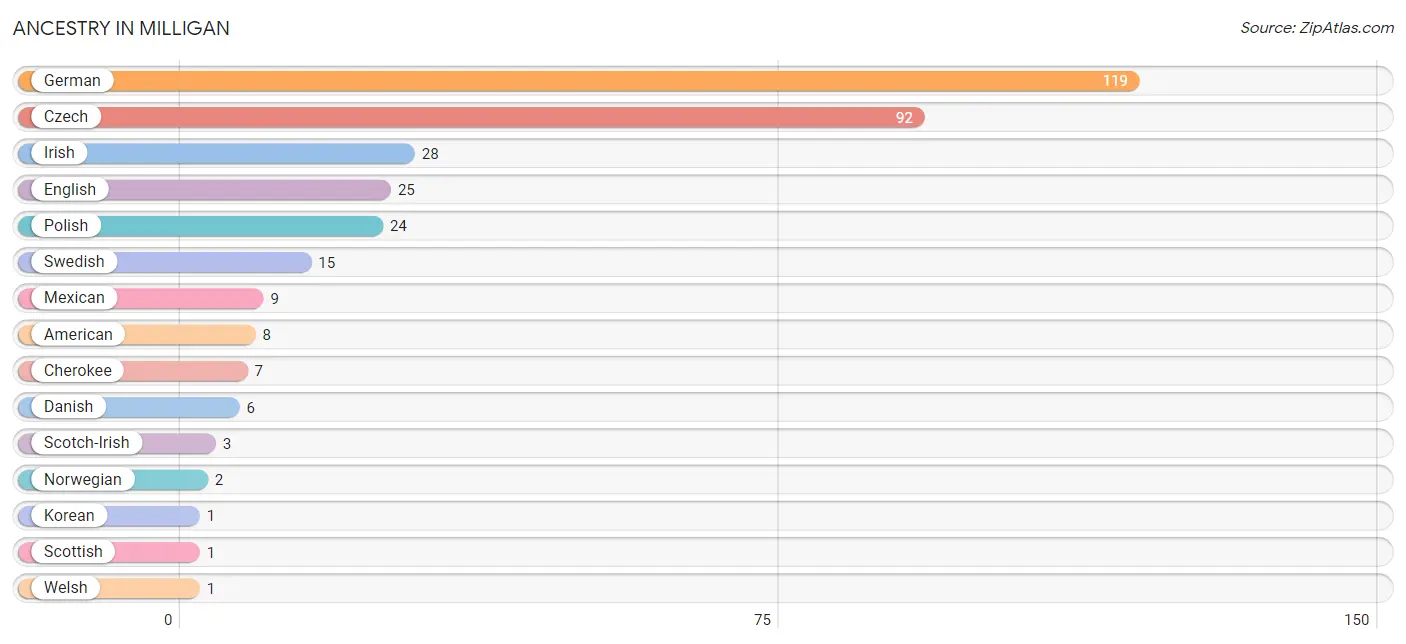
| Ancestry | # Population | % Population |
| American | 8 | 3.1% |
| Cherokee | 7 | 2.7% |
| Czech | 92 | 35.9% |
| Danish | 6 | 2.3% |
| English | 25 | 9.8% |
| German | 119 | 46.5% |
| Irish | 28 | 10.9% |
| Korean | 1 | 0.4% |
| Mexican | 9 | 3.5% |
| Norwegian | 2 | 0.8% |
| Polish | 24 | 9.4% |
| Scotch-Irish | 3 | 1.2% |
| Scottish | 1 | 0.4% |
| Swedish | 15 | 5.9% |
| Welsh | 1 | 0.4% | View All 15 Rows |
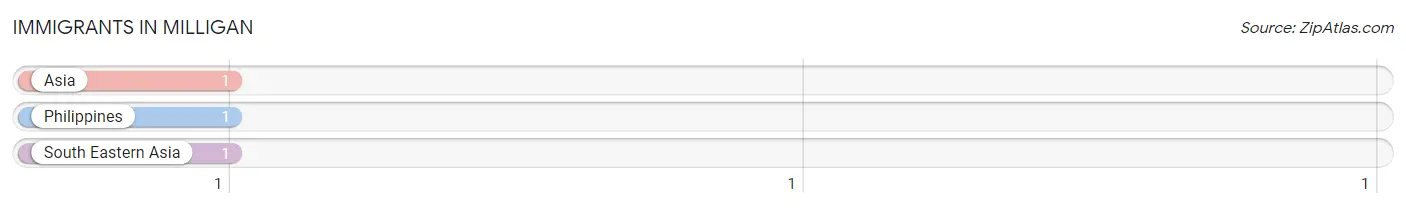
Immigrants in Milligan
The most numerous immigrant groups reported in Milligan came from Asia (1 | 0.4%), Philippines (1 | 0.4%), and South Eastern Asia (1 | 0.4%), together accounting for 1.2% of all Milligan residents.
| Immigration Origin | # Population | % Population |
| Asia | 1 | 0.4% |
| Philippines | 1 | 0.4% |
| South Eastern Asia | 1 | 0.4% | View All 3 Rows |
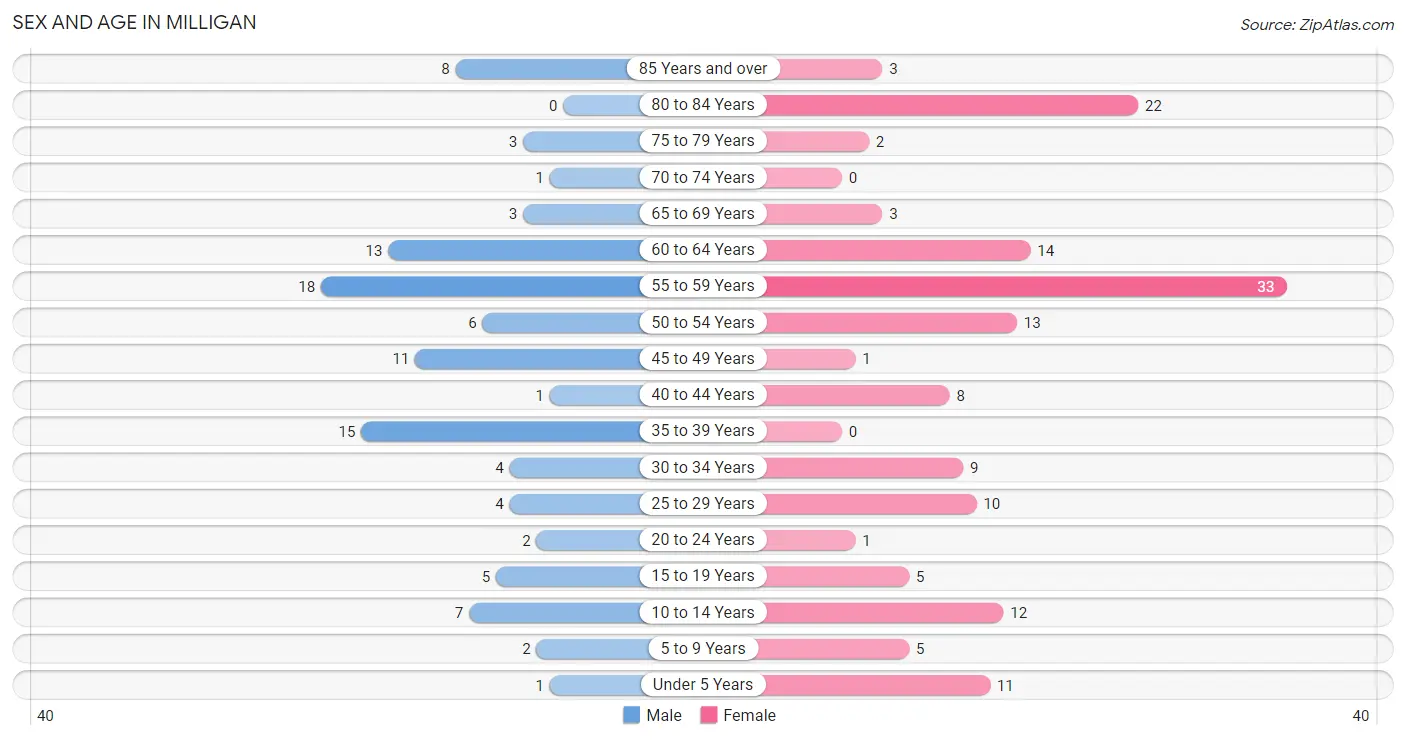
Sex and Age in Milligan
Sex and Age in Milligan
The most populous age groups in Milligan are 55 to 59 Years (18 | 17.3%) for men and 55 to 59 Years (33 | 21.7%) for women.
| Age Bracket | Male | Female |
| Under 5 Years | 1 (1.0%) | 11 (7.2%) |
| 5 to 9 Years | 2 (1.9%) | 5 (3.3%) |
| 10 to 14 Years | 7 (6.7%) | 12 (7.9%) |
| 15 to 19 Years | 5 (4.8%) | 5 (3.3%) |
| 20 to 24 Years | 2 (1.9%) | 1 (0.7%) |
| 25 to 29 Years | 4 (3.8%) | 10 (6.6%) |
| 30 to 34 Years | 4 (3.8%) | 9 (5.9%) |
| 35 to 39 Years | 15 (14.4%) | 0 (0.0%) |
| 40 to 44 Years | 1 (1.0%) | 8 (5.3%) |
| 45 to 49 Years | 11 (10.6%) | 1 (0.7%) |
| 50 to 54 Years | 6 (5.8%) | 13 (8.6%) |
| 55 to 59 Years | 18 (17.3%) | 33 (21.7%) |
| 60 to 64 Years | 13 (12.5%) | 14 (9.2%) |
| 65 to 69 Years | 3 (2.9%) | 3 (2.0%) |
| 70 to 74 Years | 1 (1.0%) | 0 (0.0%) |
| 75 to 79 Years | 3 (2.9%) | 2 (1.3%) |
| 80 to 84 Years | 0 (0.0%) | 22 (14.5%) |
| 85 Years and over | 8 (7.7%) | 3 (2.0%) |
| Total | 104 (100.0%) | 152 (100.0%) |
Families and Households in Milligan
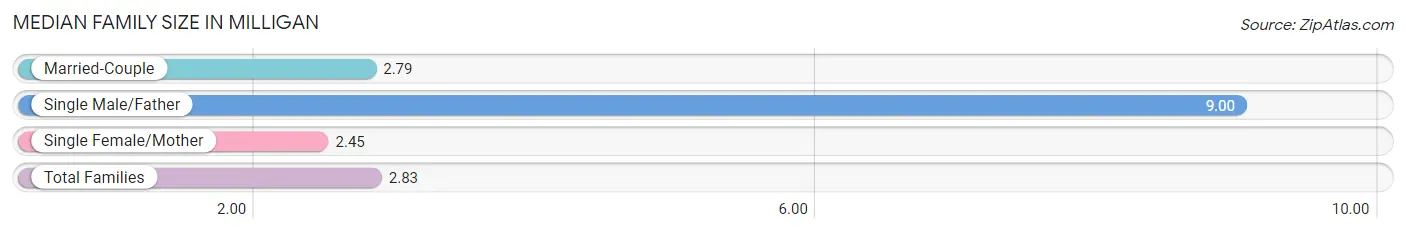
Median Family Size in Milligan
The median family size in Milligan is 2.83 persons per family, with single male/father families (1 | 1.5%) accounting for the largest median family size of 9 persons per family. On the other hand, single female/mother families (11 | 16.9%) represent the smallest median family size with 2.45 persons per family.
| Family Type | # Families | Family Size |
| Married-Couple | 53 (81.5%) | 2.79 |
| Single Male/Father | 1 (1.5%) | 9.00 |
| Single Female/Mother | 11 (16.9%) | 2.45 |
| Total Families | 65 (100.0%) | 2.83 |
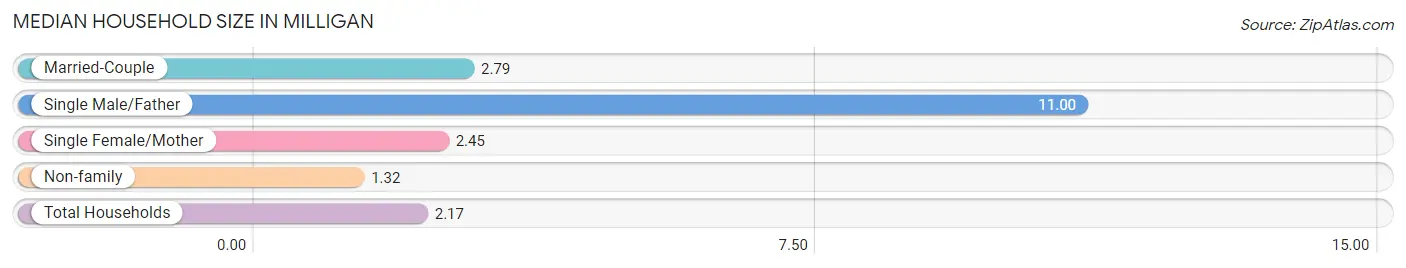
Median Household Size in Milligan
The median household size in Milligan is 2.17 persons per household, with single male/father households (1 | 0.9%) accounting for the largest median household size of 11 persons per household. non-family households (53 | 44.9%) represent the smallest median household size with 1.32 persons per household.
| Household Type | # Households | Household Size |
| Married-Couple | 53 (44.9%) | 2.79 |
| Single Male/Father | 1 (0.9%) | 11.00 |
| Single Female/Mother | 11 (9.3%) | 2.45 |
| Non-family | 53 (44.9%) | 1.32 |
| Total Households | 118 (100.0%) | 2.17 |
Household Size by Marriage Status in Milligan
Out of a total of 118 households in Milligan, 65 (55.1%) are family households, while 53 (44.9%) are nonfamily households. The most numerous type of family households are 2-person households, comprising 41, and the most common type of nonfamily households are 1-person households, comprising 41.
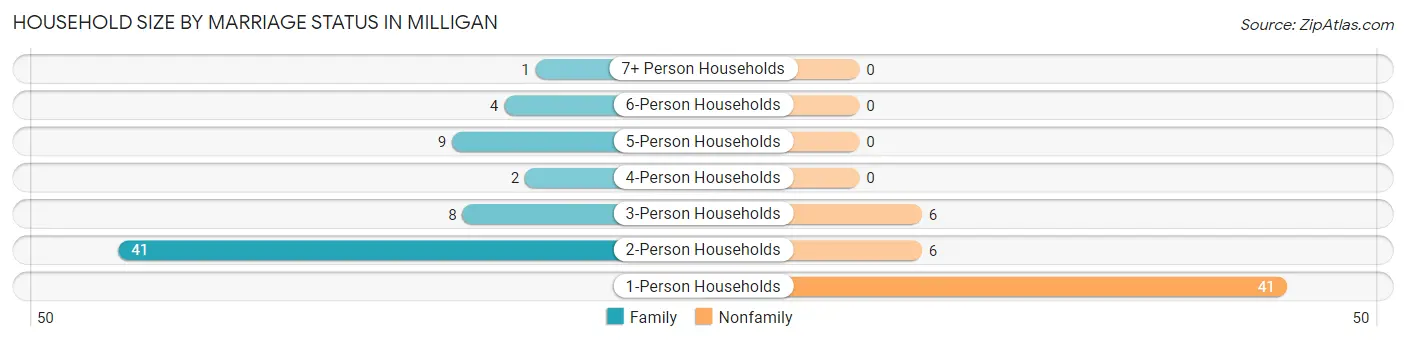
| Household Size | Family Households | Nonfamily Households |
| 1-Person Households | - | 41 (34.7%) |
| 2-Person Households | 41 (34.7%) | 6 (5.1%) |
| 3-Person Households | 8 (6.8%) | 6 (5.1%) |
| 4-Person Households | 2 (1.7%) | 0 (0.0%) |
| 5-Person Households | 9 (7.6%) | 0 (0.0%) |
| 6-Person Households | 4 (3.4%) | 0 (0.0%) |
| 7+ Person Households | 1 (0.9%) | 0 (0.0%) |
| Total | 65 (55.1%) | 53 (44.9%) |
Female Fertility in Milligan
Fertility by Age in Milligan
Average fertility rate in Milligan is 270.0 births per 1,000 women. Women in the age bracket of 20 to 34 years have the highest fertility rate with 500.0 births per 1,000 women. Women in the age bracket of 20 to 34 years acount for 100.0% of all women with births.
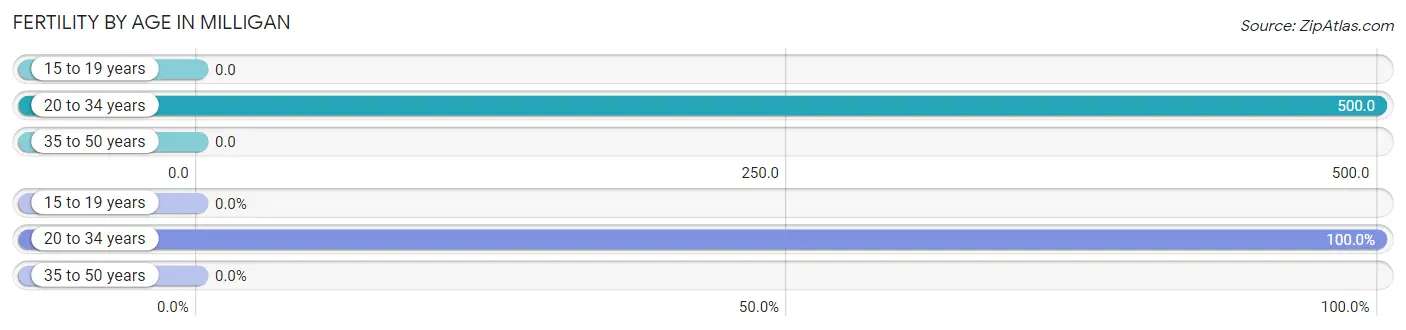
| Age Bracket | Women with Births | Births / 1,000 Women |
| 15 to 19 years | 0 (0.0%) | 0.0 |
| 20 to 34 years | 10 (100.0%) | 500.0 |
| 35 to 50 years | 0 (0.0%) | 0.0 |
| Total | 10 (100.0%) | 270.0 |
Fertility by Age by Marriage Status in Milligan
30.0% of women with births (10) in Milligan are married. The highest percentage of unmarried women with births falls into 20 to 34 years age bracket with 70.0% of them unmarried at the time of birth, while the lowest percentage of unmarried women with births belong to 20 to 34 years age bracket with 70.0% of them unmarried.
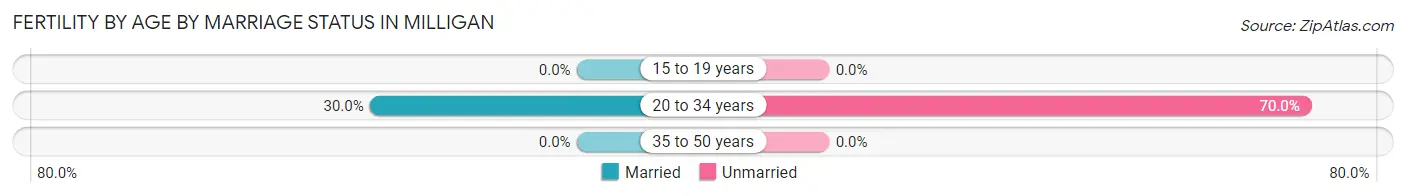
| Age Bracket | Married | Unmarried |
| 15 to 19 years | 0 (0.0%) | 0 (0.0%) |
| 20 to 34 years | 3 (30.0%) | 7 (70.0%) |
| 35 to 50 years | 0 (0.0%) | 0 (0.0%) |
| Total | 3 (30.0%) | 7 (70.0%) |
Fertility by Education in Milligan
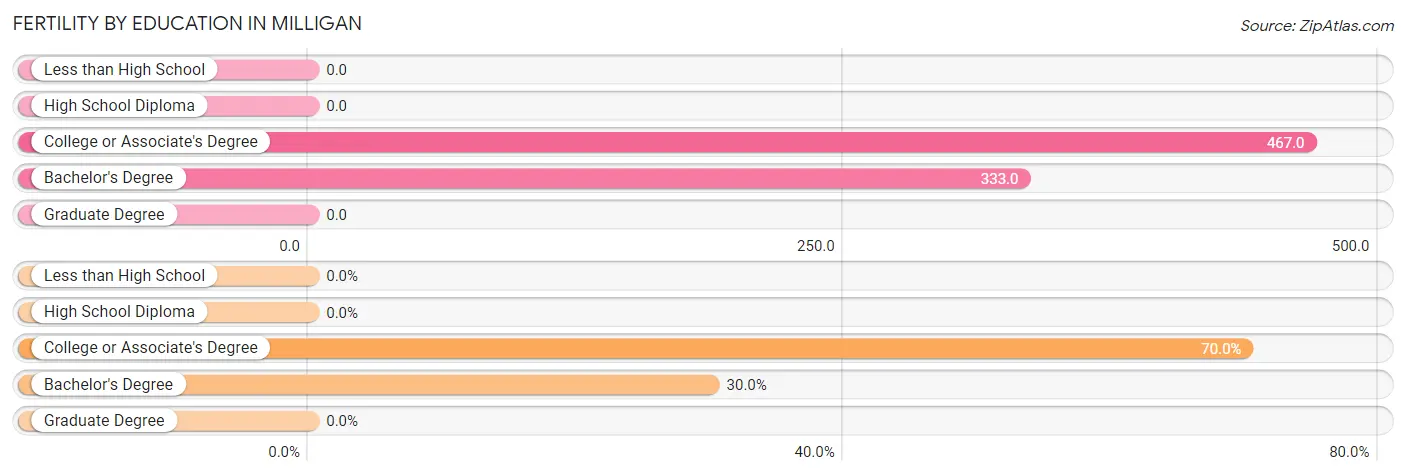
| Educational Attainment | Women with Births | Births / 1,000 Women |
| Less than High School | 0 (0.0%) | 0.0 |
| High School Diploma | 0 (0.0%) | 0.0 |
| College or Associate's Degree | 7 (70.0%) | 467.0 |
| Bachelor's Degree | 3 (30.0%) | 333.0 |
| Graduate Degree | 0 (0.0%) | 0.0 |
| Total | 10 (100.0%) | 270.0 |
Fertility by Education by Marriage Status in Milligan
70.0% of women with births in Milligan are unmarried. Women with the educational attainment of bachelor's degree are most likely to be married with 100.0% of them married at childbirth, while women with the educational attainment of college or associate's degree are least likely to be married with 100.0% of them unmarried at childbirth.
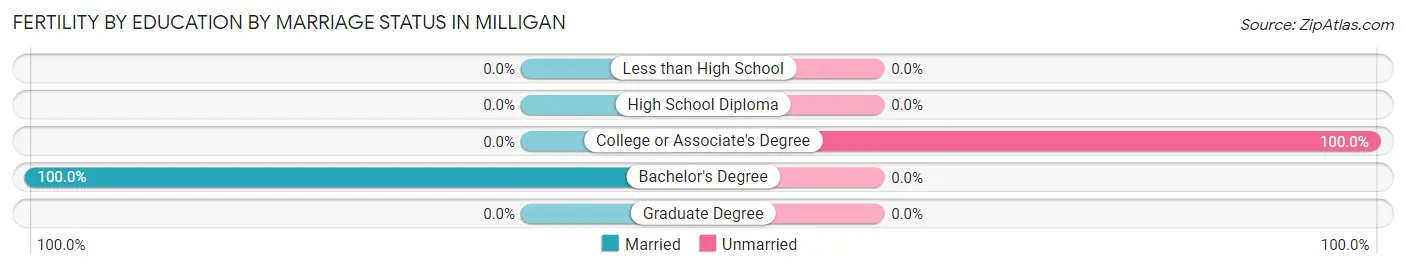
| Educational Attainment | Married | Unmarried |
| Less than High School | 0 (0.0%) | 0 (0.0%) |
| High School Diploma | 0 (0.0%) | 0 (0.0%) |
| College or Associate's Degree | 0 (0.0%) | 7 (100.0%) |
| Bachelor's Degree | 3 (100.0%) | 0 (0.0%) |
| Graduate Degree | 0 (0.0%) | 0 (0.0%) |
| Total | 3 (30.0%) | 7 (70.0%) |
Employment Characteristics in Milligan
Employment by Class of Employer in Milligan
Among the 99 employed individuals in Milligan, private company employees (64 | 64.6%), state government employees (19 | 19.2%), and not-for-profit organizations (10 | 10.1%) make up the most common classes of employment.
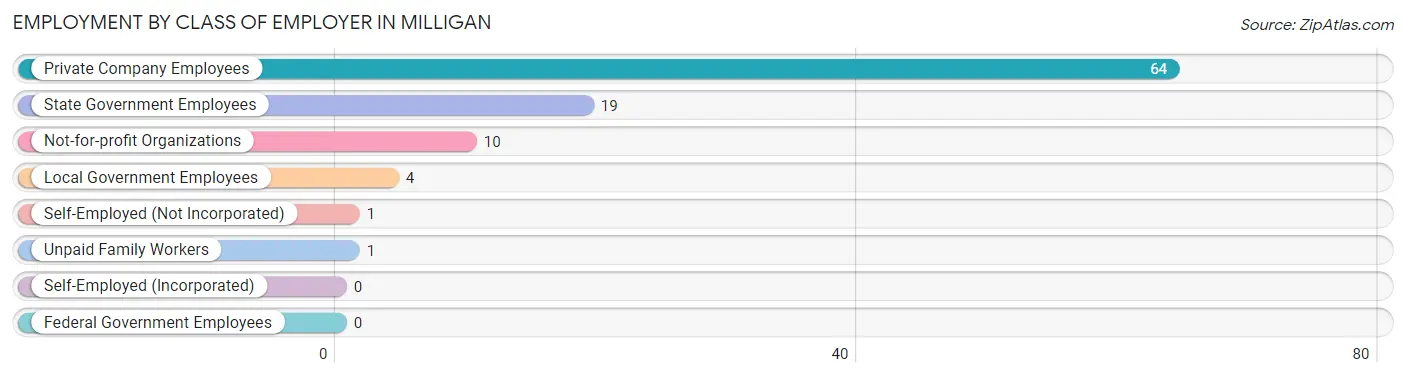
| Employer Class | # Employees | % Employees |
| Private Company Employees | 64 | 64.6% |
| Self-Employed (Incorporated) | 0 | 0.0% |
| Self-Employed (Not Incorporated) | 1 | 1.0% |
| Not-for-profit Organizations | 10 | 10.1% |
| Local Government Employees | 4 | 4.0% |
| State Government Employees | 19 | 19.2% |
| Federal Government Employees | 0 | 0.0% |
| Unpaid Family Workers | 1 | 1.0% |
| Total | 99 | 100.0% |
Employment Status by Age in Milligan
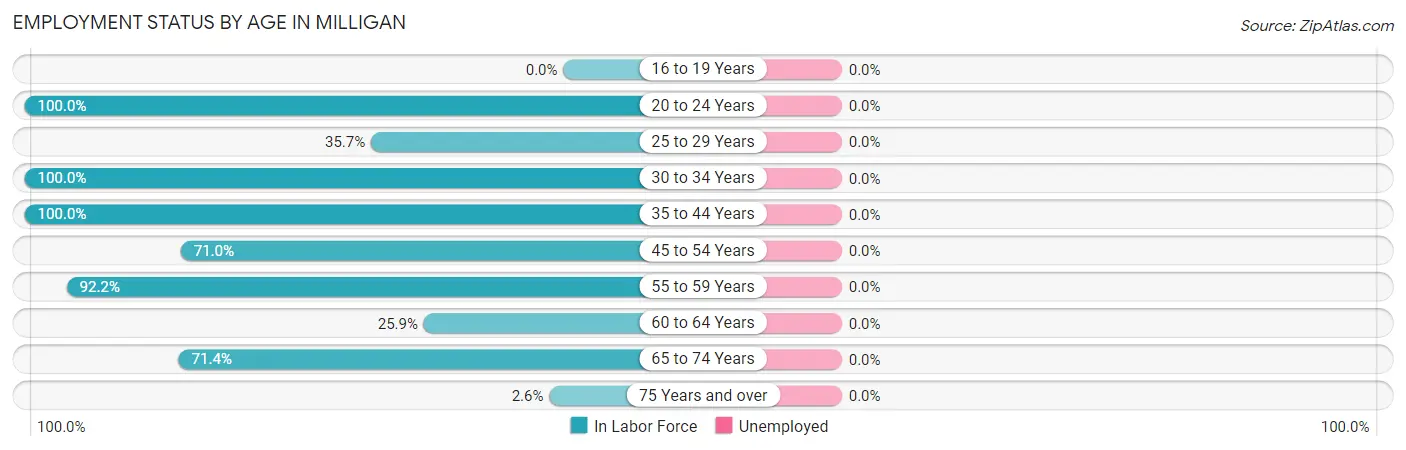
| Age Bracket | In Labor Force | Unemployed |
| 16 to 19 Years | 0 (0.0%) | 0 (0.0%) |
| 20 to 24 Years | 3 (100.0%) | 0 (0.0%) |
| 25 to 29 Years | 5 (35.7%) | 0 (0.0%) |
| 30 to 34 Years | 13 (100.0%) | 0 (0.0%) |
| 35 to 44 Years | 24 (100.0%) | 0 (0.0%) |
| 45 to 54 Years | 22 (71.0%) | 0 (0.0%) |
| 55 to 59 Years | 47 (92.2%) | 0 (0.0%) |
| 60 to 64 Years | 7 (25.9%) | 0 (0.0%) |
| 65 to 74 Years | 5 (71.4%) | 0 (0.0%) |
| 75 Years and over | 1 (2.6%) | 0 (0.0%) |
| Total | 127 (59.6%) | 0 (0.0%) |
Employment Status by Educational Attainment in Milligan
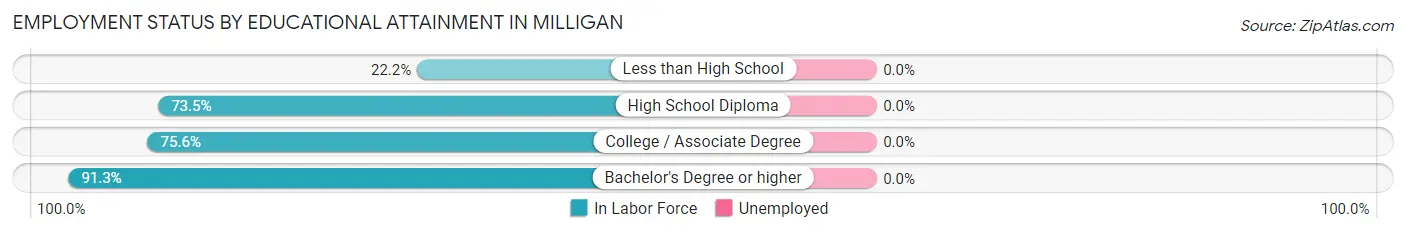
| Educational Attainment | In Labor Force | Unemployed |
| Less than High School | 2 (22.2%) | 0 (0.0%) |
| High School Diploma | 61 (73.5%) | 0 (0.0%) |
| College / Associate Degree | 34 (75.6%) | 0 (0.0%) |
| Bachelor's Degree or higher | 21 (91.3%) | 0 (0.0%) |
| Total | 118 (73.8%) | 0 (0.0%) |
Employment Occupations by Sex in Milligan
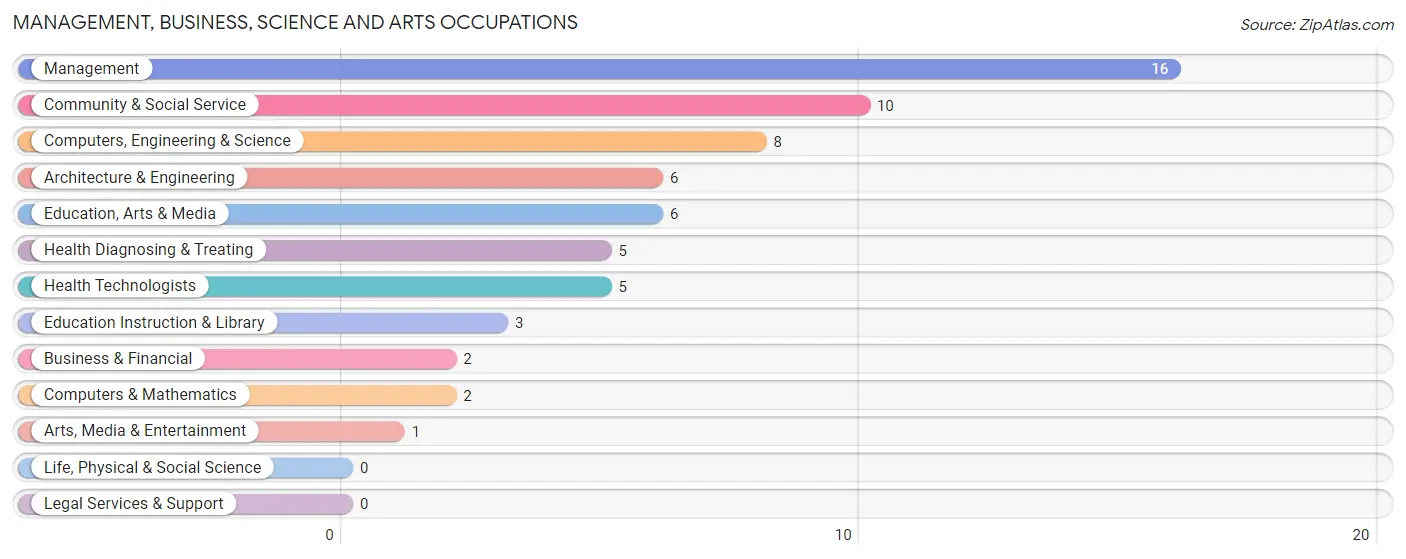
Management, Business, Science and Arts Occupations
The most common Management, Business, Science and Arts occupations in Milligan are Management (16 | 12.6%), Community & Social Service (10 | 7.9%), Computers, Engineering & Science (8 | 6.3%), Architecture & Engineering (6 | 4.7%), and Education, Arts & Media (6 | 4.7%).
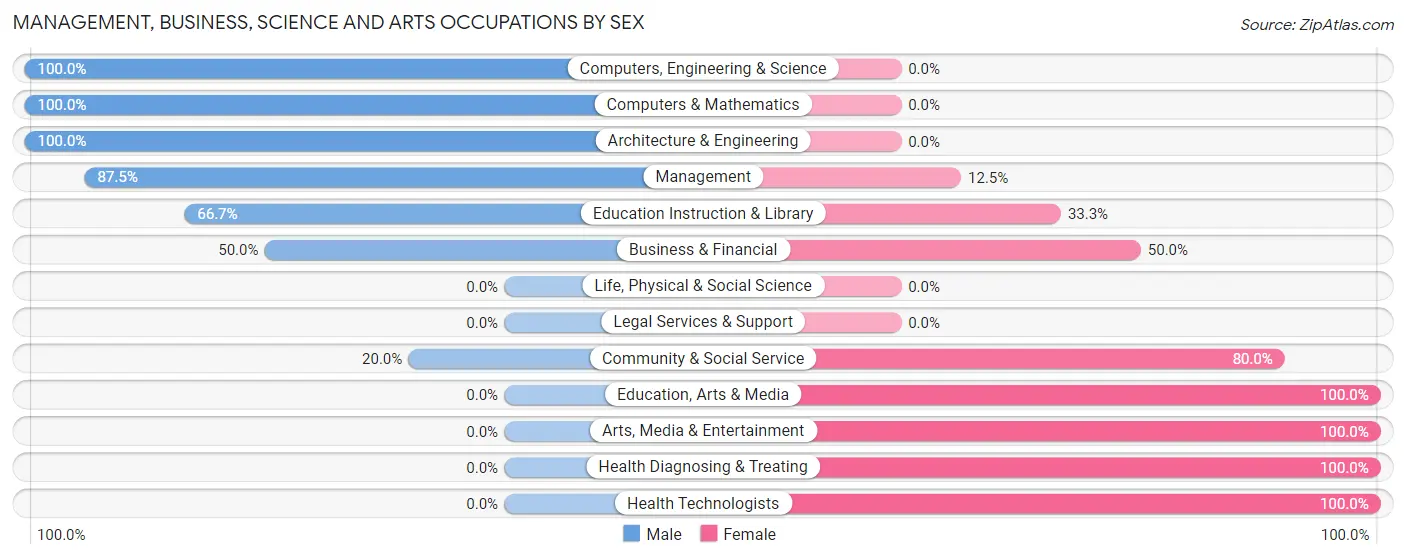
Management, Business, Science and Arts Occupations by Sex
Within the Management, Business, Science and Arts occupations in Milligan, the most male-oriented occupations are Computers, Engineering & Science (100.0%), Computers & Mathematics (100.0%), and Architecture & Engineering (100.0%), while the most female-oriented occupations are Education, Arts & Media (100.0%), Arts, Media & Entertainment (100.0%), and Health Diagnosing & Treating (100.0%).
| Occupation | Male | Female |
| Management | 14 (87.5%) | 2 (12.5%) |
| Business & Financial | 1 (50.0%) | 1 (50.0%) |
| Computers, Engineering & Science | 8 (100.0%) | 0 (0.0%) |
| Computers & Mathematics | 2 (100.0%) | 0 (0.0%) |
| Architecture & Engineering | 6 (100.0%) | 0 (0.0%) |
| Life, Physical & Social Science | 0 (0.0%) | 0 (0.0%) |
| Community & Social Service | 2 (20.0%) | 8 (80.0%) |
| Education, Arts & Media | 0 (0.0%) | 6 (100.0%) |
| Legal Services & Support | 0 (0.0%) | 0 (0.0%) |
| Education Instruction & Library | 2 (66.7%) | 1 (33.3%) |
| Arts, Media & Entertainment | 0 (0.0%) | 1 (100.0%) |
| Health Diagnosing & Treating | 0 (0.0%) | 5 (100.0%) |
| Health Technologists | 0 (0.0%) | 5 (100.0%) |
| Total (Category) | 25 (61.0%) | 16 (39.0%) |
| Total (Overall) | 60 (47.2%) | 67 (52.8%) |
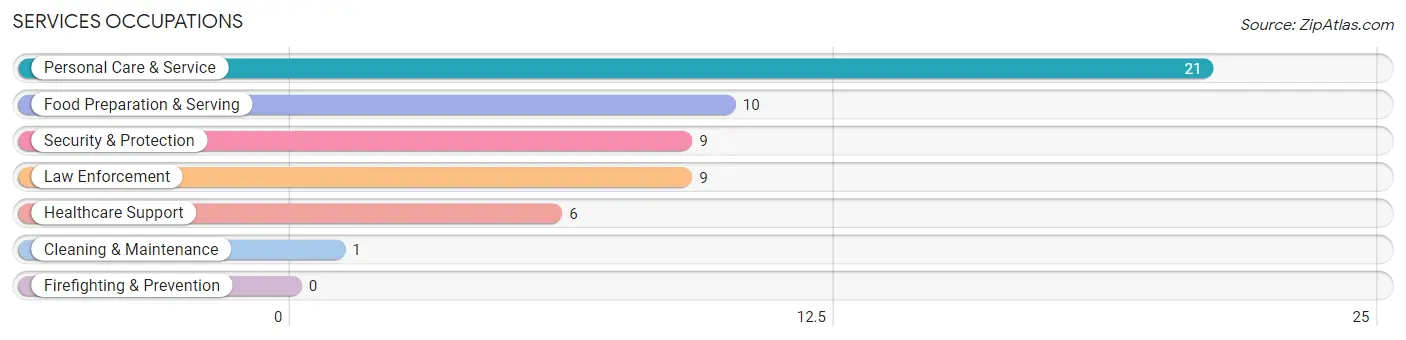
Services Occupations
The most common Services occupations in Milligan are Personal Care & Service (21 | 16.5%), Food Preparation & Serving (10 | 7.9%), Security & Protection (9 | 7.1%), Law Enforcement (9 | 7.1%), and Healthcare Support (6 | 4.7%).
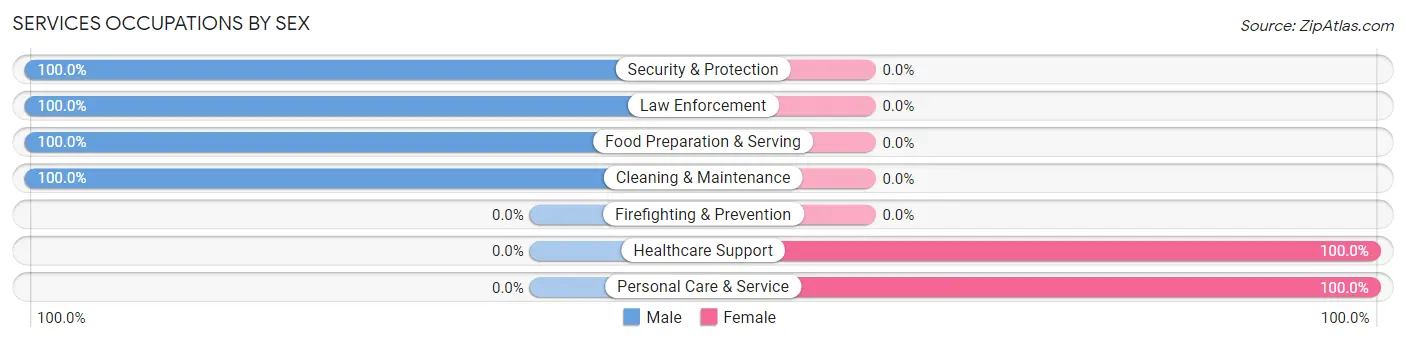
Services Occupations by Sex
Within the Services occupations in Milligan, the most male-oriented occupations are Security & Protection (100.0%), Law Enforcement (100.0%), and Food Preparation & Serving (100.0%), while the most female-oriented occupations are Healthcare Support (100.0%), and Personal Care & Service (100.0%).
| Occupation | Male | Female |
| Healthcare Support | 0 (0.0%) | 6 (100.0%) |
| Security & Protection | 9 (100.0%) | 0 (0.0%) |
| Firefighting & Prevention | 0 (0.0%) | 0 (0.0%) |
| Law Enforcement | 9 (100.0%) | 0 (0.0%) |
| Food Preparation & Serving | 10 (100.0%) | 0 (0.0%) |
| Cleaning & Maintenance | 1 (100.0%) | 0 (0.0%) |
| Personal Care & Service | 0 (0.0%) | 21 (100.0%) |
| Total (Category) | 20 (42.5%) | 27 (57.5%) |
| Total (Overall) | 60 (47.2%) | 67 (52.8%) |
Sales and Office Occupations
The most common Sales and Office occupations in Milligan are Sales & Related (13 | 10.2%), and Office & Administration (10 | 7.9%).
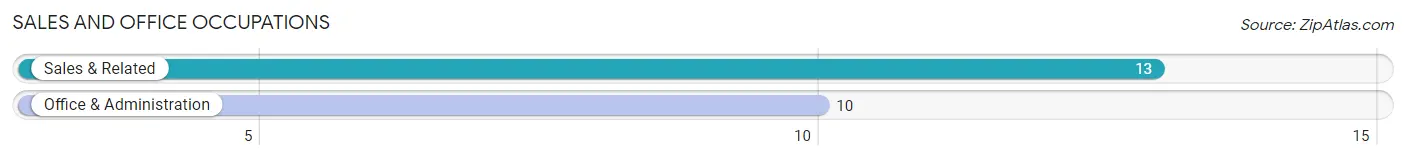
Sales and Office Occupations by Sex
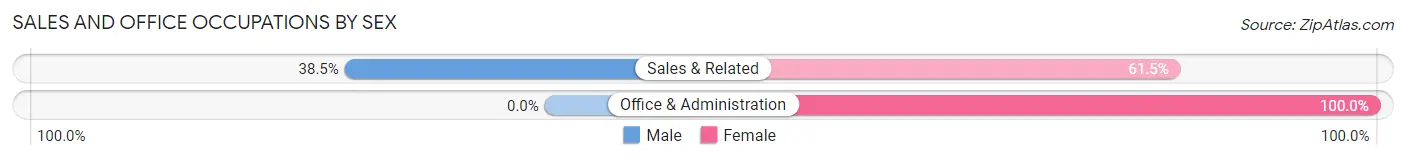
| Occupation | Male | Female |
| Sales & Related | 5 (38.5%) | 8 (61.5%) |
| Office & Administration | 0 (0.0%) | 10 (100.0%) |
| Total (Category) | 5 (21.7%) | 18 (78.3%) |
| Total (Overall) | 60 (47.2%) | 67 (52.8%) |
Natural Resources, Construction and Maintenance Occupations
The most common Natural Resources, Construction and Maintenance occupations in Milligan are Farming, Fishing & Forestry (1 | 0.8%), Construction & Extraction (1 | 0.8%), and Installation, Maintenance & Repair (1 | 0.8%).
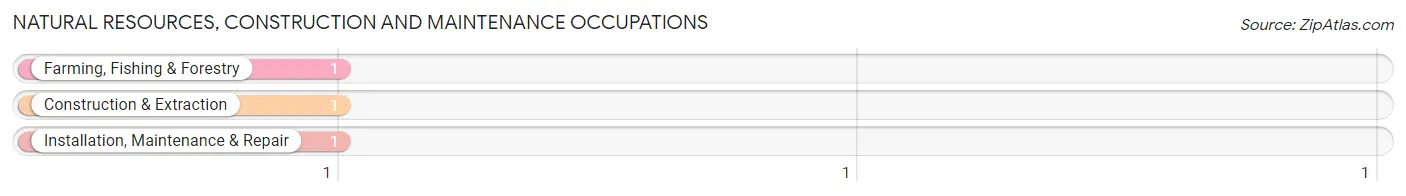
Natural Resources, Construction and Maintenance Occupations by Sex
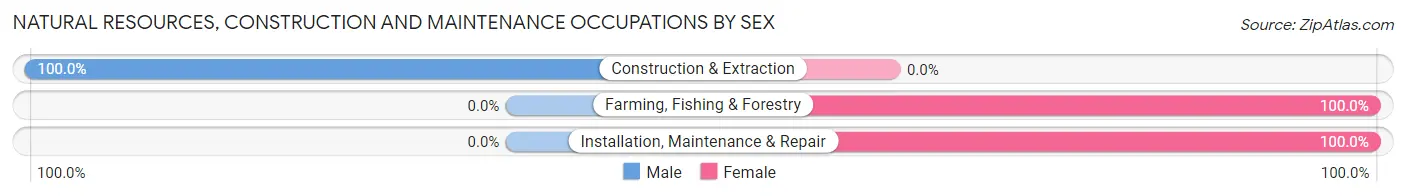
| Occupation | Male | Female |
| Farming, Fishing & Forestry | 0 (0.0%) | 1 (100.0%) |
| Construction & Extraction | 1 (100.0%) | 0 (0.0%) |
| Installation, Maintenance & Repair | 0 (0.0%) | 1 (100.0%) |
| Total (Category) | 1 (33.3%) | 2 (66.7%) |
| Total (Overall) | 60 (47.2%) | 67 (52.8%) |
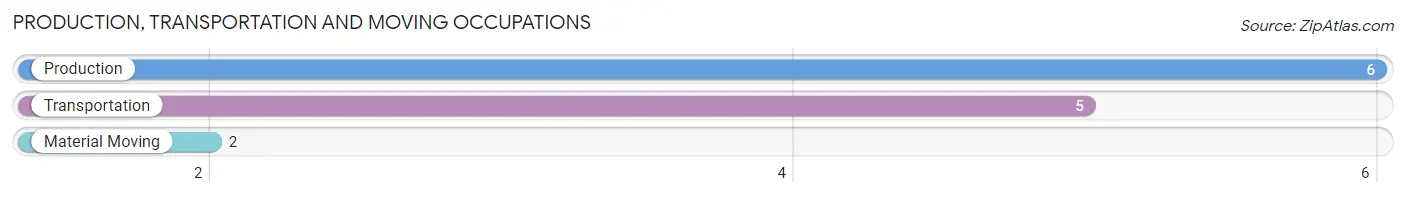
Production, Transportation and Moving Occupations
The most common Production, Transportation and Moving occupations in Milligan are Production (6 | 4.7%), Transportation (5 | 3.9%), and Material Moving (2 | 1.6%).
Production, Transportation and Moving Occupations by Sex
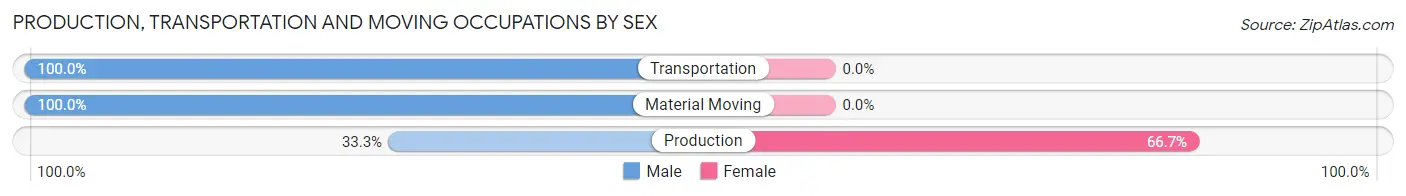
| Occupation | Male | Female |
| Production | 2 (33.3%) | 4 (66.7%) |
| Transportation | 5 (100.0%) | 0 (0.0%) |
| Material Moving | 2 (100.0%) | 0 (0.0%) |
| Total (Category) | 9 (69.2%) | 4 (30.8%) |
| Total (Overall) | 60 (47.2%) | 67 (52.8%) |
Employment Industries by Sex in Milligan
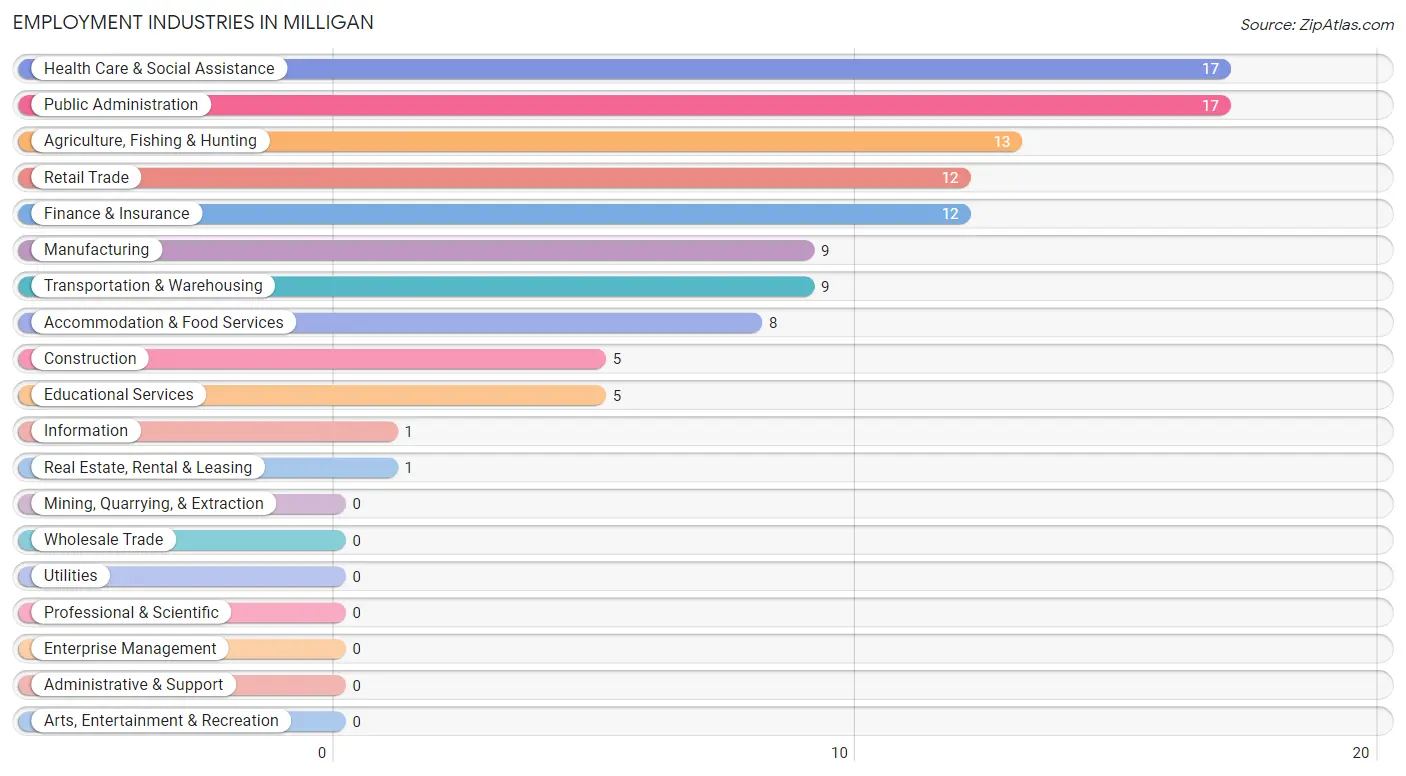
Employment Industries in Milligan
The major employment industries in Milligan include Health Care & Social Assistance (17 | 13.4%), Public Administration (17 | 13.4%), Agriculture, Fishing & Hunting (13 | 10.2%), Retail Trade (12 | 9.5%), and Finance & Insurance (12 | 9.5%).
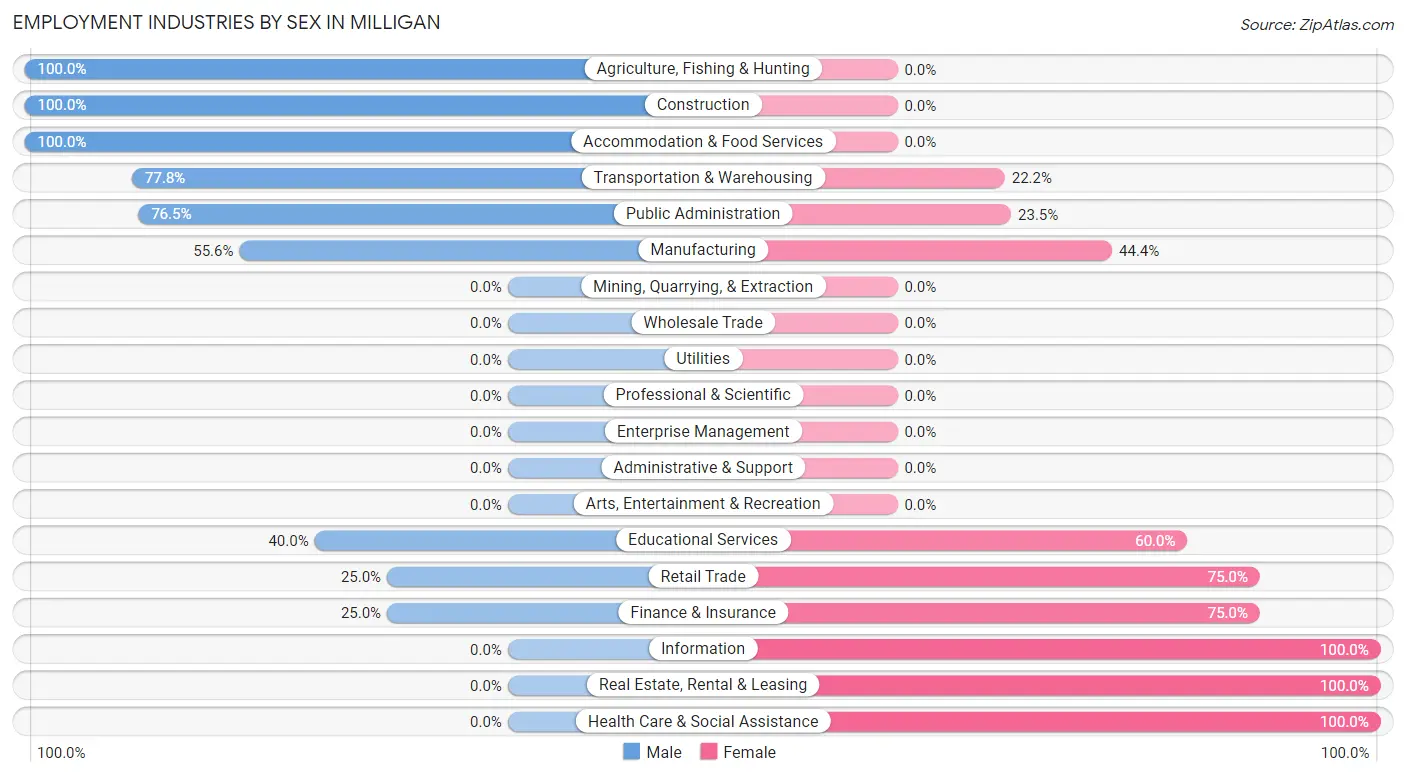
Employment Industries by Sex in Milligan
The Milligan industries that see more men than women are Agriculture, Fishing & Hunting (100.0%), Construction (100.0%), and Accommodation & Food Services (100.0%), whereas the industries that tend to have a higher number of women are Information (100.0%), Real Estate, Rental & Leasing (100.0%), and Health Care & Social Assistance (100.0%).
| Industry | Male | Female |
| Agriculture, Fishing & Hunting | 13 (100.0%) | 0 (0.0%) |
| Mining, Quarrying, & Extraction | 0 (0.0%) | 0 (0.0%) |
| Construction | 5 (100.0%) | 0 (0.0%) |
| Manufacturing | 5 (55.6%) | 4 (44.4%) |
| Wholesale Trade | 0 (0.0%) | 0 (0.0%) |
| Retail Trade | 3 (25.0%) | 9 (75.0%) |
| Transportation & Warehousing | 7 (77.8%) | 2 (22.2%) |
| Utilities | 0 (0.0%) | 0 (0.0%) |
| Information | 0 (0.0%) | 1 (100.0%) |
| Finance & Insurance | 3 (25.0%) | 9 (75.0%) |
| Real Estate, Rental & Leasing | 0 (0.0%) | 1 (100.0%) |
| Professional & Scientific | 0 (0.0%) | 0 (0.0%) |
| Enterprise Management | 0 (0.0%) | 0 (0.0%) |
| Administrative & Support | 0 (0.0%) | 0 (0.0%) |
| Educational Services | 2 (40.0%) | 3 (60.0%) |
| Health Care & Social Assistance | 0 (0.0%) | 17 (100.0%) |
| Arts, Entertainment & Recreation | 0 (0.0%) | 0 (0.0%) |
| Accommodation & Food Services | 8 (100.0%) | 0 (0.0%) |
| Public Administration | 13 (76.5%) | 4 (23.5%) |
| Total | 60 (47.2%) | 67 (52.8%) |
Education in Milligan
School Enrollment in Milligan
The most common levels of schooling among the 41 students in Milligan are middle school (19 | 46.3%), high school (10 | 24.4%), and elementary school (6 | 14.6%).
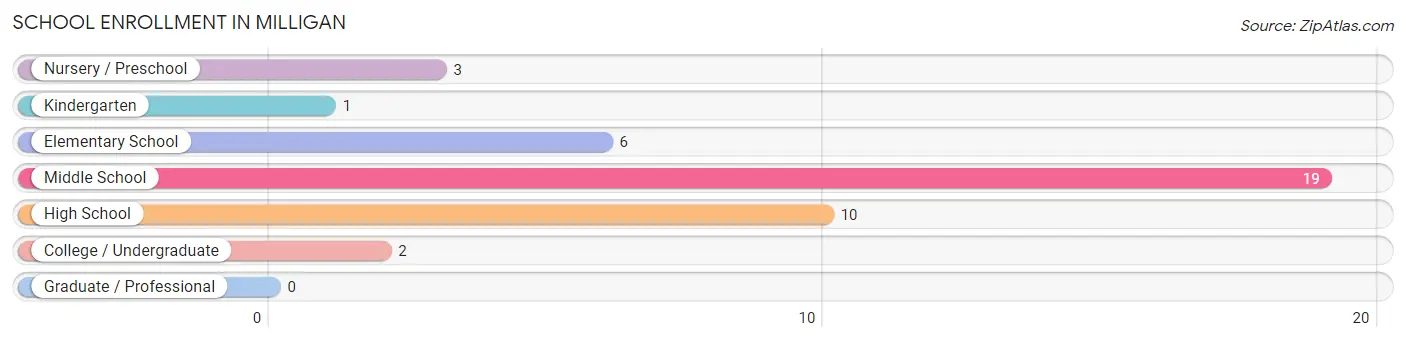
| School Level | # Students | % Students |
| Nursery / Preschool | 3 | 7.3% |
| Kindergarten | 1 | 2.4% |
| Elementary School | 6 | 14.6% |
| Middle School | 19 | 46.3% |
| High School | 10 | 24.4% |
| College / Undergraduate | 2 | 4.9% |
| Graduate / Professional | 0 | 0.0% |
| Total | 41 | 100.0% |
School Enrollment by Age by Funding Source in Milligan
Out of a total of 41 students who are enrolled in schools in Milligan, 3 (7.3%) attend a private institution, while the remaining 38 (92.7%) are enrolled in public schools. The age group of 15 to 17 year olds has the highest likelihood of being enrolled in private schools, with 2 (20.0% in the age bracket) enrolled. Conversely, the age group of 3 to 4 year olds has the lowest likelihood of being enrolled in a private school, with 3 (100.0% in the age bracket) attending a public institution.
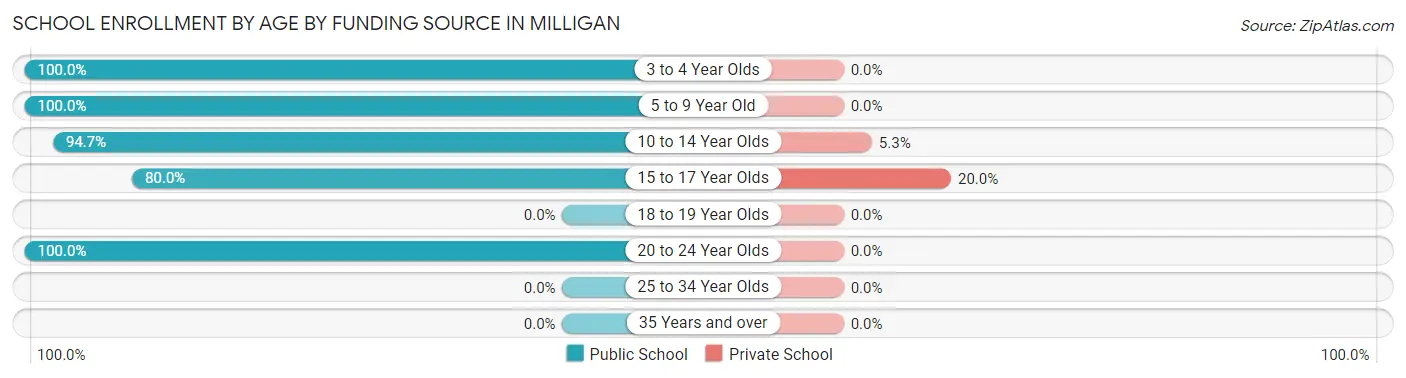
| Age Bracket | Public School | Private School |
| 3 to 4 Year Olds | 3 (100.0%) | 0 (0.0%) |
| 5 to 9 Year Old | 7 (100.0%) | 0 (0.0%) |
| 10 to 14 Year Olds | 18 (94.7%) | 1 (5.3%) |
| 15 to 17 Year Olds | 8 (80.0%) | 2 (20.0%) |
| 18 to 19 Year Olds | 0 (0.0%) | 0 (0.0%) |
| 20 to 24 Year Olds | 2 (100.0%) | 0 (0.0%) |
| 25 to 34 Year Olds | 0 (0.0%) | 0 (0.0%) |
| 35 Years and over | 0 (0.0%) | 0 (0.0%) |
| Total | 38 (92.7%) | 3 (7.3%) |
Educational Attainment by Field of Study in Milligan
Education (6 | 24.0%), arts & humanities (6 | 24.0%), science & technology (5 | 20.0%), business (4 | 16.0%), and psychology (2 | 8.0%) are the most common fields of study among 25 individuals in Milligan who have obtained a bachelor's degree or higher.
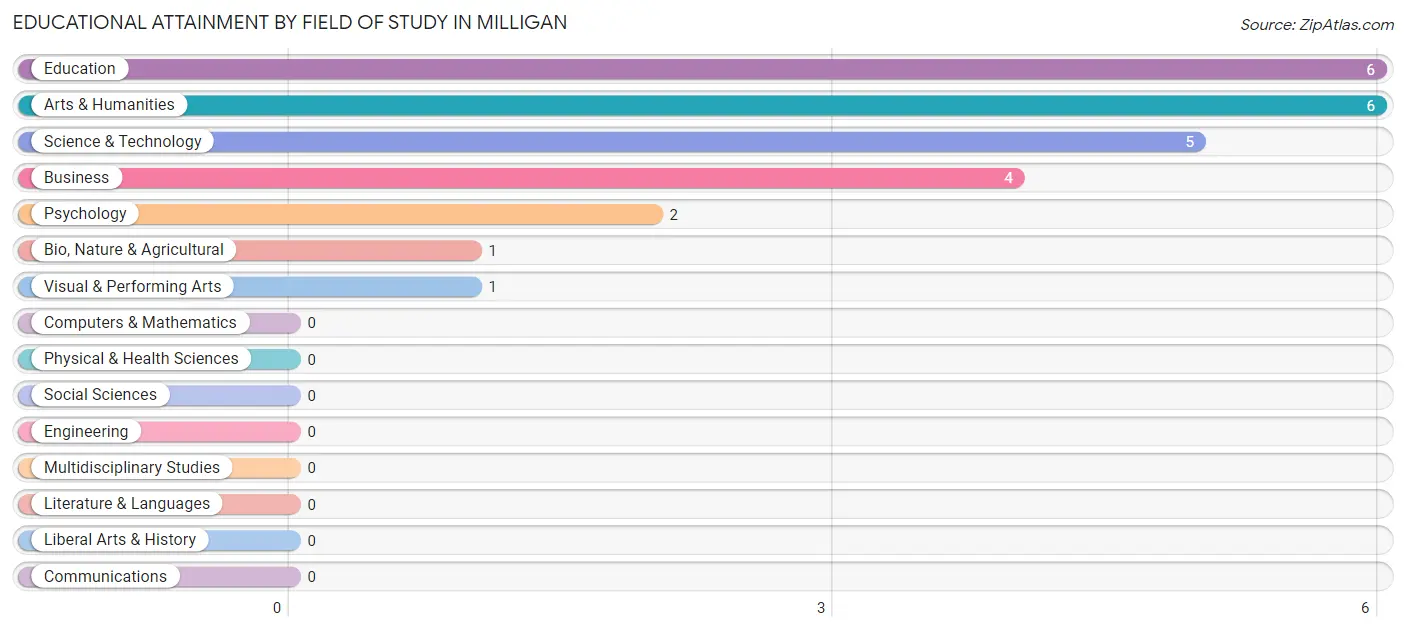
| Field of Study | # Graduates | % Graduates |
| Computers & Mathematics | 0 | 0.0% |
| Bio, Nature & Agricultural | 1 | 4.0% |
| Physical & Health Sciences | 0 | 0.0% |
| Psychology | 2 | 8.0% |
| Social Sciences | 0 | 0.0% |
| Engineering | 0 | 0.0% |
| Multidisciplinary Studies | 0 | 0.0% |
| Science & Technology | 5 | 20.0% |
| Business | 4 | 16.0% |
| Education | 6 | 24.0% |
| Literature & Languages | 0 | 0.0% |
| Liberal Arts & History | 0 | 0.0% |
| Visual & Performing Arts | 1 | 4.0% |
| Communications | 0 | 0.0% |
| Arts & Humanities | 6 | 24.0% |
| Total | 25 | 100.0% |
Transportation & Commute in Milligan
Vehicle Availability by Sex in Milligan
The most prevalent vehicle ownership categories in Milligan are males with 3 vehicles (25, accounting for 51.0%) and females with 3 vehicles (27, making up 50.0%).
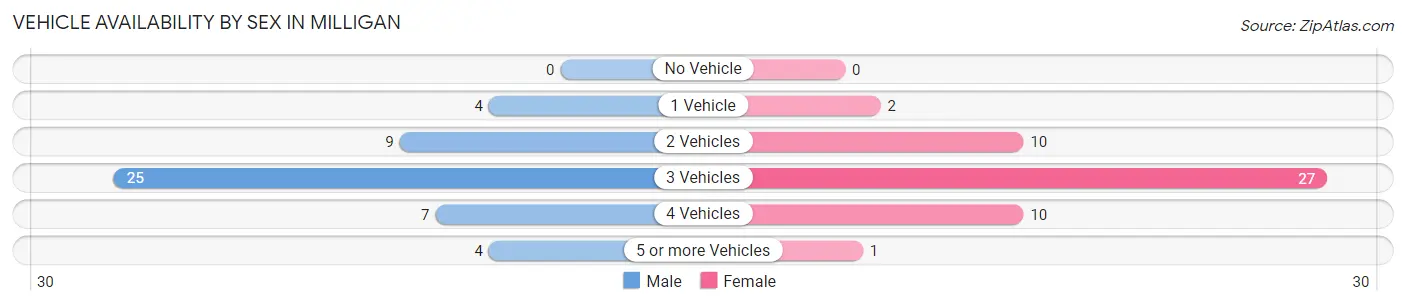
| Vehicles Available | Male | Female |
| No Vehicle | 0 (0.0%) | 0 (0.0%) |
| 1 Vehicle | 4 (8.2%) | 2 (4.0%) |
| 2 Vehicles | 9 (18.4%) | 10 (20.0%) |
| 3 Vehicles | 25 (51.0%) | 27 (54.0%) |
| 4 Vehicles | 7 (14.3%) | 10 (20.0%) |
| 5 or more Vehicles | 4 (8.2%) | 1 (2.0%) |
| Total | 49 (100.0%) | 50 (100.0%) |
Commute Time in Milligan
The most frequently occuring commute durations in Milligan are 20 to 24 minutes (18 commuters, 19.2%), 60 to 89 minutes (14 commuters, 14.9%), and 5 to 9 minutes (13 commuters, 13.8%).
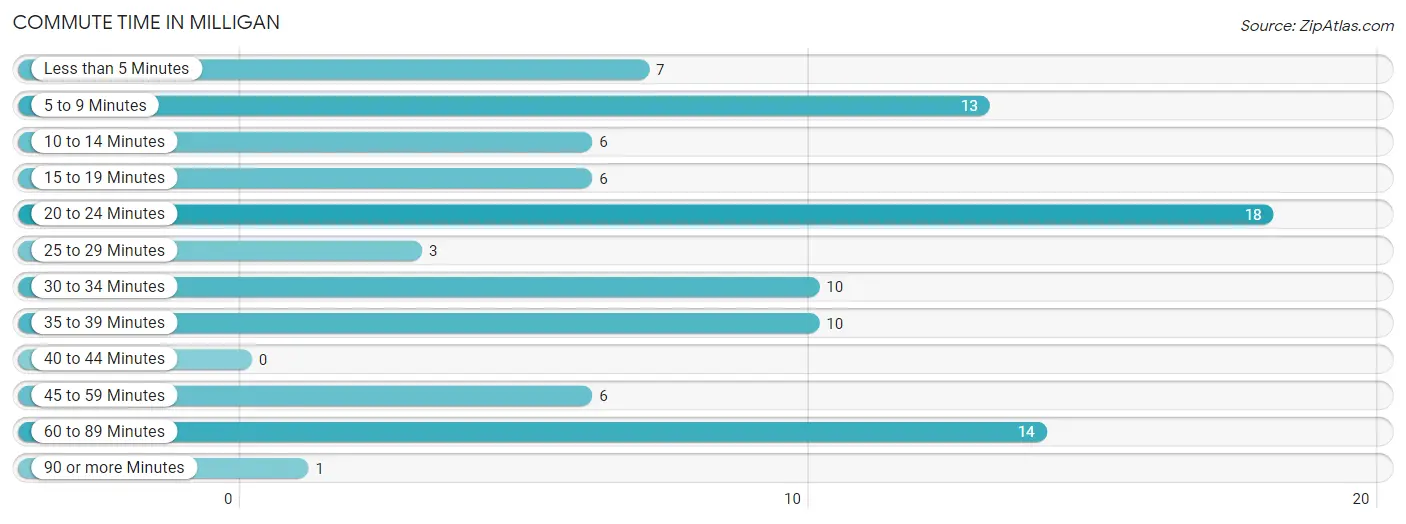
| Commute Time | # Commuters | % Commuters |
| Less than 5 Minutes | 7 | 7.4% |
| 5 to 9 Minutes | 13 | 13.8% |
| 10 to 14 Minutes | 6 | 6.4% |
| 15 to 19 Minutes | 6 | 6.4% |
| 20 to 24 Minutes | 18 | 19.2% |
| 25 to 29 Minutes | 3 | 3.2% |
| 30 to 34 Minutes | 10 | 10.6% |
| 35 to 39 Minutes | 10 | 10.6% |
| 40 to 44 Minutes | 0 | 0.0% |
| 45 to 59 Minutes | 6 | 6.4% |
| 60 to 89 Minutes | 14 | 14.9% |
| 90 or more Minutes | 1 | 1.1% |
Commute Time by Sex in Milligan
The most common commute times in Milligan are 20 to 24 minutes (17 commuters, 35.4%) for males and 5 to 9 minutes (13 commuters, 28.3%) for females.
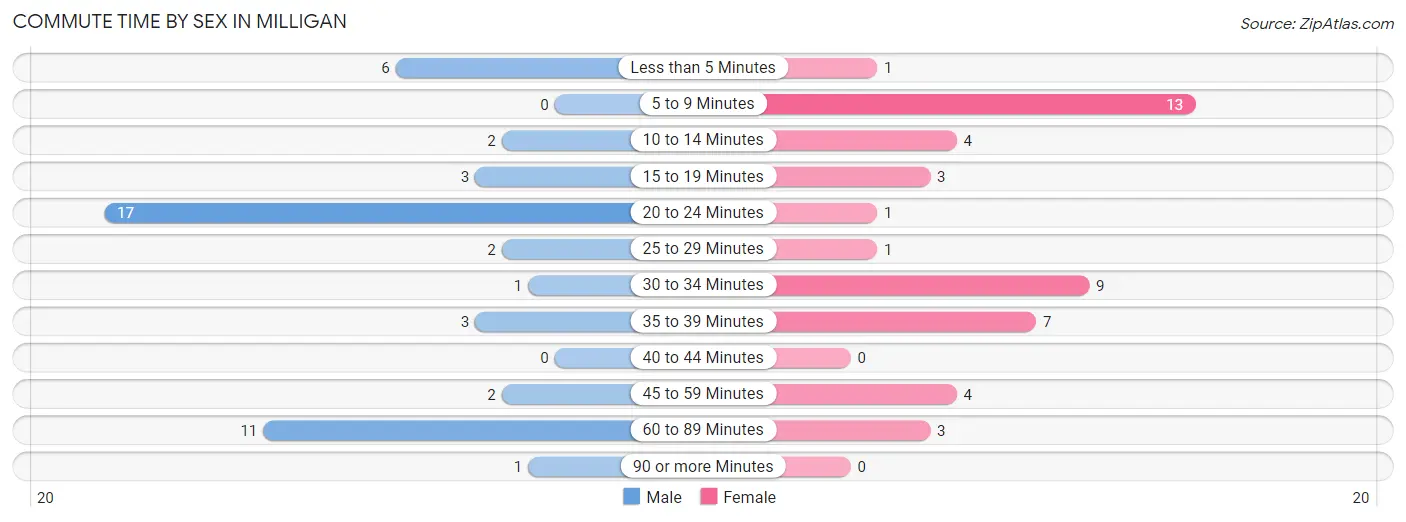
| Commute Time | Male | Female |
| Less than 5 Minutes | 6 (12.5%) | 1 (2.2%) |
| 5 to 9 Minutes | 0 (0.0%) | 13 (28.3%) |
| 10 to 14 Minutes | 2 (4.2%) | 4 (8.7%) |
| 15 to 19 Minutes | 3 (6.2%) | 3 (6.5%) |
| 20 to 24 Minutes | 17 (35.4%) | 1 (2.2%) |
| 25 to 29 Minutes | 2 (4.2%) | 1 (2.2%) |
| 30 to 34 Minutes | 1 (2.1%) | 9 (19.6%) |
| 35 to 39 Minutes | 3 (6.2%) | 7 (15.2%) |
| 40 to 44 Minutes | 0 (0.0%) | 0 (0.0%) |
| 45 to 59 Minutes | 2 (4.2%) | 4 (8.7%) |
| 60 to 89 Minutes | 11 (22.9%) | 3 (6.5%) |
| 90 or more Minutes | 1 (2.1%) | 0 (0.0%) |
Time of Departure to Work by Sex in Milligan
The most frequent times of departure to work in Milligan are 9:00 AM to 9:59 AM (14, 29.2%) for males and 12:00 AM to 4:59 AM (12, 26.1%) for females.
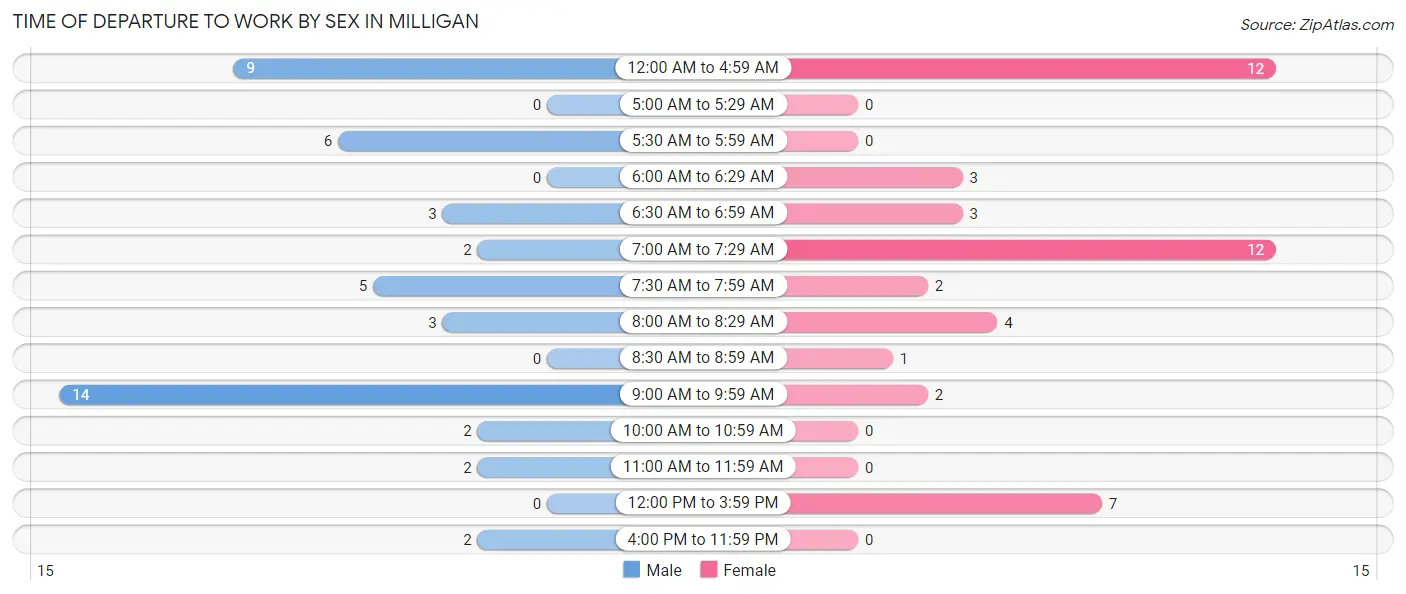
| Time of Departure | Male | Female |
| 12:00 AM to 4:59 AM | 9 (18.8%) | 12 (26.1%) |
| 5:00 AM to 5:29 AM | 0 (0.0%) | 0 (0.0%) |
| 5:30 AM to 5:59 AM | 6 (12.5%) | 0 (0.0%) |
| 6:00 AM to 6:29 AM | 0 (0.0%) | 3 (6.5%) |
| 6:30 AM to 6:59 AM | 3 (6.2%) | 3 (6.5%) |
| 7:00 AM to 7:29 AM | 2 (4.2%) | 12 (26.1%) |
| 7:30 AM to 7:59 AM | 5 (10.4%) | 2 (4.3%) |
| 8:00 AM to 8:29 AM | 3 (6.2%) | 4 (8.7%) |
| 8:30 AM to 8:59 AM | 0 (0.0%) | 1 (2.2%) |
| 9:00 AM to 9:59 AM | 14 (29.2%) | 2 (4.3%) |
| 10:00 AM to 10:59 AM | 2 (4.2%) | 0 (0.0%) |
| 11:00 AM to 11:59 AM | 2 (4.2%) | 0 (0.0%) |
| 12:00 PM to 3:59 PM | 0 (0.0%) | 7 (15.2%) |
| 4:00 PM to 11:59 PM | 2 (4.2%) | 0 (0.0%) |
| Total | 48 (100.0%) | 46 (100.0%) |
Housing Occupancy in Milligan
Occupancy by Ownership in Milligan
Of the total 118 dwellings in Milligan, owner-occupied units account for 102 (86.4%), while renter-occupied units make up 16 (13.6%).
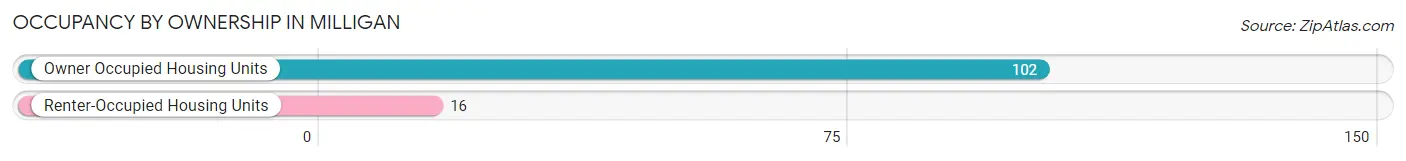
| Occupancy | # Housing Units | % Housing Units |
| Owner Occupied Housing Units | 102 | 86.4% |
| Renter-Occupied Housing Units | 16 | 13.6% |
| Total Occupied Housing Units | 118 | 100.0% |
Occupancy by Household Size in Milligan
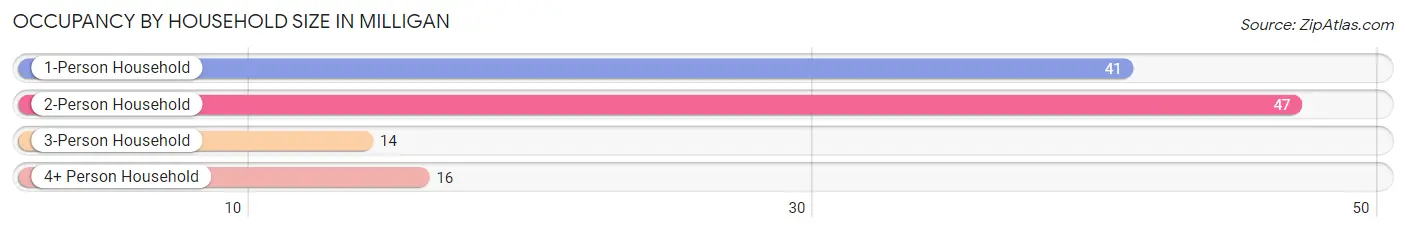
| Household Size | # Housing Units | % Housing Units |
| 1-Person Household | 41 | 34.7% |
| 2-Person Household | 47 | 39.8% |
| 3-Person Household | 14 | 11.9% |
| 4+ Person Household | 16 | 13.6% |
| Total Housing Units | 118 | 100.0% |
Occupancy by Ownership by Household Size in Milligan
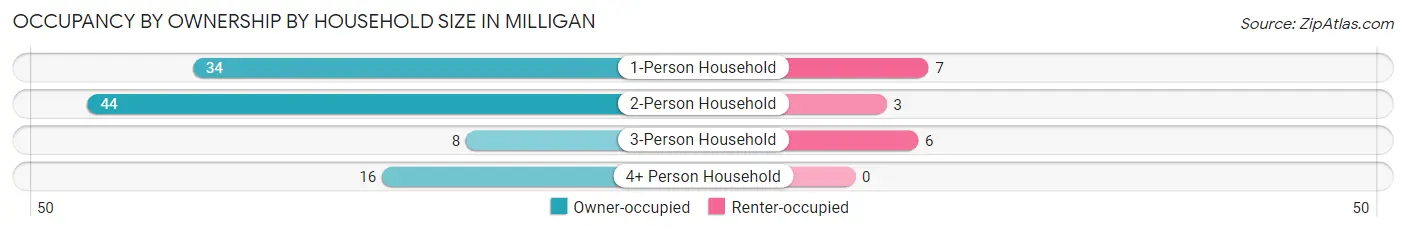
| Household Size | Owner-occupied | Renter-occupied |
| 1-Person Household | 34 (82.9%) | 7 (17.1%) |
| 2-Person Household | 44 (93.6%) | 3 (6.4%) |
| 3-Person Household | 8 (57.1%) | 6 (42.9%) |
| 4+ Person Household | 16 (100.0%) | 0 (0.0%) |
| Total Housing Units | 102 (86.4%) | 16 (13.6%) |
Occupancy by Educational Attainment in Milligan
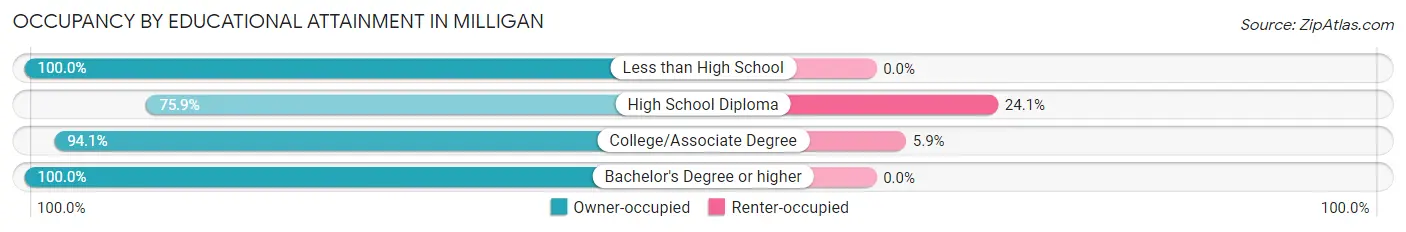
| Household Size | Owner-occupied | Renter-occupied |
| Less than High School | 10 (100.0%) | 0 (0.0%) |
| High School Diploma | 44 (75.9%) | 14 (24.1%) |
| College/Associate Degree | 32 (94.1%) | 2 (5.9%) |
| Bachelor's Degree or higher | 16 (100.0%) | 0 (0.0%) |
Occupancy by Age of Householder in Milligan
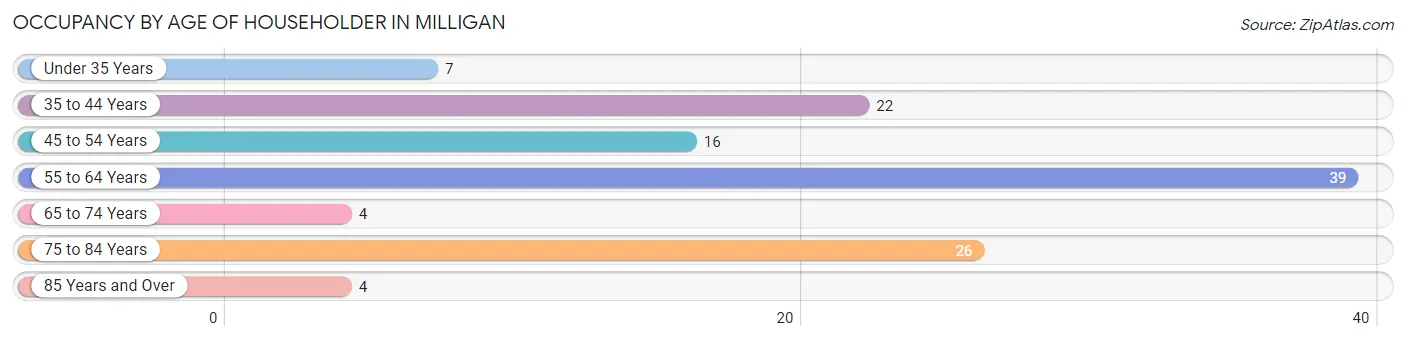
| Age Bracket | # Households | % Households |
| Under 35 Years | 7 | 5.9% |
| 35 to 44 Years | 22 | 18.6% |
| 45 to 54 Years | 16 | 13.6% |
| 55 to 64 Years | 39 | 33.1% |
| 65 to 74 Years | 4 | 3.4% |
| 75 to 84 Years | 26 | 22.0% |
| 85 Years and Over | 4 | 3.4% |
| Total | 118 | 100.0% |
Housing Finances in Milligan
Median Income by Occupancy in Milligan
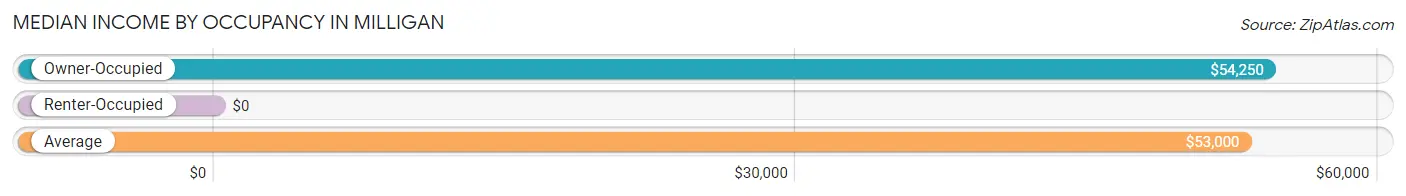
| Occupancy Type | # Households | Median Income |
| Owner-Occupied | 102 (86.4%) | $54,250 |
| Renter-Occupied | 16 (13.6%) | $0 |
| Average | 118 (100.0%) | $53,000 |
Occupancy by Householder Income Bracket in Milligan
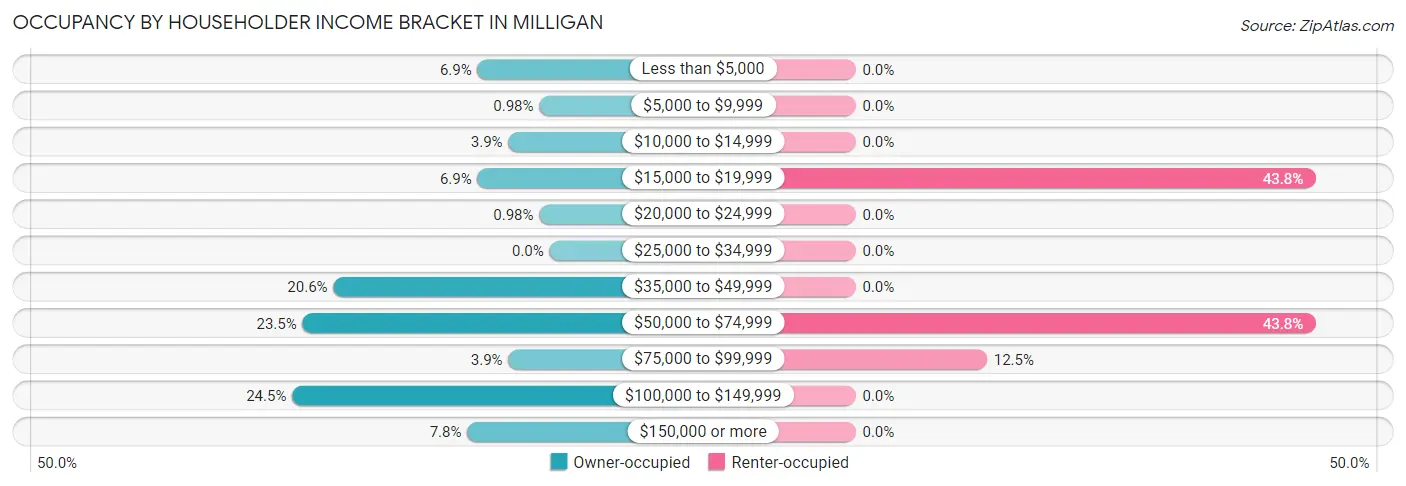
| Income Bracket | Owner-occupied | Renter-occupied |
| Less than $5,000 | 7 (6.9%) | 0 (0.0%) |
| $5,000 to $9,999 | 1 (1.0%) | 0 (0.0%) |
| $10,000 to $14,999 | 4 (3.9%) | 0 (0.0%) |
| $15,000 to $19,999 | 7 (6.9%) | 7 (43.8%) |
| $20,000 to $24,999 | 1 (1.0%) | 0 (0.0%) |
| $25,000 to $34,999 | 0 (0.0%) | 0 (0.0%) |
| $35,000 to $49,999 | 21 (20.6%) | 0 (0.0%) |
| $50,000 to $74,999 | 24 (23.5%) | 7 (43.8%) |
| $75,000 to $99,999 | 4 (3.9%) | 2 (12.5%) |
| $100,000 to $149,999 | 25 (24.5%) | 0 (0.0%) |
| $150,000 or more | 8 (7.8%) | 0 (0.0%) |
| Total | 102 (100.0%) | 16 (100.0%) |
Monthly Housing Cost Tiers in Milligan
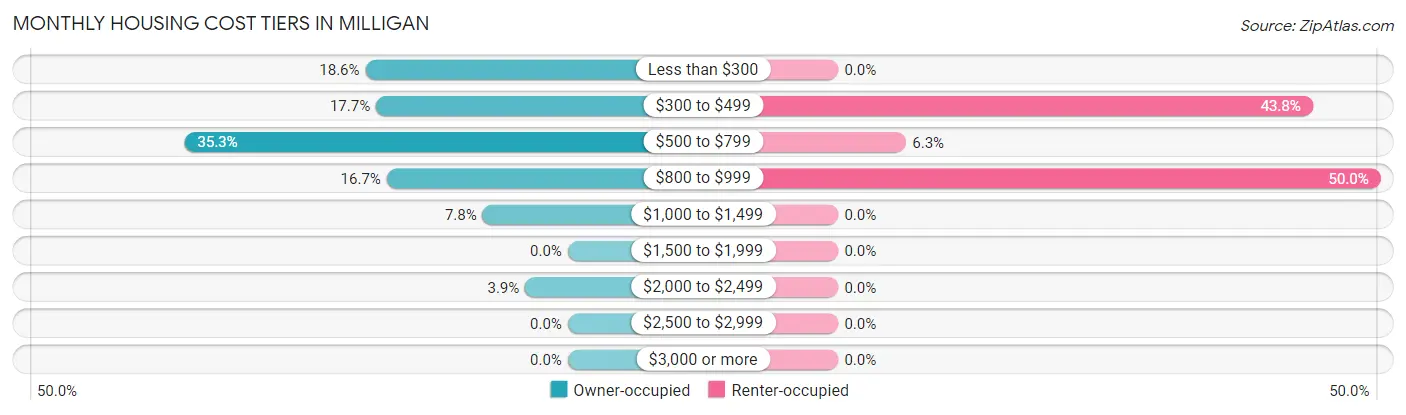
| Monthly Cost | Owner-occupied | Renter-occupied |
| Less than $300 | 19 (18.6%) | 0 (0.0%) |
| $300 to $499 | 18 (17.6%) | 7 (43.8%) |
| $500 to $799 | 36 (35.3%) | 1 (6.2%) |
| $800 to $999 | 17 (16.7%) | 8 (50.0%) |
| $1,000 to $1,499 | 8 (7.8%) | 0 (0.0%) |
| $1,500 to $1,999 | 0 (0.0%) | 0 (0.0%) |
| $2,000 to $2,499 | 4 (3.9%) | 0 (0.0%) |
| $2,500 to $2,999 | 0 (0.0%) | 0 (0.0%) |
| $3,000 or more | 0 (0.0%) | 0 (0.0%) |
| Total | 102 (100.0%) | 16 (100.0%) |
Physical Housing Characteristics in Milligan
Housing Structures in Milligan
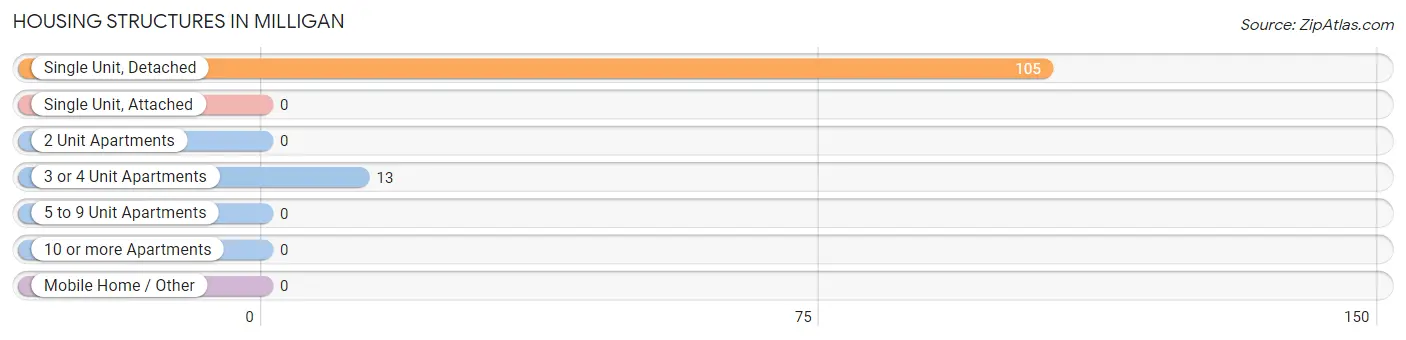
| Structure Type | # Housing Units | % Housing Units |
| Single Unit, Detached | 105 | 89.0% |
| Single Unit, Attached | 0 | 0.0% |
| 2 Unit Apartments | 0 | 0.0% |
| 3 or 4 Unit Apartments | 13 | 11.0% |
| 5 to 9 Unit Apartments | 0 | 0.0% |
| 10 or more Apartments | 0 | 0.0% |
| Mobile Home / Other | 0 | 0.0% |
| Total | 118 | 100.0% |
Housing Structures by Occupancy in Milligan
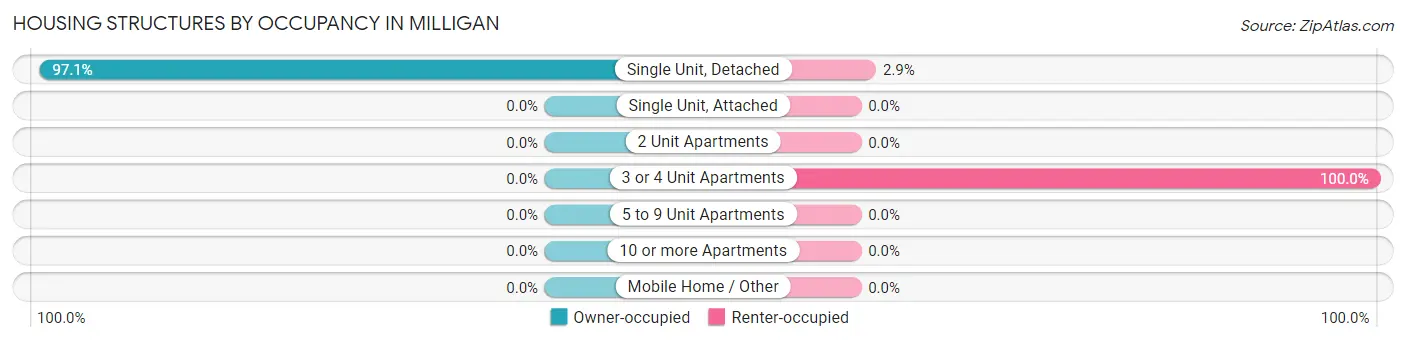
| Structure Type | Owner-occupied | Renter-occupied |
| Single Unit, Detached | 102 (97.1%) | 3 (2.9%) |
| Single Unit, Attached | 0 (0.0%) | 0 (0.0%) |
| 2 Unit Apartments | 0 (0.0%) | 0 (0.0%) |
| 3 or 4 Unit Apartments | 0 (0.0%) | 13 (100.0%) |
| 5 to 9 Unit Apartments | 0 (0.0%) | 0 (0.0%) |
| 10 or more Apartments | 0 (0.0%) | 0 (0.0%) |
| Mobile Home / Other | 0 (0.0%) | 0 (0.0%) |
| Total | 102 (86.4%) | 16 (13.6%) |
Housing Structures by Number of Rooms in Milligan
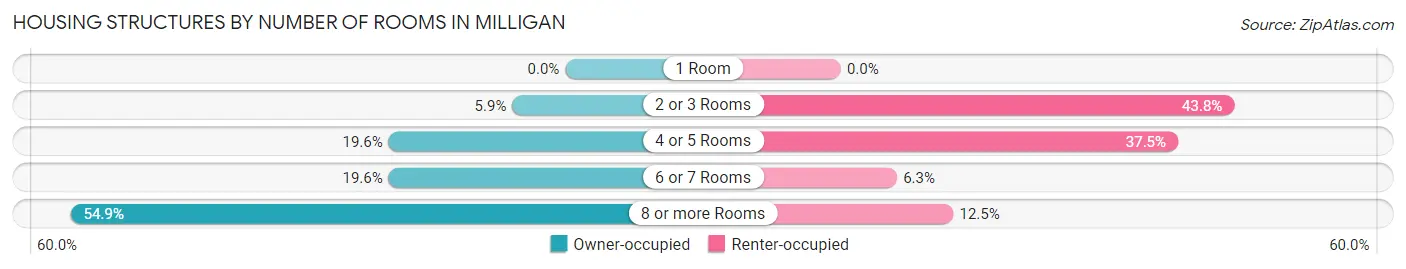
| Number of Rooms | Owner-occupied | Renter-occupied |
| 1 Room | 0 (0.0%) | 0 (0.0%) |
| 2 or 3 Rooms | 6 (5.9%) | 7 (43.8%) |
| 4 or 5 Rooms | 20 (19.6%) | 6 (37.5%) |
| 6 or 7 Rooms | 20 (19.6%) | 1 (6.2%) |
| 8 or more Rooms | 56 (54.9%) | 2 (12.5%) |
| Total | 102 (100.0%) | 16 (100.0%) |
Housing Structure by Heating Type in Milligan
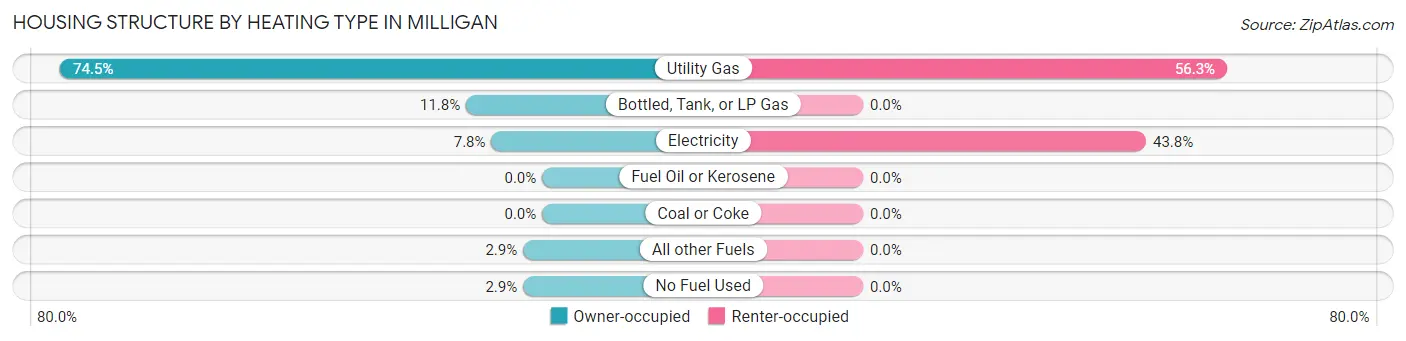
| Heating Type | Owner-occupied | Renter-occupied |
| Utility Gas | 76 (74.5%) | 9 (56.2%) |
| Bottled, Tank, or LP Gas | 12 (11.8%) | 0 (0.0%) |
| Electricity | 8 (7.8%) | 7 (43.8%) |
| Fuel Oil or Kerosene | 0 (0.0%) | 0 (0.0%) |
| Coal or Coke | 0 (0.0%) | 0 (0.0%) |
| All other Fuels | 3 (2.9%) | 0 (0.0%) |
| No Fuel Used | 3 (2.9%) | 0 (0.0%) |
| Total | 102 (100.0%) | 16 (100.0%) |
Household Vehicle Usage in Milligan
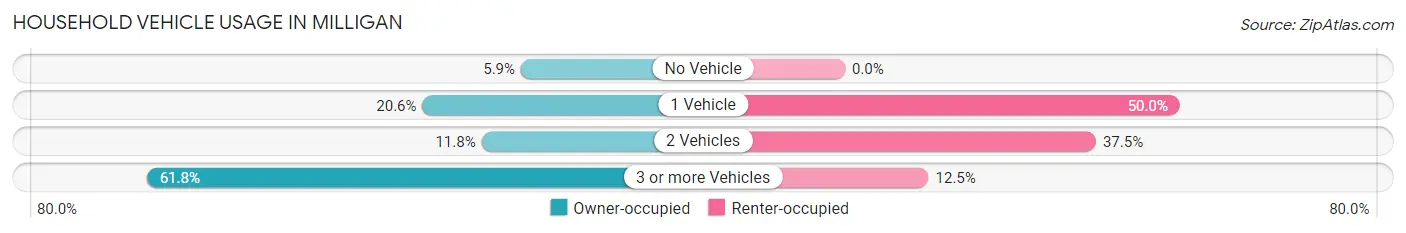
| Vehicles per Household | Owner-occupied | Renter-occupied |
| No Vehicle | 6 (5.9%) | 0 (0.0%) |
| 1 Vehicle | 21 (20.6%) | 8 (50.0%) |
| 2 Vehicles | 12 (11.8%) | 6 (37.5%) |
| 3 or more Vehicles | 63 (61.8%) | 2 (12.5%) |
| Total | 102 (100.0%) | 16 (100.0%) |
Real Estate & Mortgages in Milligan
Real Estate and Mortgage Overview in Milligan
| Characteristic | Without Mortgage | With Mortgage |
| Housing Units | 66 | 36 |
| Median Property Value | $55,700 | $70,000 |
| Median Household Income | $46,250 | $7 |
| Monthly Housing Costs | $456 | $0 |
| Real Estate Taxes | - | - |
Property Value by Mortgage Status in Milligan
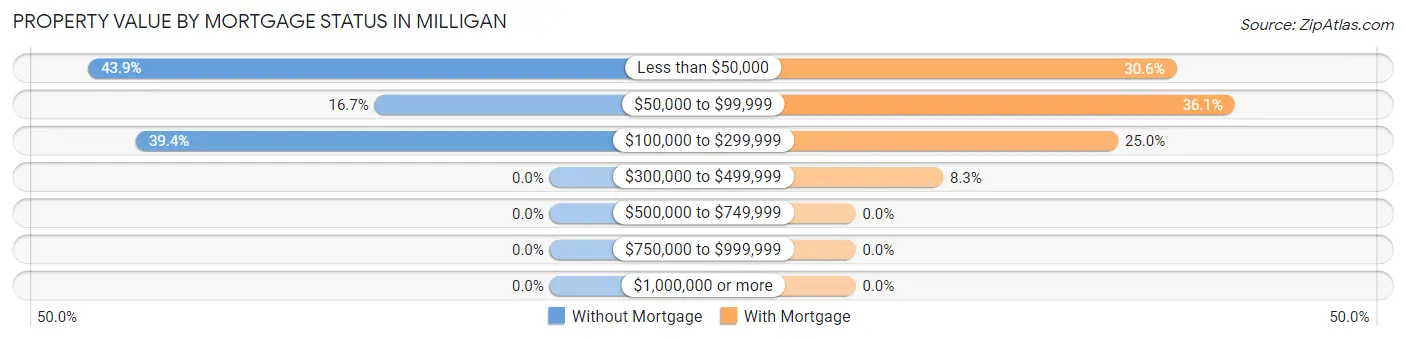
| Property Value | Without Mortgage | With Mortgage |
| Less than $50,000 | 29 (43.9%) | 11 (30.6%) |
| $50,000 to $99,999 | 11 (16.7%) | 13 (36.1%) |
| $100,000 to $299,999 | 26 (39.4%) | 9 (25.0%) |
| $300,000 to $499,999 | 0 (0.0%) | 3 (8.3%) |
| $500,000 to $749,999 | 0 (0.0%) | 0 (0.0%) |
| $750,000 to $999,999 | 0 (0.0%) | 0 (0.0%) |
| $1,000,000 or more | 0 (0.0%) | 0 (0.0%) |
| Total | 66 (100.0%) | 36 (100.0%) |
Household Income by Mortgage Status in Milligan
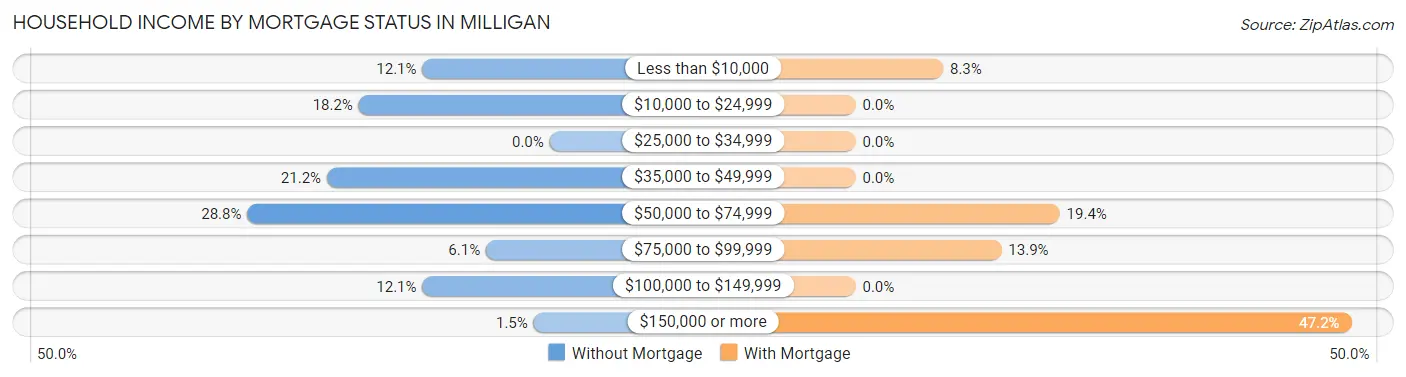
| Household Income | Without Mortgage | With Mortgage |
| Less than $10,000 | 8 (12.1%) | 3 (8.3%) |
| $10,000 to $24,999 | 12 (18.2%) | 0 (0.0%) |
| $25,000 to $34,999 | 0 (0.0%) | 0 (0.0%) |
| $35,000 to $49,999 | 14 (21.2%) | 0 (0.0%) |
| $50,000 to $74,999 | 19 (28.8%) | 7 (19.4%) |
| $75,000 to $99,999 | 4 (6.1%) | 5 (13.9%) |
| $100,000 to $149,999 | 8 (12.1%) | 0 (0.0%) |
| $150,000 or more | 1 (1.5%) | 17 (47.2%) |
| Total | 66 (100.0%) | 36 (100.0%) |
Property Value to Household Income Ratio in Milligan
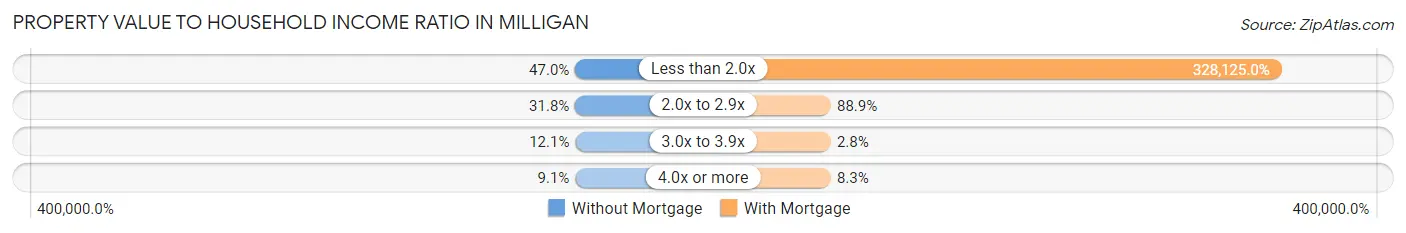
| Value-to-Income Ratio | Without Mortgage | With Mortgage |
| Less than 2.0x | 31 (47.0%) | 118,125 (328,125.0%) |
| 2.0x to 2.9x | 21 (31.8%) | 32 (88.9%) |
| 3.0x to 3.9x | 8 (12.1%) | 1 (2.8%) |
| 4.0x or more | 6 (9.1%) | 3 (8.3%) |
| Total | 66 (100.0%) | 36 (100.0%) |
Real Estate Taxes by Mortgage Status in Milligan
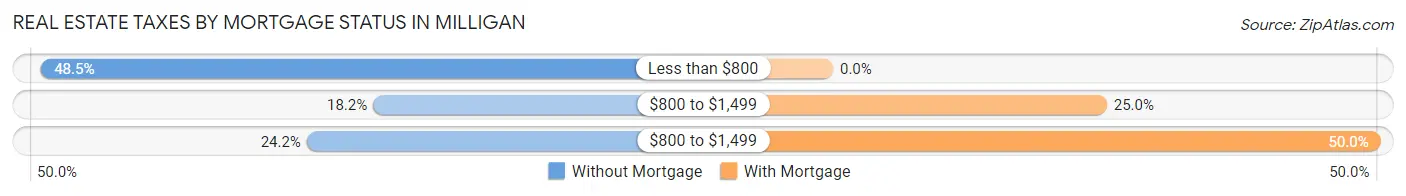
| Property Taxes | Without Mortgage | With Mortgage |
| Less than $800 | 32 (48.5%) | 0 (0.0%) |
| $800 to $1,499 | 12 (18.2%) | 9 (25.0%) |
| $800 to $1,499 | 16 (24.2%) | 18 (50.0%) |
| Total | 66 (100.0%) | 36 (100.0%) |
Health & Disability in Milligan
Health Insurance Coverage by Age in Milligan
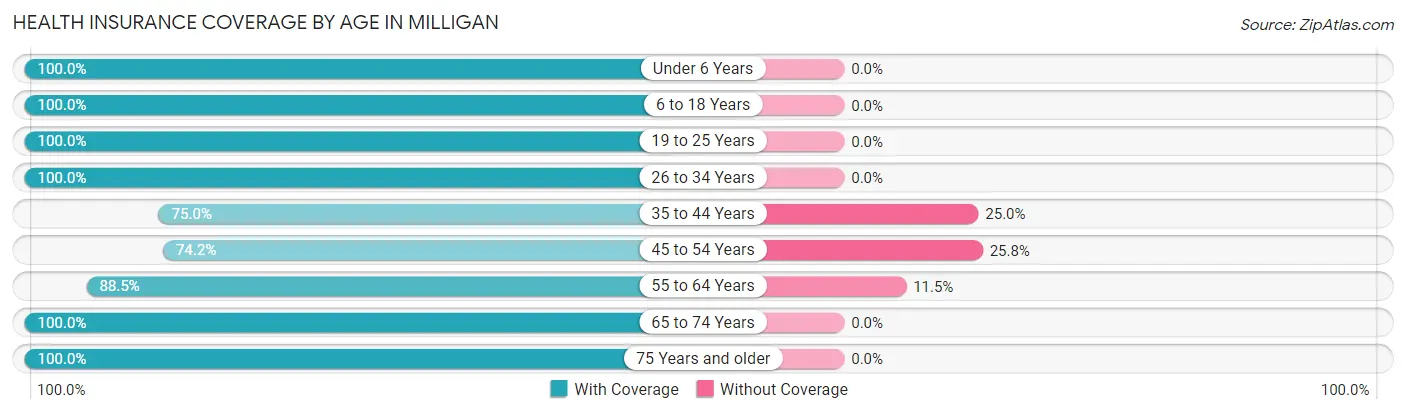
| Age Bracket | With Coverage | Without Coverage |
| Under 6 Years | 13 (100.0%) | 0 (0.0%) |
| 6 to 18 Years | 35 (100.0%) | 0 (0.0%) |
| 19 to 25 Years | 10 (100.0%) | 0 (0.0%) |
| 26 to 34 Years | 20 (100.0%) | 0 (0.0%) |
| 35 to 44 Years | 18 (75.0%) | 6 (25.0%) |
| 45 to 54 Years | 23 (74.2%) | 8 (25.8%) |
| 55 to 64 Years | 69 (88.5%) | 9 (11.5%) |
| 65 to 74 Years | 7 (100.0%) | 0 (0.0%) |
| 75 Years and older | 38 (100.0%) | 0 (0.0%) |
| Total | 233 (91.0%) | 23 (9.0%) |
Health Insurance Coverage by Citizenship Status in Milligan
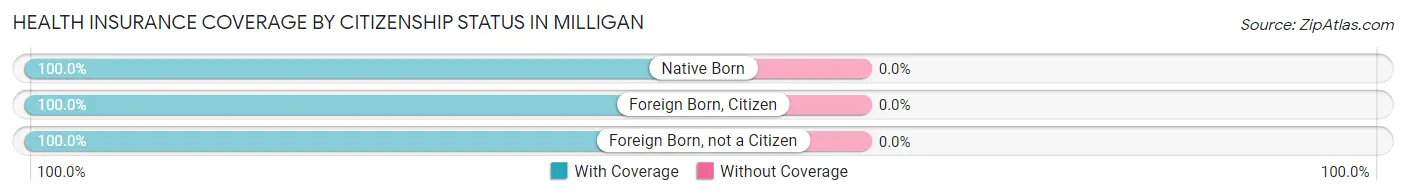
| Citizenship Status | With Coverage | Without Coverage |
| Native Born | 13 (100.0%) | 0 (0.0%) |
| Foreign Born, Citizen | 35 (100.0%) | 0 (0.0%) |
| Foreign Born, not a Citizen | 10 (100.0%) | 0 (0.0%) |
Health Insurance Coverage by Household Income in Milligan
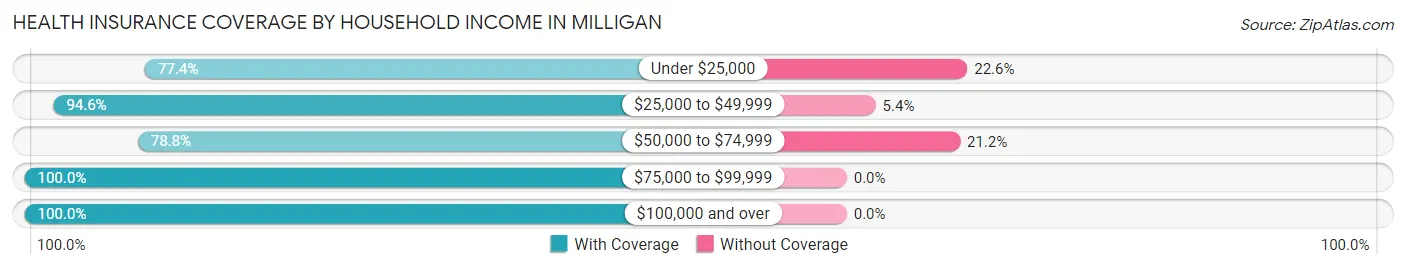
| Household Income | With Coverage | Without Coverage |
| Under $25,000 | 24 (77.4%) | 7 (22.6%) |
| $25,000 to $49,999 | 35 (94.6%) | 2 (5.4%) |
| $50,000 to $74,999 | 52 (78.8%) | 14 (21.2%) |
| $75,000 to $99,999 | 9 (100.0%) | 0 (0.0%) |
| $100,000 and over | 113 (100.0%) | 0 (0.0%) |
Public vs Private Health Insurance Coverage by Age in Milligan
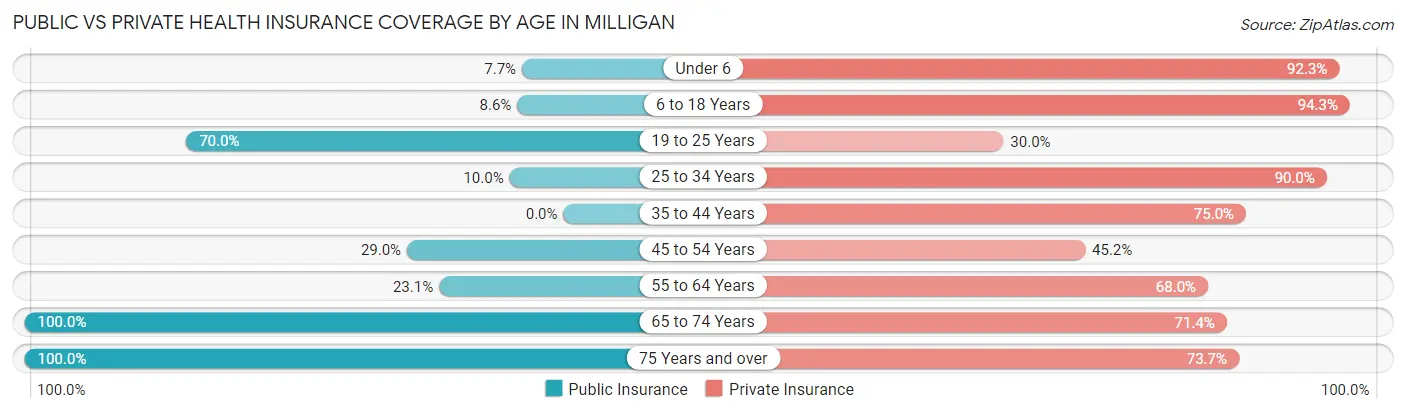
| Age Bracket | Public Insurance | Private Insurance |
| Under 6 | 1 (7.7%) | 12 (92.3%) |
| 6 to 18 Years | 3 (8.6%) | 33 (94.3%) |
| 19 to 25 Years | 7 (70.0%) | 3 (30.0%) |
| 25 to 34 Years | 2 (10.0%) | 18 (90.0%) |
| 35 to 44 Years | 0 (0.0%) | 18 (75.0%) |
| 45 to 54 Years | 9 (29.0%) | 14 (45.2%) |
| 55 to 64 Years | 18 (23.1%) | 53 (67.9%) |
| 65 to 74 Years | 7 (100.0%) | 5 (71.4%) |
| 75 Years and over | 38 (100.0%) | 28 (73.7%) |
| Total | 85 (33.2%) | 184 (71.9%) |
Disability Status by Sex by Age in Milligan
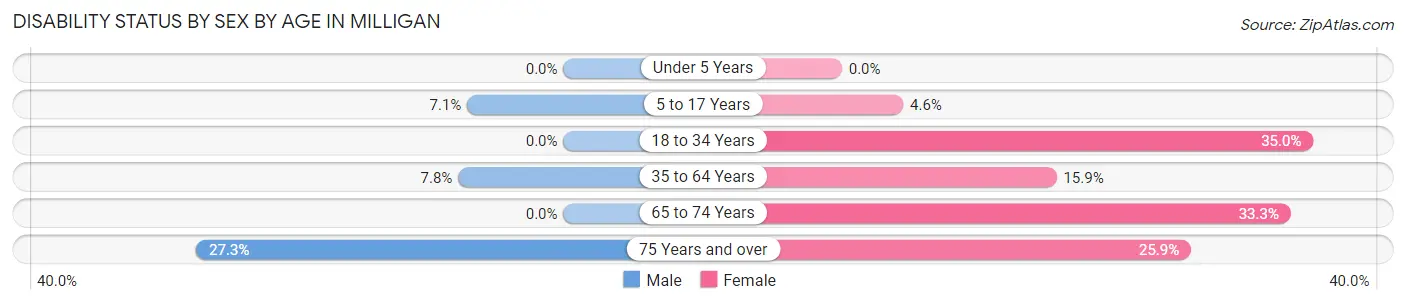
| Age Bracket | Male | Female |
| Under 5 Years | 0 (0.0%) | 0 (0.0%) |
| 5 to 17 Years | 1 (7.1%) | 1 (4.5%) |
| 18 to 34 Years | 0 (0.0%) | 7 (35.0%) |
| 35 to 64 Years | 5 (7.8%) | 11 (15.9%) |
| 65 to 74 Years | 0 (0.0%) | 1 (33.3%) |
| 75 Years and over | 3 (27.3%) | 7 (25.9%) |
Disability Class by Sex by Age in Milligan
Disability Class: Hearing Difficulty
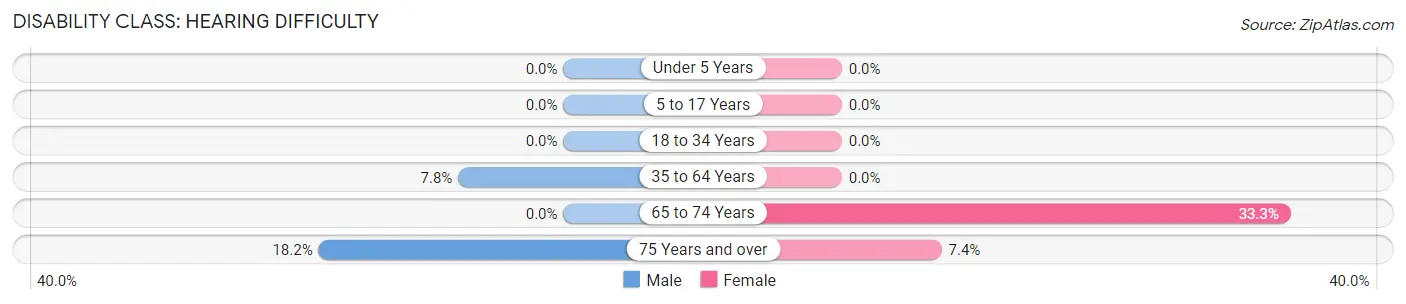
| Age Bracket | Male | Female |
| Under 5 Years | 0 (0.0%) | 0 (0.0%) |
| 5 to 17 Years | 0 (0.0%) | 0 (0.0%) |
| 18 to 34 Years | 0 (0.0%) | 0 (0.0%) |
| 35 to 64 Years | 5 (7.8%) | 0 (0.0%) |
| 65 to 74 Years | 0 (0.0%) | 1 (33.3%) |
| 75 Years and over | 2 (18.2%) | 2 (7.4%) |
Disability Class: Vision Difficulty
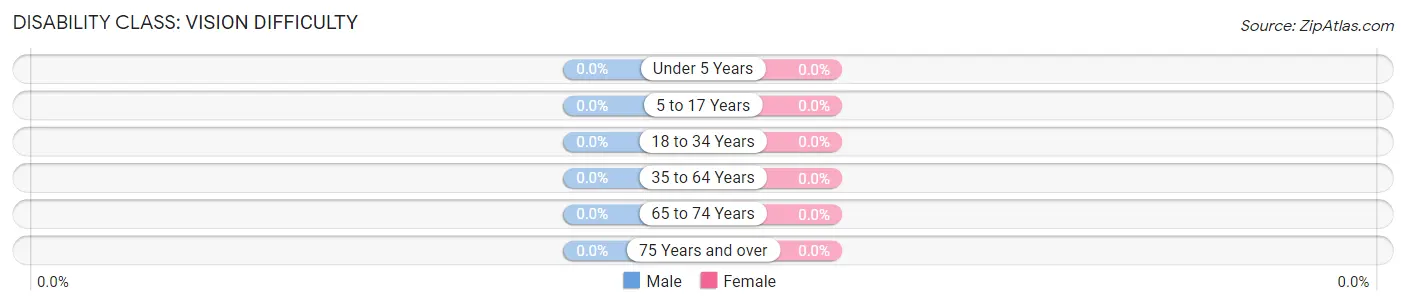
| Age Bracket | Male | Female |
| Under 5 Years | 0 (0.0%) | 0 (0.0%) |
| 5 to 17 Years | 0 (0.0%) | 0 (0.0%) |
| 18 to 34 Years | 0 (0.0%) | 0 (0.0%) |
| 35 to 64 Years | 0 (0.0%) | 0 (0.0%) |
| 65 to 74 Years | 0 (0.0%) | 0 (0.0%) |
| 75 Years and over | 0 (0.0%) | 0 (0.0%) |
Disability Class: Cognitive Difficulty
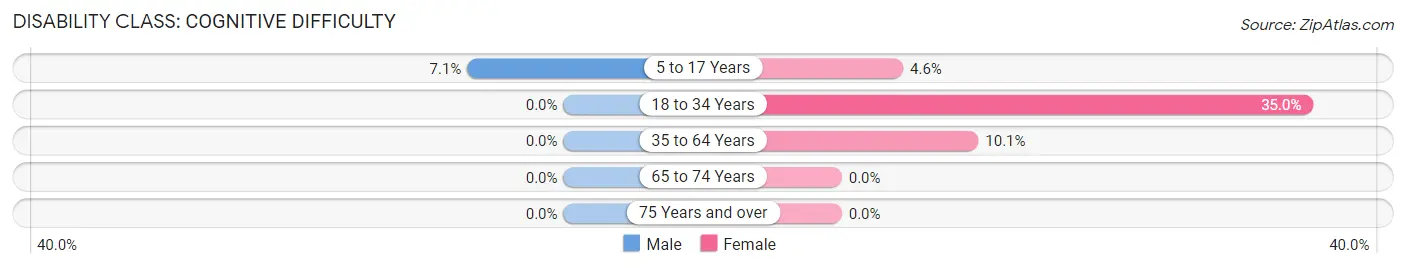
| Age Bracket | Male | Female |
| 5 to 17 Years | 1 (7.1%) | 1 (4.5%) |
| 18 to 34 Years | 0 (0.0%) | 7 (35.0%) |
| 35 to 64 Years | 0 (0.0%) | 7 (10.1%) |
| 65 to 74 Years | 0 (0.0%) | 0 (0.0%) |
| 75 Years and over | 0 (0.0%) | 0 (0.0%) |
Disability Class: Ambulatory Difficulty
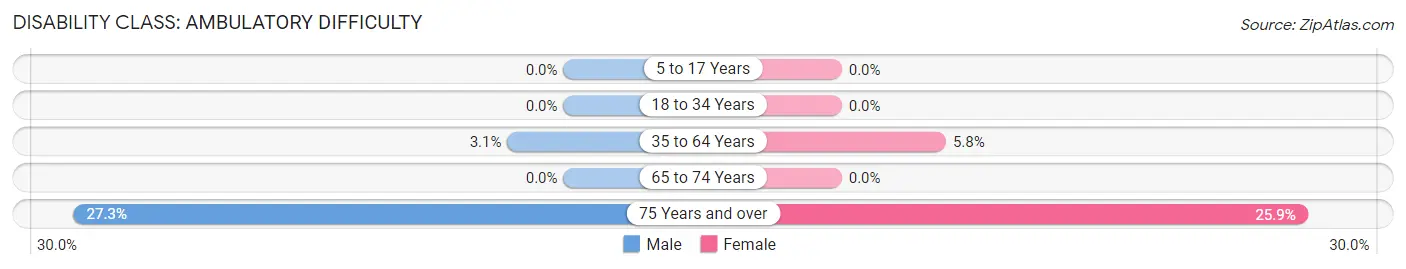
| Age Bracket | Male | Female |
| 5 to 17 Years | 0 (0.0%) | 0 (0.0%) |
| 18 to 34 Years | 0 (0.0%) | 0 (0.0%) |
| 35 to 64 Years | 2 (3.1%) | 4 (5.8%) |
| 65 to 74 Years | 0 (0.0%) | 0 (0.0%) |
| 75 Years and over | 3 (27.3%) | 7 (25.9%) |
Disability Class: Self-Care Difficulty
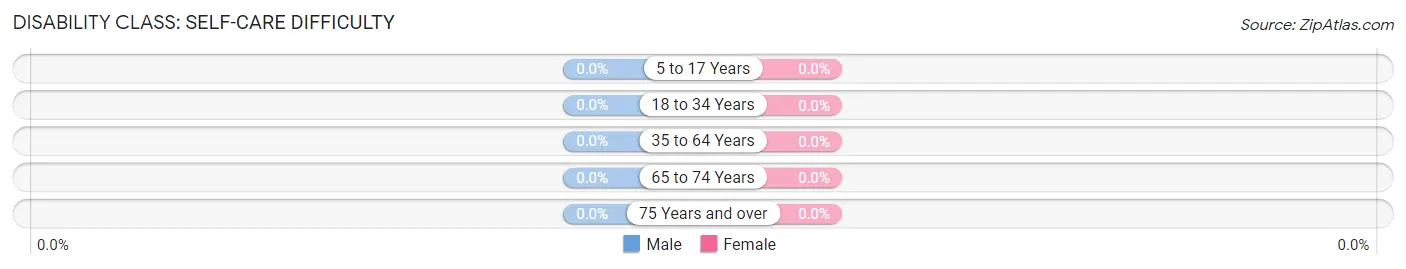
| Age Bracket | Male | Female |
| 5 to 17 Years | 0 (0.0%) | 0 (0.0%) |
| 18 to 34 Years | 0 (0.0%) | 0 (0.0%) |
| 35 to 64 Years | 0 (0.0%) | 0 (0.0%) |
| 65 to 74 Years | 0 (0.0%) | 0 (0.0%) |
| 75 Years and over | 0 (0.0%) | 0 (0.0%) |
Technology Access in Milligan
Computing Device Access in Milligan
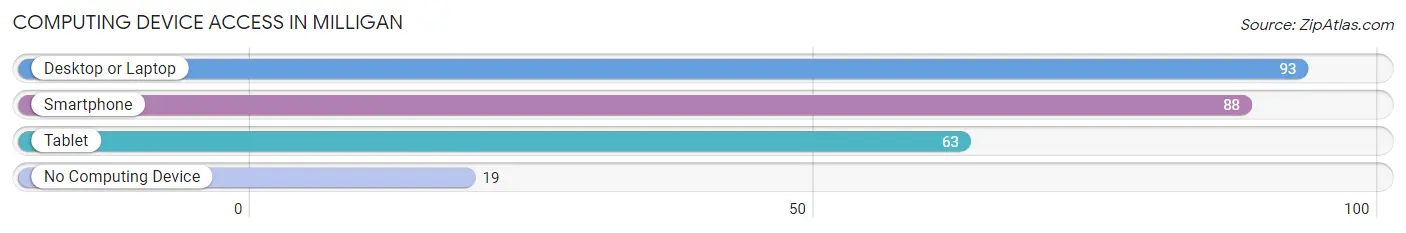
| Device Type | # Households | % Households |
| Desktop or Laptop | 93 | 78.8% |
| Smartphone | 88 | 74.6% |
| Tablet | 63 | 53.4% |
| No Computing Device | 19 | 16.1% |
| Total | 118 | 100.0% |
Internet Access in Milligan
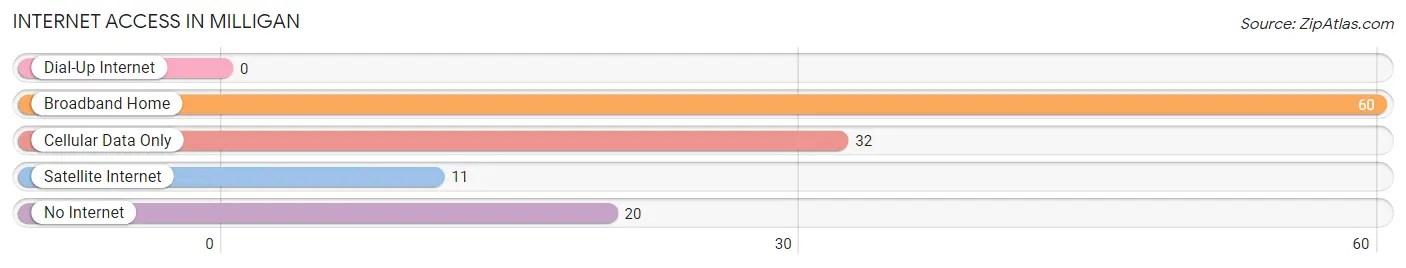
| Internet Type | # Households | % Households |
| Dial-Up Internet | 0 | 0.0% |
| Broadband Home | 60 | 50.8% |
| Cellular Data Only | 32 | 27.1% |
| Satellite Internet | 11 | 9.3% |
| No Internet | 20 | 17.0% |
| Total | 118 | 100.0% |
Milligan Summary
Milligan, Nebraska is a small village located in Saline County, Nebraska. It is situated on the banks of the Big Blue River, approximately 20 miles south of Lincoln. The village was founded in 1871 by a group of German immigrants who had come to the area to homestead. The village was named after the Reverend John Milligan, a Presbyterian minister who had been instrumental in helping the settlers establish their new home.
Milligan has a population of approximately 500 people, and is a rural community with a strong agricultural base. The village is home to a variety of businesses, including a grocery store, a hardware store, a bank, a post office, and a few restaurants. The village also has a small library, a community center, and a volunteer fire department.
Geographically, Milligan is located in the rolling hills of southeastern Nebraska. The village is surrounded by farmland, and the Big Blue River runs through the village. The climate in Milligan is generally mild, with temperatures ranging from the mid-30s in the winter to the mid-80s in the summer.
The economy of Milligan is largely based on agriculture. The village is home to several farms, and the surrounding area is known for its production of corn, soybeans, and wheat. In addition, the village is home to a few small businesses, including a grocery store, a hardware store, and a bank.
Demographically, Milligan is a predominantly white community. According to the 2010 census, the village had a population of 498 people, of which 97.2% were white, 0.6% were African American, 0.2% were Asian, 0.2% were Native American, and 1.8% were of two or more races. The median household income in Milligan was $45,000, and the median age was 43.
Milligan is a small, rural community with a strong agricultural base. The village is home to a variety of businesses, and the surrounding area is known for its production of corn, soybeans, and wheat. The village is also home to a small library, a community center, and a volunteer fire department. The population of Milligan is predominantly white, and the median household income is $45,000.
Common Questions
What is Per Capita Income in Milligan?
Per Capita income in Milligan is $31,061.
What is the Median Family Income in Milligan?
Median Family Income in Milligan is $86,875.
What is the Median Household income in Milligan?
Median Household Income in Milligan is $53,000.
What is Inequality or Gini Index in Milligan?
Inequality or Gini Index in Milligan is 0.41.
What is the Total Population of Milligan?
Total Population of Milligan is 256.
What is the Total Male Population of Milligan?
Total Male Population of Milligan is 104.
What is the Total Female Population of Milligan?
Total Female Population of Milligan is 152.
What is the Ratio of Males per 100 Females in Milligan?
There are 68.42 Males per 100 Females in Milligan.
What is the Ratio of Females per 100 Males in Milligan?
There are 146.15 Females per 100 Males in Milligan.
What is the Median Population Age in Milligan?
Median Population Age in Milligan is 54.3 Years.
What is the Average Family Size in Milligan
Average Family Size in Milligan is 2.8 People.
What is the Average Household Size in Milligan
Average Household Size in Milligan is 2.2 People.
How Large is the Labor Force in Milligan?
There are 127 People in the Labor Forcein in Milligan.
What is the Percentage of People in the Labor Force in Milligan?
59.6% of People are in the Labor Force in Milligan.