Kimball, NE Map & Demographics
Kimball Map
Kimball Overview
$30,447
PER CAPITA INCOME
$63,214
AVG FAMILY INCOME
$47,917
AVG HOUSEHOLD INCOME
33.3%
WAGE / INCOME GAP [ % ]
66.7¢/ $1
WAGE / INCOME GAP [ $ ]
0.47
INEQUALITY / GINI INDEX
2,149
TOTAL POPULATION
1,060
MALE POPULATION
1,089
FEMALE POPULATION
97.34
MALES / 100 FEMALES
102.74
FEMALES / 100 MALES
41.6
MEDIAN AGE
3.1
AVG FAMILY SIZE
2.2
AVG HOUSEHOLD SIZE
1,065
LABOR FORCE [ PEOPLE ]
62.3%
PERCENT IN LABOR FORCE
2.1%
UNEMPLOYMENT RATE
Kimball Zip Codes
Kimball Area Codes
Income in Kimball
Income Overview in Kimball
Per Capita Income in Kimball is $30,447, while median incomes of families and households are $63,214 and $47,917 respectively.
| Characteristic | Number | Measure |
| Per Capita Income | 2,149 | $30,447 |
| Median Family Income | 490 | $63,214 |
| Mean Family Income | 490 | $87,242 |
| Median Household Income | 941 | $47,917 |
| Mean Household Income | 941 | $67,637 |
| Income Deficit | 490 | $0 |
| Wage / Income Gap (%) | 2,149 | 33.26% |
| Wage / Income Gap ($) | 2,149 | 66.74¢ per $1 |
| Gini / Inequality Index | 2,149 | 0.47 |
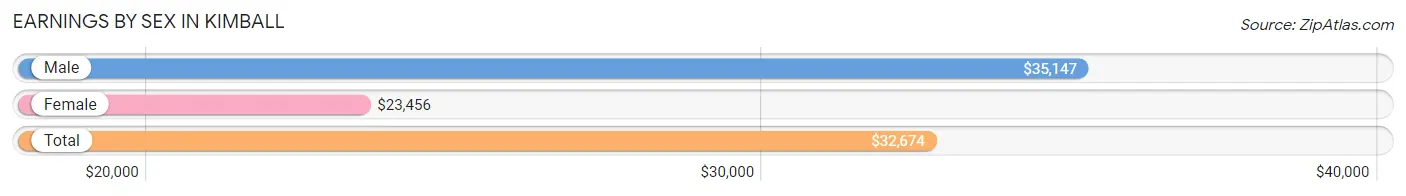
Earnings by Sex in Kimball
Average Earnings in Kimball are $32,674, $35,147 for men and $23,456 for women, a difference of 33.3%.
| Sex | Number | Average Earnings |
| Male | 596 (52.6%) | $35,147 |
| Female | 537 (47.4%) | $23,456 |
| Total | 1,133 (100.0%) | $32,674 |
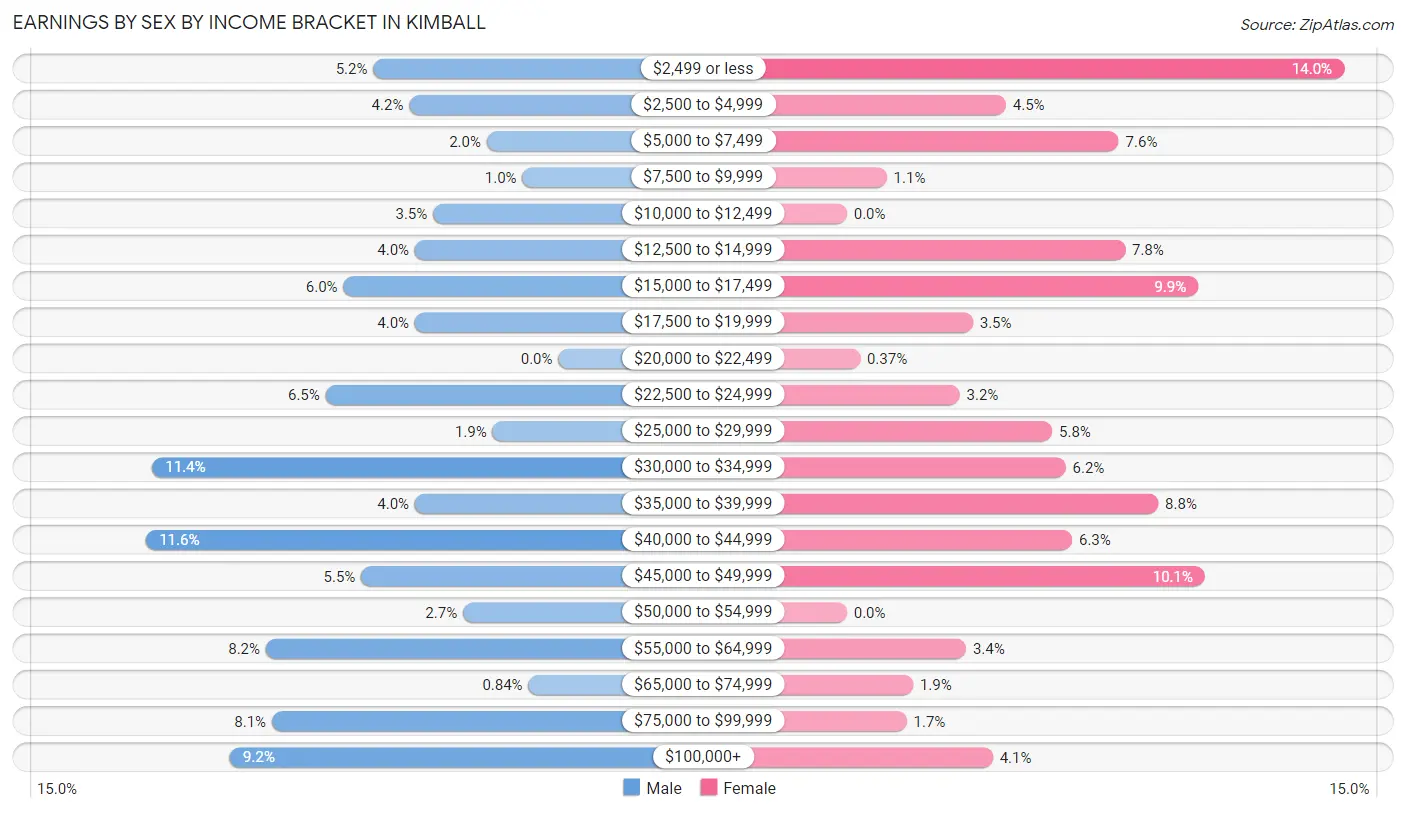
Earnings by Sex by Income Bracket in Kimball
The most common earnings brackets in Kimball are $40,000 to $44,999 for men (69 | 11.6%) and $2,499 or less for women (75 | 14.0%).
| Income | Male | Female |
| $2,499 or less | 31 (5.2%) | 75 (14.0%) |
| $2,500 to $4,999 | 25 (4.2%) | 24 (4.5%) |
| $5,000 to $7,499 | 12 (2.0%) | 41 (7.6%) |
| $7,500 to $9,999 | 6 (1.0%) | 6 (1.1%) |
| $10,000 to $12,499 | 21 (3.5%) | 0 (0.0%) |
| $12,500 to $14,999 | 24 (4.0%) | 42 (7.8%) |
| $15,000 to $17,499 | 36 (6.0%) | 53 (9.9%) |
| $17,500 to $19,999 | 24 (4.0%) | 19 (3.5%) |
| $20,000 to $22,499 | 0 (0.0%) | 2 (0.4%) |
| $22,500 to $24,999 | 39 (6.5%) | 17 (3.2%) |
| $25,000 to $29,999 | 11 (1.8%) | 31 (5.8%) |
| $30,000 to $34,999 | 68 (11.4%) | 33 (6.1%) |
| $35,000 to $39,999 | 24 (4.0%) | 47 (8.7%) |
| $40,000 to $44,999 | 69 (11.6%) | 34 (6.3%) |
| $45,000 to $49,999 | 33 (5.5%) | 54 (10.1%) |
| $50,000 to $54,999 | 16 (2.7%) | 0 (0.0%) |
| $55,000 to $64,999 | 49 (8.2%) | 18 (3.4%) |
| $65,000 to $74,999 | 5 (0.8%) | 10 (1.9%) |
| $75,000 to $99,999 | 48 (8.1%) | 9 (1.7%) |
| $100,000+ | 55 (9.2%) | 22 (4.1%) |
| Total | 596 (100.0%) | 537 (100.0%) |
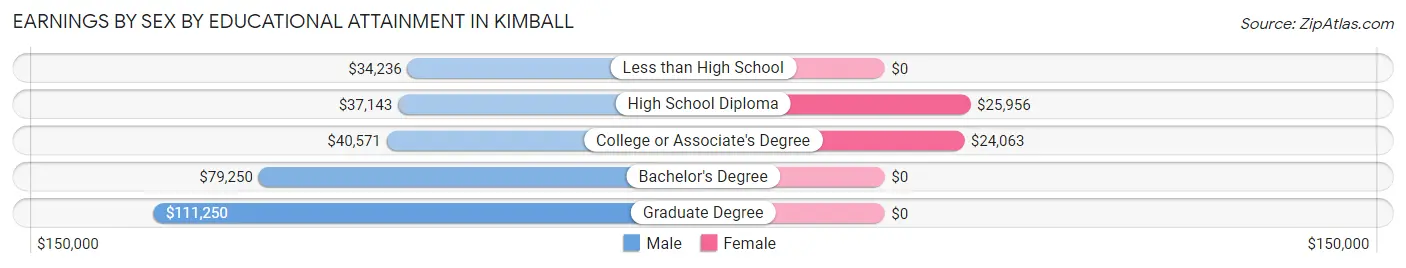
Earnings by Sex by Educational Attainment in Kimball
Average earnings in Kimball are $40,393 for men and $25,435 for women, a difference of 37.0%. Men with an educational attainment of graduate degree enjoy the highest average annual earnings of $111,250, while those with less than high school education earn the least with $34,236. Women with an educational attainment of high school diploma earn the most with the average annual earnings of $25,956, while those with college or associate's degree education have the smallest earnings of $24,063.
| Educational Attainment | Male Income | Female Income |
| Less than High School | $34,236 | $0 |
| High School Diploma | $37,143 | $25,956 |
| College or Associate's Degree | $40,571 | $24,063 |
| Bachelor's Degree | $79,250 | $0 |
| Graduate Degree | $111,250 | $0 |
| Total | $40,393 | $25,435 |
Family Income in Kimball
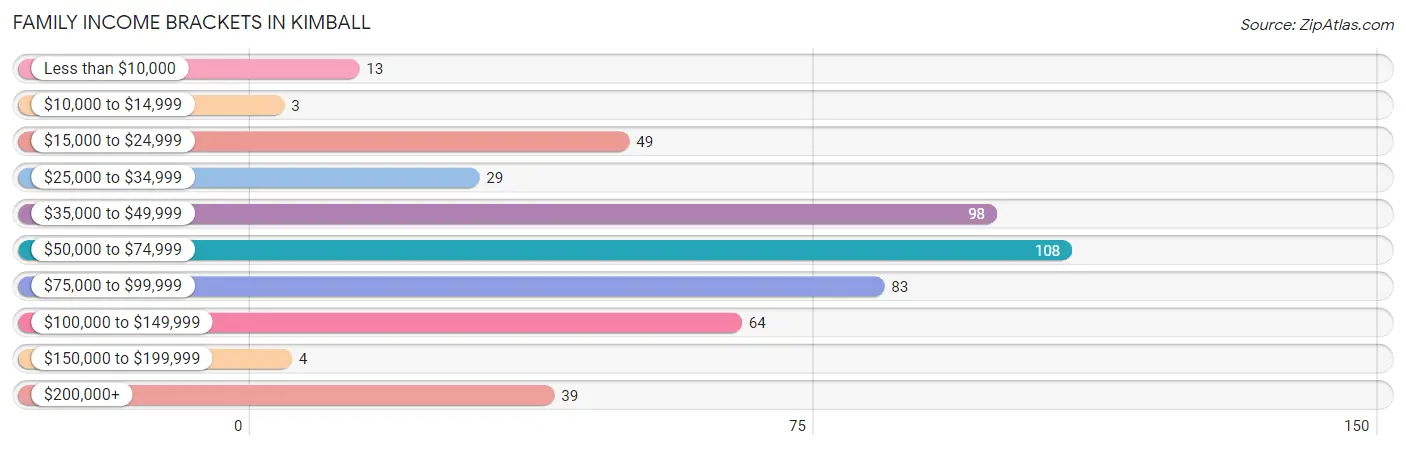
Family Income Brackets in Kimball
According to the Kimball family income data, there are 108 families falling into the $50,000 to $74,999 income range, which is the most common income bracket and makes up 22.0% of all families. Conversely, the $10,000 to $14,999 income bracket is the least frequent group with only 3 families (0.6%) belonging to this category.
| Income Bracket | # Families | % Families |
| Less than $10,000 | 13 | 2.7% |
| $10,000 to $14,999 | 3 | 0.6% |
| $15,000 to $24,999 | 49 | 10.0% |
| $25,000 to $34,999 | 29 | 5.9% |
| $35,000 to $49,999 | 98 | 20.0% |
| $50,000 to $74,999 | 108 | 22.0% |
| $75,000 to $99,999 | 83 | 16.9% |
| $100,000 to $149,999 | 64 | 13.1% |
| $150,000 to $199,999 | 4 | 0.8% |
| $200,000+ | 39 | 8.0% |
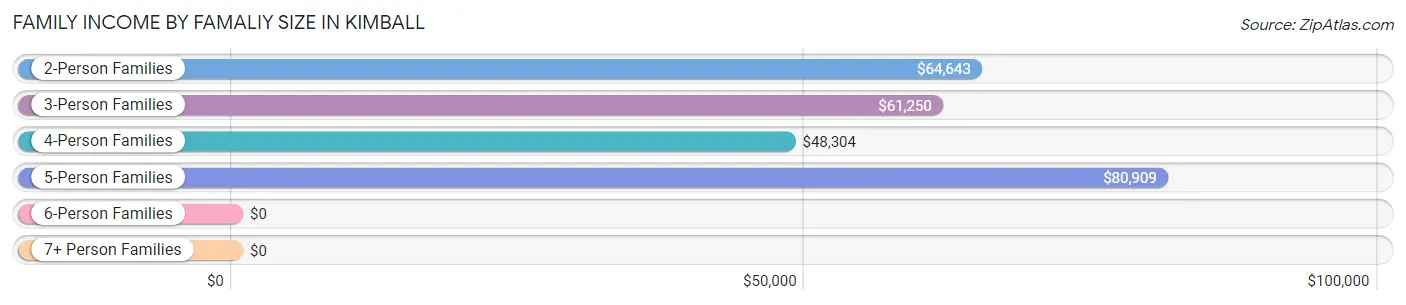
Family Income by Famaliy Size in Kimball
5-person families (72 | 14.7%) account for the highest median family income in Kimball with $80,909 per family, while 2-person families (264 | 53.9%) have the highest median income of $32,322 per family member.
| Income Bracket | # Families | Median Income |
| 2-Person Families | 264 (53.9%) | $64,643 |
| 3-Person Families | 53 (10.8%) | $61,250 |
| 4-Person Families | 89 (18.2%) | $48,304 |
| 5-Person Families | 72 (14.7%) | $80,909 |
| 6-Person Families | 8 (1.6%) | $0 |
| 7+ Person Families | 4 (0.8%) | $0 |
| Total | 490 (100.0%) | $63,214 |
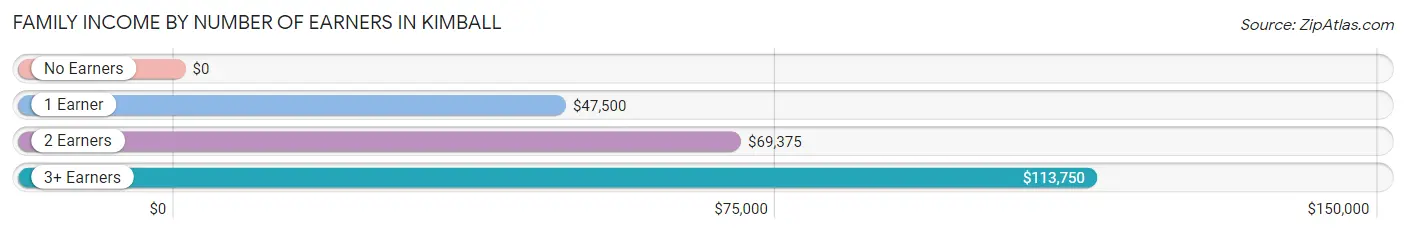
Family Income by Number of Earners in Kimball
| Number of Earners | # Families | Median Income |
| No Earners | 96 (19.6%) | $0 |
| 1 Earner | 162 (33.1%) | $47,500 |
| 2 Earners | 179 (36.5%) | $69,375 |
| 3+ Earners | 53 (10.8%) | $113,750 |
| Total | 490 (100.0%) | $63,214 |
Household Income in Kimball
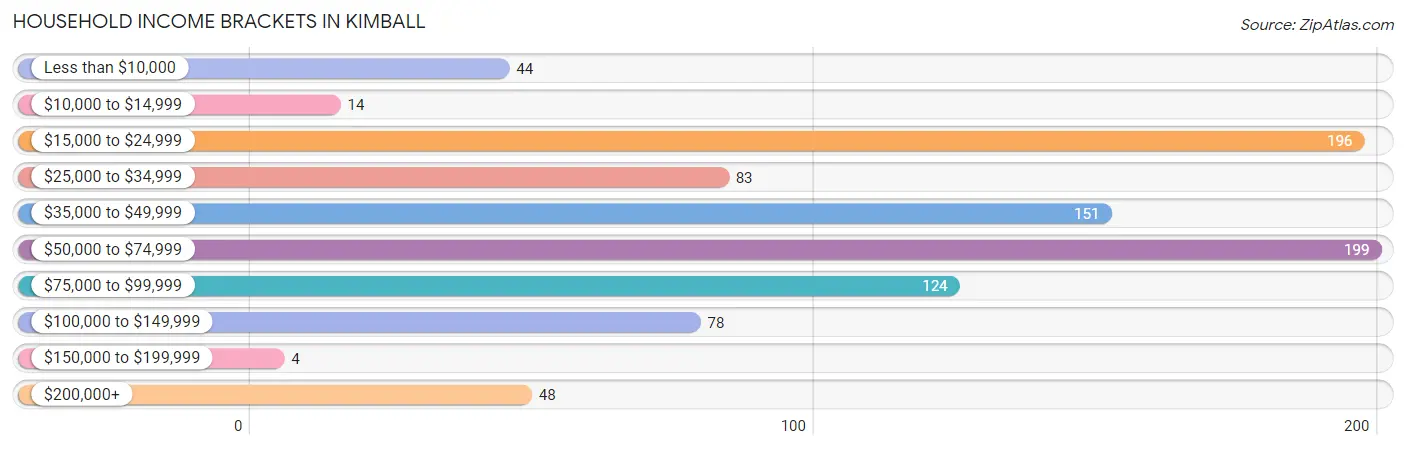
Household Income Brackets in Kimball
With 199 households falling in the category, the $50,000 to $74,999 income range is the most frequent in Kimball, accounting for 21.1% of all households. In contrast, only 4 households (0.4%) fall into the $150,000 to $199,999 income bracket, making it the least populous group.
| Income Bracket | # Households | % Households |
| Less than $10,000 | 44 | 4.7% |
| $10,000 to $14,999 | 14 | 1.5% |
| $15,000 to $24,999 | 196 | 20.8% |
| $25,000 to $34,999 | 83 | 8.8% |
| $35,000 to $49,999 | 151 | 16.0% |
| $50,000 to $74,999 | 199 | 21.1% |
| $75,000 to $99,999 | 124 | 13.2% |
| $100,000 to $149,999 | 78 | 8.3% |
| $150,000 to $199,999 | 4 | 0.4% |
| $200,000+ | 48 | 5.1% |
Household Income by Householder Age in Kimball
The median household income in Kimball is $47,917, with the highest median household income of $57,727 found in the 45 to 64 years age bracket for the primary householder. A total of 312 households (33.2%) fall into this category. Meanwhile, the 65+ years age bracket for the primary householder has the lowest median household income of $37,000, with 342 households (36.3%) in this group.
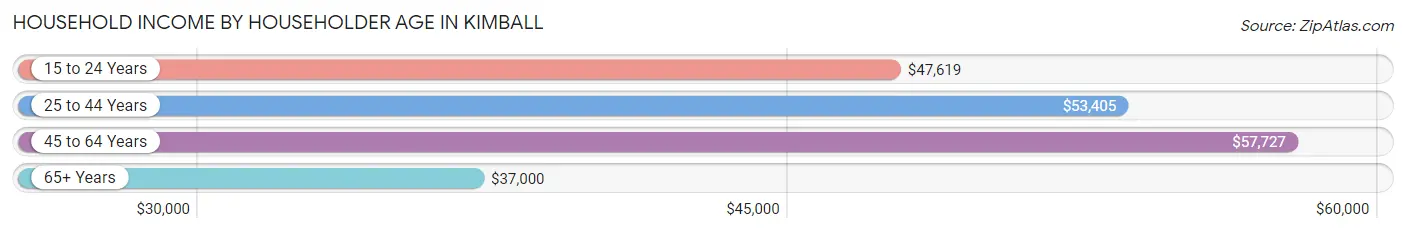
| Income Bracket | # Households | Median Income |
| 15 to 24 Years | 66 (7.0%) | $47,619 |
| 25 to 44 Years | 221 (23.5%) | $53,405 |
| 45 to 64 Years | 312 (33.2%) | $57,727 |
| 65+ Years | 342 (36.3%) | $37,000 |
| Total | 941 (100.0%) | $47,917 |
Poverty in Kimball
Income Below Poverty by Sex and Age in Kimball
With 3.3% poverty level for males and 15.8% for females among the residents of Kimball, under 5 year old males and 35 to 44 year old females are the most vulnerable to poverty, with 4 males (14.3%) and 44 females (36.4%) in their respective age groups living below the poverty level.
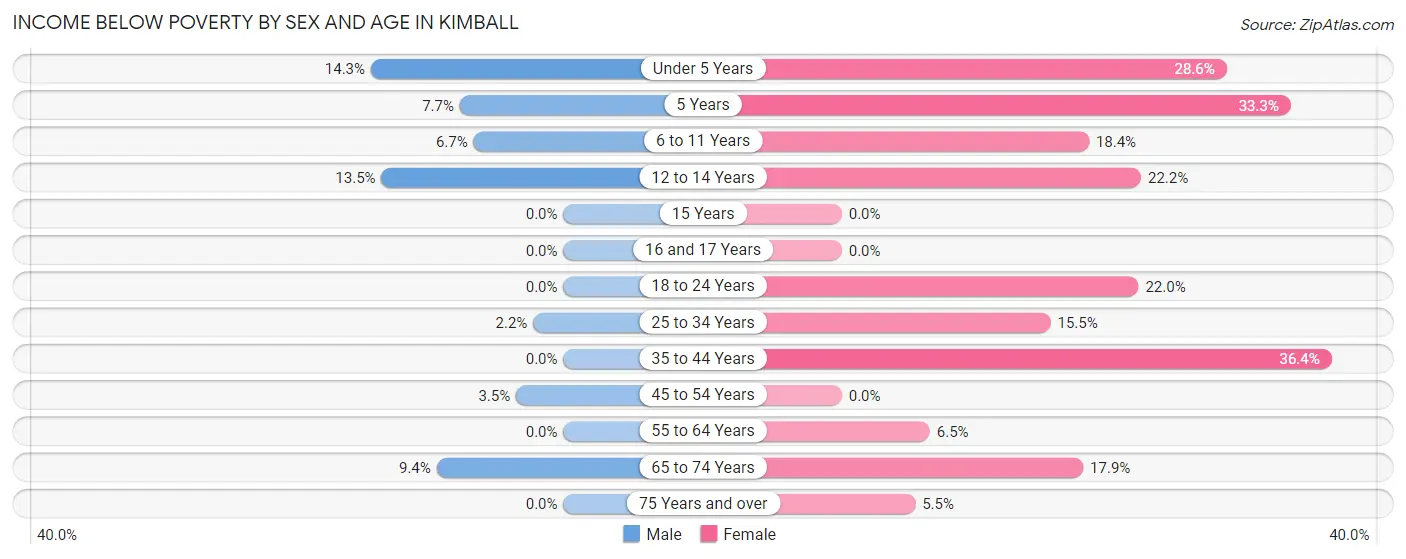
| Age Bracket | Male | Female |
| Under 5 Years | 4 (14.3%) | 18 (28.6%) |
| 5 Years | 4 (7.7%) | 10 (33.3%) |
| 6 to 11 Years | 6 (6.7%) | 20 (18.3%) |
| 12 to 14 Years | 5 (13.5%) | 2 (22.2%) |
| 15 Years | 0 (0.0%) | 0 (0.0%) |
| 16 and 17 Years | 0 (0.0%) | 0 (0.0%) |
| 18 to 24 Years | 0 (0.0%) | 13 (22.0%) |
| 25 to 34 Years | 3 (2.2%) | 20 (15.5%) |
| 35 to 44 Years | 0 (0.0%) | 44 (36.4%) |
| 45 to 54 Years | 4 (3.5%) | 0 (0.0%) |
| 55 to 64 Years | 0 (0.0%) | 10 (6.5%) |
| 65 to 74 Years | 8 (9.4%) | 19 (17.9%) |
| 75 Years and over | 0 (0.0%) | 9 (5.4%) |
| Total | 34 (3.3%) | 165 (15.8%) |
Income Above Poverty by Sex and Age in Kimball
According to the poverty statistics in Kimball, males aged 16 and 17 years and females aged 15 years are the age groups that are most secure financially, with 100.0% of males and 100.0% of females in these age groups living above the poverty line.
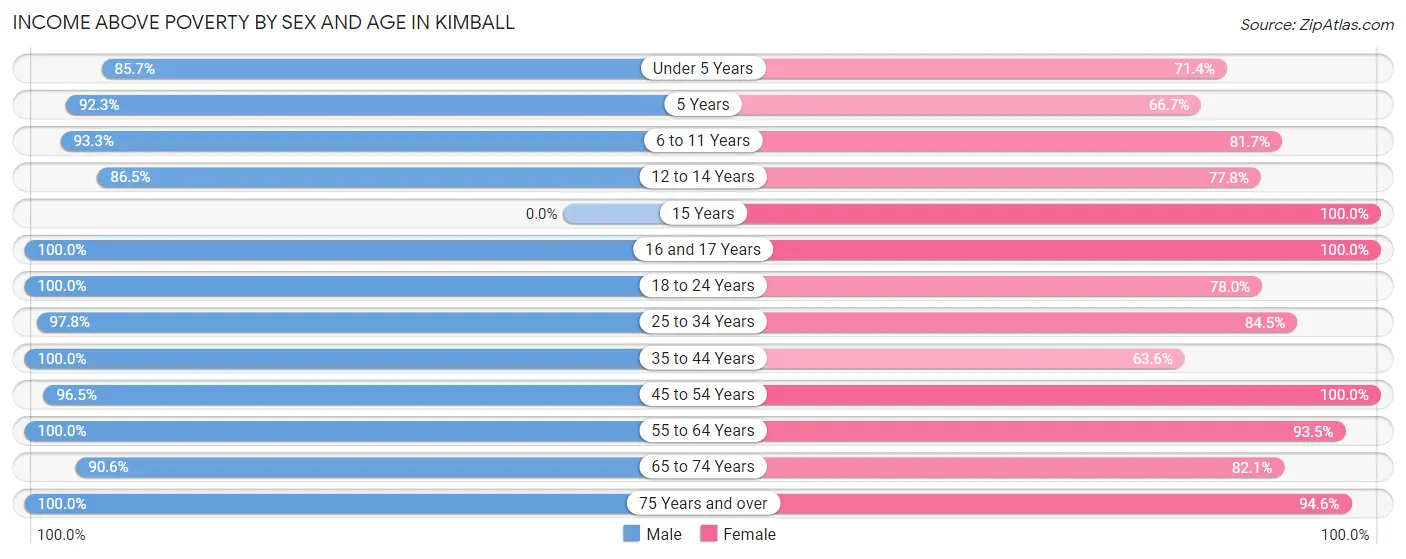
| Age Bracket | Male | Female |
| Under 5 Years | 24 (85.7%) | 45 (71.4%) |
| 5 Years | 48 (92.3%) | 20 (66.7%) |
| 6 to 11 Years | 84 (93.3%) | 89 (81.7%) |
| 12 to 14 Years | 32 (86.5%) | 7 (77.8%) |
| 15 Years | 0 (0.0%) | 12 (100.0%) |
| 16 and 17 Years | 26 (100.0%) | 12 (100.0%) |
| 18 to 24 Years | 86 (100.0%) | 46 (78.0%) |
| 25 to 34 Years | 131 (97.8%) | 109 (84.5%) |
| 35 to 44 Years | 120 (100.0%) | 77 (63.6%) |
| 45 to 54 Years | 110 (96.5%) | 77 (100.0%) |
| 55 to 64 Years | 148 (100.0%) | 143 (93.5%) |
| 65 to 74 Years | 77 (90.6%) | 87 (82.1%) |
| 75 Years and over | 109 (100.0%) | 156 (94.6%) |
| Total | 995 (96.7%) | 880 (84.2%) |
Income Below Poverty Among Married-Couple Families in Kimball
The poverty statistics for married-couple families in Kimball show that 1.0% or 3 of the total 311 families live below the poverty line. Families with no children have the highest poverty rate of 1.4%, comprising of 3 families. On the other hand, families with 1 or 2 children have the lowest poverty rate of 0.0%, which includes 0 families.
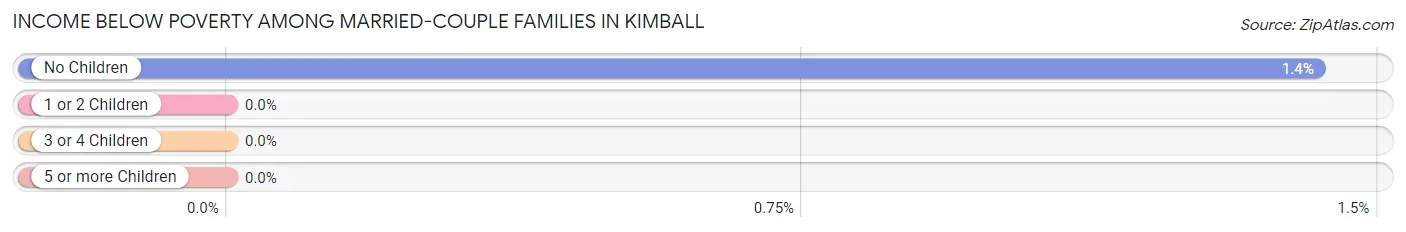
| Children | Above Poverty | Below Poverty |
| No Children | 208 (98.6%) | 3 (1.4%) |
| 1 or 2 Children | 66 (100.0%) | 0 (0.0%) |
| 3 or 4 Children | 34 (100.0%) | 0 (0.0%) |
| 5 or more Children | 0 (0.0%) | 0 (0.0%) |
| Total | 308 (99.0%) | 3 (1.0%) |
Income Below Poverty Among Single-Parent Households in Kimball
According to the poverty data in Kimball, 3.1% or 3 single-father households and 32.9% or 27 single-mother households are living below the poverty line. Among single-father households, those with 3 or 4 children have the highest poverty rate, with 3 households (9.4%) experiencing poverty. Likewise, among single-mother households, those with 1 or 2 children have the highest poverty rate, with 12 households (48.0%) falling below the poverty line.
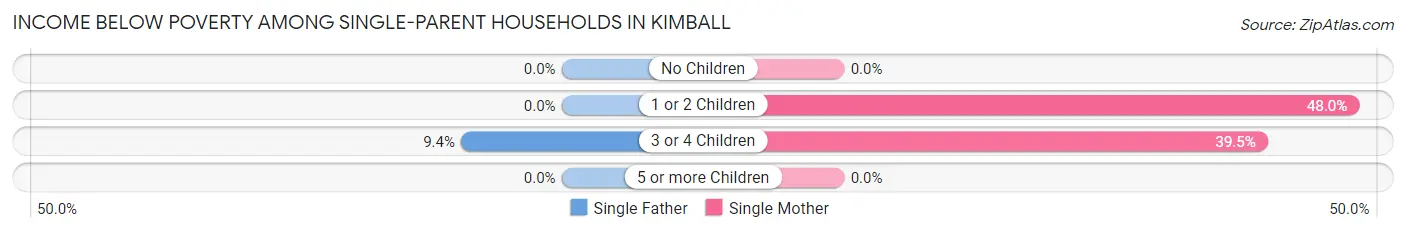
| Children | Single Father | Single Mother |
| No Children | 0 (0.0%) | 0 (0.0%) |
| 1 or 2 Children | 0 (0.0%) | 12 (48.0%) |
| 3 or 4 Children | 3 (9.4%) | 15 (39.5%) |
| 5 or more Children | 0 (0.0%) | 0 (0.0%) |
| Total | 3 (3.1%) | 27 (32.9%) |
Income Below Poverty Among Married-Couple vs Single-Parent Households in Kimball
The poverty data for Kimball shows that 3 of the married-couple family households (1.0%) and 30 of the single-parent households (16.8%) are living below the poverty level. Within the married-couple family households, those with no children have the highest poverty rate, with 3 households (1.4%) falling below the poverty line. Among the single-parent households, those with 1 or 2 children have the highest poverty rate, with 12 household (31.6%) living below poverty.
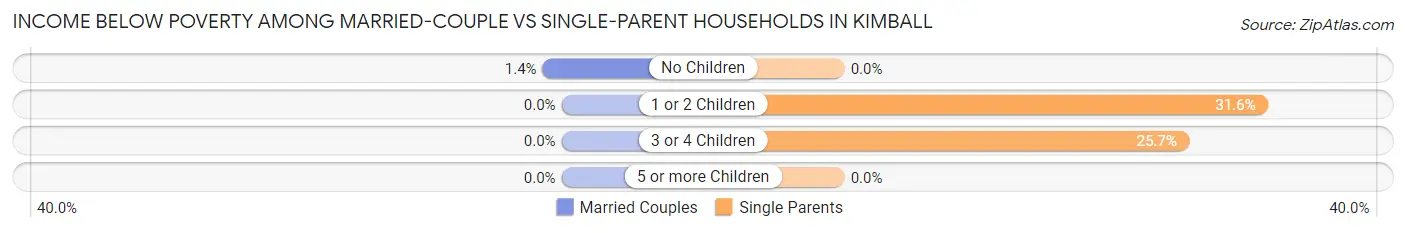
| Children | Married-Couple Families | Single-Parent Households |
| No Children | 3 (1.4%) | 0 (0.0%) |
| 1 or 2 Children | 0 (0.0%) | 12 (31.6%) |
| 3 or 4 Children | 0 (0.0%) | 18 (25.7%) |
| 5 or more Children | 0 (0.0%) | 0 (0.0%) |
| Total | 3 (1.0%) | 30 (16.8%) |
Race in Kimball
The most populous races in Kimball are White / Caucasian (1,885 | 87.7%), Hispanic or Latino (305 | 14.2%), and Two or more Races (232 | 10.8%).
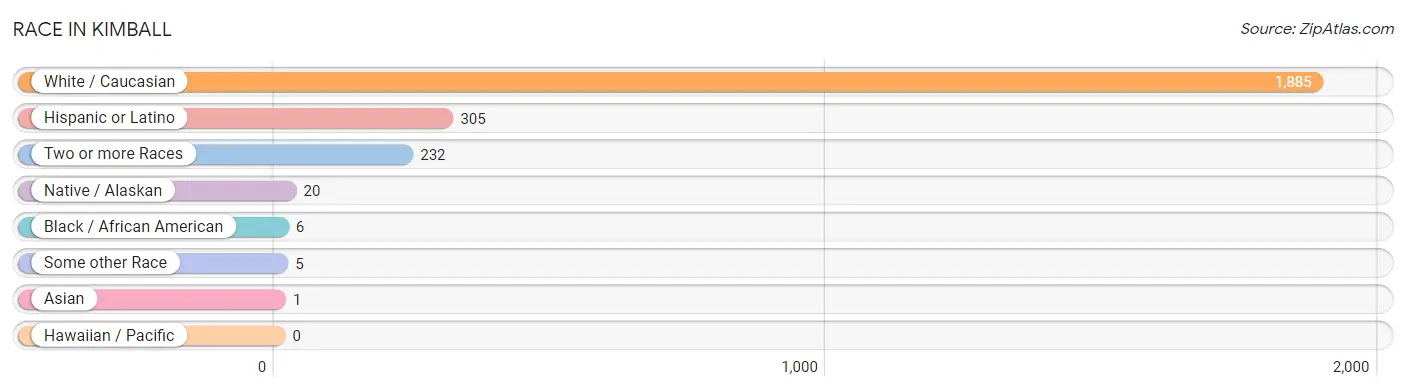
| Race | # Population | % Population |
| Asian | 1 | 0.1% |
| Black / African American | 6 | 0.3% |
| Hawaiian / Pacific | 0 | 0.0% |
| Hispanic or Latino | 305 | 14.2% |
| Native / Alaskan | 20 | 0.9% |
| White / Caucasian | 1,885 | 87.7% |
| Two or more Races | 232 | 10.8% |
| Some other Race | 5 | 0.2% |
| Total | 2,149 | 100.0% |
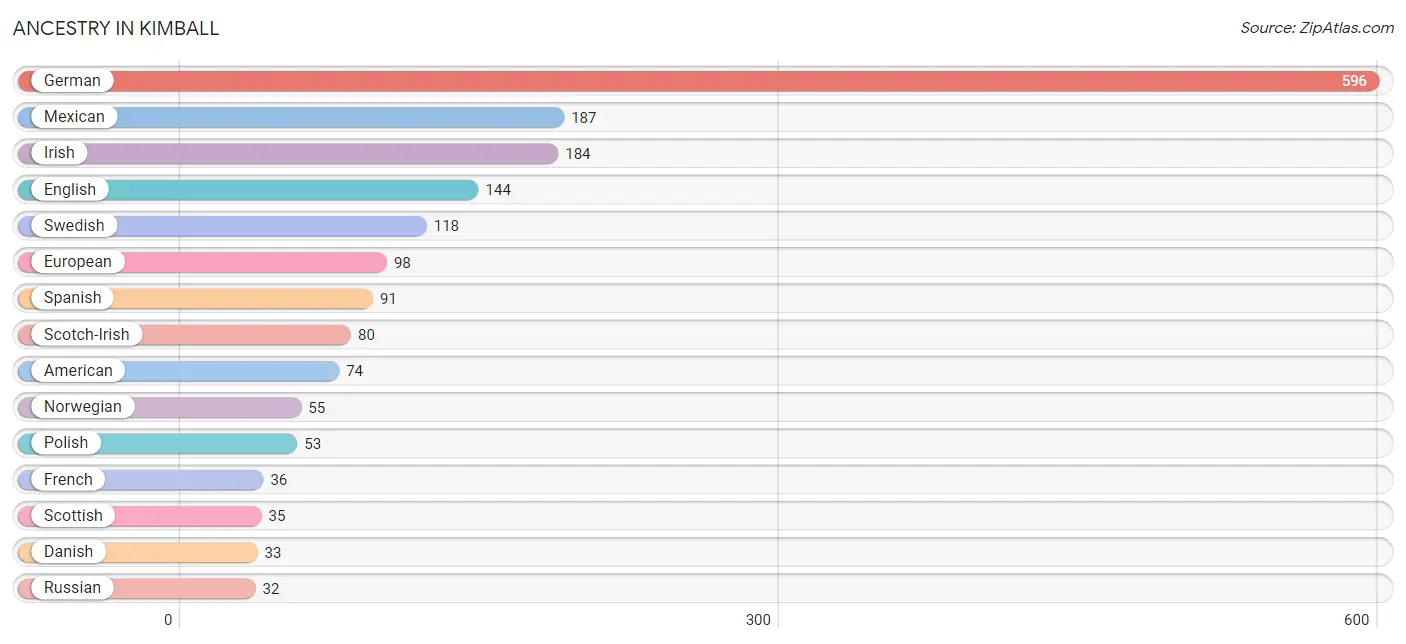
Ancestry in Kimball
The most populous ancestries reported in Kimball are German (596 | 27.7%), Mexican (187 | 8.7%), Irish (184 | 8.6%), English (144 | 6.7%), and Swedish (118 | 5.5%), together accounting for 57.2% of all Kimball residents.
| Ancestry | # Population | % Population |
| American | 74 | 3.4% |
| Arapaho | 2 | 0.1% |
| Argentinean | 6 | 0.3% |
| Austrian | 3 | 0.1% |
| Belgian | 5 | 0.2% |
| Bhutanese | 6 | 0.3% |
| Burmese | 8 | 0.4% |
| Central American | 10 | 0.5% |
| Cherokee | 6 | 0.3% |
| Cuban | 4 | 0.2% |
| Czech | 22 | 1.0% |
| Danish | 33 | 1.5% |
| Dutch | 17 | 0.8% |
| English | 144 | 6.7% |
| European | 98 | 4.6% |
| French | 36 | 1.7% |
| German | 596 | 27.7% |
| Honduran | 10 | 0.5% |
| Irish | 184 | 8.6% |
| Italian | 6 | 0.3% |
| Mexican | 187 | 8.7% |
| Native Hawaiian | 6 | 0.3% |
| Norwegian | 55 | 2.6% |
| Polish | 53 | 2.5% |
| Russian | 32 | 1.5% |
| Scandinavian | 18 | 0.8% |
| Scotch-Irish | 80 | 3.7% |
| Scottish | 35 | 1.6% |
| Sioux | 29 | 1.3% |
| Somali | 4 | 0.2% |
| South American | 6 | 0.3% |
| Spanish | 91 | 4.2% |
| Subsaharan African | 4 | 0.2% |
| Swedish | 118 | 5.5% |
| Swiss | 3 | 0.1% |
| Welsh | 20 | 0.9% | View All 36 Rows |
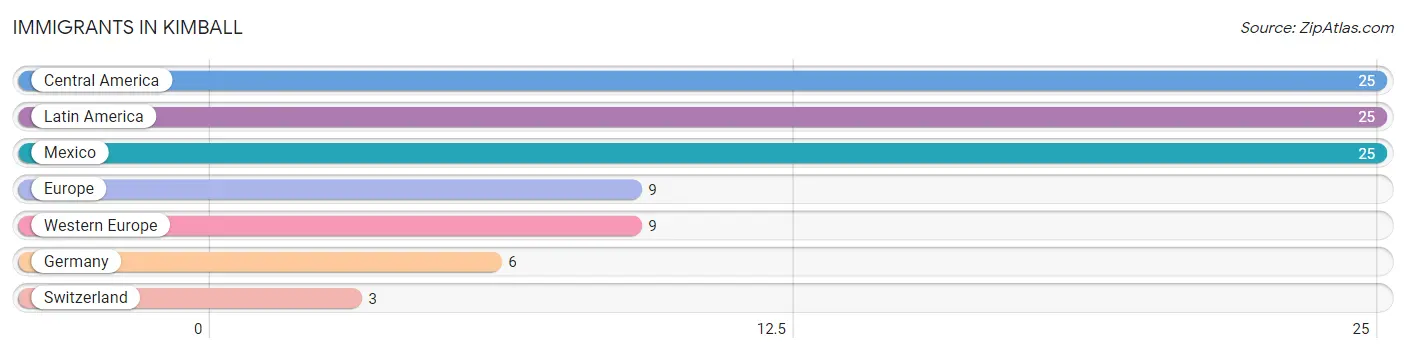
Immigrants in Kimball
The most numerous immigrant groups reported in Kimball came from Central America (25 | 1.2%), Latin America (25 | 1.2%), Mexico (25 | 1.2%), Europe (9 | 0.4%), and Western Europe (9 | 0.4%), together accounting for 4.3% of all Kimball residents.
| Immigration Origin | # Population | % Population |
| Central America | 25 | 1.2% |
| Europe | 9 | 0.4% |
| Germany | 6 | 0.3% |
| Latin America | 25 | 1.2% |
| Mexico | 25 | 1.2% |
| Switzerland | 3 | 0.1% |
| Western Europe | 9 | 0.4% | View All 7 Rows |
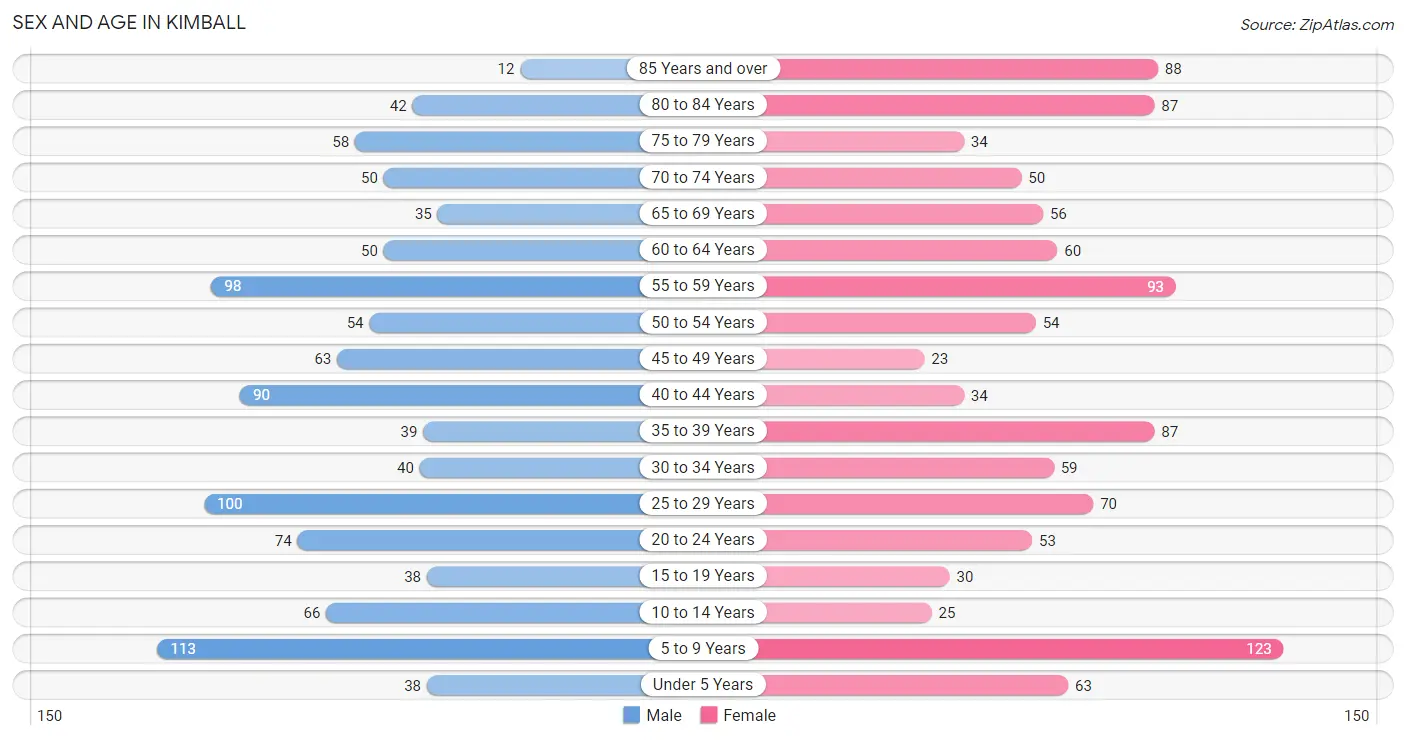
Sex and Age in Kimball
Sex and Age in Kimball
The most populous age groups in Kimball are 5 to 9 Years (113 | 10.7%) for men and 5 to 9 Years (123 | 11.3%) for women.
| Age Bracket | Male | Female |
| Under 5 Years | 38 (3.6%) | 63 (5.8%) |
| 5 to 9 Years | 113 (10.7%) | 123 (11.3%) |
| 10 to 14 Years | 66 (6.2%) | 25 (2.3%) |
| 15 to 19 Years | 38 (3.6%) | 30 (2.8%) |
| 20 to 24 Years | 74 (7.0%) | 53 (4.9%) |
| 25 to 29 Years | 100 (9.4%) | 70 (6.4%) |
| 30 to 34 Years | 40 (3.8%) | 59 (5.4%) |
| 35 to 39 Years | 39 (3.7%) | 87 (8.0%) |
| 40 to 44 Years | 90 (8.5%) | 34 (3.1%) |
| 45 to 49 Years | 63 (5.9%) | 23 (2.1%) |
| 50 to 54 Years | 54 (5.1%) | 54 (5.0%) |
| 55 to 59 Years | 98 (9.2%) | 93 (8.5%) |
| 60 to 64 Years | 50 (4.7%) | 60 (5.5%) |
| 65 to 69 Years | 35 (3.3%) | 56 (5.1%) |
| 70 to 74 Years | 50 (4.7%) | 50 (4.6%) |
| 75 to 79 Years | 58 (5.5%) | 34 (3.1%) |
| 80 to 84 Years | 42 (4.0%) | 87 (8.0%) |
| 85 Years and over | 12 (1.1%) | 88 (8.1%) |
| Total | 1,060 (100.0%) | 1,089 (100.0%) |
Families and Households in Kimball
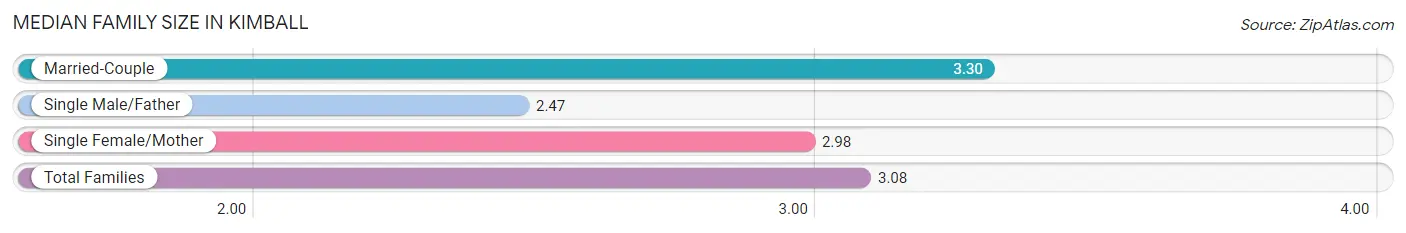
Median Family Size in Kimball
The median family size in Kimball is 3.08 persons per family, with married-couple families (311 | 63.5%) accounting for the largest median family size of 3.3 persons per family. On the other hand, single male/father families (97 | 19.8%) represent the smallest median family size with 2.47 persons per family.
| Family Type | # Families | Family Size |
| Married-Couple | 311 (63.5%) | 3.30 |
| Single Male/Father | 97 (19.8%) | 2.47 |
| Single Female/Mother | 82 (16.7%) | 2.98 |
| Total Families | 490 (100.0%) | 3.08 |
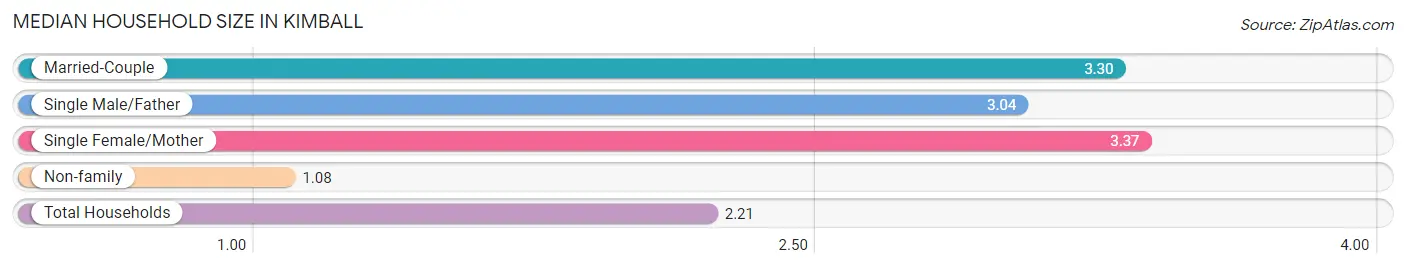
Median Household Size in Kimball
The median household size in Kimball is 2.21 persons per household, with single female/mother households (82 | 8.7%) accounting for the largest median household size of 3.37 persons per household. non-family households (451 | 47.9%) represent the smallest median household size with 1.08 persons per household.
| Household Type | # Households | Household Size |
| Married-Couple | 311 (33.1%) | 3.30 |
| Single Male/Father | 97 (10.3%) | 3.04 |
| Single Female/Mother | 82 (8.7%) | 3.37 |
| Non-family | 451 (47.9%) | 1.08 |
| Total Households | 941 (100.0%) | 2.21 |
Household Size by Marriage Status in Kimball
Out of a total of 941 households in Kimball, 490 (52.1%) are family households, while 451 (47.9%) are nonfamily households. The most numerous type of family households are 2-person households, comprising 245, and the most common type of nonfamily households are 1-person households, comprising 421.
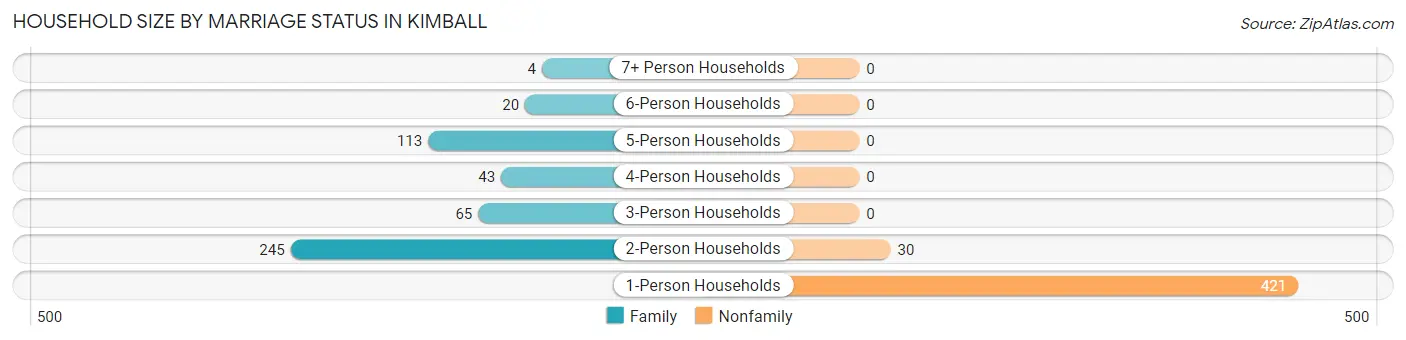
| Household Size | Family Households | Nonfamily Households |
| 1-Person Households | - | 421 (44.7%) |
| 2-Person Households | 245 (26.0%) | 30 (3.2%) |
| 3-Person Households | 65 (6.9%) | 0 (0.0%) |
| 4-Person Households | 43 (4.6%) | 0 (0.0%) |
| 5-Person Households | 113 (12.0%) | 0 (0.0%) |
| 6-Person Households | 20 (2.1%) | 0 (0.0%) |
| 7+ Person Households | 4 (0.4%) | 0 (0.0%) |
| Total | 490 (52.1%) | 451 (47.9%) |
Female Fertility in Kimball
Fertility by Age in Kimball
Average fertility rate in Kimball is 116.0 births per 1,000 women. Women in the age bracket of 20 to 34 years have the highest fertility rate with 231.0 births per 1,000 women. Women in the age bracket of 20 to 34 years acount for 100.0% of all women with births.
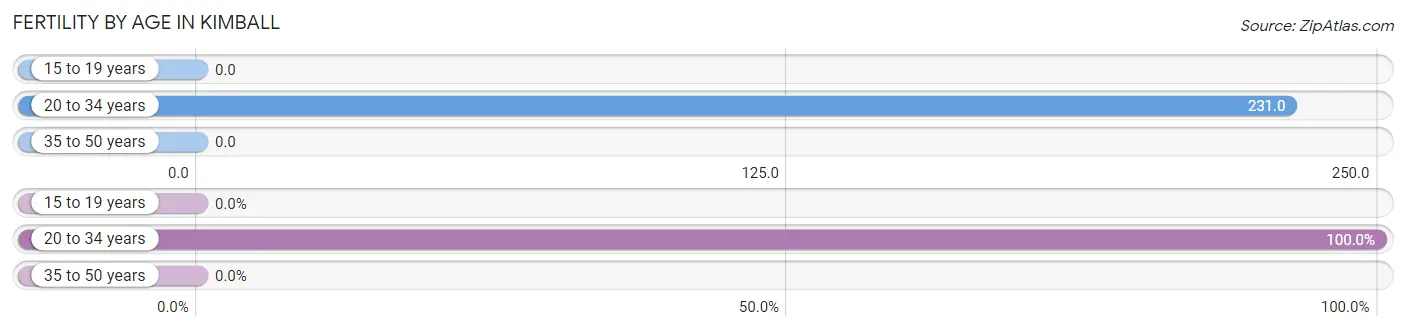
| Age Bracket | Women with Births | Births / 1,000 Women |
| 15 to 19 years | 0 (0.0%) | 0.0 |
| 20 to 34 years | 42 (100.0%) | 231.0 |
| 35 to 50 years | 0 (0.0%) | 0.0 |
| Total | 42 (100.0%) | 116.0 |
Fertility by Age by Marriage Status in Kimball
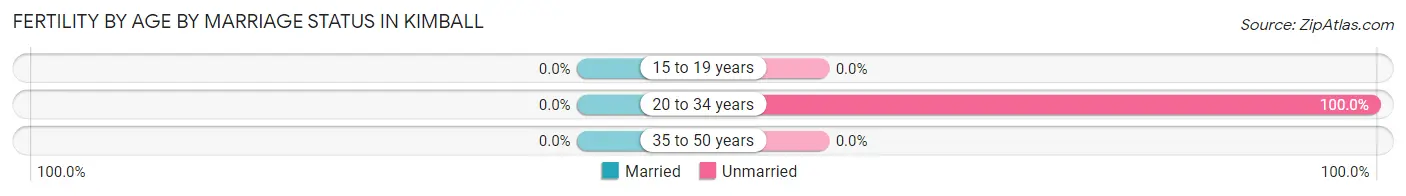
| Age Bracket | Married | Unmarried |
| 15 to 19 years | 0 (0.0%) | 0 (0.0%) |
| 20 to 34 years | 0 (0.0%) | 42 (100.0%) |
| 35 to 50 years | 0 (0.0%) | 0 (0.0%) |
| Total | 0 (0.0%) | 42 (100.0%) |
Fertility by Education in Kimball
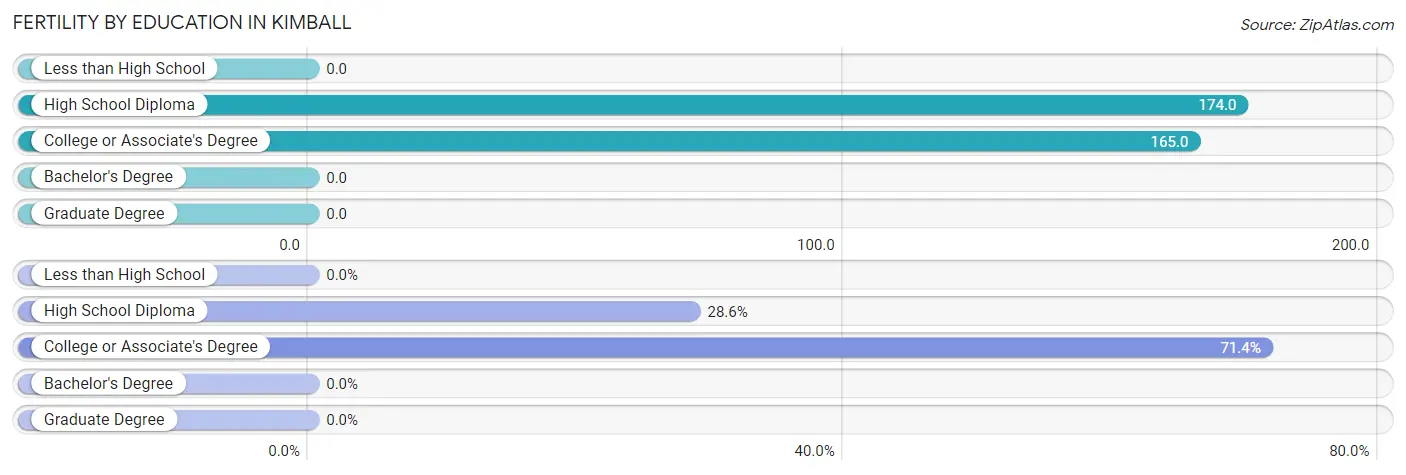
| Educational Attainment | Women with Births | Births / 1,000 Women |
| Less than High School | 0 (0.0%) | 0.0 |
| High School Diploma | 12 (28.6%) | 174.0 |
| College or Associate's Degree | 30 (71.4%) | 165.0 |
| Bachelor's Degree | 0 (0.0%) | 0.0 |
| Graduate Degree | 0 (0.0%) | 0.0 |
| Total | 42 (100.0%) | 116.0 |
Fertility by Education by Marriage Status in Kimball
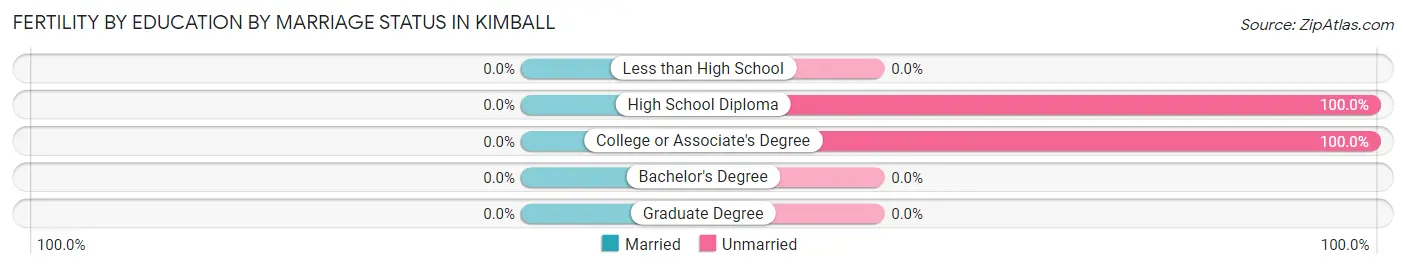
| Educational Attainment | Married | Unmarried |
| Less than High School | 0 (0.0%) | 0 (0.0%) |
| High School Diploma | 0 (0.0%) | 12 (100.0%) |
| College or Associate's Degree | 0 (0.0%) | 30 (100.0%) |
| Bachelor's Degree | 0 (0.0%) | 0 (0.0%) |
| Graduate Degree | 0 (0.0%) | 0 (0.0%) |
| Total | 0 (0.0%) | 42 (100.0%) |
Employment Characteristics in Kimball
Employment by Class of Employer in Kimball
Among the 1,011 employed individuals in Kimball, private company employees (643 | 63.6%), self-employed (not incorporated) (134 | 13.3%), and self-employed (incorporated) (75 | 7.4%) make up the most common classes of employment.
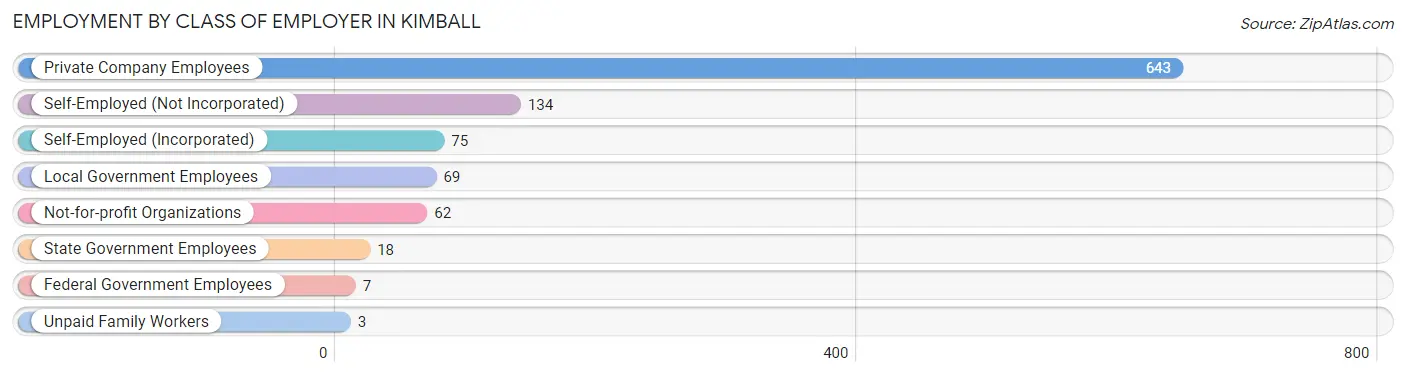
| Employer Class | # Employees | % Employees |
| Private Company Employees | 643 | 63.6% |
| Self-Employed (Incorporated) | 75 | 7.4% |
| Self-Employed (Not Incorporated) | 134 | 13.3% |
| Not-for-profit Organizations | 62 | 6.1% |
| Local Government Employees | 69 | 6.8% |
| State Government Employees | 18 | 1.8% |
| Federal Government Employees | 7 | 0.7% |
| Unpaid Family Workers | 3 | 0.3% |
| Total | 1,011 | 100.0% |
Employment Status by Age in Kimball
According to the labor force statistics for Kimball, out of the total population over 16 years of age (1,709), 62.3% or 1,065 individuals are in the labor force, with 2.1% or 22 of them unemployed. The age group with the highest labor force participation rate is 20 to 24 years, with 100.0% or 127 individuals in the labor force. Within the labor force, the 25 to 29 years age range has the highest percentage of unemployed individuals, with 13.0% or 18 of them being unemployed.
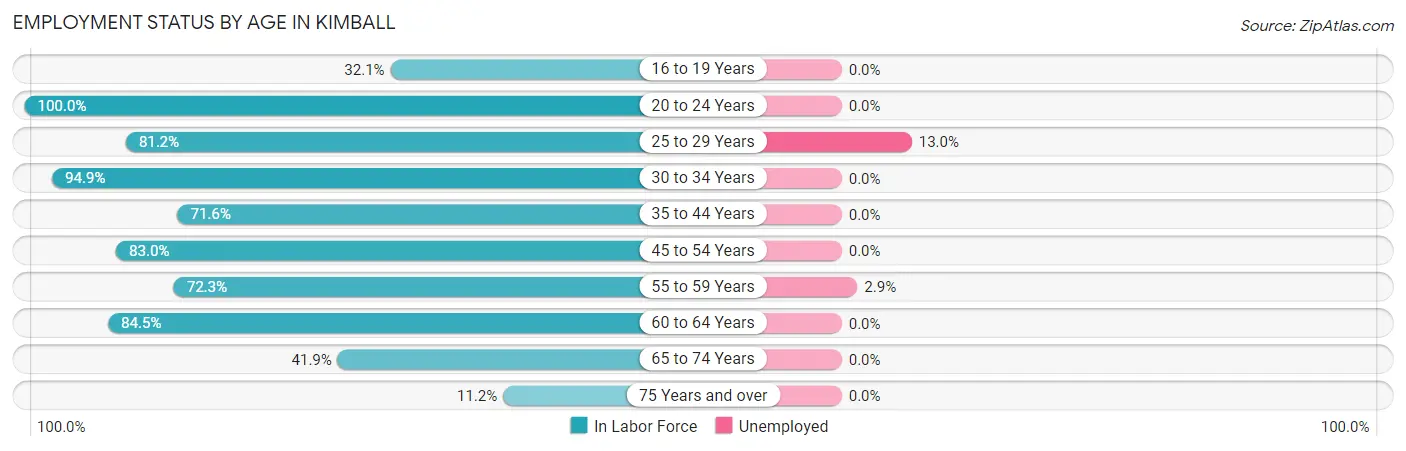
| Age Bracket | In Labor Force | Unemployed |
| 16 to 19 Years | 18 (32.1%) | 0 (0.0%) |
| 20 to 24 Years | 127 (100.0%) | 0 (0.0%) |
| 25 to 29 Years | 138 (81.2%) | 18 (13.0%) |
| 30 to 34 Years | 94 (94.9%) | 0 (0.0%) |
| 35 to 44 Years | 179 (71.6%) | 0 (0.0%) |
| 45 to 54 Years | 161 (83.0%) | 0 (0.0%) |
| 55 to 59 Years | 138 (72.3%) | 4 (2.9%) |
| 60 to 64 Years | 93 (84.5%) | 0 (0.0%) |
| 65 to 74 Years | 80 (41.9%) | 0 (0.0%) |
| 75 Years and over | 36 (11.2%) | 0 (0.0%) |
| Total | 1,065 (62.3%) | 22 (2.1%) |
Employment Status by Educational Attainment in Kimball
According to labor force statistics for Kimball, 79.2% of individuals (803) out of the total population between 25 and 64 years of age (1,014) are in the labor force, with 2.7% or 22 of them being unemployed. The group with the highest labor force participation rate are those with the educational attainment of high school diploma, with 82.6% or 237 individuals in the labor force. Within the labor force, individuals with high school diploma education have the highest percentage of unemployment, with 6.3% or 15 of them being unemployed.
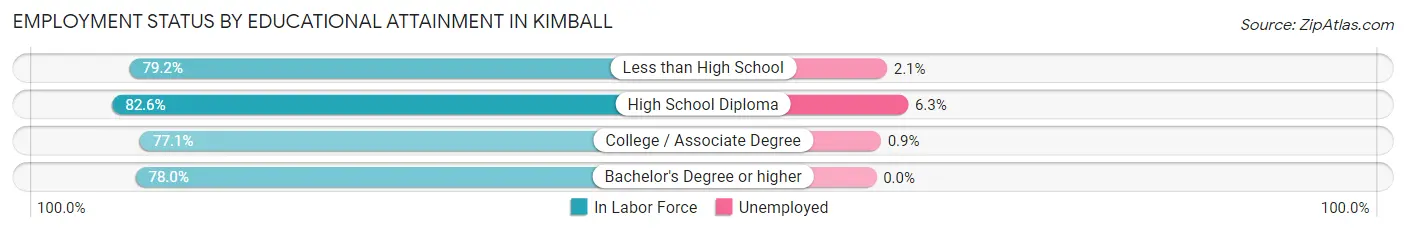
| Educational Attainment | In Labor Force | Unemployed |
| Less than High School | 190 (79.2%) | 5 (2.1%) |
| High School Diploma | 237 (82.6%) | 18 (6.3%) |
| College / Associate Degree | 330 (77.1%) | 4 (0.9%) |
| Bachelor's Degree or higher | 46 (78.0%) | 0 (0.0%) |
| Total | 803 (79.2%) | 27 (2.7%) |
Employment Occupations by Sex in Kimball
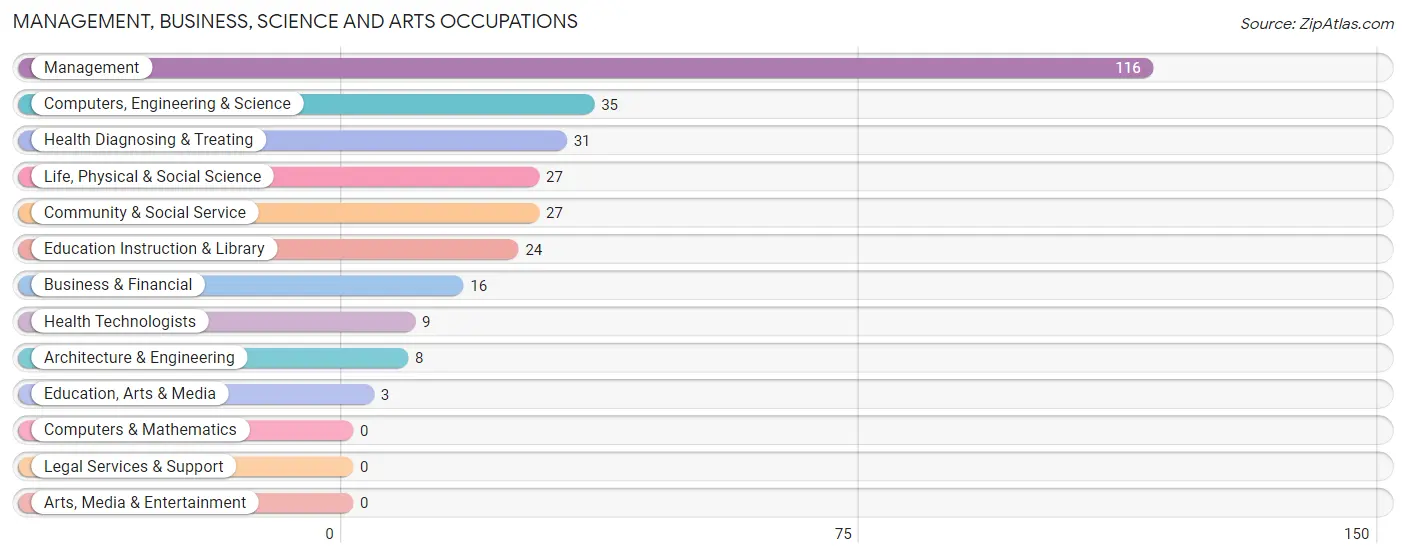
Management, Business, Science and Arts Occupations
The most common Management, Business, Science and Arts occupations in Kimball are Management (116 | 11.1%), Computers, Engineering & Science (35 | 3.4%), Health Diagnosing & Treating (31 | 3.0%), Life, Physical & Social Science (27 | 2.6%), and Community & Social Service (27 | 2.6%).
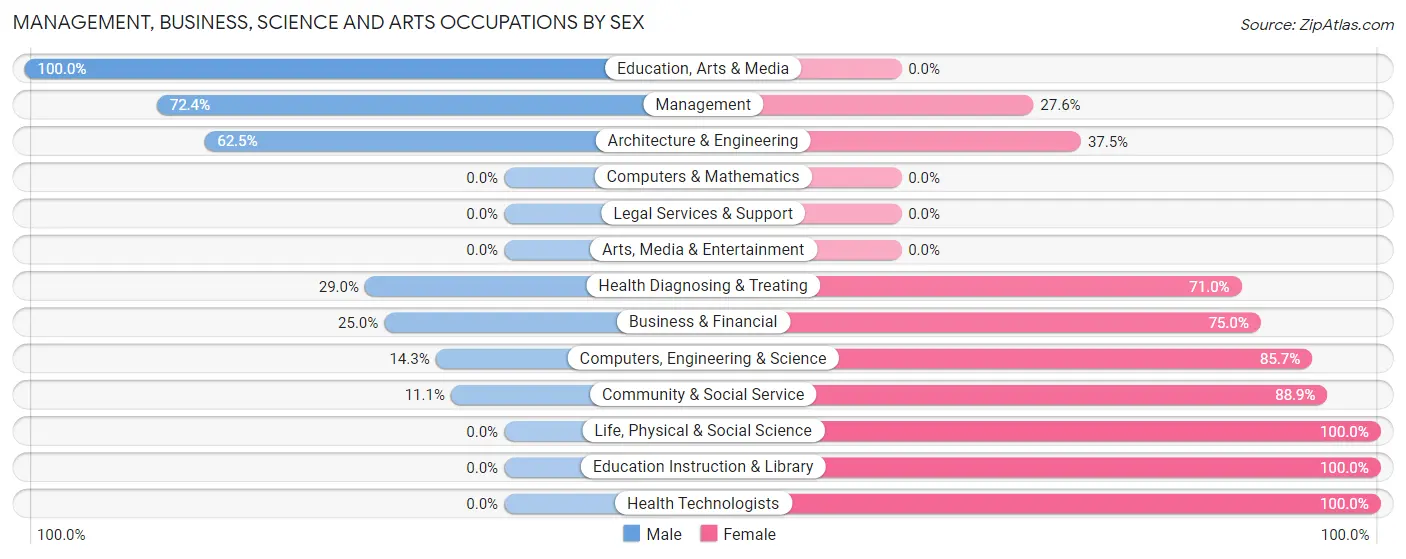
Management, Business, Science and Arts Occupations by Sex
Within the Management, Business, Science and Arts occupations in Kimball, the most male-oriented occupations are Education, Arts & Media (100.0%), Management (72.4%), and Architecture & Engineering (62.5%), while the most female-oriented occupations are Life, Physical & Social Science (100.0%), Education Instruction & Library (100.0%), and Health Technologists (100.0%).
| Occupation | Male | Female |
| Management | 84 (72.4%) | 32 (27.6%) |
| Business & Financial | 4 (25.0%) | 12 (75.0%) |
| Computers, Engineering & Science | 5 (14.3%) | 30 (85.7%) |
| Computers & Mathematics | 0 (0.0%) | 0 (0.0%) |
| Architecture & Engineering | 5 (62.5%) | 3 (37.5%) |
| Life, Physical & Social Science | 0 (0.0%) | 27 (100.0%) |
| Community & Social Service | 3 (11.1%) | 24 (88.9%) |
| Education, Arts & Media | 3 (100.0%) | 0 (0.0%) |
| Legal Services & Support | 0 (0.0%) | 0 (0.0%) |
| Education Instruction & Library | 0 (0.0%) | 24 (100.0%) |
| Arts, Media & Entertainment | 0 (0.0%) | 0 (0.0%) |
| Health Diagnosing & Treating | 9 (29.0%) | 22 (71.0%) |
| Health Technologists | 0 (0.0%) | 9 (100.0%) |
| Total (Category) | 105 (46.7%) | 120 (53.3%) |
| Total (Overall) | 541 (51.9%) | 501 (48.1%) |
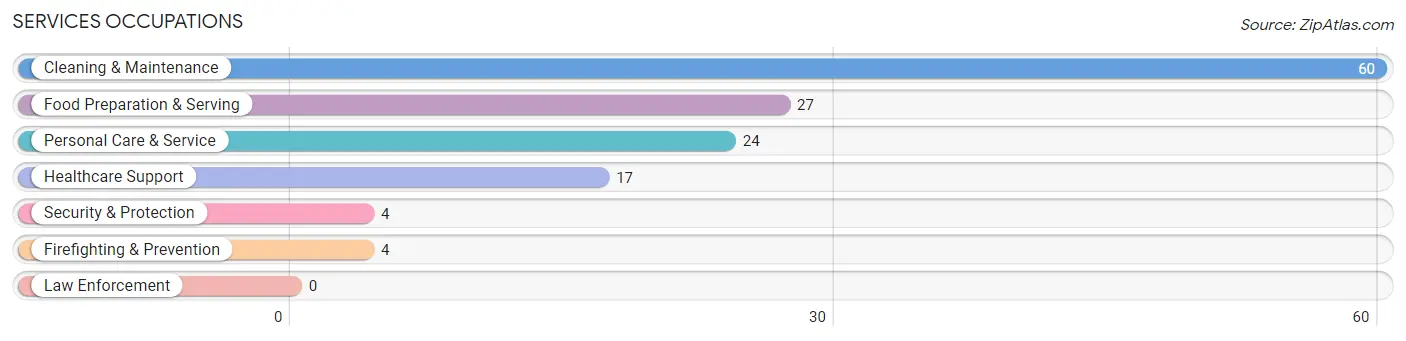
Services Occupations
The most common Services occupations in Kimball are Cleaning & Maintenance (60 | 5.8%), Food Preparation & Serving (27 | 2.6%), Personal Care & Service (24 | 2.3%), Healthcare Support (17 | 1.6%), and Security & Protection (4 | 0.4%).
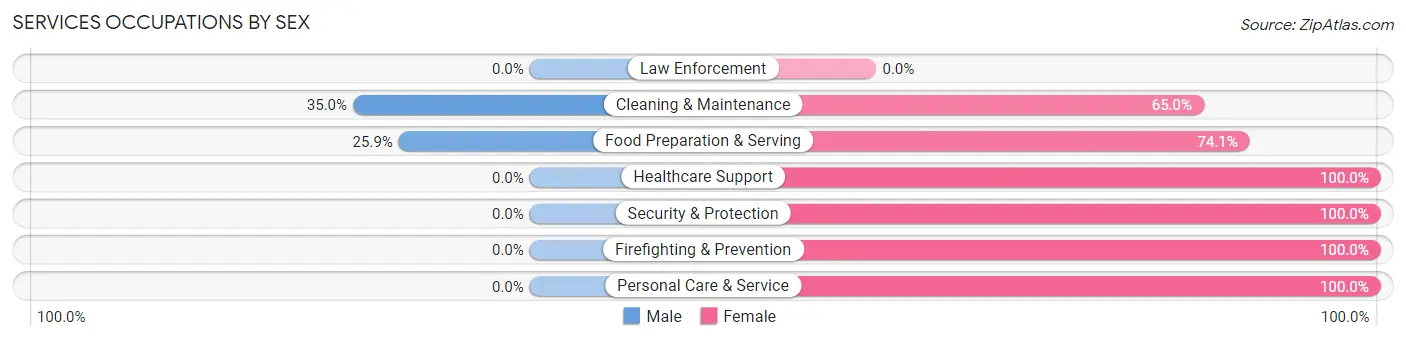
Services Occupations by Sex
Within the Services occupations in Kimball, the most male-oriented occupations are Cleaning & Maintenance (35.0%), and Food Preparation & Serving (25.9%), while the most female-oriented occupations are Healthcare Support (100.0%), Security & Protection (100.0%), and Firefighting & Prevention (100.0%).
| Occupation | Male | Female |
| Healthcare Support | 0 (0.0%) | 17 (100.0%) |
| Security & Protection | 0 (0.0%) | 4 (100.0%) |
| Firefighting & Prevention | 0 (0.0%) | 4 (100.0%) |
| Law Enforcement | 0 (0.0%) | 0 (0.0%) |
| Food Preparation & Serving | 7 (25.9%) | 20 (74.1%) |
| Cleaning & Maintenance | 21 (35.0%) | 39 (65.0%) |
| Personal Care & Service | 0 (0.0%) | 24 (100.0%) |
| Total (Category) | 28 (21.2%) | 104 (78.8%) |
| Total (Overall) | 541 (51.9%) | 501 (48.1%) |
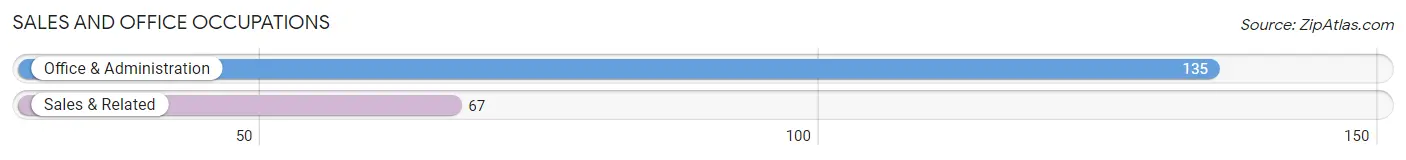
Sales and Office Occupations
The most common Sales and Office occupations in Kimball are Office & Administration (135 | 13.0%), and Sales & Related (67 | 6.4%).
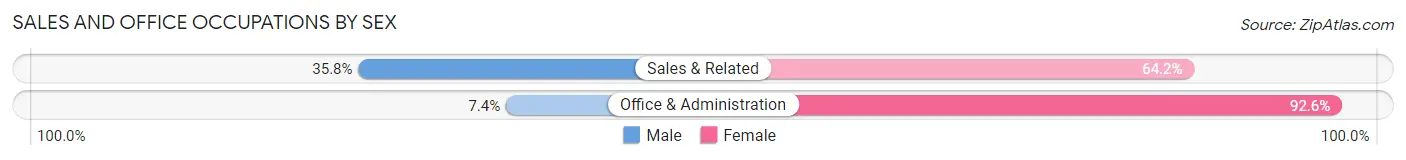
Sales and Office Occupations by Sex
| Occupation | Male | Female |
| Sales & Related | 24 (35.8%) | 43 (64.2%) |
| Office & Administration | 10 (7.4%) | 125 (92.6%) |
| Total (Category) | 34 (16.8%) | 168 (83.2%) |
| Total (Overall) | 541 (51.9%) | 501 (48.1%) |
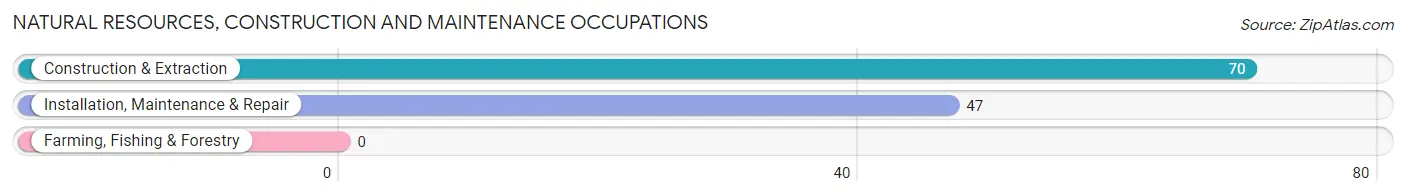
Natural Resources, Construction and Maintenance Occupations
The most common Natural Resources, Construction and Maintenance occupations in Kimball are Construction & Extraction (70 | 6.7%), and Installation, Maintenance & Repair (47 | 4.5%).
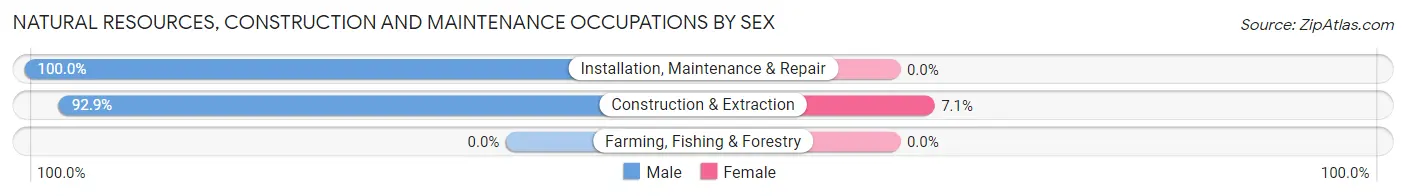
Natural Resources, Construction and Maintenance Occupations by Sex
| Occupation | Male | Female |
| Farming, Fishing & Forestry | 0 (0.0%) | 0 (0.0%) |
| Construction & Extraction | 65 (92.9%) | 5 (7.1%) |
| Installation, Maintenance & Repair | 47 (100.0%) | 0 (0.0%) |
| Total (Category) | 112 (95.7%) | 5 (4.3%) |
| Total (Overall) | 541 (51.9%) | 501 (48.1%) |
Production, Transportation and Moving Occupations
The most common Production, Transportation and Moving occupations in Kimball are Production (245 | 23.5%), Transportation (76 | 7.3%), and Material Moving (45 | 4.3%).
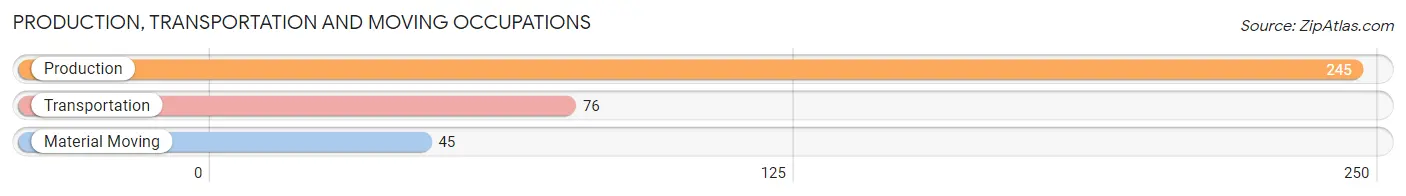
Production, Transportation and Moving Occupations by Sex
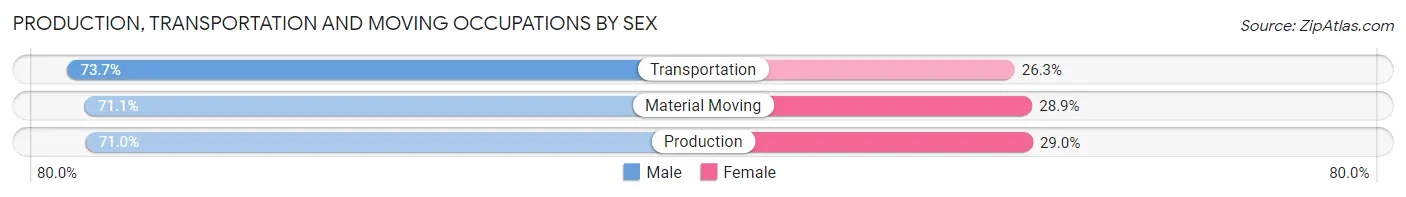
| Occupation | Male | Female |
| Production | 174 (71.0%) | 71 (29.0%) |
| Transportation | 56 (73.7%) | 20 (26.3%) |
| Material Moving | 32 (71.1%) | 13 (28.9%) |
| Total (Category) | 262 (71.6%) | 104 (28.4%) |
| Total (Overall) | 541 (51.9%) | 501 (48.1%) |
Employment Industries by Sex in Kimball
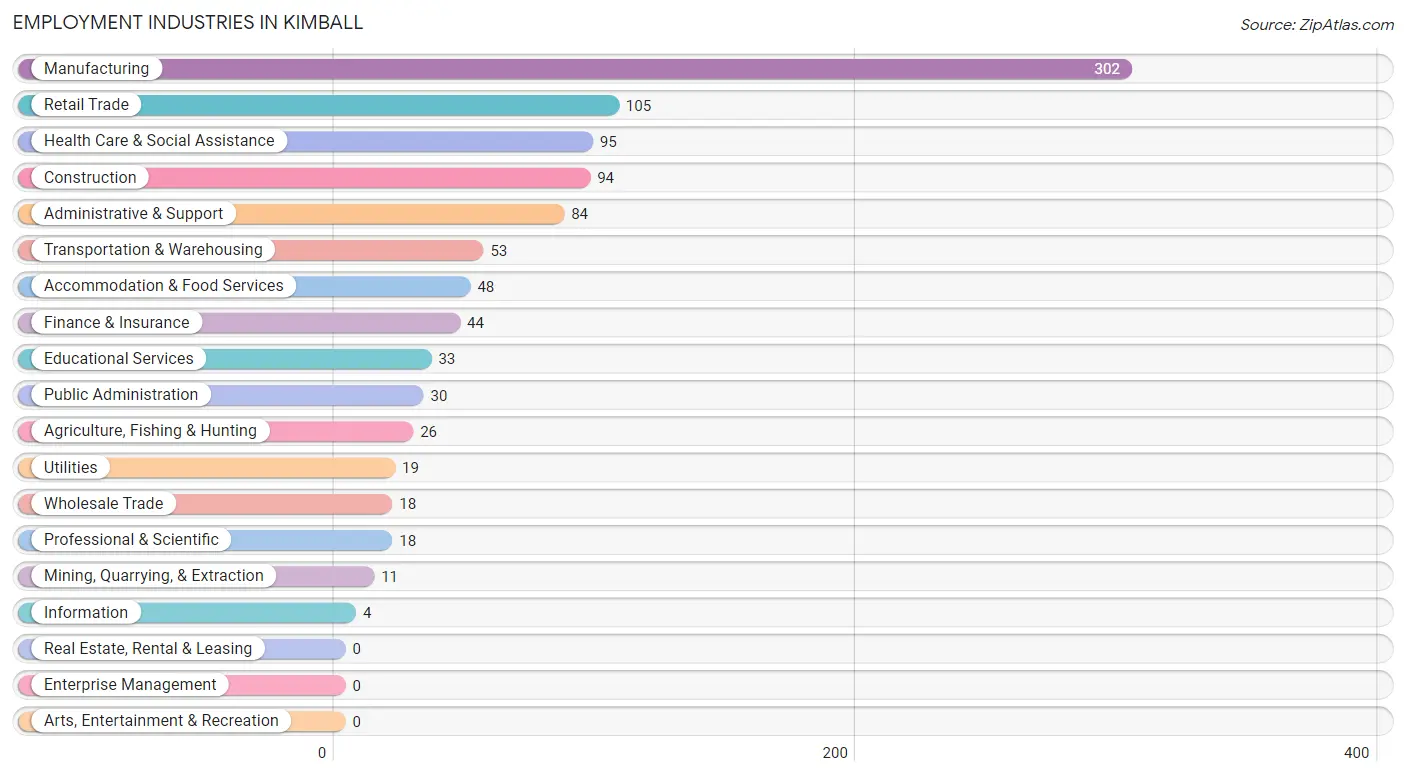
Employment Industries in Kimball
The major employment industries in Kimball include Manufacturing (302 | 29.0%), Retail Trade (105 | 10.1%), Health Care & Social Assistance (95 | 9.1%), Construction (94 | 9.0%), and Administrative & Support (84 | 8.1%).
Employment Industries by Sex in Kimball
The Kimball industries that see more men than women are Agriculture, Fishing & Hunting (100.0%), Mining, Quarrying, & Extraction (100.0%), and Construction (100.0%), whereas the industries that tend to have a higher number of women are Information (100.0%), Finance & Insurance (100.0%), and Accommodation & Food Services (100.0%).
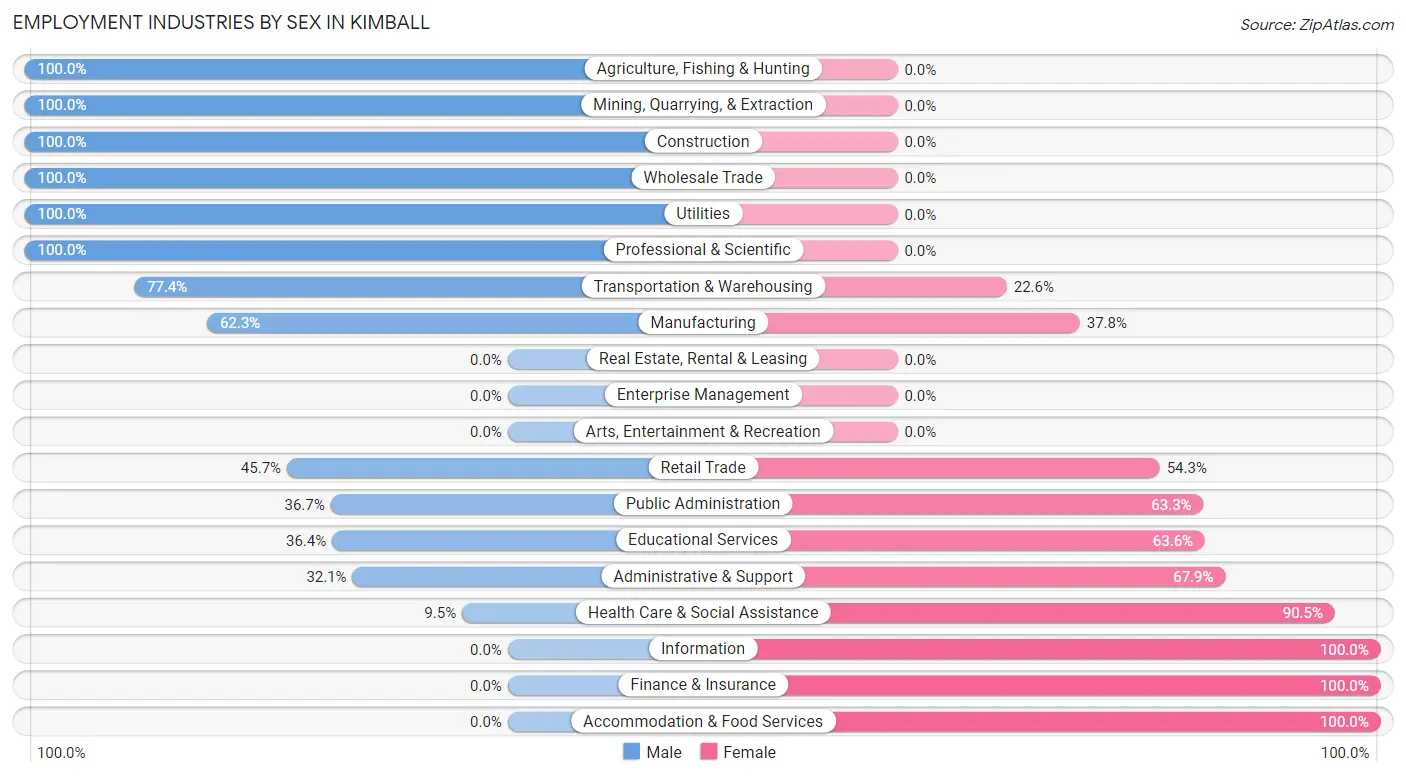
| Industry | Male | Female |
| Agriculture, Fishing & Hunting | 26 (100.0%) | 0 (0.0%) |
| Mining, Quarrying, & Extraction | 11 (100.0%) | 0 (0.0%) |
| Construction | 94 (100.0%) | 0 (0.0%) |
| Manufacturing | 188 (62.3%) | 114 (37.8%) |
| Wholesale Trade | 18 (100.0%) | 0 (0.0%) |
| Retail Trade | 48 (45.7%) | 57 (54.3%) |
| Transportation & Warehousing | 41 (77.4%) | 12 (22.6%) |
| Utilities | 19 (100.0%) | 0 (0.0%) |
| Information | 0 (0.0%) | 4 (100.0%) |
| Finance & Insurance | 0 (0.0%) | 44 (100.0%) |
| Real Estate, Rental & Leasing | 0 (0.0%) | 0 (0.0%) |
| Professional & Scientific | 18 (100.0%) | 0 (0.0%) |
| Enterprise Management | 0 (0.0%) | 0 (0.0%) |
| Administrative & Support | 27 (32.1%) | 57 (67.9%) |
| Educational Services | 12 (36.4%) | 21 (63.6%) |
| Health Care & Social Assistance | 9 (9.5%) | 86 (90.5%) |
| Arts, Entertainment & Recreation | 0 (0.0%) | 0 (0.0%) |
| Accommodation & Food Services | 0 (0.0%) | 48 (100.0%) |
| Public Administration | 11 (36.7%) | 19 (63.3%) |
| Total | 541 (51.9%) | 501 (48.1%) |
Education in Kimball
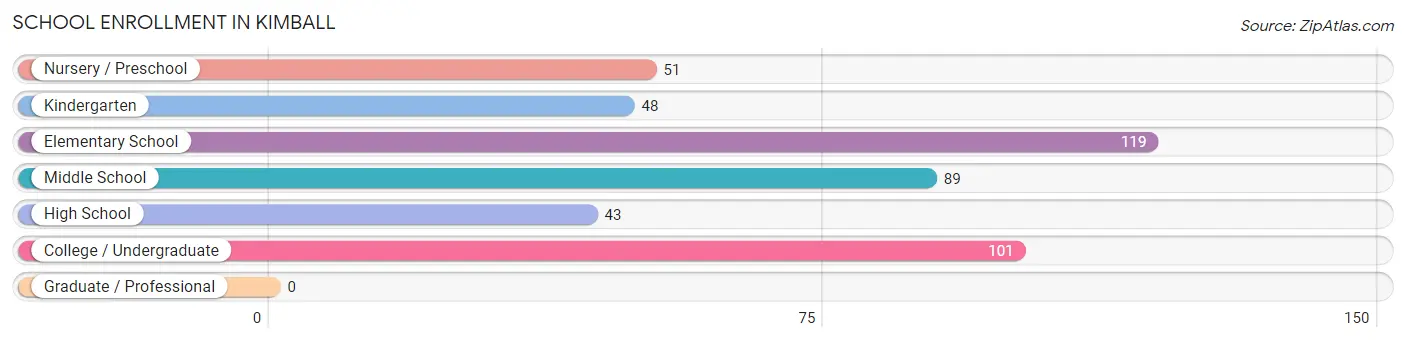
School Enrollment in Kimball
The most common levels of schooling among the 451 students in Kimball are elementary school (119 | 26.4%), college / undergraduate (101 | 22.4%), and middle school (89 | 19.7%).
| School Level | # Students | % Students |
| Nursery / Preschool | 51 | 11.3% |
| Kindergarten | 48 | 10.6% |
| Elementary School | 119 | 26.4% |
| Middle School | 89 | 19.7% |
| High School | 43 | 9.5% |
| College / Undergraduate | 101 | 22.4% |
| Graduate / Professional | 0 | 0.0% |
| Total | 451 | 100.0% |
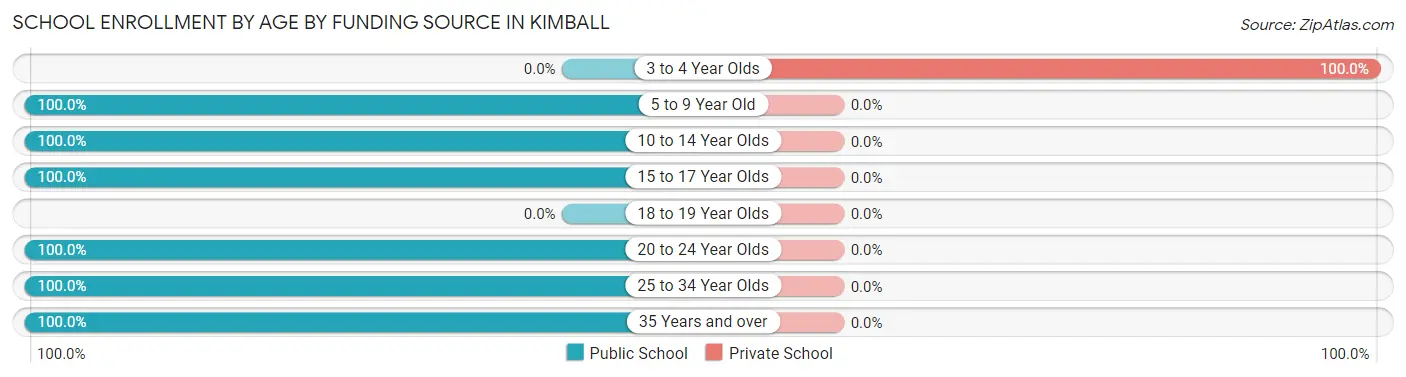
School Enrollment by Age by Funding Source in Kimball
Out of a total of 451 students who are enrolled in schools in Kimball, 2 (0.4%) attend a private institution, while the remaining 449 (99.6%) are enrolled in public schools. The age group of 3 to 4 year olds has the highest likelihood of being enrolled in private schools, with 2 (100.0% in the age bracket) enrolled. Conversely, the age group of 5 to 9 year old has the lowest likelihood of being enrolled in a private school, with 216 (100.0% in the age bracket) attending a public institution.
| Age Bracket | Public School | Private School |
| 3 to 4 Year Olds | 0 (0.0%) | 2 (100.0%) |
| 5 to 9 Year Old | 216 (100.0%) | 0 (0.0%) |
| 10 to 14 Year Olds | 91 (100.0%) | 0 (0.0%) |
| 15 to 17 Year Olds | 41 (100.0%) | 0 (0.0%) |
| 18 to 19 Year Olds | 0 (0.0%) | 0 (0.0%) |
| 20 to 24 Year Olds | 20 (100.0%) | 0 (0.0%) |
| 25 to 34 Year Olds | 55 (100.0%) | 0 (0.0%) |
| 35 Years and over | 26 (100.0%) | 0 (0.0%) |
| Total | 449 (99.6%) | 2 (0.4%) |
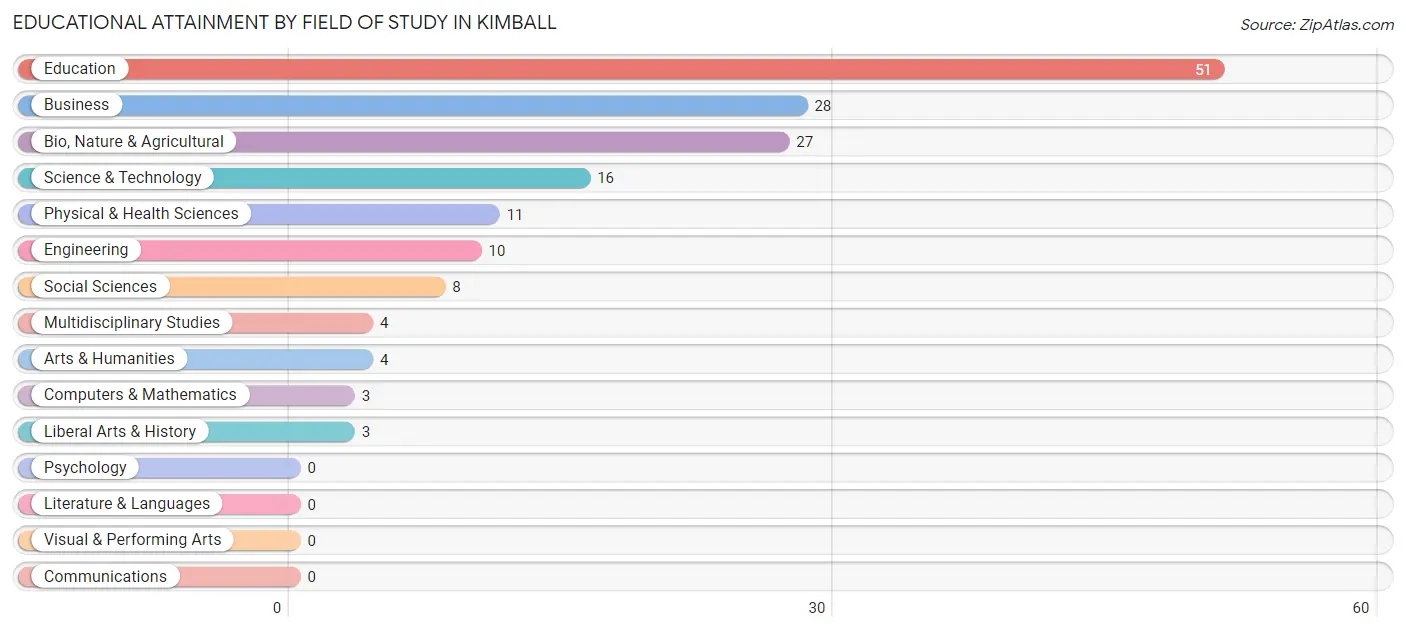
Educational Attainment by Field of Study in Kimball
Education (51 | 30.9%), business (28 | 17.0%), bio, nature & agricultural (27 | 16.4%), science & technology (16 | 9.7%), and physical & health sciences (11 | 6.7%) are the most common fields of study among 165 individuals in Kimball who have obtained a bachelor's degree or higher.
| Field of Study | # Graduates | % Graduates |
| Computers & Mathematics | 3 | 1.8% |
| Bio, Nature & Agricultural | 27 | 16.4% |
| Physical & Health Sciences | 11 | 6.7% |
| Psychology | 0 | 0.0% |
| Social Sciences | 8 | 4.9% |
| Engineering | 10 | 6.1% |
| Multidisciplinary Studies | 4 | 2.4% |
| Science & Technology | 16 | 9.7% |
| Business | 28 | 17.0% |
| Education | 51 | 30.9% |
| Literature & Languages | 0 | 0.0% |
| Liberal Arts & History | 3 | 1.8% |
| Visual & Performing Arts | 0 | 0.0% |
| Communications | 0 | 0.0% |
| Arts & Humanities | 4 | 2.4% |
| Total | 165 | 100.0% |
Transportation & Commute in Kimball
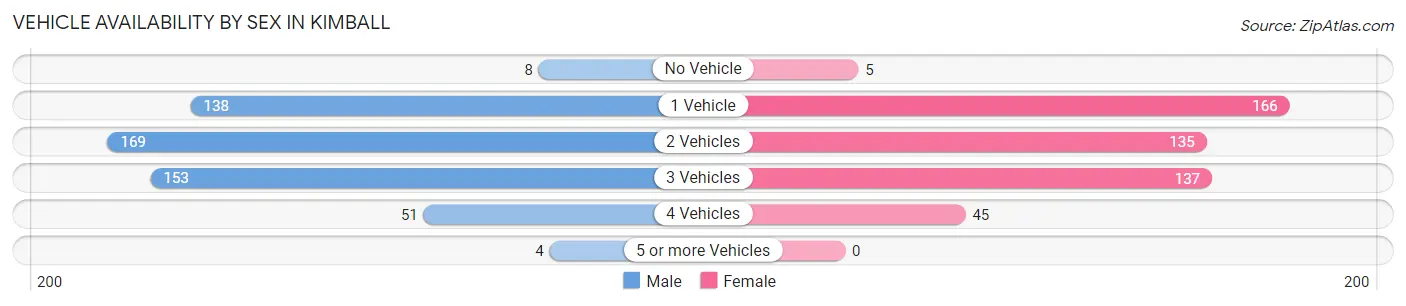
Vehicle Availability by Sex in Kimball
The most prevalent vehicle ownership categories in Kimball are males with 2 vehicles (169, accounting for 32.3%) and females with 2 vehicles (135, making up 34.6%).
| Vehicles Available | Male | Female |
| No Vehicle | 8 (1.5%) | 5 (1.0%) |
| 1 Vehicle | 138 (26.4%) | 166 (34.0%) |
| 2 Vehicles | 169 (32.3%) | 135 (27.7%) |
| 3 Vehicles | 153 (29.2%) | 137 (28.1%) |
| 4 Vehicles | 51 (9.8%) | 45 (9.2%) |
| 5 or more Vehicles | 4 (0.8%) | 0 (0.0%) |
| Total | 523 (100.0%) | 488 (100.0%) |
Commute Time in Kimball
The most frequently occuring commute durations in Kimball are 5 to 9 minutes (432 commuters, 46.1%), less than 5 minutes (151 commuters, 16.1%), and 10 to 14 minutes (121 commuters, 12.9%).
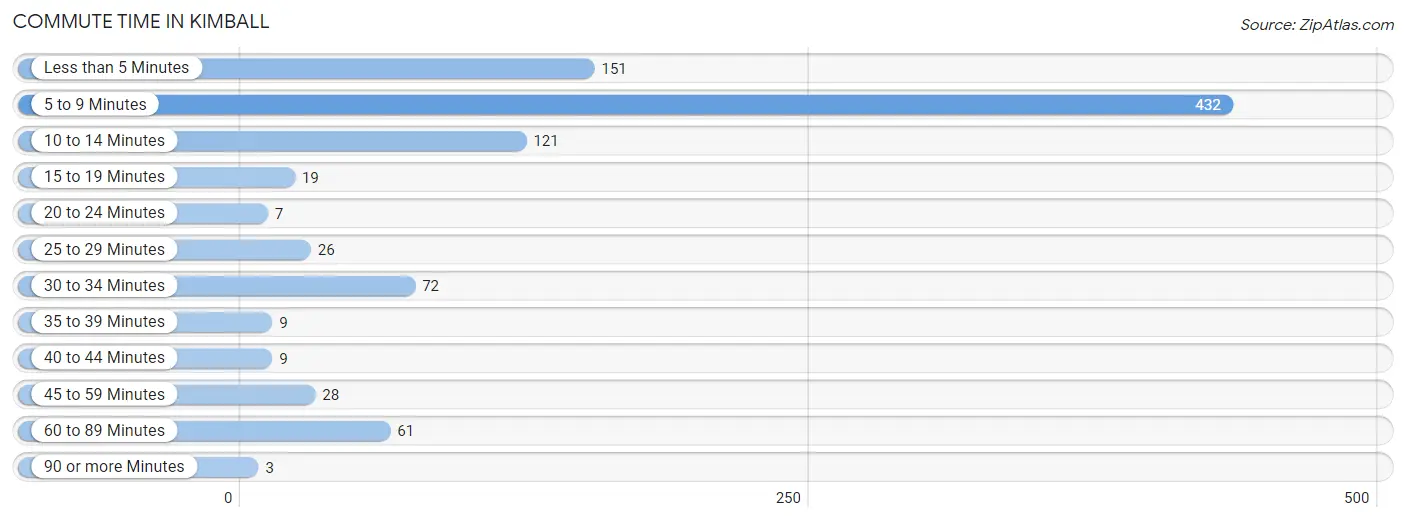
| Commute Time | # Commuters | % Commuters |
| Less than 5 Minutes | 151 | 16.1% |
| 5 to 9 Minutes | 432 | 46.1% |
| 10 to 14 Minutes | 121 | 12.9% |
| 15 to 19 Minutes | 19 | 2.0% |
| 20 to 24 Minutes | 7 | 0.7% |
| 25 to 29 Minutes | 26 | 2.8% |
| 30 to 34 Minutes | 72 | 7.7% |
| 35 to 39 Minutes | 9 | 1.0% |
| 40 to 44 Minutes | 9 | 1.0% |
| 45 to 59 Minutes | 28 | 3.0% |
| 60 to 89 Minutes | 61 | 6.5% |
| 90 or more Minutes | 3 | 0.3% |
Commute Time by Sex in Kimball
The most common commute times in Kimball are 5 to 9 minutes (187 commuters, 40.6%) for males and 5 to 9 minutes (245 commuters, 51.4%) for females.
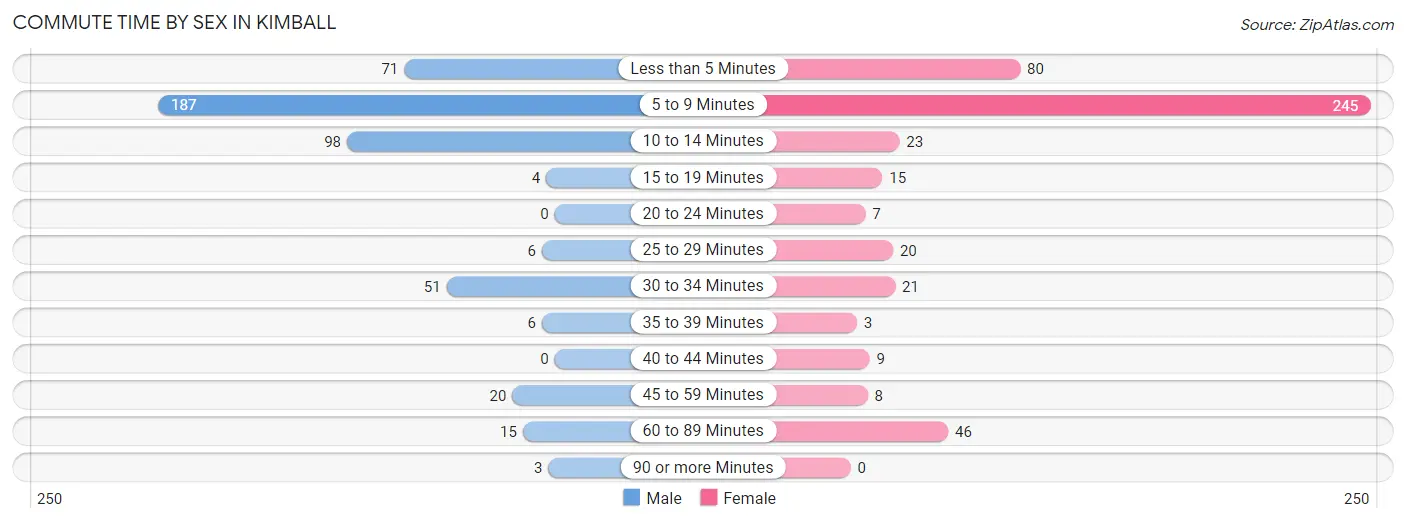
| Commute Time | Male | Female |
| Less than 5 Minutes | 71 (15.4%) | 80 (16.8%) |
| 5 to 9 Minutes | 187 (40.6%) | 245 (51.4%) |
| 10 to 14 Minutes | 98 (21.3%) | 23 (4.8%) |
| 15 to 19 Minutes | 4 (0.9%) | 15 (3.1%) |
| 20 to 24 Minutes | 0 (0.0%) | 7 (1.5%) |
| 25 to 29 Minutes | 6 (1.3%) | 20 (4.2%) |
| 30 to 34 Minutes | 51 (11.1%) | 21 (4.4%) |
| 35 to 39 Minutes | 6 (1.3%) | 3 (0.6%) |
| 40 to 44 Minutes | 0 (0.0%) | 9 (1.9%) |
| 45 to 59 Minutes | 20 (4.3%) | 8 (1.7%) |
| 60 to 89 Minutes | 15 (3.3%) | 46 (9.6%) |
| 90 or more Minutes | 3 (0.6%) | 0 (0.0%) |
Time of Departure to Work by Sex in Kimball
The most frequent times of departure to work in Kimball are 5:30 AM to 5:59 AM (135, 29.3%) for males and 6:30 AM to 6:59 AM (77, 16.1%) for females.
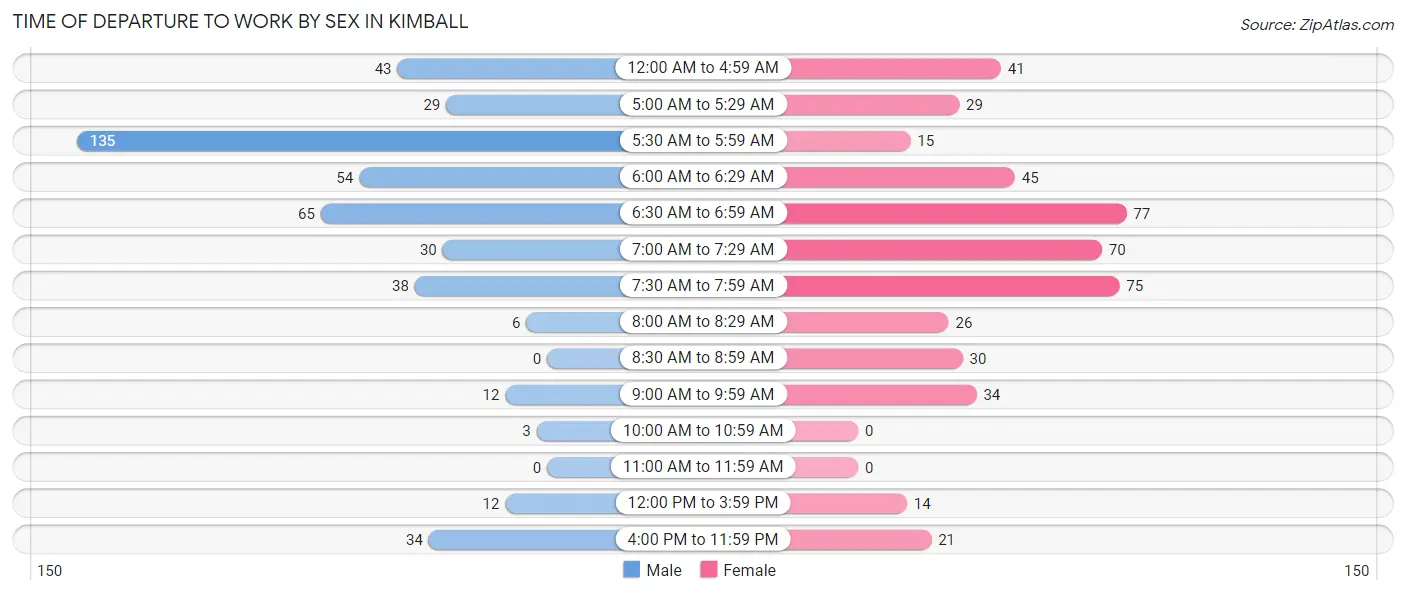
| Time of Departure | Male | Female |
| 12:00 AM to 4:59 AM | 43 (9.3%) | 41 (8.6%) |
| 5:00 AM to 5:29 AM | 29 (6.3%) | 29 (6.1%) |
| 5:30 AM to 5:59 AM | 135 (29.3%) | 15 (3.1%) |
| 6:00 AM to 6:29 AM | 54 (11.7%) | 45 (9.4%) |
| 6:30 AM to 6:59 AM | 65 (14.1%) | 77 (16.1%) |
| 7:00 AM to 7:29 AM | 30 (6.5%) | 70 (14.7%) |
| 7:30 AM to 7:59 AM | 38 (8.2%) | 75 (15.7%) |
| 8:00 AM to 8:29 AM | 6 (1.3%) | 26 (5.4%) |
| 8:30 AM to 8:59 AM | 0 (0.0%) | 30 (6.3%) |
| 9:00 AM to 9:59 AM | 12 (2.6%) | 34 (7.1%) |
| 10:00 AM to 10:59 AM | 3 (0.6%) | 0 (0.0%) |
| 11:00 AM to 11:59 AM | 0 (0.0%) | 0 (0.0%) |
| 12:00 PM to 3:59 PM | 12 (2.6%) | 14 (2.9%) |
| 4:00 PM to 11:59 PM | 34 (7.4%) | 21 (4.4%) |
| Total | 461 (100.0%) | 477 (100.0%) |
Housing Occupancy in Kimball
Occupancy by Ownership in Kimball
Of the total 941 dwellings in Kimball, owner-occupied units account for 620 (65.9%), while renter-occupied units make up 321 (34.1%).
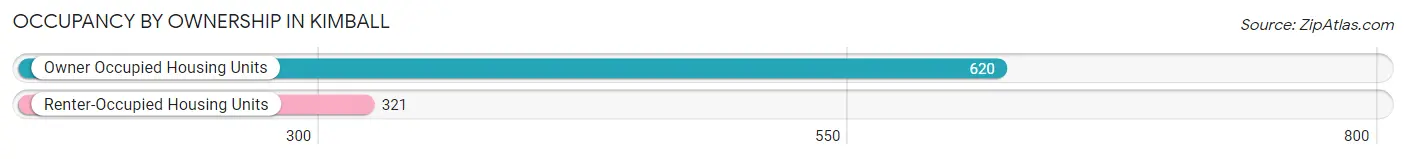
| Occupancy | # Housing Units | % Housing Units |
| Owner Occupied Housing Units | 620 | 65.9% |
| Renter-Occupied Housing Units | 321 | 34.1% |
| Total Occupied Housing Units | 941 | 100.0% |
Occupancy by Household Size in Kimball
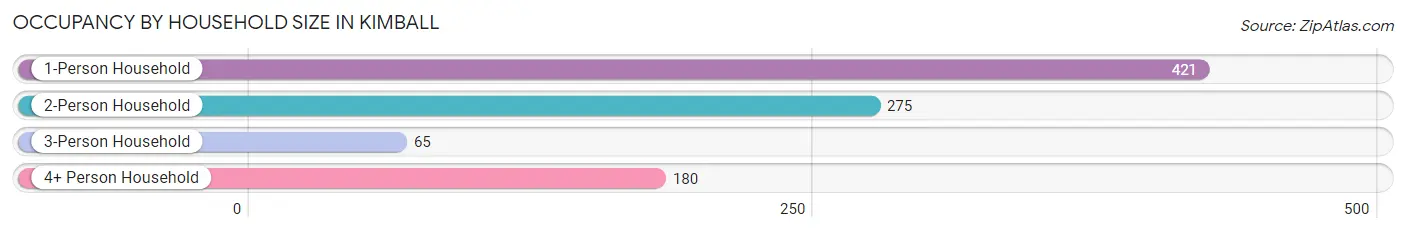
| Household Size | # Housing Units | % Housing Units |
| 1-Person Household | 421 | 44.7% |
| 2-Person Household | 275 | 29.2% |
| 3-Person Household | 65 | 6.9% |
| 4+ Person Household | 180 | 19.1% |
| Total Housing Units | 941 | 100.0% |
Occupancy by Ownership by Household Size in Kimball
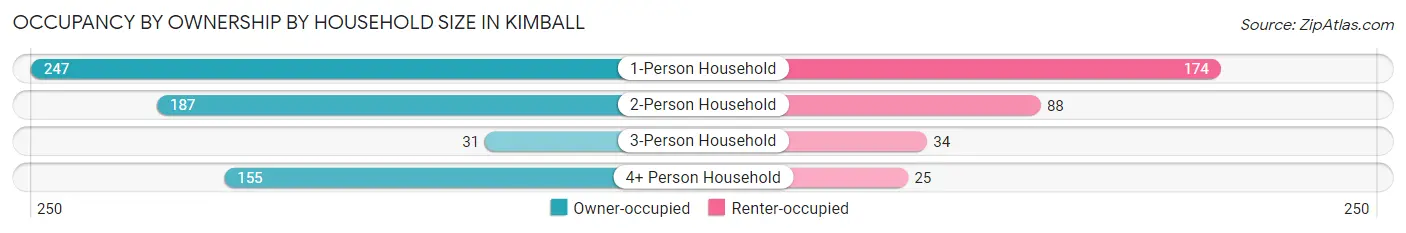
| Household Size | Owner-occupied | Renter-occupied |
| 1-Person Household | 247 (58.7%) | 174 (41.3%) |
| 2-Person Household | 187 (68.0%) | 88 (32.0%) |
| 3-Person Household | 31 (47.7%) | 34 (52.3%) |
| 4+ Person Household | 155 (86.1%) | 25 (13.9%) |
| Total Housing Units | 620 (65.9%) | 321 (34.1%) |
Occupancy by Educational Attainment in Kimball
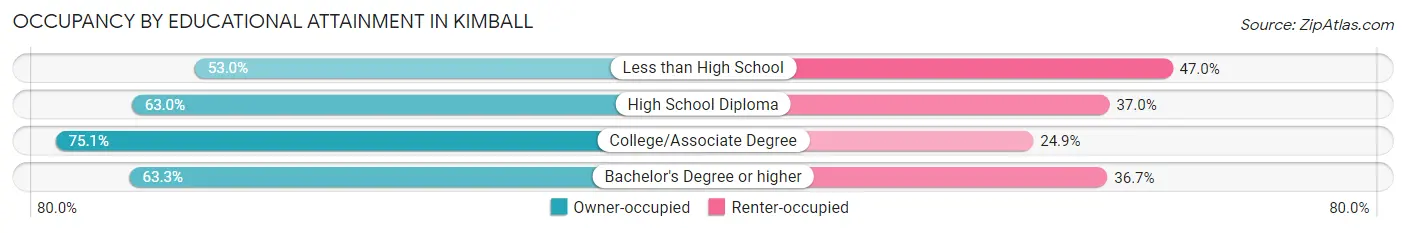
| Household Size | Owner-occupied | Renter-occupied |
| Less than High School | 71 (53.0%) | 63 (47.0%) |
| High School Diploma | 223 (63.0%) | 131 (37.0%) |
| College/Associate Degree | 250 (75.1%) | 83 (24.9%) |
| Bachelor's Degree or higher | 76 (63.3%) | 44 (36.7%) |
Occupancy by Age of Householder in Kimball
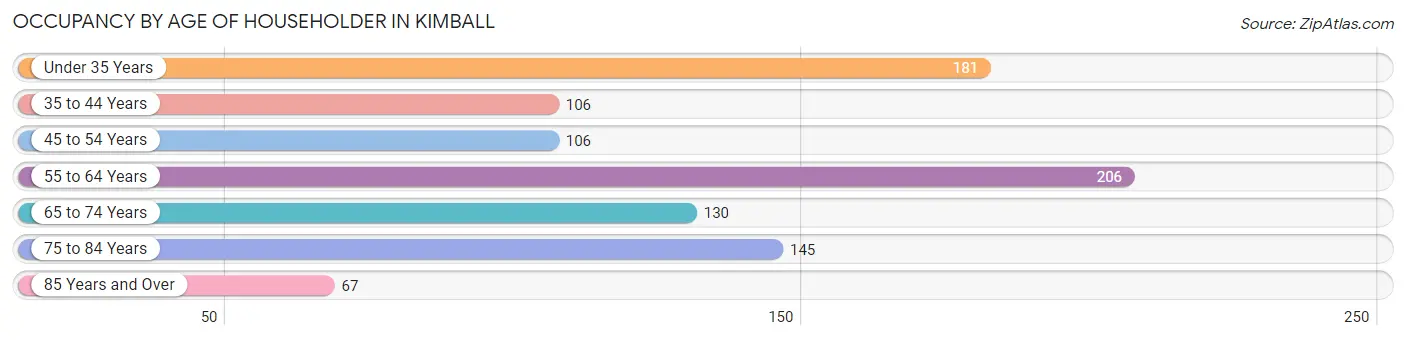
| Age Bracket | # Households | % Households |
| Under 35 Years | 181 | 19.2% |
| 35 to 44 Years | 106 | 11.3% |
| 45 to 54 Years | 106 | 11.3% |
| 55 to 64 Years | 206 | 21.9% |
| 65 to 74 Years | 130 | 13.8% |
| 75 to 84 Years | 145 | 15.4% |
| 85 Years and Over | 67 | 7.1% |
| Total | 941 | 100.0% |
Housing Finances in Kimball
Median Income by Occupancy in Kimball
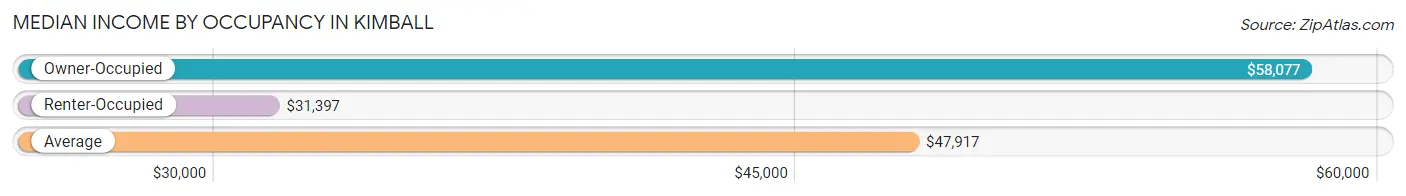
| Occupancy Type | # Households | Median Income |
| Owner-Occupied | 620 (65.9%) | $58,077 |
| Renter-Occupied | 321 (34.1%) | $31,397 |
| Average | 941 (100.0%) | $47,917 |
Occupancy by Householder Income Bracket in Kimball
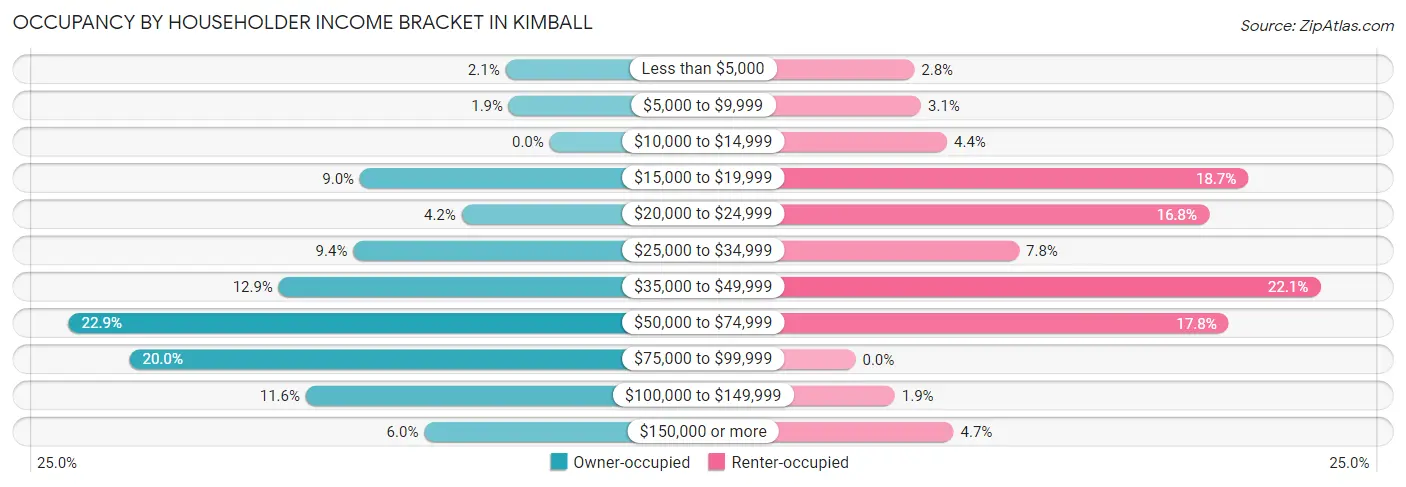
| Income Bracket | Owner-occupied | Renter-occupied |
| Less than $5,000 | 13 (2.1%) | 9 (2.8%) |
| $5,000 to $9,999 | 12 (1.9%) | 10 (3.1%) |
| $10,000 to $14,999 | 0 (0.0%) | 14 (4.4%) |
| $15,000 to $19,999 | 56 (9.0%) | 60 (18.7%) |
| $20,000 to $24,999 | 26 (4.2%) | 54 (16.8%) |
| $25,000 to $34,999 | 58 (9.3%) | 25 (7.8%) |
| $35,000 to $49,999 | 80 (12.9%) | 71 (22.1%) |
| $50,000 to $74,999 | 142 (22.9%) | 57 (17.8%) |
| $75,000 to $99,999 | 124 (20.0%) | 0 (0.0%) |
| $100,000 to $149,999 | 72 (11.6%) | 6 (1.9%) |
| $150,000 or more | 37 (6.0%) | 15 (4.7%) |
| Total | 620 (100.0%) | 321 (100.0%) |
Monthly Housing Cost Tiers in Kimball
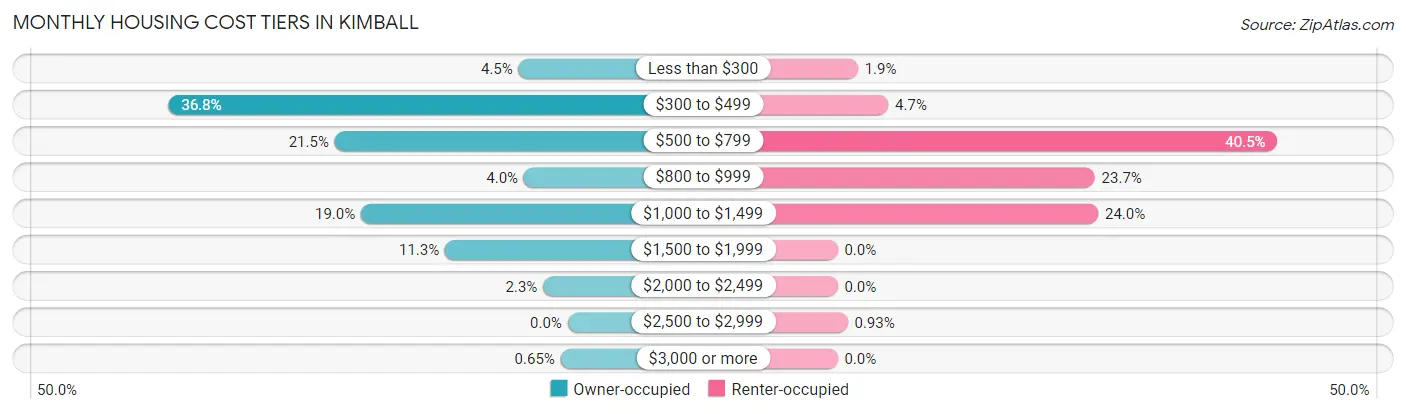
| Monthly Cost | Owner-occupied | Renter-occupied |
| Less than $300 | 28 (4.5%) | 6 (1.9%) |
| $300 to $499 | 228 (36.8%) | 15 (4.7%) |
| $500 to $799 | 133 (21.4%) | 130 (40.5%) |
| $800 to $999 | 25 (4.0%) | 76 (23.7%) |
| $1,000 to $1,499 | 118 (19.0%) | 77 (24.0%) |
| $1,500 to $1,999 | 70 (11.3%) | 0 (0.0%) |
| $2,000 to $2,499 | 14 (2.3%) | 0 (0.0%) |
| $2,500 to $2,999 | 0 (0.0%) | 3 (0.9%) |
| $3,000 or more | 4 (0.6%) | 0 (0.0%) |
| Total | 620 (100.0%) | 321 (100.0%) |
Physical Housing Characteristics in Kimball
Housing Structures in Kimball
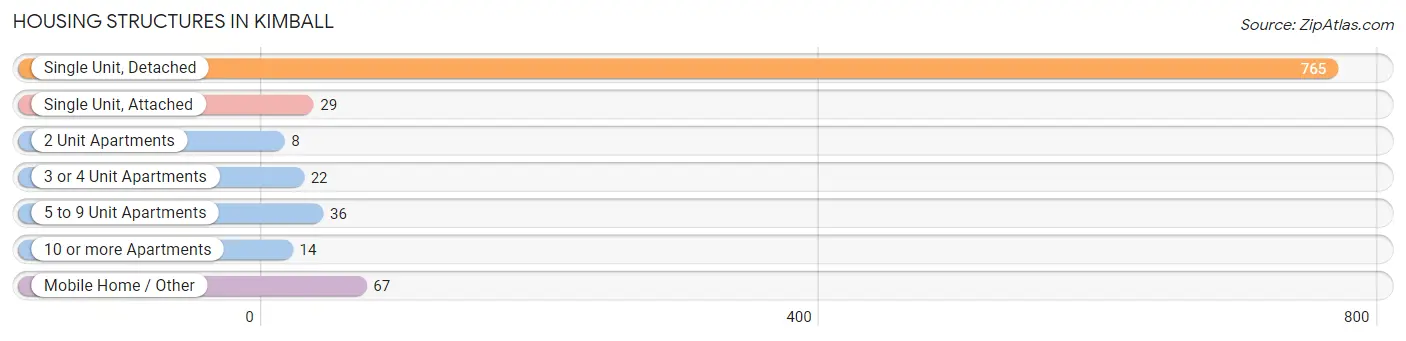
| Structure Type | # Housing Units | % Housing Units |
| Single Unit, Detached | 765 | 81.3% |
| Single Unit, Attached | 29 | 3.1% |
| 2 Unit Apartments | 8 | 0.9% |
| 3 or 4 Unit Apartments | 22 | 2.3% |
| 5 to 9 Unit Apartments | 36 | 3.8% |
| 10 or more Apartments | 14 | 1.5% |
| Mobile Home / Other | 67 | 7.1% |
| Total | 941 | 100.0% |
Housing Structures by Occupancy in Kimball
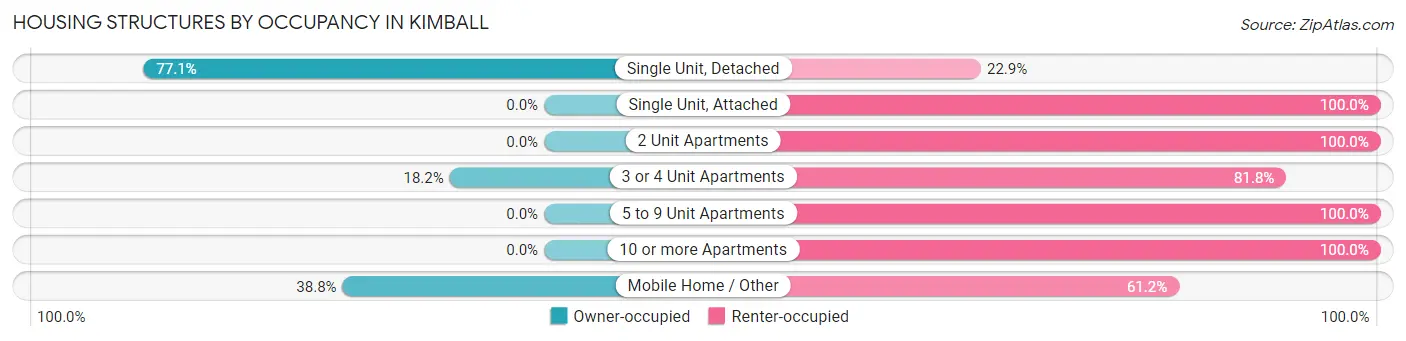
| Structure Type | Owner-occupied | Renter-occupied |
| Single Unit, Detached | 590 (77.1%) | 175 (22.9%) |
| Single Unit, Attached | 0 (0.0%) | 29 (100.0%) |
| 2 Unit Apartments | 0 (0.0%) | 8 (100.0%) |
| 3 or 4 Unit Apartments | 4 (18.2%) | 18 (81.8%) |
| 5 to 9 Unit Apartments | 0 (0.0%) | 36 (100.0%) |
| 10 or more Apartments | 0 (0.0%) | 14 (100.0%) |
| Mobile Home / Other | 26 (38.8%) | 41 (61.2%) |
| Total | 620 (65.9%) | 321 (34.1%) |
Housing Structures by Number of Rooms in Kimball
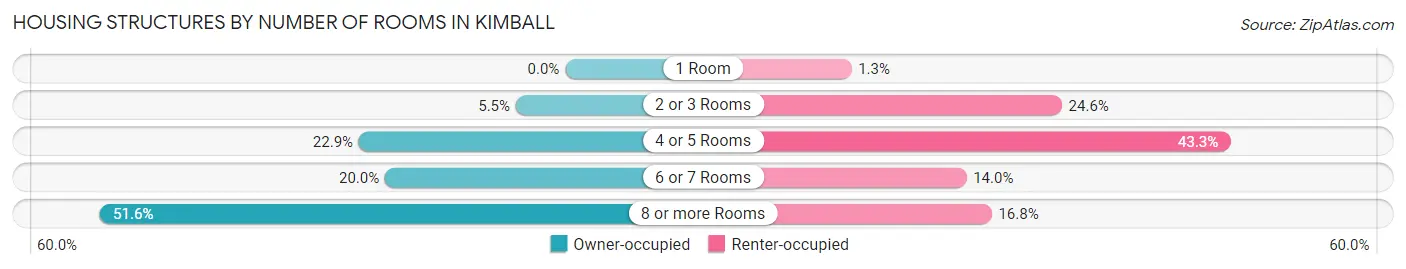
| Number of Rooms | Owner-occupied | Renter-occupied |
| 1 Room | 0 (0.0%) | 4 (1.3%) |
| 2 or 3 Rooms | 34 (5.5%) | 79 (24.6%) |
| 4 or 5 Rooms | 142 (22.9%) | 139 (43.3%) |
| 6 or 7 Rooms | 124 (20.0%) | 45 (14.0%) |
| 8 or more Rooms | 320 (51.6%) | 54 (16.8%) |
| Total | 620 (100.0%) | 321 (100.0%) |
Housing Structure by Heating Type in Kimball
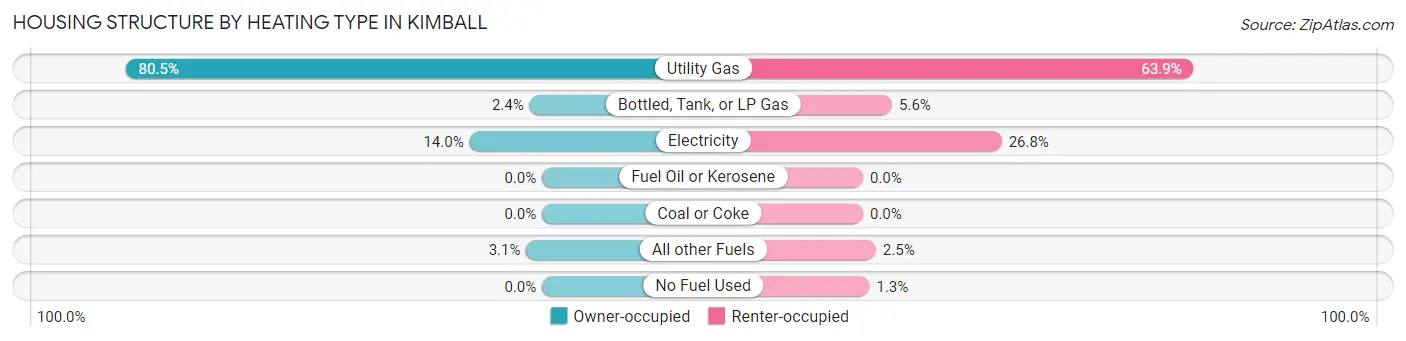
| Heating Type | Owner-occupied | Renter-occupied |
| Utility Gas | 499 (80.5%) | 205 (63.9%) |
| Bottled, Tank, or LP Gas | 15 (2.4%) | 18 (5.6%) |
| Electricity | 87 (14.0%) | 86 (26.8%) |
| Fuel Oil or Kerosene | 0 (0.0%) | 0 (0.0%) |
| Coal or Coke | 0 (0.0%) | 0 (0.0%) |
| All other Fuels | 19 (3.1%) | 8 (2.5%) |
| No Fuel Used | 0 (0.0%) | 4 (1.3%) |
| Total | 620 (100.0%) | 321 (100.0%) |
Household Vehicle Usage in Kimball
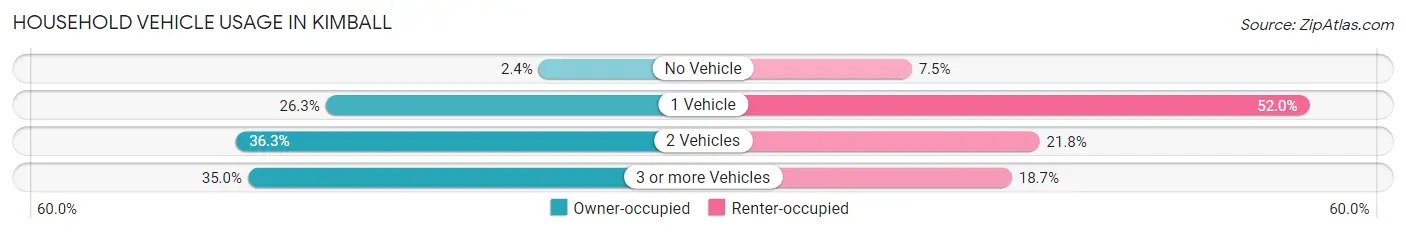
| Vehicles per Household | Owner-occupied | Renter-occupied |
| No Vehicle | 15 (2.4%) | 24 (7.5%) |
| 1 Vehicle | 163 (26.3%) | 167 (52.0%) |
| 2 Vehicles | 225 (36.3%) | 70 (21.8%) |
| 3 or more Vehicles | 217 (35.0%) | 60 (18.7%) |
| Total | 620 (100.0%) | 321 (100.0%) |
Real Estate & Mortgages in Kimball
Real Estate and Mortgage Overview in Kimball
| Characteristic | Without Mortgage | With Mortgage |
| Housing Units | 423 | 197 |
| Median Property Value | $72,200 | $136,000 |
| Median Household Income | $53,567 | $13 |
| Monthly Housing Costs | $470 | $4 |
| Real Estate Taxes | $1,426 | $4 |
Property Value by Mortgage Status in Kimball
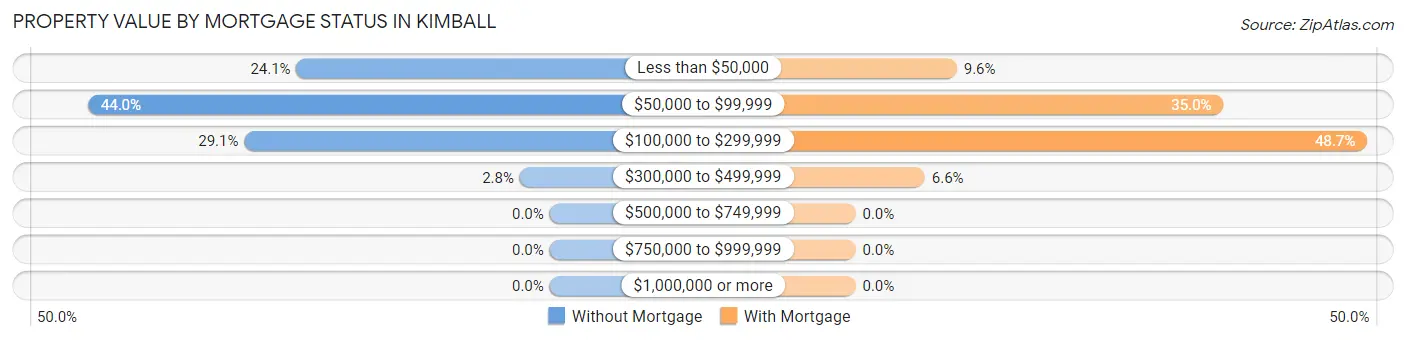
| Property Value | Without Mortgage | With Mortgage |
| Less than $50,000 | 102 (24.1%) | 19 (9.6%) |
| $50,000 to $99,999 | 186 (44.0%) | 69 (35.0%) |
| $100,000 to $299,999 | 123 (29.1%) | 96 (48.7%) |
| $300,000 to $499,999 | 12 (2.8%) | 13 (6.6%) |
| $500,000 to $749,999 | 0 (0.0%) | 0 (0.0%) |
| $750,000 to $999,999 | 0 (0.0%) | 0 (0.0%) |
| $1,000,000 or more | 0 (0.0%) | 0 (0.0%) |
| Total | 423 (100.0%) | 197 (100.0%) |
Household Income by Mortgage Status in Kimball
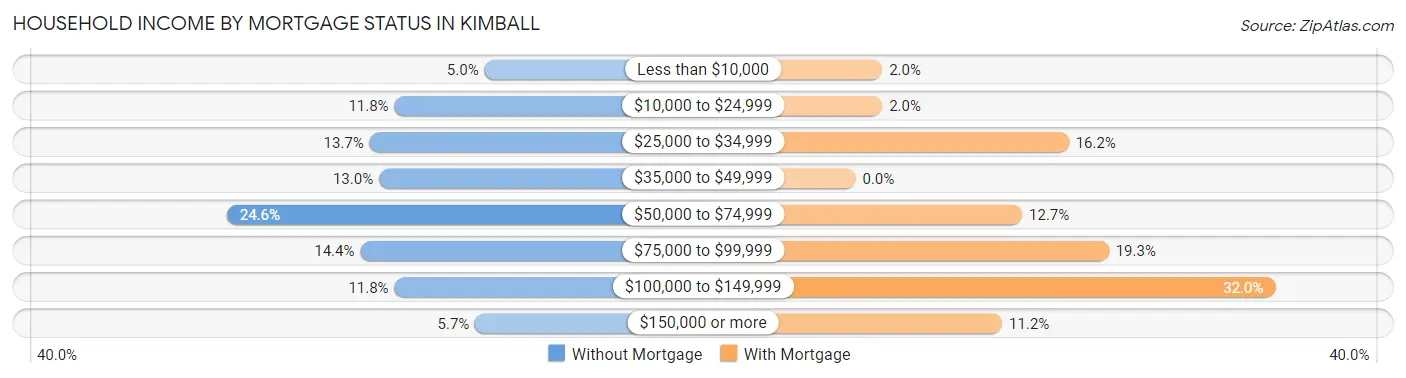
| Household Income | Without Mortgage | With Mortgage |
| Less than $10,000 | 21 (5.0%) | 4 (2.0%) |
| $10,000 to $24,999 | 50 (11.8%) | 4 (2.0%) |
| $25,000 to $34,999 | 58 (13.7%) | 32 (16.2%) |
| $35,000 to $49,999 | 55 (13.0%) | 0 (0.0%) |
| $50,000 to $74,999 | 104 (24.6%) | 25 (12.7%) |
| $75,000 to $99,999 | 61 (14.4%) | 38 (19.3%) |
| $100,000 to $149,999 | 50 (11.8%) | 63 (32.0%) |
| $150,000 or more | 24 (5.7%) | 22 (11.2%) |
| Total | 423 (100.0%) | 197 (100.0%) |
Property Value to Household Income Ratio in Kimball
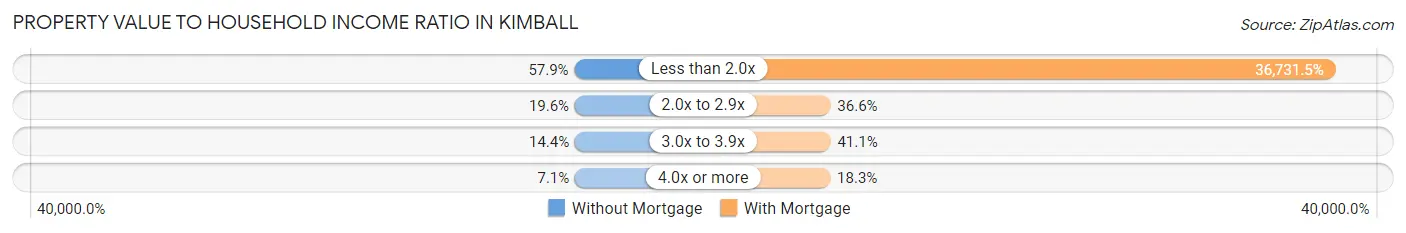
| Value-to-Income Ratio | Without Mortgage | With Mortgage |
| Less than 2.0x | 245 (57.9%) | 72,361 (36,731.5%) |
| 2.0x to 2.9x | 83 (19.6%) | 72 (36.5%) |
| 3.0x to 3.9x | 61 (14.4%) | 81 (41.1%) |
| 4.0x or more | 30 (7.1%) | 36 (18.3%) |
| Total | 423 (100.0%) | 197 (100.0%) |
Real Estate Taxes by Mortgage Status in Kimball
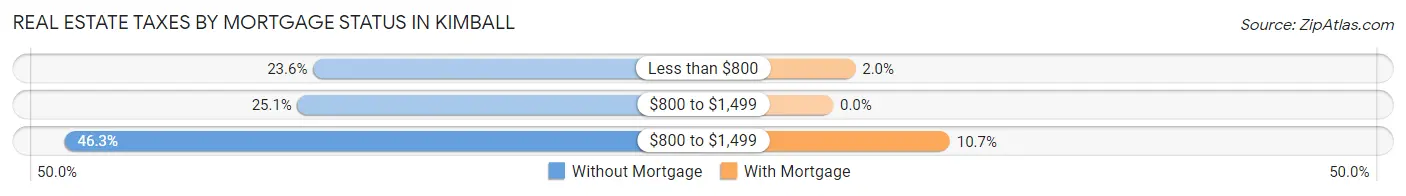
| Property Taxes | Without Mortgage | With Mortgage |
| Less than $800 | 100 (23.6%) | 4 (2.0%) |
| $800 to $1,499 | 106 (25.1%) | 0 (0.0%) |
| $800 to $1,499 | 196 (46.3%) | 21 (10.7%) |
| Total | 423 (100.0%) | 197 (100.0%) |
Health & Disability in Kimball
Health Insurance Coverage by Age in Kimball
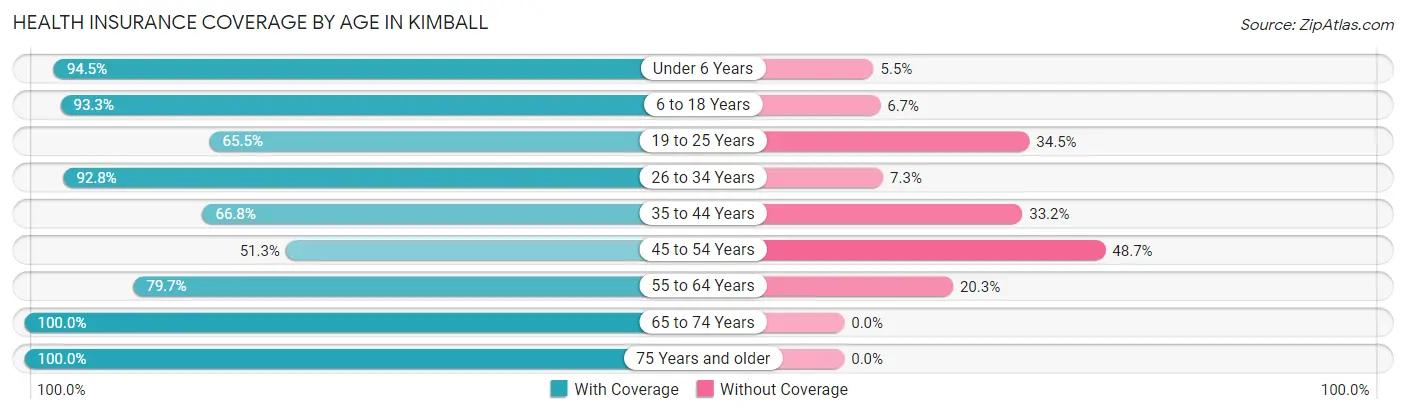
| Age Bracket | With Coverage | Without Coverage |
| Under 6 Years | 173 (94.5%) | 10 (5.5%) |
| 6 to 18 Years | 292 (93.3%) | 21 (6.7%) |
| 19 to 25 Years | 129 (65.5%) | 68 (34.5%) |
| 26 to 34 Years | 179 (92.7%) | 14 (7.2%) |
| 35 to 44 Years | 161 (66.8%) | 80 (33.2%) |
| 45 to 54 Years | 98 (51.3%) | 93 (48.7%) |
| 55 to 64 Years | 240 (79.7%) | 61 (20.3%) |
| 65 to 74 Years | 191 (100.0%) | 0 (0.0%) |
| 75 Years and older | 274 (100.0%) | 0 (0.0%) |
| Total | 1,737 (83.4%) | 347 (16.7%) |
Health Insurance Coverage by Citizenship Status in Kimball
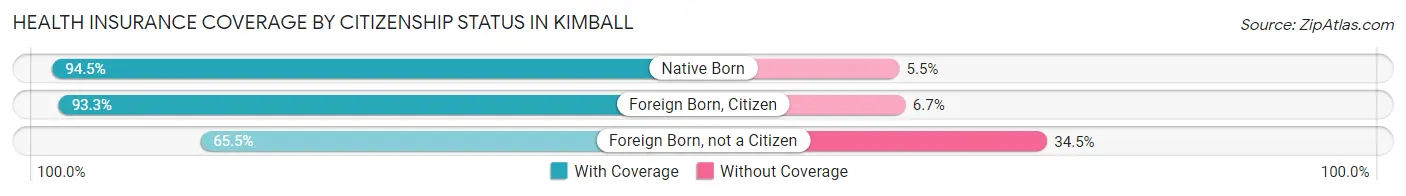
| Citizenship Status | With Coverage | Without Coverage |
| Native Born | 173 (94.5%) | 10 (5.5%) |
| Foreign Born, Citizen | 292 (93.3%) | 21 (6.7%) |
| Foreign Born, not a Citizen | 129 (65.5%) | 68 (34.5%) |
Health Insurance Coverage by Household Income in Kimball
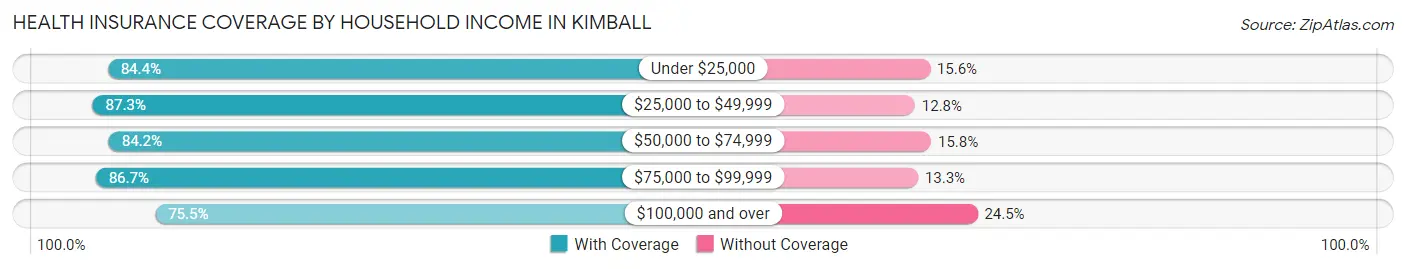
| Household Income | With Coverage | Without Coverage |
| Under $25,000 | 271 (84.4%) | 50 (15.6%) |
| $25,000 to $49,999 | 349 (87.3%) | 51 (12.8%) |
| $50,000 to $74,999 | 379 (84.2%) | 71 (15.8%) |
| $75,000 to $99,999 | 377 (86.7%) | 58 (13.3%) |
| $100,000 and over | 361 (75.5%) | 117 (24.5%) |
Public vs Private Health Insurance Coverage by Age in Kimball
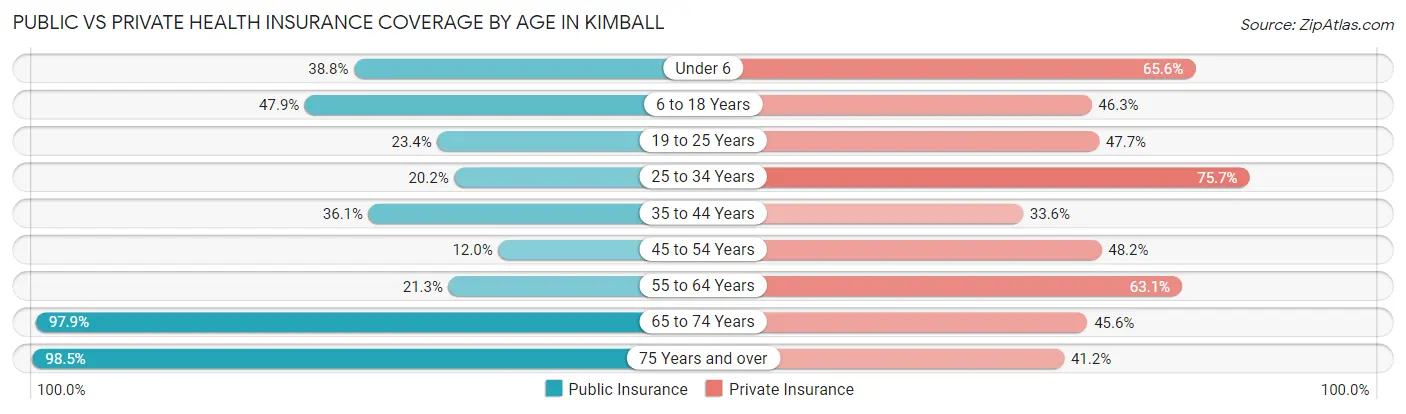
| Age Bracket | Public Insurance | Private Insurance |
| Under 6 | 71 (38.8%) | 120 (65.6%) |
| 6 to 18 Years | 150 (47.9%) | 145 (46.3%) |
| 19 to 25 Years | 46 (23.4%) | 94 (47.7%) |
| 25 to 34 Years | 39 (20.2%) | 146 (75.6%) |
| 35 to 44 Years | 87 (36.1%) | 81 (33.6%) |
| 45 to 54 Years | 23 (12.0%) | 92 (48.2%) |
| 55 to 64 Years | 64 (21.3%) | 190 (63.1%) |
| 65 to 74 Years | 187 (97.9%) | 87 (45.6%) |
| 75 Years and over | 270 (98.5%) | 113 (41.2%) |
| Total | 937 (45.0%) | 1,068 (51.2%) |
Disability Status by Sex by Age in Kimball
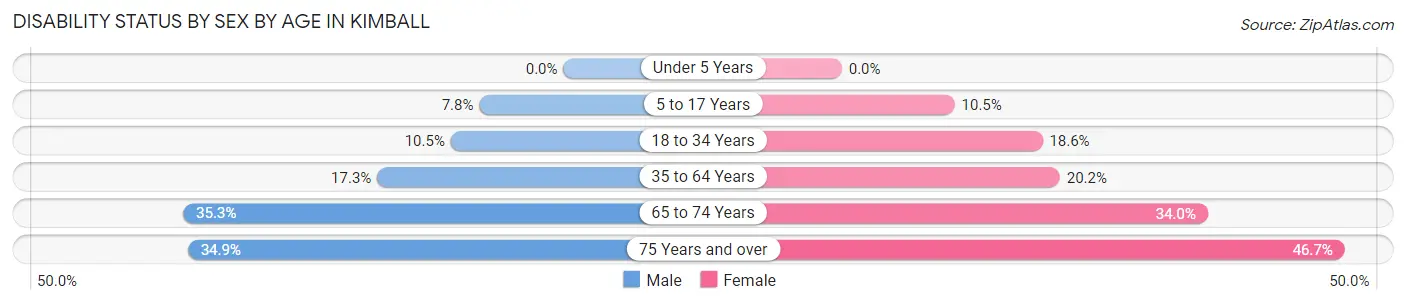
| Age Bracket | Male | Female |
| Under 5 Years | 0 (0.0%) | 0 (0.0%) |
| 5 to 17 Years | 16 (7.8%) | 18 (10.5%) |
| 18 to 34 Years | 23 (10.4%) | 35 (18.6%) |
| 35 to 64 Years | 66 (17.3%) | 71 (20.2%) |
| 65 to 74 Years | 30 (35.3%) | 36 (34.0%) |
| 75 Years and over | 38 (34.9%) | 77 (46.7%) |
Disability Class by Sex by Age in Kimball
Disability Class: Hearing Difficulty
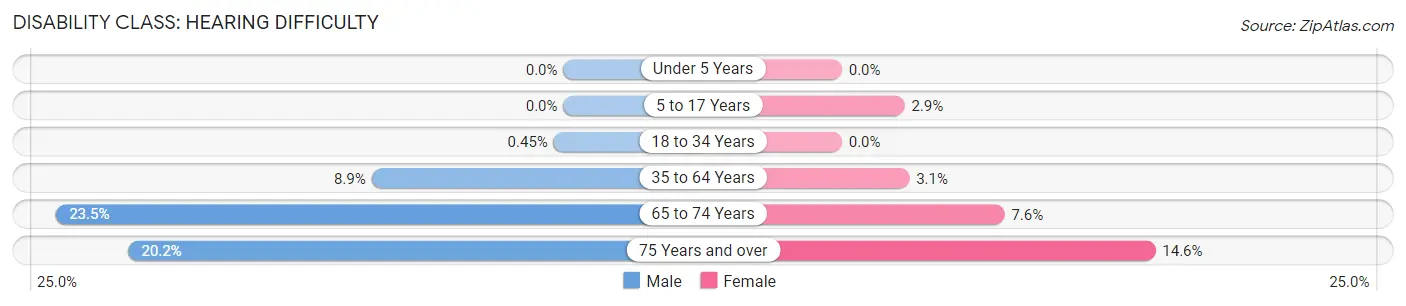
| Age Bracket | Male | Female |
| Under 5 Years | 0 (0.0%) | 0 (0.0%) |
| 5 to 17 Years | 0 (0.0%) | 5 (2.9%) |
| 18 to 34 Years | 1 (0.4%) | 0 (0.0%) |
| 35 to 64 Years | 34 (8.9%) | 11 (3.1%) |
| 65 to 74 Years | 20 (23.5%) | 8 (7.5%) |
| 75 Years and over | 22 (20.2%) | 24 (14.5%) |
Disability Class: Vision Difficulty
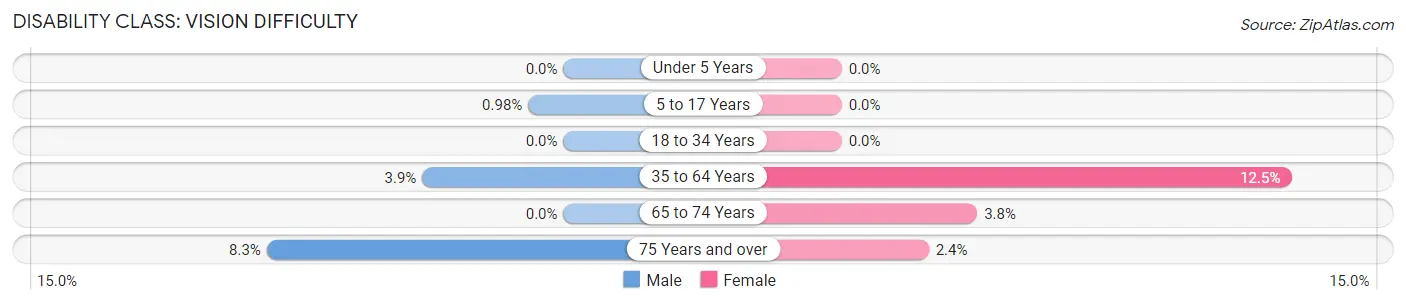
| Age Bracket | Male | Female |
| Under 5 Years | 0 (0.0%) | 0 (0.0%) |
| 5 to 17 Years | 2 (1.0%) | 0 (0.0%) |
| 18 to 34 Years | 0 (0.0%) | 0 (0.0%) |
| 35 to 64 Years | 15 (3.9%) | 44 (12.5%) |
| 65 to 74 Years | 0 (0.0%) | 4 (3.8%) |
| 75 Years and over | 9 (8.3%) | 4 (2.4%) |
Disability Class: Cognitive Difficulty
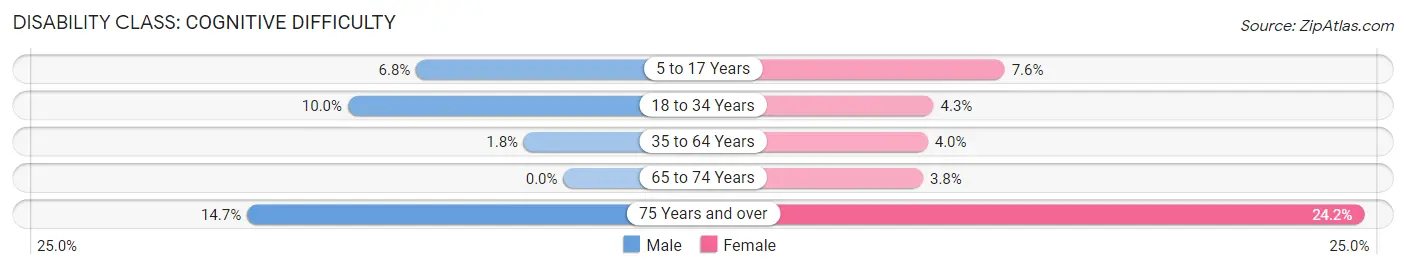
| Age Bracket | Male | Female |
| 5 to 17 Years | 14 (6.8%) | 13 (7.6%) |
| 18 to 34 Years | 22 (10.0%) | 8 (4.3%) |
| 35 to 64 Years | 7 (1.8%) | 14 (4.0%) |
| 65 to 74 Years | 0 (0.0%) | 4 (3.8%) |
| 75 Years and over | 16 (14.7%) | 40 (24.2%) |
Disability Class: Ambulatory Difficulty
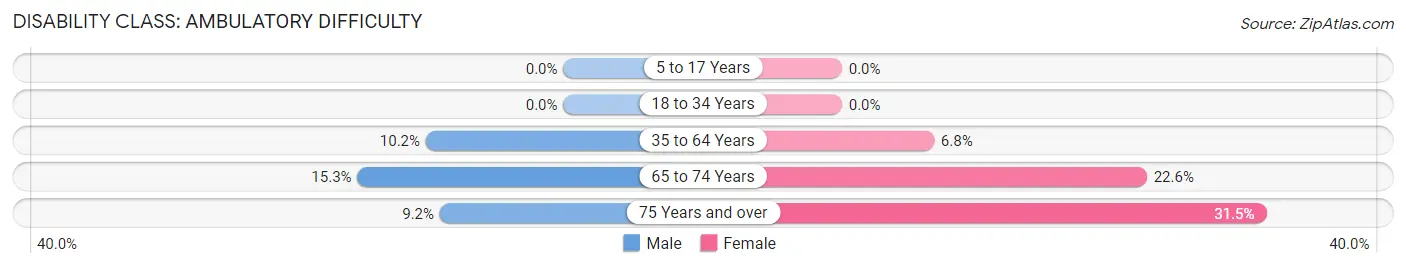
| Age Bracket | Male | Female |
| 5 to 17 Years | 0 (0.0%) | 0 (0.0%) |
| 18 to 34 Years | 0 (0.0%) | 0 (0.0%) |
| 35 to 64 Years | 39 (10.2%) | 24 (6.8%) |
| 65 to 74 Years | 13 (15.3%) | 24 (22.6%) |
| 75 Years and over | 10 (9.2%) | 52 (31.5%) |
Disability Class: Self-Care Difficulty
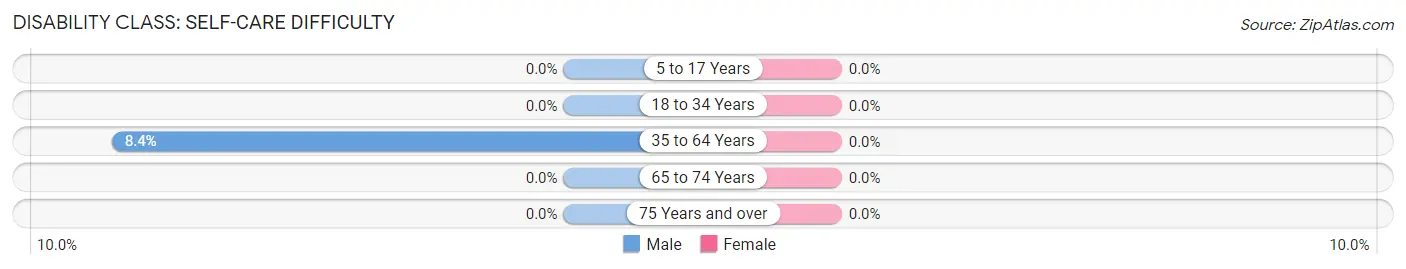
| Age Bracket | Male | Female |
| 5 to 17 Years | 0 (0.0%) | 0 (0.0%) |
| 18 to 34 Years | 0 (0.0%) | 0 (0.0%) |
| 35 to 64 Years | 32 (8.4%) | 0 (0.0%) |
| 65 to 74 Years | 0 (0.0%) | 0 (0.0%) |
| 75 Years and over | 0 (0.0%) | 0 (0.0%) |
Technology Access in Kimball
Computing Device Access in Kimball
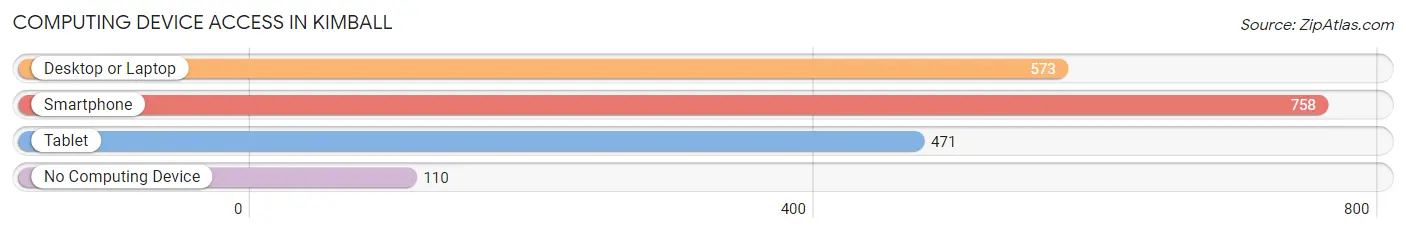
| Device Type | # Households | % Households |
| Desktop or Laptop | 573 | 60.9% |
| Smartphone | 758 | 80.5% |
| Tablet | 471 | 50.0% |
| No Computing Device | 110 | 11.7% |
| Total | 941 | 100.0% |
Internet Access in Kimball
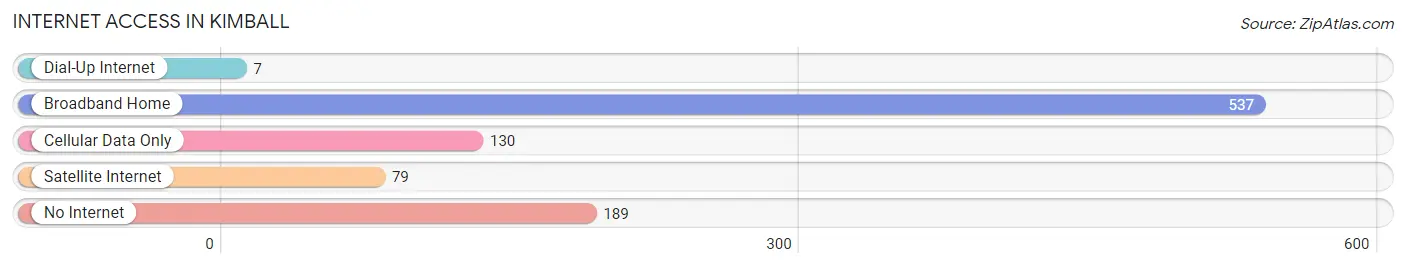
| Internet Type | # Households | % Households |
| Dial-Up Internet | 7 | 0.7% |
| Broadband Home | 537 | 57.1% |
| Cellular Data Only | 130 | 13.8% |
| Satellite Internet | 79 | 8.4% |
| No Internet | 189 | 20.1% |
| Total | 941 | 100.0% |
Kimball Summary
Kimball, Nebraska is a small city located in the southwestern corner of the state, near the Wyoming border. It is the county seat of Kimball County and has a population of approximately 2,000 people. The city was founded in 1887 and was named after railroad magnate Thomas Kimball.
Geography
Kimball is located in the High Plains region of the Great Plains, at an elevation of 4,068 feet. The city is situated on the banks of the North Platte River, which flows through the city. The city is surrounded by rolling hills and grasslands, and is located in the heart of the Nebraska Sandhills. The climate is semi-arid, with hot summers and cold winters.
Economy
Kimball’s economy is largely based on agriculture and ranching. The city is home to several large cattle ranches, as well as several smaller farms. The city is also home to several manufacturing companies, including a plastics factory and a metal fabrication plant. The city is also home to a number of retail stores, restaurants, and other businesses.
Demographics
Kimball’s population is predominantly white, with a small Hispanic population. The median household income is $41,000, and the median home value is $90,000. The city has a low unemployment rate, and the poverty rate is below the national average.
Education
Kimball is served by the Kimball Public Schools, which includes an elementary school, a middle school, and a high school. The city is also home to a branch of Western Nebraska Community College.
Culture
Kimball is home to a number of cultural attractions, including the Kimball County Historical Museum, the Kimball County Art Center, and the Kimball County Fairgrounds. The city also hosts a number of annual events, including the Kimball County Fair, the Kimball County Rodeo, and the Kimball County Music Festival.
Kimball is a small city with a rich history and a vibrant culture. It is a great place to live, work, and raise a family. The city is home to a diverse population, and offers a variety of economic opportunities. Kimball is a great place to call home.
Common Questions
What is Per Capita Income in Kimball?
Per Capita income in Kimball is $30,447.
What is the Median Family Income in Kimball?
Median Family Income in Kimball is $63,214.
What is the Median Household income in Kimball?
Median Household Income in Kimball is $47,917.
What is Income or Wage Gap in Kimball?
Income or Wage Gap in Kimball is 33.3%.
Women in Kimball earn 66.7 cents for every dollar earned by a man.
What is Inequality or Gini Index in Kimball?
Inequality or Gini Index in Kimball is 0.47.
What is the Total Population of Kimball?
Total Population of Kimball is 2,149.
What is the Total Male Population of Kimball?
Total Male Population of Kimball is 1,060.
What is the Total Female Population of Kimball?
Total Female Population of Kimball is 1,089.
What is the Ratio of Males per 100 Females in Kimball?
There are 97.34 Males per 100 Females in Kimball.
What is the Ratio of Females per 100 Males in Kimball?
There are 102.74 Females per 100 Males in Kimball.
What is the Median Population Age in Kimball?
Median Population Age in Kimball is 41.6 Years.
What is the Average Family Size in Kimball
Average Family Size in Kimball is 3.1 People.
What is the Average Household Size in Kimball
Average Household Size in Kimball is 2.2 People.
How Large is the Labor Force in Kimball?
There are 1,065 People in the Labor Forcein in Kimball.
What is the Percentage of People in the Labor Force in Kimball?
62.3% of People are in the Labor Force in Kimball.
What is the Unemployment Rate in Kimball?
Unemployment Rate in Kimball is 2.1%.