Humphrey, NE Map & Demographics
Humphrey Map
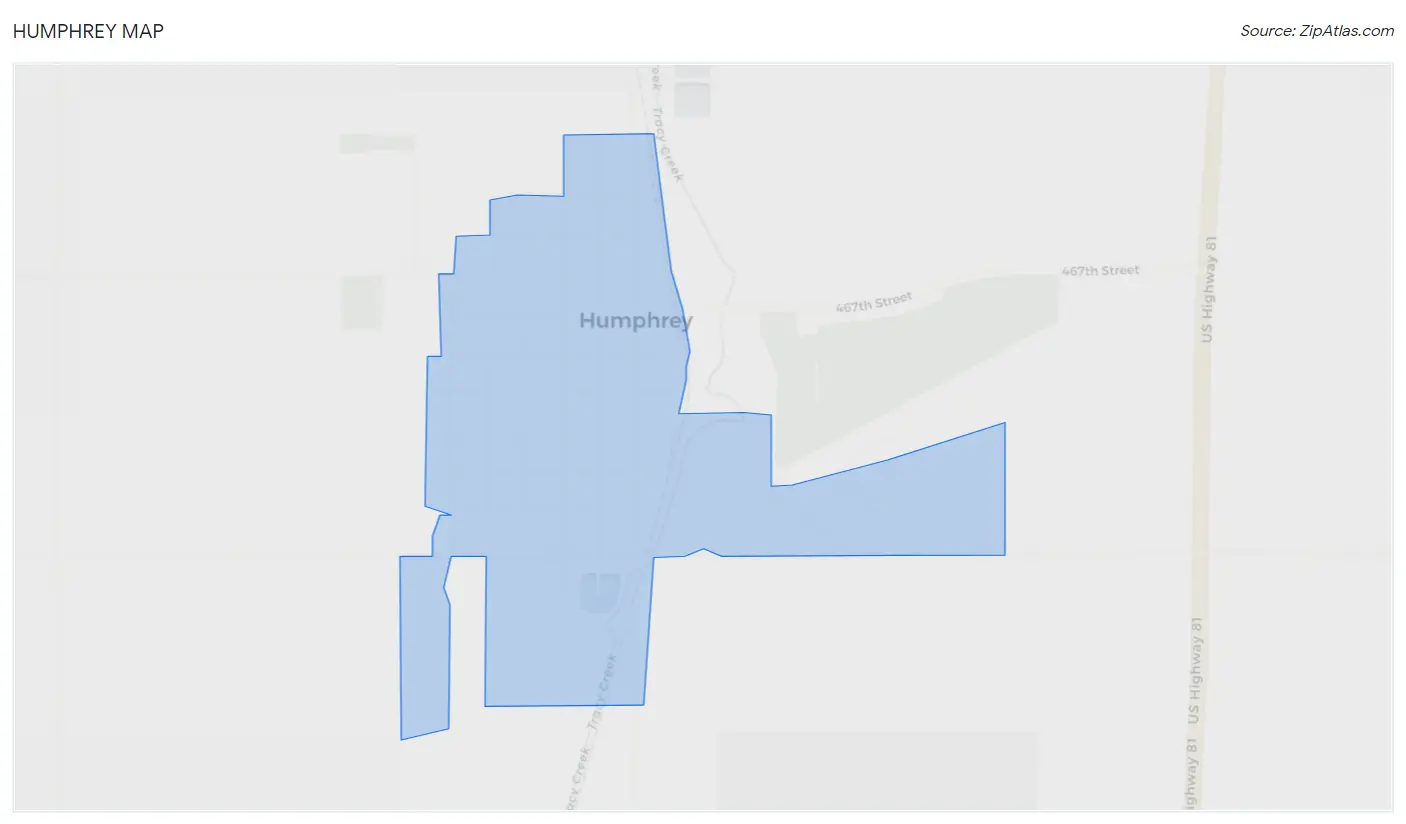
Humphrey Overview
$36,581
PER CAPITA INCOME
$106,094
AVG FAMILY INCOME
$67,750
AVG HOUSEHOLD INCOME
23.7%
WAGE / INCOME GAP [ % ]
76.3¢/ $1
WAGE / INCOME GAP [ $ ]
0.36
INEQUALITY / GINI INDEX
722
TOTAL POPULATION
358
MALE POPULATION
364
FEMALE POPULATION
98.35
MALES / 100 FEMALES
101.68
FEMALES / 100 MALES
35.9
MEDIAN AGE
3.0
AVG FAMILY SIZE
2.1
AVG HOUSEHOLD SIZE
387
LABOR FORCE [ PEOPLE ]
69.2%
PERCENT IN LABOR FORCE
1.6%
UNEMPLOYMENT RATE
Humphrey Zip Codes
Humphrey Area Codes
Income in Humphrey
Income Overview in Humphrey
Per Capita Income in Humphrey is $36,581, while median incomes of families and households are $106,094 and $67,750 respectively.
| Characteristic | Number | Measure |
| Per Capita Income | 722 | $36,581 |
| Median Family Income | 181 | $106,094 |
| Mean Family Income | 181 | $105,771 |
| Median Household Income | 336 | $67,750 |
| Mean Household Income | 336 | $77,757 |
| Income Deficit | 181 | $0 |
| Wage / Income Gap (%) | 722 | 23.66% |
| Wage / Income Gap ($) | 722 | 76.34¢ per $1 |
| Gini / Inequality Index | 722 | 0.36 |
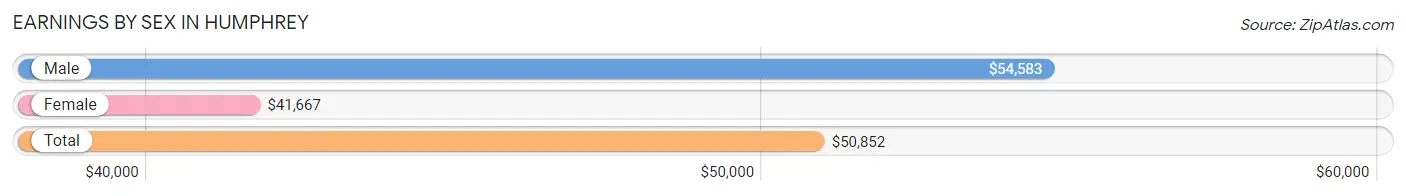
Earnings by Sex in Humphrey
Average Earnings in Humphrey are $50,852, $54,583 for men and $41,667 for women, a difference of 23.7%.
| Sex | Number | Average Earnings |
| Male | 233 (57.8%) | $54,583 |
| Female | 170 (42.2%) | $41,667 |
| Total | 403 (100.0%) | $50,852 |
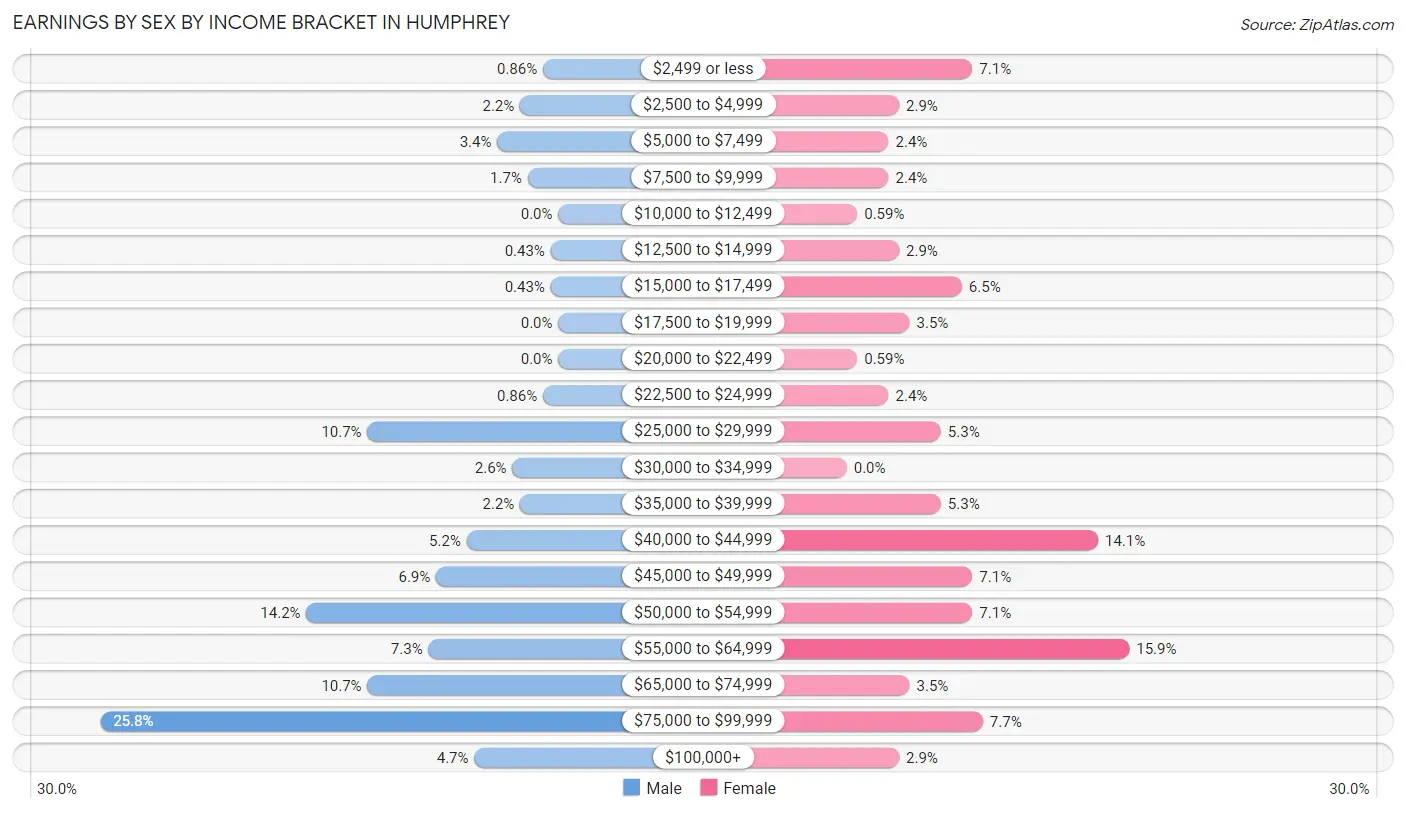
Earnings by Sex by Income Bracket in Humphrey
The most common earnings brackets in Humphrey are $75,000 to $99,999 for men (60 | 25.8%) and $55,000 to $64,999 for women (27 | 15.9%).
| Income | Male | Female |
| $2,499 or less | 2 (0.9%) | 12 (7.1%) |
| $2,500 to $4,999 | 5 (2.1%) | 5 (2.9%) |
| $5,000 to $7,499 | 8 (3.4%) | 4 (2.4%) |
| $7,500 to $9,999 | 4 (1.7%) | 4 (2.4%) |
| $10,000 to $12,499 | 0 (0.0%) | 1 (0.6%) |
| $12,500 to $14,999 | 1 (0.4%) | 5 (2.9%) |
| $15,000 to $17,499 | 1 (0.4%) | 11 (6.5%) |
| $17,500 to $19,999 | 0 (0.0%) | 6 (3.5%) |
| $20,000 to $22,499 | 0 (0.0%) | 1 (0.6%) |
| $22,500 to $24,999 | 2 (0.9%) | 4 (2.4%) |
| $25,000 to $29,999 | 25 (10.7%) | 9 (5.3%) |
| $30,000 to $34,999 | 6 (2.6%) | 0 (0.0%) |
| $35,000 to $39,999 | 5 (2.1%) | 9 (5.3%) |
| $40,000 to $44,999 | 12 (5.1%) | 24 (14.1%) |
| $45,000 to $49,999 | 16 (6.9%) | 12 (7.1%) |
| $50,000 to $54,999 | 33 (14.2%) | 12 (7.1%) |
| $55,000 to $64,999 | 17 (7.3%) | 27 (15.9%) |
| $65,000 to $74,999 | 25 (10.7%) | 6 (3.5%) |
| $75,000 to $99,999 | 60 (25.8%) | 13 (7.6%) |
| $100,000+ | 11 (4.7%) | 5 (2.9%) |
| Total | 233 (100.0%) | 170 (100.0%) |
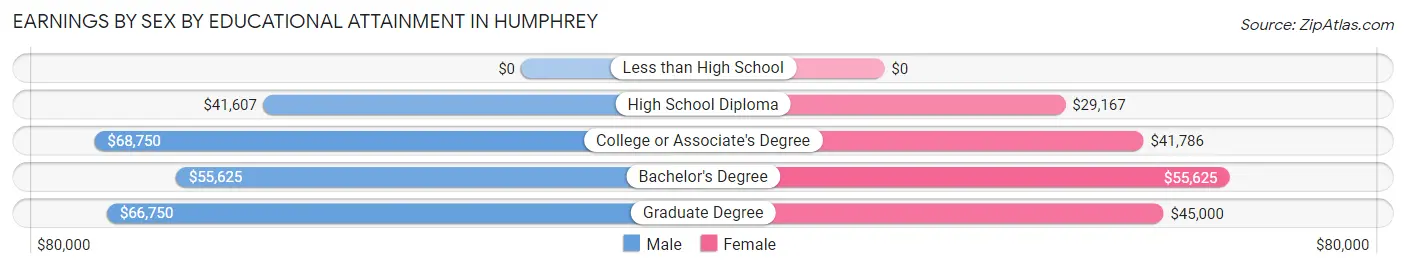
Earnings by Sex by Educational Attainment in Humphrey
Average earnings in Humphrey are $57,500 for men and $45,417 for women, a difference of 21.0%. Men with an educational attainment of college or associate's degree enjoy the highest average annual earnings of $68,750, while those with high school diploma education earn the least with $41,607. Women with an educational attainment of bachelor's degree earn the most with the average annual earnings of $55,625, while those with high school diploma education have the smallest earnings of $29,167.
| Educational Attainment | Male Income | Female Income |
| Less than High School | - | - |
| High School Diploma | $41,607 | $29,167 |
| College or Associate's Degree | $68,750 | $41,786 |
| Bachelor's Degree | $55,625 | $55,625 |
| Graduate Degree | $66,750 | $45,000 |
| Total | $57,500 | $45,417 |
Family Income in Humphrey
Family Income Brackets in Humphrey
According to the Humphrey family income data, there are 71 families falling into the $100,000 to $149,999 income range, which is the most common income bracket and makes up 39.2% of all families. Conversely, the $25,000 to $34,999 income bracket is the least frequent group with only 2 families (1.1%) belonging to this category.
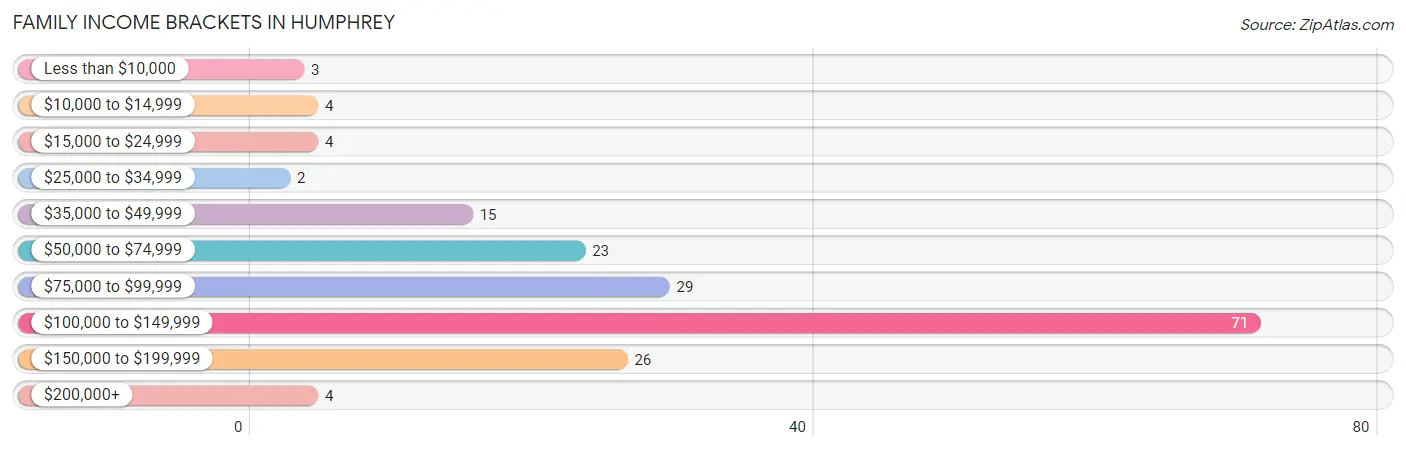
| Income Bracket | # Families | % Families |
| Less than $10,000 | 3 | 1.7% |
| $10,000 to $14,999 | 4 | 2.2% |
| $15,000 to $24,999 | 4 | 2.2% |
| $25,000 to $34,999 | 2 | 1.1% |
| $35,000 to $49,999 | 15 | 8.3% |
| $50,000 to $74,999 | 23 | 12.7% |
| $75,000 to $99,999 | 29 | 16.0% |
| $100,000 to $149,999 | 71 | 39.2% |
| $150,000 to $199,999 | 26 | 14.4% |
| $200,000+ | 4 | 2.2% |
Family Income by Famaliy Size in Humphrey
5-person families (23 | 12.7%) account for the highest median family income in Humphrey with $156,406 per family, while 2-person families (97 | 53.6%) have the highest median income of $48,625 per family member.
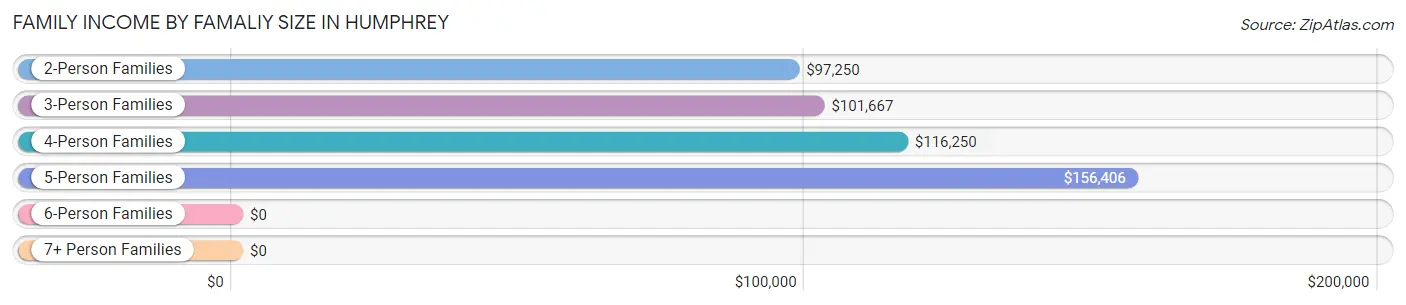
| Income Bracket | # Families | Median Income |
| 2-Person Families | 97 (53.6%) | $97,250 |
| 3-Person Families | 34 (18.8%) | $101,667 |
| 4-Person Families | 23 (12.7%) | $116,250 |
| 5-Person Families | 23 (12.7%) | $156,406 |
| 6-Person Families | 4 (2.2%) | $0 |
| 7+ Person Families | 0 (0.0%) | $0 |
| Total | 181 (100.0%) | $106,094 |
Family Income by Number of Earners in Humphrey
The median family income in Humphrey is $106,094, with families comprising 3+ earners (14) having the highest median family income of $162,500, while families with 1 earner (39) have the lowest median family income of $51,875, accounting for 7.7% and 21.5% of families, respectively.
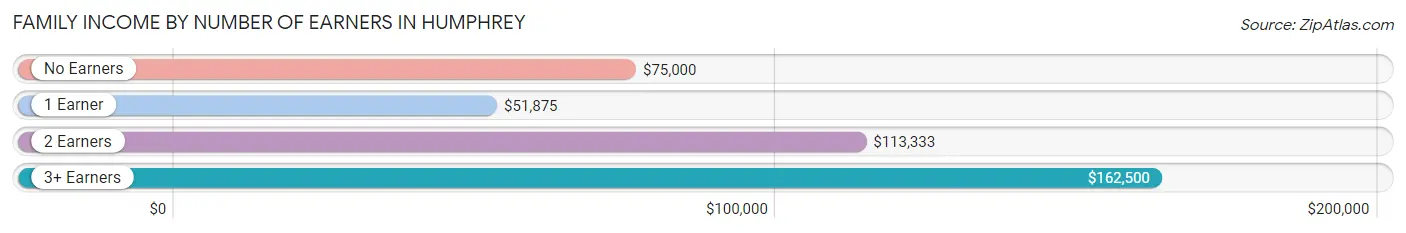
| Number of Earners | # Families | Median Income |
| No Earners | 18 (9.9%) | $75,000 |
| 1 Earner | 39 (21.5%) | $51,875 |
| 2 Earners | 110 (60.8%) | $113,333 |
| 3+ Earners | 14 (7.7%) | $162,500 |
| Total | 181 (100.0%) | $106,094 |
Household Income in Humphrey
Household Income Brackets in Humphrey
With 79 households falling in the category, the $100,000 to $149,999 income range is the most frequent in Humphrey, accounting for 23.5% of all households. In contrast, only 4 households (1.2%) fall into the $200,000+ income bracket, making it the least populous group.
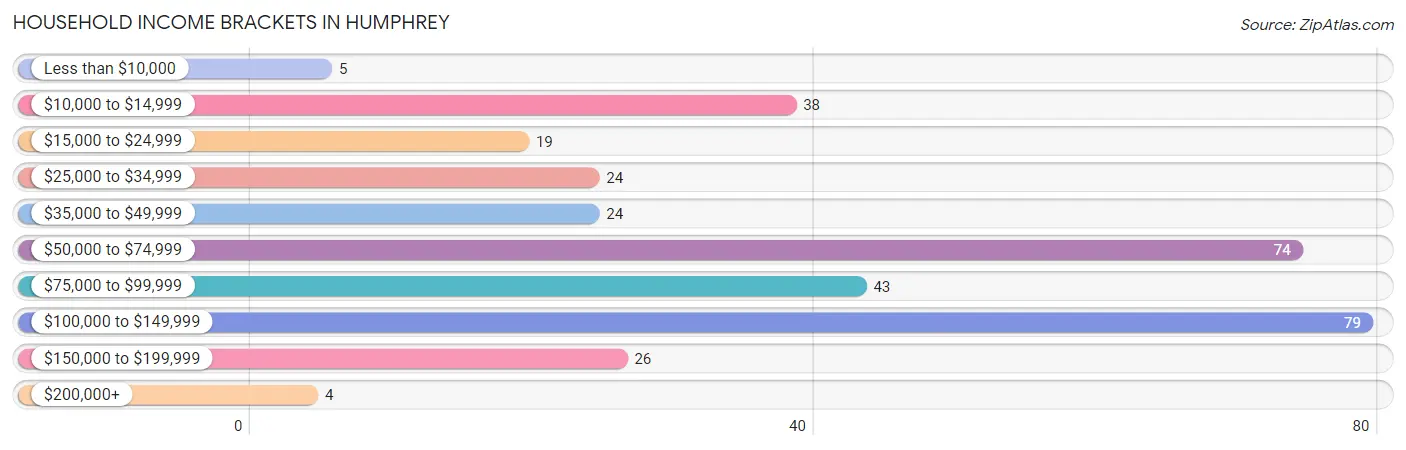
| Income Bracket | # Households | % Households |
| Less than $10,000 | 5 | 1.5% |
| $10,000 to $14,999 | 38 | 11.3% |
| $15,000 to $24,999 | 19 | 5.7% |
| $25,000 to $34,999 | 24 | 7.1% |
| $35,000 to $49,999 | 24 | 7.1% |
| $50,000 to $74,999 | 74 | 22.0% |
| $75,000 to $99,999 | 43 | 12.8% |
| $100,000 to $149,999 | 79 | 23.5% |
| $150,000 to $199,999 | 26 | 7.7% |
| $200,000+ | 4 | 1.2% |
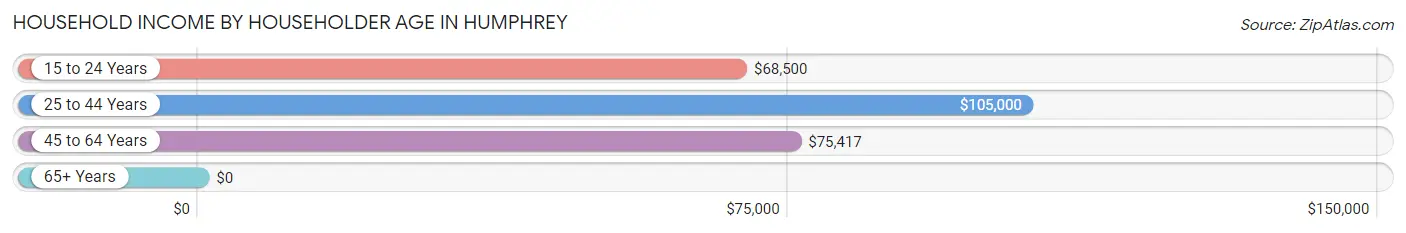
Household Income by Householder Age in Humphrey
The median household income in Humphrey is $67,750, with the highest median household income of $105,000 found in the 25 to 44 years age bracket for the primary householder. A total of 106 households (31.6%) fall into this category. Meanwhile, the 65+ years age bracket for the primary householder has the lowest median household income of $0, with 121 households (36.0%) in this group.
| Income Bracket | # Households | Median Income |
| 15 to 24 Years | 24 (7.1%) | $68,500 |
| 25 to 44 Years | 106 (31.6%) | $105,000 |
| 45 to 64 Years | 85 (25.3%) | $75,417 |
| 65+ Years | 121 (36.0%) | $0 |
| Total | 336 (100.0%) | $67,750 |
Poverty in Humphrey
Income Below Poverty by Sex and Age in Humphrey
With 5.3% poverty level for males and 8.6% for females among the residents of Humphrey, 15 year old males and 75 year old and over females are the most vulnerable to poverty, with 2 males (40.0%) and 22 females (30.6%) in their respective age groups living below the poverty level.
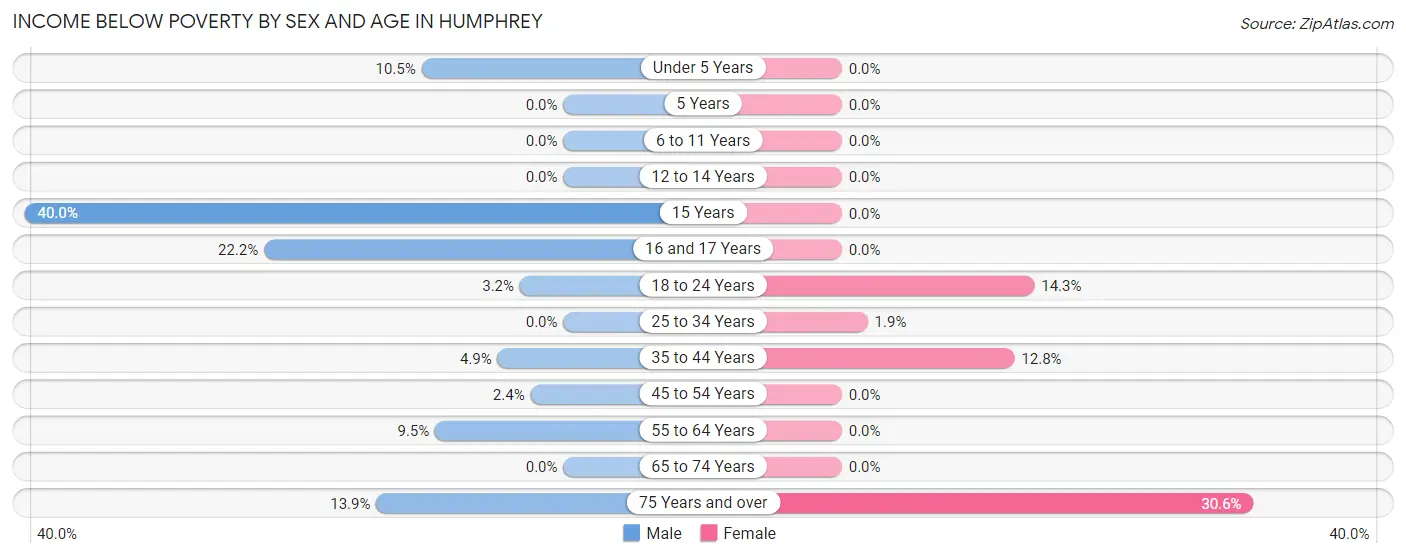
| Age Bracket | Male | Female |
| Under 5 Years | 2 (10.5%) | 0 (0.0%) |
| 5 Years | 0 (0.0%) | 0 (0.0%) |
| 6 to 11 Years | 0 (0.0%) | 0 (0.0%) |
| 12 to 14 Years | 0 (0.0%) | 0 (0.0%) |
| 15 Years | 2 (40.0%) | 0 (0.0%) |
| 16 and 17 Years | 2 (22.2%) | 0 (0.0%) |
| 18 to 24 Years | 1 (3.2%) | 3 (14.3%) |
| 25 to 34 Years | 0 (0.0%) | 1 (1.9%) |
| 35 to 44 Years | 2 (4.9%) | 5 (12.8%) |
| 45 to 54 Years | 1 (2.4%) | 0 (0.0%) |
| 55 to 64 Years | 4 (9.5%) | 0 (0.0%) |
| 65 to 74 Years | 0 (0.0%) | 0 (0.0%) |
| 75 Years and over | 5 (13.9%) | 22 (30.6%) |
| Total | 19 (5.3%) | 31 (8.6%) |
Income Above Poverty by Sex and Age in Humphrey
According to the poverty statistics in Humphrey, males aged 5 years and females aged under 5 years are the age groups that are most secure financially, with 100.0% of males and 100.0% of females in these age groups living above the poverty line.
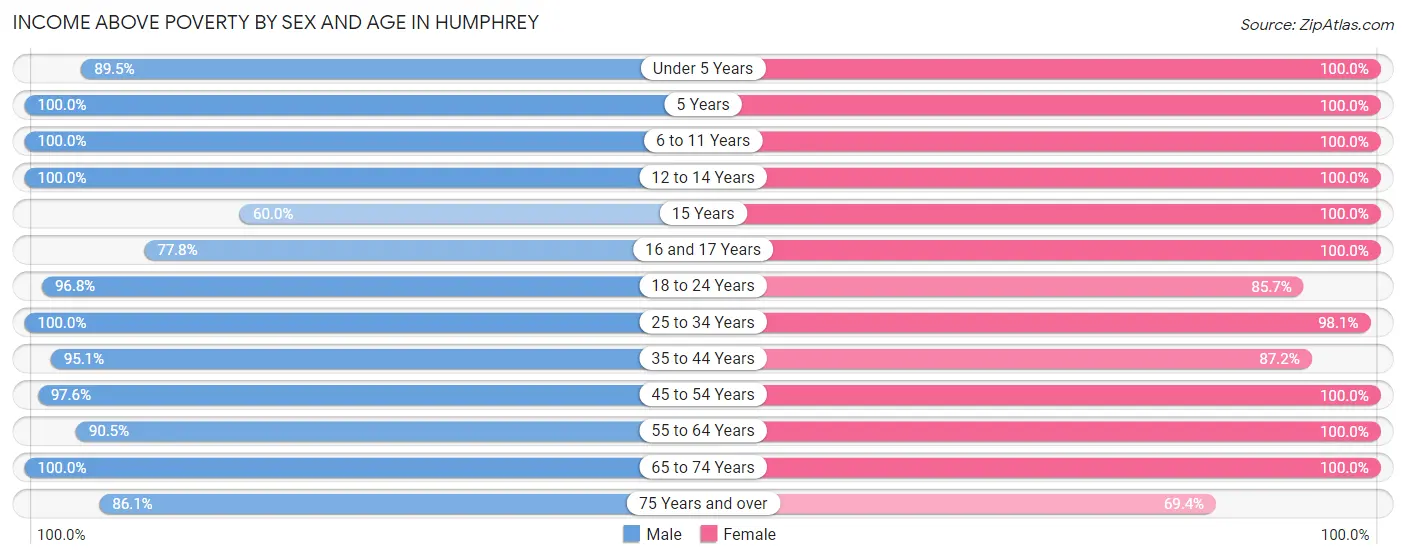
| Age Bracket | Male | Female |
| Under 5 Years | 17 (89.5%) | 46 (100.0%) |
| 5 Years | 10 (100.0%) | 12 (100.0%) |
| 6 to 11 Years | 18 (100.0%) | 28 (100.0%) |
| 12 to 14 Years | 12 (100.0%) | 7 (100.0%) |
| 15 Years | 3 (60.0%) | 3 (100.0%) |
| 16 and 17 Years | 7 (77.8%) | 6 (100.0%) |
| 18 to 24 Years | 30 (96.8%) | 18 (85.7%) |
| 25 to 34 Years | 66 (100.0%) | 51 (98.1%) |
| 35 to 44 Years | 39 (95.1%) | 34 (87.2%) |
| 45 to 54 Years | 40 (97.6%) | 32 (100.0%) |
| 55 to 64 Years | 38 (90.5%) | 22 (100.0%) |
| 65 to 74 Years | 27 (100.0%) | 22 (100.0%) |
| 75 Years and over | 31 (86.1%) | 50 (69.4%) |
| Total | 338 (94.7%) | 331 (91.4%) |
Income Below Poverty Among Married-Couple Families in Humphrey
The poverty statistics for married-couple families in Humphrey show that 1.3% or 2 of the total 160 families live below the poverty line. Families with no children have the highest poverty rate of 2.4%, comprising of 2 families. On the other hand, families with 1 or 2 children have the lowest poverty rate of 0.0%, which includes 0 families.
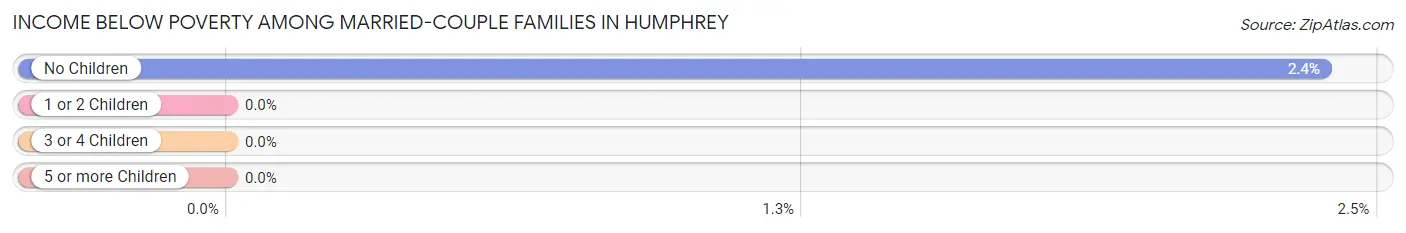
| Children | Above Poverty | Below Poverty |
| No Children | 82 (97.6%) | 2 (2.4%) |
| 1 or 2 Children | 53 (100.0%) | 0 (0.0%) |
| 3 or 4 Children | 23 (100.0%) | 0 (0.0%) |
| 5 or more Children | 0 (0.0%) | 0 (0.0%) |
| Total | 158 (98.8%) | 2 (1.3%) |
Income Below Poverty Among Single-Parent Households in Humphrey
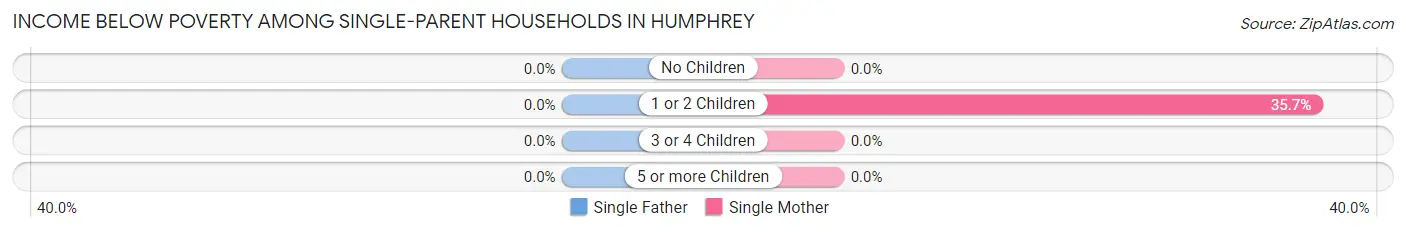
| Children | Single Father | Single Mother |
| No Children | 0 (0.0%) | 0 (0.0%) |
| 1 or 2 Children | 0 (0.0%) | 5 (35.7%) |
| 3 or 4 Children | 0 (0.0%) | 0 (0.0%) |
| 5 or more Children | 0 (0.0%) | 0 (0.0%) |
| Total | 0 (0.0%) | 5 (33.3%) |
Income Below Poverty Among Married-Couple vs Single-Parent Households in Humphrey
The poverty data for Humphrey shows that 2 of the married-couple family households (1.3%) and 5 of the single-parent households (23.8%) are living below the poverty level. Within the married-couple family households, those with no children have the highest poverty rate, with 2 households (2.4%) falling below the poverty line. Among the single-parent households, those with 1 or 2 children have the highest poverty rate, with 5 household (31.2%) living below poverty.
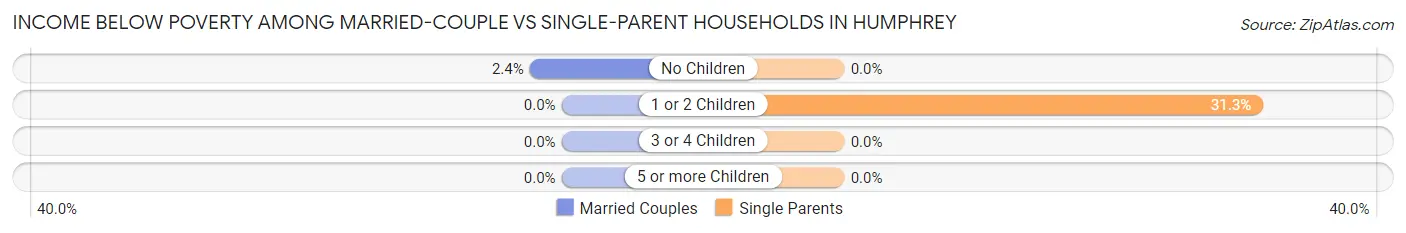
| Children | Married-Couple Families | Single-Parent Households |
| No Children | 2 (2.4%) | 0 (0.0%) |
| 1 or 2 Children | 0 (0.0%) | 5 (31.2%) |
| 3 or 4 Children | 0 (0.0%) | 0 (0.0%) |
| 5 or more Children | 0 (0.0%) | 0 (0.0%) |
| Total | 2 (1.3%) | 5 (23.8%) |
Race in Humphrey
The most populous races in Humphrey are White / Caucasian (695 | 96.3%), Two or more Races (17 | 2.4%), and Some other Race (7 | 1.0%).
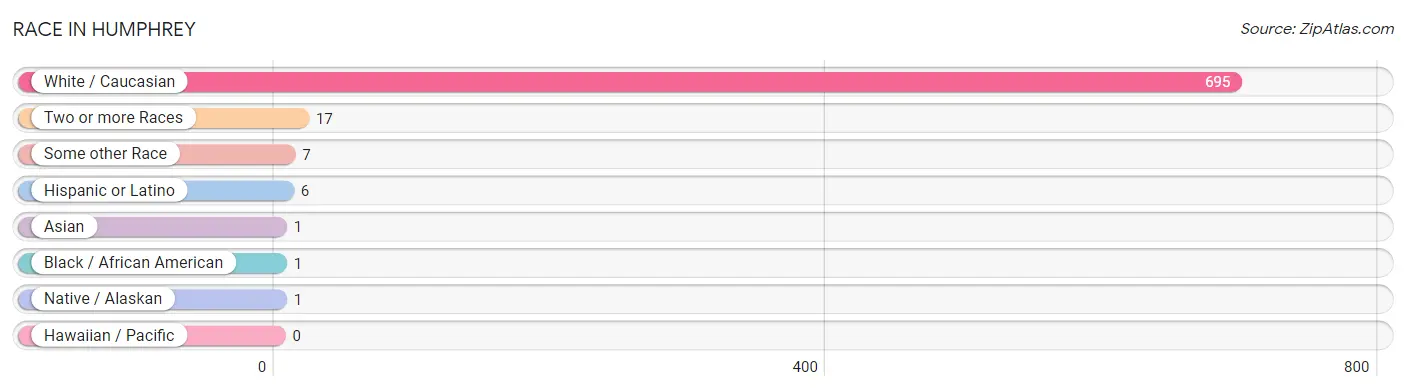
| Race | # Population | % Population |
| Asian | 1 | 0.1% |
| Black / African American | 1 | 0.1% |
| Hawaiian / Pacific | 0 | 0.0% |
| Hispanic or Latino | 6 | 0.8% |
| Native / Alaskan | 1 | 0.1% |
| White / Caucasian | 695 | 96.3% |
| Two or more Races | 17 | 2.4% |
| Some other Race | 7 | 1.0% |
| Total | 722 | 100.0% |
Ancestry in Humphrey
The most populous ancestries reported in Humphrey are German (399 | 55.3%), American (93 | 12.9%), Polish (71 | 9.8%), Irish (39 | 5.4%), and Czech (23 | 3.2%), together accounting for 86.6% of all Humphrey residents.
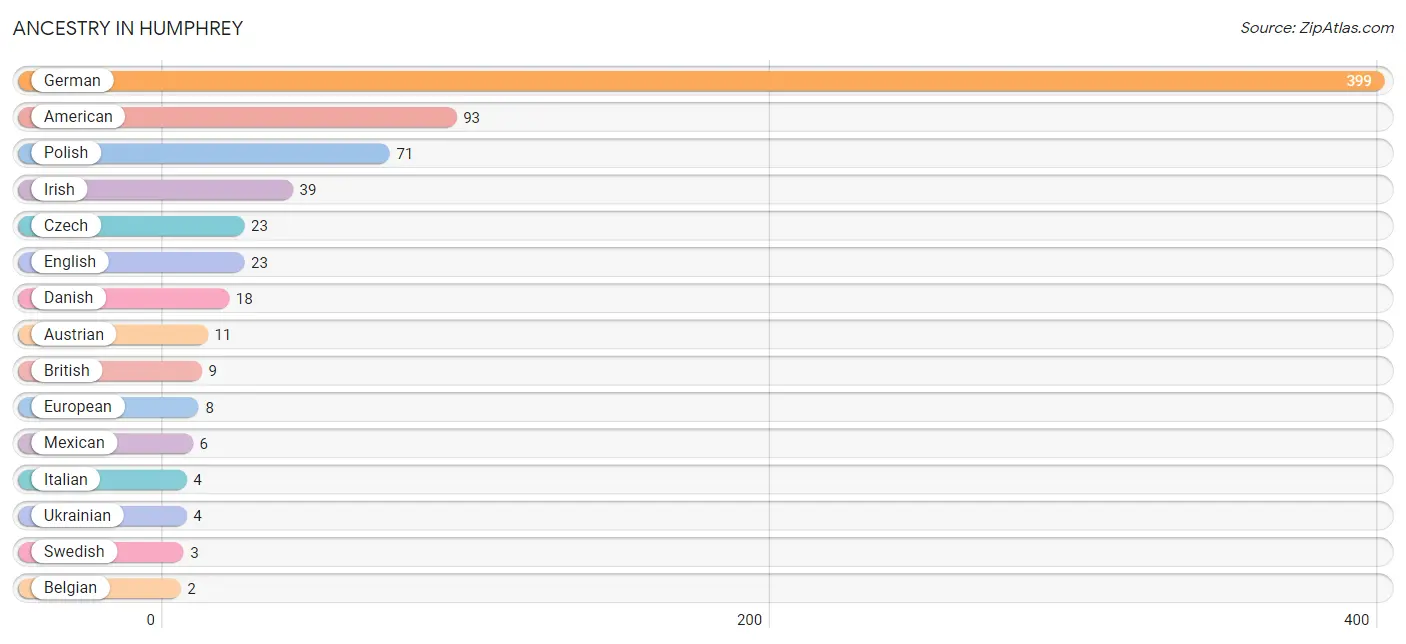
| Ancestry | # Population | % Population |
| American | 93 | 12.9% |
| Austrian | 11 | 1.5% |
| Belgian | 2 | 0.3% |
| British | 9 | 1.3% |
| Cherokee | 1 | 0.1% |
| Czech | 23 | 3.2% |
| Danish | 18 | 2.5% |
| English | 23 | 3.2% |
| European | 8 | 1.1% |
| French | 2 | 0.3% |
| German | 399 | 55.3% |
| Irish | 39 | 5.4% |
| Italian | 4 | 0.5% |
| Korean | 1 | 0.1% |
| Mexican | 6 | 0.8% |
| Norwegian | 2 | 0.3% |
| Polish | 71 | 9.8% |
| Russian | 2 | 0.3% |
| Scottish | 1 | 0.1% |
| Swedish | 3 | 0.4% |
| Ukrainian | 4 | 0.5% | View All 21 Rows |
Immigrants in Humphrey
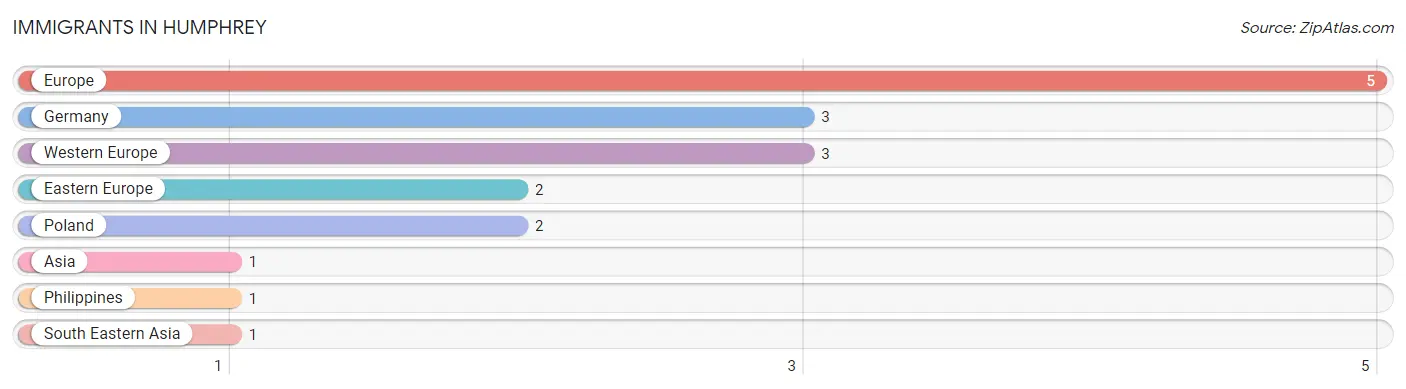
The most numerous immigrant groups reported in Humphrey came from Europe (5 | 0.7%), Germany (3 | 0.4%), Western Europe (3 | 0.4%), Eastern Europe (2 | 0.3%), and Poland (2 | 0.3%), together accounting for 2.1% of all Humphrey residents.
| Immigration Origin | # Population | % Population |
| Asia | 1 | 0.1% |
| Eastern Europe | 2 | 0.3% |
| Europe | 5 | 0.7% |
| Germany | 3 | 0.4% |
| Philippines | 1 | 0.1% |
| Poland | 2 | 0.3% |
| South Eastern Asia | 1 | 0.1% |
| Western Europe | 3 | 0.4% | View All 8 Rows |
Sex and Age in Humphrey
Sex and Age in Humphrey
The most populous age groups in Humphrey are 25 to 29 Years (39 | 10.9%) for men and 85 Years and over (59 | 16.2%) for women.
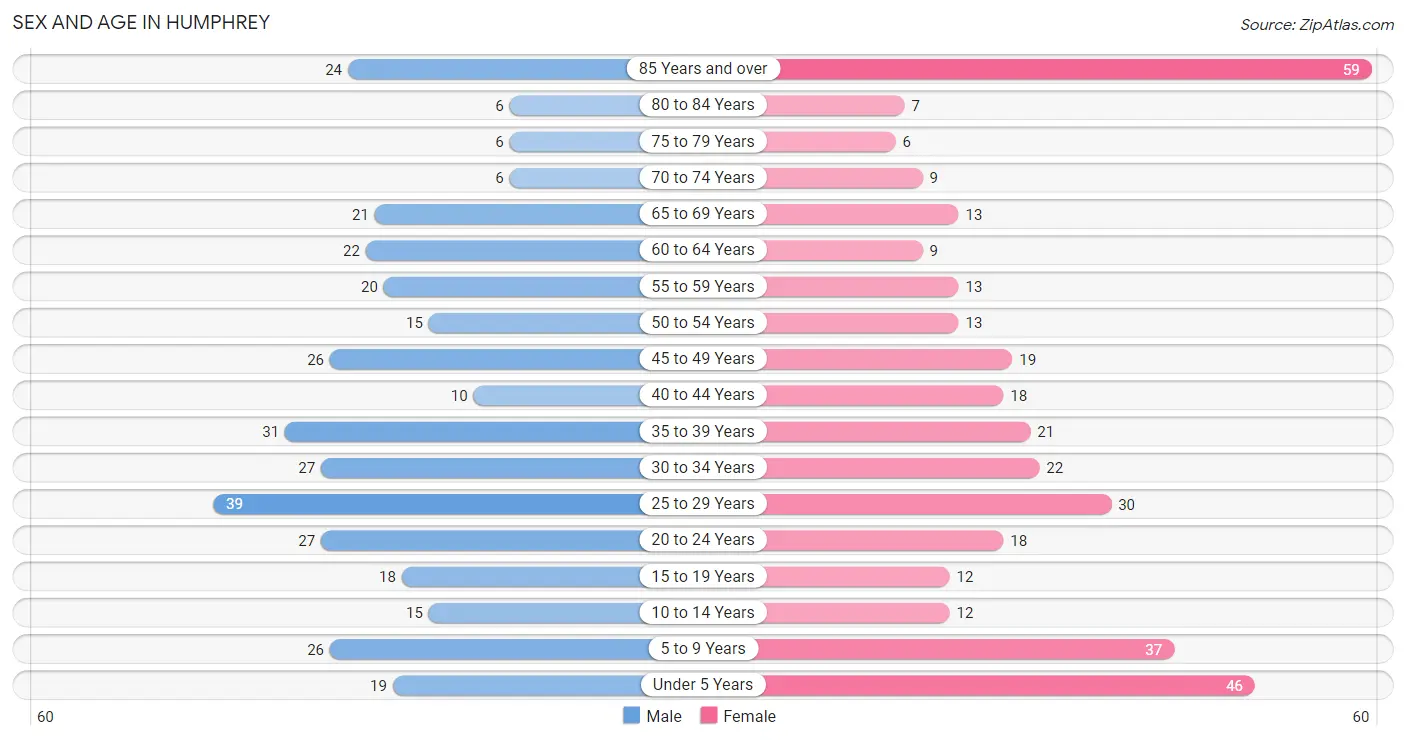
| Age Bracket | Male | Female |
| Under 5 Years | 19 (5.3%) | 46 (12.6%) |
| 5 to 9 Years | 26 (7.3%) | 37 (10.2%) |
| 10 to 14 Years | 15 (4.2%) | 12 (3.3%) |
| 15 to 19 Years | 18 (5.0%) | 12 (3.3%) |
| 20 to 24 Years | 27 (7.5%) | 18 (5.0%) |
| 25 to 29 Years | 39 (10.9%) | 30 (8.2%) |
| 30 to 34 Years | 27 (7.5%) | 22 (6.0%) |
| 35 to 39 Years | 31 (8.7%) | 21 (5.8%) |
| 40 to 44 Years | 10 (2.8%) | 18 (5.0%) |
| 45 to 49 Years | 26 (7.3%) | 19 (5.2%) |
| 50 to 54 Years | 15 (4.2%) | 13 (3.6%) |
| 55 to 59 Years | 20 (5.6%) | 13 (3.6%) |
| 60 to 64 Years | 22 (6.1%) | 9 (2.5%) |
| 65 to 69 Years | 21 (5.9%) | 13 (3.6%) |
| 70 to 74 Years | 6 (1.7%) | 9 (2.5%) |
| 75 to 79 Years | 6 (1.7%) | 6 (1.7%) |
| 80 to 84 Years | 6 (1.7%) | 7 (1.9%) |
| 85 Years and over | 24 (6.7%) | 59 (16.2%) |
| Total | 358 (100.0%) | 364 (100.0%) |
Families and Households in Humphrey
Median Family Size in Humphrey
The median family size in Humphrey is 3.02 persons per family, with married-couple families (160 | 88.4%) accounting for the largest median family size of 3.13 persons per family. On the other hand, single female/mother families (15 | 8.3%) represent the smallest median family size with 2.07 persons per family.
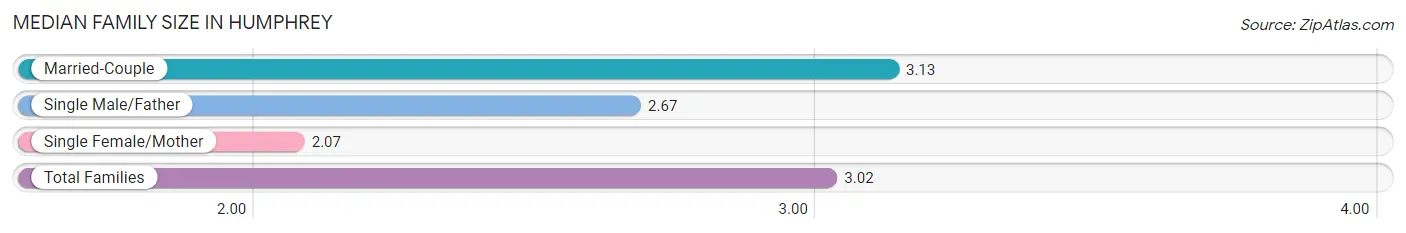
| Family Type | # Families | Family Size |
| Married-Couple | 160 (88.4%) | 3.13 |
| Single Male/Father | 6 (3.3%) | 2.67 |
| Single Female/Mother | 15 (8.3%) | 2.07 |
| Total Families | 181 (100.0%) | 3.02 |
Median Household Size in Humphrey
The median household size in Humphrey is 2.13 persons per household, with single male/father households (6 | 1.8%) accounting for the largest median household size of 3.33 persons per household. non-family households (155 | 46.1%) represent the smallest median household size with 1.05 persons per household.
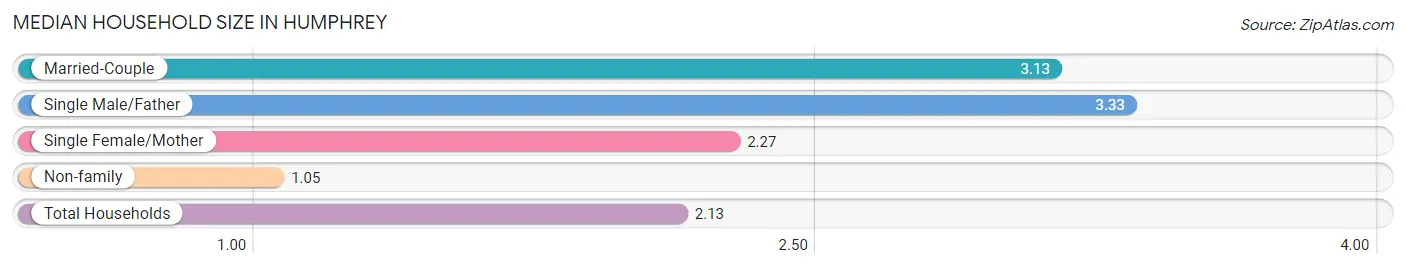
| Household Type | # Households | Household Size |
| Married-Couple | 160 (47.6%) | 3.13 |
| Single Male/Father | 6 (1.8%) | 3.33 |
| Single Female/Mother | 15 (4.5%) | 2.27 |
| Non-family | 155 (46.1%) | 1.05 |
| Total Households | 336 (100.0%) | 2.13 |
Household Size by Marriage Status in Humphrey
Out of a total of 336 households in Humphrey, 181 (53.9%) are family households, while 155 (46.1%) are nonfamily households. The most numerous type of family households are 2-person households, comprising 95, and the most common type of nonfamily households are 1-person households, comprising 150.
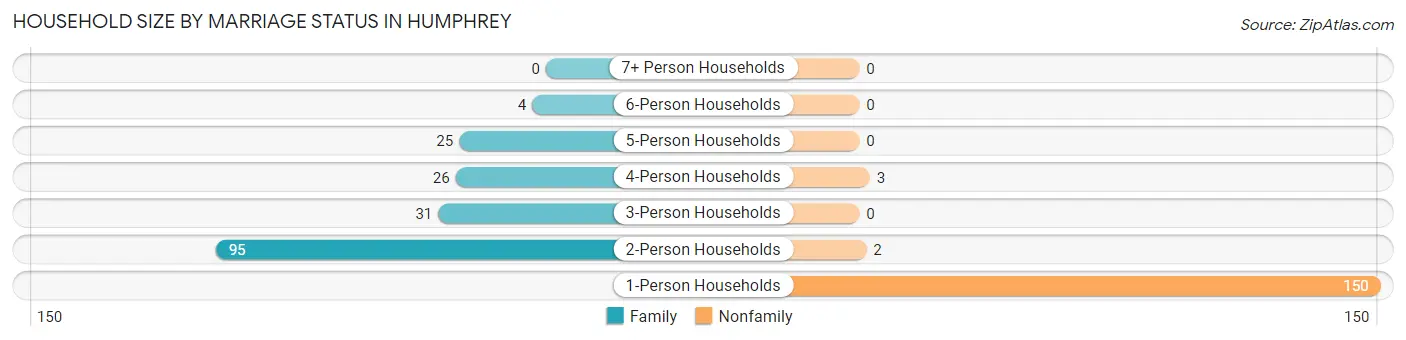
| Household Size | Family Households | Nonfamily Households |
| 1-Person Households | - | 150 (44.6%) |
| 2-Person Households | 95 (28.3%) | 2 (0.6%) |
| 3-Person Households | 31 (9.2%) | 0 (0.0%) |
| 4-Person Households | 26 (7.7%) | 3 (0.9%) |
| 5-Person Households | 25 (7.4%) | 0 (0.0%) |
| 6-Person Households | 4 (1.2%) | 0 (0.0%) |
| 7+ Person Households | 0 (0.0%) | 0 (0.0%) |
| Total | 181 (53.9%) | 155 (46.1%) |
Female Fertility in Humphrey
Fertility by Age in Humphrey
Average fertility rate in Humphrey is 155.0 births per 1,000 women. Women in the age bracket of 20 to 34 years have the highest fertility rate with 286.0 births per 1,000 women. Women in the age bracket of 20 to 34 years acount for 90.9% of all women with births.
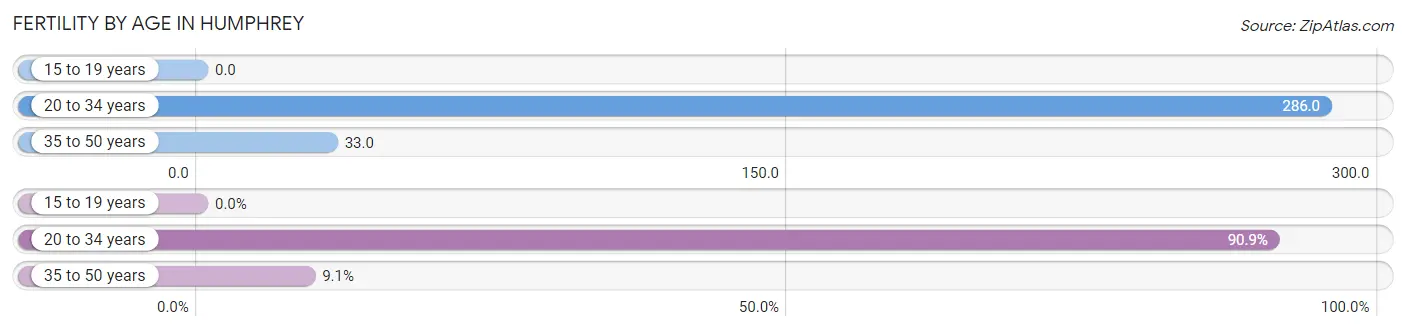
| Age Bracket | Women with Births | Births / 1,000 Women |
| 15 to 19 years | 0 (0.0%) | 0.0 |
| 20 to 34 years | 20 (90.9%) | 286.0 |
| 35 to 50 years | 2 (9.1%) | 33.0 |
| Total | 22 (100.0%) | 155.0 |
Fertility by Age by Marriage Status in Humphrey
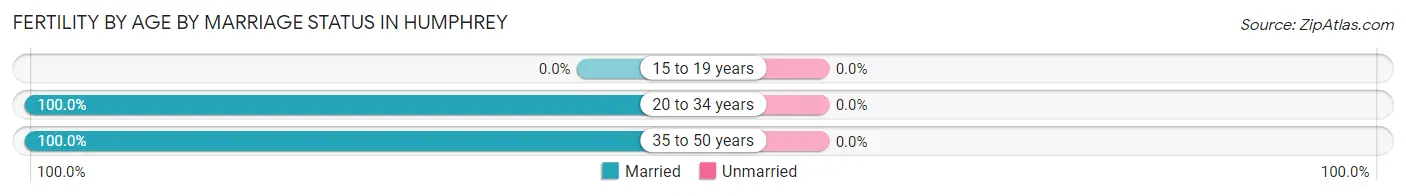
| Age Bracket | Married | Unmarried |
| 15 to 19 years | 0 (0.0%) | 0 (0.0%) |
| 20 to 34 years | 20 (100.0%) | 0 (0.0%) |
| 35 to 50 years | 2 (100.0%) | 0 (0.0%) |
| Total | 22 (100.0%) | 0 (0.0%) |
Fertility by Education in Humphrey
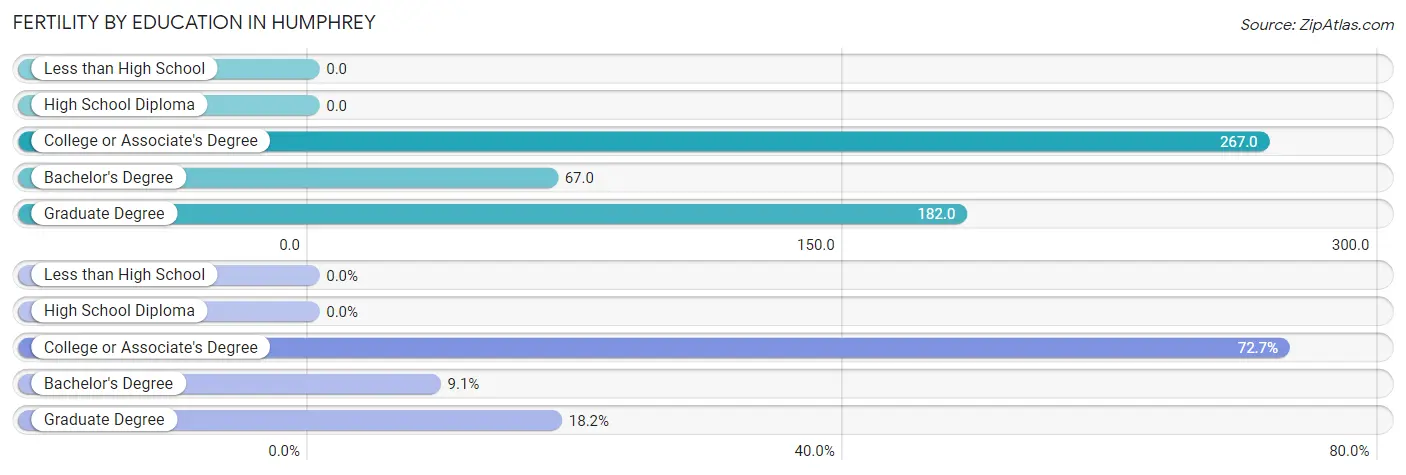
| Educational Attainment | Women with Births | Births / 1,000 Women |
| Less than High School | 0 (0.0%) | 0.0 |
| High School Diploma | 0 (0.0%) | 0.0 |
| College or Associate's Degree | 16 (72.7%) | 267.0 |
| Bachelor's Degree | 2 (9.1%) | 67.0 |
| Graduate Degree | 4 (18.2%) | 182.0 |
| Total | 22 (100.0%) | 155.0 |
Fertility by Education by Marriage Status in Humphrey
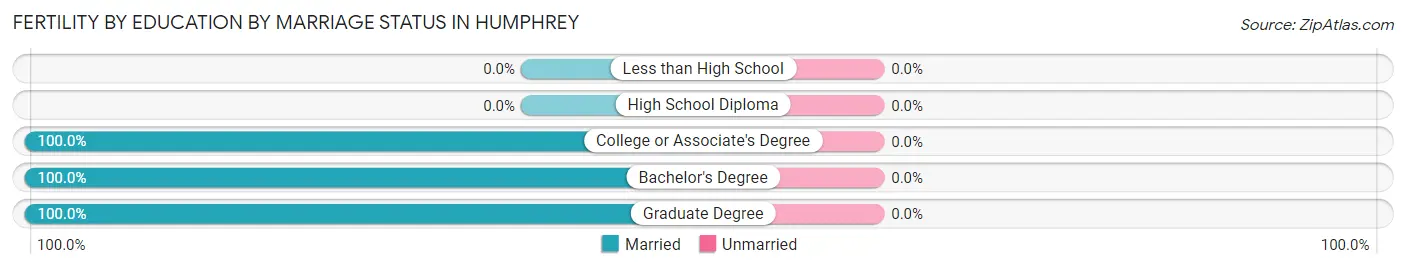
| Educational Attainment | Married | Unmarried |
| Less than High School | 0 (0.0%) | 0 (0.0%) |
| High School Diploma | 0 (0.0%) | 0 (0.0%) |
| College or Associate's Degree | 16 (100.0%) | 0 (0.0%) |
| Bachelor's Degree | 2 (100.0%) | 0 (0.0%) |
| Graduate Degree | 4 (100.0%) | 0 (0.0%) |
| Total | 22 (100.0%) | 0 (0.0%) |
Employment Characteristics in Humphrey
Employment by Class of Employer in Humphrey
Among the 374 employed individuals in Humphrey, private company employees (269 | 71.9%), not-for-profit organizations (34 | 9.1%), and self-employed (not incorporated) (31 | 8.3%) make up the most common classes of employment.
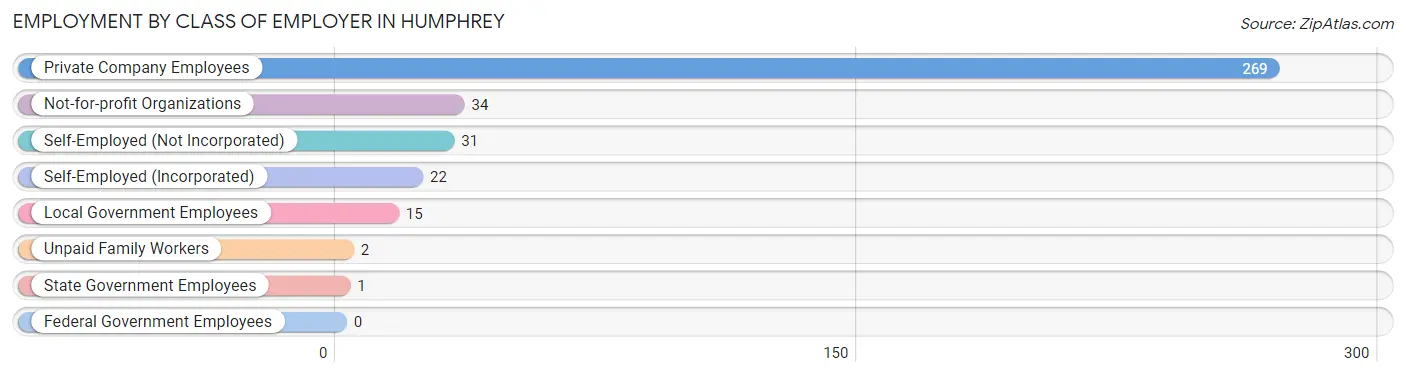
| Employer Class | # Employees | % Employees |
| Private Company Employees | 269 | 71.9% |
| Self-Employed (Incorporated) | 22 | 5.9% |
| Self-Employed (Not Incorporated) | 31 | 8.3% |
| Not-for-profit Organizations | 34 | 9.1% |
| Local Government Employees | 15 | 4.0% |
| State Government Employees | 1 | 0.3% |
| Federal Government Employees | 0 | 0.0% |
| Unpaid Family Workers | 2 | 0.5% |
| Total | 374 | 100.0% |
Employment Status by Age in Humphrey
According to the labor force statistics for Humphrey, out of the total population over 16 years of age (559), 69.2% or 387 individuals are in the labor force, with 1.6% or 6 of them unemployed. The age group with the highest labor force participation rate is 20 to 24 years, with 100.0% or 45 individuals in the labor force. Within the labor force, the 20 to 24 years age range has the highest percentage of unemployed individuals, with 8.9% or 4 of them being unemployed.
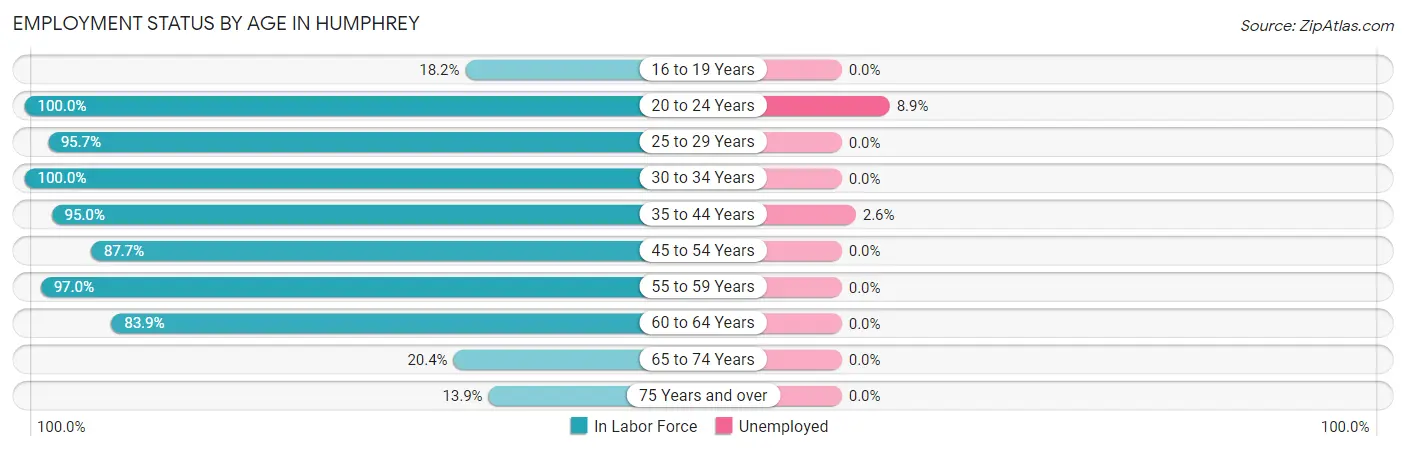
| Age Bracket | In Labor Force | Unemployed |
| 16 to 19 Years | 4 (18.2%) | 0 (0.0%) |
| 20 to 24 Years | 45 (100.0%) | 4 (8.9%) |
| 25 to 29 Years | 66 (95.7%) | 0 (0.0%) |
| 30 to 34 Years | 49 (100.0%) | 0 (0.0%) |
| 35 to 44 Years | 76 (95.0%) | 2 (2.6%) |
| 45 to 54 Years | 64 (87.7%) | 0 (0.0%) |
| 55 to 59 Years | 32 (97.0%) | 0 (0.0%) |
| 60 to 64 Years | 26 (83.9%) | 0 (0.0%) |
| 65 to 74 Years | 10 (20.4%) | 0 (0.0%) |
| 75 Years and over | 15 (13.9%) | 0 (0.0%) |
| Total | 387 (69.2%) | 6 (1.6%) |
Employment Status by Educational Attainment in Humphrey
According to labor force statistics for Humphrey, 93.4% of individuals (313) out of the total population between 25 and 64 years of age (335) are in the labor force, with 0.6% or 2 of them being unemployed. The group with the highest labor force participation rate are those with the educational attainment of college / associate degree, with 95.7% or 176 individuals in the labor force. Within the labor force, individuals with college / associate degree education have the highest percentage of unemployment, with 1.1% or 2 of them being unemployed.
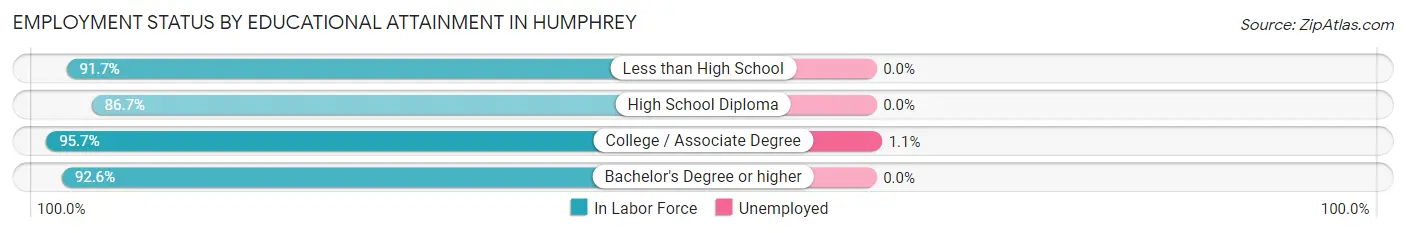
| Educational Attainment | In Labor Force | Unemployed |
| Less than High School | 11 (91.7%) | 0 (0.0%) |
| High School Diploma | 39 (86.7%) | 0 (0.0%) |
| College / Associate Degree | 176 (95.7%) | 2 (1.1%) |
| Bachelor's Degree or higher | 87 (92.6%) | 0 (0.0%) |
| Total | 313 (93.4%) | 2 (0.6%) |
Employment Occupations by Sex in Humphrey
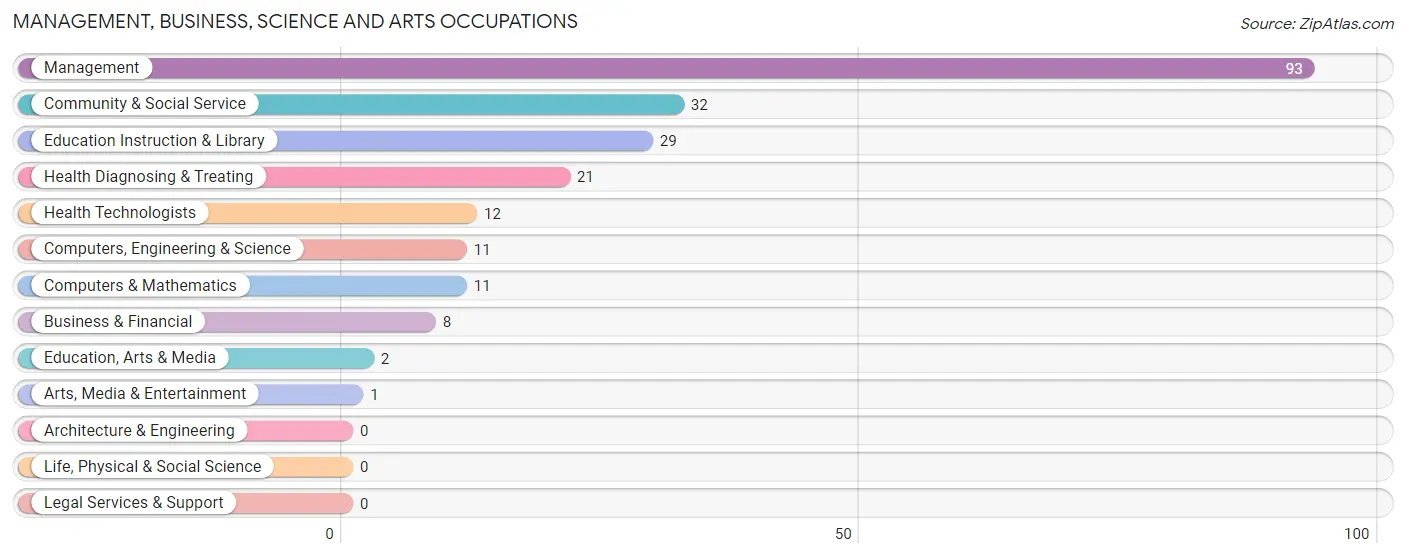
Management, Business, Science and Arts Occupations
The most common Management, Business, Science and Arts occupations in Humphrey are Management (93 | 24.4%), Community & Social Service (32 | 8.4%), Education Instruction & Library (29 | 7.6%), Health Diagnosing & Treating (21 | 5.5%), and Health Technologists (12 | 3.2%).
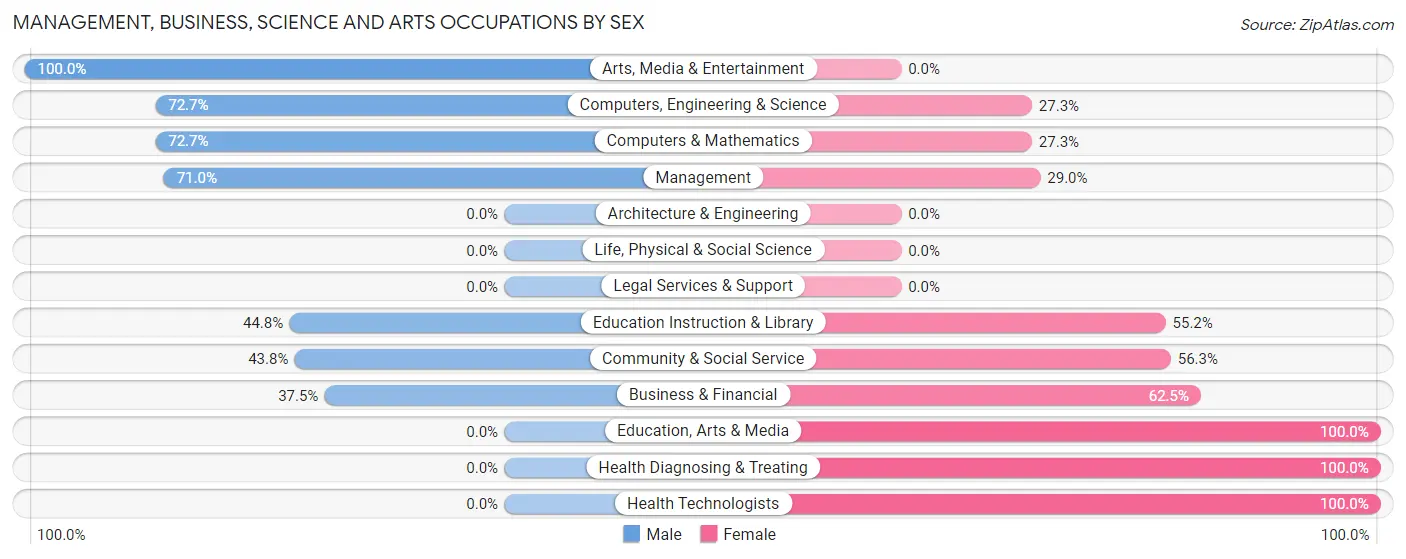
Management, Business, Science and Arts Occupations by Sex
Within the Management, Business, Science and Arts occupations in Humphrey, the most male-oriented occupations are Arts, Media & Entertainment (100.0%), Computers, Engineering & Science (72.7%), and Computers & Mathematics (72.7%), while the most female-oriented occupations are Education, Arts & Media (100.0%), Health Diagnosing & Treating (100.0%), and Health Technologists (100.0%).
| Occupation | Male | Female |
| Management | 66 (71.0%) | 27 (29.0%) |
| Business & Financial | 3 (37.5%) | 5 (62.5%) |
| Computers, Engineering & Science | 8 (72.7%) | 3 (27.3%) |
| Computers & Mathematics | 8 (72.7%) | 3 (27.3%) |
| Architecture & Engineering | 0 (0.0%) | 0 (0.0%) |
| Life, Physical & Social Science | 0 (0.0%) | 0 (0.0%) |
| Community & Social Service | 14 (43.8%) | 18 (56.2%) |
| Education, Arts & Media | 0 (0.0%) | 2 (100.0%) |
| Legal Services & Support | 0 (0.0%) | 0 (0.0%) |
| Education Instruction & Library | 13 (44.8%) | 16 (55.2%) |
| Arts, Media & Entertainment | 1 (100.0%) | 0 (0.0%) |
| Health Diagnosing & Treating | 0 (0.0%) | 21 (100.0%) |
| Health Technologists | 0 (0.0%) | 12 (100.0%) |
| Total (Category) | 91 (55.1%) | 74 (44.9%) |
| Total (Overall) | 217 (57.0%) | 164 (43.0%) |
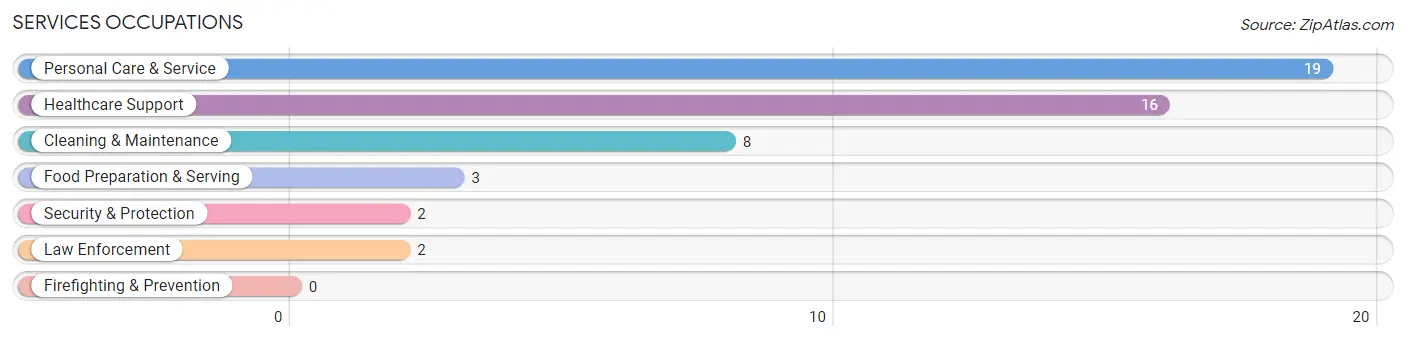
Services Occupations
The most common Services occupations in Humphrey are Personal Care & Service (19 | 5.0%), Healthcare Support (16 | 4.2%), Cleaning & Maintenance (8 | 2.1%), Food Preparation & Serving (3 | 0.8%), and Security & Protection (2 | 0.5%).
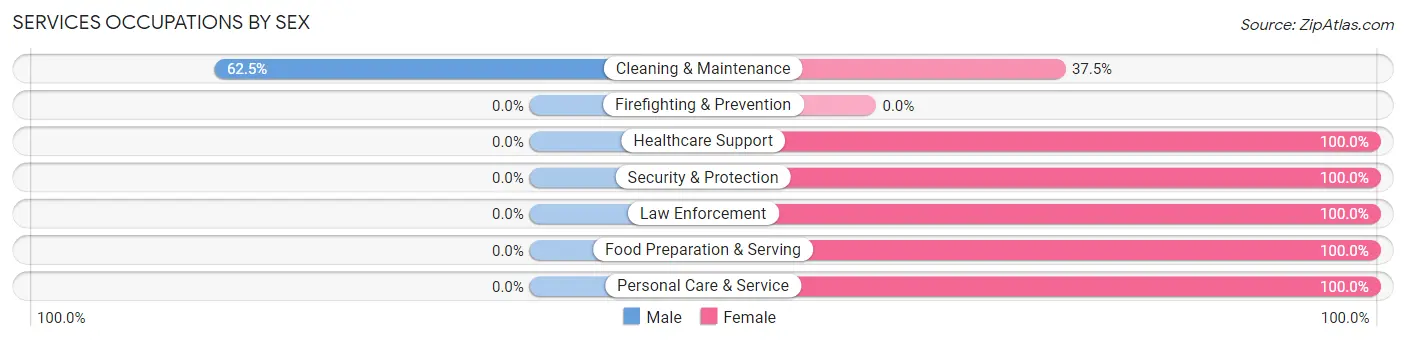
Services Occupations by Sex
| Occupation | Male | Female |
| Healthcare Support | 0 (0.0%) | 16 (100.0%) |
| Security & Protection | 0 (0.0%) | 2 (100.0%) |
| Firefighting & Prevention | 0 (0.0%) | 0 (0.0%) |
| Law Enforcement | 0 (0.0%) | 2 (100.0%) |
| Food Preparation & Serving | 0 (0.0%) | 3 (100.0%) |
| Cleaning & Maintenance | 5 (62.5%) | 3 (37.5%) |
| Personal Care & Service | 0 (0.0%) | 19 (100.0%) |
| Total (Category) | 5 (10.4%) | 43 (89.6%) |
| Total (Overall) | 217 (57.0%) | 164 (43.0%) |
Sales and Office Occupations
The most common Sales and Office occupations in Humphrey are Office & Administration (28 | 7.3%), and Sales & Related (26 | 6.8%).
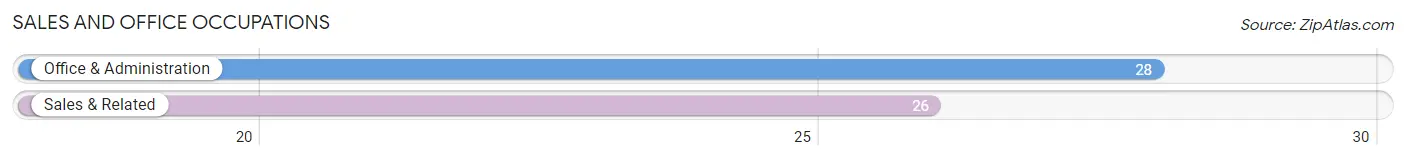
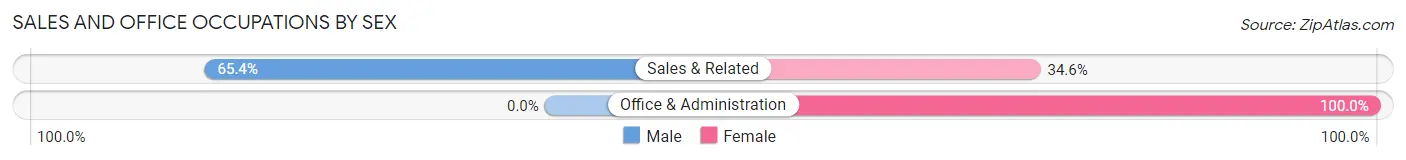
Sales and Office Occupations by Sex
| Occupation | Male | Female |
| Sales & Related | 17 (65.4%) | 9 (34.6%) |
| Office & Administration | 0 (0.0%) | 28 (100.0%) |
| Total (Category) | 17 (31.5%) | 37 (68.5%) |
| Total (Overall) | 217 (57.0%) | 164 (43.0%) |
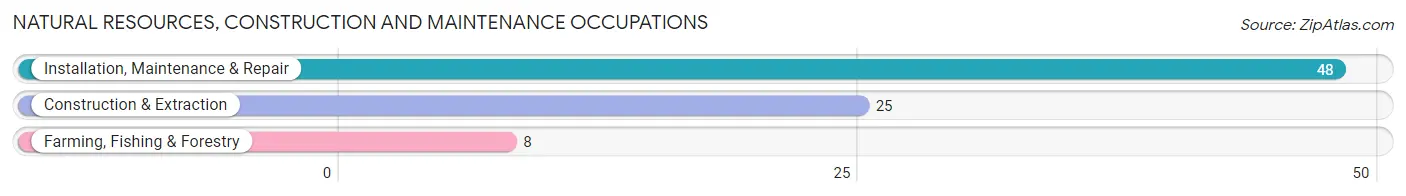
Natural Resources, Construction and Maintenance Occupations
The most common Natural Resources, Construction and Maintenance occupations in Humphrey are Installation, Maintenance & Repair (48 | 12.6%), Construction & Extraction (25 | 6.6%), and Farming, Fishing & Forestry (8 | 2.1%).
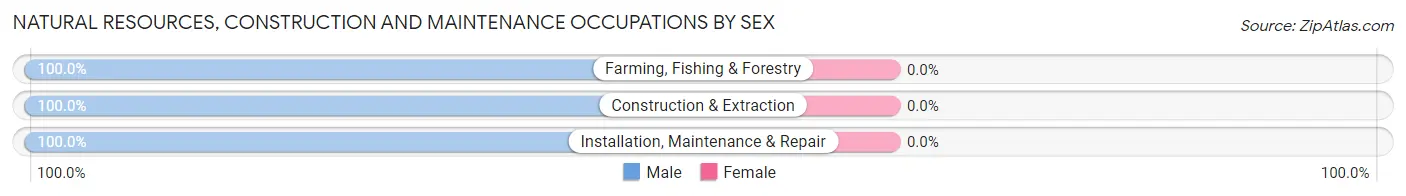
Natural Resources, Construction and Maintenance Occupations by Sex
| Occupation | Male | Female |
| Farming, Fishing & Forestry | 8 (100.0%) | 0 (0.0%) |
| Construction & Extraction | 25 (100.0%) | 0 (0.0%) |
| Installation, Maintenance & Repair | 48 (100.0%) | 0 (0.0%) |
| Total (Category) | 81 (100.0%) | 0 (0.0%) |
| Total (Overall) | 217 (57.0%) | 164 (43.0%) |
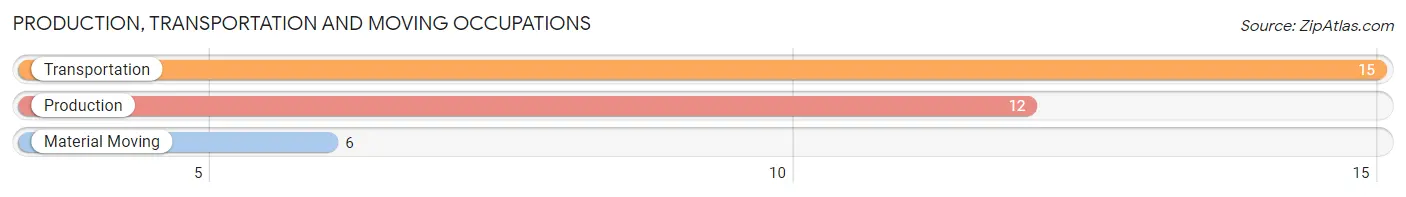
Production, Transportation and Moving Occupations
The most common Production, Transportation and Moving occupations in Humphrey are Transportation (15 | 3.9%), Production (12 | 3.2%), and Material Moving (6 | 1.6%).
Production, Transportation and Moving Occupations by Sex
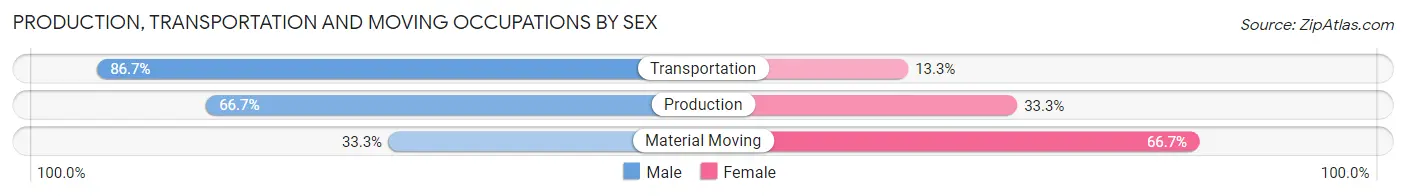
| Occupation | Male | Female |
| Production | 8 (66.7%) | 4 (33.3%) |
| Transportation | 13 (86.7%) | 2 (13.3%) |
| Material Moving | 2 (33.3%) | 4 (66.7%) |
| Total (Category) | 23 (69.7%) | 10 (30.3%) |
| Total (Overall) | 217 (57.0%) | 164 (43.0%) |
Employment Industries by Sex in Humphrey
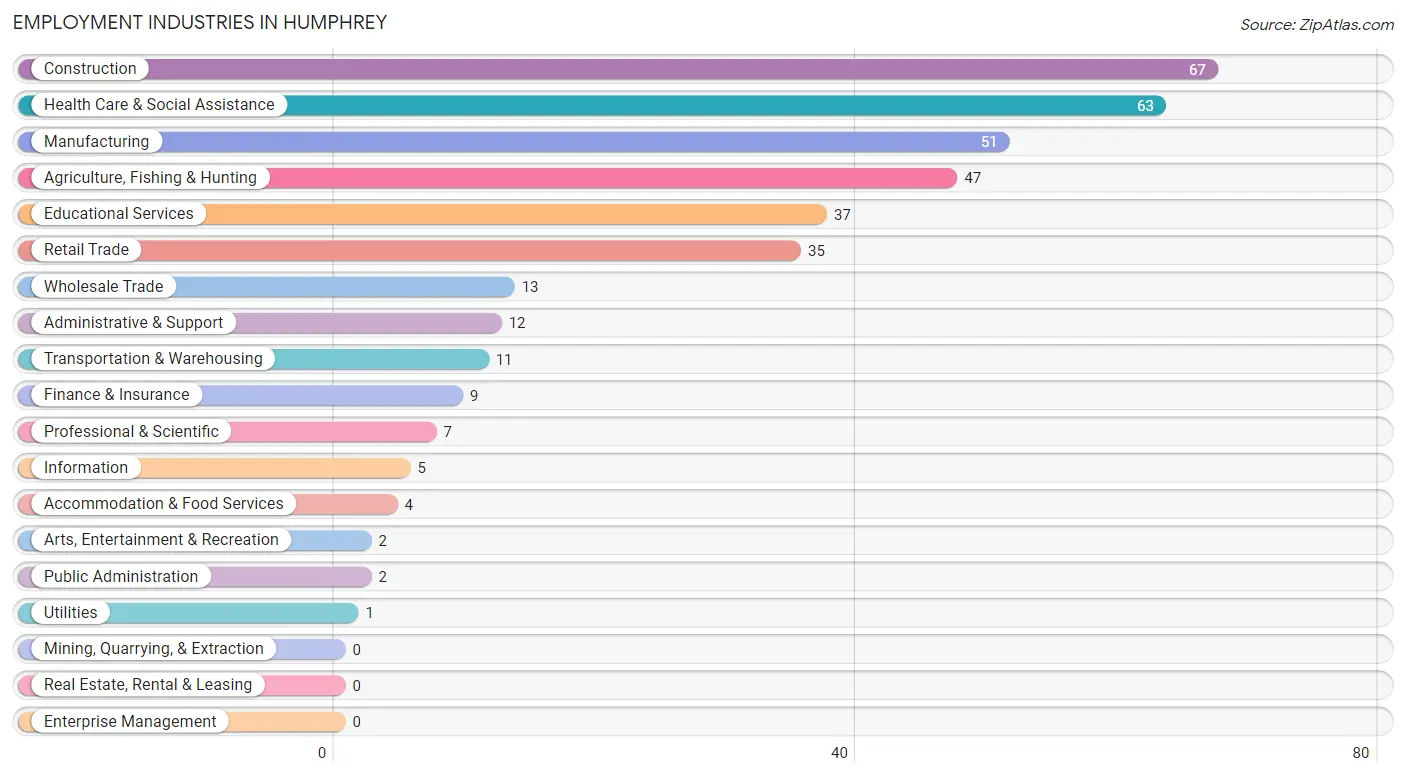
Employment Industries in Humphrey
The major employment industries in Humphrey include Construction (67 | 17.6%), Health Care & Social Assistance (63 | 16.5%), Manufacturing (51 | 13.4%), Agriculture, Fishing & Hunting (47 | 12.3%), and Educational Services (37 | 9.7%).
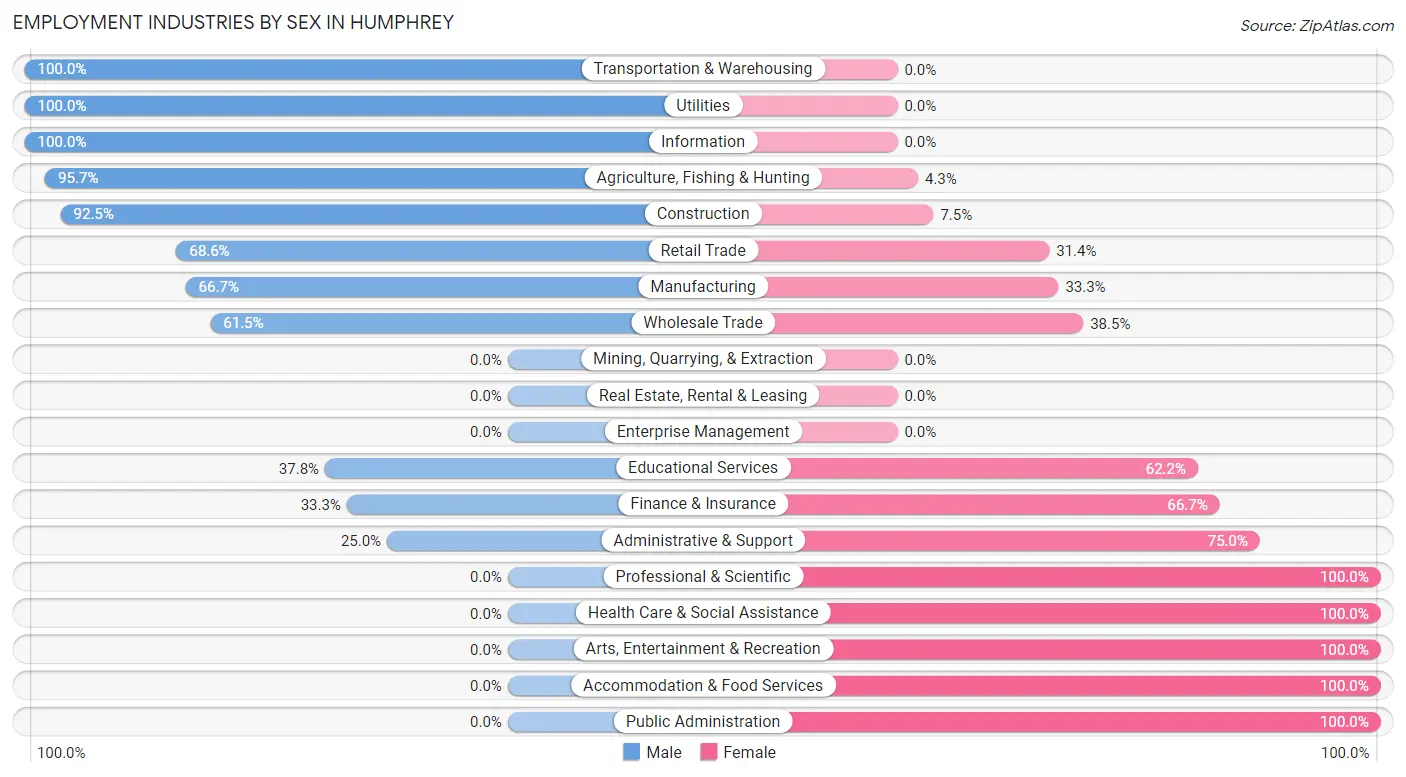
Employment Industries by Sex in Humphrey
The Humphrey industries that see more men than women are Transportation & Warehousing (100.0%), Utilities (100.0%), and Information (100.0%), whereas the industries that tend to have a higher number of women are Professional & Scientific (100.0%), Health Care & Social Assistance (100.0%), and Arts, Entertainment & Recreation (100.0%).
| Industry | Male | Female |
| Agriculture, Fishing & Hunting | 45 (95.7%) | 2 (4.3%) |
| Mining, Quarrying, & Extraction | 0 (0.0%) | 0 (0.0%) |
| Construction | 62 (92.5%) | 5 (7.5%) |
| Manufacturing | 34 (66.7%) | 17 (33.3%) |
| Wholesale Trade | 8 (61.5%) | 5 (38.5%) |
| Retail Trade | 24 (68.6%) | 11 (31.4%) |
| Transportation & Warehousing | 11 (100.0%) | 0 (0.0%) |
| Utilities | 1 (100.0%) | 0 (0.0%) |
| Information | 5 (100.0%) | 0 (0.0%) |
| Finance & Insurance | 3 (33.3%) | 6 (66.7%) |
| Real Estate, Rental & Leasing | 0 (0.0%) | 0 (0.0%) |
| Professional & Scientific | 0 (0.0%) | 7 (100.0%) |
| Enterprise Management | 0 (0.0%) | 0 (0.0%) |
| Administrative & Support | 3 (25.0%) | 9 (75.0%) |
| Educational Services | 14 (37.8%) | 23 (62.2%) |
| Health Care & Social Assistance | 0 (0.0%) | 63 (100.0%) |
| Arts, Entertainment & Recreation | 0 (0.0%) | 2 (100.0%) |
| Accommodation & Food Services | 0 (0.0%) | 4 (100.0%) |
| Public Administration | 0 (0.0%) | 2 (100.0%) |
| Total | 217 (57.0%) | 164 (43.0%) |
Education in Humphrey
School Enrollment in Humphrey
The most common levels of schooling among the 146 students in Humphrey are elementary school (40 | 27.4%), high school (35 | 24.0%), and middle school (26 | 17.8%).
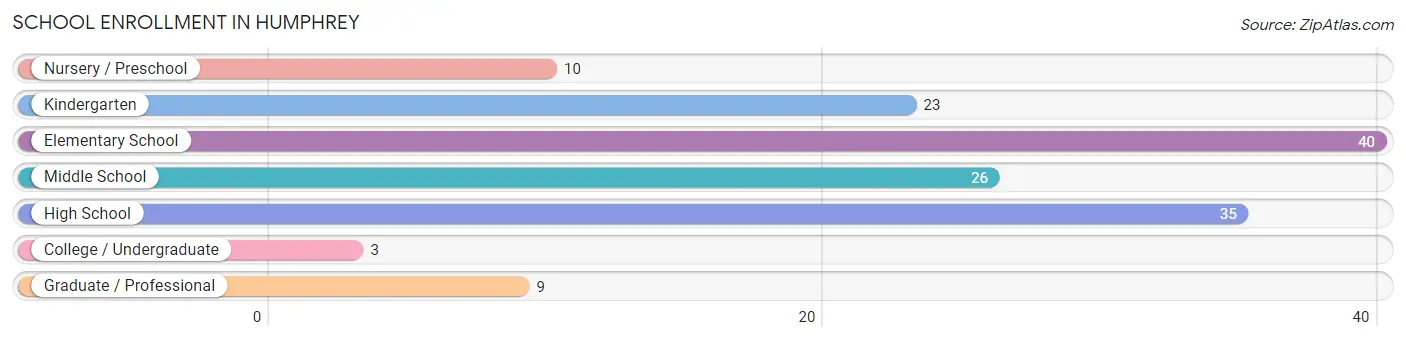
| School Level | # Students | % Students |
| Nursery / Preschool | 10 | 6.9% |
| Kindergarten | 23 | 15.8% |
| Elementary School | 40 | 27.4% |
| Middle School | 26 | 17.8% |
| High School | 35 | 24.0% |
| College / Undergraduate | 3 | 2.1% |
| Graduate / Professional | 9 | 6.2% |
| Total | 146 | 100.0% |
School Enrollment by Age by Funding Source in Humphrey
Out of a total of 146 students who are enrolled in schools in Humphrey, 80 (54.8%) attend a private institution, while the remaining 66 (45.2%) are enrolled in public schools. The age group of 5 to 9 year old has the highest likelihood of being enrolled in private schools, with 51 (82.3% in the age bracket) enrolled. Conversely, the age group of 20 to 24 year olds has the lowest likelihood of being enrolled in a private school, with 3 (100.0% in the age bracket) attending a public institution.
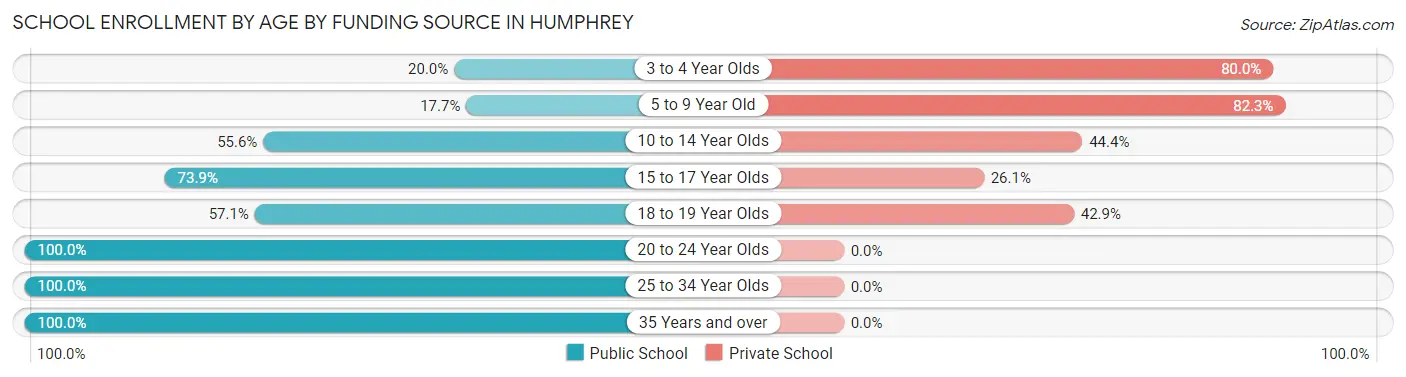
| Age Bracket | Public School | Private School |
| 3 to 4 Year Olds | 2 (20.0%) | 8 (80.0%) |
| 5 to 9 Year Old | 11 (17.7%) | 51 (82.3%) |
| 10 to 14 Year Olds | 15 (55.6%) | 12 (44.4%) |
| 15 to 17 Year Olds | 17 (73.9%) | 6 (26.1%) |
| 18 to 19 Year Olds | 4 (57.1%) | 3 (42.9%) |
| 20 to 24 Year Olds | 3 (100.0%) | 0 (0.0%) |
| 25 to 34 Year Olds | 6 (100.0%) | 0 (0.0%) |
| 35 Years and over | 8 (100.0%) | 0 (0.0%) |
| Total | 66 (45.2%) | 80 (54.8%) |
Educational Attainment by Field of Study in Humphrey
Business (31 | 28.7%), education (23 | 21.3%), arts & humanities (15 | 13.9%), science & technology (14 | 13.0%), and bio, nature & agricultural (8 | 7.4%) are the most common fields of study among 108 individuals in Humphrey who have obtained a bachelor's degree or higher.
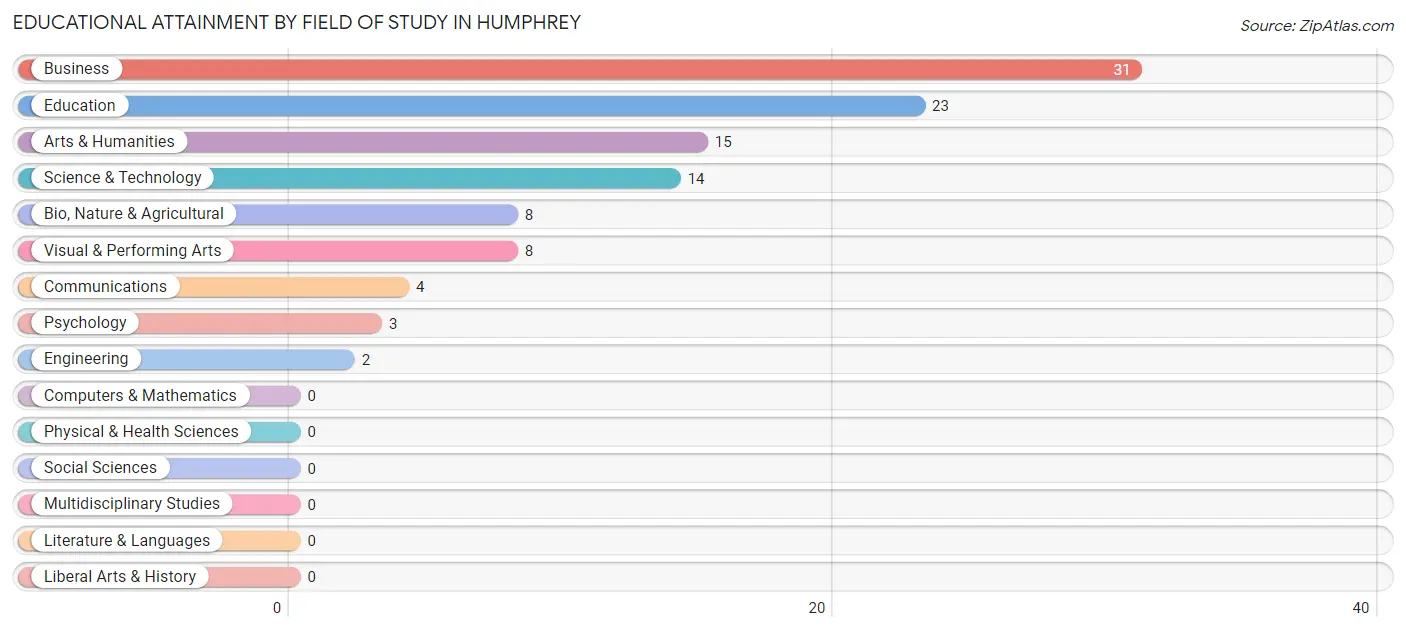
| Field of Study | # Graduates | % Graduates |
| Computers & Mathematics | 0 | 0.0% |
| Bio, Nature & Agricultural | 8 | 7.4% |
| Physical & Health Sciences | 0 | 0.0% |
| Psychology | 3 | 2.8% |
| Social Sciences | 0 | 0.0% |
| Engineering | 2 | 1.8% |
| Multidisciplinary Studies | 0 | 0.0% |
| Science & Technology | 14 | 13.0% |
| Business | 31 | 28.7% |
| Education | 23 | 21.3% |
| Literature & Languages | 0 | 0.0% |
| Liberal Arts & History | 0 | 0.0% |
| Visual & Performing Arts | 8 | 7.4% |
| Communications | 4 | 3.7% |
| Arts & Humanities | 15 | 13.9% |
| Total | 108 | 100.0% |
Transportation & Commute in Humphrey
Vehicle Availability by Sex in Humphrey
The most prevalent vehicle ownership categories in Humphrey are males with 2 vehicles (108, accounting for 50.7%) and females with 2 vehicles (67, making up 67.9%).
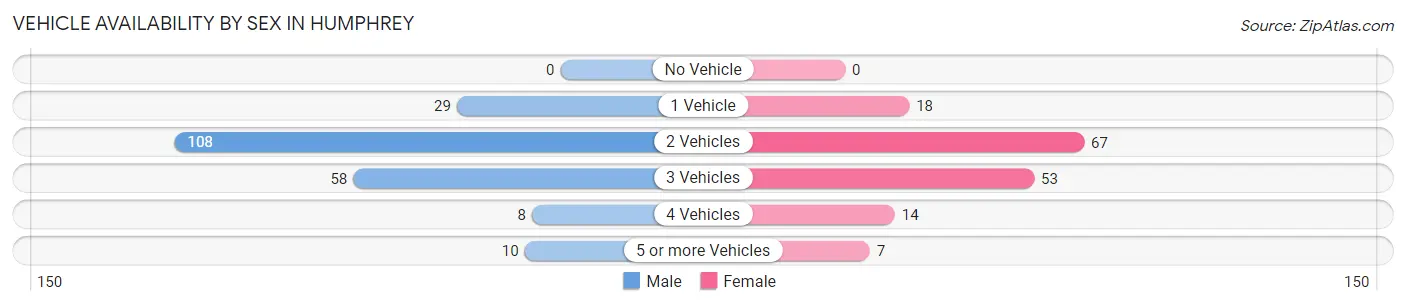
| Vehicles Available | Male | Female |
| No Vehicle | 0 (0.0%) | 0 (0.0%) |
| 1 Vehicle | 29 (13.6%) | 18 (11.3%) |
| 2 Vehicles | 108 (50.7%) | 67 (42.1%) |
| 3 Vehicles | 58 (27.2%) | 53 (33.3%) |
| 4 Vehicles | 8 (3.8%) | 14 (8.8%) |
| 5 or more Vehicles | 10 (4.7%) | 7 (4.4%) |
| Total | 213 (100.0%) | 159 (100.0%) |
Commute Time in Humphrey
The most frequently occuring commute durations in Humphrey are 5 to 9 minutes (64 commuters, 18.1%), less than 5 minutes (56 commuters, 15.9%), and 30 to 34 minutes (47 commuters, 13.3%).
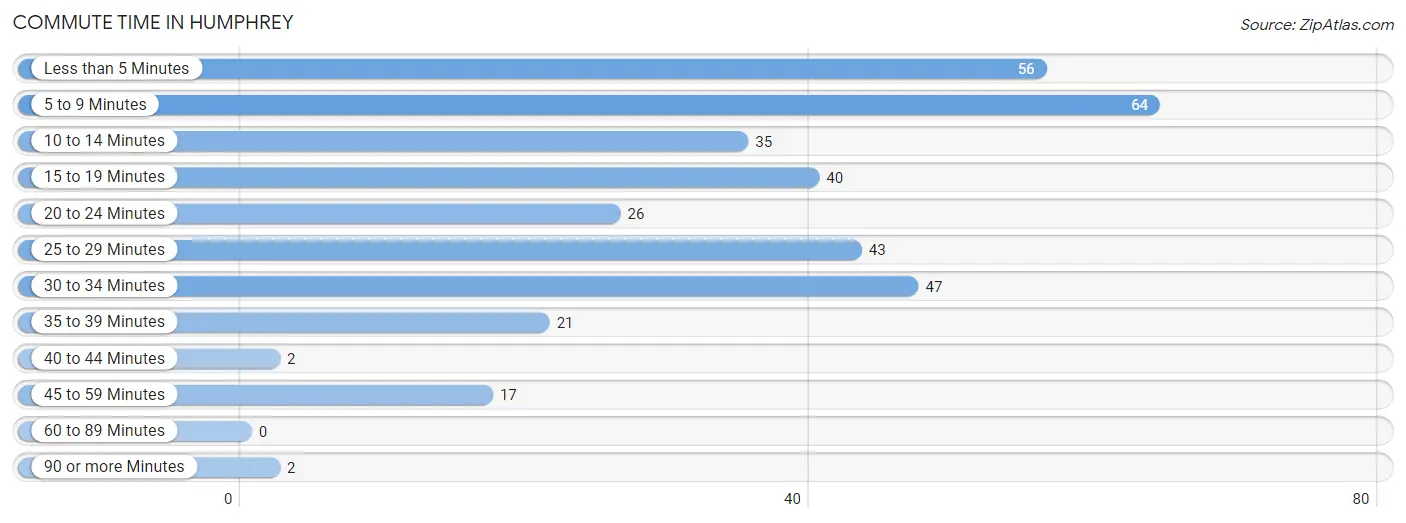
| Commute Time | # Commuters | % Commuters |
| Less than 5 Minutes | 56 | 15.9% |
| 5 to 9 Minutes | 64 | 18.1% |
| 10 to 14 Minutes | 35 | 9.9% |
| 15 to 19 Minutes | 40 | 11.3% |
| 20 to 24 Minutes | 26 | 7.4% |
| 25 to 29 Minutes | 43 | 12.2% |
| 30 to 34 Minutes | 47 | 13.3% |
| 35 to 39 Minutes | 21 | 5.9% |
| 40 to 44 Minutes | 2 | 0.6% |
| 45 to 59 Minutes | 17 | 4.8% |
| 60 to 89 Minutes | 0 | 0.0% |
| 90 or more Minutes | 2 | 0.6% |
Commute Time by Sex in Humphrey
The most common commute times in Humphrey are less than 5 minutes (47 commuters, 22.8%) for males and 30 to 34 minutes (24 commuters, 16.3%) for females.
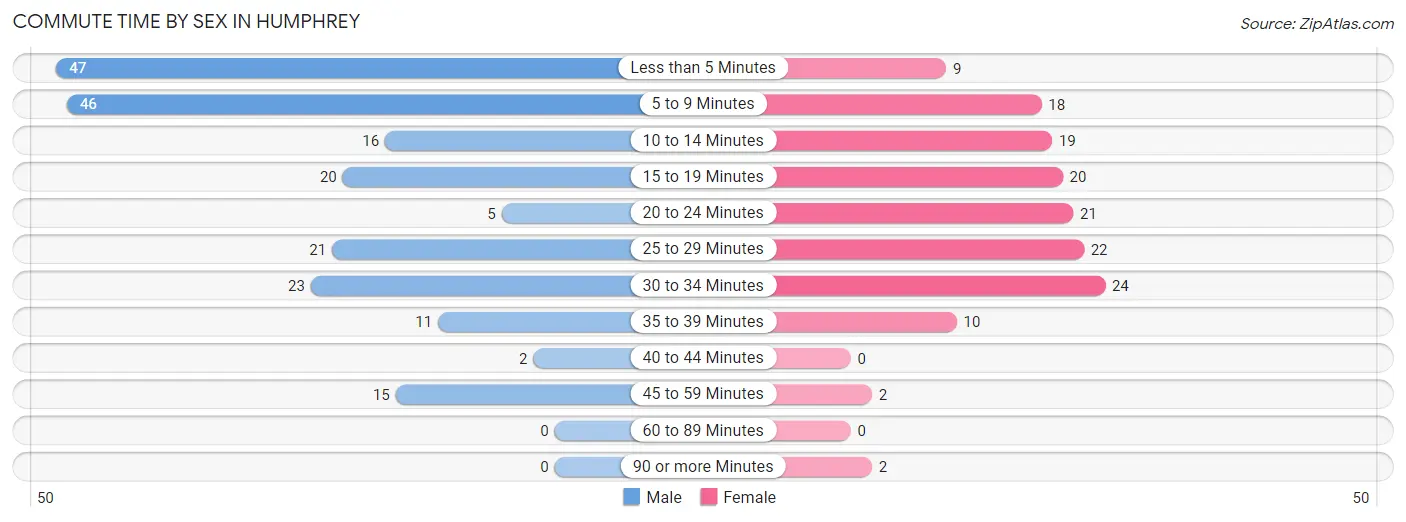
| Commute Time | Male | Female |
| Less than 5 Minutes | 47 (22.8%) | 9 (6.1%) |
| 5 to 9 Minutes | 46 (22.3%) | 18 (12.2%) |
| 10 to 14 Minutes | 16 (7.8%) | 19 (12.9%) |
| 15 to 19 Minutes | 20 (9.7%) | 20 (13.6%) |
| 20 to 24 Minutes | 5 (2.4%) | 21 (14.3%) |
| 25 to 29 Minutes | 21 (10.2%) | 22 (15.0%) |
| 30 to 34 Minutes | 23 (11.2%) | 24 (16.3%) |
| 35 to 39 Minutes | 11 (5.3%) | 10 (6.8%) |
| 40 to 44 Minutes | 2 (1.0%) | 0 (0.0%) |
| 45 to 59 Minutes | 15 (7.3%) | 2 (1.4%) |
| 60 to 89 Minutes | 0 (0.0%) | 0 (0.0%) |
| 90 or more Minutes | 0 (0.0%) | 2 (1.4%) |
Time of Departure to Work by Sex in Humphrey
The most frequent times of departure to work in Humphrey are 7:00 AM to 7:29 AM (54, 26.2%) for males and 7:00 AM to 7:29 AM (37, 25.2%) for females.
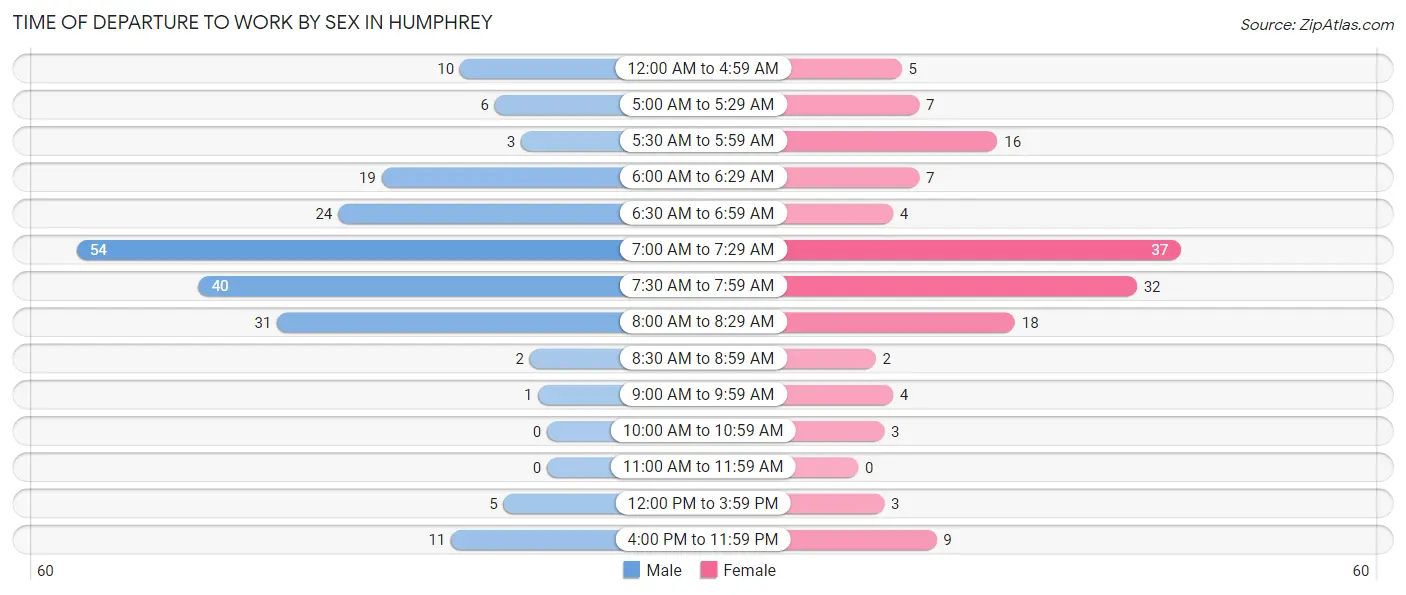
| Time of Departure | Male | Female |
| 12:00 AM to 4:59 AM | 10 (4.9%) | 5 (3.4%) |
| 5:00 AM to 5:29 AM | 6 (2.9%) | 7 (4.8%) |
| 5:30 AM to 5:59 AM | 3 (1.5%) | 16 (10.9%) |
| 6:00 AM to 6:29 AM | 19 (9.2%) | 7 (4.8%) |
| 6:30 AM to 6:59 AM | 24 (11.7%) | 4 (2.7%) |
| 7:00 AM to 7:29 AM | 54 (26.2%) | 37 (25.2%) |
| 7:30 AM to 7:59 AM | 40 (19.4%) | 32 (21.8%) |
| 8:00 AM to 8:29 AM | 31 (15.0%) | 18 (12.2%) |
| 8:30 AM to 8:59 AM | 2 (1.0%) | 2 (1.4%) |
| 9:00 AM to 9:59 AM | 1 (0.5%) | 4 (2.7%) |
| 10:00 AM to 10:59 AM | 0 (0.0%) | 3 (2.0%) |
| 11:00 AM to 11:59 AM | 0 (0.0%) | 0 (0.0%) |
| 12:00 PM to 3:59 PM | 5 (2.4%) | 3 (2.0%) |
| 4:00 PM to 11:59 PM | 11 (5.3%) | 9 (6.1%) |
| Total | 206 (100.0%) | 147 (100.0%) |
Housing Occupancy in Humphrey
Occupancy by Ownership in Humphrey
Of the total 336 dwellings in Humphrey, owner-occupied units account for 286 (85.1%), while renter-occupied units make up 50 (14.9%).
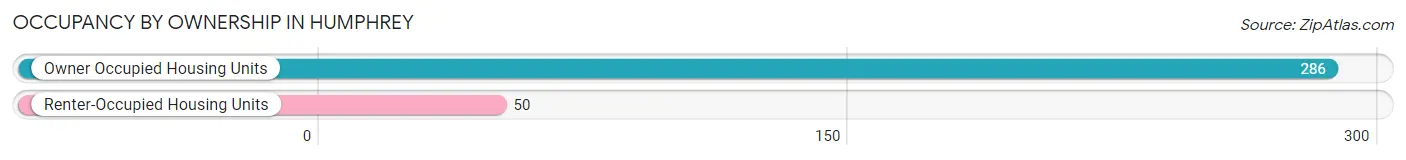
| Occupancy | # Housing Units | % Housing Units |
| Owner Occupied Housing Units | 286 | 85.1% |
| Renter-Occupied Housing Units | 50 | 14.9% |
| Total Occupied Housing Units | 336 | 100.0% |
Occupancy by Household Size in Humphrey
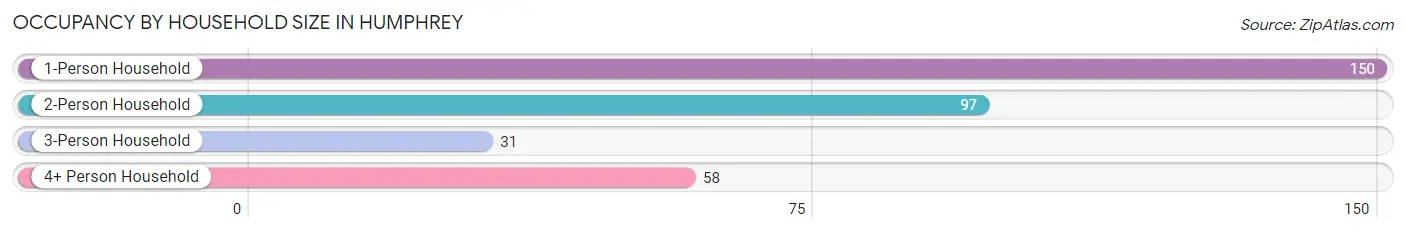
| Household Size | # Housing Units | % Housing Units |
| 1-Person Household | 150 | 44.6% |
| 2-Person Household | 97 | 28.9% |
| 3-Person Household | 31 | 9.2% |
| 4+ Person Household | 58 | 17.3% |
| Total Housing Units | 336 | 100.0% |
Occupancy by Ownership by Household Size in Humphrey
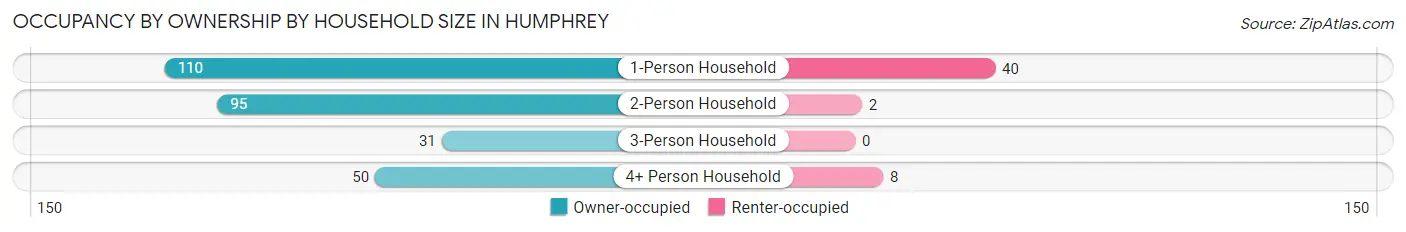
| Household Size | Owner-occupied | Renter-occupied |
| 1-Person Household | 110 (73.3%) | 40 (26.7%) |
| 2-Person Household | 95 (97.9%) | 2 (2.1%) |
| 3-Person Household | 31 (100.0%) | 0 (0.0%) |
| 4+ Person Household | 50 (86.2%) | 8 (13.8%) |
| Total Housing Units | 286 (85.1%) | 50 (14.9%) |
Occupancy by Educational Attainment in Humphrey
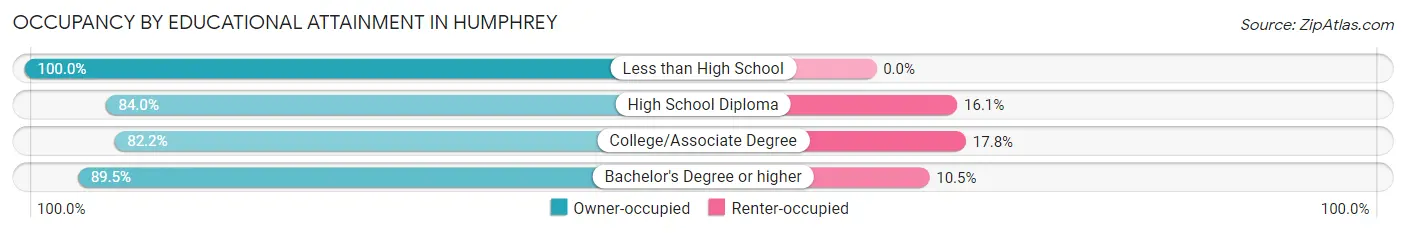
| Household Size | Owner-occupied | Renter-occupied |
| Less than High School | 16 (100.0%) | 0 (0.0%) |
| High School Diploma | 68 (84.0%) | 13 (16.1%) |
| College/Associate Degree | 134 (82.2%) | 29 (17.8%) |
| Bachelor's Degree or higher | 68 (89.5%) | 8 (10.5%) |
Occupancy by Age of Householder in Humphrey
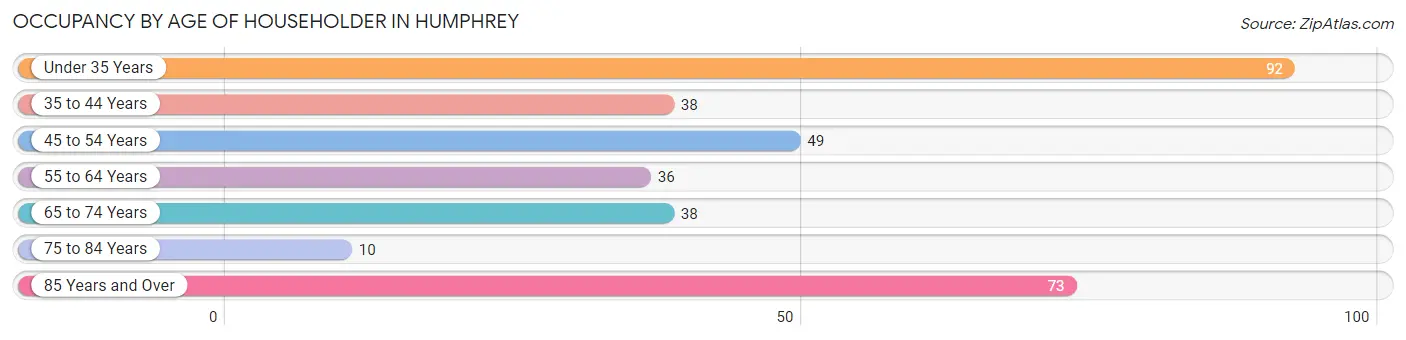
| Age Bracket | # Households | % Households |
| Under 35 Years | 92 | 27.4% |
| 35 to 44 Years | 38 | 11.3% |
| 45 to 54 Years | 49 | 14.6% |
| 55 to 64 Years | 36 | 10.7% |
| 65 to 74 Years | 38 | 11.3% |
| 75 to 84 Years | 10 | 3.0% |
| 85 Years and Over | 73 | 21.7% |
| Total | 336 | 100.0% |
Housing Finances in Humphrey
Median Income by Occupancy in Humphrey
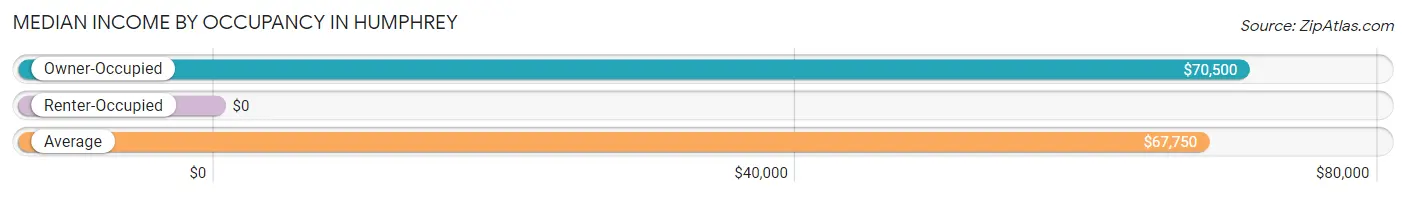
| Occupancy Type | # Households | Median Income |
| Owner-Occupied | 286 (85.1%) | $70,500 |
| Renter-Occupied | 50 (14.9%) | $0 |
| Average | 336 (100.0%) | $67,750 |
Occupancy by Householder Income Bracket in Humphrey
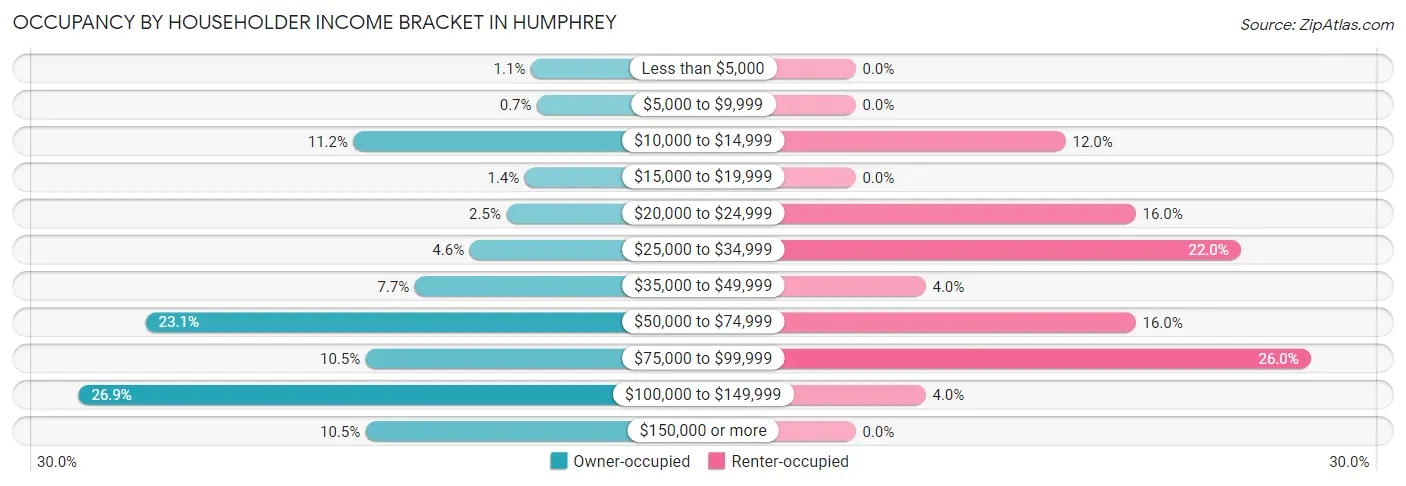
| Income Bracket | Owner-occupied | Renter-occupied |
| Less than $5,000 | 3 (1.1%) | 0 (0.0%) |
| $5,000 to $9,999 | 2 (0.7%) | 0 (0.0%) |
| $10,000 to $14,999 | 32 (11.2%) | 6 (12.0%) |
| $15,000 to $19,999 | 4 (1.4%) | 0 (0.0%) |
| $20,000 to $24,999 | 7 (2.5%) | 8 (16.0%) |
| $25,000 to $34,999 | 13 (4.5%) | 11 (22.0%) |
| $35,000 to $49,999 | 22 (7.7%) | 2 (4.0%) |
| $50,000 to $74,999 | 66 (23.1%) | 8 (16.0%) |
| $75,000 to $99,999 | 30 (10.5%) | 13 (26.0%) |
| $100,000 to $149,999 | 77 (26.9%) | 2 (4.0%) |
| $150,000 or more | 30 (10.5%) | 0 (0.0%) |
| Total | 286 (100.0%) | 50 (100.0%) |
Monthly Housing Cost Tiers in Humphrey
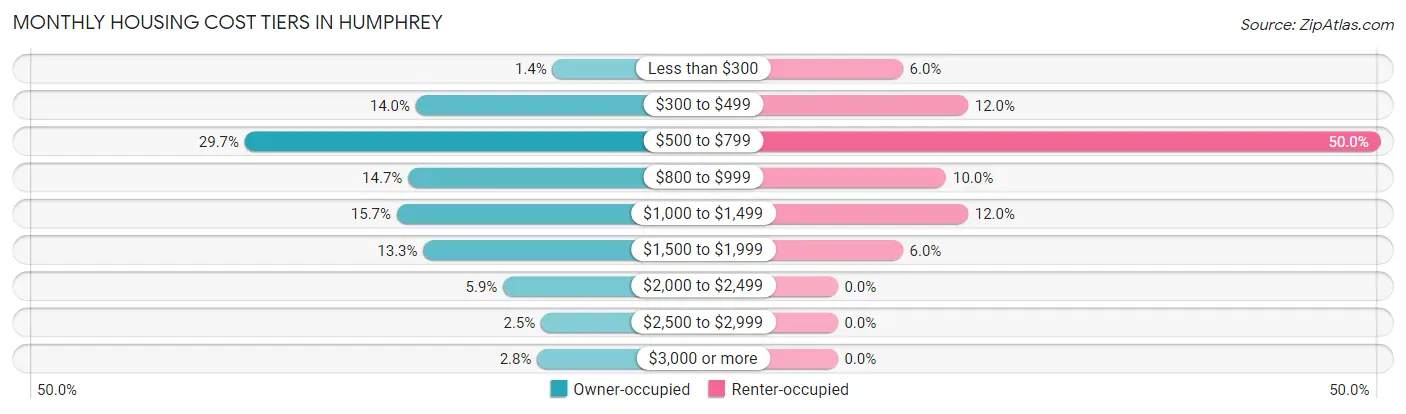
| Monthly Cost | Owner-occupied | Renter-occupied |
| Less than $300 | 4 (1.4%) | 3 (6.0%) |
| $300 to $499 | 40 (14.0%) | 6 (12.0%) |
| $500 to $799 | 85 (29.7%) | 25 (50.0%) |
| $800 to $999 | 42 (14.7%) | 5 (10.0%) |
| $1,000 to $1,499 | 45 (15.7%) | 6 (12.0%) |
| $1,500 to $1,999 | 38 (13.3%) | 3 (6.0%) |
| $2,000 to $2,499 | 17 (5.9%) | 0 (0.0%) |
| $2,500 to $2,999 | 7 (2.5%) | 0 (0.0%) |
| $3,000 or more | 8 (2.8%) | 0 (0.0%) |
| Total | 286 (100.0%) | 50 (100.0%) |
Physical Housing Characteristics in Humphrey
Housing Structures in Humphrey
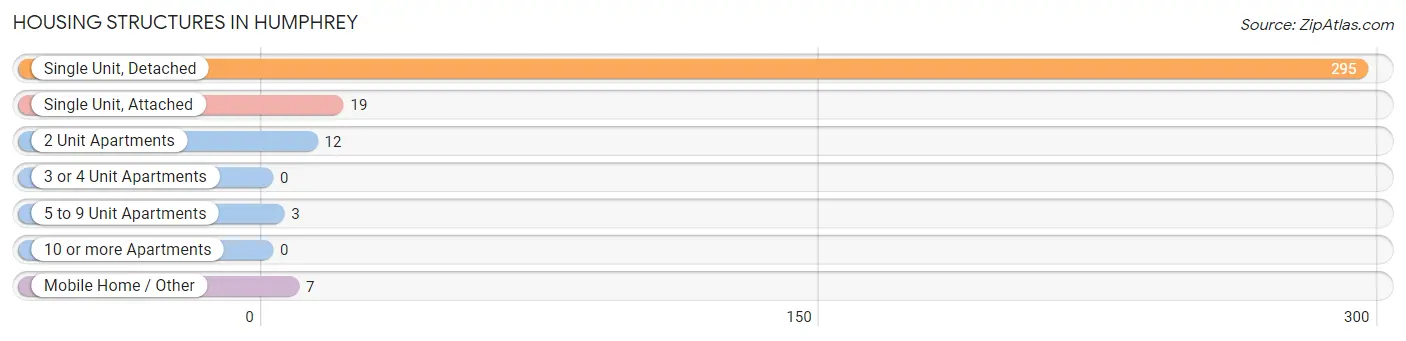
| Structure Type | # Housing Units | % Housing Units |
| Single Unit, Detached | 295 | 87.8% |
| Single Unit, Attached | 19 | 5.7% |
| 2 Unit Apartments | 12 | 3.6% |
| 3 or 4 Unit Apartments | 0 | 0.0% |
| 5 to 9 Unit Apartments | 3 | 0.9% |
| 10 or more Apartments | 0 | 0.0% |
| Mobile Home / Other | 7 | 2.1% |
| Total | 336 | 100.0% |
Housing Structures by Occupancy in Humphrey
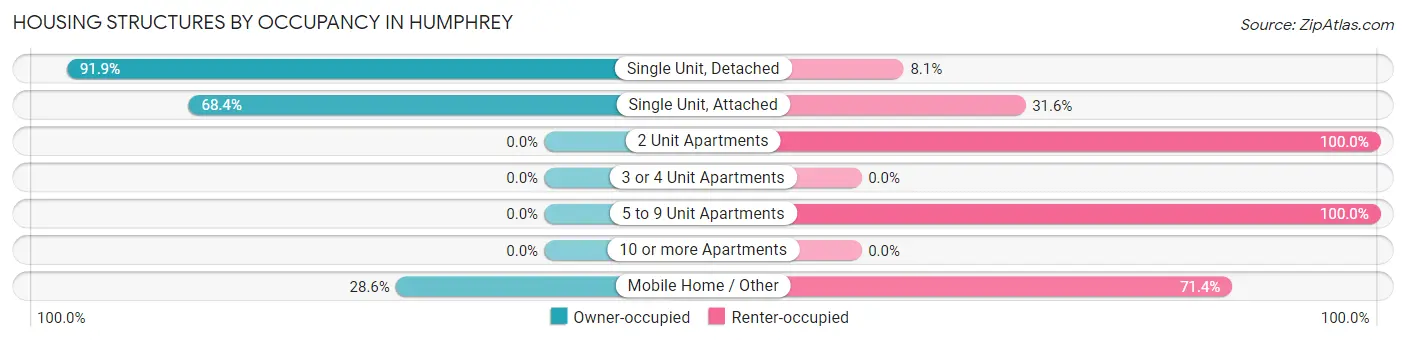
| Structure Type | Owner-occupied | Renter-occupied |
| Single Unit, Detached | 271 (91.9%) | 24 (8.1%) |
| Single Unit, Attached | 13 (68.4%) | 6 (31.6%) |
| 2 Unit Apartments | 0 (0.0%) | 12 (100.0%) |
| 3 or 4 Unit Apartments | 0 (0.0%) | 0 (0.0%) |
| 5 to 9 Unit Apartments | 0 (0.0%) | 3 (100.0%) |
| 10 or more Apartments | 0 (0.0%) | 0 (0.0%) |
| Mobile Home / Other | 2 (28.6%) | 5 (71.4%) |
| Total | 286 (85.1%) | 50 (14.9%) |
Housing Structures by Number of Rooms in Humphrey
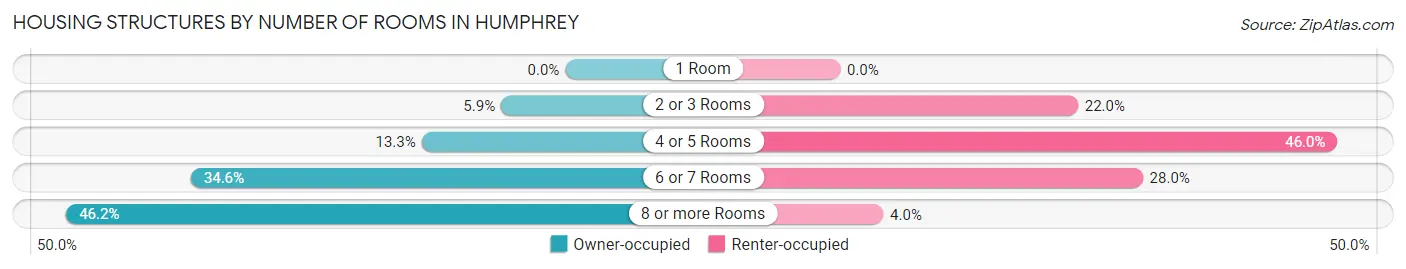
| Number of Rooms | Owner-occupied | Renter-occupied |
| 1 Room | 0 (0.0%) | 0 (0.0%) |
| 2 or 3 Rooms | 17 (5.9%) | 11 (22.0%) |
| 4 or 5 Rooms | 38 (13.3%) | 23 (46.0%) |
| 6 or 7 Rooms | 99 (34.6%) | 14 (28.0%) |
| 8 or more Rooms | 132 (46.2%) | 2 (4.0%) |
| Total | 286 (100.0%) | 50 (100.0%) |
Housing Structure by Heating Type in Humphrey
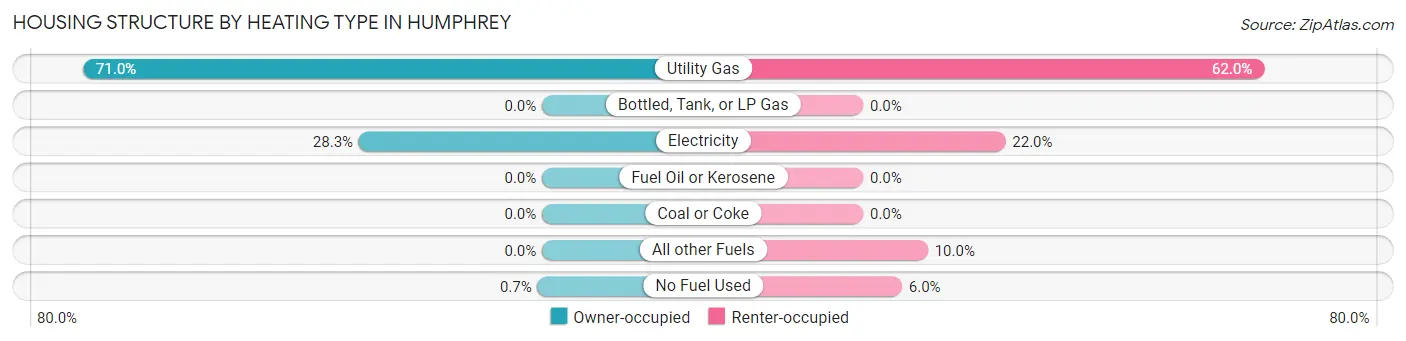
| Heating Type | Owner-occupied | Renter-occupied |
| Utility Gas | 203 (71.0%) | 31 (62.0%) |
| Bottled, Tank, or LP Gas | 0 (0.0%) | 0 (0.0%) |
| Electricity | 81 (28.3%) | 11 (22.0%) |
| Fuel Oil or Kerosene | 0 (0.0%) | 0 (0.0%) |
| Coal or Coke | 0 (0.0%) | 0 (0.0%) |
| All other Fuels | 0 (0.0%) | 5 (10.0%) |
| No Fuel Used | 2 (0.7%) | 3 (6.0%) |
| Total | 286 (100.0%) | 50 (100.0%) |
Household Vehicle Usage in Humphrey
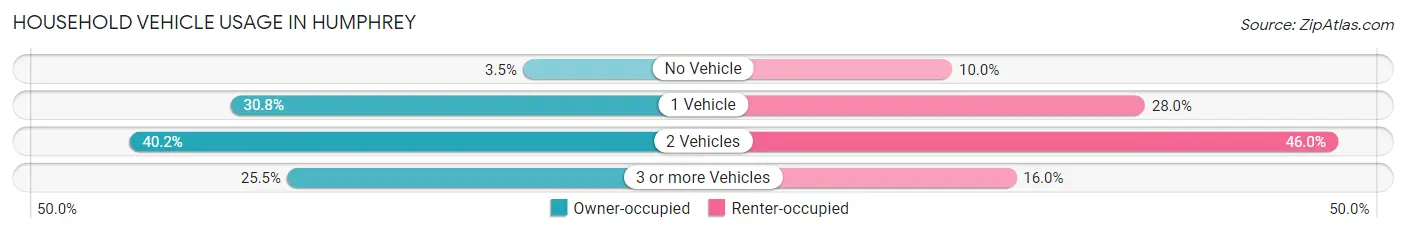
| Vehicles per Household | Owner-occupied | Renter-occupied |
| No Vehicle | 10 (3.5%) | 5 (10.0%) |
| 1 Vehicle | 88 (30.8%) | 14 (28.0%) |
| 2 Vehicles | 115 (40.2%) | 23 (46.0%) |
| 3 or more Vehicles | 73 (25.5%) | 8 (16.0%) |
| Total | 286 (100.0%) | 50 (100.0%) |
Real Estate & Mortgages in Humphrey
Real Estate and Mortgage Overview in Humphrey
| Characteristic | Without Mortgage | With Mortgage |
| Housing Units | 146 | 140 |
| Median Property Value | $157,100 | $218,600 |
| Median Household Income | $64,028 | $20 |
| Monthly Housing Costs | $581 | $8 |
| Real Estate Taxes | $1,875 | $0 |
Property Value by Mortgage Status in Humphrey
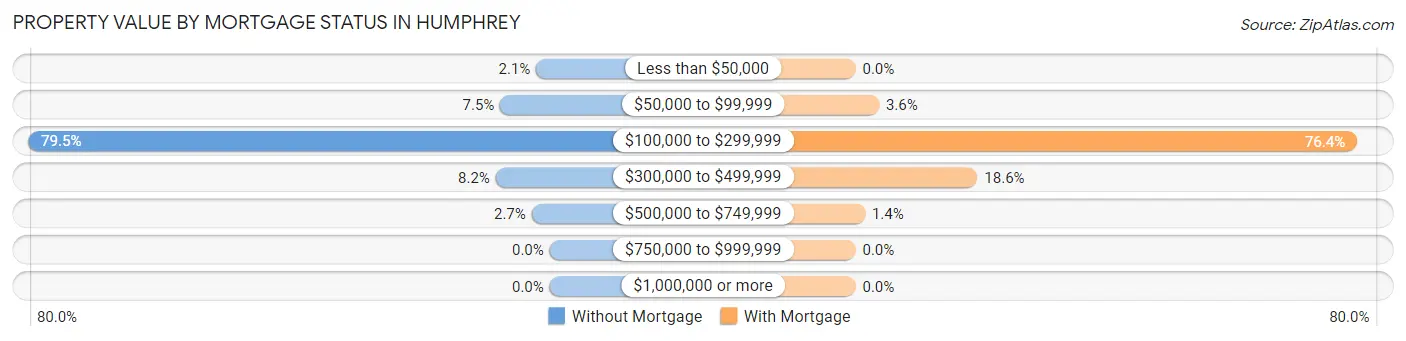
| Property Value | Without Mortgage | With Mortgage |
| Less than $50,000 | 3 (2.1%) | 0 (0.0%) |
| $50,000 to $99,999 | 11 (7.5%) | 5 (3.6%) |
| $100,000 to $299,999 | 116 (79.4%) | 107 (76.4%) |
| $300,000 to $499,999 | 12 (8.2%) | 26 (18.6%) |
| $500,000 to $749,999 | 4 (2.7%) | 2 (1.4%) |
| $750,000 to $999,999 | 0 (0.0%) | 0 (0.0%) |
| $1,000,000 or more | 0 (0.0%) | 0 (0.0%) |
| Total | 146 (100.0%) | 140 (100.0%) |
Household Income by Mortgage Status in Humphrey
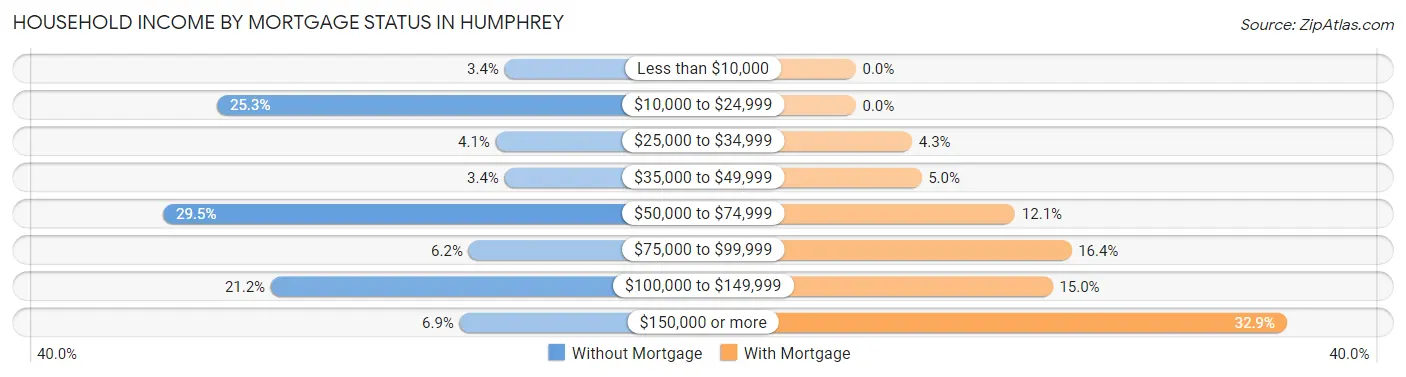
| Household Income | Without Mortgage | With Mortgage |
| Less than $10,000 | 5 (3.4%) | 0 (0.0%) |
| $10,000 to $24,999 | 37 (25.3%) | 0 (0.0%) |
| $25,000 to $34,999 | 6 (4.1%) | 6 (4.3%) |
| $35,000 to $49,999 | 5 (3.4%) | 7 (5.0%) |
| $50,000 to $74,999 | 43 (29.4%) | 17 (12.1%) |
| $75,000 to $99,999 | 9 (6.2%) | 23 (16.4%) |
| $100,000 to $149,999 | 31 (21.2%) | 21 (15.0%) |
| $150,000 or more | 10 (6.9%) | 46 (32.9%) |
| Total | 146 (100.0%) | 140 (100.0%) |
Property Value to Household Income Ratio in Humphrey
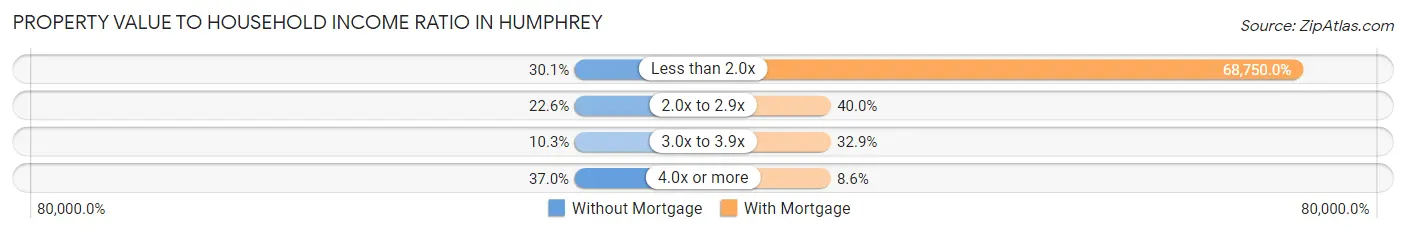
| Value-to-Income Ratio | Without Mortgage | With Mortgage |
| Less than 2.0x | 44 (30.1%) | 96,250 (68,750.0%) |
| 2.0x to 2.9x | 33 (22.6%) | 56 (40.0%) |
| 3.0x to 3.9x | 15 (10.3%) | 46 (32.9%) |
| 4.0x or more | 54 (37.0%) | 12 (8.6%) |
| Total | 146 (100.0%) | 140 (100.0%) |
Real Estate Taxes by Mortgage Status in Humphrey
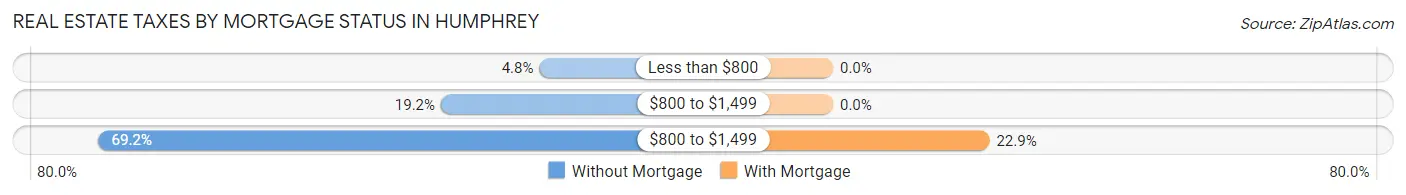
| Property Taxes | Without Mortgage | With Mortgage |
| Less than $800 | 7 (4.8%) | 0 (0.0%) |
| $800 to $1,499 | 28 (19.2%) | 0 (0.0%) |
| $800 to $1,499 | 101 (69.2%) | 32 (22.9%) |
| Total | 146 (100.0%) | 140 (100.0%) |
Health & Disability in Humphrey
Health Insurance Coverage by Age in Humphrey
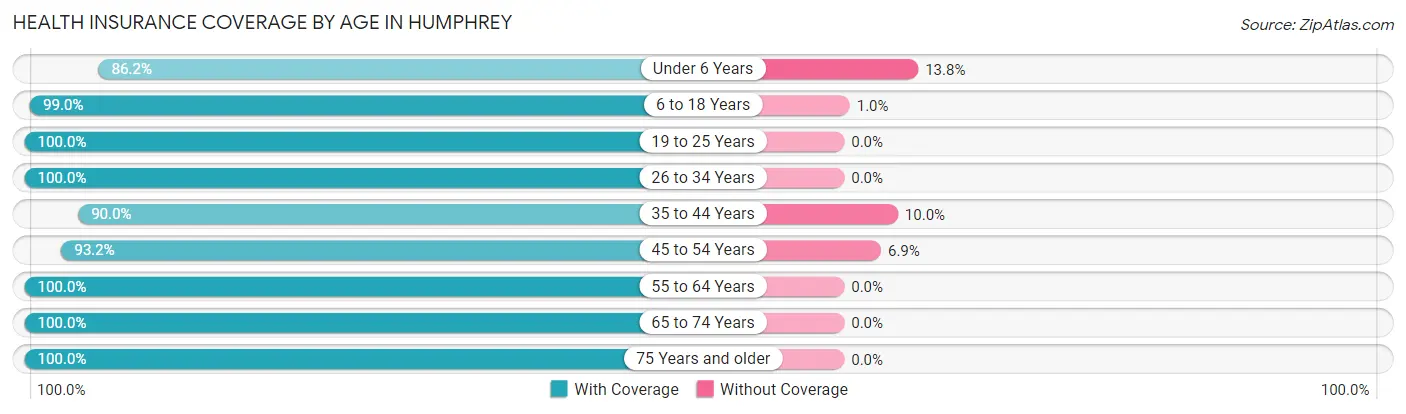
| Age Bracket | With Coverage | Without Coverage |
| Under 6 Years | 75 (86.2%) | 12 (13.8%) |
| 6 to 18 Years | 97 (99.0%) | 1 (1.0%) |
| 19 to 25 Years | 65 (100.0%) | 0 (0.0%) |
| 26 to 34 Years | 98 (100.0%) | 0 (0.0%) |
| 35 to 44 Years | 72 (90.0%) | 8 (10.0%) |
| 45 to 54 Years | 68 (93.1%) | 5 (6.9%) |
| 55 to 64 Years | 64 (100.0%) | 0 (0.0%) |
| 65 to 74 Years | 49 (100.0%) | 0 (0.0%) |
| 75 Years and older | 108 (100.0%) | 0 (0.0%) |
| Total | 696 (96.4%) | 26 (3.6%) |
Health Insurance Coverage by Citizenship Status in Humphrey
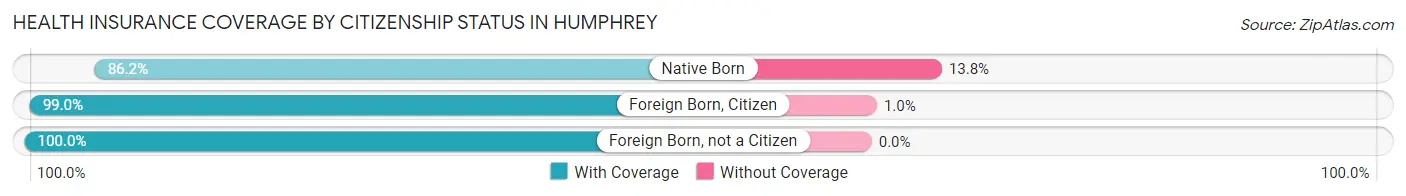
| Citizenship Status | With Coverage | Without Coverage |
| Native Born | 75 (86.2%) | 12 (13.8%) |
| Foreign Born, Citizen | 97 (99.0%) | 1 (1.0%) |
| Foreign Born, not a Citizen | 65 (100.0%) | 0 (0.0%) |
Health Insurance Coverage by Household Income in Humphrey
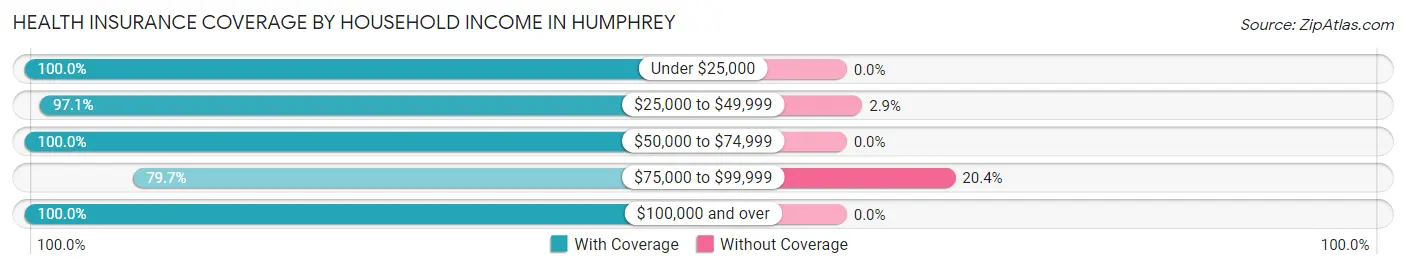
| Household Income | With Coverage | Without Coverage |
| Under $25,000 | 71 (100.0%) | 0 (0.0%) |
| $25,000 to $49,999 | 67 (97.1%) | 2 (2.9%) |
| $50,000 to $74,999 | 124 (100.0%) | 0 (0.0%) |
| $75,000 to $99,999 | 90 (79.6%) | 23 (20.3%) |
| $100,000 and over | 340 (100.0%) | 0 (0.0%) |
Public vs Private Health Insurance Coverage by Age in Humphrey
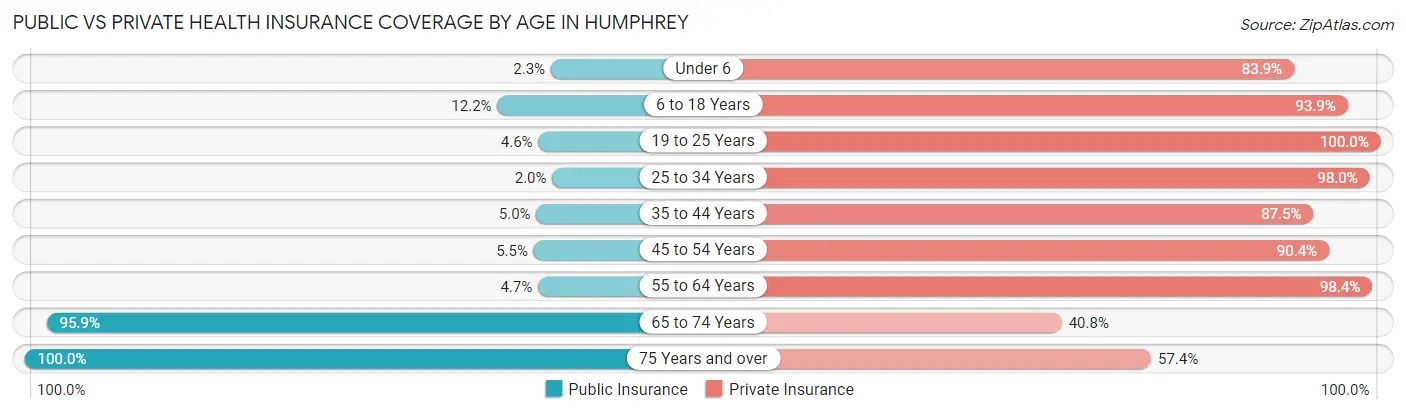
| Age Bracket | Public Insurance | Private Insurance |
| Under 6 | 2 (2.3%) | 73 (83.9%) |
| 6 to 18 Years | 12 (12.2%) | 92 (93.9%) |
| 19 to 25 Years | 3 (4.6%) | 65 (100.0%) |
| 25 to 34 Years | 2 (2.0%) | 96 (98.0%) |
| 35 to 44 Years | 4 (5.0%) | 70 (87.5%) |
| 45 to 54 Years | 4 (5.5%) | 66 (90.4%) |
| 55 to 64 Years | 3 (4.7%) | 63 (98.4%) |
| 65 to 74 Years | 47 (95.9%) | 20 (40.8%) |
| 75 Years and over | 108 (100.0%) | 62 (57.4%) |
| Total | 185 (25.6%) | 607 (84.1%) |
Disability Status by Sex by Age in Humphrey
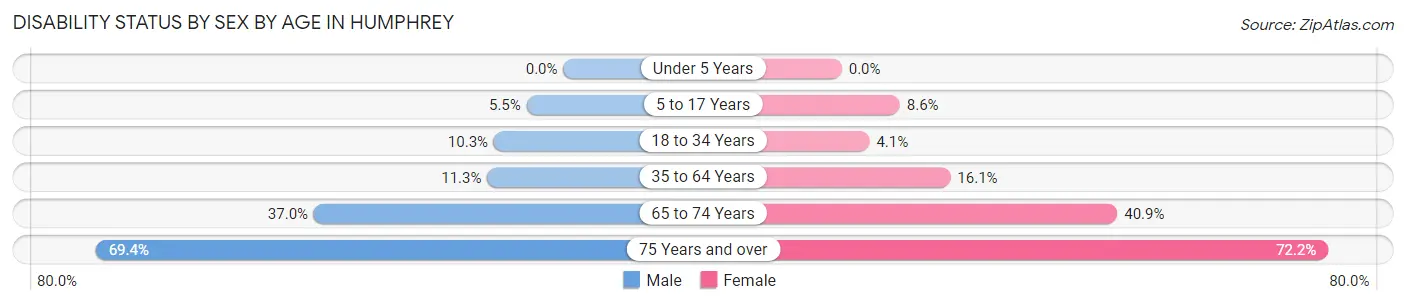
| Age Bracket | Male | Female |
| Under 5 Years | 0 (0.0%) | 0 (0.0%) |
| 5 to 17 Years | 3 (5.4%) | 5 (8.6%) |
| 18 to 34 Years | 10 (10.3%) | 3 (4.1%) |
| 35 to 64 Years | 14 (11.3%) | 15 (16.1%) |
| 65 to 74 Years | 10 (37.0%) | 9 (40.9%) |
| 75 Years and over | 25 (69.4%) | 52 (72.2%) |
Disability Class by Sex by Age in Humphrey
Disability Class: Hearing Difficulty
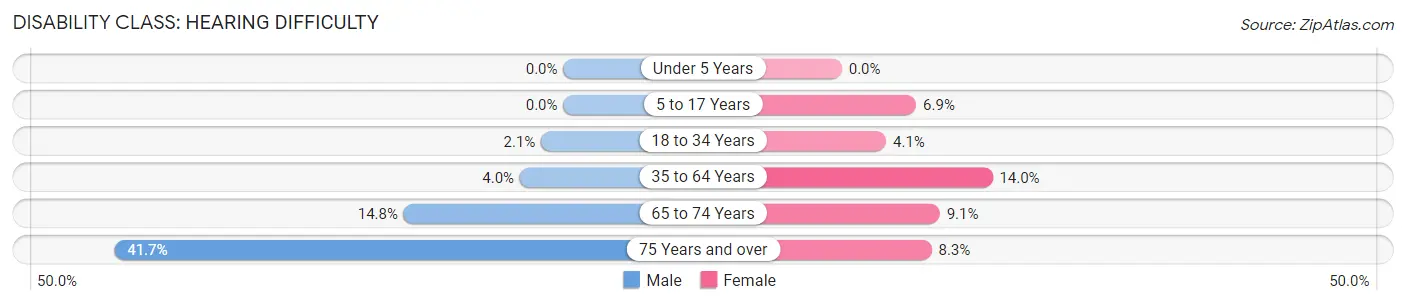
| Age Bracket | Male | Female |
| Under 5 Years | 0 (0.0%) | 0 (0.0%) |
| 5 to 17 Years | 0 (0.0%) | 4 (6.9%) |
| 18 to 34 Years | 2 (2.1%) | 3 (4.1%) |
| 35 to 64 Years | 5 (4.0%) | 13 (14.0%) |
| 65 to 74 Years | 4 (14.8%) | 2 (9.1%) |
| 75 Years and over | 15 (41.7%) | 6 (8.3%) |
Disability Class: Vision Difficulty
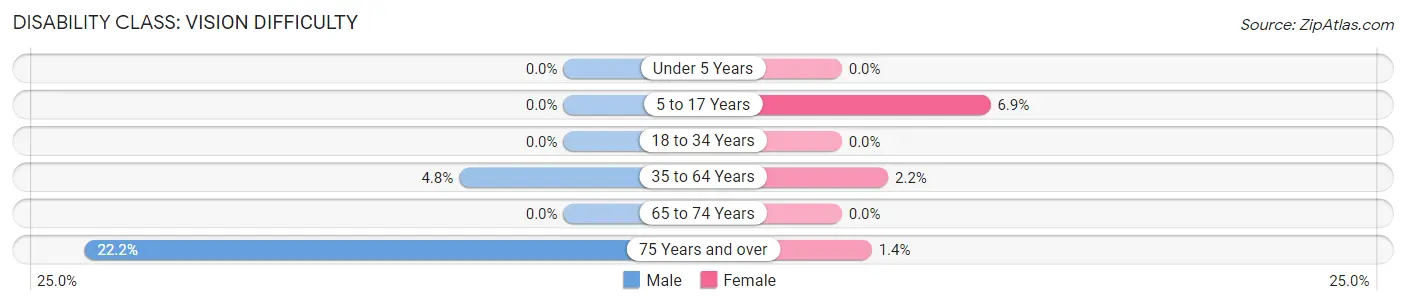
| Age Bracket | Male | Female |
| Under 5 Years | 0 (0.0%) | 0 (0.0%) |
| 5 to 17 Years | 0 (0.0%) | 4 (6.9%) |
| 18 to 34 Years | 0 (0.0%) | 0 (0.0%) |
| 35 to 64 Years | 6 (4.8%) | 2 (2.1%) |
| 65 to 74 Years | 0 (0.0%) | 0 (0.0%) |
| 75 Years and over | 8 (22.2%) | 1 (1.4%) |
Disability Class: Cognitive Difficulty
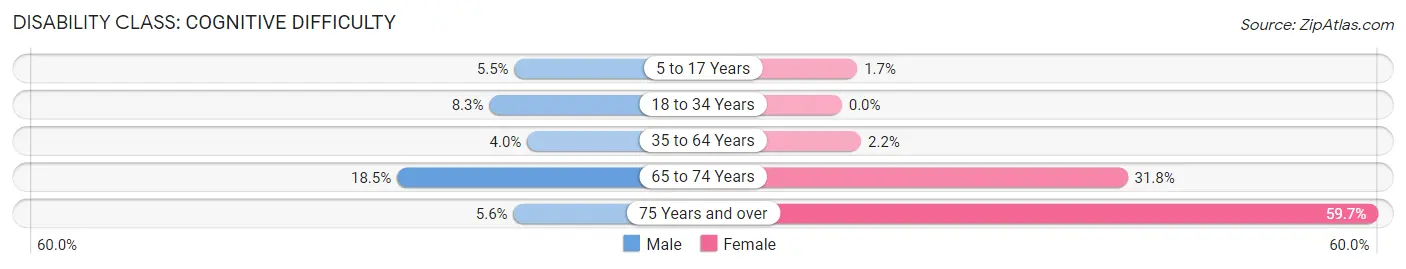
| Age Bracket | Male | Female |
| 5 to 17 Years | 3 (5.4%) | 1 (1.7%) |
| 18 to 34 Years | 8 (8.3%) | 0 (0.0%) |
| 35 to 64 Years | 5 (4.0%) | 2 (2.1%) |
| 65 to 74 Years | 5 (18.5%) | 7 (31.8%) |
| 75 Years and over | 2 (5.6%) | 43 (59.7%) |
Disability Class: Ambulatory Difficulty
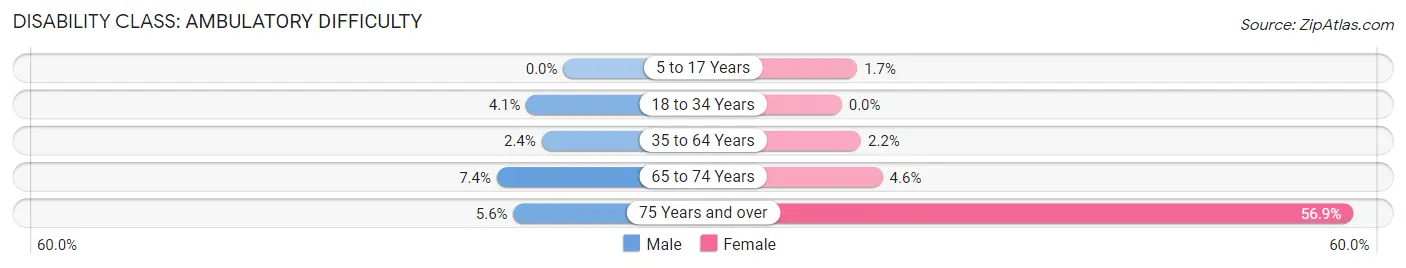
| Age Bracket | Male | Female |
| 5 to 17 Years | 0 (0.0%) | 1 (1.7%) |
| 18 to 34 Years | 4 (4.1%) | 0 (0.0%) |
| 35 to 64 Years | 3 (2.4%) | 2 (2.1%) |
| 65 to 74 Years | 2 (7.4%) | 1 (4.5%) |
| 75 Years and over | 2 (5.6%) | 41 (56.9%) |
Disability Class: Self-Care Difficulty
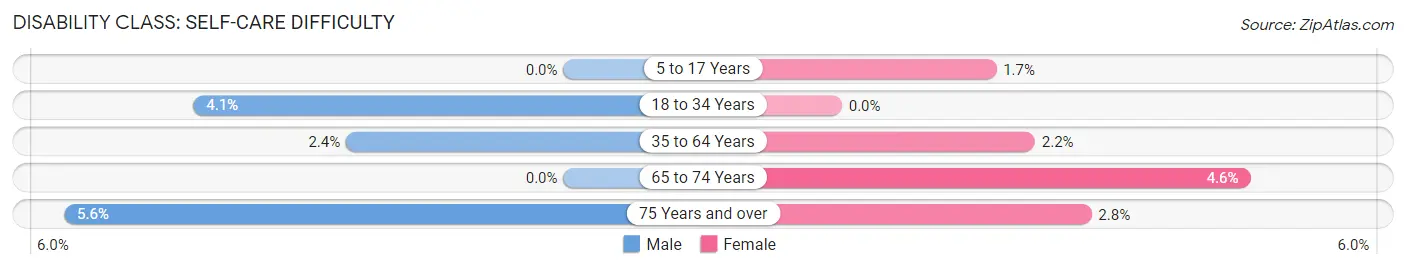
| Age Bracket | Male | Female |
| 5 to 17 Years | 0 (0.0%) | 1 (1.7%) |
| 18 to 34 Years | 4 (4.1%) | 0 (0.0%) |
| 35 to 64 Years | 3 (2.4%) | 2 (2.1%) |
| 65 to 74 Years | 0 (0.0%) | 1 (4.5%) |
| 75 Years and over | 2 (5.6%) | 2 (2.8%) |
Technology Access in Humphrey
Computing Device Access in Humphrey
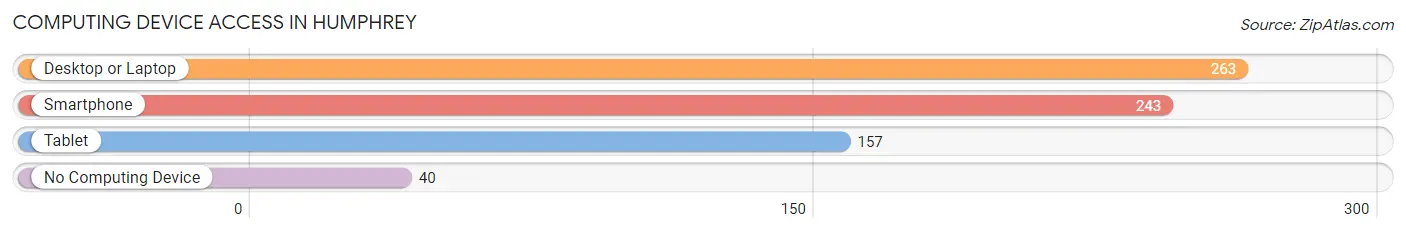
| Device Type | # Households | % Households |
| Desktop or Laptop | 263 | 78.3% |
| Smartphone | 243 | 72.3% |
| Tablet | 157 | 46.7% |
| No Computing Device | 40 | 11.9% |
| Total | 336 | 100.0% |
Internet Access in Humphrey
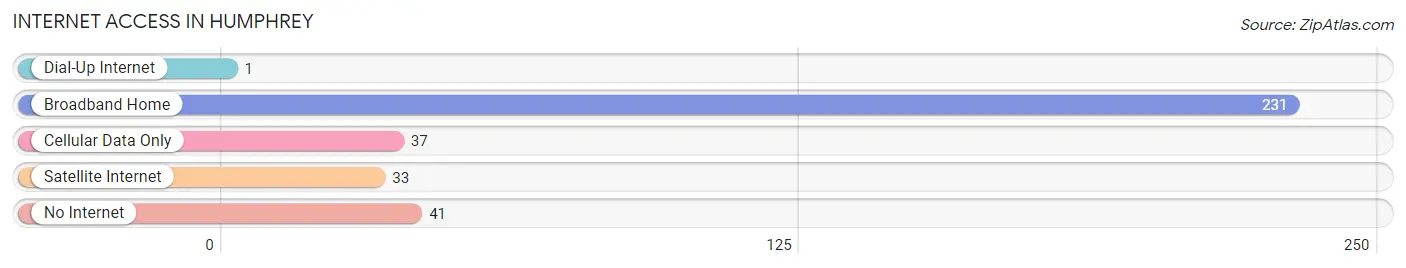
| Internet Type | # Households | % Households |
| Dial-Up Internet | 1 | 0.3% |
| Broadband Home | 231 | 68.8% |
| Cellular Data Only | 37 | 11.0% |
| Satellite Internet | 33 | 9.8% |
| No Internet | 41 | 12.2% |
| Total | 336 | 100.0% |
Humphrey Summary
Humphrey, Nebraska is a small city located in Platte County, Nebraska. It is situated along the Platte River, approximately 30 miles northwest of Omaha. The city was founded in 1871 and has a population of 1,845 as of the 2020 census.
History
Humphrey was founded in 1871 by a group of German immigrants led by John and Mary Humphrey. The city was named after John Humphrey, who was a prominent figure in the area. The city was originally a farming community, but it soon developed into a small industrial center. The first industry in the city was a flour mill, which was built in 1872. The mill was later replaced by a brickyard, which operated until the early 1900s.
In the late 1800s, Humphrey was a thriving community with a population of over 1,000. The city had several churches, a school, a bank, a post office, and a variety of businesses. The city was also home to a number of fraternal organizations, including the Masons, Odd Fellows, and Knights of Pythias.
In the early 1900s, Humphrey experienced a period of decline. The brickyard closed in 1906, and the population began to decline. The Great Depression further exacerbated the decline, and by 1940 the population had dropped to just over 500.
Geography
Humphrey is located in Platte County, Nebraska, approximately 30 miles northwest of Omaha. The city is situated along the Platte River, and is surrounded by rolling hills and farmland. The city has a total area of 1.2 square miles, all of which is land.
Economy
Humphrey’s economy is largely based on agriculture and manufacturing. The city is home to several manufacturing companies, including a plastics manufacturer, a metal fabrication company, and a food processing plant. The city also has a number of small businesses, including restaurants, retail stores, and service providers.
Demographics
As of the 2020 census, Humphrey had a population of 1,845. The racial makeup of the city was 95.2% White, 0.7% African American, 0.3% Native American, 0.3% Asian, 0.1% Pacific Islander, 1.2% from other races, and 2.3% from two or more races. Hispanic or Latino of any race were 3.2% of the population.
The median household income in Humphrey was $45,938, and the median family income was $51,938. The per capita income was $20,938. About 8.3% of families and 10.2% of the population were below the poverty line, including 13.2% of those under age 18 and 8.3% of those age 65 or over.
Humphrey is a small city with a rich history and a diverse population. The city has a strong agricultural and manufacturing base, and is home to a variety of businesses and organizations. The city is a great place to live, work, and raise a family.
Common Questions
What is Per Capita Income in Humphrey?
Per Capita income in Humphrey is $36,581.
What is the Median Family Income in Humphrey?
Median Family Income in Humphrey is $106,094.
What is the Median Household income in Humphrey?
Median Household Income in Humphrey is $67,750.
What is Income or Wage Gap in Humphrey?
Income or Wage Gap in Humphrey is 23.7%.
Women in Humphrey earn 76.3 cents for every dollar earned by a man.
What is Inequality or Gini Index in Humphrey?
Inequality or Gini Index in Humphrey is 0.36.
What is the Total Population of Humphrey?
Total Population of Humphrey is 722.
What is the Total Male Population of Humphrey?
Total Male Population of Humphrey is 358.
What is the Total Female Population of Humphrey?
Total Female Population of Humphrey is 364.
What is the Ratio of Males per 100 Females in Humphrey?
There are 98.35 Males per 100 Females in Humphrey.
What is the Ratio of Females per 100 Males in Humphrey?
There are 101.68 Females per 100 Males in Humphrey.
What is the Median Population Age in Humphrey?
Median Population Age in Humphrey is 35.9 Years.
What is the Average Family Size in Humphrey
Average Family Size in Humphrey is 3.0 People.
What is the Average Household Size in Humphrey
Average Household Size in Humphrey is 2.1 People.
How Large is the Labor Force in Humphrey?
There are 387 People in the Labor Forcein in Humphrey.
What is the Percentage of People in the Labor Force in Humphrey?
69.2% of People are in the Labor Force in Humphrey.
What is the Unemployment Rate in Humphrey?
Unemployment Rate in Humphrey is 1.6%.