Hebron, NE Map & Demographics
Hebron Map
Hebron Overview
$35,361
PER CAPITA INCOME
$94,205
AVG FAMILY INCOME
$66,786
AVG HOUSEHOLD INCOME
49.9%
WAGE / INCOME GAP [ % ]
50.1¢/ $1
WAGE / INCOME GAP [ $ ]
0.39
INEQUALITY / GINI INDEX
1,569
TOTAL POPULATION
698
MALE POPULATION
871
FEMALE POPULATION
80.14
MALES / 100 FEMALES
124.79
FEMALES / 100 MALES
48.0
MEDIAN AGE
3.0
AVG FAMILY SIZE
2.2
AVG HOUSEHOLD SIZE
760
LABOR FORCE [ PEOPLE ]
59.3%
PERCENT IN LABOR FORCE
1.7%
UNEMPLOYMENT RATE
Hebron Zip Codes
Hebron Area Codes
Income in Hebron
Income Overview in Hebron
Per Capita Income in Hebron is $35,361, while median incomes of families and households are $94,205 and $66,786 respectively.
| Characteristic | Number | Measure |
| Per Capita Income | 1,569 | $35,361 |
| Median Family Income | 337 | $94,205 |
| Mean Family Income | 337 | $102,686 |
| Median Household Income | 666 | $66,786 |
| Mean Household Income | 666 | $80,212 |
| Income Deficit | 337 | $0 |
| Wage / Income Gap (%) | 1,569 | 49.86% |
| Wage / Income Gap ($) | 1,569 | 50.14¢ per $1 |
| Gini / Inequality Index | 1,569 | 0.39 |
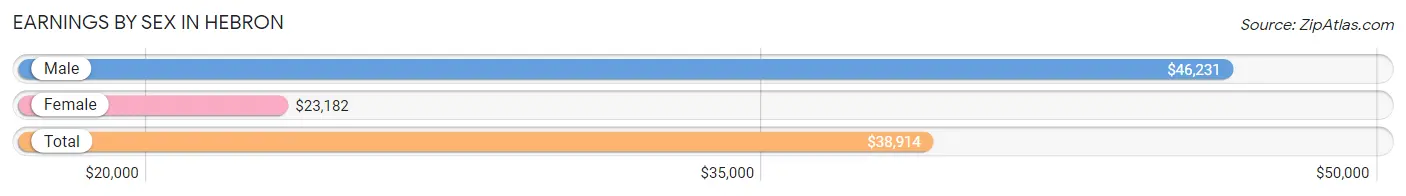
Earnings by Sex in Hebron
Average Earnings in Hebron are $38,914, $46,231 for men and $23,182 for women, a difference of 49.9%.
| Sex | Number | Average Earnings |
| Male | 413 (49.9%) | $46,231 |
| Female | 414 (50.1%) | $23,182 |
| Total | 827 (100.0%) | $38,914 |
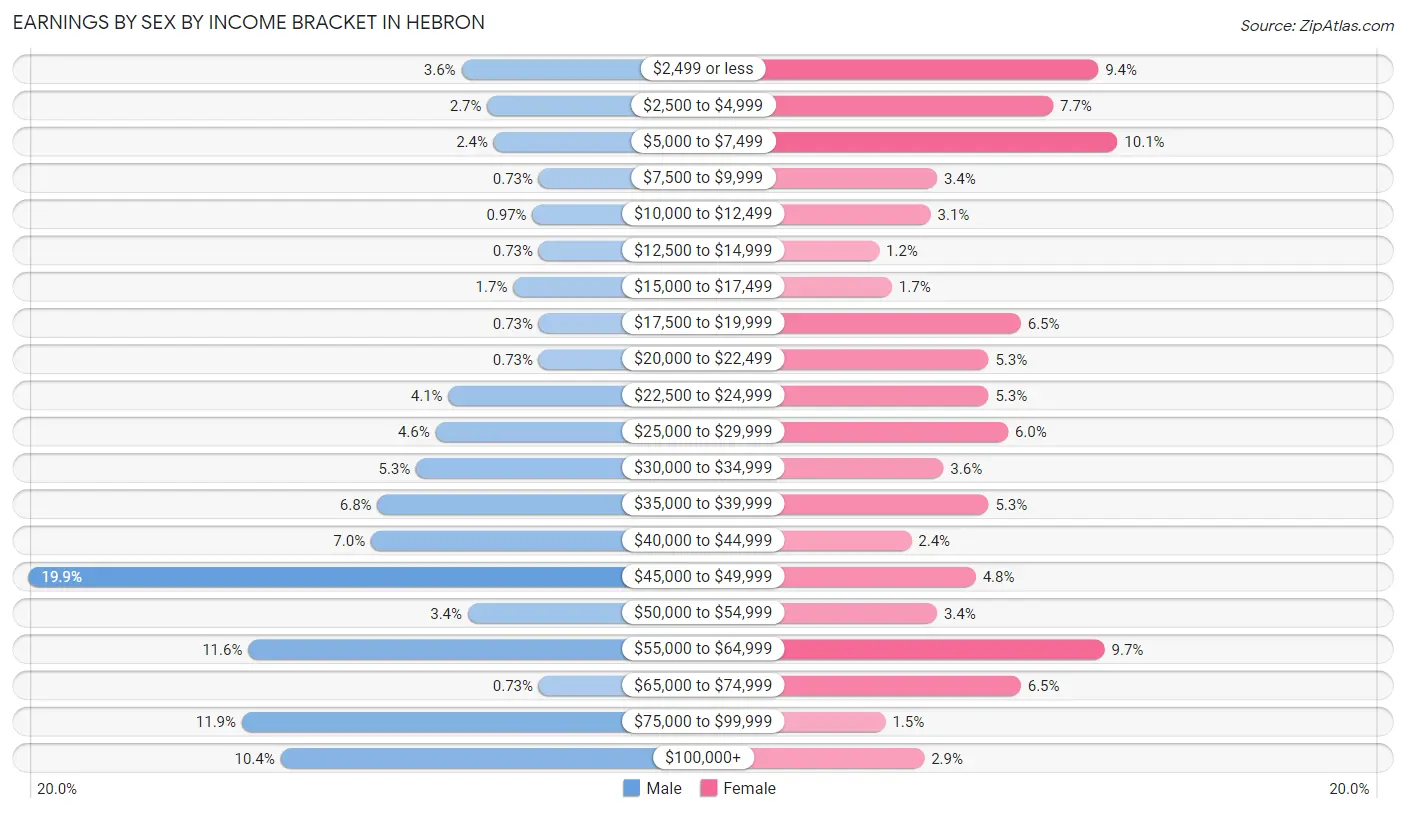
Earnings by Sex by Income Bracket in Hebron
The most common earnings brackets in Hebron are $45,000 to $49,999 for men (82 | 19.9%) and $5,000 to $7,499 for women (42 | 10.1%).
| Income | Male | Female |
| $2,499 or less | 15 (3.6%) | 39 (9.4%) |
| $2,500 to $4,999 | 11 (2.7%) | 32 (7.7%) |
| $5,000 to $7,499 | 10 (2.4%) | 42 (10.1%) |
| $7,500 to $9,999 | 3 (0.7%) | 14 (3.4%) |
| $10,000 to $12,499 | 4 (1.0%) | 13 (3.1%) |
| $12,500 to $14,999 | 3 (0.7%) | 5 (1.2%) |
| $15,000 to $17,499 | 7 (1.7%) | 7 (1.7%) |
| $17,500 to $19,999 | 3 (0.7%) | 27 (6.5%) |
| $20,000 to $22,499 | 3 (0.7%) | 22 (5.3%) |
| $22,500 to $24,999 | 17 (4.1%) | 22 (5.3%) |
| $25,000 to $29,999 | 19 (4.6%) | 25 (6.0%) |
| $30,000 to $34,999 | 22 (5.3%) | 15 (3.6%) |
| $35,000 to $39,999 | 28 (6.8%) | 22 (5.3%) |
| $40,000 to $44,999 | 29 (7.0%) | 10 (2.4%) |
| $45,000 to $49,999 | 82 (19.9%) | 20 (4.8%) |
| $50,000 to $54,999 | 14 (3.4%) | 14 (3.4%) |
| $55,000 to $64,999 | 48 (11.6%) | 40 (9.7%) |
| $65,000 to $74,999 | 3 (0.7%) | 27 (6.5%) |
| $75,000 to $99,999 | 49 (11.9%) | 6 (1.5%) |
| $100,000+ | 43 (10.4%) | 12 (2.9%) |
| Total | 413 (100.0%) | 414 (100.0%) |
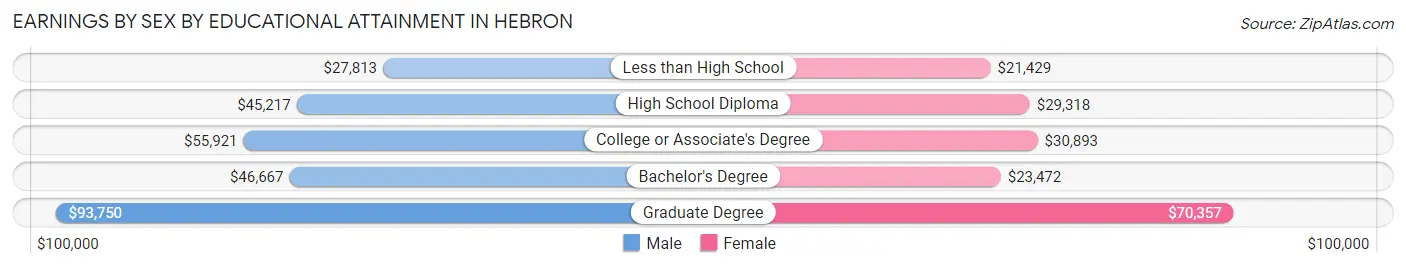
Earnings by Sex by Educational Attainment in Hebron
Average earnings in Hebron are $46,486 for men and $31,071 for women, a difference of 33.2%. Men with an educational attainment of graduate degree enjoy the highest average annual earnings of $93,750, while those with less than high school education earn the least with $27,813. Women with an educational attainment of graduate degree earn the most with the average annual earnings of $70,357, while those with less than high school education have the smallest earnings of $21,429.
| Educational Attainment | Male Income | Female Income |
| Less than High School | $27,813 | $21,429 |
| High School Diploma | $45,217 | $29,318 |
| College or Associate's Degree | $55,921 | $30,893 |
| Bachelor's Degree | $46,667 | $23,472 |
| Graduate Degree | $93,750 | $70,357 |
| Total | $46,486 | $31,071 |
Family Income in Hebron
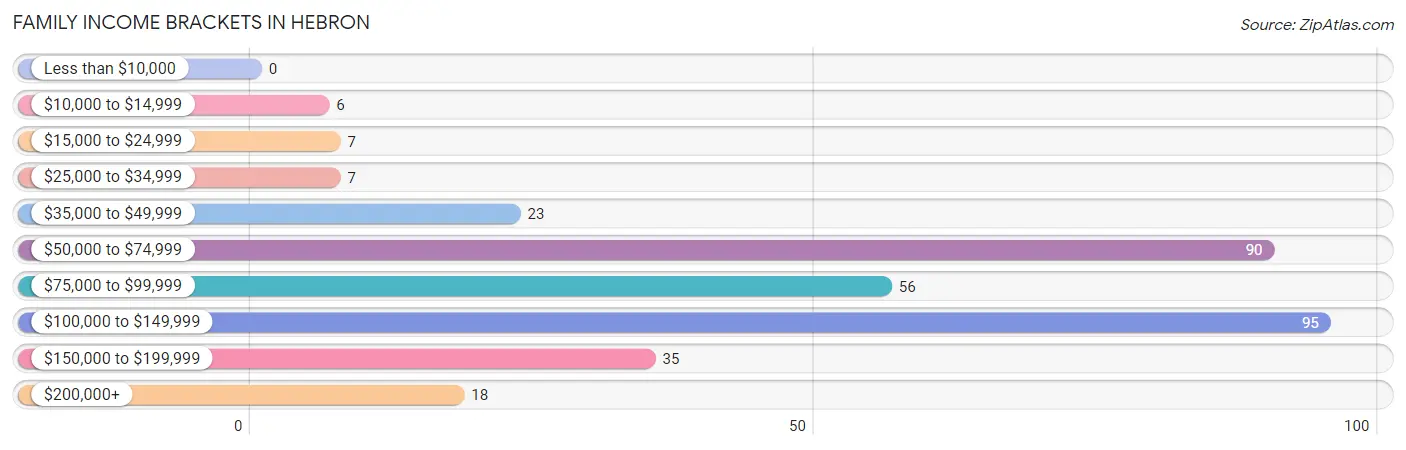
Family Income Brackets in Hebron
According to the Hebron family income data, there are 95 families falling into the $100,000 to $149,999 income range, which is the most common income bracket and makes up 28.2% of all families.
| Income Bracket | # Families | % Families |
| Less than $10,000 | 0 | 0.0% |
| $10,000 to $14,999 | 6 | 1.8% |
| $15,000 to $24,999 | 7 | 2.1% |
| $25,000 to $34,999 | 7 | 2.1% |
| $35,000 to $49,999 | 23 | 6.8% |
| $50,000 to $74,999 | 90 | 26.7% |
| $75,000 to $99,999 | 56 | 16.6% |
| $100,000 to $149,999 | 95 | 28.2% |
| $150,000 to $199,999 | 35 | 10.4% |
| $200,000+ | 18 | 5.3% |
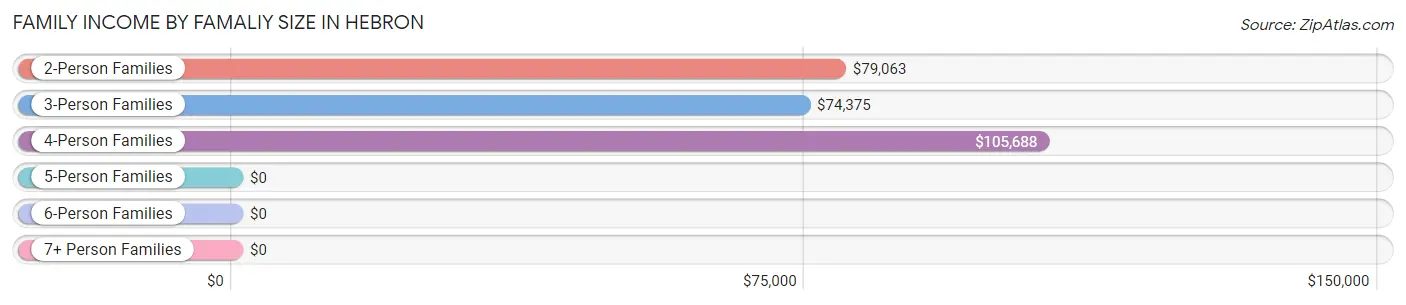
Family Income by Famaliy Size in Hebron
4-person families (73 | 21.7%) account for the highest median family income in Hebron with $105,688 per family, while 2-person families (202 | 59.9%) have the highest median income of $39,532 per family member.
| Income Bracket | # Families | Median Income |
| 2-Person Families | 202 (59.9%) | $79,063 |
| 3-Person Families | 26 (7.7%) | $74,375 |
| 4-Person Families | 73 (21.7%) | $105,688 |
| 5-Person Families | 13 (3.9%) | $0 |
| 6-Person Families | 12 (3.6%) | $0 |
| 7+ Person Families | 11 (3.3%) | $0 |
| Total | 337 (100.0%) | $94,205 |
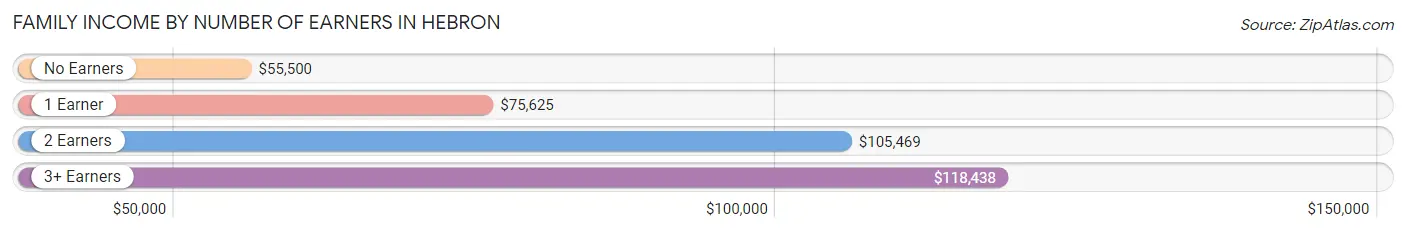
Family Income by Number of Earners in Hebron
The median family income in Hebron is $94,205, with families comprising 3+ earners (31) having the highest median family income of $118,438, while families with no earners (44) have the lowest median family income of $55,500, accounting for 9.2% and 13.1% of families, respectively.
| Number of Earners | # Families | Median Income |
| No Earners | 44 (13.1%) | $55,500 |
| 1 Earner | 73 (21.7%) | $75,625 |
| 2 Earners | 189 (56.1%) | $105,469 |
| 3+ Earners | 31 (9.2%) | $118,438 |
| Total | 337 (100.0%) | $94,205 |
Household Income in Hebron
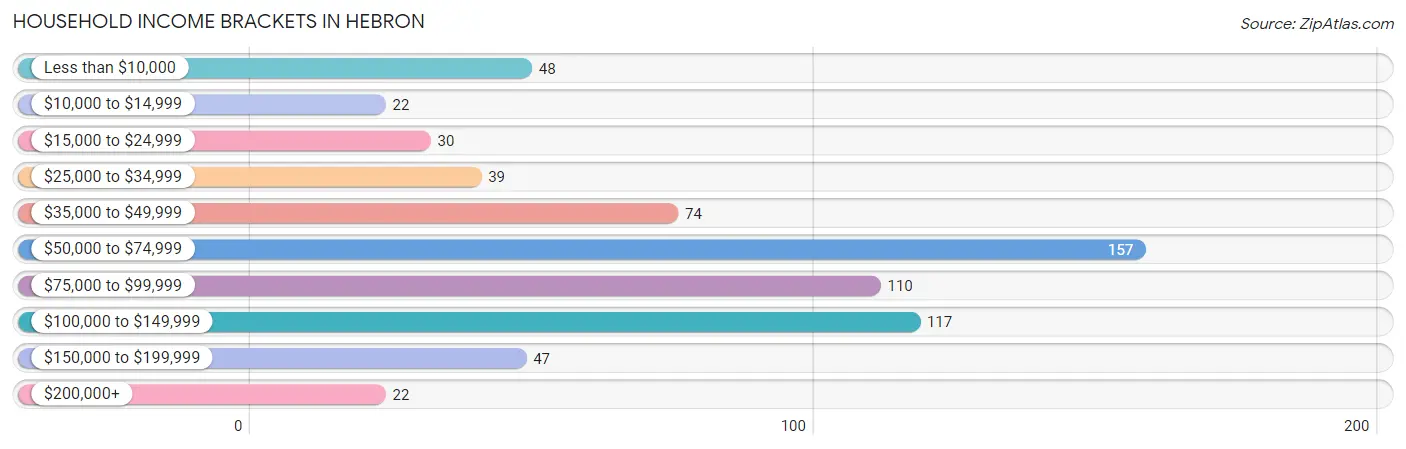
Household Income Brackets in Hebron
With 157 households falling in the category, the $50,000 to $74,999 income range is the most frequent in Hebron, accounting for 23.6% of all households. In contrast, only 22 households (3.3%) fall into the $10,000 to $14,999 income bracket, making it the least populous group.
| Income Bracket | # Households | % Households |
| Less than $10,000 | 48 | 7.2% |
| $10,000 to $14,999 | 22 | 3.3% |
| $15,000 to $24,999 | 30 | 4.5% |
| $25,000 to $34,999 | 39 | 5.9% |
| $35,000 to $49,999 | 74 | 11.1% |
| $50,000 to $74,999 | 157 | 23.6% |
| $75,000 to $99,999 | 110 | 16.5% |
| $100,000 to $149,999 | 117 | 17.6% |
| $150,000 to $199,999 | 47 | 7.1% |
| $200,000+ | 22 | 3.3% |
Household Income by Householder Age in Hebron
The median household income in Hebron is $66,786, with the highest median household income of $93,906 found in the 45 to 64 years age bracket for the primary householder. A total of 181 households (27.2%) fall into this category. Meanwhile, the 15 to 24 years age bracket for the primary householder has the lowest median household income of $56,667, with 60 households (9.0%) in this group.
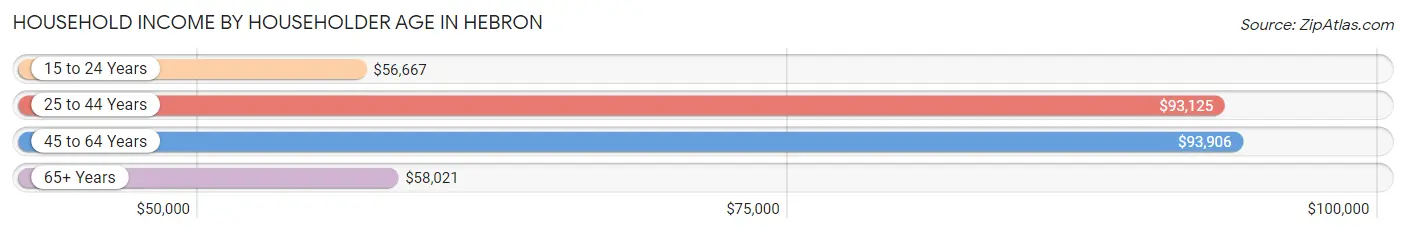
| Income Bracket | # Households | Median Income |
| 15 to 24 Years | 60 (9.0%) | $56,667 |
| 25 to 44 Years | 146 (21.9%) | $93,125 |
| 45 to 64 Years | 181 (27.2%) | $93,906 |
| 65+ Years | 279 (41.9%) | $58,021 |
| Total | 666 (100.0%) | $66,786 |
Poverty in Hebron
Income Below Poverty by Sex and Age in Hebron
With 5.4% poverty level for males and 15.2% for females among the residents of Hebron, 18 to 24 year old males and 18 to 24 year old females are the most vulnerable to poverty, with 12 males (17.4%) and 39 females (62.9%) in their respective age groups living below the poverty level.
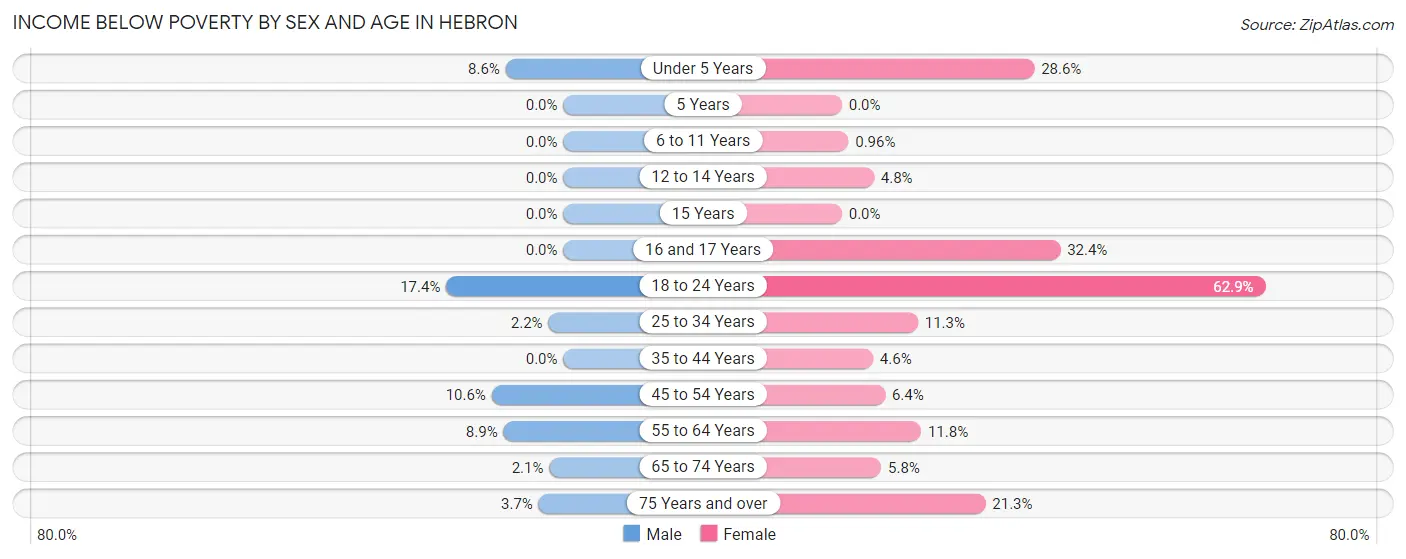
| Age Bracket | Male | Female |
| Under 5 Years | 3 (8.6%) | 8 (28.6%) |
| 5 Years | 0 (0.0%) | 0 (0.0%) |
| 6 to 11 Years | 0 (0.0%) | 1 (1.0%) |
| 12 to 14 Years | 0 (0.0%) | 1 (4.8%) |
| 15 Years | 0 (0.0%) | 0 (0.0%) |
| 16 and 17 Years | 0 (0.0%) | 12 (32.4%) |
| 18 to 24 Years | 12 (17.4%) | 39 (62.9%) |
| 25 to 34 Years | 2 (2.2%) | 7 (11.3%) |
| 35 to 44 Years | 0 (0.0%) | 3 (4.6%) |
| 45 to 54 Years | 5 (10.6%) | 5 (6.4%) |
| 55 to 64 Years | 8 (8.9%) | 10 (11.8%) |
| 65 to 74 Years | 2 (2.1%) | 6 (5.8%) |
| 75 Years and over | 3 (3.7%) | 29 (21.3%) |
| Total | 35 (5.4%) | 121 (15.2%) |
Income Above Poverty by Sex and Age in Hebron
According to the poverty statistics in Hebron, males aged 5 years and females aged 5 years are the age groups that are most secure financially, with 100.0% of males and 100.0% of females in these age groups living above the poverty line.
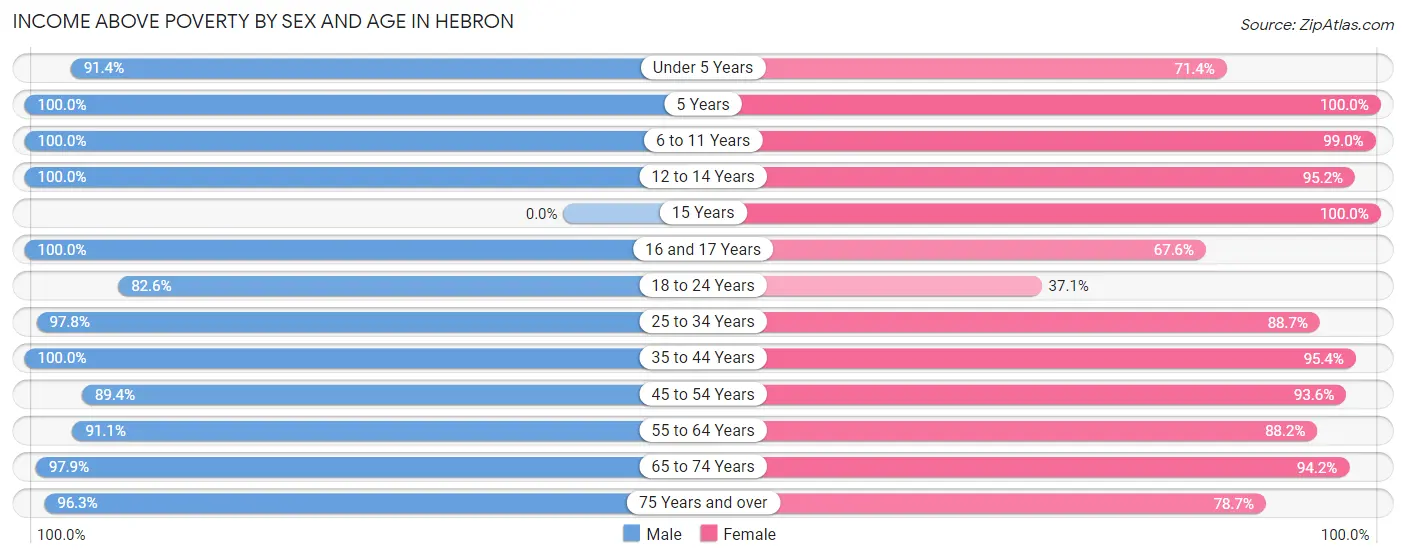
| Age Bracket | Male | Female |
| Under 5 Years | 32 (91.4%) | 20 (71.4%) |
| 5 Years | 13 (100.0%) | 3 (100.0%) |
| 6 to 11 Years | 38 (100.0%) | 103 (99.0%) |
| 12 to 14 Years | 11 (100.0%) | 20 (95.2%) |
| 15 Years | 0 (0.0%) | 11 (100.0%) |
| 16 and 17 Years | 13 (100.0%) | 25 (67.6%) |
| 18 to 24 Years | 57 (82.6%) | 23 (37.1%) |
| 25 to 34 Years | 88 (97.8%) | 55 (88.7%) |
| 35 to 44 Years | 69 (100.0%) | 62 (95.4%) |
| 45 to 54 Years | 42 (89.4%) | 73 (93.6%) |
| 55 to 64 Years | 82 (91.1%) | 75 (88.2%) |
| 65 to 74 Years | 94 (97.9%) | 97 (94.2%) |
| 75 Years and over | 79 (96.3%) | 107 (78.7%) |
| Total | 618 (94.6%) | 674 (84.8%) |
Income Below Poverty Among Married-Couple Families in Hebron
The poverty statistics for married-couple families in Hebron show that 3.0% or 9 of the total 300 families live below the poverty line. Families with 3 or 4 children have the highest poverty rate of 12.5%, comprising of 2 families. On the other hand, families with 1 or 2 children have the lowest poverty rate of 0.0%, which includes 0 families.
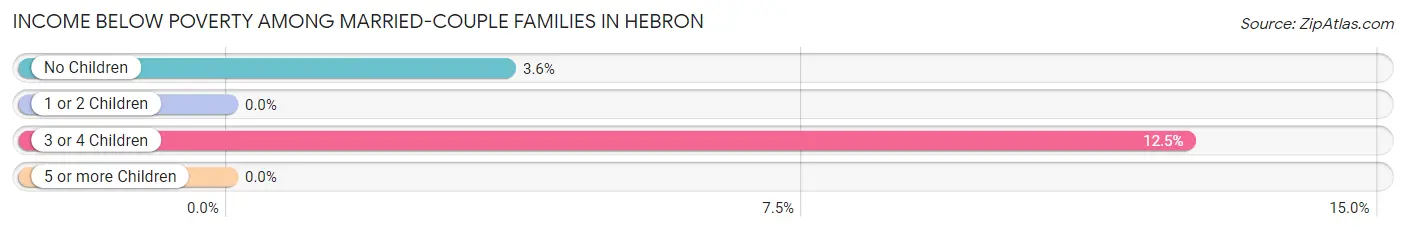
| Children | Above Poverty | Below Poverty |
| No Children | 186 (96.4%) | 7 (3.6%) |
| 1 or 2 Children | 82 (100.0%) | 0 (0.0%) |
| 3 or 4 Children | 14 (87.5%) | 2 (12.5%) |
| 5 or more Children | 9 (100.0%) | 0 (0.0%) |
| Total | 291 (97.0%) | 9 (3.0%) |
Income Below Poverty Among Single-Parent Households in Hebron
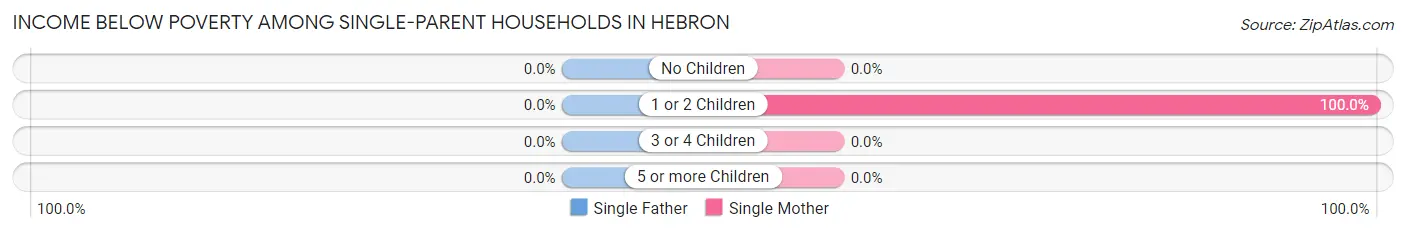
| Children | Single Father | Single Mother |
| No Children | 0 (0.0%) | 0 (0.0%) |
| 1 or 2 Children | 0 (0.0%) | 6 (100.0%) |
| 3 or 4 Children | 0 (0.0%) | 0 (0.0%) |
| 5 or more Children | 0 (0.0%) | 0 (0.0%) |
| Total | 0 (0.0%) | 6 (37.5%) |
Income Below Poverty Among Married-Couple vs Single-Parent Households in Hebron
The poverty data for Hebron shows that 9 of the married-couple family households (3.0%) and 6 of the single-parent households (16.2%) are living below the poverty level. Within the married-couple family households, those with 3 or 4 children have the highest poverty rate, with 2 households (12.5%) falling below the poverty line. Among the single-parent households, those with 1 or 2 children have the highest poverty rate, with 6 household (31.6%) living below poverty.
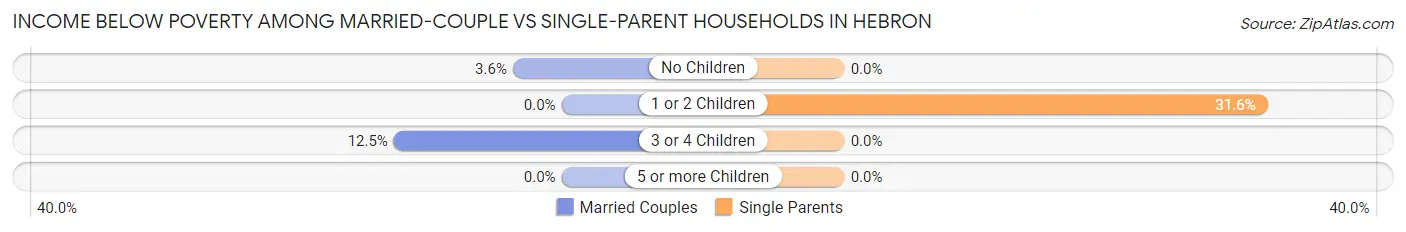
| Children | Married-Couple Families | Single-Parent Households |
| No Children | 7 (3.6%) | 0 (0.0%) |
| 1 or 2 Children | 0 (0.0%) | 6 (31.6%) |
| 3 or 4 Children | 2 (12.5%) | 0 (0.0%) |
| 5 or more Children | 0 (0.0%) | 0 (0.0%) |
| Total | 9 (3.0%) | 6 (16.2%) |
Race in Hebron
The most populous races in Hebron are White / Caucasian (1,500 | 95.6%), Two or more Races (60 | 3.8%), and Hispanic or Latino (14 | 0.9%).
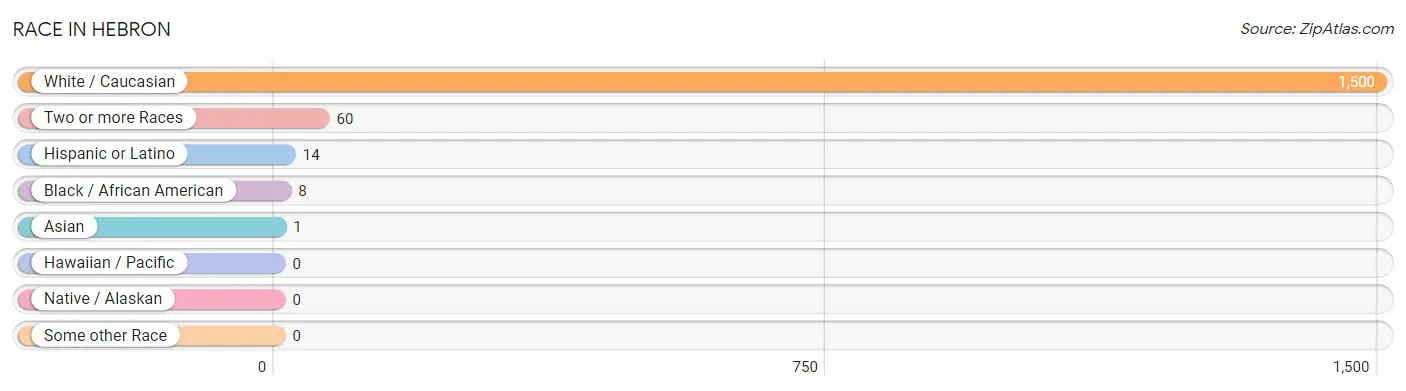
| Race | # Population | % Population |
| Asian | 1 | 0.1% |
| Black / African American | 8 | 0.5% |
| Hawaiian / Pacific | 0 | 0.0% |
| Hispanic or Latino | 14 | 0.9% |
| Native / Alaskan | 0 | 0.0% |
| White / Caucasian | 1,500 | 95.6% |
| Two or more Races | 60 | 3.8% |
| Some other Race | 0 | 0.0% |
| Total | 1,569 | 100.0% |
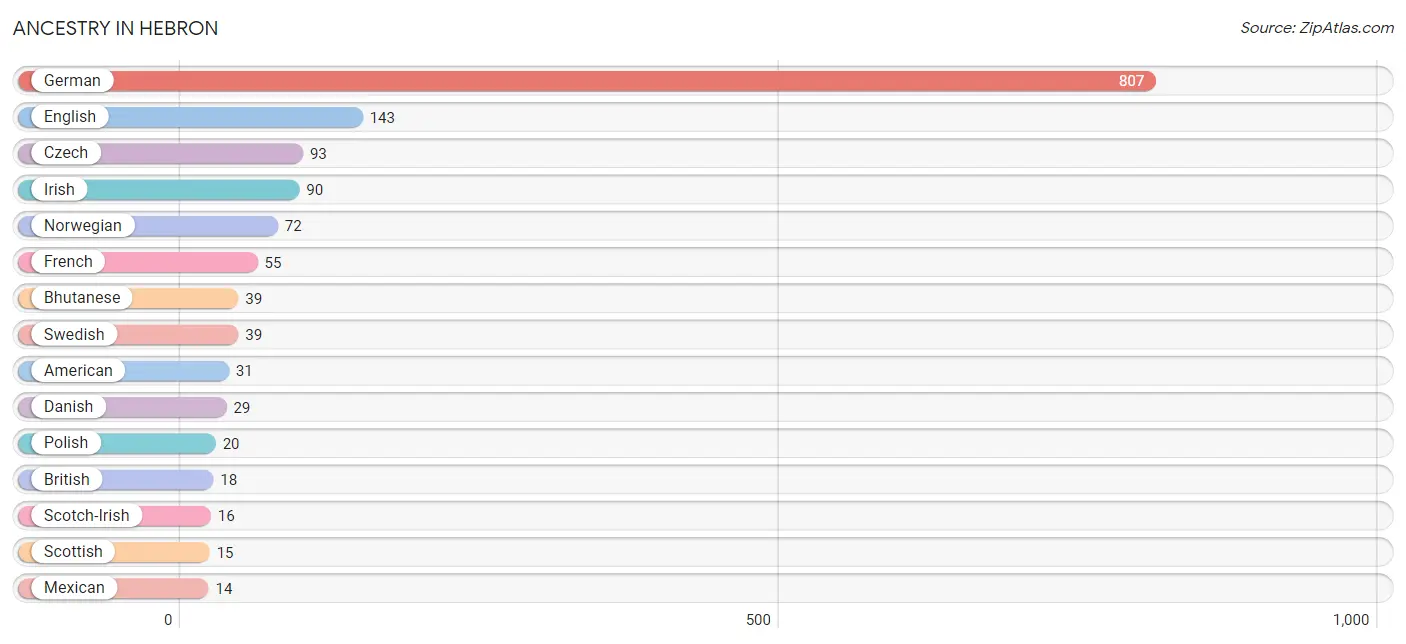
Ancestry in Hebron
The most populous ancestries reported in Hebron are German (807 | 51.4%), English (143 | 9.1%), Czech (93 | 5.9%), Irish (90 | 5.7%), and Norwegian (72 | 4.6%), together accounting for 76.8% of all Hebron residents.
| Ancestry | # Population | % Population |
| American | 31 | 2.0% |
| Belgian | 10 | 0.6% |
| Bhutanese | 39 | 2.5% |
| British | 18 | 1.1% |
| Cherokee | 2 | 0.1% |
| Choctaw | 5 | 0.3% |
| Czech | 93 | 5.9% |
| Czechoslovakian | 8 | 0.5% |
| Danish | 29 | 1.8% |
| Dutch | 8 | 0.5% |
| Eastern European | 2 | 0.1% |
| English | 143 | 9.1% |
| European | 4 | 0.3% |
| French | 55 | 3.5% |
| German | 807 | 51.4% |
| Indonesian | 1 | 0.1% |
| Irish | 90 | 5.7% |
| Italian | 7 | 0.4% |
| Mexican | 14 | 0.9% |
| Norwegian | 72 | 4.6% |
| Polish | 20 | 1.3% |
| Russian | 3 | 0.2% |
| Scandinavian | 3 | 0.2% |
| Scotch-Irish | 16 | 1.0% |
| Scottish | 15 | 1.0% |
| Sioux | 1 | 0.1% |
| Swedish | 39 | 2.5% |
| Swiss | 3 | 0.2% |
| Welsh | 13 | 0.8% | View All 29 Rows |
Immigrants in Hebron
The most numerous immigrant groups reported in Hebron came from Central America (7 | 0.4%), Latin America (7 | 0.4%), Mexico (7 | 0.4%), Asia (1 | 0.1%), and South Eastern Asia (1 | 0.1%), together accounting for 1.5% of all Hebron residents.
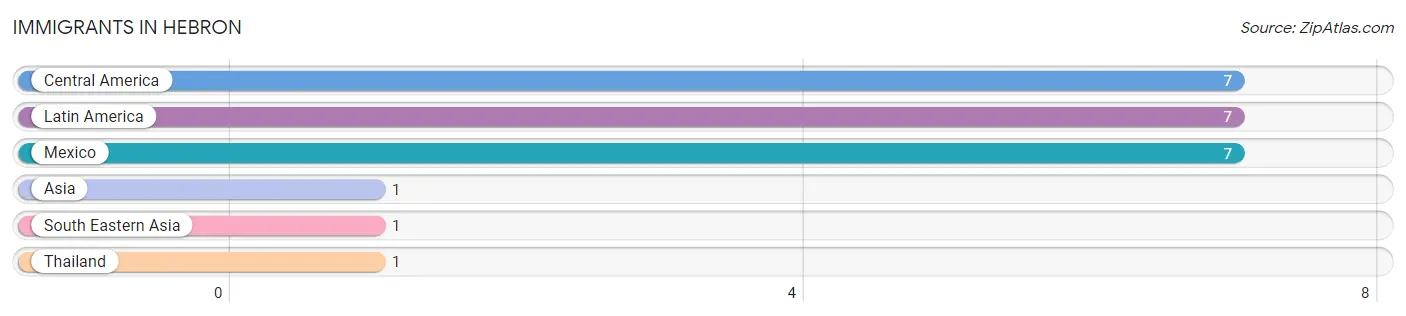
| Immigration Origin | # Population | % Population |
| Asia | 1 | 0.1% |
| Central America | 7 | 0.4% |
| Latin America | 7 | 0.4% |
| Mexico | 7 | 0.4% |
| South Eastern Asia | 1 | 0.1% |
| Thailand | 1 | 0.1% | View All 6 Rows |
Sex and Age in Hebron
Sex and Age in Hebron
The most populous age groups in Hebron are 25 to 29 Years (56 | 8.0%) for men and 85 Years and over (95 | 10.9%) for women.
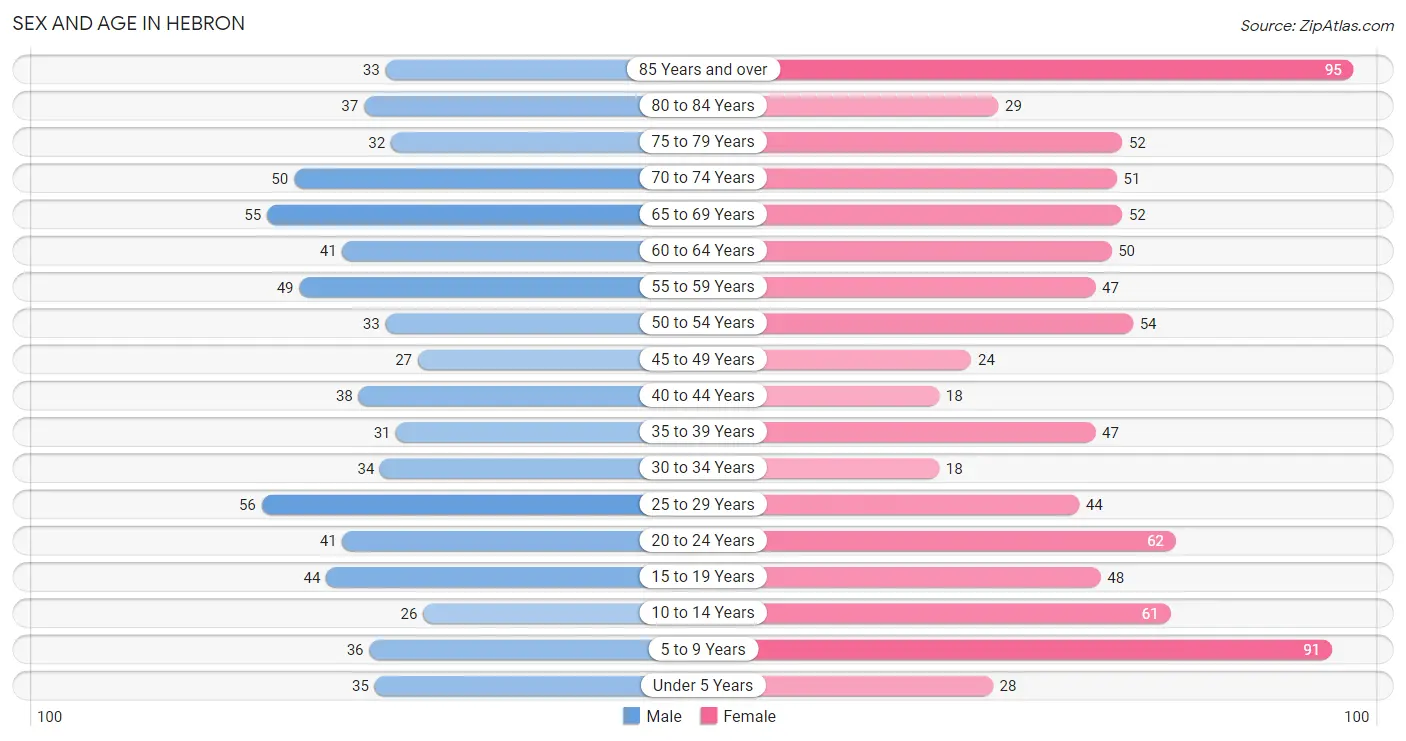
| Age Bracket | Male | Female |
| Under 5 Years | 35 (5.0%) | 28 (3.2%) |
| 5 to 9 Years | 36 (5.2%) | 91 (10.4%) |
| 10 to 14 Years | 26 (3.7%) | 61 (7.0%) |
| 15 to 19 Years | 44 (6.3%) | 48 (5.5%) |
| 20 to 24 Years | 41 (5.9%) | 62 (7.1%) |
| 25 to 29 Years | 56 (8.0%) | 44 (5.1%) |
| 30 to 34 Years | 34 (4.9%) | 18 (2.1%) |
| 35 to 39 Years | 31 (4.4%) | 47 (5.4%) |
| 40 to 44 Years | 38 (5.4%) | 18 (2.1%) |
| 45 to 49 Years | 27 (3.9%) | 24 (2.8%) |
| 50 to 54 Years | 33 (4.7%) | 54 (6.2%) |
| 55 to 59 Years | 49 (7.0%) | 47 (5.4%) |
| 60 to 64 Years | 41 (5.9%) | 50 (5.7%) |
| 65 to 69 Years | 55 (7.9%) | 52 (6.0%) |
| 70 to 74 Years | 50 (7.2%) | 51 (5.9%) |
| 75 to 79 Years | 32 (4.6%) | 52 (6.0%) |
| 80 to 84 Years | 37 (5.3%) | 29 (3.3%) |
| 85 Years and over | 33 (4.7%) | 95 (10.9%) |
| Total | 698 (100.0%) | 871 (100.0%) |
Families and Households in Hebron
Median Family Size in Hebron
The median family size in Hebron is 3.01 persons per family, with single female/mother families (16 | 4.8%) accounting for the largest median family size of 4.31 persons per family. On the other hand, married-couple families (300 | 89.0%) represent the smallest median family size with 2.94 persons per family.
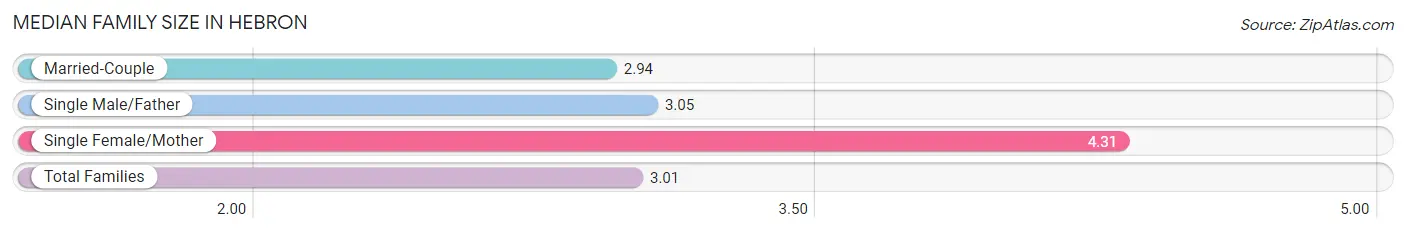
| Family Type | # Families | Family Size |
| Married-Couple | 300 (89.0%) | 2.94 |
| Single Male/Father | 21 (6.2%) | 3.05 |
| Single Female/Mother | 16 (4.8%) | 4.31 |
| Total Families | 337 (100.0%) | 3.01 |
Median Household Size in Hebron
The median household size in Hebron is 2.20 persons per household, with single female/mother households (16 | 2.4%) accounting for the largest median household size of 4.69 persons per household. non-family households (329 | 49.4%) represent the smallest median household size with 1.33 persons per household.
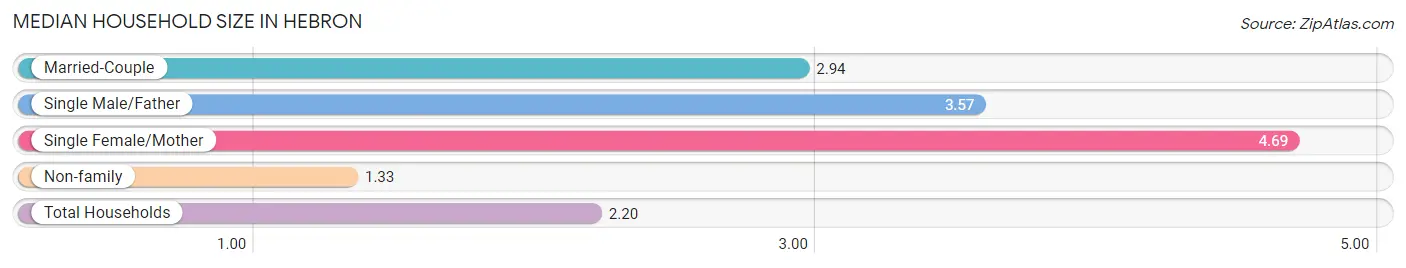
| Household Type | # Households | Household Size |
| Married-Couple | 300 (45.1%) | 2.94 |
| Single Male/Father | 21 (3.2%) | 3.57 |
| Single Female/Mother | 16 (2.4%) | 4.69 |
| Non-family | 329 (49.4%) | 1.33 |
| Total Households | 666 (100.0%) | 2.20 |
Household Size by Marriage Status in Hebron
Out of a total of 666 households in Hebron, 337 (50.6%) are family households, while 329 (49.4%) are nonfamily households. The most numerous type of family households are 2-person households, comprising 199, and the most common type of nonfamily households are 1-person households, comprising 266.
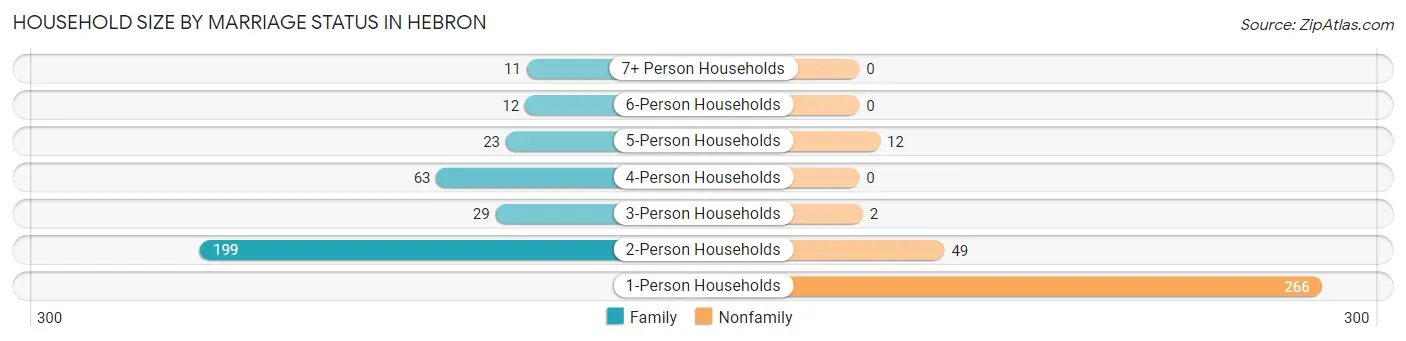
| Household Size | Family Households | Nonfamily Households |
| 1-Person Households | - | 266 (39.9%) |
| 2-Person Households | 199 (29.9%) | 49 (7.4%) |
| 3-Person Households | 29 (4.3%) | 2 (0.3%) |
| 4-Person Households | 63 (9.5%) | 0 (0.0%) |
| 5-Person Households | 23 (3.5%) | 12 (1.8%) |
| 6-Person Households | 12 (1.8%) | 0 (0.0%) |
| 7+ Person Households | 11 (1.7%) | 0 (0.0%) |
| Total | 337 (50.6%) | 329 (49.4%) |
Female Fertility in Hebron
Fertility by Age in Hebron
Average fertility rate in Hebron is 22.0 births per 1,000 women. Women in the age bracket of 20 to 34 years have the highest fertility rate with 48.0 births per 1,000 women. Women in the age bracket of 20 to 34 years acount for 100.0% of all women with births.
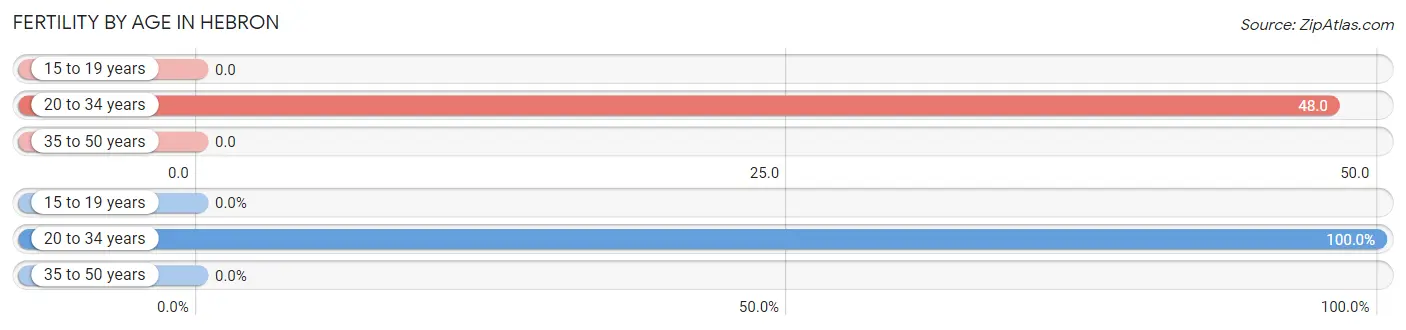
| Age Bracket | Women with Births | Births / 1,000 Women |
| 15 to 19 years | 0 (0.0%) | 0.0 |
| 20 to 34 years | 6 (100.0%) | 48.0 |
| 35 to 50 years | 0 (0.0%) | 0.0 |
| Total | 6 (100.0%) | 22.0 |
Fertility by Age by Marriage Status in Hebron
50.0% of women with births (6) in Hebron are married. The highest percentage of unmarried women with births falls into 20 to 34 years age bracket with 50.0% of them unmarried at the time of birth, while the lowest percentage of unmarried women with births belong to 20 to 34 years age bracket with 50.0% of them unmarried.
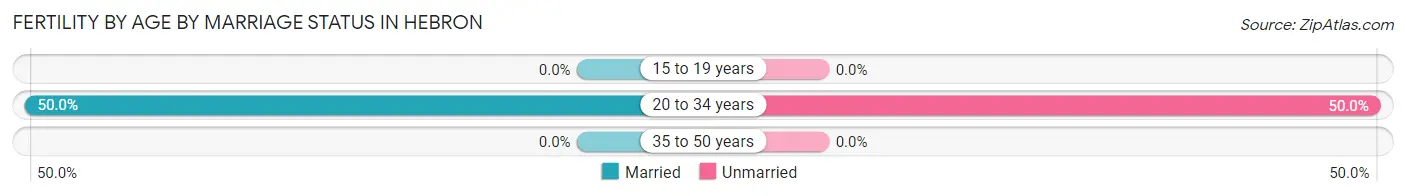
| Age Bracket | Married | Unmarried |
| 15 to 19 years | 0 (0.0%) | 0 (0.0%) |
| 20 to 34 years | 3 (50.0%) | 3 (50.0%) |
| 35 to 50 years | 0 (0.0%) | 0 (0.0%) |
| Total | 3 (50.0%) | 3 (50.0%) |
Fertility by Education in Hebron
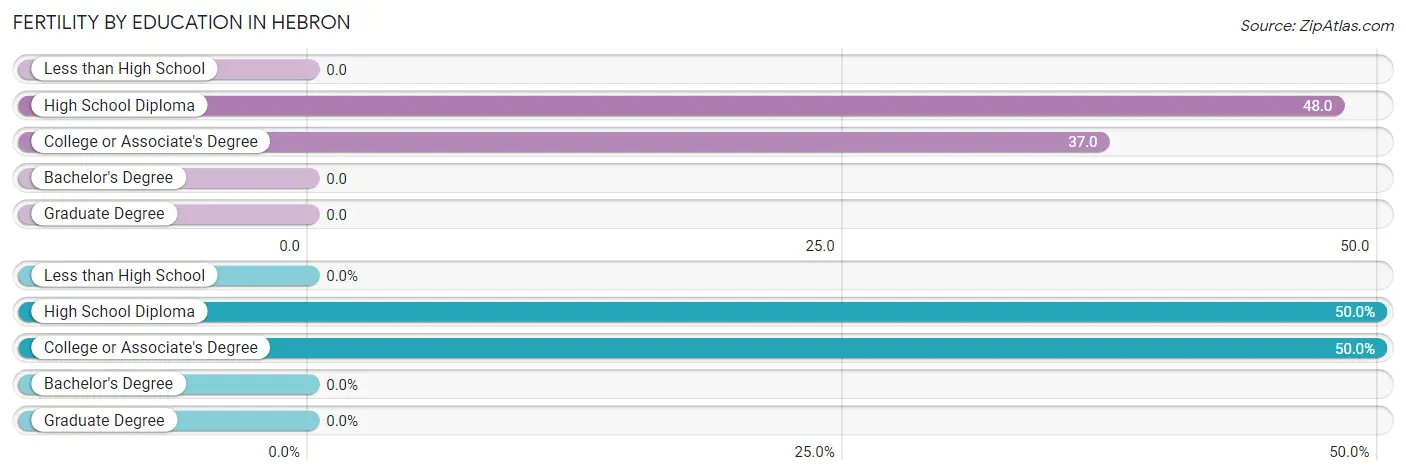
| Educational Attainment | Women with Births | Births / 1,000 Women |
| Less than High School | 0 (0.0%) | 0.0 |
| High School Diploma | 3 (50.0%) | 48.0 |
| College or Associate's Degree | 3 (50.0%) | 37.0 |
| Bachelor's Degree | 0 (0.0%) | 0.0 |
| Graduate Degree | 0 (0.0%) | 0.0 |
| Total | 6 (100.0%) | 22.0 |
Fertility by Education by Marriage Status in Hebron
50.0% of women with births in Hebron are unmarried. Women with the educational attainment of college or associate's degree are most likely to be married with 100.0% of them married at childbirth, while women with the educational attainment of high school diploma are least likely to be married with 100.0% of them unmarried at childbirth.
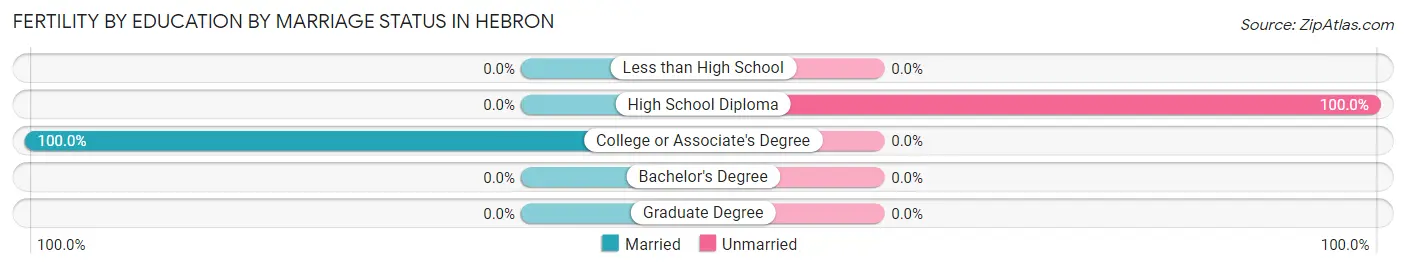
| Educational Attainment | Married | Unmarried |
| Less than High School | 0 (0.0%) | 0 (0.0%) |
| High School Diploma | 0 (0.0%) | 3 (100.0%) |
| College or Associate's Degree | 3 (100.0%) | 0 (0.0%) |
| Bachelor's Degree | 0 (0.0%) | 0 (0.0%) |
| Graduate Degree | 0 (0.0%) | 0 (0.0%) |
| Total | 3 (50.0%) | 3 (50.0%) |
Employment Characteristics in Hebron
Employment by Class of Employer in Hebron
Among the 728 employed individuals in Hebron, private company employees (468 | 64.3%), local government employees (85 | 11.7%), and self-employed (not incorporated) (72 | 9.9%) make up the most common classes of employment.
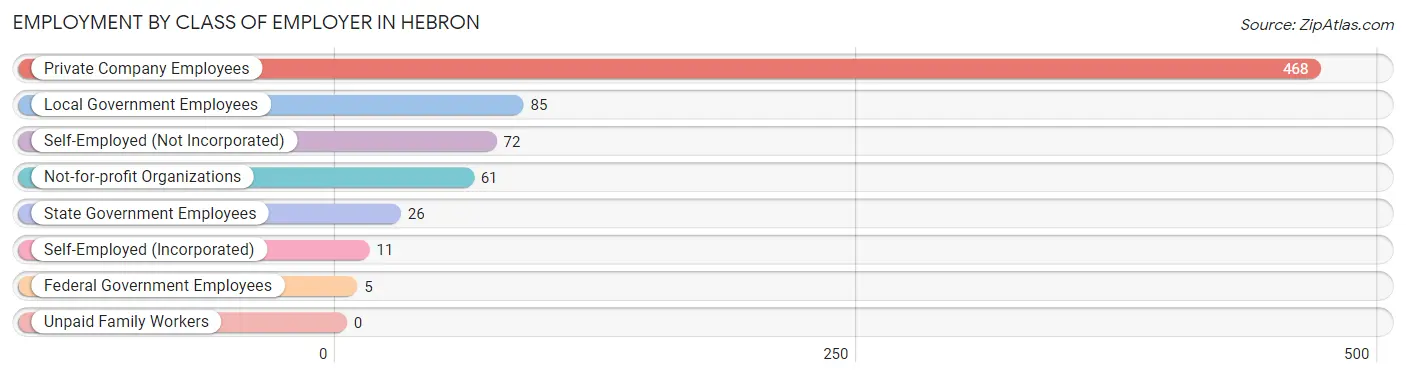
| Employer Class | # Employees | % Employees |
| Private Company Employees | 468 | 64.3% |
| Self-Employed (Incorporated) | 11 | 1.5% |
| Self-Employed (Not Incorporated) | 72 | 9.9% |
| Not-for-profit Organizations | 61 | 8.4% |
| Local Government Employees | 85 | 11.7% |
| State Government Employees | 26 | 3.6% |
| Federal Government Employees | 5 | 0.7% |
| Unpaid Family Workers | 0 | 0.0% |
| Total | 728 | 100.0% |
Employment Status by Age in Hebron
According to the labor force statistics for Hebron, out of the total population over 16 years of age (1,281), 59.3% or 760 individuals are in the labor force, with 1.7% or 13 of them unemployed. The age group with the highest labor force participation rate is 35 to 44 years, with 100.0% or 134 individuals in the labor force. Within the labor force, the 60 to 64 years age range has the highest percentage of unemployed individuals, with 9.4% or 5 of them being unemployed.
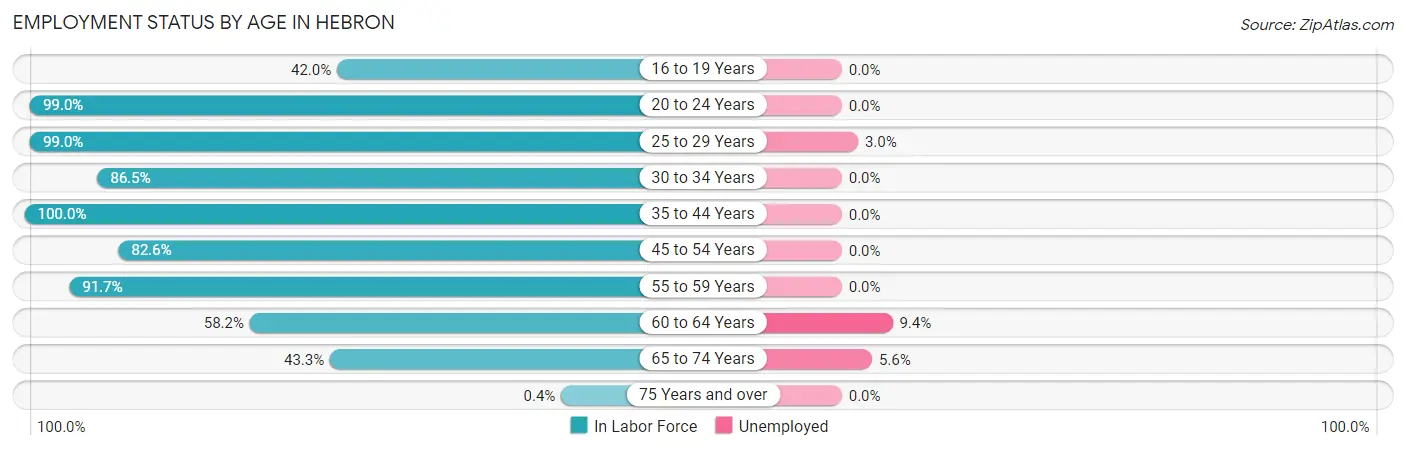
| Age Bracket | In Labor Force | Unemployed |
| 16 to 19 Years | 34 (42.0%) | 0 (0.0%) |
| 20 to 24 Years | 102 (99.0%) | 0 (0.0%) |
| 25 to 29 Years | 99 (99.0%) | 3 (3.0%) |
| 30 to 34 Years | 45 (86.5%) | 0 (0.0%) |
| 35 to 44 Years | 134 (100.0%) | 0 (0.0%) |
| 45 to 54 Years | 114 (82.6%) | 0 (0.0%) |
| 55 to 59 Years | 88 (91.7%) | 0 (0.0%) |
| 60 to 64 Years | 53 (58.2%) | 5 (9.4%) |
| 65 to 74 Years | 90 (43.3%) | 5 (5.6%) |
| 75 Years and over | 1 (0.4%) | 0 (0.0%) |
| Total | 760 (59.3%) | 13 (1.7%) |
Employment Status by Educational Attainment in Hebron
According to labor force statistics for Hebron, 87.2% of individuals (533) out of the total population between 25 and 64 years of age (611) are in the labor force, with 1.5% or 8 of them being unemployed. The group with the highest labor force participation rate are those with the educational attainment of bachelor's degree or higher, with 94.4% or 134 individuals in the labor force. Within the labor force, individuals with high school diploma education have the highest percentage of unemployment, with 4.0% or 5 of them being unemployed.
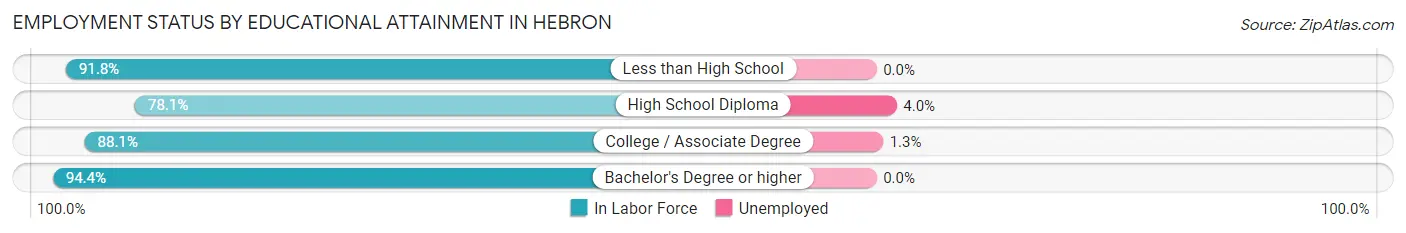
| Educational Attainment | In Labor Force | Unemployed |
| Less than High School | 45 (91.8%) | 0 (0.0%) |
| High School Diploma | 125 (78.1%) | 6 (4.0%) |
| College / Associate Degree | 229 (88.1%) | 3 (1.3%) |
| Bachelor's Degree or higher | 134 (94.4%) | 0 (0.0%) |
| Total | 533 (87.2%) | 9 (1.5%) |
Employment Occupations by Sex in Hebron
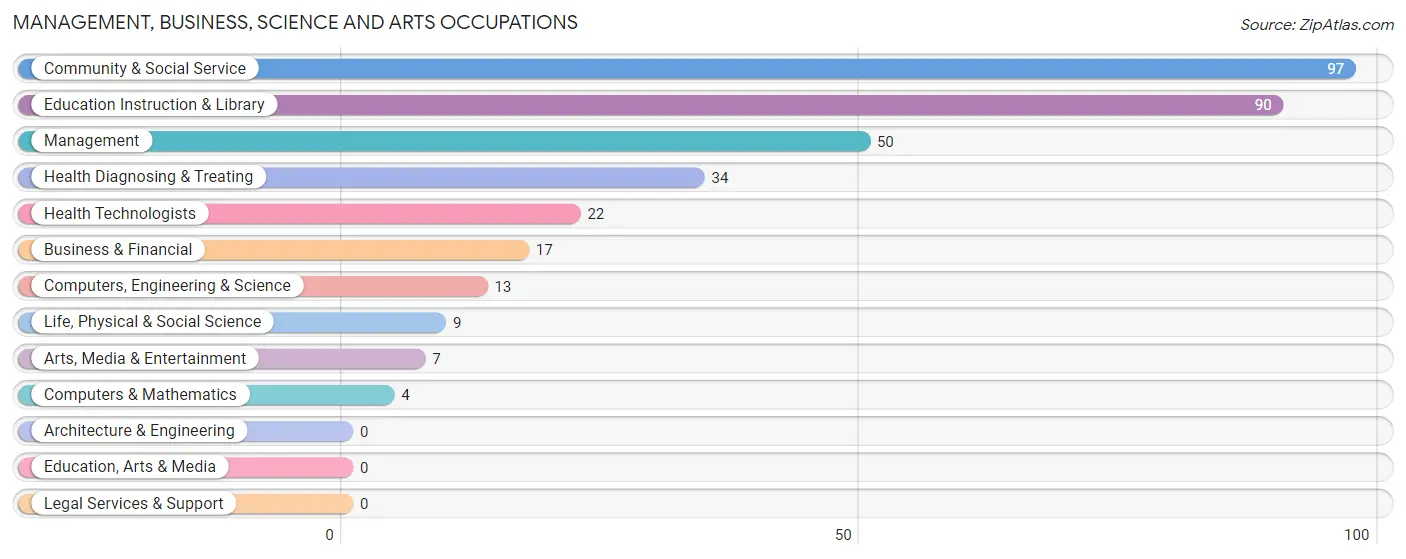
Management, Business, Science and Arts Occupations
The most common Management, Business, Science and Arts occupations in Hebron are Community & Social Service (97 | 13.0%), Education Instruction & Library (90 | 12.0%), Management (50 | 6.7%), Health Diagnosing & Treating (34 | 4.5%), and Health Technologists (22 | 2.9%).
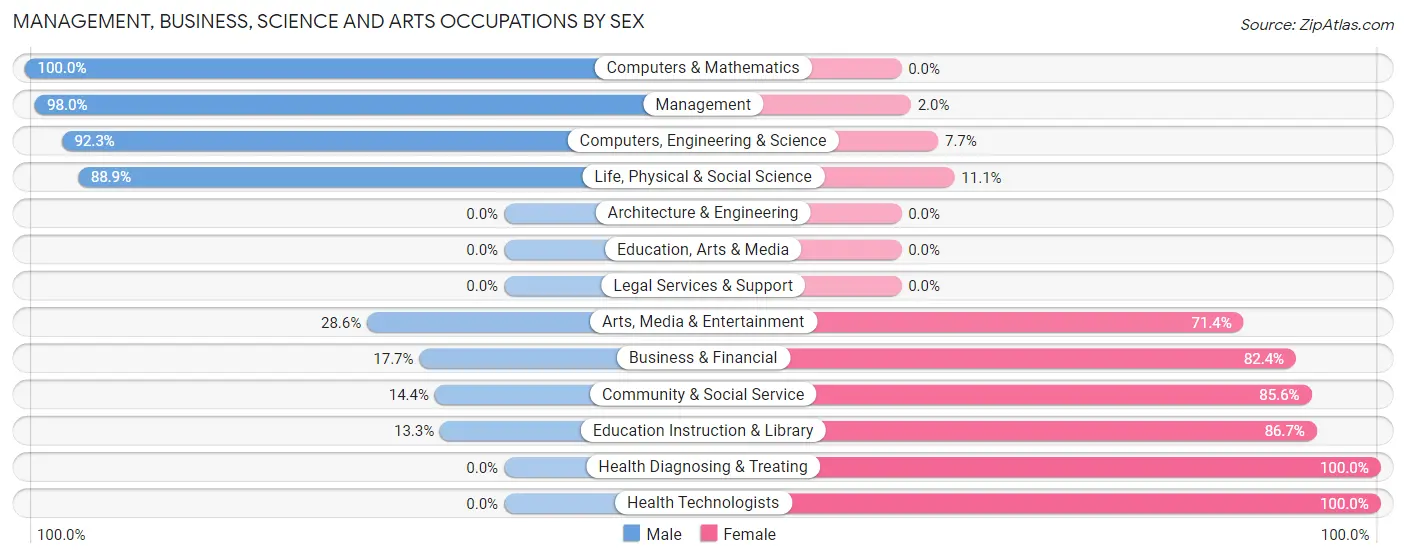
Management, Business, Science and Arts Occupations by Sex
Within the Management, Business, Science and Arts occupations in Hebron, the most male-oriented occupations are Computers & Mathematics (100.0%), Management (98.0%), and Computers, Engineering & Science (92.3%), while the most female-oriented occupations are Health Diagnosing & Treating (100.0%), Health Technologists (100.0%), and Education Instruction & Library (86.7%).
| Occupation | Male | Female |
| Management | 49 (98.0%) | 1 (2.0%) |
| Business & Financial | 3 (17.6%) | 14 (82.4%) |
| Computers, Engineering & Science | 12 (92.3%) | 1 (7.7%) |
| Computers & Mathematics | 4 (100.0%) | 0 (0.0%) |
| Architecture & Engineering | 0 (0.0%) | 0 (0.0%) |
| Life, Physical & Social Science | 8 (88.9%) | 1 (11.1%) |
| Community & Social Service | 14 (14.4%) | 83 (85.6%) |
| Education, Arts & Media | 0 (0.0%) | 0 (0.0%) |
| Legal Services & Support | 0 (0.0%) | 0 (0.0%) |
| Education Instruction & Library | 12 (13.3%) | 78 (86.7%) |
| Arts, Media & Entertainment | 2 (28.6%) | 5 (71.4%) |
| Health Diagnosing & Treating | 0 (0.0%) | 34 (100.0%) |
| Health Technologists | 0 (0.0%) | 22 (100.0%) |
| Total (Category) | 78 (37.0%) | 133 (63.0%) |
| Total (Overall) | 378 (50.6%) | 369 (49.4%) |
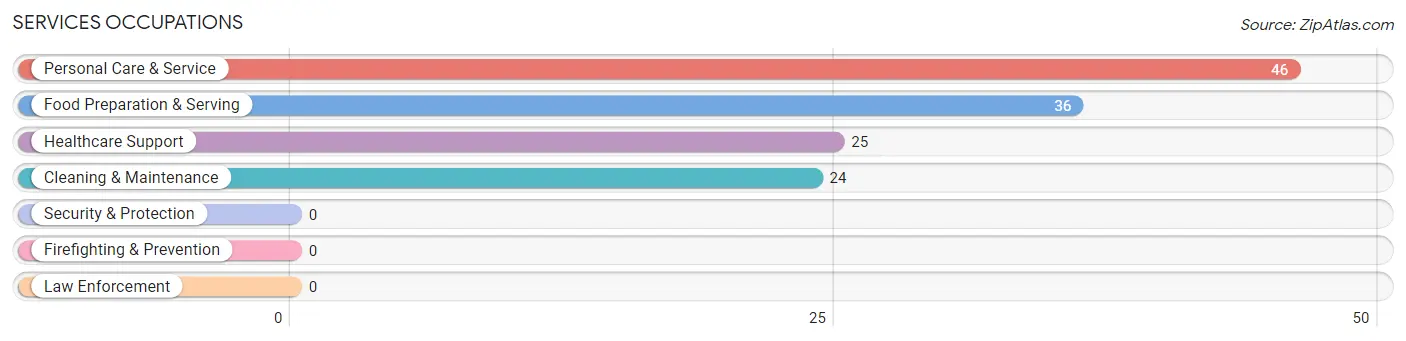
Services Occupations
The most common Services occupations in Hebron are Personal Care & Service (46 | 6.2%), Food Preparation & Serving (36 | 4.8%), Healthcare Support (25 | 3.4%), and Cleaning & Maintenance (24 | 3.2%).
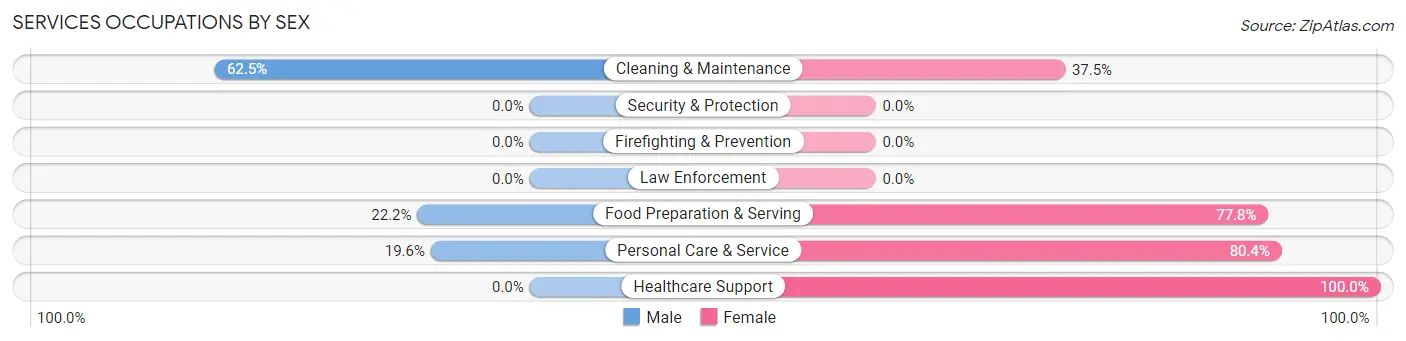
Services Occupations by Sex
Within the Services occupations in Hebron, the most male-oriented occupations are Cleaning & Maintenance (62.5%), Food Preparation & Serving (22.2%), and Personal Care & Service (19.6%), while the most female-oriented occupations are Healthcare Support (100.0%), Personal Care & Service (80.4%), and Food Preparation & Serving (77.8%).
| Occupation | Male | Female |
| Healthcare Support | 0 (0.0%) | 25 (100.0%) |
| Security & Protection | 0 (0.0%) | 0 (0.0%) |
| Firefighting & Prevention | 0 (0.0%) | 0 (0.0%) |
| Law Enforcement | 0 (0.0%) | 0 (0.0%) |
| Food Preparation & Serving | 8 (22.2%) | 28 (77.8%) |
| Cleaning & Maintenance | 15 (62.5%) | 9 (37.5%) |
| Personal Care & Service | 9 (19.6%) | 37 (80.4%) |
| Total (Category) | 32 (24.4%) | 99 (75.6%) |
| Total (Overall) | 378 (50.6%) | 369 (49.4%) |
Sales and Office Occupations
The most common Sales and Office occupations in Hebron are Office & Administration (89 | 11.9%), and Sales & Related (40 | 5.3%).
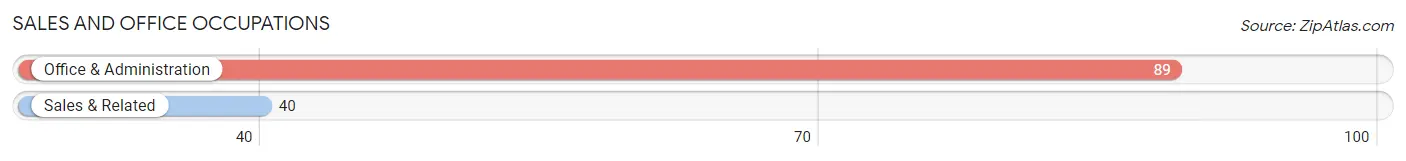
Sales and Office Occupations by Sex
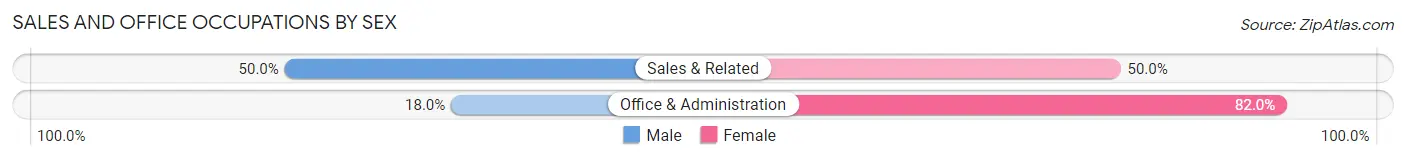
| Occupation | Male | Female |
| Sales & Related | 20 (50.0%) | 20 (50.0%) |
| Office & Administration | 16 (18.0%) | 73 (82.0%) |
| Total (Category) | 36 (27.9%) | 93 (72.1%) |
| Total (Overall) | 378 (50.6%) | 369 (49.4%) |
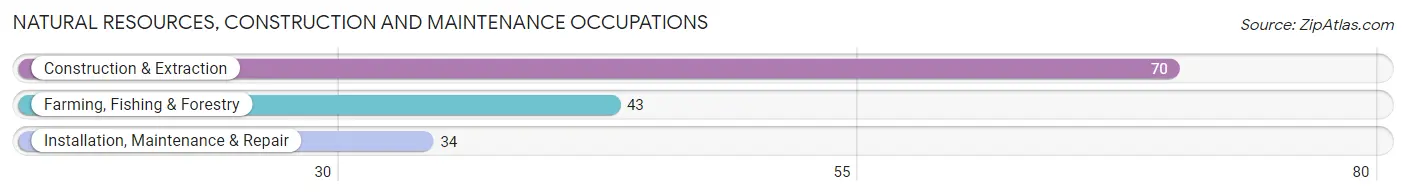
Natural Resources, Construction and Maintenance Occupations
The most common Natural Resources, Construction and Maintenance occupations in Hebron are Construction & Extraction (70 | 9.4%), Farming, Fishing & Forestry (43 | 5.8%), and Installation, Maintenance & Repair (34 | 4.5%).
Natural Resources, Construction and Maintenance Occupations by Sex
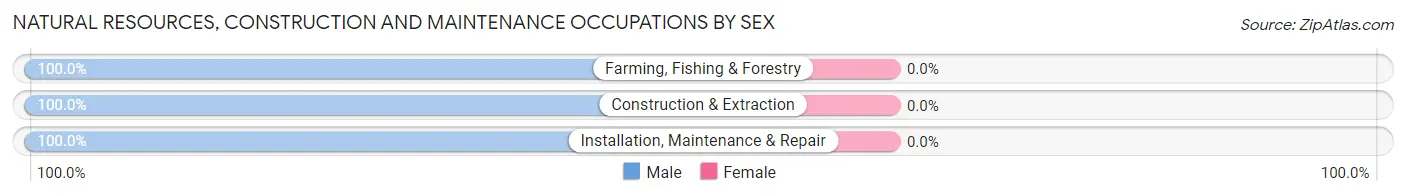
| Occupation | Male | Female |
| Farming, Fishing & Forestry | 43 (100.0%) | 0 (0.0%) |
| Construction & Extraction | 70 (100.0%) | 0 (0.0%) |
| Installation, Maintenance & Repair | 34 (100.0%) | 0 (0.0%) |
| Total (Category) | 147 (100.0%) | 0 (0.0%) |
| Total (Overall) | 378 (50.6%) | 369 (49.4%) |
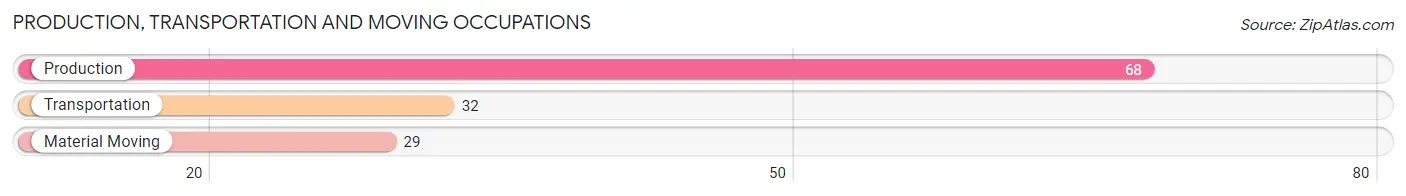
Production, Transportation and Moving Occupations
The most common Production, Transportation and Moving occupations in Hebron are Production (68 | 9.1%), Transportation (32 | 4.3%), and Material Moving (29 | 3.9%).
Production, Transportation and Moving Occupations by Sex
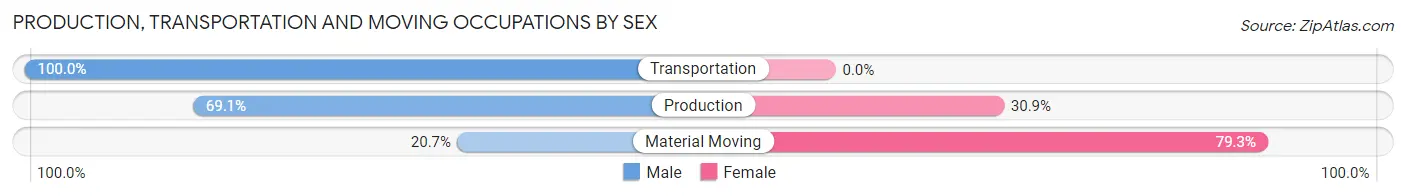
| Occupation | Male | Female |
| Production | 47 (69.1%) | 21 (30.9%) |
| Transportation | 32 (100.0%) | 0 (0.0%) |
| Material Moving | 6 (20.7%) | 23 (79.3%) |
| Total (Category) | 85 (65.9%) | 44 (34.1%) |
| Total (Overall) | 378 (50.6%) | 369 (49.4%) |
Employment Industries by Sex in Hebron
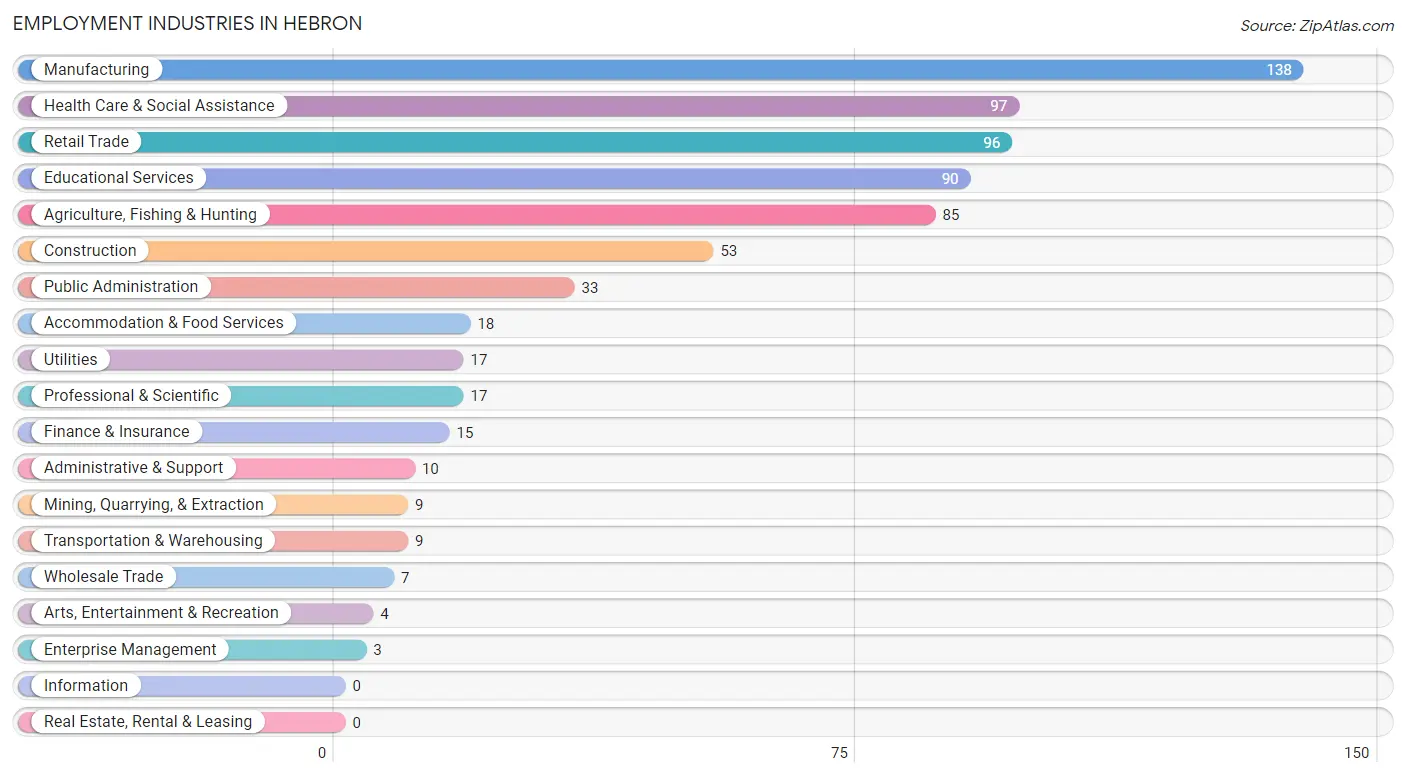
Employment Industries in Hebron
The major employment industries in Hebron include Manufacturing (138 | 18.5%), Health Care & Social Assistance (97 | 13.0%), Retail Trade (96 | 12.9%), Educational Services (90 | 12.0%), and Agriculture, Fishing & Hunting (85 | 11.4%).
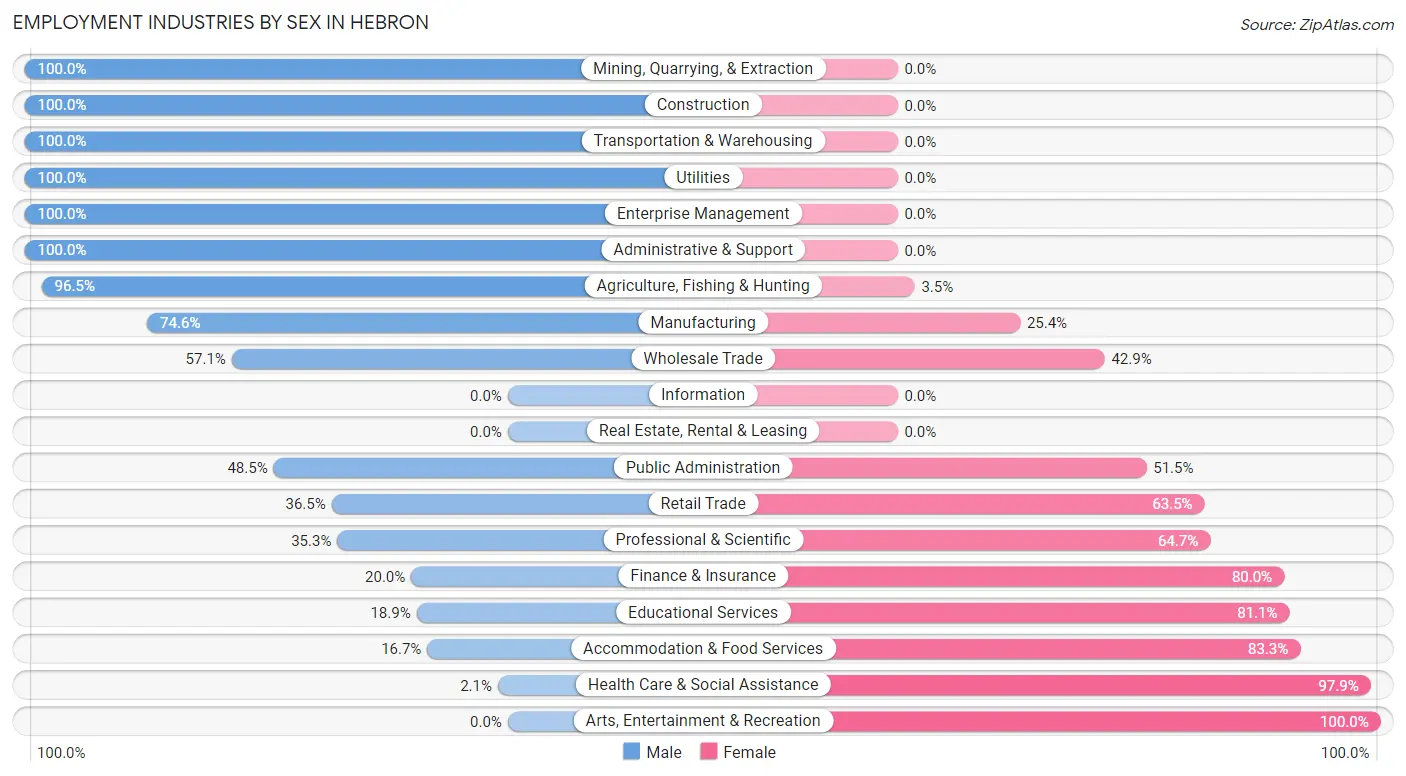
Employment Industries by Sex in Hebron
The Hebron industries that see more men than women are Mining, Quarrying, & Extraction (100.0%), Construction (100.0%), and Transportation & Warehousing (100.0%), whereas the industries that tend to have a higher number of women are Arts, Entertainment & Recreation (100.0%), Health Care & Social Assistance (97.9%), and Accommodation & Food Services (83.3%).
| Industry | Male | Female |
| Agriculture, Fishing & Hunting | 82 (96.5%) | 3 (3.5%) |
| Mining, Quarrying, & Extraction | 9 (100.0%) | 0 (0.0%) |
| Construction | 53 (100.0%) | 0 (0.0%) |
| Manufacturing | 103 (74.6%) | 35 (25.4%) |
| Wholesale Trade | 4 (57.1%) | 3 (42.9%) |
| Retail Trade | 35 (36.5%) | 61 (63.5%) |
| Transportation & Warehousing | 9 (100.0%) | 0 (0.0%) |
| Utilities | 17 (100.0%) | 0 (0.0%) |
| Information | 0 (0.0%) | 0 (0.0%) |
| Finance & Insurance | 3 (20.0%) | 12 (80.0%) |
| Real Estate, Rental & Leasing | 0 (0.0%) | 0 (0.0%) |
| Professional & Scientific | 6 (35.3%) | 11 (64.7%) |
| Enterprise Management | 3 (100.0%) | 0 (0.0%) |
| Administrative & Support | 10 (100.0%) | 0 (0.0%) |
| Educational Services | 17 (18.9%) | 73 (81.1%) |
| Health Care & Social Assistance | 2 (2.1%) | 95 (97.9%) |
| Arts, Entertainment & Recreation | 0 (0.0%) | 4 (100.0%) |
| Accommodation & Food Services | 3 (16.7%) | 15 (83.3%) |
| Public Administration | 16 (48.5%) | 17 (51.5%) |
| Total | 378 (50.6%) | 369 (49.4%) |
Education in Hebron
School Enrollment in Hebron
The most common levels of schooling among the 347 students in Hebron are elementary school (117 | 33.7%), middle school (85 | 24.5%), and high school (53 | 15.3%).
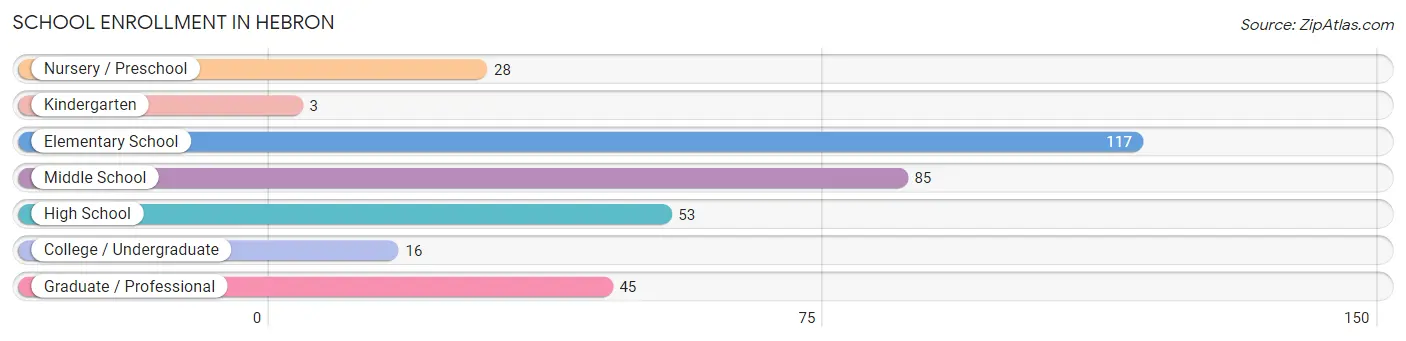
| School Level | # Students | % Students |
| Nursery / Preschool | 28 | 8.1% |
| Kindergarten | 3 | 0.9% |
| Elementary School | 117 | 33.7% |
| Middle School | 85 | 24.5% |
| High School | 53 | 15.3% |
| College / Undergraduate | 16 | 4.6% |
| Graduate / Professional | 45 | 13.0% |
| Total | 347 | 100.0% |
School Enrollment by Age by Funding Source in Hebron
Out of a total of 347 students who are enrolled in schools in Hebron, 21 (6.1%) attend a private institution, while the remaining 326 (93.9%) are enrolled in public schools. The age group of 18 to 19 year olds has the highest likelihood of being enrolled in private schools, with 1 (100.0% in the age bracket) enrolled. Conversely, the age group of 3 to 4 year olds has the lowest likelihood of being enrolled in a private school, with 15 (100.0% in the age bracket) attending a public institution.
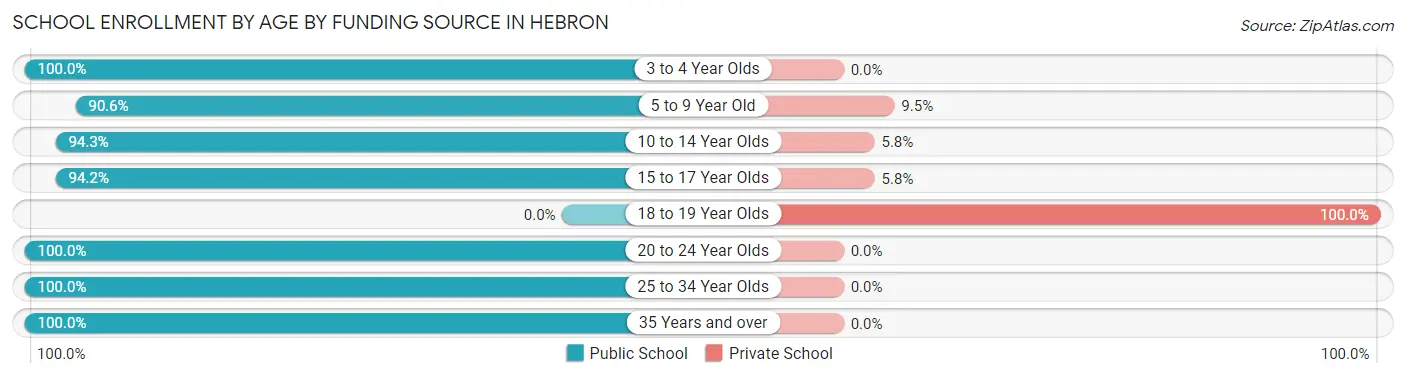
| Age Bracket | Public School | Private School |
| 3 to 4 Year Olds | 15 (100.0%) | 0 (0.0%) |
| 5 to 9 Year Old | 115 (90.5%) | 12 (9.5%) |
| 10 to 14 Year Olds | 82 (94.3%) | 5 (5.8%) |
| 15 to 17 Year Olds | 49 (94.2%) | 3 (5.8%) |
| 18 to 19 Year Olds | 0 (0.0%) | 1 (100.0%) |
| 20 to 24 Year Olds | 42 (100.0%) | 0 (0.0%) |
| 25 to 34 Year Olds | 16 (100.0%) | 0 (0.0%) |
| 35 Years and over | 7 (100.0%) | 0 (0.0%) |
| Total | 326 (93.9%) | 21 (6.1%) |
Educational Attainment by Field of Study in Hebron
Education (121 | 45.7%), bio, nature & agricultural (51 | 19.3%), arts & humanities (30 | 11.3%), business (19 | 7.2%), and science & technology (15 | 5.7%) are the most common fields of study among 265 individuals in Hebron who have obtained a bachelor's degree or higher.
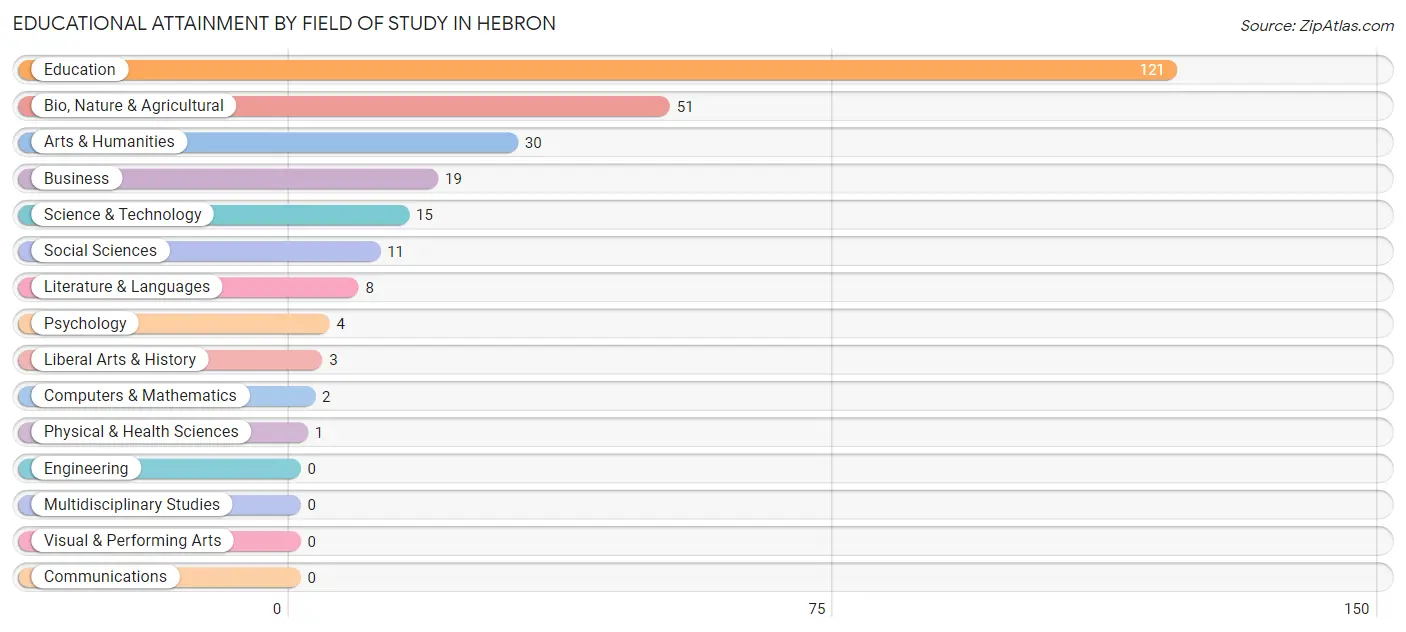
| Field of Study | # Graduates | % Graduates |
| Computers & Mathematics | 2 | 0.7% |
| Bio, Nature & Agricultural | 51 | 19.3% |
| Physical & Health Sciences | 1 | 0.4% |
| Psychology | 4 | 1.5% |
| Social Sciences | 11 | 4.2% |
| Engineering | 0 | 0.0% |
| Multidisciplinary Studies | 0 | 0.0% |
| Science & Technology | 15 | 5.7% |
| Business | 19 | 7.2% |
| Education | 121 | 45.7% |
| Literature & Languages | 8 | 3.0% |
| Liberal Arts & History | 3 | 1.1% |
| Visual & Performing Arts | 0 | 0.0% |
| Communications | 0 | 0.0% |
| Arts & Humanities | 30 | 11.3% |
| Total | 265 | 100.0% |
Transportation & Commute in Hebron
Vehicle Availability by Sex in Hebron
The most prevalent vehicle ownership categories in Hebron are males with 2 vehicles (109, accounting for 29.5%) and females with 2 vehicles (139, making up 30.5%).
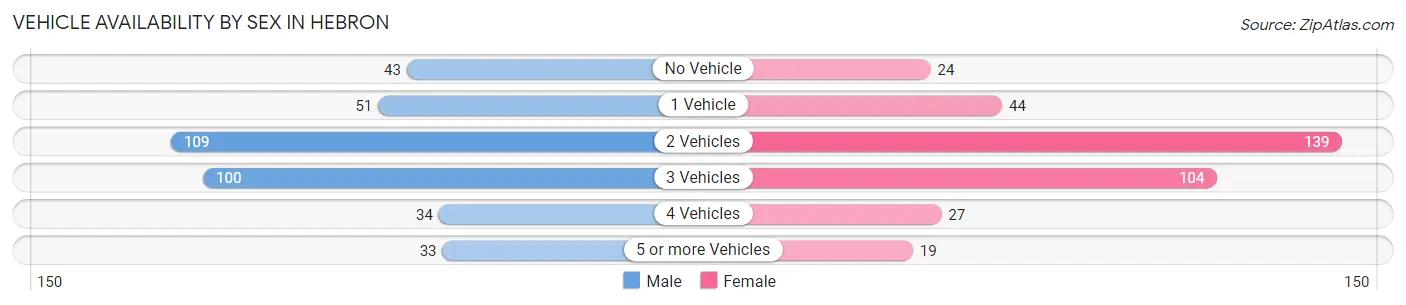
| Vehicles Available | Male | Female |
| No Vehicle | 43 (11.6%) | 24 (6.7%) |
| 1 Vehicle | 51 (13.8%) | 44 (12.3%) |
| 2 Vehicles | 109 (29.5%) | 139 (38.9%) |
| 3 Vehicles | 100 (27.0%) | 104 (29.1%) |
| 4 Vehicles | 34 (9.2%) | 27 (7.6%) |
| 5 or more Vehicles | 33 (8.9%) | 19 (5.3%) |
| Total | 370 (100.0%) | 357 (100.0%) |
Commute Time in Hebron
The most frequently occuring commute durations in Hebron are less than 5 minutes (236 commuters, 33.3%), 5 to 9 minutes (153 commuters, 21.6%), and 15 to 19 minutes (122 commuters, 17.2%).
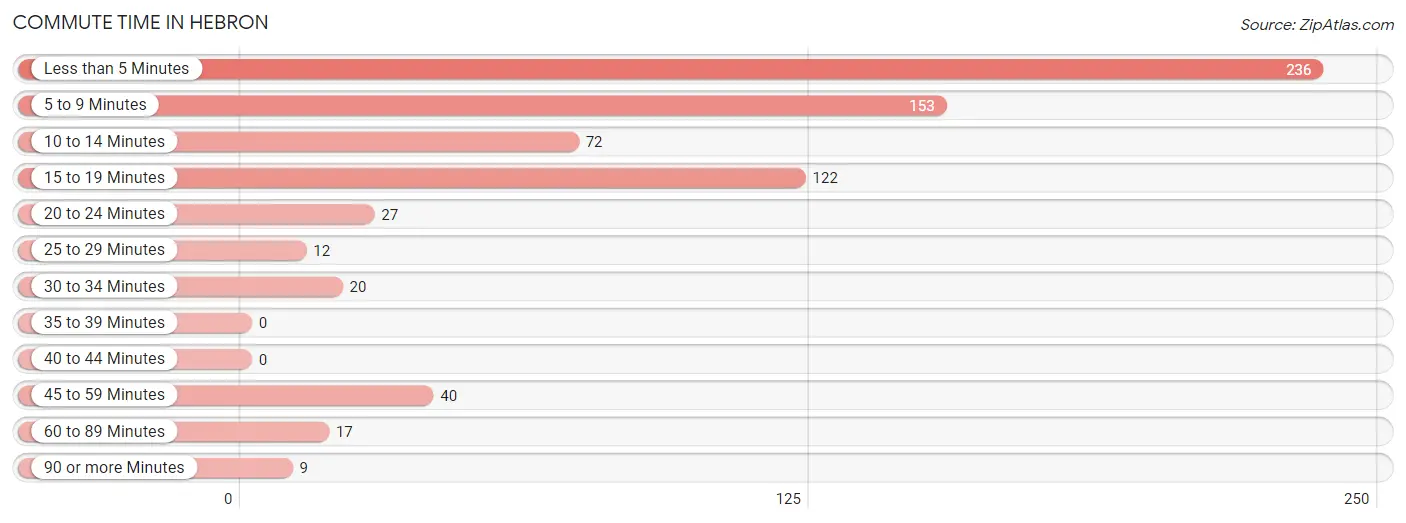
| Commute Time | # Commuters | % Commuters |
| Less than 5 Minutes | 236 | 33.3% |
| 5 to 9 Minutes | 153 | 21.6% |
| 10 to 14 Minutes | 72 | 10.2% |
| 15 to 19 Minutes | 122 | 17.2% |
| 20 to 24 Minutes | 27 | 3.8% |
| 25 to 29 Minutes | 12 | 1.7% |
| 30 to 34 Minutes | 20 | 2.8% |
| 35 to 39 Minutes | 0 | 0.0% |
| 40 to 44 Minutes | 0 | 0.0% |
| 45 to 59 Minutes | 40 | 5.7% |
| 60 to 89 Minutes | 17 | 2.4% |
| 90 or more Minutes | 9 | 1.3% |
Commute Time by Sex in Hebron
The most common commute times in Hebron are 15 to 19 minutes (100 commuters, 27.3%) for males and less than 5 minutes (150 commuters, 43.9%) for females.
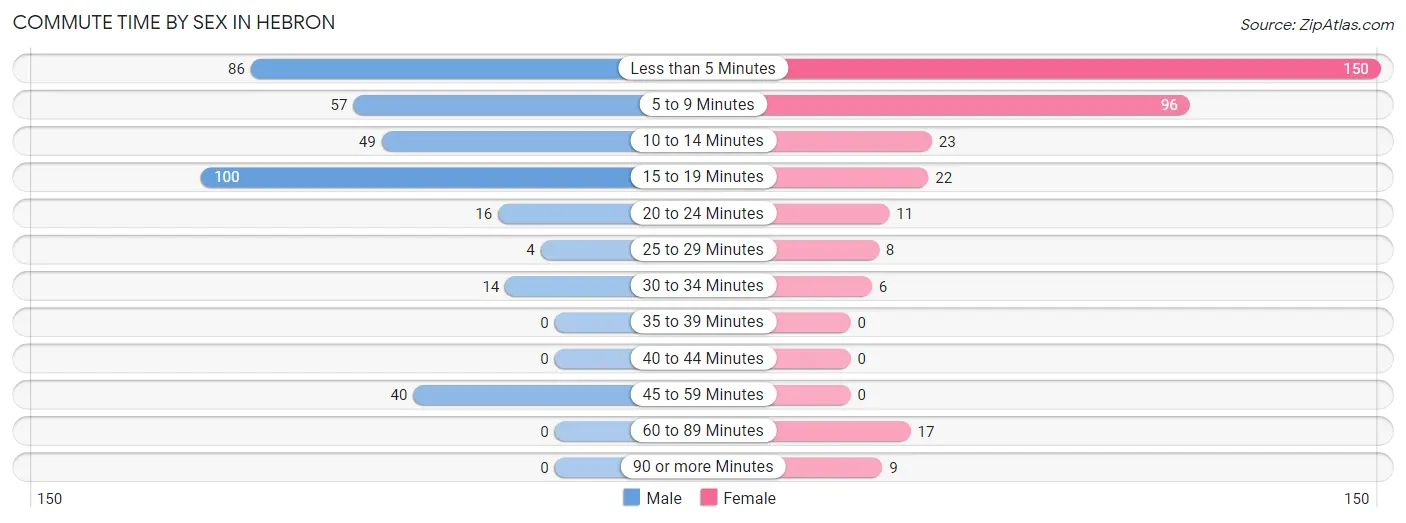
| Commute Time | Male | Female |
| Less than 5 Minutes | 86 (23.5%) | 150 (43.9%) |
| 5 to 9 Minutes | 57 (15.6%) | 96 (28.1%) |
| 10 to 14 Minutes | 49 (13.4%) | 23 (6.7%) |
| 15 to 19 Minutes | 100 (27.3%) | 22 (6.4%) |
| 20 to 24 Minutes | 16 (4.4%) | 11 (3.2%) |
| 25 to 29 Minutes | 4 (1.1%) | 8 (2.3%) |
| 30 to 34 Minutes | 14 (3.8%) | 6 (1.8%) |
| 35 to 39 Minutes | 0 (0.0%) | 0 (0.0%) |
| 40 to 44 Minutes | 0 (0.0%) | 0 (0.0%) |
| 45 to 59 Minutes | 40 (10.9%) | 0 (0.0%) |
| 60 to 89 Minutes | 0 (0.0%) | 17 (5.0%) |
| 90 or more Minutes | 0 (0.0%) | 9 (2.6%) |
Time of Departure to Work by Sex in Hebron
The most frequent times of departure to work in Hebron are 7:30 AM to 7:59 AM (117, 32.0%) for males and 7:30 AM to 7:59 AM (93, 27.2%) for females.
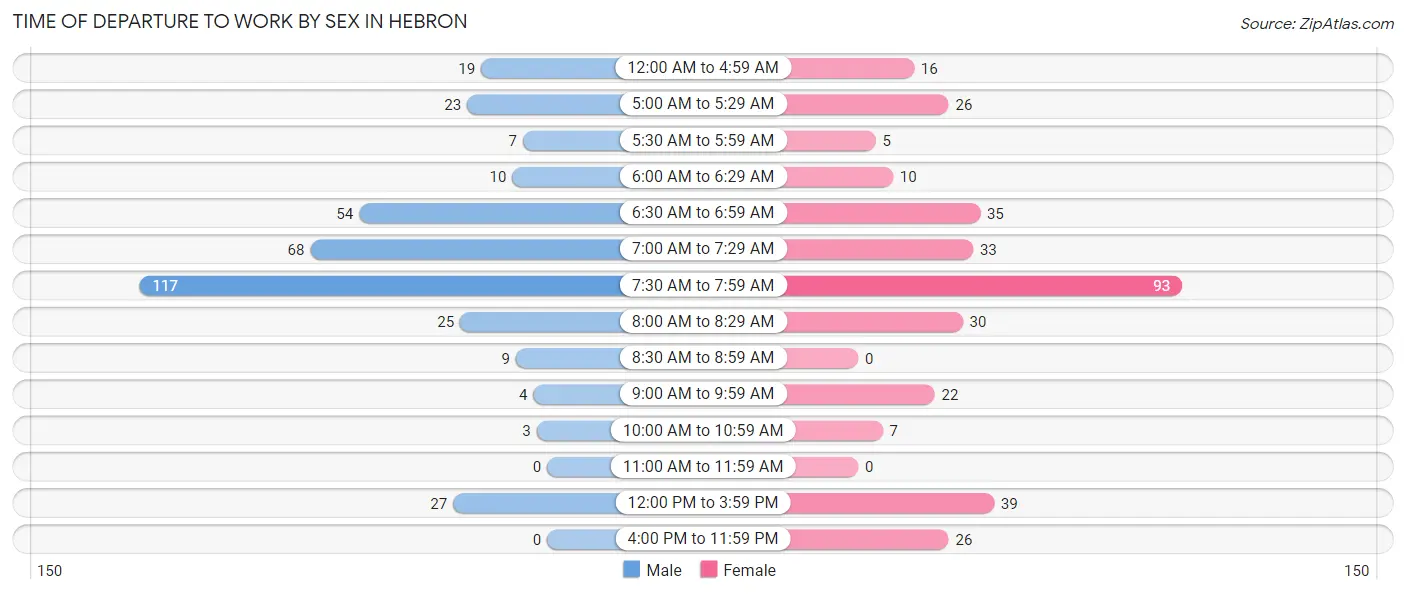
| Time of Departure | Male | Female |
| 12:00 AM to 4:59 AM | 19 (5.2%) | 16 (4.7%) |
| 5:00 AM to 5:29 AM | 23 (6.3%) | 26 (7.6%) |
| 5:30 AM to 5:59 AM | 7 (1.9%) | 5 (1.5%) |
| 6:00 AM to 6:29 AM | 10 (2.7%) | 10 (2.9%) |
| 6:30 AM to 6:59 AM | 54 (14.7%) | 35 (10.2%) |
| 7:00 AM to 7:29 AM | 68 (18.6%) | 33 (9.7%) |
| 7:30 AM to 7:59 AM | 117 (32.0%) | 93 (27.2%) |
| 8:00 AM to 8:29 AM | 25 (6.8%) | 30 (8.8%) |
| 8:30 AM to 8:59 AM | 9 (2.5%) | 0 (0.0%) |
| 9:00 AM to 9:59 AM | 4 (1.1%) | 22 (6.4%) |
| 10:00 AM to 10:59 AM | 3 (0.8%) | 7 (2.1%) |
| 11:00 AM to 11:59 AM | 0 (0.0%) | 0 (0.0%) |
| 12:00 PM to 3:59 PM | 27 (7.4%) | 39 (11.4%) |
| 4:00 PM to 11:59 PM | 0 (0.0%) | 26 (7.6%) |
| Total | 366 (100.0%) | 342 (100.0%) |
Housing Occupancy in Hebron
Occupancy by Ownership in Hebron
Of the total 666 dwellings in Hebron, owner-occupied units account for 466 (70.0%), while renter-occupied units make up 200 (30.0%).
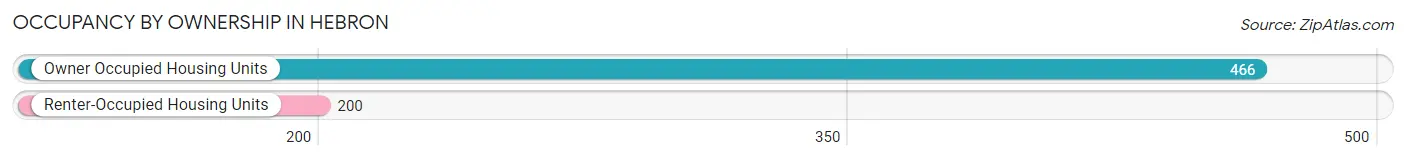
| Occupancy | # Housing Units | % Housing Units |
| Owner Occupied Housing Units | 466 | 70.0% |
| Renter-Occupied Housing Units | 200 | 30.0% |
| Total Occupied Housing Units | 666 | 100.0% |
Occupancy by Household Size in Hebron
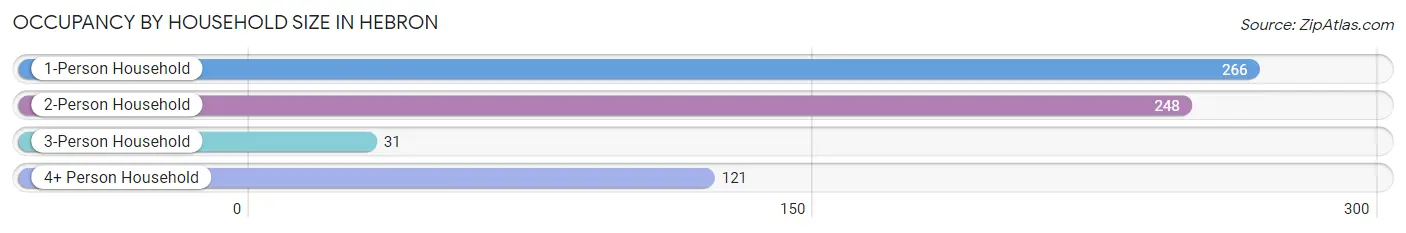
| Household Size | # Housing Units | % Housing Units |
| 1-Person Household | 266 | 39.9% |
| 2-Person Household | 248 | 37.2% |
| 3-Person Household | 31 | 4.6% |
| 4+ Person Household | 121 | 18.2% |
| Total Housing Units | 666 | 100.0% |
Occupancy by Ownership by Household Size in Hebron
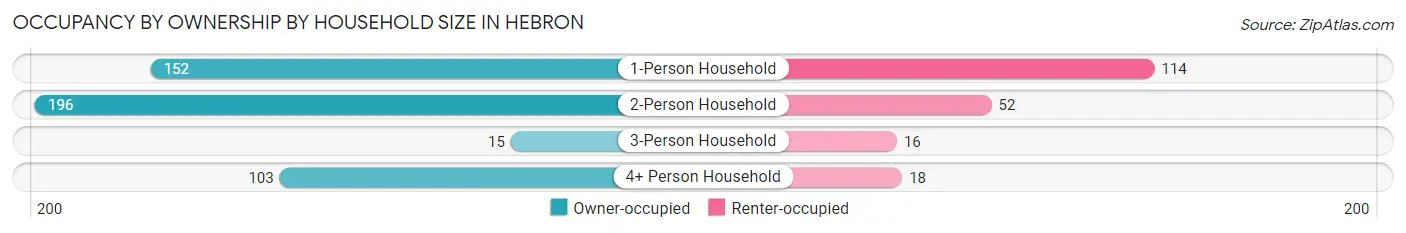
| Household Size | Owner-occupied | Renter-occupied |
| 1-Person Household | 152 (57.1%) | 114 (42.9%) |
| 2-Person Household | 196 (79.0%) | 52 (21.0%) |
| 3-Person Household | 15 (48.4%) | 16 (51.6%) |
| 4+ Person Household | 103 (85.1%) | 18 (14.9%) |
| Total Housing Units | 466 (70.0%) | 200 (30.0%) |
Occupancy by Educational Attainment in Hebron
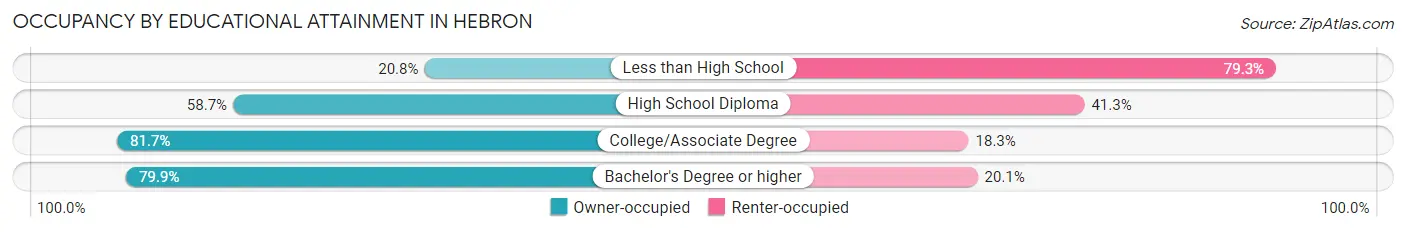
| Household Size | Owner-occupied | Renter-occupied |
| Less than High School | 11 (20.7%) | 42 (79.2%) |
| High School Diploma | 108 (58.7%) | 76 (41.3%) |
| College/Associate Degree | 196 (81.7%) | 44 (18.3%) |
| Bachelor's Degree or higher | 151 (79.9%) | 38 (20.1%) |
Occupancy by Age of Householder in Hebron
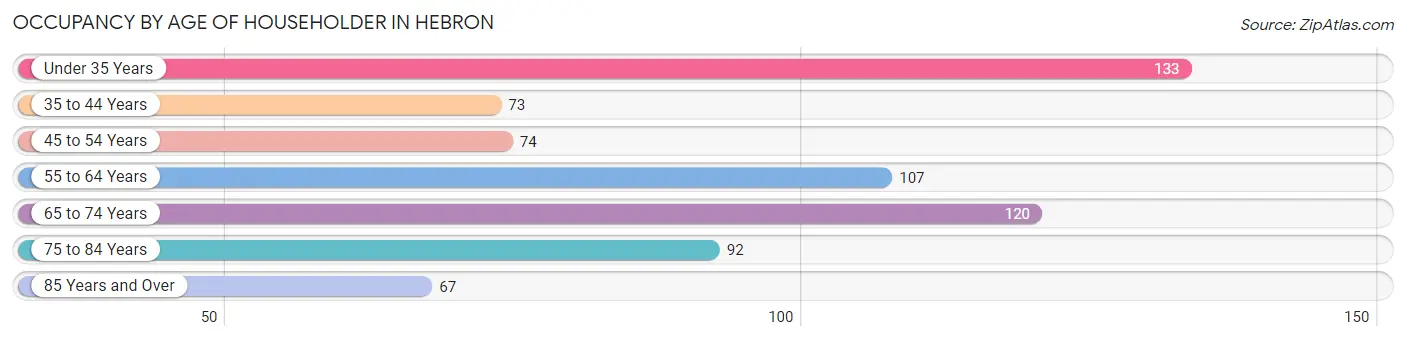
| Age Bracket | # Households | % Households |
| Under 35 Years | 133 | 20.0% |
| 35 to 44 Years | 73 | 11.0% |
| 45 to 54 Years | 74 | 11.1% |
| 55 to 64 Years | 107 | 16.1% |
| 65 to 74 Years | 120 | 18.0% |
| 75 to 84 Years | 92 | 13.8% |
| 85 Years and Over | 67 | 10.1% |
| Total | 666 | 100.0% |
Housing Finances in Hebron
Median Income by Occupancy in Hebron

| Occupancy Type | # Households | Median Income |
| Owner-Occupied | 466 (70.0%) | $78,654 |
| Renter-Occupied | 200 (30.0%) | $53,750 |
| Average | 666 (100.0%) | $66,786 |
Occupancy by Householder Income Bracket in Hebron
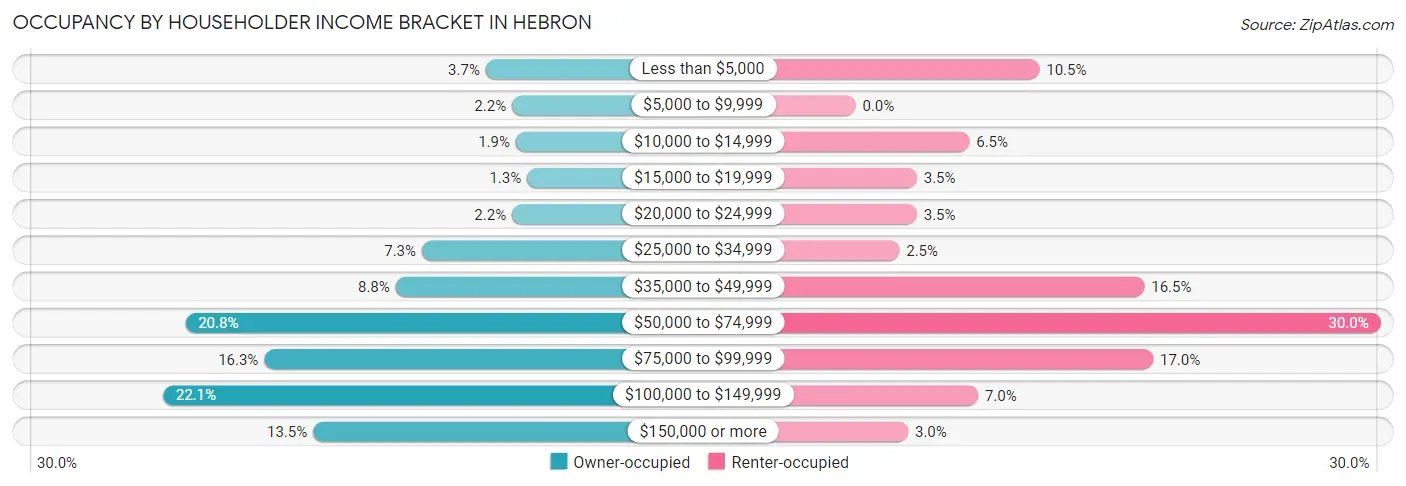
| Income Bracket | Owner-occupied | Renter-occupied |
| Less than $5,000 | 17 (3.6%) | 21 (10.5%) |
| $5,000 to $9,999 | 10 (2.1%) | 0 (0.0%) |
| $10,000 to $14,999 | 9 (1.9%) | 13 (6.5%) |
| $15,000 to $19,999 | 6 (1.3%) | 7 (3.5%) |
| $20,000 to $24,999 | 10 (2.1%) | 7 (3.5%) |
| $25,000 to $34,999 | 34 (7.3%) | 5 (2.5%) |
| $35,000 to $49,999 | 41 (8.8%) | 33 (16.5%) |
| $50,000 to $74,999 | 97 (20.8%) | 60 (30.0%) |
| $75,000 to $99,999 | 76 (16.3%) | 34 (17.0%) |
| $100,000 to $149,999 | 103 (22.1%) | 14 (7.0%) |
| $150,000 or more | 63 (13.5%) | 6 (3.0%) |
| Total | 466 (100.0%) | 200 (100.0%) |
Monthly Housing Cost Tiers in Hebron
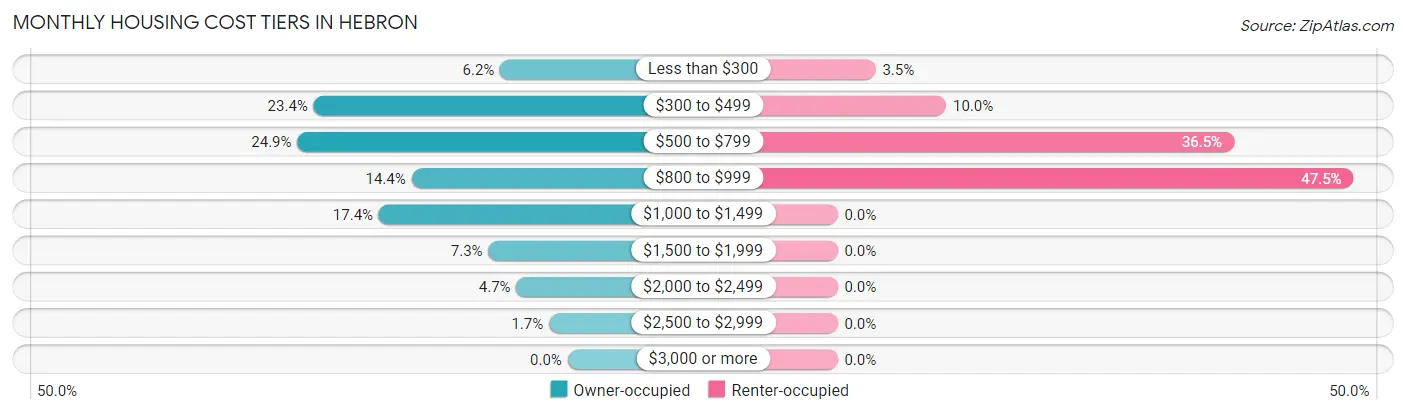
| Monthly Cost | Owner-occupied | Renter-occupied |
| Less than $300 | 29 (6.2%) | 7 (3.5%) |
| $300 to $499 | 109 (23.4%) | 20 (10.0%) |
| $500 to $799 | 116 (24.9%) | 73 (36.5%) |
| $800 to $999 | 67 (14.4%) | 95 (47.5%) |
| $1,000 to $1,499 | 81 (17.4%) | 0 (0.0%) |
| $1,500 to $1,999 | 34 (7.3%) | 0 (0.0%) |
| $2,000 to $2,499 | 22 (4.7%) | 0 (0.0%) |
| $2,500 to $2,999 | 8 (1.7%) | 0 (0.0%) |
| $3,000 or more | 0 (0.0%) | 0 (0.0%) |
| Total | 466 (100.0%) | 200 (100.0%) |
Physical Housing Characteristics in Hebron
Housing Structures in Hebron
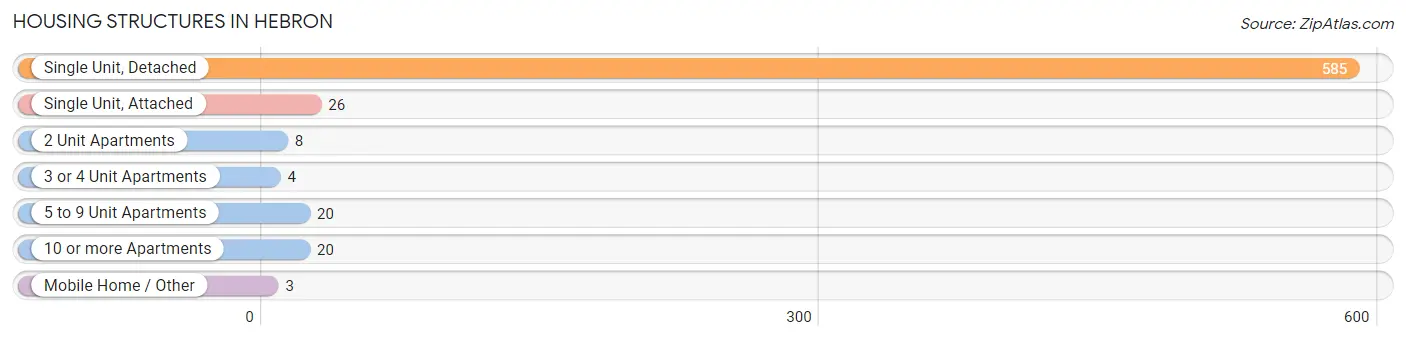
| Structure Type | # Housing Units | % Housing Units |
| Single Unit, Detached | 585 | 87.8% |
| Single Unit, Attached | 26 | 3.9% |
| 2 Unit Apartments | 8 | 1.2% |
| 3 or 4 Unit Apartments | 4 | 0.6% |
| 5 to 9 Unit Apartments | 20 | 3.0% |
| 10 or more Apartments | 20 | 3.0% |
| Mobile Home / Other | 3 | 0.4% |
| Total | 666 | 100.0% |
Housing Structures by Occupancy in Hebron
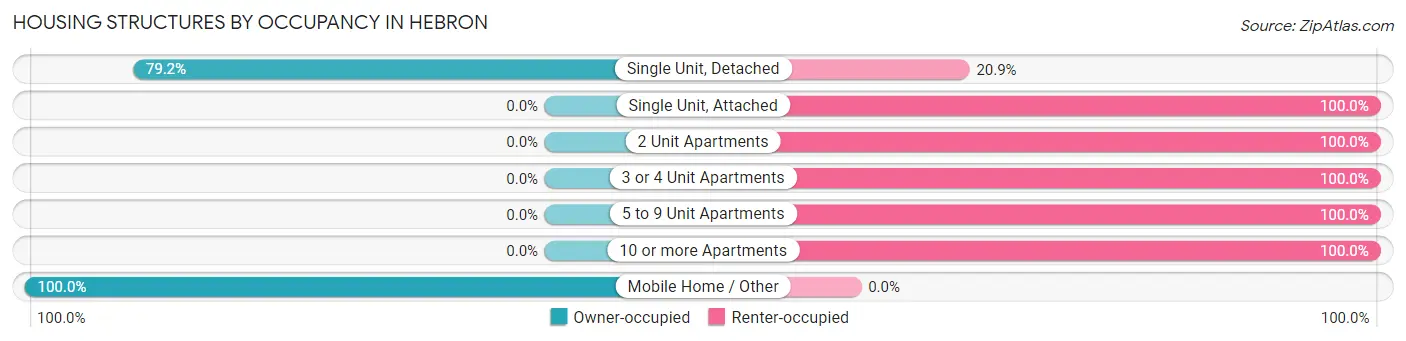
| Structure Type | Owner-occupied | Renter-occupied |
| Single Unit, Detached | 463 (79.1%) | 122 (20.8%) |
| Single Unit, Attached | 0 (0.0%) | 26 (100.0%) |
| 2 Unit Apartments | 0 (0.0%) | 8 (100.0%) |
| 3 or 4 Unit Apartments | 0 (0.0%) | 4 (100.0%) |
| 5 to 9 Unit Apartments | 0 (0.0%) | 20 (100.0%) |
| 10 or more Apartments | 0 (0.0%) | 20 (100.0%) |
| Mobile Home / Other | 3 (100.0%) | 0 (0.0%) |
| Total | 466 (70.0%) | 200 (30.0%) |
Housing Structures by Number of Rooms in Hebron
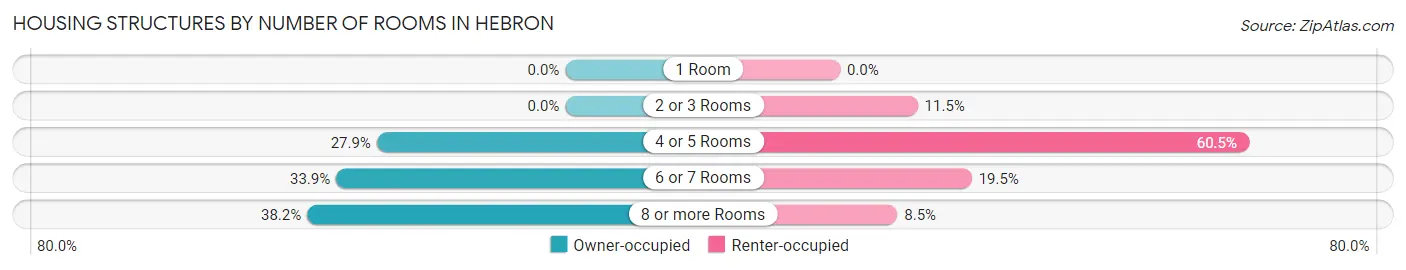
| Number of Rooms | Owner-occupied | Renter-occupied |
| 1 Room | 0 (0.0%) | 0 (0.0%) |
| 2 or 3 Rooms | 0 (0.0%) | 23 (11.5%) |
| 4 or 5 Rooms | 130 (27.9%) | 121 (60.5%) |
| 6 or 7 Rooms | 158 (33.9%) | 39 (19.5%) |
| 8 or more Rooms | 178 (38.2%) | 17 (8.5%) |
| Total | 466 (100.0%) | 200 (100.0%) |
Housing Structure by Heating Type in Hebron
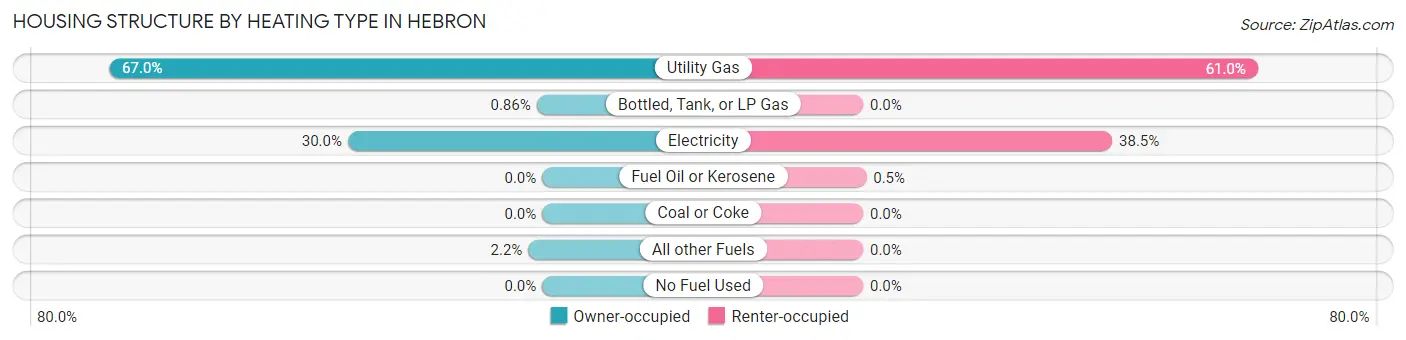
| Heating Type | Owner-occupied | Renter-occupied |
| Utility Gas | 312 (66.9%) | 122 (61.0%) |
| Bottled, Tank, or LP Gas | 4 (0.9%) | 0 (0.0%) |
| Electricity | 140 (30.0%) | 77 (38.5%) |
| Fuel Oil or Kerosene | 0 (0.0%) | 1 (0.5%) |
| Coal or Coke | 0 (0.0%) | 0 (0.0%) |
| All other Fuels | 10 (2.1%) | 0 (0.0%) |
| No Fuel Used | 0 (0.0%) | 0 (0.0%) |
| Total | 466 (100.0%) | 200 (100.0%) |
Household Vehicle Usage in Hebron
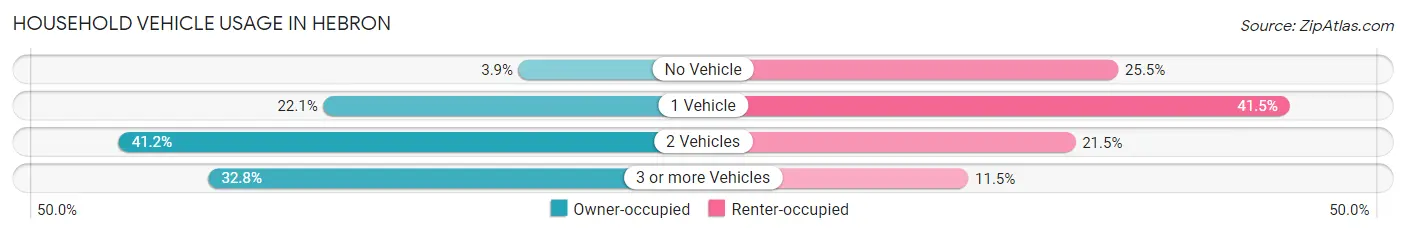
| Vehicles per Household | Owner-occupied | Renter-occupied |
| No Vehicle | 18 (3.9%) | 51 (25.5%) |
| 1 Vehicle | 103 (22.1%) | 83 (41.5%) |
| 2 Vehicles | 192 (41.2%) | 43 (21.5%) |
| 3 or more Vehicles | 153 (32.8%) | 23 (11.5%) |
| Total | 466 (100.0%) | 200 (100.0%) |
Real Estate & Mortgages in Hebron
Real Estate and Mortgage Overview in Hebron
| Characteristic | Without Mortgage | With Mortgage |
| Housing Units | 244 | 222 |
| Median Property Value | $105,400 | $118,800 |
| Median Household Income | $65,417 | $30 |
| Monthly Housing Costs | $486 | $0 |
| Real Estate Taxes | $1,348 | $5 |
Property Value by Mortgage Status in Hebron
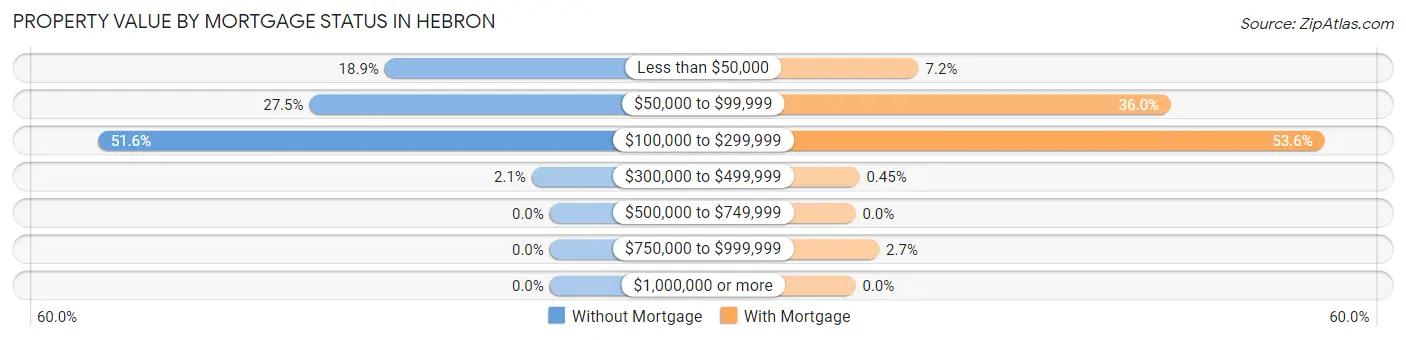
| Property Value | Without Mortgage | With Mortgage |
| Less than $50,000 | 46 (18.9%) | 16 (7.2%) |
| $50,000 to $99,999 | 67 (27.5%) | 80 (36.0%) |
| $100,000 to $299,999 | 126 (51.6%) | 119 (53.6%) |
| $300,000 to $499,999 | 5 (2.1%) | 1 (0.4%) |
| $500,000 to $749,999 | 0 (0.0%) | 0 (0.0%) |
| $750,000 to $999,999 | 0 (0.0%) | 6 (2.7%) |
| $1,000,000 or more | 0 (0.0%) | 0 (0.0%) |
| Total | 244 (100.0%) | 222 (100.0%) |
Household Income by Mortgage Status in Hebron
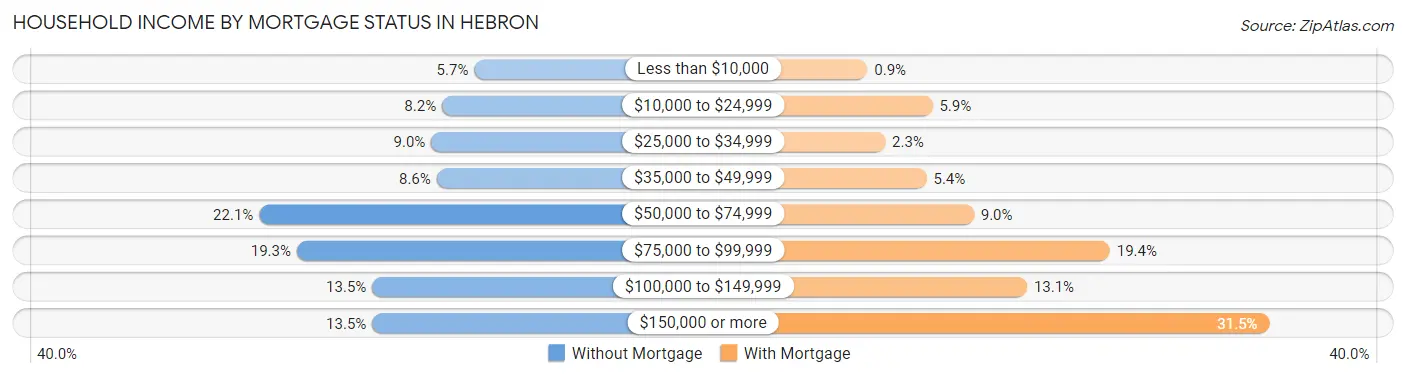
| Household Income | Without Mortgage | With Mortgage |
| Less than $10,000 | 14 (5.7%) | 2 (0.9%) |
| $10,000 to $24,999 | 20 (8.2%) | 13 (5.9%) |
| $25,000 to $34,999 | 22 (9.0%) | 5 (2.2%) |
| $35,000 to $49,999 | 21 (8.6%) | 12 (5.4%) |
| $50,000 to $74,999 | 54 (22.1%) | 20 (9.0%) |
| $75,000 to $99,999 | 47 (19.3%) | 43 (19.4%) |
| $100,000 to $149,999 | 33 (13.5%) | 29 (13.1%) |
| $150,000 or more | 33 (13.5%) | 70 (31.5%) |
| Total | 244 (100.0%) | 222 (100.0%) |
Property Value to Household Income Ratio in Hebron
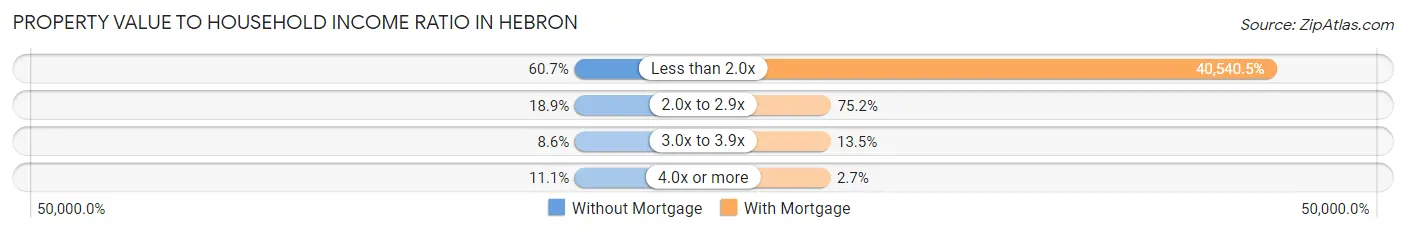
| Value-to-Income Ratio | Without Mortgage | With Mortgage |
| Less than 2.0x | 148 (60.7%) | 90,000 (40,540.5%) |
| 2.0x to 2.9x | 46 (18.9%) | 167 (75.2%) |
| 3.0x to 3.9x | 21 (8.6%) | 30 (13.5%) |
| 4.0x or more | 27 (11.1%) | 6 (2.7%) |
| Total | 244 (100.0%) | 222 (100.0%) |
Real Estate Taxes by Mortgage Status in Hebron
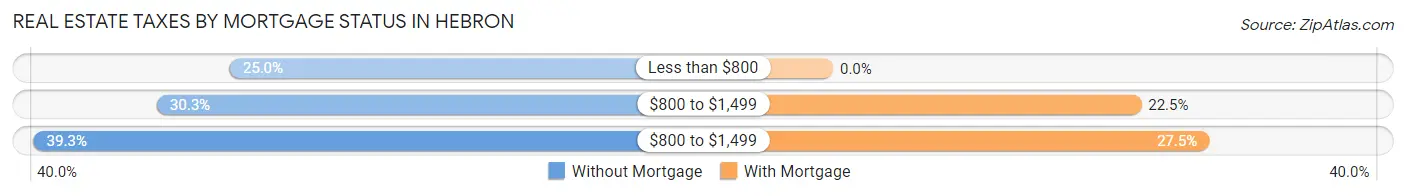
| Property Taxes | Without Mortgage | With Mortgage |
| Less than $800 | 61 (25.0%) | 0 (0.0%) |
| $800 to $1,499 | 74 (30.3%) | 50 (22.5%) |
| $800 to $1,499 | 96 (39.3%) | 61 (27.5%) |
| Total | 244 (100.0%) | 222 (100.0%) |
Health & Disability in Hebron
Health Insurance Coverage by Age in Hebron
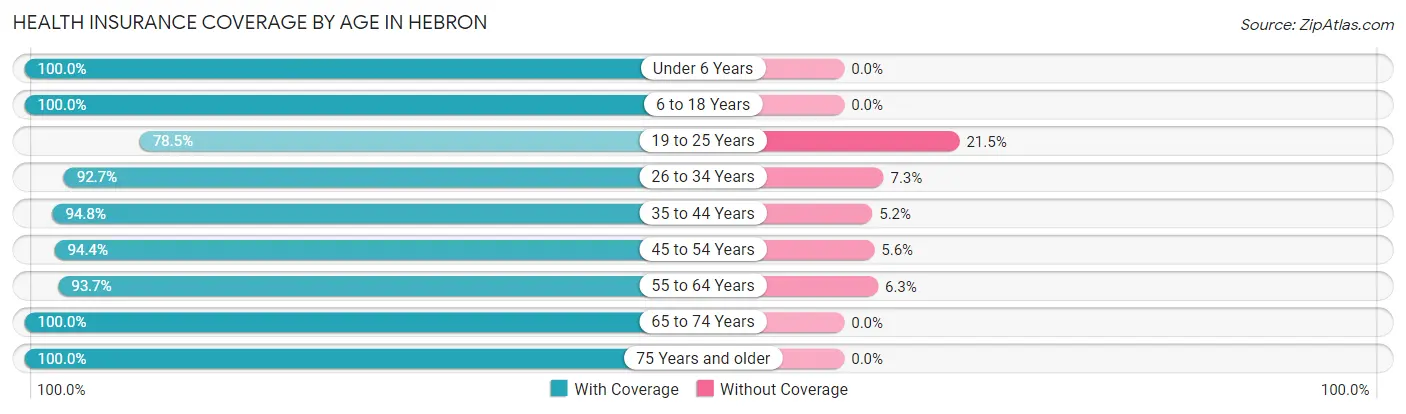
| Age Bracket | With Coverage | Without Coverage |
| Under 6 Years | 79 (100.0%) | 0 (0.0%) |
| 6 to 18 Years | 270 (100.0%) | 0 (0.0%) |
| 19 to 25 Years | 117 (78.5%) | 32 (21.5%) |
| 26 to 34 Years | 114 (92.7%) | 9 (7.3%) |
| 35 to 44 Years | 127 (94.8%) | 7 (5.2%) |
| 45 to 54 Years | 118 (94.4%) | 7 (5.6%) |
| 55 to 64 Years | 164 (93.7%) | 11 (6.3%) |
| 65 to 74 Years | 199 (100.0%) | 0 (0.0%) |
| 75 Years and older | 218 (100.0%) | 0 (0.0%) |
| Total | 1,406 (95.5%) | 66 (4.5%) |
Health Insurance Coverage by Citizenship Status in Hebron
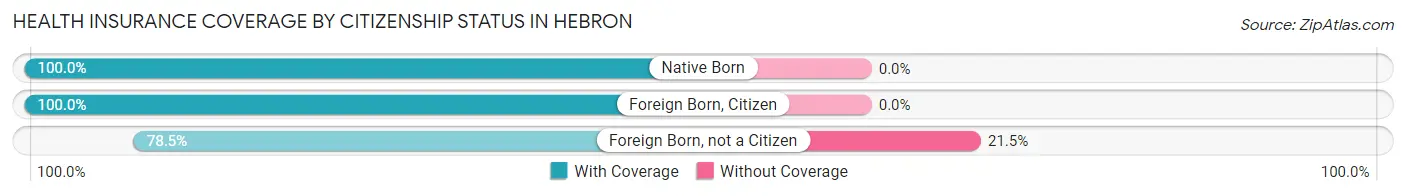
| Citizenship Status | With Coverage | Without Coverage |
| Native Born | 79 (100.0%) | 0 (0.0%) |
| Foreign Born, Citizen | 270 (100.0%) | 0 (0.0%) |
| Foreign Born, not a Citizen | 117 (78.5%) | 32 (21.5%) |
Health Insurance Coverage by Household Income in Hebron
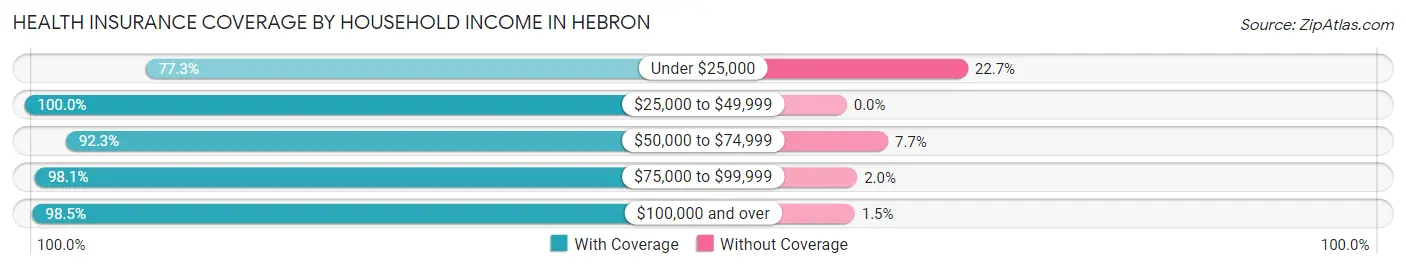
| Household Income | With Coverage | Without Coverage |
| Under $25,000 | 92 (77.3%) | 27 (22.7%) |
| $25,000 to $49,999 | 183 (100.0%) | 0 (0.0%) |
| $50,000 to $74,999 | 286 (92.3%) | 24 (7.7%) |
| $75,000 to $99,999 | 251 (98.1%) | 5 (1.9%) |
| $100,000 and over | 590 (98.5%) | 9 (1.5%) |
Public vs Private Health Insurance Coverage by Age in Hebron
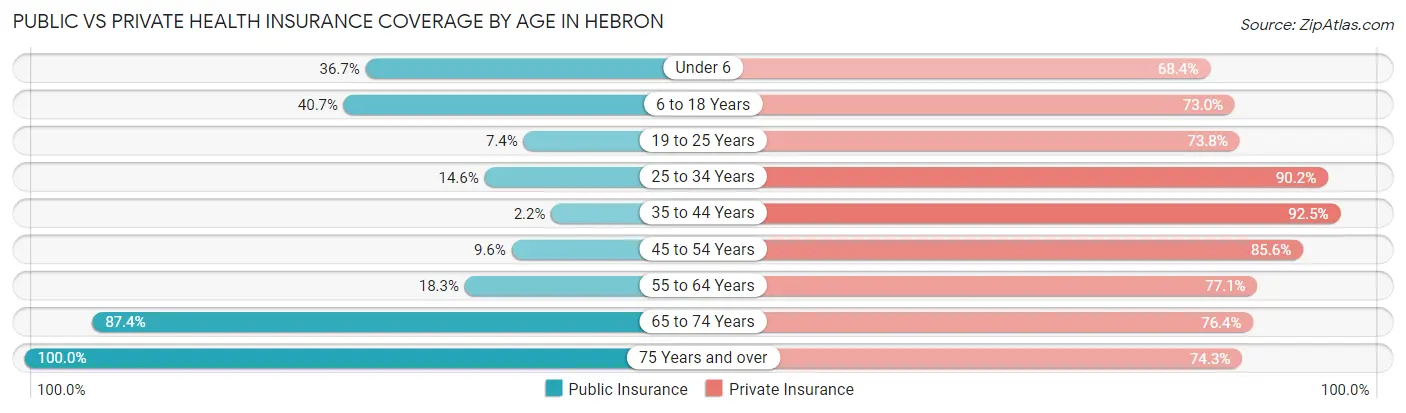
| Age Bracket | Public Insurance | Private Insurance |
| Under 6 | 29 (36.7%) | 54 (68.3%) |
| 6 to 18 Years | 110 (40.7%) | 197 (73.0%) |
| 19 to 25 Years | 11 (7.4%) | 110 (73.8%) |
| 25 to 34 Years | 18 (14.6%) | 111 (90.2%) |
| 35 to 44 Years | 3 (2.2%) | 124 (92.5%) |
| 45 to 54 Years | 12 (9.6%) | 107 (85.6%) |
| 55 to 64 Years | 32 (18.3%) | 135 (77.1%) |
| 65 to 74 Years | 174 (87.4%) | 152 (76.4%) |
| 75 Years and over | 218 (100.0%) | 162 (74.3%) |
| Total | 607 (41.2%) | 1,152 (78.3%) |
Disability Status by Sex by Age in Hebron
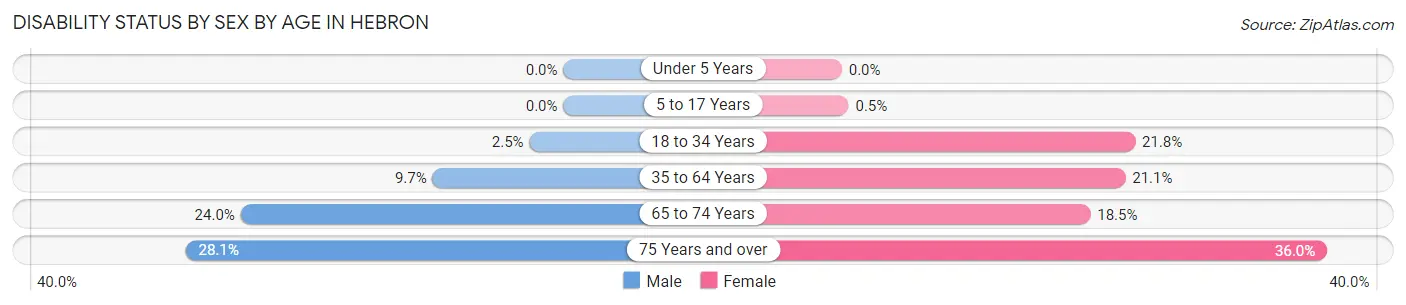
| Age Bracket | Male | Female |
| Under 5 Years | 0 (0.0%) | 0 (0.0%) |
| 5 to 17 Years | 0 (0.0%) | 1 (0.5%) |
| 18 to 34 Years | 4 (2.5%) | 27 (21.8%) |
| 35 to 64 Years | 20 (9.7%) | 48 (21.0%) |
| 65 to 74 Years | 23 (24.0%) | 19 (18.4%) |
| 75 Years and over | 23 (28.1%) | 49 (36.0%) |
Disability Class by Sex by Age in Hebron
Disability Class: Hearing Difficulty
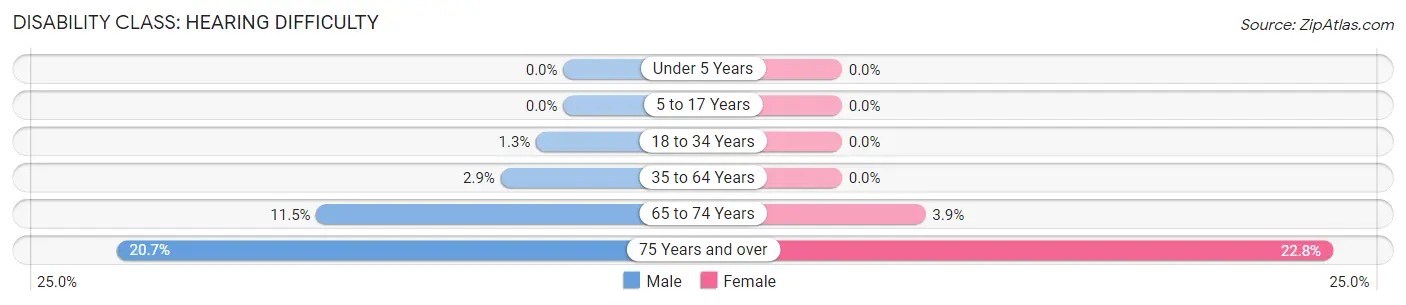
| Age Bracket | Male | Female |
| Under 5 Years | 0 (0.0%) | 0 (0.0%) |
| 5 to 17 Years | 0 (0.0%) | 0 (0.0%) |
| 18 to 34 Years | 2 (1.3%) | 0 (0.0%) |
| 35 to 64 Years | 6 (2.9%) | 0 (0.0%) |
| 65 to 74 Years | 11 (11.5%) | 4 (3.9%) |
| 75 Years and over | 17 (20.7%) | 31 (22.8%) |
Disability Class: Vision Difficulty
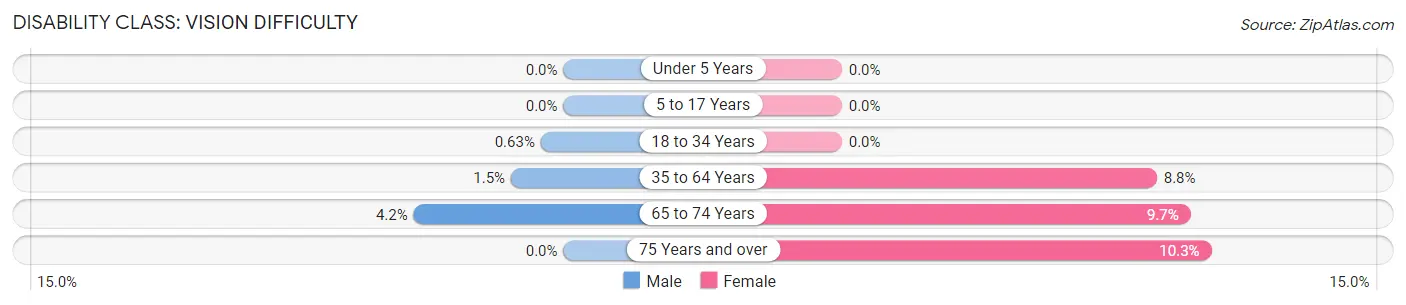
| Age Bracket | Male | Female |
| Under 5 Years | 0 (0.0%) | 0 (0.0%) |
| 5 to 17 Years | 0 (0.0%) | 0 (0.0%) |
| 18 to 34 Years | 1 (0.6%) | 0 (0.0%) |
| 35 to 64 Years | 3 (1.5%) | 20 (8.8%) |
| 65 to 74 Years | 4 (4.2%) | 10 (9.7%) |
| 75 Years and over | 0 (0.0%) | 14 (10.3%) |
Disability Class: Cognitive Difficulty
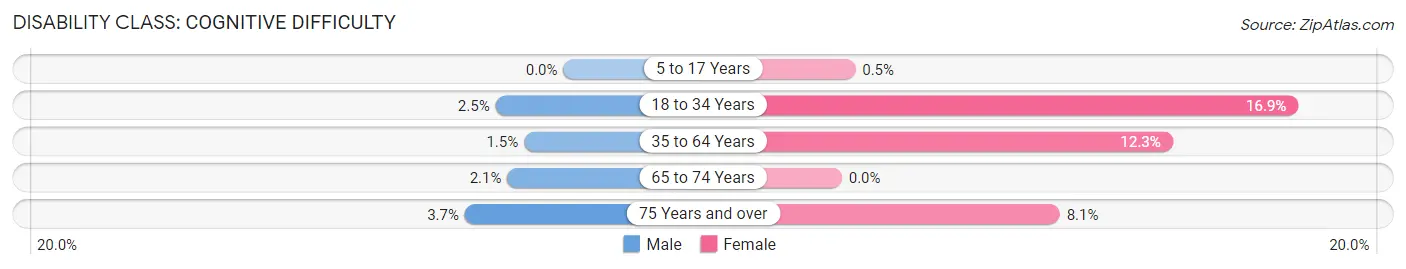
| Age Bracket | Male | Female |
| 5 to 17 Years | 0 (0.0%) | 1 (0.5%) |
| 18 to 34 Years | 4 (2.5%) | 21 (16.9%) |
| 35 to 64 Years | 3 (1.5%) | 28 (12.3%) |
| 65 to 74 Years | 2 (2.1%) | 0 (0.0%) |
| 75 Years and over | 3 (3.7%) | 11 (8.1%) |
Disability Class: Ambulatory Difficulty
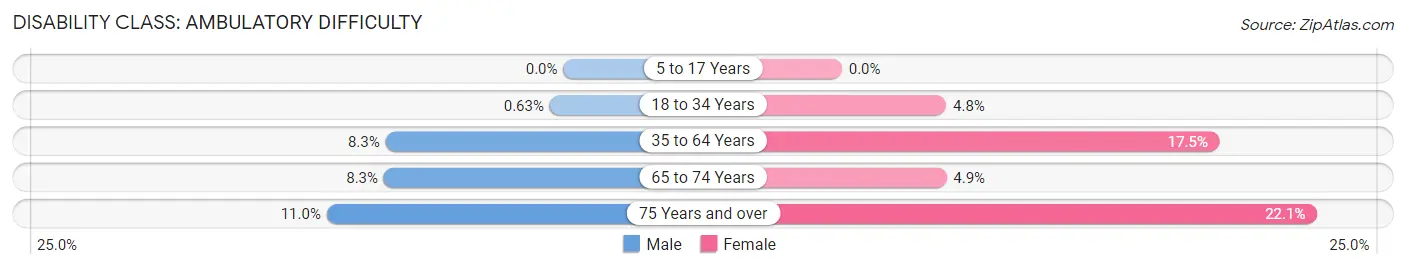
| Age Bracket | Male | Female |
| 5 to 17 Years | 0 (0.0%) | 0 (0.0%) |
| 18 to 34 Years | 1 (0.6%) | 6 (4.8%) |
| 35 to 64 Years | 17 (8.3%) | 40 (17.5%) |
| 65 to 74 Years | 8 (8.3%) | 5 (4.9%) |
| 75 Years and over | 9 (11.0%) | 30 (22.1%) |
Disability Class: Self-Care Difficulty
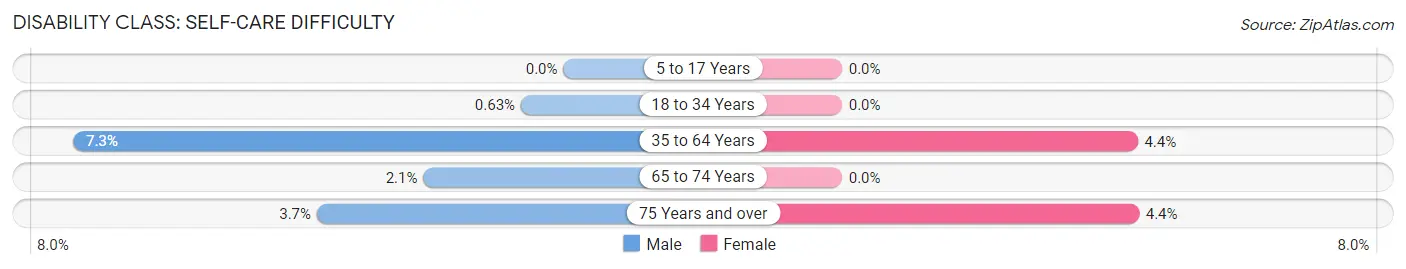
| Age Bracket | Male | Female |
| 5 to 17 Years | 0 (0.0%) | 0 (0.0%) |
| 18 to 34 Years | 1 (0.6%) | 0 (0.0%) |
| 35 to 64 Years | 15 (7.3%) | 10 (4.4%) |
| 65 to 74 Years | 2 (2.1%) | 0 (0.0%) |
| 75 Years and over | 3 (3.7%) | 6 (4.4%) |
Technology Access in Hebron
Computing Device Access in Hebron
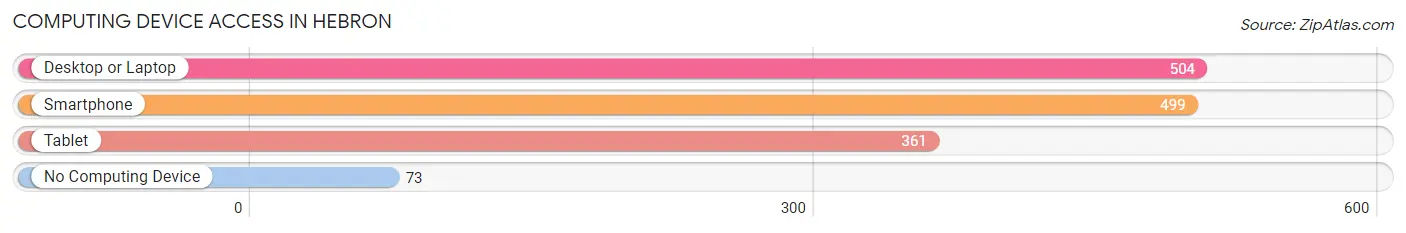
| Device Type | # Households | % Households |
| Desktop or Laptop | 504 | 75.7% |
| Smartphone | 499 | 74.9% |
| Tablet | 361 | 54.2% |
| No Computing Device | 73 | 11.0% |
| Total | 666 | 100.0% |
Internet Access in Hebron
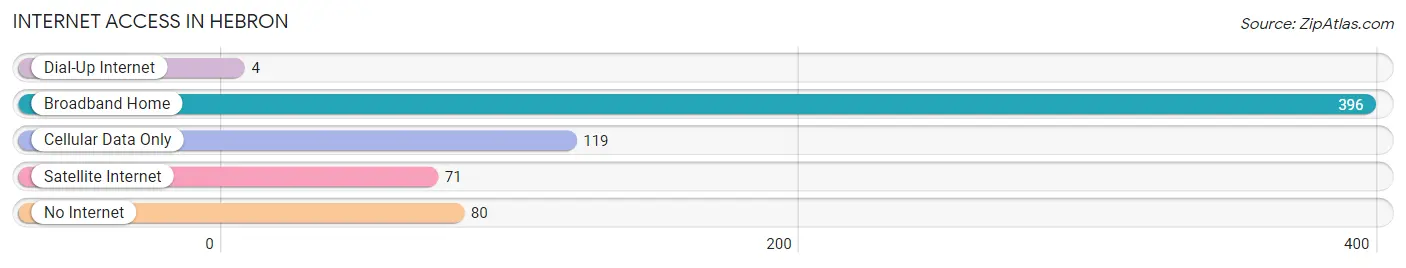
| Internet Type | # Households | % Households |
| Dial-Up Internet | 4 | 0.6% |
| Broadband Home | 396 | 59.5% |
| Cellular Data Only | 119 | 17.9% |
| Satellite Internet | 71 | 10.7% |
| No Internet | 80 | 12.0% |
| Total | 666 | 100.0% |
Hebron Summary
Hebron, Nebraska is a small town located in Thayer County in the southeastern corner of the state. It is situated on the banks of the Little Blue River, and is the county seat of Thayer County. The town was founded in 1871 and was named after the biblical city of Hebron. The population of Hebron was 1,717 in the 2010 census, making it the second-largest town in Thayer County.
Geography
Hebron is located in the southeastern corner of Nebraska, in Thayer County. It is situated on the banks of the Little Blue River, and is the county seat of Thayer County. The town is located at an elevation of 1,845 feet above sea level. The town is located in the Central Plains region of the United States, and is characterized by flat terrain and rolling hills. The climate in Hebron is characterized by hot summers and cold winters.
History
Hebron was founded in 1871 and was named after the biblical city of Hebron. The town was originally settled by German immigrants, and the town was incorporated in 1873. The town was an important stop on the Union Pacific Railroad, and the town grew rapidly in the late 19th century. The town was also an important center for the cattle industry, and the town was home to several large cattle ranches.
In the early 20th century, Hebron was an important center for the agricultural industry. The town was home to several large grain elevators, and the town was an important shipping point for grain and livestock. The town was also home to several large manufacturing plants, including a flour mill, a creamery, and a canning factory.
Economy
Hebron is a small town with a population of 1,717 in the 2010 census. The town is home to several small businesses, including a grocery store, a hardware store, and a few restaurants. The town is also home to several manufacturing plants, including a flour mill, a creamery, and a canning factory. The town is also home to several agricultural businesses, including grain elevators and livestock farms.
The town is also home to several educational institutions, including Hebron High School, Hebron Elementary School, and Hebron Christian Academy. The town is also home to several churches, including the First United Methodist Church, the Hebron Baptist Church, and the Hebron Lutheran Church.
Demographics
Hebron is a small town with a population of 1,717 in the 2010 census. The town is predominantly white, with a population that is 97.2% white, 0.9% African American, 0.3% Native American, 0.2% Asian, and 0.4% from other races. The median household income in Hebron is $45,938, and the median home value is $117,400. The town has a poverty rate of 11.2%, and the unemployment rate is 3.7%.
Conclusion
Hebron, Nebraska is a small town located in Thayer County in the southeastern corner of the state. It is situated on the banks of the Little Blue River, and is the county seat of Thayer County. The town was founded in 1871 and was named after the biblical city of Hebron. The population of Hebron was 1,717 in the 2010 census, making it the second-largest town in Thayer County. The town is predominantly white, with a population that is 97.2% white, 0.9% African American, 0.3% Native American, 0.2% Asian, and 0.4% from other races. The town is home to several small businesses, including a grocery store, a hardware store, and a few restaurants. The town is also home to several manufacturing plants, including a flour mill, a creamery, and a canning factory. The town is also home to several agricultural businesses, including grain elevators and livestock farms. The median household income in Hebron is $45,938, and the median home value is $117,400. The town has a poverty rate of 11.2%, and the unemployment rate is 3.7%.
Common Questions
What is Per Capita Income in Hebron?
Per Capita income in Hebron is $35,361.
What is the Median Family Income in Hebron?
Median Family Income in Hebron is $94,205.
What is the Median Household income in Hebron?
Median Household Income in Hebron is $66,786.
What is Income or Wage Gap in Hebron?
Income or Wage Gap in Hebron is 49.9%.
Women in Hebron earn 50.1 cents for every dollar earned by a man.
What is Inequality or Gini Index in Hebron?
Inequality or Gini Index in Hebron is 0.39.
What is the Total Population of Hebron?
Total Population of Hebron is 1,569.
What is the Total Male Population of Hebron?
Total Male Population of Hebron is 698.
What is the Total Female Population of Hebron?
Total Female Population of Hebron is 871.
What is the Ratio of Males per 100 Females in Hebron?
There are 80.14 Males per 100 Females in Hebron.
What is the Ratio of Females per 100 Males in Hebron?
There are 124.79 Females per 100 Males in Hebron.
What is the Median Population Age in Hebron?
Median Population Age in Hebron is 48.0 Years.
What is the Average Family Size in Hebron
Average Family Size in Hebron is 3.0 People.
What is the Average Household Size in Hebron
Average Household Size in Hebron is 2.2 People.
How Large is the Labor Force in Hebron?
There are 760 People in the Labor Forcein in Hebron.
What is the Percentage of People in the Labor Force in Hebron?
59.3% of People are in the Labor Force in Hebron.
What is the Unemployment Rate in Hebron?
Unemployment Rate in Hebron is 1.7%.