Hay Springs, NE Map & Demographics
Hay Springs Map
Hay Springs Overview
$36,116
PER CAPITA INCOME
$78,750
AVG FAMILY INCOME
$42,500
AVG HOUSEHOLD INCOME
35.5%
WAGE / INCOME GAP [ % ]
64.5¢/ $1
WAGE / INCOME GAP [ $ ]
0.52
INEQUALITY / GINI INDEX
656
TOTAL POPULATION
324
MALE POPULATION
332
FEMALE POPULATION
97.59
MALES / 100 FEMALES
102.47
FEMALES / 100 MALES
54.4
MEDIAN AGE
2.5
AVG FAMILY SIZE
2.0
AVG HOUSEHOLD SIZE
316
LABOR FORCE [ PEOPLE ]
54.9%
PERCENT IN LABOR FORCE
Hay Springs Zip Codes
Hay Springs Area Codes
Income in Hay Springs
Income Overview in Hay Springs
Per Capita Income in Hay Springs is $36,116, while median incomes of families and households are $78,750 and $42,500 respectively.
| Characteristic | Number | Measure |
| Per Capita Income | 656 | $36,116 |
| Median Family Income | 184 | $78,750 |
| Mean Family Income | 184 | $104,902 |
| Median Household Income | 288 | $42,500 |
| Mean Household Income | 288 | $78,448 |
| Income Deficit | 184 | $0 |
| Wage / Income Gap (%) | 656 | 35.47% |
| Wage / Income Gap ($) | 656 | 64.53¢ per $1 |
| Gini / Inequality Index | 656 | 0.52 |
Earnings by Sex in Hay Springs
Average Earnings in Hay Springs are $34,559, $43,259 for men and $27,917 for women, a difference of 35.5%.

| Sex | Number | Average Earnings |
| Male | 177 (52.1%) | $43,259 |
| Female | 163 (47.9%) | $27,917 |
| Total | 340 (100.0%) | $34,559 |
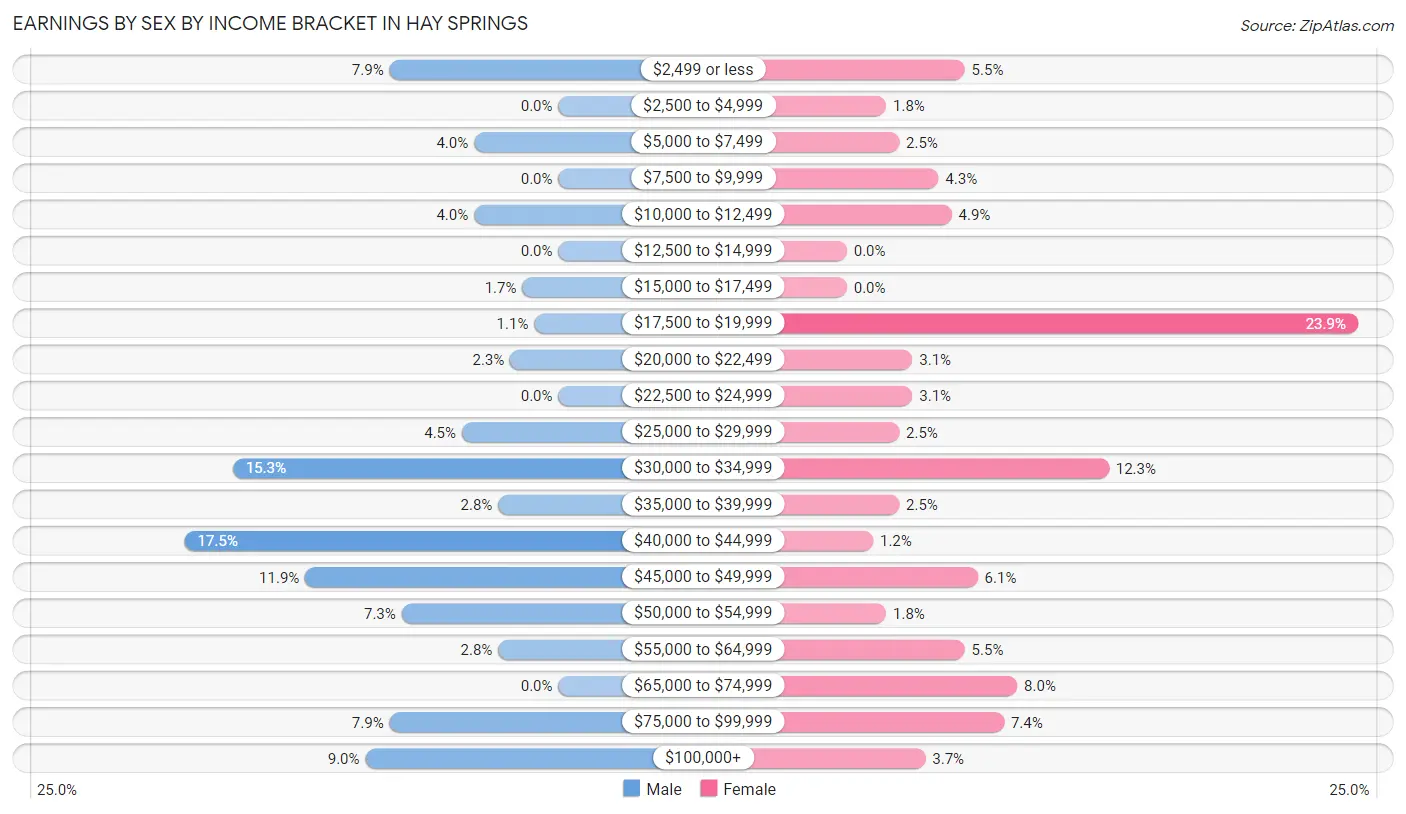
Earnings by Sex by Income Bracket in Hay Springs
The most common earnings brackets in Hay Springs are $40,000 to $44,999 for men (31 | 17.5%) and $17,500 to $19,999 for women (39 | 23.9%).
| Income | Male | Female |
| $2,499 or less | 14 (7.9%) | 9 (5.5%) |
| $2,500 to $4,999 | 0 (0.0%) | 3 (1.8%) |
| $5,000 to $7,499 | 7 (4.0%) | 4 (2.5%) |
| $7,500 to $9,999 | 0 (0.0%) | 7 (4.3%) |
| $10,000 to $12,499 | 7 (4.0%) | 8 (4.9%) |
| $12,500 to $14,999 | 0 (0.0%) | 0 (0.0%) |
| $15,000 to $17,499 | 3 (1.7%) | 0 (0.0%) |
| $17,500 to $19,999 | 2 (1.1%) | 39 (23.9%) |
| $20,000 to $22,499 | 4 (2.3%) | 5 (3.1%) |
| $22,500 to $24,999 | 0 (0.0%) | 5 (3.1%) |
| $25,000 to $29,999 | 8 (4.5%) | 4 (2.5%) |
| $30,000 to $34,999 | 27 (15.2%) | 20 (12.3%) |
| $35,000 to $39,999 | 5 (2.8%) | 4 (2.5%) |
| $40,000 to $44,999 | 31 (17.5%) | 2 (1.2%) |
| $45,000 to $49,999 | 21 (11.9%) | 10 (6.1%) |
| $50,000 to $54,999 | 13 (7.3%) | 3 (1.8%) |
| $55,000 to $64,999 | 5 (2.8%) | 9 (5.5%) |
| $65,000 to $74,999 | 0 (0.0%) | 13 (8.0%) |
| $75,000 to $99,999 | 14 (7.9%) | 12 (7.4%) |
| $100,000+ | 16 (9.0%) | 6 (3.7%) |
| Total | 177 (100.0%) | 163 (100.0%) |
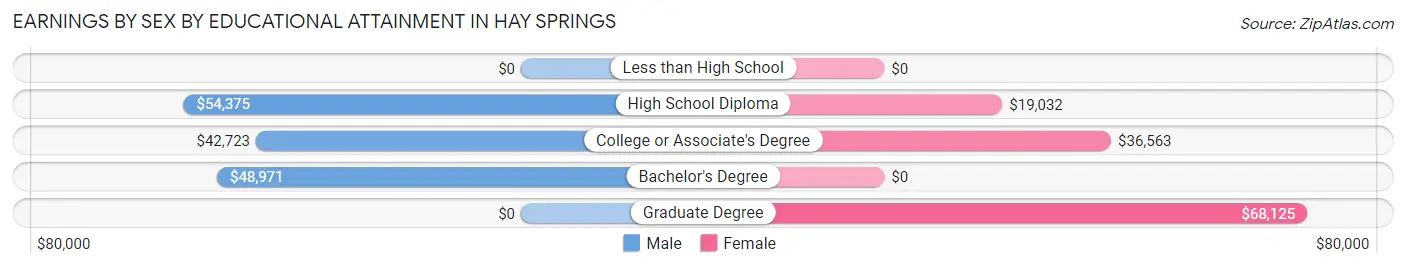
Earnings by Sex by Educational Attainment in Hay Springs
Average earnings in Hay Springs are $43,973 for men and $32,589 for women, a difference of 25.9%. Men with an educational attainment of high school diploma enjoy the highest average annual earnings of $54,375, while those with college or associate's degree education earn the least with $42,723. Women with an educational attainment of graduate degree earn the most with the average annual earnings of $68,125, while those with high school diploma education have the smallest earnings of $19,032.
| Educational Attainment | Male Income | Female Income |
| Less than High School | - | - |
| High School Diploma | $54,375 | $19,032 |
| College or Associate's Degree | $42,723 | $36,563 |
| Bachelor's Degree | $48,971 | $0 |
| Graduate Degree | - | - |
| Total | $43,973 | $32,589 |
Family Income in Hay Springs
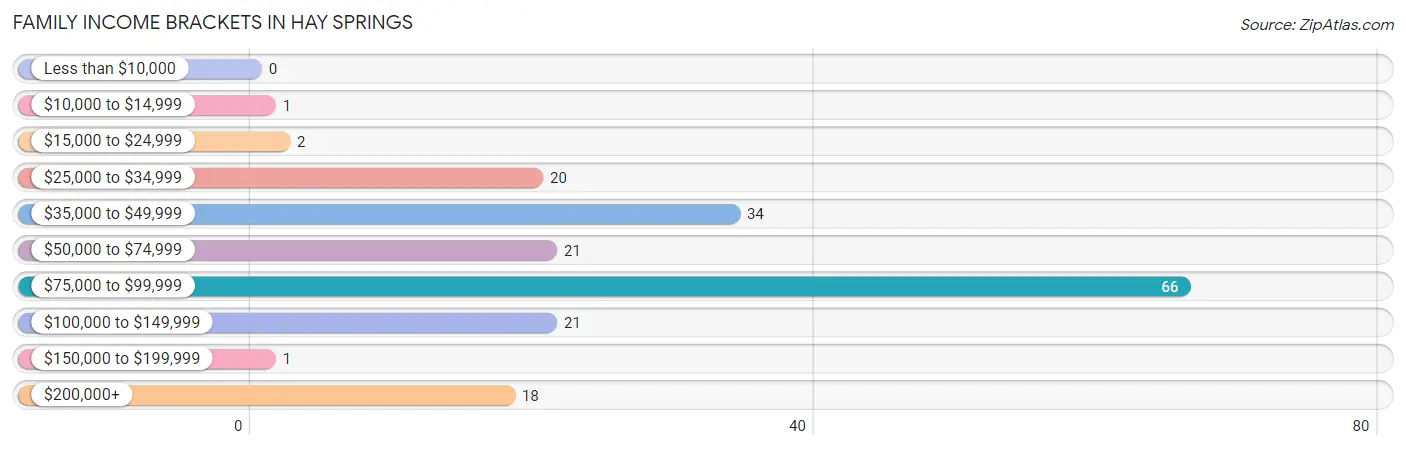
Family Income Brackets in Hay Springs
According to the Hay Springs family income data, there are 66 families falling into the $75,000 to $99,999 income range, which is the most common income bracket and makes up 35.9% of all families.
| Income Bracket | # Families | % Families |
| Less than $10,000 | 0 | 0.0% |
| $10,000 to $14,999 | 1 | 0.5% |
| $15,000 to $24,999 | 2 | 1.1% |
| $25,000 to $34,999 | 20 | 10.9% |
| $35,000 to $49,999 | 34 | 18.5% |
| $50,000 to $74,999 | 21 | 11.4% |
| $75,000 to $99,999 | 66 | 35.9% |
| $100,000 to $149,999 | 21 | 11.4% |
| $150,000 to $199,999 | 1 | 0.5% |
| $200,000+ | 18 | 9.8% |
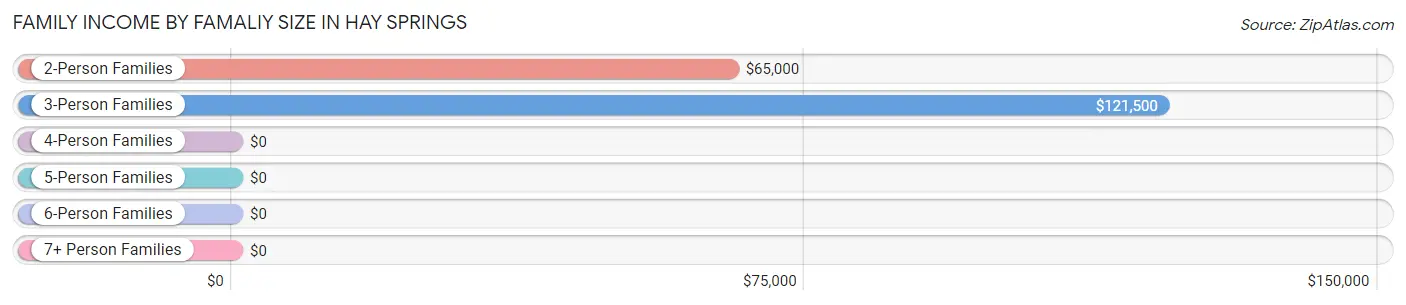
Family Income by Famaliy Size in Hay Springs
3-person families (24 | 13.0%) account for the highest median family income in Hay Springs with $121,500 per family, while 3-person families (24 | 13.0%) have the highest median income of $40,500 per family member.
| Income Bracket | # Families | Median Income |
| 2-Person Families | 134 (72.8%) | $65,000 |
| 3-Person Families | 24 (13.0%) | $121,500 |
| 4-Person Families | 0 (0.0%) | $0 |
| 5-Person Families | 26 (14.1%) | $0 |
| 6-Person Families | 0 (0.0%) | $0 |
| 7+ Person Families | 0 (0.0%) | $0 |
| Total | 184 (100.0%) | $78,750 |
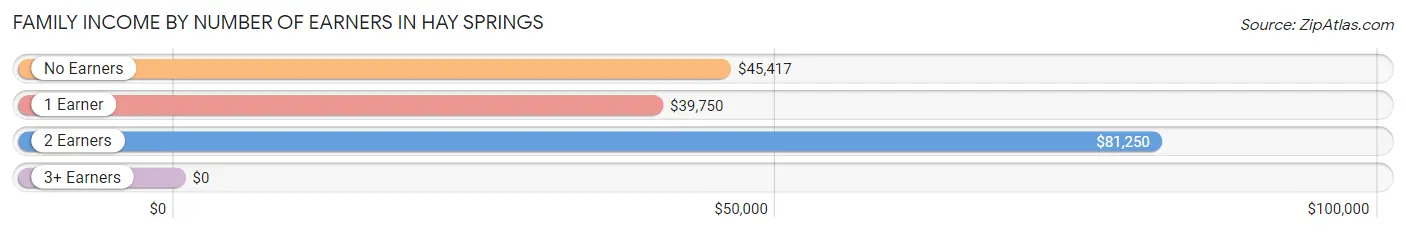
Family Income by Number of Earners in Hay Springs
| Number of Earners | # Families | Median Income |
| No Earners | 28 (15.2%) | $45,417 |
| 1 Earner | 59 (32.1%) | $39,750 |
| 2 Earners | 82 (44.6%) | $81,250 |
| 3+ Earners | 15 (8.2%) | $0 |
| Total | 184 (100.0%) | $78,750 |
Household Income in Hay Springs
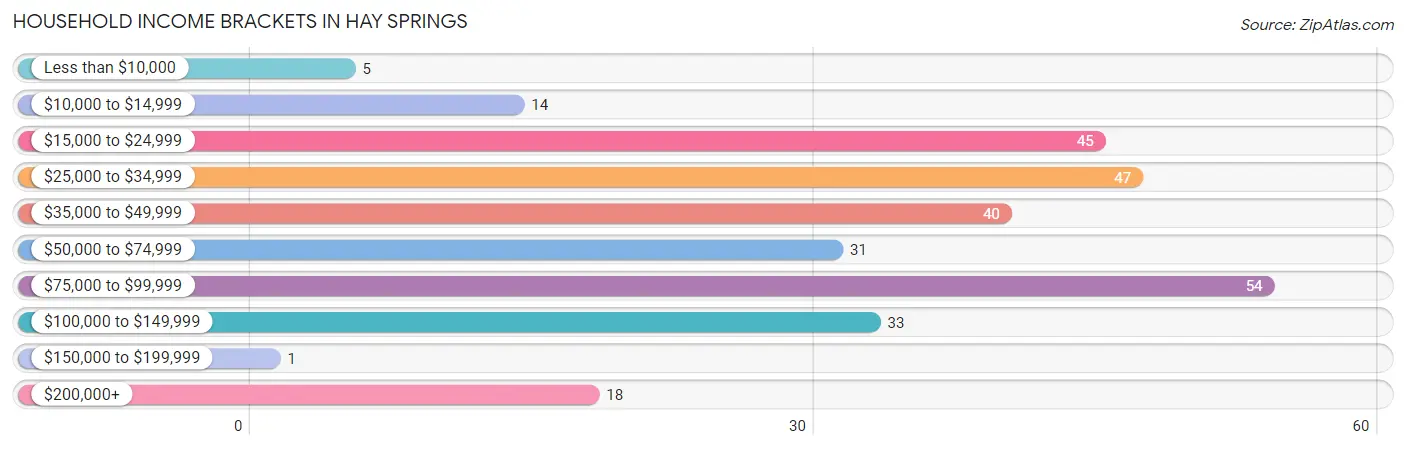
Household Income Brackets in Hay Springs
With 54 households falling in the category, the $75,000 to $99,999 income range is the most frequent in Hay Springs, accounting for 18.8% of all households. In contrast, only 1 households (0.4%) fall into the $150,000 to $199,999 income bracket, making it the least populous group.
| Income Bracket | # Households | % Households |
| Less than $10,000 | 5 | 1.7% |
| $10,000 to $14,999 | 14 | 4.9% |
| $15,000 to $24,999 | 45 | 15.6% |
| $25,000 to $34,999 | 47 | 16.3% |
| $35,000 to $49,999 | 40 | 13.9% |
| $50,000 to $74,999 | 31 | 10.8% |
| $75,000 to $99,999 | 54 | 18.8% |
| $100,000 to $149,999 | 33 | 11.5% |
| $150,000 to $199,999 | 1 | 0.3% |
| $200,000+ | 18 | 6.3% |
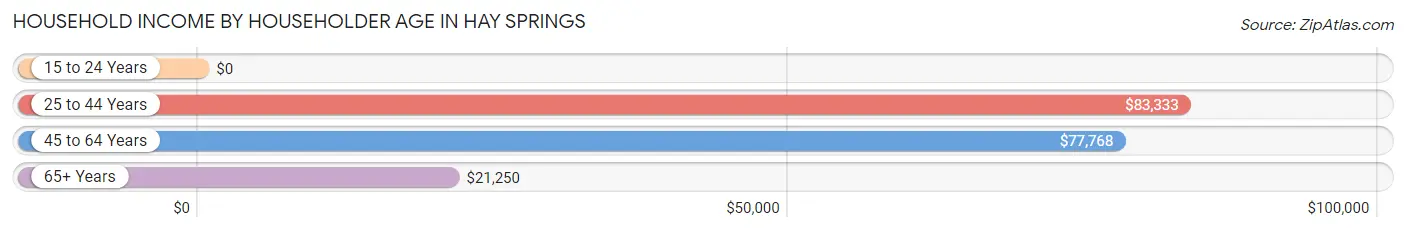
Household Income by Householder Age in Hay Springs
The median household income in Hay Springs is $42,500, with the highest median household income of $83,333 found in the 25 to 44 years age bracket for the primary householder. A total of 64 households (22.2%) fall into this category. Meanwhile, the 15 to 24 years age bracket for the primary householder has the lowest median household income of $0, with 6 households (2.1%) in this group.
| Income Bracket | # Households | Median Income |
| 15 to 24 Years | 6 (2.1%) | $0 |
| 25 to 44 Years | 64 (22.2%) | $83,333 |
| 45 to 64 Years | 122 (42.4%) | $77,768 |
| 65+ Years | 96 (33.3%) | $21,250 |
| Total | 288 (100.0%) | $42,500 |
Poverty in Hay Springs
Income Below Poverty by Sex and Age in Hay Springs
With 15.6% poverty level for males and 8.5% for females among the residents of Hay Springs, 35 to 44 year old males and 18 to 24 year old females are the most vulnerable to poverty, with 13 males (48.1%) and 15 females (41.7%) in their respective age groups living below the poverty level.
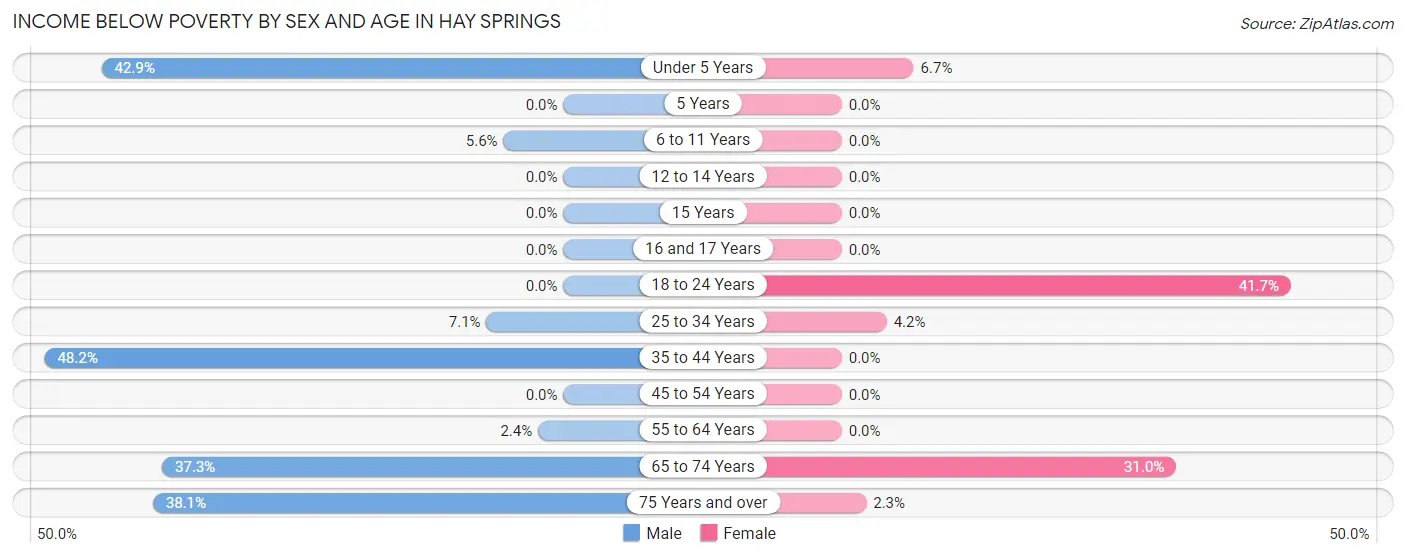
| Age Bracket | Male | Female |
| Under 5 Years | 3 (42.9%) | 1 (6.7%) |
| 5 Years | 0 (0.0%) | 0 (0.0%) |
| 6 to 11 Years | 1 (5.6%) | 0 (0.0%) |
| 12 to 14 Years | 0 (0.0%) | 0 (0.0%) |
| 15 Years | 0 (0.0%) | 0 (0.0%) |
| 16 and 17 Years | 0 (0.0%) | 0 (0.0%) |
| 18 to 24 Years | 0 (0.0%) | 15 (41.7%) |
| 25 to 34 Years | 3 (7.1%) | 1 (4.2%) |
| 35 to 44 Years | 13 (48.1%) | 0 (0.0%) |
| 45 to 54 Years | 0 (0.0%) | 0 (0.0%) |
| 55 to 64 Years | 2 (2.4%) | 0 (0.0%) |
| 65 to 74 Years | 19 (37.2%) | 9 (31.0%) |
| 75 Years and over | 8 (38.1%) | 1 (2.3%) |
| Total | 49 (15.6%) | 27 (8.5%) |
Income Above Poverty by Sex and Age in Hay Springs
According to the poverty statistics in Hay Springs, males aged 5 years and females aged 6 to 11 years are the age groups that are most secure financially, with 100.0% of males and 100.0% of females in these age groups living above the poverty line.
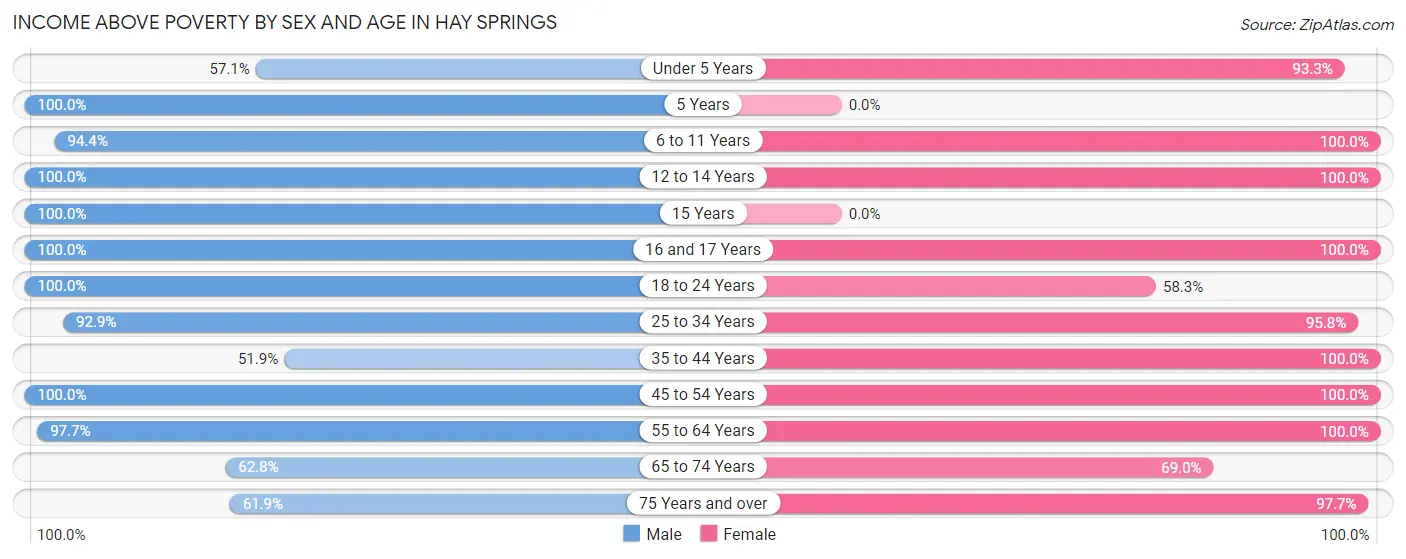
| Age Bracket | Male | Female |
| Under 5 Years | 4 (57.1%) | 14 (93.3%) |
| 5 Years | 3 (100.0%) | 0 (0.0%) |
| 6 to 11 Years | 17 (94.4%) | 10 (100.0%) |
| 12 to 14 Years | 8 (100.0%) | 11 (100.0%) |
| 15 Years | 8 (100.0%) | 0 (0.0%) |
| 16 and 17 Years | 5 (100.0%) | 3 (100.0%) |
| 18 to 24 Years | 11 (100.0%) | 21 (58.3%) |
| 25 to 34 Years | 39 (92.9%) | 23 (95.8%) |
| 35 to 44 Years | 14 (51.8%) | 36 (100.0%) |
| 45 to 54 Years | 28 (100.0%) | 39 (100.0%) |
| 55 to 64 Years | 83 (97.7%) | 69 (100.0%) |
| 65 to 74 Years | 32 (62.7%) | 20 (69.0%) |
| 75 Years and over | 13 (61.9%) | 43 (97.7%) |
| Total | 265 (84.4%) | 289 (91.5%) |
Income Below Poverty Among Married-Couple Families in Hay Springs
The poverty statistics for married-couple families in Hay Springs show that 1.9% or 3 of the total 160 families live below the poverty line. Families with 3 or 4 children have the highest poverty rate of 12.5%, comprising of 1 families. On the other hand, families with 1 or 2 children have the lowest poverty rate of 0.0%, which includes 0 families.
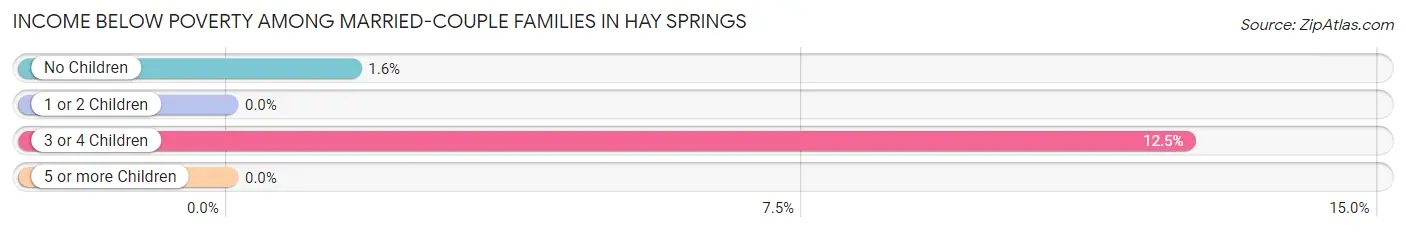
| Children | Above Poverty | Below Poverty |
| No Children | 122 (98.4%) | 2 (1.6%) |
| 1 or 2 Children | 28 (100.0%) | 0 (0.0%) |
| 3 or 4 Children | 7 (87.5%) | 1 (12.5%) |
| 5 or more Children | 0 (0.0%) | 0 (0.0%) |
| Total | 157 (98.1%) | 3 (1.9%) |
Income Below Poverty Among Single-Parent Households in Hay Springs
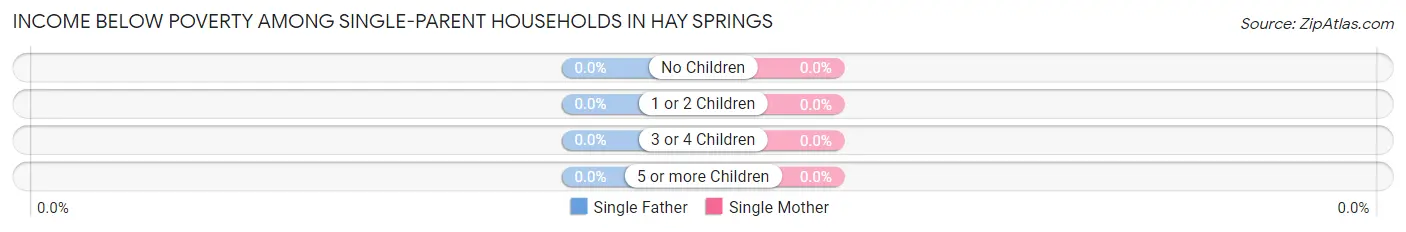
| Children | Single Father | Single Mother |
| No Children | 0 (0.0%) | 0 (0.0%) |
| 1 or 2 Children | 0 (0.0%) | 0 (0.0%) |
| 3 or 4 Children | 0 (0.0%) | 0 (0.0%) |
| 5 or more Children | 0 (0.0%) | 0 (0.0%) |
| Total | 0 (0.0%) | 0 (0.0%) |
Income Below Poverty Among Married-Couple vs Single-Parent Households in Hay Springs
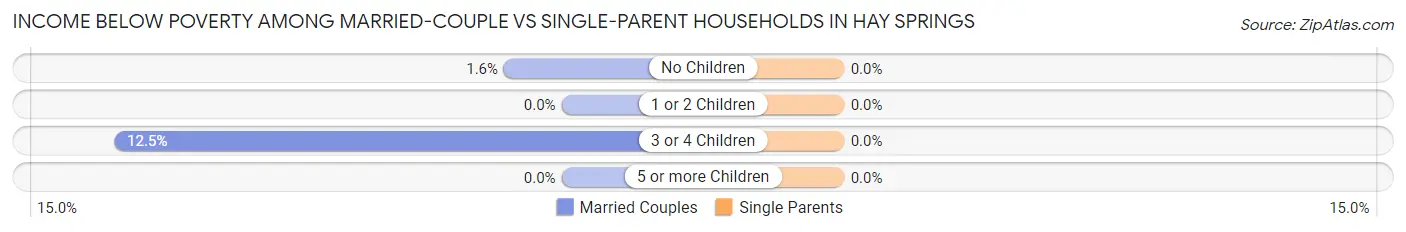
| Children | Married-Couple Families | Single-Parent Households |
| No Children | 2 (1.6%) | 0 (0.0%) |
| 1 or 2 Children | 0 (0.0%) | 0 (0.0%) |
| 3 or 4 Children | 1 (12.5%) | 0 (0.0%) |
| 5 or more Children | 0 (0.0%) | 0 (0.0%) |
| Total | 3 (1.9%) | 0 (0.0%) |
Race in Hay Springs
The most populous races in Hay Springs are White / Caucasian (611 | 93.1%), Two or more Races (26 | 4.0%), and Black / African American (13 | 2.0%).
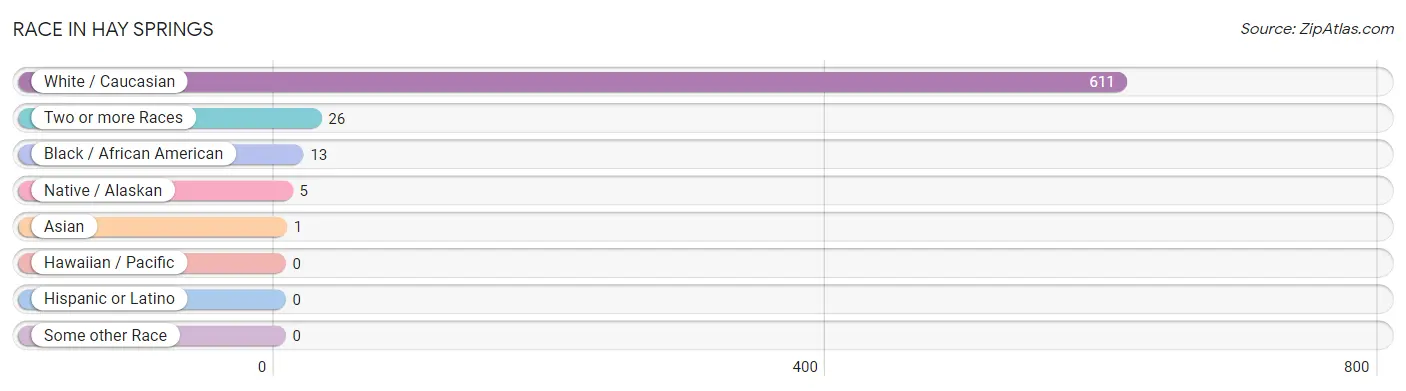
| Race | # Population | % Population |
| Asian | 1 | 0.2% |
| Black / African American | 13 | 2.0% |
| Hawaiian / Pacific | 0 | 0.0% |
| Hispanic or Latino | 0 | 0.0% |
| Native / Alaskan | 5 | 0.8% |
| White / Caucasian | 611 | 93.1% |
| Two or more Races | 26 | 4.0% |
| Some other Race | 0 | 0.0% |
| Total | 656 | 100.0% |
Ancestry in Hay Springs
The most populous ancestries reported in Hay Springs are German (188 | 28.7%), English (107 | 16.3%), Irish (56 | 8.5%), Norwegian (54 | 8.2%), and American (33 | 5.0%), together accounting for 66.8% of all Hay Springs residents.
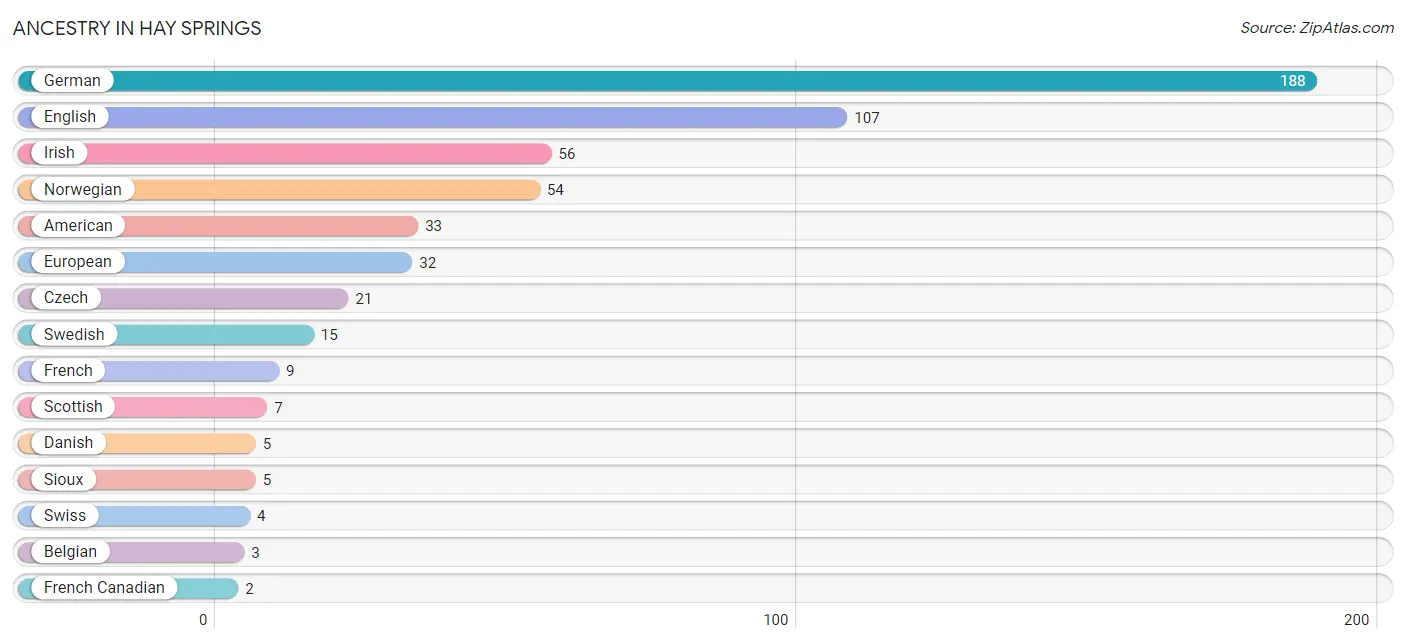
| Ancestry | # Population | % Population |
| American | 33 | 5.0% |
| Belgian | 3 | 0.5% |
| Bhutanese | 1 | 0.2% |
| Czech | 21 | 3.2% |
| Danish | 5 | 0.8% |
| Dutch | 1 | 0.2% |
| English | 107 | 16.3% |
| European | 32 | 4.9% |
| French | 9 | 1.4% |
| French Canadian | 2 | 0.3% |
| German | 188 | 28.7% |
| Irish | 56 | 8.5% |
| Norwegian | 54 | 8.2% |
| Polish | 2 | 0.3% |
| Scottish | 7 | 1.1% |
| Sioux | 5 | 0.8% |
| Swedish | 15 | 2.3% |
| Swiss | 4 | 0.6% | View All 18 Rows |
Immigrants in Hay Springs
The most numerous immigrant groups reported in Hay Springs came from Central America (2 | 0.3%), Latin America (2 | 0.3%), and Panama (2 | 0.3%), together accounting for 0.9% of all Hay Springs residents.
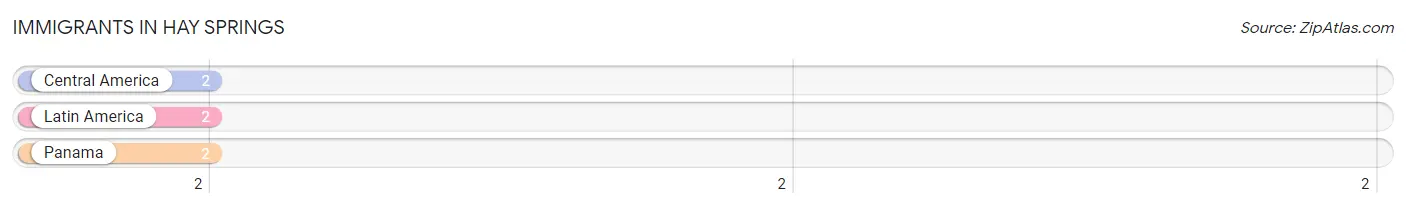
| Immigration Origin | # Population | % Population |
| Central America | 2 | 0.3% |
| Latin America | 2 | 0.3% |
| Panama | 2 | 0.3% | View All 3 Rows |
Sex and Age in Hay Springs
Sex and Age in Hay Springs
The most populous age groups in Hay Springs are 60 to 64 Years (48 | 14.8%) for men and 55 to 59 Years (52 | 15.7%) for women.
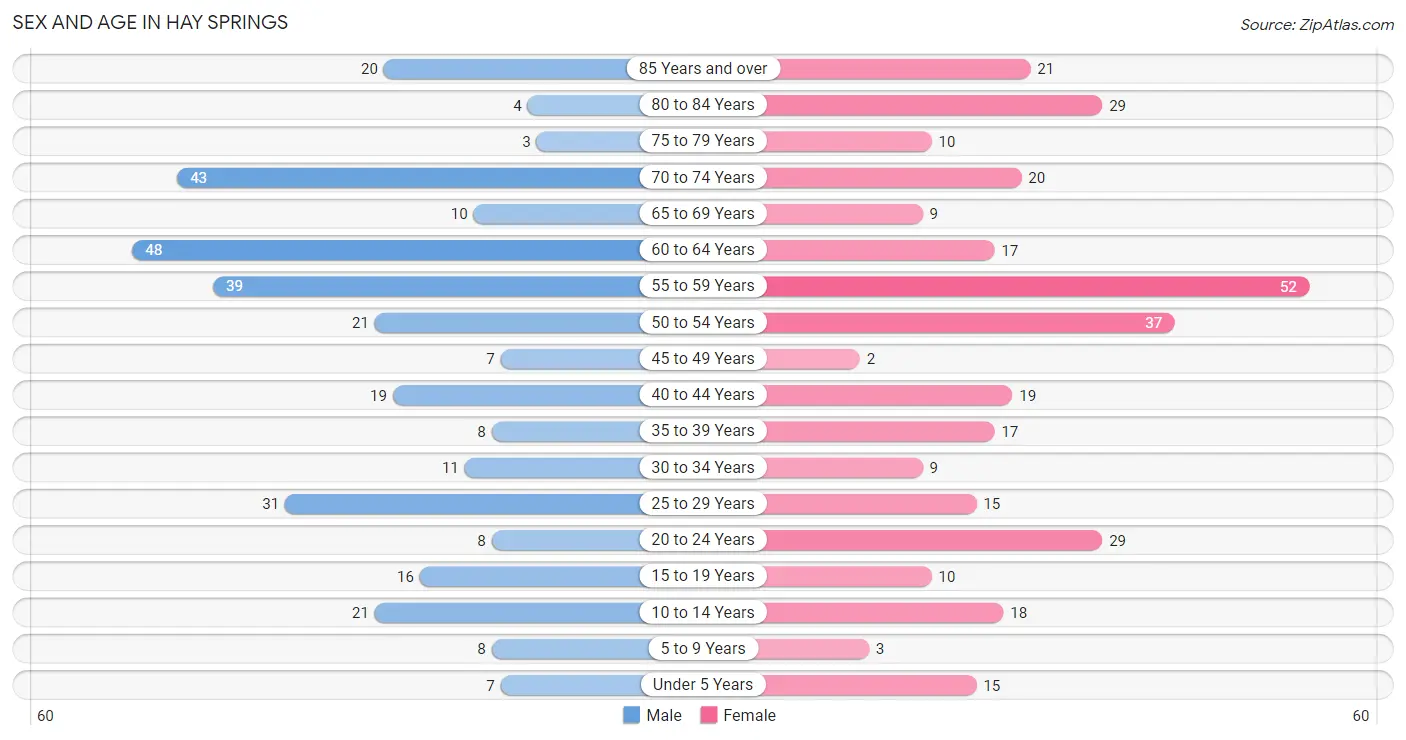
| Age Bracket | Male | Female |
| Under 5 Years | 7 (2.2%) | 15 (4.5%) |
| 5 to 9 Years | 8 (2.5%) | 3 (0.9%) |
| 10 to 14 Years | 21 (6.5%) | 18 (5.4%) |
| 15 to 19 Years | 16 (4.9%) | 10 (3.0%) |
| 20 to 24 Years | 8 (2.5%) | 29 (8.7%) |
| 25 to 29 Years | 31 (9.6%) | 15 (4.5%) |
| 30 to 34 Years | 11 (3.4%) | 9 (2.7%) |
| 35 to 39 Years | 8 (2.5%) | 17 (5.1%) |
| 40 to 44 Years | 19 (5.9%) | 19 (5.7%) |
| 45 to 49 Years | 7 (2.2%) | 2 (0.6%) |
| 50 to 54 Years | 21 (6.5%) | 37 (11.1%) |
| 55 to 59 Years | 39 (12.0%) | 52 (15.7%) |
| 60 to 64 Years | 48 (14.8%) | 17 (5.1%) |
| 65 to 69 Years | 10 (3.1%) | 9 (2.7%) |
| 70 to 74 Years | 43 (13.3%) | 20 (6.0%) |
| 75 to 79 Years | 3 (0.9%) | 10 (3.0%) |
| 80 to 84 Years | 4 (1.2%) | 29 (8.7%) |
| 85 Years and over | 20 (6.2%) | 21 (6.3%) |
| Total | 324 (100.0%) | 332 (100.0%) |
Families and Households in Hay Springs
Median Family Size in Hay Springs
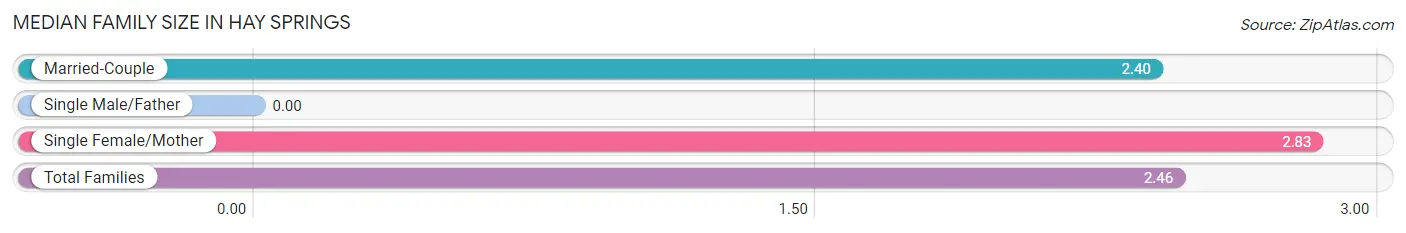
| Family Type | # Families | Family Size |
| Married-Couple | 160 (87.0%) | 2.40 |
| Single Male/Father | 0 (0.0%) | - |
| Single Female/Mother | 24 (13.0%) | 2.83 |
| Total Families | 184 (100.0%) | 2.46 |
Median Household Size in Hay Springs
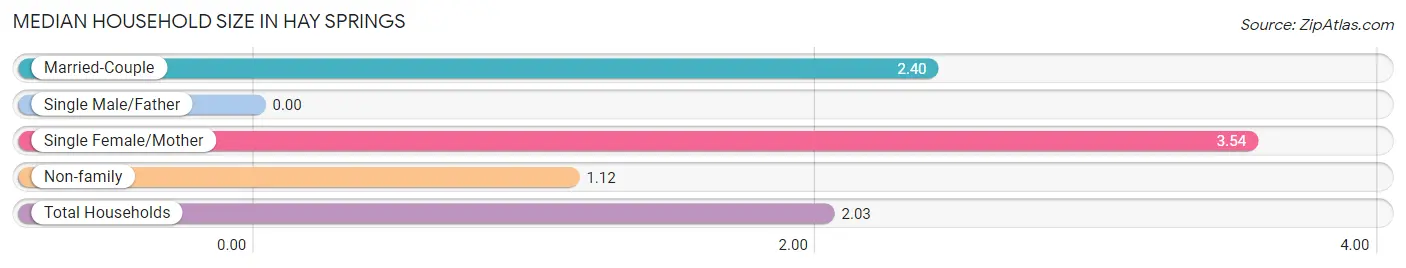
| Household Type | # Households | Household Size |
| Married-Couple | 160 (55.6%) | 2.40 |
| Single Male/Father | 0 (0.0%) | - |
| Single Female/Mother | 24 (8.3%) | 3.54 |
| Non-family | 104 (36.1%) | 1.12 |
| Total Households | 288 (100.0%) | 2.03 |
Household Size by Marriage Status in Hay Springs
Out of a total of 288 households in Hay Springs, 184 (63.9%) are family households, while 104 (36.1%) are nonfamily households. The most numerous type of family households are 2-person households, comprising 134, and the most common type of nonfamily households are 1-person households, comprising 99.
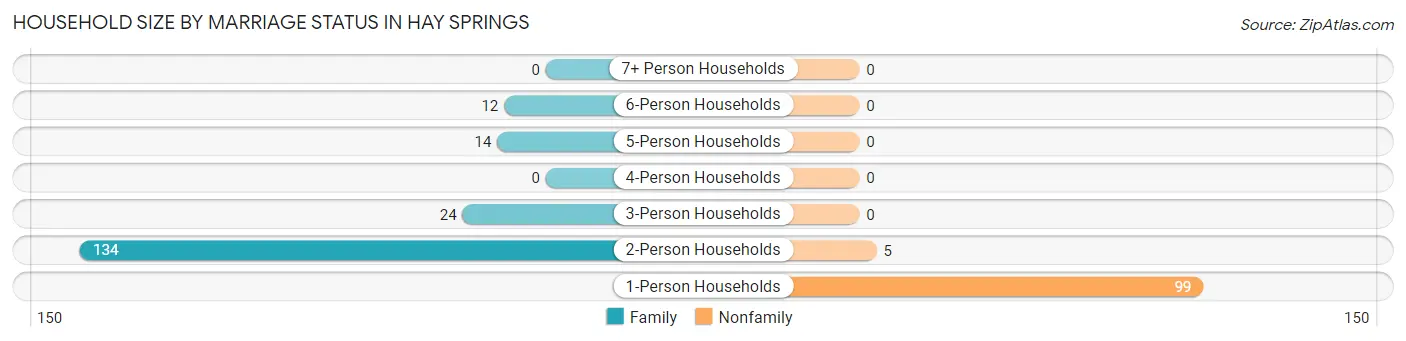
| Household Size | Family Households | Nonfamily Households |
| 1-Person Households | - | 99 (34.4%) |
| 2-Person Households | 134 (46.5%) | 5 (1.7%) |
| 3-Person Households | 24 (8.3%) | 0 (0.0%) |
| 4-Person Households | 0 (0.0%) | 0 (0.0%) |
| 5-Person Households | 14 (4.9%) | 0 (0.0%) |
| 6-Person Households | 12 (4.2%) | 0 (0.0%) |
| 7+ Person Households | 0 (0.0%) | 0 (0.0%) |
| Total | 184 (63.9%) | 104 (36.1%) |
Female Fertility in Hay Springs
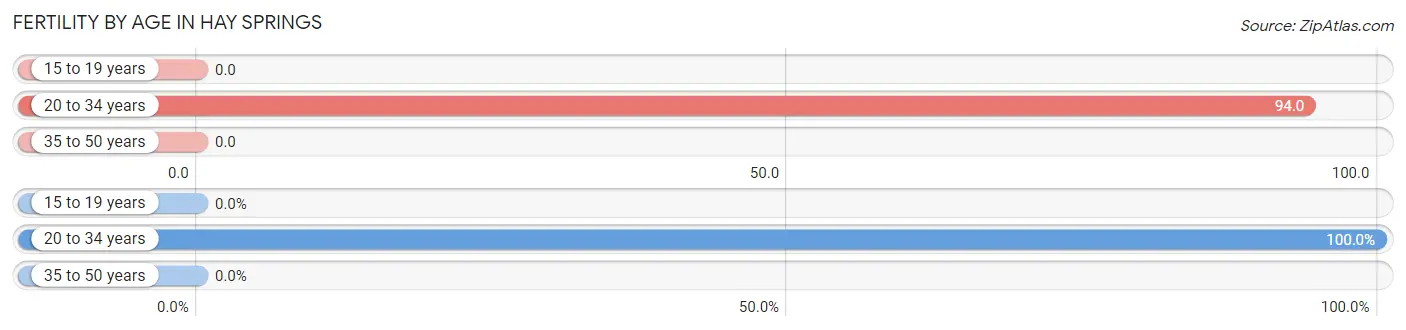
Fertility by Age in Hay Springs
Average fertility rate in Hay Springs is 48.0 births per 1,000 women. Women in the age bracket of 20 to 34 years have the highest fertility rate with 94.0 births per 1,000 women. Women in the age bracket of 20 to 34 years acount for 100.0% of all women with births.
| Age Bracket | Women with Births | Births / 1,000 Women |
| 15 to 19 years | 0 (0.0%) | 0.0 |
| 20 to 34 years | 5 (100.0%) | 94.0 |
| 35 to 50 years | 0 (0.0%) | 0.0 |
| Total | 5 (100.0%) | 48.0 |
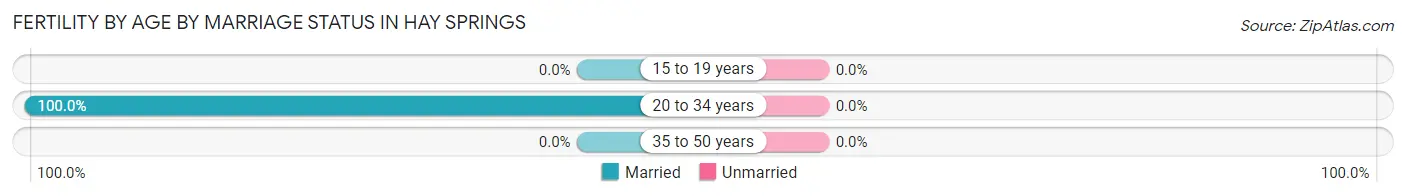
Fertility by Age by Marriage Status in Hay Springs
| Age Bracket | Married | Unmarried |
| 15 to 19 years | 0 (0.0%) | 0 (0.0%) |
| 20 to 34 years | 5 (100.0%) | 0 (0.0%) |
| 35 to 50 years | 0 (0.0%) | 0 (0.0%) |
| Total | 5 (100.0%) | 0 (0.0%) |
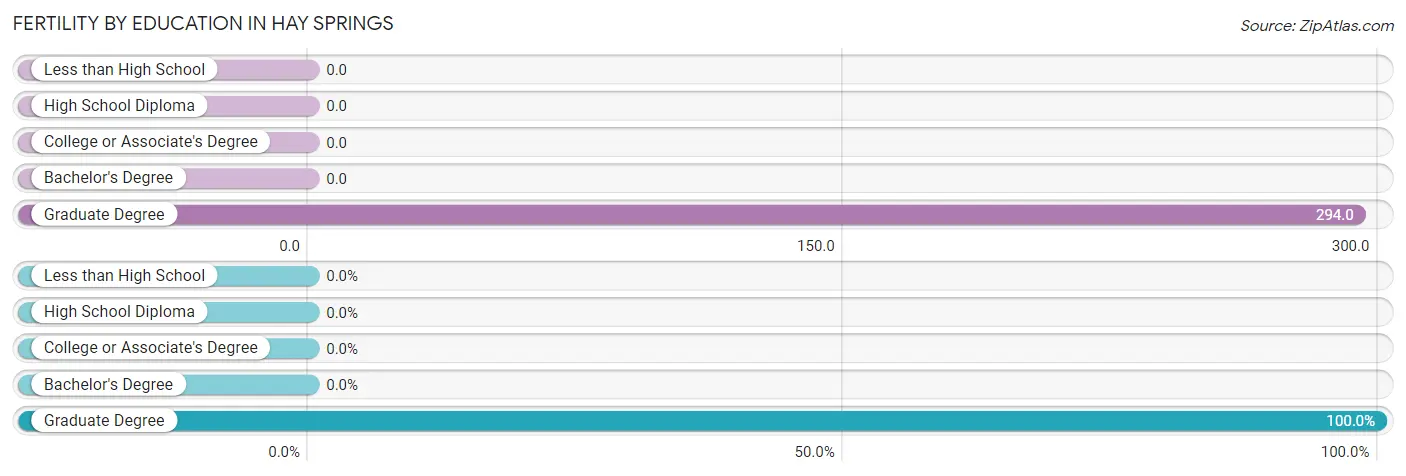
Fertility by Education in Hay Springs
| Educational Attainment | Women with Births | Births / 1,000 Women |
| Less than High School | 0 (0.0%) | 0.0 |
| High School Diploma | 0 (0.0%) | 0.0 |
| College or Associate's Degree | 0 (0.0%) | 0.0 |
| Bachelor's Degree | 0 (0.0%) | 0.0 |
| Graduate Degree | 5 (100.0%) | 294.0 |
| Total | 5 (100.0%) | 48.0 |
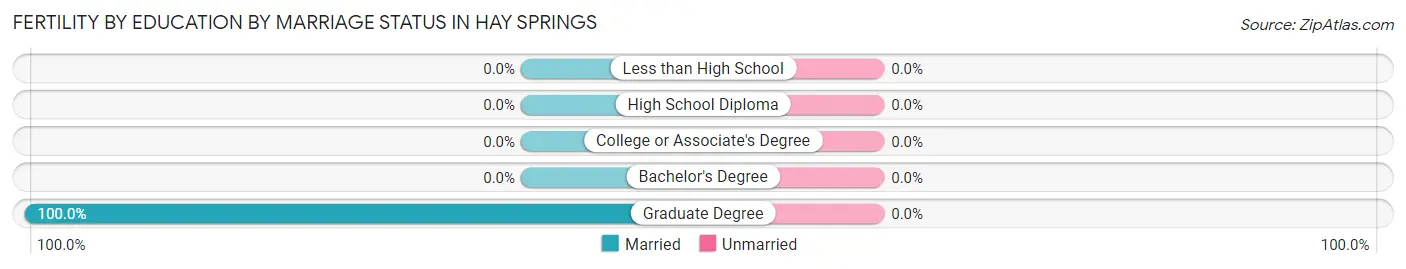
Fertility by Education by Marriage Status in Hay Springs
| Educational Attainment | Married | Unmarried |
| Less than High School | 0 (0.0%) | 0 (0.0%) |
| High School Diploma | 0 (0.0%) | 0 (0.0%) |
| College or Associate's Degree | 0 (0.0%) | 0 (0.0%) |
| Bachelor's Degree | 0 (0.0%) | 0 (0.0%) |
| Graduate Degree | 5 (100.0%) | 0 (0.0%) |
| Total | 5 (100.0%) | 0 (0.0%) |
Employment Characteristics in Hay Springs
Employment by Class of Employer in Hay Springs
Among the 314 employed individuals in Hay Springs, private company employees (132 | 42.0%), self-employed (not incorporated) (56 | 17.8%), and local government employees (45 | 14.3%) make up the most common classes of employment.
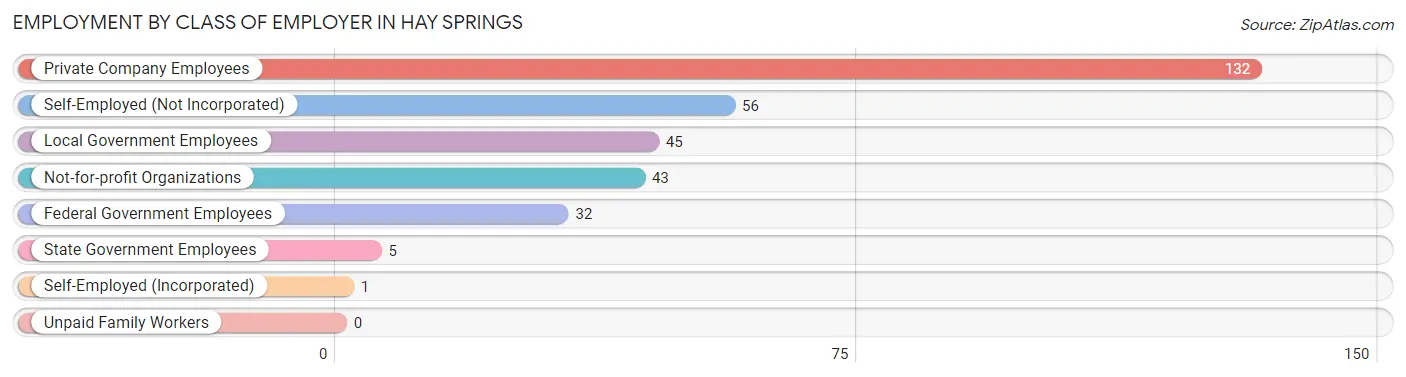
| Employer Class | # Employees | % Employees |
| Private Company Employees | 132 | 42.0% |
| Self-Employed (Incorporated) | 1 | 0.3% |
| Self-Employed (Not Incorporated) | 56 | 17.8% |
| Not-for-profit Organizations | 43 | 13.7% |
| Local Government Employees | 45 | 14.3% |
| State Government Employees | 5 | 1.6% |
| Federal Government Employees | 32 | 10.2% |
| Unpaid Family Workers | 0 | 0.0% |
| Total | 314 | 100.0% |
Employment Status by Age in Hay Springs
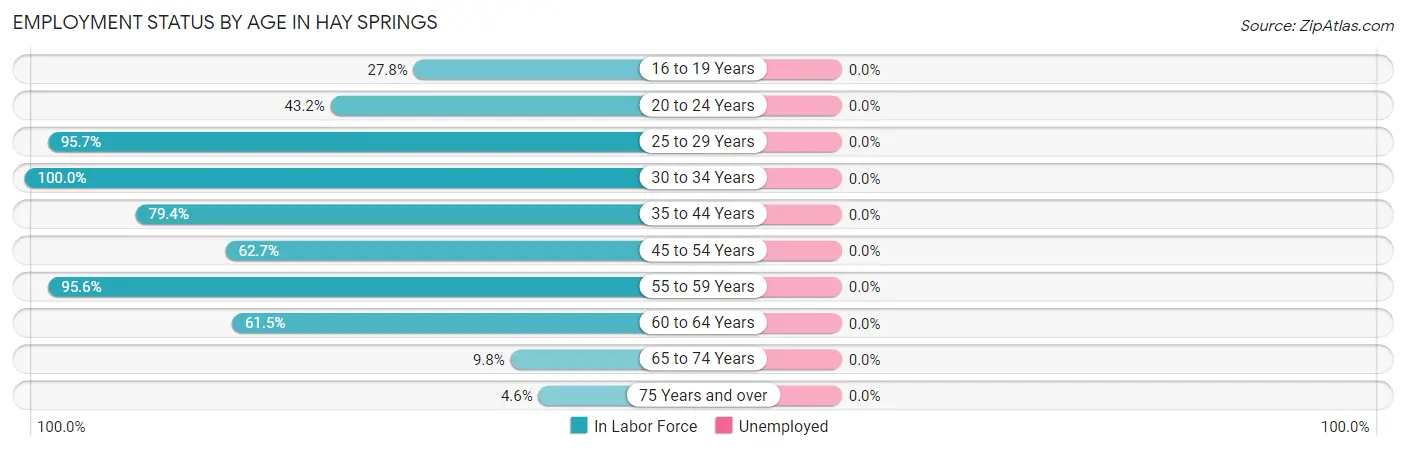
| Age Bracket | In Labor Force | Unemployed |
| 16 to 19 Years | 5 (27.8%) | 0 (0.0%) |
| 20 to 24 Years | 16 (43.2%) | 0 (0.0%) |
| 25 to 29 Years | 44 (95.7%) | 0 (0.0%) |
| 30 to 34 Years | 20 (100.0%) | 0 (0.0%) |
| 35 to 44 Years | 50 (79.4%) | 0 (0.0%) |
| 45 to 54 Years | 42 (62.7%) | 0 (0.0%) |
| 55 to 59 Years | 87 (95.6%) | 0 (0.0%) |
| 60 to 64 Years | 40 (61.5%) | 0 (0.0%) |
| 65 to 74 Years | 8 (9.8%) | 0 (0.0%) |
| 75 Years and over | 4 (4.6%) | 0 (0.0%) |
| Total | 316 (54.9%) | 0 (0.0%) |
Employment Status by Educational Attainment in Hay Springs
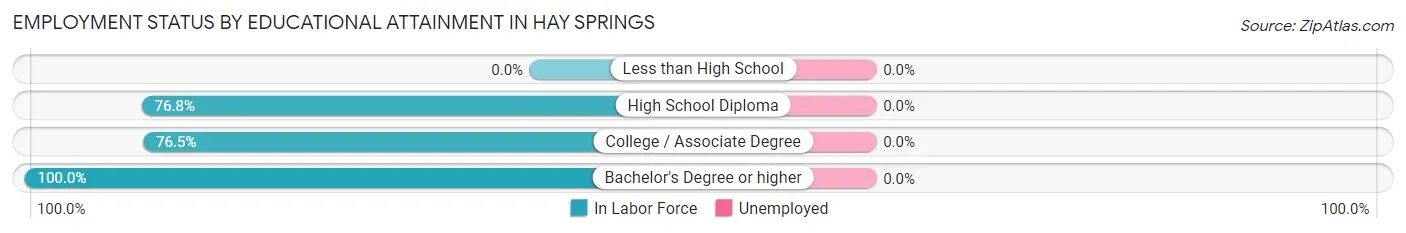
| Educational Attainment | In Labor Force | Unemployed |
| Less than High School | 0 (0.0%) | 0 (0.0%) |
| High School Diploma | 76 (76.8%) | 0 (0.0%) |
| College / Associate Degree | 143 (76.5%) | 0 (0.0%) |
| Bachelor's Degree or higher | 64 (100.0%) | 0 (0.0%) |
| Total | 283 (80.4%) | 0 (0.0%) |
Employment Occupations by Sex in Hay Springs
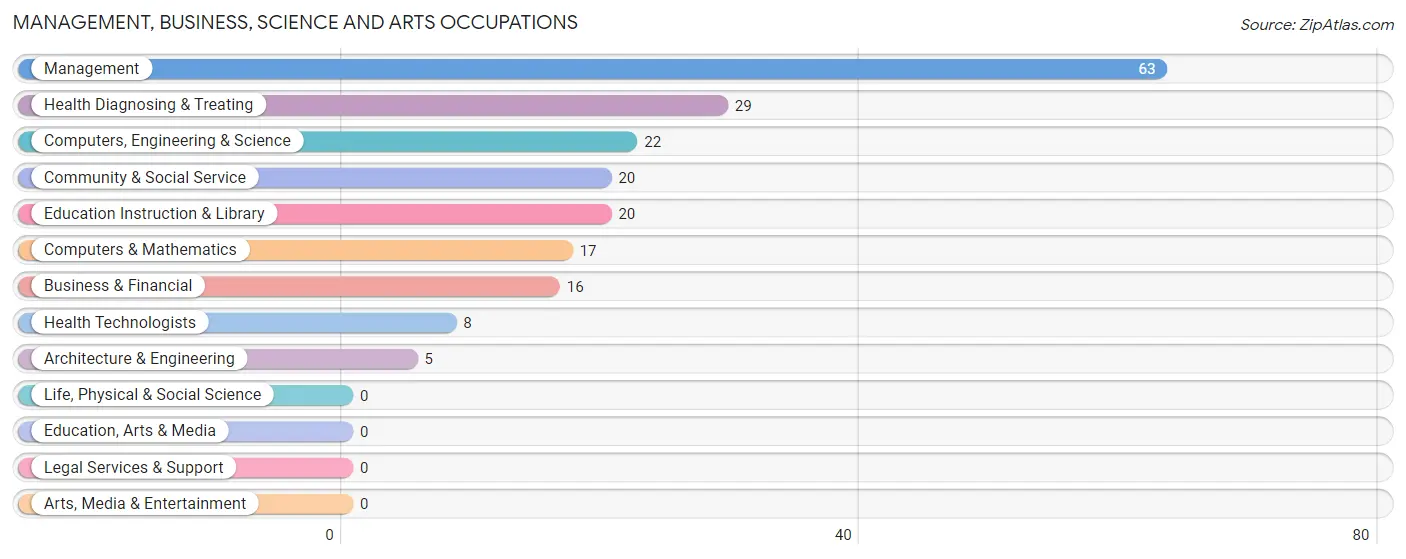
Management, Business, Science and Arts Occupations
The most common Management, Business, Science and Arts occupations in Hay Springs are Management (63 | 19.9%), Health Diagnosing & Treating (29 | 9.2%), Computers, Engineering & Science (22 | 7.0%), Community & Social Service (20 | 6.3%), and Education Instruction & Library (20 | 6.3%).
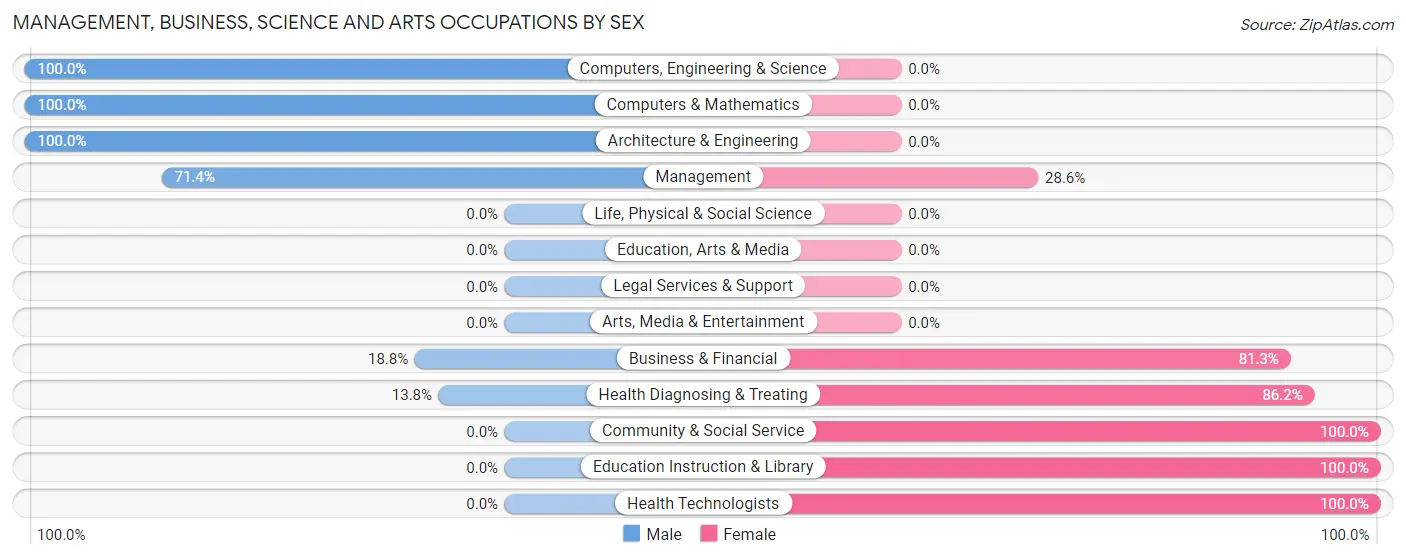
Management, Business, Science and Arts Occupations by Sex
Within the Management, Business, Science and Arts occupations in Hay Springs, the most male-oriented occupations are Computers, Engineering & Science (100.0%), Computers & Mathematics (100.0%), and Architecture & Engineering (100.0%), while the most female-oriented occupations are Community & Social Service (100.0%), Education Instruction & Library (100.0%), and Health Technologists (100.0%).
| Occupation | Male | Female |
| Management | 45 (71.4%) | 18 (28.6%) |
| Business & Financial | 3 (18.8%) | 13 (81.2%) |
| Computers, Engineering & Science | 22 (100.0%) | 0 (0.0%) |
| Computers & Mathematics | 17 (100.0%) | 0 (0.0%) |
| Architecture & Engineering | 5 (100.0%) | 0 (0.0%) |
| Life, Physical & Social Science | 0 (0.0%) | 0 (0.0%) |
| Community & Social Service | 0 (0.0%) | 20 (100.0%) |
| Education, Arts & Media | 0 (0.0%) | 0 (0.0%) |
| Legal Services & Support | 0 (0.0%) | 0 (0.0%) |
| Education Instruction & Library | 0 (0.0%) | 20 (100.0%) |
| Arts, Media & Entertainment | 0 (0.0%) | 0 (0.0%) |
| Health Diagnosing & Treating | 4 (13.8%) | 25 (86.2%) |
| Health Technologists | 0 (0.0%) | 8 (100.0%) |
| Total (Category) | 74 (49.3%) | 76 (50.7%) |
| Total (Overall) | 168 (53.2%) | 148 (46.8%) |
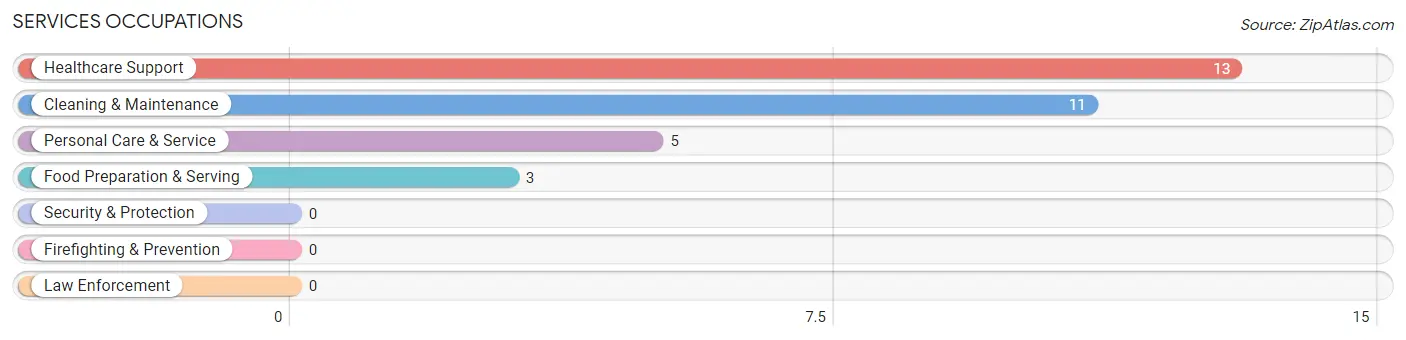
Services Occupations
The most common Services occupations in Hay Springs are Healthcare Support (13 | 4.1%), Cleaning & Maintenance (11 | 3.5%), Personal Care & Service (5 | 1.6%), and Food Preparation & Serving (3 | 0.9%).
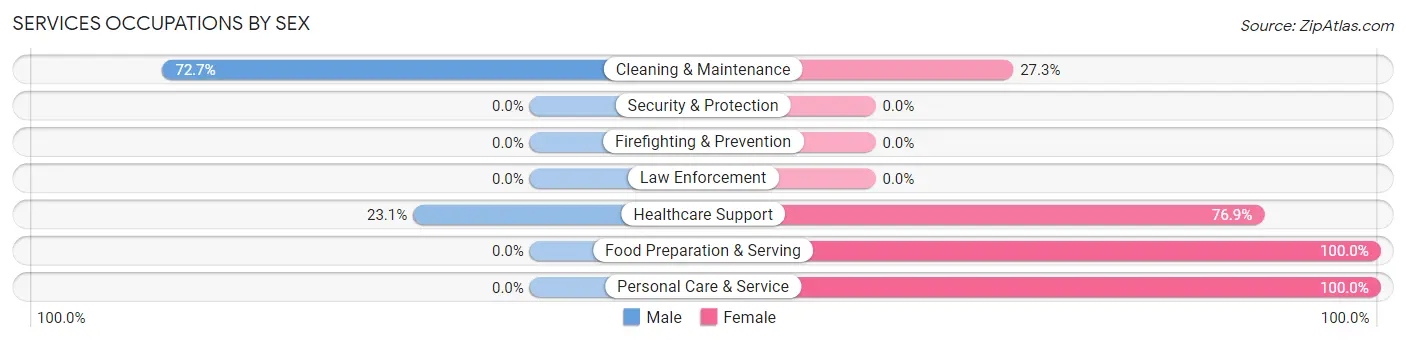
Services Occupations by Sex
Within the Services occupations in Hay Springs, the most male-oriented occupations are Cleaning & Maintenance (72.7%), and Healthcare Support (23.1%), while the most female-oriented occupations are Food Preparation & Serving (100.0%), Personal Care & Service (100.0%), and Healthcare Support (76.9%).
| Occupation | Male | Female |
| Healthcare Support | 3 (23.1%) | 10 (76.9%) |
| Security & Protection | 0 (0.0%) | 0 (0.0%) |
| Firefighting & Prevention | 0 (0.0%) | 0 (0.0%) |
| Law Enforcement | 0 (0.0%) | 0 (0.0%) |
| Food Preparation & Serving | 0 (0.0%) | 3 (100.0%) |
| Cleaning & Maintenance | 8 (72.7%) | 3 (27.3%) |
| Personal Care & Service | 0 (0.0%) | 5 (100.0%) |
| Total (Category) | 11 (34.4%) | 21 (65.6%) |
| Total (Overall) | 168 (53.2%) | 148 (46.8%) |
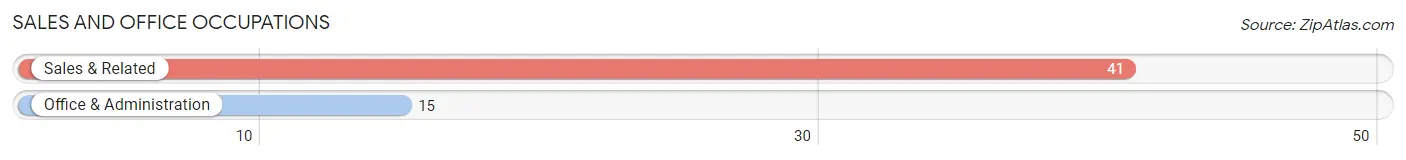
Sales and Office Occupations
The most common Sales and Office occupations in Hay Springs are Sales & Related (41 | 13.0%), and Office & Administration (15 | 4.8%).
Sales and Office Occupations by Sex
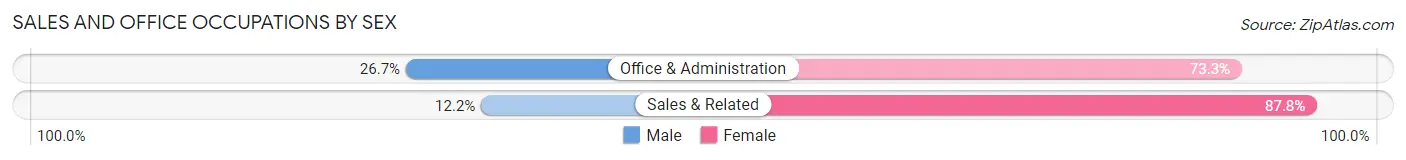
| Occupation | Male | Female |
| Sales & Related | 5 (12.2%) | 36 (87.8%) |
| Office & Administration | 4 (26.7%) | 11 (73.3%) |
| Total (Category) | 9 (16.1%) | 47 (83.9%) |
| Total (Overall) | 168 (53.2%) | 148 (46.8%) |
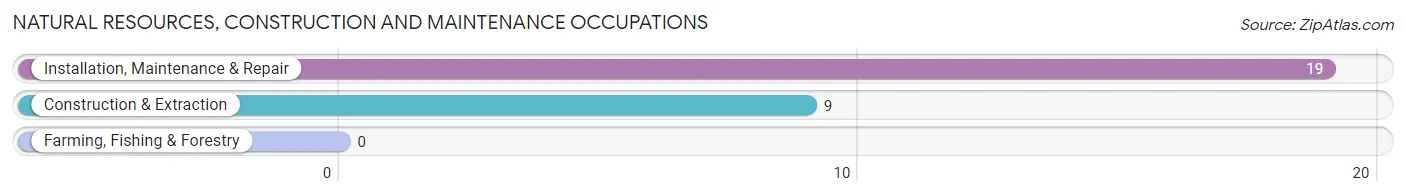
Natural Resources, Construction and Maintenance Occupations
The most common Natural Resources, Construction and Maintenance occupations in Hay Springs are Installation, Maintenance & Repair (19 | 6.0%), and Construction & Extraction (9 | 2.9%).
Natural Resources, Construction and Maintenance Occupations by Sex
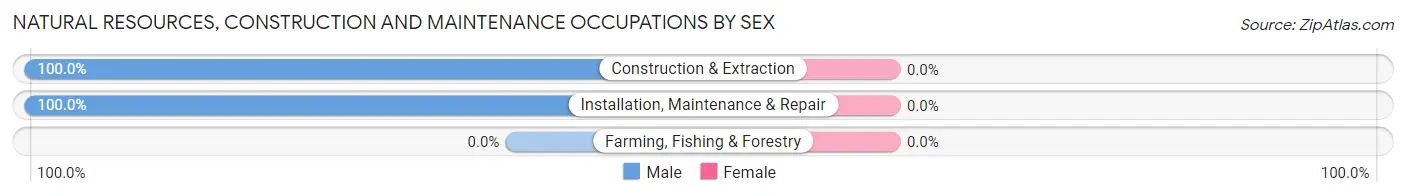
| Occupation | Male | Female |
| Farming, Fishing & Forestry | 0 (0.0%) | 0 (0.0%) |
| Construction & Extraction | 9 (100.0%) | 0 (0.0%) |
| Installation, Maintenance & Repair | 19 (100.0%) | 0 (0.0%) |
| Total (Category) | 28 (100.0%) | 0 (0.0%) |
| Total (Overall) | 168 (53.2%) | 148 (46.8%) |
Production, Transportation and Moving Occupations
The most common Production, Transportation and Moving occupations in Hay Springs are Production (31 | 9.8%), Transportation (16 | 5.1%), and Material Moving (3 | 0.9%).
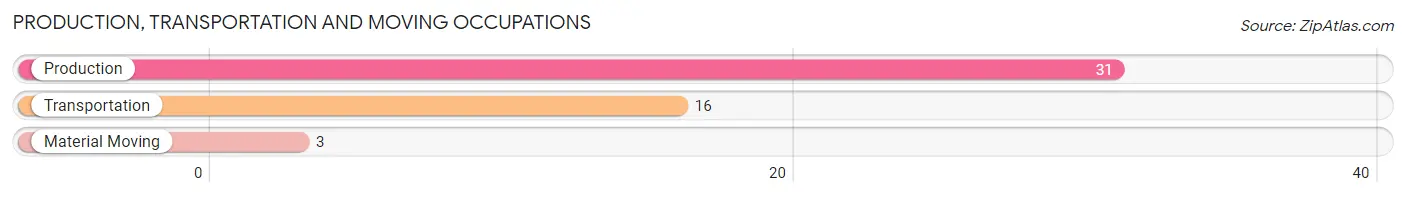
Production, Transportation and Moving Occupations by Sex
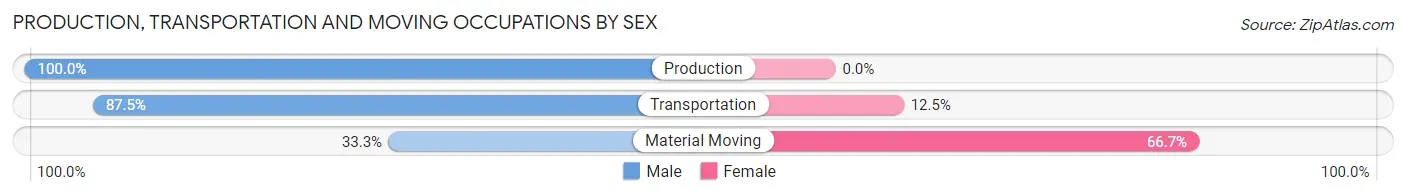
| Occupation | Male | Female |
| Production | 31 (100.0%) | 0 (0.0%) |
| Transportation | 14 (87.5%) | 2 (12.5%) |
| Material Moving | 1 (33.3%) | 2 (66.7%) |
| Total (Category) | 46 (92.0%) | 4 (8.0%) |
| Total (Overall) | 168 (53.2%) | 148 (46.8%) |
Employment Industries by Sex in Hay Springs
Employment Industries in Hay Springs
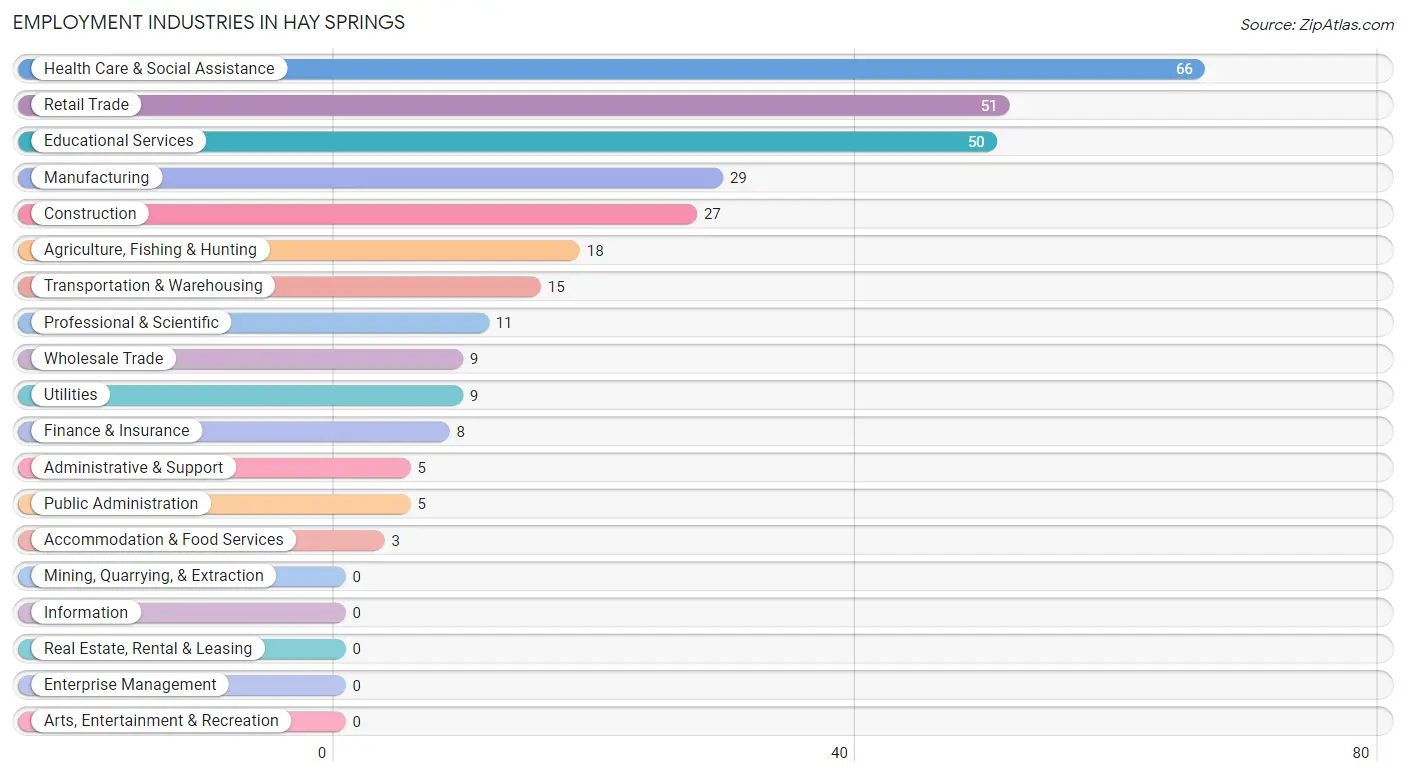
The major employment industries in Hay Springs include Health Care & Social Assistance (66 | 20.9%), Retail Trade (51 | 16.1%), Educational Services (50 | 15.8%), Manufacturing (29 | 9.2%), and Construction (27 | 8.5%).
Employment Industries by Sex in Hay Springs
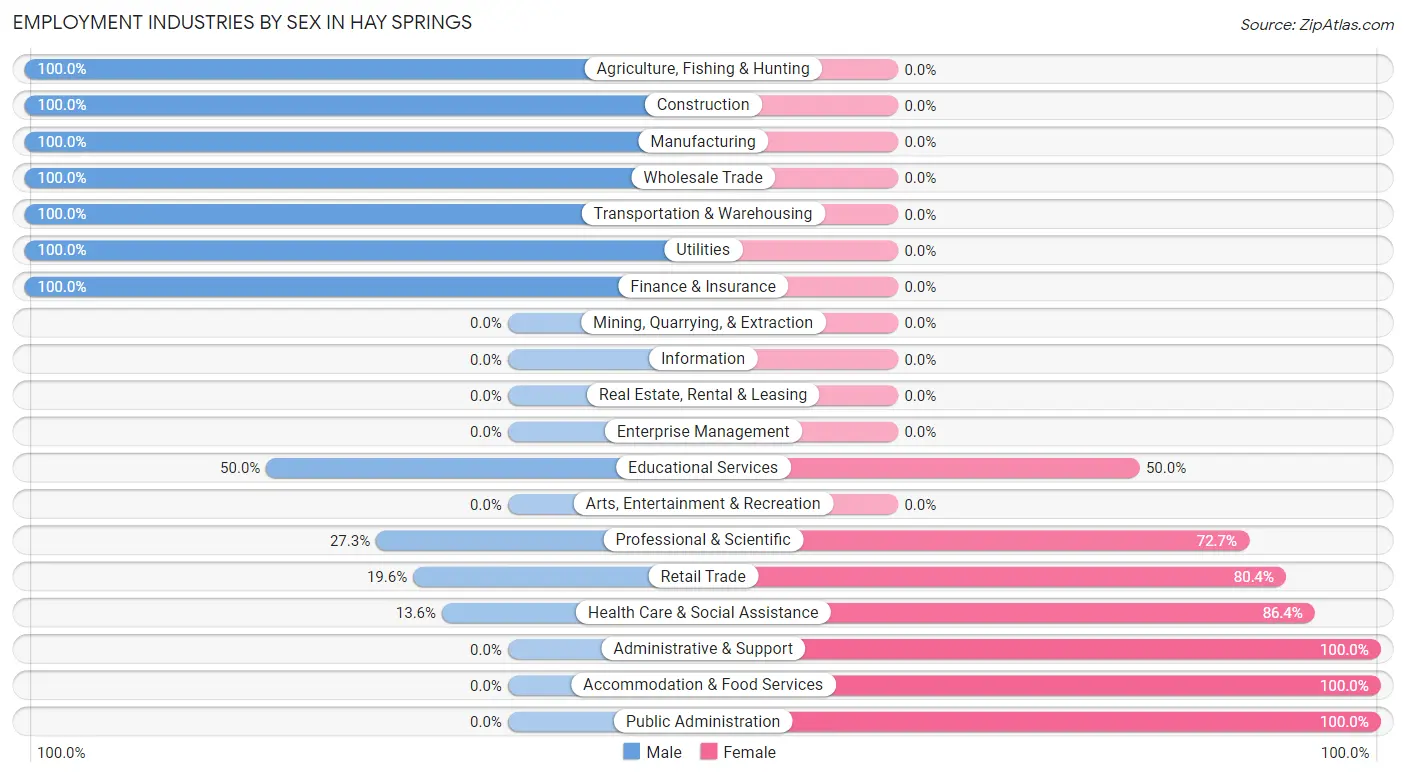
The Hay Springs industries that see more men than women are Agriculture, Fishing & Hunting (100.0%), Construction (100.0%), and Manufacturing (100.0%), whereas the industries that tend to have a higher number of women are Administrative & Support (100.0%), Accommodation & Food Services (100.0%), and Public Administration (100.0%).
| Industry | Male | Female |
| Agriculture, Fishing & Hunting | 18 (100.0%) | 0 (0.0%) |
| Mining, Quarrying, & Extraction | 0 (0.0%) | 0 (0.0%) |
| Construction | 27 (100.0%) | 0 (0.0%) |
| Manufacturing | 29 (100.0%) | 0 (0.0%) |
| Wholesale Trade | 9 (100.0%) | 0 (0.0%) |
| Retail Trade | 10 (19.6%) | 41 (80.4%) |
| Transportation & Warehousing | 15 (100.0%) | 0 (0.0%) |
| Utilities | 9 (100.0%) | 0 (0.0%) |
| Information | 0 (0.0%) | 0 (0.0%) |
| Finance & Insurance | 8 (100.0%) | 0 (0.0%) |
| Real Estate, Rental & Leasing | 0 (0.0%) | 0 (0.0%) |
| Professional & Scientific | 3 (27.3%) | 8 (72.7%) |
| Enterprise Management | 0 (0.0%) | 0 (0.0%) |
| Administrative & Support | 0 (0.0%) | 5 (100.0%) |
| Educational Services | 25 (50.0%) | 25 (50.0%) |
| Health Care & Social Assistance | 9 (13.6%) | 57 (86.4%) |
| Arts, Entertainment & Recreation | 0 (0.0%) | 0 (0.0%) |
| Accommodation & Food Services | 0 (0.0%) | 3 (100.0%) |
| Public Administration | 0 (0.0%) | 5 (100.0%) |
| Total | 168 (53.2%) | 148 (46.8%) |
Education in Hay Springs
School Enrollment in Hay Springs
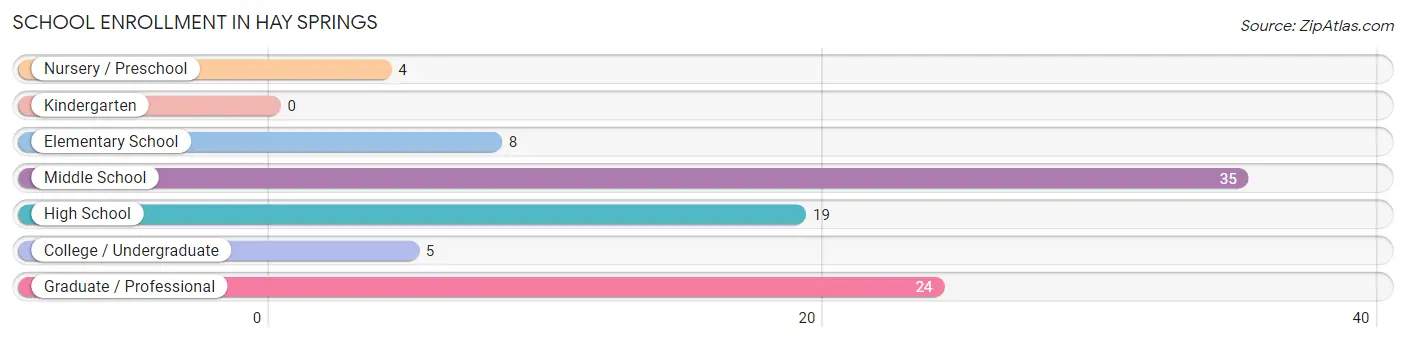
The most common levels of schooling among the 95 students in Hay Springs are middle school (35 | 36.8%), graduate / professional (24 | 25.3%), and high school (19 | 20.0%).
| School Level | # Students | % Students |
| Nursery / Preschool | 4 | 4.2% |
| Kindergarten | 0 | 0.0% |
| Elementary School | 8 | 8.4% |
| Middle School | 35 | 36.8% |
| High School | 19 | 20.0% |
| College / Undergraduate | 5 | 5.3% |
| Graduate / Professional | 24 | 25.3% |
| Total | 95 | 100.0% |
School Enrollment by Age by Funding Source in Hay Springs
Out of a total of 95 students who are enrolled in schools in Hay Springs, 5 (5.3%) attend a private institution, while the remaining 90 (94.7%) are enrolled in public schools. The age group of 5 to 9 year old has the highest likelihood of being enrolled in private schools, with 4 (36.4% in the age bracket) enrolled. Conversely, the age group of 3 to 4 year olds has the lowest likelihood of being enrolled in a private school, with 1 (100.0% in the age bracket) attending a public institution.
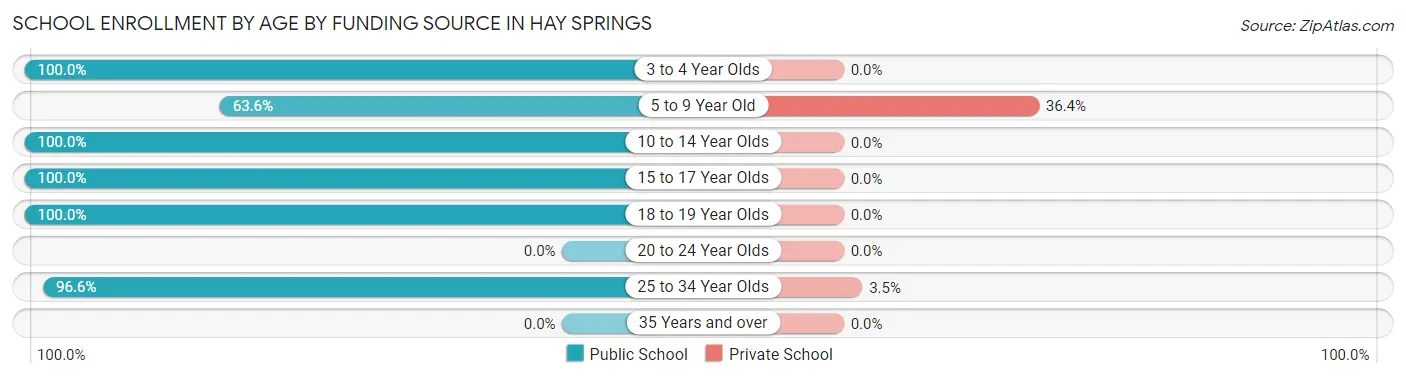
| Age Bracket | Public School | Private School |
| 3 to 4 Year Olds | 1 (100.0%) | 0 (0.0%) |
| 5 to 9 Year Old | 7 (63.6%) | 4 (36.4%) |
| 10 to 14 Year Olds | 35 (100.0%) | 0 (0.0%) |
| 15 to 17 Year Olds | 16 (100.0%) | 0 (0.0%) |
| 18 to 19 Year Olds | 3 (100.0%) | 0 (0.0%) |
| 20 to 24 Year Olds | 0 (0.0%) | 0 (0.0%) |
| 25 to 34 Year Olds | 28 (96.6%) | 1 (3.5%) |
| 35 Years and over | 0 (0.0%) | 0 (0.0%) |
| Total | 90 (94.7%) | 5 (5.3%) |
Educational Attainment by Field of Study in Hay Springs
Business (24 | 26.1%), bio, nature & agricultural (20 | 21.7%), education (16 | 17.4%), science & technology (8 | 8.7%), and literature & languages (7 | 7.6%) are the most common fields of study among 92 individuals in Hay Springs who have obtained a bachelor's degree or higher.
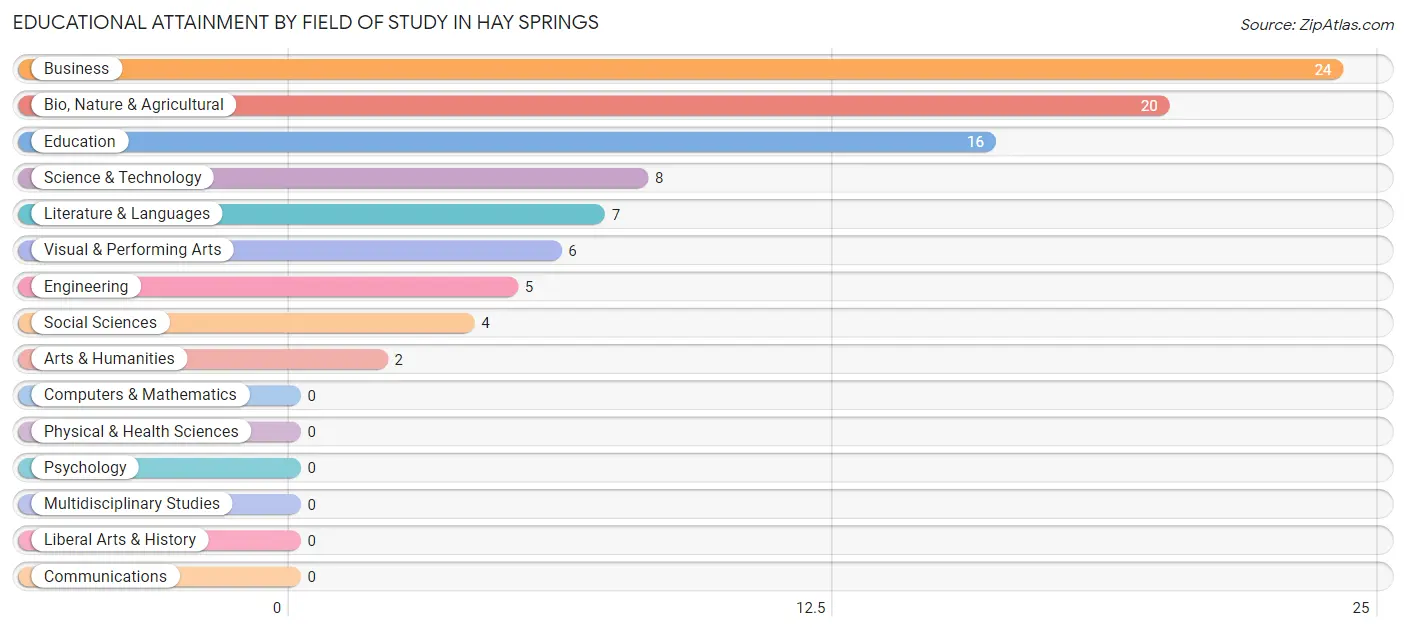
| Field of Study | # Graduates | % Graduates |
| Computers & Mathematics | 0 | 0.0% |
| Bio, Nature & Agricultural | 20 | 21.7% |
| Physical & Health Sciences | 0 | 0.0% |
| Psychology | 0 | 0.0% |
| Social Sciences | 4 | 4.3% |
| Engineering | 5 | 5.4% |
| Multidisciplinary Studies | 0 | 0.0% |
| Science & Technology | 8 | 8.7% |
| Business | 24 | 26.1% |
| Education | 16 | 17.4% |
| Literature & Languages | 7 | 7.6% |
| Liberal Arts & History | 0 | 0.0% |
| Visual & Performing Arts | 6 | 6.5% |
| Communications | 0 | 0.0% |
| Arts & Humanities | 2 | 2.2% |
| Total | 92 | 100.0% |
Transportation & Commute in Hay Springs
Vehicle Availability by Sex in Hay Springs
The most prevalent vehicle ownership categories in Hay Springs are males with 2 vehicles (83, accounting for 49.4%) and females with 2 vehicles (77, making up 56.9%).
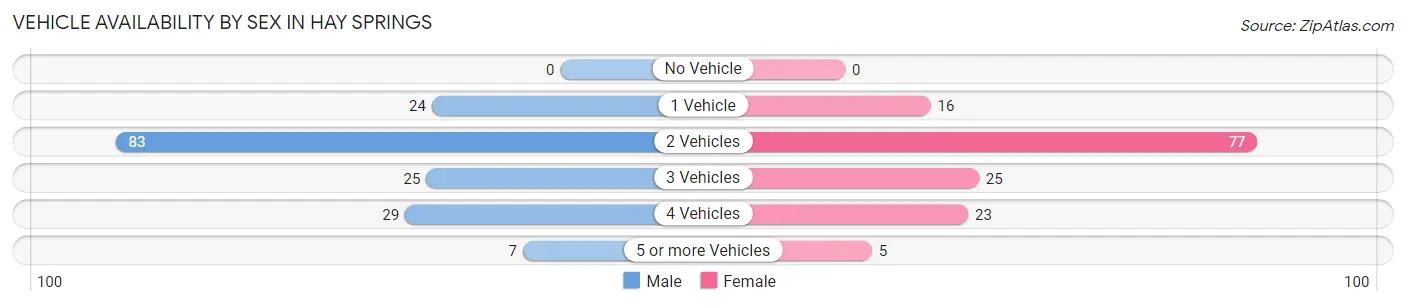
| Vehicles Available | Male | Female |
| No Vehicle | 0 (0.0%) | 0 (0.0%) |
| 1 Vehicle | 24 (14.3%) | 16 (11.0%) |
| 2 Vehicles | 83 (49.4%) | 77 (52.7%) |
| 3 Vehicles | 25 (14.9%) | 25 (17.1%) |
| 4 Vehicles | 29 (17.3%) | 23 (15.8%) |
| 5 or more Vehicles | 7 (4.2%) | 5 (3.4%) |
| Total | 168 (100.0%) | 146 (100.0%) |
Commute Time in Hay Springs
The most frequently occuring commute durations in Hay Springs are less than 5 minutes (85 commuters, 28.9%), 5 to 9 minutes (61 commuters, 20.7%), and 30 to 34 minutes (43 commuters, 14.6%).
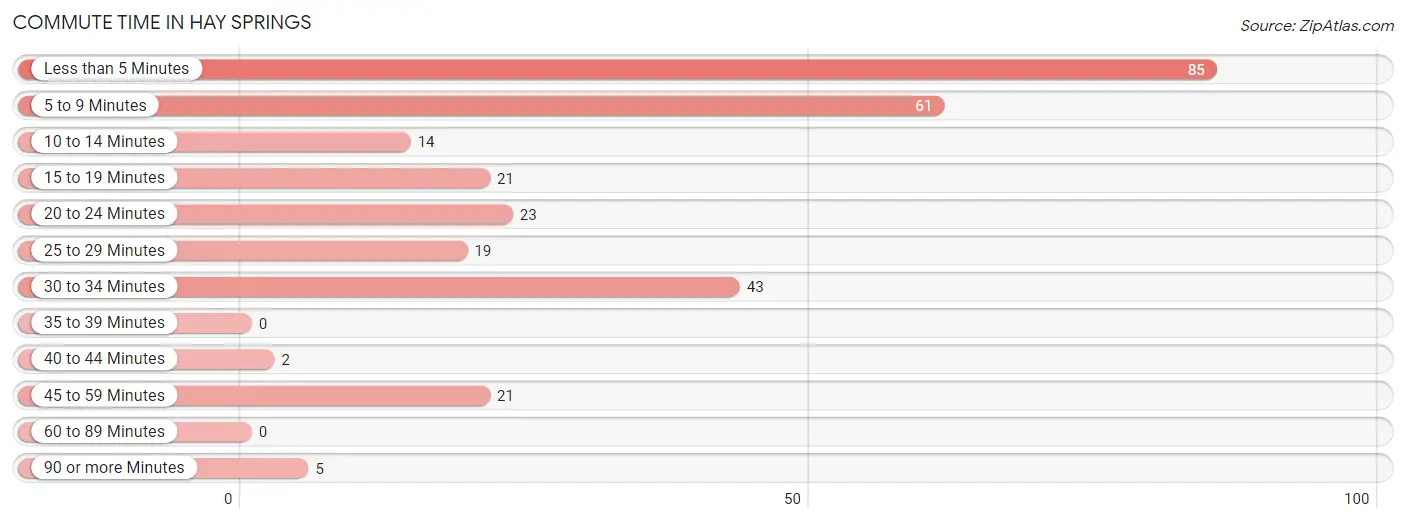
| Commute Time | # Commuters | % Commuters |
| Less than 5 Minutes | 85 | 28.9% |
| 5 to 9 Minutes | 61 | 20.7% |
| 10 to 14 Minutes | 14 | 4.8% |
| 15 to 19 Minutes | 21 | 7.1% |
| 20 to 24 Minutes | 23 | 7.8% |
| 25 to 29 Minutes | 19 | 6.5% |
| 30 to 34 Minutes | 43 | 14.6% |
| 35 to 39 Minutes | 0 | 0.0% |
| 40 to 44 Minutes | 2 | 0.7% |
| 45 to 59 Minutes | 21 | 7.1% |
| 60 to 89 Minutes | 0 | 0.0% |
| 90 or more Minutes | 5 | 1.7% |
Commute Time by Sex in Hay Springs
The most common commute times in Hay Springs are 5 to 9 minutes (41 commuters, 27.7%) for males and less than 5 minutes (71 commuters, 48.6%) for females.
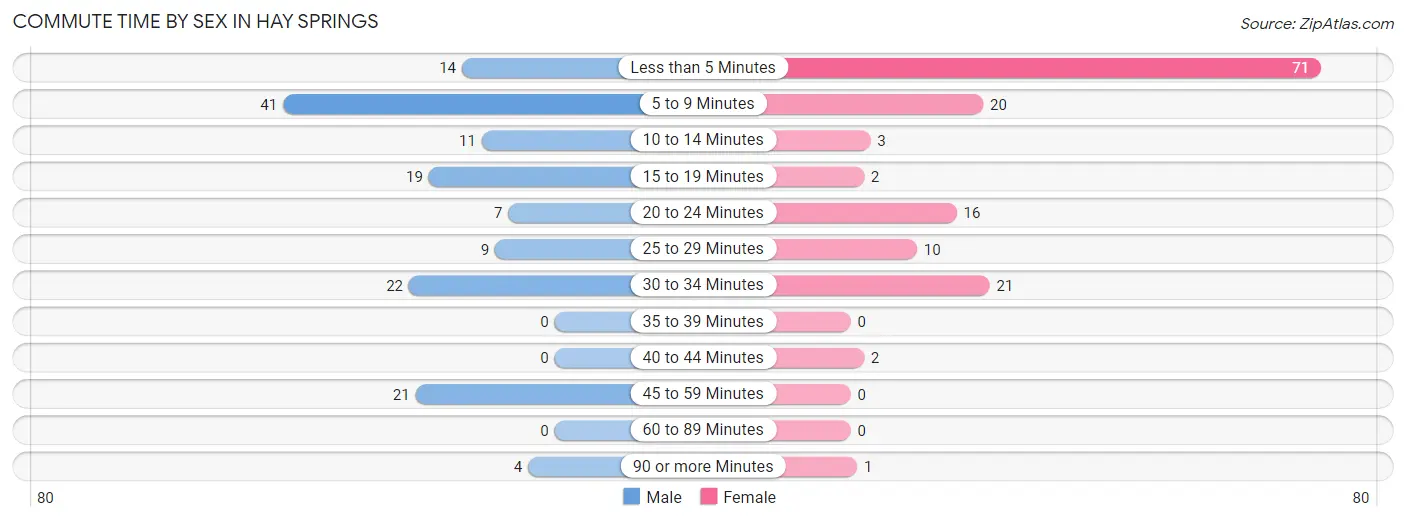
| Commute Time | Male | Female |
| Less than 5 Minutes | 14 (9.5%) | 71 (48.6%) |
| 5 to 9 Minutes | 41 (27.7%) | 20 (13.7%) |
| 10 to 14 Minutes | 11 (7.4%) | 3 (2.1%) |
| 15 to 19 Minutes | 19 (12.8%) | 2 (1.4%) |
| 20 to 24 Minutes | 7 (4.7%) | 16 (11.0%) |
| 25 to 29 Minutes | 9 (6.1%) | 10 (6.9%) |
| 30 to 34 Minutes | 22 (14.9%) | 21 (14.4%) |
| 35 to 39 Minutes | 0 (0.0%) | 0 (0.0%) |
| 40 to 44 Minutes | 0 (0.0%) | 2 (1.4%) |
| 45 to 59 Minutes | 21 (14.2%) | 0 (0.0%) |
| 60 to 89 Minutes | 0 (0.0%) | 0 (0.0%) |
| 90 or more Minutes | 4 (2.7%) | 1 (0.7%) |
Time of Departure to Work by Sex in Hay Springs
The most frequent times of departure to work in Hay Springs are 6:00 AM to 6:29 AM (45, 30.4%) for males and 12:00 AM to 4:59 AM (36, 24.7%) for females.
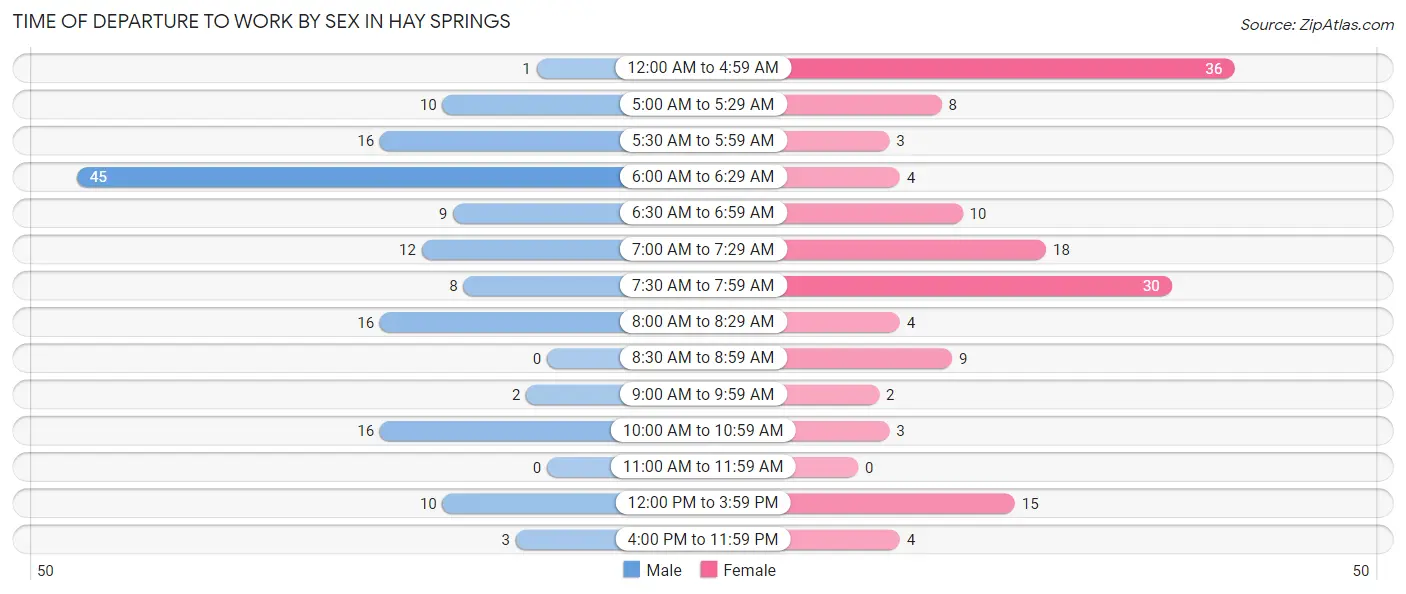
| Time of Departure | Male | Female |
| 12:00 AM to 4:59 AM | 1 (0.7%) | 36 (24.7%) |
| 5:00 AM to 5:29 AM | 10 (6.8%) | 8 (5.5%) |
| 5:30 AM to 5:59 AM | 16 (10.8%) | 3 (2.1%) |
| 6:00 AM to 6:29 AM | 45 (30.4%) | 4 (2.7%) |
| 6:30 AM to 6:59 AM | 9 (6.1%) | 10 (6.9%) |
| 7:00 AM to 7:29 AM | 12 (8.1%) | 18 (12.3%) |
| 7:30 AM to 7:59 AM | 8 (5.4%) | 30 (20.5%) |
| 8:00 AM to 8:29 AM | 16 (10.8%) | 4 (2.7%) |
| 8:30 AM to 8:59 AM | 0 (0.0%) | 9 (6.2%) |
| 9:00 AM to 9:59 AM | 2 (1.3%) | 2 (1.4%) |
| 10:00 AM to 10:59 AM | 16 (10.8%) | 3 (2.1%) |
| 11:00 AM to 11:59 AM | 0 (0.0%) | 0 (0.0%) |
| 12:00 PM to 3:59 PM | 10 (6.8%) | 15 (10.3%) |
| 4:00 PM to 11:59 PM | 3 (2.0%) | 4 (2.7%) |
| Total | 148 (100.0%) | 146 (100.0%) |
Housing Occupancy in Hay Springs
Occupancy by Ownership in Hay Springs
Of the total 288 dwellings in Hay Springs, owner-occupied units account for 235 (81.6%), while renter-occupied units make up 53 (18.4%).
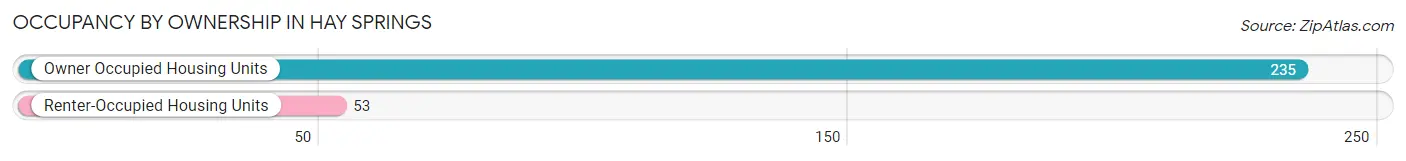
| Occupancy | # Housing Units | % Housing Units |
| Owner Occupied Housing Units | 235 | 81.6% |
| Renter-Occupied Housing Units | 53 | 18.4% |
| Total Occupied Housing Units | 288 | 100.0% |
Occupancy by Household Size in Hay Springs
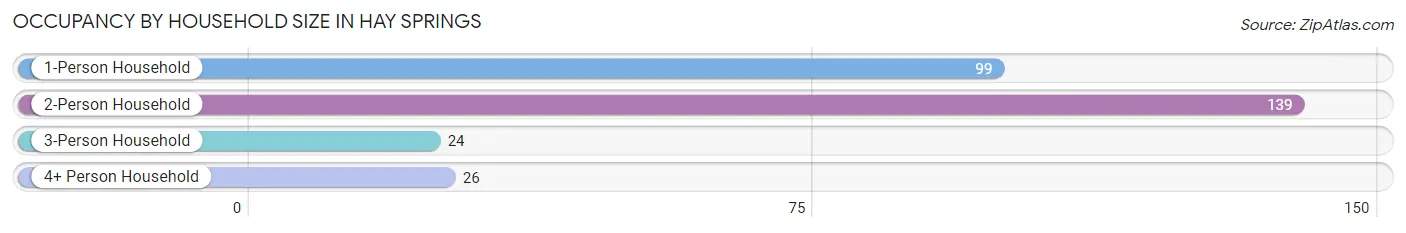
| Household Size | # Housing Units | % Housing Units |
| 1-Person Household | 99 | 34.4% |
| 2-Person Household | 139 | 48.3% |
| 3-Person Household | 24 | 8.3% |
| 4+ Person Household | 26 | 9.0% |
| Total Housing Units | 288 | 100.0% |
Occupancy by Ownership by Household Size in Hay Springs
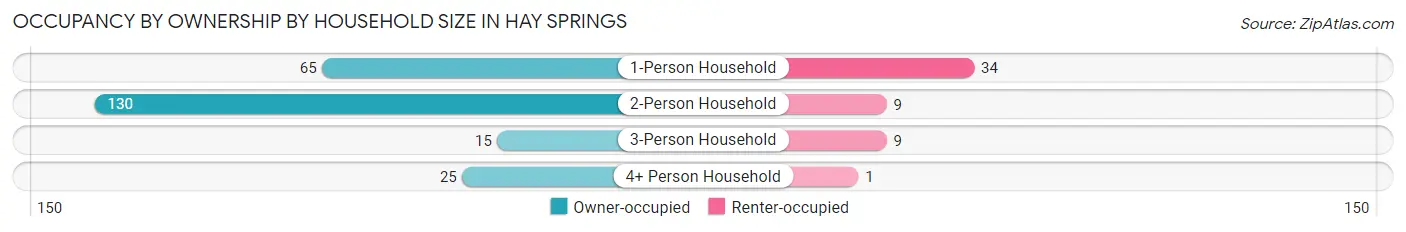
| Household Size | Owner-occupied | Renter-occupied |
| 1-Person Household | 65 (65.7%) | 34 (34.3%) |
| 2-Person Household | 130 (93.5%) | 9 (6.5%) |
| 3-Person Household | 15 (62.5%) | 9 (37.5%) |
| 4+ Person Household | 25 (96.2%) | 1 (3.8%) |
| Total Housing Units | 235 (81.6%) | 53 (18.4%) |
Occupancy by Educational Attainment in Hay Springs
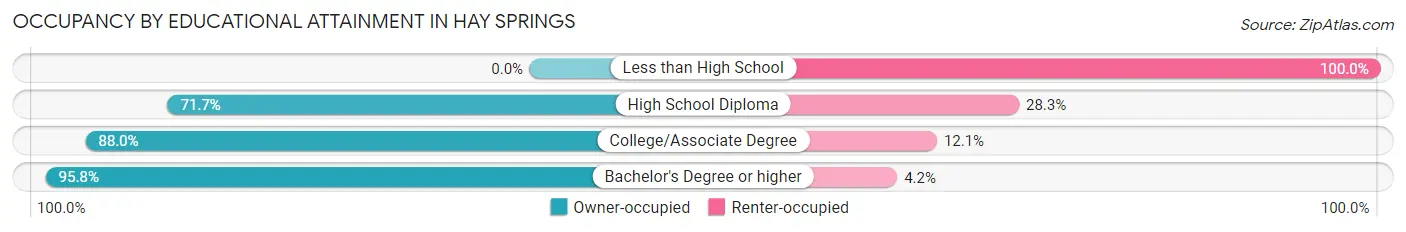
| Household Size | Owner-occupied | Renter-occupied |
| Less than High School | 0 (0.0%) | 14 (100.0%) |
| High School Diploma | 43 (71.7%) | 17 (28.3%) |
| College/Associate Degree | 146 (87.9%) | 20 (12.0%) |
| Bachelor's Degree or higher | 46 (95.8%) | 2 (4.2%) |
Occupancy by Age of Householder in Hay Springs
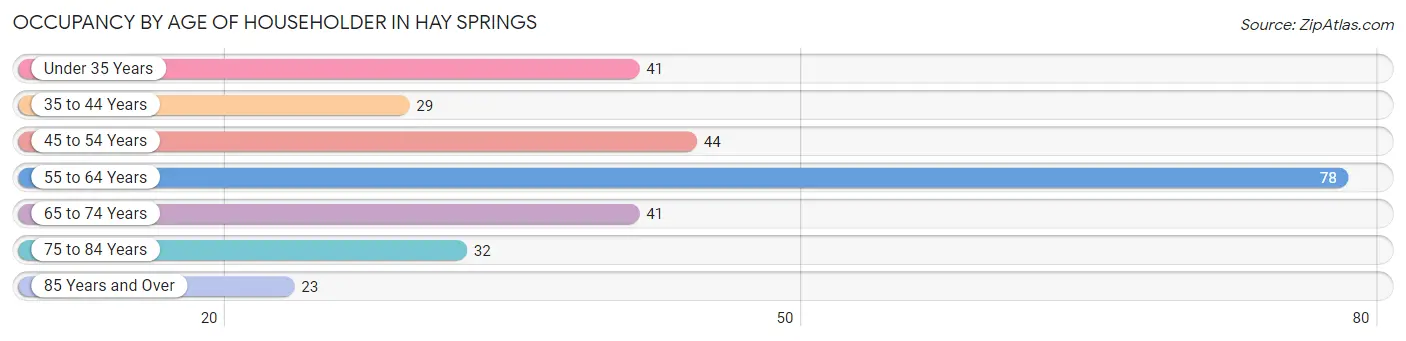
| Age Bracket | # Households | % Households |
| Under 35 Years | 41 | 14.2% |
| 35 to 44 Years | 29 | 10.1% |
| 45 to 54 Years | 44 | 15.3% |
| 55 to 64 Years | 78 | 27.1% |
| 65 to 74 Years | 41 | 14.2% |
| 75 to 84 Years | 32 | 11.1% |
| 85 Years and Over | 23 | 8.0% |
| Total | 288 | 100.0% |
Housing Finances in Hay Springs
Median Income by Occupancy in Hay Springs
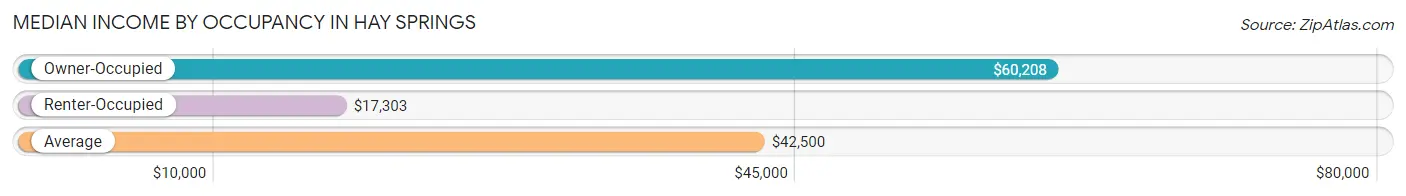
| Occupancy Type | # Households | Median Income |
| Owner-Occupied | 235 (81.6%) | $60,208 |
| Renter-Occupied | 53 (18.4%) | $17,303 |
| Average | 288 (100.0%) | $42,500 |
Occupancy by Householder Income Bracket in Hay Springs
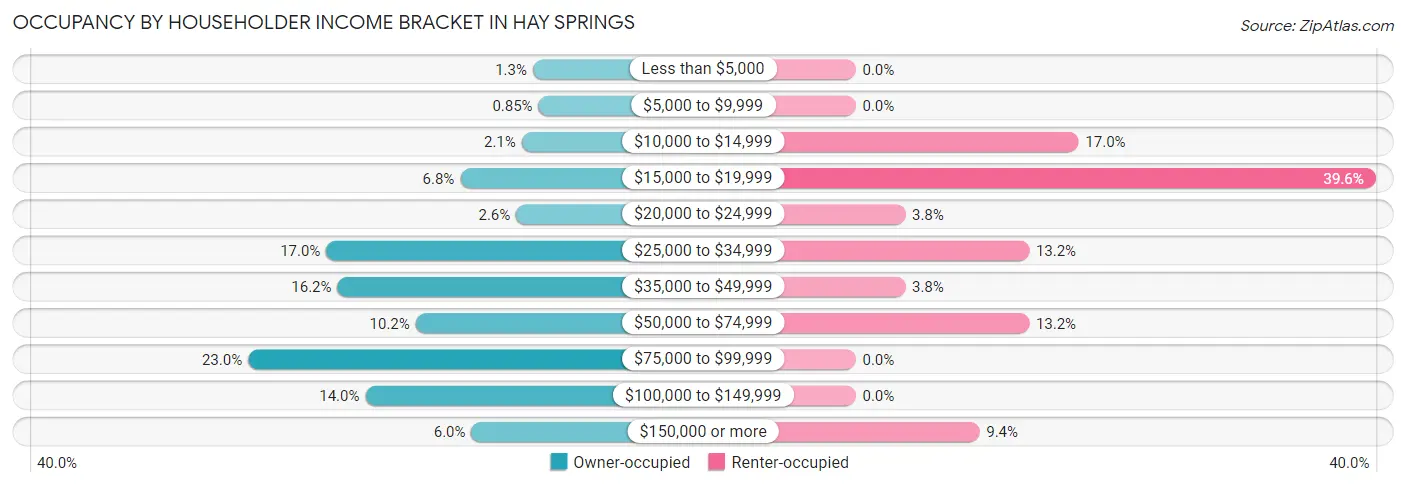
| Income Bracket | Owner-occupied | Renter-occupied |
| Less than $5,000 | 3 (1.3%) | 0 (0.0%) |
| $5,000 to $9,999 | 2 (0.9%) | 0 (0.0%) |
| $10,000 to $14,999 | 5 (2.1%) | 9 (17.0%) |
| $15,000 to $19,999 | 16 (6.8%) | 21 (39.6%) |
| $20,000 to $24,999 | 6 (2.5%) | 2 (3.8%) |
| $25,000 to $34,999 | 40 (17.0%) | 7 (13.2%) |
| $35,000 to $49,999 | 38 (16.2%) | 2 (3.8%) |
| $50,000 to $74,999 | 24 (10.2%) | 7 (13.2%) |
| $75,000 to $99,999 | 54 (23.0%) | 0 (0.0%) |
| $100,000 to $149,999 | 33 (14.0%) | 0 (0.0%) |
| $150,000 or more | 14 (6.0%) | 5 (9.4%) |
| Total | 235 (100.0%) | 53 (100.0%) |
Monthly Housing Cost Tiers in Hay Springs
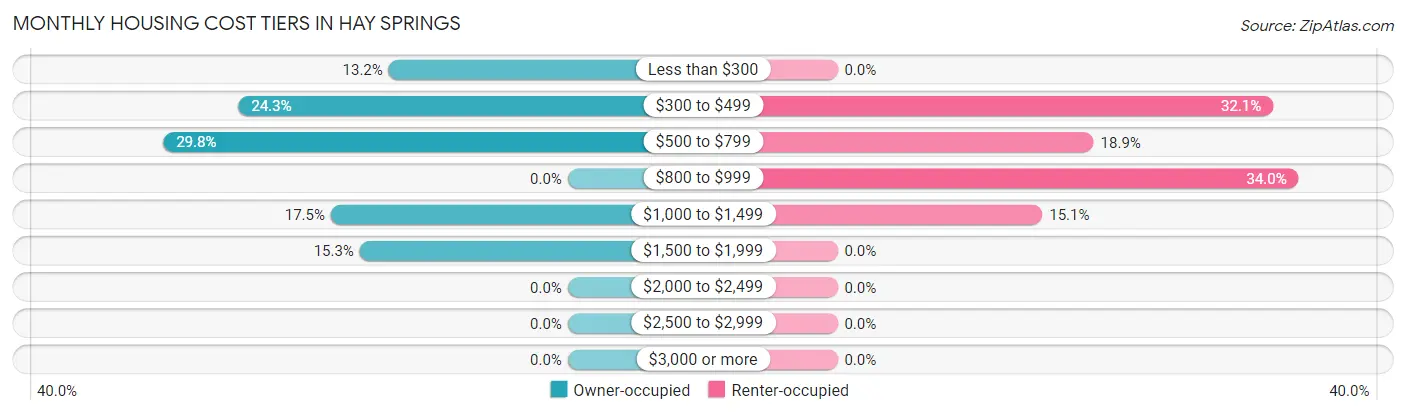
| Monthly Cost | Owner-occupied | Renter-occupied |
| Less than $300 | 31 (13.2%) | 0 (0.0%) |
| $300 to $499 | 57 (24.3%) | 17 (32.1%) |
| $500 to $799 | 70 (29.8%) | 10 (18.9%) |
| $800 to $999 | 0 (0.0%) | 18 (34.0%) |
| $1,000 to $1,499 | 41 (17.4%) | 8 (15.1%) |
| $1,500 to $1,999 | 36 (15.3%) | 0 (0.0%) |
| $2,000 to $2,499 | 0 (0.0%) | 0 (0.0%) |
| $2,500 to $2,999 | 0 (0.0%) | 0 (0.0%) |
| $3,000 or more | 0 (0.0%) | 0 (0.0%) |
| Total | 235 (100.0%) | 53 (100.0%) |
Physical Housing Characteristics in Hay Springs
Housing Structures in Hay Springs
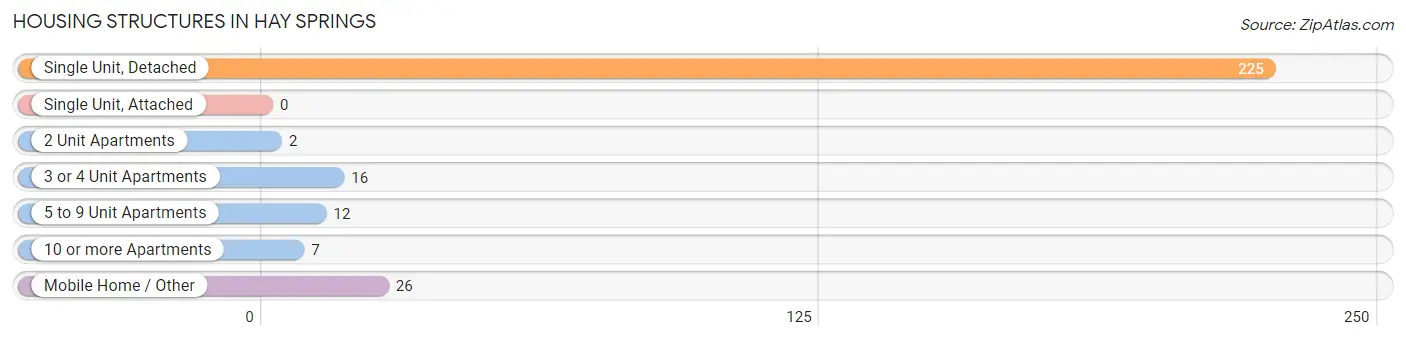
| Structure Type | # Housing Units | % Housing Units |
| Single Unit, Detached | 225 | 78.1% |
| Single Unit, Attached | 0 | 0.0% |
| 2 Unit Apartments | 2 | 0.7% |
| 3 or 4 Unit Apartments | 16 | 5.6% |
| 5 to 9 Unit Apartments | 12 | 4.2% |
| 10 or more Apartments | 7 | 2.4% |
| Mobile Home / Other | 26 | 9.0% |
| Total | 288 | 100.0% |
Housing Structures by Occupancy in Hay Springs
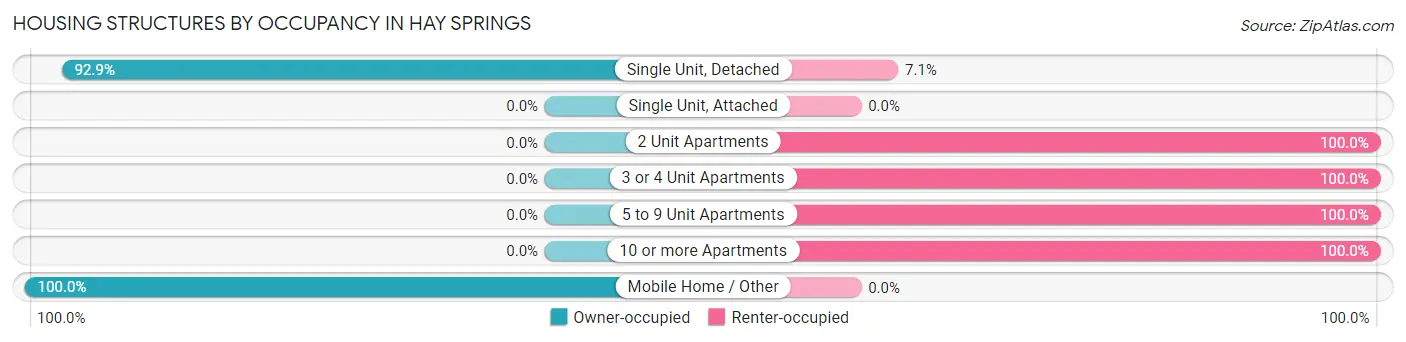
| Structure Type | Owner-occupied | Renter-occupied |
| Single Unit, Detached | 209 (92.9%) | 16 (7.1%) |
| Single Unit, Attached | 0 (0.0%) | 0 (0.0%) |
| 2 Unit Apartments | 0 (0.0%) | 2 (100.0%) |
| 3 or 4 Unit Apartments | 0 (0.0%) | 16 (100.0%) |
| 5 to 9 Unit Apartments | 0 (0.0%) | 12 (100.0%) |
| 10 or more Apartments | 0 (0.0%) | 7 (100.0%) |
| Mobile Home / Other | 26 (100.0%) | 0 (0.0%) |
| Total | 235 (81.6%) | 53 (18.4%) |
Housing Structures by Number of Rooms in Hay Springs
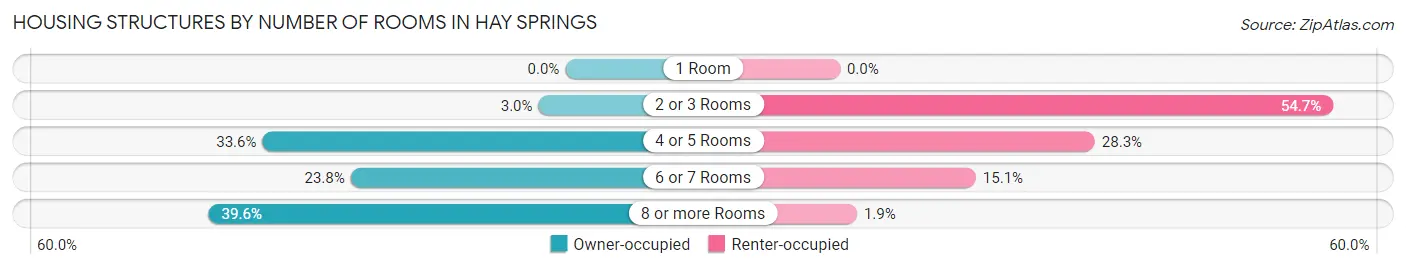
| Number of Rooms | Owner-occupied | Renter-occupied |
| 1 Room | 0 (0.0%) | 0 (0.0%) |
| 2 or 3 Rooms | 7 (3.0%) | 29 (54.7%) |
| 4 or 5 Rooms | 79 (33.6%) | 15 (28.3%) |
| 6 or 7 Rooms | 56 (23.8%) | 8 (15.1%) |
| 8 or more Rooms | 93 (39.6%) | 1 (1.9%) |
| Total | 235 (100.0%) | 53 (100.0%) |
Housing Structure by Heating Type in Hay Springs
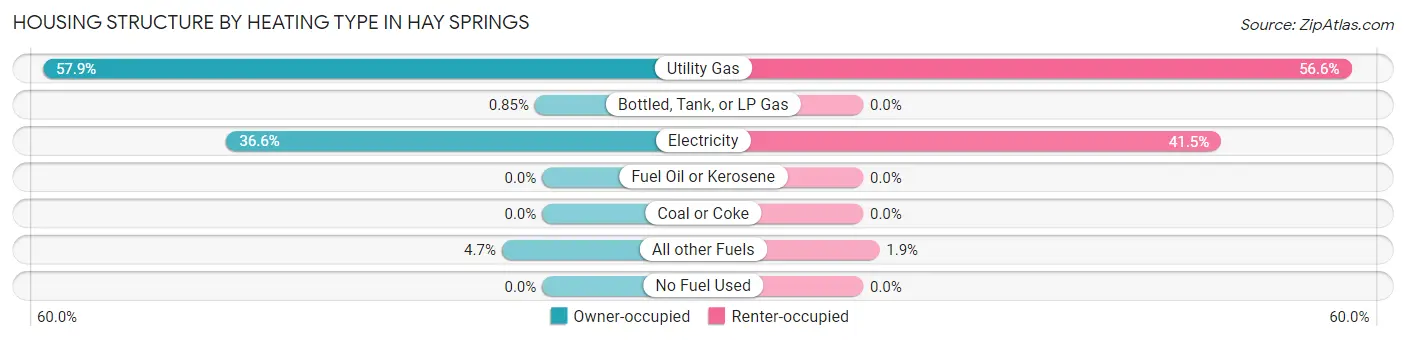
| Heating Type | Owner-occupied | Renter-occupied |
| Utility Gas | 136 (57.9%) | 30 (56.6%) |
| Bottled, Tank, or LP Gas | 2 (0.9%) | 0 (0.0%) |
| Electricity | 86 (36.6%) | 22 (41.5%) |
| Fuel Oil or Kerosene | 0 (0.0%) | 0 (0.0%) |
| Coal or Coke | 0 (0.0%) | 0 (0.0%) |
| All other Fuels | 11 (4.7%) | 1 (1.9%) |
| No Fuel Used | 0 (0.0%) | 0 (0.0%) |
| Total | 235 (100.0%) | 53 (100.0%) |
Household Vehicle Usage in Hay Springs
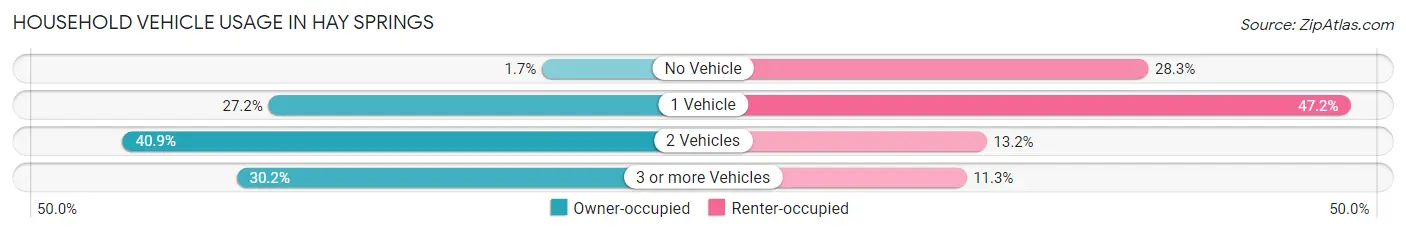
| Vehicles per Household | Owner-occupied | Renter-occupied |
| No Vehicle | 4 (1.7%) | 15 (28.3%) |
| 1 Vehicle | 64 (27.2%) | 25 (47.2%) |
| 2 Vehicles | 96 (40.8%) | 7 (13.2%) |
| 3 or more Vehicles | 71 (30.2%) | 6 (11.3%) |
| Total | 235 (100.0%) | 53 (100.0%) |
Real Estate & Mortgages in Hay Springs
Real Estate and Mortgage Overview in Hay Springs
| Characteristic | Without Mortgage | With Mortgage |
| Housing Units | 108 | 127 |
| Median Property Value | $52,400 | $119,300 |
| Median Household Income | $33,438 | $12 |
| Monthly Housing Costs | $343 | $0 |
| Real Estate Taxes | $889 | $0 |
Property Value by Mortgage Status in Hay Springs
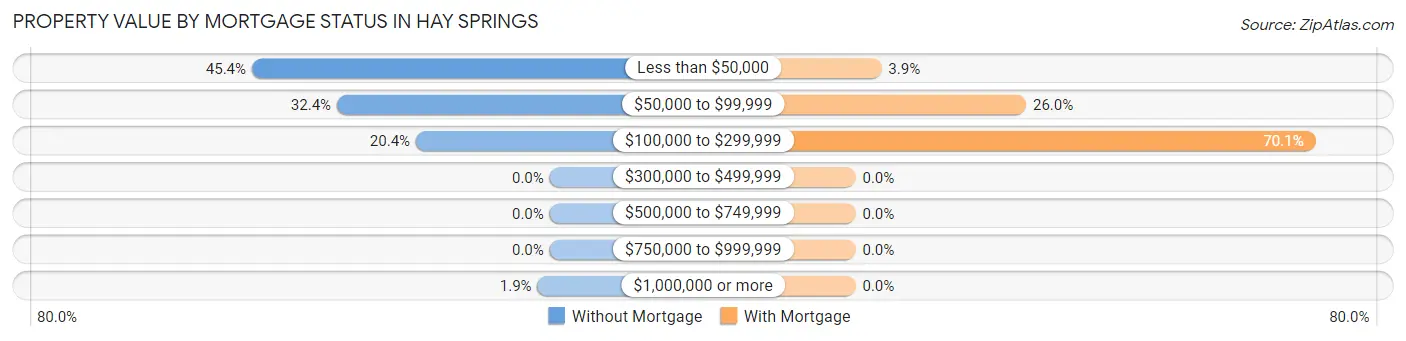
| Property Value | Without Mortgage | With Mortgage |
| Less than $50,000 | 49 (45.4%) | 5 (3.9%) |
| $50,000 to $99,999 | 35 (32.4%) | 33 (26.0%) |
| $100,000 to $299,999 | 22 (20.4%) | 89 (70.1%) |
| $300,000 to $499,999 | 0 (0.0%) | 0 (0.0%) |
| $500,000 to $749,999 | 0 (0.0%) | 0 (0.0%) |
| $750,000 to $999,999 | 0 (0.0%) | 0 (0.0%) |
| $1,000,000 or more | 2 (1.8%) | 0 (0.0%) |
| Total | 108 (100.0%) | 127 (100.0%) |
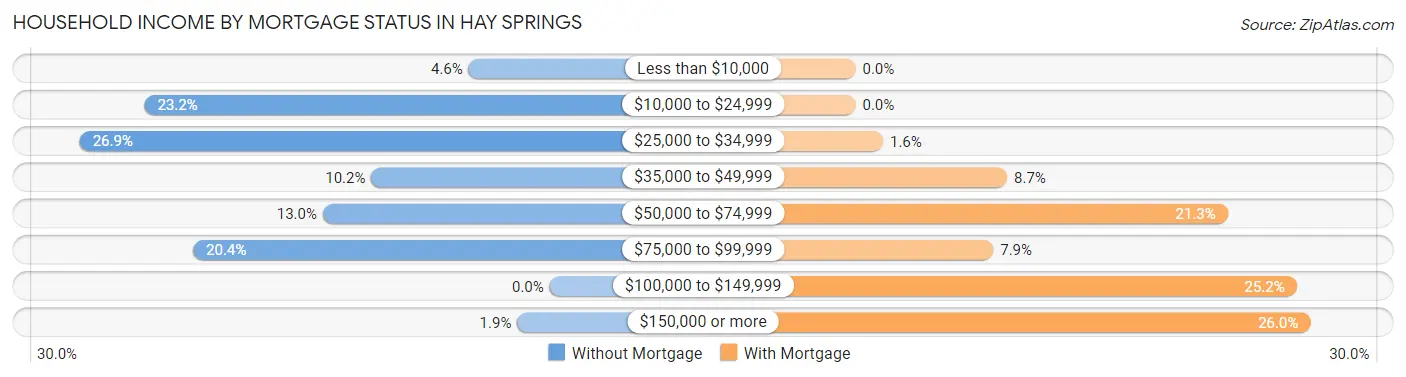
Household Income by Mortgage Status in Hay Springs
| Household Income | Without Mortgage | With Mortgage |
| Less than $10,000 | 5 (4.6%) | 0 (0.0%) |
| $10,000 to $24,999 | 25 (23.2%) | 0 (0.0%) |
| $25,000 to $34,999 | 29 (26.9%) | 2 (1.6%) |
| $35,000 to $49,999 | 11 (10.2%) | 11 (8.7%) |
| $50,000 to $74,999 | 14 (13.0%) | 27 (21.3%) |
| $75,000 to $99,999 | 22 (20.4%) | 10 (7.9%) |
| $100,000 to $149,999 | 0 (0.0%) | 32 (25.2%) |
| $150,000 or more | 2 (1.8%) | 33 (26.0%) |
| Total | 108 (100.0%) | 127 (100.0%) |
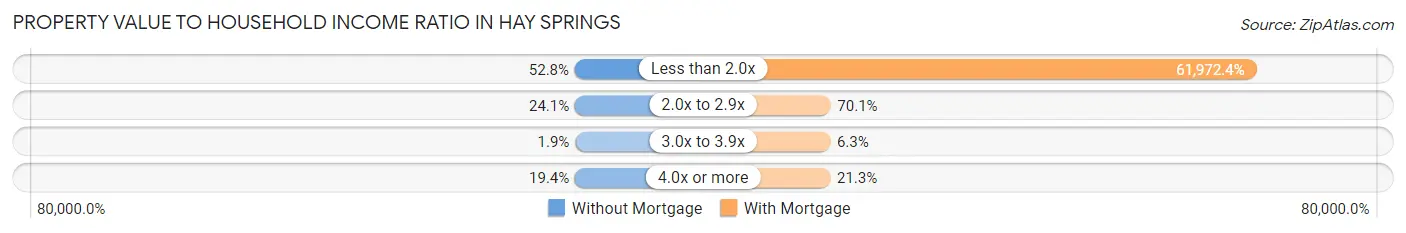
Property Value to Household Income Ratio in Hay Springs
| Value-to-Income Ratio | Without Mortgage | With Mortgage |
| Less than 2.0x | 57 (52.8%) | 78,705 (61,972.4%) |
| 2.0x to 2.9x | 26 (24.1%) | 89 (70.1%) |
| 3.0x to 3.9x | 2 (1.8%) | 8 (6.3%) |
| 4.0x or more | 21 (19.4%) | 27 (21.3%) |
| Total | 108 (100.0%) | 127 (100.0%) |
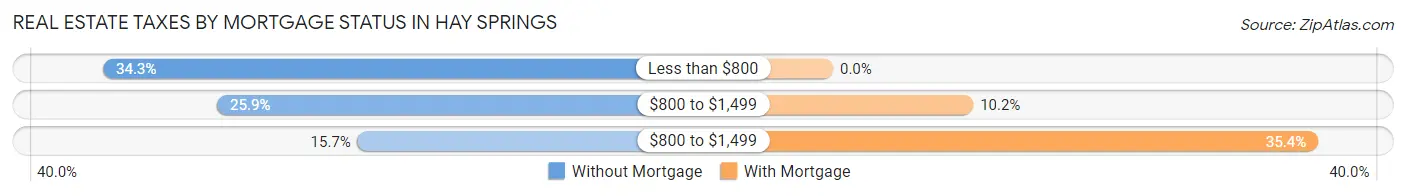
Real Estate Taxes by Mortgage Status in Hay Springs
| Property Taxes | Without Mortgage | With Mortgage |
| Less than $800 | 37 (34.3%) | 0 (0.0%) |
| $800 to $1,499 | 28 (25.9%) | 13 (10.2%) |
| $800 to $1,499 | 17 (15.7%) | 45 (35.4%) |
| Total | 108 (100.0%) | 127 (100.0%) |
Health & Disability in Hay Springs
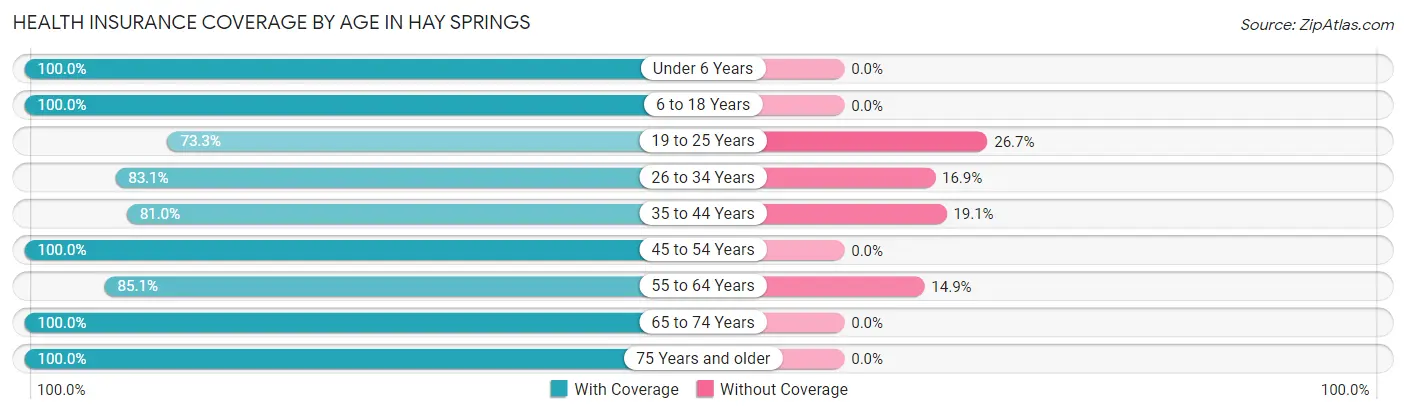
Health Insurance Coverage by Age in Hay Springs
| Age Bracket | With Coverage | Without Coverage |
| Under 6 Years | 25 (100.0%) | 0 (0.0%) |
| 6 to 18 Years | 66 (100.0%) | 0 (0.0%) |
| 19 to 25 Years | 33 (73.3%) | 12 (26.7%) |
| 26 to 34 Years | 54 (83.1%) | 11 (16.9%) |
| 35 to 44 Years | 51 (80.9%) | 12 (19.1%) |
| 45 to 54 Years | 67 (100.0%) | 0 (0.0%) |
| 55 to 64 Years | 131 (85.1%) | 23 (14.9%) |
| 65 to 74 Years | 80 (100.0%) | 0 (0.0%) |
| 75 Years and older | 65 (100.0%) | 0 (0.0%) |
| Total | 572 (90.8%) | 58 (9.2%) |
Health Insurance Coverage by Citizenship Status in Hay Springs
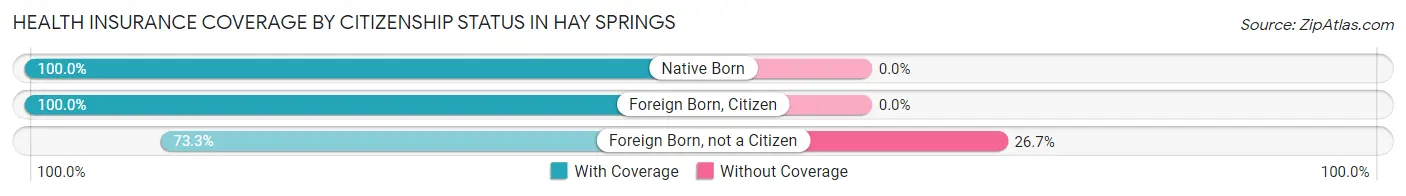
| Citizenship Status | With Coverage | Without Coverage |
| Native Born | 25 (100.0%) | 0 (0.0%) |
| Foreign Born, Citizen | 66 (100.0%) | 0 (0.0%) |
| Foreign Born, not a Citizen | 33 (73.3%) | 12 (26.7%) |
Health Insurance Coverage by Household Income in Hay Springs
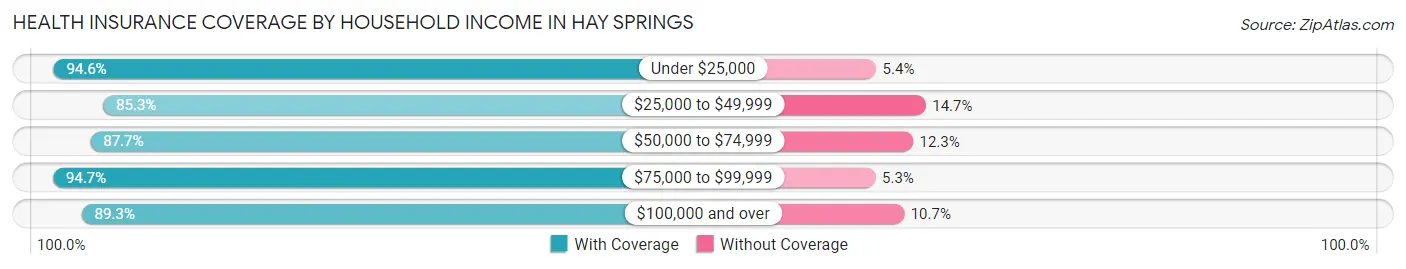
| Household Income | With Coverage | Without Coverage |
| Under $25,000 | 70 (94.6%) | 4 (5.4%) |
| $25,000 to $49,999 | 116 (85.3%) | 20 (14.7%) |
| $50,000 to $74,999 | 57 (87.7%) | 8 (12.3%) |
| $75,000 to $99,999 | 125 (94.7%) | 7 (5.3%) |
| $100,000 and over | 159 (89.3%) | 19 (10.7%) |
Public vs Private Health Insurance Coverage by Age in Hay Springs
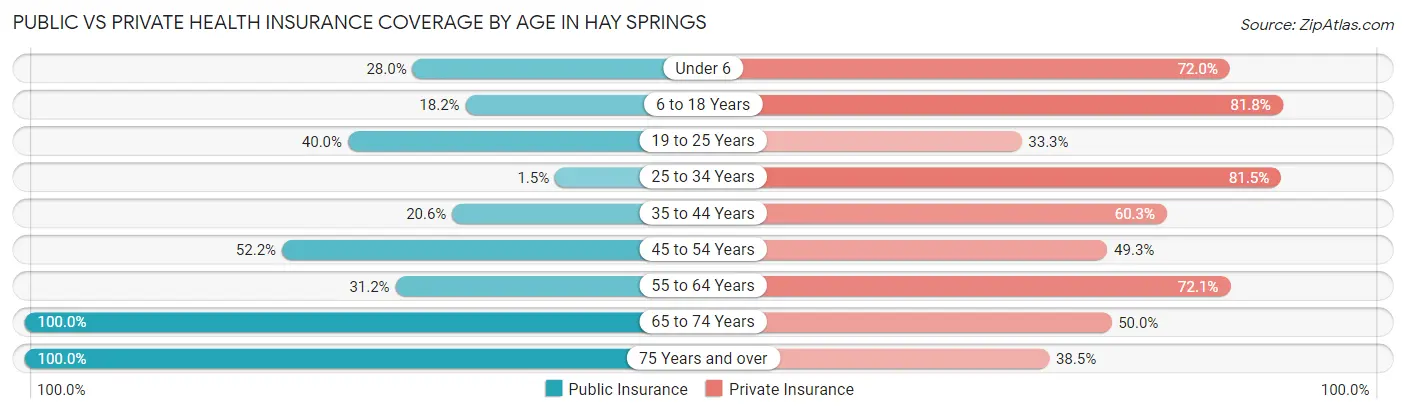
| Age Bracket | Public Insurance | Private Insurance |
| Under 6 | 7 (28.0%) | 18 (72.0%) |
| 6 to 18 Years | 12 (18.2%) | 54 (81.8%) |
| 19 to 25 Years | 18 (40.0%) | 15 (33.3%) |
| 25 to 34 Years | 1 (1.5%) | 53 (81.5%) |
| 35 to 44 Years | 13 (20.6%) | 38 (60.3%) |
| 45 to 54 Years | 35 (52.2%) | 33 (49.2%) |
| 55 to 64 Years | 48 (31.2%) | 111 (72.1%) |
| 65 to 74 Years | 80 (100.0%) | 40 (50.0%) |
| 75 Years and over | 65 (100.0%) | 25 (38.5%) |
| Total | 279 (44.3%) | 387 (61.4%) |
Disability Status by Sex by Age in Hay Springs
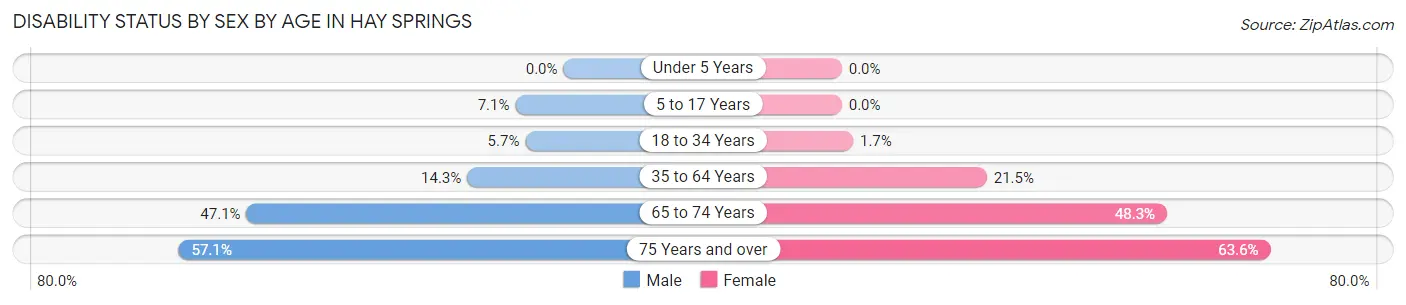
| Age Bracket | Male | Female |
| Under 5 Years | 0 (0.0%) | 0 (0.0%) |
| 5 to 17 Years | 3 (7.1%) | 0 (0.0%) |
| 18 to 34 Years | 3 (5.7%) | 1 (1.7%) |
| 35 to 64 Years | 20 (14.3%) | 31 (21.5%) |
| 65 to 74 Years | 24 (47.1%) | 14 (48.3%) |
| 75 Years and over | 12 (57.1%) | 28 (63.6%) |
Disability Class by Sex by Age in Hay Springs
Disability Class: Hearing Difficulty
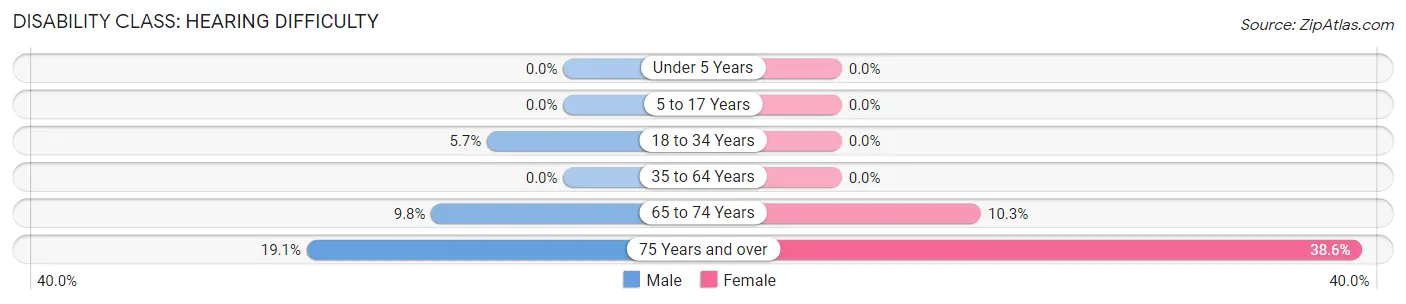
| Age Bracket | Male | Female |
| Under 5 Years | 0 (0.0%) | 0 (0.0%) |
| 5 to 17 Years | 0 (0.0%) | 0 (0.0%) |
| 18 to 34 Years | 3 (5.7%) | 0 (0.0%) |
| 35 to 64 Years | 0 (0.0%) | 0 (0.0%) |
| 65 to 74 Years | 5 (9.8%) | 3 (10.3%) |
| 75 Years and over | 4 (19.1%) | 17 (38.6%) |
Disability Class: Vision Difficulty
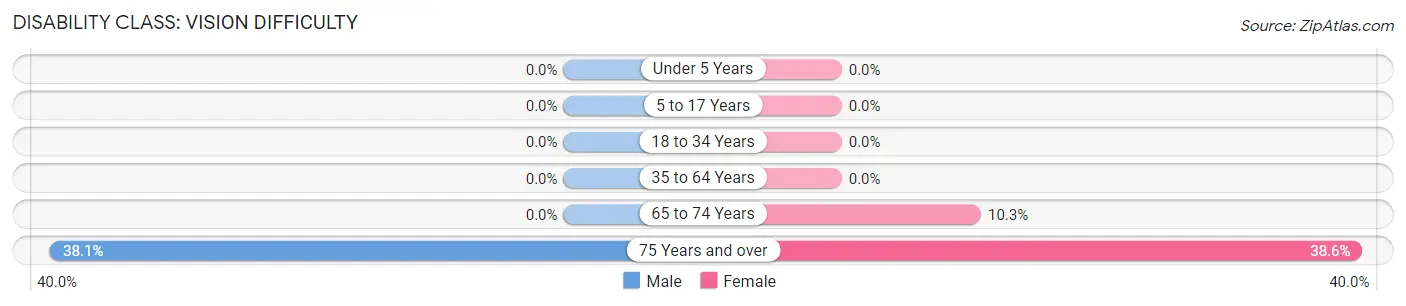
| Age Bracket | Male | Female |
| Under 5 Years | 0 (0.0%) | 0 (0.0%) |
| 5 to 17 Years | 0 (0.0%) | 0 (0.0%) |
| 18 to 34 Years | 0 (0.0%) | 0 (0.0%) |
| 35 to 64 Years | 0 (0.0%) | 0 (0.0%) |
| 65 to 74 Years | 0 (0.0%) | 3 (10.3%) |
| 75 Years and over | 8 (38.1%) | 17 (38.6%) |
Disability Class: Cognitive Difficulty
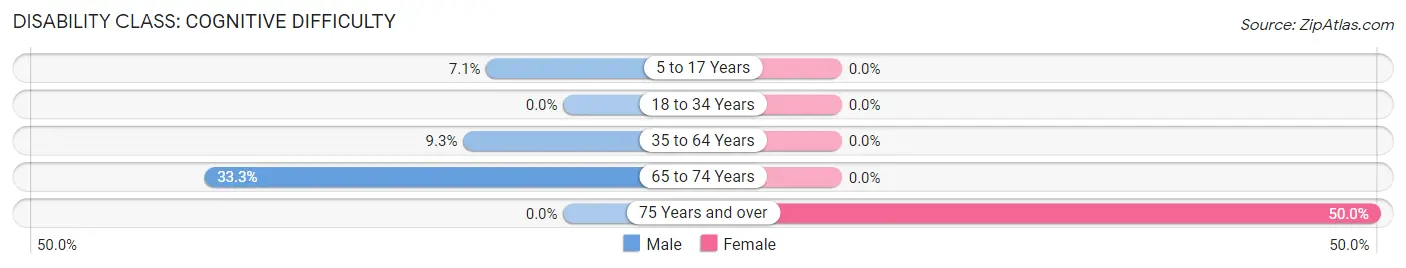
| Age Bracket | Male | Female |
| 5 to 17 Years | 3 (7.1%) | 0 (0.0%) |
| 18 to 34 Years | 0 (0.0%) | 0 (0.0%) |
| 35 to 64 Years | 13 (9.3%) | 0 (0.0%) |
| 65 to 74 Years | 17 (33.3%) | 0 (0.0%) |
| 75 Years and over | 0 (0.0%) | 22 (50.0%) |
Disability Class: Ambulatory Difficulty
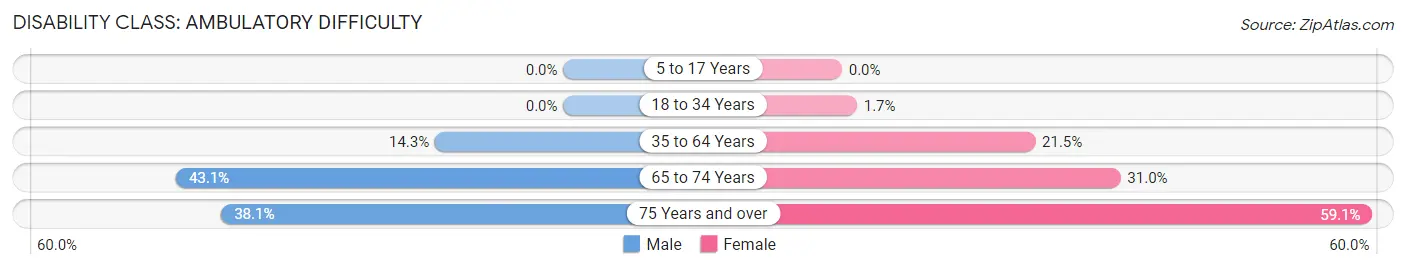
| Age Bracket | Male | Female |
| 5 to 17 Years | 0 (0.0%) | 0 (0.0%) |
| 18 to 34 Years | 0 (0.0%) | 1 (1.7%) |
| 35 to 64 Years | 20 (14.3%) | 31 (21.5%) |
| 65 to 74 Years | 22 (43.1%) | 9 (31.0%) |
| 75 Years and over | 8 (38.1%) | 26 (59.1%) |
Disability Class: Self-Care Difficulty
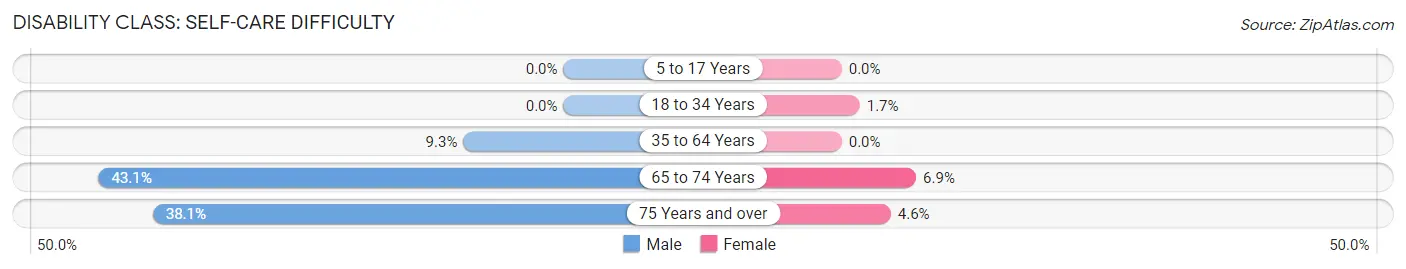
| Age Bracket | Male | Female |
| 5 to 17 Years | 0 (0.0%) | 0 (0.0%) |
| 18 to 34 Years | 0 (0.0%) | 1 (1.7%) |
| 35 to 64 Years | 13 (9.3%) | 0 (0.0%) |
| 65 to 74 Years | 22 (43.1%) | 2 (6.9%) |
| 75 Years and over | 8 (38.1%) | 2 (4.5%) |
Technology Access in Hay Springs
Computing Device Access in Hay Springs
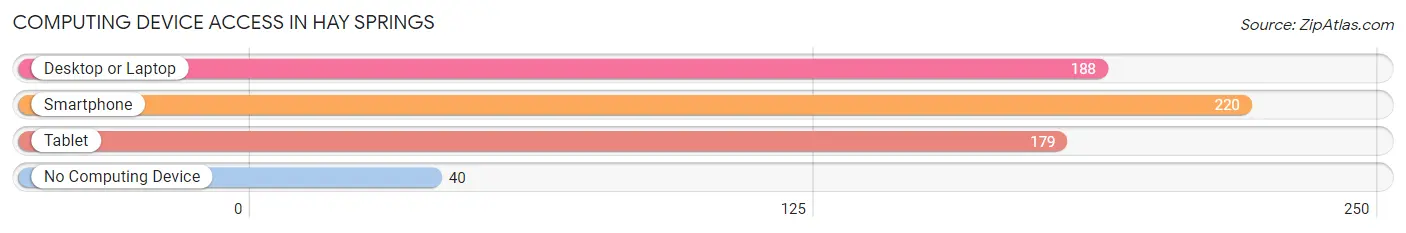
| Device Type | # Households | % Households |
| Desktop or Laptop | 188 | 65.3% |
| Smartphone | 220 | 76.4% |
| Tablet | 179 | 62.2% |
| No Computing Device | 40 | 13.9% |
| Total | 288 | 100.0% |
Internet Access in Hay Springs
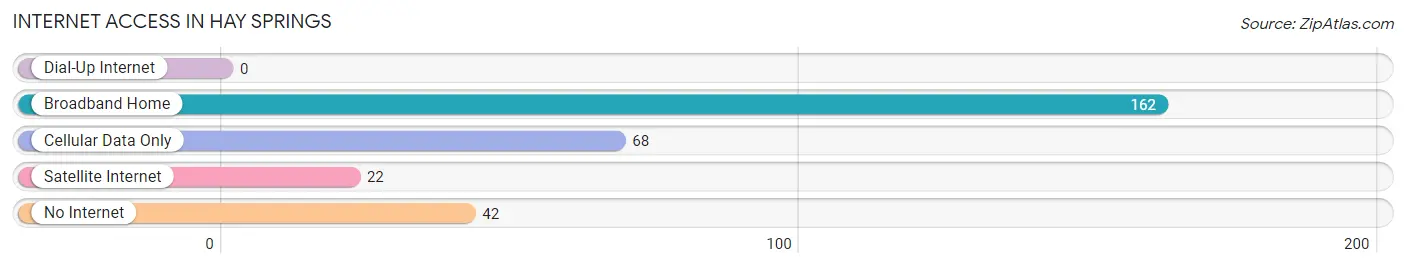
| Internet Type | # Households | % Households |
| Dial-Up Internet | 0 | 0.0% |
| Broadband Home | 162 | 56.2% |
| Cellular Data Only | 68 | 23.6% |
| Satellite Internet | 22 | 7.6% |
| No Internet | 42 | 14.6% |
| Total | 288 | 100.0% |
Hay Springs Summary
History
Hay Springs is a small town located in the northwest corner of Nebraska, in the Pine Ridge region of the state. The town was founded in 1885 by a group of settlers from Iowa, led by William Hay. The town was named after William Hay, who was a prominent figure in the area. The town was originally a farming community, but it soon became a center for the cattle industry. The town was also known for its timber industry, which provided lumber for the construction of homes and businesses.
The town grew steadily throughout the late 19th and early 20th centuries, and by the 1920s it had become a thriving community. The town was home to several businesses, including a bank, a hotel, a general store, and a post office. The town also had a school, a library, and a movie theater.
In the 1950s, the town began to decline as the cattle industry moved away from the area. The town's population began to decline, and by the 1970s the town was in decline. In the 1980s, the town began to experience a resurgence, as new businesses moved into the area and the population began to grow again.
Today, Hay Springs is a small town with a population of just over 500 people. The town is still home to several businesses, including a bank, a hotel, a general store, and a post office. The town also has a school, a library, and a movie theater.
Geography
Hay Springs is located in the northwest corner of Nebraska, in the Pine Ridge region of the state. The town is situated on the banks of the Niobrara River, and is surrounded by rolling hills and grasslands. The town is located about 30 miles from the South Dakota border, and about 50 miles from the Wyoming border.
The town is located in the Central Time Zone, and has a humid continental climate. The average temperature in the summer is around 80 degrees Fahrenheit, and the average temperature in the winter is around 20 degrees Fahrenheit. The town receives an average of 25 inches of precipitation per year.
Economy
The economy of Hay Springs is largely based on agriculture and tourism. The town is home to several farms, which produce a variety of crops, including corn, soybeans, wheat, and hay. The town is also home to several ranches, which raise cattle and other livestock.
The town is also home to several businesses, including a bank, a hotel, a general store, and a post office. The town also has a school, a library, and a movie theater.
The town is also home to several tourist attractions, including the Niobrara National Scenic River, the Hay Springs State Park, and the Hay Springs Historical Museum. The town is also home to several festivals and events, including the Hay Springs Harvest Festival and the Hay Springs Rodeo.
Demographics
As of the 2010 census, the population of Hay Springs was 514. The town has a total area of 0.7 square miles, all of which is land. The town has a population density of 735 people per square mile.
The racial makeup of the town is 97.3% White, 0.2% African American, 0.2% Native American, 0.2% Asian, 0.2% from other races, and 1.9% from two or more races. The median age in the town is 44.3 years, and the median household income is $41,250. The town has a poverty rate of 11.3%.
Common Questions
What is Per Capita Income in Hay Springs?
Per Capita income in Hay Springs is $36,116.
What is the Median Family Income in Hay Springs?
Median Family Income in Hay Springs is $78,750.
What is the Median Household income in Hay Springs?
Median Household Income in Hay Springs is $42,500.
What is Income or Wage Gap in Hay Springs?
Income or Wage Gap in Hay Springs is 35.5%.
Women in Hay Springs earn 64.5 cents for every dollar earned by a man.
What is Inequality or Gini Index in Hay Springs?
Inequality or Gini Index in Hay Springs is 0.52.
What is the Total Population of Hay Springs?
Total Population of Hay Springs is 656.
What is the Total Male Population of Hay Springs?
Total Male Population of Hay Springs is 324.
What is the Total Female Population of Hay Springs?
Total Female Population of Hay Springs is 332.
What is the Ratio of Males per 100 Females in Hay Springs?
There are 97.59 Males per 100 Females in Hay Springs.
What is the Ratio of Females per 100 Males in Hay Springs?
There are 102.47 Females per 100 Males in Hay Springs.
What is the Median Population Age in Hay Springs?
Median Population Age in Hay Springs is 54.4 Years.
What is the Average Family Size in Hay Springs
Average Family Size in Hay Springs is 2.5 People.
What is the Average Household Size in Hay Springs
Average Household Size in Hay Springs is 2.0 People.
How Large is the Labor Force in Hay Springs?
There are 316 People in the Labor Forcein in Hay Springs.
What is the Percentage of People in the Labor Force in Hay Springs?
54.9% of People are in the Labor Force in Hay Springs.