Hartington, NE Map & Demographics
Hartington Map
Hartington Overview
$39,579
PER CAPITA INCOME
$100,833
AVG FAMILY INCOME
$79,444
AVG HOUSEHOLD INCOME
25.3%
WAGE / INCOME GAP [ % ]
74.7¢/ $1
WAGE / INCOME GAP [ $ ]
0.43
INEQUALITY / GINI INDEX
1,552
TOTAL POPULATION
799
MALE POPULATION
753
FEMALE POPULATION
106.11
MALES / 100 FEMALES
94.24
FEMALES / 100 MALES
49.6
MEDIAN AGE
3.1
AVG FAMILY SIZE
2.3
AVG HOUSEHOLD SIZE
766
LABOR FORCE [ PEOPLE ]
60.5%
PERCENT IN LABOR FORCE
3.1%
UNEMPLOYMENT RATE
Hartington Zip Codes
Hartington Area Codes
Income in Hartington
Income Overview in Hartington
Per Capita Income in Hartington is $39,579, while median incomes of families and households are $100,833 and $79,444 respectively.
| Characteristic | Number | Measure |
| Per Capita Income | 1,552 | $39,579 |
| Median Family Income | 390 | $100,833 |
| Mean Family Income | 390 | $123,576 |
| Median Household Income | 648 | $79,444 |
| Mean Household Income | 648 | $91,905 |
| Income Deficit | 390 | $0 |
| Wage / Income Gap (%) | 1,552 | 25.31% |
| Wage / Income Gap ($) | 1,552 | 74.69¢ per $1 |
| Gini / Inequality Index | 1,552 | 0.43 |
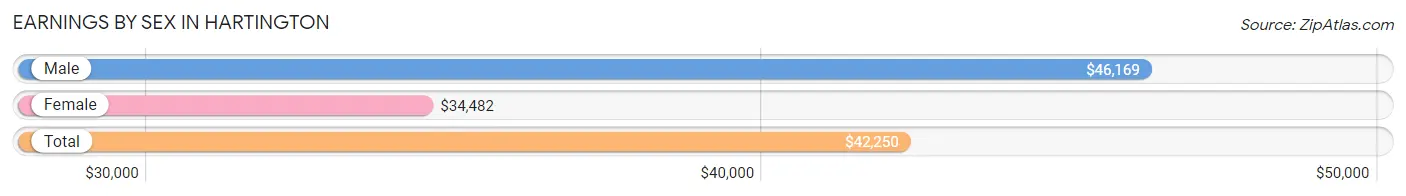
Earnings by Sex in Hartington
Average Earnings in Hartington are $42,250, $46,169 for men and $34,482 for women, a difference of 25.3%.
| Sex | Number | Average Earnings |
| Male | 419 (53.6%) | $46,169 |
| Female | 363 (46.4%) | $34,482 |
| Total | 782 (100.0%) | $42,250 |
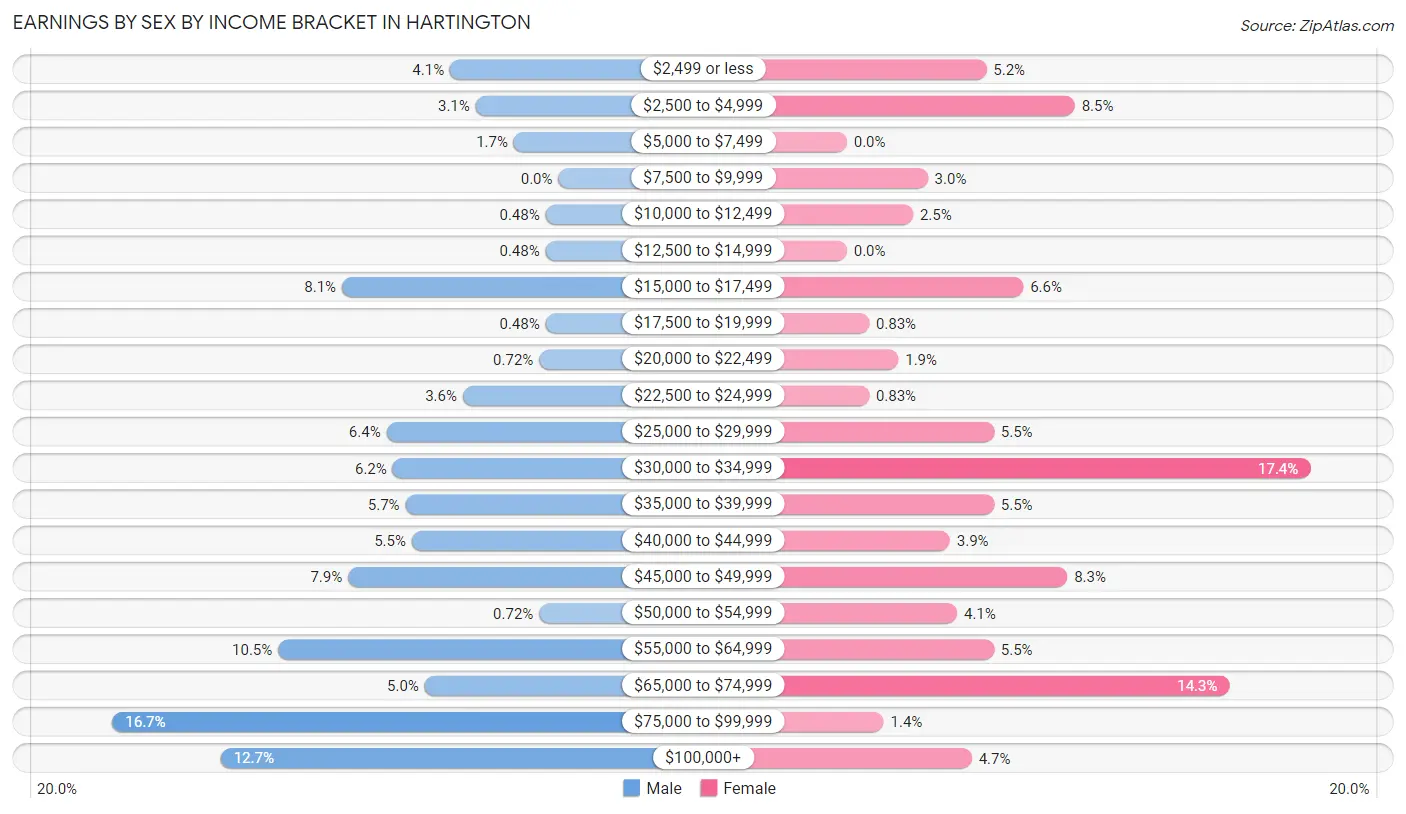
Earnings by Sex by Income Bracket in Hartington
The most common earnings brackets in Hartington are $75,000 to $99,999 for men (70 | 16.7%) and $30,000 to $34,999 for women (63 | 17.4%).
| Income | Male | Female |
| $2,499 or less | 17 (4.1%) | 19 (5.2%) |
| $2,500 to $4,999 | 13 (3.1%) | 31 (8.5%) |
| $5,000 to $7,499 | 7 (1.7%) | 0 (0.0%) |
| $7,500 to $9,999 | 0 (0.0%) | 11 (3.0%) |
| $10,000 to $12,499 | 2 (0.5%) | 9 (2.5%) |
| $12,500 to $14,999 | 2 (0.5%) | 0 (0.0%) |
| $15,000 to $17,499 | 34 (8.1%) | 24 (6.6%) |
| $17,500 to $19,999 | 2 (0.5%) | 3 (0.8%) |
| $20,000 to $22,499 | 3 (0.7%) | 7 (1.9%) |
| $22,500 to $24,999 | 15 (3.6%) | 3 (0.8%) |
| $25,000 to $29,999 | 27 (6.4%) | 20 (5.5%) |
| $30,000 to $34,999 | 26 (6.2%) | 63 (17.4%) |
| $35,000 to $39,999 | 24 (5.7%) | 20 (5.5%) |
| $40,000 to $44,999 | 23 (5.5%) | 14 (3.9%) |
| $45,000 to $49,999 | 33 (7.9%) | 30 (8.3%) |
| $50,000 to $54,999 | 3 (0.7%) | 15 (4.1%) |
| $55,000 to $64,999 | 44 (10.5%) | 20 (5.5%) |
| $65,000 to $74,999 | 21 (5.0%) | 52 (14.3%) |
| $75,000 to $99,999 | 70 (16.7%) | 5 (1.4%) |
| $100,000+ | 53 (12.7%) | 17 (4.7%) |
| Total | 419 (100.0%) | 363 (100.0%) |
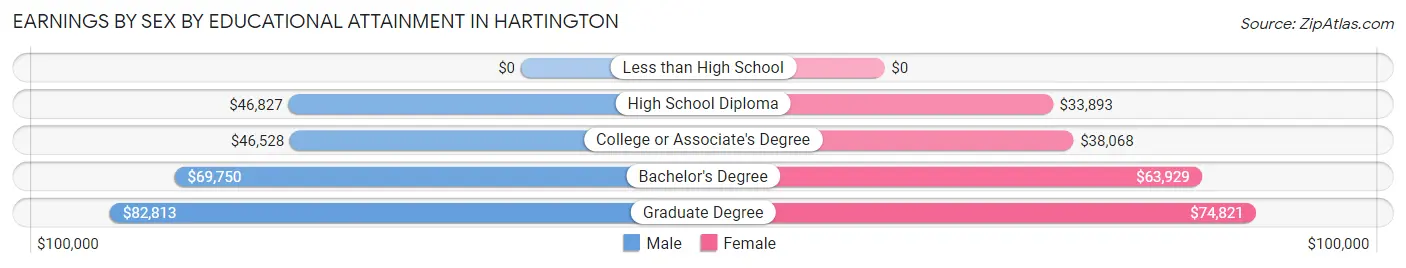
Earnings by Sex by Educational Attainment in Hartington
Average earnings in Hartington are $57,222 for men and $38,977 for women, a difference of 31.9%. Men with an educational attainment of graduate degree enjoy the highest average annual earnings of $82,813, while those with college or associate's degree education earn the least with $46,528. Women with an educational attainment of graduate degree earn the most with the average annual earnings of $74,821, while those with high school diploma education have the smallest earnings of $33,893.
| Educational Attainment | Male Income | Female Income |
| Less than High School | - | - |
| High School Diploma | $46,827 | $33,893 |
| College or Associate's Degree | $46,528 | $38,068 |
| Bachelor's Degree | $69,750 | $63,929 |
| Graduate Degree | $82,813 | $74,821 |
| Total | $57,222 | $38,977 |
Family Income in Hartington
Family Income Brackets in Hartington
According to the Hartington family income data, there are 91 families falling into the $100,000 to $149,999 income range, which is the most common income bracket and makes up 23.3% of all families. Conversely, the less than $10,000 income bracket is the least frequent group with only 2 families (0.5%) belonging to this category.
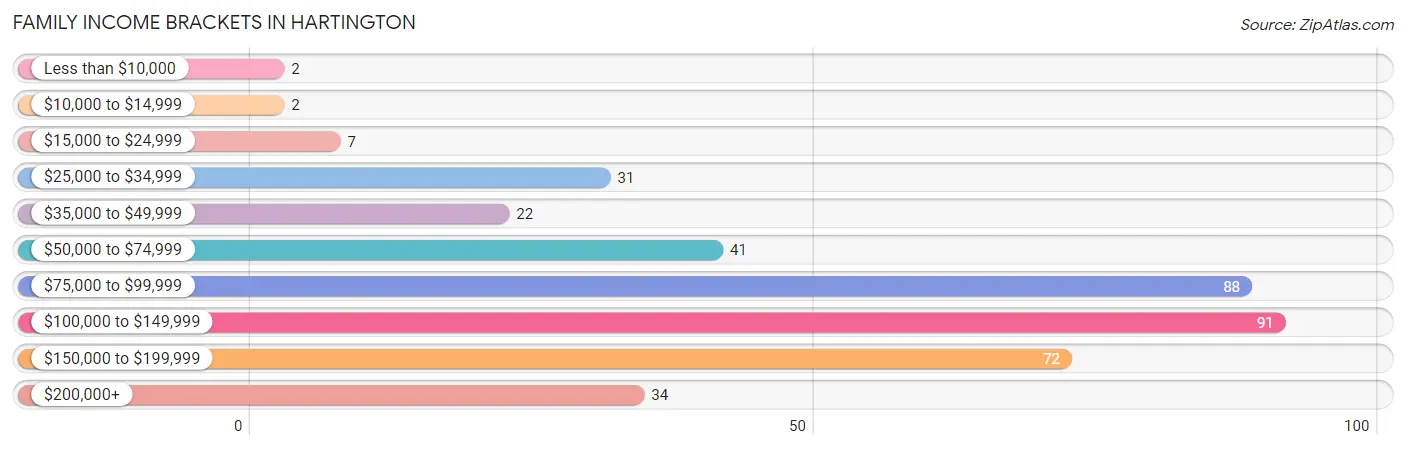
| Income Bracket | # Families | % Families |
| Less than $10,000 | 2 | 0.5% |
| $10,000 to $14,999 | 2 | 0.5% |
| $15,000 to $24,999 | 7 | 1.8% |
| $25,000 to $34,999 | 31 | 7.9% |
| $35,000 to $49,999 | 22 | 5.6% |
| $50,000 to $74,999 | 41 | 10.5% |
| $75,000 to $99,999 | 88 | 22.6% |
| $100,000 to $149,999 | 91 | 23.3% |
| $150,000 to $199,999 | 72 | 18.5% |
| $200,000+ | 34 | 8.7% |
Family Income by Famaliy Size in Hartington
5-person families (44 | 11.3%) account for the highest median family income in Hartington with $114,063 per family, while 2-person families (192 | 49.2%) have the highest median income of $47,084 per family member.
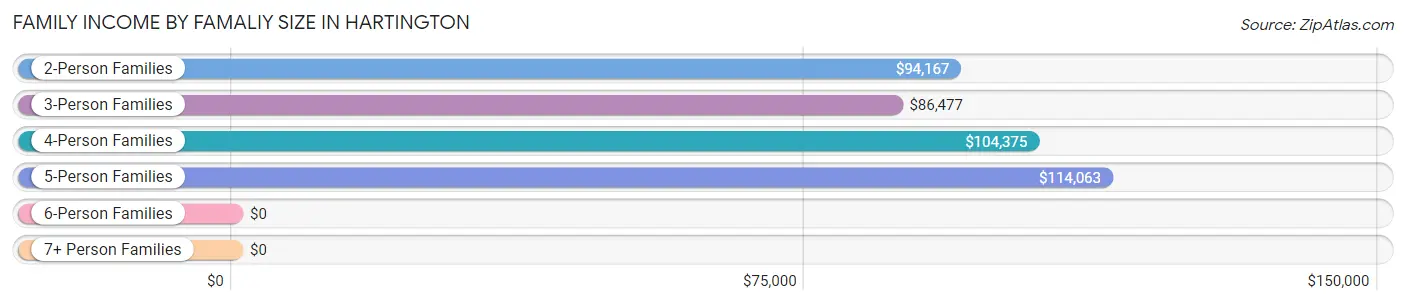
| Income Bracket | # Families | Median Income |
| 2-Person Families | 192 (49.2%) | $94,167 |
| 3-Person Families | 55 (14.1%) | $86,477 |
| 4-Person Families | 82 (21.0%) | $104,375 |
| 5-Person Families | 44 (11.3%) | $114,063 |
| 6-Person Families | 7 (1.8%) | $0 |
| 7+ Person Families | 10 (2.6%) | $0 |
| Total | 390 (100.0%) | $100,833 |
Family Income by Number of Earners in Hartington
The median family income in Hartington is $100,833, with families comprising 3+ earners (49) having the highest median family income of $157,083, while families with 2 earners (187) have the lowest median family income of $92,917, accounting for 12.6% and 47.9% of families, respectively.
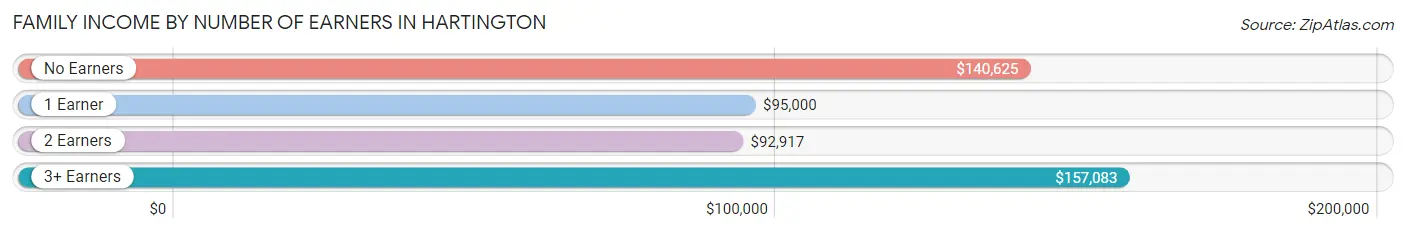
| Number of Earners | # Families | Median Income |
| No Earners | 62 (15.9%) | $140,625 |
| 1 Earner | 92 (23.6%) | $95,000 |
| 2 Earners | 187 (47.9%) | $92,917 |
| 3+ Earners | 49 (12.6%) | $157,083 |
| Total | 390 (100.0%) | $100,833 |
Household Income in Hartington
Household Income Brackets in Hartington
With 127 households falling in the category, the $75,000 to $99,999 income range is the most frequent in Hartington, accounting for 19.6% of all households. In contrast, only 13 households (2.0%) fall into the less than $10,000 income bracket, making it the least populous group.
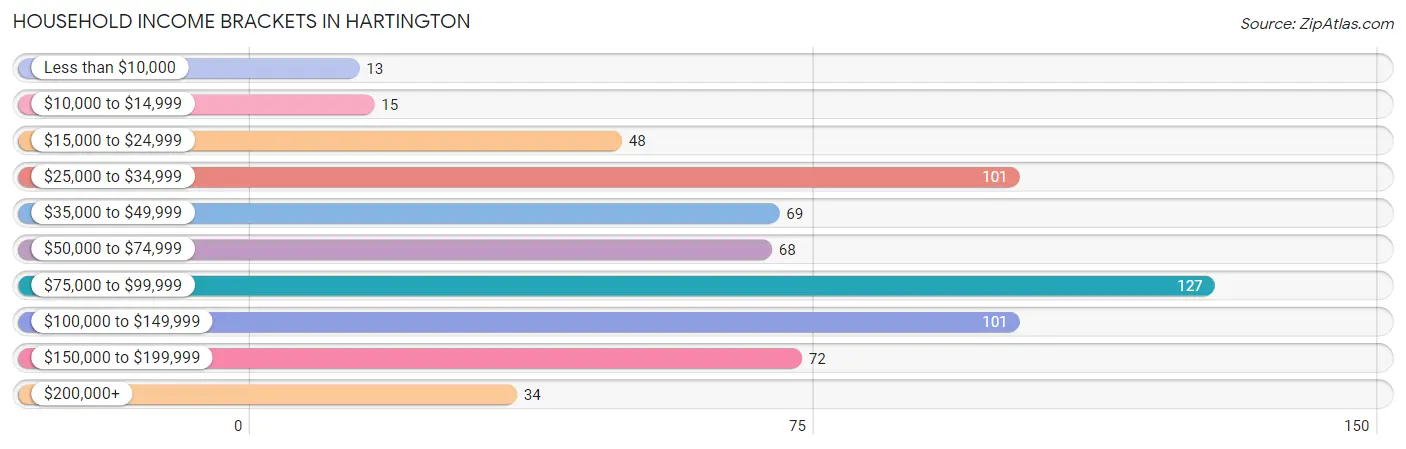
| Income Bracket | # Households | % Households |
| Less than $10,000 | 13 | 2.0% |
| $10,000 to $14,999 | 15 | 2.3% |
| $15,000 to $24,999 | 48 | 7.4% |
| $25,000 to $34,999 | 101 | 15.6% |
| $35,000 to $49,999 | 69 | 10.6% |
| $50,000 to $74,999 | 68 | 10.5% |
| $75,000 to $99,999 | 127 | 19.6% |
| $100,000 to $149,999 | 101 | 15.6% |
| $150,000 to $199,999 | 72 | 11.1% |
| $200,000+ | 34 | 5.2% |
Household Income by Householder Age in Hartington
The median household income in Hartington is $79,444, with the highest median household income of $91,053 found in the 25 to 44 years age bracket for the primary householder. A total of 122 households (18.8%) fall into this category. Meanwhile, the 15 to 24 years age bracket for the primary householder has the lowest median household income of $0, with 5 households (0.8%) in this group.
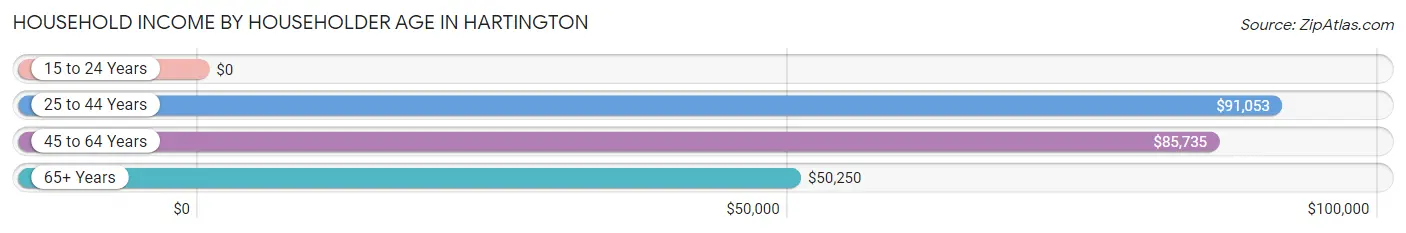
| Income Bracket | # Households | Median Income |
| 15 to 24 Years | 5 (0.8%) | $0 |
| 25 to 44 Years | 122 (18.8%) | $91,053 |
| 45 to 64 Years | 226 (34.9%) | $85,735 |
| 65+ Years | 295 (45.5%) | $50,250 |
| Total | 648 (100.0%) | $79,444 |
Poverty in Hartington
Income Below Poverty by Sex and Age in Hartington
With 2.6% poverty level for males and 6.3% for females among the residents of Hartington, 75 year old and over males and 18 to 24 year old females are the most vulnerable to poverty, with 10 males (10.6%) and 7 females (22.6%) in their respective age groups living below the poverty level.
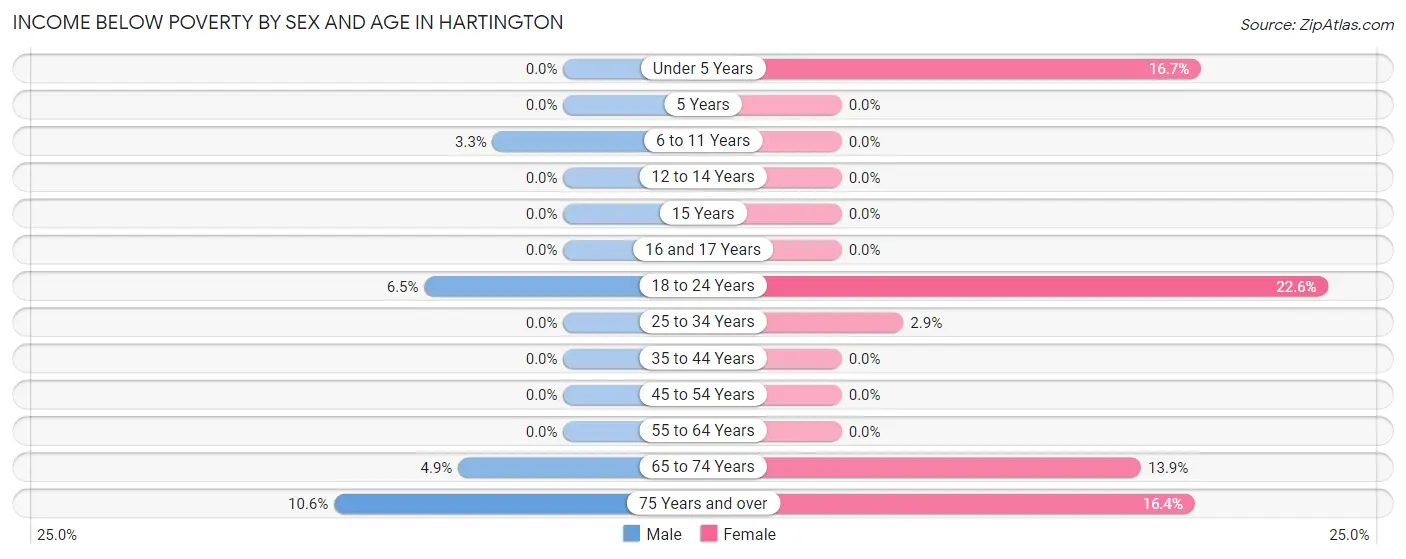
| Age Bracket | Male | Female |
| Under 5 Years | 0 (0.0%) | 4 (16.7%) |
| 5 Years | 0 (0.0%) | 0 (0.0%) |
| 6 to 11 Years | 2 (3.3%) | 0 (0.0%) |
| 12 to 14 Years | 0 (0.0%) | 0 (0.0%) |
| 15 Years | 0 (0.0%) | 0 (0.0%) |
| 16 and 17 Years | 0 (0.0%) | 0 (0.0%) |
| 18 to 24 Years | 2 (6.5%) | 7 (22.6%) |
| 25 to 34 Years | 0 (0.0%) | 1 (2.9%) |
| 35 to 44 Years | 0 (0.0%) | 0 (0.0%) |
| 45 to 54 Years | 0 (0.0%) | 0 (0.0%) |
| 55 to 64 Years | 0 (0.0%) | 0 (0.0%) |
| 65 to 74 Years | 6 (4.9%) | 15 (13.9%) |
| 75 Years and over | 10 (10.6%) | 19 (16.4%) |
| Total | 20 (2.6%) | 46 (6.3%) |
Income Above Poverty by Sex and Age in Hartington
According to the poverty statistics in Hartington, males aged under 5 years and females aged 5 years are the age groups that are most secure financially, with 100.0% of males and 100.0% of females in these age groups living above the poverty line.
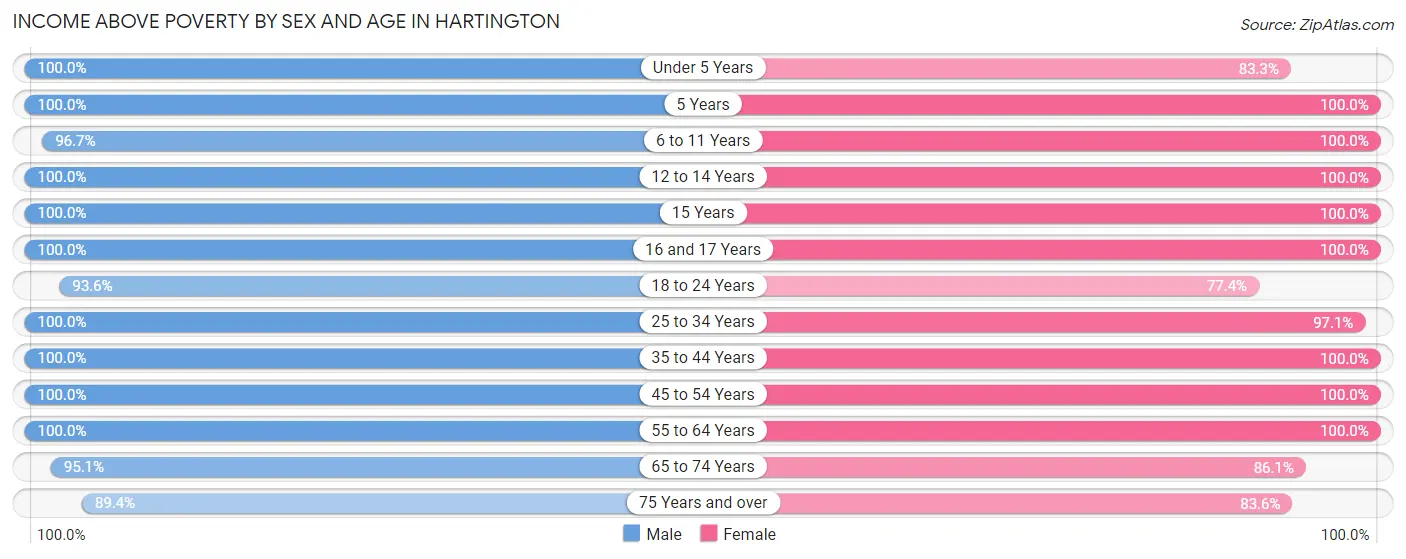
| Age Bracket | Male | Female |
| Under 5 Years | 52 (100.0%) | 20 (83.3%) |
| 5 Years | 16 (100.0%) | 3 (100.0%) |
| 6 to 11 Years | 59 (96.7%) | 77 (100.0%) |
| 12 to 14 Years | 14 (100.0%) | 29 (100.0%) |
| 15 Years | 5 (100.0%) | 3 (100.0%) |
| 16 and 17 Years | 37 (100.0%) | 38 (100.0%) |
| 18 to 24 Years | 29 (93.5%) | 24 (77.4%) |
| 25 to 34 Years | 65 (100.0%) | 34 (97.1%) |
| 35 to 44 Years | 96 (100.0%) | 72 (100.0%) |
| 45 to 54 Years | 78 (100.0%) | 54 (100.0%) |
| 55 to 64 Years | 97 (100.0%) | 137 (100.0%) |
| 65 to 74 Years | 117 (95.1%) | 93 (86.1%) |
| 75 Years and over | 84 (89.4%) | 97 (83.6%) |
| Total | 749 (97.4%) | 681 (93.7%) |
Income Below Poverty Among Married-Couple Families in Hartington
The poverty statistics for married-couple families in Hartington show that 1.9% or 7 of the total 364 families live below the poverty line. Families with no children have the highest poverty rate of 2.4%, comprising of 5 families. On the other hand, families with 3 or 4 children have the lowest poverty rate of 0.0%, which includes 0 families.
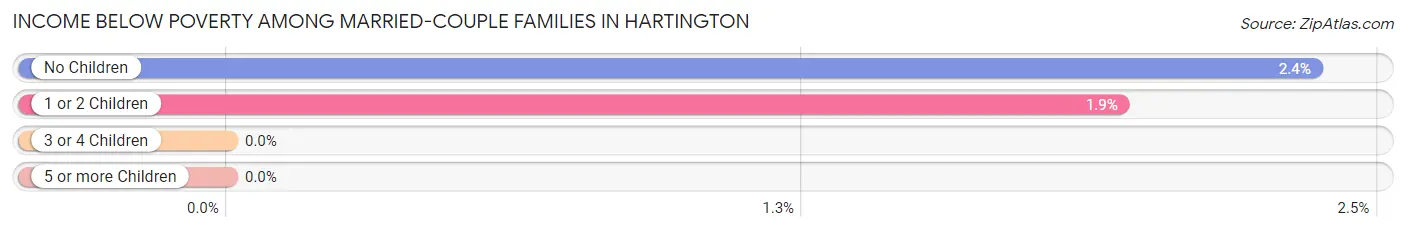
| Children | Above Poverty | Below Poverty |
| No Children | 207 (97.6%) | 5 (2.4%) |
| 1 or 2 Children | 101 (98.1%) | 2 (1.9%) |
| 3 or 4 Children | 44 (100.0%) | 0 (0.0%) |
| 5 or more Children | 5 (100.0%) | 0 (0.0%) |
| Total | 357 (98.1%) | 7 (1.9%) |
Income Below Poverty Among Single-Parent Households in Hartington
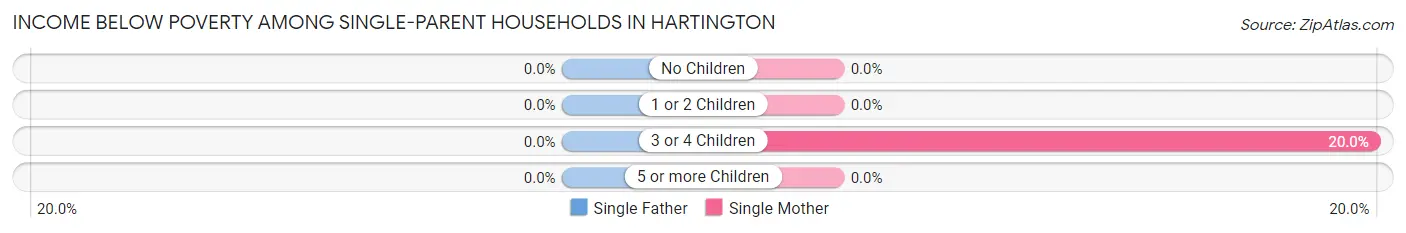
| Children | Single Father | Single Mother |
| No Children | 0 (0.0%) | 0 (0.0%) |
| 1 or 2 Children | 0 (0.0%) | 0 (0.0%) |
| 3 or 4 Children | 0 (0.0%) | 1 (20.0%) |
| 5 or more Children | 0 (0.0%) | 0 (0.0%) |
| Total | 0 (0.0%) | 1 (7.7%) |
Income Below Poverty Among Married-Couple vs Single-Parent Households in Hartington
The poverty data for Hartington shows that 7 of the married-couple family households (1.9%) and 1 of the single-parent households (3.8%) are living below the poverty level. Within the married-couple family households, those with no children have the highest poverty rate, with 5 households (2.4%) falling below the poverty line. Among the single-parent households, those with 3 or 4 children have the highest poverty rate, with 1 household (10.0%) living below poverty.
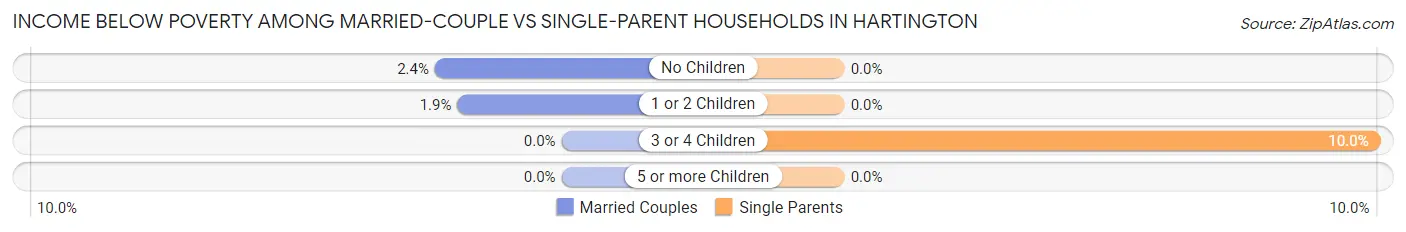
| Children | Married-Couple Families | Single-Parent Households |
| No Children | 5 (2.4%) | 0 (0.0%) |
| 1 or 2 Children | 2 (1.9%) | 0 (0.0%) |
| 3 or 4 Children | 0 (0.0%) | 1 (10.0%) |
| 5 or more Children | 0 (0.0%) | 0 (0.0%) |
| Total | 7 (1.9%) | 1 (3.8%) |
Race in Hartington
The most populous races in Hartington are White / Caucasian (1,513 | 97.5%), Hispanic or Latino (34 | 2.2%), and Native / Alaskan (15 | 1.0%).
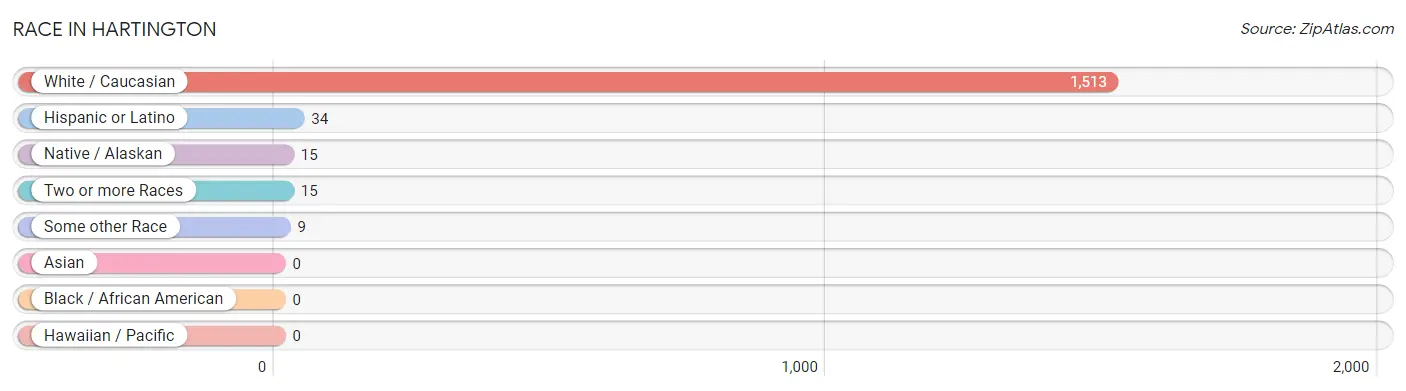
| Race | # Population | % Population |
| Asian | 0 | 0.0% |
| Black / African American | 0 | 0.0% |
| Hawaiian / Pacific | 0 | 0.0% |
| Hispanic or Latino | 34 | 2.2% |
| Native / Alaskan | 15 | 1.0% |
| White / Caucasian | 1,513 | 97.5% |
| Two or more Races | 15 | 1.0% |
| Some other Race | 9 | 0.6% |
| Total | 1,552 | 100.0% |
Ancestry in Hartington
The most populous ancestries reported in Hartington are German (798 | 51.4%), Irish (134 | 8.6%), Danish (115 | 7.4%), Czech (76 | 4.9%), and Norwegian (65 | 4.2%), together accounting for 76.6% of all Hartington residents.
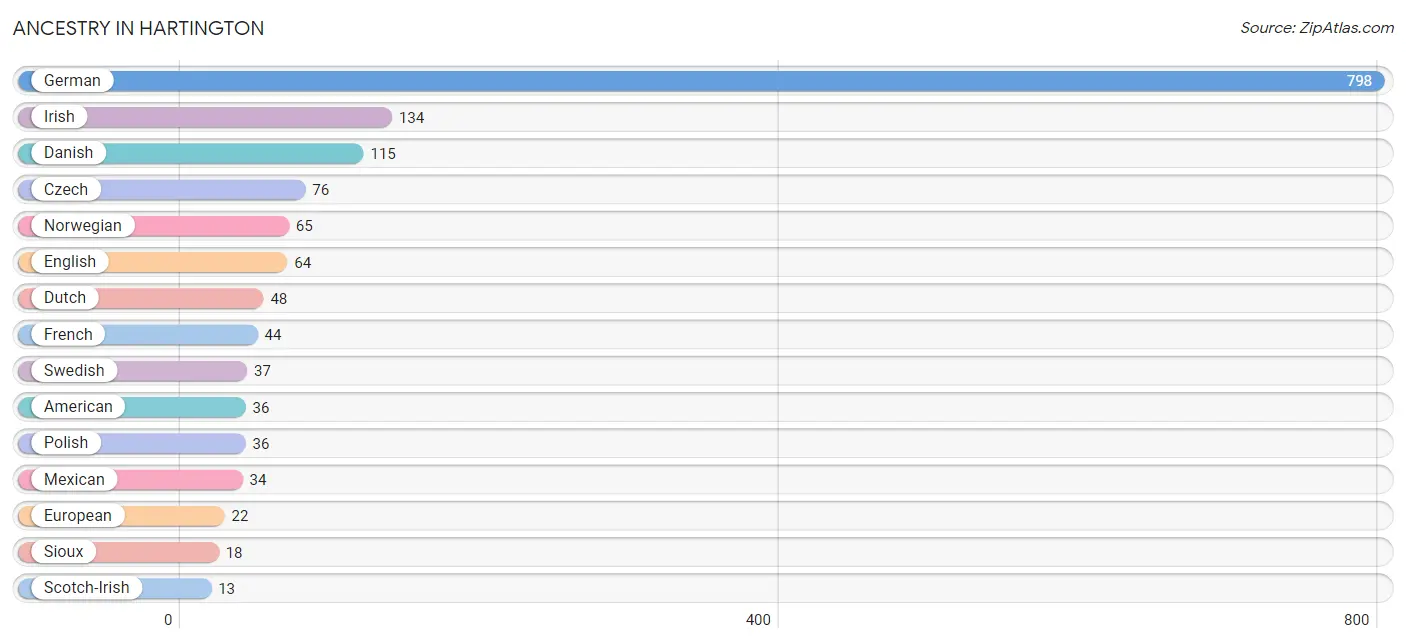
| Ancestry | # Population | % Population |
| American | 36 | 2.3% |
| Arab | 3 | 0.2% |
| Basque | 9 | 0.6% |
| Czech | 76 | 4.9% |
| Danish | 115 | 7.4% |
| Dutch | 48 | 3.1% |
| English | 64 | 4.1% |
| European | 22 | 1.4% |
| French | 44 | 2.8% |
| German | 798 | 51.4% |
| Irish | 134 | 8.6% |
| Italian | 8 | 0.5% |
| Mexican | 34 | 2.2% |
| Norwegian | 65 | 4.2% |
| Polish | 36 | 2.3% |
| Russian | 2 | 0.1% |
| Scandinavian | 8 | 0.5% |
| Scotch-Irish | 13 | 0.8% |
| Scottish | 5 | 0.3% |
| Sioux | 18 | 1.2% |
| Swedish | 37 | 2.4% |
| Swiss | 3 | 0.2% |
| Syrian | 3 | 0.2% | View All 23 Rows |
Immigrants in Hartington
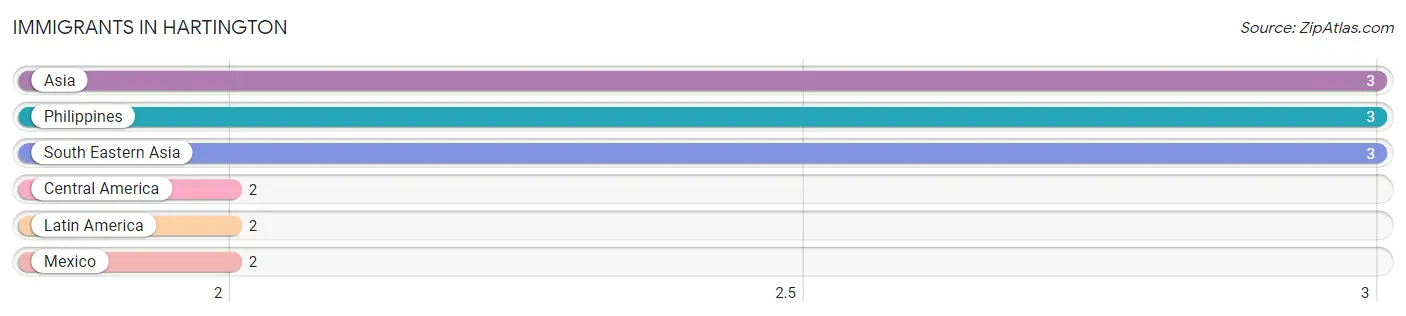
The most numerous immigrant groups reported in Hartington came from Asia (3 | 0.2%), Philippines (3 | 0.2%), South Eastern Asia (3 | 0.2%), Central America (2 | 0.1%), and Latin America (2 | 0.1%), together accounting for 0.8% of all Hartington residents.
| Immigration Origin | # Population | % Population |
| Asia | 3 | 0.2% |
| Central America | 2 | 0.1% |
| Latin America | 2 | 0.1% |
| Mexico | 2 | 0.1% |
| Philippines | 3 | 0.2% |
| South Eastern Asia | 3 | 0.2% | View All 6 Rows |
Sex and Age in Hartington
Sex and Age in Hartington
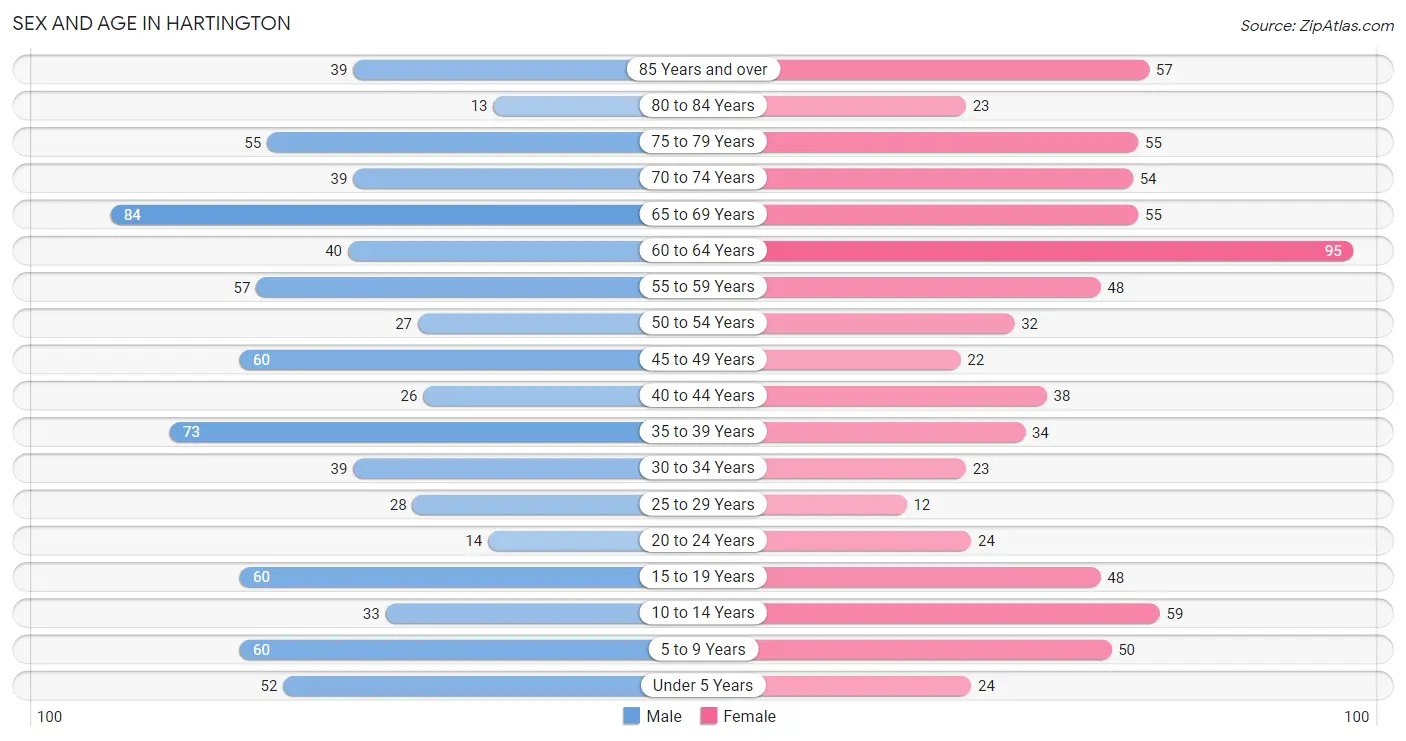
The most populous age groups in Hartington are 65 to 69 Years (84 | 10.5%) for men and 60 to 64 Years (95 | 12.6%) for women.
| Age Bracket | Male | Female |
| Under 5 Years | 52 (6.5%) | 24 (3.2%) |
| 5 to 9 Years | 60 (7.5%) | 50 (6.6%) |
| 10 to 14 Years | 33 (4.1%) | 59 (7.8%) |
| 15 to 19 Years | 60 (7.5%) | 48 (6.4%) |
| 20 to 24 Years | 14 (1.8%) | 24 (3.2%) |
| 25 to 29 Years | 28 (3.5%) | 12 (1.6%) |
| 30 to 34 Years | 39 (4.9%) | 23 (3.0%) |
| 35 to 39 Years | 73 (9.1%) | 34 (4.5%) |
| 40 to 44 Years | 26 (3.3%) | 38 (5.1%) |
| 45 to 49 Years | 60 (7.5%) | 22 (2.9%) |
| 50 to 54 Years | 27 (3.4%) | 32 (4.3%) |
| 55 to 59 Years | 57 (7.1%) | 48 (6.4%) |
| 60 to 64 Years | 40 (5.0%) | 95 (12.6%) |
| 65 to 69 Years | 84 (10.5%) | 55 (7.3%) |
| 70 to 74 Years | 39 (4.9%) | 54 (7.2%) |
| 75 to 79 Years | 55 (6.9%) | 55 (7.3%) |
| 80 to 84 Years | 13 (1.6%) | 23 (3.0%) |
| 85 Years and over | 39 (4.9%) | 57 (7.6%) |
| Total | 799 (100.0%) | 753 (100.0%) |
Families and Households in Hartington
Median Family Size in Hartington
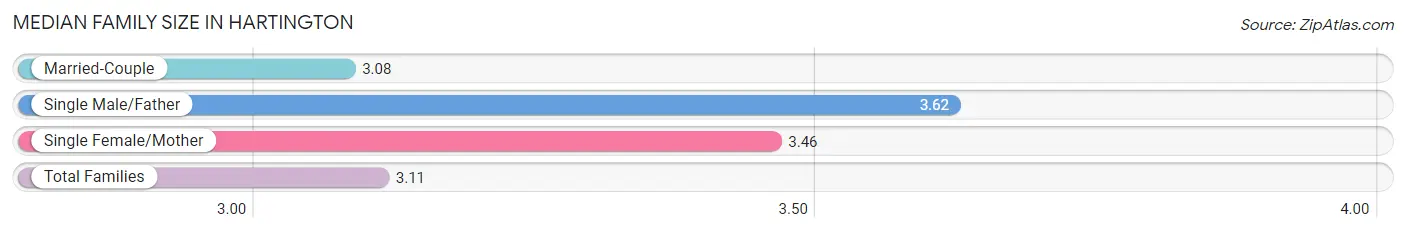
The median family size in Hartington is 3.11 persons per family, with single male/father families (13 | 3.3%) accounting for the largest median family size of 3.62 persons per family. On the other hand, married-couple families (364 | 93.3%) represent the smallest median family size with 3.08 persons per family.
| Family Type | # Families | Family Size |
| Married-Couple | 364 (93.3%) | 3.08 |
| Single Male/Father | 13 (3.3%) | 3.62 |
| Single Female/Mother | 13 (3.3%) | 3.46 |
| Total Families | 390 (100.0%) | 3.11 |
Median Household Size in Hartington
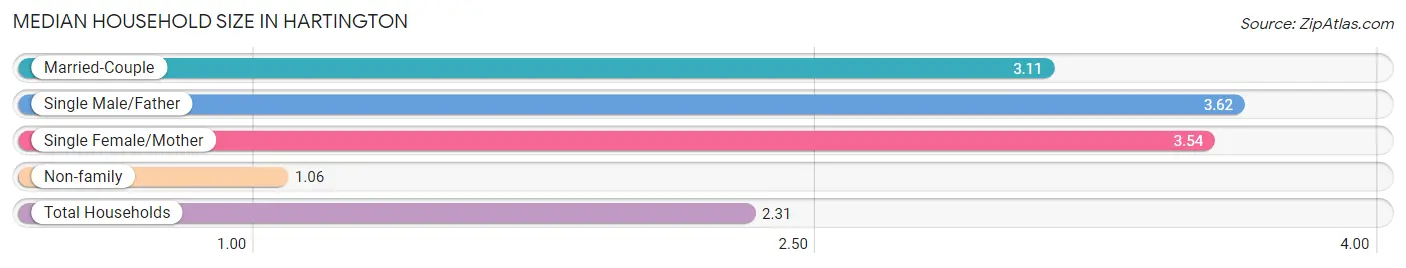
The median household size in Hartington is 2.31 persons per household, with single male/father households (13 | 2.0%) accounting for the largest median household size of 3.62 persons per household. non-family households (258 | 39.8%) represent the smallest median household size with 1.06 persons per household.
| Household Type | # Households | Household Size |
| Married-Couple | 364 (56.2%) | 3.11 |
| Single Male/Father | 13 (2.0%) | 3.62 |
| Single Female/Mother | 13 (2.0%) | 3.54 |
| Non-family | 258 (39.8%) | 1.06 |
| Total Households | 648 (100.0%) | 2.31 |
Household Size by Marriage Status in Hartington
Out of a total of 648 households in Hartington, 390 (60.2%) are family households, while 258 (39.8%) are nonfamily households. The most numerous type of family households are 2-person households, comprising 192, and the most common type of nonfamily households are 1-person households, comprising 244.
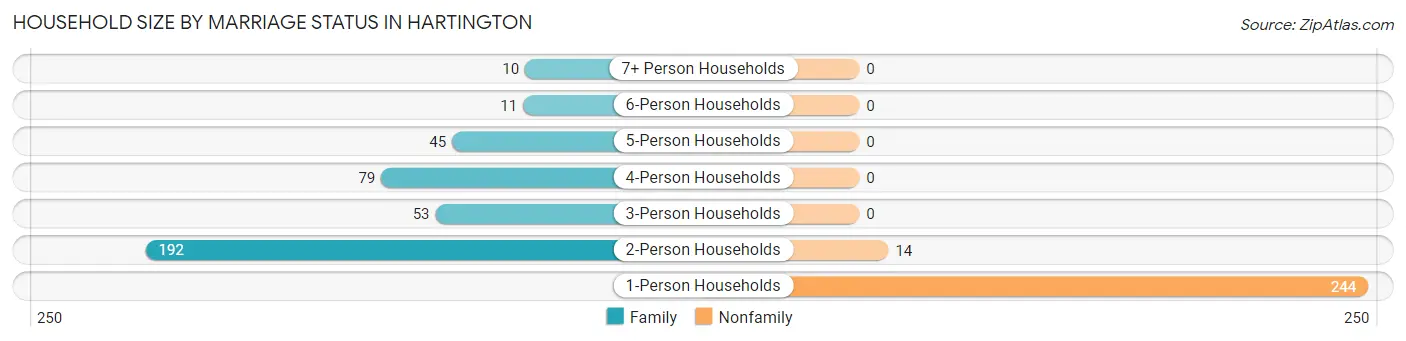
| Household Size | Family Households | Nonfamily Households |
| 1-Person Households | - | 244 (37.7%) |
| 2-Person Households | 192 (29.6%) | 14 (2.2%) |
| 3-Person Households | 53 (8.2%) | 0 (0.0%) |
| 4-Person Households | 79 (12.2%) | 0 (0.0%) |
| 5-Person Households | 45 (6.9%) | 0 (0.0%) |
| 6-Person Households | 11 (1.7%) | 0 (0.0%) |
| 7+ Person Households | 10 (1.5%) | 0 (0.0%) |
| Total | 390 (60.2%) | 258 (39.8%) |
Female Fertility in Hartington
Fertility by Age in Hartington
Average fertility rate in Hartington is 37.0 births per 1,000 women. Women in the age bracket of 20 to 34 years have the highest fertility rate with 51.0 births per 1,000 women. Women in the age bracket of 35 to 50 years acount for 62.5% of all women with births.
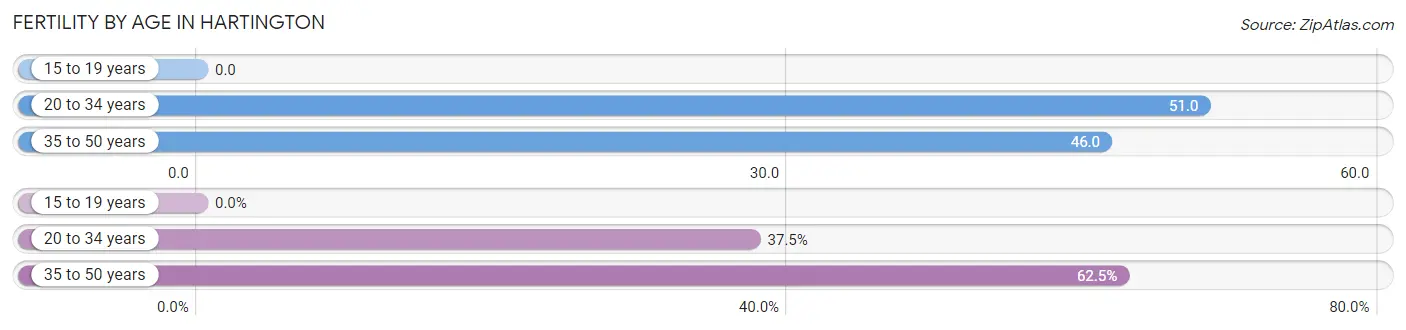
| Age Bracket | Women with Births | Births / 1,000 Women |
| 15 to 19 years | 0 (0.0%) | 0.0 |
| 20 to 34 years | 3 (37.5%) | 51.0 |
| 35 to 50 years | 5 (62.5%) | 46.0 |
| Total | 8 (100.0%) | 37.0 |
Fertility by Age by Marriage Status in Hartington
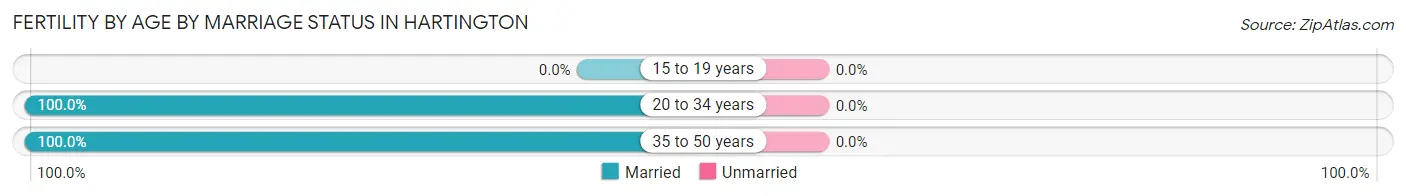
| Age Bracket | Married | Unmarried |
| 15 to 19 years | 0 (0.0%) | 0 (0.0%) |
| 20 to 34 years | 3 (100.0%) | 0 (0.0%) |
| 35 to 50 years | 5 (100.0%) | 0 (0.0%) |
| Total | 8 (100.0%) | 0 (0.0%) |
Fertility by Education in Hartington
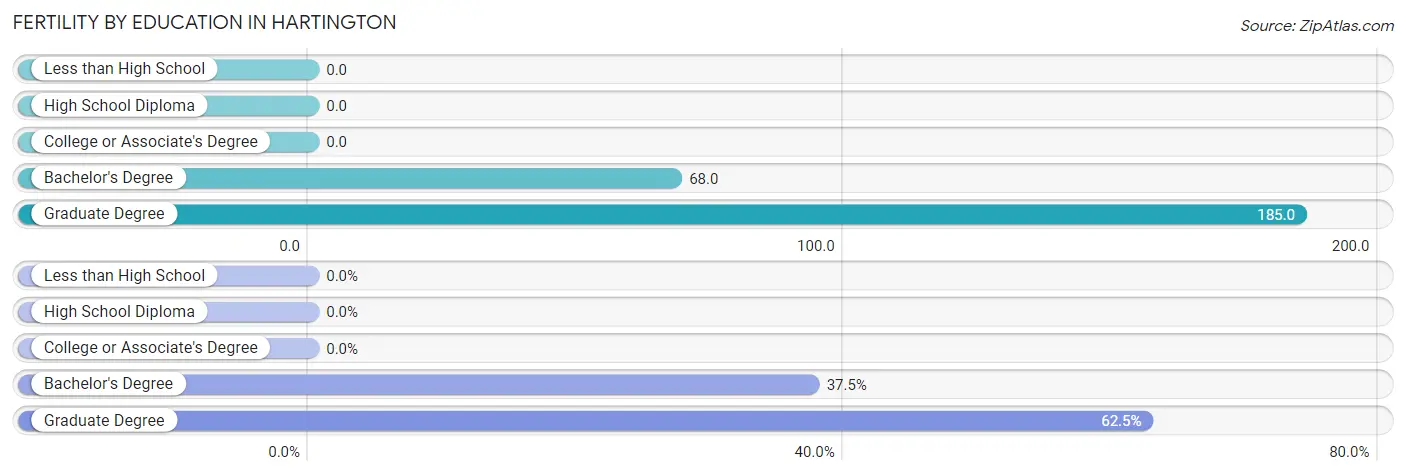
| Educational Attainment | Women with Births | Births / 1,000 Women |
| Less than High School | 0 (0.0%) | 0.0 |
| High School Diploma | 0 (0.0%) | 0.0 |
| College or Associate's Degree | 0 (0.0%) | 0.0 |
| Bachelor's Degree | 3 (37.5%) | 68.0 |
| Graduate Degree | 5 (62.5%) | 185.0 |
| Total | 8 (100.0%) | 37.0 |
Fertility by Education by Marriage Status in Hartington
| Educational Attainment | Married | Unmarried |
| Less than High School | 0 (0.0%) | 0 (0.0%) |
| High School Diploma | 0 (0.0%) | 0 (0.0%) |
| College or Associate's Degree | 0 (0.0%) | 0 (0.0%) |
| Bachelor's Degree | 3 (100.0%) | 0 (0.0%) |
| Graduate Degree | 5 (100.0%) | 0 (0.0%) |
| Total | 8 (100.0%) | 0 (0.0%) |
Employment Characteristics in Hartington
Employment by Class of Employer in Hartington
Among the 735 employed individuals in Hartington, private company employees (422 | 57.4%), not-for-profit organizations (98 | 13.3%), and local government employees (66 | 9.0%) make up the most common classes of employment.
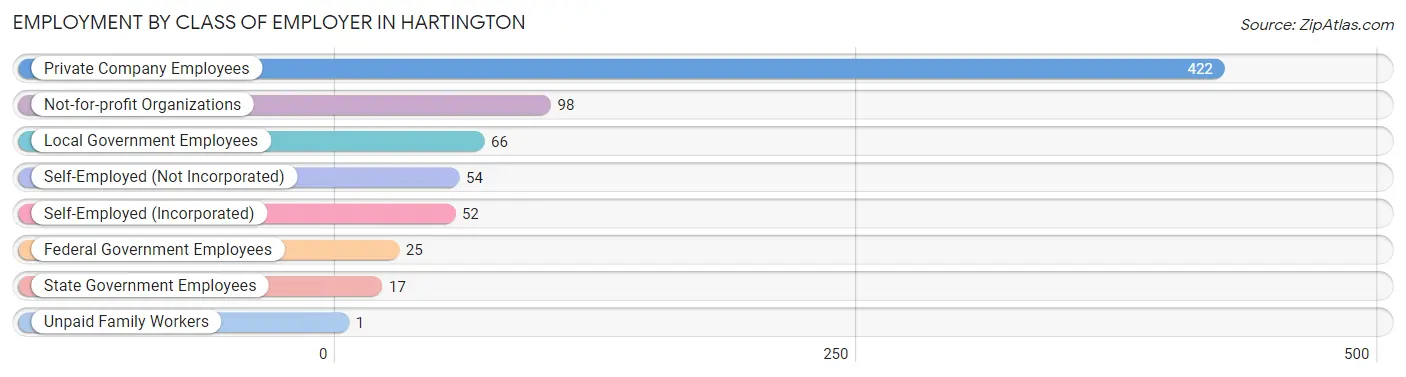
| Employer Class | # Employees | % Employees |
| Private Company Employees | 422 | 57.4% |
| Self-Employed (Incorporated) | 52 | 7.1% |
| Self-Employed (Not Incorporated) | 54 | 7.3% |
| Not-for-profit Organizations | 98 | 13.3% |
| Local Government Employees | 66 | 9.0% |
| State Government Employees | 17 | 2.3% |
| Federal Government Employees | 25 | 3.4% |
| Unpaid Family Workers | 1 | 0.1% |
| Total | 735 | 100.0% |
Employment Status by Age in Hartington
According to the labor force statistics for Hartington, out of the total population over 16 years of age (1,266), 60.5% or 766 individuals are in the labor force, with 3.1% or 24 of them unemployed. The age group with the highest labor force participation rate is 30 to 34 years, with 98.4% or 61 individuals in the labor force. Within the labor force, the 55 to 59 years age range has the highest percentage of unemployed individuals, with 11.1% or 11 of them being unemployed.
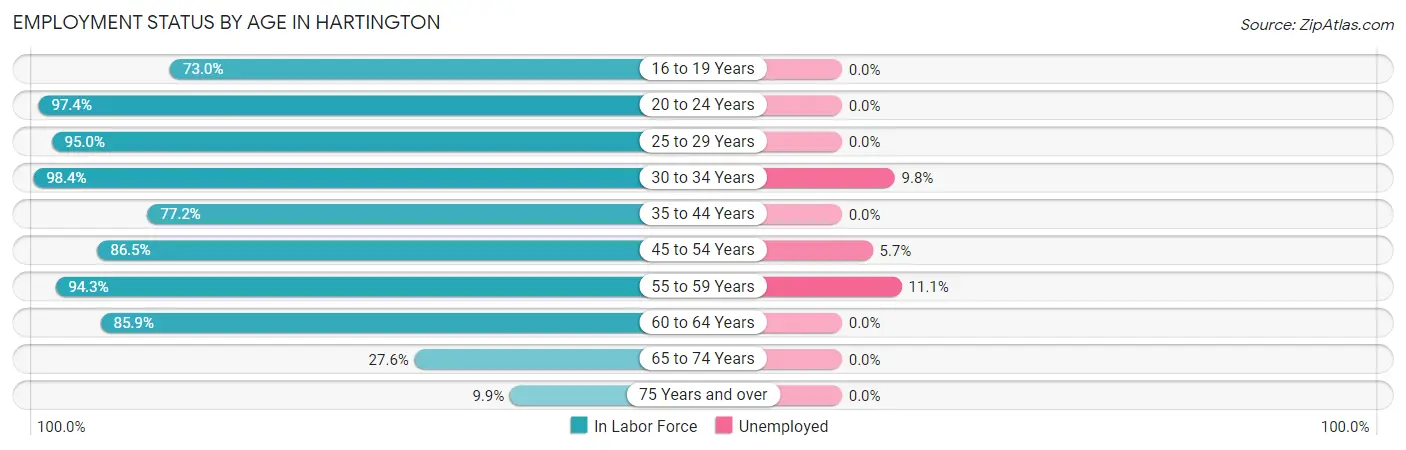
| Age Bracket | In Labor Force | Unemployed |
| 16 to 19 Years | 73 (73.0%) | 0 (0.0%) |
| 20 to 24 Years | 37 (97.4%) | 0 (0.0%) |
| 25 to 29 Years | 38 (95.0%) | 0 (0.0%) |
| 30 to 34 Years | 61 (98.4%) | 6 (9.8%) |
| 35 to 44 Years | 132 (77.2%) | 0 (0.0%) |
| 45 to 54 Years | 122 (86.5%) | 7 (5.7%) |
| 55 to 59 Years | 99 (94.3%) | 11 (11.1%) |
| 60 to 64 Years | 116 (85.9%) | 0 (0.0%) |
| 65 to 74 Years | 64 (27.6%) | 0 (0.0%) |
| 75 Years and over | 24 (9.9%) | 0 (0.0%) |
| Total | 766 (60.5%) | 24 (3.1%) |
Employment Status by Educational Attainment in Hartington
According to labor force statistics for Hartington, 86.9% of individuals (568) out of the total population between 25 and 64 years of age (654) are in the labor force, with 4.2% or 24 of them being unemployed. The group with the highest labor force participation rate are those with the educational attainment of bachelor's degree or higher, with 96.7% or 148 individuals in the labor force. Within the labor force, individuals with college / associate degree education have the highest percentage of unemployment, with 6.2% or 13 of them being unemployed.
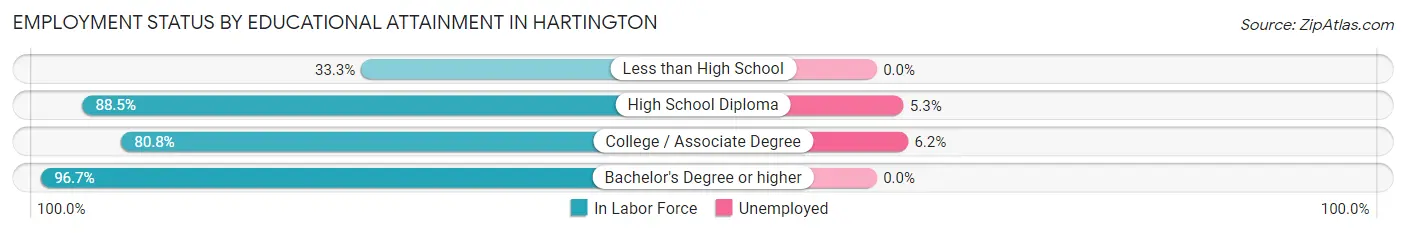
| Educational Attainment | In Labor Force | Unemployed |
| Less than High School | 2 (33.3%) | 0 (0.0%) |
| High School Diploma | 207 (88.5%) | 12 (5.3%) |
| College / Associate Degree | 211 (80.8%) | 16 (6.2%) |
| Bachelor's Degree or higher | 148 (96.7%) | 0 (0.0%) |
| Total | 568 (86.9%) | 27 (4.2%) |
Employment Occupations by Sex in Hartington
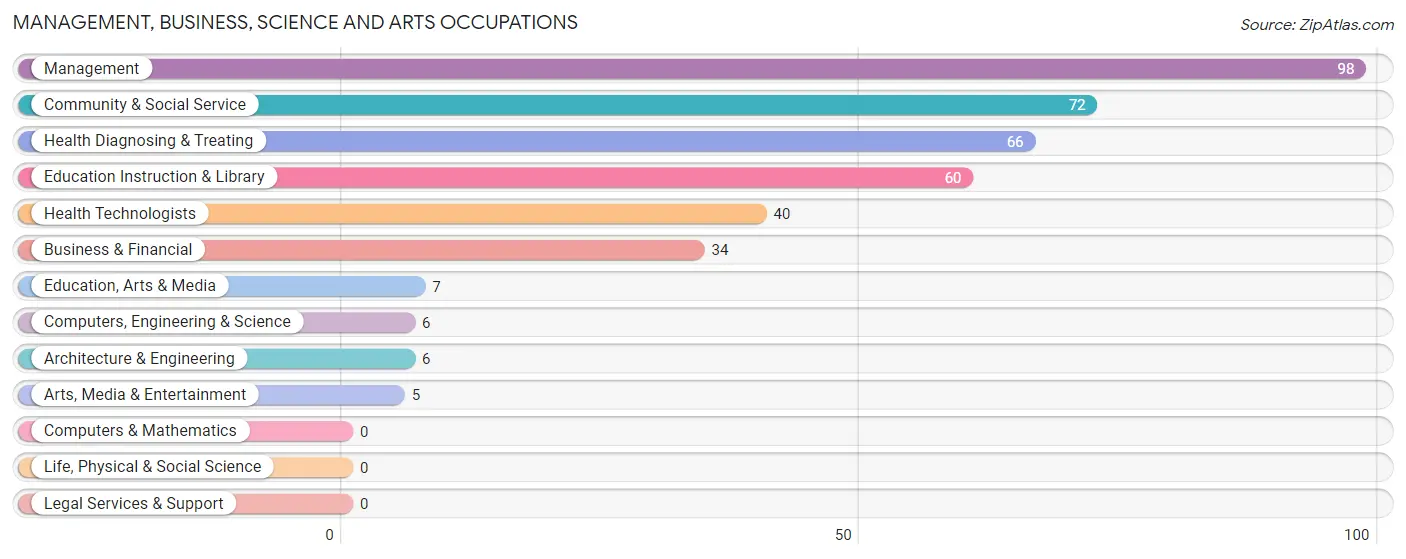
Management, Business, Science and Arts Occupations
The most common Management, Business, Science and Arts occupations in Hartington are Management (98 | 13.2%), Community & Social Service (72 | 9.7%), Health Diagnosing & Treating (66 | 8.9%), Education Instruction & Library (60 | 8.1%), and Health Technologists (40 | 5.4%).
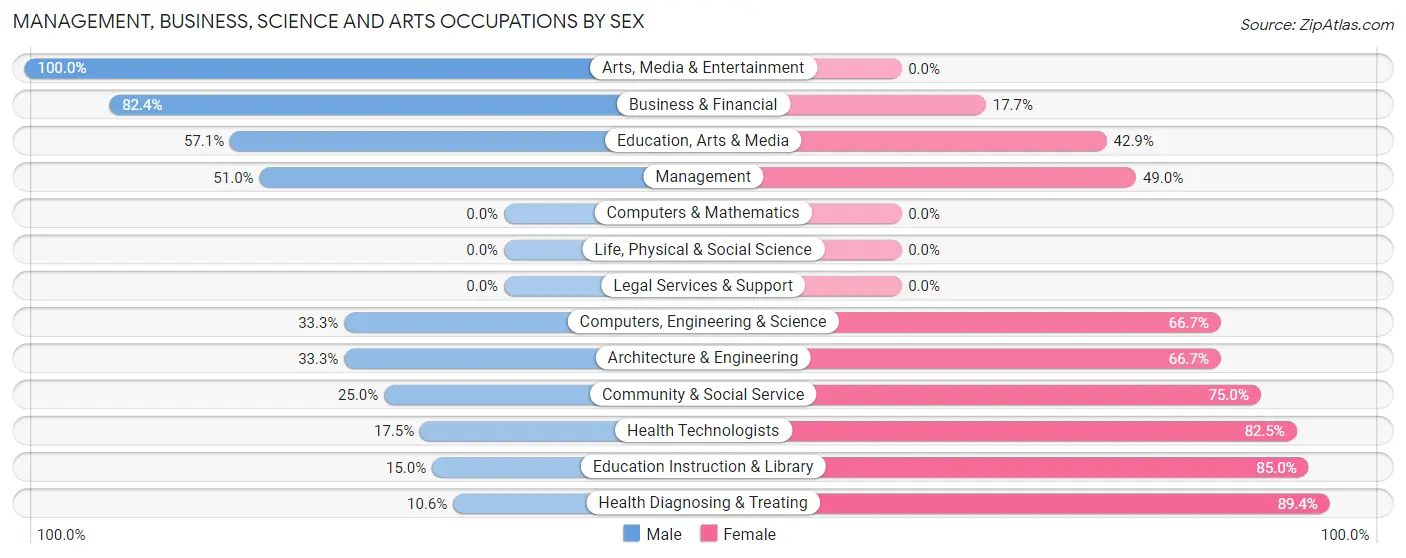
Management, Business, Science and Arts Occupations by Sex
Within the Management, Business, Science and Arts occupations in Hartington, the most male-oriented occupations are Arts, Media & Entertainment (100.0%), Business & Financial (82.4%), and Education, Arts & Media (57.1%), while the most female-oriented occupations are Health Diagnosing & Treating (89.4%), Education Instruction & Library (85.0%), and Health Technologists (82.5%).
| Occupation | Male | Female |
| Management | 50 (51.0%) | 48 (49.0%) |
| Business & Financial | 28 (82.4%) | 6 (17.6%) |
| Computers, Engineering & Science | 2 (33.3%) | 4 (66.7%) |
| Computers & Mathematics | 0 (0.0%) | 0 (0.0%) |
| Architecture & Engineering | 2 (33.3%) | 4 (66.7%) |
| Life, Physical & Social Science | 0 (0.0%) | 0 (0.0%) |
| Community & Social Service | 18 (25.0%) | 54 (75.0%) |
| Education, Arts & Media | 4 (57.1%) | 3 (42.9%) |
| Legal Services & Support | 0 (0.0%) | 0 (0.0%) |
| Education Instruction & Library | 9 (15.0%) | 51 (85.0%) |
| Arts, Media & Entertainment | 5 (100.0%) | 0 (0.0%) |
| Health Diagnosing & Treating | 7 (10.6%) | 59 (89.4%) |
| Health Technologists | 7 (17.5%) | 33 (82.5%) |
| Total (Category) | 105 (38.0%) | 171 (62.0%) |
| Total (Overall) | 391 (52.7%) | 351 (47.3%) |
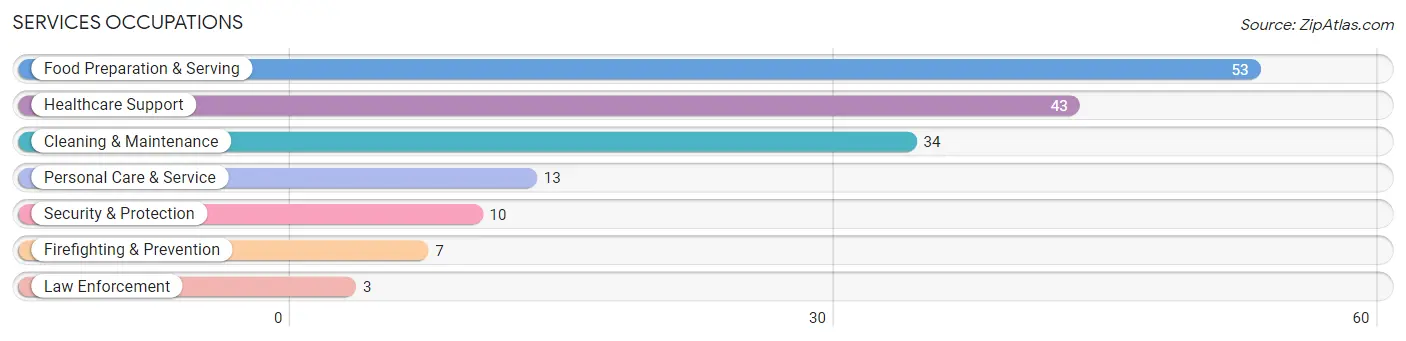
Services Occupations
The most common Services occupations in Hartington are Food Preparation & Serving (53 | 7.1%), Healthcare Support (43 | 5.8%), Cleaning & Maintenance (34 | 4.6%), Personal Care & Service (13 | 1.8%), and Security & Protection (10 | 1.3%).
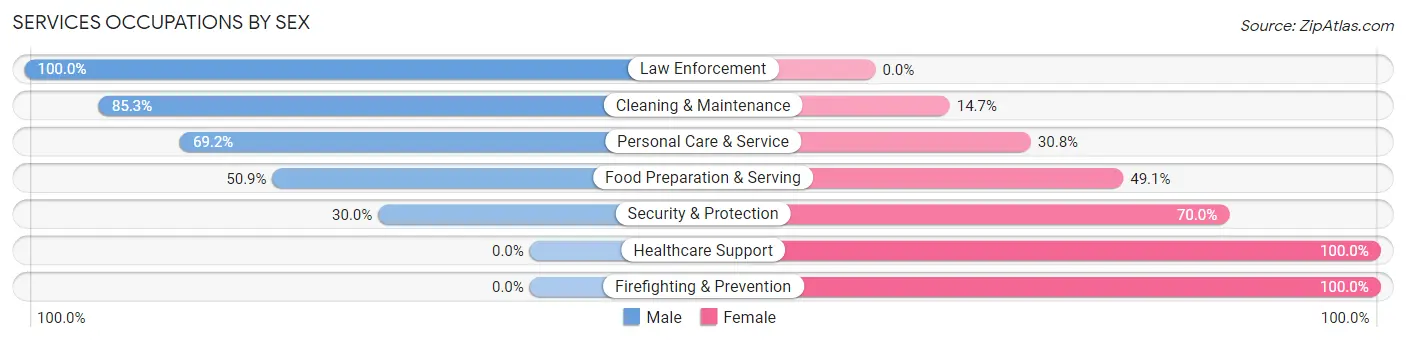
Services Occupations by Sex
Within the Services occupations in Hartington, the most male-oriented occupations are Law Enforcement (100.0%), Cleaning & Maintenance (85.3%), and Personal Care & Service (69.2%), while the most female-oriented occupations are Healthcare Support (100.0%), Firefighting & Prevention (100.0%), and Security & Protection (70.0%).
| Occupation | Male | Female |
| Healthcare Support | 0 (0.0%) | 43 (100.0%) |
| Security & Protection | 3 (30.0%) | 7 (70.0%) |
| Firefighting & Prevention | 0 (0.0%) | 7 (100.0%) |
| Law Enforcement | 3 (100.0%) | 0 (0.0%) |
| Food Preparation & Serving | 27 (50.9%) | 26 (49.1%) |
| Cleaning & Maintenance | 29 (85.3%) | 5 (14.7%) |
| Personal Care & Service | 9 (69.2%) | 4 (30.8%) |
| Total (Category) | 68 (44.4%) | 85 (55.6%) |
| Total (Overall) | 391 (52.7%) | 351 (47.3%) |
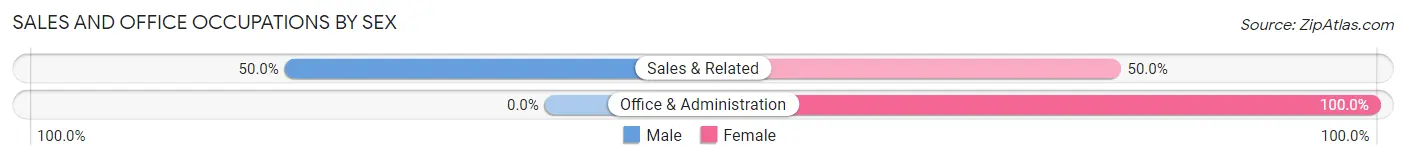
Sales and Office Occupations
The most common Sales and Office occupations in Hartington are Office & Administration (55 | 7.4%), and Sales & Related (42 | 5.7%).
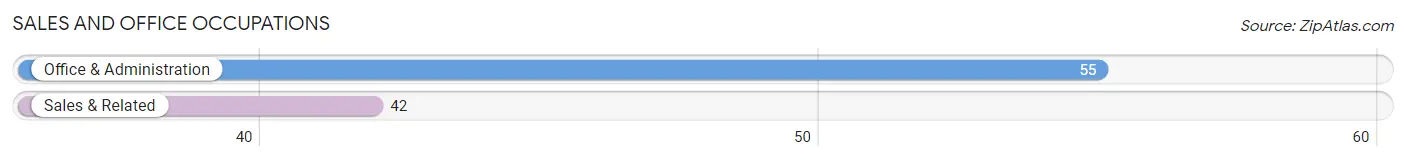
Sales and Office Occupations by Sex
| Occupation | Male | Female |
| Sales & Related | 21 (50.0%) | 21 (50.0%) |
| Office & Administration | 0 (0.0%) | 55 (100.0%) |
| Total (Category) | 21 (21.6%) | 76 (78.3%) |
| Total (Overall) | 391 (52.7%) | 351 (47.3%) |
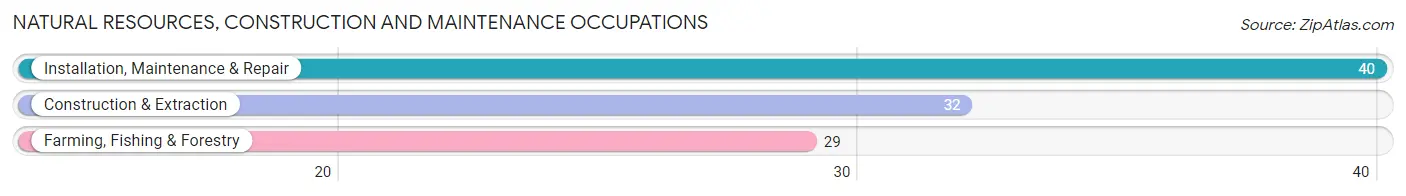
Natural Resources, Construction and Maintenance Occupations
The most common Natural Resources, Construction and Maintenance occupations in Hartington are Installation, Maintenance & Repair (40 | 5.4%), Construction & Extraction (32 | 4.3%), and Farming, Fishing & Forestry (29 | 3.9%).
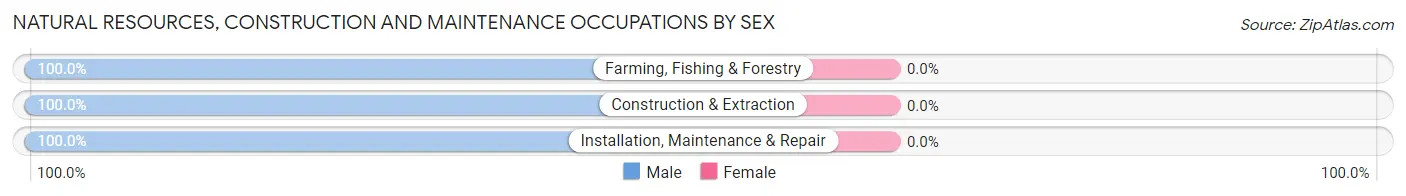
Natural Resources, Construction and Maintenance Occupations by Sex
| Occupation | Male | Female |
| Farming, Fishing & Forestry | 29 (100.0%) | 0 (0.0%) |
| Construction & Extraction | 32 (100.0%) | 0 (0.0%) |
| Installation, Maintenance & Repair | 40 (100.0%) | 0 (0.0%) |
| Total (Category) | 101 (100.0%) | 0 (0.0%) |
| Total (Overall) | 391 (52.7%) | 351 (47.3%) |
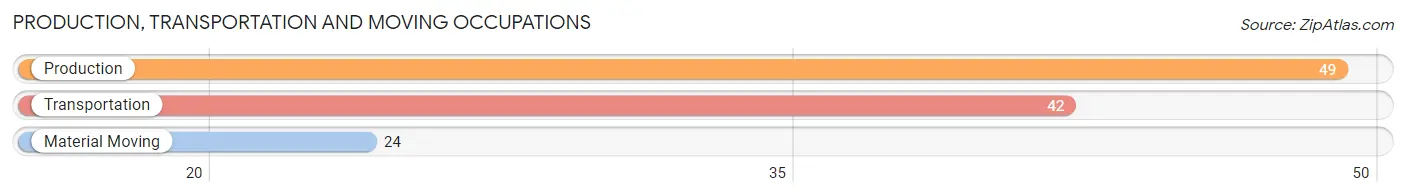
Production, Transportation and Moving Occupations
The most common Production, Transportation and Moving occupations in Hartington are Production (49 | 6.6%), Transportation (42 | 5.7%), and Material Moving (24 | 3.2%).
Production, Transportation and Moving Occupations by Sex
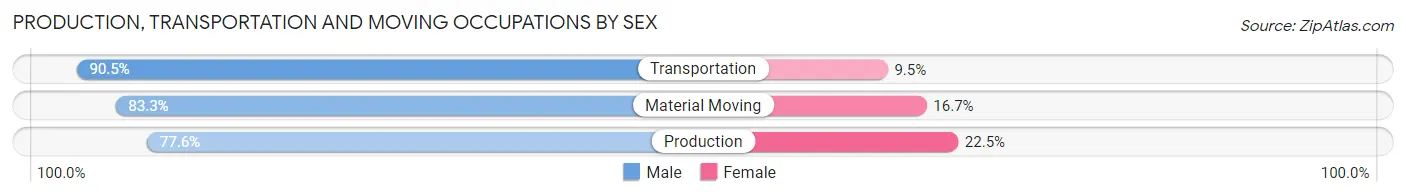
| Occupation | Male | Female |
| Production | 38 (77.5%) | 11 (22.5%) |
| Transportation | 38 (90.5%) | 4 (9.5%) |
| Material Moving | 20 (83.3%) | 4 (16.7%) |
| Total (Category) | 96 (83.5%) | 19 (16.5%) |
| Total (Overall) | 391 (52.7%) | 351 (47.3%) |
Employment Industries by Sex in Hartington
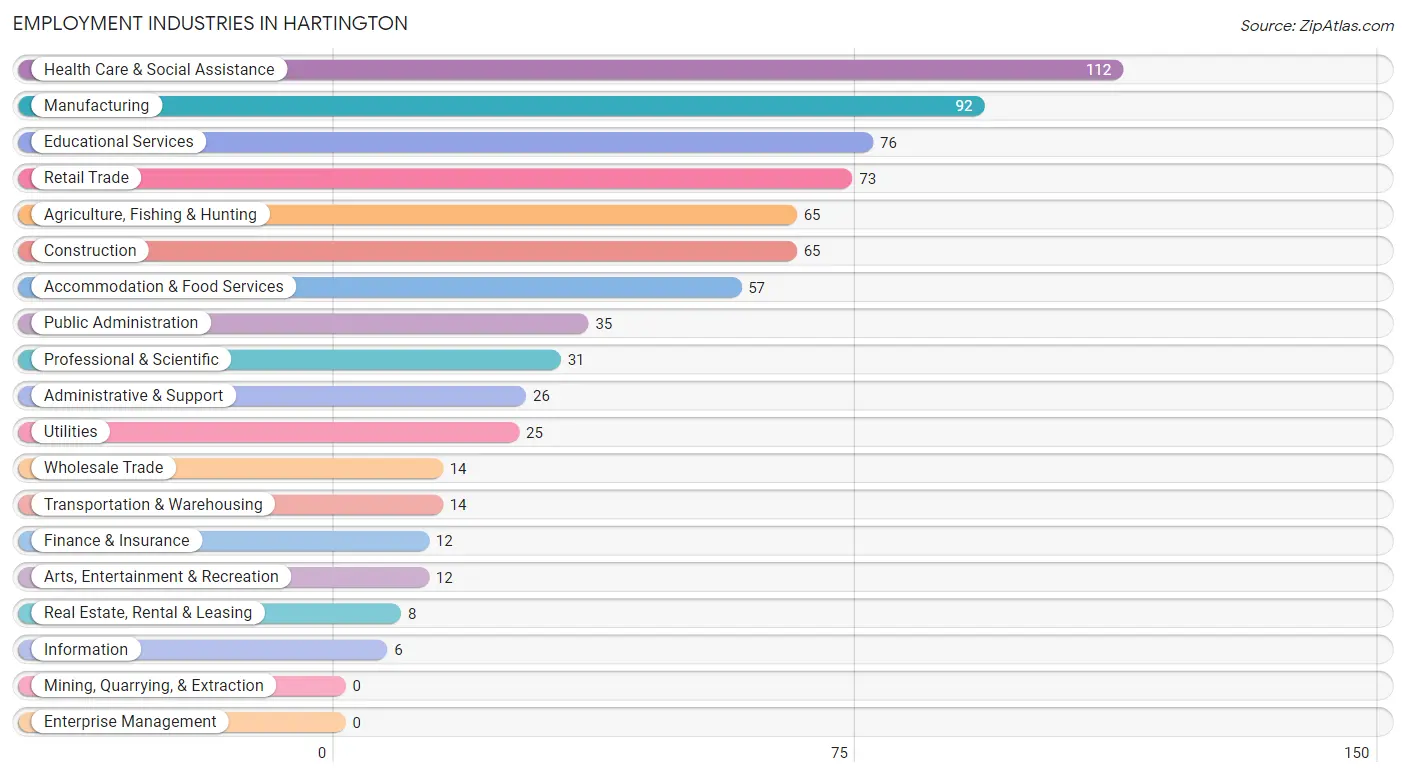
Employment Industries in Hartington
The major employment industries in Hartington include Health Care & Social Assistance (112 | 15.1%), Manufacturing (92 | 12.4%), Educational Services (76 | 10.2%), Retail Trade (73 | 9.8%), and Agriculture, Fishing & Hunting (65 | 8.8%).
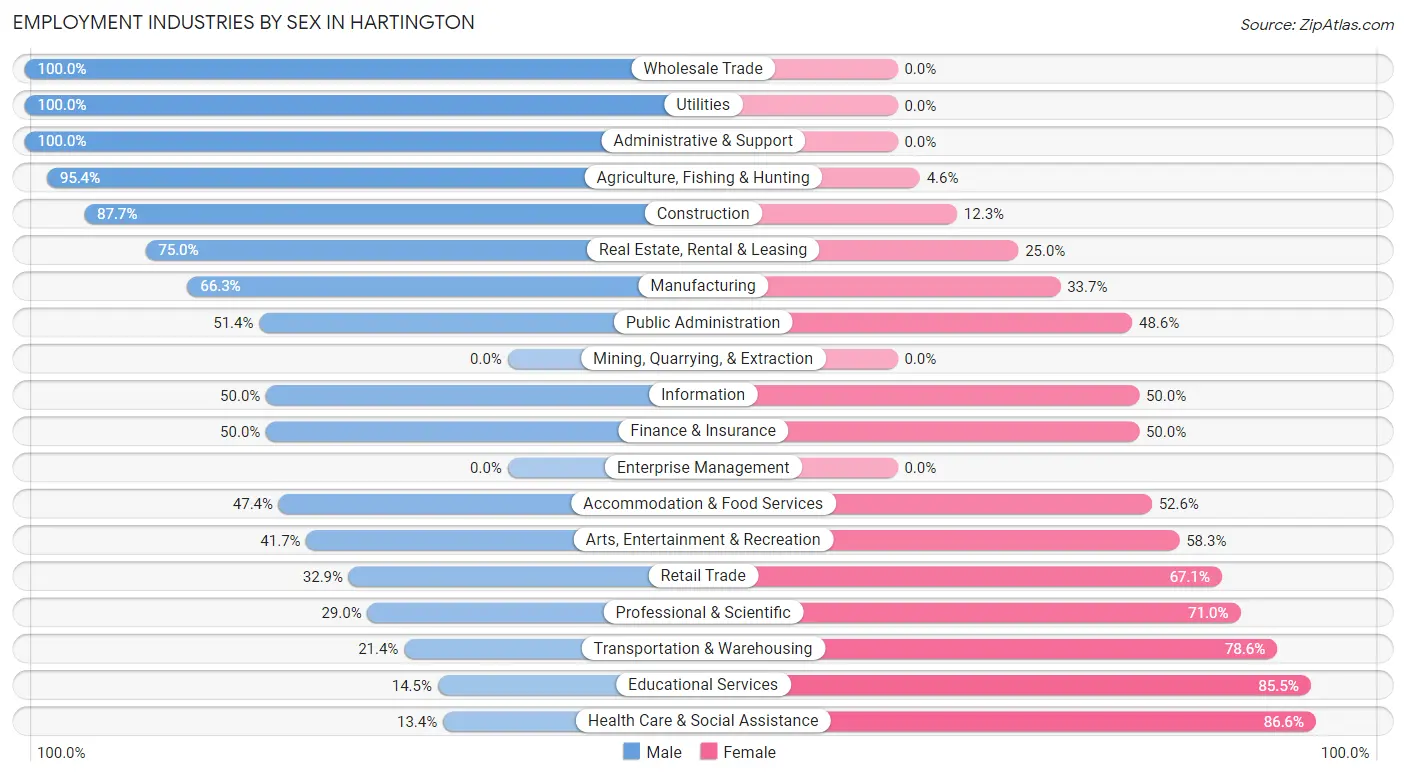
Employment Industries by Sex in Hartington
The Hartington industries that see more men than women are Wholesale Trade (100.0%), Utilities (100.0%), and Administrative & Support (100.0%), whereas the industries that tend to have a higher number of women are Health Care & Social Assistance (86.6%), Educational Services (85.5%), and Transportation & Warehousing (78.6%).
| Industry | Male | Female |
| Agriculture, Fishing & Hunting | 62 (95.4%) | 3 (4.6%) |
| Mining, Quarrying, & Extraction | 0 (0.0%) | 0 (0.0%) |
| Construction | 57 (87.7%) | 8 (12.3%) |
| Manufacturing | 61 (66.3%) | 31 (33.7%) |
| Wholesale Trade | 14 (100.0%) | 0 (0.0%) |
| Retail Trade | 24 (32.9%) | 49 (67.1%) |
| Transportation & Warehousing | 3 (21.4%) | 11 (78.6%) |
| Utilities | 25 (100.0%) | 0 (0.0%) |
| Information | 3 (50.0%) | 3 (50.0%) |
| Finance & Insurance | 6 (50.0%) | 6 (50.0%) |
| Real Estate, Rental & Leasing | 6 (75.0%) | 2 (25.0%) |
| Professional & Scientific | 9 (29.0%) | 22 (71.0%) |
| Enterprise Management | 0 (0.0%) | 0 (0.0%) |
| Administrative & Support | 26 (100.0%) | 0 (0.0%) |
| Educational Services | 11 (14.5%) | 65 (85.5%) |
| Health Care & Social Assistance | 15 (13.4%) | 97 (86.6%) |
| Arts, Entertainment & Recreation | 5 (41.7%) | 7 (58.3%) |
| Accommodation & Food Services | 27 (47.4%) | 30 (52.6%) |
| Public Administration | 18 (51.4%) | 17 (48.6%) |
| Total | 391 (52.7%) | 351 (47.3%) |
Education in Hartington
School Enrollment in Hartington
The most common levels of schooling among the 369 students in Hartington are high school (115 | 31.2%), middle school (78 | 21.1%), and elementary school (72 | 19.5%).
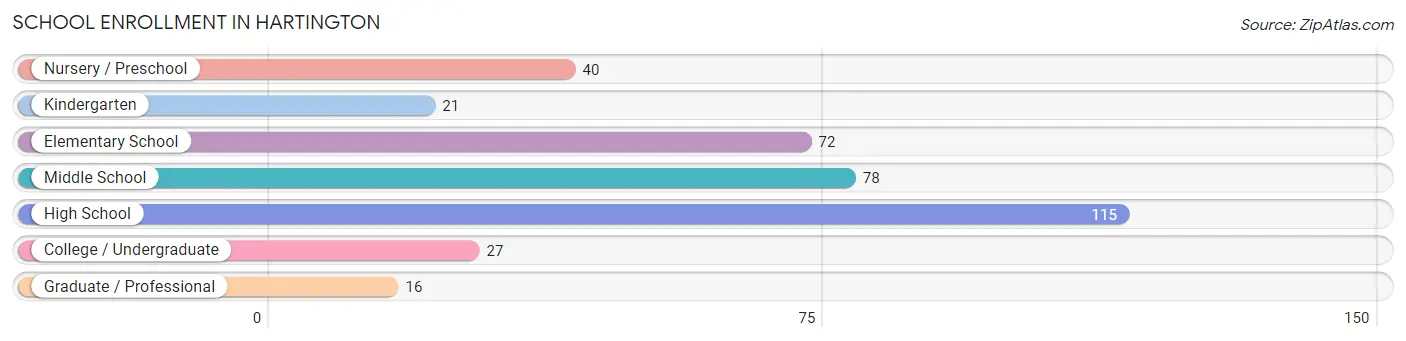
| School Level | # Students | % Students |
| Nursery / Preschool | 40 | 10.8% |
| Kindergarten | 21 | 5.7% |
| Elementary School | 72 | 19.5% |
| Middle School | 78 | 21.1% |
| High School | 115 | 31.2% |
| College / Undergraduate | 27 | 7.3% |
| Graduate / Professional | 16 | 4.3% |
| Total | 369 | 100.0% |
School Enrollment by Age by Funding Source in Hartington
Out of a total of 369 students who are enrolled in schools in Hartington, 104 (28.2%) attend a private institution, while the remaining 265 (71.8%) are enrolled in public schools. The age group of 25 to 34 year olds has the highest likelihood of being enrolled in private schools, with 2 (100.0% in the age bracket) enrolled. Conversely, the age group of 18 to 19 year olds has the lowest likelihood of being enrolled in a private school, with 10 (100.0% in the age bracket) attending a public institution.
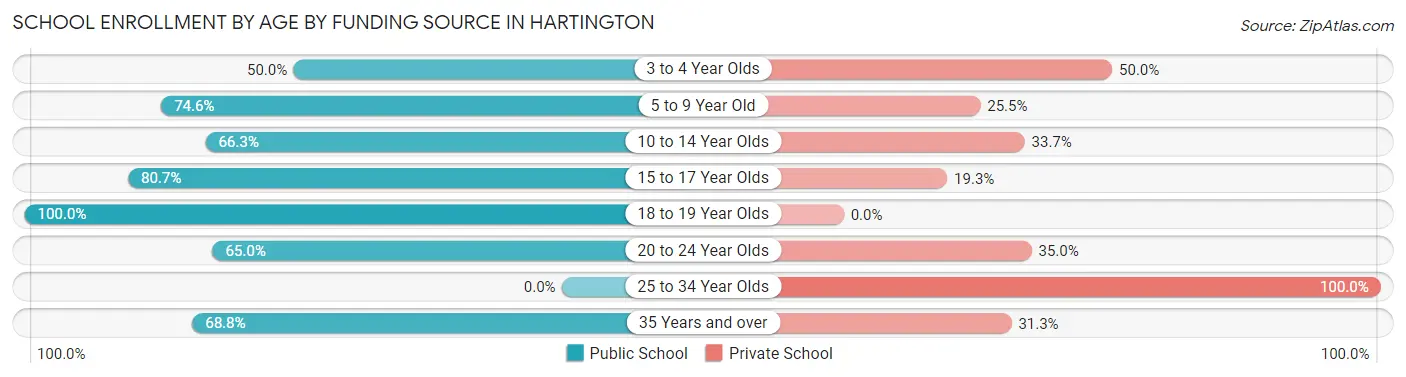
| Age Bracket | Public School | Private School |
| 3 to 4 Year Olds | 10 (50.0%) | 10 (50.0%) |
| 5 to 9 Year Old | 82 (74.6%) | 28 (25.5%) |
| 10 to 14 Year Olds | 61 (66.3%) | 31 (33.7%) |
| 15 to 17 Year Olds | 67 (80.7%) | 16 (19.3%) |
| 18 to 19 Year Olds | 10 (100.0%) | 0 (0.0%) |
| 20 to 24 Year Olds | 13 (65.0%) | 7 (35.0%) |
| 25 to 34 Year Olds | 0 (0.0%) | 2 (100.0%) |
| 35 Years and over | 22 (68.8%) | 10 (31.2%) |
| Total | 265 (71.8%) | 104 (28.2%) |
Educational Attainment by Field of Study in Hartington
Education (68 | 29.2%), business (51 | 21.9%), science & technology (40 | 17.2%), bio, nature & agricultural (25 | 10.7%), and arts & humanities (19 | 8.2%) are the most common fields of study among 233 individuals in Hartington who have obtained a bachelor's degree or higher.
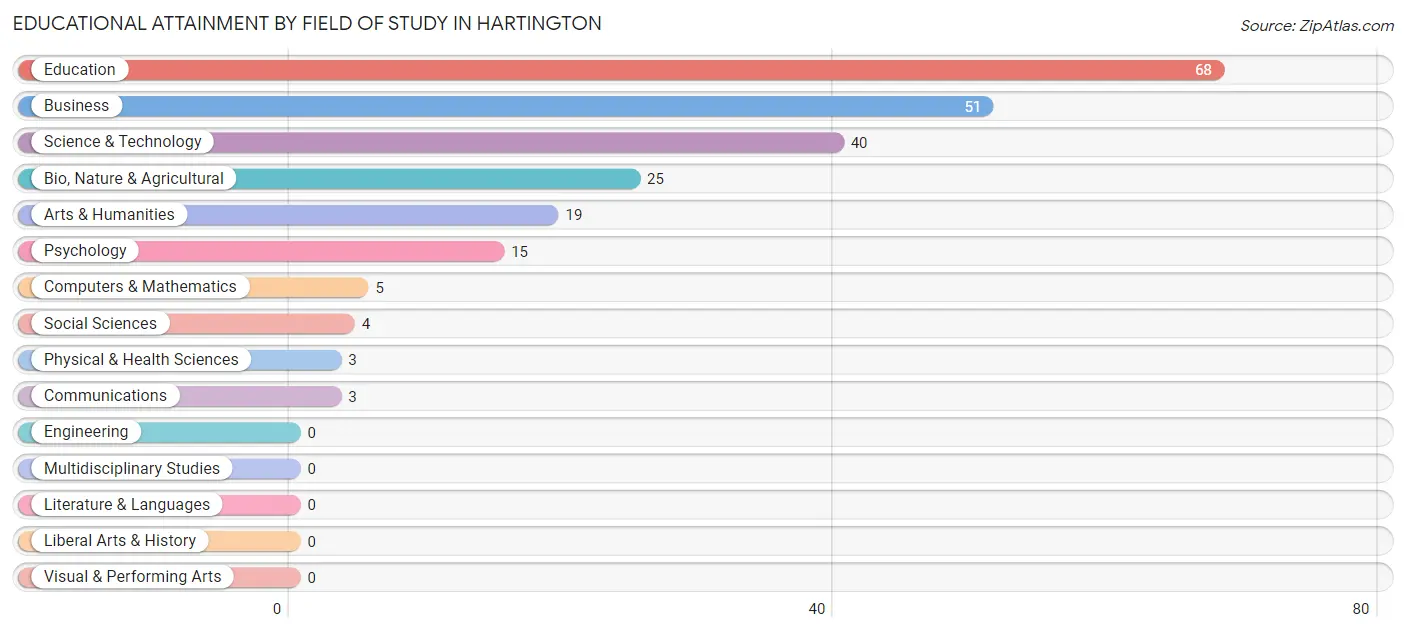
| Field of Study | # Graduates | % Graduates |
| Computers & Mathematics | 5 | 2.1% |
| Bio, Nature & Agricultural | 25 | 10.7% |
| Physical & Health Sciences | 3 | 1.3% |
| Psychology | 15 | 6.4% |
| Social Sciences | 4 | 1.7% |
| Engineering | 0 | 0.0% |
| Multidisciplinary Studies | 0 | 0.0% |
| Science & Technology | 40 | 17.2% |
| Business | 51 | 21.9% |
| Education | 68 | 29.2% |
| Literature & Languages | 0 | 0.0% |
| Liberal Arts & History | 0 | 0.0% |
| Visual & Performing Arts | 0 | 0.0% |
| Communications | 3 | 1.3% |
| Arts & Humanities | 19 | 8.2% |
| Total | 233 | 100.0% |
Transportation & Commute in Hartington
Vehicle Availability by Sex in Hartington
The most prevalent vehicle ownership categories in Hartington are males with 2 vehicles (158, accounting for 40.7%) and females with 2 vehicles (132, making up 45.5%).
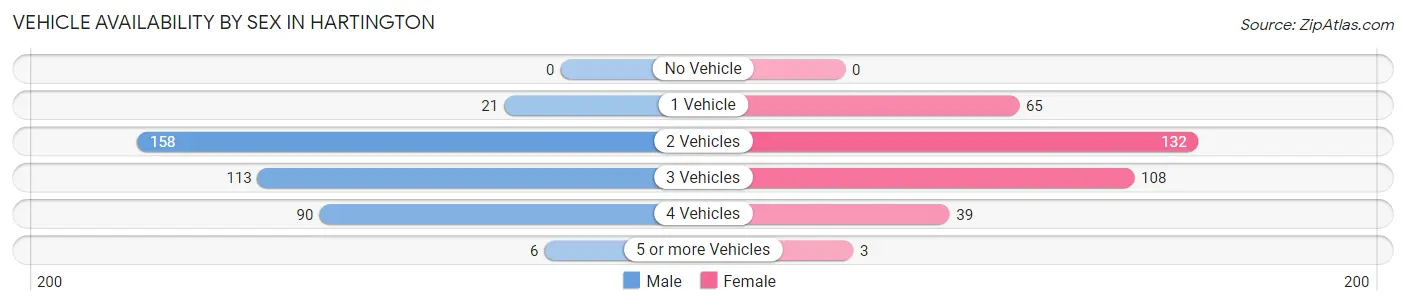
| Vehicles Available | Male | Female |
| No Vehicle | 0 (0.0%) | 0 (0.0%) |
| 1 Vehicle | 21 (5.4%) | 65 (18.7%) |
| 2 Vehicles | 158 (40.7%) | 132 (38.0%) |
| 3 Vehicles | 113 (29.1%) | 108 (31.1%) |
| 4 Vehicles | 90 (23.2%) | 39 (11.2%) |
| 5 or more Vehicles | 6 (1.5%) | 3 (0.9%) |
| Total | 388 (100.0%) | 347 (100.0%) |
Commute Time in Hartington
The most frequently occuring commute durations in Hartington are 5 to 9 minutes (208 commuters, 29.3%), less than 5 minutes (162 commuters, 22.9%), and 30 to 34 minutes (86 commuters, 12.1%).
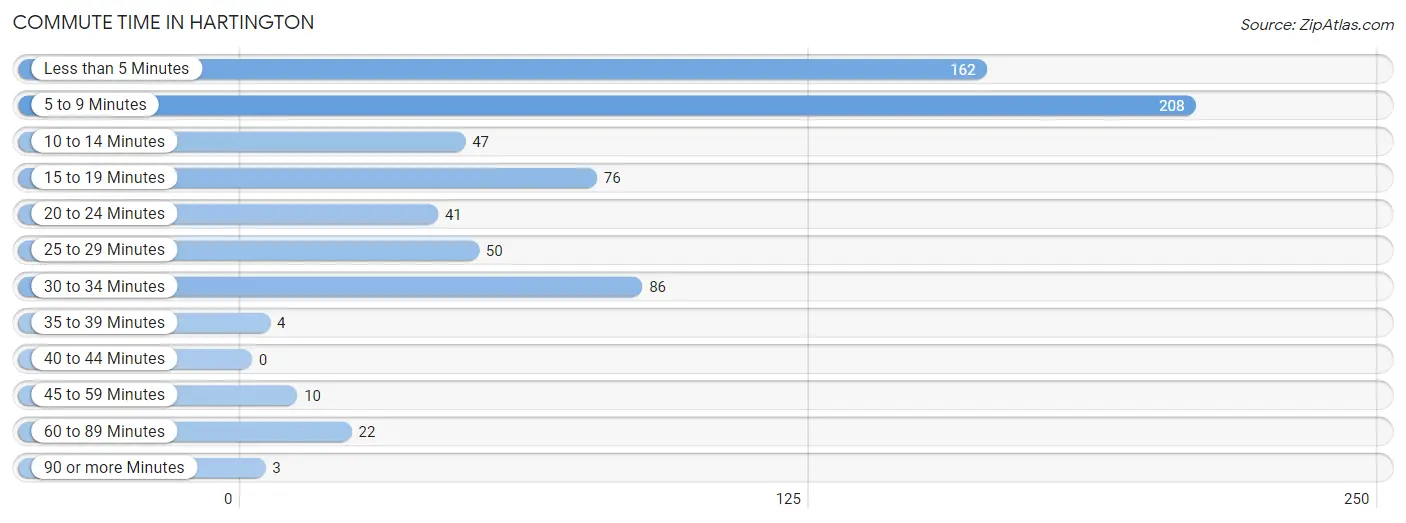
| Commute Time | # Commuters | % Commuters |
| Less than 5 Minutes | 162 | 22.9% |
| 5 to 9 Minutes | 208 | 29.3% |
| 10 to 14 Minutes | 47 | 6.6% |
| 15 to 19 Minutes | 76 | 10.7% |
| 20 to 24 Minutes | 41 | 5.8% |
| 25 to 29 Minutes | 50 | 7.0% |
| 30 to 34 Minutes | 86 | 12.1% |
| 35 to 39 Minutes | 4 | 0.6% |
| 40 to 44 Minutes | 0 | 0.0% |
| 45 to 59 Minutes | 10 | 1.4% |
| 60 to 89 Minutes | 22 | 3.1% |
| 90 or more Minutes | 3 | 0.4% |
Commute Time by Sex in Hartington
The most common commute times in Hartington are 5 to 9 minutes (100 commuters, 26.7%) for males and 5 to 9 minutes (108 commuters, 32.3%) for females.
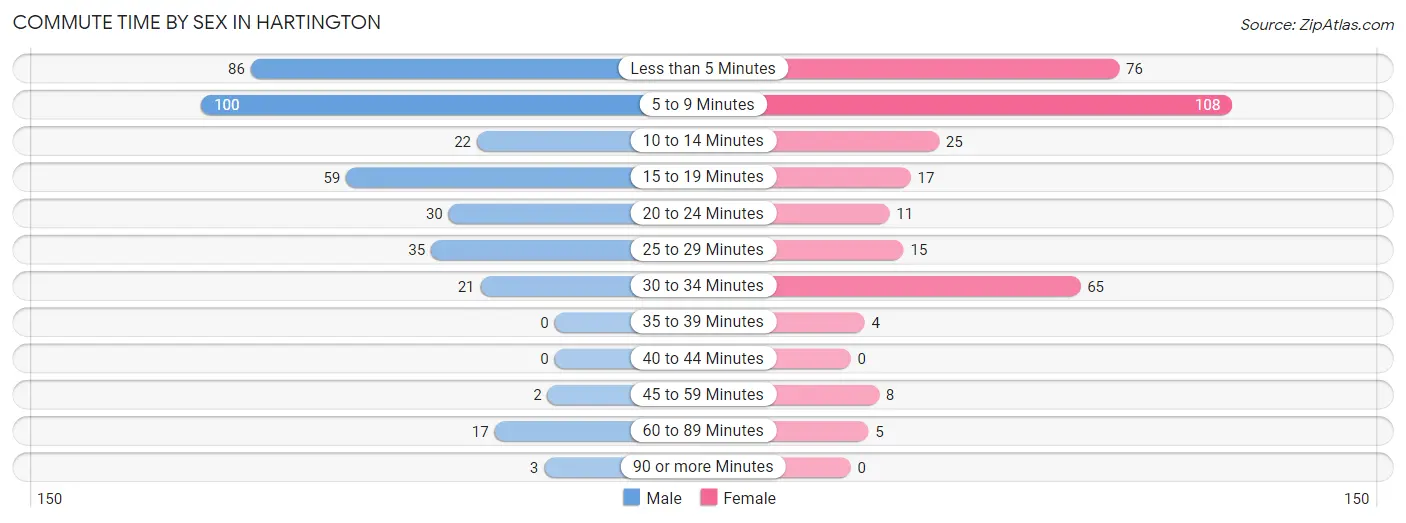
| Commute Time | Male | Female |
| Less than 5 Minutes | 86 (22.9%) | 76 (22.8%) |
| 5 to 9 Minutes | 100 (26.7%) | 108 (32.3%) |
| 10 to 14 Minutes | 22 (5.9%) | 25 (7.5%) |
| 15 to 19 Minutes | 59 (15.7%) | 17 (5.1%) |
| 20 to 24 Minutes | 30 (8.0%) | 11 (3.3%) |
| 25 to 29 Minutes | 35 (9.3%) | 15 (4.5%) |
| 30 to 34 Minutes | 21 (5.6%) | 65 (19.5%) |
| 35 to 39 Minutes | 0 (0.0%) | 4 (1.2%) |
| 40 to 44 Minutes | 0 (0.0%) | 0 (0.0%) |
| 45 to 59 Minutes | 2 (0.5%) | 8 (2.4%) |
| 60 to 89 Minutes | 17 (4.5%) | 5 (1.5%) |
| 90 or more Minutes | 3 (0.8%) | 0 (0.0%) |
Time of Departure to Work by Sex in Hartington
The most frequent times of departure to work in Hartington are 7:00 AM to 7:29 AM (87, 23.2%) for males and 7:30 AM to 7:59 AM (126, 37.7%) for females.
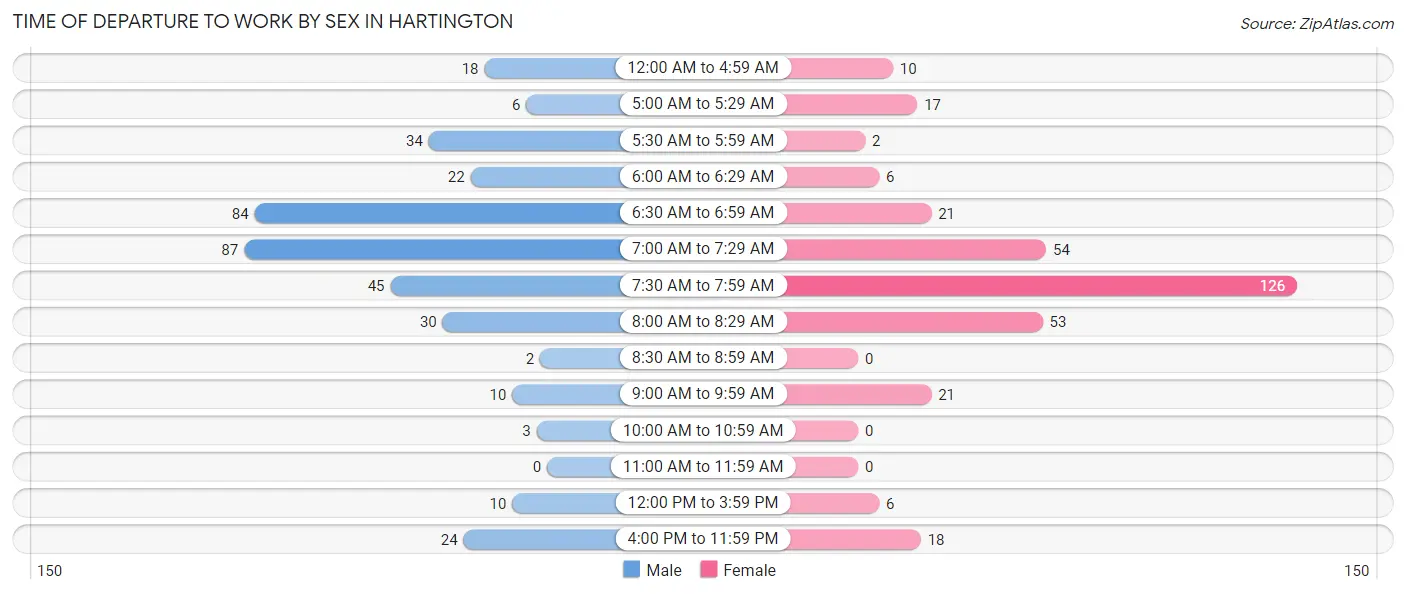
| Time of Departure | Male | Female |
| 12:00 AM to 4:59 AM | 18 (4.8%) | 10 (3.0%) |
| 5:00 AM to 5:29 AM | 6 (1.6%) | 17 (5.1%) |
| 5:30 AM to 5:59 AM | 34 (9.1%) | 2 (0.6%) |
| 6:00 AM to 6:29 AM | 22 (5.9%) | 6 (1.8%) |
| 6:30 AM to 6:59 AM | 84 (22.4%) | 21 (6.3%) |
| 7:00 AM to 7:29 AM | 87 (23.2%) | 54 (16.2%) |
| 7:30 AM to 7:59 AM | 45 (12.0%) | 126 (37.7%) |
| 8:00 AM to 8:29 AM | 30 (8.0%) | 53 (15.9%) |
| 8:30 AM to 8:59 AM | 2 (0.5%) | 0 (0.0%) |
| 9:00 AM to 9:59 AM | 10 (2.7%) | 21 (6.3%) |
| 10:00 AM to 10:59 AM | 3 (0.8%) | 0 (0.0%) |
| 11:00 AM to 11:59 AM | 0 (0.0%) | 0 (0.0%) |
| 12:00 PM to 3:59 PM | 10 (2.7%) | 6 (1.8%) |
| 4:00 PM to 11:59 PM | 24 (6.4%) | 18 (5.4%) |
| Total | 375 (100.0%) | 334 (100.0%) |
Housing Occupancy in Hartington
Occupancy by Ownership in Hartington
Of the total 648 dwellings in Hartington, owner-occupied units account for 567 (87.5%), while renter-occupied units make up 81 (12.5%).
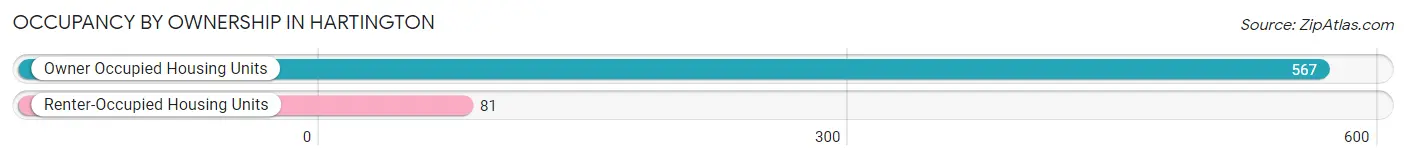
| Occupancy | # Housing Units | % Housing Units |
| Owner Occupied Housing Units | 567 | 87.5% |
| Renter-Occupied Housing Units | 81 | 12.5% |
| Total Occupied Housing Units | 648 | 100.0% |
Occupancy by Household Size in Hartington
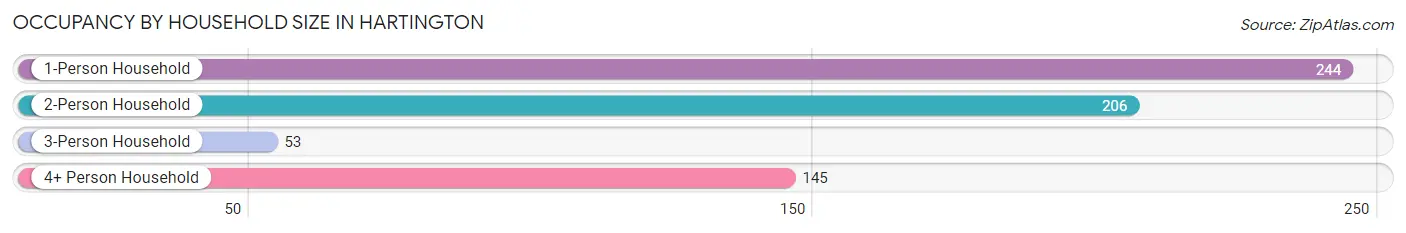
| Household Size | # Housing Units | % Housing Units |
| 1-Person Household | 244 | 37.7% |
| 2-Person Household | 206 | 31.8% |
| 3-Person Household | 53 | 8.2% |
| 4+ Person Household | 145 | 22.4% |
| Total Housing Units | 648 | 100.0% |
Occupancy by Ownership by Household Size in Hartington
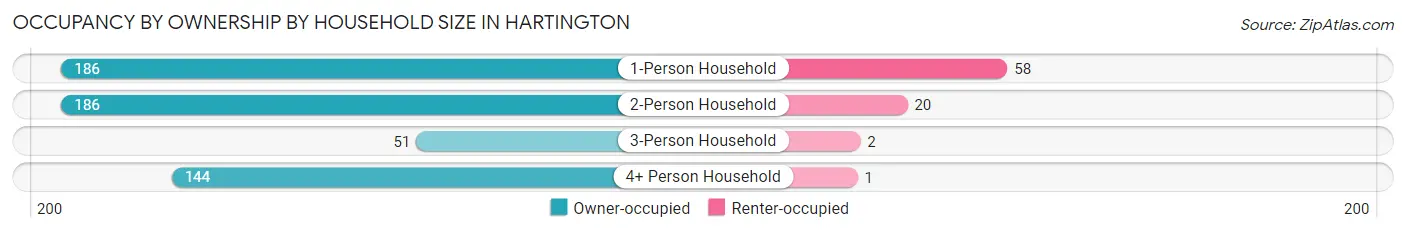
| Household Size | Owner-occupied | Renter-occupied |
| 1-Person Household | 186 (76.2%) | 58 (23.8%) |
| 2-Person Household | 186 (90.3%) | 20 (9.7%) |
| 3-Person Household | 51 (96.2%) | 2 (3.8%) |
| 4+ Person Household | 144 (99.3%) | 1 (0.7%) |
| Total Housing Units | 567 (87.5%) | 81 (12.5%) |
Occupancy by Educational Attainment in Hartington
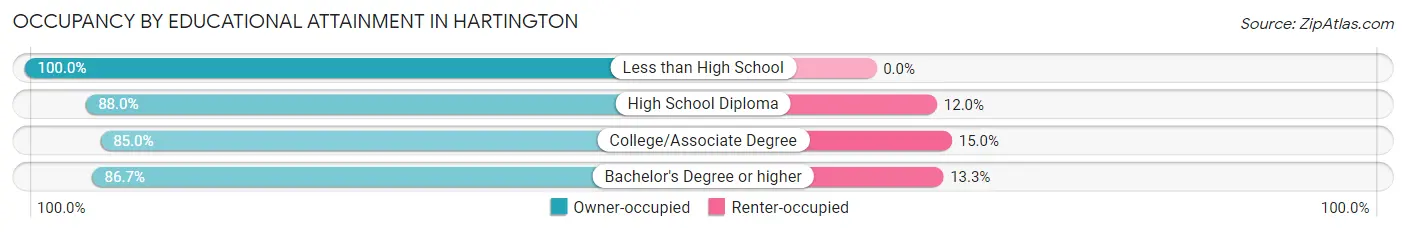
| Household Size | Owner-occupied | Renter-occupied |
| Less than High School | 34 (100.0%) | 0 (0.0%) |
| High School Diploma | 256 (88.0%) | 35 (12.0%) |
| College/Associate Degree | 153 (85.0%) | 27 (15.0%) |
| Bachelor's Degree or higher | 124 (86.7%) | 19 (13.3%) |
Occupancy by Age of Householder in Hartington
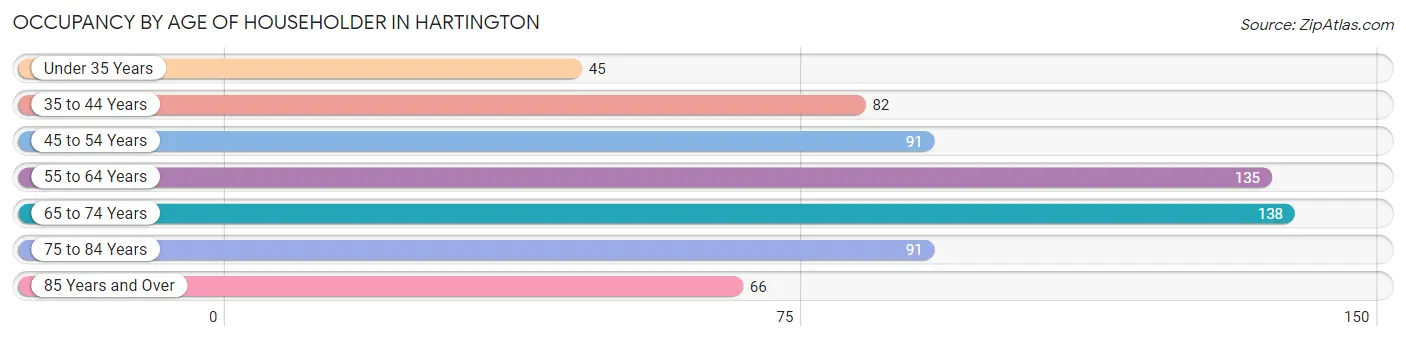
| Age Bracket | # Households | % Households |
| Under 35 Years | 45 | 6.9% |
| 35 to 44 Years | 82 | 12.7% |
| 45 to 54 Years | 91 | 14.0% |
| 55 to 64 Years | 135 | 20.8% |
| 65 to 74 Years | 138 | 21.3% |
| 75 to 84 Years | 91 | 14.0% |
| 85 Years and Over | 66 | 10.2% |
| Total | 648 | 100.0% |
Housing Finances in Hartington
Median Income by Occupancy in Hartington
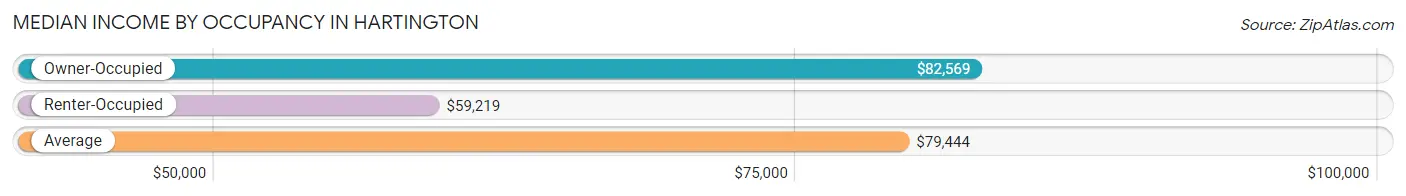
| Occupancy Type | # Households | Median Income |
| Owner-Occupied | 567 (87.5%) | $82,569 |
| Renter-Occupied | 81 (12.5%) | $59,219 |
| Average | 648 (100.0%) | $79,444 |
Occupancy by Householder Income Bracket in Hartington
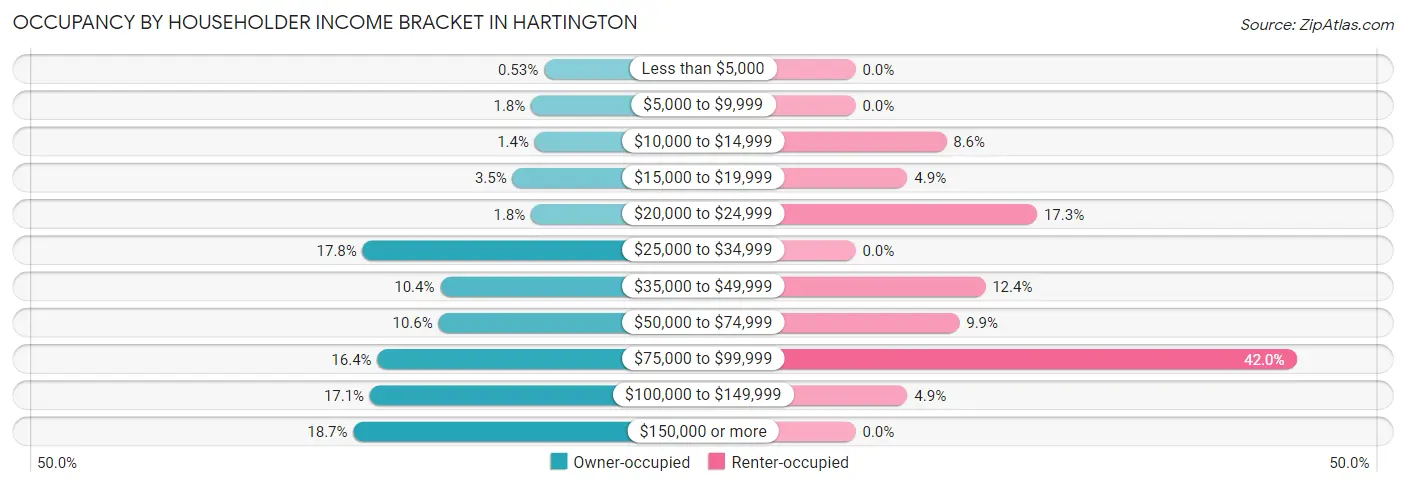
| Income Bracket | Owner-occupied | Renter-occupied |
| Less than $5,000 | 3 (0.5%) | 0 (0.0%) |
| $5,000 to $9,999 | 10 (1.8%) | 0 (0.0%) |
| $10,000 to $14,999 | 8 (1.4%) | 7 (8.6%) |
| $15,000 to $19,999 | 20 (3.5%) | 4 (4.9%) |
| $20,000 to $24,999 | 10 (1.8%) | 14 (17.3%) |
| $25,000 to $34,999 | 101 (17.8%) | 0 (0.0%) |
| $35,000 to $49,999 | 59 (10.4%) | 10 (12.3%) |
| $50,000 to $74,999 | 60 (10.6%) | 8 (9.9%) |
| $75,000 to $99,999 | 93 (16.4%) | 34 (42.0%) |
| $100,000 to $149,999 | 97 (17.1%) | 4 (4.9%) |
| $150,000 or more | 106 (18.7%) | 0 (0.0%) |
| Total | 567 (100.0%) | 81 (100.0%) |
Monthly Housing Cost Tiers in Hartington
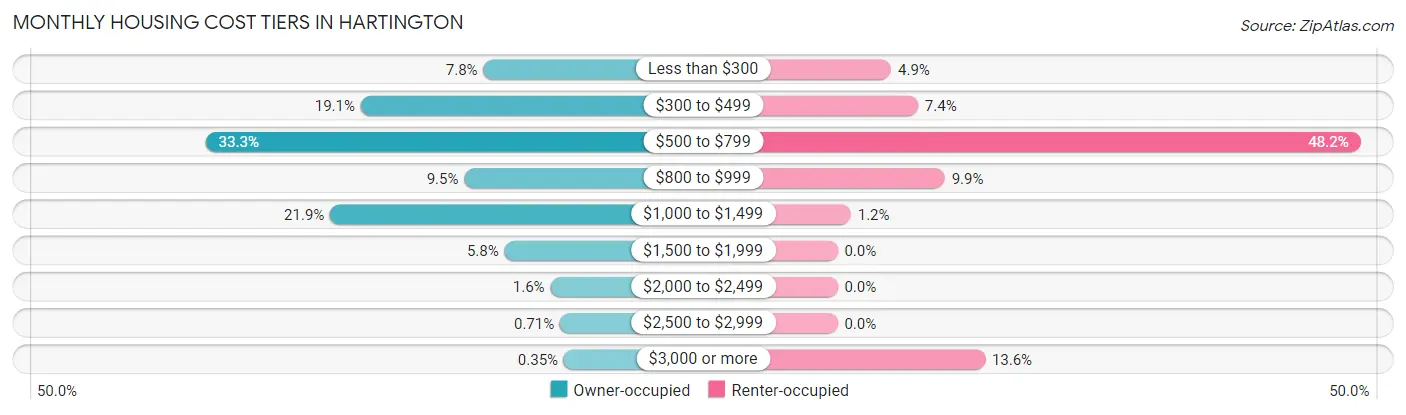
| Monthly Cost | Owner-occupied | Renter-occupied |
| Less than $300 | 44 (7.8%) | 4 (4.9%) |
| $300 to $499 | 108 (19.1%) | 6 (7.4%) |
| $500 to $799 | 189 (33.3%) | 39 (48.1%) |
| $800 to $999 | 54 (9.5%) | 8 (9.9%) |
| $1,000 to $1,499 | 124 (21.9%) | 1 (1.2%) |
| $1,500 to $1,999 | 33 (5.8%) | 0 (0.0%) |
| $2,000 to $2,499 | 9 (1.6%) | 0 (0.0%) |
| $2,500 to $2,999 | 4 (0.7%) | 0 (0.0%) |
| $3,000 or more | 2 (0.4%) | 11 (13.6%) |
| Total | 567 (100.0%) | 81 (100.0%) |
Physical Housing Characteristics in Hartington
Housing Structures in Hartington
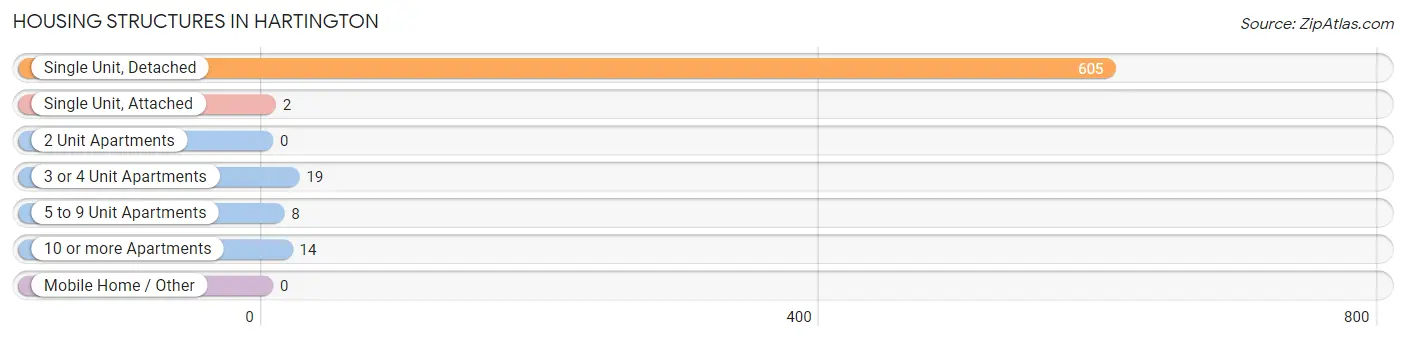
| Structure Type | # Housing Units | % Housing Units |
| Single Unit, Detached | 605 | 93.4% |
| Single Unit, Attached | 2 | 0.3% |
| 2 Unit Apartments | 0 | 0.0% |
| 3 or 4 Unit Apartments | 19 | 2.9% |
| 5 to 9 Unit Apartments | 8 | 1.2% |
| 10 or more Apartments | 14 | 2.2% |
| Mobile Home / Other | 0 | 0.0% |
| Total | 648 | 100.0% |
Housing Structures by Occupancy in Hartington
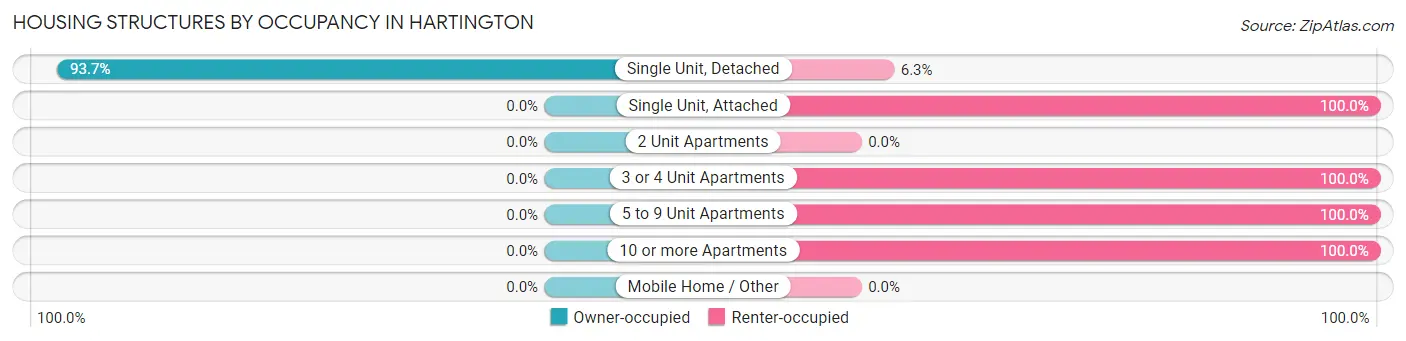
| Structure Type | Owner-occupied | Renter-occupied |
| Single Unit, Detached | 567 (93.7%) | 38 (6.3%) |
| Single Unit, Attached | 0 (0.0%) | 2 (100.0%) |
| 2 Unit Apartments | 0 (0.0%) | 0 (0.0%) |
| 3 or 4 Unit Apartments | 0 (0.0%) | 19 (100.0%) |
| 5 to 9 Unit Apartments | 0 (0.0%) | 8 (100.0%) |
| 10 or more Apartments | 0 (0.0%) | 14 (100.0%) |
| Mobile Home / Other | 0 (0.0%) | 0 (0.0%) |
| Total | 567 (87.5%) | 81 (12.5%) |
Housing Structures by Number of Rooms in Hartington
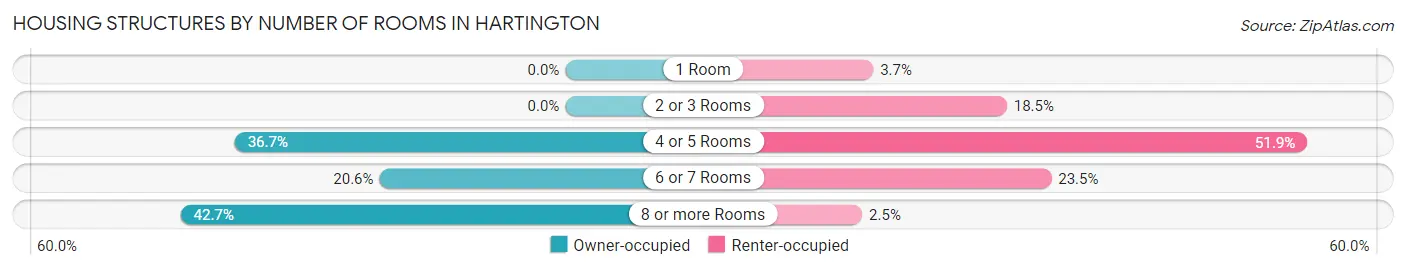
| Number of Rooms | Owner-occupied | Renter-occupied |
| 1 Room | 0 (0.0%) | 3 (3.7%) |
| 2 or 3 Rooms | 0 (0.0%) | 15 (18.5%) |
| 4 or 5 Rooms | 208 (36.7%) | 42 (51.8%) |
| 6 or 7 Rooms | 117 (20.6%) | 19 (23.5%) |
| 8 or more Rooms | 242 (42.7%) | 2 (2.5%) |
| Total | 567 (100.0%) | 81 (100.0%) |
Housing Structure by Heating Type in Hartington
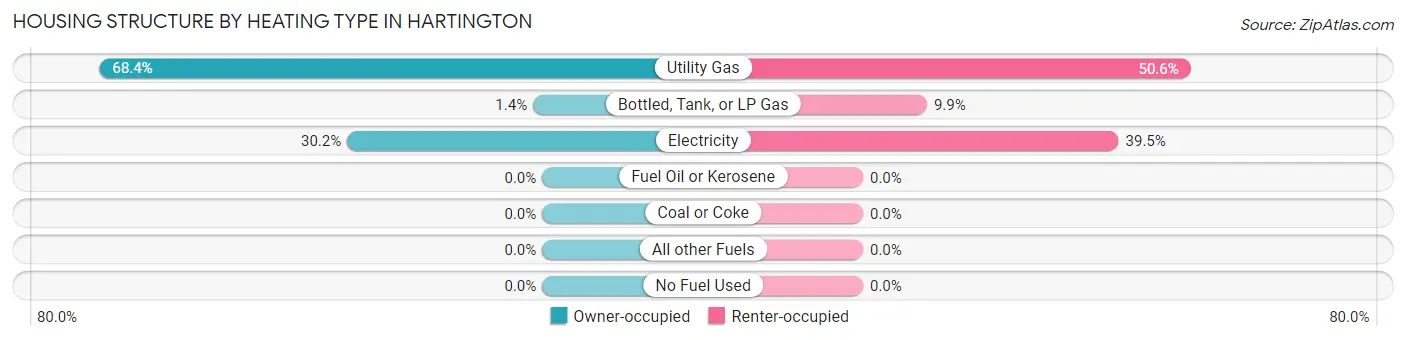
| Heating Type | Owner-occupied | Renter-occupied |
| Utility Gas | 388 (68.4%) | 41 (50.6%) |
| Bottled, Tank, or LP Gas | 8 (1.4%) | 8 (9.9%) |
| Electricity | 171 (30.2%) | 32 (39.5%) |
| Fuel Oil or Kerosene | 0 (0.0%) | 0 (0.0%) |
| Coal or Coke | 0 (0.0%) | 0 (0.0%) |
| All other Fuels | 0 (0.0%) | 0 (0.0%) |
| No Fuel Used | 0 (0.0%) | 0 (0.0%) |
| Total | 567 (100.0%) | 81 (100.0%) |
Household Vehicle Usage in Hartington
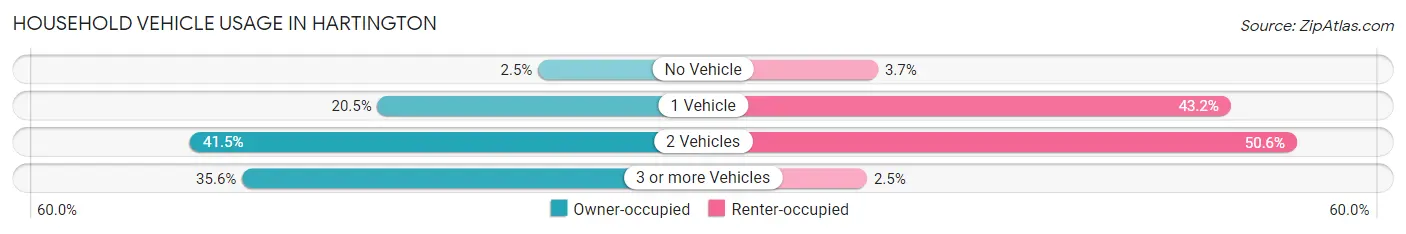
| Vehicles per Household | Owner-occupied | Renter-occupied |
| No Vehicle | 14 (2.5%) | 3 (3.7%) |
| 1 Vehicle | 116 (20.5%) | 35 (43.2%) |
| 2 Vehicles | 235 (41.4%) | 41 (50.6%) |
| 3 or more Vehicles | 202 (35.6%) | 2 (2.5%) |
| Total | 567 (100.0%) | 81 (100.0%) |
Real Estate & Mortgages in Hartington
Real Estate and Mortgage Overview in Hartington
| Characteristic | Without Mortgage | With Mortgage |
| Housing Units | 296 | 271 |
| Median Property Value | $142,900 | $159,400 |
| Median Household Income | $83,056 | $50 |
| Monthly Housing Costs | $495 | $0 |
| Real Estate Taxes | $1,696 | $22 |
Property Value by Mortgage Status in Hartington
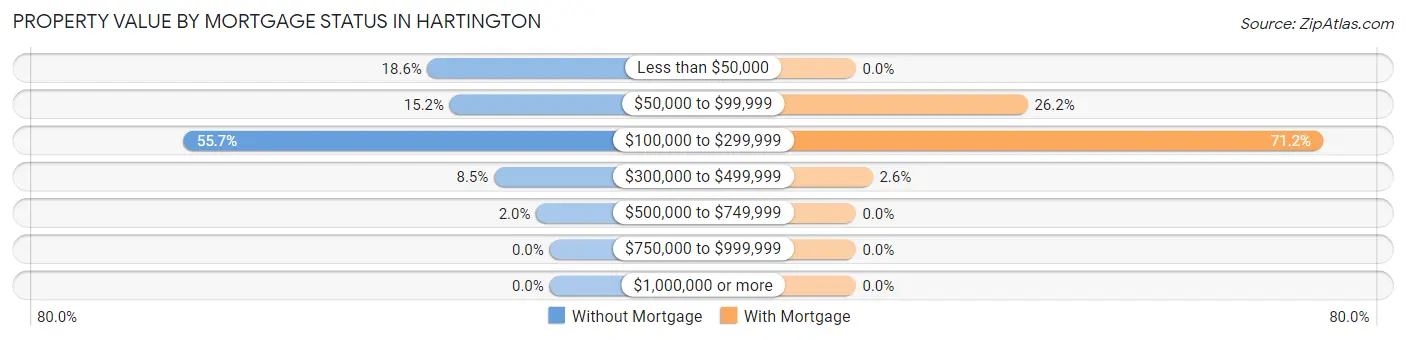
| Property Value | Without Mortgage | With Mortgage |
| Less than $50,000 | 55 (18.6%) | 0 (0.0%) |
| $50,000 to $99,999 | 45 (15.2%) | 71 (26.2%) |
| $100,000 to $299,999 | 165 (55.7%) | 193 (71.2%) |
| $300,000 to $499,999 | 25 (8.5%) | 7 (2.6%) |
| $500,000 to $749,999 | 6 (2.0%) | 0 (0.0%) |
| $750,000 to $999,999 | 0 (0.0%) | 0 (0.0%) |
| $1,000,000 or more | 0 (0.0%) | 0 (0.0%) |
| Total | 296 (100.0%) | 271 (100.0%) |
Household Income by Mortgage Status in Hartington
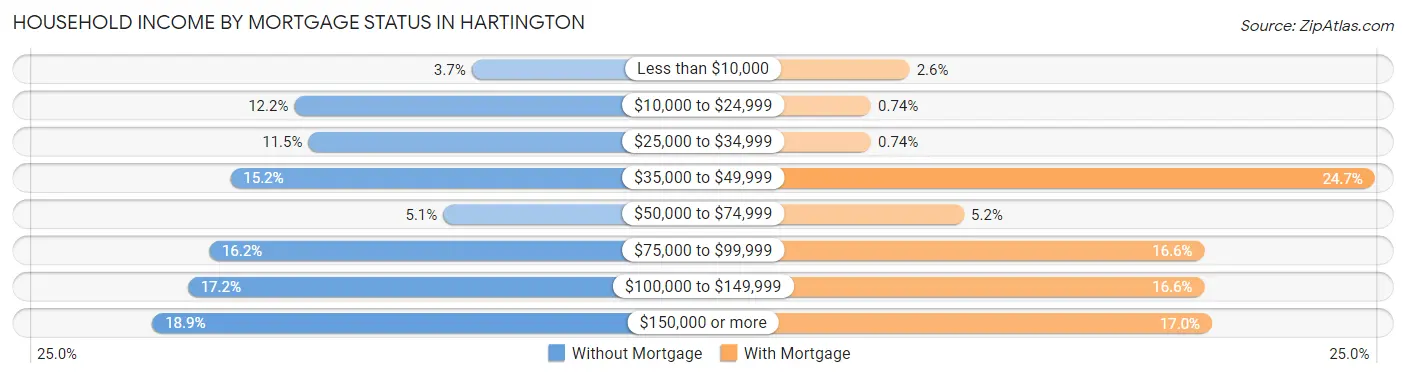
| Household Income | Without Mortgage | With Mortgage |
| Less than $10,000 | 11 (3.7%) | 7 (2.6%) |
| $10,000 to $24,999 | 36 (12.2%) | 2 (0.7%) |
| $25,000 to $34,999 | 34 (11.5%) | 2 (0.7%) |
| $35,000 to $49,999 | 45 (15.2%) | 67 (24.7%) |
| $50,000 to $74,999 | 15 (5.1%) | 14 (5.2%) |
| $75,000 to $99,999 | 48 (16.2%) | 45 (16.6%) |
| $100,000 to $149,999 | 51 (17.2%) | 45 (16.6%) |
| $150,000 or more | 56 (18.9%) | 46 (17.0%) |
| Total | 296 (100.0%) | 271 (100.0%) |
Property Value to Household Income Ratio in Hartington
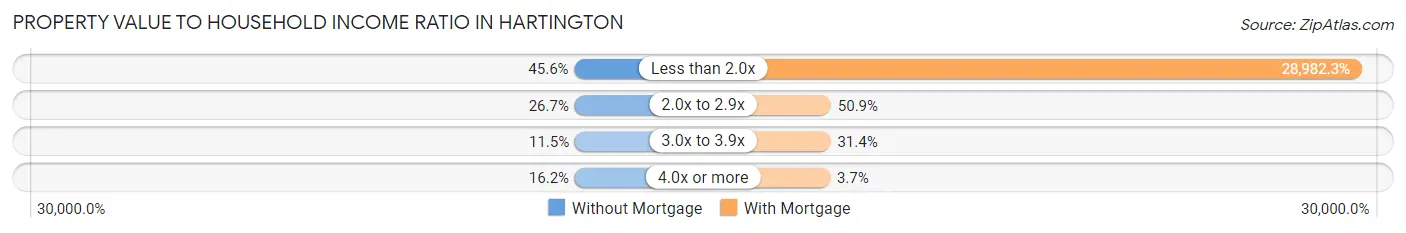
| Value-to-Income Ratio | Without Mortgage | With Mortgage |
| Less than 2.0x | 135 (45.6%) | 78,542 (28,982.3%) |
| 2.0x to 2.9x | 79 (26.7%) | 138 (50.9%) |
| 3.0x to 3.9x | 34 (11.5%) | 85 (31.4%) |
| 4.0x or more | 48 (16.2%) | 10 (3.7%) |
| Total | 296 (100.0%) | 271 (100.0%) |
Real Estate Taxes by Mortgage Status in Hartington
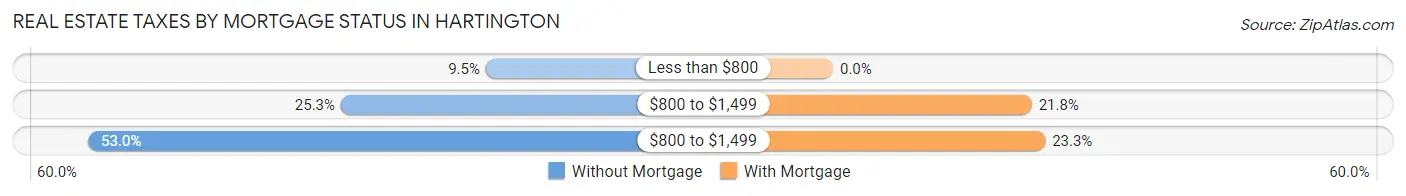
| Property Taxes | Without Mortgage | With Mortgage |
| Less than $800 | 28 (9.5%) | 0 (0.0%) |
| $800 to $1,499 | 75 (25.3%) | 59 (21.8%) |
| $800 to $1,499 | 157 (53.0%) | 63 (23.3%) |
| Total | 296 (100.0%) | 271 (100.0%) |
Health & Disability in Hartington
Health Insurance Coverage by Age in Hartington
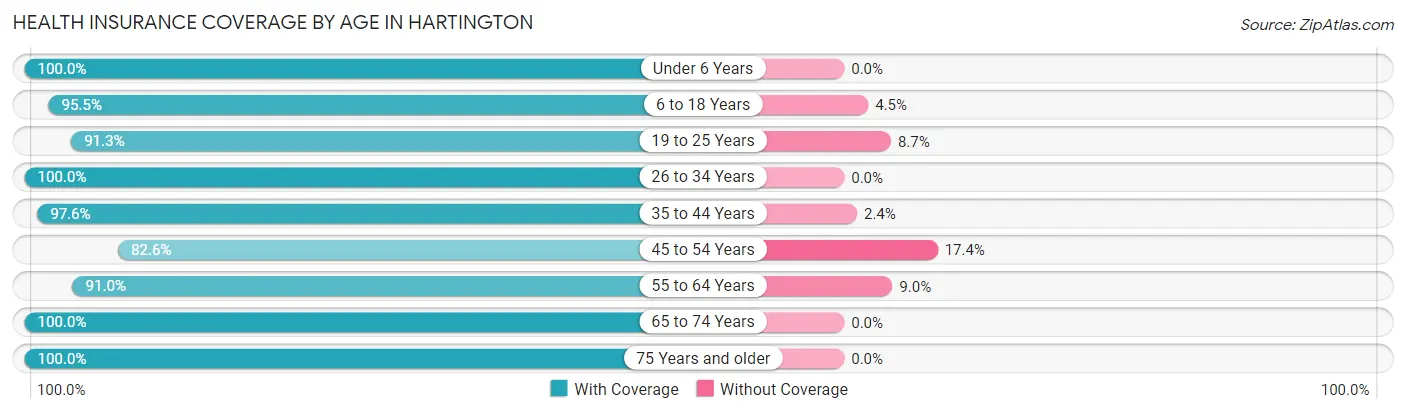
| Age Bracket | With Coverage | Without Coverage |
| Under 6 Years | 95 (100.0%) | 0 (0.0%) |
| 6 to 18 Years | 278 (95.5%) | 13 (4.5%) |
| 19 to 25 Years | 42 (91.3%) | 4 (8.7%) |
| 26 to 34 Years | 91 (100.0%) | 0 (0.0%) |
| 35 to 44 Years | 164 (97.6%) | 4 (2.4%) |
| 45 to 54 Years | 109 (82.6%) | 23 (17.4%) |
| 55 to 64 Years | 213 (91.0%) | 21 (9.0%) |
| 65 to 74 Years | 231 (100.0%) | 0 (0.0%) |
| 75 Years and older | 210 (100.0%) | 0 (0.0%) |
| Total | 1,433 (95.7%) | 65 (4.3%) |
Health Insurance Coverage by Citizenship Status in Hartington
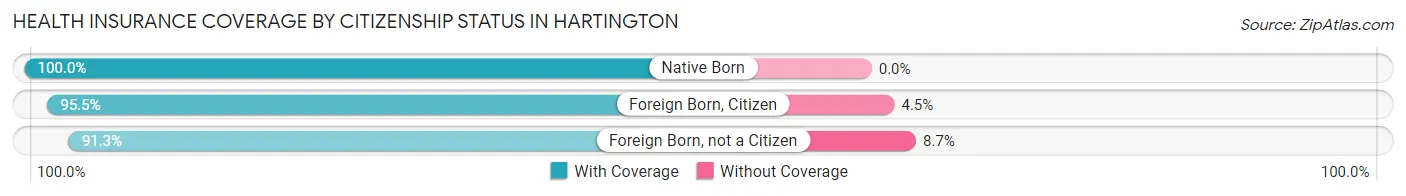
| Citizenship Status | With Coverage | Without Coverage |
| Native Born | 95 (100.0%) | 0 (0.0%) |
| Foreign Born, Citizen | 278 (95.5%) | 13 (4.5%) |
| Foreign Born, not a Citizen | 42 (91.3%) | 4 (8.7%) |
Health Insurance Coverage by Household Income in Hartington
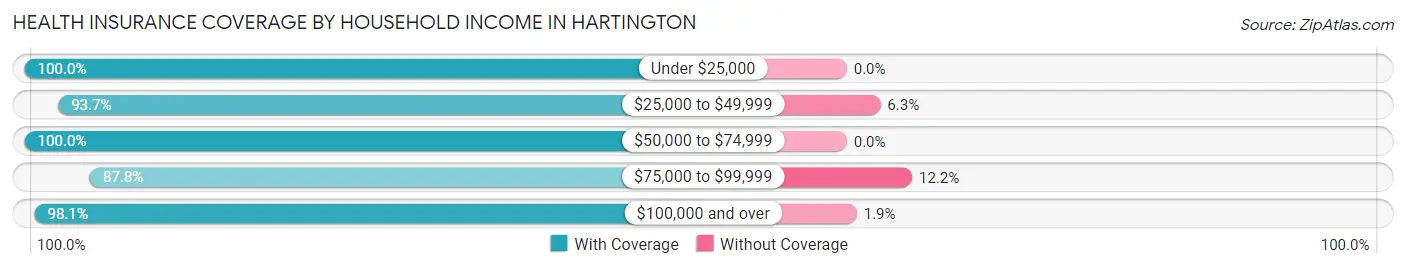
| Household Income | With Coverage | Without Coverage |
| Under $25,000 | 100 (100.0%) | 0 (0.0%) |
| $25,000 to $49,999 | 253 (93.7%) | 17 (6.3%) |
| $50,000 to $74,999 | 146 (100.0%) | 0 (0.0%) |
| $75,000 to $99,999 | 251 (87.8%) | 35 (12.2%) |
| $100,000 and over | 683 (98.1%) | 13 (1.9%) |
Public vs Private Health Insurance Coverage by Age in Hartington
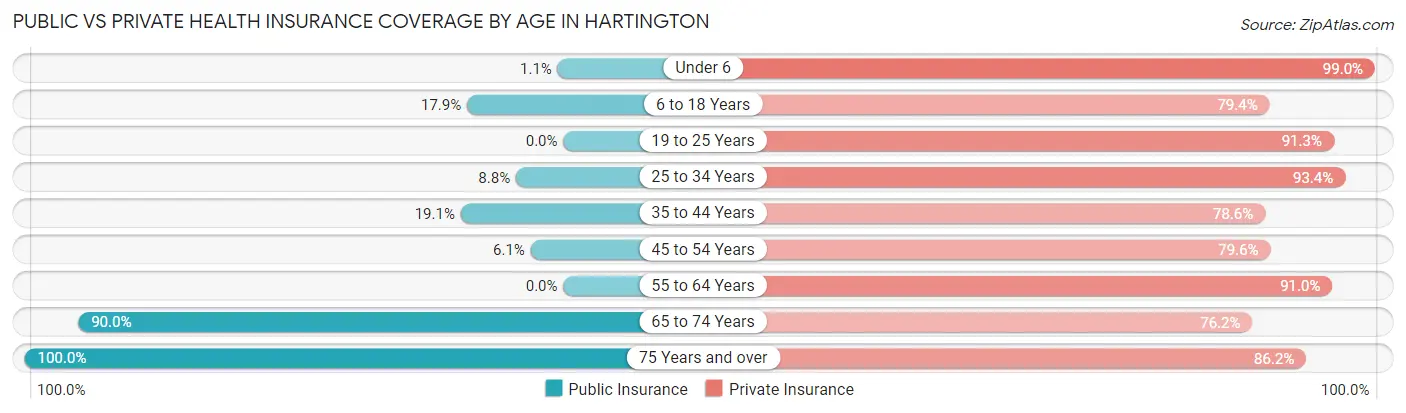
| Age Bracket | Public Insurance | Private Insurance |
| Under 6 | 1 (1.1%) | 94 (99.0%) |
| 6 to 18 Years | 52 (17.9%) | 231 (79.4%) |
| 19 to 25 Years | 0 (0.0%) | 42 (91.3%) |
| 25 to 34 Years | 8 (8.8%) | 85 (93.4%) |
| 35 to 44 Years | 32 (19.1%) | 132 (78.6%) |
| 45 to 54 Years | 8 (6.1%) | 105 (79.5%) |
| 55 to 64 Years | 0 (0.0%) | 213 (91.0%) |
| 65 to 74 Years | 208 (90.0%) | 176 (76.2%) |
| 75 Years and over | 210 (100.0%) | 181 (86.2%) |
| Total | 519 (34.6%) | 1,259 (84.1%) |
Disability Status by Sex by Age in Hartington
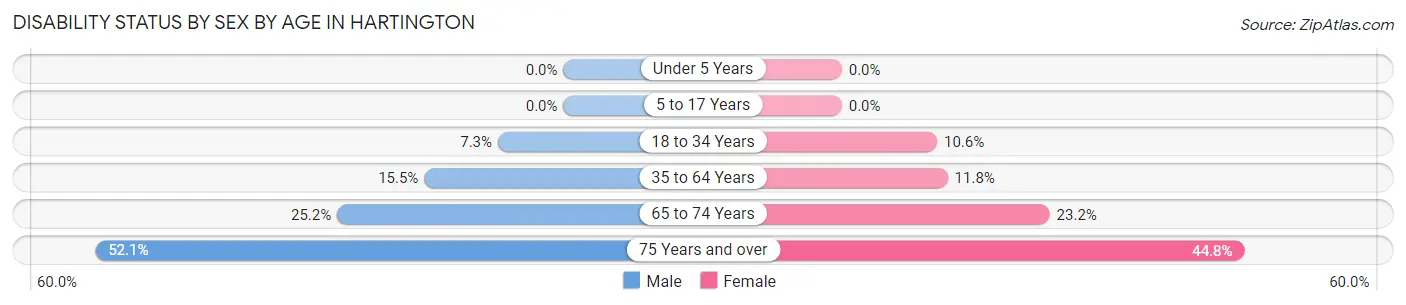
| Age Bracket | Male | Female |
| Under 5 Years | 0 (0.0%) | 0 (0.0%) |
| 5 to 17 Years | 0 (0.0%) | 0 (0.0%) |
| 18 to 34 Years | 7 (7.3%) | 7 (10.6%) |
| 35 to 64 Years | 42 (15.5%) | 31 (11.8%) |
| 65 to 74 Years | 31 (25.2%) | 25 (23.2%) |
| 75 Years and over | 49 (52.1%) | 52 (44.8%) |
Disability Class by Sex by Age in Hartington
Disability Class: Hearing Difficulty
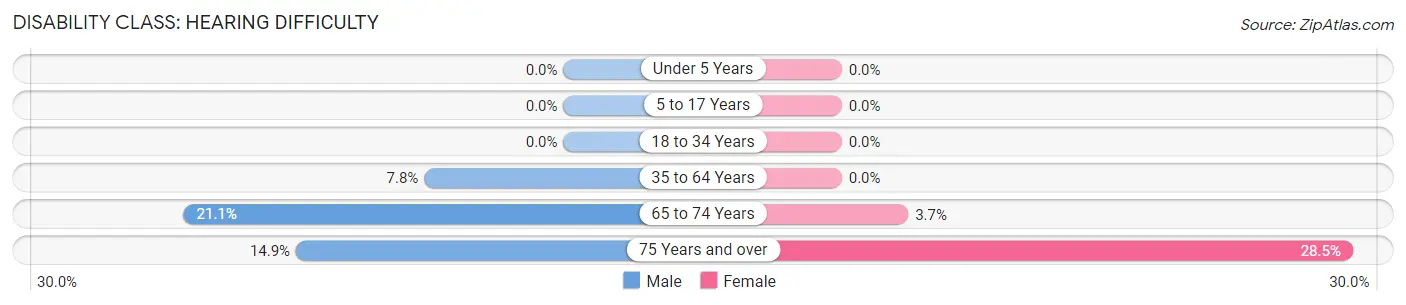
| Age Bracket | Male | Female |
| Under 5 Years | 0 (0.0%) | 0 (0.0%) |
| 5 to 17 Years | 0 (0.0%) | 0 (0.0%) |
| 18 to 34 Years | 0 (0.0%) | 0 (0.0%) |
| 35 to 64 Years | 21 (7.7%) | 0 (0.0%) |
| 65 to 74 Years | 26 (21.1%) | 4 (3.7%) |
| 75 Years and over | 14 (14.9%) | 33 (28.4%) |
Disability Class: Vision Difficulty
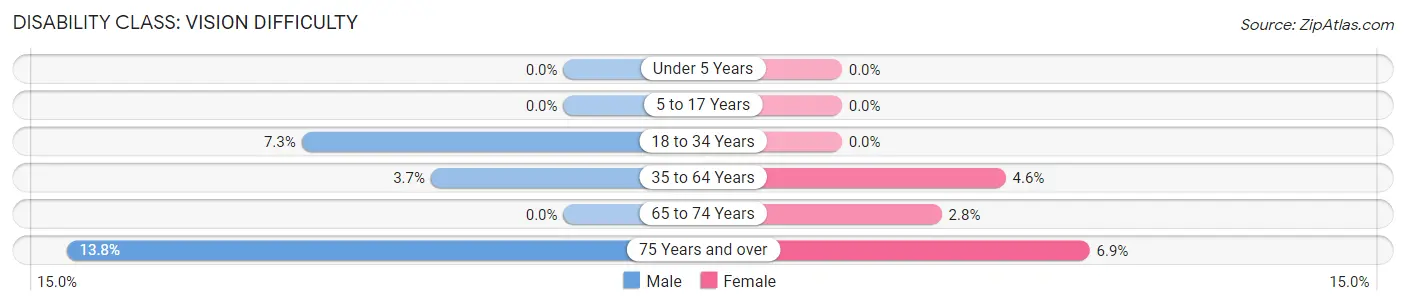
| Age Bracket | Male | Female |
| Under 5 Years | 0 (0.0%) | 0 (0.0%) |
| 5 to 17 Years | 0 (0.0%) | 0 (0.0%) |
| 18 to 34 Years | 7 (7.3%) | 0 (0.0%) |
| 35 to 64 Years | 10 (3.7%) | 12 (4.6%) |
| 65 to 74 Years | 0 (0.0%) | 3 (2.8%) |
| 75 Years and over | 13 (13.8%) | 8 (6.9%) |
Disability Class: Cognitive Difficulty
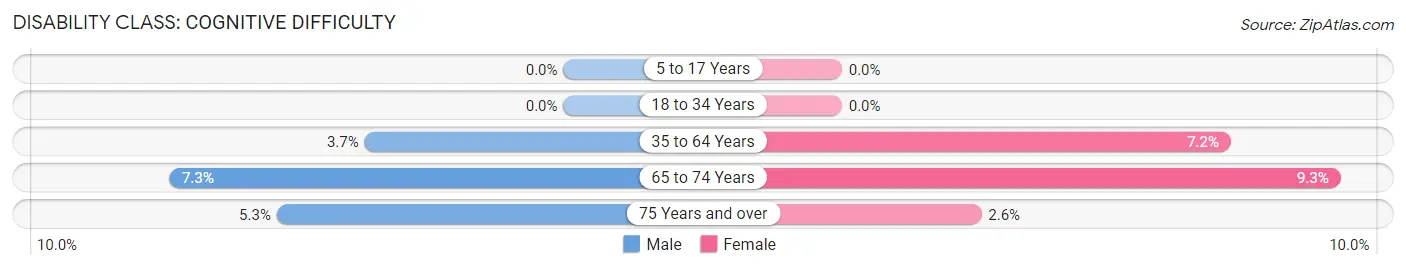
| Age Bracket | Male | Female |
| 5 to 17 Years | 0 (0.0%) | 0 (0.0%) |
| 18 to 34 Years | 0 (0.0%) | 0 (0.0%) |
| 35 to 64 Years | 10 (3.7%) | 19 (7.2%) |
| 65 to 74 Years | 9 (7.3%) | 10 (9.3%) |
| 75 Years and over | 5 (5.3%) | 3 (2.6%) |
Disability Class: Ambulatory Difficulty
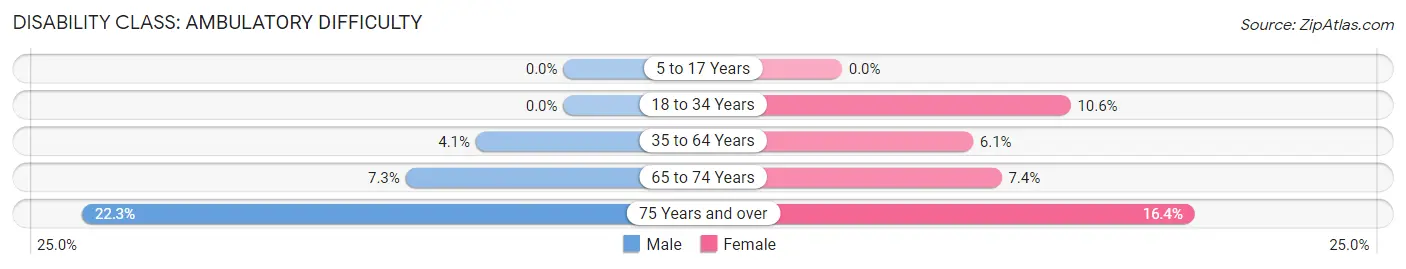
| Age Bracket | Male | Female |
| 5 to 17 Years | 0 (0.0%) | 0 (0.0%) |
| 18 to 34 Years | 0 (0.0%) | 7 (10.6%) |
| 35 to 64 Years | 11 (4.1%) | 16 (6.1%) |
| 65 to 74 Years | 9 (7.3%) | 8 (7.4%) |
| 75 Years and over | 21 (22.3%) | 19 (16.4%) |
Disability Class: Self-Care Difficulty
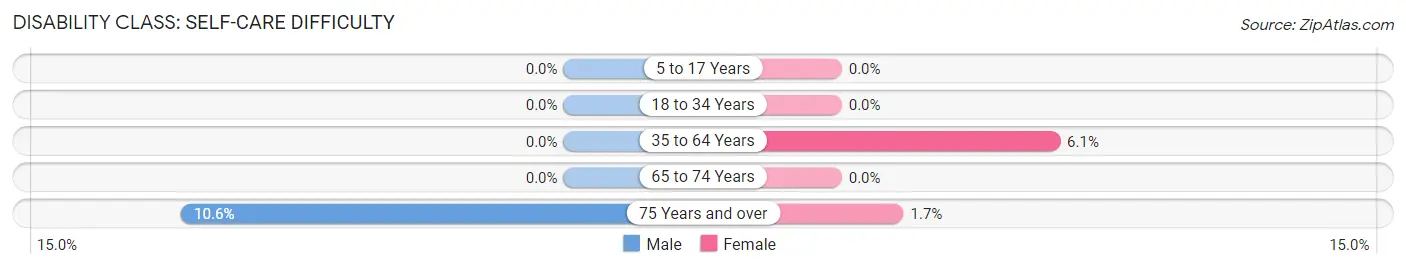
| Age Bracket | Male | Female |
| 5 to 17 Years | 0 (0.0%) | 0 (0.0%) |
| 18 to 34 Years | 0 (0.0%) | 0 (0.0%) |
| 35 to 64 Years | 0 (0.0%) | 16 (6.1%) |
| 65 to 74 Years | 0 (0.0%) | 0 (0.0%) |
| 75 Years and over | 10 (10.6%) | 2 (1.7%) |
Technology Access in Hartington
Computing Device Access in Hartington
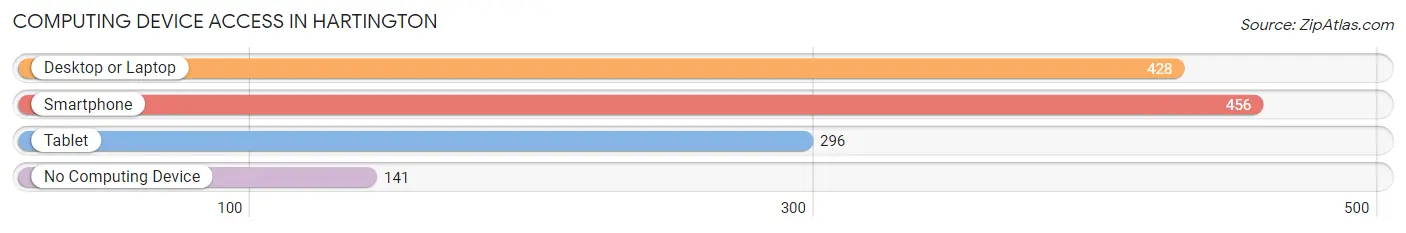
| Device Type | # Households | % Households |
| Desktop or Laptop | 428 | 66.0% |
| Smartphone | 456 | 70.4% |
| Tablet | 296 | 45.7% |
| No Computing Device | 141 | 21.8% |
| Total | 648 | 100.0% |
Internet Access in Hartington
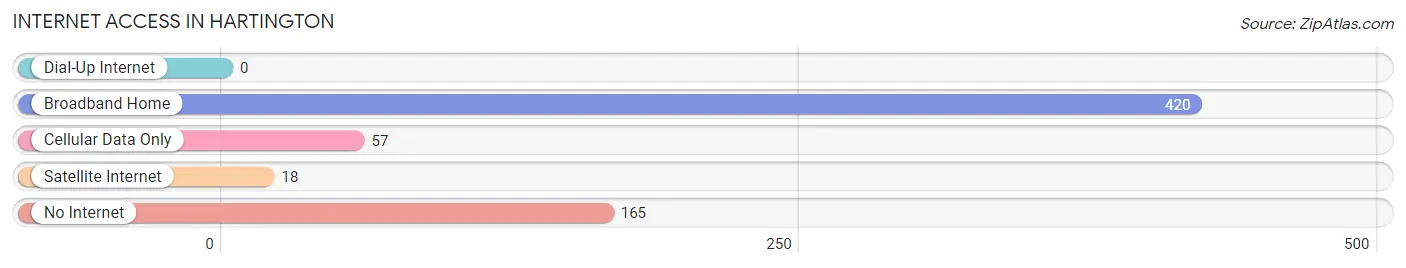
| Internet Type | # Households | % Households |
| Dial-Up Internet | 0 | 0.0% |
| Broadband Home | 420 | 64.8% |
| Cellular Data Only | 57 | 8.8% |
| Satellite Internet | 18 | 2.8% |
| No Internet | 165 | 25.5% |
| Total | 648 | 100.0% |
Hartington Summary
Hartington, Nebraska is a small city located in Cedar County in the northeastern part of the state. It is situated on the banks of the Missouri River and is the county seat of Cedar County. The city has a population of 1,541 as of the 2020 census.
Hartington was founded in 1871 by German immigrants who were attracted to the area by its fertile soil and abundant natural resources. The city was named after Hartington, England, the hometown of one of the original settlers. The city was incorporated in 1884 and has since grown to become a thriving community.
Geography
Hartington is located in the northeastern part of Nebraska, in Cedar County. It is situated on the banks of the Missouri River, which forms the border between Nebraska and South Dakota. The city is located at an elevation of 1,845 feet above sea level. The city has a total area of 1.3 square miles, all of which is land.
The climate in Hartington is classified as humid continental, with hot summers and cold winters. The average annual temperature is 48°F, with an average high of 79°F in the summer and an average low of 17°F in the winter. The average annual precipitation is 28 inches.
Economy
The economy of Hartington is largely based on agriculture and manufacturing. The city is home to several large agricultural businesses, including a feed mill, a grain elevator, and a dairy. The city also has several manufacturing businesses, including a furniture factory, a plastics factory, and a printing company.
The city is also home to several retail businesses, including a grocery store, a hardware store, and a variety of specialty shops. The city also has several restaurants, bars, and other entertainment venues.
Demographics
As of the 2020 census, the population of Hartington was 1,541. The racial makeup of the city was 97.2% White, 0.7% African American, 0.3% Native American, 0.2% Asian, 0.1% Pacific Islander, 0.3% from other races, and 1.3% from two or more races. Hispanic or Latino of any race were 1.3% of the population.
The median income for a household in Hartington was $41,944, and the median income for a family was $50,000. The per capita income for the city was $20,845. About 8.3% of families and 10.2% of the population were below the poverty line, including 14.2% of those under age 18 and 8.2% of those age 65 or over.
Hartington is a small city with a rich history and a vibrant economy. It is a great place to live, work, and raise a family. The city has a diverse population and a variety of businesses and attractions. Hartington is a great place to call home.
Common Questions
What is Per Capita Income in Hartington?
Per Capita income in Hartington is $39,579.
What is the Median Family Income in Hartington?
Median Family Income in Hartington is $100,833.
What is the Median Household income in Hartington?
Median Household Income in Hartington is $79,444.
What is Income or Wage Gap in Hartington?
Income or Wage Gap in Hartington is 25.3%.
Women in Hartington earn 74.7 cents for every dollar earned by a man.
What is Inequality or Gini Index in Hartington?
Inequality or Gini Index in Hartington is 0.43.
What is the Total Population of Hartington?
Total Population of Hartington is 1,552.
What is the Total Male Population of Hartington?
Total Male Population of Hartington is 799.
What is the Total Female Population of Hartington?
Total Female Population of Hartington is 753.
What is the Ratio of Males per 100 Females in Hartington?
There are 106.11 Males per 100 Females in Hartington.
What is the Ratio of Females per 100 Males in Hartington?
There are 94.24 Females per 100 Males in Hartington.
What is the Median Population Age in Hartington?
Median Population Age in Hartington is 49.6 Years.
What is the Average Family Size in Hartington
Average Family Size in Hartington is 3.1 People.
What is the Average Household Size in Hartington
Average Household Size in Hartington is 2.3 People.
How Large is the Labor Force in Hartington?
There are 766 People in the Labor Forcein in Hartington.
What is the Percentage of People in the Labor Force in Hartington?
60.5% of People are in the Labor Force in Hartington.
What is the Unemployment Rate in Hartington?
Unemployment Rate in Hartington is 3.1%.