Haigler, NE Map & Demographics
Haigler Map
Haigler Overview
$22,985
PER CAPITA INCOME
$87,500
AVG FAMILY INCOME
$44,821
AVG HOUSEHOLD INCOME
46.2%
WAGE / INCOME GAP [ % ]
53.8¢/ $1
WAGE / INCOME GAP [ $ ]
0.36
INEQUALITY / GINI INDEX
165
TOTAL POPULATION
72
MALE POPULATION
93
FEMALE POPULATION
77.42
MALES / 100 FEMALES
129.17
FEMALES / 100 MALES
27.8
MEDIAN AGE
3.4
AVG FAMILY SIZE
2.5
AVG HOUSEHOLD SIZE
62
LABOR FORCE [ PEOPLE ]
53.9%
PERCENT IN LABOR FORCE
Haigler Zip Codes
Haigler Area Codes
Income in Haigler
Income Overview in Haigler
Per Capita Income in Haigler is $22,985, while median incomes of families and households are $87,500 and $44,821 respectively.
| Characteristic | Number | Measure |
| Per Capita Income | 165 | $22,985 |
| Median Family Income | 40 | $87,500 |
| Mean Family Income | 40 | $77,090 |
| Median Household Income | 65 | $44,821 |
| Mean Household Income | 65 | $60,815 |
| Income Deficit | 40 | $0 |
| Wage / Income Gap (%) | 165 | 46.21% |
| Wage / Income Gap ($) | 165 | 53.79¢ per $1 |
| Gini / Inequality Index | 165 | 0.36 |
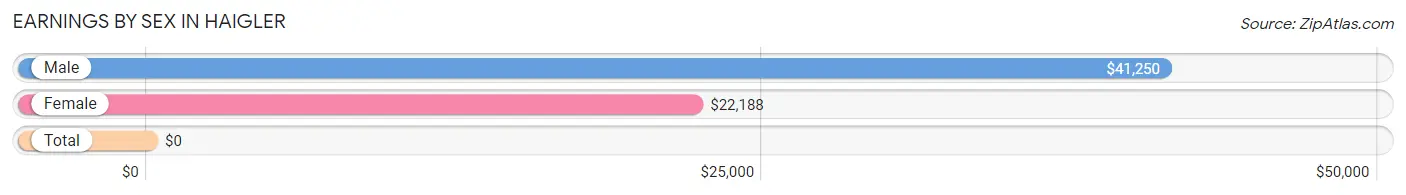
Earnings by Sex in Haigler
| Sex | Number | Average Earnings |
| Male | 27 (35.5%) | $41,250 |
| Female | 49 (64.5%) | $22,188 |
| Total | 76 (100.0%) | $0 |
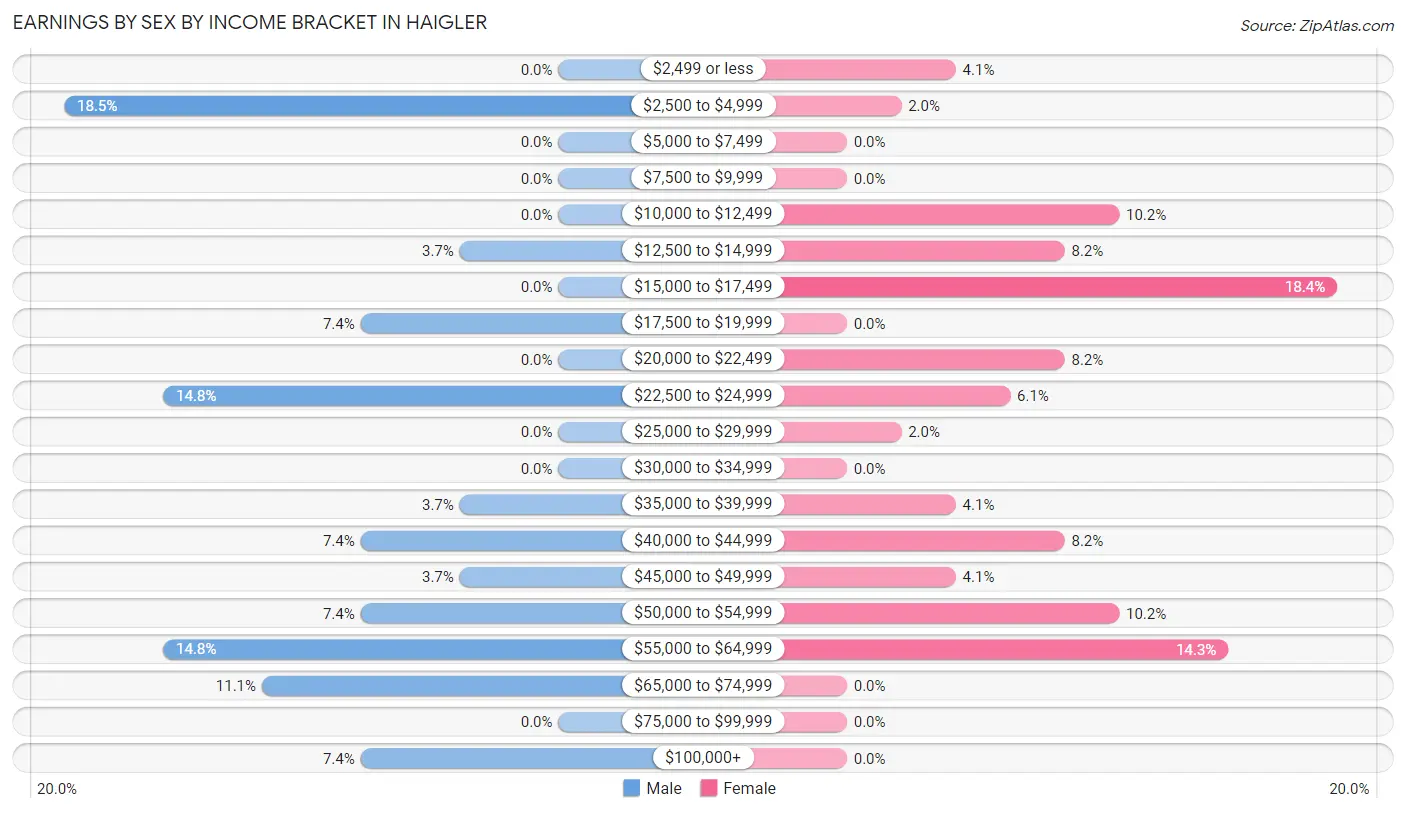
Earnings by Sex by Income Bracket in Haigler
The most common earnings brackets in Haigler are $2,500 to $4,999 for men (5 | 18.5%) and $15,000 to $17,499 for women (9 | 18.4%).
| Income | Male | Female |
| $2,499 or less | 0 (0.0%) | 2 (4.1%) |
| $2,500 to $4,999 | 5 (18.5%) | 1 (2.0%) |
| $5,000 to $7,499 | 0 (0.0%) | 0 (0.0%) |
| $7,500 to $9,999 | 0 (0.0%) | 0 (0.0%) |
| $10,000 to $12,499 | 0 (0.0%) | 5 (10.2%) |
| $12,500 to $14,999 | 1 (3.7%) | 4 (8.2%) |
| $15,000 to $17,499 | 0 (0.0%) | 9 (18.4%) |
| $17,500 to $19,999 | 2 (7.4%) | 0 (0.0%) |
| $20,000 to $22,499 | 0 (0.0%) | 4 (8.2%) |
| $22,500 to $24,999 | 4 (14.8%) | 3 (6.1%) |
| $25,000 to $29,999 | 0 (0.0%) | 1 (2.0%) |
| $30,000 to $34,999 | 0 (0.0%) | 0 (0.0%) |
| $35,000 to $39,999 | 1 (3.7%) | 2 (4.1%) |
| $40,000 to $44,999 | 2 (7.4%) | 4 (8.2%) |
| $45,000 to $49,999 | 1 (3.7%) | 2 (4.1%) |
| $50,000 to $54,999 | 2 (7.4%) | 5 (10.2%) |
| $55,000 to $64,999 | 4 (14.8%) | 7 (14.3%) |
| $65,000 to $74,999 | 3 (11.1%) | 0 (0.0%) |
| $75,000 to $99,999 | 0 (0.0%) | 0 (0.0%) |
| $100,000+ | 2 (7.4%) | 0 (0.0%) |
| Total | 27 (100.0%) | 49 (100.0%) |
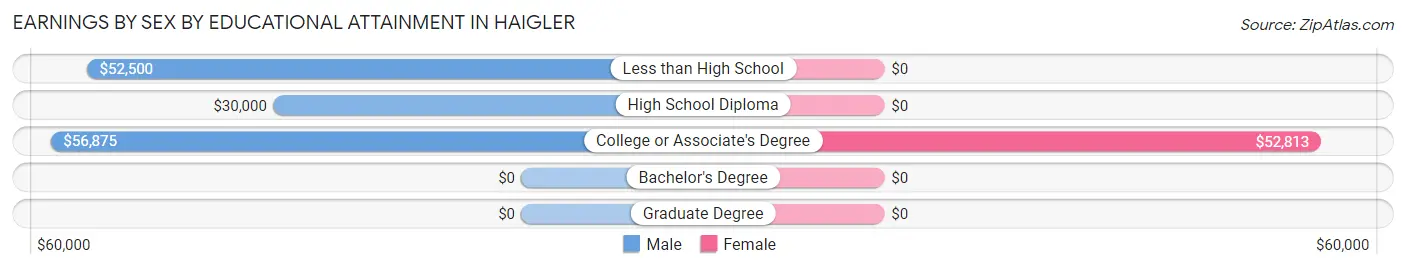
Earnings by Sex by Educational Attainment in Haigler
Average earnings in Haigler are $50,625 for men and $42,500 for women, a difference of 16.1%. Men with an educational attainment of college or associate's degree enjoy the highest average annual earnings of $56,875, while those with high school diploma education earn the least with $30,000. Women with an educational attainment of college or associate's degree earn the most with the average annual earnings of $52,813, while those with college or associate's degree education have the smallest earnings of $52,813.
| Educational Attainment | Male Income | Female Income |
| Less than High School | $52,500 | $0 |
| High School Diploma | $30,000 | $0 |
| College or Associate's Degree | $56,875 | $52,813 |
| Bachelor's Degree | - | - |
| Graduate Degree | - | - |
| Total | $50,625 | $42,500 |
Family Income in Haigler
Family Income Brackets in Haigler
According to the Haigler family income data, there are 17 families falling into the $75,000 to $99,999 income range, which is the most common income bracket and makes up 42.5% of all families.
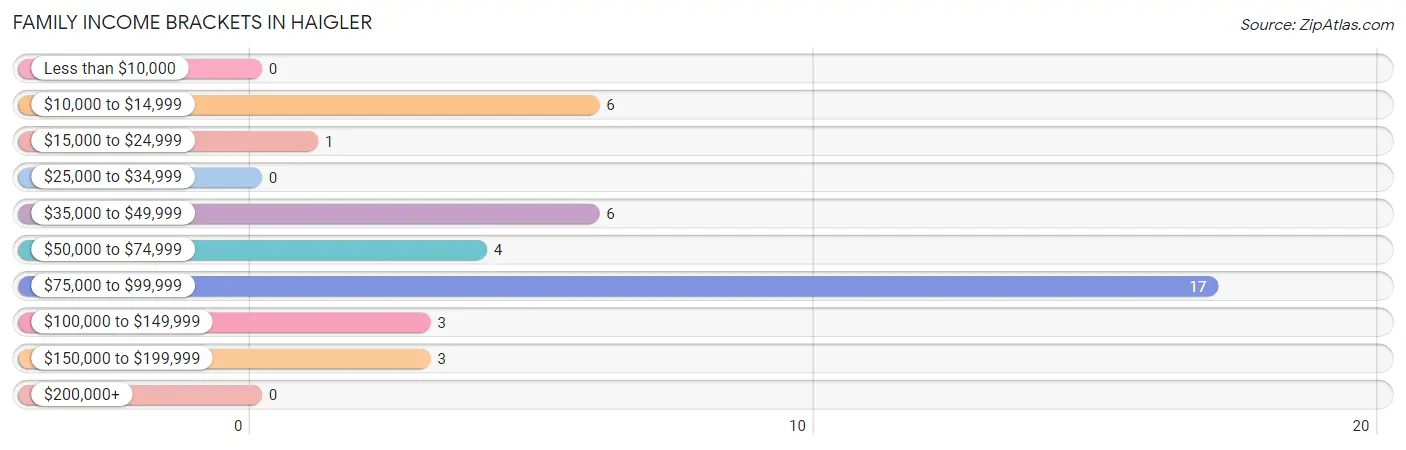
| Income Bracket | # Families | % Families |
| Less than $10,000 | 0 | 0.0% |
| $10,000 to $14,999 | 6 | 15.0% |
| $15,000 to $24,999 | 1 | 2.5% |
| $25,000 to $34,999 | 0 | 0.0% |
| $35,000 to $49,999 | 6 | 15.0% |
| $50,000 to $74,999 | 4 | 10.0% |
| $75,000 to $99,999 | 17 | 42.5% |
| $100,000 to $149,999 | 3 | 7.5% |
| $150,000 to $199,999 | 3 | 7.5% |
| $200,000+ | 0 | 0.0% |
Family Income by Famaliy Size in Haigler
2-person families (24 | 60.0%) account for the highest median family income in Haigler with $88,750 per family, while 2-person families (24 | 60.0%) have the highest median income of $44,375 per family member.
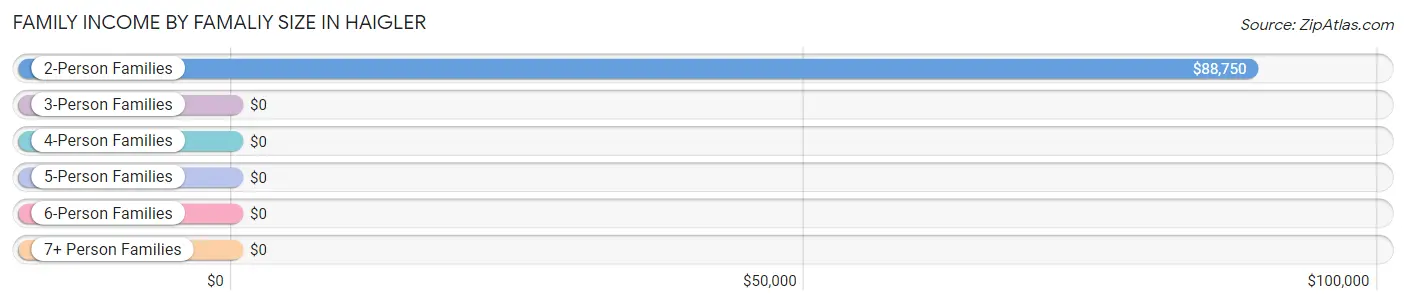
| Income Bracket | # Families | Median Income |
| 2-Person Families | 24 (60.0%) | $88,750 |
| 3-Person Families | 4 (10.0%) | $0 |
| 4-Person Families | 6 (15.0%) | $0 |
| 5-Person Families | 2 (5.0%) | $0 |
| 6-Person Families | 4 (10.0%) | $0 |
| 7+ Person Families | 0 (0.0%) | $0 |
| Total | 40 (100.0%) | $87,500 |
Family Income by Number of Earners in Haigler
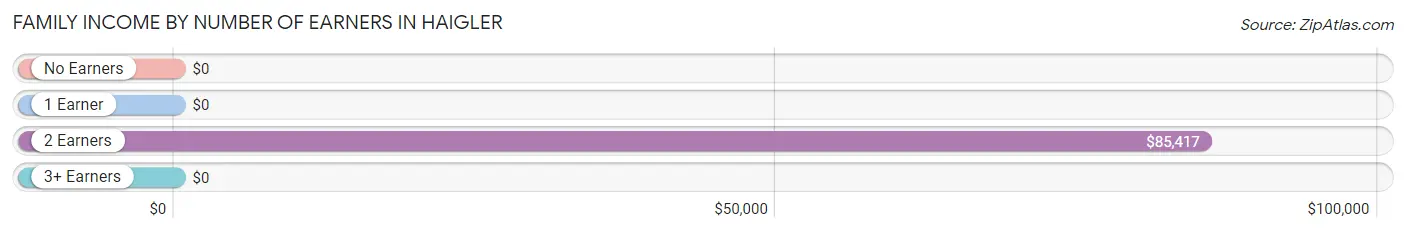
| Number of Earners | # Families | Median Income |
| No Earners | 5 (12.5%) | $0 |
| 1 Earner | 14 (35.0%) | $0 |
| 2 Earners | 17 (42.5%) | $85,417 |
| 3+ Earners | 4 (10.0%) | $0 |
| Total | 40 (100.0%) | $87,500 |
Household Income in Haigler
Household Income Brackets in Haigler
With 17 households falling in the category, the $75,000 to $99,999 income range is the most frequent in Haigler, accounting for 26.2% of all households.
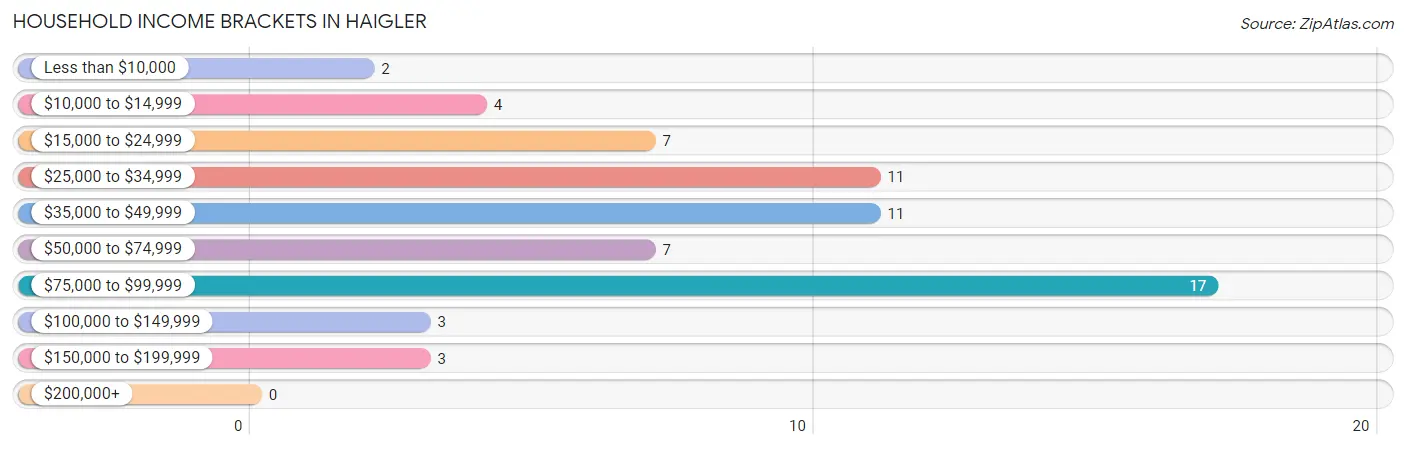
| Income Bracket | # Households | % Households |
| Less than $10,000 | 2 | 3.1% |
| $10,000 to $14,999 | 4 | 6.2% |
| $15,000 to $24,999 | 7 | 10.8% |
| $25,000 to $34,999 | 11 | 16.9% |
| $35,000 to $49,999 | 11 | 16.9% |
| $50,000 to $74,999 | 7 | 10.8% |
| $75,000 to $99,999 | 17 | 26.2% |
| $100,000 to $149,999 | 3 | 4.6% |
| $150,000 to $199,999 | 3 | 4.6% |
| $200,000+ | 0 | 0.0% |
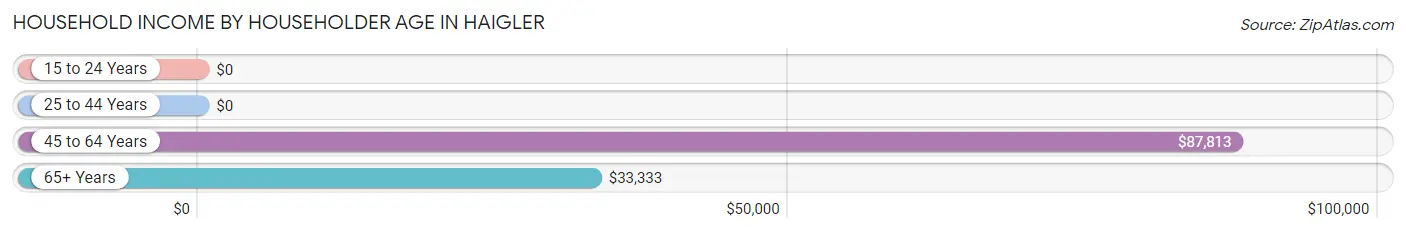
Household Income by Householder Age in Haigler
The median household income in Haigler is $44,821, with the highest median household income of $87,813 found in the 45 to 64 years age bracket for the primary householder. A total of 29 households (44.6%) fall into this category. Meanwhile, the 15 to 24 years age bracket for the primary householder has the lowest median household income of $0, with 4 households (6.1%) in this group.
| Income Bracket | # Households | Median Income |
| 15 to 24 Years | 4 (6.1%) | $0 |
| 25 to 44 Years | 12 (18.5%) | $0 |
| 45 to 64 Years | 29 (44.6%) | $87,813 |
| 65+ Years | 20 (30.8%) | $33,333 |
| Total | 65 (100.0%) | $44,821 |
Poverty in Haigler
Income Below Poverty by Sex and Age in Haigler
With 34.7% poverty level for males and 12.9% for females among the residents of Haigler, under 5 year old males and 45 to 54 year old females are the most vulnerable to poverty, with 14 males (87.5%) and 2 females (50.0%) in their respective age groups living below the poverty level.
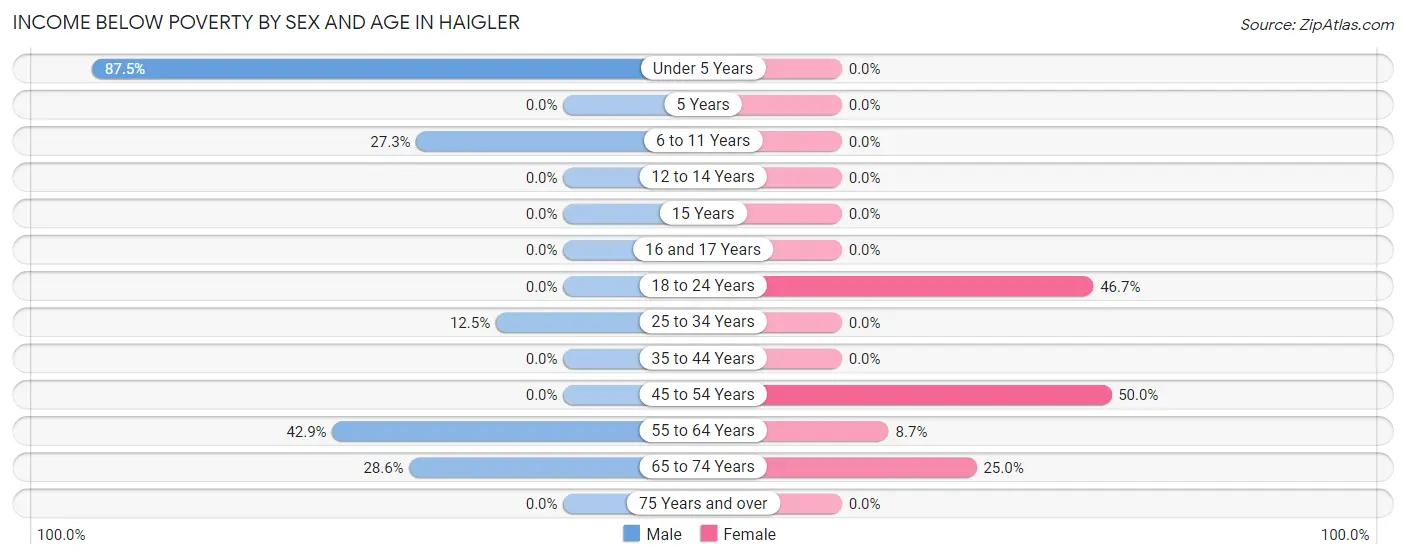
| Age Bracket | Male | Female |
| Under 5 Years | 14 (87.5%) | 0 (0.0%) |
| 5 Years | 0 (0.0%) | 0 (0.0%) |
| 6 to 11 Years | 3 (27.3%) | 0 (0.0%) |
| 12 to 14 Years | 0 (0.0%) | 0 (0.0%) |
| 15 Years | 0 (0.0%) | 0 (0.0%) |
| 16 and 17 Years | 0 (0.0%) | 0 (0.0%) |
| 18 to 24 Years | 0 (0.0%) | 7 (46.7%) |
| 25 to 34 Years | 1 (12.5%) | 0 (0.0%) |
| 35 to 44 Years | 0 (0.0%) | 0 (0.0%) |
| 45 to 54 Years | 0 (0.0%) | 2 (50.0%) |
| 55 to 64 Years | 3 (42.9%) | 2 (8.7%) |
| 65 to 74 Years | 4 (28.6%) | 1 (25.0%) |
| 75 Years and over | 0 (0.0%) | 0 (0.0%) |
| Total | 25 (34.7%) | 12 (12.9%) |
Income Above Poverty by Sex and Age in Haigler
According to the poverty statistics in Haigler, males aged 15 years and females aged under 5 years are the age groups that are most secure financially, with 100.0% of males and 100.0% of females in these age groups living above the poverty line.
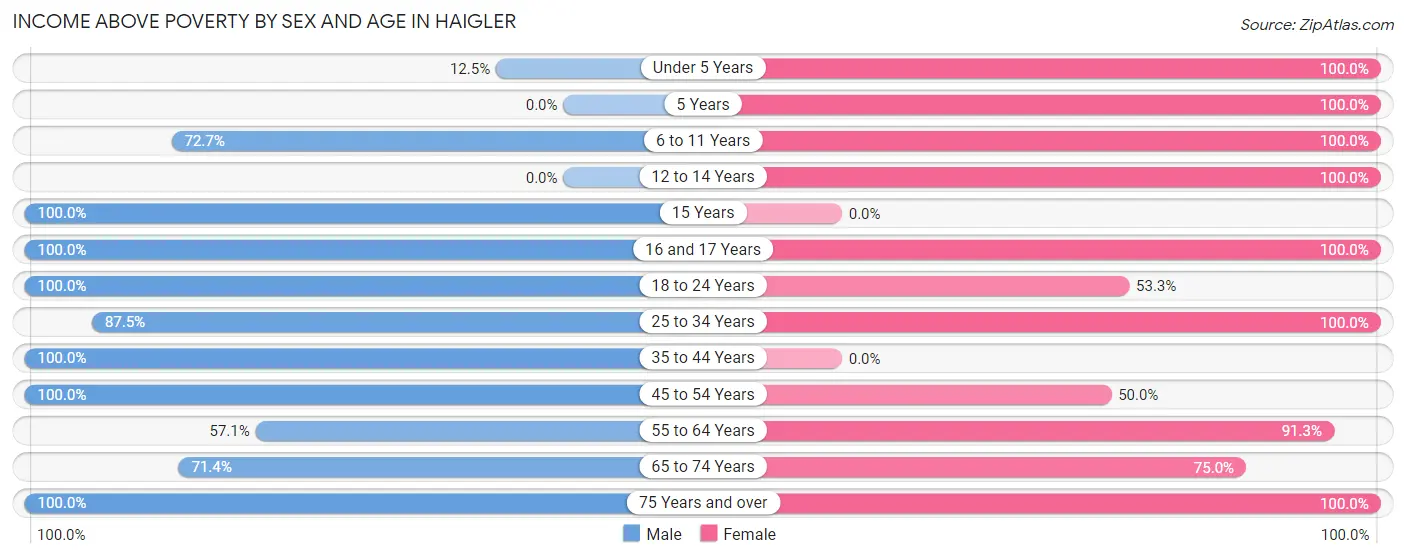
| Age Bracket | Male | Female |
| Under 5 Years | 2 (12.5%) | 7 (100.0%) |
| 5 Years | 0 (0.0%) | 7 (100.0%) |
| 6 to 11 Years | 8 (72.7%) | 7 (100.0%) |
| 12 to 14 Years | 0 (0.0%) | 1 (100.0%) |
| 15 Years | 1 (100.0%) | 0 (0.0%) |
| 16 and 17 Years | 5 (100.0%) | 2 (100.0%) |
| 18 to 24 Years | 1 (100.0%) | 8 (53.3%) |
| 25 to 34 Years | 7 (87.5%) | 10 (100.0%) |
| 35 to 44 Years | 4 (100.0%) | 0 (0.0%) |
| 45 to 54 Years | 2 (100.0%) | 2 (50.0%) |
| 55 to 64 Years | 4 (57.1%) | 21 (91.3%) |
| 65 to 74 Years | 10 (71.4%) | 3 (75.0%) |
| 75 Years and over | 3 (100.0%) | 13 (100.0%) |
| Total | 47 (65.3%) | 81 (87.1%) |
Income Below Poverty Among Married-Couple Families in Haigler
The poverty statistics for married-couple families in Haigler show that 8.3% or 3 of the total 36 families live below the poverty line. Families with no children have the highest poverty rate of 10.0%, comprising of 2 families. On the other hand, families with 3 or 4 children have the lowest poverty rate of 0.0%, which includes 0 families.
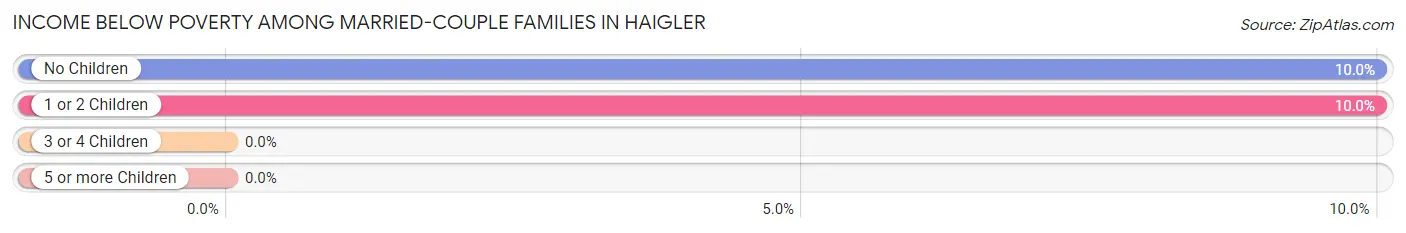
| Children | Above Poverty | Below Poverty |
| No Children | 18 (90.0%) | 2 (10.0%) |
| 1 or 2 Children | 9 (90.0%) | 1 (10.0%) |
| 3 or 4 Children | 6 (100.0%) | 0 (0.0%) |
| 5 or more Children | 0 (0.0%) | 0 (0.0%) |
| Total | 33 (91.7%) | 3 (8.3%) |
Income Below Poverty Among Single-Parent Households in Haigler
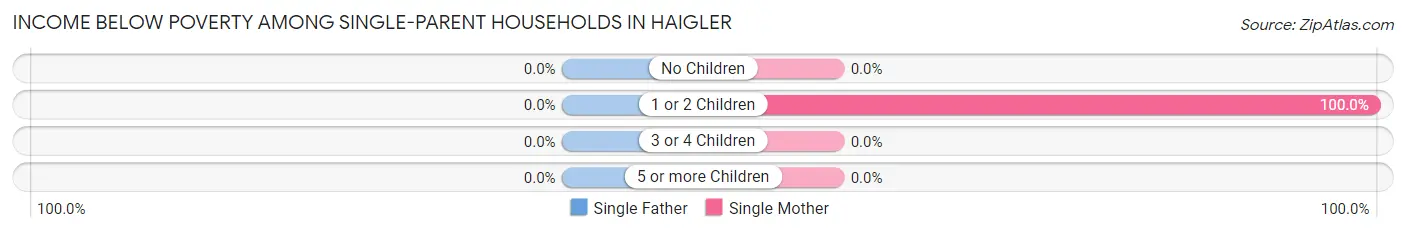
| Children | Single Father | Single Mother |
| No Children | 0 (0.0%) | 0 (0.0%) |
| 1 or 2 Children | 0 (0.0%) | 4 (100.0%) |
| 3 or 4 Children | 0 (0.0%) | 0 (0.0%) |
| 5 or more Children | 0 (0.0%) | 0 (0.0%) |
| Total | 0 (0.0%) | 4 (100.0%) |
Income Below Poverty Among Married-Couple vs Single-Parent Households in Haigler
The poverty data for Haigler shows that 3 of the married-couple family households (8.3%) and 4 of the single-parent households (100.0%) are living below the poverty level. Within the married-couple family households, those with no children have the highest poverty rate, with 2 households (10.0%) falling below the poverty line. Among the single-parent households, those with 1 or 2 children have the highest poverty rate, with 4 household (100.0%) living below poverty.
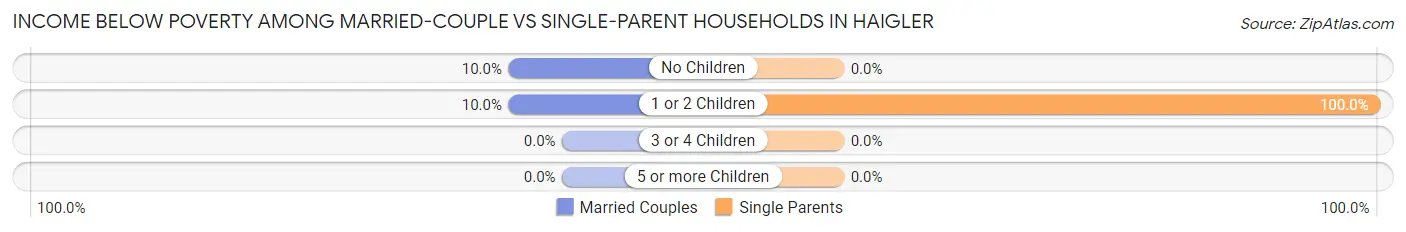
| Children | Married-Couple Families | Single-Parent Households |
| No Children | 2 (10.0%) | 0 (0.0%) |
| 1 or 2 Children | 1 (10.0%) | 4 (100.0%) |
| 3 or 4 Children | 0 (0.0%) | 0 (0.0%) |
| 5 or more Children | 0 (0.0%) | 0 (0.0%) |
| Total | 3 (8.3%) | 4 (100.0%) |
Race in Haigler
The most populous races in Haigler are White / Caucasian (144 | 87.3%), Hispanic or Latino (18 | 10.9%), and Some other Race (17 | 10.3%).
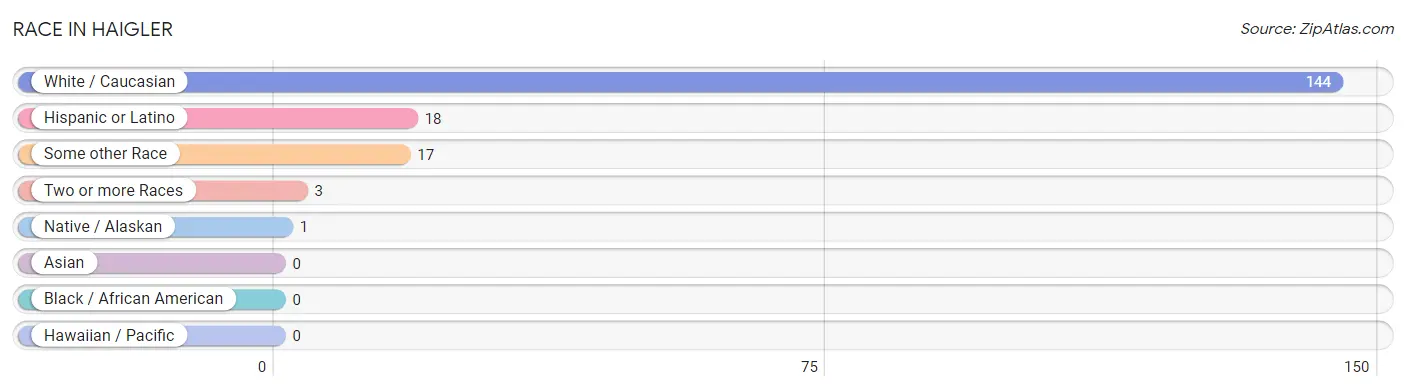
| Race | # Population | % Population |
| Asian | 0 | 0.0% |
| Black / African American | 0 | 0.0% |
| Hawaiian / Pacific | 0 | 0.0% |
| Hispanic or Latino | 18 | 10.9% |
| Native / Alaskan | 1 | 0.6% |
| White / Caucasian | 144 | 87.3% |
| Two or more Races | 3 | 1.8% |
| Some other Race | 17 | 10.3% |
| Total | 165 | 100.0% |
Ancestry in Haigler
The most populous ancestries reported in Haigler are German (47 | 28.5%), Mexican (18 | 10.9%), English (12 | 7.3%), Irish (9 | 5.4%), and Swedish (6 | 3.6%), together accounting for 55.7% of all Haigler residents.
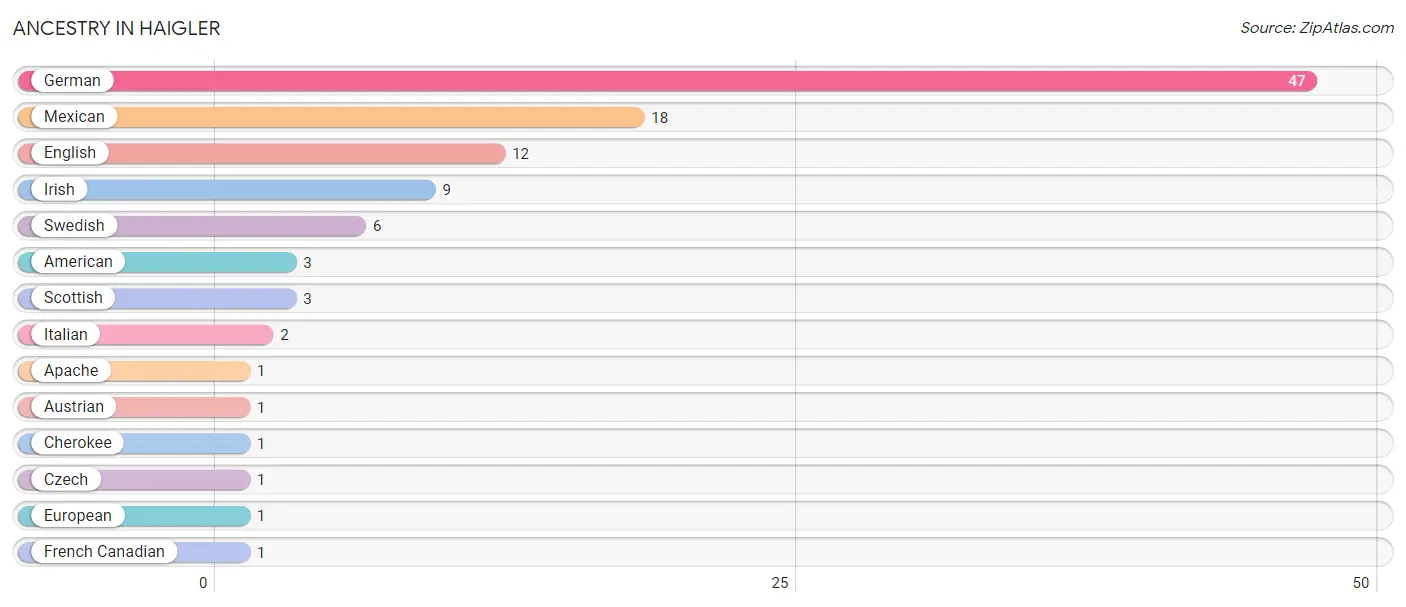
| Ancestry | # Population | % Population |
| American | 3 | 1.8% |
| Apache | 1 | 0.6% |
| Austrian | 1 | 0.6% |
| Cherokee | 1 | 0.6% |
| Czech | 1 | 0.6% |
| English | 12 | 7.3% |
| European | 1 | 0.6% |
| French Canadian | 1 | 0.6% |
| German | 47 | 28.5% |
| Irish | 9 | 5.4% |
| Italian | 2 | 1.2% |
| Mexican | 18 | 10.9% |
| Scottish | 3 | 1.8% |
| Swedish | 6 | 3.6% | View All 14 Rows |
Immigrants in Haigler
The most numerous immigrant groups reported in Haigler came from Central America (2 | 1.2%), Latin America (2 | 1.2%), and Mexico (2 | 1.2%), together accounting for 3.6% of all Haigler residents.
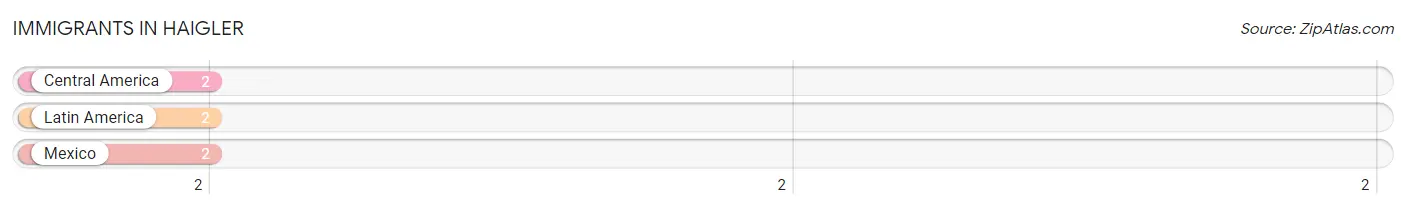
| Immigration Origin | # Population | % Population |
| Central America | 2 | 1.2% |
| Latin America | 2 | 1.2% |
| Mexico | 2 | 1.2% | View All 3 Rows |
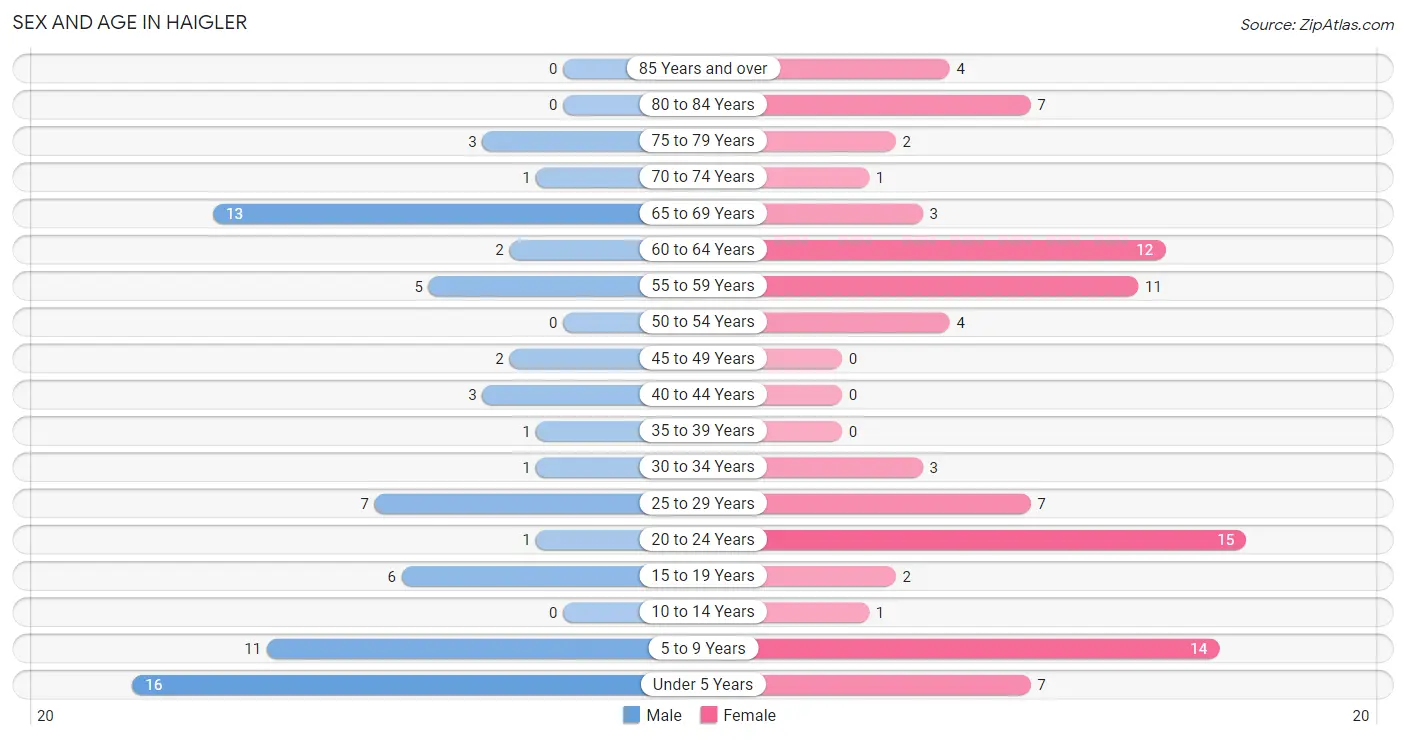
Sex and Age in Haigler
Sex and Age in Haigler
The most populous age groups in Haigler are Under 5 Years (16 | 22.2%) for men and 20 to 24 Years (15 | 16.1%) for women.
| Age Bracket | Male | Female |
| Under 5 Years | 16 (22.2%) | 7 (7.5%) |
| 5 to 9 Years | 11 (15.3%) | 14 (15.0%) |
| 10 to 14 Years | 0 (0.0%) | 1 (1.1%) |
| 15 to 19 Years | 6 (8.3%) | 2 (2.1%) |
| 20 to 24 Years | 1 (1.4%) | 15 (16.1%) |
| 25 to 29 Years | 7 (9.7%) | 7 (7.5%) |
| 30 to 34 Years | 1 (1.4%) | 3 (3.2%) |
| 35 to 39 Years | 1 (1.4%) | 0 (0.0%) |
| 40 to 44 Years | 3 (4.2%) | 0 (0.0%) |
| 45 to 49 Years | 2 (2.8%) | 0 (0.0%) |
| 50 to 54 Years | 0 (0.0%) | 4 (4.3%) |
| 55 to 59 Years | 5 (6.9%) | 11 (11.8%) |
| 60 to 64 Years | 2 (2.8%) | 12 (12.9%) |
| 65 to 69 Years | 13 (18.1%) | 3 (3.2%) |
| 70 to 74 Years | 1 (1.4%) | 1 (1.1%) |
| 75 to 79 Years | 3 (4.2%) | 2 (2.1%) |
| 80 to 84 Years | 0 (0.0%) | 7 (7.5%) |
| 85 Years and over | 0 (0.0%) | 4 (4.3%) |
| Total | 72 (100.0%) | 93 (100.0%) |
Families and Households in Haigler
Median Family Size in Haigler
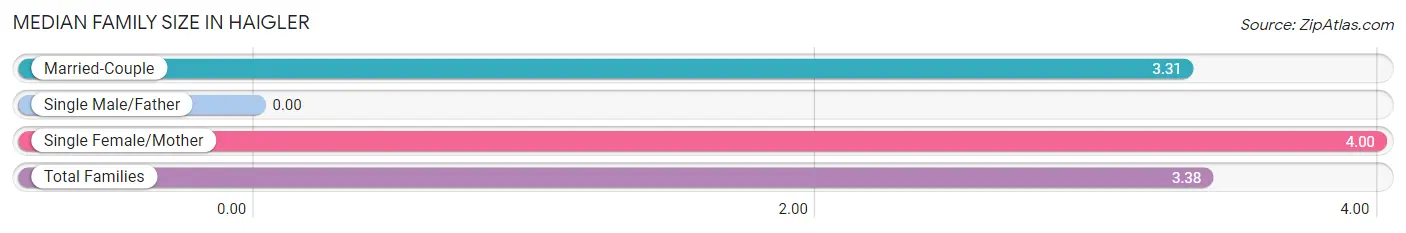
| Family Type | # Families | Family Size |
| Married-Couple | 36 (90.0%) | 3.31 |
| Single Male/Father | 0 (0.0%) | - |
| Single Female/Mother | 4 (10.0%) | 4.00 |
| Total Families | 40 (100.0%) | 3.38 |
Median Household Size in Haigler
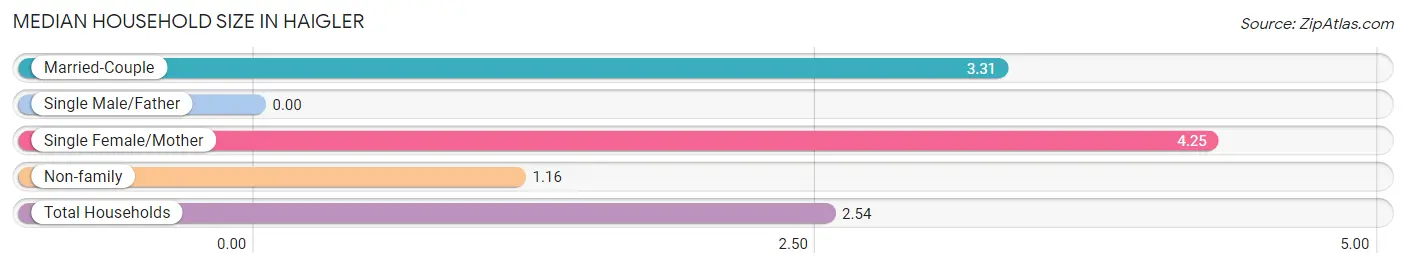
| Household Type | # Households | Household Size |
| Married-Couple | 36 (55.4%) | 3.31 |
| Single Male/Father | 0 (0.0%) | - |
| Single Female/Mother | 4 (6.1%) | 4.25 |
| Non-family | 25 (38.5%) | 1.16 |
| Total Households | 65 (100.0%) | 2.54 |
Household Size by Marriage Status in Haigler
Out of a total of 65 households in Haigler, 40 (61.5%) are family households, while 25 (38.5%) are nonfamily households. The most numerous type of family households are 2-person households, comprising 20, and the most common type of nonfamily households are 1-person households, comprising 22.
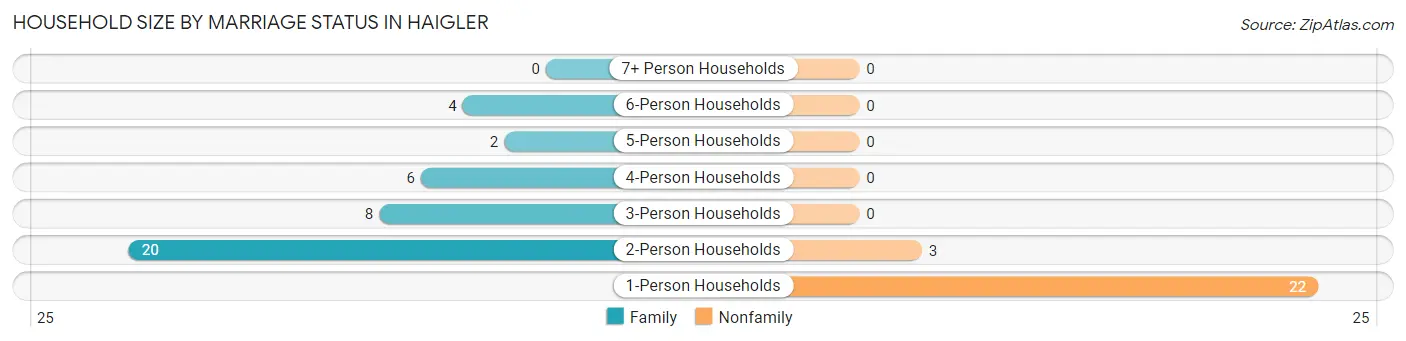
| Household Size | Family Households | Nonfamily Households |
| 1-Person Households | - | 22 (33.9%) |
| 2-Person Households | 20 (30.8%) | 3 (4.6%) |
| 3-Person Households | 8 (12.3%) | 0 (0.0%) |
| 4-Person Households | 6 (9.2%) | 0 (0.0%) |
| 5-Person Households | 2 (3.1%) | 0 (0.0%) |
| 6-Person Households | 4 (6.1%) | 0 (0.0%) |
| 7+ Person Households | 0 (0.0%) | 0 (0.0%) |
| Total | 40 (61.5%) | 25 (38.5%) |
Female Fertility in Haigler
Fertility by Age in Haigler
Average fertility rate in Haigler is 148.0 births per 1,000 women. Women in the age bracket of 20 to 34 years have the highest fertility rate with 160.0 births per 1,000 women. Women in the age bracket of 20 to 34 years acount for 100.0% of all women with births.
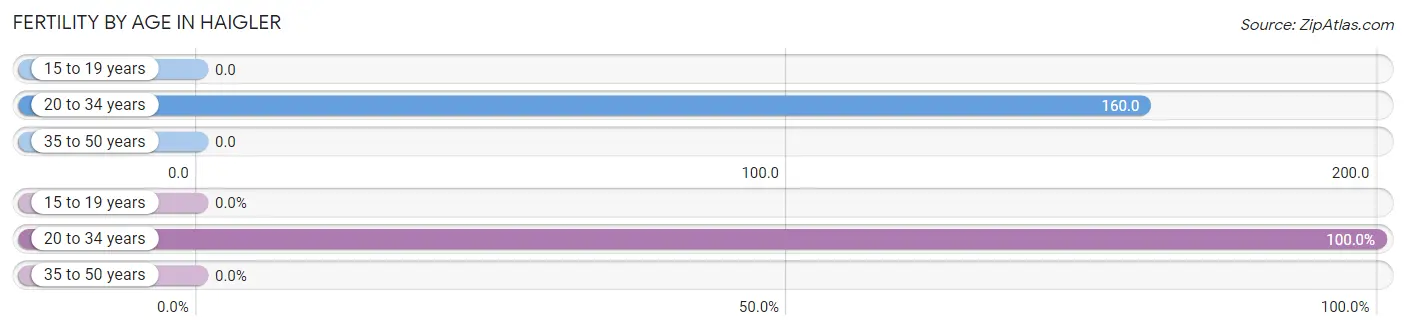
| Age Bracket | Women with Births | Births / 1,000 Women |
| 15 to 19 years | 0 (0.0%) | 0.0 |
| 20 to 34 years | 4 (100.0%) | 160.0 |
| 35 to 50 years | 0 (0.0%) | 0.0 |
| Total | 4 (100.0%) | 148.0 |
Fertility by Age by Marriage Status in Haigler
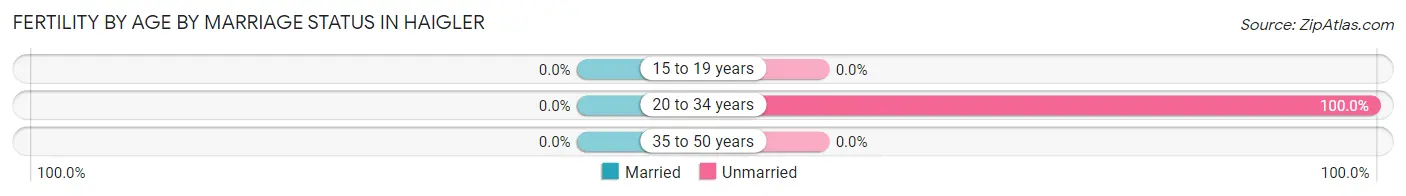
| Age Bracket | Married | Unmarried |
| 15 to 19 years | 0 (0.0%) | 0 (0.0%) |
| 20 to 34 years | 0 (0.0%) | 4 (100.0%) |
| 35 to 50 years | 0 (0.0%) | 0 (0.0%) |
| Total | 0 (0.0%) | 4 (100.0%) |
Fertility by Education in Haigler
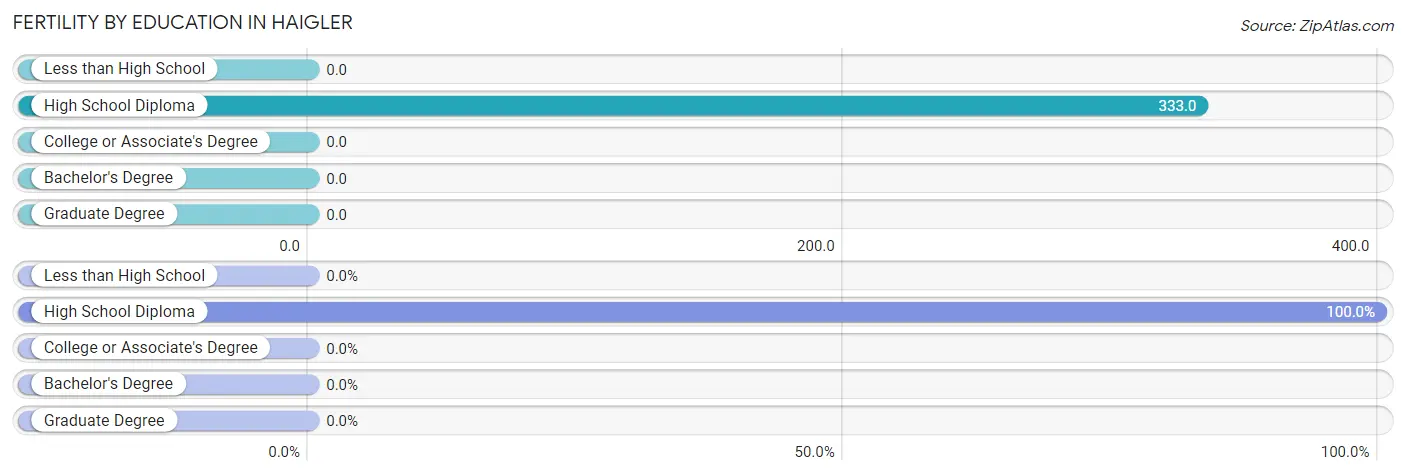
| Educational Attainment | Women with Births | Births / 1,000 Women |
| Less than High School | 0 (0.0%) | 0.0 |
| High School Diploma | 4 (100.0%) | 333.0 |
| College or Associate's Degree | 0 (0.0%) | 0.0 |
| Bachelor's Degree | 0 (0.0%) | 0.0 |
| Graduate Degree | 0 (0.0%) | 0.0 |
| Total | 4 (100.0%) | 148.0 |
Fertility by Education by Marriage Status in Haigler
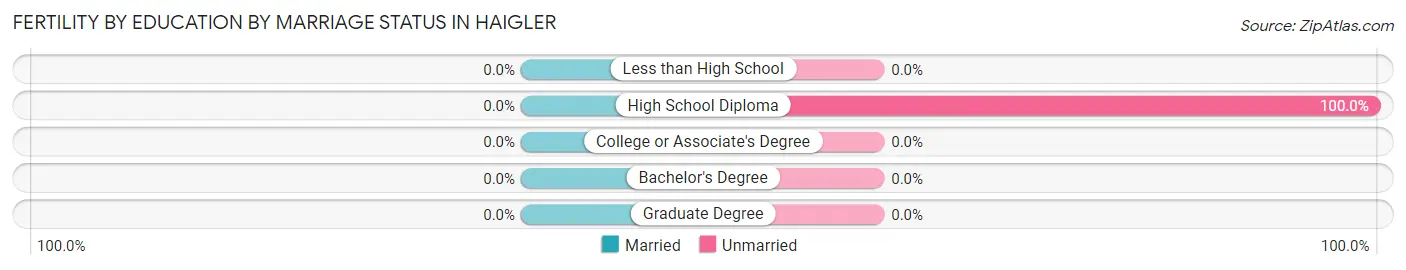
| Educational Attainment | Married | Unmarried |
| Less than High School | 0 (0.0%) | 0 (0.0%) |
| High School Diploma | 0 (0.0%) | 4 (100.0%) |
| College or Associate's Degree | 0 (0.0%) | 0 (0.0%) |
| Bachelor's Degree | 0 (0.0%) | 0 (0.0%) |
| Graduate Degree | 0 (0.0%) | 0 (0.0%) |
| Total | 0 (0.0%) | 4 (100.0%) |
Employment Characteristics in Haigler
Employment by Class of Employer in Haigler
Among the 58 employed individuals in Haigler, private company employees (36 | 62.1%), self-employed (not incorporated) (9 | 15.5%), and local government employees (7 | 12.1%) make up the most common classes of employment.
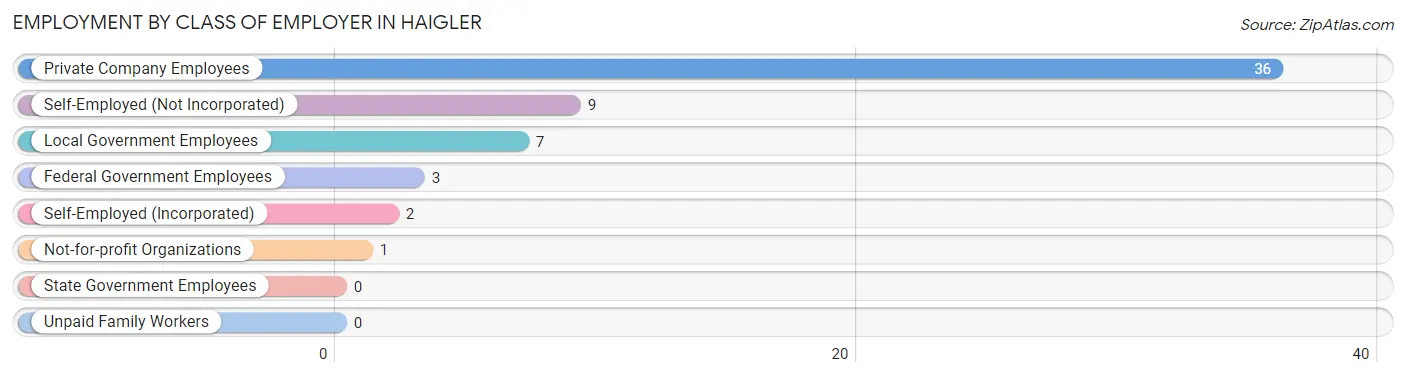
| Employer Class | # Employees | % Employees |
| Private Company Employees | 36 | 62.1% |
| Self-Employed (Incorporated) | 2 | 3.5% |
| Self-Employed (Not Incorporated) | 9 | 15.5% |
| Not-for-profit Organizations | 1 | 1.7% |
| Local Government Employees | 7 | 12.1% |
| State Government Employees | 0 | 0.0% |
| Federal Government Employees | 3 | 5.2% |
| Unpaid Family Workers | 0 | 0.0% |
| Total | 58 | 100.0% |
Employment Status by Age in Haigler
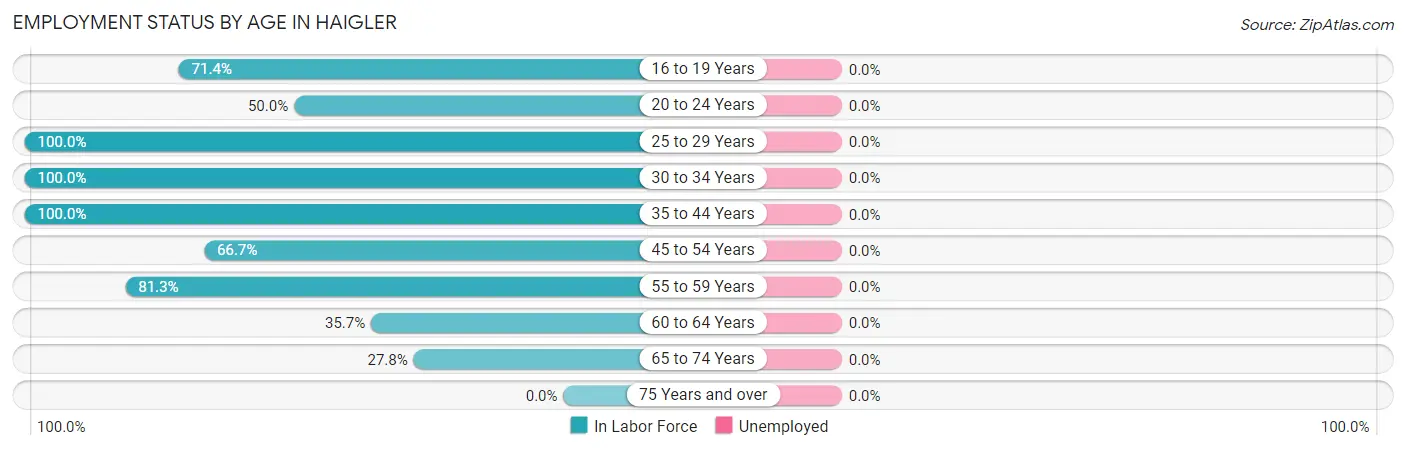
| Age Bracket | In Labor Force | Unemployed |
| 16 to 19 Years | 5 (71.4%) | 0 (0.0%) |
| 20 to 24 Years | 8 (50.0%) | 0 (0.0%) |
| 25 to 29 Years | 14 (100.0%) | 0 (0.0%) |
| 30 to 34 Years | 4 (100.0%) | 0 (0.0%) |
| 35 to 44 Years | 4 (100.0%) | 0 (0.0%) |
| 45 to 54 Years | 4 (66.7%) | 0 (0.0%) |
| 55 to 59 Years | 13 (81.3%) | 0 (0.0%) |
| 60 to 64 Years | 5 (35.7%) | 0 (0.0%) |
| 65 to 74 Years | 5 (27.8%) | 0 (0.0%) |
| 75 Years and over | 0 (0.0%) | 0 (0.0%) |
| Total | 62 (53.9%) | 0 (0.0%) |
Employment Status by Educational Attainment in Haigler
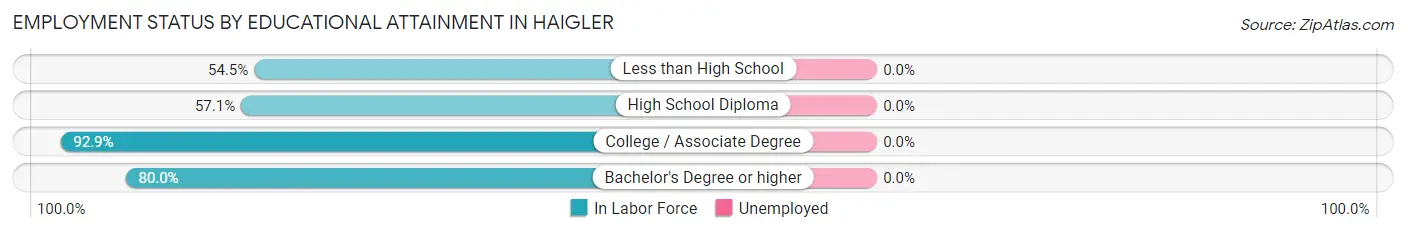
| Educational Attainment | In Labor Force | Unemployed |
| Less than High School | 6 (54.5%) | 0 (0.0%) |
| High School Diploma | 8 (57.1%) | 0 (0.0%) |
| College / Associate Degree | 26 (92.9%) | 0 (0.0%) |
| Bachelor's Degree or higher | 4 (80.0%) | 0 (0.0%) |
| Total | 44 (75.9%) | 0 (0.0%) |
Employment Occupations by Sex in Haigler
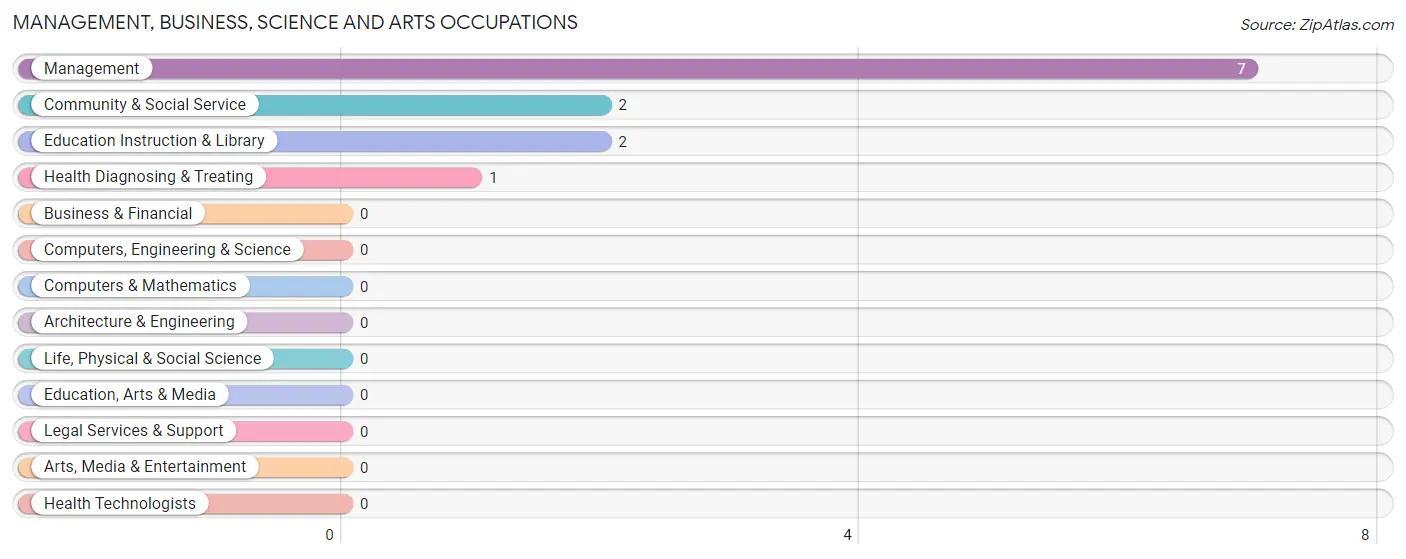
Management, Business, Science and Arts Occupations
The most common Management, Business, Science and Arts occupations in Haigler are Management (7 | 11.3%), Community & Social Service (2 | 3.2%), Education Instruction & Library (2 | 3.2%), and Health Diagnosing & Treating (1 | 1.6%).
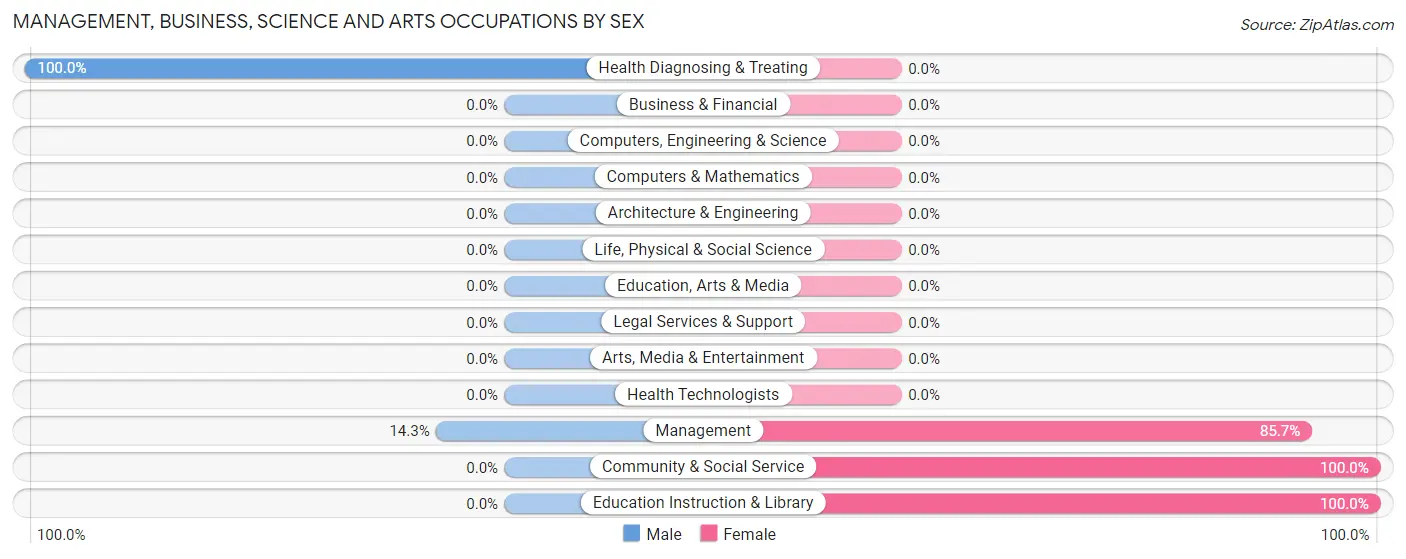
Management, Business, Science and Arts Occupations by Sex
Within the Management, Business, Science and Arts occupations in Haigler, the most male-oriented occupations are Health Diagnosing & Treating (100.0%), and Management (14.3%), while the most female-oriented occupations are Community & Social Service (100.0%), Education Instruction & Library (100.0%), and Management (85.7%).
| Occupation | Male | Female |
| Management | 1 (14.3%) | 6 (85.7%) |
| Business & Financial | 0 (0.0%) | 0 (0.0%) |
| Computers, Engineering & Science | 0 (0.0%) | 0 (0.0%) |
| Computers & Mathematics | 0 (0.0%) | 0 (0.0%) |
| Architecture & Engineering | 0 (0.0%) | 0 (0.0%) |
| Life, Physical & Social Science | 0 (0.0%) | 0 (0.0%) |
| Community & Social Service | 0 (0.0%) | 2 (100.0%) |
| Education, Arts & Media | 0 (0.0%) | 0 (0.0%) |
| Legal Services & Support | 0 (0.0%) | 0 (0.0%) |
| Education Instruction & Library | 0 (0.0%) | 2 (100.0%) |
| Arts, Media & Entertainment | 0 (0.0%) | 0 (0.0%) |
| Health Diagnosing & Treating | 1 (100.0%) | 0 (0.0%) |
| Health Technologists | 0 (0.0%) | 0 (0.0%) |
| Total (Category) | 2 (20.0%) | 8 (80.0%) |
| Total (Overall) | 27 (43.5%) | 35 (56.5%) |
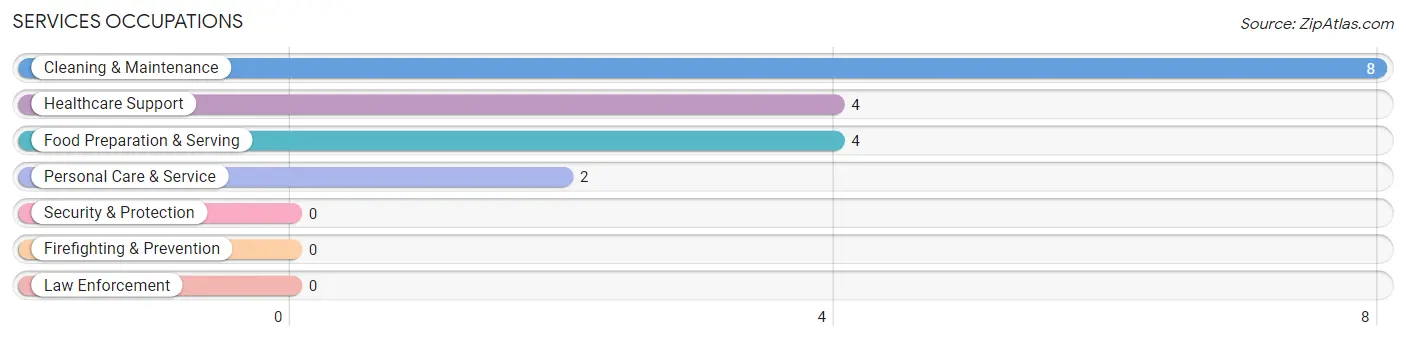
Services Occupations
The most common Services occupations in Haigler are Cleaning & Maintenance (8 | 12.9%), Healthcare Support (4 | 6.5%), Food Preparation & Serving (4 | 6.5%), and Personal Care & Service (2 | 3.2%).
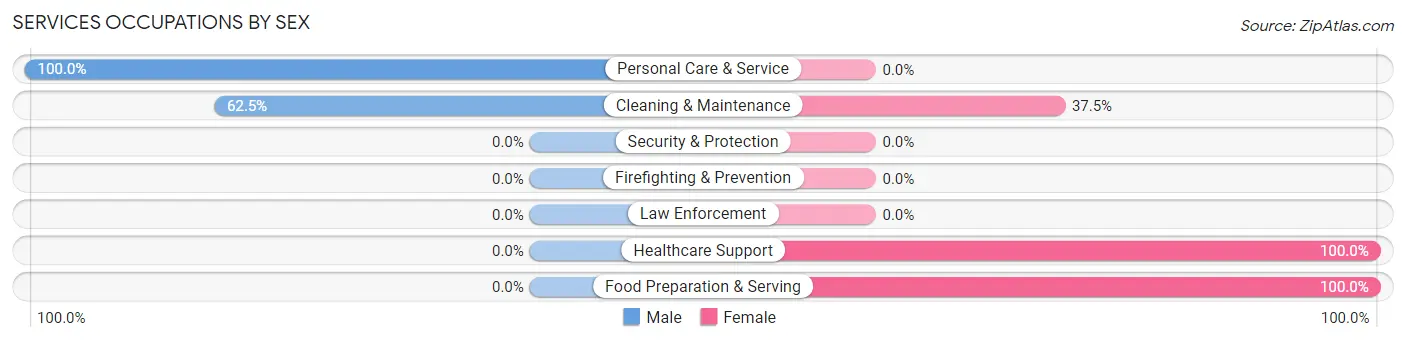
Services Occupations by Sex
Within the Services occupations in Haigler, the most male-oriented occupations are Personal Care & Service (100.0%), and Cleaning & Maintenance (62.5%), while the most female-oriented occupations are Healthcare Support (100.0%), Food Preparation & Serving (100.0%), and Cleaning & Maintenance (37.5%).
| Occupation | Male | Female |
| Healthcare Support | 0 (0.0%) | 4 (100.0%) |
| Security & Protection | 0 (0.0%) | 0 (0.0%) |
| Firefighting & Prevention | 0 (0.0%) | 0 (0.0%) |
| Law Enforcement | 0 (0.0%) | 0 (0.0%) |
| Food Preparation & Serving | 0 (0.0%) | 4 (100.0%) |
| Cleaning & Maintenance | 5 (62.5%) | 3 (37.5%) |
| Personal Care & Service | 2 (100.0%) | 0 (0.0%) |
| Total (Category) | 7 (38.9%) | 11 (61.1%) |
| Total (Overall) | 27 (43.5%) | 35 (56.5%) |
Sales and Office Occupations
The most common Sales and Office occupations in Haigler are Office & Administration (15 | 24.2%), and Sales & Related (2 | 3.2%).
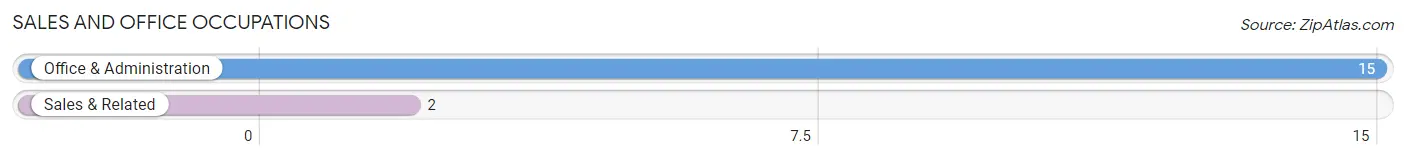
Sales and Office Occupations by Sex
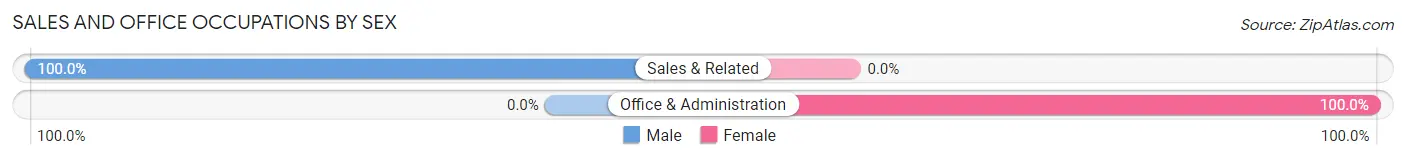
| Occupation | Male | Female |
| Sales & Related | 2 (100.0%) | 0 (0.0%) |
| Office & Administration | 0 (0.0%) | 15 (100.0%) |
| Total (Category) | 2 (11.8%) | 15 (88.2%) |
| Total (Overall) | 27 (43.5%) | 35 (56.5%) |
Natural Resources, Construction and Maintenance Occupations
The most common Natural Resources, Construction and Maintenance occupations in Haigler are Farming, Fishing & Forestry (12 | 19.4%), and Construction & Extraction (1 | 1.6%).
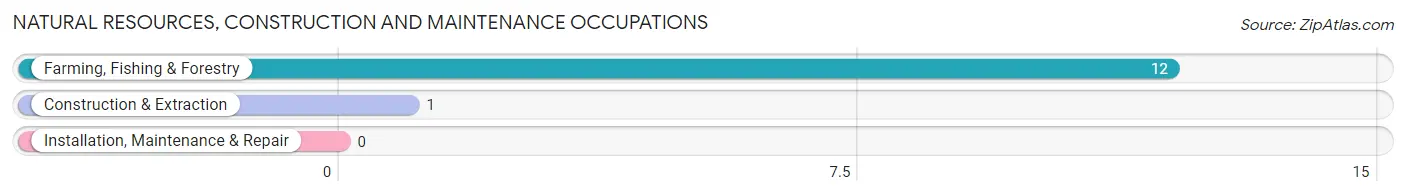
Natural Resources, Construction and Maintenance Occupations by Sex
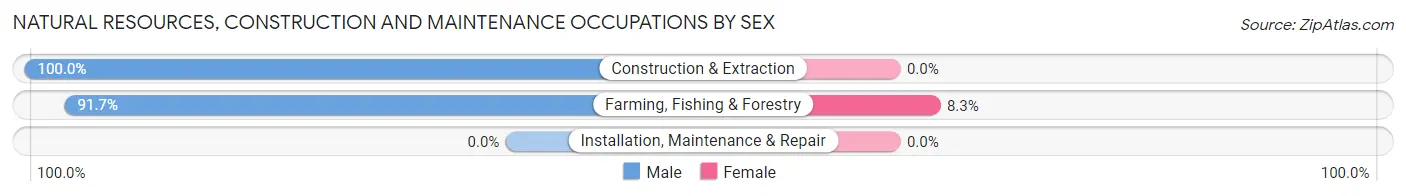
| Occupation | Male | Female |
| Farming, Fishing & Forestry | 11 (91.7%) | 1 (8.3%) |
| Construction & Extraction | 1 (100.0%) | 0 (0.0%) |
| Installation, Maintenance & Repair | 0 (0.0%) | 0 (0.0%) |
| Total (Category) | 12 (92.3%) | 1 (7.7%) |
| Total (Overall) | 27 (43.5%) | 35 (56.5%) |
Production, Transportation and Moving Occupations
The most common Production, Transportation and Moving occupations in Haigler are , and Transportation (4 | 6.5%).
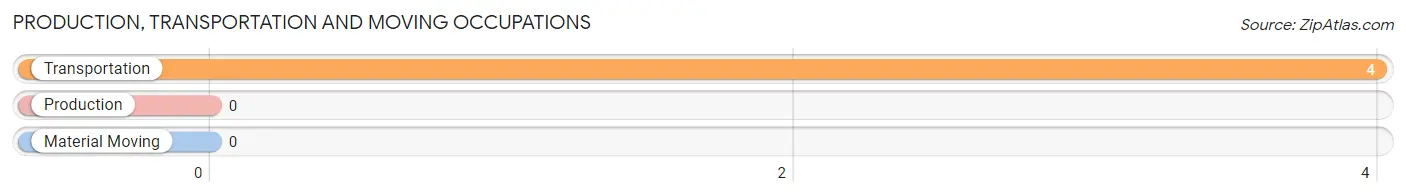
Production, Transportation and Moving Occupations by Sex
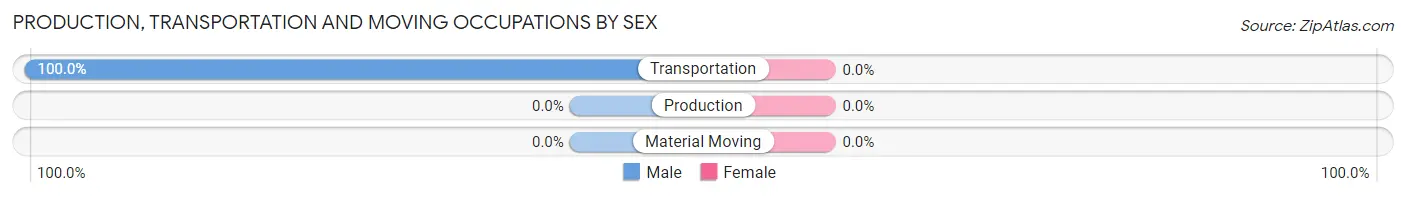
| Occupation | Male | Female |
| Production | 0 (0.0%) | 0 (0.0%) |
| Transportation | 4 (100.0%) | 0 (0.0%) |
| Material Moving | 0 (0.0%) | 0 (0.0%) |
| Total (Category) | 4 (100.0%) | 0 (0.0%) |
| Total (Overall) | 27 (43.5%) | 35 (56.5%) |
Employment Industries by Sex in Haigler
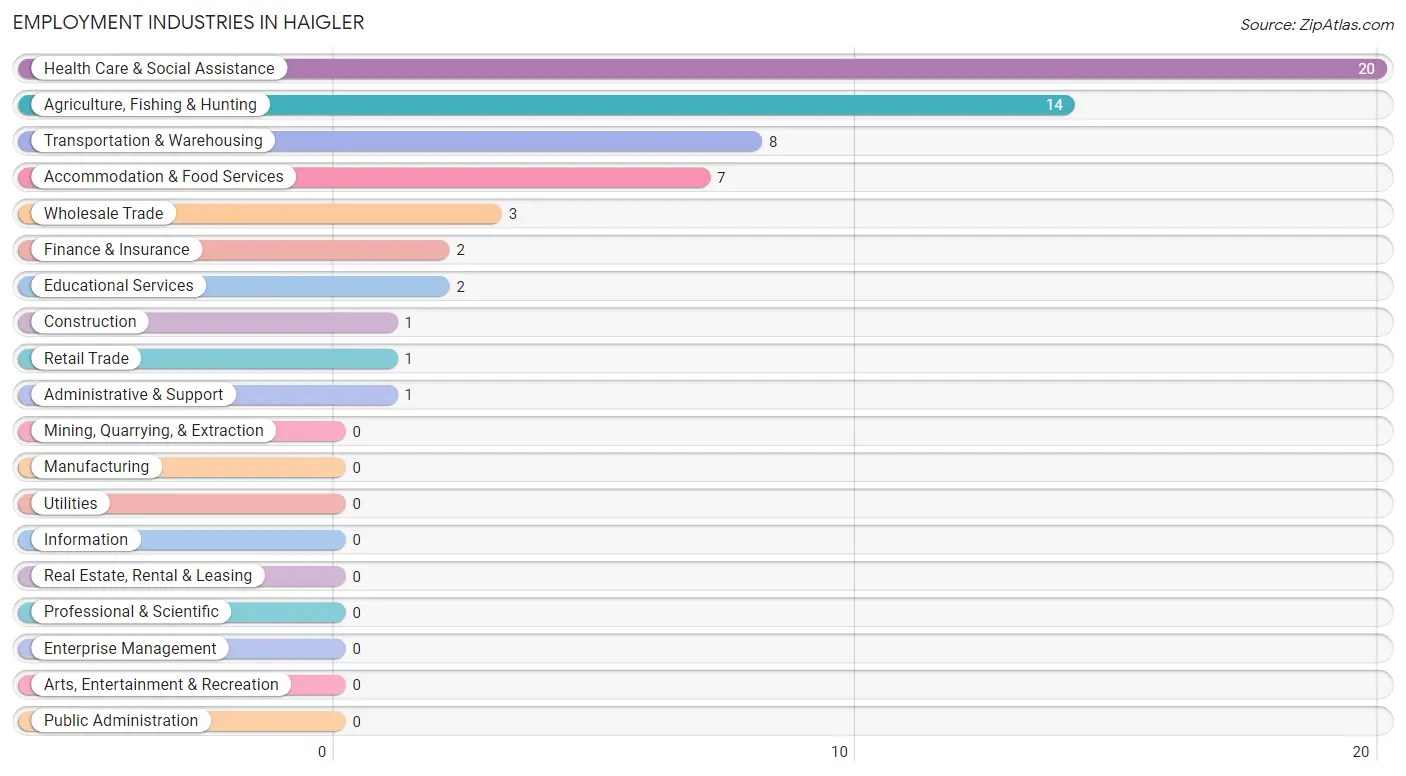
Employment Industries in Haigler
The major employment industries in Haigler include Health Care & Social Assistance (20 | 32.3%), Agriculture, Fishing & Hunting (14 | 22.6%), Transportation & Warehousing (8 | 12.9%), Accommodation & Food Services (7 | 11.3%), and Wholesale Trade (3 | 4.8%).
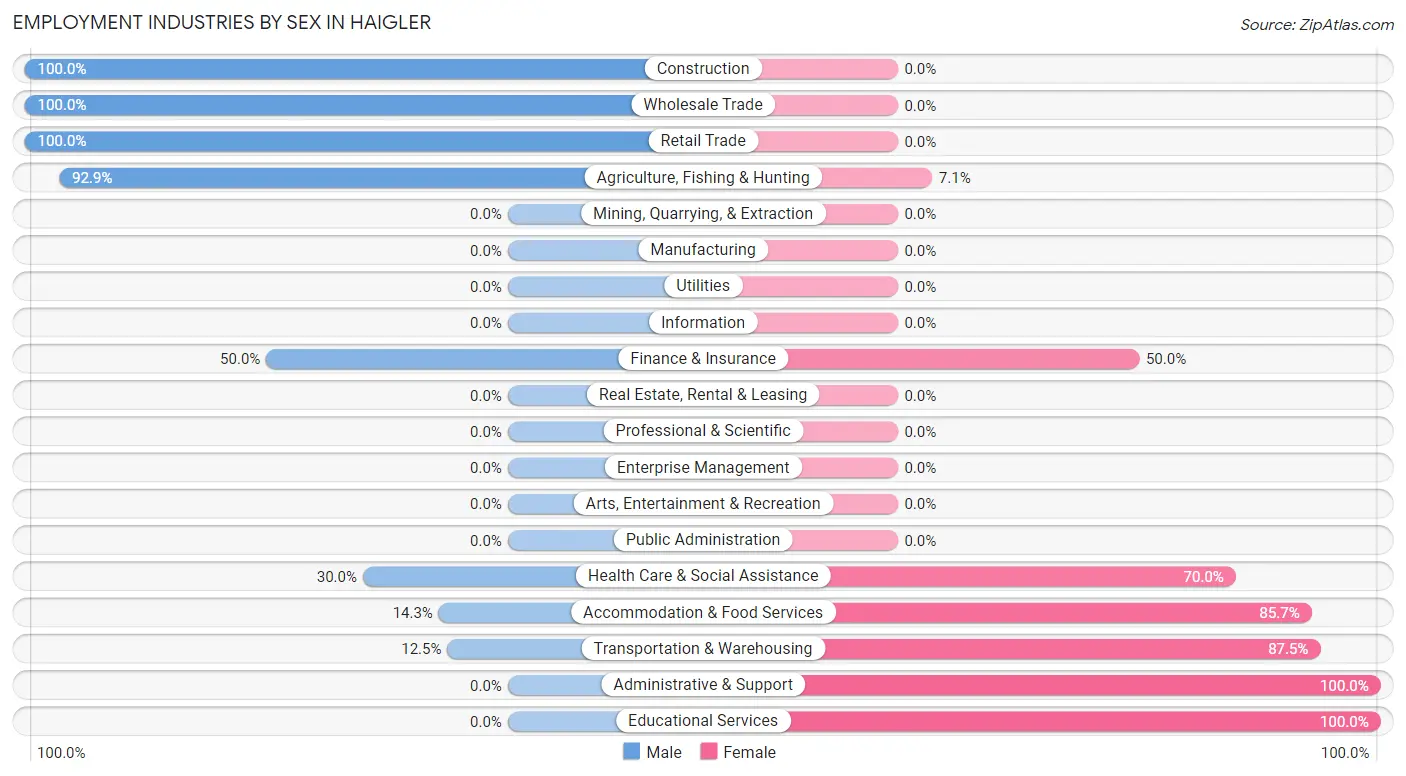
Employment Industries by Sex in Haigler
The Haigler industries that see more men than women are Construction (100.0%), Wholesale Trade (100.0%), and Retail Trade (100.0%), whereas the industries that tend to have a higher number of women are Administrative & Support (100.0%), Educational Services (100.0%), and Transportation & Warehousing (87.5%).
| Industry | Male | Female |
| Agriculture, Fishing & Hunting | 13 (92.9%) | 1 (7.1%) |
| Mining, Quarrying, & Extraction | 0 (0.0%) | 0 (0.0%) |
| Construction | 1 (100.0%) | 0 (0.0%) |
| Manufacturing | 0 (0.0%) | 0 (0.0%) |
| Wholesale Trade | 3 (100.0%) | 0 (0.0%) |
| Retail Trade | 1 (100.0%) | 0 (0.0%) |
| Transportation & Warehousing | 1 (12.5%) | 7 (87.5%) |
| Utilities | 0 (0.0%) | 0 (0.0%) |
| Information | 0 (0.0%) | 0 (0.0%) |
| Finance & Insurance | 1 (50.0%) | 1 (50.0%) |
| Real Estate, Rental & Leasing | 0 (0.0%) | 0 (0.0%) |
| Professional & Scientific | 0 (0.0%) | 0 (0.0%) |
| Enterprise Management | 0 (0.0%) | 0 (0.0%) |
| Administrative & Support | 0 (0.0%) | 1 (100.0%) |
| Educational Services | 0 (0.0%) | 2 (100.0%) |
| Health Care & Social Assistance | 6 (30.0%) | 14 (70.0%) |
| Arts, Entertainment & Recreation | 0 (0.0%) | 0 (0.0%) |
| Accommodation & Food Services | 1 (14.3%) | 6 (85.7%) |
| Public Administration | 0 (0.0%) | 0 (0.0%) |
| Total | 27 (43.5%) | 35 (56.5%) |
Education in Haigler
School Enrollment in Haigler
The most common levels of schooling among the 27 students in Haigler are elementary school (11 | 40.7%), kindergarten (7 | 25.9%), and college / undergraduate (5 | 18.5%).
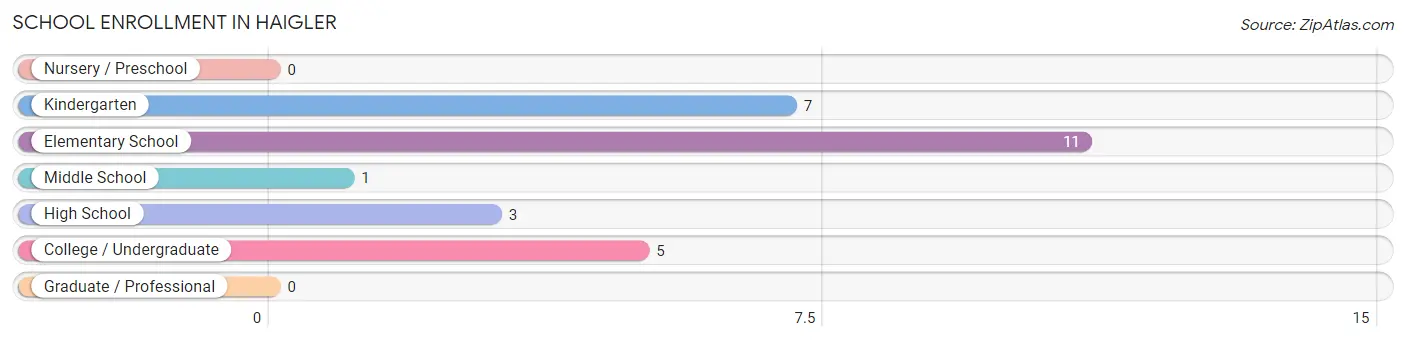
| School Level | # Students | % Students |
| Nursery / Preschool | 0 | 0.0% |
| Kindergarten | 7 | 25.9% |
| Elementary School | 11 | 40.7% |
| Middle School | 1 | 3.7% |
| High School | 3 | 11.1% |
| College / Undergraduate | 5 | 18.5% |
| Graduate / Professional | 0 | 0.0% |
| Total | 27 | 100.0% |
School Enrollment by Age by Funding Source in Haigler
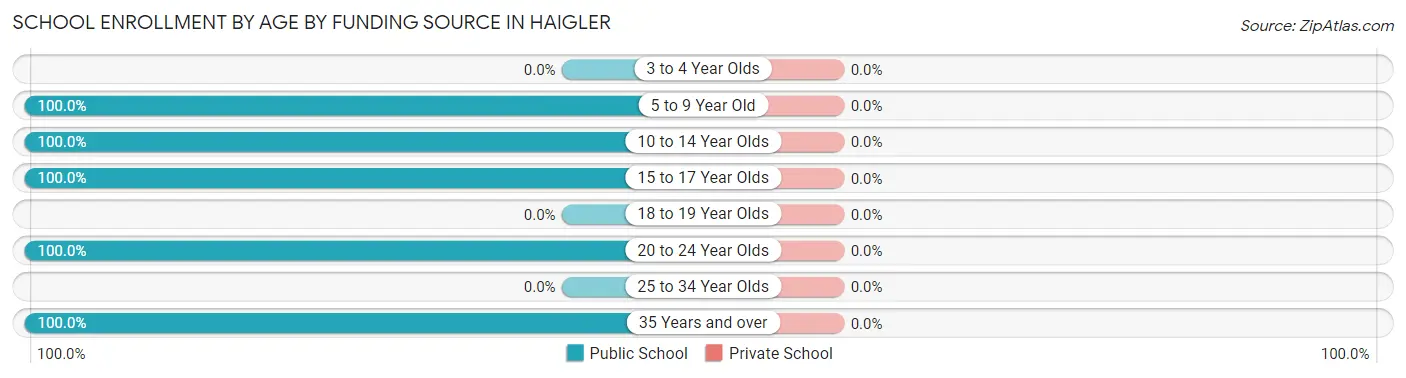
| Age Bracket | Public School | Private School |
| 3 to 4 Year Olds | 0 (0.0%) | 0 (0.0%) |
| 5 to 9 Year Old | 18 (100.0%) | 0 (0.0%) |
| 10 to 14 Year Olds | 1 (100.0%) | 0 (0.0%) |
| 15 to 17 Year Olds | 3 (100.0%) | 0 (0.0%) |
| 18 to 19 Year Olds | 0 (0.0%) | 0 (0.0%) |
| 20 to 24 Year Olds | 3 (100.0%) | 0 (0.0%) |
| 25 to 34 Year Olds | 0 (0.0%) | 0 (0.0%) |
| 35 Years and over | 2 (100.0%) | 0 (0.0%) |
| Total | 27 (100.0%) | 0 (0.0%) |
Educational Attainment by Field of Study in Haigler
Education (5 | 50.0%), engineering (3 | 30.0%), and bio, nature & agricultural (2 | 20.0%) are the most common fields of study among 10 individuals in Haigler who have obtained a bachelor's degree or higher.
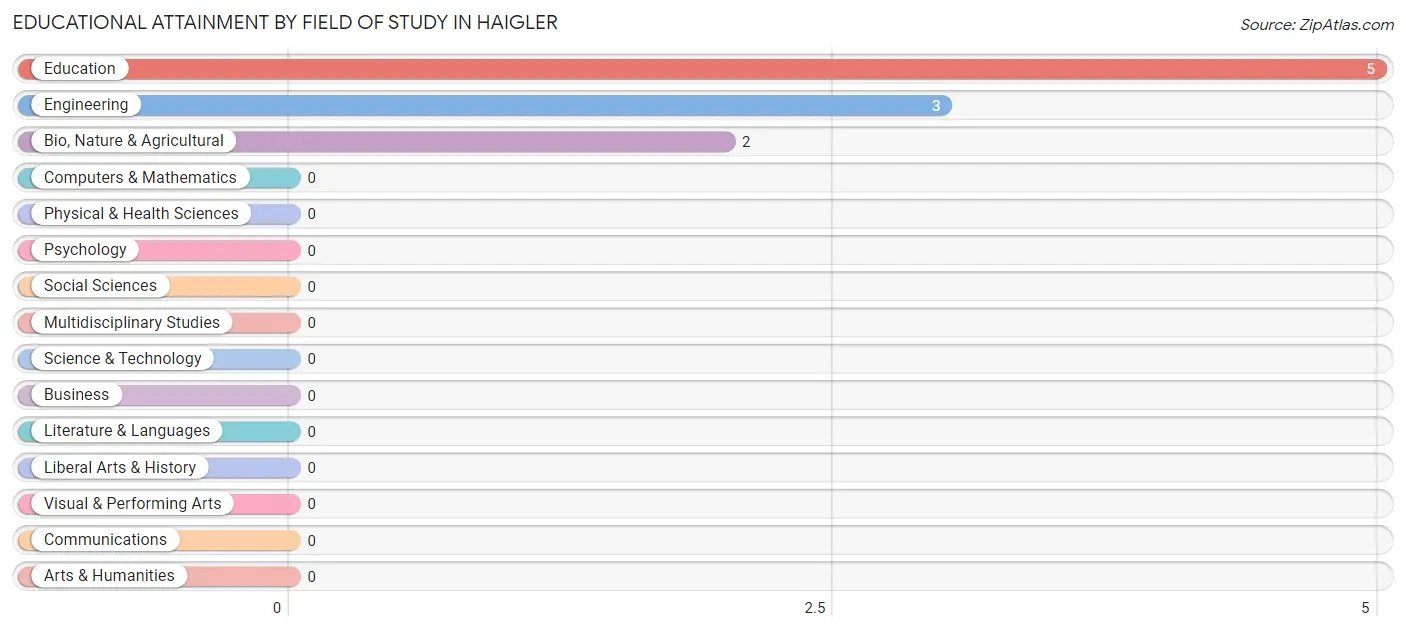
| Field of Study | # Graduates | % Graduates |
| Computers & Mathematics | 0 | 0.0% |
| Bio, Nature & Agricultural | 2 | 20.0% |
| Physical & Health Sciences | 0 | 0.0% |
| Psychology | 0 | 0.0% |
| Social Sciences | 0 | 0.0% |
| Engineering | 3 | 30.0% |
| Multidisciplinary Studies | 0 | 0.0% |
| Science & Technology | 0 | 0.0% |
| Business | 0 | 0.0% |
| Education | 5 | 50.0% |
| Literature & Languages | 0 | 0.0% |
| Liberal Arts & History | 0 | 0.0% |
| Visual & Performing Arts | 0 | 0.0% |
| Communications | 0 | 0.0% |
| Arts & Humanities | 0 | 0.0% |
| Total | 10 | 100.0% |
Transportation & Commute in Haigler
Vehicle Availability by Sex in Haigler
The most prevalent vehicle ownership categories in Haigler are males with 3 vehicles (15, accounting for 55.6%) and females with 3 vehicles (7, making up 48.4%).
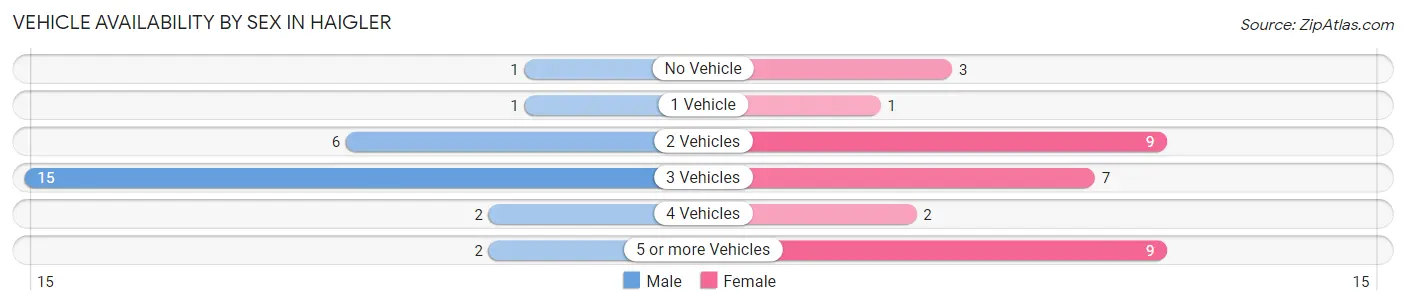
| Vehicles Available | Male | Female |
| No Vehicle | 1 (3.7%) | 3 (9.7%) |
| 1 Vehicle | 1 (3.7%) | 1 (3.2%) |
| 2 Vehicles | 6 (22.2%) | 9 (29.0%) |
| 3 Vehicles | 15 (55.6%) | 7 (22.6%) |
| 4 Vehicles | 2 (7.4%) | 2 (6.5%) |
| 5 or more Vehicles | 2 (7.4%) | 9 (29.0%) |
| Total | 27 (100.0%) | 31 (100.0%) |
Commute Time in Haigler
The most frequently occuring commute durations in Haigler are 30 to 34 minutes (22 commuters, 38.6%), 25 to 29 minutes (12 commuters, 21.0%), and 5 to 9 minutes (7 commuters, 12.3%).
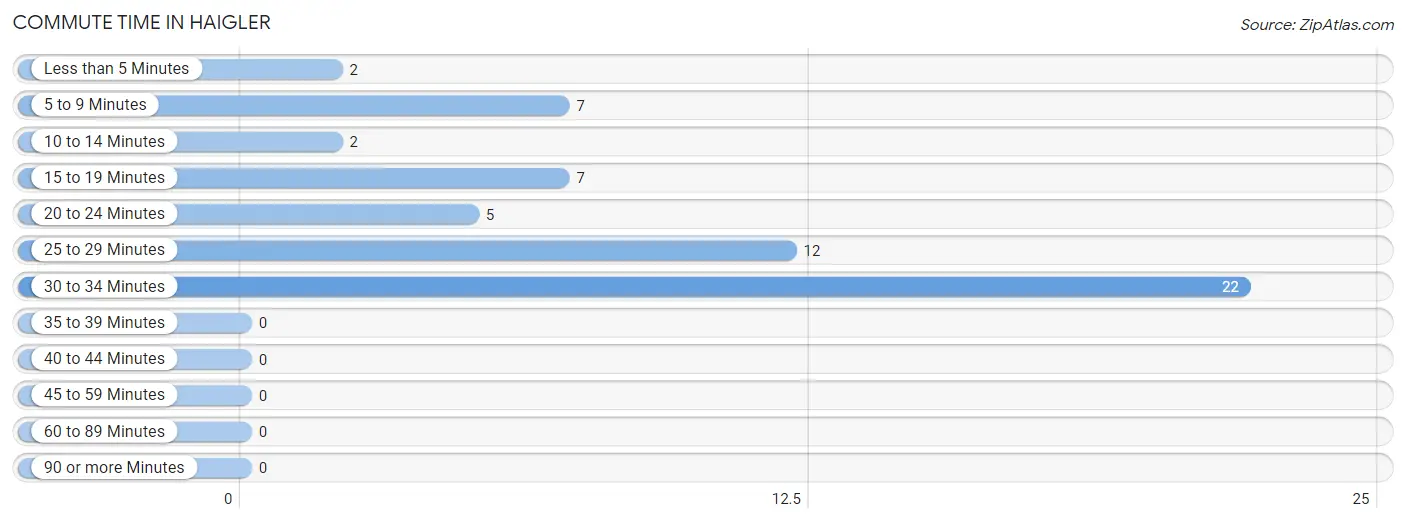
| Commute Time | # Commuters | % Commuters |
| Less than 5 Minutes | 2 | 3.5% |
| 5 to 9 Minutes | 7 | 12.3% |
| 10 to 14 Minutes | 2 | 3.5% |
| 15 to 19 Minutes | 7 | 12.3% |
| 20 to 24 Minutes | 5 | 8.8% |
| 25 to 29 Minutes | 12 | 21.0% |
| 30 to 34 Minutes | 22 | 38.6% |
| 35 to 39 Minutes | 0 | 0.0% |
| 40 to 44 Minutes | 0 | 0.0% |
| 45 to 59 Minutes | 0 | 0.0% |
| 60 to 89 Minutes | 0 | 0.0% |
| 90 or more Minutes | 0 | 0.0% |
Commute Time by Sex in Haigler
The most common commute times in Haigler are 30 to 34 minutes (8 commuters, 30.8%) for males and 30 to 34 minutes (14 commuters, 45.2%) for females.
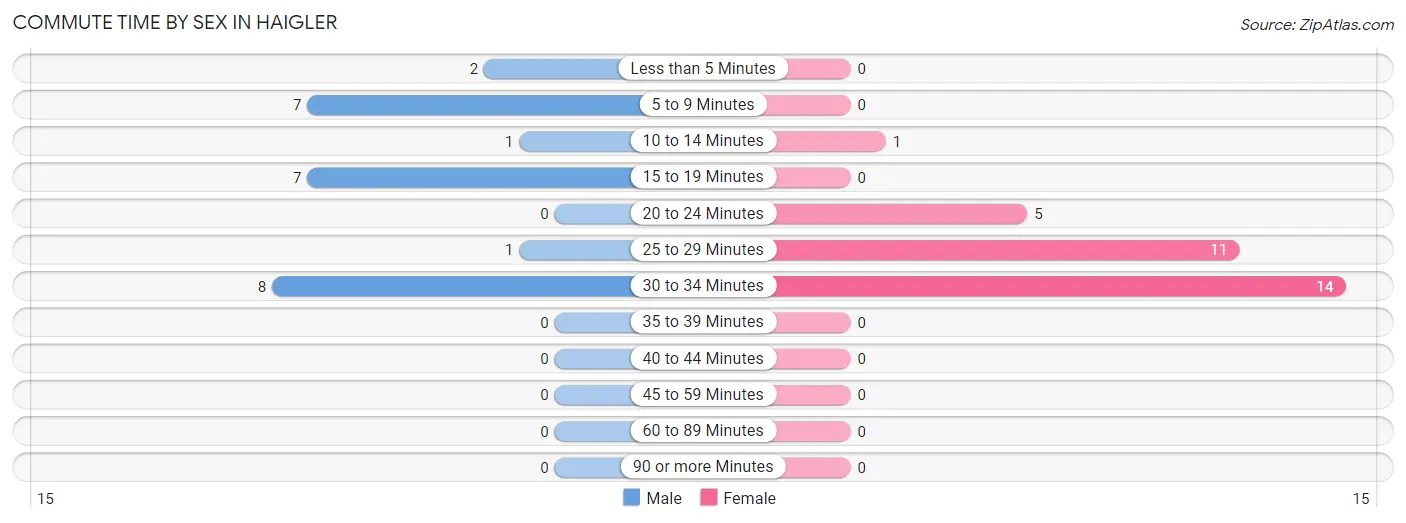
| Commute Time | Male | Female |
| Less than 5 Minutes | 2 (7.7%) | 0 (0.0%) |
| 5 to 9 Minutes | 7 (26.9%) | 0 (0.0%) |
| 10 to 14 Minutes | 1 (3.8%) | 1 (3.2%) |
| 15 to 19 Minutes | 7 (26.9%) | 0 (0.0%) |
| 20 to 24 Minutes | 0 (0.0%) | 5 (16.1%) |
| 25 to 29 Minutes | 1 (3.8%) | 11 (35.5%) |
| 30 to 34 Minutes | 8 (30.8%) | 14 (45.2%) |
| 35 to 39 Minutes | 0 (0.0%) | 0 (0.0%) |
| 40 to 44 Minutes | 0 (0.0%) | 0 (0.0%) |
| 45 to 59 Minutes | 0 (0.0%) | 0 (0.0%) |
| 60 to 89 Minutes | 0 (0.0%) | 0 (0.0%) |
| 90 or more Minutes | 0 (0.0%) | 0 (0.0%) |
Time of Departure to Work by Sex in Haigler
The most frequent times of departure to work in Haigler are 6:30 AM to 6:59 AM (8, 30.8%) for males and 6:30 AM to 6:59 AM (17, 54.8%) for females.
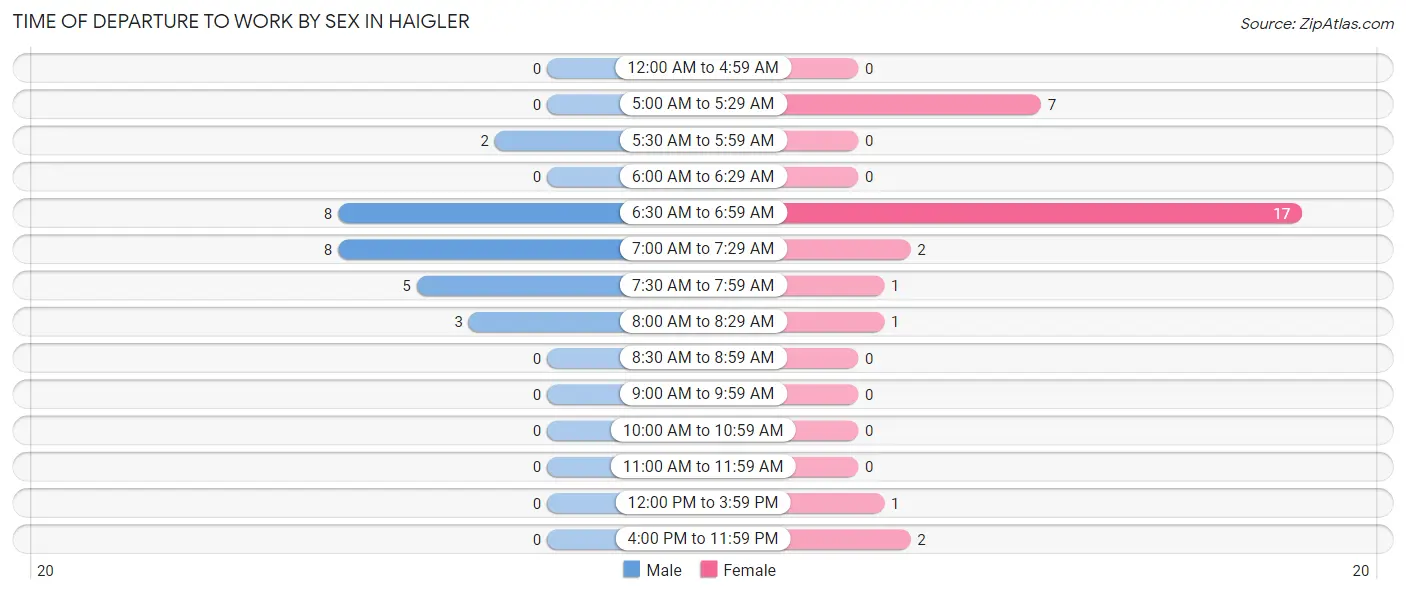
| Time of Departure | Male | Female |
| 12:00 AM to 4:59 AM | 0 (0.0%) | 0 (0.0%) |
| 5:00 AM to 5:29 AM | 0 (0.0%) | 7 (22.6%) |
| 5:30 AM to 5:59 AM | 2 (7.7%) | 0 (0.0%) |
| 6:00 AM to 6:29 AM | 0 (0.0%) | 0 (0.0%) |
| 6:30 AM to 6:59 AM | 8 (30.8%) | 17 (54.8%) |
| 7:00 AM to 7:29 AM | 8 (30.8%) | 2 (6.5%) |
| 7:30 AM to 7:59 AM | 5 (19.2%) | 1 (3.2%) |
| 8:00 AM to 8:29 AM | 3 (11.5%) | 1 (3.2%) |
| 8:30 AM to 8:59 AM | 0 (0.0%) | 0 (0.0%) |
| 9:00 AM to 9:59 AM | 0 (0.0%) | 0 (0.0%) |
| 10:00 AM to 10:59 AM | 0 (0.0%) | 0 (0.0%) |
| 11:00 AM to 11:59 AM | 0 (0.0%) | 0 (0.0%) |
| 12:00 PM to 3:59 PM | 0 (0.0%) | 1 (3.2%) |
| 4:00 PM to 11:59 PM | 0 (0.0%) | 2 (6.5%) |
| Total | 26 (100.0%) | 31 (100.0%) |
Housing Occupancy in Haigler
Occupancy by Ownership in Haigler
Of the total 65 dwellings in Haigler, owner-occupied units account for 53 (81.5%), while renter-occupied units make up 12 (18.5%).
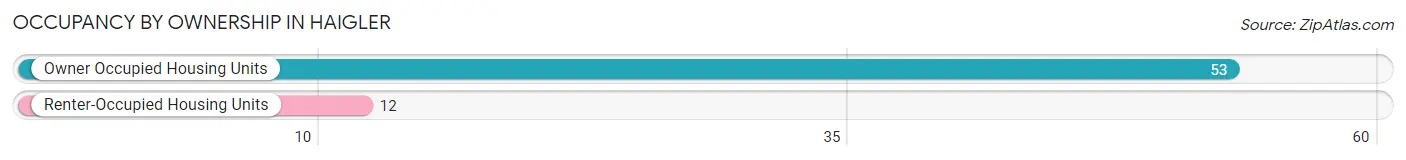
| Occupancy | # Housing Units | % Housing Units |
| Owner Occupied Housing Units | 53 | 81.5% |
| Renter-Occupied Housing Units | 12 | 18.5% |
| Total Occupied Housing Units | 65 | 100.0% |
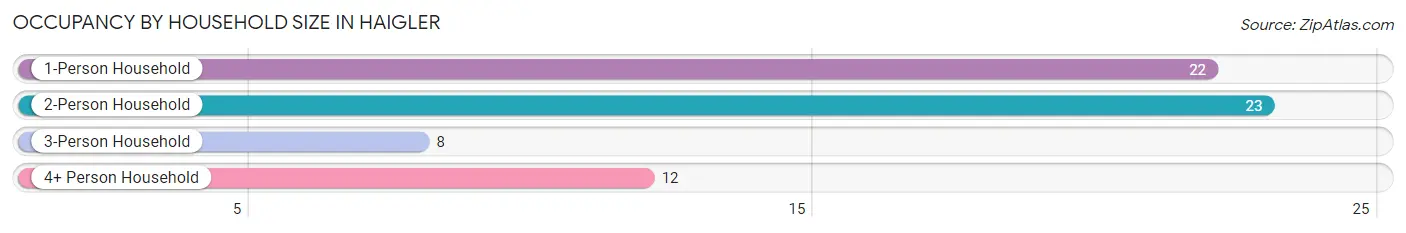
Occupancy by Household Size in Haigler
| Household Size | # Housing Units | % Housing Units |
| 1-Person Household | 22 | 33.9% |
| 2-Person Household | 23 | 35.4% |
| 3-Person Household | 8 | 12.3% |
| 4+ Person Household | 12 | 18.5% |
| Total Housing Units | 65 | 100.0% |
Occupancy by Ownership by Household Size in Haigler
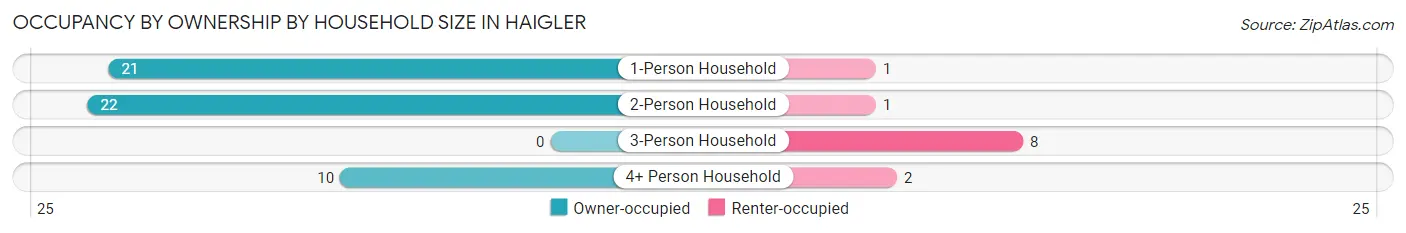
| Household Size | Owner-occupied | Renter-occupied |
| 1-Person Household | 21 (95.5%) | 1 (4.5%) |
| 2-Person Household | 22 (95.7%) | 1 (4.3%) |
| 3-Person Household | 0 (0.0%) | 8 (100.0%) |
| 4+ Person Household | 10 (83.3%) | 2 (16.7%) |
| Total Housing Units | 53 (81.5%) | 12 (18.5%) |
Occupancy by Educational Attainment in Haigler
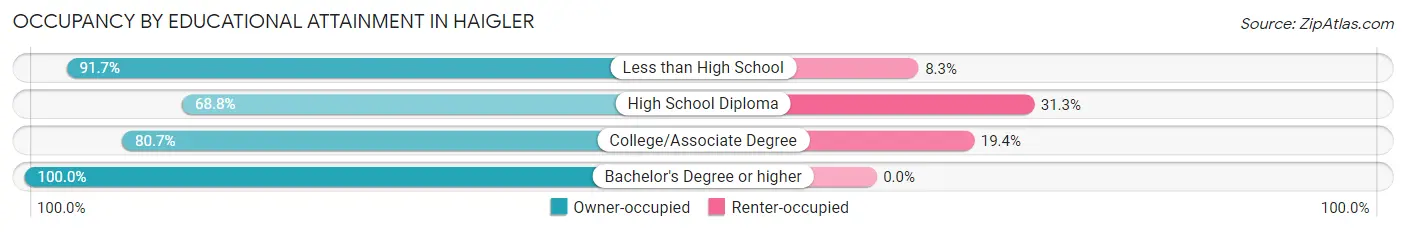
| Household Size | Owner-occupied | Renter-occupied |
| Less than High School | 11 (91.7%) | 1 (8.3%) |
| High School Diploma | 11 (68.8%) | 5 (31.2%) |
| College/Associate Degree | 25 (80.6%) | 6 (19.4%) |
| Bachelor's Degree or higher | 6 (100.0%) | 0 (0.0%) |
Occupancy by Age of Householder in Haigler
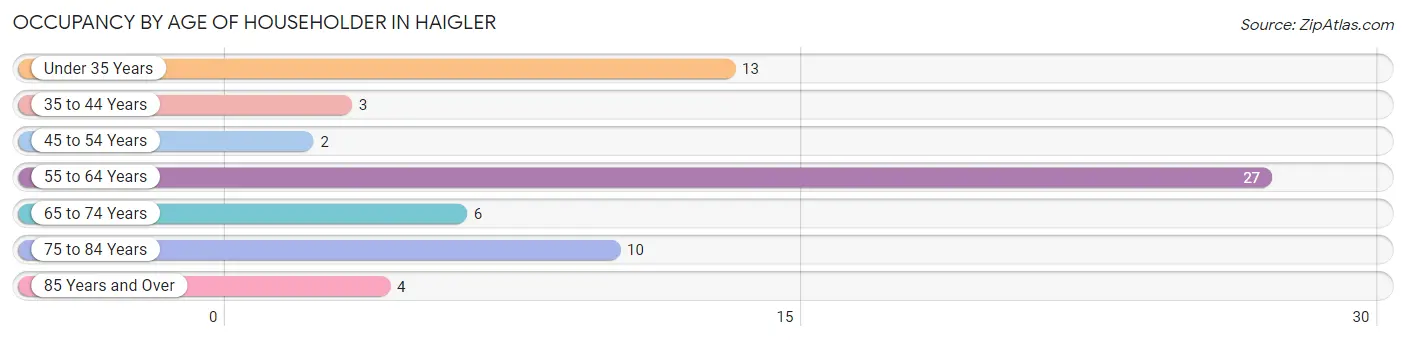
| Age Bracket | # Households | % Households |
| Under 35 Years | 13 | 20.0% |
| 35 to 44 Years | 3 | 4.6% |
| 45 to 54 Years | 2 | 3.1% |
| 55 to 64 Years | 27 | 41.5% |
| 65 to 74 Years | 6 | 9.2% |
| 75 to 84 Years | 10 | 15.4% |
| 85 Years and Over | 4 | 6.1% |
| Total | 65 | 100.0% |
Housing Finances in Haigler
Median Income by Occupancy in Haigler
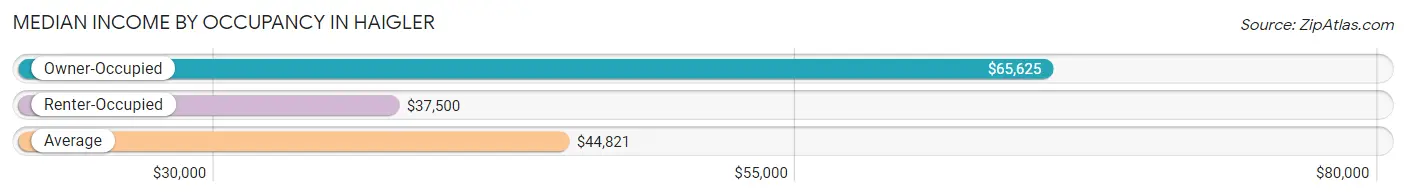
| Occupancy Type | # Households | Median Income |
| Owner-Occupied | 53 (81.5%) | $65,625 |
| Renter-Occupied | 12 (18.5%) | $37,500 |
| Average | 65 (100.0%) | $44,821 |
Occupancy by Householder Income Bracket in Haigler
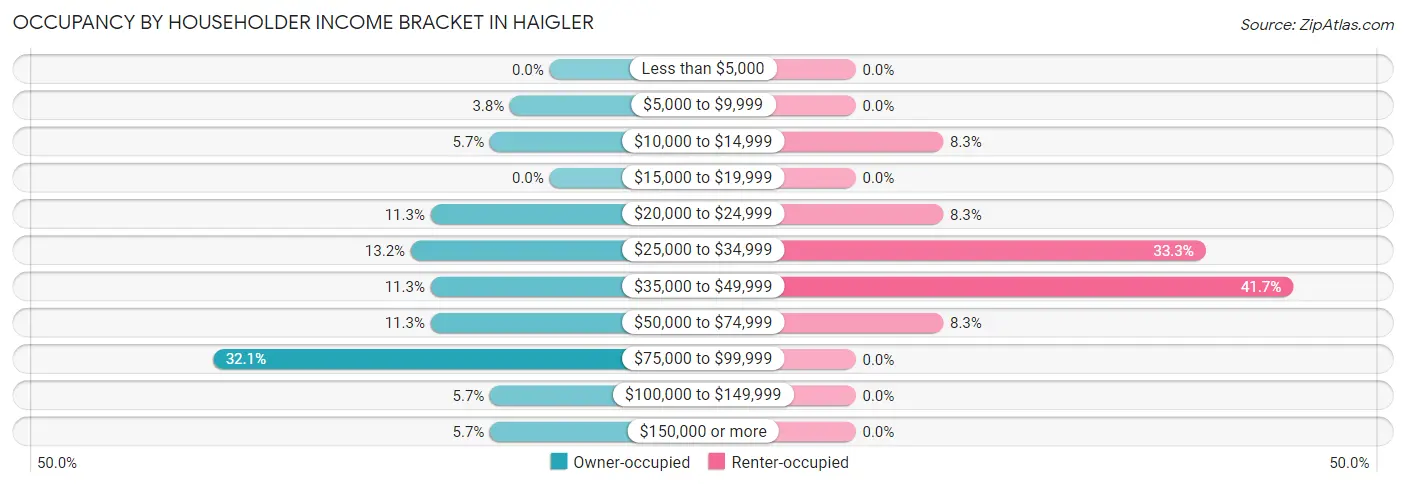
| Income Bracket | Owner-occupied | Renter-occupied |
| Less than $5,000 | 0 (0.0%) | 0 (0.0%) |
| $5,000 to $9,999 | 2 (3.8%) | 0 (0.0%) |
| $10,000 to $14,999 | 3 (5.7%) | 1 (8.3%) |
| $15,000 to $19,999 | 0 (0.0%) | 0 (0.0%) |
| $20,000 to $24,999 | 6 (11.3%) | 1 (8.3%) |
| $25,000 to $34,999 | 7 (13.2%) | 4 (33.3%) |
| $35,000 to $49,999 | 6 (11.3%) | 5 (41.7%) |
| $50,000 to $74,999 | 6 (11.3%) | 1 (8.3%) |
| $75,000 to $99,999 | 17 (32.1%) | 0 (0.0%) |
| $100,000 to $149,999 | 3 (5.7%) | 0 (0.0%) |
| $150,000 or more | 3 (5.7%) | 0 (0.0%) |
| Total | 53 (100.0%) | 12 (100.0%) |
Monthly Housing Cost Tiers in Haigler
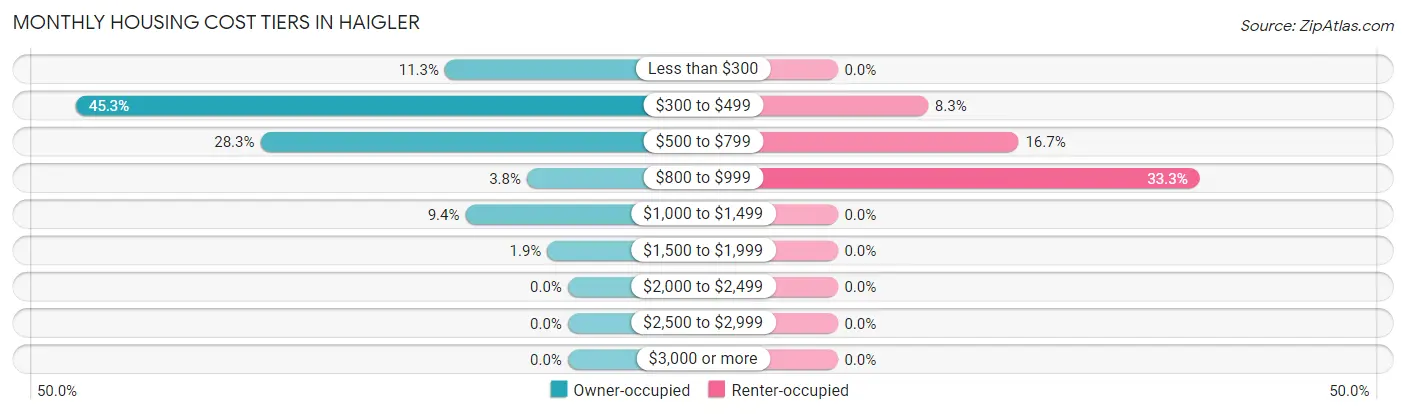
| Monthly Cost | Owner-occupied | Renter-occupied |
| Less than $300 | 6 (11.3%) | 0 (0.0%) |
| $300 to $499 | 24 (45.3%) | 1 (8.3%) |
| $500 to $799 | 15 (28.3%) | 2 (16.7%) |
| $800 to $999 | 2 (3.8%) | 4 (33.3%) |
| $1,000 to $1,499 | 5 (9.4%) | 0 (0.0%) |
| $1,500 to $1,999 | 1 (1.9%) | 0 (0.0%) |
| $2,000 to $2,499 | 0 (0.0%) | 0 (0.0%) |
| $2,500 to $2,999 | 0 (0.0%) | 0 (0.0%) |
| $3,000 or more | 0 (0.0%) | 0 (0.0%) |
| Total | 53 (100.0%) | 12 (100.0%) |
Physical Housing Characteristics in Haigler
Housing Structures in Haigler
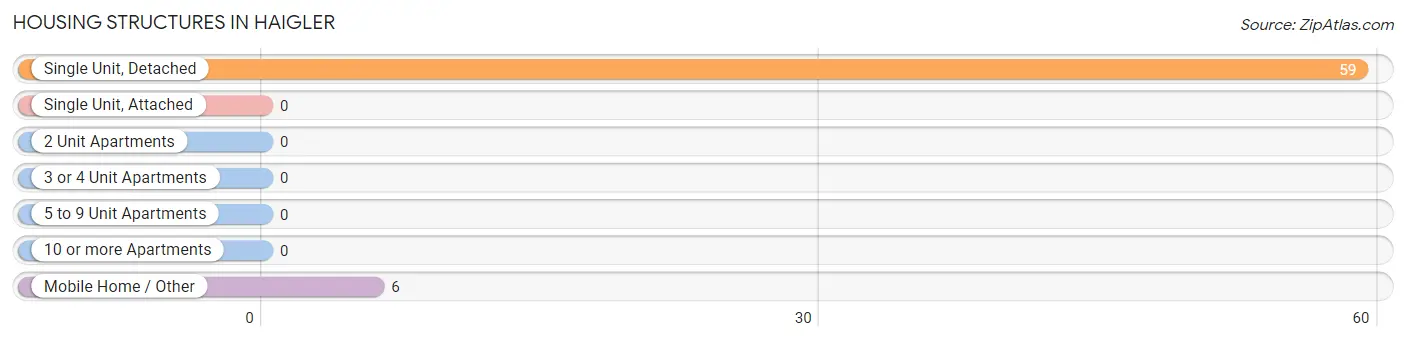
| Structure Type | # Housing Units | % Housing Units |
| Single Unit, Detached | 59 | 90.8% |
| Single Unit, Attached | 0 | 0.0% |
| 2 Unit Apartments | 0 | 0.0% |
| 3 or 4 Unit Apartments | 0 | 0.0% |
| 5 to 9 Unit Apartments | 0 | 0.0% |
| 10 or more Apartments | 0 | 0.0% |
| Mobile Home / Other | 6 | 9.2% |
| Total | 65 | 100.0% |
Housing Structures by Occupancy in Haigler
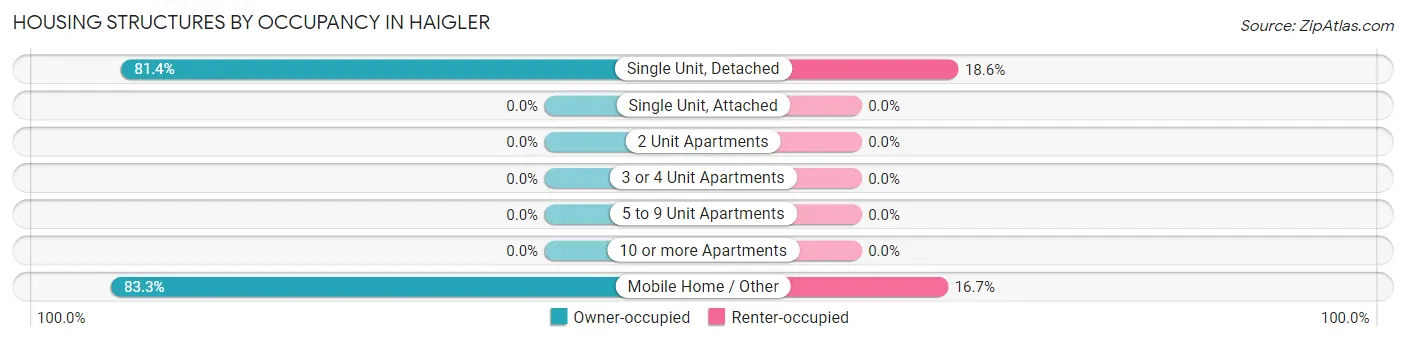
| Structure Type | Owner-occupied | Renter-occupied |
| Single Unit, Detached | 48 (81.4%) | 11 (18.6%) |
| Single Unit, Attached | 0 (0.0%) | 0 (0.0%) |
| 2 Unit Apartments | 0 (0.0%) | 0 (0.0%) |
| 3 or 4 Unit Apartments | 0 (0.0%) | 0 (0.0%) |
| 5 to 9 Unit Apartments | 0 (0.0%) | 0 (0.0%) |
| 10 or more Apartments | 0 (0.0%) | 0 (0.0%) |
| Mobile Home / Other | 5 (83.3%) | 1 (16.7%) |
| Total | 53 (81.5%) | 12 (18.5%) |
Housing Structures by Number of Rooms in Haigler
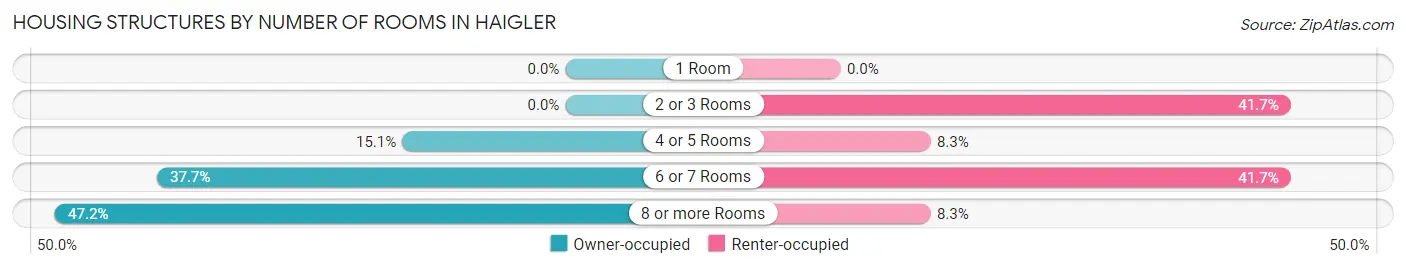
| Number of Rooms | Owner-occupied | Renter-occupied |
| 1 Room | 0 (0.0%) | 0 (0.0%) |
| 2 or 3 Rooms | 0 (0.0%) | 5 (41.7%) |
| 4 or 5 Rooms | 8 (15.1%) | 1 (8.3%) |
| 6 or 7 Rooms | 20 (37.7%) | 5 (41.7%) |
| 8 or more Rooms | 25 (47.2%) | 1 (8.3%) |
| Total | 53 (100.0%) | 12 (100.0%) |
Housing Structure by Heating Type in Haigler
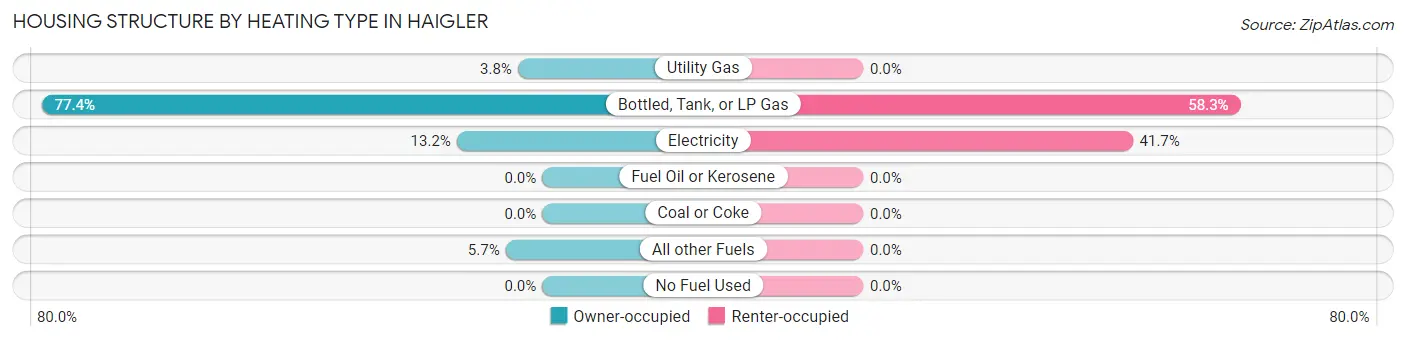
| Heating Type | Owner-occupied | Renter-occupied |
| Utility Gas | 2 (3.8%) | 0 (0.0%) |
| Bottled, Tank, or LP Gas | 41 (77.4%) | 7 (58.3%) |
| Electricity | 7 (13.2%) | 5 (41.7%) |
| Fuel Oil or Kerosene | 0 (0.0%) | 0 (0.0%) |
| Coal or Coke | 0 (0.0%) | 0 (0.0%) |
| All other Fuels | 3 (5.7%) | 0 (0.0%) |
| No Fuel Used | 0 (0.0%) | 0 (0.0%) |
| Total | 53 (100.0%) | 12 (100.0%) |
Household Vehicle Usage in Haigler
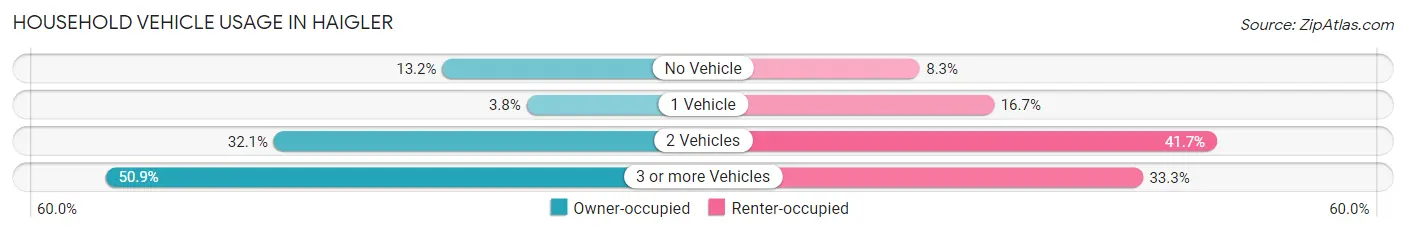
| Vehicles per Household | Owner-occupied | Renter-occupied |
| No Vehicle | 7 (13.2%) | 1 (8.3%) |
| 1 Vehicle | 2 (3.8%) | 2 (16.7%) |
| 2 Vehicles | 17 (32.1%) | 5 (41.7%) |
| 3 or more Vehicles | 27 (50.9%) | 4 (33.3%) |
| Total | 53 (100.0%) | 12 (100.0%) |
Real Estate & Mortgages in Haigler
Real Estate and Mortgage Overview in Haigler
| Characteristic | Without Mortgage | With Mortgage |
| Housing Units | 43 | 10 |
| Median Property Value | $66,900 | $0 |
| Median Household Income | $49,375 | $0 |
| Monthly Housing Costs | $447 | $0 |
| Real Estate Taxes | $650 | $0 |
Property Value by Mortgage Status in Haigler
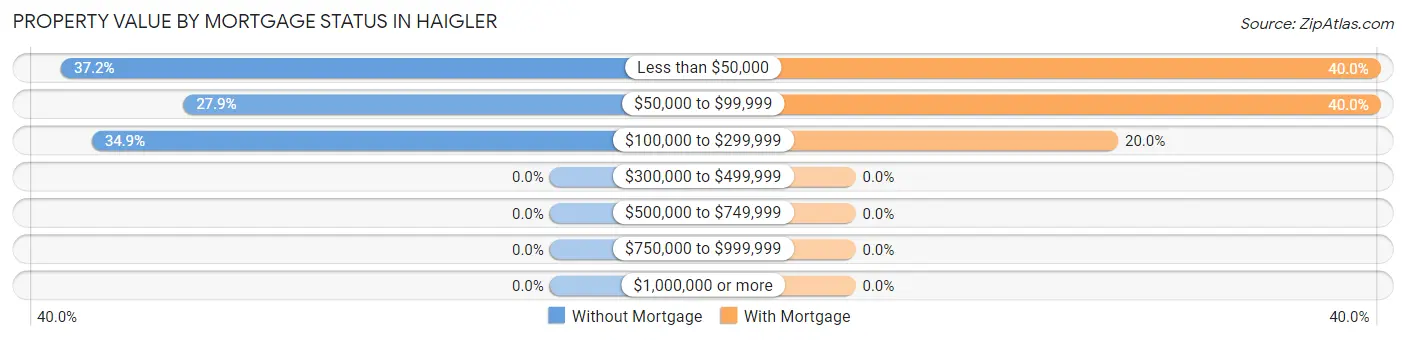
| Property Value | Without Mortgage | With Mortgage |
| Less than $50,000 | 16 (37.2%) | 4 (40.0%) |
| $50,000 to $99,999 | 12 (27.9%) | 4 (40.0%) |
| $100,000 to $299,999 | 15 (34.9%) | 2 (20.0%) |
| $300,000 to $499,999 | 0 (0.0%) | 0 (0.0%) |
| $500,000 to $749,999 | 0 (0.0%) | 0 (0.0%) |
| $750,000 to $999,999 | 0 (0.0%) | 0 (0.0%) |
| $1,000,000 or more | 0 (0.0%) | 0 (0.0%) |
| Total | 43 (100.0%) | 10 (100.0%) |
Household Income by Mortgage Status in Haigler
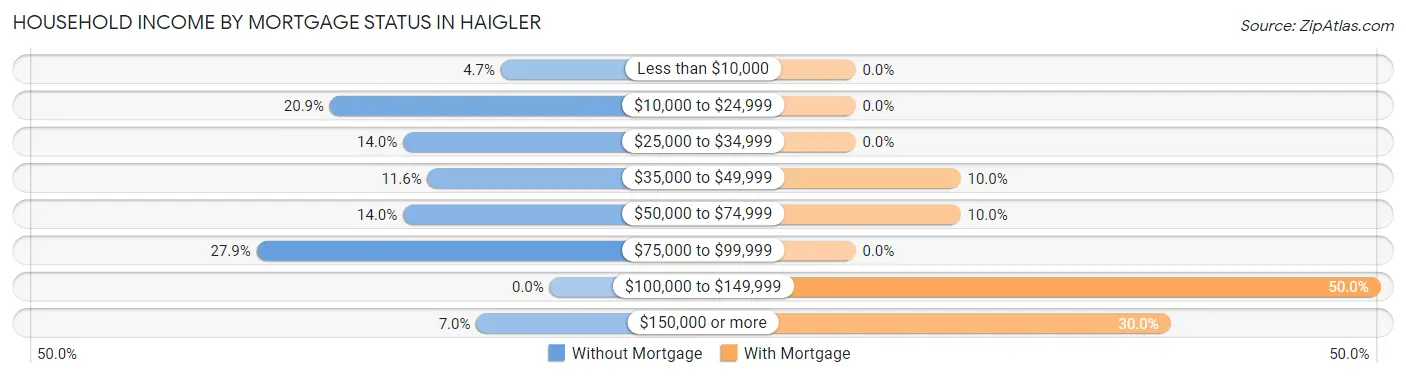
| Household Income | Without Mortgage | With Mortgage |
| Less than $10,000 | 2 (4.6%) | 0 (0.0%) |
| $10,000 to $24,999 | 9 (20.9%) | 0 (0.0%) |
| $25,000 to $34,999 | 6 (14.0%) | 0 (0.0%) |
| $35,000 to $49,999 | 5 (11.6%) | 1 (10.0%) |
| $50,000 to $74,999 | 6 (14.0%) | 1 (10.0%) |
| $75,000 to $99,999 | 12 (27.9%) | 0 (0.0%) |
| $100,000 to $149,999 | 0 (0.0%) | 5 (50.0%) |
| $150,000 or more | 3 (7.0%) | 3 (30.0%) |
| Total | 43 (100.0%) | 10 (100.0%) |
Property Value to Household Income Ratio in Haigler
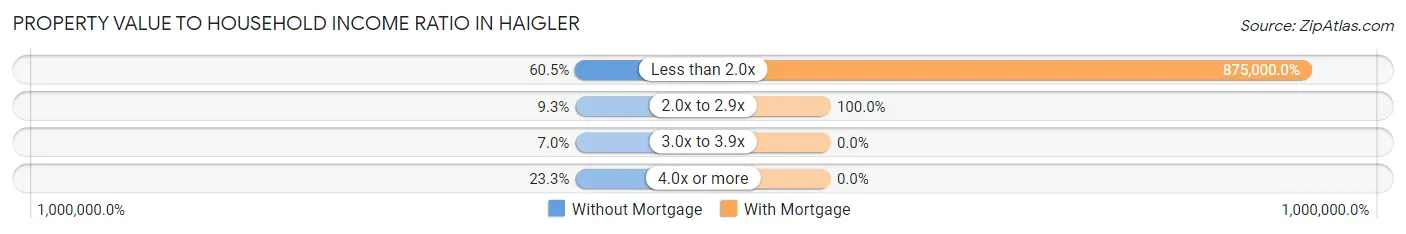
| Value-to-Income Ratio | Without Mortgage | With Mortgage |
| Less than 2.0x | 26 (60.5%) | 87,500 (875,000.0%) |
| 2.0x to 2.9x | 4 (9.3%) | 10 (100.0%) |
| 3.0x to 3.9x | 3 (7.0%) | 0 (0.0%) |
| 4.0x or more | 10 (23.3%) | 0 (0.0%) |
| Total | 43 (100.0%) | 10 (100.0%) |
Real Estate Taxes by Mortgage Status in Haigler
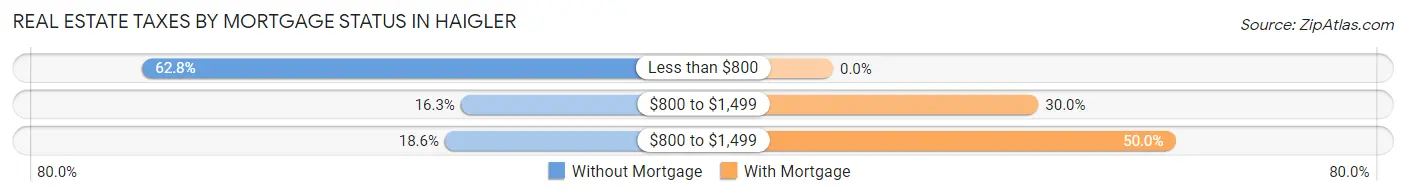
| Property Taxes | Without Mortgage | With Mortgage |
| Less than $800 | 27 (62.8%) | 0 (0.0%) |
| $800 to $1,499 | 7 (16.3%) | 3 (30.0%) |
| $800 to $1,499 | 8 (18.6%) | 5 (50.0%) |
| Total | 43 (100.0%) | 10 (100.0%) |
Health & Disability in Haigler
Health Insurance Coverage by Age in Haigler
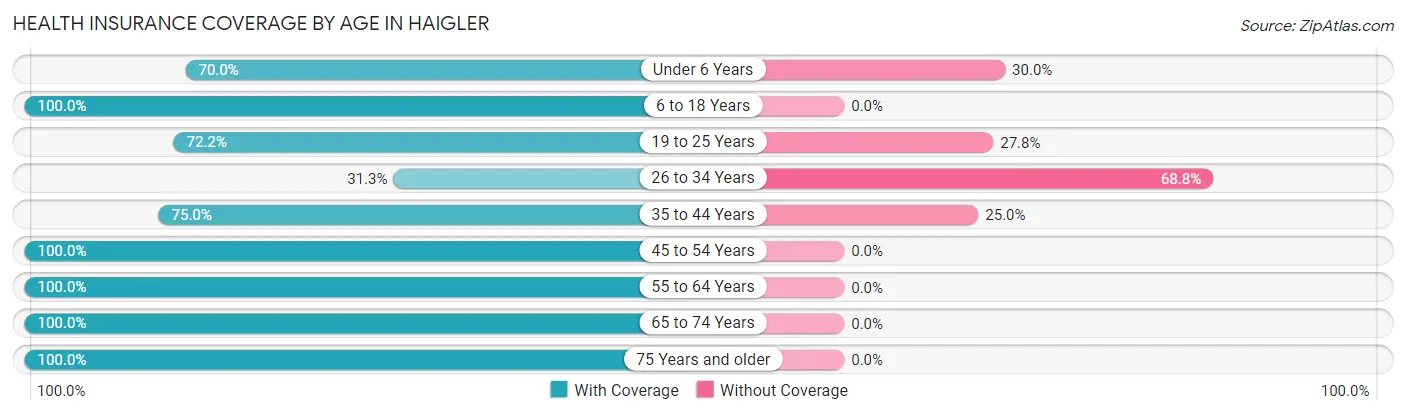
| Age Bracket | With Coverage | Without Coverage |
| Under 6 Years | 21 (70.0%) | 9 (30.0%) |
| 6 to 18 Years | 27 (100.0%) | 0 (0.0%) |
| 19 to 25 Years | 13 (72.2%) | 5 (27.8%) |
| 26 to 34 Years | 5 (31.2%) | 11 (68.8%) |
| 35 to 44 Years | 3 (75.0%) | 1 (25.0%) |
| 45 to 54 Years | 6 (100.0%) | 0 (0.0%) |
| 55 to 64 Years | 30 (100.0%) | 0 (0.0%) |
| 65 to 74 Years | 18 (100.0%) | 0 (0.0%) |
| 75 Years and older | 16 (100.0%) | 0 (0.0%) |
| Total | 139 (84.2%) | 26 (15.8%) |
Health Insurance Coverage by Citizenship Status in Haigler
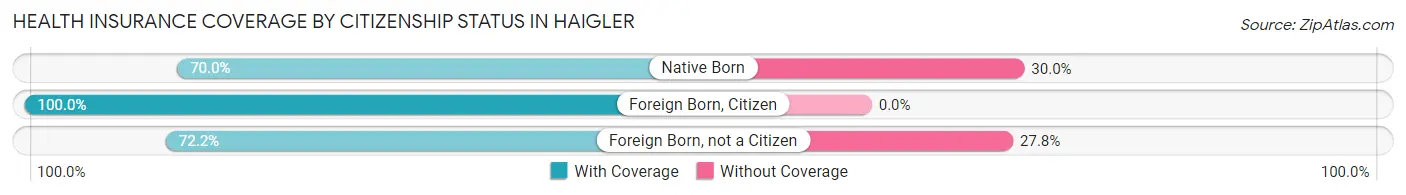
| Citizenship Status | With Coverage | Without Coverage |
| Native Born | 21 (70.0%) | 9 (30.0%) |
| Foreign Born, Citizen | 27 (100.0%) | 0 (0.0%) |
| Foreign Born, not a Citizen | 13 (72.2%) | 5 (27.8%) |
Health Insurance Coverage by Household Income in Haigler
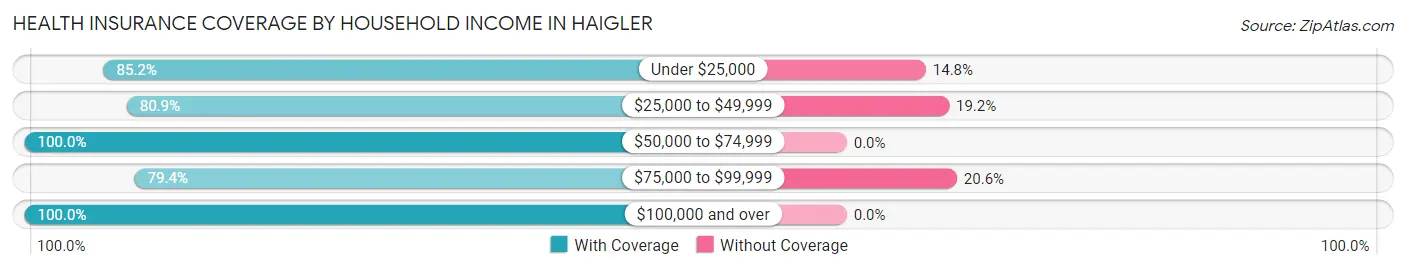
| Household Income | With Coverage | Without Coverage |
| Under $25,000 | 23 (85.2%) | 4 (14.8%) |
| $25,000 to $49,999 | 38 (80.8%) | 9 (19.2%) |
| $50,000 to $74,999 | 14 (100.0%) | 0 (0.0%) |
| $75,000 to $99,999 | 50 (79.4%) | 13 (20.6%) |
| $100,000 and over | 14 (100.0%) | 0 (0.0%) |
Public vs Private Health Insurance Coverage by Age in Haigler
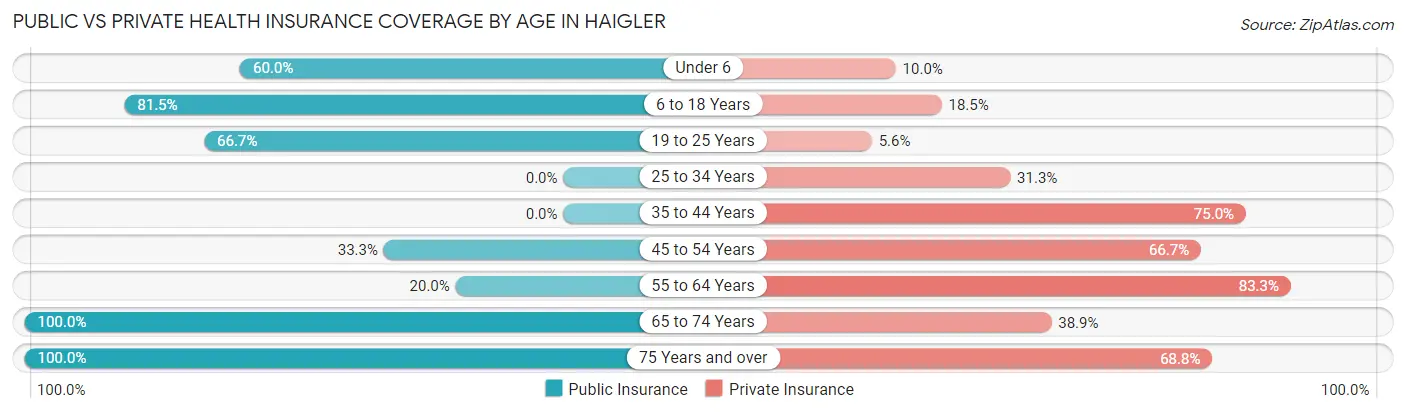
| Age Bracket | Public Insurance | Private Insurance |
| Under 6 | 18 (60.0%) | 3 (10.0%) |
| 6 to 18 Years | 22 (81.5%) | 5 (18.5%) |
| 19 to 25 Years | 12 (66.7%) | 1 (5.6%) |
| 25 to 34 Years | 0 (0.0%) | 5 (31.2%) |
| 35 to 44 Years | 0 (0.0%) | 3 (75.0%) |
| 45 to 54 Years | 2 (33.3%) | 4 (66.7%) |
| 55 to 64 Years | 6 (20.0%) | 25 (83.3%) |
| 65 to 74 Years | 18 (100.0%) | 7 (38.9%) |
| 75 Years and over | 16 (100.0%) | 11 (68.8%) |
| Total | 94 (57.0%) | 64 (38.8%) |
Disability Status by Sex by Age in Haigler
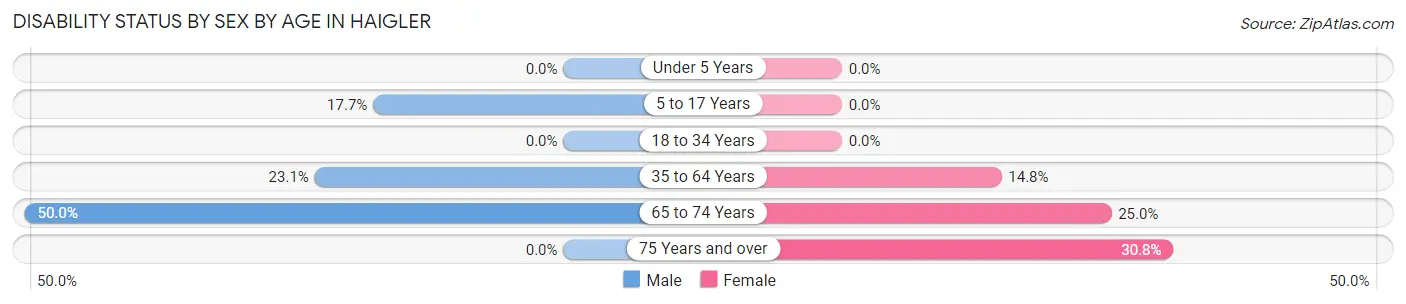
| Age Bracket | Male | Female |
| Under 5 Years | 0 (0.0%) | 0 (0.0%) |
| 5 to 17 Years | 3 (17.6%) | 0 (0.0%) |
| 18 to 34 Years | 0 (0.0%) | 0 (0.0%) |
| 35 to 64 Years | 3 (23.1%) | 4 (14.8%) |
| 65 to 74 Years | 7 (50.0%) | 1 (25.0%) |
| 75 Years and over | 0 (0.0%) | 4 (30.8%) |
Disability Class by Sex by Age in Haigler
Disability Class: Hearing Difficulty
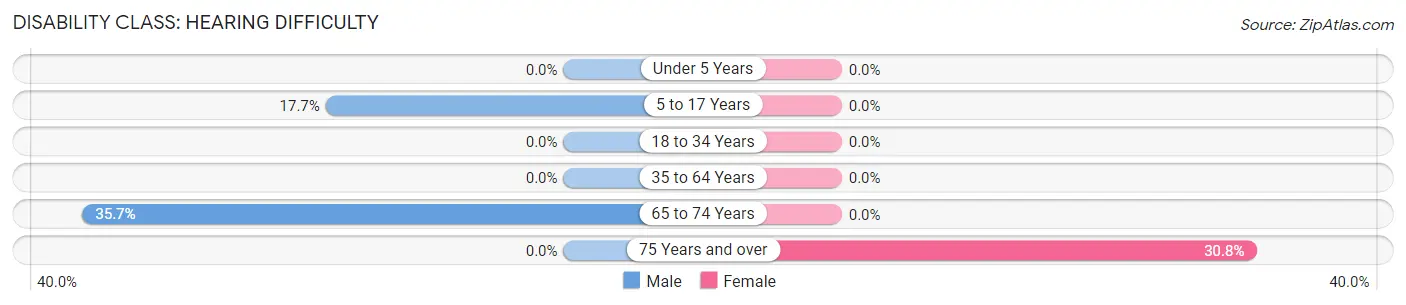
| Age Bracket | Male | Female |
| Under 5 Years | 0 (0.0%) | 0 (0.0%) |
| 5 to 17 Years | 3 (17.6%) | 0 (0.0%) |
| 18 to 34 Years | 0 (0.0%) | 0 (0.0%) |
| 35 to 64 Years | 0 (0.0%) | 0 (0.0%) |
| 65 to 74 Years | 5 (35.7%) | 0 (0.0%) |
| 75 Years and over | 0 (0.0%) | 4 (30.8%) |
Disability Class: Vision Difficulty
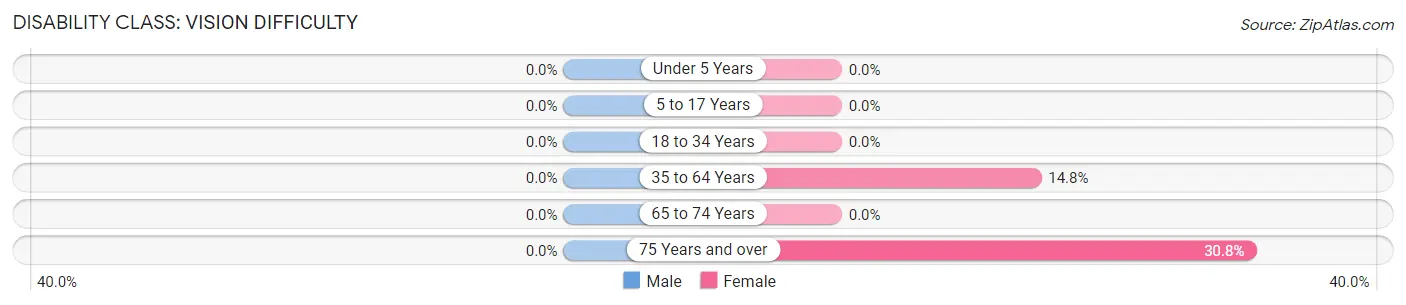
| Age Bracket | Male | Female |
| Under 5 Years | 0 (0.0%) | 0 (0.0%) |
| 5 to 17 Years | 0 (0.0%) | 0 (0.0%) |
| 18 to 34 Years | 0 (0.0%) | 0 (0.0%) |
| 35 to 64 Years | 0 (0.0%) | 4 (14.8%) |
| 65 to 74 Years | 0 (0.0%) | 0 (0.0%) |
| 75 Years and over | 0 (0.0%) | 4 (30.8%) |
Disability Class: Cognitive Difficulty
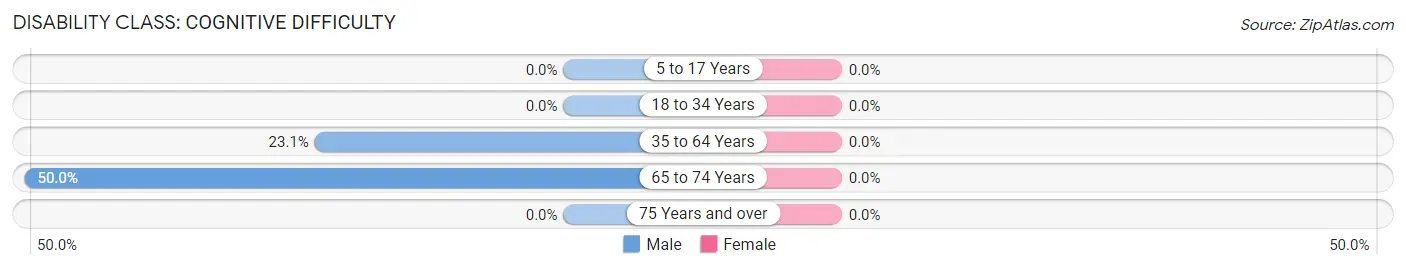
| Age Bracket | Male | Female |
| 5 to 17 Years | 0 (0.0%) | 0 (0.0%) |
| 18 to 34 Years | 0 (0.0%) | 0 (0.0%) |
| 35 to 64 Years | 3 (23.1%) | 0 (0.0%) |
| 65 to 74 Years | 7 (50.0%) | 0 (0.0%) |
| 75 Years and over | 0 (0.0%) | 0 (0.0%) |
Disability Class: Ambulatory Difficulty
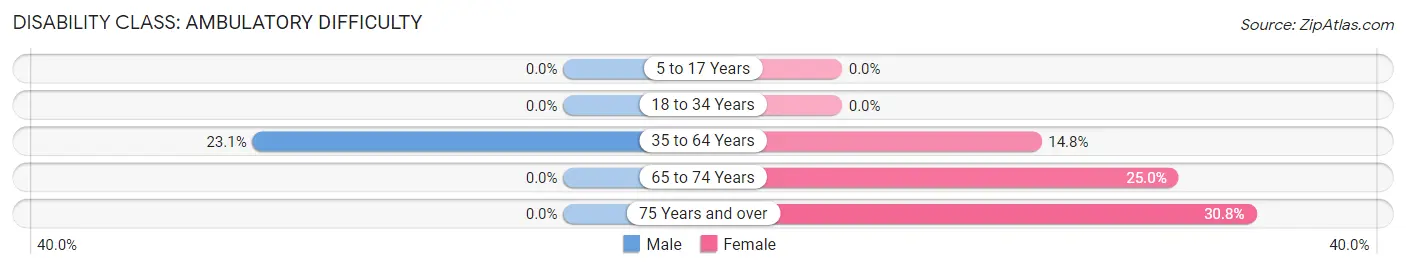
| Age Bracket | Male | Female |
| 5 to 17 Years | 0 (0.0%) | 0 (0.0%) |
| 18 to 34 Years | 0 (0.0%) | 0 (0.0%) |
| 35 to 64 Years | 3 (23.1%) | 4 (14.8%) |
| 65 to 74 Years | 0 (0.0%) | 1 (25.0%) |
| 75 Years and over | 0 (0.0%) | 4 (30.8%) |
Disability Class: Self-Care Difficulty
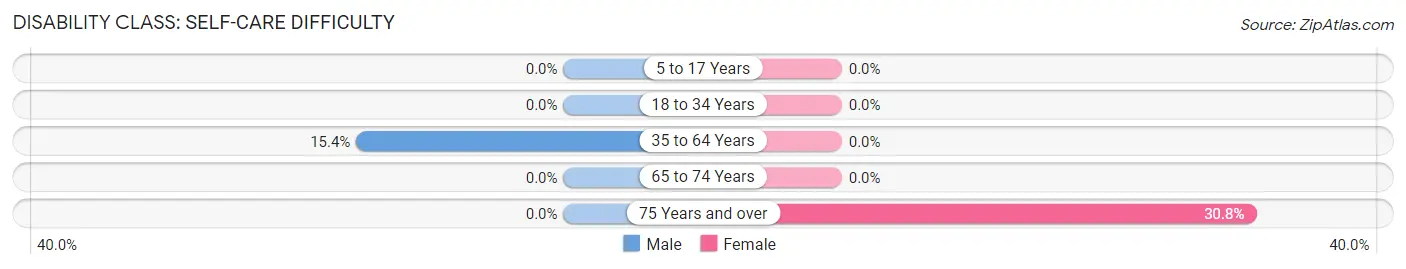
| Age Bracket | Male | Female |
| 5 to 17 Years | 0 (0.0%) | 0 (0.0%) |
| 18 to 34 Years | 0 (0.0%) | 0 (0.0%) |
| 35 to 64 Years | 2 (15.4%) | 0 (0.0%) |
| 65 to 74 Years | 0 (0.0%) | 0 (0.0%) |
| 75 Years and over | 0 (0.0%) | 4 (30.8%) |
Technology Access in Haigler
Computing Device Access in Haigler
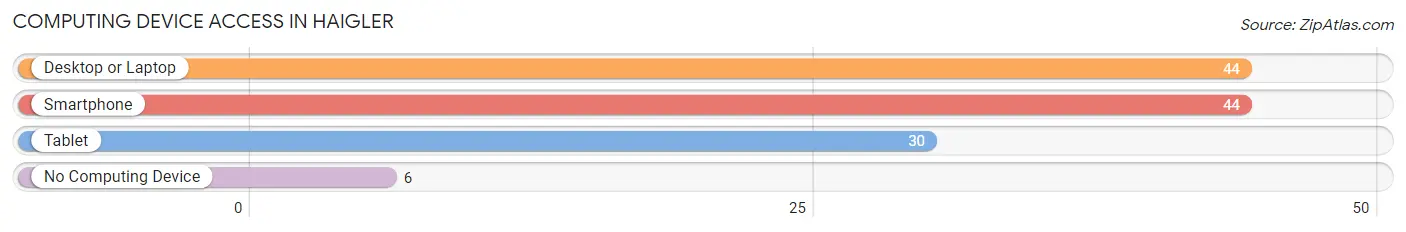
| Device Type | # Households | % Households |
| Desktop or Laptop | 44 | 67.7% |
| Smartphone | 44 | 67.7% |
| Tablet | 30 | 46.2% |
| No Computing Device | 6 | 9.2% |
| Total | 65 | 100.0% |
Internet Access in Haigler
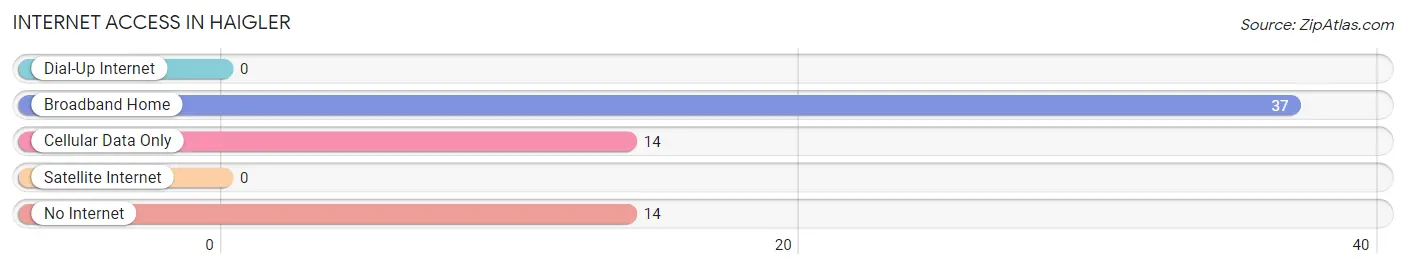
| Internet Type | # Households | % Households |
| Dial-Up Internet | 0 | 0.0% |
| Broadband Home | 37 | 56.9% |
| Cellular Data Only | 14 | 21.5% |
| Satellite Internet | 0 | 0.0% |
| No Internet | 14 | 21.5% |
| Total | 65 | 100.0% |
Haigler Summary
Haigler is a small town located in the southwestern corner of Nebraska, in Dundy County. It is situated on the Republican River, and is the county seat of Dundy County. The town was founded in 1887, and was named after the first postmaster, William Haigler. The population of Haigler was estimated to be around 200 people in 2020.
Geography
Haigler is located in the High Plains region of Nebraska, and is situated on the Republican River. The town is located at an elevation of 3,400 feet above sea level. The town is surrounded by rolling hills and grasslands, and is located in a semi-arid climate. The average annual precipitation is around 17 inches, and the average annual temperature is around 54 degrees Fahrenheit.
Economy
Haigler’s economy is largely based on agriculture. The town is home to several farms and ranches, and the main crops grown in the area are corn, wheat, and soybeans. The town also has a few small businesses, including a grocery store, a hardware store, and a few restaurants.
Demographics
Haigler is a predominantly white town, with the majority of the population being of German, Irish, and English descent. The town also has a small Hispanic population, and a small Native American population. The median household income in Haigler is around $35,000, and the median home value is around $90,000.
History
Haigler was founded in 1887, and was named after the first postmaster, William Haigler. The town was originally a stop on the Union Pacific Railroad, and was a popular destination for settlers in the area. The town was incorporated in 1891, and the first school was built in 1892. The town grew steadily throughout the early 20th century, and by the 1950s, the population had grown to around 500 people.
Haigler has remained a small town throughout its history, and has managed to retain its rural charm. The town is home to several historic buildings, including the Haigler Opera House, which was built in 1895. The town is also home to the Dundy County Museum, which houses artifacts from the town’s history.
Haigler is a small town with a rich history and a unique charm. The town is home to a diverse population, and is a great place to live and work. The town is surrounded by rolling hills and grasslands, and is a great place to explore the outdoors. Haigler is a great place to call home, and is a great place to visit.
Common Questions
What is Per Capita Income in Haigler?
Per Capita income in Haigler is $22,985.
What is the Median Family Income in Haigler?
Median Family Income in Haigler is $87,500.
What is the Median Household income in Haigler?
Median Household Income in Haigler is $44,821.
What is Income or Wage Gap in Haigler?
Income or Wage Gap in Haigler is 46.2%.
Women in Haigler earn 53.8 cents for every dollar earned by a man.
What is Inequality or Gini Index in Haigler?
Inequality or Gini Index in Haigler is 0.36.
What is the Total Population of Haigler?
Total Population of Haigler is 165.
What is the Total Male Population of Haigler?
Total Male Population of Haigler is 72.
What is the Total Female Population of Haigler?
Total Female Population of Haigler is 93.
What is the Ratio of Males per 100 Females in Haigler?
There are 77.42 Males per 100 Females in Haigler.
What is the Ratio of Females per 100 Males in Haigler?
There are 129.17 Females per 100 Males in Haigler.
What is the Median Population Age in Haigler?
Median Population Age in Haigler is 27.8 Years.
What is the Average Family Size in Haigler
Average Family Size in Haigler is 3.4 People.
What is the Average Household Size in Haigler
Average Household Size in Haigler is 2.5 People.
How Large is the Labor Force in Haigler?
There are 62 People in the Labor Forcein in Haigler.
What is the Percentage of People in the Labor Force in Haigler?
53.9% of People are in the Labor Force in Haigler.