Gothenburg, NE Map & Demographics
Gothenburg Map
Gothenburg Overview
$40,707
PER CAPITA INCOME
$101,013
AVG FAMILY INCOME
$84,615
AVG HOUSEHOLD INCOME
29.2%
WAGE / INCOME GAP [ % ]
70.8¢/ $1
WAGE / INCOME GAP [ $ ]
0.39
INEQUALITY / GINI INDEX
3,463
TOTAL POPULATION
1,876
MALE POPULATION
1,587
FEMALE POPULATION
118.21
MALES / 100 FEMALES
84.59
FEMALES / 100 MALES
40.6
MEDIAN AGE
3.1
AVG FAMILY SIZE
2.5
AVG HOUSEHOLD SIZE
1,916
LABOR FORCE [ PEOPLE ]
70.2%
PERCENT IN LABOR FORCE
3.3%
UNEMPLOYMENT RATE
Gothenburg Zip Codes
Gothenburg Area Codes
Income in Gothenburg
Income Overview in Gothenburg
Per Capita Income in Gothenburg is $40,707, while median incomes of families and households are $101,013 and $84,615 respectively.
| Characteristic | Number | Measure |
| Per Capita Income | 3,463 | $40,707 |
| Median Family Income | 933 | $101,013 |
| Mean Family Income | 933 | $119,766 |
| Median Household Income | 1,382 | $84,615 |
| Mean Household Income | 1,382 | $98,645 |
| Income Deficit | 933 | $0 |
| Wage / Income Gap (%) | 3,463 | 29.16% |
| Wage / Income Gap ($) | 3,463 | 70.84¢ per $1 |
| Gini / Inequality Index | 3,463 | 0.39 |
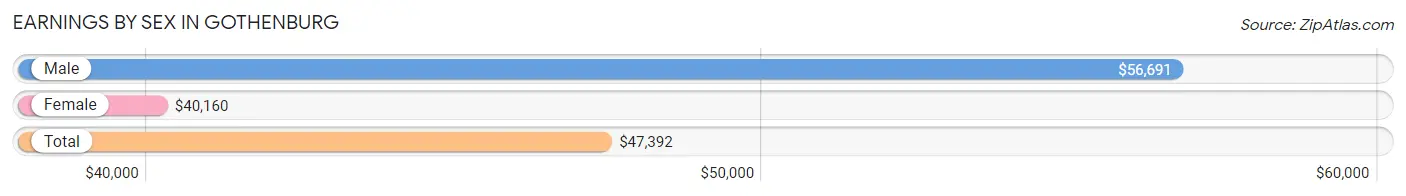
Earnings by Sex in Gothenburg
Average Earnings in Gothenburg are $47,392, $56,691 for men and $40,160 for women, a difference of 29.2%.
| Sex | Number | Average Earnings |
| Male | 1,183 (59.1%) | $56,691 |
| Female | 820 (40.9%) | $40,160 |
| Total | 2,003 (100.0%) | $47,392 |
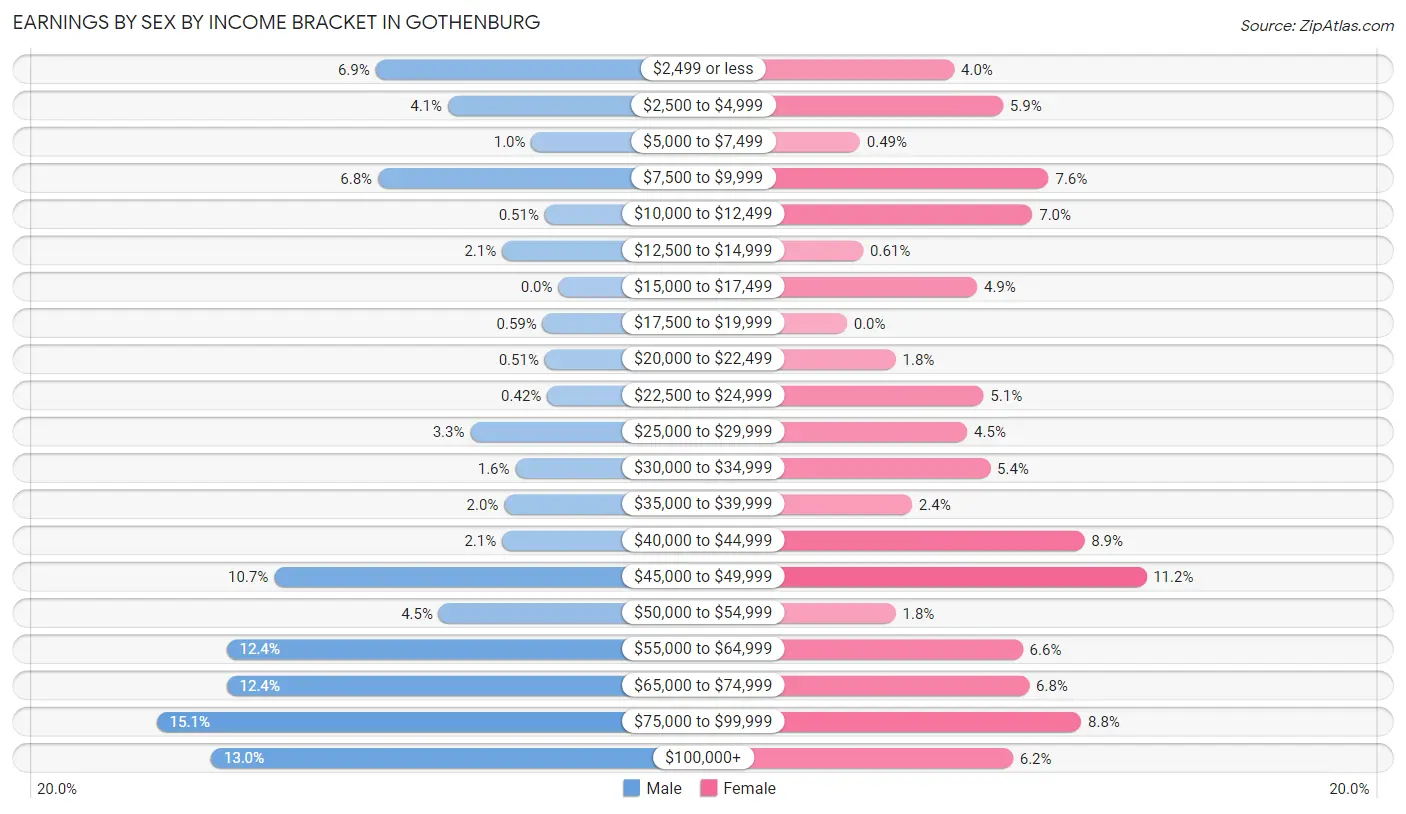
Earnings by Sex by Income Bracket in Gothenburg
The most common earnings brackets in Gothenburg are $75,000 to $99,999 for men (178 | 15.0%) and $45,000 to $49,999 for women (92 | 11.2%).
| Income | Male | Female |
| $2,499 or less | 81 (6.9%) | 33 (4.0%) |
| $2,500 to $4,999 | 49 (4.1%) | 48 (5.9%) |
| $5,000 to $7,499 | 12 (1.0%) | 4 (0.5%) |
| $7,500 to $9,999 | 80 (6.8%) | 62 (7.6%) |
| $10,000 to $12,499 | 6 (0.5%) | 57 (7.0%) |
| $12,500 to $14,999 | 25 (2.1%) | 5 (0.6%) |
| $15,000 to $17,499 | 0 (0.0%) | 40 (4.9%) |
| $17,500 to $19,999 | 7 (0.6%) | 0 (0.0%) |
| $20,000 to $22,499 | 6 (0.5%) | 15 (1.8%) |
| $22,500 to $24,999 | 5 (0.4%) | 42 (5.1%) |
| $25,000 to $29,999 | 39 (3.3%) | 37 (4.5%) |
| $30,000 to $34,999 | 19 (1.6%) | 44 (5.4%) |
| $35,000 to $39,999 | 24 (2.0%) | 20 (2.4%) |
| $40,000 to $44,999 | 25 (2.1%) | 73 (8.9%) |
| $45,000 to $49,999 | 126 (10.6%) | 92 (11.2%) |
| $50,000 to $54,999 | 53 (4.5%) | 15 (1.8%) |
| $55,000 to $64,999 | 147 (12.4%) | 54 (6.6%) |
| $65,000 to $74,999 | 147 (12.4%) | 56 (6.8%) |
| $75,000 to $99,999 | 178 (15.0%) | 72 (8.8%) |
| $100,000+ | 154 (13.0%) | 51 (6.2%) |
| Total | 1,183 (100.0%) | 820 (100.0%) |
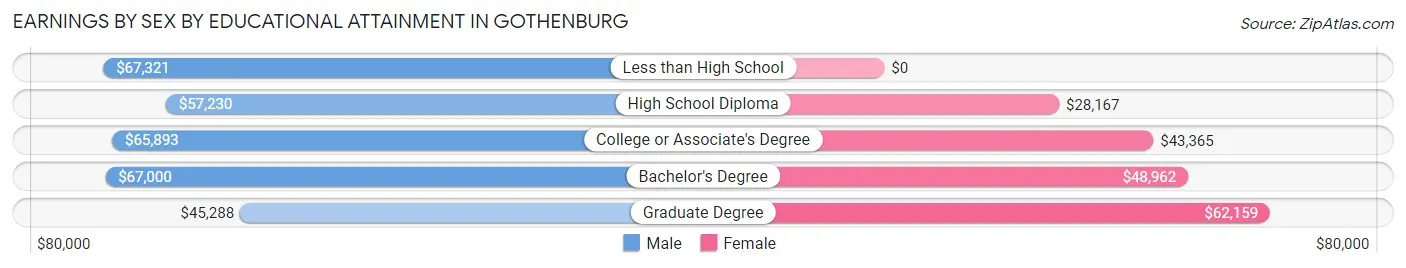
Earnings by Sex by Educational Attainment in Gothenburg
Average earnings in Gothenburg are $63,716 for men and $45,260 for women, a difference of 29.0%. Men with an educational attainment of less than high school enjoy the highest average annual earnings of $67,321, while those with graduate degree education earn the least with $45,288. Women with an educational attainment of graduate degree earn the most with the average annual earnings of $62,159, while those with high school diploma education have the smallest earnings of $28,167.
| Educational Attainment | Male Income | Female Income |
| Less than High School | $67,321 | $0 |
| High School Diploma | $57,230 | $28,167 |
| College or Associate's Degree | $65,893 | $43,365 |
| Bachelor's Degree | $67,000 | $48,962 |
| Graduate Degree | $45,288 | $62,159 |
| Total | $63,716 | $45,260 |
Family Income in Gothenburg
Family Income Brackets in Gothenburg
According to the Gothenburg family income data, there are 193 families falling into the $100,000 to $149,999 income range, which is the most common income bracket and makes up 20.7% of all families.
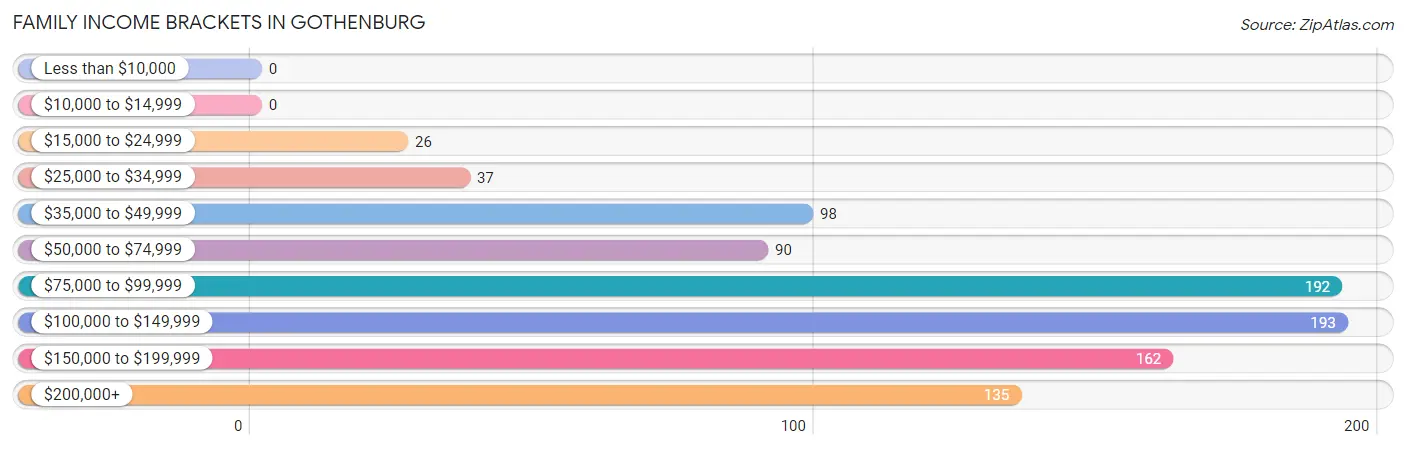
| Income Bracket | # Families | % Families |
| Less than $10,000 | 0 | 0.0% |
| $10,000 to $14,999 | 0 | 0.0% |
| $15,000 to $24,999 | 26 | 2.8% |
| $25,000 to $34,999 | 37 | 4.0% |
| $35,000 to $49,999 | 98 | 10.5% |
| $50,000 to $74,999 | 90 | 9.6% |
| $75,000 to $99,999 | 192 | 20.6% |
| $100,000 to $149,999 | 193 | 20.7% |
| $150,000 to $199,999 | 162 | 17.4% |
| $200,000+ | 135 | 14.5% |
Family Income by Famaliy Size in Gothenburg
4-person families (241 | 25.8%) account for the highest median family income in Gothenburg with $149,511 per family, while 2-person families (444 | 47.6%) have the highest median income of $49,519 per family member.
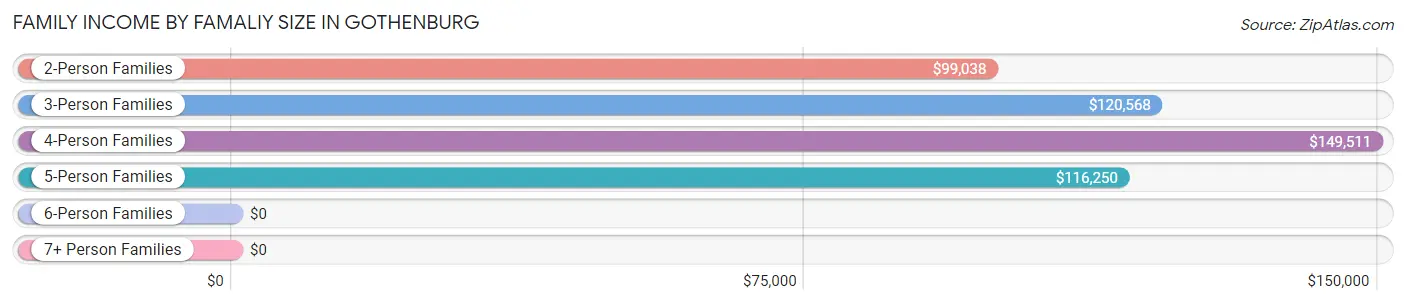
| Income Bracket | # Families | Median Income |
| 2-Person Families | 444 (47.6%) | $99,038 |
| 3-Person Families | 137 (14.7%) | $120,568 |
| 4-Person Families | 241 (25.8%) | $149,511 |
| 5-Person Families | 111 (11.9%) | $116,250 |
| 6-Person Families | 0 (0.0%) | $0 |
| 7+ Person Families | 0 (0.0%) | $0 |
| Total | 933 (100.0%) | $101,013 |
Family Income by Number of Earners in Gothenburg
The median family income in Gothenburg is $101,013, with families comprising 3+ earners (200) having the highest median family income of $174,091, while families with no earners (101) have the lowest median family income of $39,205, accounting for 21.4% and 10.8% of families, respectively.
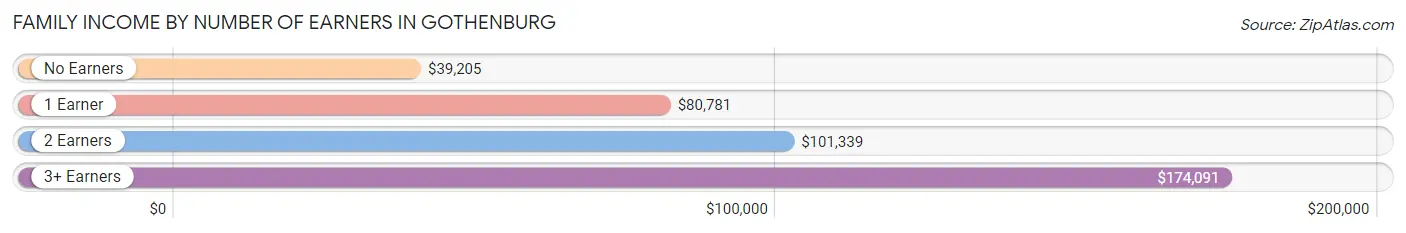
| Number of Earners | # Families | Median Income |
| No Earners | 101 (10.8%) | $39,205 |
| 1 Earner | 190 (20.4%) | $80,781 |
| 2 Earners | 442 (47.4%) | $101,339 |
| 3+ Earners | 200 (21.4%) | $174,091 |
| Total | 933 (100.0%) | $101,013 |
Household Income in Gothenburg
Household Income Brackets in Gothenburg
With 247 households falling in the category, the $100,000 to $149,999 income range is the most frequent in Gothenburg, accounting for 17.9% of all households. In contrast, only 30 households (2.2%) fall into the $10,000 to $14,999 income bracket, making it the least populous group.
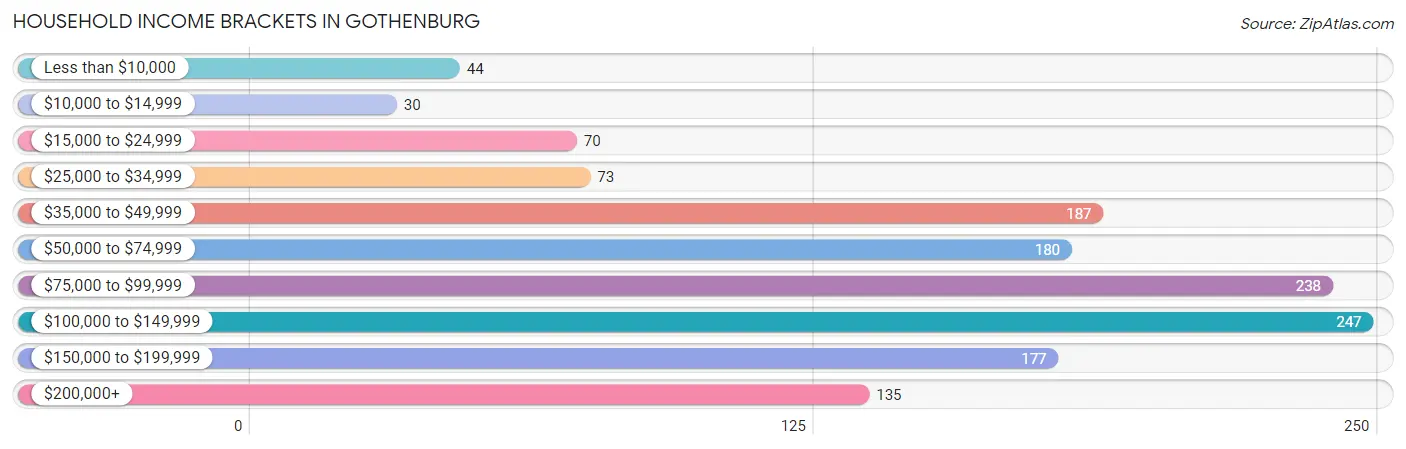
| Income Bracket | # Households | % Households |
| Less than $10,000 | 44 | 3.2% |
| $10,000 to $14,999 | 30 | 2.2% |
| $15,000 to $24,999 | 70 | 5.1% |
| $25,000 to $34,999 | 73 | 5.3% |
| $35,000 to $49,999 | 187 | 13.5% |
| $50,000 to $74,999 | 180 | 13.0% |
| $75,000 to $99,999 | 238 | 17.2% |
| $100,000 to $149,999 | 247 | 17.9% |
| $150,000 to $199,999 | 177 | 12.8% |
| $200,000+ | 135 | 9.8% |
Household Income by Householder Age in Gothenburg
The median household income in Gothenburg is $84,615, with the highest median household income of $101,250 found in the 25 to 44 years age bracket for the primary householder. A total of 346 households (25.0%) fall into this category. Meanwhile, the 65+ years age bracket for the primary householder has the lowest median household income of $46,833, with 386 households (27.9%) in this group.
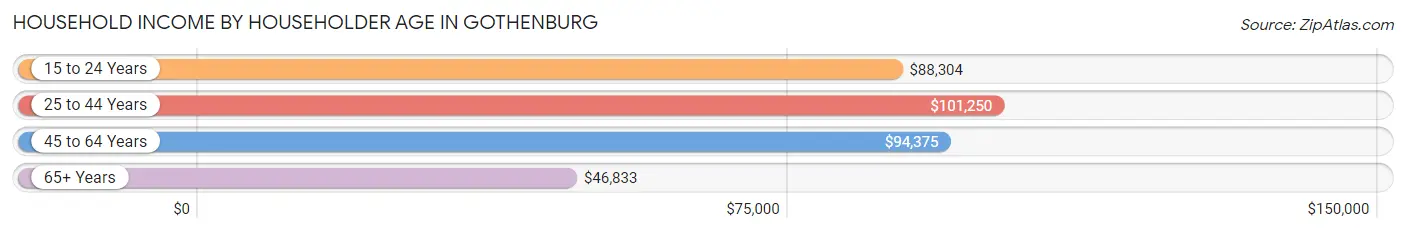
| Income Bracket | # Households | Median Income |
| 15 to 24 Years | 60 (4.3%) | $88,304 |
| 25 to 44 Years | 346 (25.0%) | $101,250 |
| 45 to 64 Years | 590 (42.7%) | $94,375 |
| 65+ Years | 386 (27.9%) | $46,833 |
| Total | 1,382 (100.0%) | $84,615 |
Poverty in Gothenburg
Income Below Poverty by Sex and Age in Gothenburg
With 5.4% poverty level for males and 6.6% for females among the residents of Gothenburg, 45 to 54 year old males and 75 year old and over females are the most vulnerable to poverty, with 40 males (14.5%) and 22 females (18.8%) in their respective age groups living below the poverty level.
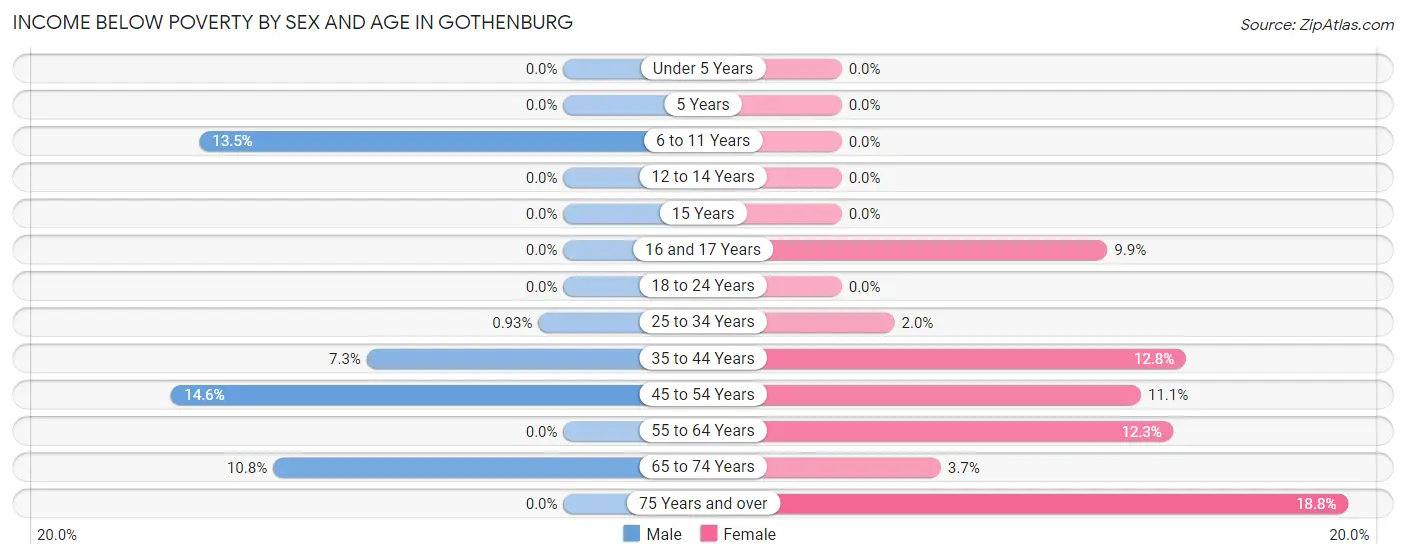
| Age Bracket | Male | Female |
| Under 5 Years | 0 (0.0%) | 0 (0.0%) |
| 5 Years | 0 (0.0%) | 0 (0.0%) |
| 6 to 11 Years | 20 (13.5%) | 0 (0.0%) |
| 12 to 14 Years | 0 (0.0%) | 0 (0.0%) |
| 15 Years | 0 (0.0%) | 0 (0.0%) |
| 16 and 17 Years | 0 (0.0%) | 7 (9.9%) |
| 18 to 24 Years | 0 (0.0%) | 0 (0.0%) |
| 25 to 34 Years | 2 (0.9%) | 3 (2.0%) |
| 35 to 44 Years | 13 (7.3%) | 23 (12.8%) |
| 45 to 54 Years | 40 (14.5%) | 17 (11.1%) |
| 55 to 64 Years | 0 (0.0%) | 26 (12.3%) |
| 65 to 74 Years | 25 (10.8%) | 5 (3.7%) |
| 75 Years and over | 0 (0.0%) | 22 (18.8%) |
| Total | 100 (5.4%) | 103 (6.6%) |
Income Above Poverty by Sex and Age in Gothenburg
According to the poverty statistics in Gothenburg, males aged under 5 years and females aged under 5 years are the age groups that are most secure financially, with 100.0% of males and 100.0% of females in these age groups living above the poverty line.
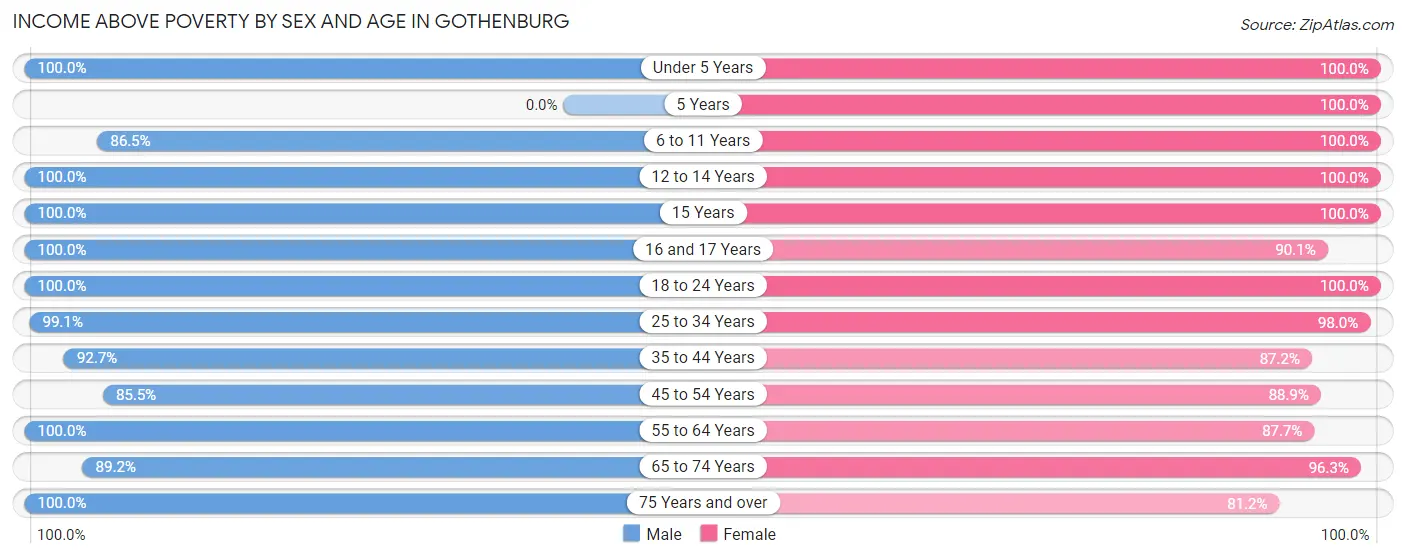
| Age Bracket | Male | Female |
| Under 5 Years | 81 (100.0%) | 90 (100.0%) |
| 5 Years | 0 (0.0%) | 13 (100.0%) |
| 6 to 11 Years | 128 (86.5%) | 174 (100.0%) |
| 12 to 14 Years | 55 (100.0%) | 118 (100.0%) |
| 15 Years | 40 (100.0%) | 15 (100.0%) |
| 16 and 17 Years | 73 (100.0%) | 64 (90.1%) |
| 18 to 24 Years | 173 (100.0%) | 130 (100.0%) |
| 25 to 34 Years | 212 (99.1%) | 150 (98.0%) |
| 35 to 44 Years | 165 (92.7%) | 157 (87.2%) |
| 45 to 54 Years | 235 (85.5%) | 136 (88.9%) |
| 55 to 64 Years | 263 (100.0%) | 185 (87.7%) |
| 65 to 74 Years | 207 (89.2%) | 131 (96.3%) |
| 75 Years and over | 115 (100.0%) | 95 (81.2%) |
| Total | 1,747 (94.6%) | 1,458 (93.4%) |
Income Below Poverty Among Married-Couple Families in Gothenburg
The poverty statistics for married-couple families in Gothenburg show that 1.4% or 11 of the total 802 families live below the poverty line. Families with 1 or 2 children have the highest poverty rate of 3.5%, comprising of 11 families. On the other hand, families with no children have the lowest poverty rate of 0.0%, which includes 0 families.
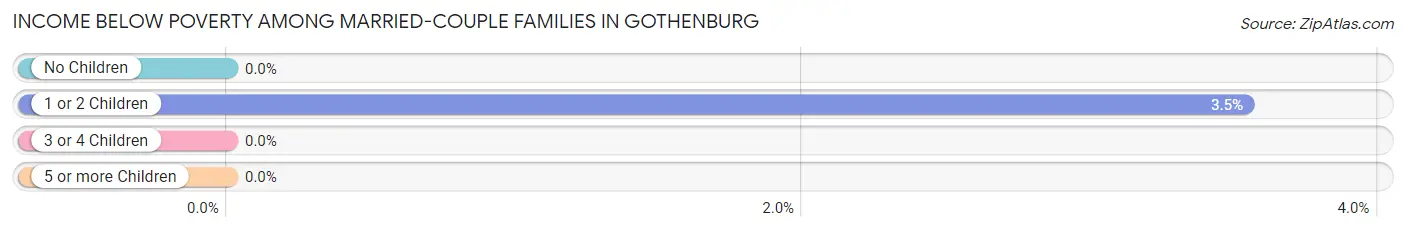
| Children | Above Poverty | Below Poverty |
| No Children | 397 (100.0%) | 0 (0.0%) |
| 1 or 2 Children | 300 (96.5%) | 11 (3.5%) |
| 3 or 4 Children | 94 (100.0%) | 0 (0.0%) |
| 5 or more Children | 0 (0.0%) | 0 (0.0%) |
| Total | 791 (98.6%) | 11 (1.4%) |
Income Below Poverty Among Single-Parent Households in Gothenburg
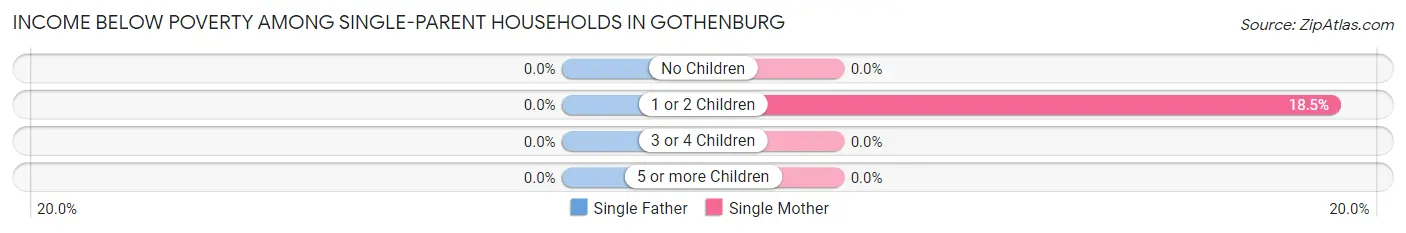
| Children | Single Father | Single Mother |
| No Children | 0 (0.0%) | 0 (0.0%) |
| 1 or 2 Children | 0 (0.0%) | 5 (18.5%) |
| 3 or 4 Children | 0 (0.0%) | 0 (0.0%) |
| 5 or more Children | 0 (0.0%) | 0 (0.0%) |
| Total | 0 (0.0%) | 5 (9.6%) |
Income Below Poverty Among Married-Couple vs Single-Parent Households in Gothenburg
The poverty data for Gothenburg shows that 11 of the married-couple family households (1.4%) and 5 of the single-parent households (3.8%) are living below the poverty level. Within the married-couple family households, those with 1 or 2 children have the highest poverty rate, with 11 households (3.5%) falling below the poverty line. Among the single-parent households, those with 1 or 2 children have the highest poverty rate, with 5 household (18.5%) living below poverty.
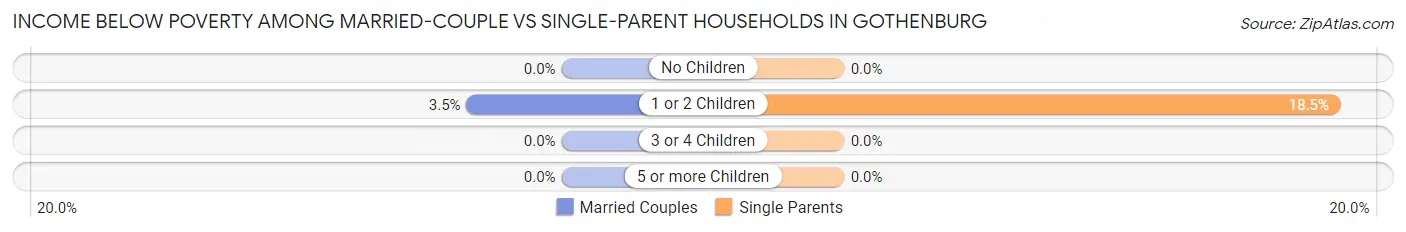
| Children | Married-Couple Families | Single-Parent Households |
| No Children | 0 (0.0%) | 0 (0.0%) |
| 1 or 2 Children | 11 (3.5%) | 5 (18.5%) |
| 3 or 4 Children | 0 (0.0%) | 0 (0.0%) |
| 5 or more Children | 0 (0.0%) | 0 (0.0%) |
| Total | 11 (1.4%) | 5 (3.8%) |
Race in Gothenburg
The most populous races in Gothenburg are White / Caucasian (3,272 | 94.5%), Two or more Races (148 | 4.3%), and Hispanic or Latino (102 | 2.9%).
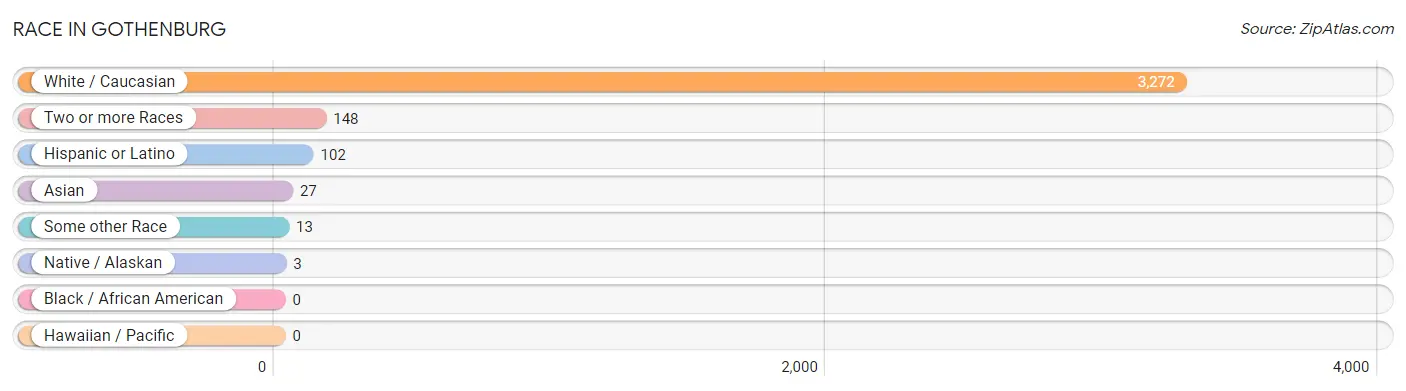
| Race | # Population | % Population |
| Asian | 27 | 0.8% |
| Black / African American | 0 | 0.0% |
| Hawaiian / Pacific | 0 | 0.0% |
| Hispanic or Latino | 102 | 2.9% |
| Native / Alaskan | 3 | 0.1% |
| White / Caucasian | 3,272 | 94.5% |
| Two or more Races | 148 | 4.3% |
| Some other Race | 13 | 0.4% |
| Total | 3,463 | 100.0% |
Ancestry in Gothenburg
The most populous ancestries reported in Gothenburg are German (1,445 | 41.7%), Irish (476 | 13.8%), Swedish (427 | 12.3%), English (353 | 10.2%), and American (314 | 9.1%), together accounting for 87.1% of all Gothenburg residents.
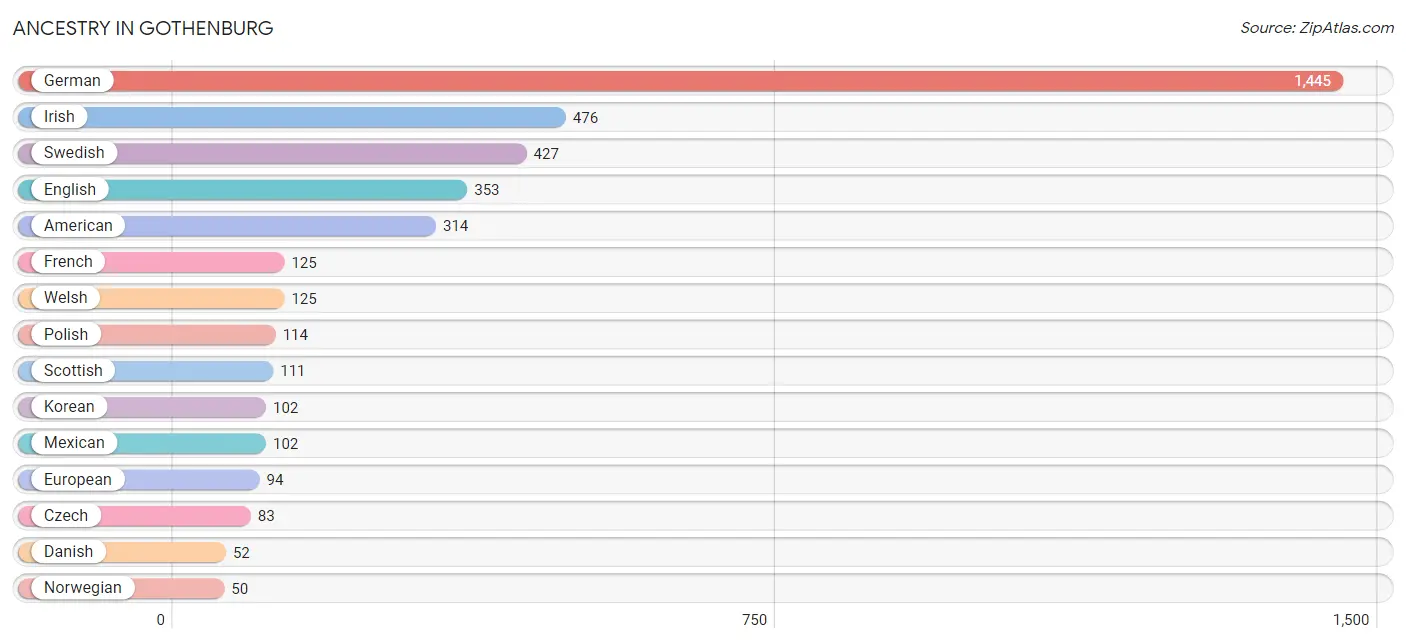
| Ancestry | # Population | % Population |
| American | 314 | 9.1% |
| Belgian | 16 | 0.5% |
| Cambodian | 36 | 1.0% |
| Czech | 83 | 2.4% |
| Danish | 52 | 1.5% |
| Dutch | 27 | 0.8% |
| English | 353 | 10.2% |
| European | 94 | 2.7% |
| French | 125 | 3.6% |
| French Canadian | 7 | 0.2% |
| German | 1,445 | 41.7% |
| Hungarian | 15 | 0.4% |
| Irish | 476 | 13.8% |
| Italian | 31 | 0.9% |
| Korean | 102 | 2.9% |
| Mexican | 102 | 2.9% |
| Norwegian | 50 | 1.4% |
| Polish | 114 | 3.3% |
| Scandinavian | 6 | 0.2% |
| Scotch-Irish | 14 | 0.4% |
| Scottish | 111 | 3.2% |
| Swedish | 427 | 12.3% |
| Swiss | 14 | 0.4% |
| Welsh | 125 | 3.6% | View All 24 Rows |
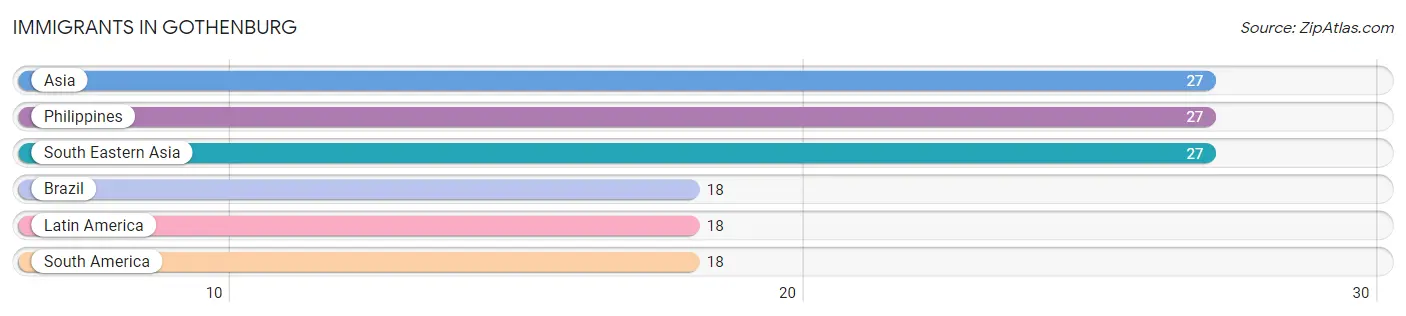
Immigrants in Gothenburg
The most numerous immigrant groups reported in Gothenburg came from Asia (27 | 0.8%), Philippines (27 | 0.8%), South Eastern Asia (27 | 0.8%), Brazil (18 | 0.5%), and Latin America (18 | 0.5%), together accounting for 3.4% of all Gothenburg residents.
| Immigration Origin | # Population | % Population |
| Asia | 27 | 0.8% |
| Brazil | 18 | 0.5% |
| Latin America | 18 | 0.5% |
| Philippines | 27 | 0.8% |
| South America | 18 | 0.5% |
| South Eastern Asia | 27 | 0.8% | View All 6 Rows |
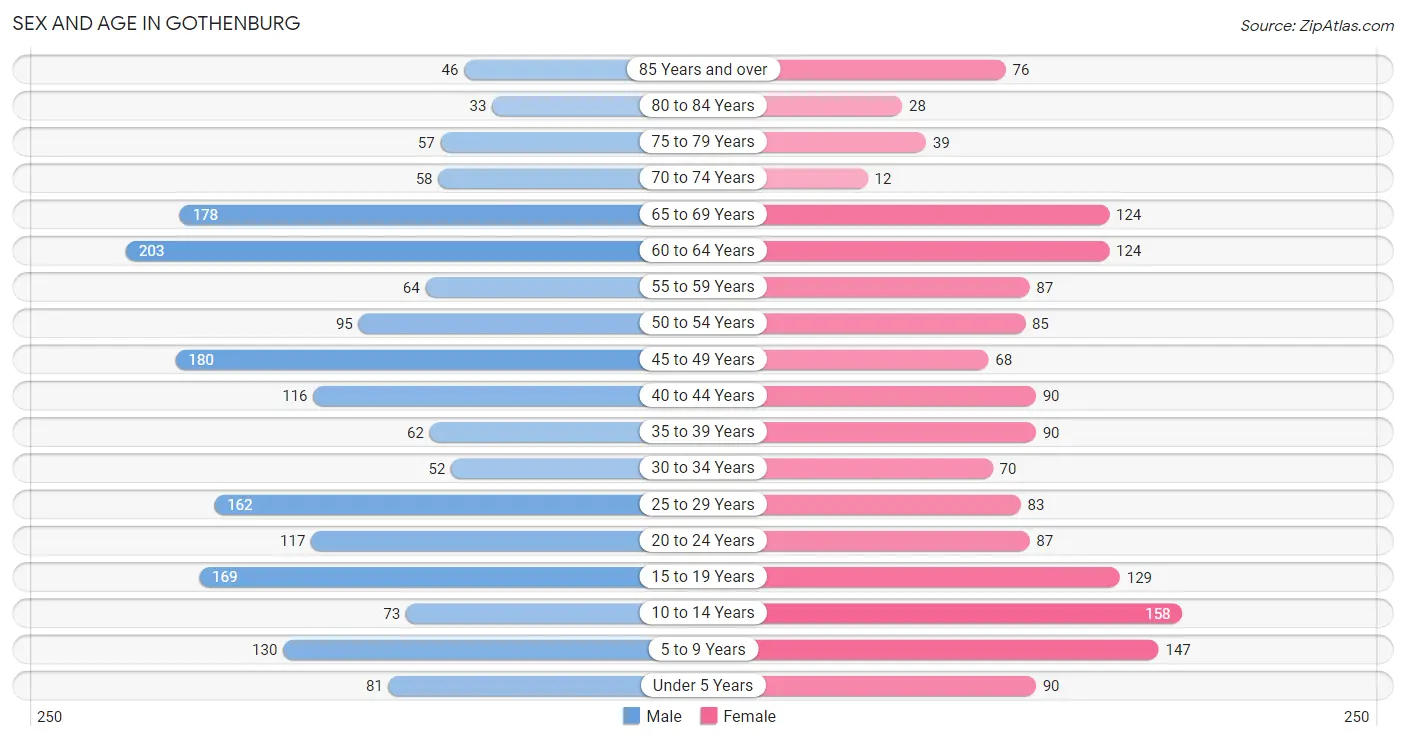
Sex and Age in Gothenburg
Sex and Age in Gothenburg
The most populous age groups in Gothenburg are 60 to 64 Years (203 | 10.8%) for men and 10 to 14 Years (158 | 10.0%) for women.
| Age Bracket | Male | Female |
| Under 5 Years | 81 (4.3%) | 90 (5.7%) |
| 5 to 9 Years | 130 (6.9%) | 147 (9.3%) |
| 10 to 14 Years | 73 (3.9%) | 158 (10.0%) |
| 15 to 19 Years | 169 (9.0%) | 129 (8.1%) |
| 20 to 24 Years | 117 (6.2%) | 87 (5.5%) |
| 25 to 29 Years | 162 (8.6%) | 83 (5.2%) |
| 30 to 34 Years | 52 (2.8%) | 70 (4.4%) |
| 35 to 39 Years | 62 (3.3%) | 90 (5.7%) |
| 40 to 44 Years | 116 (6.2%) | 90 (5.7%) |
| 45 to 49 Years | 180 (9.6%) | 68 (4.3%) |
| 50 to 54 Years | 95 (5.1%) | 85 (5.4%) |
| 55 to 59 Years | 64 (3.4%) | 87 (5.5%) |
| 60 to 64 Years | 203 (10.8%) | 124 (7.8%) |
| 65 to 69 Years | 178 (9.5%) | 124 (7.8%) |
| 70 to 74 Years | 58 (3.1%) | 12 (0.8%) |
| 75 to 79 Years | 57 (3.0%) | 39 (2.5%) |
| 80 to 84 Years | 33 (1.8%) | 28 (1.8%) |
| 85 Years and over | 46 (2.5%) | 76 (4.8%) |
| Total | 1,876 (100.0%) | 1,587 (100.0%) |
Families and Households in Gothenburg
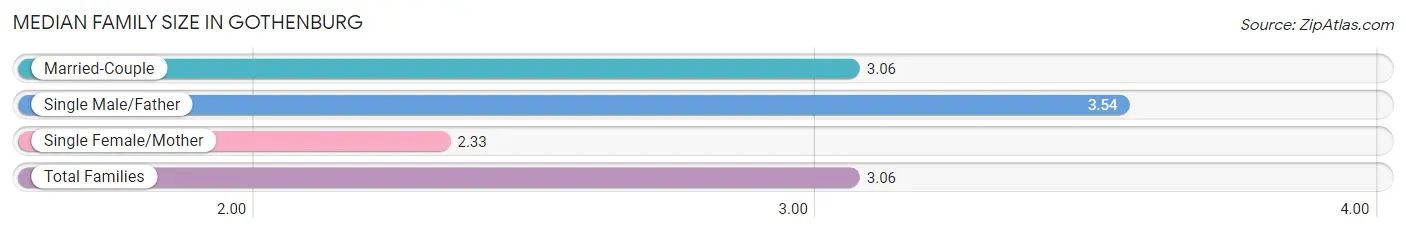
Median Family Size in Gothenburg
The median family size in Gothenburg is 3.06 persons per family, with single male/father families (79 | 8.5%) accounting for the largest median family size of 3.54 persons per family. On the other hand, single female/mother families (52 | 5.6%) represent the smallest median family size with 2.33 persons per family.
| Family Type | # Families | Family Size |
| Married-Couple | 802 (86.0%) | 3.06 |
| Single Male/Father | 79 (8.5%) | 3.54 |
| Single Female/Mother | 52 (5.6%) | 2.33 |
| Total Families | 933 (100.0%) | 3.06 |
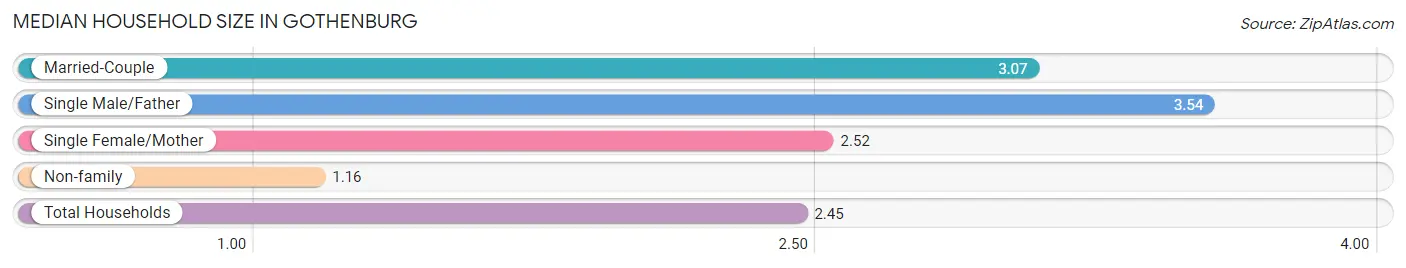
Median Household Size in Gothenburg
The median household size in Gothenburg is 2.45 persons per household, with single male/father households (79 | 5.7%) accounting for the largest median household size of 3.54 persons per household. non-family households (449 | 32.5%) represent the smallest median household size with 1.16 persons per household.
| Household Type | # Households | Household Size |
| Married-Couple | 802 (58.0%) | 3.07 |
| Single Male/Father | 79 (5.7%) | 3.54 |
| Single Female/Mother | 52 (3.8%) | 2.52 |
| Non-family | 449 (32.5%) | 1.16 |
| Total Households | 1,382 (100.0%) | 2.45 |
Household Size by Marriage Status in Gothenburg
Out of a total of 1,382 households in Gothenburg, 933 (67.5%) are family households, while 449 (32.5%) are nonfamily households. The most numerous type of family households are 2-person households, comprising 438, and the most common type of nonfamily households are 1-person households, comprising 378.
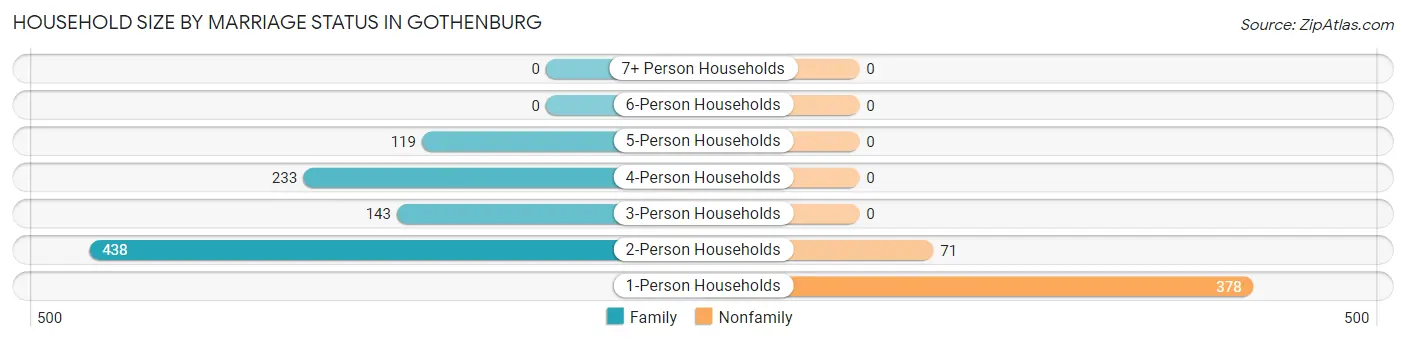
| Household Size | Family Households | Nonfamily Households |
| 1-Person Households | - | 378 (27.4%) |
| 2-Person Households | 438 (31.7%) | 71 (5.1%) |
| 3-Person Households | 143 (10.3%) | 0 (0.0%) |
| 4-Person Households | 233 (16.9%) | 0 (0.0%) |
| 5-Person Households | 119 (8.6%) | 0 (0.0%) |
| 6-Person Households | 0 (0.0%) | 0 (0.0%) |
| 7+ Person Households | 0 (0.0%) | 0 (0.0%) |
| Total | 933 (67.5%) | 449 (32.5%) |
Female Fertility in Gothenburg
Fertility by Age in Gothenburg
Average fertility rate in Gothenburg is 24.0 births per 1,000 women. Women in the age bracket of 20 to 34 years have the highest fertility rate with 63.0 births per 1,000 women. Women in the age bracket of 20 to 34 years acount for 100.0% of all women with births.
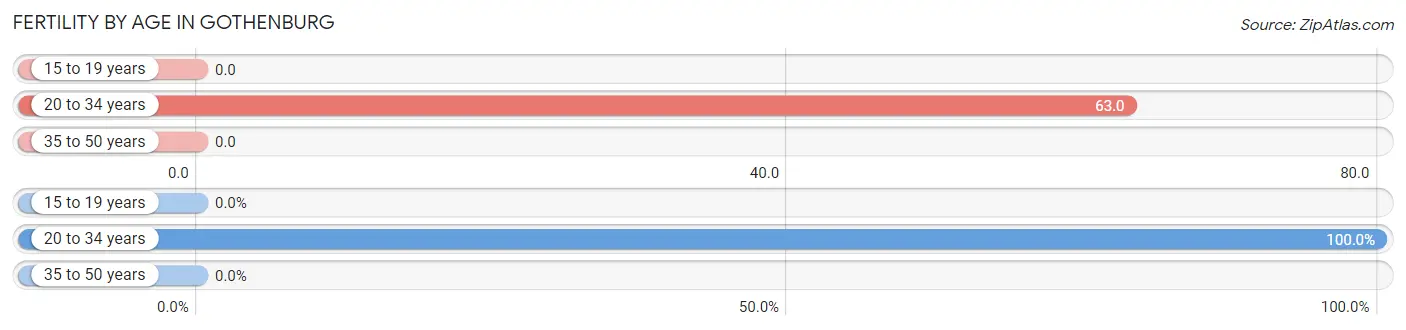
| Age Bracket | Women with Births | Births / 1,000 Women |
| 15 to 19 years | 0 (0.0%) | 0.0 |
| 20 to 34 years | 15 (100.0%) | 63.0 |
| 35 to 50 years | 0 (0.0%) | 0.0 |
| Total | 15 (100.0%) | 24.0 |
Fertility by Age by Marriage Status in Gothenburg
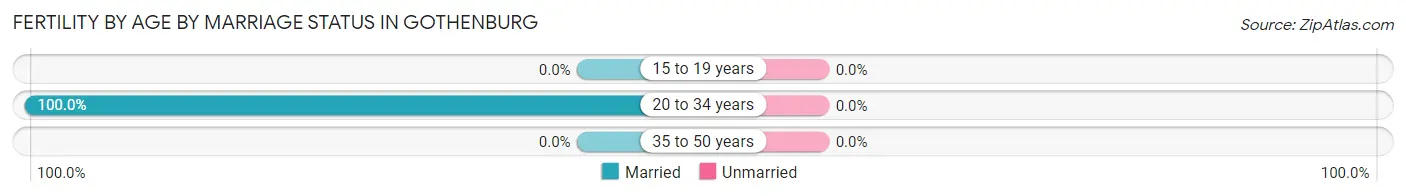
| Age Bracket | Married | Unmarried |
| 15 to 19 years | 0 (0.0%) | 0 (0.0%) |
| 20 to 34 years | 15 (100.0%) | 0 (0.0%) |
| 35 to 50 years | 0 (0.0%) | 0 (0.0%) |
| Total | 15 (100.0%) | 0 (0.0%) |
Fertility by Education in Gothenburg
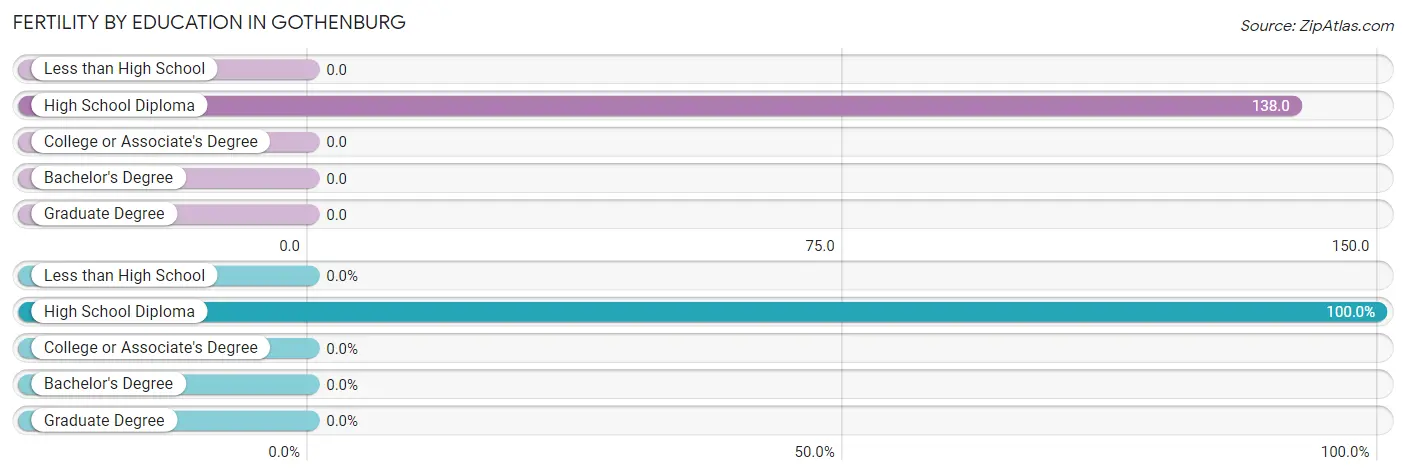
| Educational Attainment | Women with Births | Births / 1,000 Women |
| Less than High School | 0 (0.0%) | 0.0 |
| High School Diploma | 15 (100.0%) | 138.0 |
| College or Associate's Degree | 0 (0.0%) | 0.0 |
| Bachelor's Degree | 0 (0.0%) | 0.0 |
| Graduate Degree | 0 (0.0%) | 0.0 |
| Total | 15 (100.0%) | 24.0 |
Fertility by Education by Marriage Status in Gothenburg
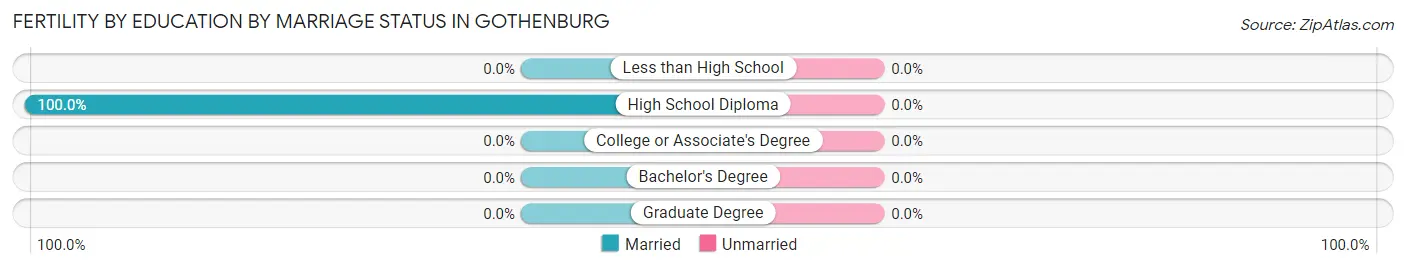
| Educational Attainment | Married | Unmarried |
| Less than High School | 0 (0.0%) | 0 (0.0%) |
| High School Diploma | 15 (100.0%) | 0 (0.0%) |
| College or Associate's Degree | 0 (0.0%) | 0 (0.0%) |
| Bachelor's Degree | 0 (0.0%) | 0 (0.0%) |
| Graduate Degree | 0 (0.0%) | 0 (0.0%) |
| Total | 15 (100.0%) | 0 (0.0%) |
Employment Characteristics in Gothenburg
Employment by Class of Employer in Gothenburg
Among the 1,846 employed individuals in Gothenburg, private company employees (1,200 | 65.0%), not-for-profit organizations (184 | 10.0%), and local government employees (158 | 8.6%) make up the most common classes of employment.
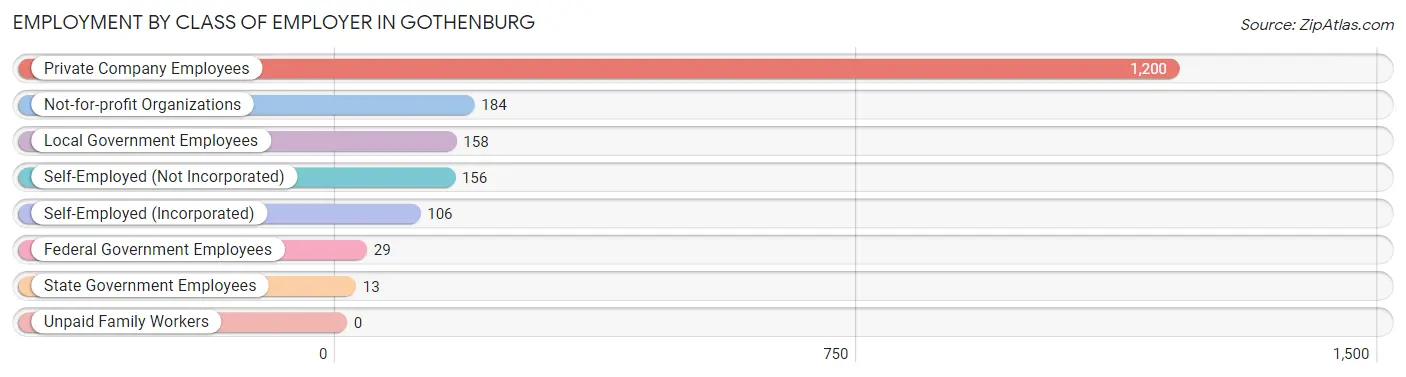
| Employer Class | # Employees | % Employees |
| Private Company Employees | 1,200 | 65.0% |
| Self-Employed (Incorporated) | 106 | 5.7% |
| Self-Employed (Not Incorporated) | 156 | 8.5% |
| Not-for-profit Organizations | 184 | 10.0% |
| Local Government Employees | 158 | 8.6% |
| State Government Employees | 13 | 0.7% |
| Federal Government Employees | 29 | 1.6% |
| Unpaid Family Workers | 0 | 0.0% |
| Total | 1,846 | 100.0% |
Employment Status by Age in Gothenburg
According to the labor force statistics for Gothenburg, out of the total population over 16 years of age (2,729), 70.2% or 1,916 individuals are in the labor force, with 3.3% or 63 of them unemployed. The age group with the highest labor force participation rate is 35 to 44 years, with 99.2% or 355 individuals in the labor force. Within the labor force, the 45 to 54 years age range has the highest percentage of unemployed individuals, with 7.2% or 25 of them being unemployed.
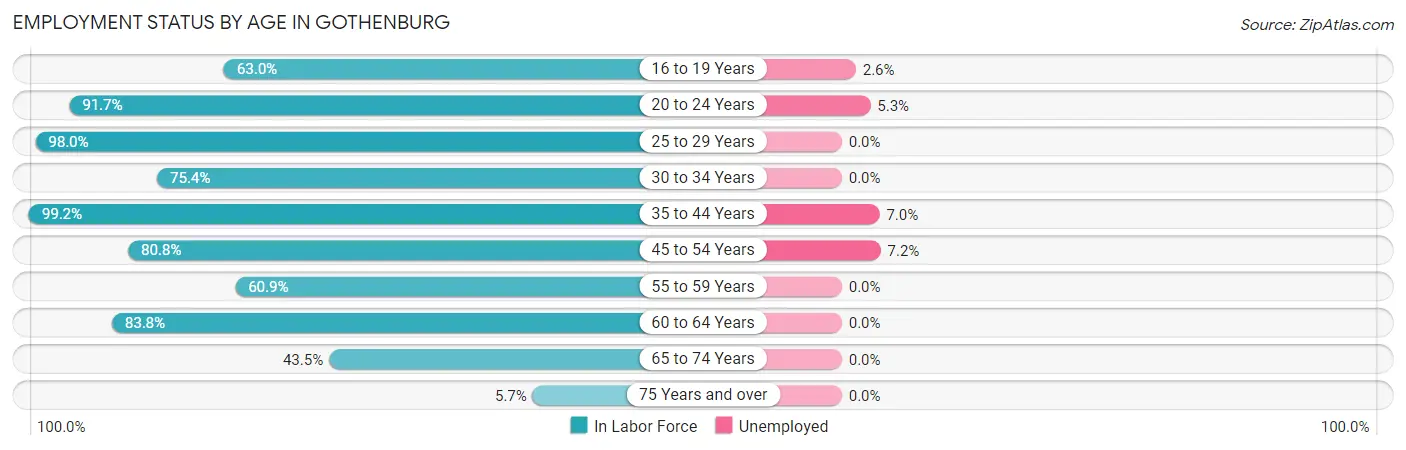
| Age Bracket | In Labor Force | Unemployed |
| 16 to 19 Years | 153 (63.0%) | 4 (2.6%) |
| 20 to 24 Years | 187 (91.7%) | 10 (5.3%) |
| 25 to 29 Years | 240 (98.0%) | 0 (0.0%) |
| 30 to 34 Years | 92 (75.4%) | 0 (0.0%) |
| 35 to 44 Years | 355 (99.2%) | 25 (7.0%) |
| 45 to 54 Years | 346 (80.8%) | 25 (7.2%) |
| 55 to 59 Years | 92 (60.9%) | 0 (0.0%) |
| 60 to 64 Years | 274 (83.8%) | 0 (0.0%) |
| 65 to 74 Years | 162 (43.5%) | 0 (0.0%) |
| 75 Years and over | 16 (5.7%) | 0 (0.0%) |
| Total | 1,916 (70.2%) | 63 (3.3%) |
Employment Status by Educational Attainment in Gothenburg
According to labor force statistics for Gothenburg, 85.8% of individuals (1,399) out of the total population between 25 and 64 years of age (1,631) are in the labor force, with 3.6% or 50 of them being unemployed. The group with the highest labor force participation rate are those with the educational attainment of college / associate degree, with 87.8% or 590 individuals in the labor force. Within the labor force, individuals with high school diploma education have the highest percentage of unemployment, with 8.3% or 37 of them being unemployed.
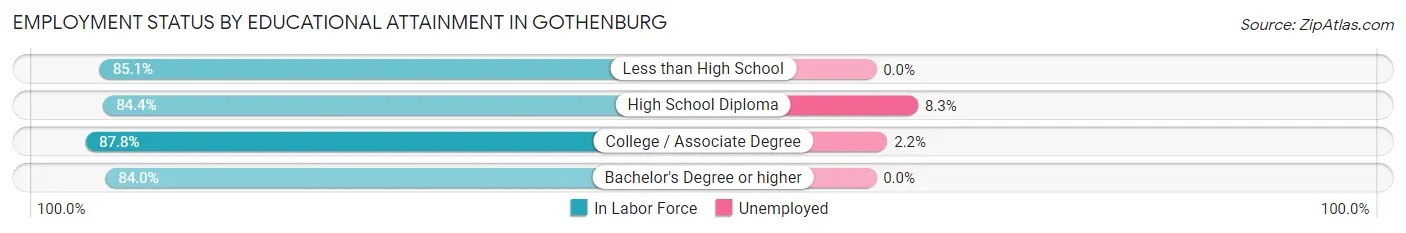
| Educational Attainment | In Labor Force | Unemployed |
| Less than High School | 86 (85.1%) | 0 (0.0%) |
| High School Diploma | 445 (84.4%) | 44 (8.3%) |
| College / Associate Degree | 590 (87.8%) | 15 (2.2%) |
| Bachelor's Degree or higher | 278 (84.0%) | 0 (0.0%) |
| Total | 1,399 (85.8%) | 59 (3.6%) |
Employment Occupations by Sex in Gothenburg
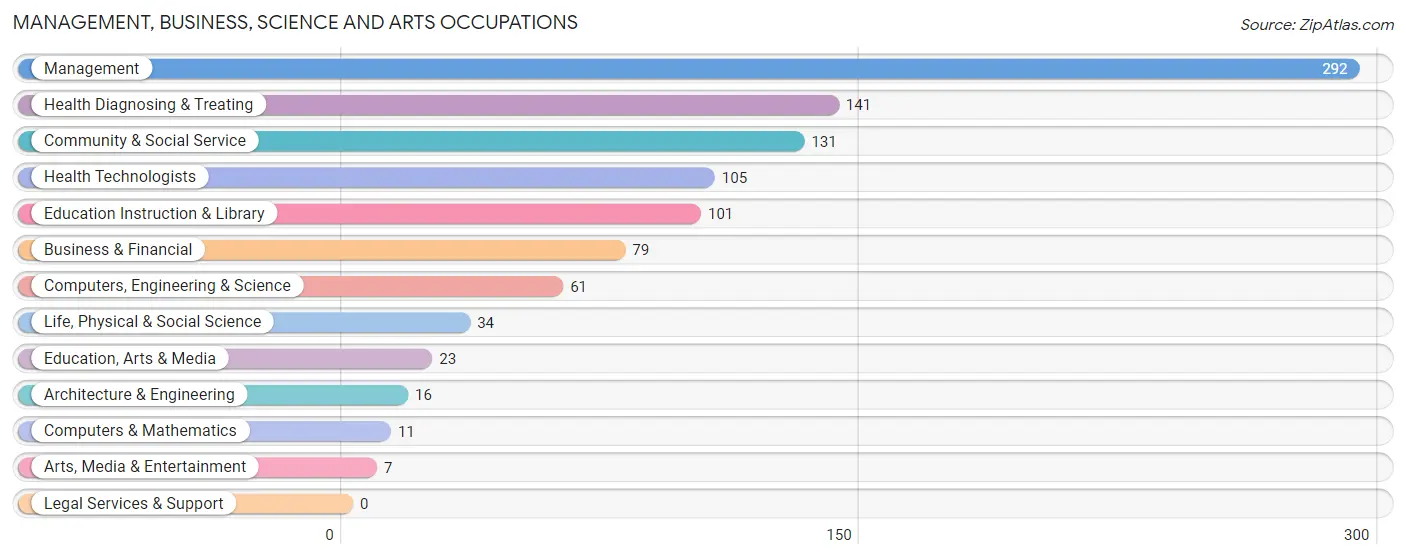
Management, Business, Science and Arts Occupations
The most common Management, Business, Science and Arts occupations in Gothenburg are Management (292 | 15.8%), Health Diagnosing & Treating (141 | 7.6%), Community & Social Service (131 | 7.1%), Health Technologists (105 | 5.7%), and Education Instruction & Library (101 | 5.4%).
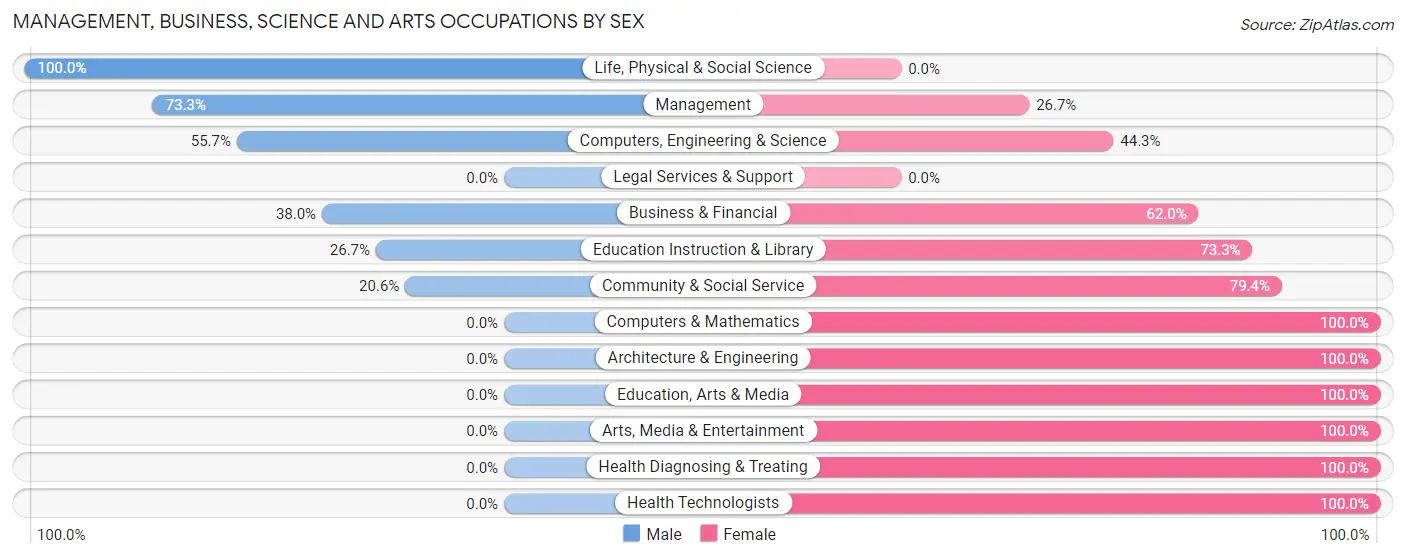
Management, Business, Science and Arts Occupations by Sex
Within the Management, Business, Science and Arts occupations in Gothenburg, the most male-oriented occupations are Life, Physical & Social Science (100.0%), Management (73.3%), and Computers, Engineering & Science (55.7%), while the most female-oriented occupations are Computers & Mathematics (100.0%), Architecture & Engineering (100.0%), and Education, Arts & Media (100.0%).
| Occupation | Male | Female |
| Management | 214 (73.3%) | 78 (26.7%) |
| Business & Financial | 30 (38.0%) | 49 (62.0%) |
| Computers, Engineering & Science | 34 (55.7%) | 27 (44.3%) |
| Computers & Mathematics | 0 (0.0%) | 11 (100.0%) |
| Architecture & Engineering | 0 (0.0%) | 16 (100.0%) |
| Life, Physical & Social Science | 34 (100.0%) | 0 (0.0%) |
| Community & Social Service | 27 (20.6%) | 104 (79.4%) |
| Education, Arts & Media | 0 (0.0%) | 23 (100.0%) |
| Legal Services & Support | 0 (0.0%) | 0 (0.0%) |
| Education Instruction & Library | 27 (26.7%) | 74 (73.3%) |
| Arts, Media & Entertainment | 0 (0.0%) | 7 (100.0%) |
| Health Diagnosing & Treating | 0 (0.0%) | 141 (100.0%) |
| Health Technologists | 0 (0.0%) | 105 (100.0%) |
| Total (Category) | 305 (43.3%) | 399 (56.7%) |
| Total (Overall) | 1,096 (59.2%) | 757 (40.8%) |
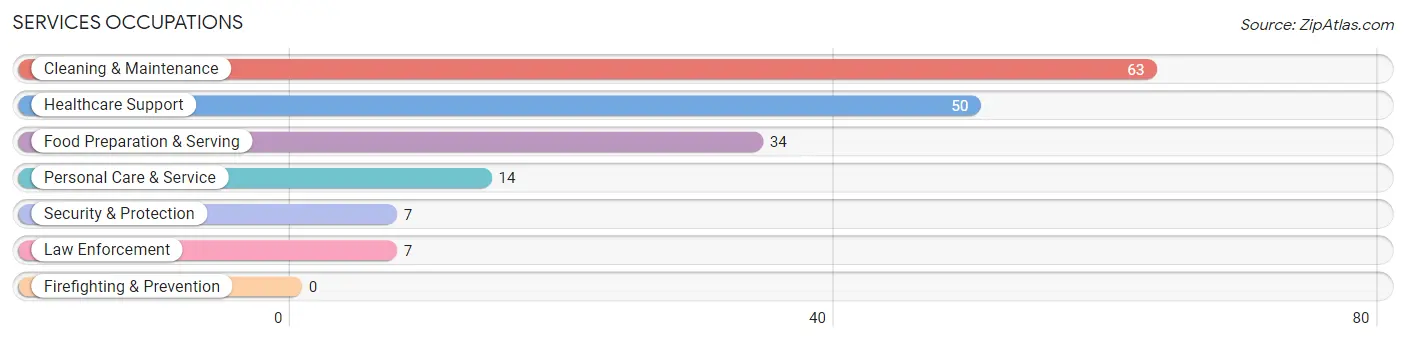
Services Occupations
The most common Services occupations in Gothenburg are Cleaning & Maintenance (63 | 3.4%), Healthcare Support (50 | 2.7%), Food Preparation & Serving (34 | 1.8%), Personal Care & Service (14 | 0.8%), and Security & Protection (7 | 0.4%).
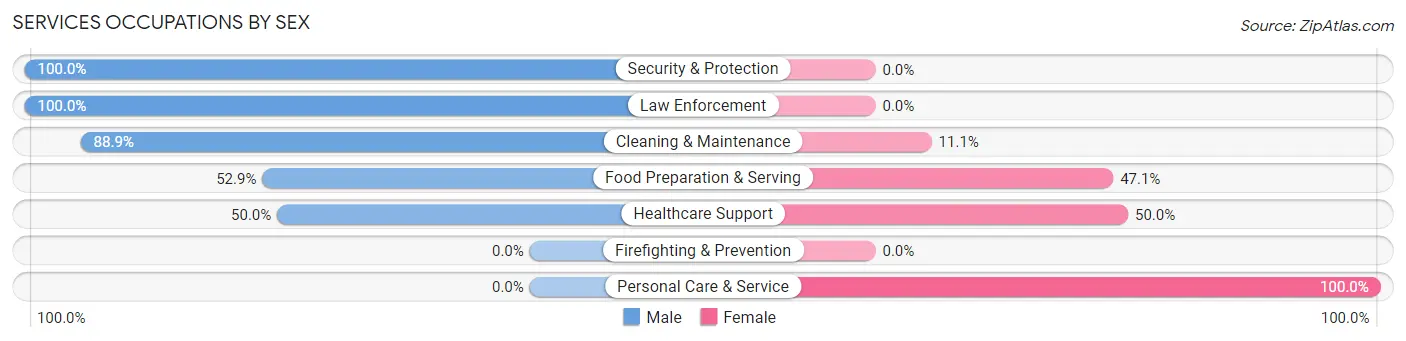
Services Occupations by Sex
Within the Services occupations in Gothenburg, the most male-oriented occupations are Security & Protection (100.0%), Law Enforcement (100.0%), and Cleaning & Maintenance (88.9%), while the most female-oriented occupations are Personal Care & Service (100.0%), Healthcare Support (50.0%), and Food Preparation & Serving (47.1%).
| Occupation | Male | Female |
| Healthcare Support | 25 (50.0%) | 25 (50.0%) |
| Security & Protection | 7 (100.0%) | 0 (0.0%) |
| Firefighting & Prevention | 0 (0.0%) | 0 (0.0%) |
| Law Enforcement | 7 (100.0%) | 0 (0.0%) |
| Food Preparation & Serving | 18 (52.9%) | 16 (47.1%) |
| Cleaning & Maintenance | 56 (88.9%) | 7 (11.1%) |
| Personal Care & Service | 0 (0.0%) | 14 (100.0%) |
| Total (Category) | 106 (63.1%) | 62 (36.9%) |
| Total (Overall) | 1,096 (59.2%) | 757 (40.8%) |
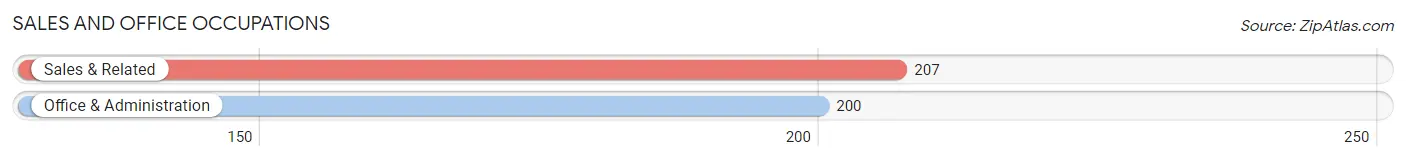
Sales and Office Occupations
The most common Sales and Office occupations in Gothenburg are Sales & Related (207 | 11.2%), and Office & Administration (200 | 10.8%).
Sales and Office Occupations by Sex
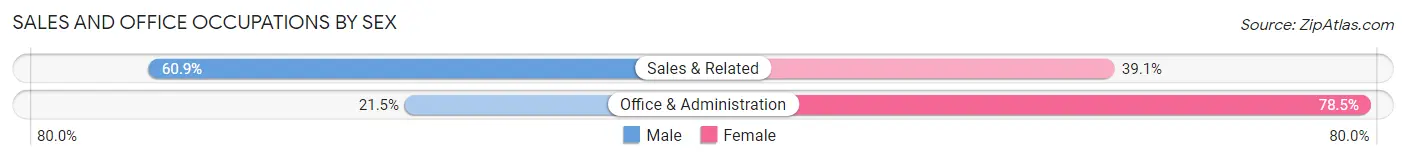
| Occupation | Male | Female |
| Sales & Related | 126 (60.9%) | 81 (39.1%) |
| Office & Administration | 43 (21.5%) | 157 (78.5%) |
| Total (Category) | 169 (41.5%) | 238 (58.5%) |
| Total (Overall) | 1,096 (59.2%) | 757 (40.8%) |
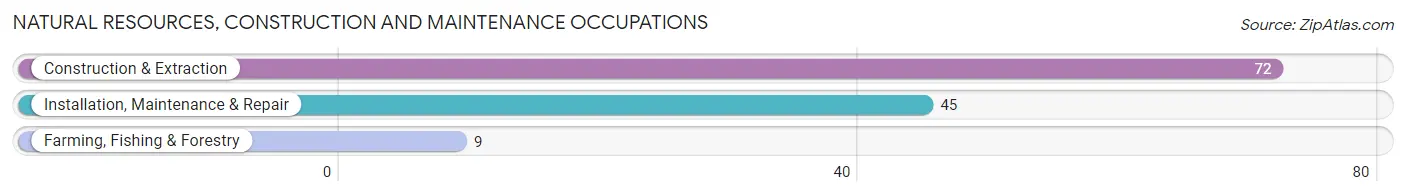
Natural Resources, Construction and Maintenance Occupations
The most common Natural Resources, Construction and Maintenance occupations in Gothenburg are Construction & Extraction (72 | 3.9%), Installation, Maintenance & Repair (45 | 2.4%), and Farming, Fishing & Forestry (9 | 0.5%).
Natural Resources, Construction and Maintenance Occupations by Sex
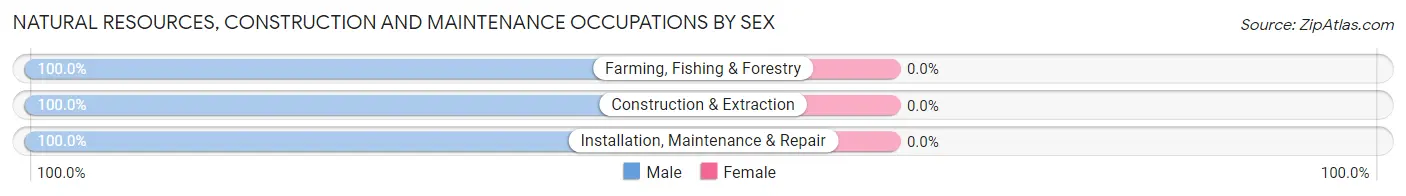
| Occupation | Male | Female |
| Farming, Fishing & Forestry | 9 (100.0%) | 0 (0.0%) |
| Construction & Extraction | 72 (100.0%) | 0 (0.0%) |
| Installation, Maintenance & Repair | 45 (100.0%) | 0 (0.0%) |
| Total (Category) | 126 (100.0%) | 0 (0.0%) |
| Total (Overall) | 1,096 (59.2%) | 757 (40.8%) |
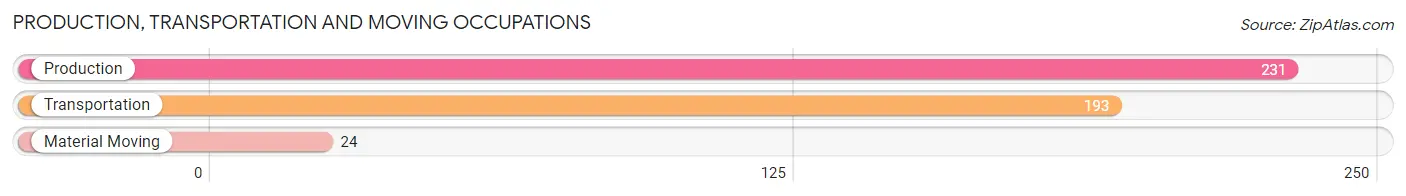
Production, Transportation and Moving Occupations
The most common Production, Transportation and Moving occupations in Gothenburg are Production (231 | 12.5%), Transportation (193 | 10.4%), and Material Moving (24 | 1.3%).
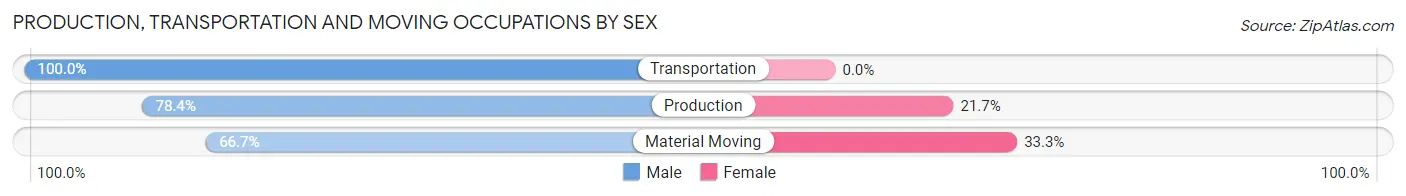
Production, Transportation and Moving Occupations by Sex
| Occupation | Male | Female |
| Production | 181 (78.3%) | 50 (21.6%) |
| Transportation | 193 (100.0%) | 0 (0.0%) |
| Material Moving | 16 (66.7%) | 8 (33.3%) |
| Total (Category) | 390 (87.1%) | 58 (13.0%) |
| Total (Overall) | 1,096 (59.2%) | 757 (40.8%) |
Employment Industries by Sex in Gothenburg
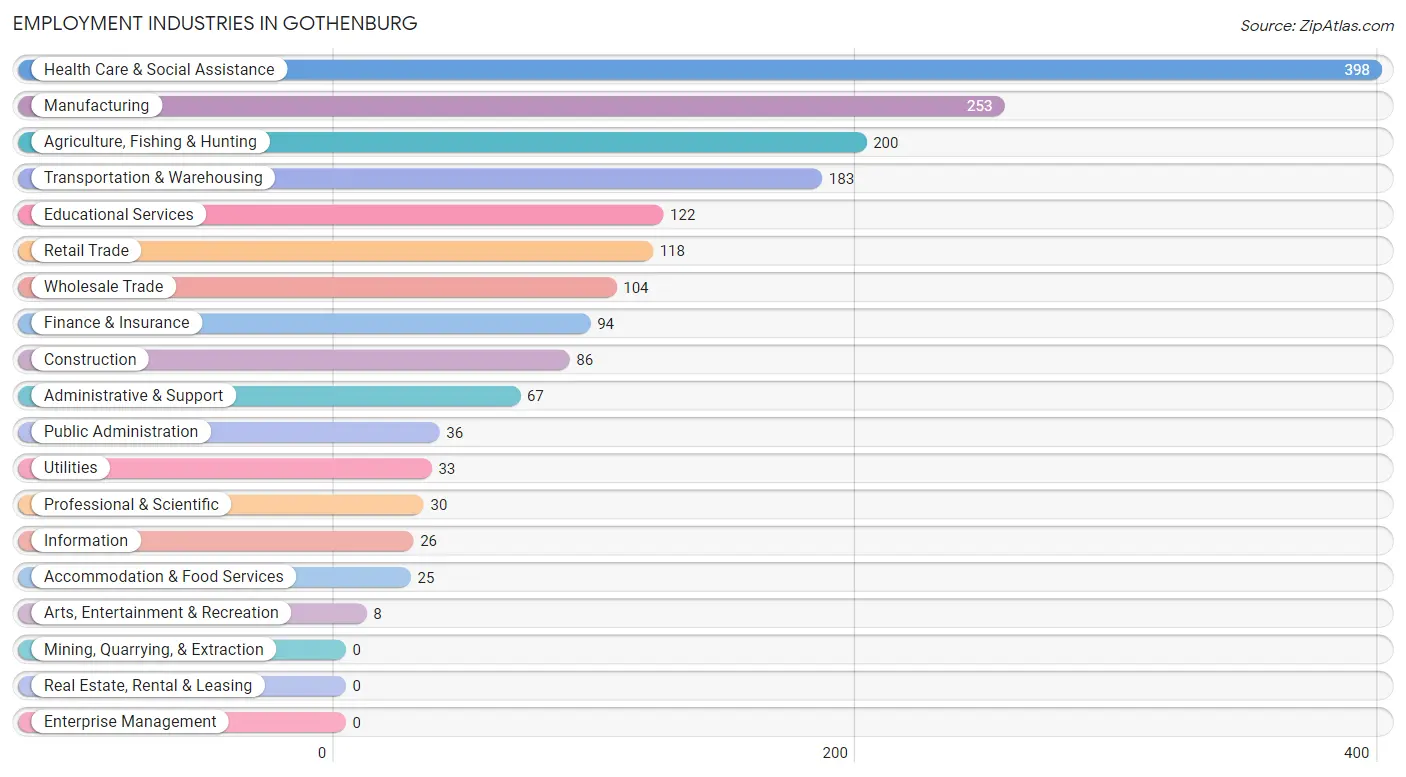
Employment Industries in Gothenburg
The major employment industries in Gothenburg include Health Care & Social Assistance (398 | 21.5%), Manufacturing (253 | 13.7%), Agriculture, Fishing & Hunting (200 | 10.8%), Transportation & Warehousing (183 | 9.9%), and Educational Services (122 | 6.6%).
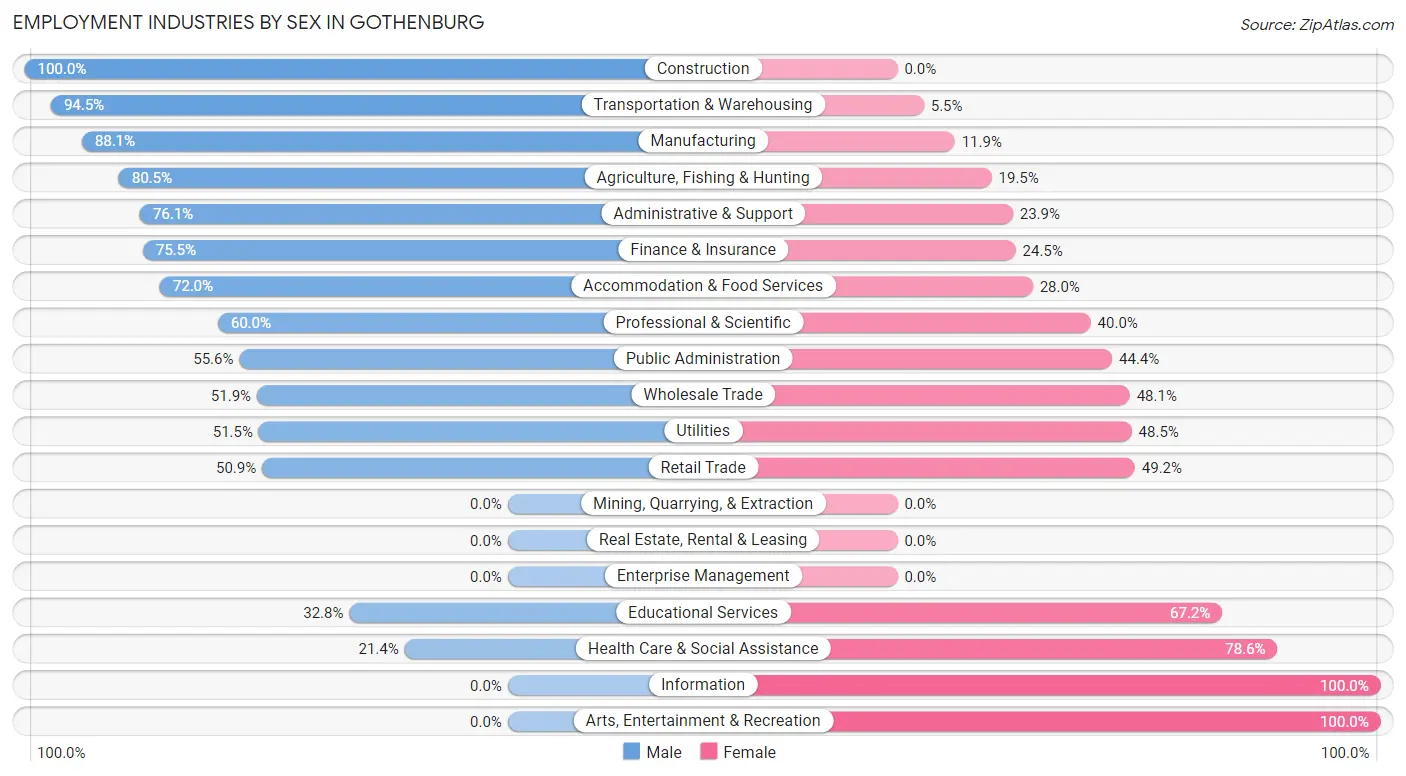
Employment Industries by Sex in Gothenburg
The Gothenburg industries that see more men than women are Construction (100.0%), Transportation & Warehousing (94.5%), and Manufacturing (88.1%), whereas the industries that tend to have a higher number of women are Information (100.0%), Arts, Entertainment & Recreation (100.0%), and Health Care & Social Assistance (78.6%).
| Industry | Male | Female |
| Agriculture, Fishing & Hunting | 161 (80.5%) | 39 (19.5%) |
| Mining, Quarrying, & Extraction | 0 (0.0%) | 0 (0.0%) |
| Construction | 86 (100.0%) | 0 (0.0%) |
| Manufacturing | 223 (88.1%) | 30 (11.9%) |
| Wholesale Trade | 54 (51.9%) | 50 (48.1%) |
| Retail Trade | 60 (50.8%) | 58 (49.1%) |
| Transportation & Warehousing | 173 (94.5%) | 10 (5.5%) |
| Utilities | 17 (51.5%) | 16 (48.5%) |
| Information | 0 (0.0%) | 26 (100.0%) |
| Finance & Insurance | 71 (75.5%) | 23 (24.5%) |
| Real Estate, Rental & Leasing | 0 (0.0%) | 0 (0.0%) |
| Professional & Scientific | 18 (60.0%) | 12 (40.0%) |
| Enterprise Management | 0 (0.0%) | 0 (0.0%) |
| Administrative & Support | 51 (76.1%) | 16 (23.9%) |
| Educational Services | 40 (32.8%) | 82 (67.2%) |
| Health Care & Social Assistance | 85 (21.4%) | 313 (78.6%) |
| Arts, Entertainment & Recreation | 0 (0.0%) | 8 (100.0%) |
| Accommodation & Food Services | 18 (72.0%) | 7 (28.0%) |
| Public Administration | 20 (55.6%) | 16 (44.4%) |
| Total | 1,096 (59.2%) | 757 (40.8%) |
Education in Gothenburg
School Enrollment in Gothenburg
The most common levels of schooling among the 893 students in Gothenburg are high school (262 | 29.3%), elementary school (206 | 23.1%), and middle school (183 | 20.5%).
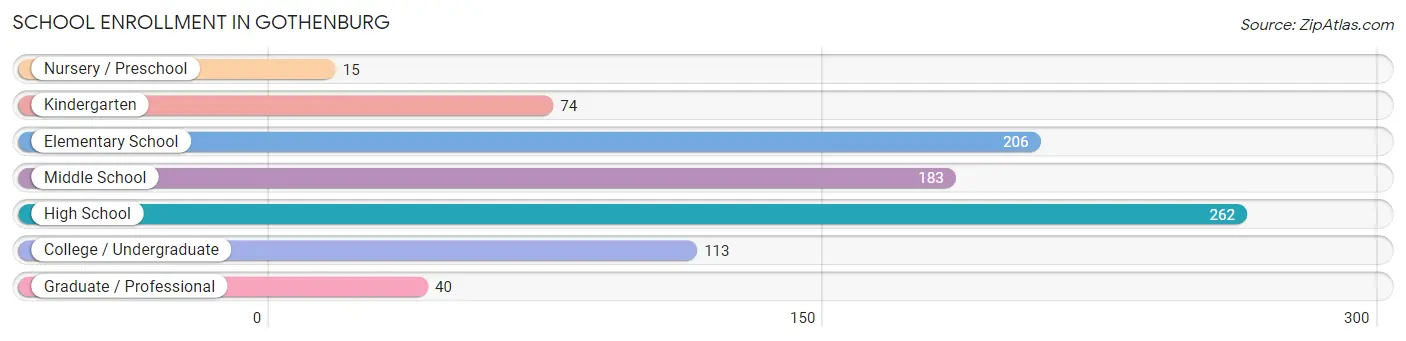
| School Level | # Students | % Students |
| Nursery / Preschool | 15 | 1.7% |
| Kindergarten | 74 | 8.3% |
| Elementary School | 206 | 23.1% |
| Middle School | 183 | 20.5% |
| High School | 262 | 29.3% |
| College / Undergraduate | 113 | 12.7% |
| Graduate / Professional | 40 | 4.5% |
| Total | 893 | 100.0% |
School Enrollment by Age by Funding Source in Gothenburg
Out of a total of 893 students who are enrolled in schools in Gothenburg, 51 (5.7%) attend a private institution, while the remaining 842 (94.3%) are enrolled in public schools. The age group of 25 to 34 year olds has the highest likelihood of being enrolled in private schools, with 19 (47.5% in the age bracket) enrolled. Conversely, the age group of 3 to 4 year olds has the lowest likelihood of being enrolled in a private school, with 15 (100.0% in the age bracket) attending a public institution.
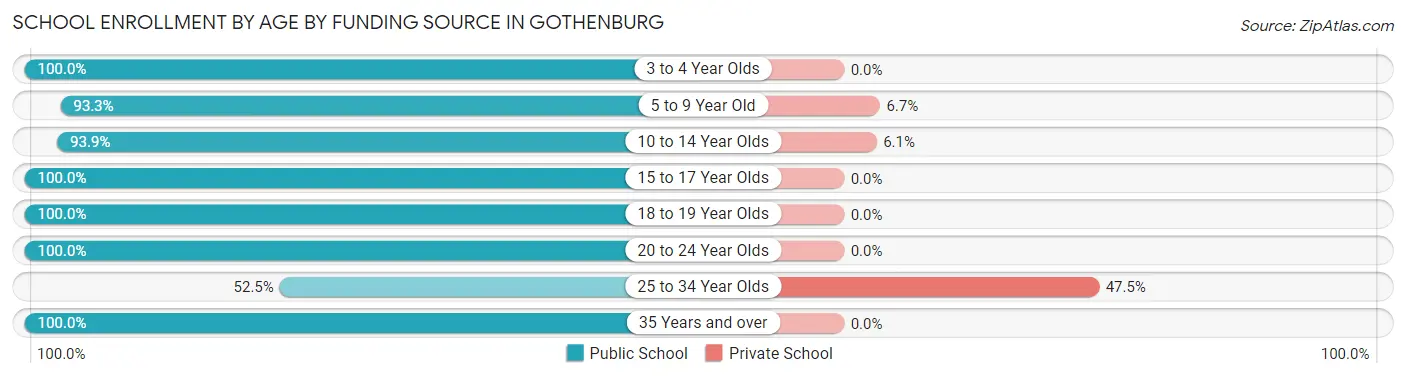
| Age Bracket | Public School | Private School |
| 3 to 4 Year Olds | 15 (100.0%) | 0 (0.0%) |
| 5 to 9 Year Old | 252 (93.3%) | 18 (6.7%) |
| 10 to 14 Year Olds | 217 (93.9%) | 14 (6.1%) |
| 15 to 17 Year Olds | 199 (100.0%) | 0 (0.0%) |
| 18 to 19 Year Olds | 45 (100.0%) | 0 (0.0%) |
| 20 to 24 Year Olds | 73 (100.0%) | 0 (0.0%) |
| 25 to 34 Year Olds | 21 (52.5%) | 19 (47.5%) |
| 35 Years and over | 20 (100.0%) | 0 (0.0%) |
| Total | 842 (94.3%) | 51 (5.7%) |
Educational Attainment by Field of Study in Gothenburg
Education (169 | 29.6%), business (122 | 21.4%), science & technology (109 | 19.1%), bio, nature & agricultural (73 | 12.8%), and computers & mathematics (30 | 5.2%) are the most common fields of study among 571 individuals in Gothenburg who have obtained a bachelor's degree or higher.
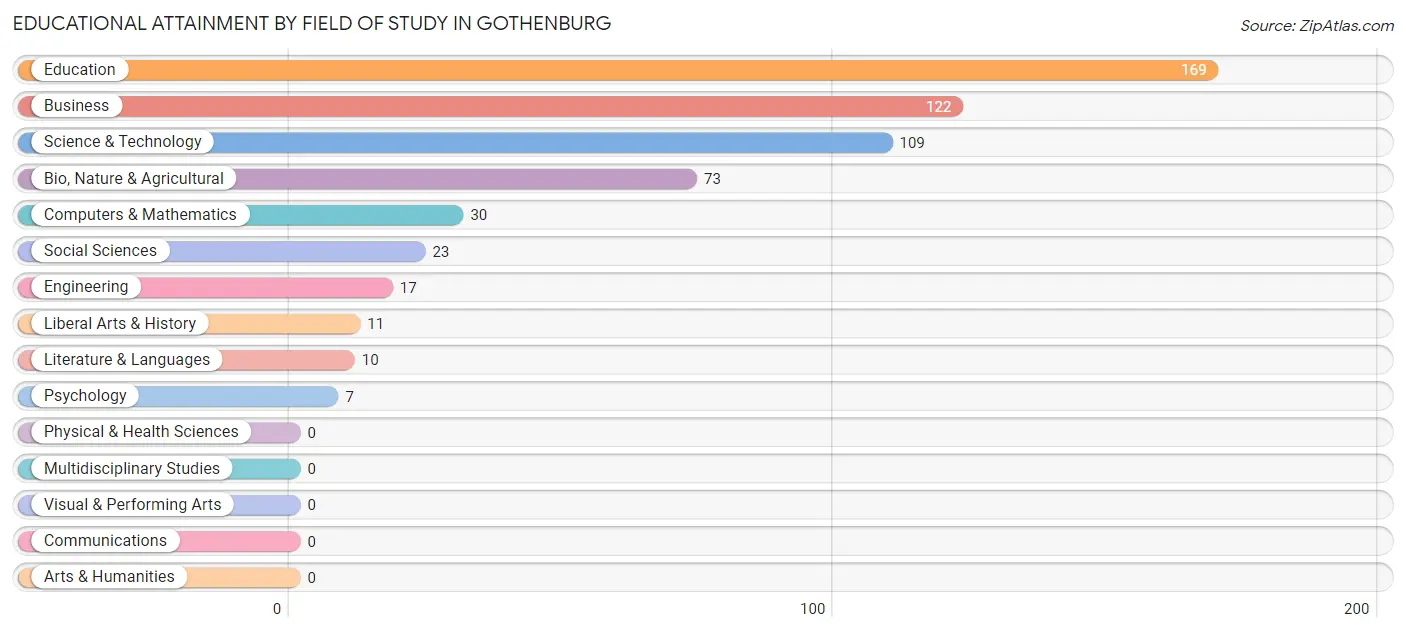
| Field of Study | # Graduates | % Graduates |
| Computers & Mathematics | 30 | 5.2% |
| Bio, Nature & Agricultural | 73 | 12.8% |
| Physical & Health Sciences | 0 | 0.0% |
| Psychology | 7 | 1.2% |
| Social Sciences | 23 | 4.0% |
| Engineering | 17 | 3.0% |
| Multidisciplinary Studies | 0 | 0.0% |
| Science & Technology | 109 | 19.1% |
| Business | 122 | 21.4% |
| Education | 169 | 29.6% |
| Literature & Languages | 10 | 1.8% |
| Liberal Arts & History | 11 | 1.9% |
| Visual & Performing Arts | 0 | 0.0% |
| Communications | 0 | 0.0% |
| Arts & Humanities | 0 | 0.0% |
| Total | 571 | 100.0% |
Transportation & Commute in Gothenburg
Vehicle Availability by Sex in Gothenburg
The most prevalent vehicle ownership categories in Gothenburg are males with 3 vehicles (530, accounting for 48.4%) and females with 3 vehicles (228, making up 71.0%).
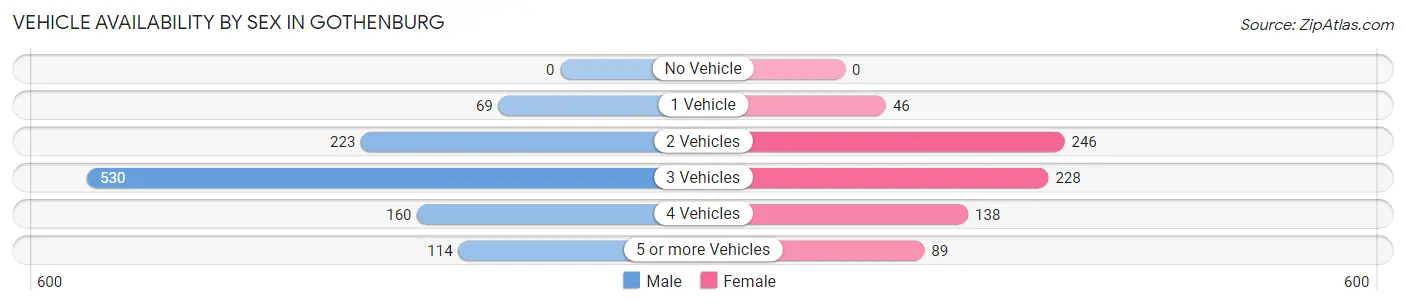
| Vehicles Available | Male | Female |
| No Vehicle | 0 (0.0%) | 0 (0.0%) |
| 1 Vehicle | 69 (6.3%) | 46 (6.2%) |
| 2 Vehicles | 223 (20.3%) | 246 (32.9%) |
| 3 Vehicles | 530 (48.4%) | 228 (30.5%) |
| 4 Vehicles | 160 (14.6%) | 138 (18.5%) |
| 5 or more Vehicles | 114 (10.4%) | 89 (11.9%) |
| Total | 1,096 (100.0%) | 747 (100.0%) |
Commute Time in Gothenburg
The most frequently occuring commute durations in Gothenburg are 5 to 9 minutes (679 commuters, 38.1%), less than 5 minutes (392 commuters, 22.0%), and 15 to 19 minutes (141 commuters, 7.9%).
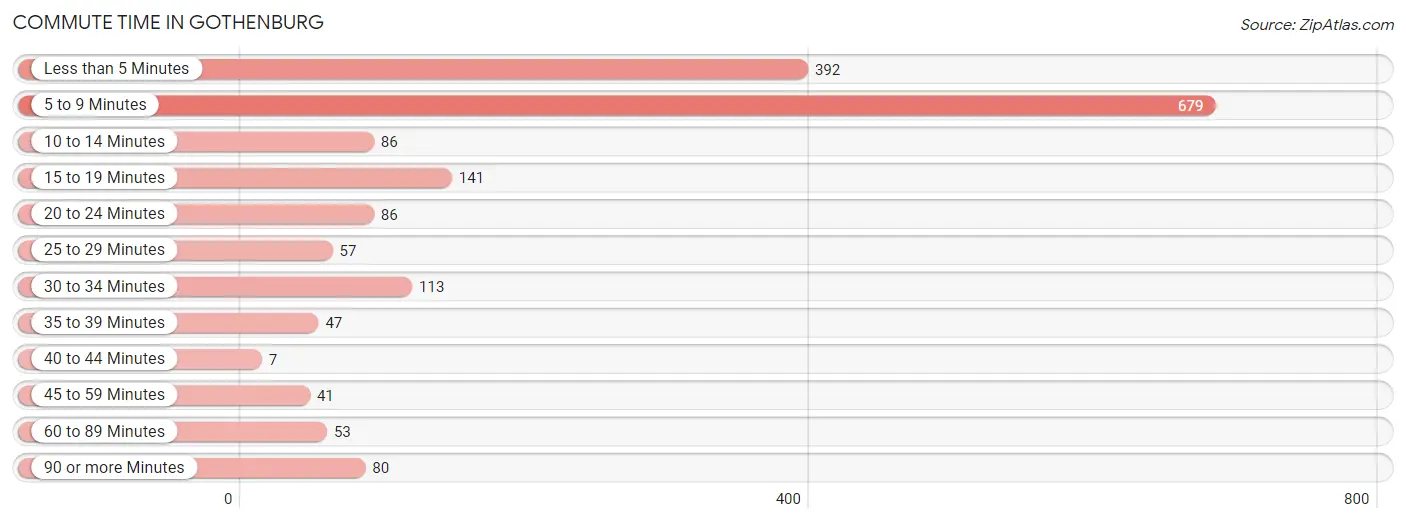
| Commute Time | # Commuters | % Commuters |
| Less than 5 Minutes | 392 | 22.0% |
| 5 to 9 Minutes | 679 | 38.1% |
| 10 to 14 Minutes | 86 | 4.8% |
| 15 to 19 Minutes | 141 | 7.9% |
| 20 to 24 Minutes | 86 | 4.8% |
| 25 to 29 Minutes | 57 | 3.2% |
| 30 to 34 Minutes | 113 | 6.3% |
| 35 to 39 Minutes | 47 | 2.6% |
| 40 to 44 Minutes | 7 | 0.4% |
| 45 to 59 Minutes | 41 | 2.3% |
| 60 to 89 Minutes | 53 | 3.0% |
| 90 or more Minutes | 80 | 4.5% |
Commute Time by Sex in Gothenburg
The most common commute times in Gothenburg are 5 to 9 minutes (378 commuters, 35.1%) for males and 5 to 9 minutes (301 commuters, 42.8%) for females.
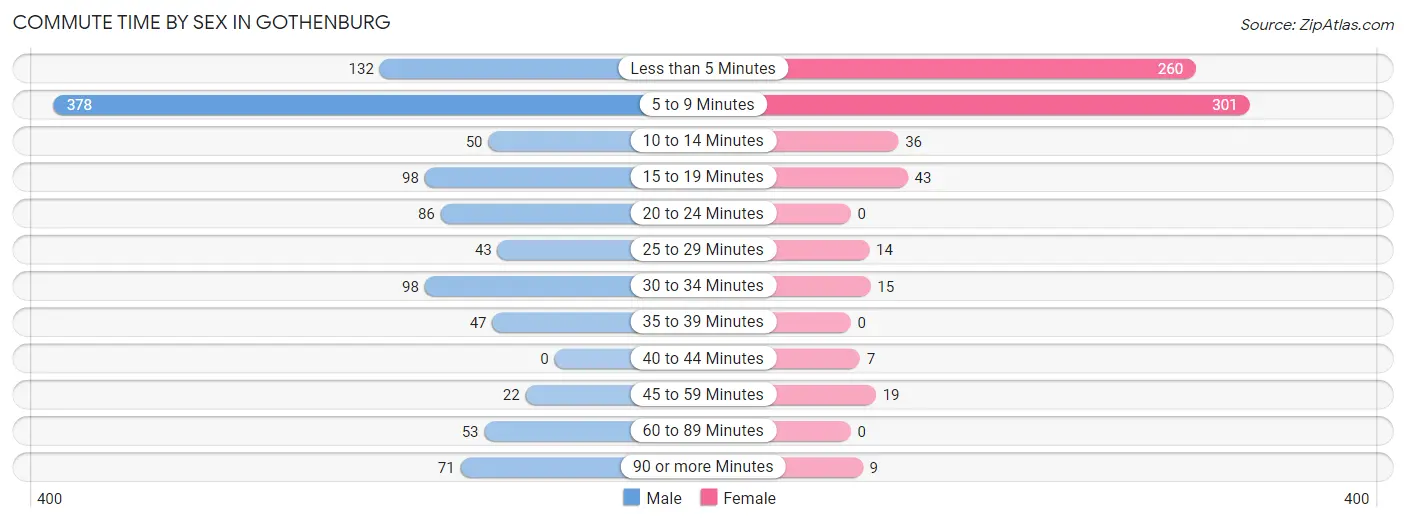
| Commute Time | Male | Female |
| Less than 5 Minutes | 132 (12.2%) | 260 (36.9%) |
| 5 to 9 Minutes | 378 (35.1%) | 301 (42.8%) |
| 10 to 14 Minutes | 50 (4.6%) | 36 (5.1%) |
| 15 to 19 Minutes | 98 (9.1%) | 43 (6.1%) |
| 20 to 24 Minutes | 86 (8.0%) | 0 (0.0%) |
| 25 to 29 Minutes | 43 (4.0%) | 14 (2.0%) |
| 30 to 34 Minutes | 98 (9.1%) | 15 (2.1%) |
| 35 to 39 Minutes | 47 (4.4%) | 0 (0.0%) |
| 40 to 44 Minutes | 0 (0.0%) | 7 (1.0%) |
| 45 to 59 Minutes | 22 (2.0%) | 19 (2.7%) |
| 60 to 89 Minutes | 53 (4.9%) | 0 (0.0%) |
| 90 or more Minutes | 71 (6.6%) | 9 (1.3%) |
Time of Departure to Work by Sex in Gothenburg
The most frequent times of departure to work in Gothenburg are 6:30 AM to 6:59 AM (213, 19.8%) for males and 7:30 AM to 7:59 AM (273, 38.8%) for females.
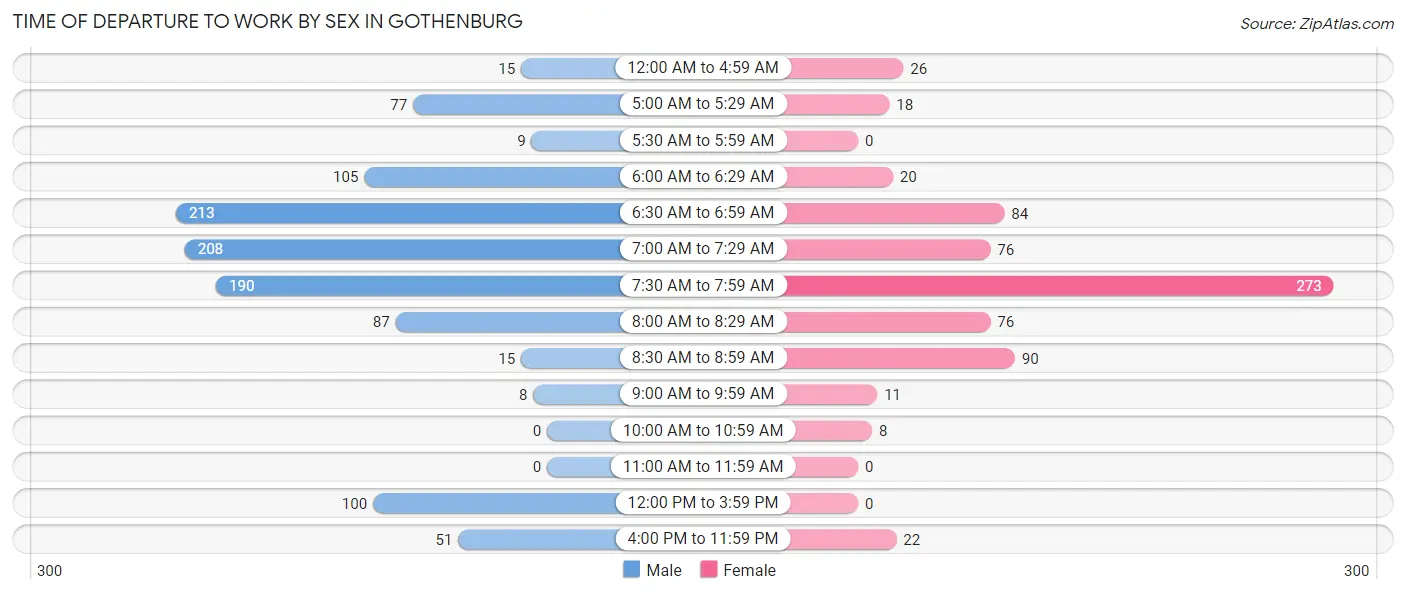
| Time of Departure | Male | Female |
| 12:00 AM to 4:59 AM | 15 (1.4%) | 26 (3.7%) |
| 5:00 AM to 5:29 AM | 77 (7.1%) | 18 (2.6%) |
| 5:30 AM to 5:59 AM | 9 (0.8%) | 0 (0.0%) |
| 6:00 AM to 6:29 AM | 105 (9.7%) | 20 (2.8%) |
| 6:30 AM to 6:59 AM | 213 (19.8%) | 84 (11.9%) |
| 7:00 AM to 7:29 AM | 208 (19.3%) | 76 (10.8%) |
| 7:30 AM to 7:59 AM | 190 (17.6%) | 273 (38.8%) |
| 8:00 AM to 8:29 AM | 87 (8.1%) | 76 (10.8%) |
| 8:30 AM to 8:59 AM | 15 (1.4%) | 90 (12.8%) |
| 9:00 AM to 9:59 AM | 8 (0.7%) | 11 (1.6%) |
| 10:00 AM to 10:59 AM | 0 (0.0%) | 8 (1.1%) |
| 11:00 AM to 11:59 AM | 0 (0.0%) | 0 (0.0%) |
| 12:00 PM to 3:59 PM | 100 (9.3%) | 0 (0.0%) |
| 4:00 PM to 11:59 PM | 51 (4.7%) | 22 (3.1%) |
| Total | 1,078 (100.0%) | 704 (100.0%) |
Housing Occupancy in Gothenburg
Occupancy by Ownership in Gothenburg
Of the total 1,382 dwellings in Gothenburg, owner-occupied units account for 1,053 (76.2%), while renter-occupied units make up 329 (23.8%).
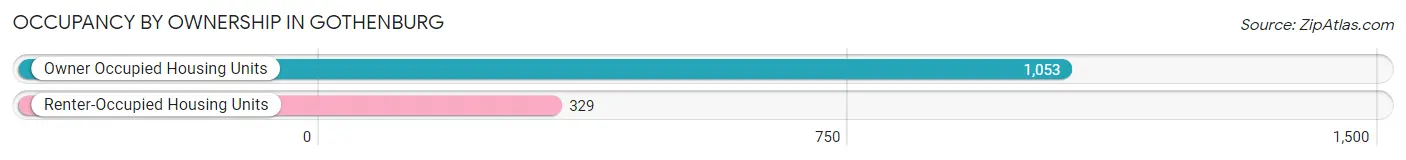
| Occupancy | # Housing Units | % Housing Units |
| Owner Occupied Housing Units | 1,053 | 76.2% |
| Renter-Occupied Housing Units | 329 | 23.8% |
| Total Occupied Housing Units | 1,382 | 100.0% |
Occupancy by Household Size in Gothenburg
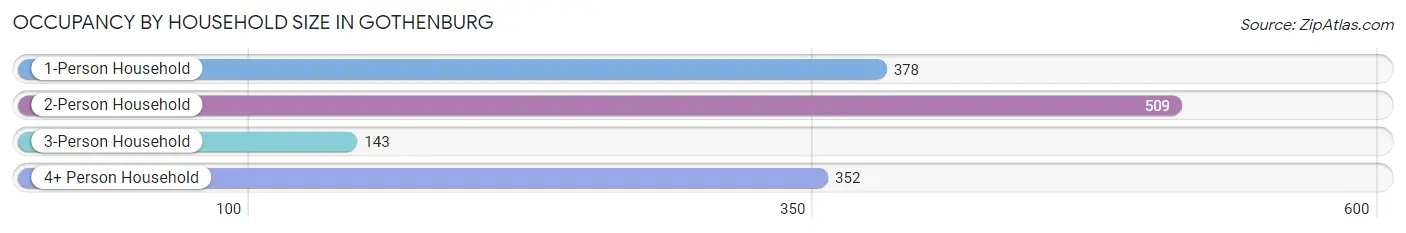
| Household Size | # Housing Units | % Housing Units |
| 1-Person Household | 378 | 27.4% |
| 2-Person Household | 509 | 36.8% |
| 3-Person Household | 143 | 10.3% |
| 4+ Person Household | 352 | 25.5% |
| Total Housing Units | 1,382 | 100.0% |
Occupancy by Ownership by Household Size in Gothenburg
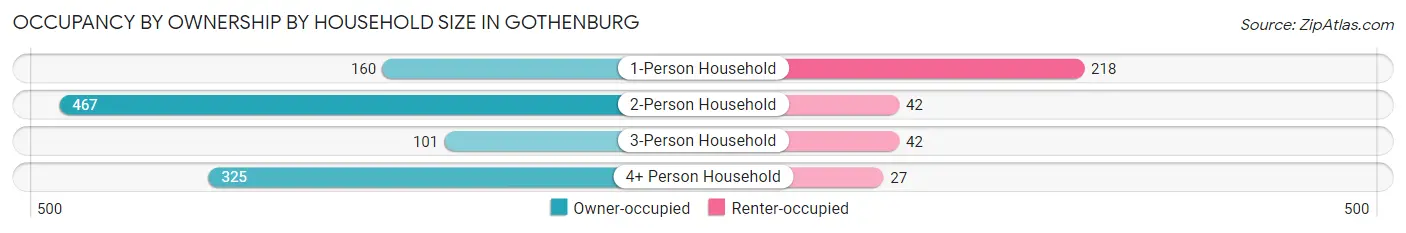
| Household Size | Owner-occupied | Renter-occupied |
| 1-Person Household | 160 (42.3%) | 218 (57.7%) |
| 2-Person Household | 467 (91.7%) | 42 (8.3%) |
| 3-Person Household | 101 (70.6%) | 42 (29.4%) |
| 4+ Person Household | 325 (92.3%) | 27 (7.7%) |
| Total Housing Units | 1,053 (76.2%) | 329 (23.8%) |
Occupancy by Educational Attainment in Gothenburg
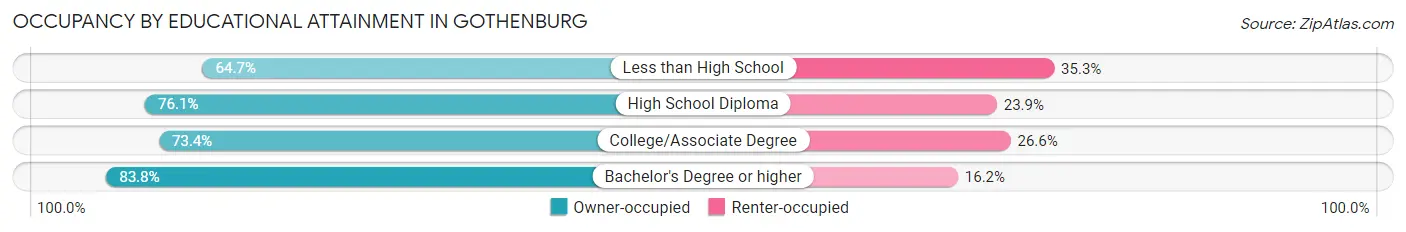
| Household Size | Owner-occupied | Renter-occupied |
| Less than High School | 66 (64.7%) | 36 (35.3%) |
| High School Diploma | 296 (76.1%) | 93 (23.9%) |
| College/Associate Degree | 391 (73.4%) | 142 (26.6%) |
| Bachelor's Degree or higher | 300 (83.8%) | 58 (16.2%) |
Occupancy by Age of Householder in Gothenburg
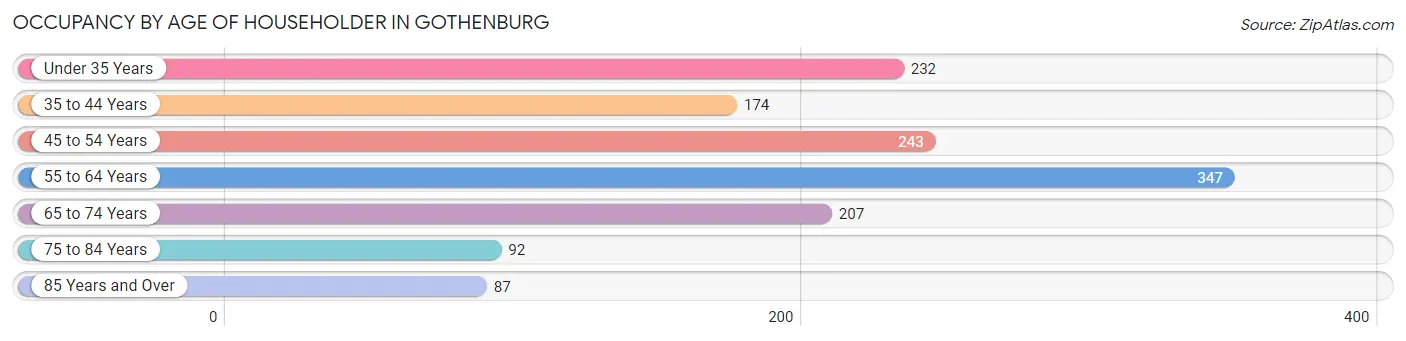
| Age Bracket | # Households | % Households |
| Under 35 Years | 232 | 16.8% |
| 35 to 44 Years | 174 | 12.6% |
| 45 to 54 Years | 243 | 17.6% |
| 55 to 64 Years | 347 | 25.1% |
| 65 to 74 Years | 207 | 15.0% |
| 75 to 84 Years | 92 | 6.7% |
| 85 Years and Over | 87 | 6.3% |
| Total | 1,382 | 100.0% |
Housing Finances in Gothenburg
Median Income by Occupancy in Gothenburg
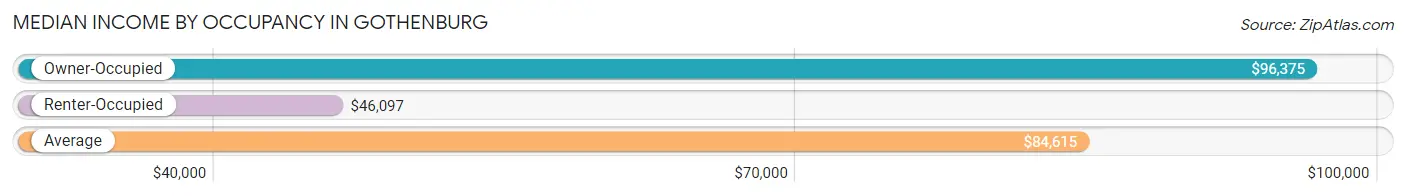
| Occupancy Type | # Households | Median Income |
| Owner-Occupied | 1,053 (76.2%) | $96,375 |
| Renter-Occupied | 329 (23.8%) | $46,097 |
| Average | 1,382 (100.0%) | $84,615 |
Occupancy by Householder Income Bracket in Gothenburg
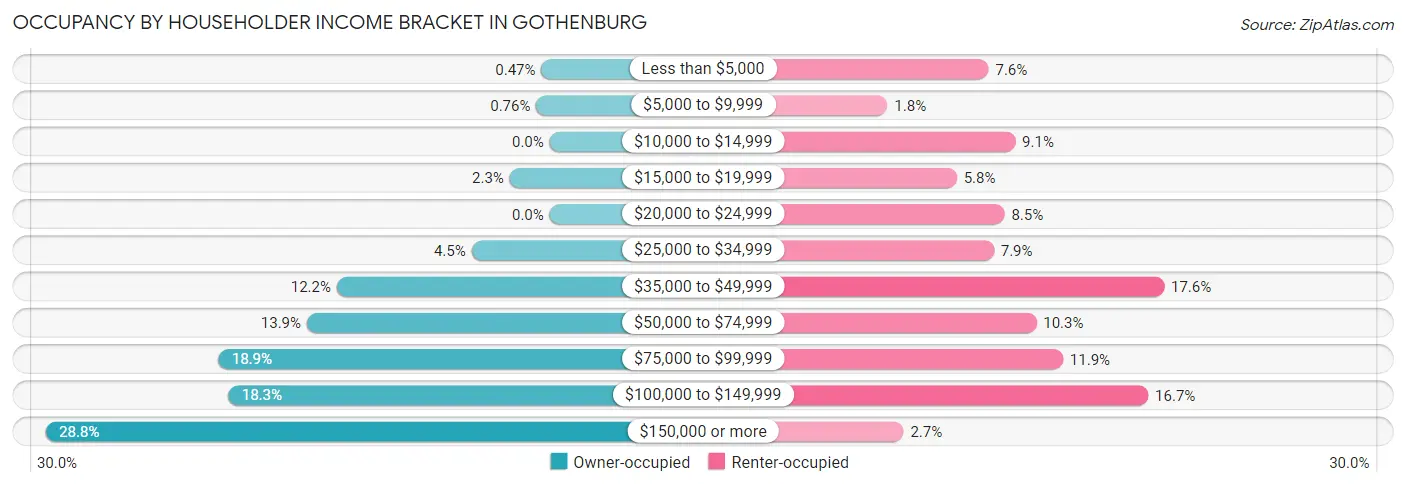
| Income Bracket | Owner-occupied | Renter-occupied |
| Less than $5,000 | 5 (0.5%) | 25 (7.6%) |
| $5,000 to $9,999 | 8 (0.8%) | 6 (1.8%) |
| $10,000 to $14,999 | 0 (0.0%) | 30 (9.1%) |
| $15,000 to $19,999 | 24 (2.3%) | 19 (5.8%) |
| $20,000 to $24,999 | 0 (0.0%) | 28 (8.5%) |
| $25,000 to $34,999 | 47 (4.5%) | 26 (7.9%) |
| $35,000 to $49,999 | 128 (12.2%) | 58 (17.6%) |
| $50,000 to $74,999 | 146 (13.9%) | 34 (10.3%) |
| $75,000 to $99,999 | 199 (18.9%) | 39 (11.8%) |
| $100,000 to $149,999 | 193 (18.3%) | 55 (16.7%) |
| $150,000 or more | 303 (28.8%) | 9 (2.7%) |
| Total | 1,053 (100.0%) | 329 (100.0%) |
Monthly Housing Cost Tiers in Gothenburg
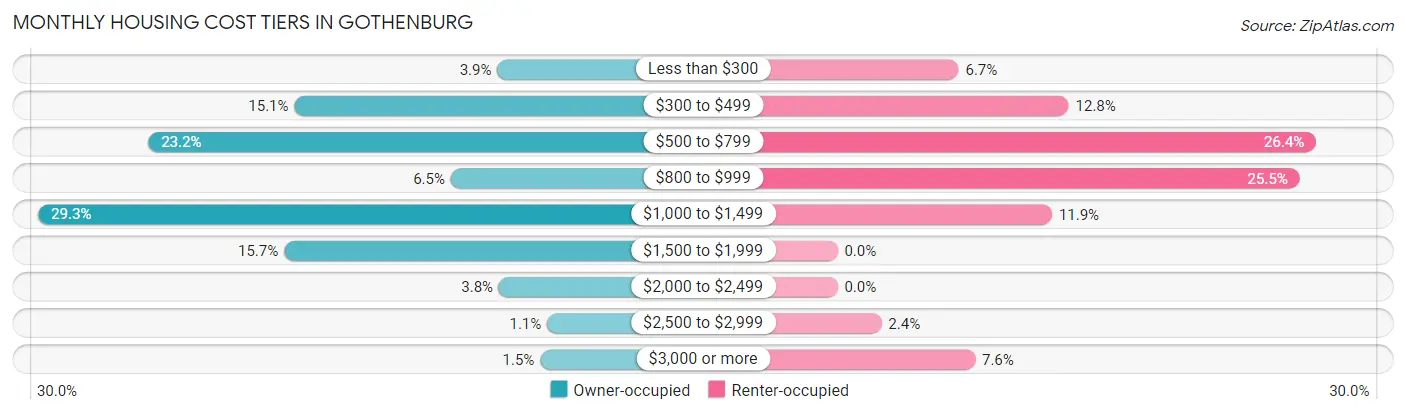
| Monthly Cost | Owner-occupied | Renter-occupied |
| Less than $300 | 41 (3.9%) | 22 (6.7%) |
| $300 to $499 | 159 (15.1%) | 42 (12.8%) |
| $500 to $799 | 244 (23.2%) | 87 (26.4%) |
| $800 to $999 | 68 (6.5%) | 84 (25.5%) |
| $1,000 to $1,499 | 308 (29.2%) | 39 (11.8%) |
| $1,500 to $1,999 | 165 (15.7%) | 0 (0.0%) |
| $2,000 to $2,499 | 40 (3.8%) | 0 (0.0%) |
| $2,500 to $2,999 | 12 (1.1%) | 8 (2.4%) |
| $3,000 or more | 16 (1.5%) | 25 (7.6%) |
| Total | 1,053 (100.0%) | 329 (100.0%) |
Physical Housing Characteristics in Gothenburg
Housing Structures in Gothenburg
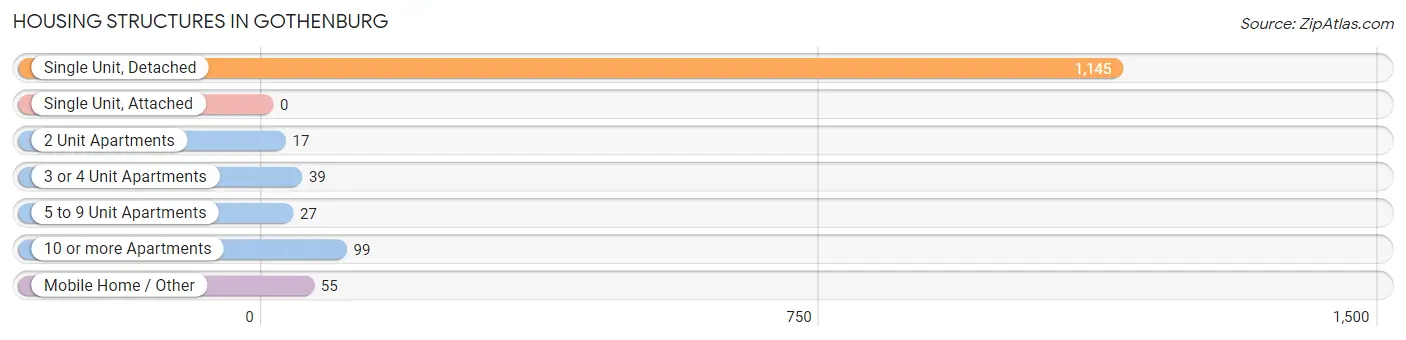
| Structure Type | # Housing Units | % Housing Units |
| Single Unit, Detached | 1,145 | 82.9% |
| Single Unit, Attached | 0 | 0.0% |
| 2 Unit Apartments | 17 | 1.2% |
| 3 or 4 Unit Apartments | 39 | 2.8% |
| 5 to 9 Unit Apartments | 27 | 1.9% |
| 10 or more Apartments | 99 | 7.2% |
| Mobile Home / Other | 55 | 4.0% |
| Total | 1,382 | 100.0% |
Housing Structures by Occupancy in Gothenburg
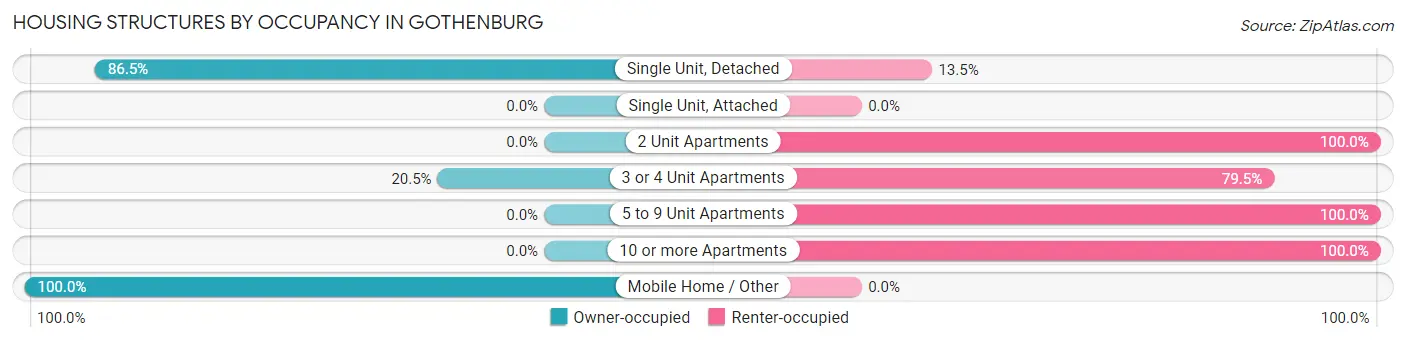
| Structure Type | Owner-occupied | Renter-occupied |
| Single Unit, Detached | 990 (86.5%) | 155 (13.5%) |
| Single Unit, Attached | 0 (0.0%) | 0 (0.0%) |
| 2 Unit Apartments | 0 (0.0%) | 17 (100.0%) |
| 3 or 4 Unit Apartments | 8 (20.5%) | 31 (79.5%) |
| 5 to 9 Unit Apartments | 0 (0.0%) | 27 (100.0%) |
| 10 or more Apartments | 0 (0.0%) | 99 (100.0%) |
| Mobile Home / Other | 55 (100.0%) | 0 (0.0%) |
| Total | 1,053 (76.2%) | 329 (23.8%) |
Housing Structures by Number of Rooms in Gothenburg
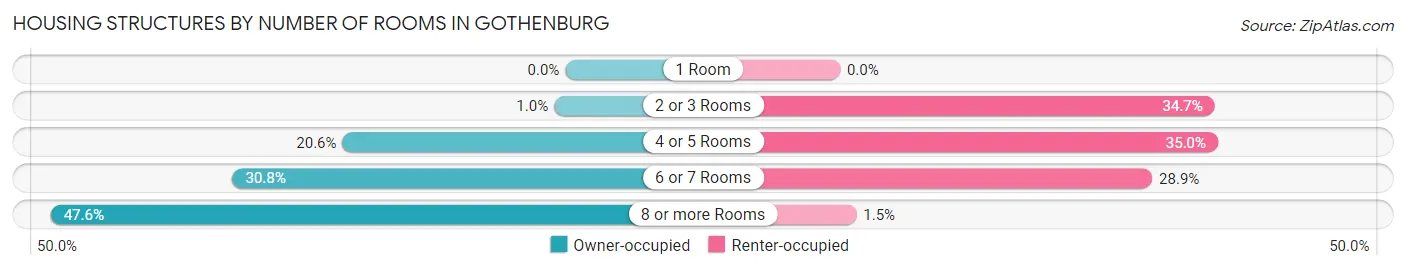
| Number of Rooms | Owner-occupied | Renter-occupied |
| 1 Room | 0 (0.0%) | 0 (0.0%) |
| 2 or 3 Rooms | 11 (1.0%) | 114 (34.6%) |
| 4 or 5 Rooms | 217 (20.6%) | 115 (34.9%) |
| 6 or 7 Rooms | 324 (30.8%) | 95 (28.9%) |
| 8 or more Rooms | 501 (47.6%) | 5 (1.5%) |
| Total | 1,053 (100.0%) | 329 (100.0%) |
Housing Structure by Heating Type in Gothenburg
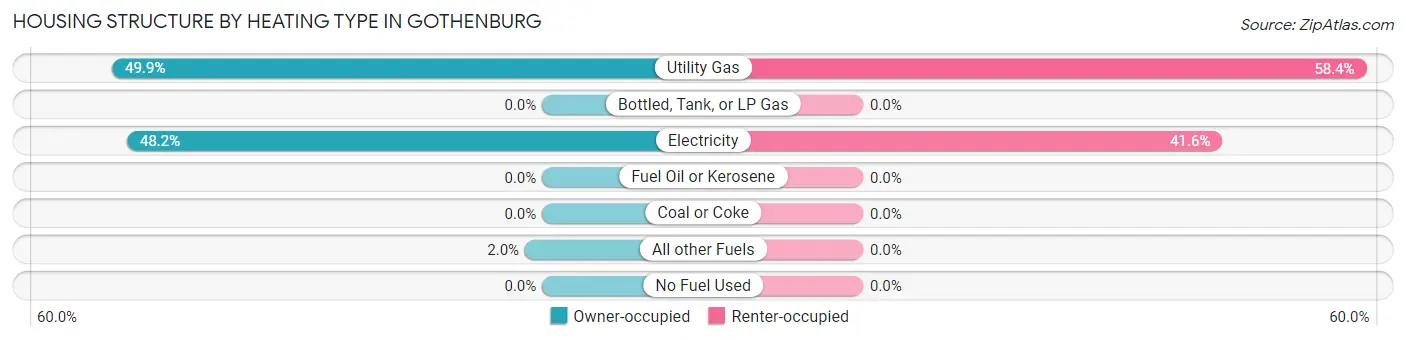
| Heating Type | Owner-occupied | Renter-occupied |
| Utility Gas | 525 (49.9%) | 192 (58.4%) |
| Bottled, Tank, or LP Gas | 0 (0.0%) | 0 (0.0%) |
| Electricity | 507 (48.1%) | 137 (41.6%) |
| Fuel Oil or Kerosene | 0 (0.0%) | 0 (0.0%) |
| Coal or Coke | 0 (0.0%) | 0 (0.0%) |
| All other Fuels | 21 (2.0%) | 0 (0.0%) |
| No Fuel Used | 0 (0.0%) | 0 (0.0%) |
| Total | 1,053 (100.0%) | 329 (100.0%) |
Household Vehicle Usage in Gothenburg
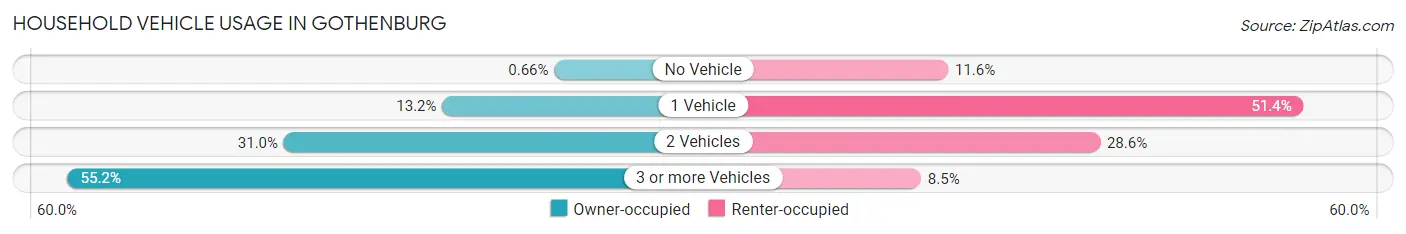
| Vehicles per Household | Owner-occupied | Renter-occupied |
| No Vehicle | 7 (0.7%) | 38 (11.6%) |
| 1 Vehicle | 139 (13.2%) | 169 (51.4%) |
| 2 Vehicles | 326 (31.0%) | 94 (28.6%) |
| 3 or more Vehicles | 581 (55.2%) | 28 (8.5%) |
| Total | 1,053 (100.0%) | 329 (100.0%) |
Real Estate & Mortgages in Gothenburg
Real Estate and Mortgage Overview in Gothenburg
| Characteristic | Without Mortgage | With Mortgage |
| Housing Units | 430 | 623 |
| Median Property Value | $155,100 | $150,500 |
| Median Household Income | $76,545 | $213 |
| Monthly Housing Costs | $529 | $16 |
| Real Estate Taxes | $1,739 | $11 |
Property Value by Mortgage Status in Gothenburg
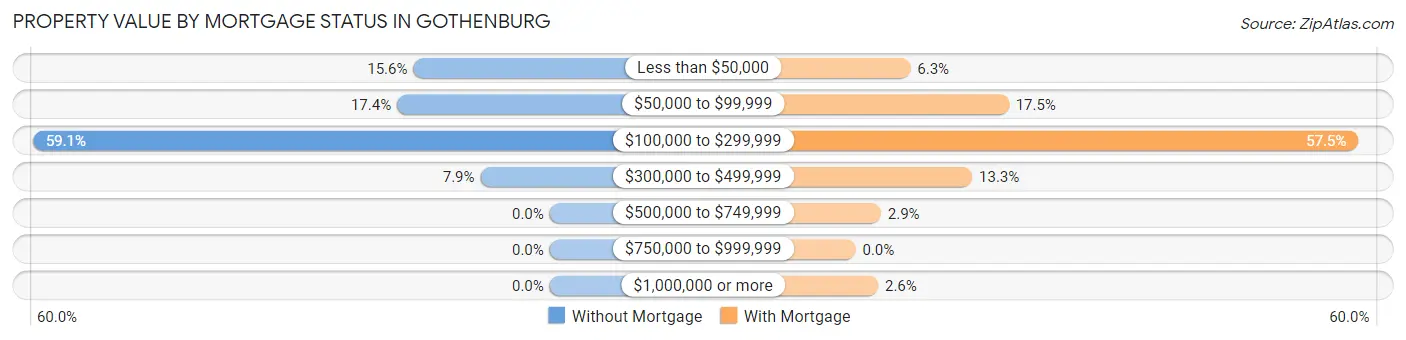
| Property Value | Without Mortgage | With Mortgage |
| Less than $50,000 | 67 (15.6%) | 39 (6.3%) |
| $50,000 to $99,999 | 75 (17.4%) | 109 (17.5%) |
| $100,000 to $299,999 | 254 (59.1%) | 358 (57.5%) |
| $300,000 to $499,999 | 34 (7.9%) | 83 (13.3%) |
| $500,000 to $749,999 | 0 (0.0%) | 18 (2.9%) |
| $750,000 to $999,999 | 0 (0.0%) | 0 (0.0%) |
| $1,000,000 or more | 0 (0.0%) | 16 (2.6%) |
| Total | 430 (100.0%) | 623 (100.0%) |
Household Income by Mortgage Status in Gothenburg
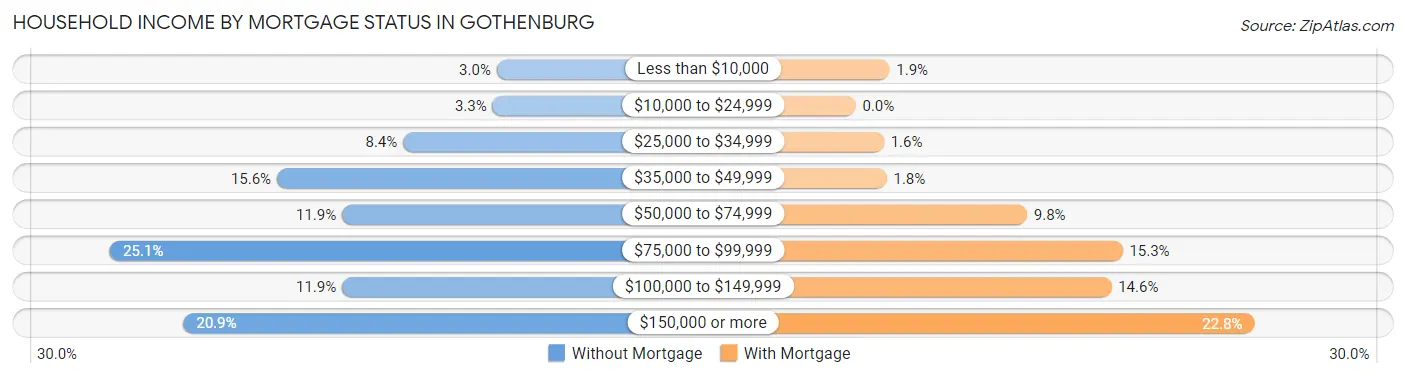
| Household Income | Without Mortgage | With Mortgage |
| Less than $10,000 | 13 (3.0%) | 12 (1.9%) |
| $10,000 to $24,999 | 14 (3.3%) | 0 (0.0%) |
| $25,000 to $34,999 | 36 (8.4%) | 10 (1.6%) |
| $35,000 to $49,999 | 67 (15.6%) | 11 (1.8%) |
| $50,000 to $74,999 | 51 (11.9%) | 61 (9.8%) |
| $75,000 to $99,999 | 108 (25.1%) | 95 (15.2%) |
| $100,000 to $149,999 | 51 (11.9%) | 91 (14.6%) |
| $150,000 or more | 90 (20.9%) | 142 (22.8%) |
| Total | 430 (100.0%) | 623 (100.0%) |
Property Value to Household Income Ratio in Gothenburg
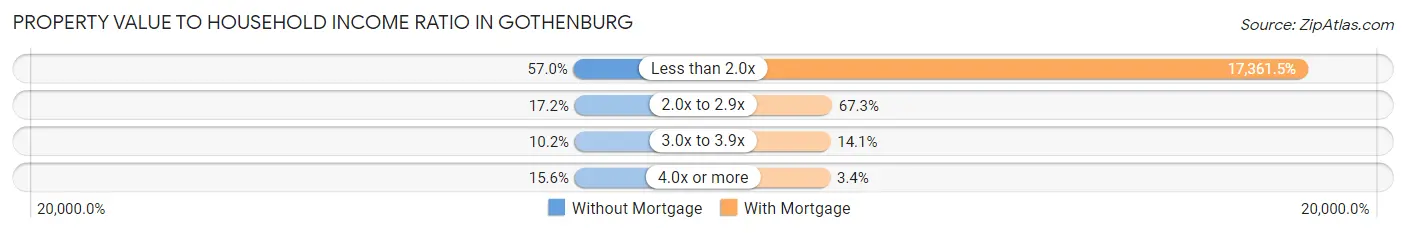
| Value-to-Income Ratio | Without Mortgage | With Mortgage |
| Less than 2.0x | 245 (57.0%) | 108,162 (17,361.5%) |
| 2.0x to 2.9x | 74 (17.2%) | 419 (67.3%) |
| 3.0x to 3.9x | 44 (10.2%) | 88 (14.1%) |
| 4.0x or more | 67 (15.6%) | 21 (3.4%) |
| Total | 430 (100.0%) | 623 (100.0%) |
Real Estate Taxes by Mortgage Status in Gothenburg
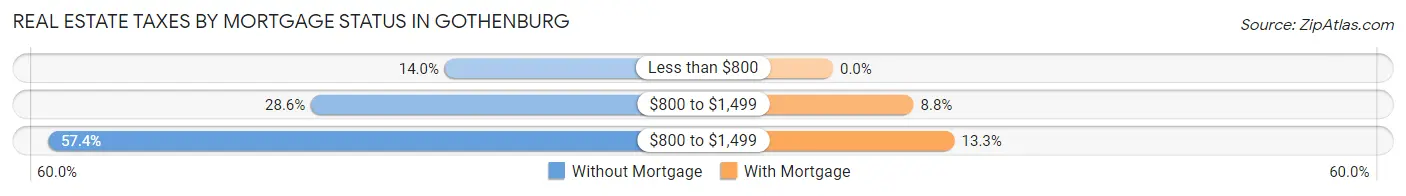
| Property Taxes | Without Mortgage | With Mortgage |
| Less than $800 | 60 (14.0%) | 0 (0.0%) |
| $800 to $1,499 | 123 (28.6%) | 55 (8.8%) |
| $800 to $1,499 | 247 (57.4%) | 83 (13.3%) |
| Total | 430 (100.0%) | 623 (100.0%) |
Health & Disability in Gothenburg
Health Insurance Coverage by Age in Gothenburg
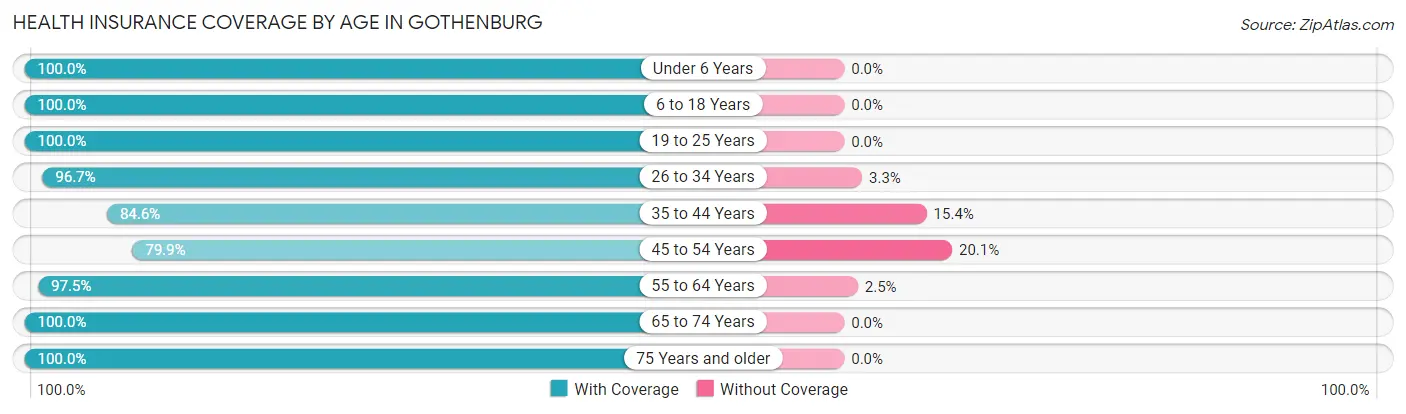
| Age Bracket | With Coverage | Without Coverage |
| Under 6 Years | 184 (100.0%) | 0 (0.0%) |
| 6 to 18 Years | 738 (100.0%) | 0 (0.0%) |
| 19 to 25 Years | 295 (100.0%) | 0 (0.0%) |
| 26 to 34 Years | 320 (96.7%) | 11 (3.3%) |
| 35 to 44 Years | 303 (84.6%) | 55 (15.4%) |
| 45 to 54 Years | 342 (79.9%) | 86 (20.1%) |
| 55 to 64 Years | 462 (97.5%) | 12 (2.5%) |
| 65 to 74 Years | 368 (100.0%) | 0 (0.0%) |
| 75 Years and older | 232 (100.0%) | 0 (0.0%) |
| Total | 3,244 (95.2%) | 164 (4.8%) |
Health Insurance Coverage by Citizenship Status in Gothenburg
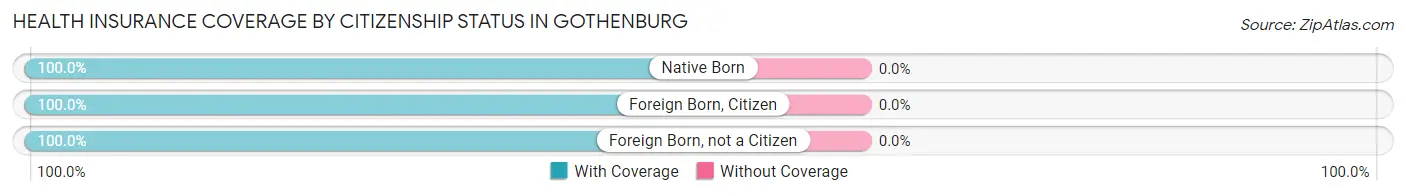
| Citizenship Status | With Coverage | Without Coverage |
| Native Born | 184 (100.0%) | 0 (0.0%) |
| Foreign Born, Citizen | 738 (100.0%) | 0 (0.0%) |
| Foreign Born, not a Citizen | 295 (100.0%) | 0 (0.0%) |
Health Insurance Coverage by Household Income in Gothenburg
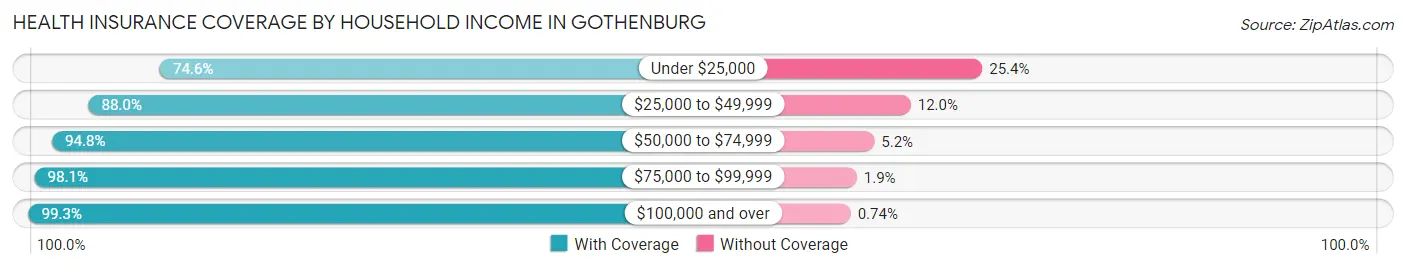
| Household Income | With Coverage | Without Coverage |
| Under $25,000 | 144 (74.6%) | 49 (25.4%) |
| $25,000 to $49,999 | 492 (88.0%) | 67 (12.0%) |
| $50,000 to $74,999 | 404 (94.8%) | 22 (5.2%) |
| $75,000 to $99,999 | 571 (98.1%) | 11 (1.9%) |
| $100,000 and over | 1,620 (99.3%) | 12 (0.7%) |
Public vs Private Health Insurance Coverage by Age in Gothenburg
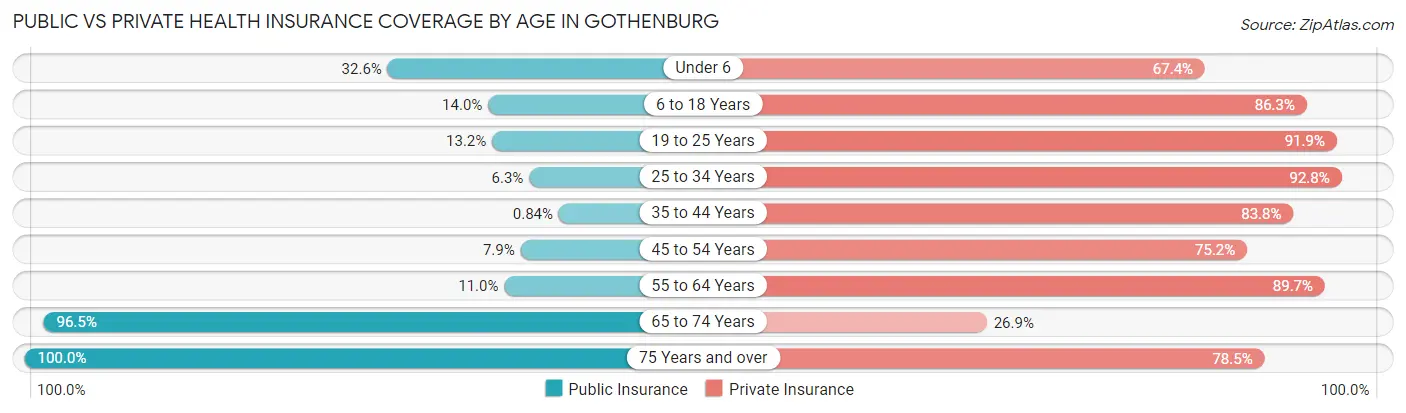
| Age Bracket | Public Insurance | Private Insurance |
| Under 6 | 60 (32.6%) | 124 (67.4%) |
| 6 to 18 Years | 103 (14.0%) | 637 (86.3%) |
| 19 to 25 Years | 39 (13.2%) | 271 (91.9%) |
| 25 to 34 Years | 21 (6.3%) | 307 (92.7%) |
| 35 to 44 Years | 3 (0.8%) | 300 (83.8%) |
| 45 to 54 Years | 34 (7.9%) | 322 (75.2%) |
| 55 to 64 Years | 52 (11.0%) | 425 (89.7%) |
| 65 to 74 Years | 355 (96.5%) | 99 (26.9%) |
| 75 Years and over | 232 (100.0%) | 182 (78.4%) |
| Total | 899 (26.4%) | 2,667 (78.3%) |
Disability Status by Sex by Age in Gothenburg
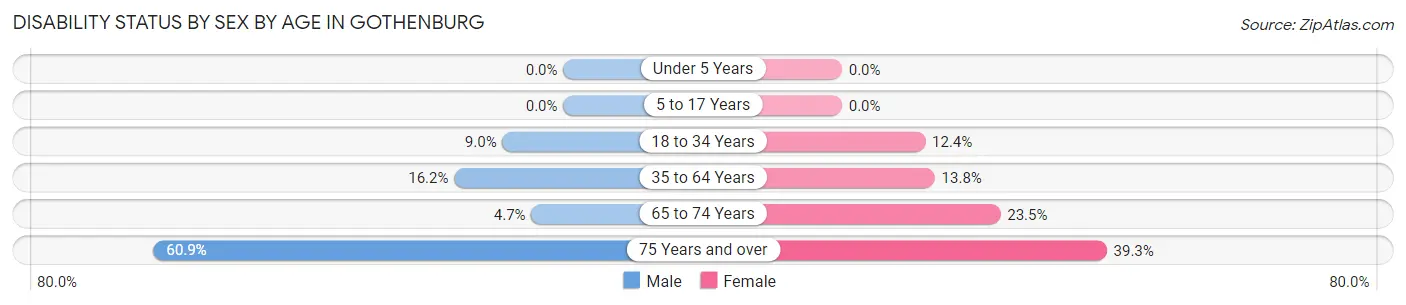
| Age Bracket | Male | Female |
| Under 5 Years | 0 (0.0%) | 0 (0.0%) |
| 5 to 17 Years | 0 (0.0%) | 0 (0.0%) |
| 18 to 34 Years | 35 (9.0%) | 35 (12.4%) |
| 35 to 64 Years | 116 (16.2%) | 75 (13.8%) |
| 65 to 74 Years | 11 (4.7%) | 32 (23.5%) |
| 75 Years and over | 70 (60.9%) | 46 (39.3%) |
Disability Class by Sex by Age in Gothenburg
Disability Class: Hearing Difficulty
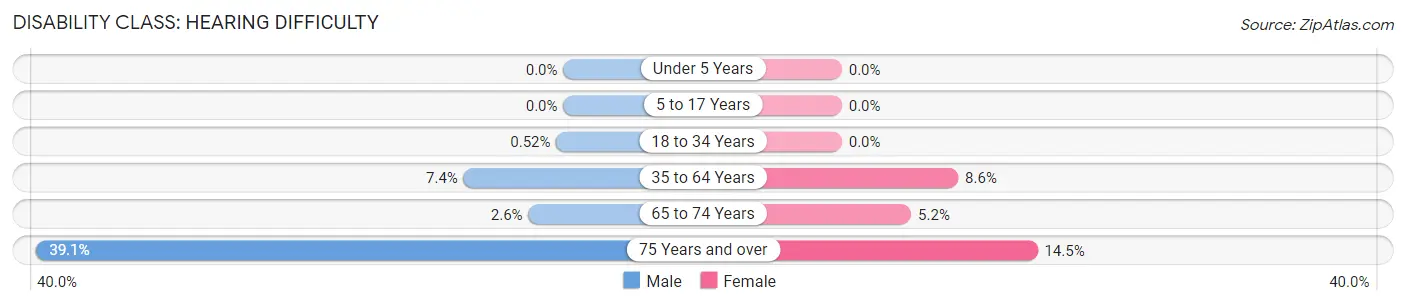
| Age Bracket | Male | Female |
| Under 5 Years | 0 (0.0%) | 0 (0.0%) |
| 5 to 17 Years | 0 (0.0%) | 0 (0.0%) |
| 18 to 34 Years | 2 (0.5%) | 0 (0.0%) |
| 35 to 64 Years | 53 (7.4%) | 47 (8.6%) |
| 65 to 74 Years | 6 (2.6%) | 7 (5.1%) |
| 75 Years and over | 45 (39.1%) | 17 (14.5%) |
Disability Class: Vision Difficulty
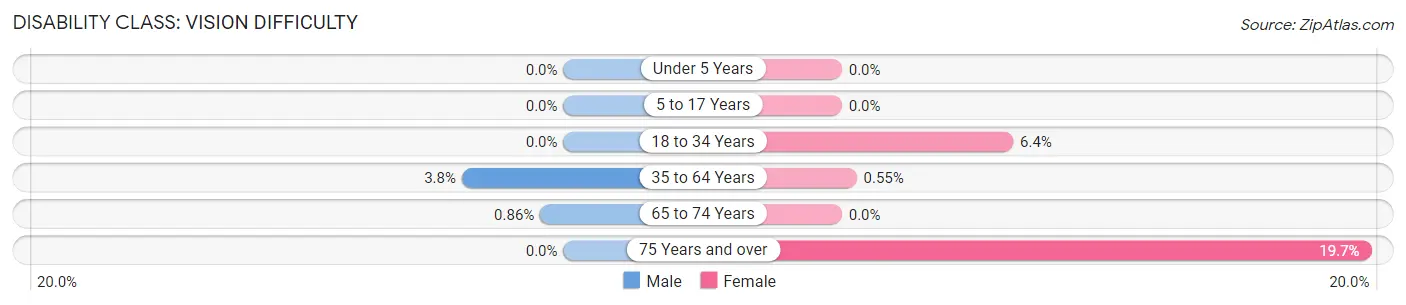
| Age Bracket | Male | Female |
| Under 5 Years | 0 (0.0%) | 0 (0.0%) |
| 5 to 17 Years | 0 (0.0%) | 0 (0.0%) |
| 18 to 34 Years | 0 (0.0%) | 18 (6.4%) |
| 35 to 64 Years | 27 (3.8%) | 3 (0.5%) |
| 65 to 74 Years | 2 (0.9%) | 0 (0.0%) |
| 75 Years and over | 0 (0.0%) | 23 (19.7%) |
Disability Class: Cognitive Difficulty
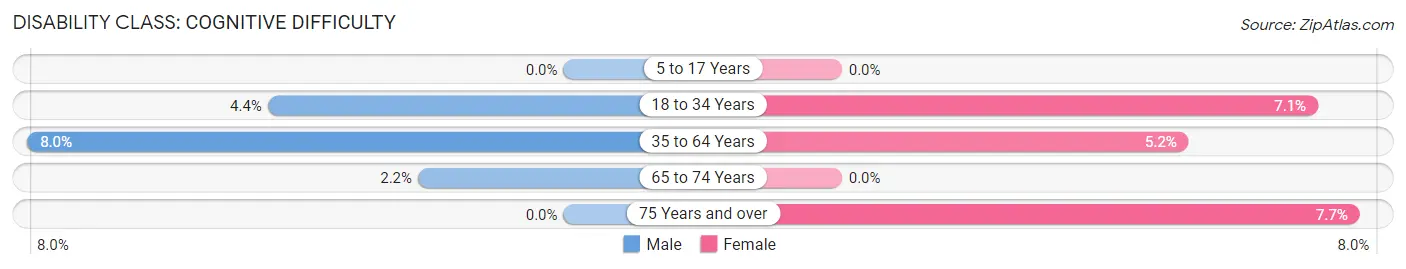
| Age Bracket | Male | Female |
| 5 to 17 Years | 0 (0.0%) | 0 (0.0%) |
| 18 to 34 Years | 17 (4.4%) | 20 (7.1%) |
| 35 to 64 Years | 57 (8.0%) | 28 (5.1%) |
| 65 to 74 Years | 5 (2.2%) | 0 (0.0%) |
| 75 Years and over | 0 (0.0%) | 9 (7.7%) |
Disability Class: Ambulatory Difficulty
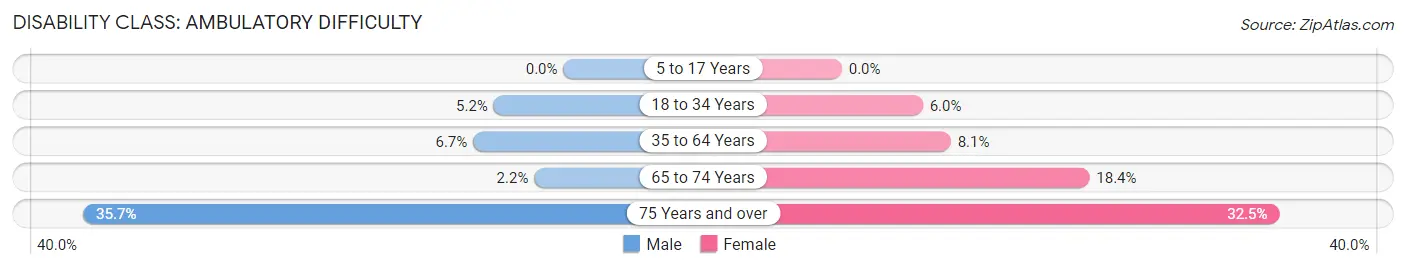
| Age Bracket | Male | Female |
| 5 to 17 Years | 0 (0.0%) | 0 (0.0%) |
| 18 to 34 Years | 20 (5.2%) | 17 (6.0%) |
| 35 to 64 Years | 48 (6.7%) | 44 (8.1%) |
| 65 to 74 Years | 5 (2.2%) | 25 (18.4%) |
| 75 Years and over | 41 (35.6%) | 38 (32.5%) |
Disability Class: Self-Care Difficulty
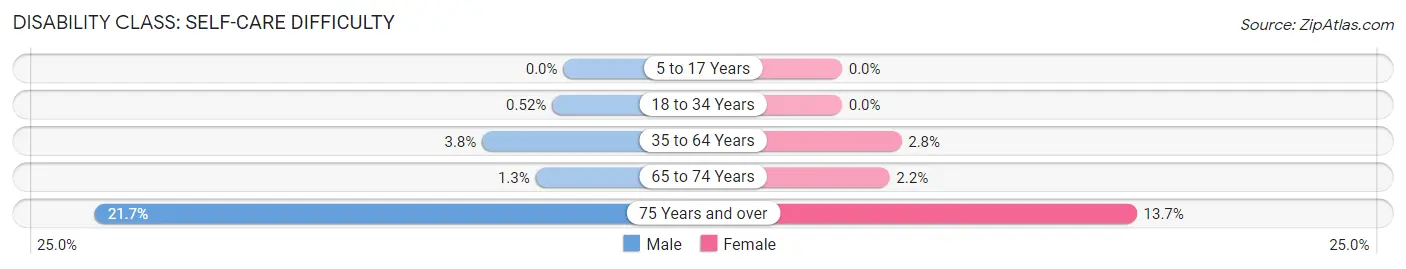
| Age Bracket | Male | Female |
| 5 to 17 Years | 0 (0.0%) | 0 (0.0%) |
| 18 to 34 Years | 2 (0.5%) | 0 (0.0%) |
| 35 to 64 Years | 27 (3.8%) | 15 (2.8%) |
| 65 to 74 Years | 3 (1.3%) | 3 (2.2%) |
| 75 Years and over | 25 (21.7%) | 16 (13.7%) |
Technology Access in Gothenburg
Computing Device Access in Gothenburg
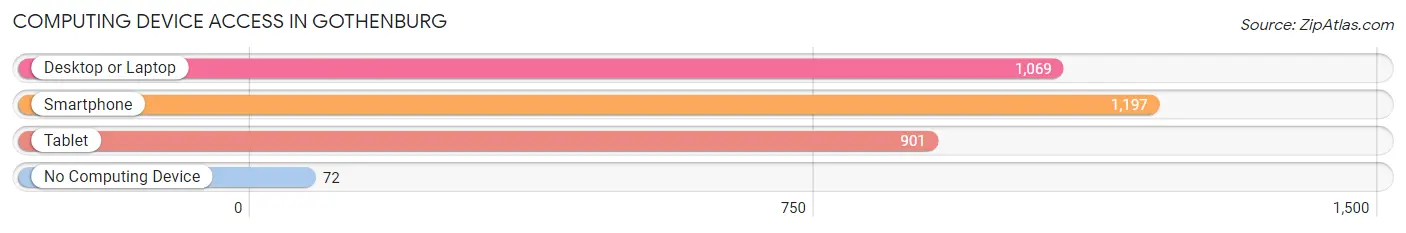
| Device Type | # Households | % Households |
| Desktop or Laptop | 1,069 | 77.3% |
| Smartphone | 1,197 | 86.6% |
| Tablet | 901 | 65.2% |
| No Computing Device | 72 | 5.2% |
| Total | 1,382 | 100.0% |
Internet Access in Gothenburg
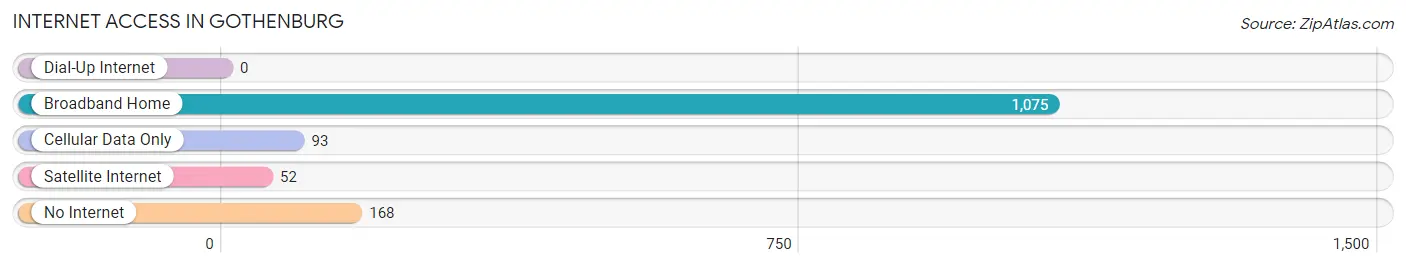
| Internet Type | # Households | % Households |
| Dial-Up Internet | 0 | 0.0% |
| Broadband Home | 1,075 | 77.8% |
| Cellular Data Only | 93 | 6.7% |
| Satellite Internet | 52 | 3.8% |
| No Internet | 168 | 12.2% |
| Total | 1,382 | 100.0% |
Gothenburg Summary
Gothenburg is a city located in the state of Nebraska in the United States. It is the county seat of Dawson County and is located on the Platte River. The city has a population of approximately 3,000 people and is the largest city in the county.
Geography
Gothenburg is located in the south-central part of Nebraska, approximately 100 miles west of Lincoln and 130 miles northwest of Omaha. It is situated on the Platte River, which is a major tributary of the Missouri River. The city is surrounded by rolling hills and is located in the High Plains region of the Great Plains. The climate is semi-arid, with hot summers and cold winters.
Economy
Gothenburg’s economy is largely based on agriculture and related industries. The city is home to several large grain elevators and is a major center for the production of corn, wheat, and soybeans. Other industries in the city include manufacturing, retail, and tourism. The city is also home to several large employers, including the Gothenburg Health Care Center, Gothenburg Public Schools, and the Gothenburg State Bank.
Demographics
As of the 2010 census, Gothenburg had a population of 3,000 people. The racial makeup of the city was 95.2% White, 0.7% African American, 0.3% Native American, 0.3% Asian, 0.1% Pacific Islander, 1.7% from other races, and 1.9% from two or more races. Hispanic or Latino of any race were 4.3% of the population.
The median income for a household in the city was $41,250, and the median income for a family was $50,000. The per capita income for the city was $20,845. About 8.3% of families and 10.2% of the population were below the poverty line, including 14.3% of those under age 18 and 8.3% of those age 65 or over.
History
Gothenburg was founded in 1882 by Swedish immigrants who were seeking a better life in the United States. The city was named after the Swedish city of Gothenburg and was the first Swedish settlement in the United States. The city quickly grew and became a major center for agriculture and industry. In the early 20th century, the city was home to several large grain elevators and was a major center for the production of corn, wheat, and soybeans.
In the late 20th century, the city began to diversify its economy and attract new businesses. Today, Gothenburg is a thriving community with a strong economy and a vibrant culture. The city is home to several large employers, including the Gothenburg Health Care Center, Gothenburg Public Schools, and the Gothenburg State Bank. The city is also home to several cultural attractions, including the Gothenburg Historical Museum and the Gothenburg Arts Center.
Common Questions
What is Per Capita Income in Gothenburg?
Per Capita income in Gothenburg is $40,707.
What is the Median Family Income in Gothenburg?
Median Family Income in Gothenburg is $101,013.
What is the Median Household income in Gothenburg?
Median Household Income in Gothenburg is $84,615.
What is Income or Wage Gap in Gothenburg?
Income or Wage Gap in Gothenburg is 29.2%.
Women in Gothenburg earn 70.8 cents for every dollar earned by a man.
What is Inequality or Gini Index in Gothenburg?
Inequality or Gini Index in Gothenburg is 0.39.
What is the Total Population of Gothenburg?
Total Population of Gothenburg is 3,463.
What is the Total Male Population of Gothenburg?
Total Male Population of Gothenburg is 1,876.
What is the Total Female Population of Gothenburg?
Total Female Population of Gothenburg is 1,587.
What is the Ratio of Males per 100 Females in Gothenburg?
There are 118.21 Males per 100 Females in Gothenburg.
What is the Ratio of Females per 100 Males in Gothenburg?
There are 84.59 Females per 100 Males in Gothenburg.
What is the Median Population Age in Gothenburg?
Median Population Age in Gothenburg is 40.6 Years.
What is the Average Family Size in Gothenburg
Average Family Size in Gothenburg is 3.1 People.
What is the Average Household Size in Gothenburg
Average Household Size in Gothenburg is 2.5 People.
How Large is the Labor Force in Gothenburg?
There are 1,916 People in the Labor Forcein in Gothenburg.
What is the Percentage of People in the Labor Force in Gothenburg?
70.2% of People are in the Labor Force in Gothenburg.
What is the Unemployment Rate in Gothenburg?
Unemployment Rate in Gothenburg is 3.3%.