Giltner, NE Map & Demographics
Giltner Map
Giltner Overview
$34,359
PER CAPITA INCOME
$76,563
AVG FAMILY INCOME
$71,250
AVG HOUSEHOLD INCOME
45.6%
WAGE / INCOME GAP [ % ]
54.4¢/ $1
WAGE / INCOME GAP [ $ ]
0.43
INEQUALITY / GINI INDEX
463
TOTAL POPULATION
244
MALE POPULATION
219
FEMALE POPULATION
111.42
MALES / 100 FEMALES
89.75
FEMALES / 100 MALES
38.4
MEDIAN AGE
3.4
AVG FAMILY SIZE
3.0
AVG HOUSEHOLD SIZE
258
LABOR FORCE [ PEOPLE ]
71.7%
PERCENT IN LABOR FORCE
2.7%
UNEMPLOYMENT RATE
Giltner Zip Codes
Giltner Area Codes
Income in Giltner
Income Overview in Giltner
Per Capita Income in Giltner is $34,359, while median incomes of families and households are $76,563 and $71,250 respectively.
| Characteristic | Number | Measure |
| Per Capita Income | 463 | $34,359 |
| Median Family Income | 97 | $76,563 |
| Mean Family Income | 97 | $89,272 |
| Median Household Income | 156 | $71,250 |
| Mean Household Income | 156 | $93,876 |
| Income Deficit | 97 | $0 |
| Wage / Income Gap (%) | 463 | 45.63% |
| Wage / Income Gap ($) | 463 | 54.37¢ per $1 |
| Gini / Inequality Index | 463 | 0.43 |
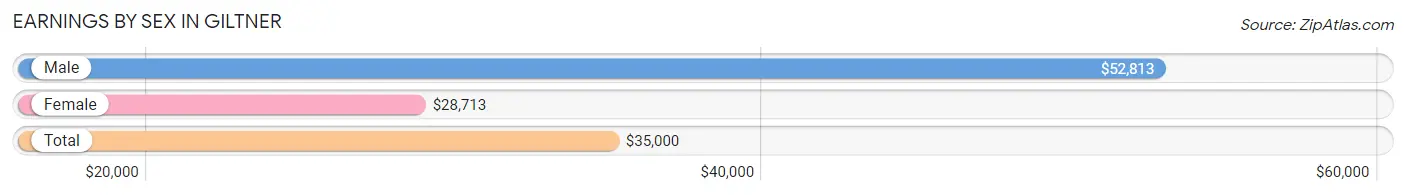
Earnings by Sex in Giltner
Average Earnings in Giltner are $35,000, $52,813 for men and $28,713 for women, a difference of 45.6%.
| Sex | Number | Average Earnings |
| Male | 139 (51.5%) | $52,813 |
| Female | 131 (48.5%) | $28,713 |
| Total | 270 (100.0%) | $35,000 |
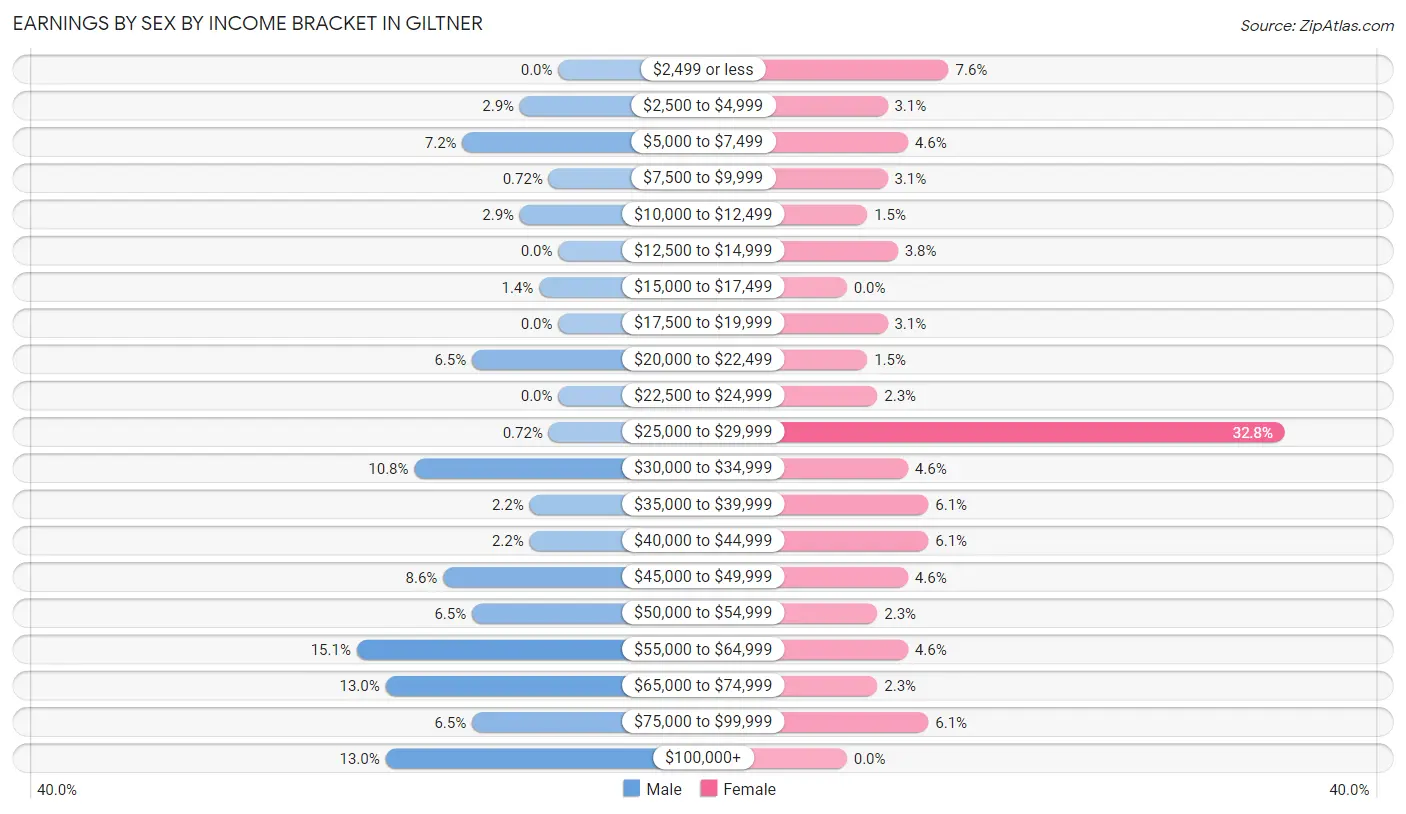
Earnings by Sex by Income Bracket in Giltner
The most common earnings brackets in Giltner are $55,000 to $64,999 for men (21 | 15.1%) and $25,000 to $29,999 for women (43 | 32.8%).
| Income | Male | Female |
| $2,499 or less | 0 (0.0%) | 10 (7.6%) |
| $2,500 to $4,999 | 4 (2.9%) | 4 (3.0%) |
| $5,000 to $7,499 | 10 (7.2%) | 6 (4.6%) |
| $7,500 to $9,999 | 1 (0.7%) | 4 (3.0%) |
| $10,000 to $12,499 | 4 (2.9%) | 2 (1.5%) |
| $12,500 to $14,999 | 0 (0.0%) | 5 (3.8%) |
| $15,000 to $17,499 | 2 (1.4%) | 0 (0.0%) |
| $17,500 to $19,999 | 0 (0.0%) | 4 (3.0%) |
| $20,000 to $22,499 | 9 (6.5%) | 2 (1.5%) |
| $22,500 to $24,999 | 0 (0.0%) | 3 (2.3%) |
| $25,000 to $29,999 | 1 (0.7%) | 43 (32.8%) |
| $30,000 to $34,999 | 15 (10.8%) | 6 (4.6%) |
| $35,000 to $39,999 | 3 (2.2%) | 8 (6.1%) |
| $40,000 to $44,999 | 3 (2.2%) | 8 (6.1%) |
| $45,000 to $49,999 | 12 (8.6%) | 6 (4.6%) |
| $50,000 to $54,999 | 9 (6.5%) | 3 (2.3%) |
| $55,000 to $64,999 | 21 (15.1%) | 6 (4.6%) |
| $65,000 to $74,999 | 18 (13.0%) | 3 (2.3%) |
| $75,000 to $99,999 | 9 (6.5%) | 8 (6.1%) |
| $100,000+ | 18 (13.0%) | 0 (0.0%) |
| Total | 139 (100.0%) | 131 (100.0%) |
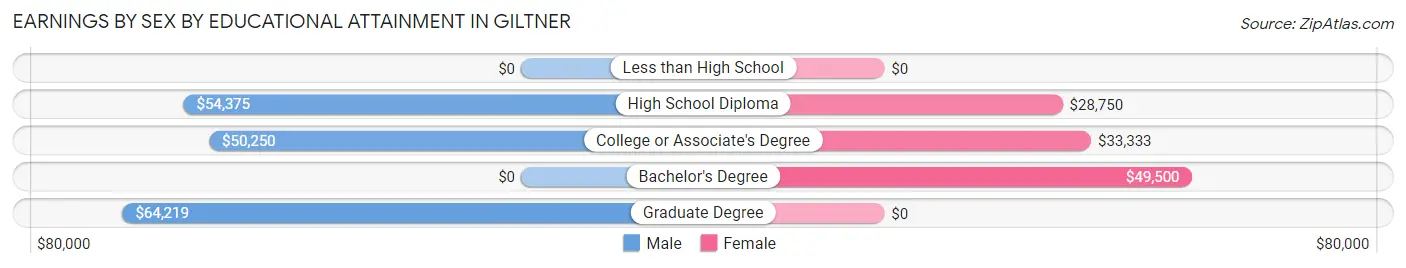
Earnings by Sex by Educational Attainment in Giltner
Average earnings in Giltner are $56,250 for men and $29,228 for women, a difference of 48.0%. Men with an educational attainment of graduate degree enjoy the highest average annual earnings of $64,219, while those with college or associate's degree education earn the least with $50,250. Women with an educational attainment of bachelor's degree earn the most with the average annual earnings of $49,500, while those with high school diploma education have the smallest earnings of $28,750.
| Educational Attainment | Male Income | Female Income |
| Less than High School | - | - |
| High School Diploma | $54,375 | $28,750 |
| College or Associate's Degree | $50,250 | $33,333 |
| Bachelor's Degree | - | - |
| Graduate Degree | $64,219 | $0 |
| Total | $56,250 | $29,228 |
Family Income in Giltner
Family Income Brackets in Giltner
According to the Giltner family income data, there are 24 families falling into the $50,000 to $74,999 income range, which is the most common income bracket and makes up 24.7% of all families.
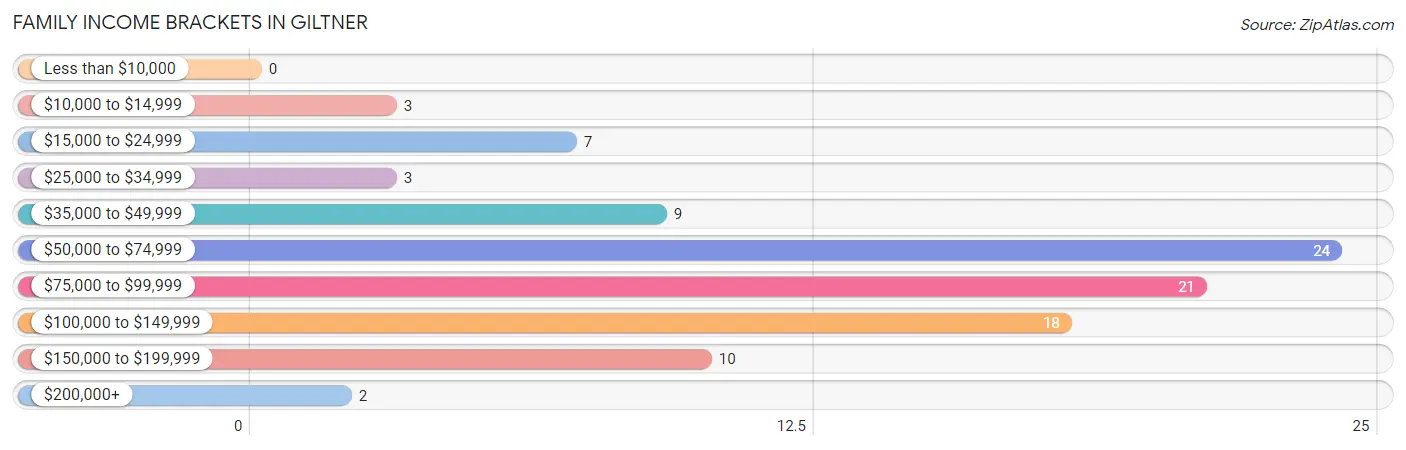
| Income Bracket | # Families | % Families |
| Less than $10,000 | 0 | 0.0% |
| $10,000 to $14,999 | 3 | 3.1% |
| $15,000 to $24,999 | 7 | 7.2% |
| $25,000 to $34,999 | 3 | 3.1% |
| $35,000 to $49,999 | 9 | 9.3% |
| $50,000 to $74,999 | 24 | 24.7% |
| $75,000 to $99,999 | 21 | 21.6% |
| $100,000 to $149,999 | 18 | 18.6% |
| $150,000 to $199,999 | 10 | 10.3% |
| $200,000+ | 2 | 2.1% |
Family Income by Famaliy Size in Giltner
5-person families (18 | 18.6%) account for the highest median family income in Giltner with $91,250 per family, while 2-person families (46 | 47.4%) have the highest median income of $36,666 per family member.
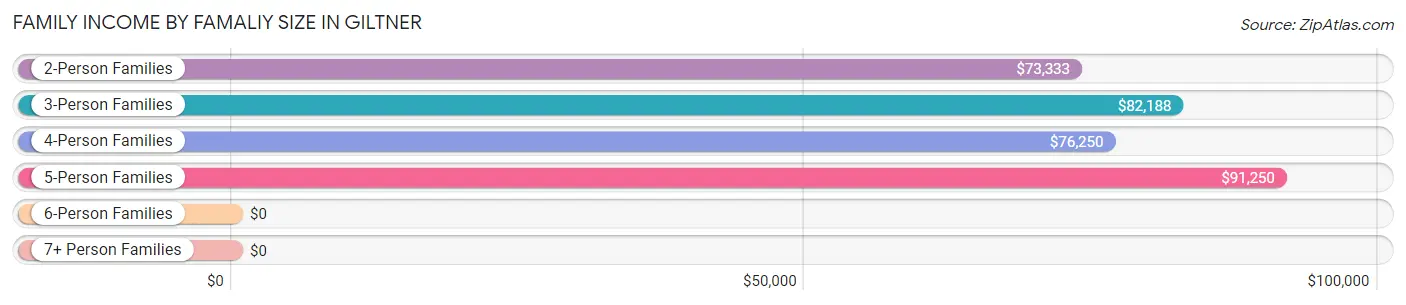
| Income Bracket | # Families | Median Income |
| 2-Person Families | 46 (47.4%) | $73,333 |
| 3-Person Families | 17 (17.5%) | $82,188 |
| 4-Person Families | 11 (11.3%) | $76,250 |
| 5-Person Families | 18 (18.6%) | $91,250 |
| 6-Person Families | 3 (3.1%) | $0 |
| 7+ Person Families | 2 (2.1%) | $0 |
| Total | 97 (100.0%) | $76,563 |
Family Income by Number of Earners in Giltner
The median family income in Giltner is $76,563, with families comprising 2 earners (41) having the highest median family income of $109,250, while families with no earners (15) have the lowest median family income of $31,875, accounting for 42.3% and 15.5% of families, respectively.
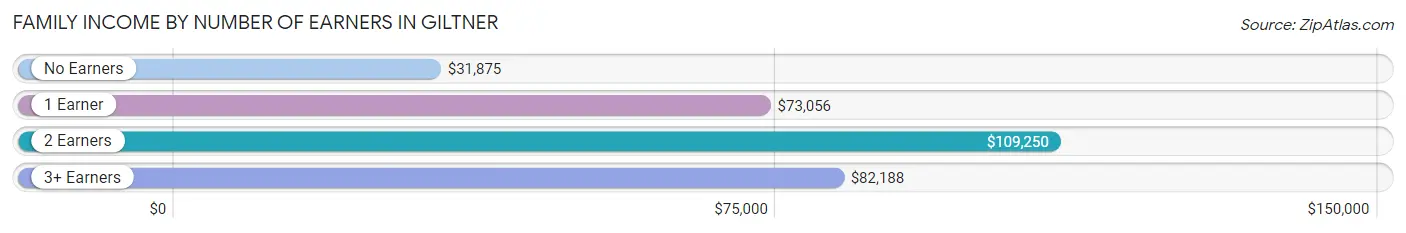
| Number of Earners | # Families | Median Income |
| No Earners | 15 (15.5%) | $31,875 |
| 1 Earner | 26 (26.8%) | $73,056 |
| 2 Earners | 41 (42.3%) | $109,250 |
| 3+ Earners | 15 (15.5%) | $82,188 |
| Total | 97 (100.0%) | $76,563 |
Household Income in Giltner
Household Income Brackets in Giltner
With 33 households falling in the category, the $50,000 to $74,999 income range is the most frequent in Giltner, accounting for 21.1% of all households. In contrast, only 2 households (1.3%) fall into the $10,000 to $14,999 income bracket, making it the least populous group.
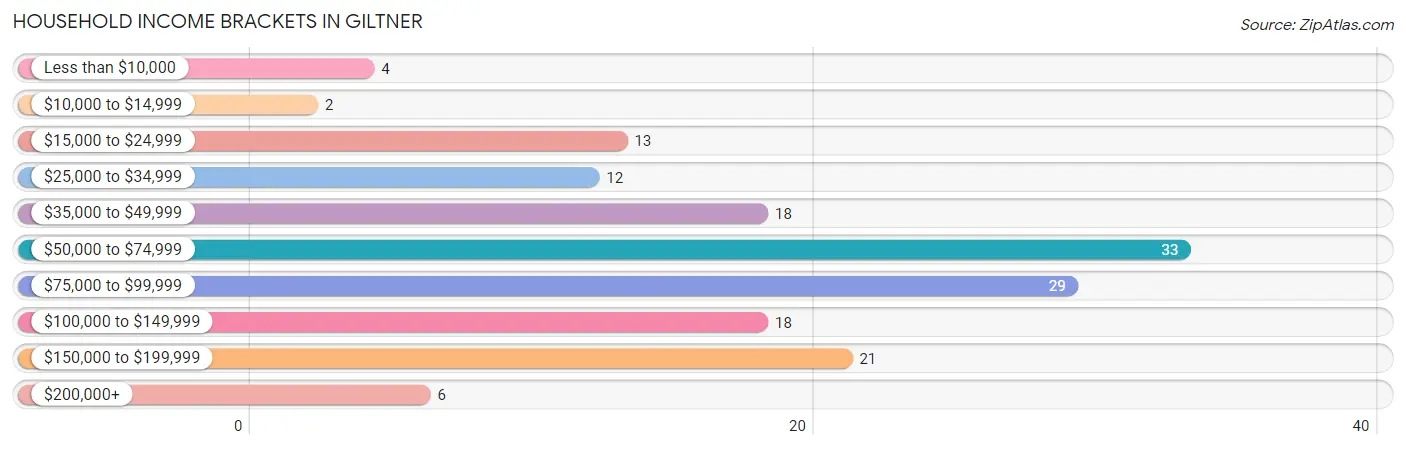
| Income Bracket | # Households | % Households |
| Less than $10,000 | 4 | 2.6% |
| $10,000 to $14,999 | 2 | 1.3% |
| $15,000 to $24,999 | 13 | 8.3% |
| $25,000 to $34,999 | 12 | 7.7% |
| $35,000 to $49,999 | 18 | 11.5% |
| $50,000 to $74,999 | 33 | 21.2% |
| $75,000 to $99,999 | 29 | 18.6% |
| $100,000 to $149,999 | 18 | 11.5% |
| $150,000 to $199,999 | 21 | 13.5% |
| $200,000+ | 6 | 3.8% |
Household Income by Householder Age in Giltner
The median household income in Giltner is $71,250, with the highest median household income of $87,500 found in the 25 to 44 years age bracket for the primary householder. A total of 74 households (47.4%) fall into this category. Meanwhile, the 15 to 24 years age bracket for the primary householder has the lowest median household income of $0, with 2 households (1.3%) in this group.
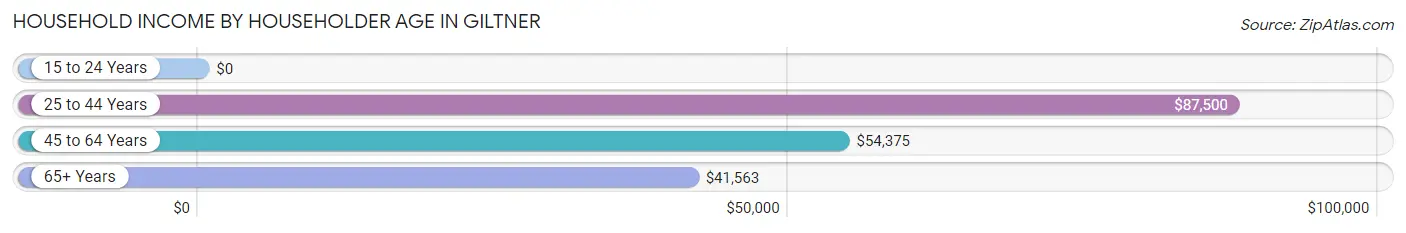
| Income Bracket | # Households | Median Income |
| 15 to 24 Years | 2 (1.3%) | $0 |
| 25 to 44 Years | 74 (47.4%) | $87,500 |
| 45 to 64 Years | 45 (28.8%) | $54,375 |
| 65+ Years | 35 (22.4%) | $41,563 |
| Total | 156 (100.0%) | $71,250 |
Poverty in Giltner
Income Below Poverty by Sex and Age in Giltner
With 8.1% poverty level for males and 9.4% for females among the residents of Giltner, 55 to 64 year old males and 5 year old females are the most vulnerable to poverty, with 5 males (27.8%) and 2 females (100.0%) in their respective age groups living below the poverty level.
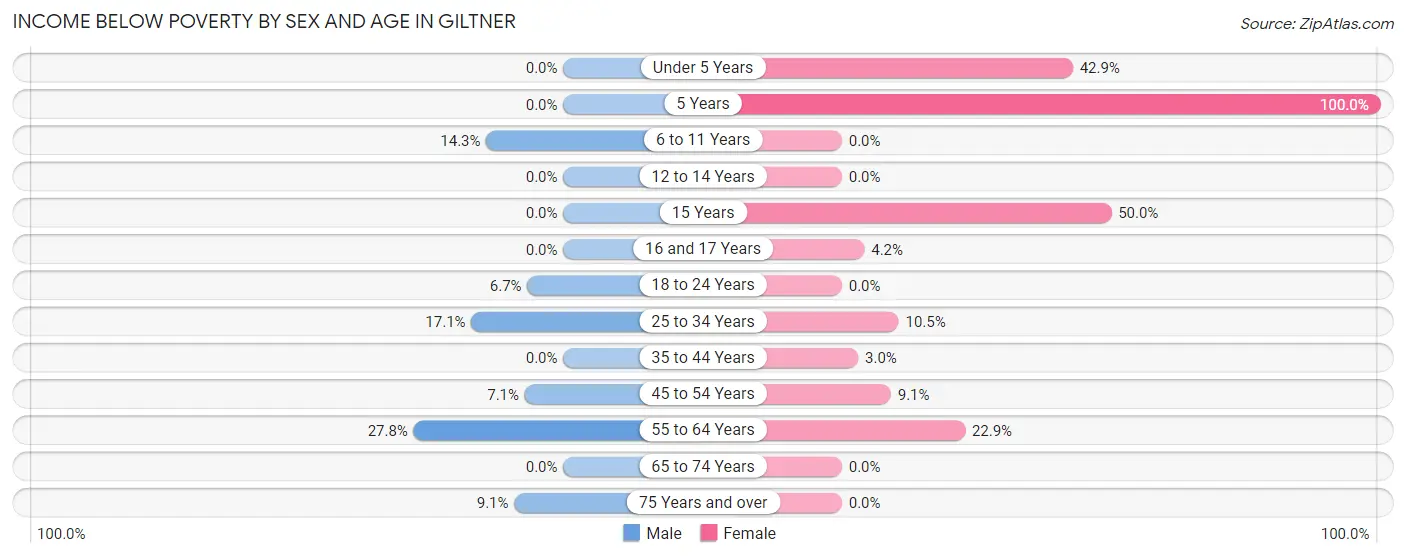
| Age Bracket | Male | Female |
| Under 5 Years | 0 (0.0%) | 3 (42.9%) |
| 5 Years | 0 (0.0%) | 2 (100.0%) |
| 6 to 11 Years | 4 (14.3%) | 0 (0.0%) |
| 12 to 14 Years | 0 (0.0%) | 0 (0.0%) |
| 15 Years | 0 (0.0%) | 1 (50.0%) |
| 16 and 17 Years | 0 (0.0%) | 1 (4.2%) |
| 18 to 24 Years | 1 (6.7%) | 0 (0.0%) |
| 25 to 34 Years | 7 (17.1%) | 2 (10.5%) |
| 35 to 44 Years | 0 (0.0%) | 2 (3.0%) |
| 45 to 54 Years | 1 (7.1%) | 1 (9.1%) |
| 55 to 64 Years | 5 (27.8%) | 8 (22.9%) |
| 65 to 74 Years | 0 (0.0%) | 0 (0.0%) |
| 75 Years and over | 1 (9.1%) | 0 (0.0%) |
| Total | 19 (8.1%) | 20 (9.4%) |
Income Above Poverty by Sex and Age in Giltner
According to the poverty statistics in Giltner, males aged under 5 years and females aged 6 to 11 years are the age groups that are most secure financially, with 100.0% of males and 100.0% of females in these age groups living above the poverty line.
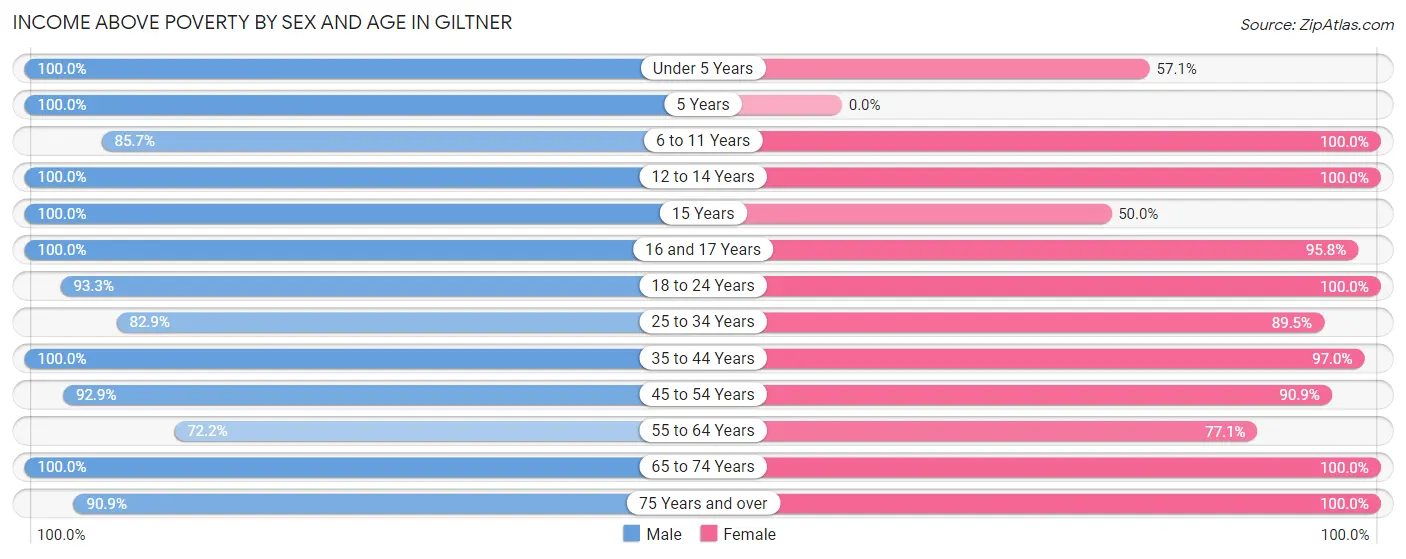
| Age Bracket | Male | Female |
| Under 5 Years | 15 (100.0%) | 4 (57.1%) |
| 5 Years | 1 (100.0%) | 0 (0.0%) |
| 6 to 11 Years | 24 (85.7%) | 5 (100.0%) |
| 12 to 14 Years | 10 (100.0%) | 15 (100.0%) |
| 15 Years | 1 (100.0%) | 1 (50.0%) |
| 16 and 17 Years | 3 (100.0%) | 23 (95.8%) |
| 18 to 24 Years | 14 (93.3%) | 8 (100.0%) |
| 25 to 34 Years | 34 (82.9%) | 17 (89.5%) |
| 35 to 44 Years | 51 (100.0%) | 64 (97.0%) |
| 45 to 54 Years | 13 (92.9%) | 10 (90.9%) |
| 55 to 64 Years | 13 (72.2%) | 27 (77.1%) |
| 65 to 74 Years | 26 (100.0%) | 10 (100.0%) |
| 75 Years and over | 10 (90.9%) | 8 (100.0%) |
| Total | 215 (91.9%) | 192 (90.6%) |
Income Below Poverty Among Married-Couple Families in Giltner
The poverty statistics for married-couple families in Giltner show that 6.5% or 5 of the total 77 families live below the poverty line. Families with no children have the highest poverty rate of 12.8%, comprising of 5 families. On the other hand, families with 1 or 2 children have the lowest poverty rate of 0.0%, which includes 0 families.
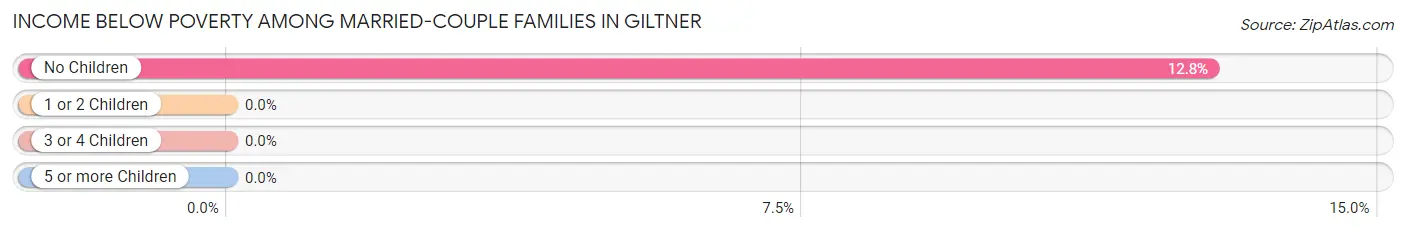
| Children | Above Poverty | Below Poverty |
| No Children | 34 (87.2%) | 5 (12.8%) |
| 1 or 2 Children | 19 (100.0%) | 0 (0.0%) |
| 3 or 4 Children | 17 (100.0%) | 0 (0.0%) |
| 5 or more Children | 2 (100.0%) | 0 (0.0%) |
| Total | 72 (93.5%) | 5 (6.5%) |
Income Below Poverty Among Single-Parent Households in Giltner
According to the poverty data in Giltner, 16.7% or 2 single-father households and 25.0% or 2 single-mother households are living below the poverty line. Among single-father households, those with 1 or 2 children have the highest poverty rate, with 2 households (20.0%) experiencing poverty. Likewise, among single-mother households, those with 3 or 4 children have the highest poverty rate, with 2 households (100.0%) falling below the poverty line.
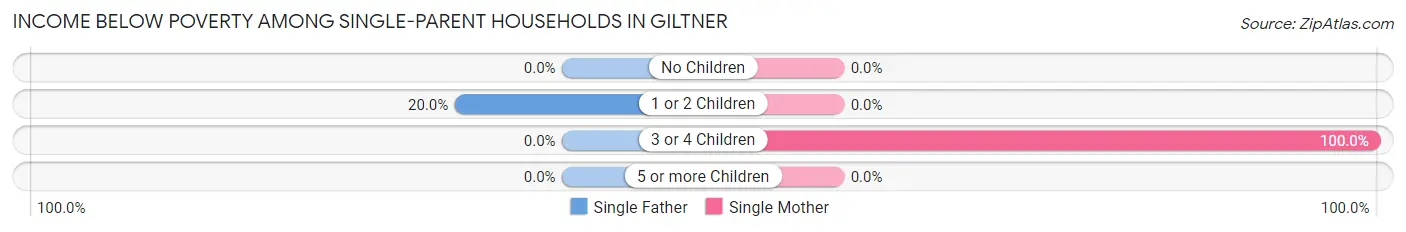
| Children | Single Father | Single Mother |
| No Children | 0 (0.0%) | 0 (0.0%) |
| 1 or 2 Children | 2 (20.0%) | 0 (0.0%) |
| 3 or 4 Children | 0 (0.0%) | 2 (100.0%) |
| 5 or more Children | 0 (0.0%) | 0 (0.0%) |
| Total | 2 (16.7%) | 2 (25.0%) |
Income Below Poverty Among Married-Couple vs Single-Parent Households in Giltner
The poverty data for Giltner shows that 5 of the married-couple family households (6.5%) and 4 of the single-parent households (20.0%) are living below the poverty level. Within the married-couple family households, those with no children have the highest poverty rate, with 5 households (12.8%) falling below the poverty line. Among the single-parent households, those with 3 or 4 children have the highest poverty rate, with 2 household (100.0%) living below poverty.
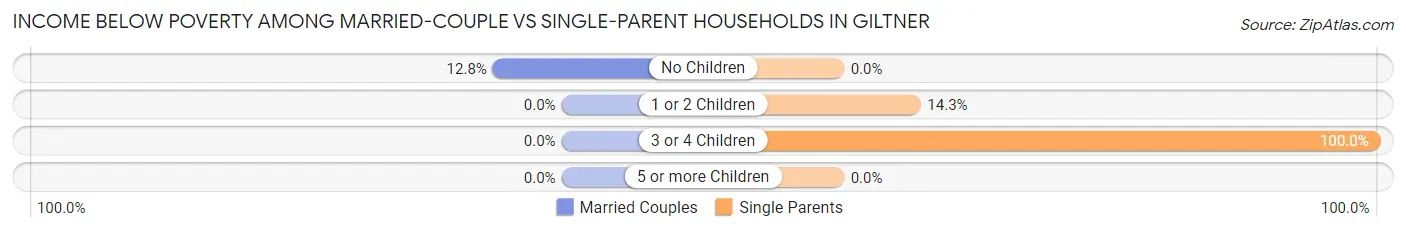
| Children | Married-Couple Families | Single-Parent Households |
| No Children | 5 (12.8%) | 0 (0.0%) |
| 1 or 2 Children | 0 (0.0%) | 2 (14.3%) |
| 3 or 4 Children | 0 (0.0%) | 2 (100.0%) |
| 5 or more Children | 0 (0.0%) | 0 (0.0%) |
| Total | 5 (6.5%) | 4 (20.0%) |
Race in Giltner
The most populous races in Giltner are White / Caucasian (403 | 87.0%), Asian (31 | 6.7%), and Hispanic or Latino (23 | 5.0%).
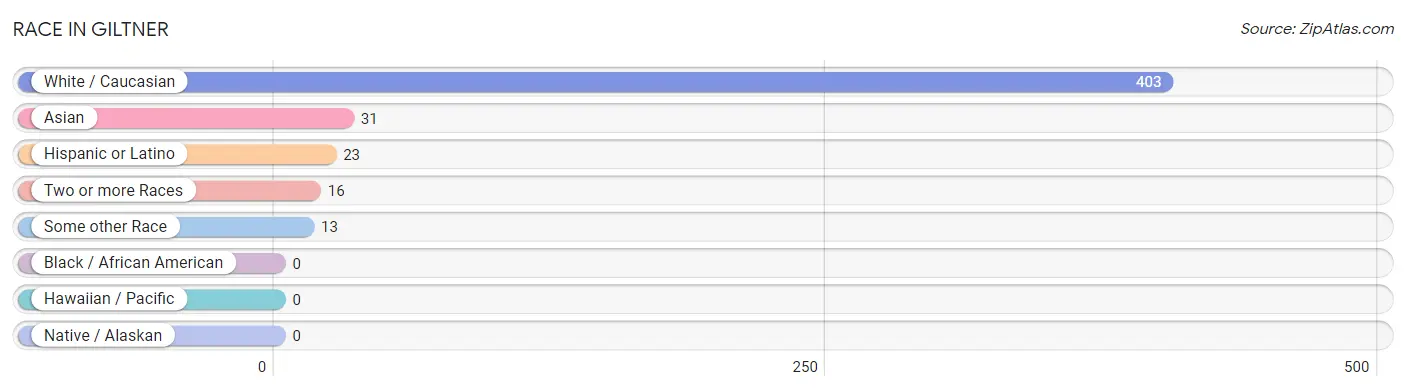
| Race | # Population | % Population |
| Asian | 31 | 6.7% |
| Black / African American | 0 | 0.0% |
| Hawaiian / Pacific | 0 | 0.0% |
| Hispanic or Latino | 23 | 5.0% |
| Native / Alaskan | 0 | 0.0% |
| White / Caucasian | 403 | 87.0% |
| Two or more Races | 16 | 3.5% |
| Some other Race | 13 | 2.8% |
| Total | 463 | 100.0% |
Ancestry in Giltner
The most populous ancestries reported in Giltner are German (157 | 33.9%), Irish (59 | 12.7%), English (32 | 6.9%), Bhutanese (31 | 6.7%), and Mexican (23 | 5.0%), together accounting for 65.2% of all Giltner residents.
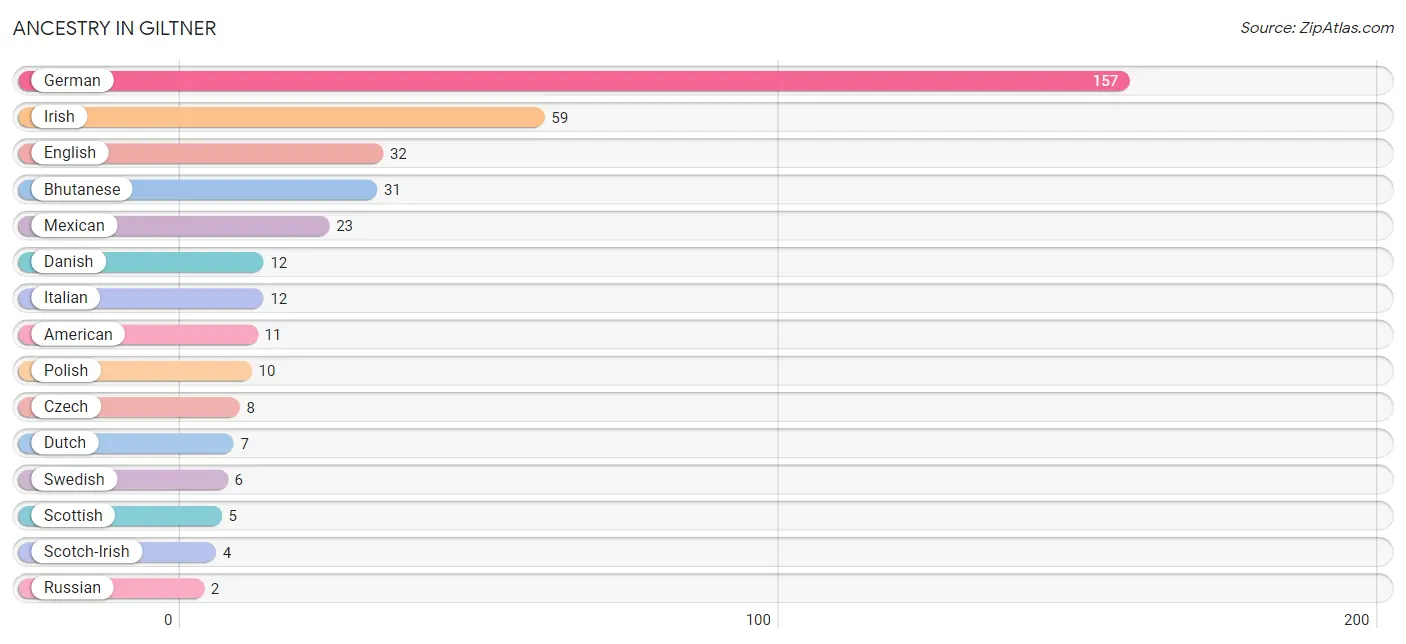
| Ancestry | # Population | % Population |
| American | 11 | 2.4% |
| Bhutanese | 31 | 6.7% |
| Czech | 8 | 1.7% |
| Danish | 12 | 2.6% |
| Dutch | 7 | 1.5% |
| English | 32 | 6.9% |
| French | 1 | 0.2% |
| German | 157 | 33.9% |
| Irish | 59 | 12.7% |
| Italian | 12 | 2.6% |
| Mexican | 23 | 5.0% |
| Norwegian | 1 | 0.2% |
| Polish | 10 | 2.2% |
| Russian | 2 | 0.4% |
| Scotch-Irish | 4 | 0.9% |
| Scottish | 5 | 1.1% |
| Swedish | 6 | 1.3% | View All 17 Rows |
Immigrants in Giltner
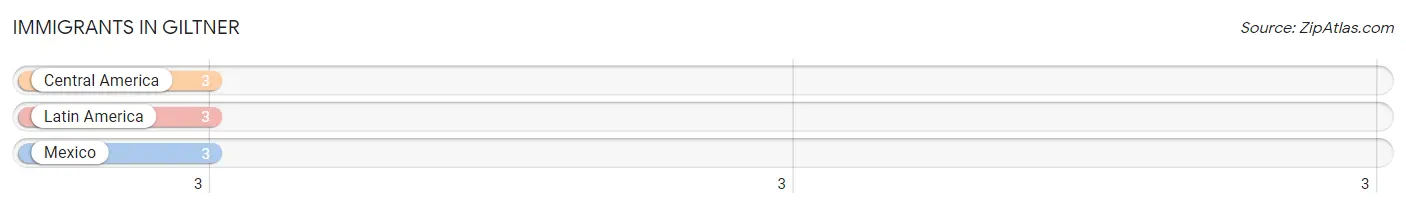
The most numerous immigrant groups reported in Giltner came from Central America (3 | 0.6%), Latin America (3 | 0.6%), and Mexico (3 | 0.6%), together accounting for 1.9% of all Giltner residents.
| Immigration Origin | # Population | % Population |
| Central America | 3 | 0.6% |
| Latin America | 3 | 0.6% |
| Mexico | 3 | 0.6% | View All 3 Rows |
Sex and Age in Giltner
Sex and Age in Giltner
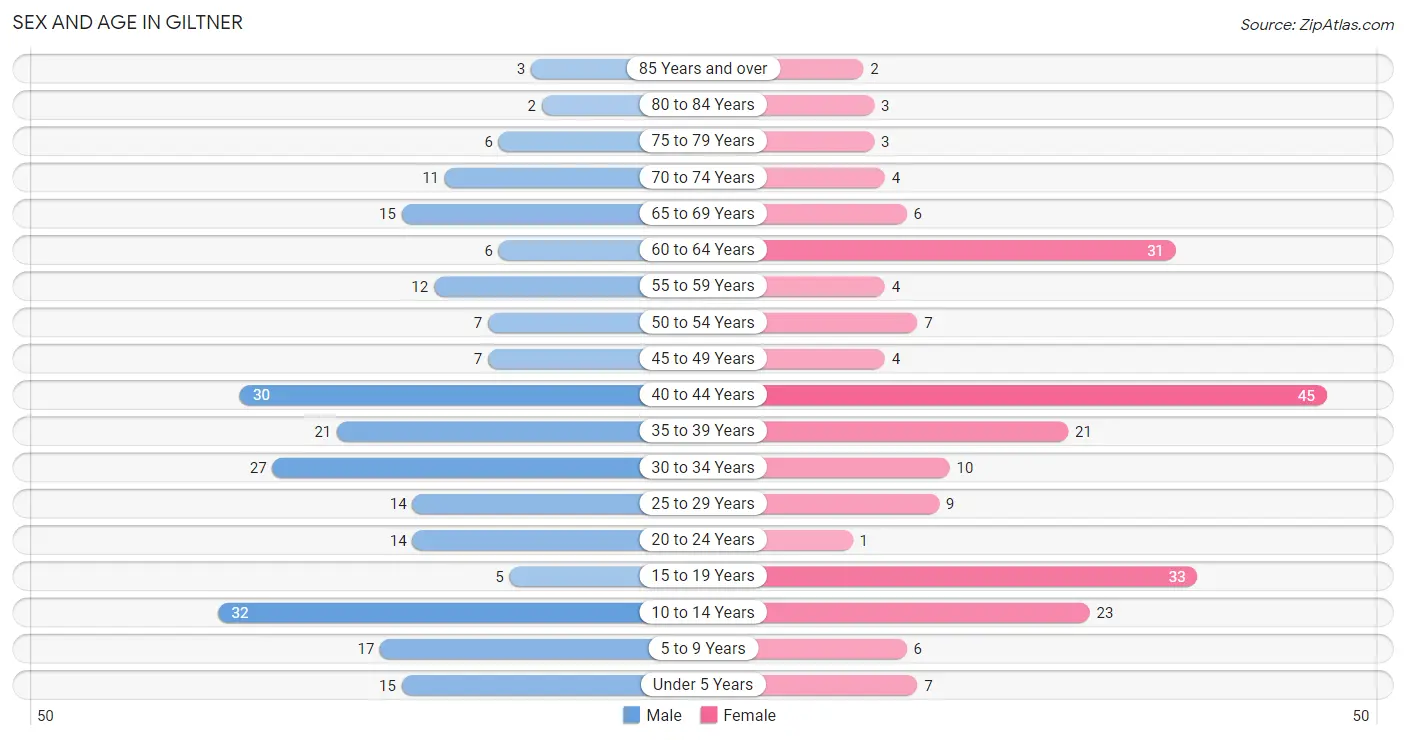
The most populous age groups in Giltner are 10 to 14 Years (32 | 13.1%) for men and 40 to 44 Years (45 | 20.5%) for women.
| Age Bracket | Male | Female |
| Under 5 Years | 15 (6.1%) | 7 (3.2%) |
| 5 to 9 Years | 17 (7.0%) | 6 (2.7%) |
| 10 to 14 Years | 32 (13.1%) | 23 (10.5%) |
| 15 to 19 Years | 5 (2.1%) | 33 (15.1%) |
| 20 to 24 Years | 14 (5.7%) | 1 (0.5%) |
| 25 to 29 Years | 14 (5.7%) | 9 (4.1%) |
| 30 to 34 Years | 27 (11.1%) | 10 (4.6%) |
| 35 to 39 Years | 21 (8.6%) | 21 (9.6%) |
| 40 to 44 Years | 30 (12.3%) | 45 (20.5%) |
| 45 to 49 Years | 7 (2.9%) | 4 (1.8%) |
| 50 to 54 Years | 7 (2.9%) | 7 (3.2%) |
| 55 to 59 Years | 12 (4.9%) | 4 (1.8%) |
| 60 to 64 Years | 6 (2.5%) | 31 (14.2%) |
| 65 to 69 Years | 15 (6.1%) | 6 (2.7%) |
| 70 to 74 Years | 11 (4.5%) | 4 (1.8%) |
| 75 to 79 Years | 6 (2.5%) | 3 (1.4%) |
| 80 to 84 Years | 2 (0.8%) | 3 (1.4%) |
| 85 Years and over | 3 (1.2%) | 2 (0.9%) |
| Total | 244 (100.0%) | 219 (100.0%) |
Families and Households in Giltner
Median Family Size in Giltner
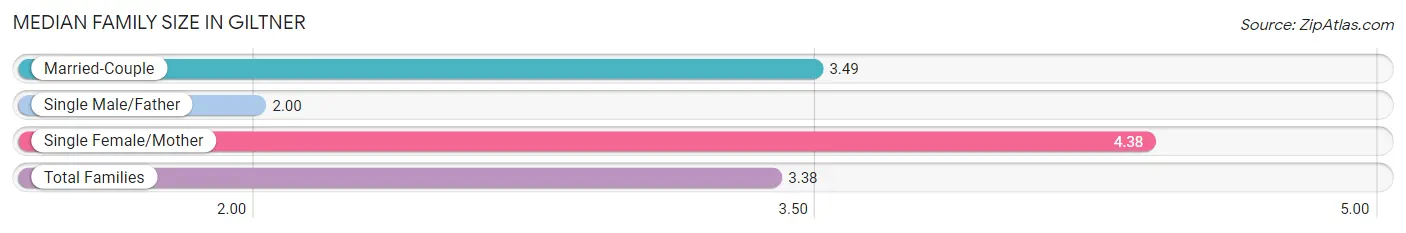
The median family size in Giltner is 3.38 persons per family, with single female/mother families (8 | 8.3%) accounting for the largest median family size of 4.38 persons per family. On the other hand, single male/father families (12 | 12.4%) represent the smallest median family size with 2.00 persons per family.
| Family Type | # Families | Family Size |
| Married-Couple | 77 (79.4%) | 3.49 |
| Single Male/Father | 12 (12.4%) | 2.00 |
| Single Female/Mother | 8 (8.3%) | 4.38 |
| Total Families | 97 (100.0%) | 3.38 |
Median Household Size in Giltner
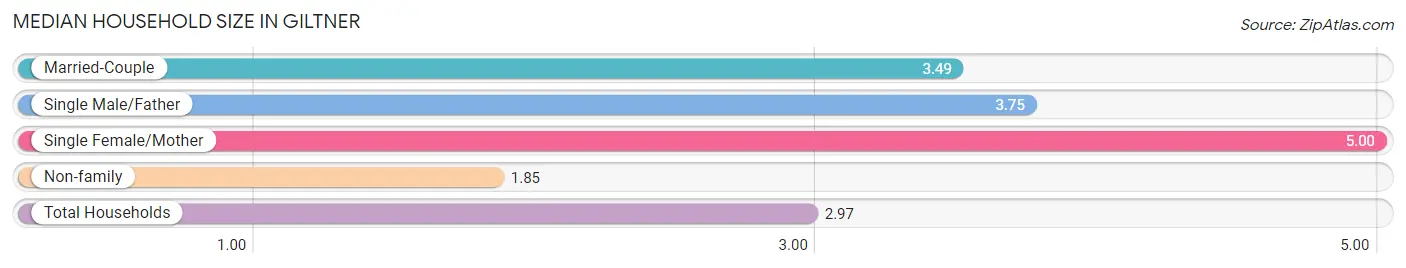
The median household size in Giltner is 2.97 persons per household, with single female/mother households (8 | 5.1%) accounting for the largest median household size of 5 persons per household. non-family households (59 | 37.8%) represent the smallest median household size with 1.85 persons per household.
| Household Type | # Households | Household Size |
| Married-Couple | 77 (49.4%) | 3.49 |
| Single Male/Father | 12 (7.7%) | 3.75 |
| Single Female/Mother | 8 (5.1%) | 5.00 |
| Non-family | 59 (37.8%) | 1.85 |
| Total Households | 156 (100.0%) | 2.97 |
Household Size by Marriage Status in Giltner
Out of a total of 156 households in Giltner, 97 (62.2%) are family households, while 59 (37.8%) are nonfamily households. The most numerous type of family households are 2-person households, comprising 38, and the most common type of nonfamily households are 1-person households, comprising 48.
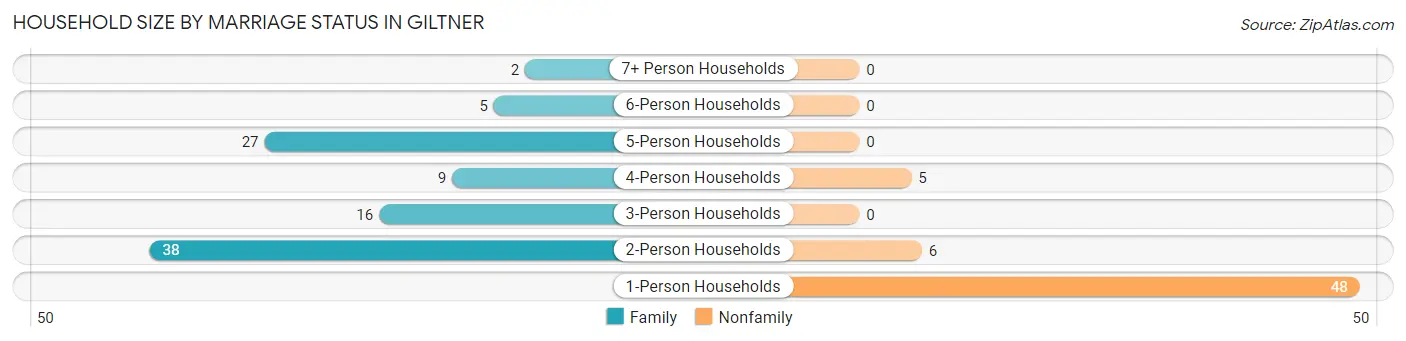
| Household Size | Family Households | Nonfamily Households |
| 1-Person Households | - | 48 (30.8%) |
| 2-Person Households | 38 (24.4%) | 6 (3.8%) |
| 3-Person Households | 16 (10.3%) | 0 (0.0%) |
| 4-Person Households | 9 (5.8%) | 5 (3.2%) |
| 5-Person Households | 27 (17.3%) | 0 (0.0%) |
| 6-Person Households | 5 (3.2%) | 0 (0.0%) |
| 7+ Person Households | 2 (1.3%) | 0 (0.0%) |
| Total | 97 (62.2%) | 59 (37.8%) |
Female Fertility in Giltner
Fertility by Age in Giltner
Average fertility rate in Giltner is 40.0 births per 1,000 women. Women in the age bracket of 20 to 34 years have the highest fertility rate with 250.0 births per 1,000 women. Women in the age bracket of 20 to 34 years acount for 100.0% of all women with births.
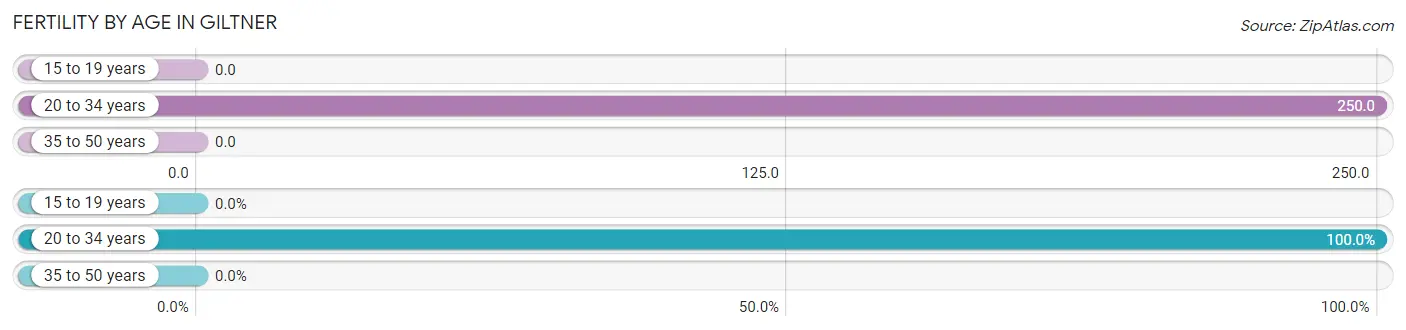
| Age Bracket | Women with Births | Births / 1,000 Women |
| 15 to 19 years | 0 (0.0%) | 0.0 |
| 20 to 34 years | 5 (100.0%) | 250.0 |
| 35 to 50 years | 0 (0.0%) | 0.0 |
| Total | 5 (100.0%) | 40.0 |
Fertility by Age by Marriage Status in Giltner
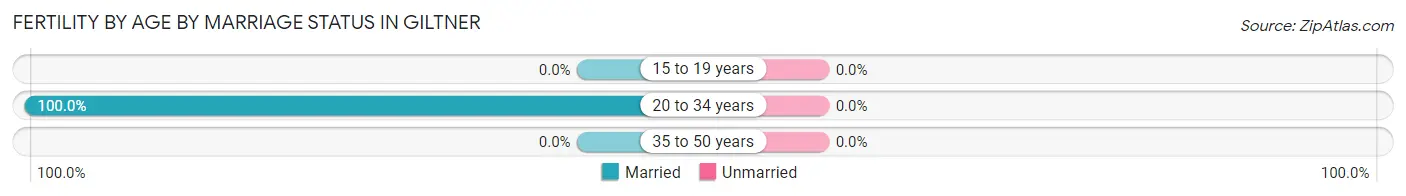
| Age Bracket | Married | Unmarried |
| 15 to 19 years | 0 (0.0%) | 0 (0.0%) |
| 20 to 34 years | 5 (100.0%) | 0 (0.0%) |
| 35 to 50 years | 0 (0.0%) | 0 (0.0%) |
| Total | 5 (100.0%) | 0 (0.0%) |
Fertility by Education in Giltner
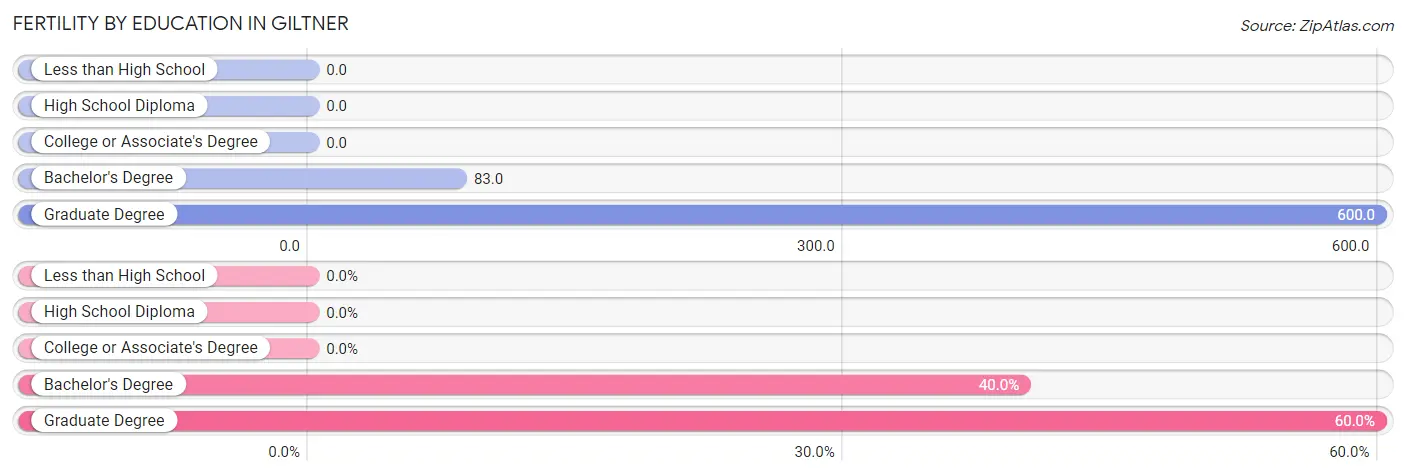
| Educational Attainment | Women with Births | Births / 1,000 Women |
| Less than High School | 0 (0.0%) | 0.0 |
| High School Diploma | 0 (0.0%) | 0.0 |
| College or Associate's Degree | 0 (0.0%) | 0.0 |
| Bachelor's Degree | 2 (40.0%) | 83.0 |
| Graduate Degree | 3 (60.0%) | 600.0 |
| Total | 5 (100.0%) | 40.0 |
Fertility by Education by Marriage Status in Giltner
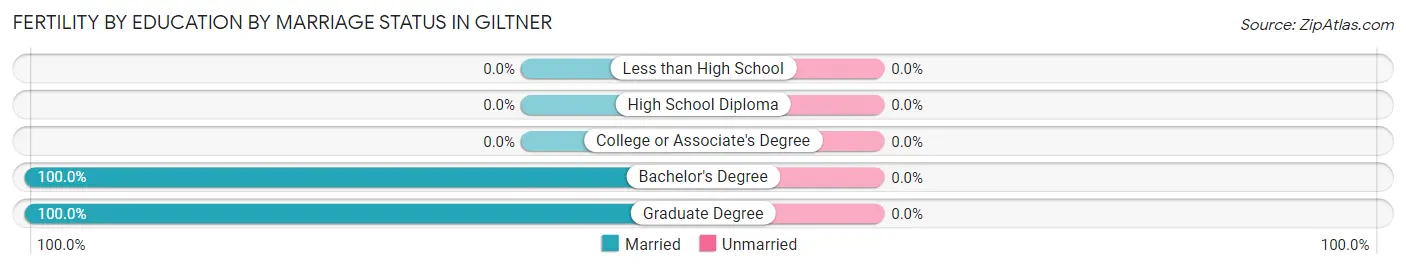
| Educational Attainment | Married | Unmarried |
| Less than High School | 0 (0.0%) | 0 (0.0%) |
| High School Diploma | 0 (0.0%) | 0 (0.0%) |
| College or Associate's Degree | 0 (0.0%) | 0 (0.0%) |
| Bachelor's Degree | 2 (100.0%) | 0 (0.0%) |
| Graduate Degree | 3 (100.0%) | 0 (0.0%) |
| Total | 5 (100.0%) | 0 (0.0%) |
Employment Characteristics in Giltner
Employment by Class of Employer in Giltner
Among the 249 employed individuals in Giltner, private company employees (163 | 65.5%), self-employed (not incorporated) (30 | 12.0%), and local government employees (29 | 11.7%) make up the most common classes of employment.
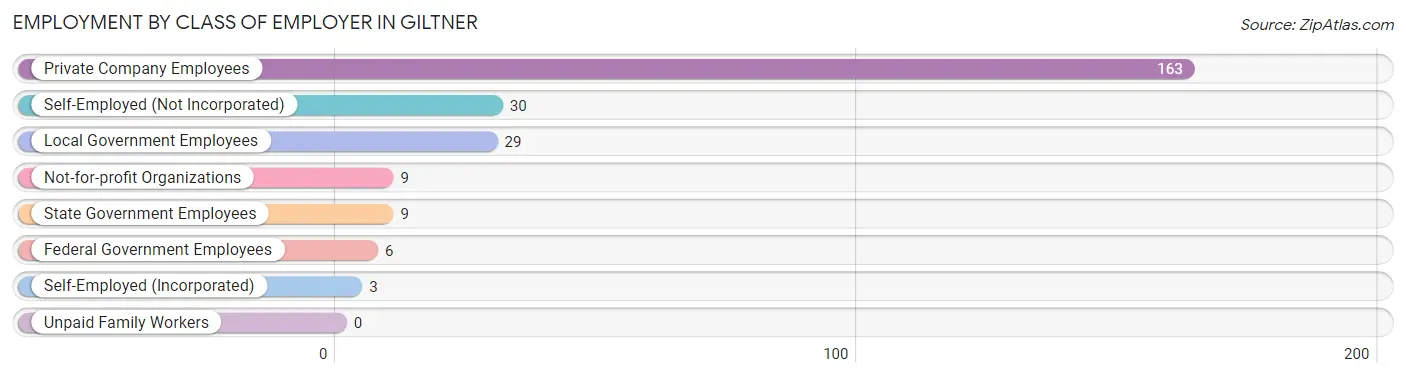
| Employer Class | # Employees | % Employees |
| Private Company Employees | 163 | 65.5% |
| Self-Employed (Incorporated) | 3 | 1.2% |
| Self-Employed (Not Incorporated) | 30 | 12.0% |
| Not-for-profit Organizations | 9 | 3.6% |
| Local Government Employees | 29 | 11.7% |
| State Government Employees | 9 | 3.6% |
| Federal Government Employees | 6 | 2.4% |
| Unpaid Family Workers | 0 | 0.0% |
| Total | 249 | 100.0% |
Employment Status by Age in Giltner
According to the labor force statistics for Giltner, out of the total population over 16 years of age (360), 71.7% or 258 individuals are in the labor force, with 2.7% or 7 of them unemployed. The age group with the highest labor force participation rate is 30 to 34 years, with 100.0% or 37 individuals in the labor force. Within the labor force, the 30 to 34 years age range has the highest percentage of unemployed individuals, with 18.9% or 7 of them being unemployed.
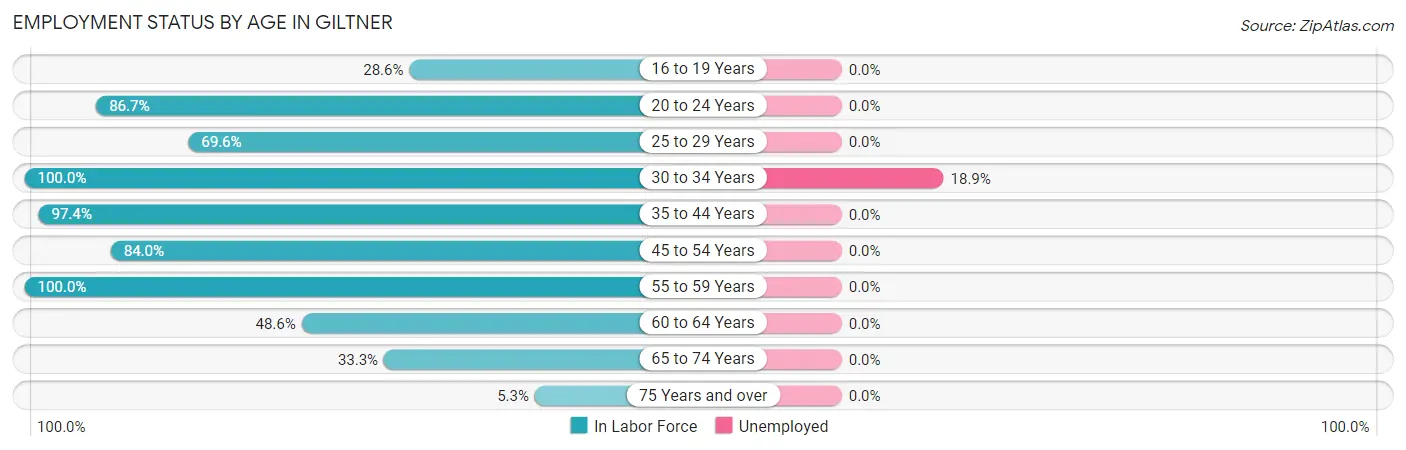
| Age Bracket | In Labor Force | Unemployed |
| 16 to 19 Years | 10 (28.6%) | 0 (0.0%) |
| 20 to 24 Years | 13 (86.7%) | 0 (0.0%) |
| 25 to 29 Years | 16 (69.6%) | 0 (0.0%) |
| 30 to 34 Years | 37 (100.0%) | 7 (18.9%) |
| 35 to 44 Years | 114 (97.4%) | 0 (0.0%) |
| 45 to 54 Years | 21 (84.0%) | 0 (0.0%) |
| 55 to 59 Years | 16 (100.0%) | 0 (0.0%) |
| 60 to 64 Years | 18 (48.6%) | 0 (0.0%) |
| 65 to 74 Years | 12 (33.3%) | 0 (0.0%) |
| 75 Years and over | 1 (5.3%) | 0 (0.0%) |
| Total | 258 (71.7%) | 7 (2.7%) |
Employment Status by Educational Attainment in Giltner
According to labor force statistics for Giltner, 87.1% of individuals (222) out of the total population between 25 and 64 years of age (255) are in the labor force, with 3.2% or 7 of them being unemployed. The group with the highest labor force participation rate are those with the educational attainment of less than high school, with 100.0% or 6 individuals in the labor force. Within the labor force, individuals with high school diploma education have the highest percentage of unemployment, with 8.0% or 7 of them being unemployed.
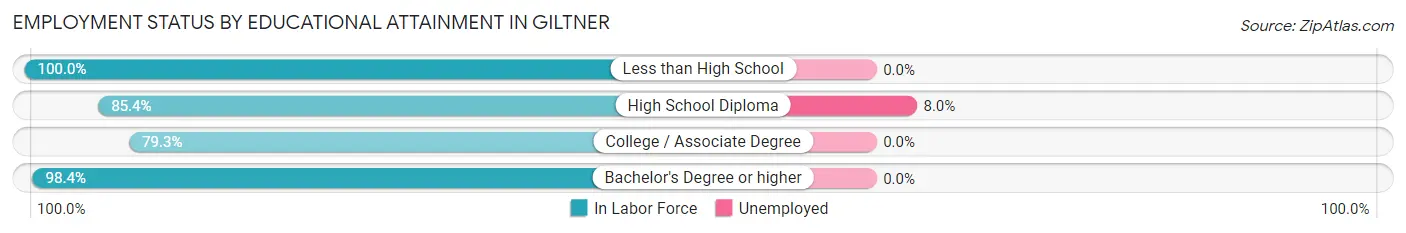
| Educational Attainment | In Labor Force | Unemployed |
| Less than High School | 6 (100.0%) | 0 (0.0%) |
| High School Diploma | 88 (85.4%) | 8 (8.0%) |
| College / Associate Degree | 65 (79.3%) | 0 (0.0%) |
| Bachelor's Degree or higher | 63 (98.4%) | 0 (0.0%) |
| Total | 222 (87.1%) | 8 (3.2%) |
Employment Occupations by Sex in Giltner
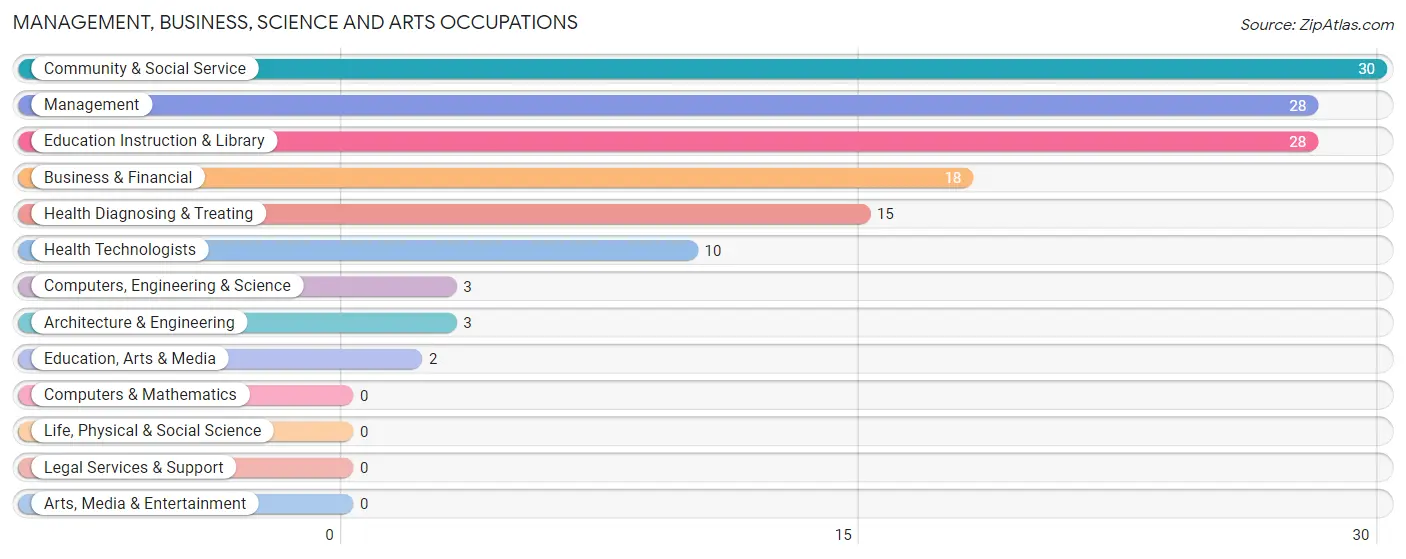
Management, Business, Science and Arts Occupations
The most common Management, Business, Science and Arts occupations in Giltner are Community & Social Service (30 | 11.9%), Management (28 | 11.2%), Education Instruction & Library (28 | 11.2%), Business & Financial (18 | 7.2%), and Health Diagnosing & Treating (15 | 6.0%).
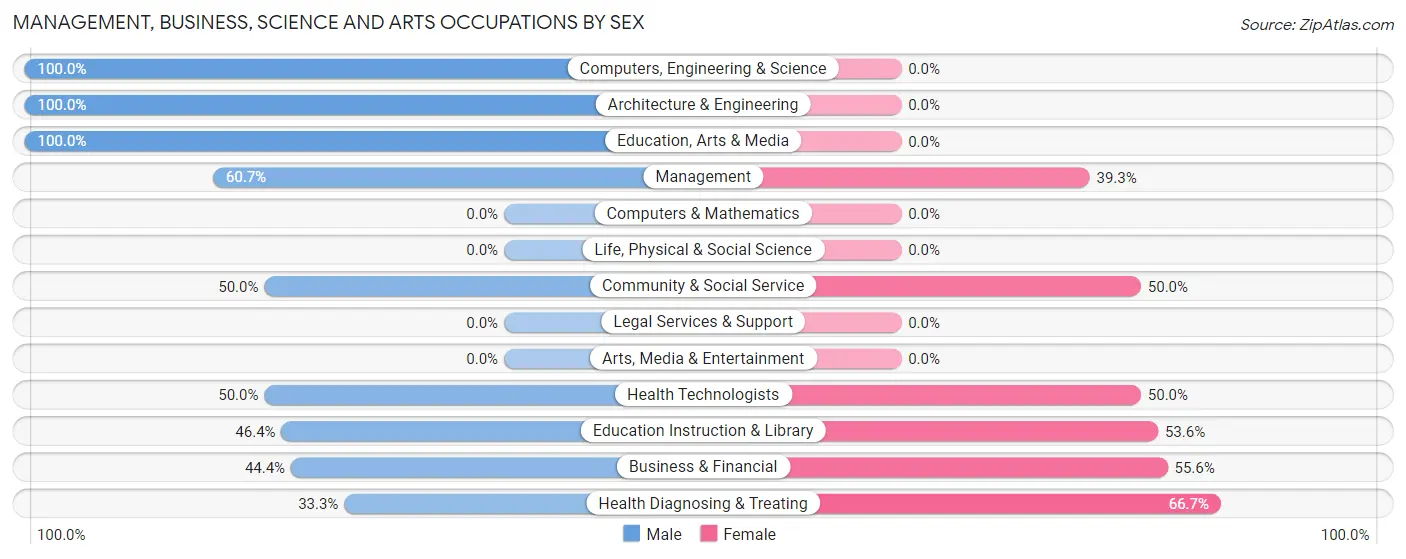
Management, Business, Science and Arts Occupations by Sex
Within the Management, Business, Science and Arts occupations in Giltner, the most male-oriented occupations are Computers, Engineering & Science (100.0%), Architecture & Engineering (100.0%), and Education, Arts & Media (100.0%), while the most female-oriented occupations are Health Diagnosing & Treating (66.7%), Business & Financial (55.6%), and Education Instruction & Library (53.6%).
| Occupation | Male | Female |
| Management | 17 (60.7%) | 11 (39.3%) |
| Business & Financial | 8 (44.4%) | 10 (55.6%) |
| Computers, Engineering & Science | 3 (100.0%) | 0 (0.0%) |
| Computers & Mathematics | 0 (0.0%) | 0 (0.0%) |
| Architecture & Engineering | 3 (100.0%) | 0 (0.0%) |
| Life, Physical & Social Science | 0 (0.0%) | 0 (0.0%) |
| Community & Social Service | 15 (50.0%) | 15 (50.0%) |
| Education, Arts & Media | 2 (100.0%) | 0 (0.0%) |
| Legal Services & Support | 0 (0.0%) | 0 (0.0%) |
| Education Instruction & Library | 13 (46.4%) | 15 (53.6%) |
| Arts, Media & Entertainment | 0 (0.0%) | 0 (0.0%) |
| Health Diagnosing & Treating | 5 (33.3%) | 10 (66.7%) |
| Health Technologists | 5 (50.0%) | 5 (50.0%) |
| Total (Category) | 48 (51.1%) | 46 (48.9%) |
| Total (Overall) | 127 (50.6%) | 124 (49.4%) |
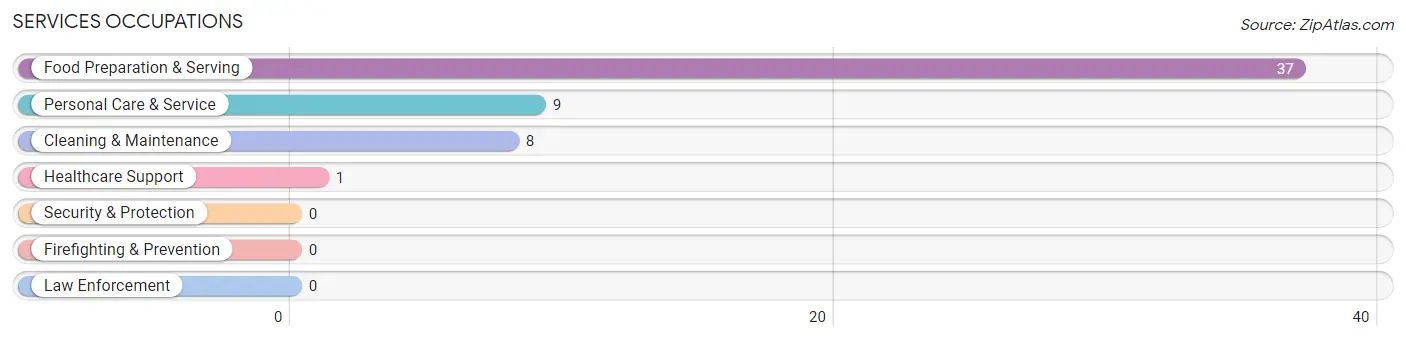
Services Occupations
The most common Services occupations in Giltner are Food Preparation & Serving (37 | 14.7%), Personal Care & Service (9 | 3.6%), Cleaning & Maintenance (8 | 3.2%), and Healthcare Support (1 | 0.4%).
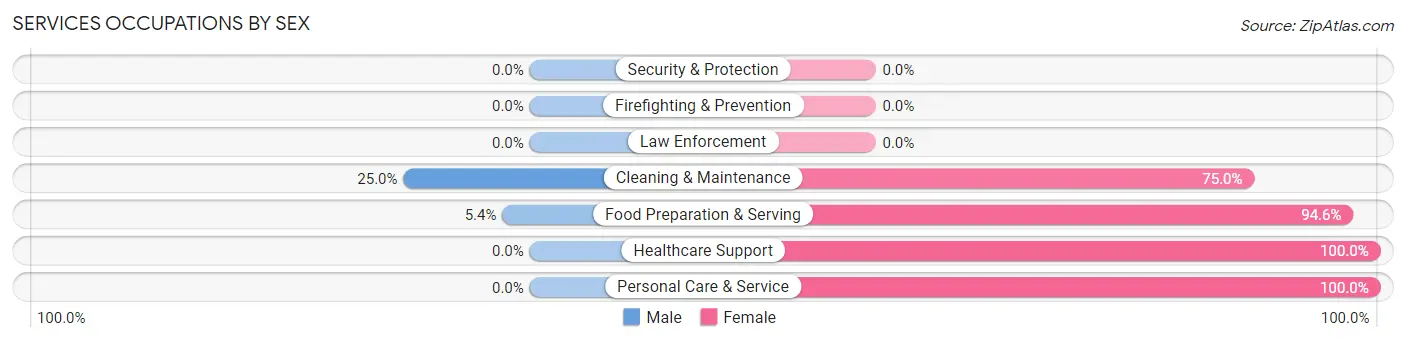
Services Occupations by Sex
Within the Services occupations in Giltner, the most male-oriented occupations are Cleaning & Maintenance (25.0%), and Food Preparation & Serving (5.4%), while the most female-oriented occupations are Healthcare Support (100.0%), Personal Care & Service (100.0%), and Food Preparation & Serving (94.6%).
| Occupation | Male | Female |
| Healthcare Support | 0 (0.0%) | 1 (100.0%) |
| Security & Protection | 0 (0.0%) | 0 (0.0%) |
| Firefighting & Prevention | 0 (0.0%) | 0 (0.0%) |
| Law Enforcement | 0 (0.0%) | 0 (0.0%) |
| Food Preparation & Serving | 2 (5.4%) | 35 (94.6%) |
| Cleaning & Maintenance | 2 (25.0%) | 6 (75.0%) |
| Personal Care & Service | 0 (0.0%) | 9 (100.0%) |
| Total (Category) | 4 (7.3%) | 51 (92.7%) |
| Total (Overall) | 127 (50.6%) | 124 (49.4%) |
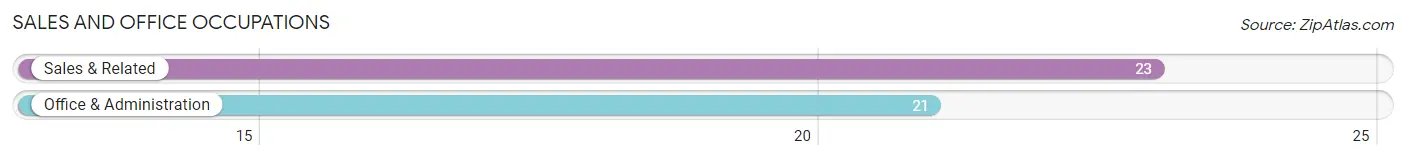
Sales and Office Occupations
The most common Sales and Office occupations in Giltner are Sales & Related (23 | 9.2%), and Office & Administration (21 | 8.4%).
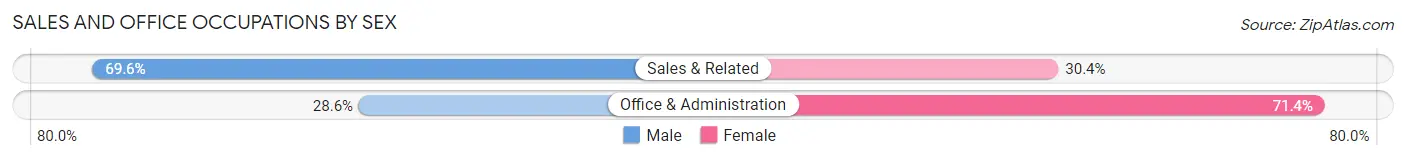
Sales and Office Occupations by Sex
| Occupation | Male | Female |
| Sales & Related | 16 (69.6%) | 7 (30.4%) |
| Office & Administration | 6 (28.6%) | 15 (71.4%) |
| Total (Category) | 22 (50.0%) | 22 (50.0%) |
| Total (Overall) | 127 (50.6%) | 124 (49.4%) |
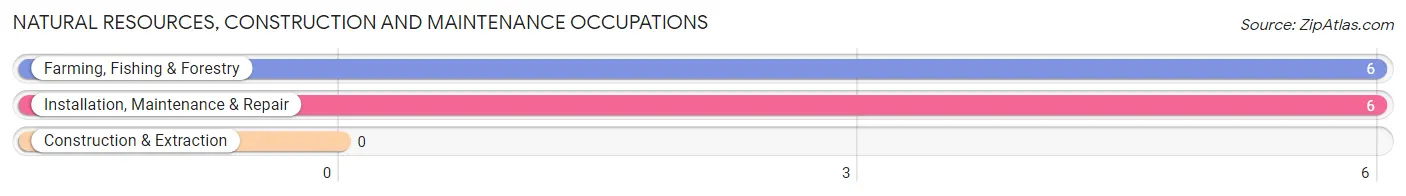
Natural Resources, Construction and Maintenance Occupations
The most common Natural Resources, Construction and Maintenance occupations in Giltner are Farming, Fishing & Forestry (6 | 2.4%), and Installation, Maintenance & Repair (6 | 2.4%).
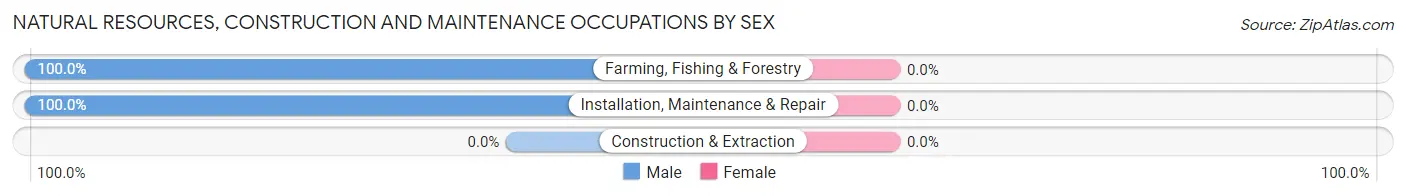
Natural Resources, Construction and Maintenance Occupations by Sex
| Occupation | Male | Female |
| Farming, Fishing & Forestry | 6 (100.0%) | 0 (0.0%) |
| Construction & Extraction | 0 (0.0%) | 0 (0.0%) |
| Installation, Maintenance & Repair | 6 (100.0%) | 0 (0.0%) |
| Total (Category) | 12 (100.0%) | 0 (0.0%) |
| Total (Overall) | 127 (50.6%) | 124 (49.4%) |
Production, Transportation and Moving Occupations
The most common Production, Transportation and Moving occupations in Giltner are Transportation (23 | 9.2%), Material Moving (15 | 6.0%), and Production (8 | 3.2%).
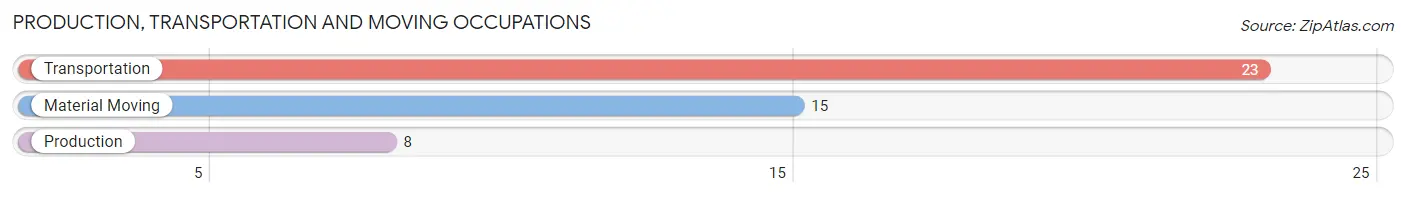
Production, Transportation and Moving Occupations by Sex
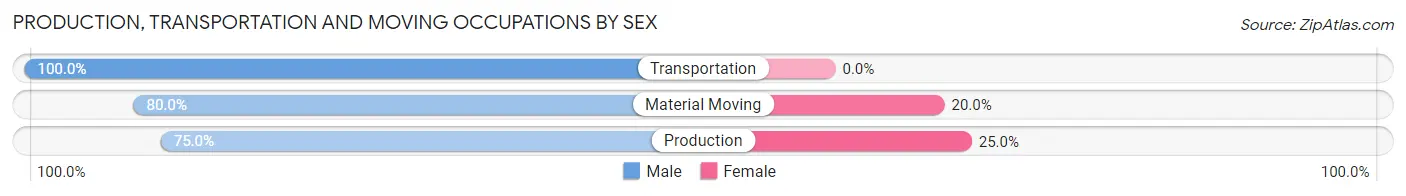
| Occupation | Male | Female |
| Production | 6 (75.0%) | 2 (25.0%) |
| Transportation | 23 (100.0%) | 0 (0.0%) |
| Material Moving | 12 (80.0%) | 3 (20.0%) |
| Total (Category) | 41 (89.1%) | 5 (10.9%) |
| Total (Overall) | 127 (50.6%) | 124 (49.4%) |
Employment Industries by Sex in Giltner
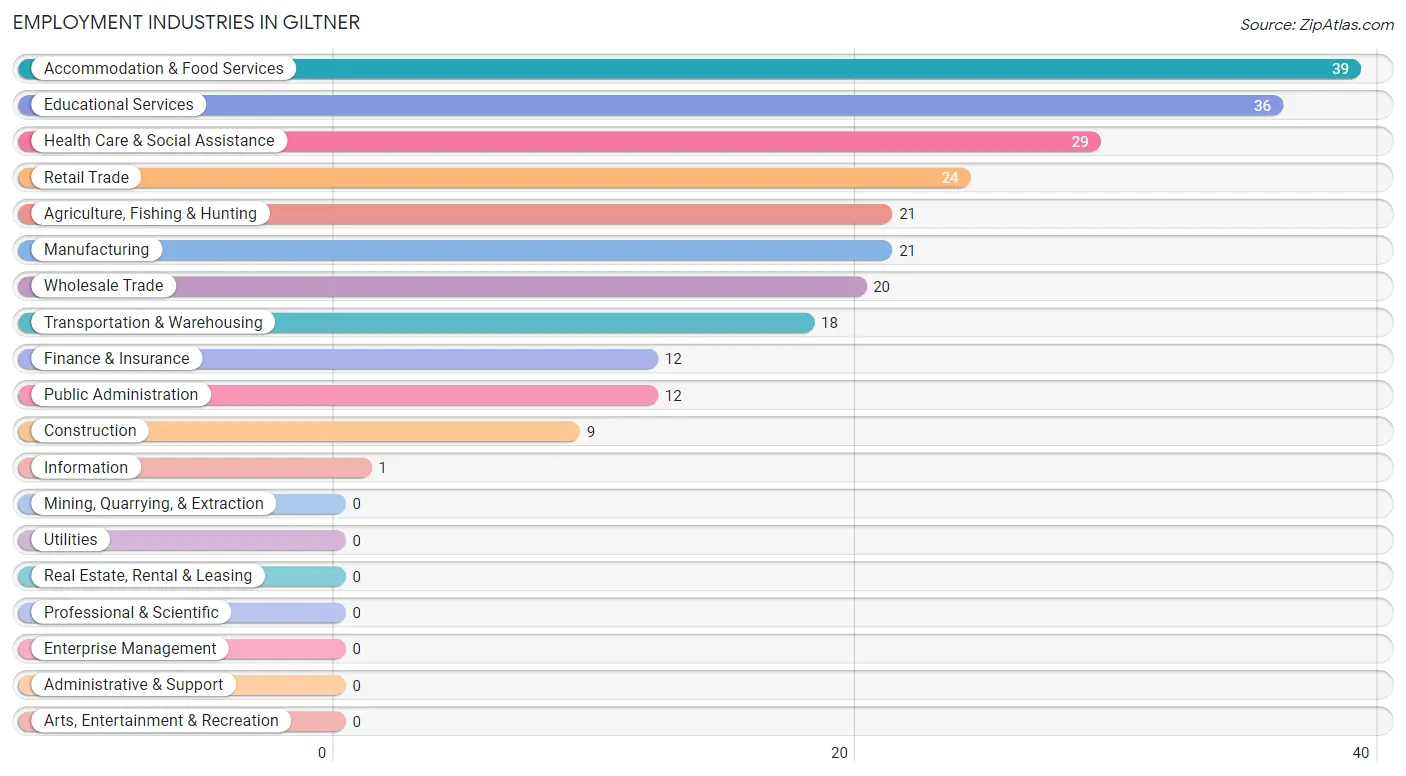
Employment Industries in Giltner
The major employment industries in Giltner include Accommodation & Food Services (39 | 15.5%), Educational Services (36 | 14.3%), Health Care & Social Assistance (29 | 11.6%), Retail Trade (24 | 9.6%), and Agriculture, Fishing & Hunting (21 | 8.4%).
Employment Industries by Sex in Giltner
The Giltner industries that see more men than women are Agriculture, Fishing & Hunting (100.0%), Transportation & Warehousing (100.0%), and Wholesale Trade (95.0%), whereas the industries that tend to have a higher number of women are Information (100.0%), Accommodation & Food Services (94.9%), and Health Care & Social Assistance (82.8%).
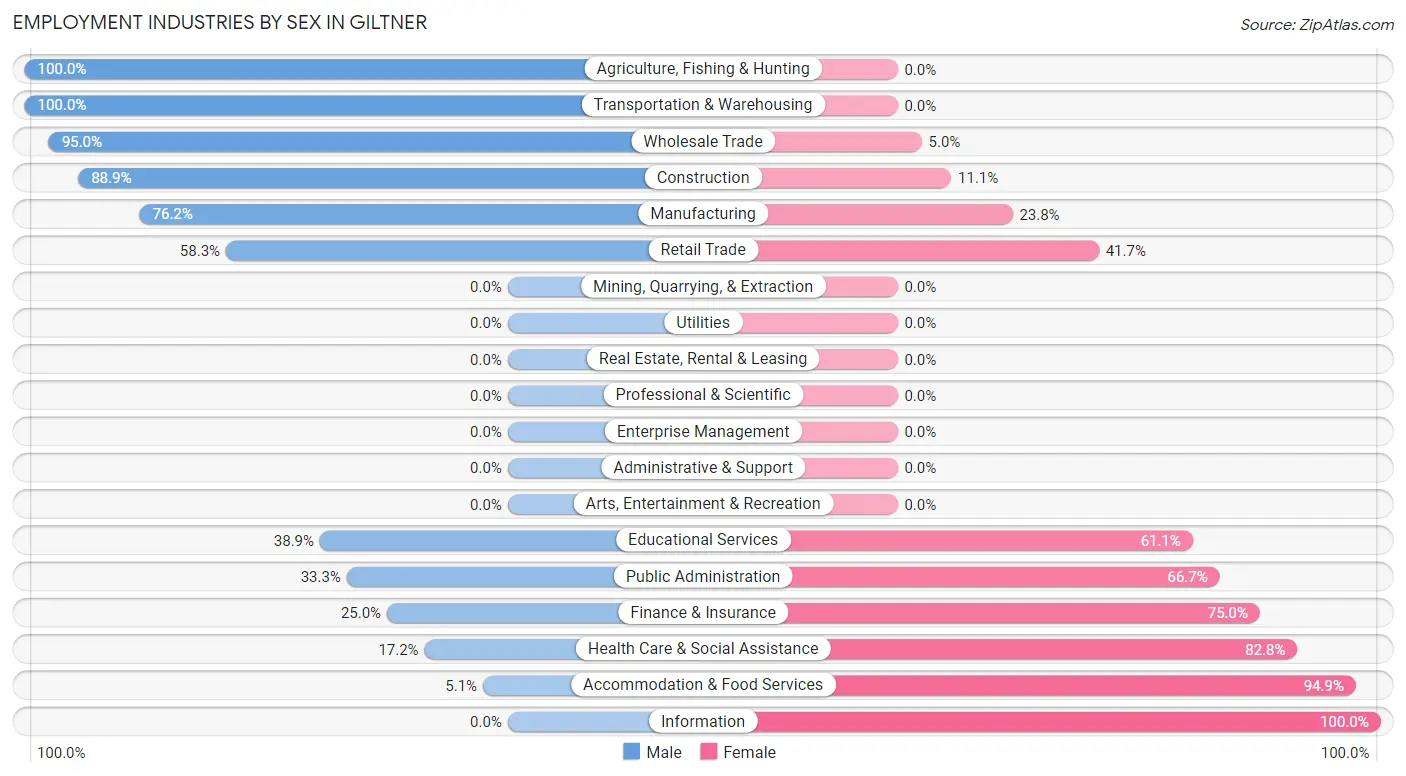
| Industry | Male | Female |
| Agriculture, Fishing & Hunting | 21 (100.0%) | 0 (0.0%) |
| Mining, Quarrying, & Extraction | 0 (0.0%) | 0 (0.0%) |
| Construction | 8 (88.9%) | 1 (11.1%) |
| Manufacturing | 16 (76.2%) | 5 (23.8%) |
| Wholesale Trade | 19 (95.0%) | 1 (5.0%) |
| Retail Trade | 14 (58.3%) | 10 (41.7%) |
| Transportation & Warehousing | 18 (100.0%) | 0 (0.0%) |
| Utilities | 0 (0.0%) | 0 (0.0%) |
| Information | 0 (0.0%) | 1 (100.0%) |
| Finance & Insurance | 3 (25.0%) | 9 (75.0%) |
| Real Estate, Rental & Leasing | 0 (0.0%) | 0 (0.0%) |
| Professional & Scientific | 0 (0.0%) | 0 (0.0%) |
| Enterprise Management | 0 (0.0%) | 0 (0.0%) |
| Administrative & Support | 0 (0.0%) | 0 (0.0%) |
| Educational Services | 14 (38.9%) | 22 (61.1%) |
| Health Care & Social Assistance | 5 (17.2%) | 24 (82.8%) |
| Arts, Entertainment & Recreation | 0 (0.0%) | 0 (0.0%) |
| Accommodation & Food Services | 2 (5.1%) | 37 (94.9%) |
| Public Administration | 4 (33.3%) | 8 (66.7%) |
| Total | 127 (50.6%) | 124 (49.4%) |
Education in Giltner
School Enrollment in Giltner
The most common levels of schooling among the 129 students in Giltner are high school (45 | 34.9%), middle school (40 | 31.0%), and elementary school (18 | 14.0%).
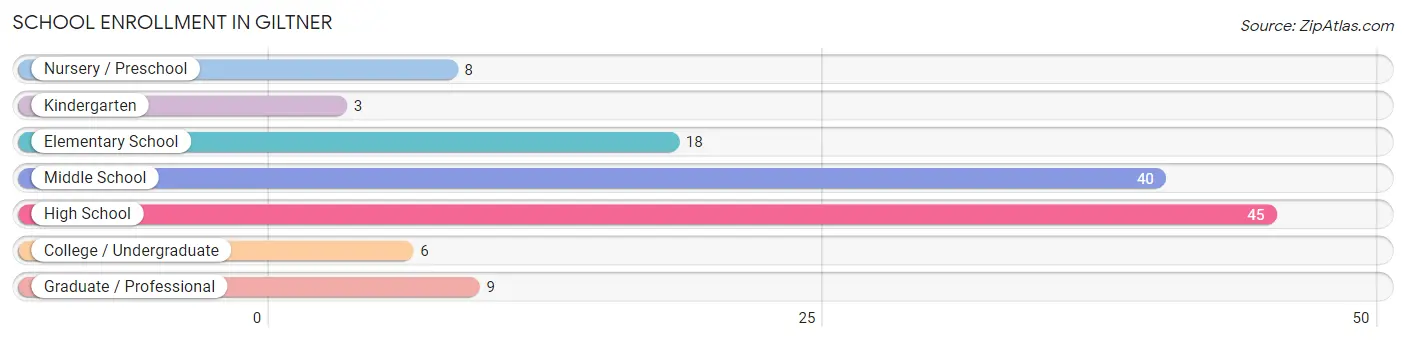
| School Level | # Students | % Students |
| Nursery / Preschool | 8 | 6.2% |
| Kindergarten | 3 | 2.3% |
| Elementary School | 18 | 14.0% |
| Middle School | 40 | 31.0% |
| High School | 45 | 34.9% |
| College / Undergraduate | 6 | 4.6% |
| Graduate / Professional | 9 | 7.0% |
| Total | 129 | 100.0% |
School Enrollment by Age by Funding Source in Giltner
Out of a total of 129 students who are enrolled in schools in Giltner, 1 (0.8%) attend a private institution, while the remaining 128 (99.2%) are enrolled in public schools. The age group of 15 to 17 year olds has the highest likelihood of being enrolled in private schools, with 1 (3.3% in the age bracket) enrolled. Conversely, the age group of 3 to 4 year olds has the lowest likelihood of being enrolled in a private school, with 8 (100.0% in the age bracket) attending a public institution.
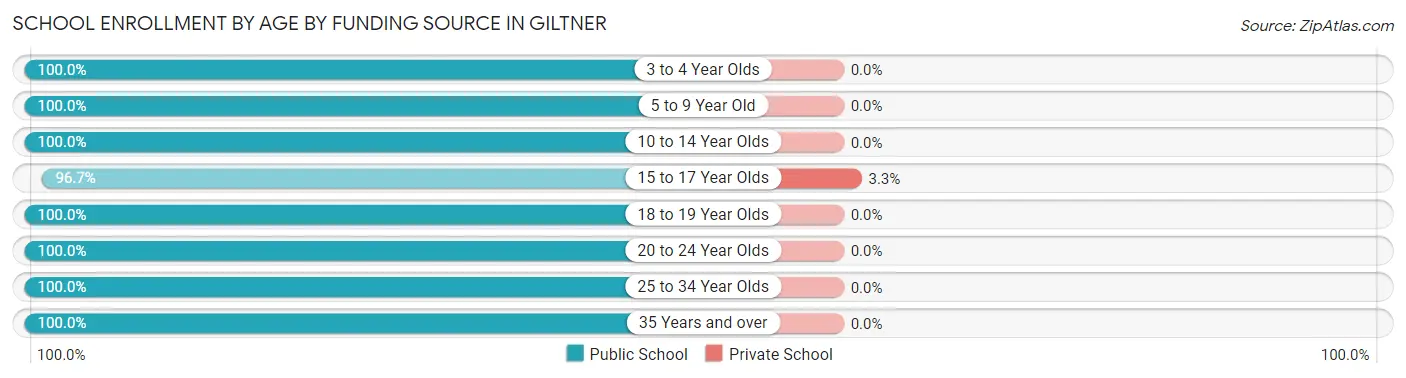
| Age Bracket | Public School | Private School |
| 3 to 4 Year Olds | 8 (100.0%) | 0 (0.0%) |
| 5 to 9 Year Old | 17 (100.0%) | 0 (0.0%) |
| 10 to 14 Year Olds | 51 (100.0%) | 0 (0.0%) |
| 15 to 17 Year Olds | 29 (96.7%) | 1 (3.3%) |
| 18 to 19 Year Olds | 8 (100.0%) | 0 (0.0%) |
| 20 to 24 Year Olds | 2 (100.0%) | 0 (0.0%) |
| 25 to 34 Year Olds | 2 (100.0%) | 0 (0.0%) |
| 35 Years and over | 11 (100.0%) | 0 (0.0%) |
| Total | 128 (99.2%) | 1 (0.8%) |
Educational Attainment by Field of Study in Giltner
Education (26 | 37.7%), business (11 | 15.9%), arts & humanities (8 | 11.6%), bio, nature & agricultural (6 | 8.7%), and physical & health sciences (6 | 8.7%) are the most common fields of study among 69 individuals in Giltner who have obtained a bachelor's degree or higher.
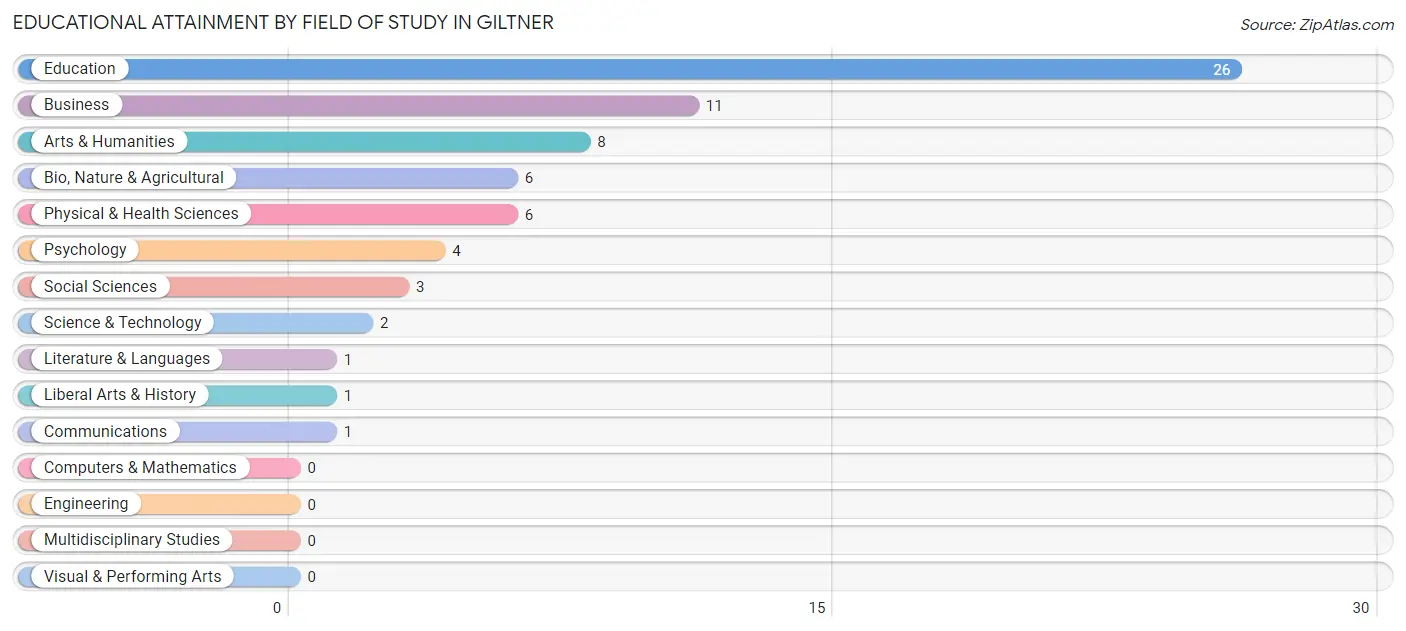
| Field of Study | # Graduates | % Graduates |
| Computers & Mathematics | 0 | 0.0% |
| Bio, Nature & Agricultural | 6 | 8.7% |
| Physical & Health Sciences | 6 | 8.7% |
| Psychology | 4 | 5.8% |
| Social Sciences | 3 | 4.3% |
| Engineering | 0 | 0.0% |
| Multidisciplinary Studies | 0 | 0.0% |
| Science & Technology | 2 | 2.9% |
| Business | 11 | 15.9% |
| Education | 26 | 37.7% |
| Literature & Languages | 1 | 1.5% |
| Liberal Arts & History | 1 | 1.5% |
| Visual & Performing Arts | 0 | 0.0% |
| Communications | 1 | 1.5% |
| Arts & Humanities | 8 | 11.6% |
| Total | 69 | 100.0% |
Transportation & Commute in Giltner
Vehicle Availability by Sex in Giltner
The most prevalent vehicle ownership categories in Giltner are males with 3 vehicles (43, accounting for 34.1%) and females with 3 vehicles (35, making up 35.0%).
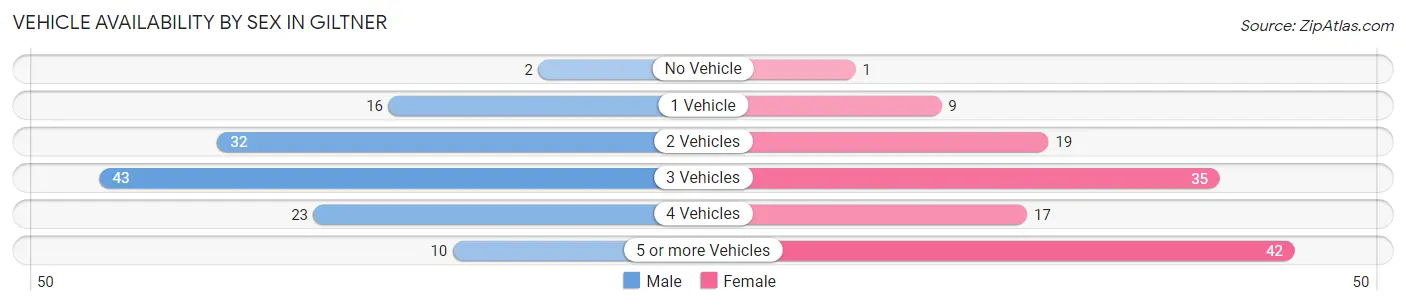
| Vehicles Available | Male | Female |
| No Vehicle | 2 (1.6%) | 1 (0.8%) |
| 1 Vehicle | 16 (12.7%) | 9 (7.3%) |
| 2 Vehicles | 32 (25.4%) | 19 (15.4%) |
| 3 Vehicles | 43 (34.1%) | 35 (28.5%) |
| 4 Vehicles | 23 (18.2%) | 17 (13.8%) |
| 5 or more Vehicles | 10 (7.9%) | 42 (34.2%) |
| Total | 126 (100.0%) | 123 (100.0%) |
Commute Time in Giltner
The most frequently occuring commute durations in Giltner are 30 to 34 minutes (69 commuters, 29.1%), 25 to 29 minutes (31 commuters, 13.1%), and 15 to 19 minutes (30 commuters, 12.7%).
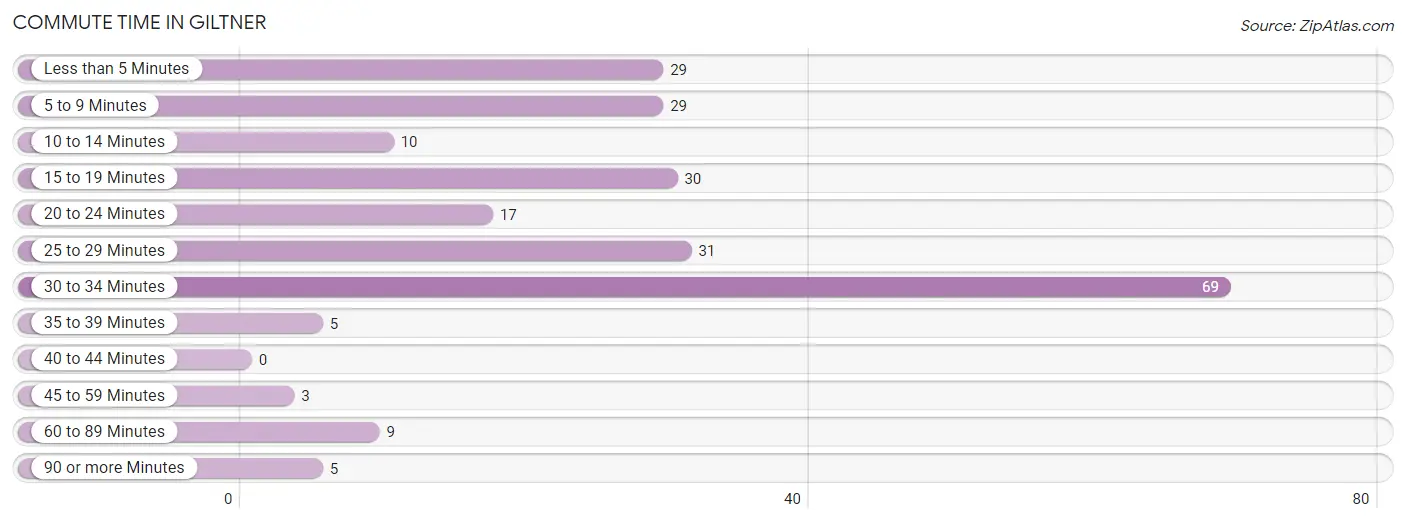
| Commute Time | # Commuters | % Commuters |
| Less than 5 Minutes | 29 | 12.2% |
| 5 to 9 Minutes | 29 | 12.2% |
| 10 to 14 Minutes | 10 | 4.2% |
| 15 to 19 Minutes | 30 | 12.7% |
| 20 to 24 Minutes | 17 | 7.2% |
| 25 to 29 Minutes | 31 | 13.1% |
| 30 to 34 Minutes | 69 | 29.1% |
| 35 to 39 Minutes | 5 | 2.1% |
| 40 to 44 Minutes | 0 | 0.0% |
| 45 to 59 Minutes | 3 | 1.3% |
| 60 to 89 Minutes | 9 | 3.8% |
| 90 or more Minutes | 5 | 2.1% |
Commute Time by Sex in Giltner
The most common commute times in Giltner are 5 to 9 minutes (27 commuters, 23.1%) for males and 30 to 34 minutes (46 commuters, 38.3%) for females.
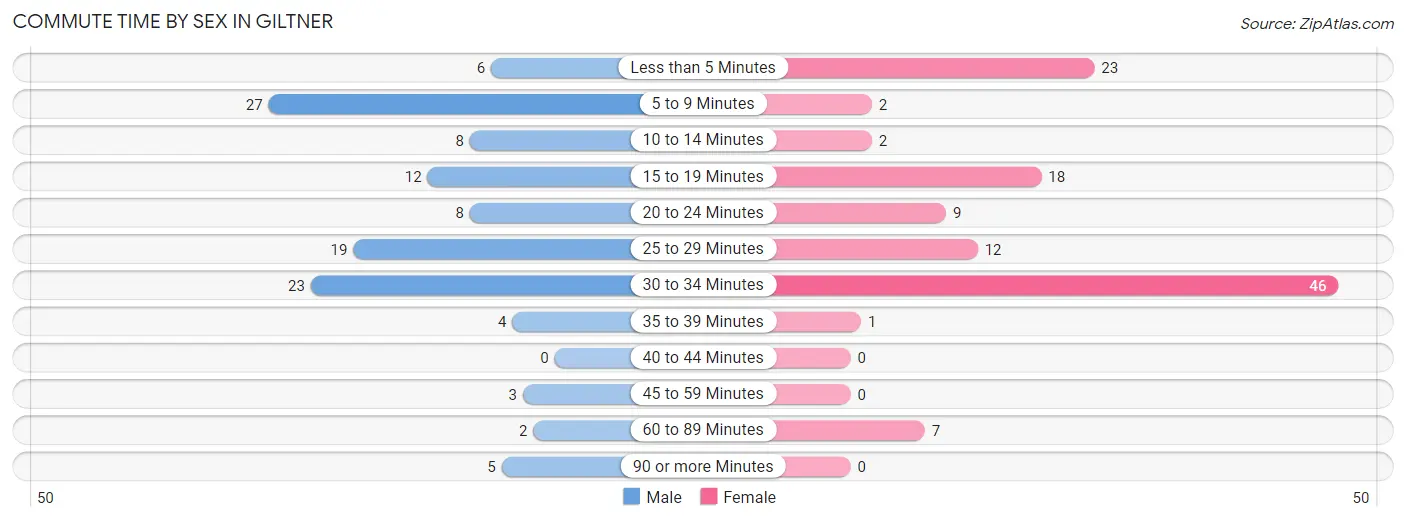
| Commute Time | Male | Female |
| Less than 5 Minutes | 6 (5.1%) | 23 (19.2%) |
| 5 to 9 Minutes | 27 (23.1%) | 2 (1.7%) |
| 10 to 14 Minutes | 8 (6.8%) | 2 (1.7%) |
| 15 to 19 Minutes | 12 (10.3%) | 18 (15.0%) |
| 20 to 24 Minutes | 8 (6.8%) | 9 (7.5%) |
| 25 to 29 Minutes | 19 (16.2%) | 12 (10.0%) |
| 30 to 34 Minutes | 23 (19.7%) | 46 (38.3%) |
| 35 to 39 Minutes | 4 (3.4%) | 1 (0.8%) |
| 40 to 44 Minutes | 0 (0.0%) | 0 (0.0%) |
| 45 to 59 Minutes | 3 (2.6%) | 0 (0.0%) |
| 60 to 89 Minutes | 2 (1.7%) | 7 (5.8%) |
| 90 or more Minutes | 5 (4.3%) | 0 (0.0%) |
Time of Departure to Work by Sex in Giltner
The most frequent times of departure to work in Giltner are 7:00 AM to 7:29 AM (27, 23.1%) for males and 12:00 PM to 3:59 PM (37, 30.8%) for females.
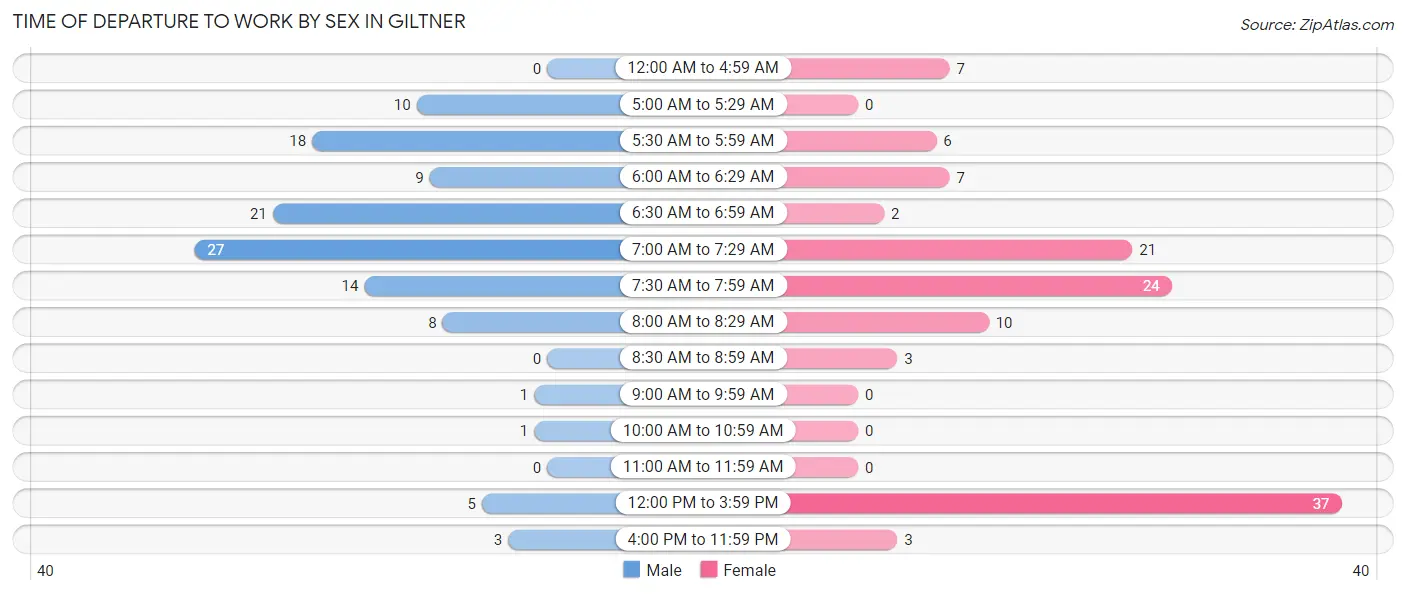
| Time of Departure | Male | Female |
| 12:00 AM to 4:59 AM | 0 (0.0%) | 7 (5.8%) |
| 5:00 AM to 5:29 AM | 10 (8.6%) | 0 (0.0%) |
| 5:30 AM to 5:59 AM | 18 (15.4%) | 6 (5.0%) |
| 6:00 AM to 6:29 AM | 9 (7.7%) | 7 (5.8%) |
| 6:30 AM to 6:59 AM | 21 (17.9%) | 2 (1.7%) |
| 7:00 AM to 7:29 AM | 27 (23.1%) | 21 (17.5%) |
| 7:30 AM to 7:59 AM | 14 (12.0%) | 24 (20.0%) |
| 8:00 AM to 8:29 AM | 8 (6.8%) | 10 (8.3%) |
| 8:30 AM to 8:59 AM | 0 (0.0%) | 3 (2.5%) |
| 9:00 AM to 9:59 AM | 1 (0.9%) | 0 (0.0%) |
| 10:00 AM to 10:59 AM | 1 (0.9%) | 0 (0.0%) |
| 11:00 AM to 11:59 AM | 0 (0.0%) | 0 (0.0%) |
| 12:00 PM to 3:59 PM | 5 (4.3%) | 37 (30.8%) |
| 4:00 PM to 11:59 PM | 3 (2.6%) | 3 (2.5%) |
| Total | 117 (100.0%) | 120 (100.0%) |
Housing Occupancy in Giltner
Occupancy by Ownership in Giltner
Of the total 156 dwellings in Giltner, owner-occupied units account for 132 (84.6%), while renter-occupied units make up 24 (15.4%).
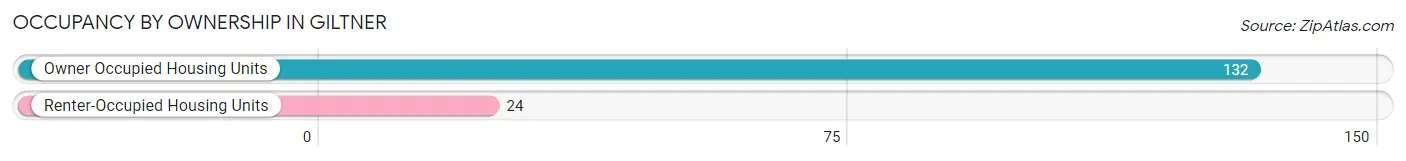
| Occupancy | # Housing Units | % Housing Units |
| Owner Occupied Housing Units | 132 | 84.6% |
| Renter-Occupied Housing Units | 24 | 15.4% |
| Total Occupied Housing Units | 156 | 100.0% |
Occupancy by Household Size in Giltner
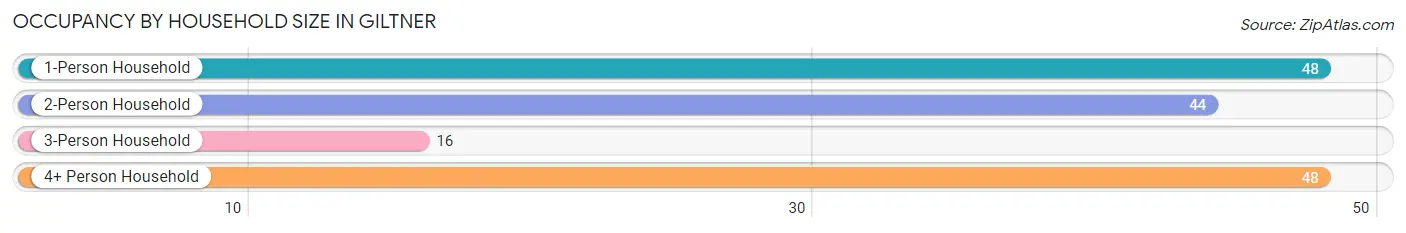
| Household Size | # Housing Units | % Housing Units |
| 1-Person Household | 48 | 30.8% |
| 2-Person Household | 44 | 28.2% |
| 3-Person Household | 16 | 10.3% |
| 4+ Person Household | 48 | 30.8% |
| Total Housing Units | 156 | 100.0% |
Occupancy by Ownership by Household Size in Giltner
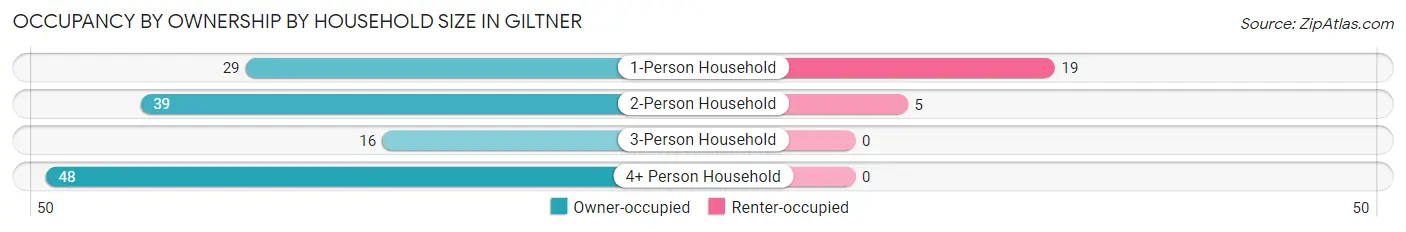
| Household Size | Owner-occupied | Renter-occupied |
| 1-Person Household | 29 (60.4%) | 19 (39.6%) |
| 2-Person Household | 39 (88.6%) | 5 (11.4%) |
| 3-Person Household | 16 (100.0%) | 0 (0.0%) |
| 4+ Person Household | 48 (100.0%) | 0 (0.0%) |
| Total Housing Units | 132 (84.6%) | 24 (15.4%) |
Occupancy by Educational Attainment in Giltner
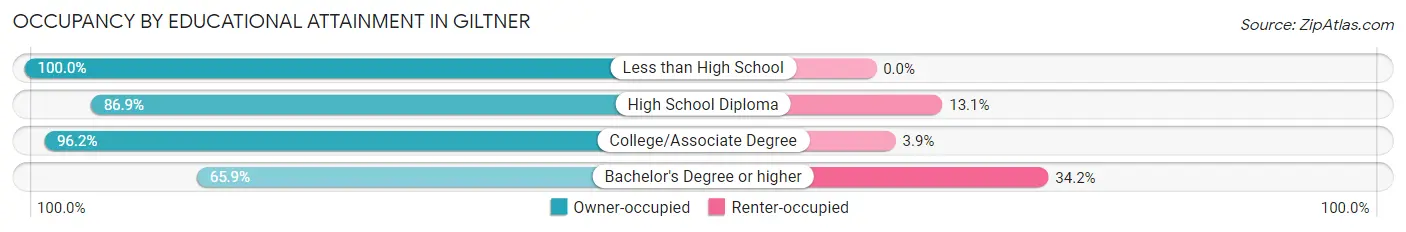
| Household Size | Owner-occupied | Renter-occupied |
| Less than High School | 2 (100.0%) | 0 (0.0%) |
| High School Diploma | 53 (86.9%) | 8 (13.1%) |
| College/Associate Degree | 50 (96.2%) | 2 (3.8%) |
| Bachelor's Degree or higher | 27 (65.8%) | 14 (34.2%) |
Occupancy by Age of Householder in Giltner
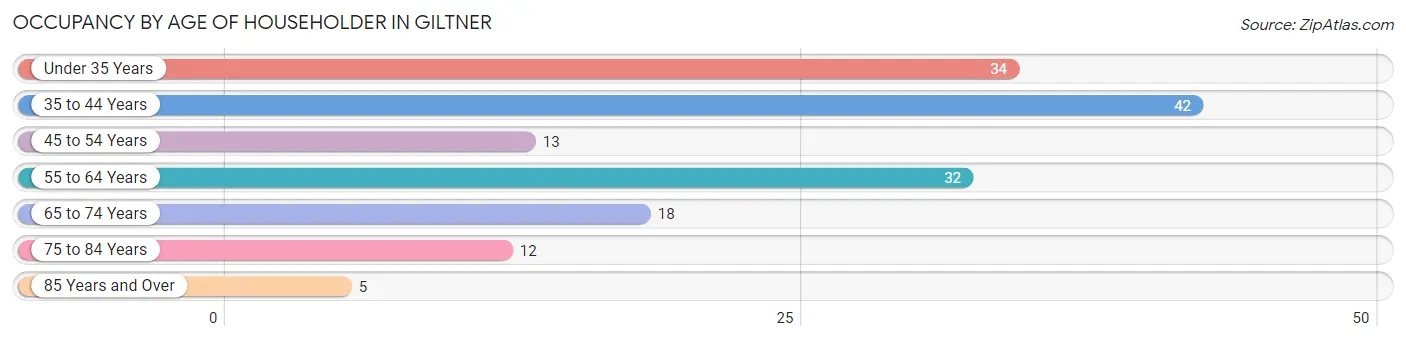
| Age Bracket | # Households | % Households |
| Under 35 Years | 34 | 21.8% |
| 35 to 44 Years | 42 | 26.9% |
| 45 to 54 Years | 13 | 8.3% |
| 55 to 64 Years | 32 | 20.5% |
| 65 to 74 Years | 18 | 11.5% |
| 75 to 84 Years | 12 | 7.7% |
| 85 Years and Over | 5 | 3.2% |
| Total | 156 | 100.0% |
Housing Finances in Giltner
Median Income by Occupancy in Giltner
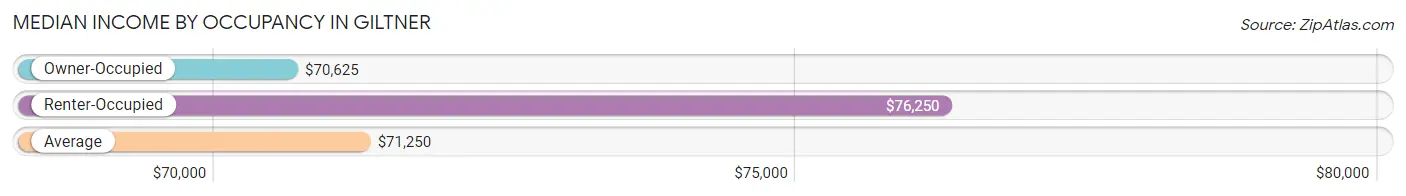
| Occupancy Type | # Households | Median Income |
| Owner-Occupied | 132 (84.6%) | $70,625 |
| Renter-Occupied | 24 (15.4%) | $76,250 |
| Average | 156 (100.0%) | $71,250 |
Occupancy by Householder Income Bracket in Giltner
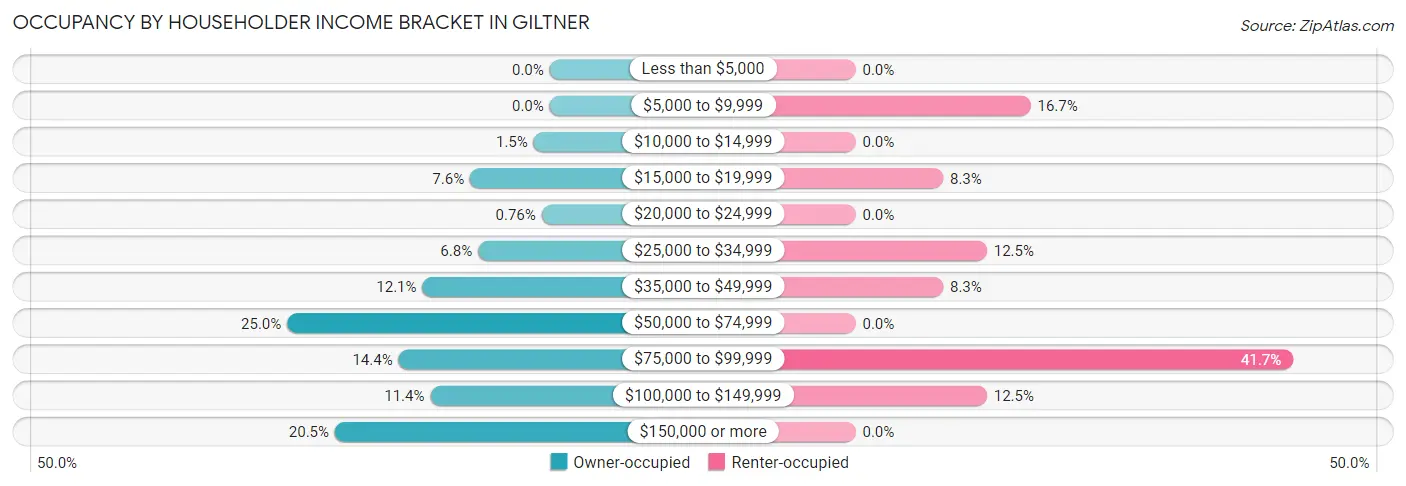
| Income Bracket | Owner-occupied | Renter-occupied |
| Less than $5,000 | 0 (0.0%) | 0 (0.0%) |
| $5,000 to $9,999 | 0 (0.0%) | 4 (16.7%) |
| $10,000 to $14,999 | 2 (1.5%) | 0 (0.0%) |
| $15,000 to $19,999 | 10 (7.6%) | 2 (8.3%) |
| $20,000 to $24,999 | 1 (0.8%) | 0 (0.0%) |
| $25,000 to $34,999 | 9 (6.8%) | 3 (12.5%) |
| $35,000 to $49,999 | 16 (12.1%) | 2 (8.3%) |
| $50,000 to $74,999 | 33 (25.0%) | 0 (0.0%) |
| $75,000 to $99,999 | 19 (14.4%) | 10 (41.7%) |
| $100,000 to $149,999 | 15 (11.4%) | 3 (12.5%) |
| $150,000 or more | 27 (20.4%) | 0 (0.0%) |
| Total | 132 (100.0%) | 24 (100.0%) |
Monthly Housing Cost Tiers in Giltner
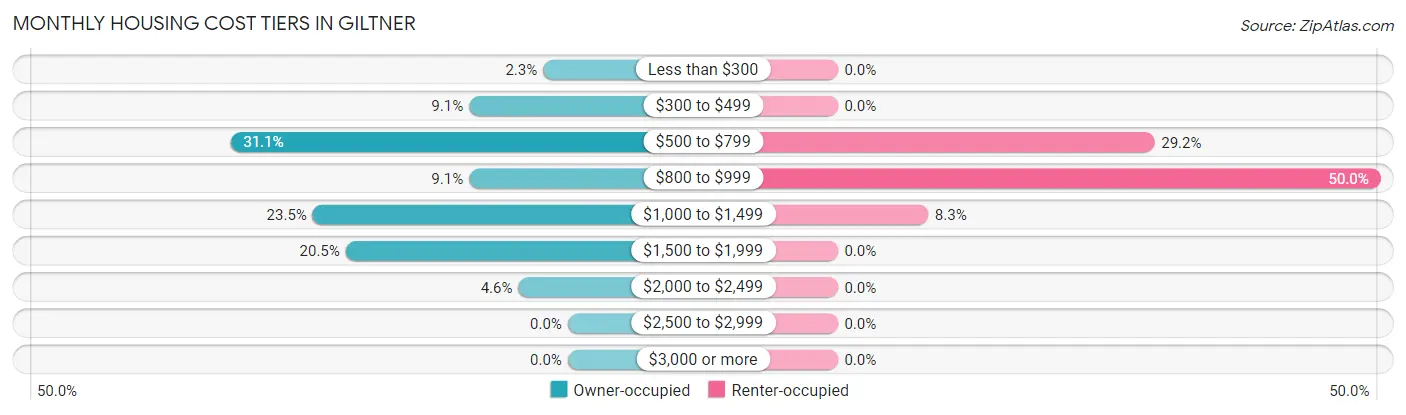
| Monthly Cost | Owner-occupied | Renter-occupied |
| Less than $300 | 3 (2.3%) | 0 (0.0%) |
| $300 to $499 | 12 (9.1%) | 0 (0.0%) |
| $500 to $799 | 41 (31.1%) | 7 (29.2%) |
| $800 to $999 | 12 (9.1%) | 12 (50.0%) |
| $1,000 to $1,499 | 31 (23.5%) | 2 (8.3%) |
| $1,500 to $1,999 | 27 (20.4%) | 0 (0.0%) |
| $2,000 to $2,499 | 6 (4.5%) | 0 (0.0%) |
| $2,500 to $2,999 | 0 (0.0%) | 0 (0.0%) |
| $3,000 or more | 0 (0.0%) | 0 (0.0%) |
| Total | 132 (100.0%) | 24 (100.0%) |
Physical Housing Characteristics in Giltner
Housing Structures in Giltner
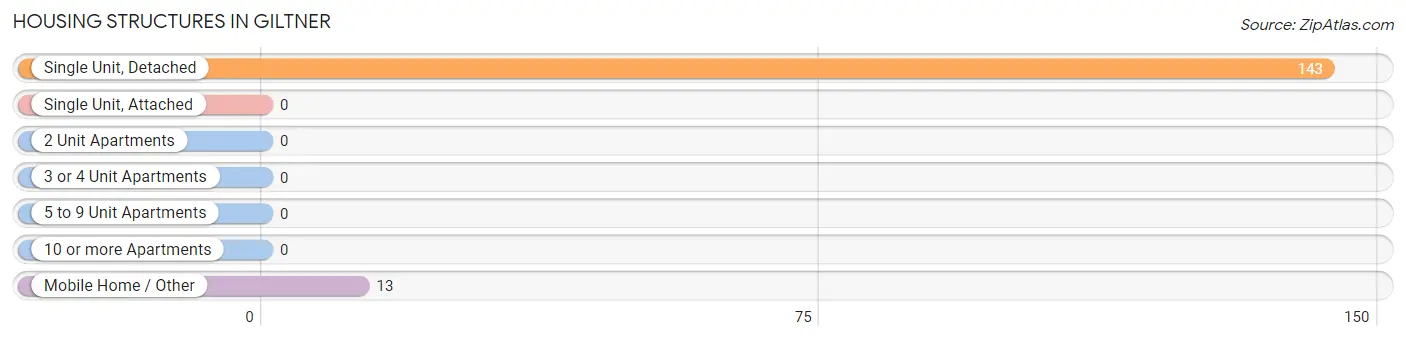
| Structure Type | # Housing Units | % Housing Units |
| Single Unit, Detached | 143 | 91.7% |
| Single Unit, Attached | 0 | 0.0% |
| 2 Unit Apartments | 0 | 0.0% |
| 3 or 4 Unit Apartments | 0 | 0.0% |
| 5 to 9 Unit Apartments | 0 | 0.0% |
| 10 or more Apartments | 0 | 0.0% |
| Mobile Home / Other | 13 | 8.3% |
| Total | 156 | 100.0% |
Housing Structures by Occupancy in Giltner
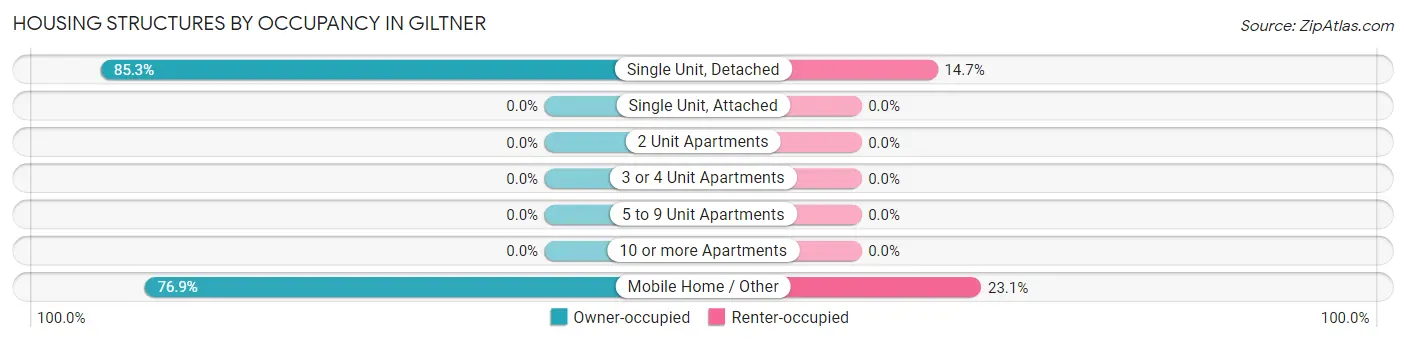
| Structure Type | Owner-occupied | Renter-occupied |
| Single Unit, Detached | 122 (85.3%) | 21 (14.7%) |
| Single Unit, Attached | 0 (0.0%) | 0 (0.0%) |
| 2 Unit Apartments | 0 (0.0%) | 0 (0.0%) |
| 3 or 4 Unit Apartments | 0 (0.0%) | 0 (0.0%) |
| 5 to 9 Unit Apartments | 0 (0.0%) | 0 (0.0%) |
| 10 or more Apartments | 0 (0.0%) | 0 (0.0%) |
| Mobile Home / Other | 10 (76.9%) | 3 (23.1%) |
| Total | 132 (84.6%) | 24 (15.4%) |
Housing Structures by Number of Rooms in Giltner
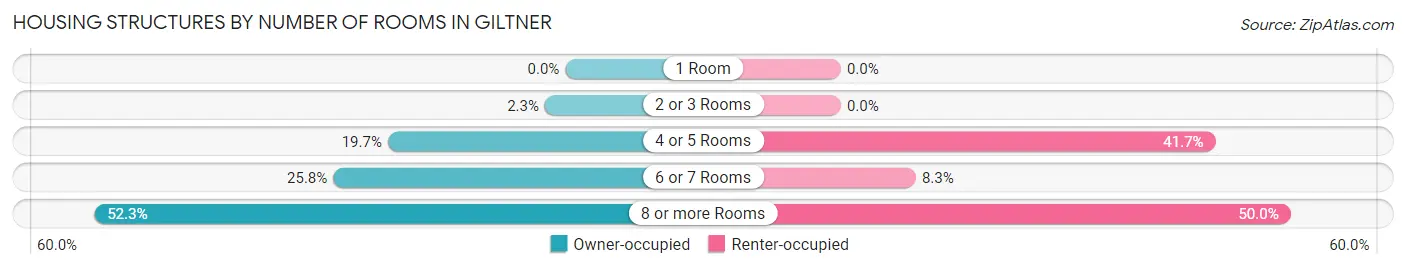
| Number of Rooms | Owner-occupied | Renter-occupied |
| 1 Room | 0 (0.0%) | 0 (0.0%) |
| 2 or 3 Rooms | 3 (2.3%) | 0 (0.0%) |
| 4 or 5 Rooms | 26 (19.7%) | 10 (41.7%) |
| 6 or 7 Rooms | 34 (25.8%) | 2 (8.3%) |
| 8 or more Rooms | 69 (52.3%) | 12 (50.0%) |
| Total | 132 (100.0%) | 24 (100.0%) |
Housing Structure by Heating Type in Giltner
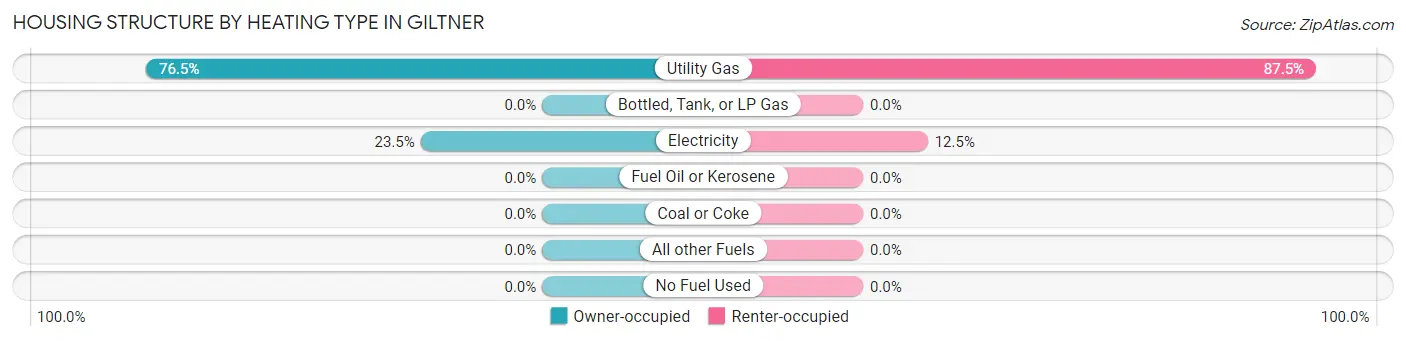
| Heating Type | Owner-occupied | Renter-occupied |
| Utility Gas | 101 (76.5%) | 21 (87.5%) |
| Bottled, Tank, or LP Gas | 0 (0.0%) | 0 (0.0%) |
| Electricity | 31 (23.5%) | 3 (12.5%) |
| Fuel Oil or Kerosene | 0 (0.0%) | 0 (0.0%) |
| Coal or Coke | 0 (0.0%) | 0 (0.0%) |
| All other Fuels | 0 (0.0%) | 0 (0.0%) |
| No Fuel Used | 0 (0.0%) | 0 (0.0%) |
| Total | 132 (100.0%) | 24 (100.0%) |
Household Vehicle Usage in Giltner
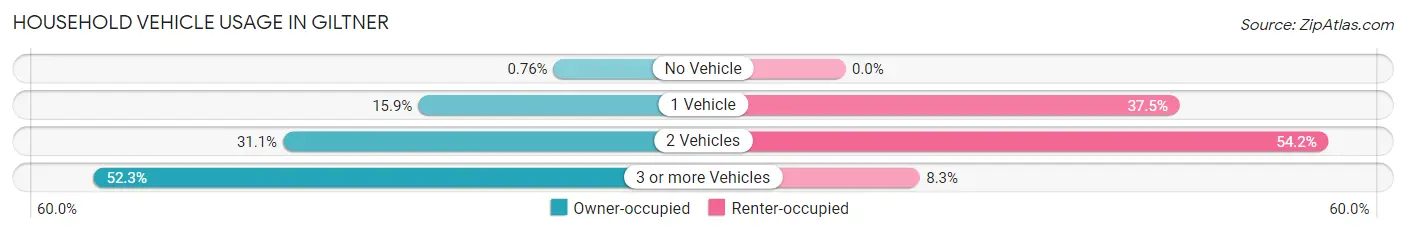
| Vehicles per Household | Owner-occupied | Renter-occupied |
| No Vehicle | 1 (0.8%) | 0 (0.0%) |
| 1 Vehicle | 21 (15.9%) | 9 (37.5%) |
| 2 Vehicles | 41 (31.1%) | 13 (54.2%) |
| 3 or more Vehicles | 69 (52.3%) | 2 (8.3%) |
| Total | 132 (100.0%) | 24 (100.0%) |
Real Estate & Mortgages in Giltner
Real Estate and Mortgage Overview in Giltner
| Characteristic | Without Mortgage | With Mortgage |
| Housing Units | 54 | 78 |
| Median Property Value | $168,800 | $147,100 |
| Median Household Income | $52,500 | $20 |
| Monthly Housing Costs | $586 | $0 |
| Real Estate Taxes | $1,484 | $2 |
Property Value by Mortgage Status in Giltner
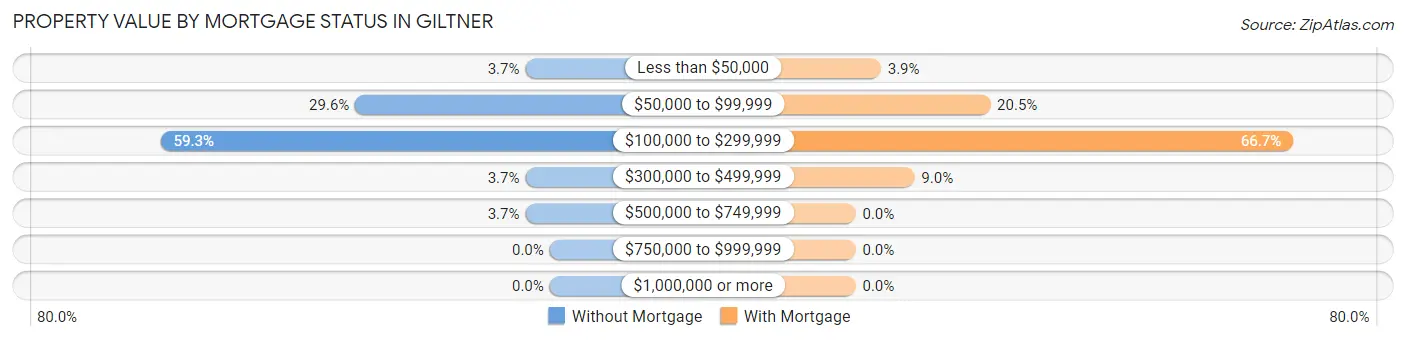
| Property Value | Without Mortgage | With Mortgage |
| Less than $50,000 | 2 (3.7%) | 3 (3.8%) |
| $50,000 to $99,999 | 16 (29.6%) | 16 (20.5%) |
| $100,000 to $299,999 | 32 (59.3%) | 52 (66.7%) |
| $300,000 to $499,999 | 2 (3.7%) | 7 (9.0%) |
| $500,000 to $749,999 | 2 (3.7%) | 0 (0.0%) |
| $750,000 to $999,999 | 0 (0.0%) | 0 (0.0%) |
| $1,000,000 or more | 0 (0.0%) | 0 (0.0%) |
| Total | 54 (100.0%) | 78 (100.0%) |
Household Income by Mortgage Status in Giltner
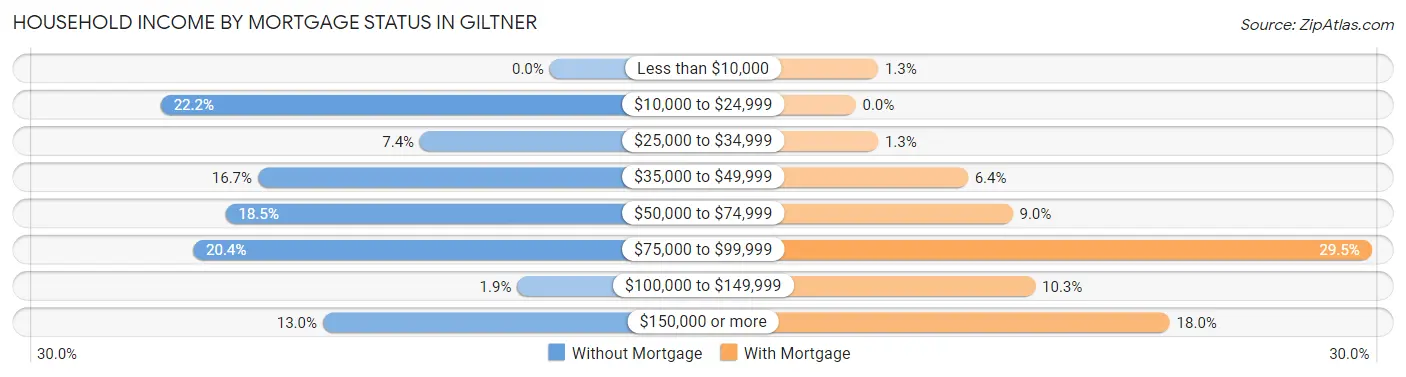
| Household Income | Without Mortgage | With Mortgage |
| Less than $10,000 | 0 (0.0%) | 1 (1.3%) |
| $10,000 to $24,999 | 12 (22.2%) | 0 (0.0%) |
| $25,000 to $34,999 | 4 (7.4%) | 1 (1.3%) |
| $35,000 to $49,999 | 9 (16.7%) | 5 (6.4%) |
| $50,000 to $74,999 | 10 (18.5%) | 7 (9.0%) |
| $75,000 to $99,999 | 11 (20.4%) | 23 (29.5%) |
| $100,000 to $149,999 | 1 (1.8%) | 8 (10.3%) |
| $150,000 or more | 7 (13.0%) | 14 (17.9%) |
| Total | 54 (100.0%) | 78 (100.0%) |
Property Value to Household Income Ratio in Giltner
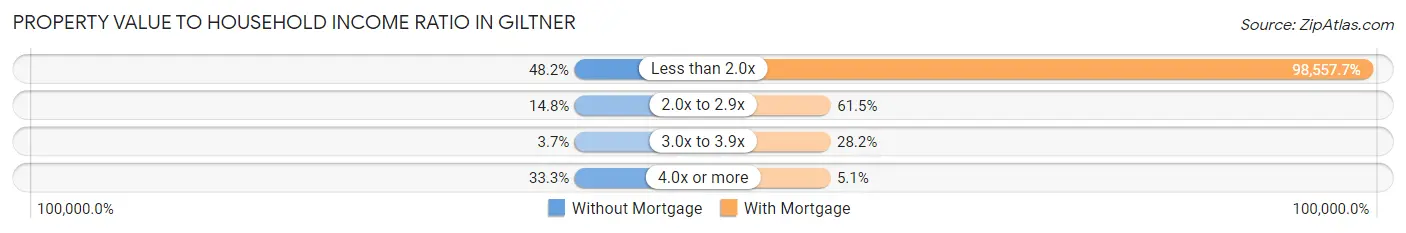
| Value-to-Income Ratio | Without Mortgage | With Mortgage |
| Less than 2.0x | 26 (48.1%) | 76,875 (98,557.7%) |
| 2.0x to 2.9x | 8 (14.8%) | 48 (61.5%) |
| 3.0x to 3.9x | 2 (3.7%) | 22 (28.2%) |
| 4.0x or more | 18 (33.3%) | 4 (5.1%) |
| Total | 54 (100.0%) | 78 (100.0%) |
Real Estate Taxes by Mortgage Status in Giltner
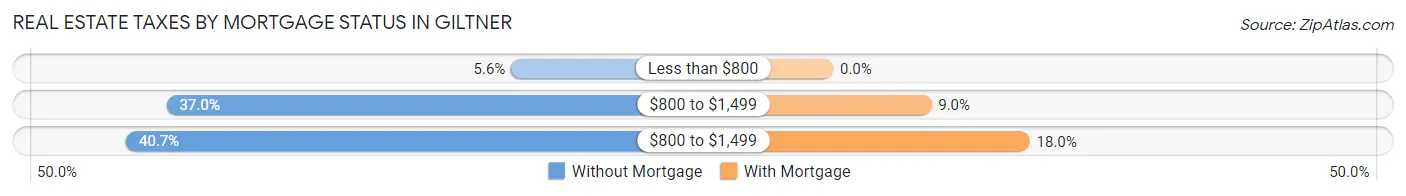
| Property Taxes | Without Mortgage | With Mortgage |
| Less than $800 | 3 (5.6%) | 0 (0.0%) |
| $800 to $1,499 | 20 (37.0%) | 7 (9.0%) |
| $800 to $1,499 | 22 (40.7%) | 14 (17.9%) |
| Total | 54 (100.0%) | 78 (100.0%) |
Health & Disability in Giltner
Health Insurance Coverage by Age in Giltner
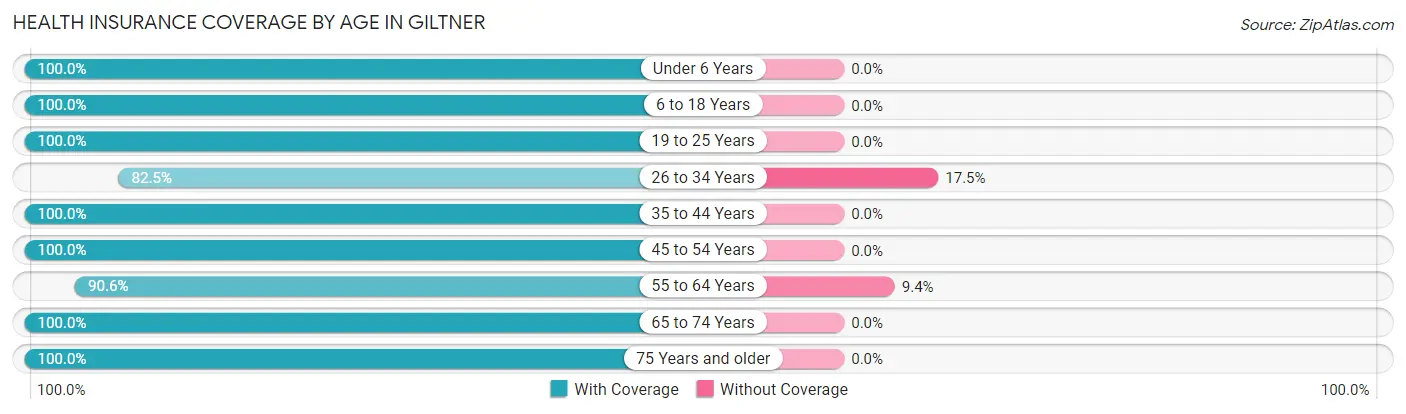
| Age Bracket | With Coverage | Without Coverage |
| Under 6 Years | 25 (100.0%) | 0 (0.0%) |
| 6 to 18 Years | 113 (100.0%) | 0 (0.0%) |
| 19 to 25 Years | 18 (100.0%) | 0 (0.0%) |
| 26 to 34 Years | 47 (82.5%) | 10 (17.5%) |
| 35 to 44 Years | 117 (100.0%) | 0 (0.0%) |
| 45 to 54 Years | 25 (100.0%) | 0 (0.0%) |
| 55 to 64 Years | 48 (90.6%) | 5 (9.4%) |
| 65 to 74 Years | 36 (100.0%) | 0 (0.0%) |
| 75 Years and older | 19 (100.0%) | 0 (0.0%) |
| Total | 448 (96.8%) | 15 (3.2%) |
Health Insurance Coverage by Citizenship Status in Giltner
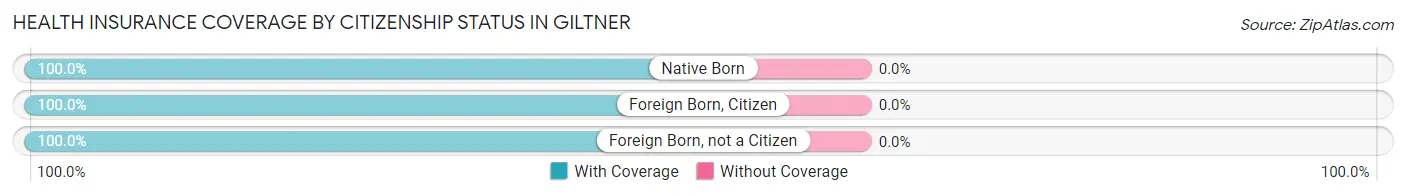
| Citizenship Status | With Coverage | Without Coverage |
| Native Born | 25 (100.0%) | 0 (0.0%) |
| Foreign Born, Citizen | 113 (100.0%) | 0 (0.0%) |
| Foreign Born, not a Citizen | 18 (100.0%) | 0 (0.0%) |
Health Insurance Coverage by Household Income in Giltner
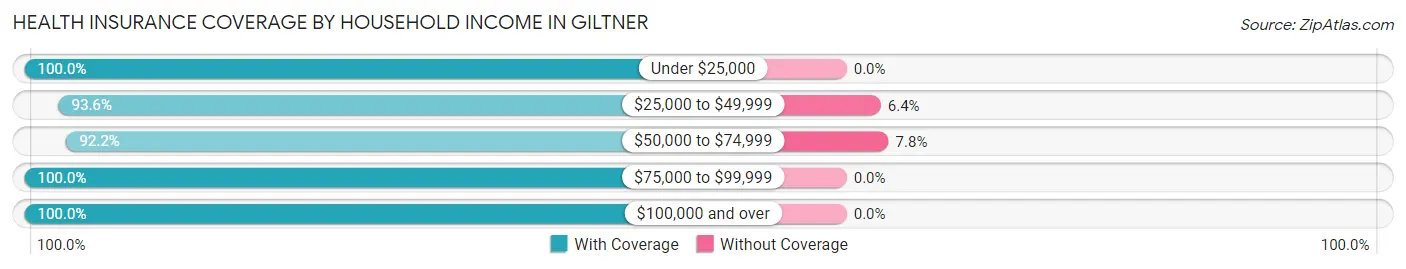
| Household Income | With Coverage | Without Coverage |
| Under $25,000 | 26 (100.0%) | 0 (0.0%) |
| $25,000 to $49,999 | 44 (93.6%) | 3 (6.4%) |
| $50,000 to $74,999 | 141 (92.2%) | 12 (7.8%) |
| $75,000 to $99,999 | 71 (100.0%) | 0 (0.0%) |
| $100,000 and over | 166 (100.0%) | 0 (0.0%) |
Public vs Private Health Insurance Coverage by Age in Giltner
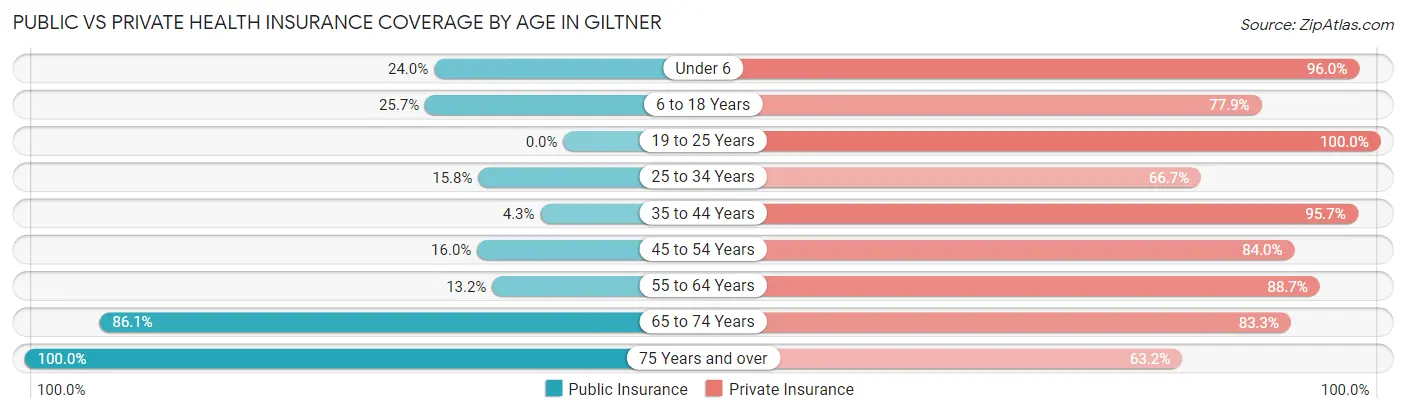
| Age Bracket | Public Insurance | Private Insurance |
| Under 6 | 6 (24.0%) | 24 (96.0%) |
| 6 to 18 Years | 29 (25.7%) | 88 (77.9%) |
| 19 to 25 Years | 0 (0.0%) | 18 (100.0%) |
| 25 to 34 Years | 9 (15.8%) | 38 (66.7%) |
| 35 to 44 Years | 5 (4.3%) | 112 (95.7%) |
| 45 to 54 Years | 4 (16.0%) | 21 (84.0%) |
| 55 to 64 Years | 7 (13.2%) | 47 (88.7%) |
| 65 to 74 Years | 31 (86.1%) | 30 (83.3%) |
| 75 Years and over | 19 (100.0%) | 12 (63.2%) |
| Total | 110 (23.8%) | 390 (84.2%) |
Disability Status by Sex by Age in Giltner
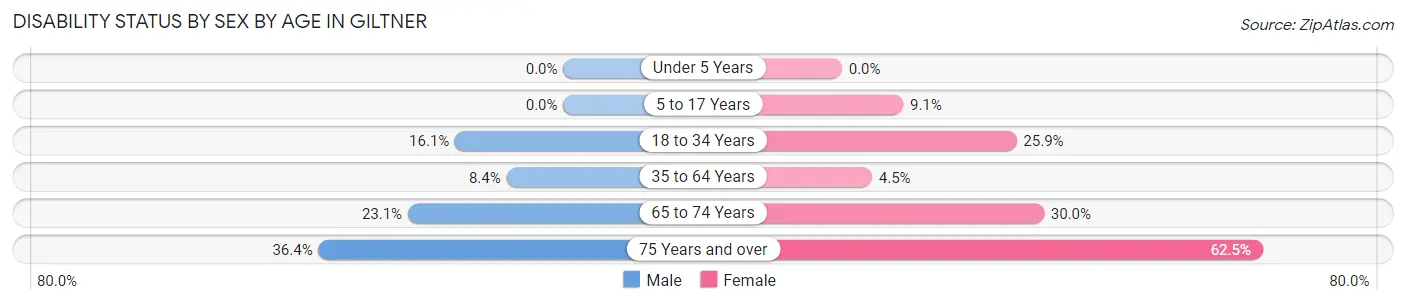
| Age Bracket | Male | Female |
| Under 5 Years | 0 (0.0%) | 0 (0.0%) |
| 5 to 17 Years | 0 (0.0%) | 5 (9.1%) |
| 18 to 34 Years | 9 (16.1%) | 7 (25.9%) |
| 35 to 64 Years | 7 (8.4%) | 5 (4.5%) |
| 65 to 74 Years | 6 (23.1%) | 3 (30.0%) |
| 75 Years and over | 4 (36.4%) | 5 (62.5%) |
Disability Class by Sex by Age in Giltner
Disability Class: Hearing Difficulty
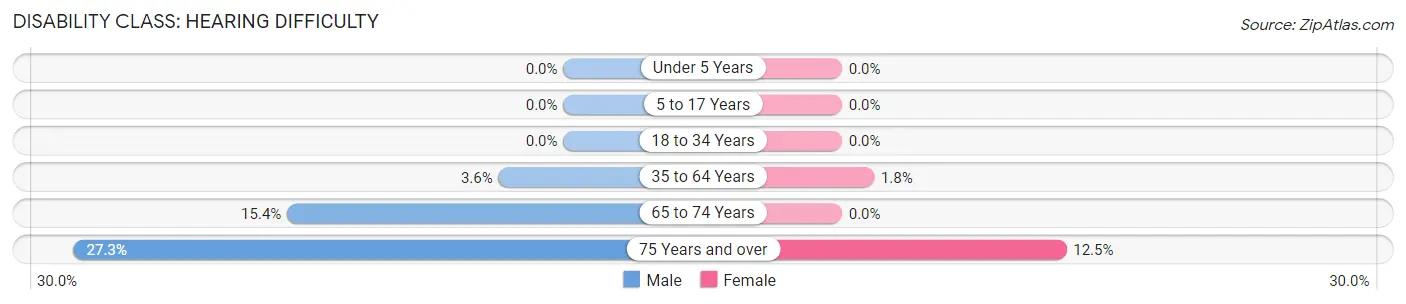
| Age Bracket | Male | Female |
| Under 5 Years | 0 (0.0%) | 0 (0.0%) |
| 5 to 17 Years | 0 (0.0%) | 0 (0.0%) |
| 18 to 34 Years | 0 (0.0%) | 0 (0.0%) |
| 35 to 64 Years | 3 (3.6%) | 2 (1.8%) |
| 65 to 74 Years | 4 (15.4%) | 0 (0.0%) |
| 75 Years and over | 3 (27.3%) | 1 (12.5%) |
Disability Class: Vision Difficulty
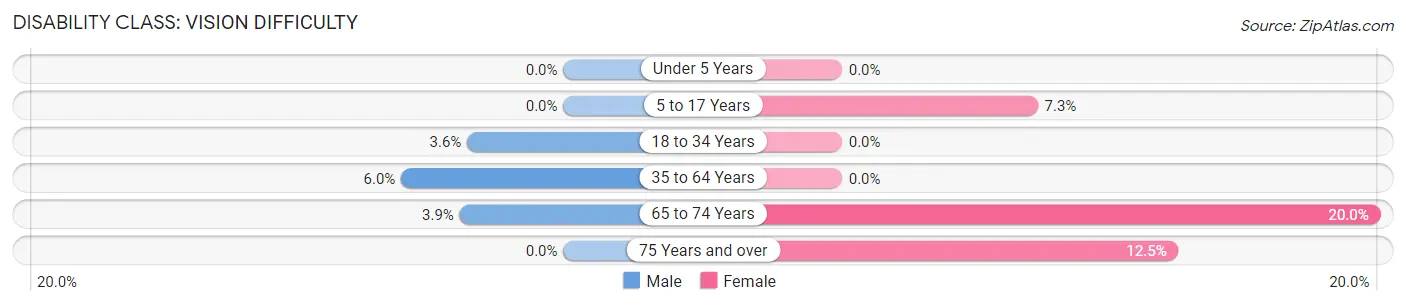
| Age Bracket | Male | Female |
| Under 5 Years | 0 (0.0%) | 0 (0.0%) |
| 5 to 17 Years | 0 (0.0%) | 4 (7.3%) |
| 18 to 34 Years | 2 (3.6%) | 0 (0.0%) |
| 35 to 64 Years | 5 (6.0%) | 0 (0.0%) |
| 65 to 74 Years | 1 (3.8%) | 2 (20.0%) |
| 75 Years and over | 0 (0.0%) | 1 (12.5%) |
Disability Class: Cognitive Difficulty
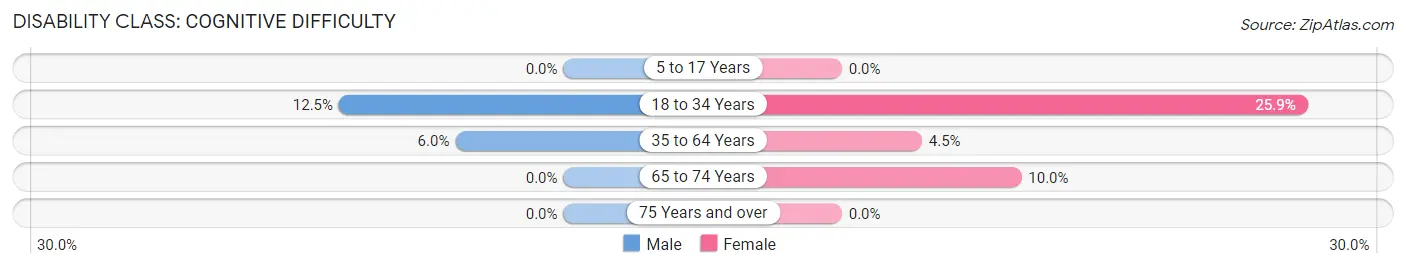
| Age Bracket | Male | Female |
| 5 to 17 Years | 0 (0.0%) | 0 (0.0%) |
| 18 to 34 Years | 7 (12.5%) | 7 (25.9%) |
| 35 to 64 Years | 5 (6.0%) | 5 (4.5%) |
| 65 to 74 Years | 0 (0.0%) | 1 (10.0%) |
| 75 Years and over | 0 (0.0%) | 0 (0.0%) |
Disability Class: Ambulatory Difficulty
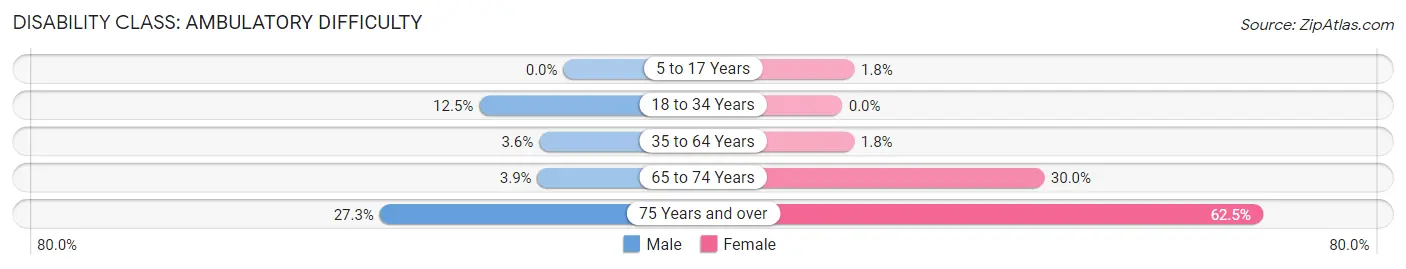
| Age Bracket | Male | Female |
| 5 to 17 Years | 0 (0.0%) | 1 (1.8%) |
| 18 to 34 Years | 7 (12.5%) | 0 (0.0%) |
| 35 to 64 Years | 3 (3.6%) | 2 (1.8%) |
| 65 to 74 Years | 1 (3.8%) | 3 (30.0%) |
| 75 Years and over | 3 (27.3%) | 5 (62.5%) |
Disability Class: Self-Care Difficulty
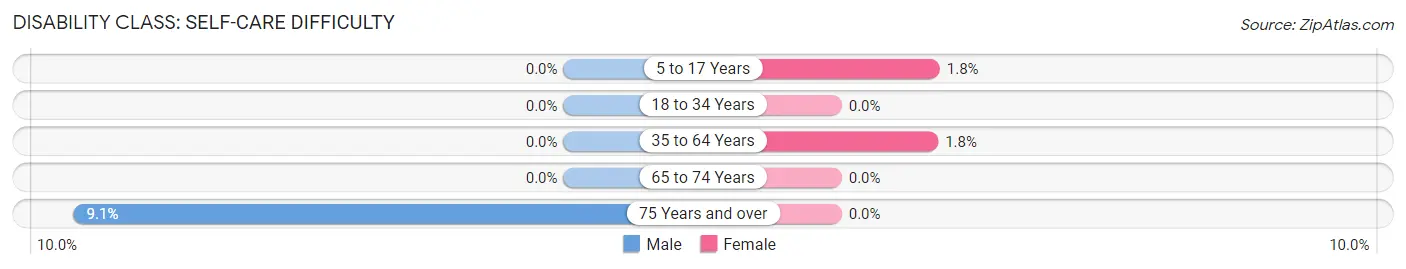
| Age Bracket | Male | Female |
| 5 to 17 Years | 0 (0.0%) | 1 (1.8%) |
| 18 to 34 Years | 0 (0.0%) | 0 (0.0%) |
| 35 to 64 Years | 0 (0.0%) | 2 (1.8%) |
| 65 to 74 Years | 0 (0.0%) | 0 (0.0%) |
| 75 Years and over | 1 (9.1%) | 0 (0.0%) |
Technology Access in Giltner
Computing Device Access in Giltner
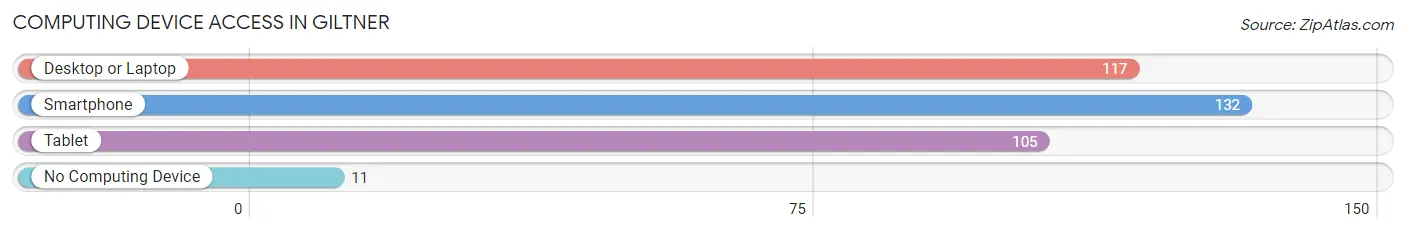
| Device Type | # Households | % Households |
| Desktop or Laptop | 117 | 75.0% |
| Smartphone | 132 | 84.6% |
| Tablet | 105 | 67.3% |
| No Computing Device | 11 | 7.0% |
| Total | 156 | 100.0% |
Internet Access in Giltner
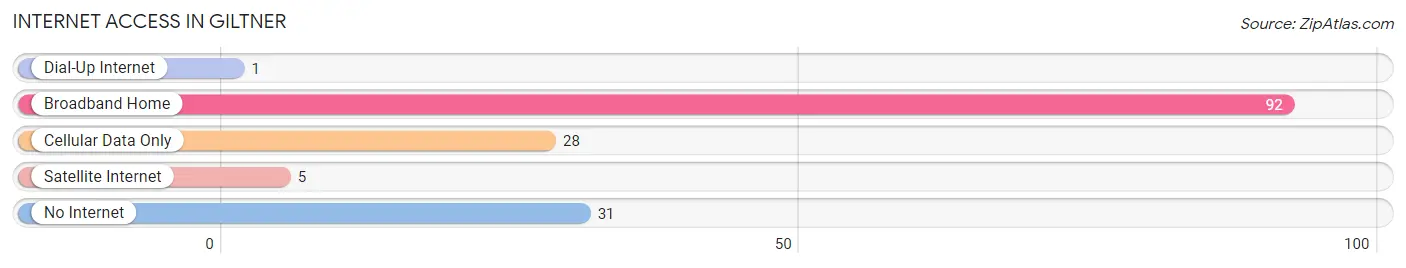
| Internet Type | # Households | % Households |
| Dial-Up Internet | 1 | 0.6% |
| Broadband Home | 92 | 59.0% |
| Cellular Data Only | 28 | 17.9% |
| Satellite Internet | 5 | 3.2% |
| No Internet | 31 | 19.9% |
| Total | 156 | 100.0% |
Giltner Summary
Giltner is a small village located in Hamilton County, Nebraska. It is situated in the south-central part of the state, approximately 30 miles northwest of Grand Island. The village has a population of approximately 300 people, and is part of the Grand Island metropolitan area.
History
Giltner was founded in 1887 by a group of settlers from Germany. The village was named after a local landowner, John Giltner. The settlers were attracted to the area due to its fertile soil and abundant water supply.
The village was incorporated in 1891 and quickly grew to become a thriving agricultural community. The first post office was established in 1892, and the first school was built in 1895.
In the early 1900s, Giltner was a bustling community with a variety of businesses, including a bank, a hotel, a blacksmith shop, a livery stable, and a general store. The village also had a newspaper, the Giltner Gazette, which was published from 1902 to 1910.
Geography
Giltner is located in the south-central part of Nebraska, approximately 30 miles northwest of Grand Island. The village is situated in the Platte River Valley, which is known for its fertile soil and abundant water supply.
The village is surrounded by rolling hills and farmland. The nearest major city is Grand Island, which is located approximately 30 miles to the southeast.
Economy
The economy of Giltner is largely based on agriculture. The village is surrounded by fertile farmland, and the local economy is heavily dependent on the production of corn, soybeans, and other crops.
In addition to agriculture, Giltner also has a few small businesses, including a gas station, a grocery store, and a restaurant.
Demographics
As of the 2010 census, Giltner had a population of 300 people. The racial makeup of the village was 97.3% White, 0.7% Native American, 0.3% Asian, and 1.7% from two or more races.
The median household income in Giltner was $45,000, and the median family income was $50,000. The per capita income was $20,000. Approximately 10.7% of the population was below the poverty line.
Conclusion
Giltner is a small village located in Hamilton County, Nebraska. It was founded in 1887 by a group of settlers from Germany, and has since grown to become a thriving agricultural community. The village is surrounded by rolling hills and farmland, and the local economy is largely based on the production of corn, soybeans, and other crops. Giltner has a population of approximately 300 people, and the median household income is $45,000.
Common Questions
What is Per Capita Income in Giltner?
Per Capita income in Giltner is $34,359.
What is the Median Family Income in Giltner?
Median Family Income in Giltner is $76,563.
What is the Median Household income in Giltner?
Median Household Income in Giltner is $71,250.
What is Income or Wage Gap in Giltner?
Income or Wage Gap in Giltner is 45.6%.
Women in Giltner earn 54.4 cents for every dollar earned by a man.
What is Inequality or Gini Index in Giltner?
Inequality or Gini Index in Giltner is 0.43.
What is the Total Population of Giltner?
Total Population of Giltner is 463.
What is the Total Male Population of Giltner?
Total Male Population of Giltner is 244.
What is the Total Female Population of Giltner?
Total Female Population of Giltner is 219.
What is the Ratio of Males per 100 Females in Giltner?
There are 111.42 Males per 100 Females in Giltner.
What is the Ratio of Females per 100 Males in Giltner?
There are 89.75 Females per 100 Males in Giltner.
What is the Median Population Age in Giltner?
Median Population Age in Giltner is 38.4 Years.
What is the Average Family Size in Giltner
Average Family Size in Giltner is 3.4 People.
What is the Average Household Size in Giltner
Average Household Size in Giltner is 3.0 People.
How Large is the Labor Force in Giltner?
There are 258 People in the Labor Forcein in Giltner.
What is the Percentage of People in the Labor Force in Giltner?
71.7% of People are in the Labor Force in Giltner.
What is the Unemployment Rate in Giltner?
Unemployment Rate in Giltner is 2.7%.