Gandy, NE Map & Demographics
Gandy Map
Gandy Overview
$27,100
PER CAPITA INCOME
$61,250
AVG FAMILY INCOME
$42,917
AVG HOUSEHOLD INCOME
0.41
INEQUALITY / GINI INDEX
26
TOTAL POPULATION
10
MALE POPULATION
16
FEMALE POPULATION
62.50
MALES / 100 FEMALES
160.00
FEMALES / 100 MALES
60.0
MEDIAN AGE
3.2
AVG FAMILY SIZE
2.0
AVG HOUSEHOLD SIZE
11
LABOR FORCE [ PEOPLE ]
55.0%
PERCENT IN LABOR FORCE
Income in Gandy
Income Overview in Gandy
Per Capita Income in Gandy is $27,100, while median incomes of families and households are $61,250 and $42,917 respectively.
| Characteristic | Number | Measure |
| Per Capita Income | 26 | $27,100 |
| Median Family Income | 6 | $61,250 |
| Mean Family Income | 6 | $78,483 |
| Median Household Income | 13 | $42,917 |
| Mean Household Income | 13 | $53,531 |
| Income Deficit | 6 | $0 |
| Wage / Income Gap (%) | 26 | 0.00% |
| Wage / Income Gap ($) | 26 | 100.00¢ per $1 |
| Gini / Inequality Index | 26 | 0.41 |
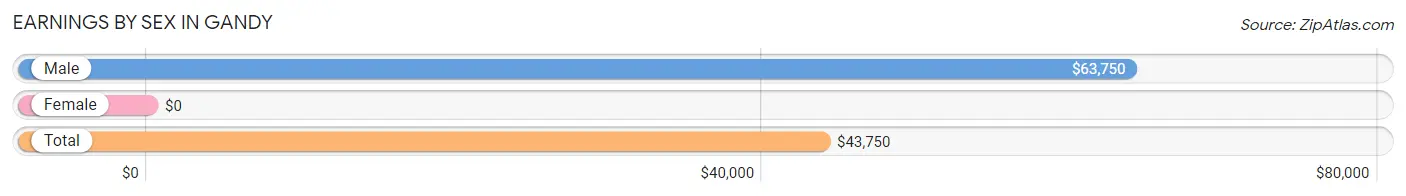
Earnings by Sex in Gandy
| Sex | Number | Average Earnings |
| Male | 4 (36.4%) | $63,750 |
| Female | 7 (63.6%) | $0 |
| Total | 11 (100.0%) | $43,750 |
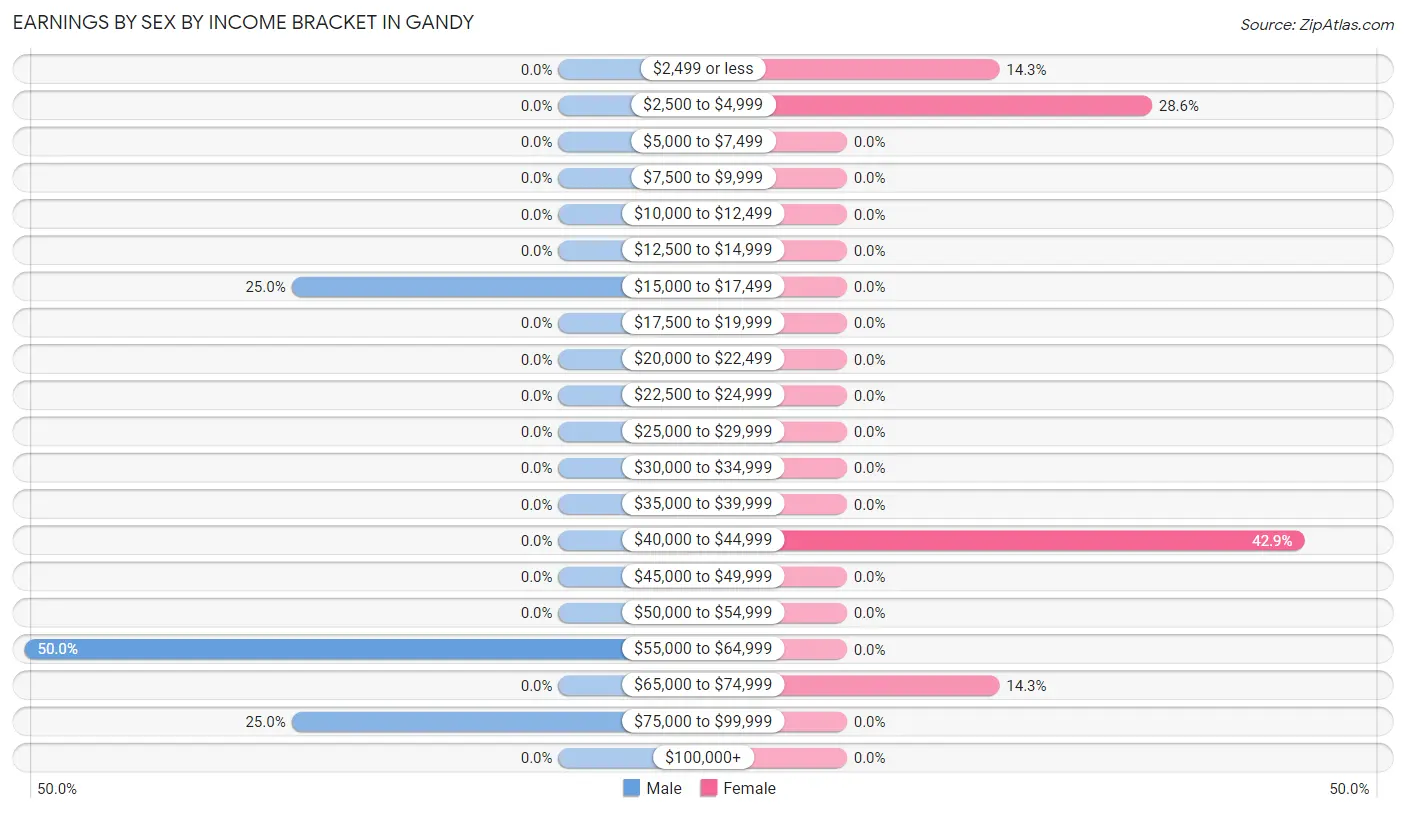
Earnings by Sex by Income Bracket in Gandy
The most common earnings brackets in Gandy are $55,000 to $64,999 for men (2 | 50.0%) and $40,000 to $44,999 for women (3 | 42.9%).
| Income | Male | Female |
| $2,499 or less | 0 (0.0%) | 1 (14.3%) |
| $2,500 to $4,999 | 0 (0.0%) | 2 (28.6%) |
| $5,000 to $7,499 | 0 (0.0%) | 0 (0.0%) |
| $7,500 to $9,999 | 0 (0.0%) | 0 (0.0%) |
| $10,000 to $12,499 | 0 (0.0%) | 0 (0.0%) |
| $12,500 to $14,999 | 0 (0.0%) | 0 (0.0%) |
| $15,000 to $17,499 | 1 (25.0%) | 0 (0.0%) |
| $17,500 to $19,999 | 0 (0.0%) | 0 (0.0%) |
| $20,000 to $22,499 | 0 (0.0%) | 0 (0.0%) |
| $22,500 to $24,999 | 0 (0.0%) | 0 (0.0%) |
| $25,000 to $29,999 | 0 (0.0%) | 0 (0.0%) |
| $30,000 to $34,999 | 0 (0.0%) | 0 (0.0%) |
| $35,000 to $39,999 | 0 (0.0%) | 0 (0.0%) |
| $40,000 to $44,999 | 0 (0.0%) | 3 (42.9%) |
| $45,000 to $49,999 | 0 (0.0%) | 0 (0.0%) |
| $50,000 to $54,999 | 0 (0.0%) | 0 (0.0%) |
| $55,000 to $64,999 | 2 (50.0%) | 0 (0.0%) |
| $65,000 to $74,999 | 0 (0.0%) | 1 (14.3%) |
| $75,000 to $99,999 | 1 (25.0%) | 0 (0.0%) |
| $100,000+ | 0 (0.0%) | 0 (0.0%) |
| Total | 4 (100.0%) | 7 (100.0%) |
Earnings by Sex by Educational Attainment in Gandy
| Educational Attainment | Male Income | Female Income |
| Less than High School | - | - |
| High School Diploma | - | - |
| College or Associate's Degree | - | - |
| Bachelor's Degree | - | - |
| Graduate Degree | - | - |
| Total | $63,750 | $0 |
Family Income in Gandy
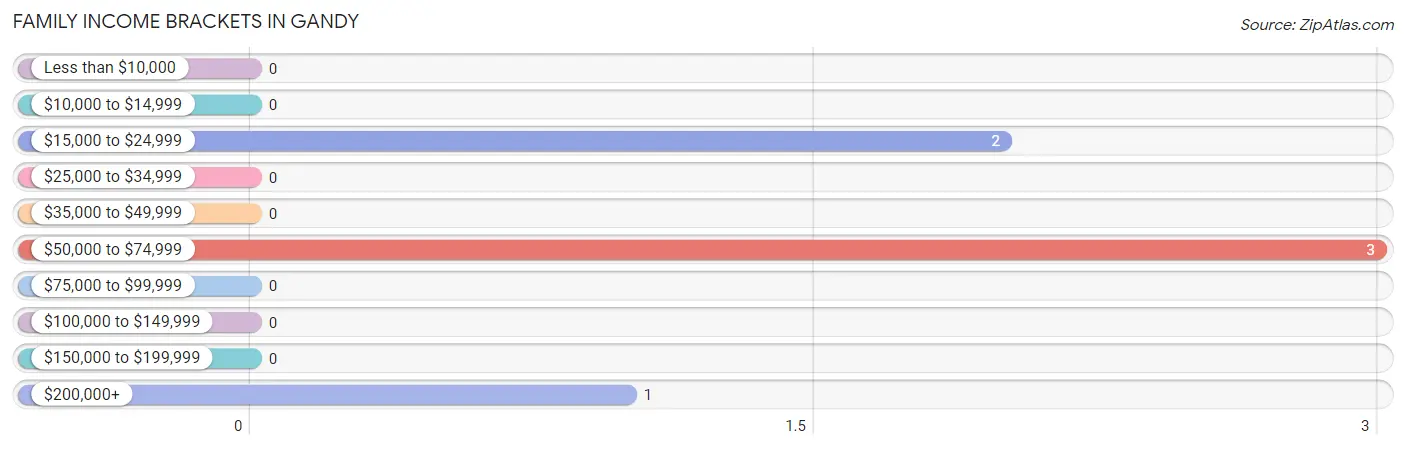
Family Income Brackets in Gandy
According to the Gandy family income data, there are 3 families falling into the $50,000 to $74,999 income range, which is the most common income bracket and makes up 50.0% of all families.
| Income Bracket | # Families | % Families |
| Less than $10,000 | 0 | 0.0% |
| $10,000 to $14,999 | 0 | 0.0% |
| $15,000 to $24,999 | 2 | 33.3% |
| $25,000 to $34,999 | 0 | 0.0% |
| $35,000 to $49,999 | 0 | 0.0% |
| $50,000 to $74,999 | 3 | 50.0% |
| $75,000 to $99,999 | 0 | 0.0% |
| $100,000 to $149,999 | 0 | 0.0% |
| $150,000 to $199,999 | 0 | 0.0% |
| $200,000+ | 1 | 16.7% |
Family Income by Famaliy Size in Gandy
| Income Bracket | # Families | Median Income |
| 2-Person Families | 4 (66.7%) | $0 |
| 3-Person Families | 0 (0.0%) | $0 |
| 4-Person Families | 0 (0.0%) | $0 |
| 5-Person Families | 0 (0.0%) | $0 |
| 6-Person Families | 0 (0.0%) | $0 |
| 7+ Person Families | 2 (33.3%) | $0 |
| Total | 6 (100.0%) | $61,250 |
Family Income by Number of Earners in Gandy
| Number of Earners | # Families | Median Income |
| No Earners | 2 (33.3%) | $0 |
| 1 Earner | 1 (16.7%) | $0 |
| 2 Earners | 3 (50.0%) | $0 |
| 3+ Earners | 0 (0.0%) | $0 |
| Total | 6 (100.0%) | $61,250 |
Household Income in Gandy
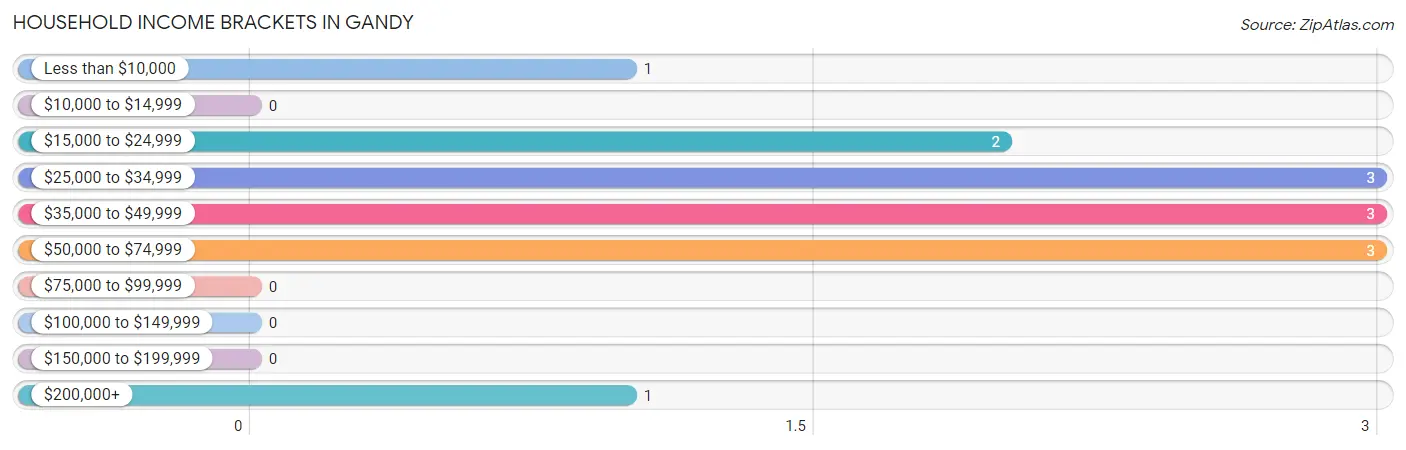
Household Income Brackets in Gandy
With 3 households falling in the category, the $25,000 to $34,999 income range is the most frequent in Gandy, accounting for 23.1% of all households.
| Income Bracket | # Households | % Households |
| Less than $10,000 | 1 | 7.7% |
| $10,000 to $14,999 | 0 | 0.0% |
| $15,000 to $24,999 | 2 | 15.4% |
| $25,000 to $34,999 | 3 | 23.1% |
| $35,000 to $49,999 | 3 | 23.1% |
| $50,000 to $74,999 | 3 | 23.1% |
| $75,000 to $99,999 | 0 | 0.0% |
| $100,000 to $149,999 | 0 | 0.0% |
| $150,000 to $199,999 | 0 | 0.0% |
| $200,000+ | 1 | 7.7% |
Household Income by Householder Age in Gandy
The median household income in Gandy is $42,917, with the highest median household income of $30,417 found in the 65+ years age bracket for the primary householder. A total of 7 households (53.8%) fall into this category.
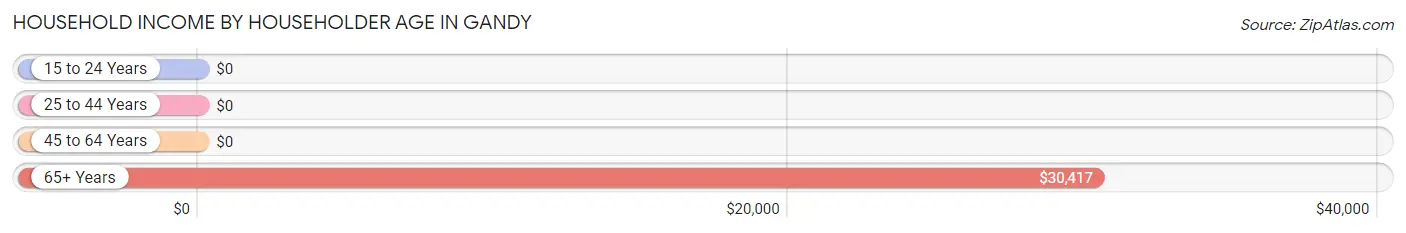
| Income Bracket | # Households | Median Income |
| 15 to 24 Years | 0 (0.0%) | $0 |
| 25 to 44 Years | 2 (15.4%) | $0 |
| 45 to 64 Years | 4 (30.8%) | $0 |
| 65+ Years | 7 (53.8%) | $30,417 |
| Total | 13 (100.0%) | $42,917 |
Poverty in Gandy
Income Below Poverty by Sex and Age in Gandy
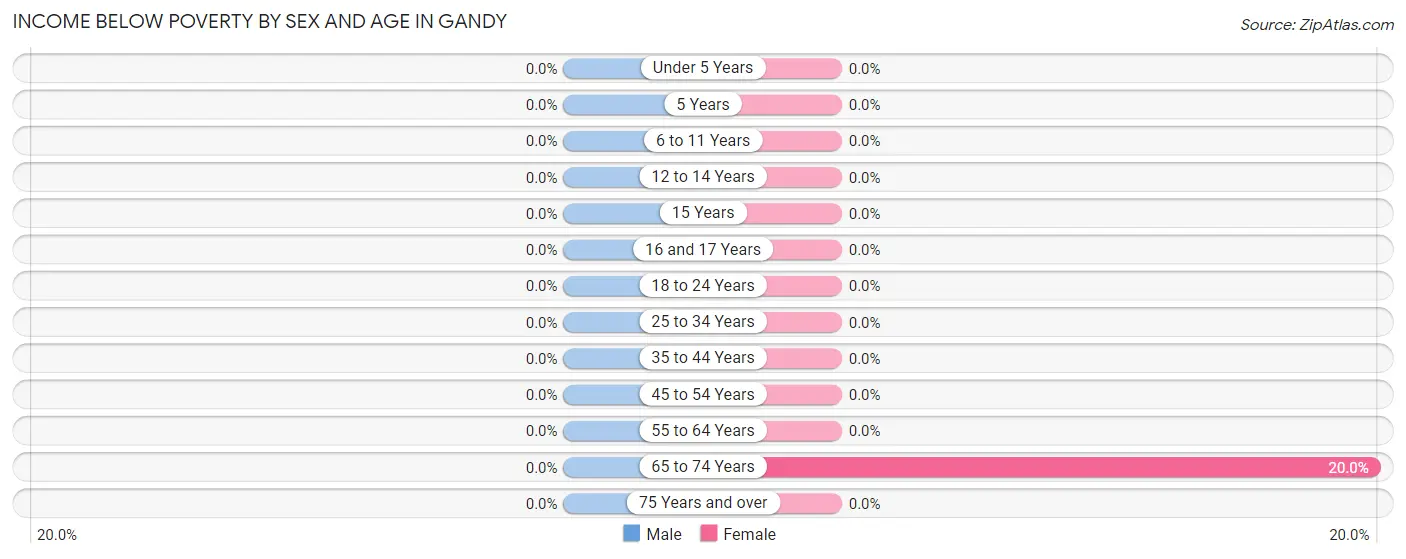
| Age Bracket | Male | Female |
| Under 5 Years | 0 (0.0%) | 0 (0.0%) |
| 5 Years | 0 (0.0%) | 0 (0.0%) |
| 6 to 11 Years | 0 (0.0%) | 0 (0.0%) |
| 12 to 14 Years | 0 (0.0%) | 0 (0.0%) |
| 15 Years | 0 (0.0%) | 0 (0.0%) |
| 16 and 17 Years | 0 (0.0%) | 0 (0.0%) |
| 18 to 24 Years | 0 (0.0%) | 0 (0.0%) |
| 25 to 34 Years | 0 (0.0%) | 0 (0.0%) |
| 35 to 44 Years | 0 (0.0%) | 0 (0.0%) |
| 45 to 54 Years | 0 (0.0%) | 0 (0.0%) |
| 55 to 64 Years | 0 (0.0%) | 0 (0.0%) |
| 65 to 74 Years | 0 (0.0%) | 1 (20.0%) |
| 75 Years and over | 0 (0.0%) | 0 (0.0%) |
| Total | 0 (0.0%) | 1 (6.2%) |
Income Above Poverty by Sex and Age in Gandy
According to the poverty statistics in Gandy, males aged under 5 years and females aged 6 to 11 years are the age groups that are most secure financially, with 100.0% of males and 100.0% of females in these age groups living above the poverty line.
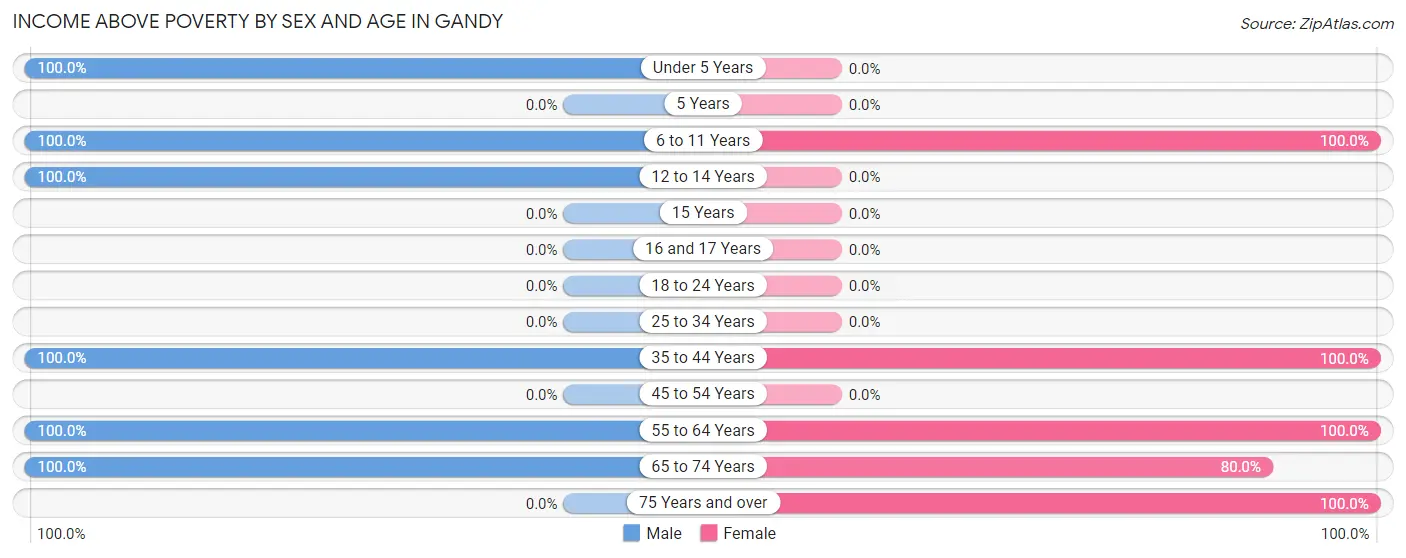
| Age Bracket | Male | Female |
| Under 5 Years | 1 (100.0%) | 0 (0.0%) |
| 5 Years | 0 (0.0%) | 0 (0.0%) |
| 6 to 11 Years | 2 (100.0%) | 2 (100.0%) |
| 12 to 14 Years | 1 (100.0%) | 0 (0.0%) |
| 15 Years | 0 (0.0%) | 0 (0.0%) |
| 16 and 17 Years | 0 (0.0%) | 0 (0.0%) |
| 18 to 24 Years | 0 (0.0%) | 0 (0.0%) |
| 25 to 34 Years | 0 (0.0%) | 0 (0.0%) |
| 35 to 44 Years | 2 (100.0%) | 2 (100.0%) |
| 45 to 54 Years | 0 (0.0%) | 0 (0.0%) |
| 55 to 64 Years | 1 (100.0%) | 4 (100.0%) |
| 65 to 74 Years | 3 (100.0%) | 4 (80.0%) |
| 75 Years and over | 0 (0.0%) | 3 (100.0%) |
| Total | 10 (100.0%) | 15 (93.8%) |
Income Below Poverty Among Married-Couple Families in Gandy
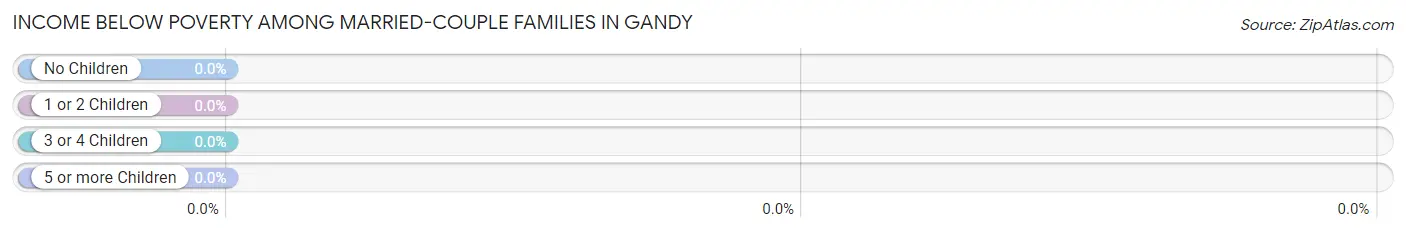
| Children | Above Poverty | Below Poverty |
| No Children | 4 (100.0%) | 0 (0.0%) |
| 1 or 2 Children | 0 (0.0%) | 0 (0.0%) |
| 3 or 4 Children | 0 (0.0%) | 0 (0.0%) |
| 5 or more Children | 2 (100.0%) | 0 (0.0%) |
| Total | 6 (100.0%) | 0 (0.0%) |
Income Below Poverty Among Single-Parent Households in Gandy
| Children | Single Father | Single Mother |
| No Children | 0 (0.0%) | 0 (0.0%) |
| 1 or 2 Children | 0 (0.0%) | 0 (0.0%) |
| 3 or 4 Children | 0 (0.0%) | 0 (0.0%) |
| 5 or more Children | 0 (0.0%) | 0 (0.0%) |
| Total | 0 (0.0%) | 0 (0.0%) |
Income Below Poverty Among Married-Couple vs Single-Parent Households in Gandy
| Children | Married-Couple Families | Single-Parent Households |
| No Children | 0 (0.0%) | 0 (0.0%) |
| 1 or 2 Children | 0 (0.0%) | 0 (0.0%) |
| 3 or 4 Children | 0 (0.0%) | 0 (0.0%) |
| 5 or more Children | 0 (0.0%) | 0 (0.0%) |
| Total | 0 (0.0%) | 0 (0.0%) |
Race in Gandy
The most populous races in Gandy are , and White / Caucasian (26 | 100.0%).
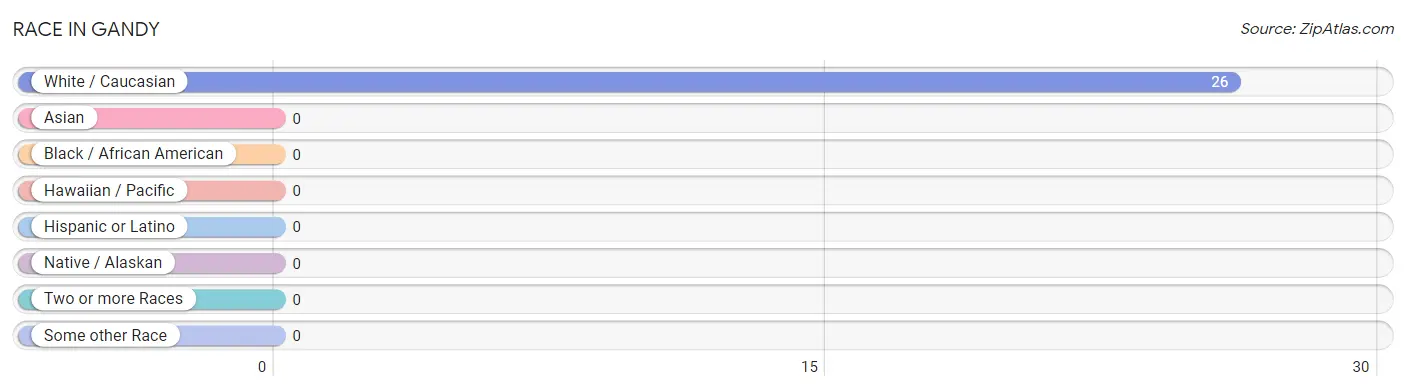
| Race | # Population | % Population |
| Asian | 0 | 0.0% |
| Black / African American | 0 | 0.0% |
| Hawaiian / Pacific | 0 | 0.0% |
| Hispanic or Latino | 0 | 0.0% |
| Native / Alaskan | 0 | 0.0% |
| White / Caucasian | 26 | 100.0% |
| Two or more Races | 0 | 0.0% |
| Some other Race | 0 | 0.0% |
| Total | 26 | 100.0% |
Ancestry in Gandy
The most populous ancestries reported in Gandy are German (17 | 65.4%), English (12 | 46.2%), Irish (4 | 15.4%), Swedish (3 | 11.5%), and French Canadian (2 | 7.7%), together accounting for 146.1% of all Gandy residents.
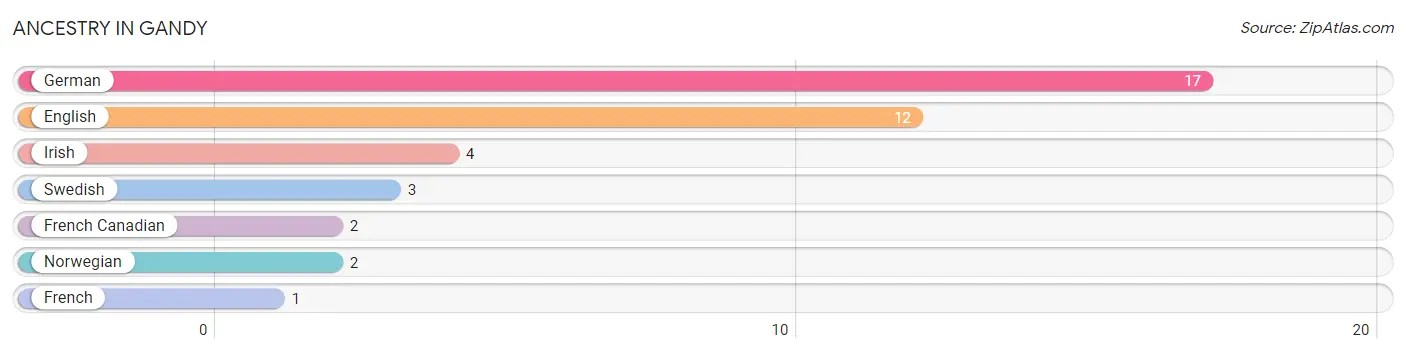
| Ancestry | # Population | % Population |
| English | 12 | 46.2% |
| French | 1 | 3.8% |
| French Canadian | 2 | 7.7% |
| German | 17 | 65.4% |
| Irish | 4 | 15.4% |
| Norwegian | 2 | 7.7% |
| Swedish | 3 | 11.5% | View All 7 Rows |
Immigrants in Gandy

| Immigration Origin | # Population | % Population | View All 0 Rows |
Sex and Age in Gandy
Sex and Age in Gandy
The most populous age groups in Gandy are 65 to 69 Years (3 | 30.0%) for men and 55 to 59 Years (3 | 18.8%) for women.
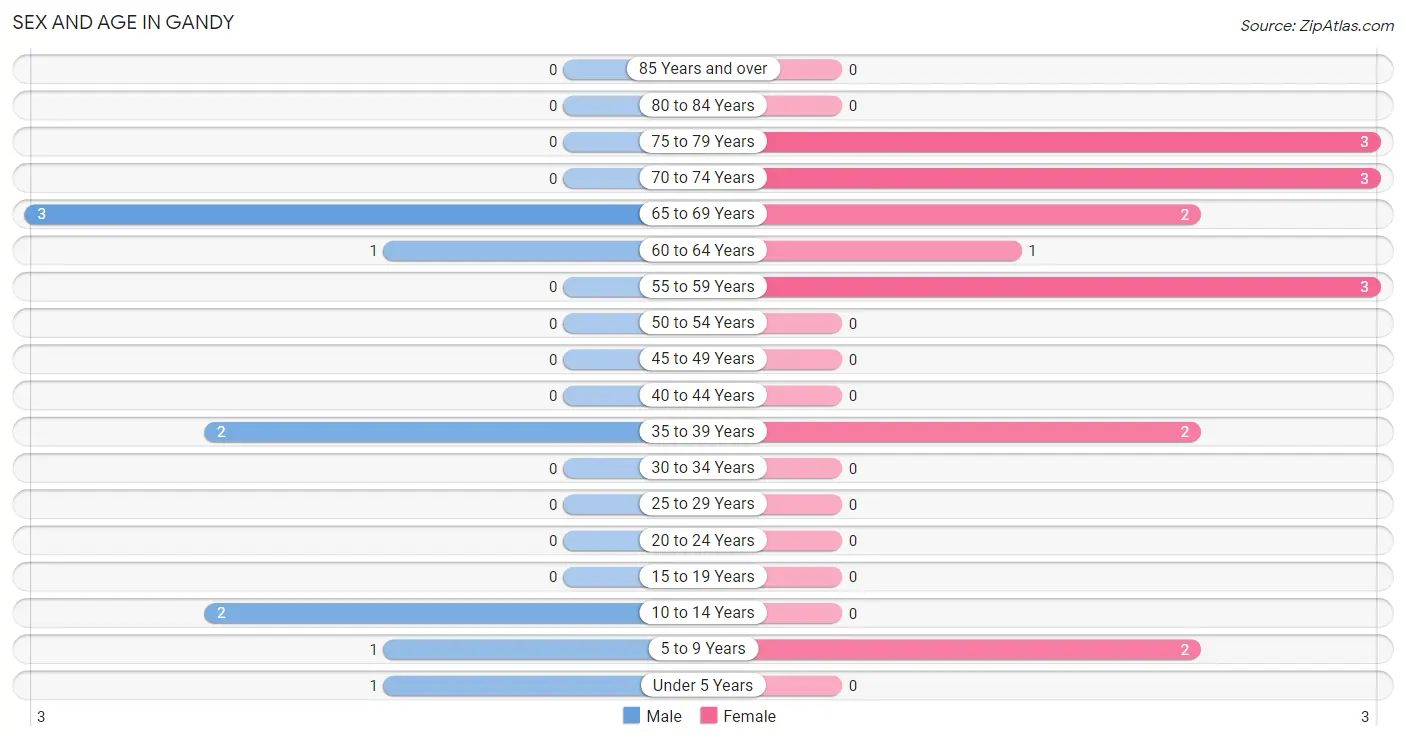
| Age Bracket | Male | Female |
| Under 5 Years | 1 (10.0%) | 0 (0.0%) |
| 5 to 9 Years | 1 (10.0%) | 2 (12.5%) |
| 10 to 14 Years | 2 (20.0%) | 0 (0.0%) |
| 15 to 19 Years | 0 (0.0%) | 0 (0.0%) |
| 20 to 24 Years | 0 (0.0%) | 0 (0.0%) |
| 25 to 29 Years | 0 (0.0%) | 0 (0.0%) |
| 30 to 34 Years | 0 (0.0%) | 0 (0.0%) |
| 35 to 39 Years | 2 (20.0%) | 2 (12.5%) |
| 40 to 44 Years | 0 (0.0%) | 0 (0.0%) |
| 45 to 49 Years | 0 (0.0%) | 0 (0.0%) |
| 50 to 54 Years | 0 (0.0%) | 0 (0.0%) |
| 55 to 59 Years | 0 (0.0%) | 3 (18.8%) |
| 60 to 64 Years | 1 (10.0%) | 1 (6.2%) |
| 65 to 69 Years | 3 (30.0%) | 2 (12.5%) |
| 70 to 74 Years | 0 (0.0%) | 3 (18.8%) |
| 75 to 79 Years | 0 (0.0%) | 3 (18.8%) |
| 80 to 84 Years | 0 (0.0%) | 0 (0.0%) |
| 85 Years and over | 0 (0.0%) | 0 (0.0%) |
| Total | 10 (100.0%) | 16 (100.0%) |
Families and Households in Gandy
Median Family Size in Gandy
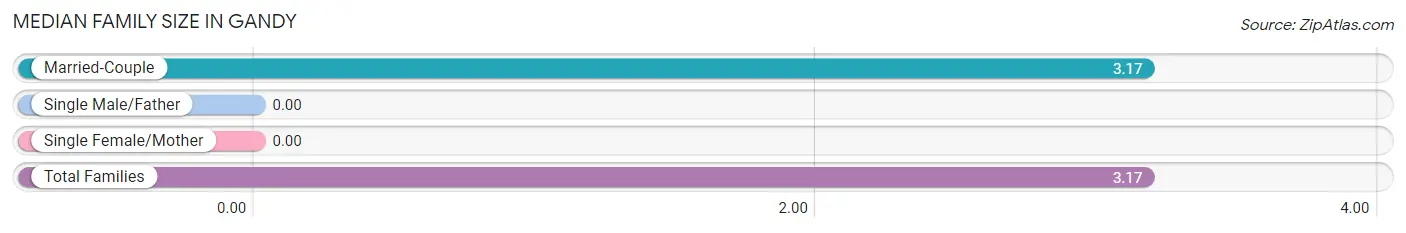
| Family Type | # Families | Family Size |
| Married-Couple | 6 (100.0%) | 3.17 |
| Single Male/Father | 0 (0.0%) | - |
| Single Female/Mother | 0 (0.0%) | - |
| Total Families | 6 (100.0%) | 3.17 |
Median Household Size in Gandy
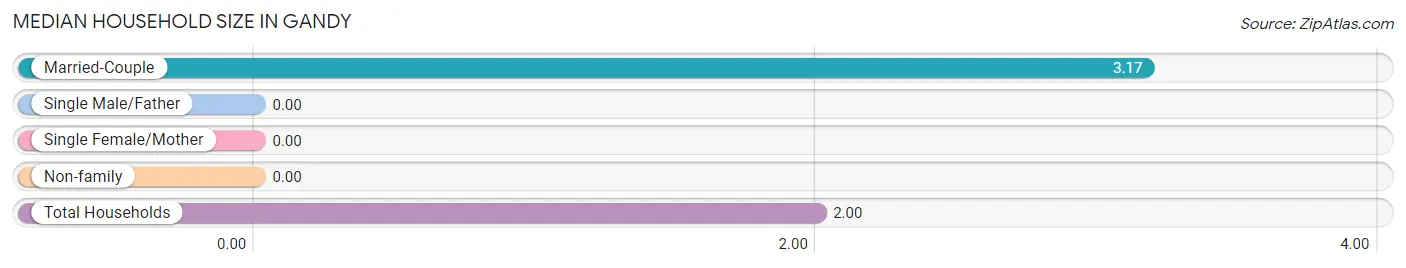
| Household Type | # Households | Household Size |
| Married-Couple | 6 (46.2%) | 3.17 |
| Single Male/Father | 0 (0.0%) | - |
| Single Female/Mother | 0 (0.0%) | - |
| Non-family | 7 (53.8%) | - |
| Total Households | 13 (100.0%) | 2.00 |
Household Size by Marriage Status in Gandy
Out of a total of 13 households in Gandy, 6 (46.2%) are family households, while 7 (53.8%) are nonfamily households. The most numerous type of family households are 2-person households, comprising 4, and the most common type of nonfamily households are 1-person households, comprising 7.
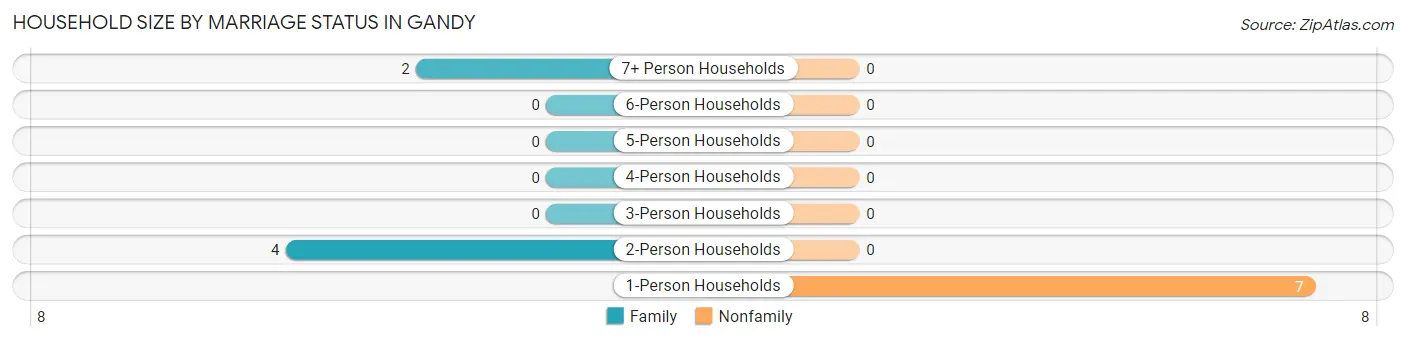
| Household Size | Family Households | Nonfamily Households |
| 1-Person Households | - | 7 (53.8%) |
| 2-Person Households | 4 (30.8%) | 0 (0.0%) |
| 3-Person Households | 0 (0.0%) | 0 (0.0%) |
| 4-Person Households | 0 (0.0%) | 0 (0.0%) |
| 5-Person Households | 0 (0.0%) | 0 (0.0%) |
| 6-Person Households | 0 (0.0%) | 0 (0.0%) |
| 7+ Person Households | 2 (15.4%) | 0 (0.0%) |
| Total | 6 (46.2%) | 7 (53.8%) |
Female Fertility in Gandy
Fertility by Age in Gandy
| Age Bracket | Women with Births | Births / 1,000 Women |
| 15 to 19 years | 0 (0.0%) | 0.0 |
| 20 to 34 years | 0 (0.0%) | 0.0 |
| 35 to 50 years | 0 (0.0%) | 0.0 |
| Total | 0 (0.0%) | 0.0 |
Fertility by Age by Marriage Status in Gandy
| Age Bracket | Married | Unmarried |
| 15 to 19 years | 0 (0.0%) | 0 (0.0%) |
| 20 to 34 years | 0 (0.0%) | 0 (0.0%) |
| 35 to 50 years | 0 (0.0%) | 0 (0.0%) |
| Total | 0 (0.0%) | 0 (0.0%) |
Fertility by Education in Gandy
| Educational Attainment | Women with Births | Births / 1,000 Women |
| Less than High School | 0 (0.0%) | 0.0 |
| High School Diploma | 0 (0.0%) | 0.0 |
| College or Associate's Degree | 0 (0.0%) | 0.0 |
| Bachelor's Degree | 0 (0.0%) | 0.0 |
| Graduate Degree | 0 (0.0%) | 0.0 |
| Total | 0 (0.0%) | 0.0 |
Fertility by Education by Marriage Status in Gandy
| Educational Attainment | Married | Unmarried |
| Less than High School | 0 (0.0%) | 0 (0.0%) |
| High School Diploma | 0 (0.0%) | 0 (0.0%) |
| College or Associate's Degree | 0 (0.0%) | 0 (0.0%) |
| Bachelor's Degree | 0 (0.0%) | 0 (0.0%) |
| Graduate Degree | 0 (0.0%) | 0 (0.0%) |
| Total | 0 (0.0%) | 0 (0.0%) |
Employment Characteristics in Gandy
Employment by Class of Employer in Gandy
Among the 11 employed individuals in Gandy, private company employees (6 | 54.5%), self-employed (not incorporated) (3 | 27.3%), and self-employed (incorporated) (1 | 9.1%) make up the most common classes of employment.
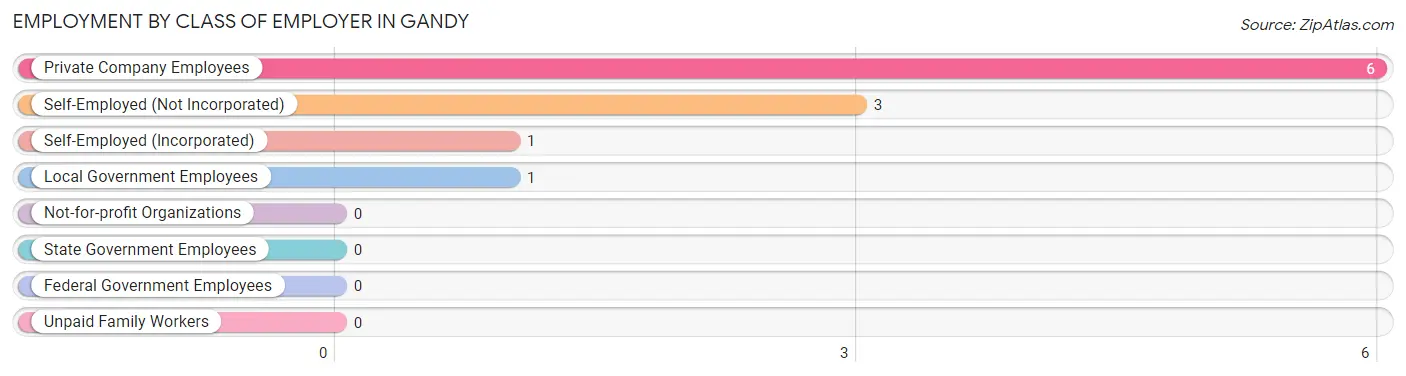
| Employer Class | # Employees | % Employees |
| Private Company Employees | 6 | 54.5% |
| Self-Employed (Incorporated) | 1 | 9.1% |
| Self-Employed (Not Incorporated) | 3 | 27.3% |
| Not-for-profit Organizations | 0 | 0.0% |
| Local Government Employees | 1 | 9.1% |
| State Government Employees | 0 | 0.0% |
| Federal Government Employees | 0 | 0.0% |
| Unpaid Family Workers | 0 | 0.0% |
| Total | 11 | 100.0% |
Employment Status by Age in Gandy
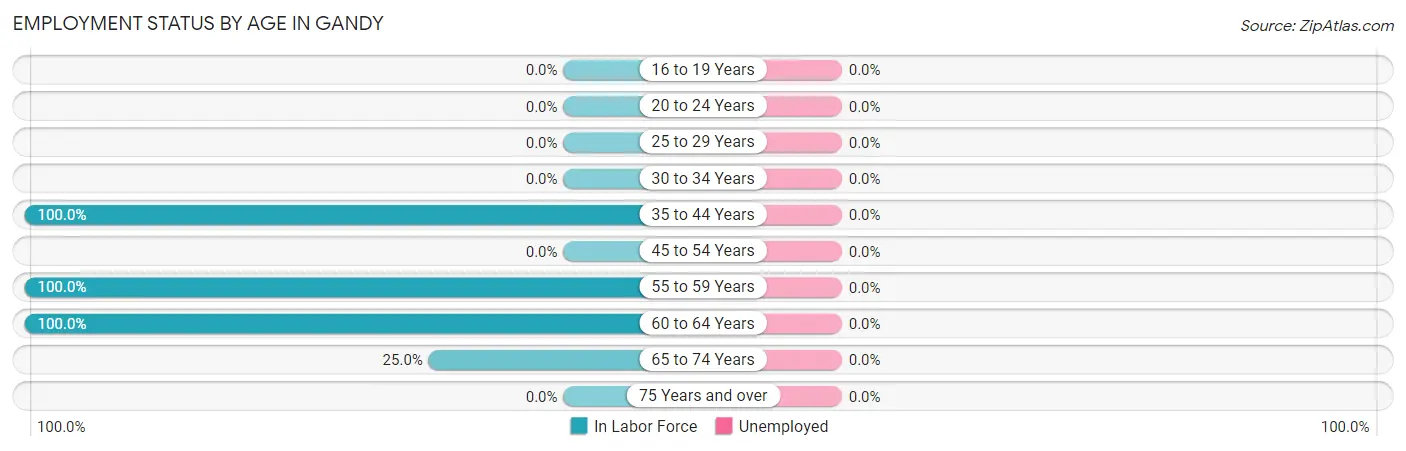
| Age Bracket | In Labor Force | Unemployed |
| 16 to 19 Years | 0 (0.0%) | 0 (0.0%) |
| 20 to 24 Years | 0 (0.0%) | 0 (0.0%) |
| 25 to 29 Years | 0 (0.0%) | 0 (0.0%) |
| 30 to 34 Years | 0 (0.0%) | 0 (0.0%) |
| 35 to 44 Years | 4 (100.0%) | 0 (0.0%) |
| 45 to 54 Years | 0 (0.0%) | 0 (0.0%) |
| 55 to 59 Years | 3 (100.0%) | 0 (0.0%) |
| 60 to 64 Years | 2 (100.0%) | 0 (0.0%) |
| 65 to 74 Years | 2 (25.0%) | 0 (0.0%) |
| 75 Years and over | 0 (0.0%) | 0 (0.0%) |
| Total | 11 (55.0%) | 0 (0.0%) |
Employment Status by Educational Attainment in Gandy
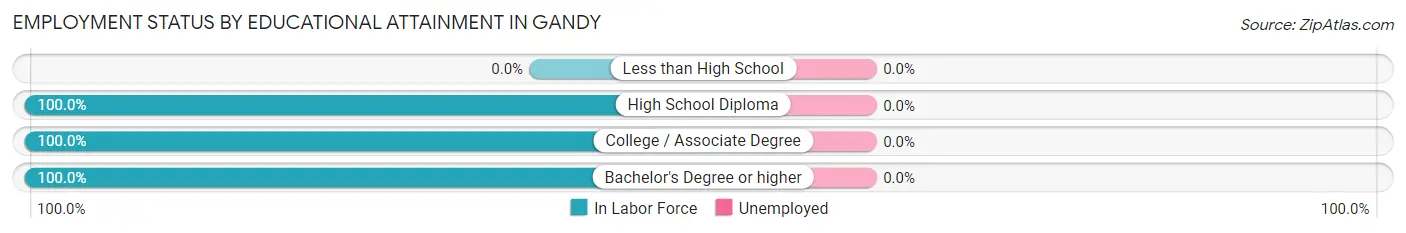
| Educational Attainment | In Labor Force | Unemployed |
| Less than High School | 0 (0.0%) | 0 (0.0%) |
| High School Diploma | 2 (100.0%) | 0 (0.0%) |
| College / Associate Degree | 5 (100.0%) | 0 (0.0%) |
| Bachelor's Degree or higher | 2 (100.0%) | 0 (0.0%) |
| Total | 9 (100.0%) | 0 (0.0%) |
Employment Occupations by Sex in Gandy
Management, Business, Science and Arts Occupations
The most common Management, Business, Science and Arts occupations in Gandy are , and Management (2 | 18.2%).
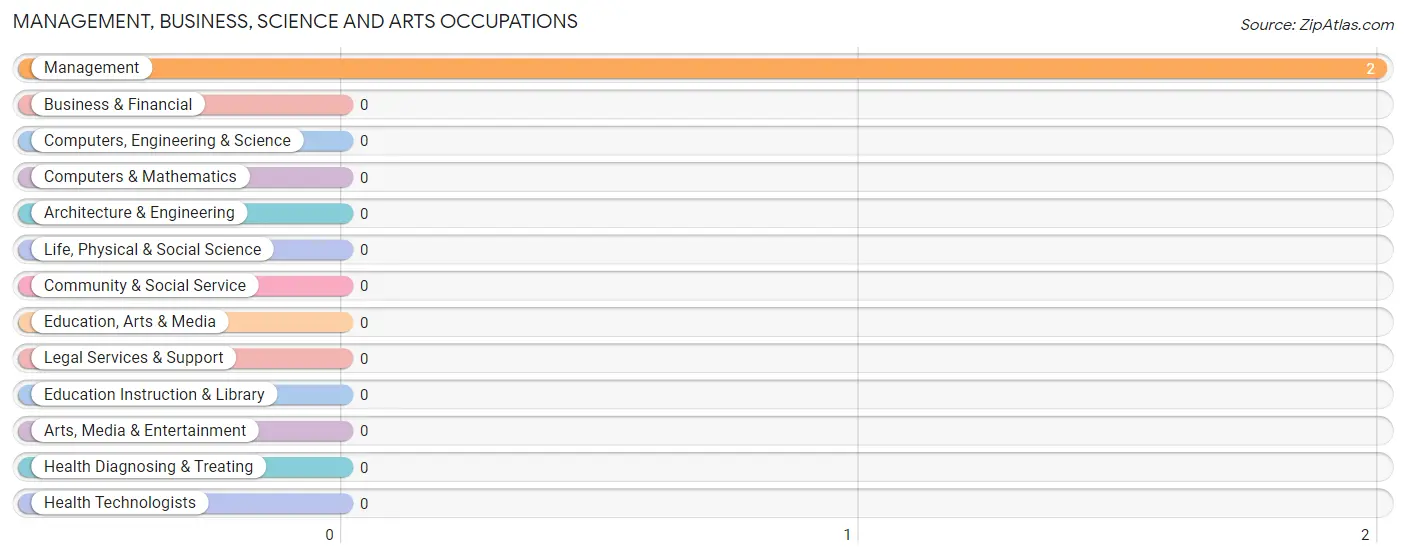
Management, Business, Science and Arts Occupations by Sex
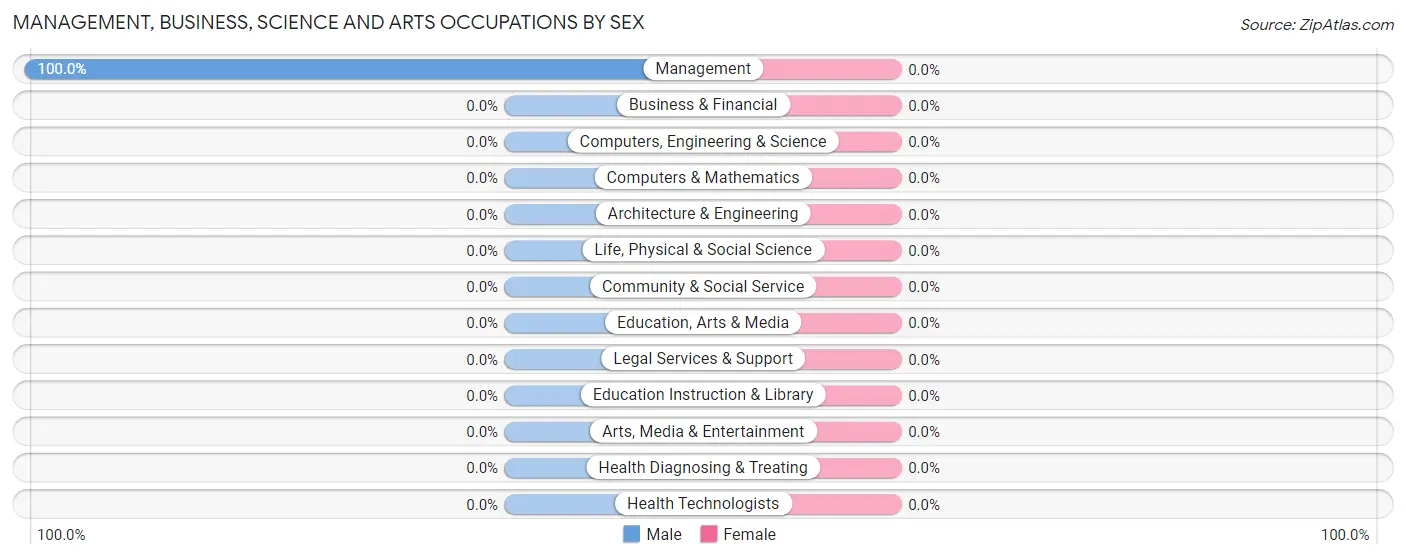
| Occupation | Male | Female |
| Management | 2 (100.0%) | 0 (0.0%) |
| Business & Financial | 0 (0.0%) | 0 (0.0%) |
| Computers, Engineering & Science | 0 (0.0%) | 0 (0.0%) |
| Computers & Mathematics | 0 (0.0%) | 0 (0.0%) |
| Architecture & Engineering | 0 (0.0%) | 0 (0.0%) |
| Life, Physical & Social Science | 0 (0.0%) | 0 (0.0%) |
| Community & Social Service | 0 (0.0%) | 0 (0.0%) |
| Education, Arts & Media | 0 (0.0%) | 0 (0.0%) |
| Legal Services & Support | 0 (0.0%) | 0 (0.0%) |
| Education Instruction & Library | 0 (0.0%) | 0 (0.0%) |
| Arts, Media & Entertainment | 0 (0.0%) | 0 (0.0%) |
| Health Diagnosing & Treating | 0 (0.0%) | 0 (0.0%) |
| Health Technologists | 0 (0.0%) | 0 (0.0%) |
| Total (Category) | 2 (100.0%) | 0 (0.0%) |
| Total (Overall) | 4 (36.4%) | 7 (63.6%) |
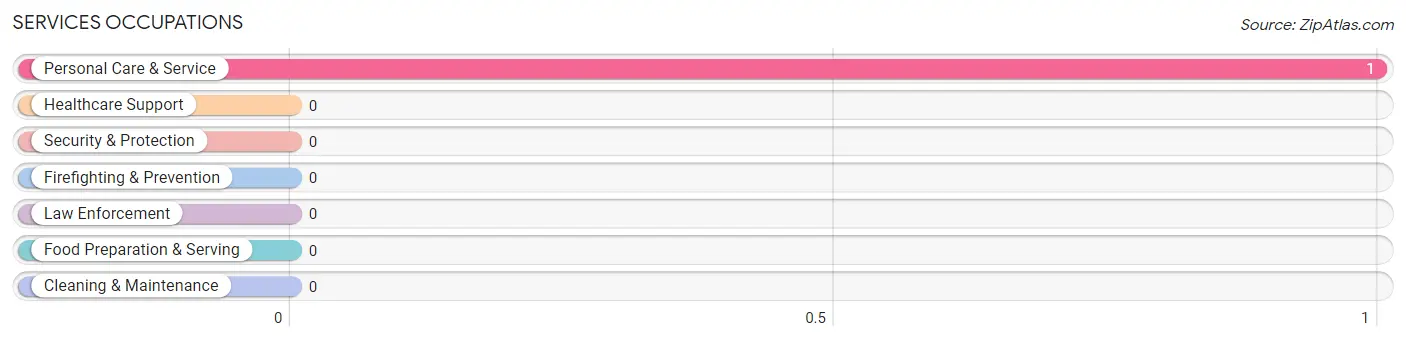
Services Occupations
The most common Services occupations in Gandy are , and Personal Care & Service (1 | 9.1%).
Services Occupations by Sex
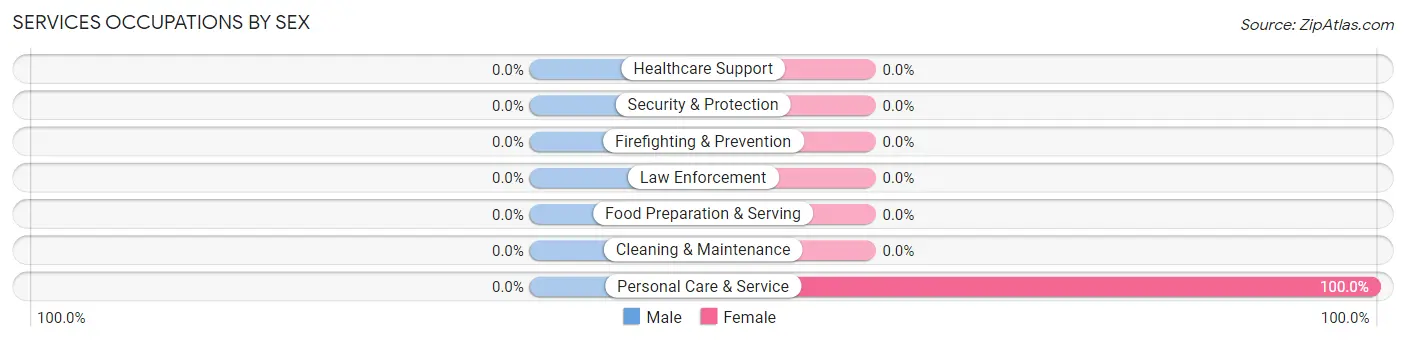
| Occupation | Male | Female |
| Healthcare Support | 0 (0.0%) | 0 (0.0%) |
| Security & Protection | 0 (0.0%) | 0 (0.0%) |
| Firefighting & Prevention | 0 (0.0%) | 0 (0.0%) |
| Law Enforcement | 0 (0.0%) | 0 (0.0%) |
| Food Preparation & Serving | 0 (0.0%) | 0 (0.0%) |
| Cleaning & Maintenance | 0 (0.0%) | 0 (0.0%) |
| Personal Care & Service | 0 (0.0%) | 1 (100.0%) |
| Total (Category) | 0 (0.0%) | 1 (100.0%) |
| Total (Overall) | 4 (36.4%) | 7 (63.6%) |
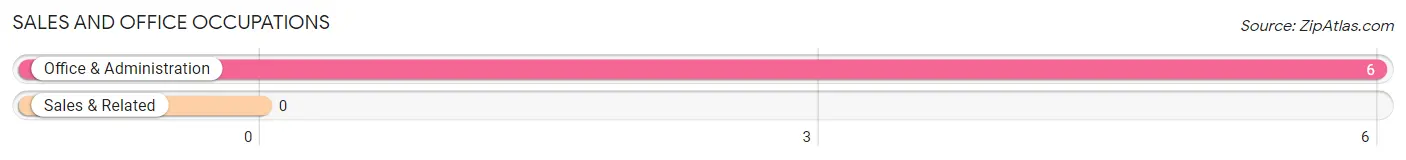
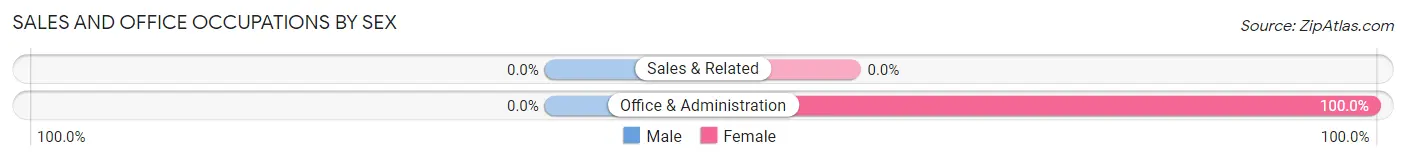
Sales and Office Occupations
The most common Sales and Office occupations in Gandy are , and Office & Administration (6 | 54.5%).
Sales and Office Occupations by Sex
| Occupation | Male | Female |
| Sales & Related | 0 (0.0%) | 0 (0.0%) |
| Office & Administration | 0 (0.0%) | 6 (100.0%) |
| Total (Category) | 0 (0.0%) | 6 (100.0%) |
| Total (Overall) | 4 (36.4%) | 7 (63.6%) |
Natural Resources, Construction and Maintenance Occupations
The most common Natural Resources, Construction and Maintenance occupations in Gandy are , and Construction & Extraction (1 | 9.1%).
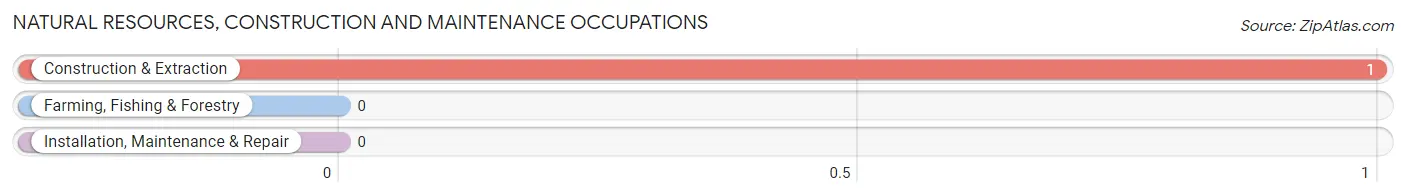
Natural Resources, Construction and Maintenance Occupations by Sex
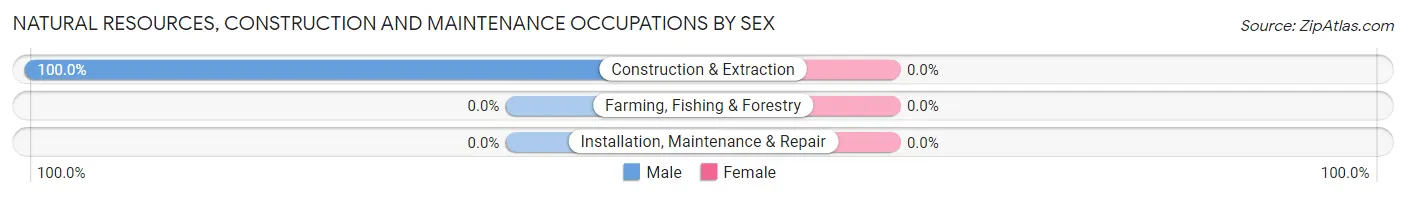
| Occupation | Male | Female |
| Farming, Fishing & Forestry | 0 (0.0%) | 0 (0.0%) |
| Construction & Extraction | 1 (100.0%) | 0 (0.0%) |
| Installation, Maintenance & Repair | 0 (0.0%) | 0 (0.0%) |
| Total (Category) | 1 (100.0%) | 0 (0.0%) |
| Total (Overall) | 4 (36.4%) | 7 (63.6%) |
Production, Transportation and Moving Occupations
The most common Production, Transportation and Moving occupations in Gandy are , and Transportation (1 | 9.1%).
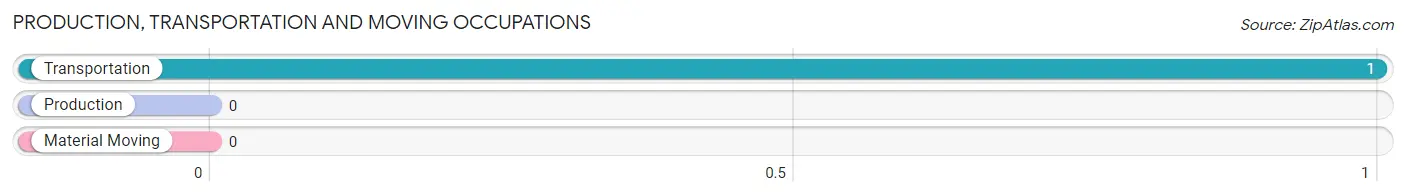
Production, Transportation and Moving Occupations by Sex
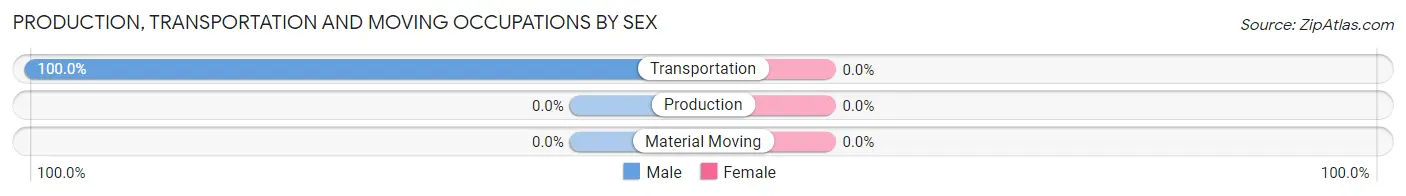
| Occupation | Male | Female |
| Production | 0 (0.0%) | 0 (0.0%) |
| Transportation | 1 (100.0%) | 0 (0.0%) |
| Material Moving | 0 (0.0%) | 0 (0.0%) |
| Total (Category) | 1 (100.0%) | 0 (0.0%) |
| Total (Overall) | 4 (36.4%) | 7 (63.6%) |
Employment Industries by Sex in Gandy
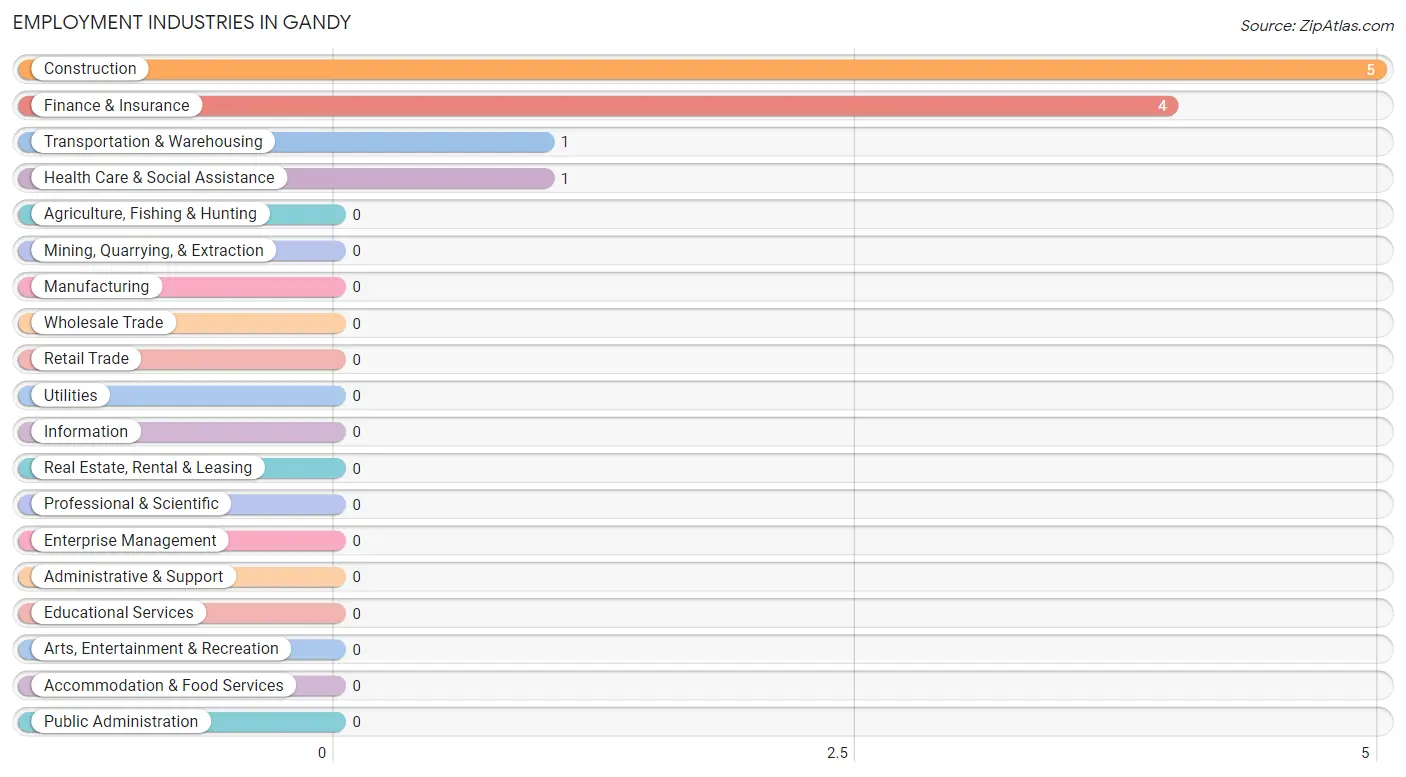
Employment Industries in Gandy
The major employment industries in Gandy include Construction (5 | 45.5%), Finance & Insurance (4 | 36.4%), Transportation & Warehousing (1 | 9.1%), and Health Care & Social Assistance (1 | 9.1%).
Employment Industries by Sex in Gandy
The Gandy industries that see more men than women are Transportation & Warehousing (100.0%), and Construction (60.0%), whereas the industries that tend to have a higher number of women are Finance & Insurance (100.0%), Health Care & Social Assistance (100.0%), and Construction (40.0%).
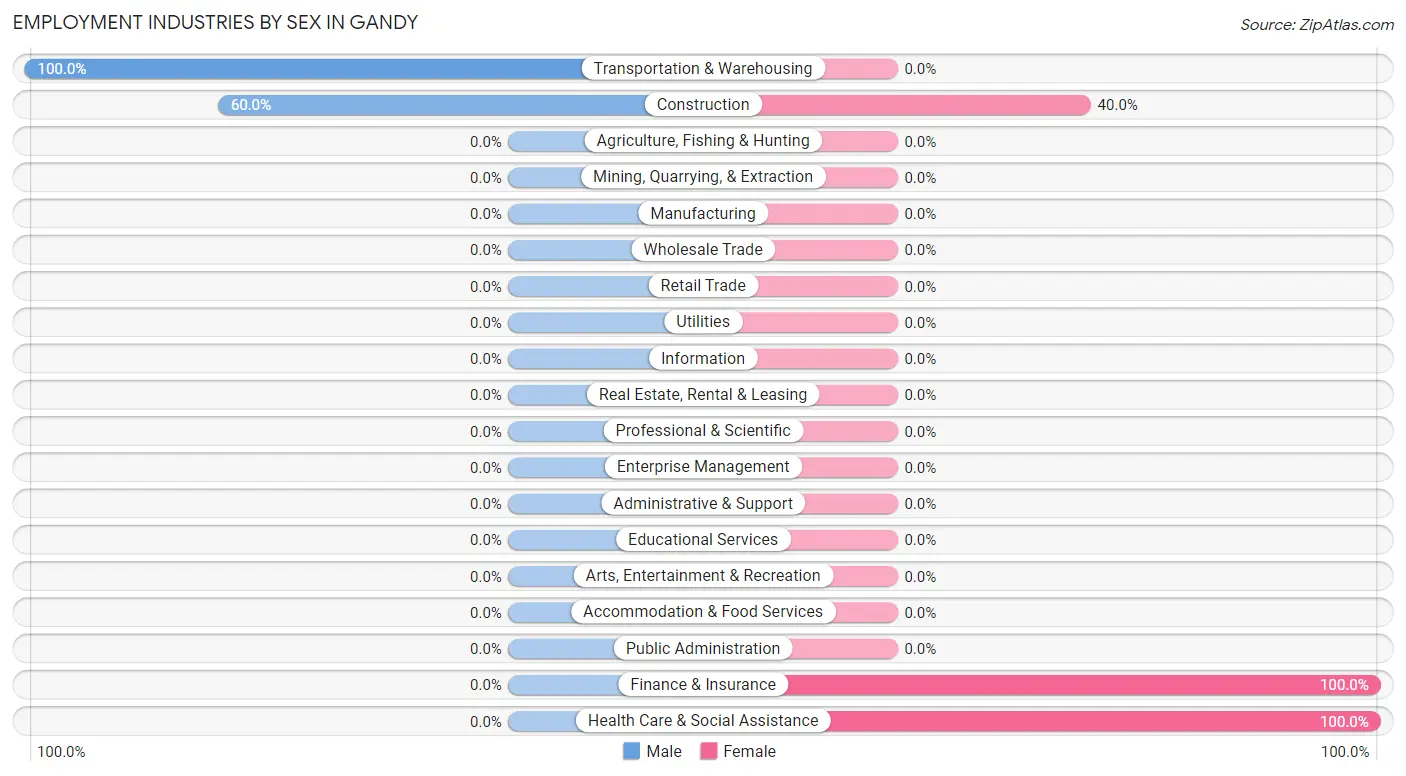
| Industry | Male | Female |
| Agriculture, Fishing & Hunting | 0 (0.0%) | 0 (0.0%) |
| Mining, Quarrying, & Extraction | 0 (0.0%) | 0 (0.0%) |
| Construction | 3 (60.0%) | 2 (40.0%) |
| Manufacturing | 0 (0.0%) | 0 (0.0%) |
| Wholesale Trade | 0 (0.0%) | 0 (0.0%) |
| Retail Trade | 0 (0.0%) | 0 (0.0%) |
| Transportation & Warehousing | 1 (100.0%) | 0 (0.0%) |
| Utilities | 0 (0.0%) | 0 (0.0%) |
| Information | 0 (0.0%) | 0 (0.0%) |
| Finance & Insurance | 0 (0.0%) | 4 (100.0%) |
| Real Estate, Rental & Leasing | 0 (0.0%) | 0 (0.0%) |
| Professional & Scientific | 0 (0.0%) | 0 (0.0%) |
| Enterprise Management | 0 (0.0%) | 0 (0.0%) |
| Administrative & Support | 0 (0.0%) | 0 (0.0%) |
| Educational Services | 0 (0.0%) | 0 (0.0%) |
| Health Care & Social Assistance | 0 (0.0%) | 1 (100.0%) |
| Arts, Entertainment & Recreation | 0 (0.0%) | 0 (0.0%) |
| Accommodation & Food Services | 0 (0.0%) | 0 (0.0%) |
| Public Administration | 0 (0.0%) | 0 (0.0%) |
| Total | 4 (36.4%) | 7 (63.6%) |
Education in Gandy
School Enrollment in Gandy
The most common levels of schooling among the 5 students in Gandy are elementary school (3 | 60.0%), nursery / preschool (1 | 20.0%), and middle school (1 | 20.0%).
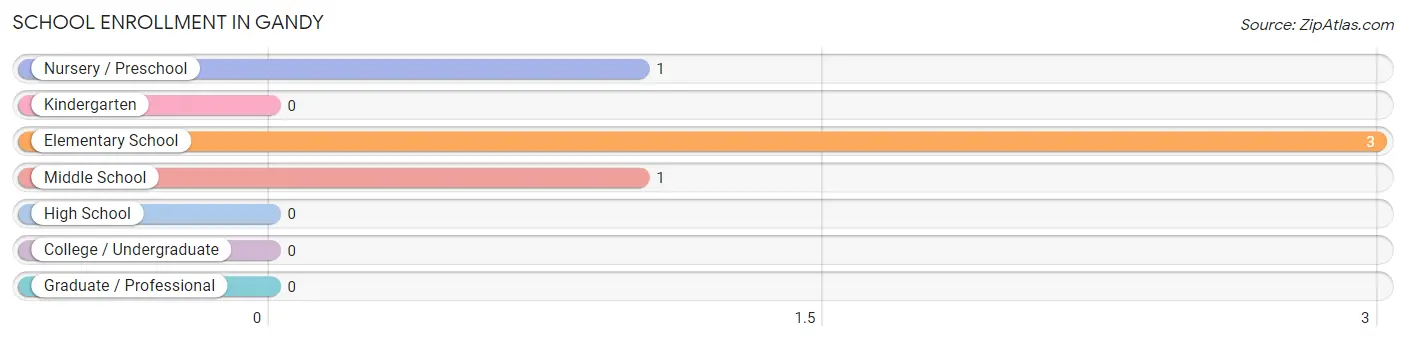
| School Level | # Students | % Students |
| Nursery / Preschool | 1 | 20.0% |
| Kindergarten | 0 | 0.0% |
| Elementary School | 3 | 60.0% |
| Middle School | 1 | 20.0% |
| High School | 0 | 0.0% |
| College / Undergraduate | 0 | 0.0% |
| Graduate / Professional | 0 | 0.0% |
| Total | 5 | 100.0% |
School Enrollment by Age by Funding Source in Gandy
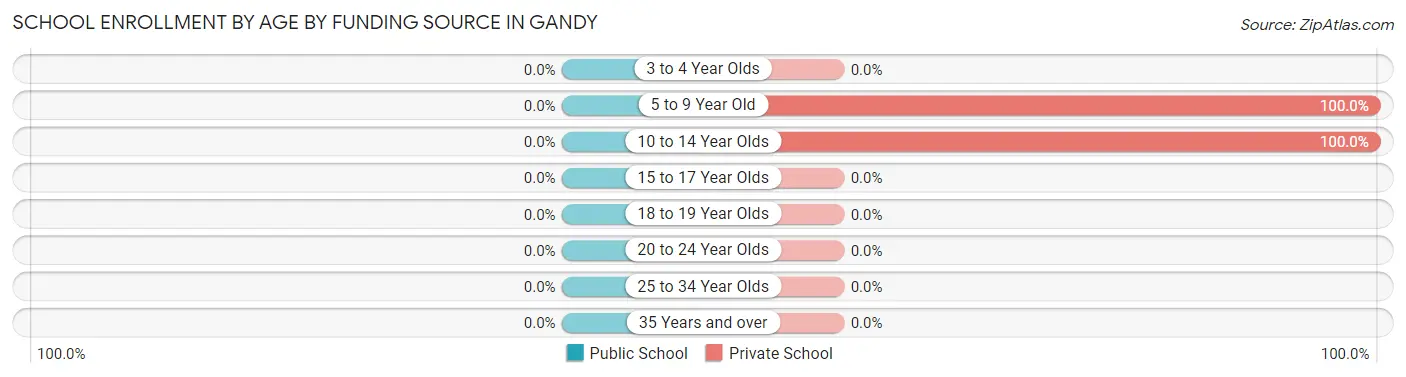
| Age Bracket | Public School | Private School |
| 3 to 4 Year Olds | 0 (0.0%) | 0 (0.0%) |
| 5 to 9 Year Old | 0 (0.0%) | 3 (100.0%) |
| 10 to 14 Year Olds | 0 (0.0%) | 2 (100.0%) |
| 15 to 17 Year Olds | 0 (0.0%) | 0 (0.0%) |
| 18 to 19 Year Olds | 0 (0.0%) | 0 (0.0%) |
| 20 to 24 Year Olds | 0 (0.0%) | 0 (0.0%) |
| 25 to 34 Year Olds | 0 (0.0%) | 0 (0.0%) |
| 35 Years and over | 0 (0.0%) | 0 (0.0%) |
| Total | 0 (0.0%) | 5 (100.0%) |
Educational Attainment by Field of Study in Gandy
Liberal arts & history (2 | 50.0%), and visual & performing arts (2 | 50.0%) are the most common fields of study among 4 individuals in Gandy who have obtained a bachelor's degree or higher.
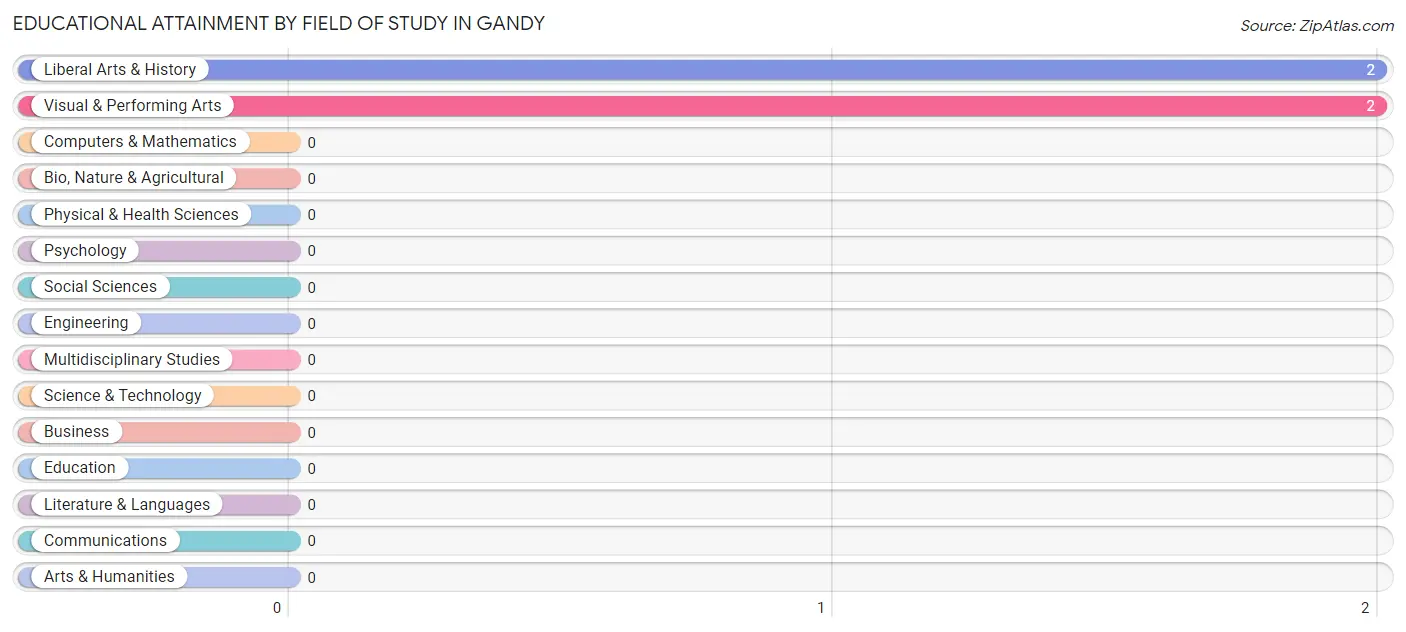
| Field of Study | # Graduates | % Graduates |
| Computers & Mathematics | 0 | 0.0% |
| Bio, Nature & Agricultural | 0 | 0.0% |
| Physical & Health Sciences | 0 | 0.0% |
| Psychology | 0 | 0.0% |
| Social Sciences | 0 | 0.0% |
| Engineering | 0 | 0.0% |
| Multidisciplinary Studies | 0 | 0.0% |
| Science & Technology | 0 | 0.0% |
| Business | 0 | 0.0% |
| Education | 0 | 0.0% |
| Literature & Languages | 0 | 0.0% |
| Liberal Arts & History | 2 | 50.0% |
| Visual & Performing Arts | 2 | 50.0% |
| Communications | 0 | 0.0% |
| Arts & Humanities | 0 | 0.0% |
| Total | 4 | 100.0% |
Transportation & Commute in Gandy
Vehicle Availability by Sex in Gandy
The most prevalent vehicle ownership categories in Gandy are males with 2 vehicles (3, accounting for 75.0%) and females with 2 vehicles (5, making up 42.9%).
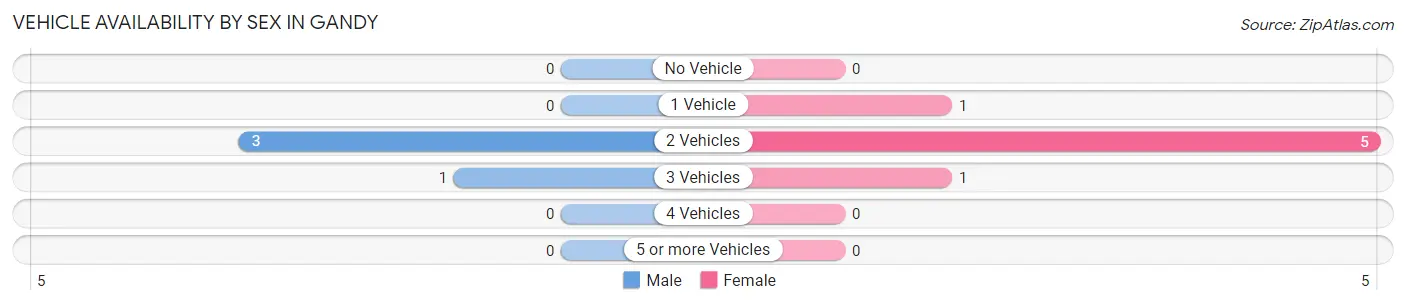
| Vehicles Available | Male | Female |
| No Vehicle | 0 (0.0%) | 0 (0.0%) |
| 1 Vehicle | 0 (0.0%) | 1 (14.3%) |
| 2 Vehicles | 3 (75.0%) | 5 (71.4%) |
| 3 Vehicles | 1 (25.0%) | 1 (14.3%) |
| 4 Vehicles | 0 (0.0%) | 0 (0.0%) |
| 5 or more Vehicles | 0 (0.0%) | 0 (0.0%) |
| Total | 4 (100.0%) | 7 (100.0%) |
Commute Time in Gandy
The most frequently occuring commute durations in Gandy are 40 to 44 minutes (3 commuters, 33.3%), 20 to 24 minutes (2 commuters, 22.2%), and 35 to 39 minutes (2 commuters, 22.2%).
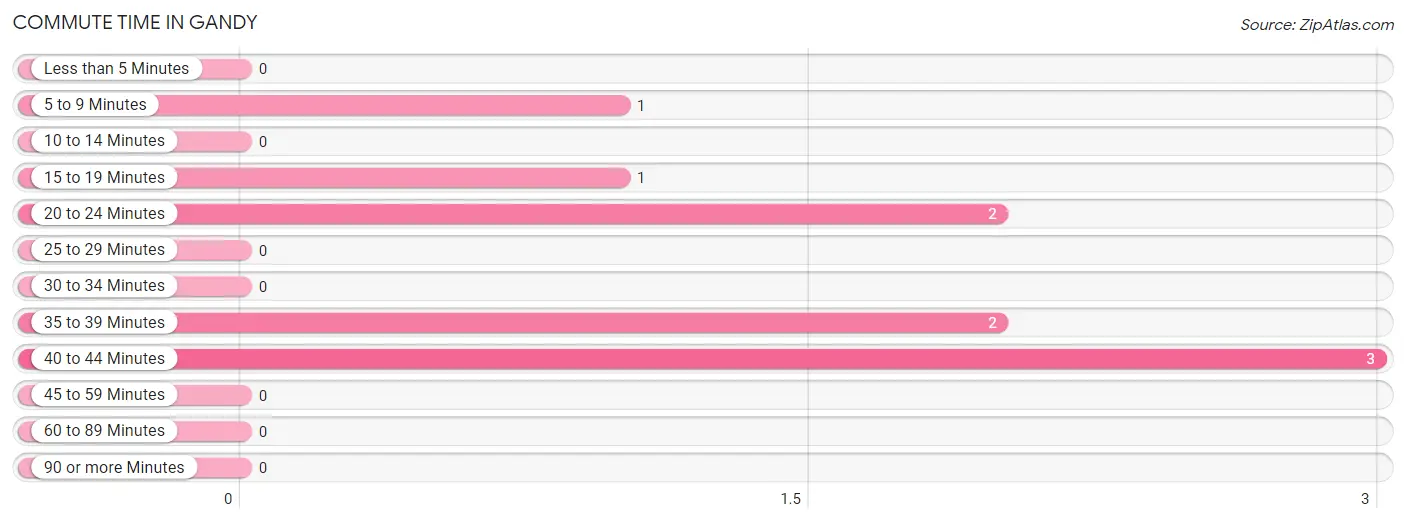
| Commute Time | # Commuters | % Commuters |
| Less than 5 Minutes | 0 | 0.0% |
| 5 to 9 Minutes | 1 | 11.1% |
| 10 to 14 Minutes | 0 | 0.0% |
| 15 to 19 Minutes | 1 | 11.1% |
| 20 to 24 Minutes | 2 | 22.2% |
| 25 to 29 Minutes | 0 | 0.0% |
| 30 to 34 Minutes | 0 | 0.0% |
| 35 to 39 Minutes | 2 | 22.2% |
| 40 to 44 Minutes | 3 | 33.3% |
| 45 to 59 Minutes | 0 | 0.0% |
| 60 to 89 Minutes | 0 | 0.0% |
| 90 or more Minutes | 0 | 0.0% |
Commute Time by Sex in Gandy
The most common commute times in Gandy are 20 to 24 minutes (2 commuters, 50.0%) for males and 40 to 44 minutes (3 commuters, 60.0%) for females.
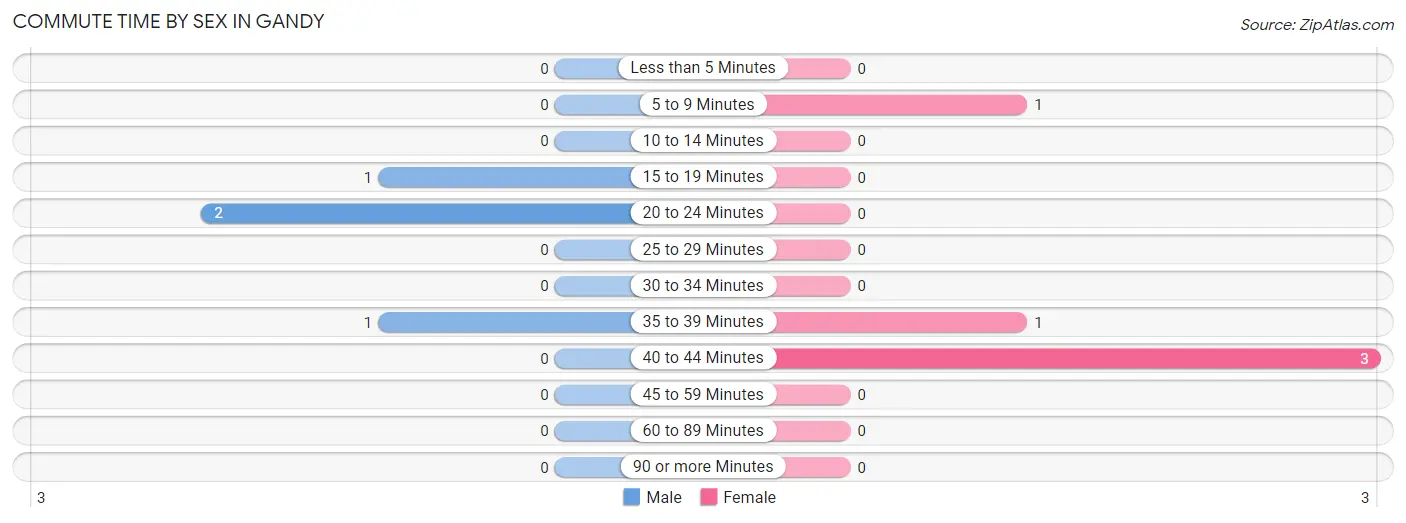
| Commute Time | Male | Female |
| Less than 5 Minutes | 0 (0.0%) | 0 (0.0%) |
| 5 to 9 Minutes | 0 (0.0%) | 1 (20.0%) |
| 10 to 14 Minutes | 0 (0.0%) | 0 (0.0%) |
| 15 to 19 Minutes | 1 (25.0%) | 0 (0.0%) |
| 20 to 24 Minutes | 2 (50.0%) | 0 (0.0%) |
| 25 to 29 Minutes | 0 (0.0%) | 0 (0.0%) |
| 30 to 34 Minutes | 0 (0.0%) | 0 (0.0%) |
| 35 to 39 Minutes | 1 (25.0%) | 1 (20.0%) |
| 40 to 44 Minutes | 0 (0.0%) | 3 (60.0%) |
| 45 to 59 Minutes | 0 (0.0%) | 0 (0.0%) |
| 60 to 89 Minutes | 0 (0.0%) | 0 (0.0%) |
| 90 or more Minutes | 0 (0.0%) | 0 (0.0%) |
Time of Departure to Work by Sex in Gandy
The most frequent times of departure to work in Gandy are 7:00 AM to 7:29 AM (2, 50.0%) for males and 7:00 AM to 7:29 AM (4, 80.0%) for females.
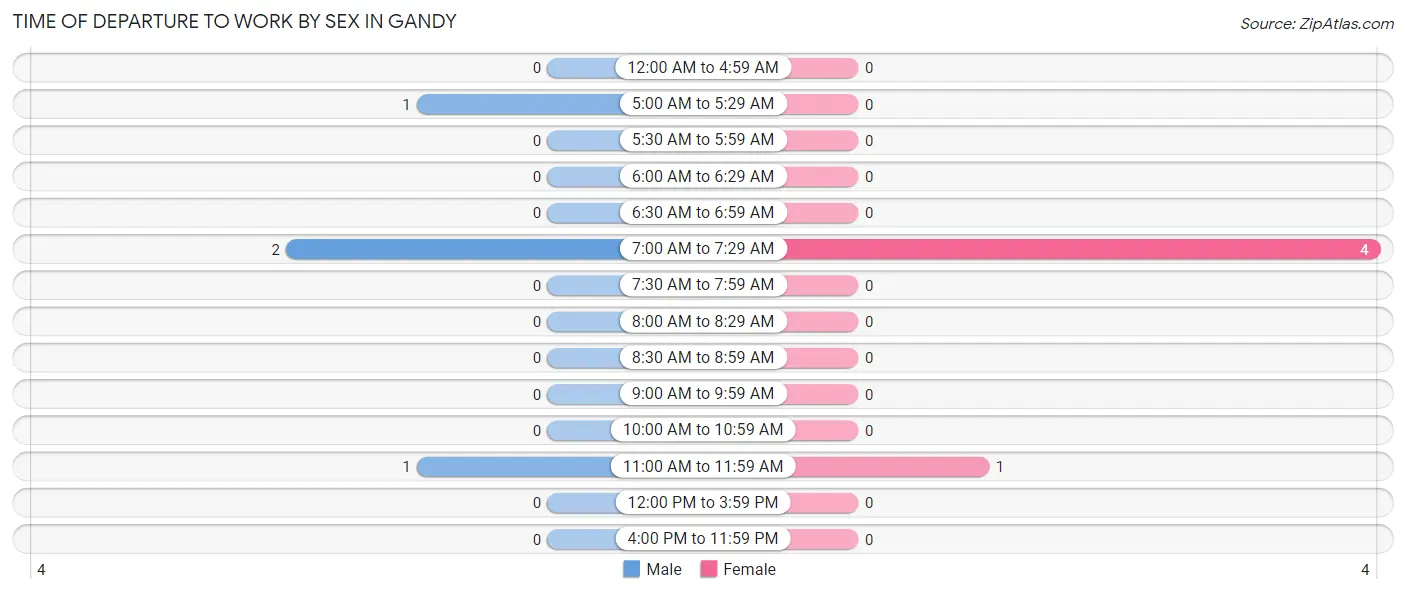
| Time of Departure | Male | Female |
| 12:00 AM to 4:59 AM | 0 (0.0%) | 0 (0.0%) |
| 5:00 AM to 5:29 AM | 1 (25.0%) | 0 (0.0%) |
| 5:30 AM to 5:59 AM | 0 (0.0%) | 0 (0.0%) |
| 6:00 AM to 6:29 AM | 0 (0.0%) | 0 (0.0%) |
| 6:30 AM to 6:59 AM | 0 (0.0%) | 0 (0.0%) |
| 7:00 AM to 7:29 AM | 2 (50.0%) | 4 (80.0%) |
| 7:30 AM to 7:59 AM | 0 (0.0%) | 0 (0.0%) |
| 8:00 AM to 8:29 AM | 0 (0.0%) | 0 (0.0%) |
| 8:30 AM to 8:59 AM | 0 (0.0%) | 0 (0.0%) |
| 9:00 AM to 9:59 AM | 0 (0.0%) | 0 (0.0%) |
| 10:00 AM to 10:59 AM | 0 (0.0%) | 0 (0.0%) |
| 11:00 AM to 11:59 AM | 1 (25.0%) | 1 (20.0%) |
| 12:00 PM to 3:59 PM | 0 (0.0%) | 0 (0.0%) |
| 4:00 PM to 11:59 PM | 0 (0.0%) | 0 (0.0%) |
| Total | 4 (100.0%) | 5 (100.0%) |
Housing Occupancy in Gandy
Occupancy by Ownership in Gandy
Of the total 13 dwellings in Gandy, owner-occupied units account for 13 (100.0%), while renter-occupied units make up 0 (0.0%).
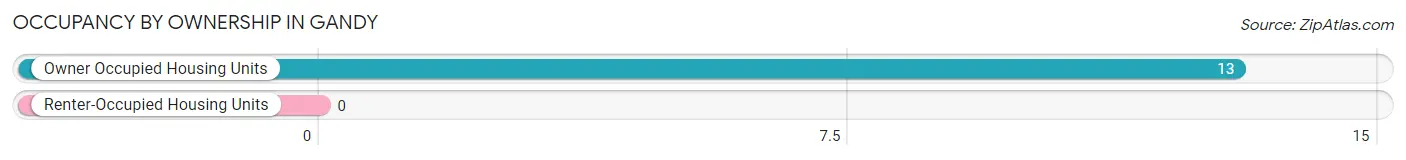
| Occupancy | # Housing Units | % Housing Units |
| Owner Occupied Housing Units | 13 | 100.0% |
| Renter-Occupied Housing Units | 0 | 0.0% |
| Total Occupied Housing Units | 13 | 100.0% |
Occupancy by Household Size in Gandy
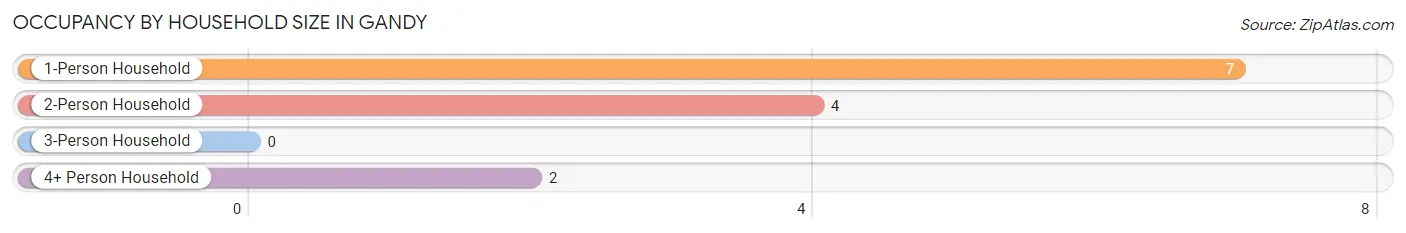
| Household Size | # Housing Units | % Housing Units |
| 1-Person Household | 7 | 53.8% |
| 2-Person Household | 4 | 30.8% |
| 3-Person Household | 0 | 0.0% |
| 4+ Person Household | 2 | 15.4% |
| Total Housing Units | 13 | 100.0% |
Occupancy by Ownership by Household Size in Gandy
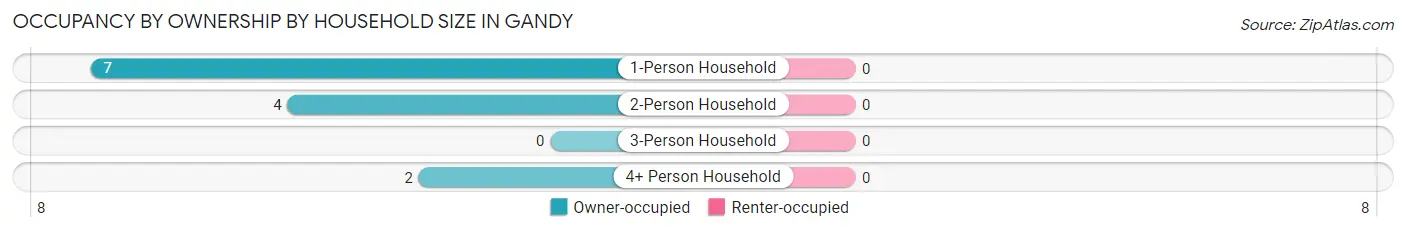
| Household Size | Owner-occupied | Renter-occupied |
| 1-Person Household | 7 (100.0%) | 0 (0.0%) |
| 2-Person Household | 4 (100.0%) | 0 (0.0%) |
| 3-Person Household | 0 (0.0%) | 0 (0.0%) |
| 4+ Person Household | 2 (100.0%) | 0 (0.0%) |
| Total Housing Units | 13 (100.0%) | 0 (0.0%) |
Occupancy by Educational Attainment in Gandy
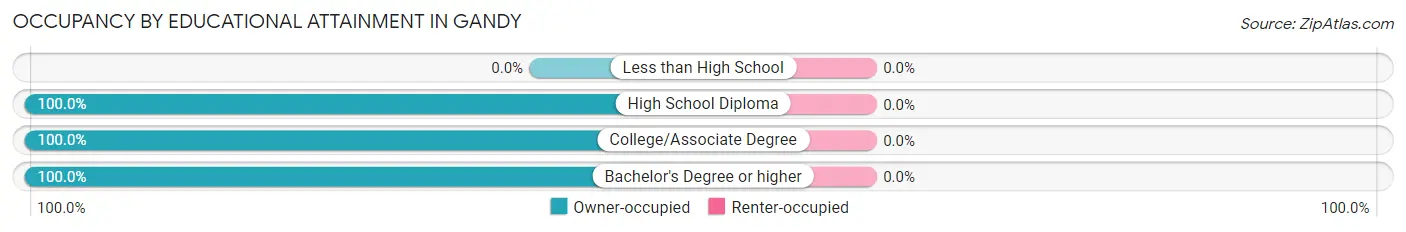
| Household Size | Owner-occupied | Renter-occupied |
| Less than High School | 0 (0.0%) | 0 (0.0%) |
| High School Diploma | 4 (100.0%) | 0 (0.0%) |
| College/Associate Degree | 7 (100.0%) | 0 (0.0%) |
| Bachelor's Degree or higher | 2 (100.0%) | 0 (0.0%) |
Occupancy by Age of Householder in Gandy
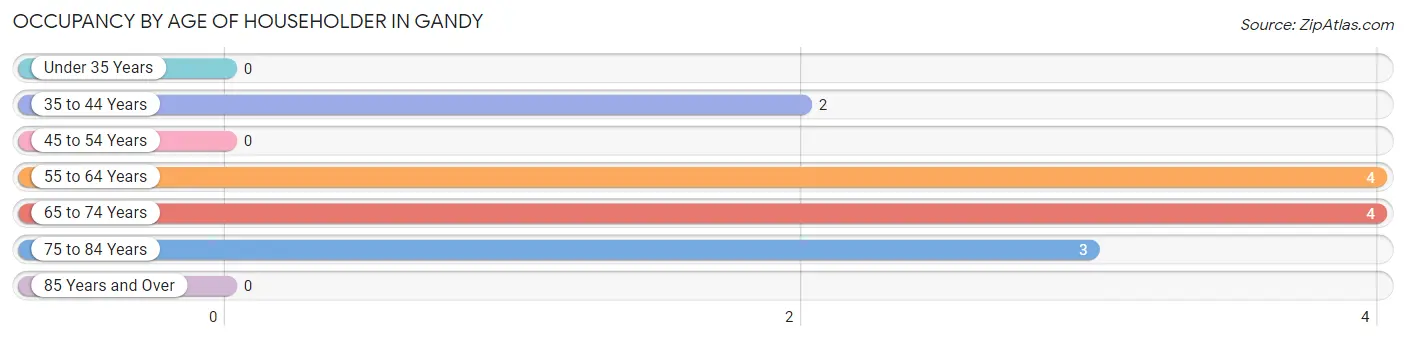
| Age Bracket | # Households | % Households |
| Under 35 Years | 0 | 0.0% |
| 35 to 44 Years | 2 | 15.4% |
| 45 to 54 Years | 0 | 0.0% |
| 55 to 64 Years | 4 | 30.8% |
| 65 to 74 Years | 4 | 30.8% |
| 75 to 84 Years | 3 | 23.1% |
| 85 Years and Over | 0 | 0.0% |
| Total | 13 | 100.0% |
Housing Finances in Gandy
Median Income by Occupancy in Gandy
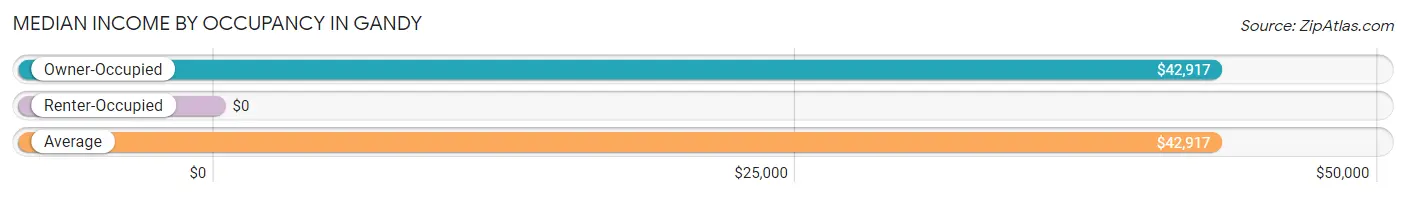
| Occupancy Type | # Households | Median Income |
| Owner-Occupied | 13 (100.0%) | $42,917 |
| Renter-Occupied | 0 (0.0%) | $0 |
| Average | 13 (100.0%) | $42,917 |
Occupancy by Householder Income Bracket in Gandy
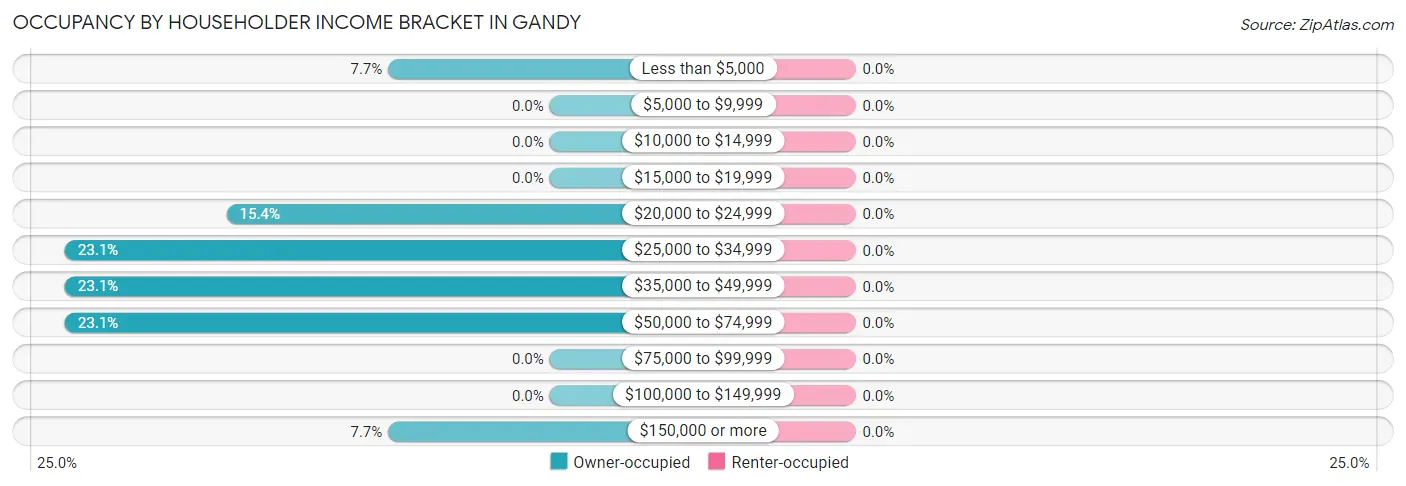
| Income Bracket | Owner-occupied | Renter-occupied |
| Less than $5,000 | 1 (7.7%) | 0 (0.0%) |
| $5,000 to $9,999 | 0 (0.0%) | 0 (0.0%) |
| $10,000 to $14,999 | 0 (0.0%) | 0 (0.0%) |
| $15,000 to $19,999 | 0 (0.0%) | 0 (0.0%) |
| $20,000 to $24,999 | 2 (15.4%) | 0 (0.0%) |
| $25,000 to $34,999 | 3 (23.1%) | 0 (0.0%) |
| $35,000 to $49,999 | 3 (23.1%) | 0 (0.0%) |
| $50,000 to $74,999 | 3 (23.1%) | 0 (0.0%) |
| $75,000 to $99,999 | 0 (0.0%) | 0 (0.0%) |
| $100,000 to $149,999 | 0 (0.0%) | 0 (0.0%) |
| $150,000 or more | 1 (7.7%) | 0 (0.0%) |
| Total | 13 (100.0%) | 0 (0.0%) |
Monthly Housing Cost Tiers in Gandy
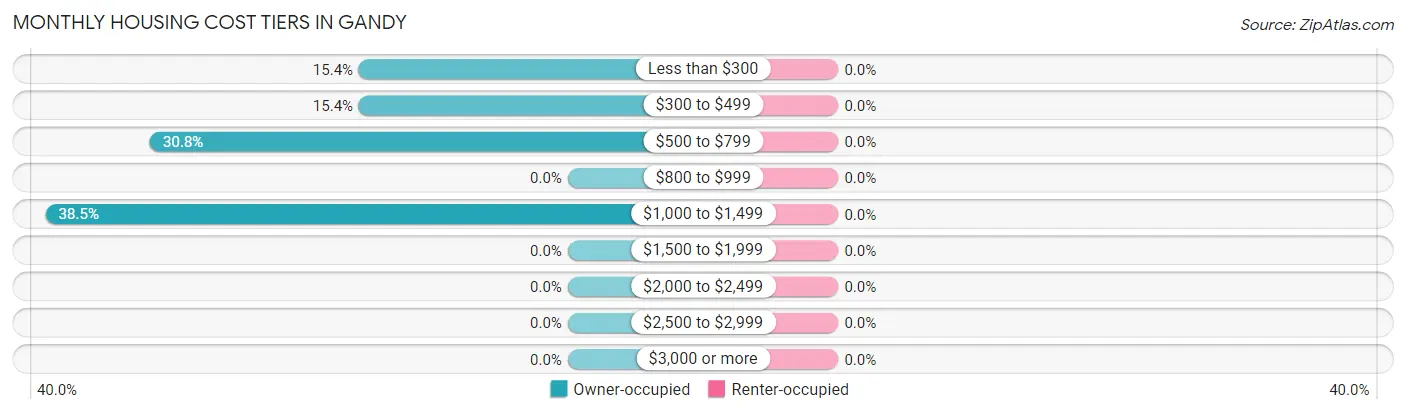
| Monthly Cost | Owner-occupied | Renter-occupied |
| Less than $300 | 2 (15.4%) | 0 (0.0%) |
| $300 to $499 | 2 (15.4%) | 0 (0.0%) |
| $500 to $799 | 4 (30.8%) | 0 (0.0%) |
| $800 to $999 | 0 (0.0%) | 0 (0.0%) |
| $1,000 to $1,499 | 5 (38.5%) | 0 (0.0%) |
| $1,500 to $1,999 | 0 (0.0%) | 0 (0.0%) |
| $2,000 to $2,499 | 0 (0.0%) | 0 (0.0%) |
| $2,500 to $2,999 | 0 (0.0%) | 0 (0.0%) |
| $3,000 or more | 0 (0.0%) | 0 (0.0%) |
| Total | 13 (100.0%) | 0 (0.0%) |
Physical Housing Characteristics in Gandy
Housing Structures in Gandy
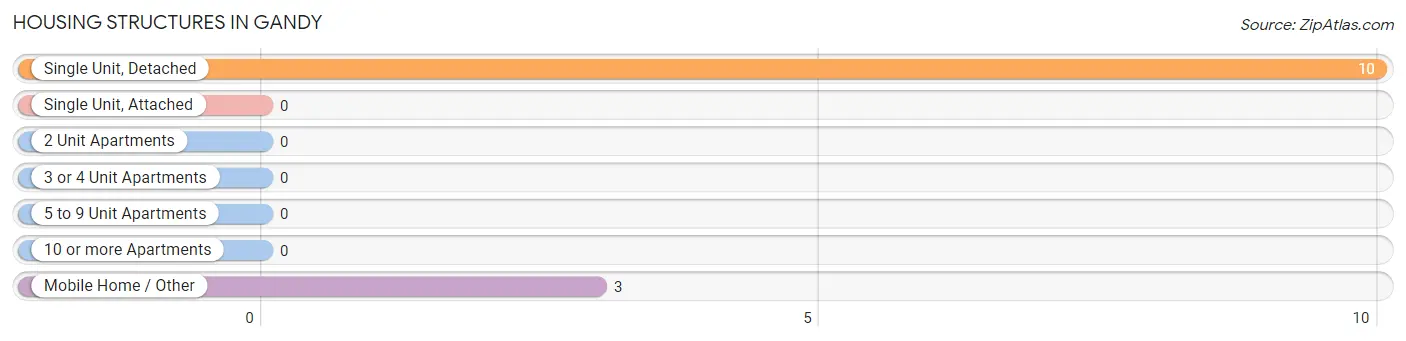
| Structure Type | # Housing Units | % Housing Units |
| Single Unit, Detached | 10 | 76.9% |
| Single Unit, Attached | 0 | 0.0% |
| 2 Unit Apartments | 0 | 0.0% |
| 3 or 4 Unit Apartments | 0 | 0.0% |
| 5 to 9 Unit Apartments | 0 | 0.0% |
| 10 or more Apartments | 0 | 0.0% |
| Mobile Home / Other | 3 | 23.1% |
| Total | 13 | 100.0% |
Housing Structures by Occupancy in Gandy
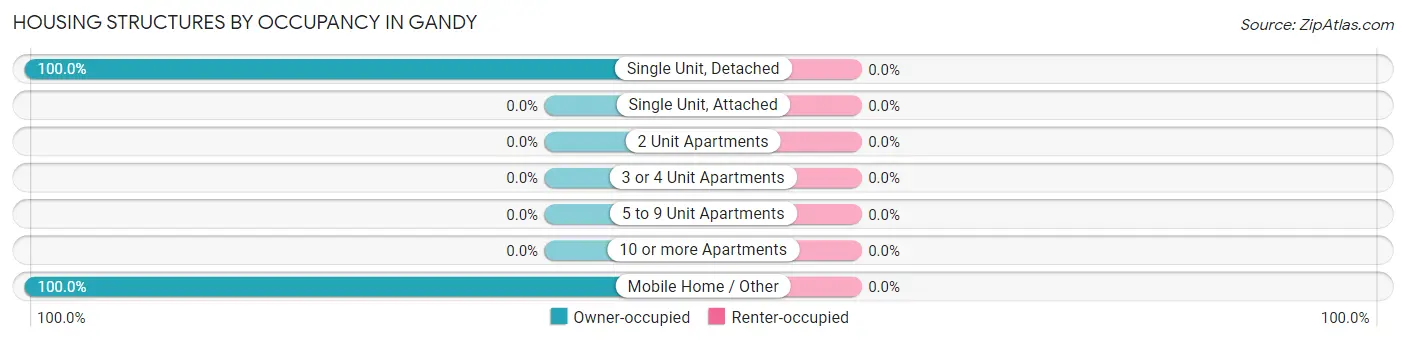
| Structure Type | Owner-occupied | Renter-occupied |
| Single Unit, Detached | 10 (100.0%) | 0 (0.0%) |
| Single Unit, Attached | 0 (0.0%) | 0 (0.0%) |
| 2 Unit Apartments | 0 (0.0%) | 0 (0.0%) |
| 3 or 4 Unit Apartments | 0 (0.0%) | 0 (0.0%) |
| 5 to 9 Unit Apartments | 0 (0.0%) | 0 (0.0%) |
| 10 or more Apartments | 0 (0.0%) | 0 (0.0%) |
| Mobile Home / Other | 3 (100.0%) | 0 (0.0%) |
| Total | 13 (100.0%) | 0 (0.0%) |
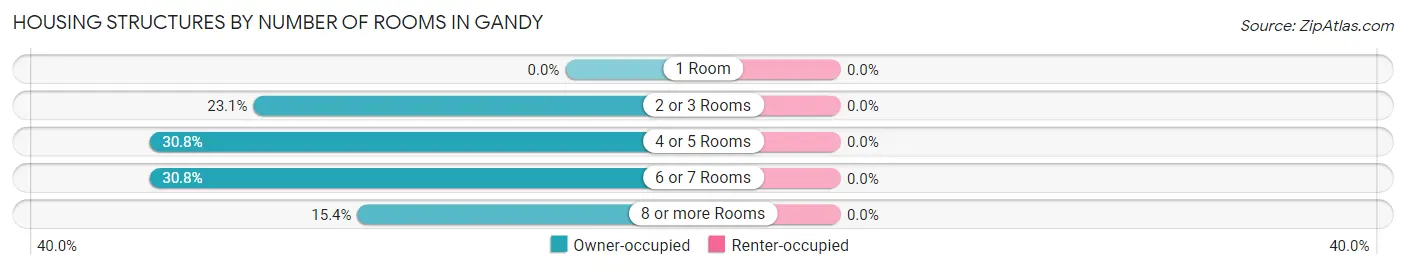
Housing Structures by Number of Rooms in Gandy
| Number of Rooms | Owner-occupied | Renter-occupied |
| 1 Room | 0 (0.0%) | 0 (0.0%) |
| 2 or 3 Rooms | 3 (23.1%) | 0 (0.0%) |
| 4 or 5 Rooms | 4 (30.8%) | 0 (0.0%) |
| 6 or 7 Rooms | 4 (30.8%) | 0 (0.0%) |
| 8 or more Rooms | 2 (15.4%) | 0 (0.0%) |
| Total | 13 (100.0%) | 0 (0.0%) |
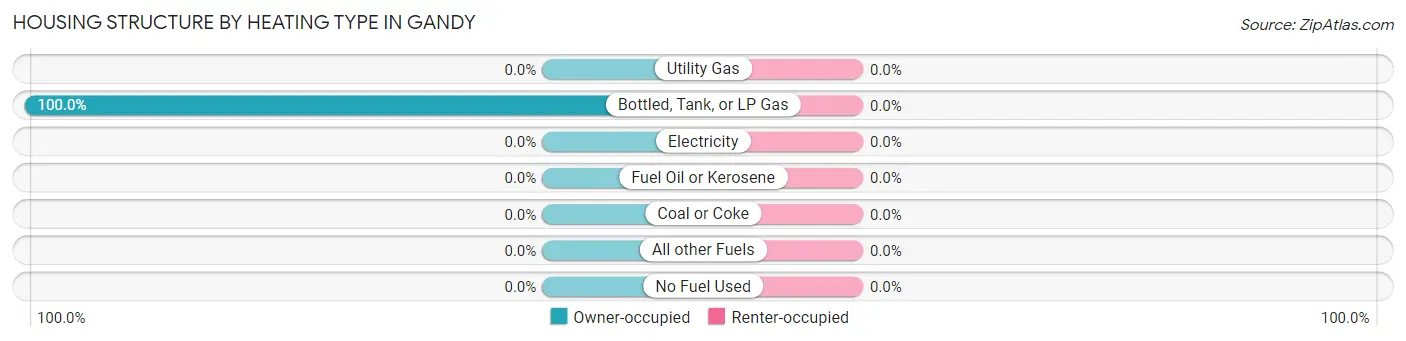
Housing Structure by Heating Type in Gandy
| Heating Type | Owner-occupied | Renter-occupied |
| Utility Gas | 0 (0.0%) | 0 (0.0%) |
| Bottled, Tank, or LP Gas | 13 (100.0%) | 0 (0.0%) |
| Electricity | 0 (0.0%) | 0 (0.0%) |
| Fuel Oil or Kerosene | 0 (0.0%) | 0 (0.0%) |
| Coal or Coke | 0 (0.0%) | 0 (0.0%) |
| All other Fuels | 0 (0.0%) | 0 (0.0%) |
| No Fuel Used | 0 (0.0%) | 0 (0.0%) |
| Total | 13 (100.0%) | 0 (0.0%) |
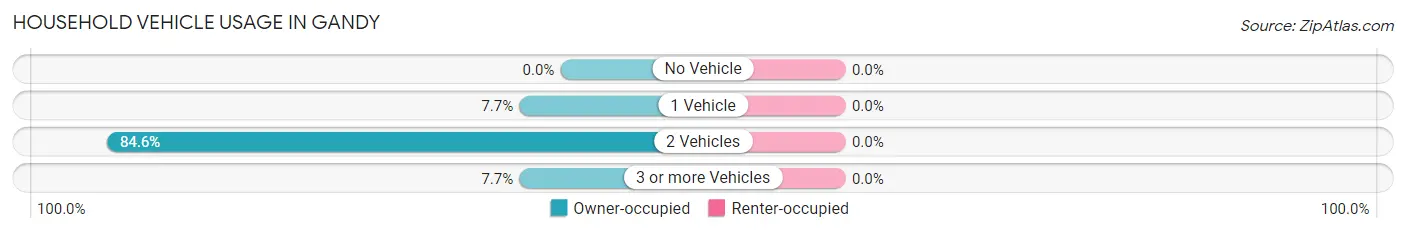
Household Vehicle Usage in Gandy
| Vehicles per Household | Owner-occupied | Renter-occupied |
| No Vehicle | 0 (0.0%) | 0 (0.0%) |
| 1 Vehicle | 1 (7.7%) | 0 (0.0%) |
| 2 Vehicles | 11 (84.6%) | 0 (0.0%) |
| 3 or more Vehicles | 1 (7.7%) | 0 (0.0%) |
| Total | 13 (100.0%) | 0 (0.0%) |
Real Estate & Mortgages in Gandy
Real Estate and Mortgage Overview in Gandy
| Characteristic | Without Mortgage | With Mortgage |
| Housing Units | 8 | 5 |
| Median Property Value | $50,000 | $0 |
| Median Household Income | $30,833 | $0 |
| Monthly Housing Costs | $600 | $0 |
| Real Estate Taxes | - | - |
Property Value by Mortgage Status in Gandy
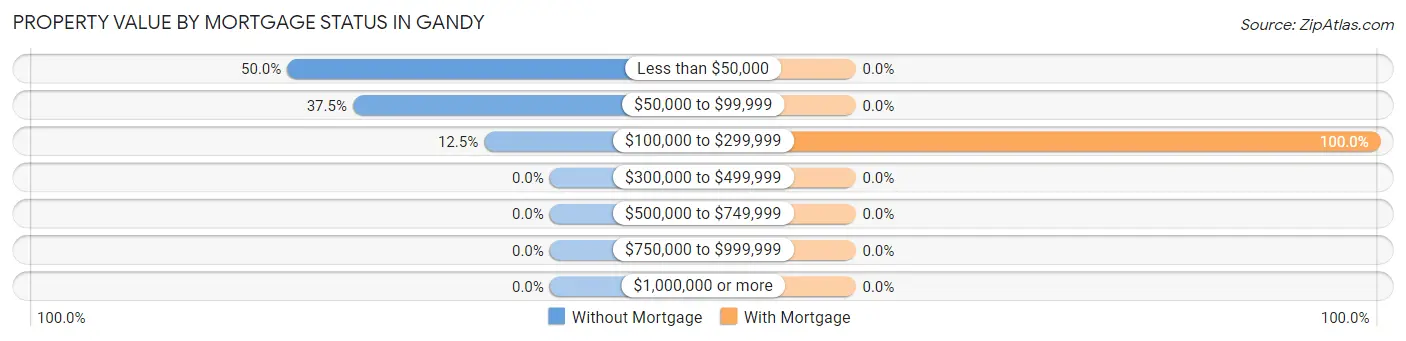
| Property Value | Without Mortgage | With Mortgage |
| Less than $50,000 | 4 (50.0%) | 0 (0.0%) |
| $50,000 to $99,999 | 3 (37.5%) | 0 (0.0%) |
| $100,000 to $299,999 | 1 (12.5%) | 5 (100.0%) |
| $300,000 to $499,999 | 0 (0.0%) | 0 (0.0%) |
| $500,000 to $749,999 | 0 (0.0%) | 0 (0.0%) |
| $750,000 to $999,999 | 0 (0.0%) | 0 (0.0%) |
| $1,000,000 or more | 0 (0.0%) | 0 (0.0%) |
| Total | 8 (100.0%) | 5 (100.0%) |
Household Income by Mortgage Status in Gandy
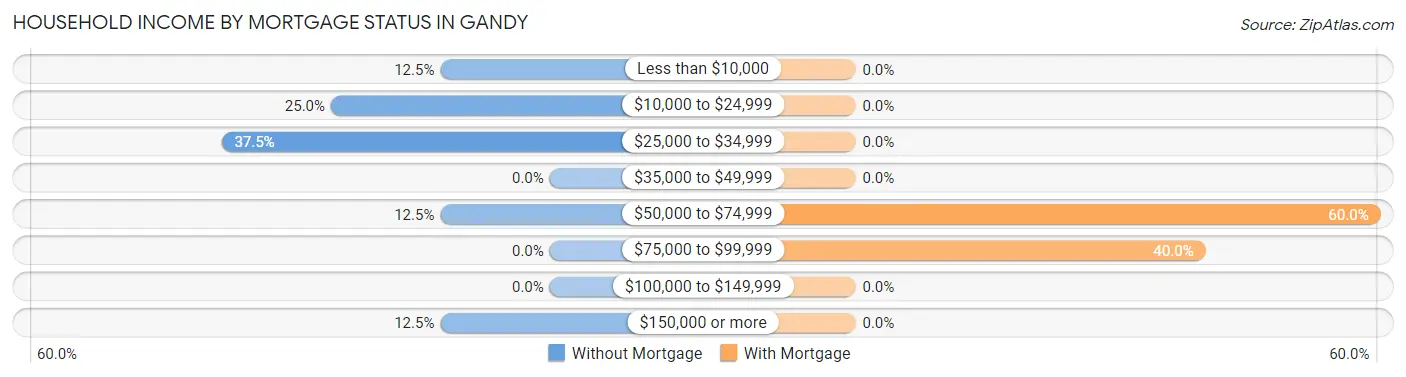
| Household Income | Without Mortgage | With Mortgage |
| Less than $10,000 | 1 (12.5%) | 0 (0.0%) |
| $10,000 to $24,999 | 2 (25.0%) | 0 (0.0%) |
| $25,000 to $34,999 | 3 (37.5%) | 0 (0.0%) |
| $35,000 to $49,999 | 0 (0.0%) | 0 (0.0%) |
| $50,000 to $74,999 | 1 (12.5%) | 3 (60.0%) |
| $75,000 to $99,999 | 0 (0.0%) | 2 (40.0%) |
| $100,000 to $149,999 | 0 (0.0%) | 0 (0.0%) |
| $150,000 or more | 1 (12.5%) | 0 (0.0%) |
| Total | 8 (100.0%) | 5 (100.0%) |
Property Value to Household Income Ratio in Gandy
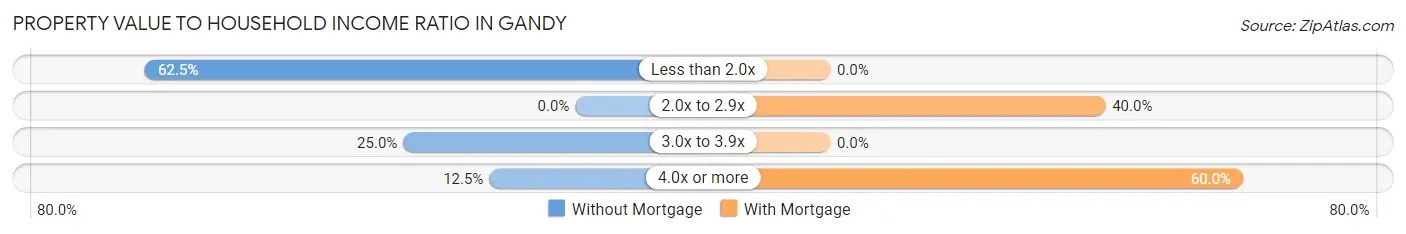
| Value-to-Income Ratio | Without Mortgage | With Mortgage |
| Less than 2.0x | 5 (62.5%) | 0 (0.0%) |
| 2.0x to 2.9x | 0 (0.0%) | 2 (40.0%) |
| 3.0x to 3.9x | 2 (25.0%) | 0 (0.0%) |
| 4.0x or more | 1 (12.5%) | 3 (60.0%) |
| Total | 8 (100.0%) | 5 (100.0%) |
Real Estate Taxes by Mortgage Status in Gandy
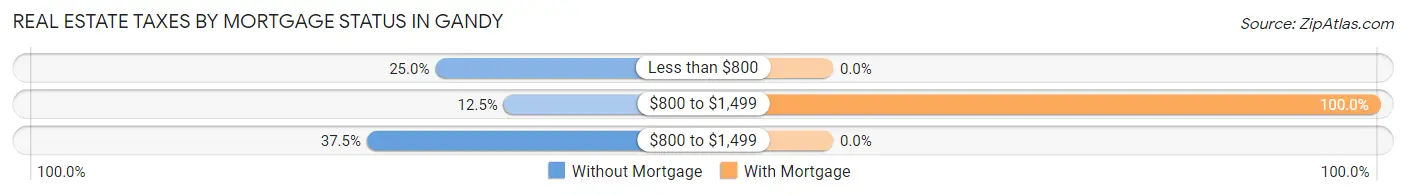
| Property Taxes | Without Mortgage | With Mortgage |
| Less than $800 | 2 (25.0%) | 0 (0.0%) |
| $800 to $1,499 | 1 (12.5%) | 5 (100.0%) |
| $800 to $1,499 | 3 (37.5%) | 0 (0.0%) |
| Total | 8 (100.0%) | 5 (100.0%) |
Health & Disability in Gandy
Health Insurance Coverage by Age in Gandy
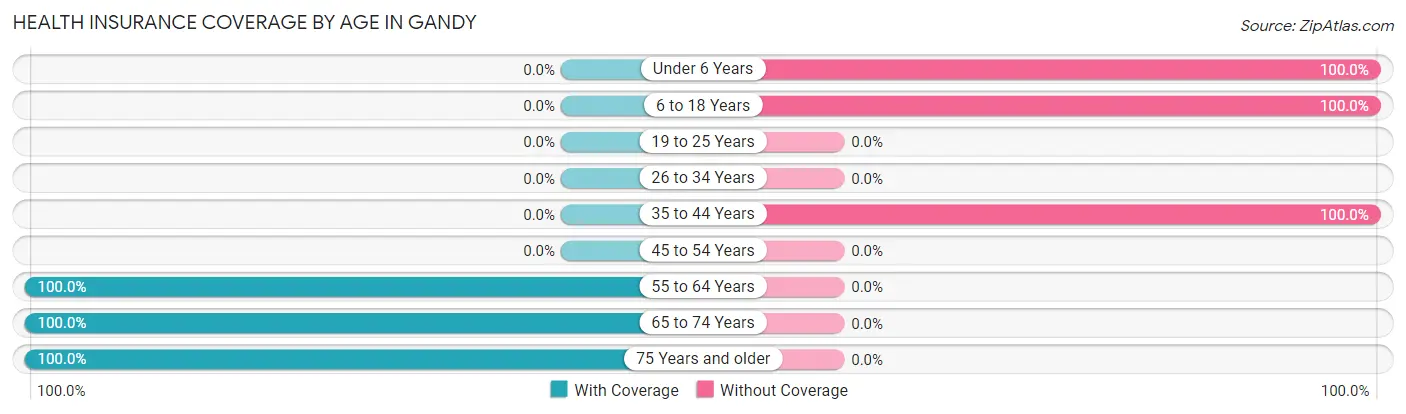
| Age Bracket | With Coverage | Without Coverage |
| Under 6 Years | 0 (0.0%) | 1 (100.0%) |
| 6 to 18 Years | 0 (0.0%) | 5 (100.0%) |
| 19 to 25 Years | 0 (0.0%) | 0 (0.0%) |
| 26 to 34 Years | 0 (0.0%) | 0 (0.0%) |
| 35 to 44 Years | 0 (0.0%) | 4 (100.0%) |
| 45 to 54 Years | 0 (0.0%) | 0 (0.0%) |
| 55 to 64 Years | 5 (100.0%) | 0 (0.0%) |
| 65 to 74 Years | 8 (100.0%) | 0 (0.0%) |
| 75 Years and older | 3 (100.0%) | 0 (0.0%) |
| Total | 16 (61.5%) | 10 (38.5%) |
Health Insurance Coverage by Citizenship Status in Gandy
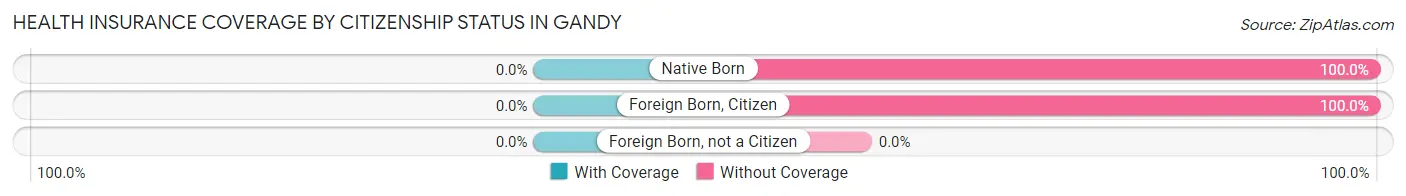
| Citizenship Status | With Coverage | Without Coverage |
| Native Born | 0 (0.0%) | 1 (100.0%) |
| Foreign Born, Citizen | 0 (0.0%) | 5 (100.0%) |
| Foreign Born, not a Citizen | 0 (0.0%) | 0 (0.0%) |
Health Insurance Coverage by Household Income in Gandy
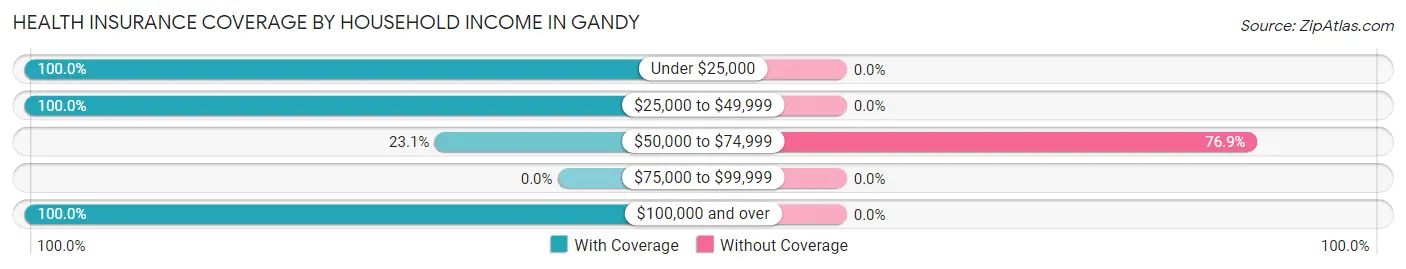
| Household Income | With Coverage | Without Coverage |
| Under $25,000 | 5 (100.0%) | 0 (0.0%) |
| $25,000 to $49,999 | 6 (100.0%) | 0 (0.0%) |
| $50,000 to $74,999 | 3 (23.1%) | 10 (76.9%) |
| $75,000 to $99,999 | 0 (0.0%) | 0 (0.0%) |
| $100,000 and over | 2 (100.0%) | 0 (0.0%) |
Public vs Private Health Insurance Coverage by Age in Gandy
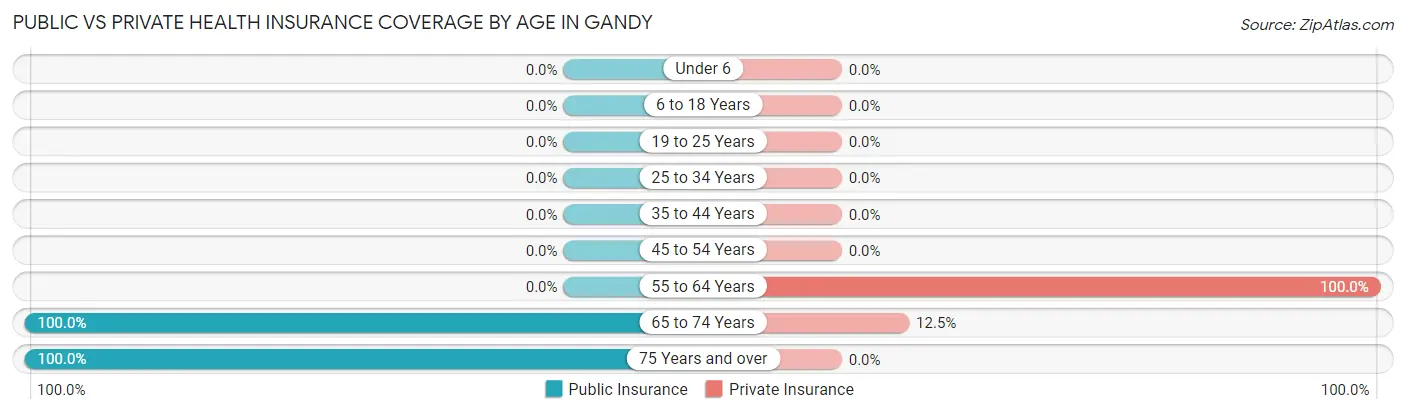
| Age Bracket | Public Insurance | Private Insurance |
| Under 6 | 0 (0.0%) | 0 (0.0%) |
| 6 to 18 Years | 0 (0.0%) | 0 (0.0%) |
| 19 to 25 Years | 0 (0.0%) | 0 (0.0%) |
| 25 to 34 Years | 0 (0.0%) | 0 (0.0%) |
| 35 to 44 Years | 0 (0.0%) | 0 (0.0%) |
| 45 to 54 Years | 0 (0.0%) | 0 (0.0%) |
| 55 to 64 Years | 0 (0.0%) | 5 (100.0%) |
| 65 to 74 Years | 8 (100.0%) | 1 (12.5%) |
| 75 Years and over | 3 (100.0%) | 0 (0.0%) |
| Total | 11 (42.3%) | 6 (23.1%) |
Disability Status by Sex by Age in Gandy
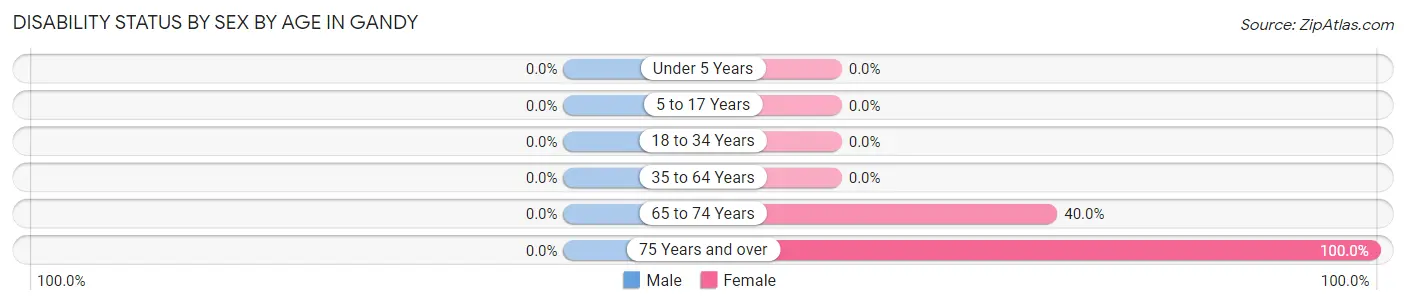
| Age Bracket | Male | Female |
| Under 5 Years | 0 (0.0%) | 0 (0.0%) |
| 5 to 17 Years | 0 (0.0%) | 0 (0.0%) |
| 18 to 34 Years | 0 (0.0%) | 0 (0.0%) |
| 35 to 64 Years | 0 (0.0%) | 0 (0.0%) |
| 65 to 74 Years | 0 (0.0%) | 2 (40.0%) |
| 75 Years and over | 0 (0.0%) | 3 (100.0%) |
Disability Class by Sex by Age in Gandy
Disability Class: Hearing Difficulty
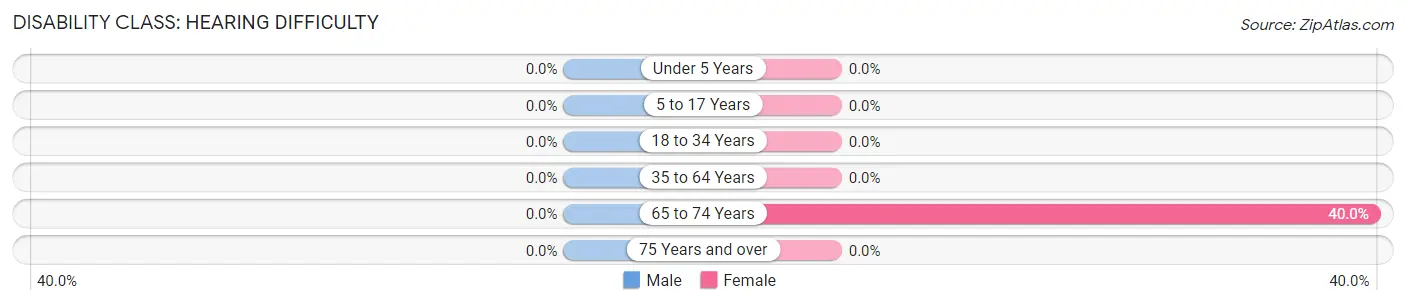
| Age Bracket | Male | Female |
| Under 5 Years | 0 (0.0%) | 0 (0.0%) |
| 5 to 17 Years | 0 (0.0%) | 0 (0.0%) |
| 18 to 34 Years | 0 (0.0%) | 0 (0.0%) |
| 35 to 64 Years | 0 (0.0%) | 0 (0.0%) |
| 65 to 74 Years | 0 (0.0%) | 2 (40.0%) |
| 75 Years and over | 0 (0.0%) | 0 (0.0%) |
Disability Class: Vision Difficulty
| Age Bracket | Male | Female |
| Under 5 Years | 0 (0.0%) | 0 (0.0%) |
| 5 to 17 Years | 0 (0.0%) | 0 (0.0%) |
| 18 to 34 Years | 0 (0.0%) | 0 (0.0%) |
| 35 to 64 Years | 0 (0.0%) | 0 (0.0%) |
| 65 to 74 Years | 0 (0.0%) | 0 (0.0%) |
| 75 Years and over | 0 (0.0%) | 0 (0.0%) |
Disability Class: Cognitive Difficulty
| Age Bracket | Male | Female |
| 5 to 17 Years | 0 (0.0%) | 0 (0.0%) |
| 18 to 34 Years | 0 (0.0%) | 0 (0.0%) |
| 35 to 64 Years | 0 (0.0%) | 0 (0.0%) |
| 65 to 74 Years | 0 (0.0%) | 0 (0.0%) |
| 75 Years and over | 0 (0.0%) | 0 (0.0%) |
Disability Class: Ambulatory Difficulty
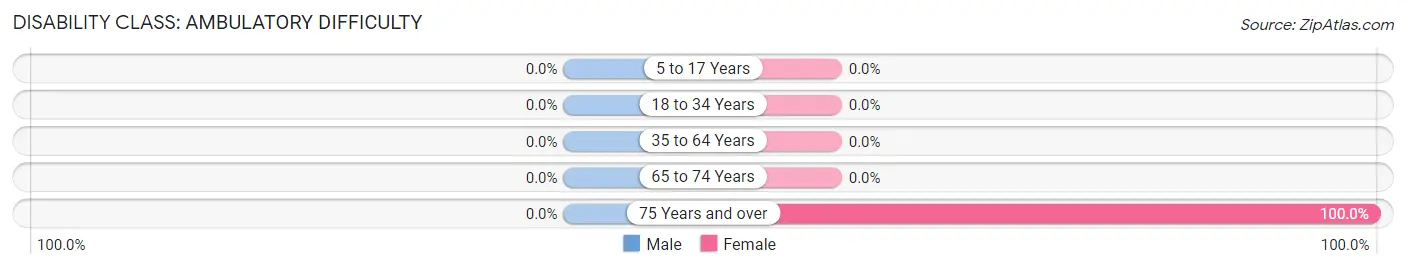
| Age Bracket | Male | Female |
| 5 to 17 Years | 0 (0.0%) | 0 (0.0%) |
| 18 to 34 Years | 0 (0.0%) | 0 (0.0%) |
| 35 to 64 Years | 0 (0.0%) | 0 (0.0%) |
| 65 to 74 Years | 0 (0.0%) | 0 (0.0%) |
| 75 Years and over | 0 (0.0%) | 3 (100.0%) |
Disability Class: Self-Care Difficulty
| Age Bracket | Male | Female |
| 5 to 17 Years | 0 (0.0%) | 0 (0.0%) |
| 18 to 34 Years | 0 (0.0%) | 0 (0.0%) |
| 35 to 64 Years | 0 (0.0%) | 0 (0.0%) |
| 65 to 74 Years | 0 (0.0%) | 0 (0.0%) |
| 75 Years and over | 0 (0.0%) | 0 (0.0%) |
Technology Access in Gandy
Computing Device Access in Gandy
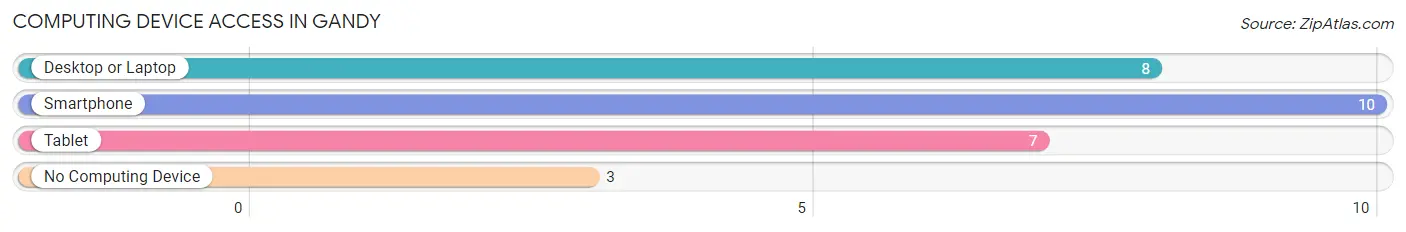
| Device Type | # Households | % Households |
| Desktop or Laptop | 8 | 61.5% |
| Smartphone | 10 | 76.9% |
| Tablet | 7 | 53.8% |
| No Computing Device | 3 | 23.1% |
| Total | 13 | 100.0% |
Internet Access in Gandy
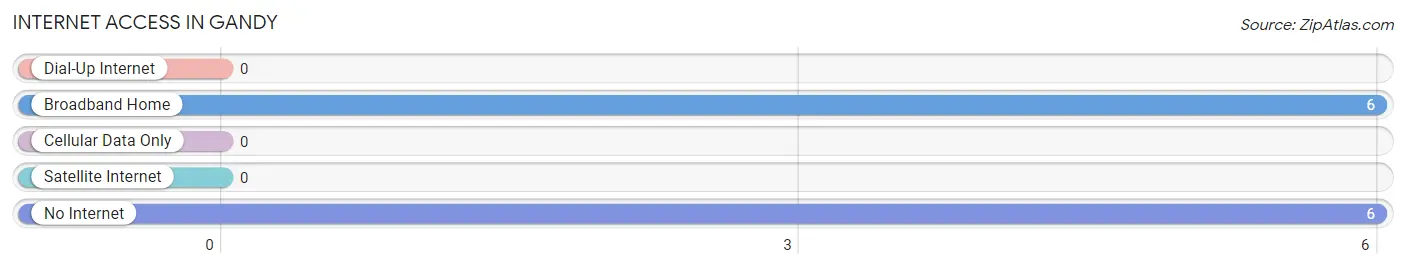
| Internet Type | # Households | % Households |
| Dial-Up Internet | 0 | 0.0% |
| Broadband Home | 6 | 46.2% |
| Cellular Data Only | 0 | 0.0% |
| Satellite Internet | 0 | 0.0% |
| No Internet | 6 | 46.2% |
| Total | 13 | 100.0% |
Gandy Summary
Gandy is a small town located in the state of Nebraska in the United States. It is situated in the southeastern corner of the state, near the border with Iowa. The town was founded in 1887 and has a population of approximately 200 people.
Gandy is located in the Platte River Valley, which is a major agricultural region in Nebraska. The town is situated on the banks of the Platte River, which provides a source of irrigation for the surrounding farmland. The town is also located near the Missouri River, which provides a source of recreation for the residents of Gandy.
The economy of Gandy is largely based on agriculture. The town is home to several farms, which produce a variety of crops, including corn, soybeans, wheat, and hay. The town also has a few small businesses, such as a grocery store, a hardware store, and a gas station.
The demographics of Gandy are largely homogeneous. The majority of the population is white, with a small percentage of African Americans and Hispanics. The median household income in Gandy is approximately $35,000, which is slightly lower than the national average. The town has a low unemployment rate, and the majority of the population is employed in the agricultural sector.
Gandy is served by the Gandy Public School District, which consists of one elementary school and one high school. The town also has a library, a post office, and a few churches. The town is home to a few parks, including a city park and a county park.
Gandy is a small town with a rich history and a strong sense of community. The town is home to a variety of people, from farmers to business owners, and everyone in between. The town is a great place to live, work, and raise a family.
Common Questions
What is Per Capita Income in Gandy?
Per Capita income in Gandy is $27,100.
What is the Median Family Income in Gandy?
Median Family Income in Gandy is $61,250.
What is the Median Household income in Gandy?
Median Household Income in Gandy is $42,917.
What is Inequality or Gini Index in Gandy?
Inequality or Gini Index in Gandy is 0.41.
What is the Total Population of Gandy?
Total Population of Gandy is 26.
What is the Total Male Population of Gandy?
Total Male Population of Gandy is 10.
What is the Total Female Population of Gandy?
Total Female Population of Gandy is 16.
What is the Ratio of Males per 100 Females in Gandy?
There are 62.50 Males per 100 Females in Gandy.
What is the Ratio of Females per 100 Males in Gandy?
There are 160.00 Females per 100 Males in Gandy.
What is the Median Population Age in Gandy?
Median Population Age in Gandy is 60.0 Years.
What is the Average Family Size in Gandy
Average Family Size in Gandy is 3.2 People.
What is the Average Household Size in Gandy
Average Household Size in Gandy is 2.0 People.
How Large is the Labor Force in Gandy?
There are 11 People in the Labor Forcein in Gandy.
What is the Percentage of People in the Labor Force in Gandy?
55.0% of People are in the Labor Force in Gandy.