Friend, NE Map & Demographics
Friend Map
Friend Overview
$36,084
PER CAPITA INCOME
$95,000
AVG FAMILY INCOME
$77,386
AVG HOUSEHOLD INCOME
14.7%
WAGE / INCOME GAP [ % ]
85.3¢/ $1
WAGE / INCOME GAP [ $ ]
0.36
INEQUALITY / GINI INDEX
1,117
TOTAL POPULATION
532
MALE POPULATION
585
FEMALE POPULATION
90.94
MALES / 100 FEMALES
109.96
FEMALES / 100 MALES
38.8
MEDIAN AGE
2.6
AVG FAMILY SIZE
2.3
AVG HOUSEHOLD SIZE
622
LABOR FORCE [ PEOPLE ]
70.8%
PERCENT IN LABOR FORCE
1.4%
UNEMPLOYMENT RATE
Friend Zip Codes
Friend Area Codes
Income in Friend
Income Overview in Friend
Per Capita Income in Friend is $36,084, while median incomes of families and households are $95,000 and $77,386 respectively.
| Characteristic | Number | Measure |
| Per Capita Income | 1,117 | $36,084 |
| Median Family Income | 338 | $95,000 |
| Mean Family Income | 338 | $106,965 |
| Median Household Income | 478 | $77,386 |
| Mean Household Income | 478 | $93,267 |
| Income Deficit | 338 | $0 |
| Wage / Income Gap (%) | 1,117 | 14.72% |
| Wage / Income Gap ($) | 1,117 | 85.28¢ per $1 |
| Gini / Inequality Index | 1,117 | 0.36 |
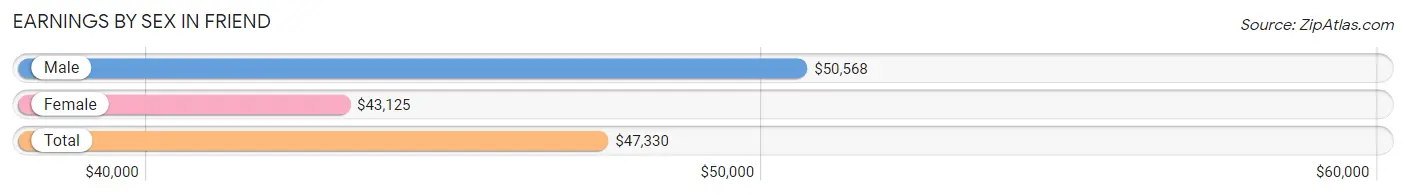
Earnings by Sex in Friend
Average Earnings in Friend are $47,330, $50,568 for men and $43,125 for women, a difference of 14.7%.
| Sex | Number | Average Earnings |
| Male | 317 (49.2%) | $50,568 |
| Female | 327 (50.8%) | $43,125 |
| Total | 644 (100.0%) | $47,330 |
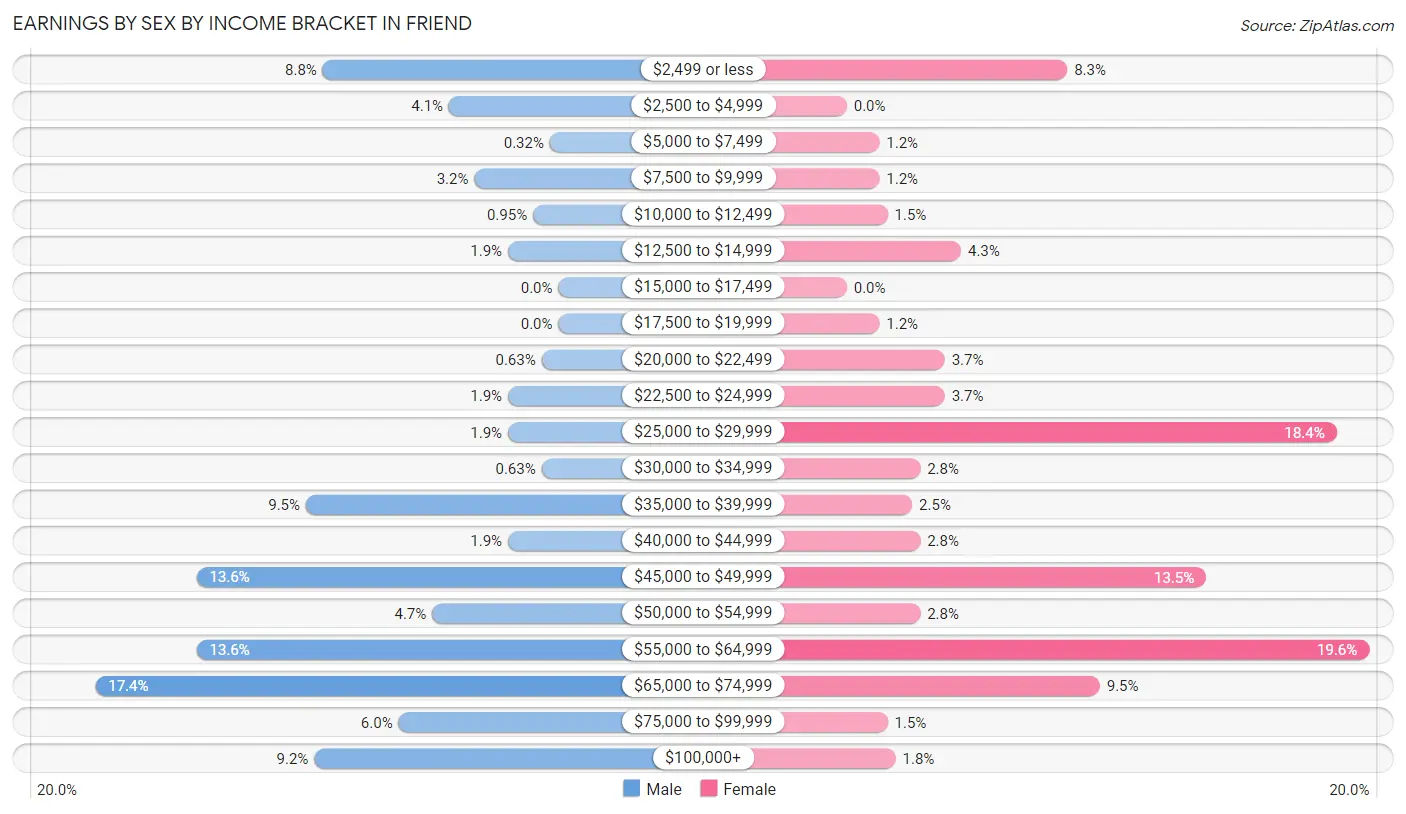
Earnings by Sex by Income Bracket in Friend
The most common earnings brackets in Friend are $65,000 to $74,999 for men (55 | 17.3%) and $55,000 to $64,999 for women (64 | 19.6%).
| Income | Male | Female |
| $2,499 or less | 28 (8.8%) | 27 (8.3%) |
| $2,500 to $4,999 | 13 (4.1%) | 0 (0.0%) |
| $5,000 to $7,499 | 1 (0.3%) | 4 (1.2%) |
| $7,500 to $9,999 | 10 (3.2%) | 4 (1.2%) |
| $10,000 to $12,499 | 3 (0.9%) | 5 (1.5%) |
| $12,500 to $14,999 | 6 (1.9%) | 14 (4.3%) |
| $15,000 to $17,499 | 0 (0.0%) | 0 (0.0%) |
| $17,500 to $19,999 | 0 (0.0%) | 4 (1.2%) |
| $20,000 to $22,499 | 2 (0.6%) | 12 (3.7%) |
| $22,500 to $24,999 | 6 (1.9%) | 12 (3.7%) |
| $25,000 to $29,999 | 6 (1.9%) | 60 (18.3%) |
| $30,000 to $34,999 | 2 (0.6%) | 9 (2.8%) |
| $35,000 to $39,999 | 30 (9.5%) | 8 (2.5%) |
| $40,000 to $44,999 | 6 (1.9%) | 9 (2.8%) |
| $45,000 to $49,999 | 43 (13.6%) | 44 (13.5%) |
| $50,000 to $54,999 | 15 (4.7%) | 9 (2.8%) |
| $55,000 to $64,999 | 43 (13.6%) | 64 (19.6%) |
| $65,000 to $74,999 | 55 (17.3%) | 31 (9.5%) |
| $75,000 to $99,999 | 19 (6.0%) | 5 (1.5%) |
| $100,000+ | 29 (9.1%) | 6 (1.8%) |
| Total | 317 (100.0%) | 327 (100.0%) |
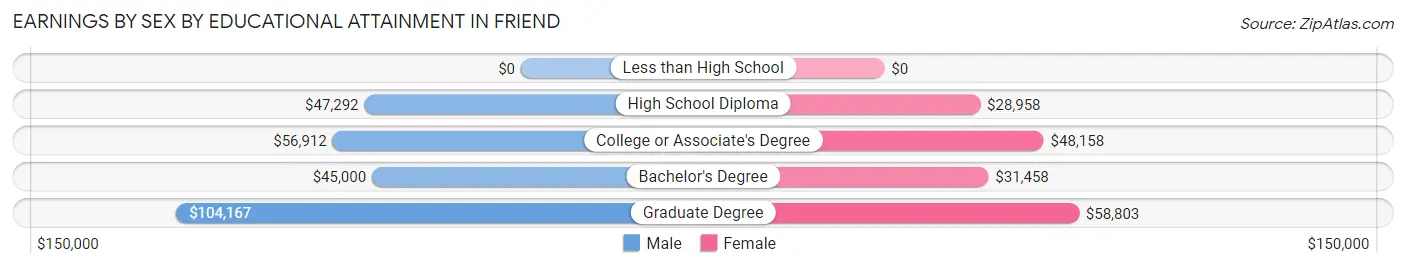
Earnings by Sex by Educational Attainment in Friend
Average earnings in Friend are $55,337 for men and $48,605 for women, a difference of 12.2%. Men with an educational attainment of graduate degree enjoy the highest average annual earnings of $104,167, while those with bachelor's degree education earn the least with $45,000. Women with an educational attainment of graduate degree earn the most with the average annual earnings of $58,803, while those with high school diploma education have the smallest earnings of $28,958.
| Educational Attainment | Male Income | Female Income |
| Less than High School | - | - |
| High School Diploma | $47,292 | $28,958 |
| College or Associate's Degree | $56,912 | $48,158 |
| Bachelor's Degree | $45,000 | $31,458 |
| Graduate Degree | $104,167 | $58,803 |
| Total | $55,337 | $48,605 |
Family Income in Friend
Family Income Brackets in Friend
According to the Friend family income data, there are 127 families falling into the $100,000 to $149,999 income range, which is the most common income bracket and makes up 37.6% of all families. Conversely, the $15,000 to $24,999 income bracket is the least frequent group with only 4 families (1.2%) belonging to this category.
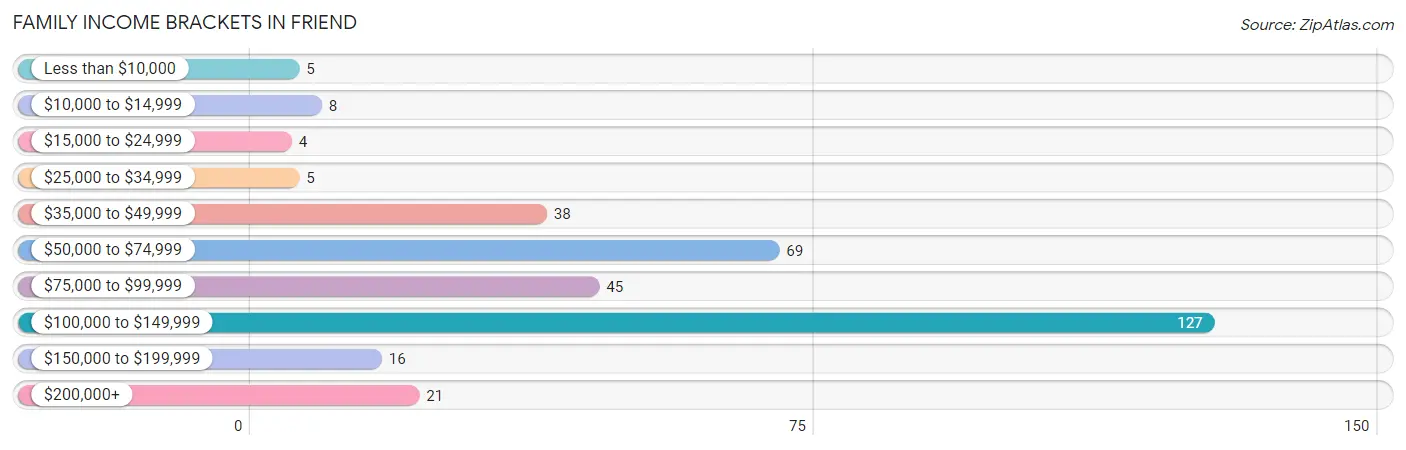
| Income Bracket | # Families | % Families |
| Less than $10,000 | 5 | 1.5% |
| $10,000 to $14,999 | 8 | 2.4% |
| $15,000 to $24,999 | 4 | 1.2% |
| $25,000 to $34,999 | 5 | 1.5% |
| $35,000 to $49,999 | 38 | 11.2% |
| $50,000 to $74,999 | 69 | 20.4% |
| $75,000 to $99,999 | 45 | 13.3% |
| $100,000 to $149,999 | 127 | 37.6% |
| $150,000 to $199,999 | 16 | 4.7% |
| $200,000+ | 21 | 6.2% |
Family Income by Famaliy Size in Friend
5-person families (43 | 12.7%) account for the highest median family income in Friend with $131,283 per family, while 2-person families (163 | 48.2%) have the highest median income of $36,010 per family member.
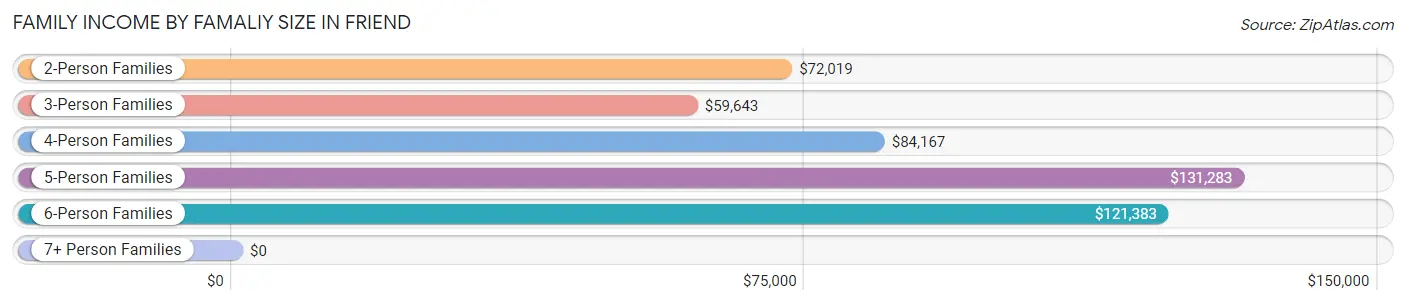
| Income Bracket | # Families | Median Income |
| 2-Person Families | 163 (48.2%) | $72,019 |
| 3-Person Families | 50 (14.8%) | $59,643 |
| 4-Person Families | 30 (8.9%) | $84,167 |
| 5-Person Families | 43 (12.7%) | $131,283 |
| 6-Person Families | 52 (15.4%) | $121,383 |
| 7+ Person Families | 0 (0.0%) | $0 |
| Total | 338 (100.0%) | $95,000 |
Family Income by Number of Earners in Friend
The median family income in Friend is $95,000, with families comprising 2 earners (164) having the highest median family income of $129,500, while families with no earners (48) have the lowest median family income of $49,605, accounting for 48.5% and 14.2% of families, respectively.
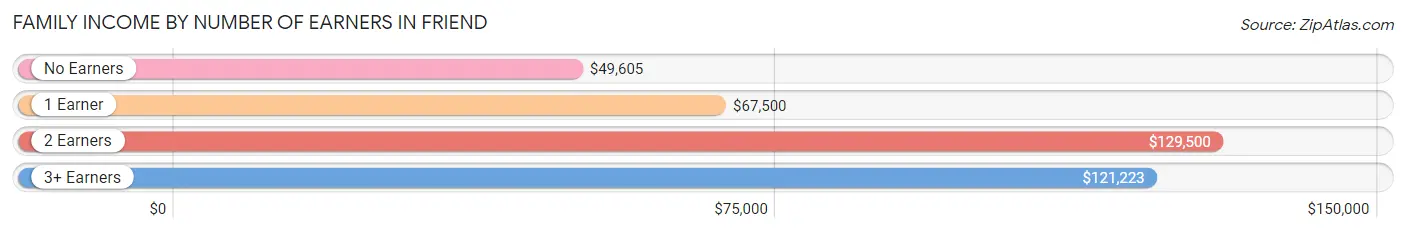
| Number of Earners | # Families | Median Income |
| No Earners | 48 (14.2%) | $49,605 |
| 1 Earner | 72 (21.3%) | $67,500 |
| 2 Earners | 164 (48.5%) | $129,500 |
| 3+ Earners | 54 (16.0%) | $121,223 |
| Total | 338 (100.0%) | $95,000 |
Household Income in Friend
Household Income Brackets in Friend
With 150 households falling in the category, the $100,000 to $149,999 income range is the most frequent in Friend, accounting for 31.4% of all households. In contrast, only 7 households (1.5%) fall into the less than $10,000 income bracket, making it the least populous group.
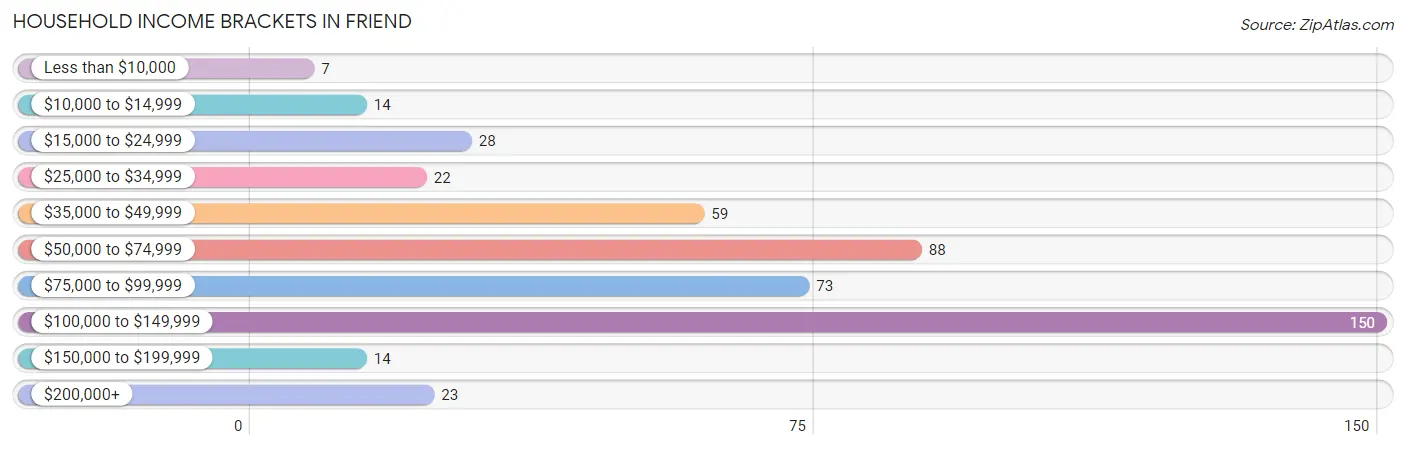
| Income Bracket | # Households | % Households |
| Less than $10,000 | 7 | 1.5% |
| $10,000 to $14,999 | 14 | 2.9% |
| $15,000 to $24,999 | 28 | 5.9% |
| $25,000 to $34,999 | 22 | 4.6% |
| $35,000 to $49,999 | 59 | 12.3% |
| $50,000 to $74,999 | 88 | 18.4% |
| $75,000 to $99,999 | 73 | 15.3% |
| $100,000 to $149,999 | 150 | 31.4% |
| $150,000 to $199,999 | 14 | 2.9% |
| $200,000+ | 23 | 4.8% |
Household Income by Householder Age in Friend
The median household income in Friend is $77,386, with the highest median household income of $121,425 found in the 25 to 44 years age bracket for the primary householder. A total of 197 households (41.2%) fall into this category. Meanwhile, the 15 to 24 years age bracket for the primary householder has the lowest median household income of $47,500, with 6 households (1.3%) in this group.
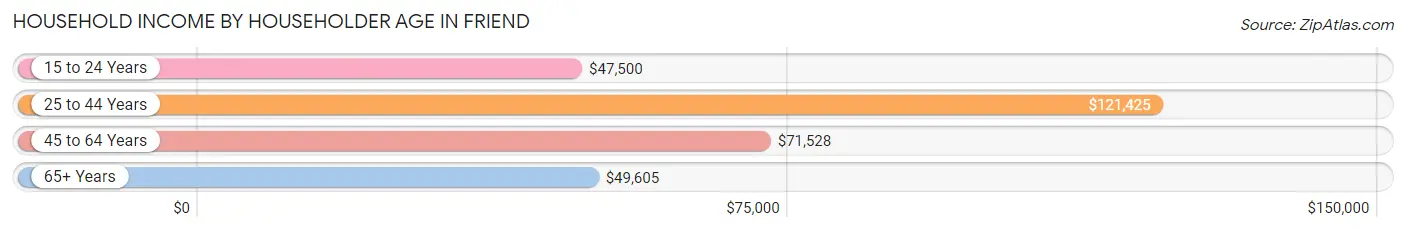
| Income Bracket | # Households | Median Income |
| 15 to 24 Years | 6 (1.3%) | $47,500 |
| 25 to 44 Years | 197 (41.2%) | $121,425 |
| 45 to 64 Years | 139 (29.1%) | $71,528 |
| 65+ Years | 136 (28.4%) | $49,605 |
| Total | 478 (100.0%) | $77,386 |
Poverty in Friend
Income Below Poverty by Sex and Age in Friend
With 3.8% poverty level for males and 8.7% for females among the residents of Friend, 16 and 17 year old males and 5 year old females are the most vulnerable to poverty, with 2 males (13.3%) and 5 females (100.0%) in their respective age groups living below the poverty level.
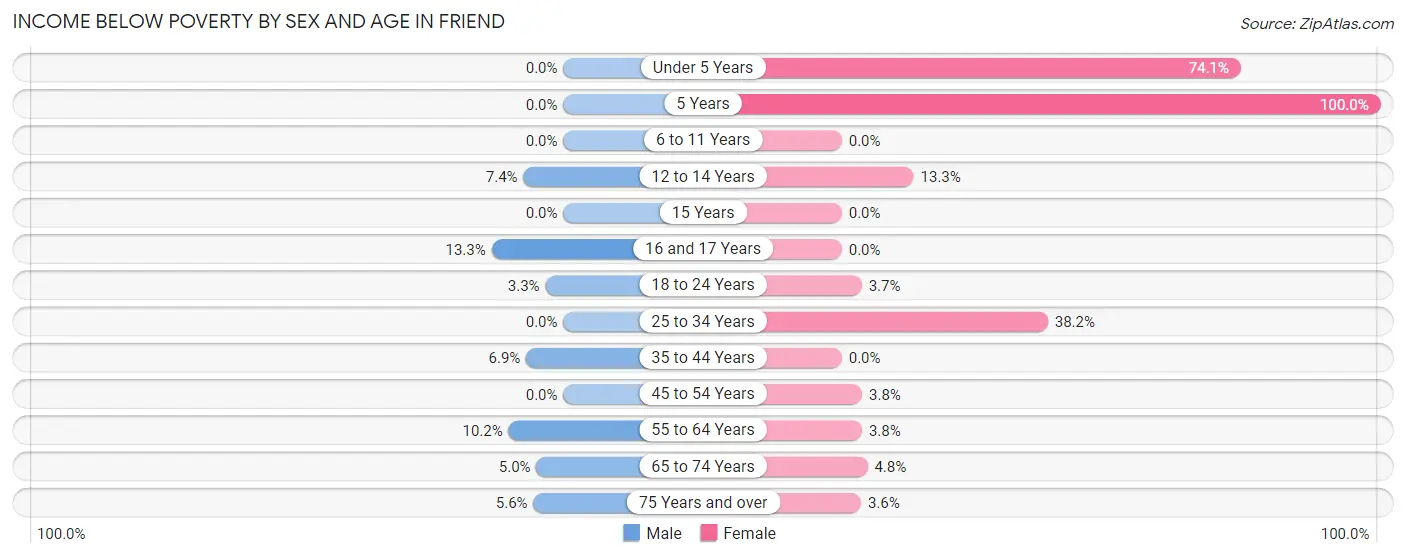
| Age Bracket | Male | Female |
| Under 5 Years | 0 (0.0%) | 20 (74.1%) |
| 5 Years | 0 (0.0%) | 5 (100.0%) |
| 6 to 11 Years | 0 (0.0%) | 0 (0.0%) |
| 12 to 14 Years | 2 (7.4%) | 2 (13.3%) |
| 15 Years | 0 (0.0%) | 0 (0.0%) |
| 16 and 17 Years | 2 (13.3%) | 0 (0.0%) |
| 18 to 24 Years | 1 (3.3%) | 2 (3.7%) |
| 25 to 34 Years | 0 (0.0%) | 13 (38.2%) |
| 35 to 44 Years | 4 (6.9%) | 0 (0.0%) |
| 45 to 54 Years | 0 (0.0%) | 2 (3.8%) |
| 55 to 64 Years | 6 (10.2%) | 3 (3.7%) |
| 65 to 74 Years | 2 (5.0%) | 1 (4.8%) |
| 75 Years and over | 3 (5.6%) | 3 (3.6%) |
| Total | 20 (3.8%) | 51 (8.7%) |
Income Above Poverty by Sex and Age in Friend
According to the poverty statistics in Friend, males aged under 5 years and females aged 6 to 11 years are the age groups that are most secure financially, with 100.0% of males and 100.0% of females in these age groups living above the poverty line.
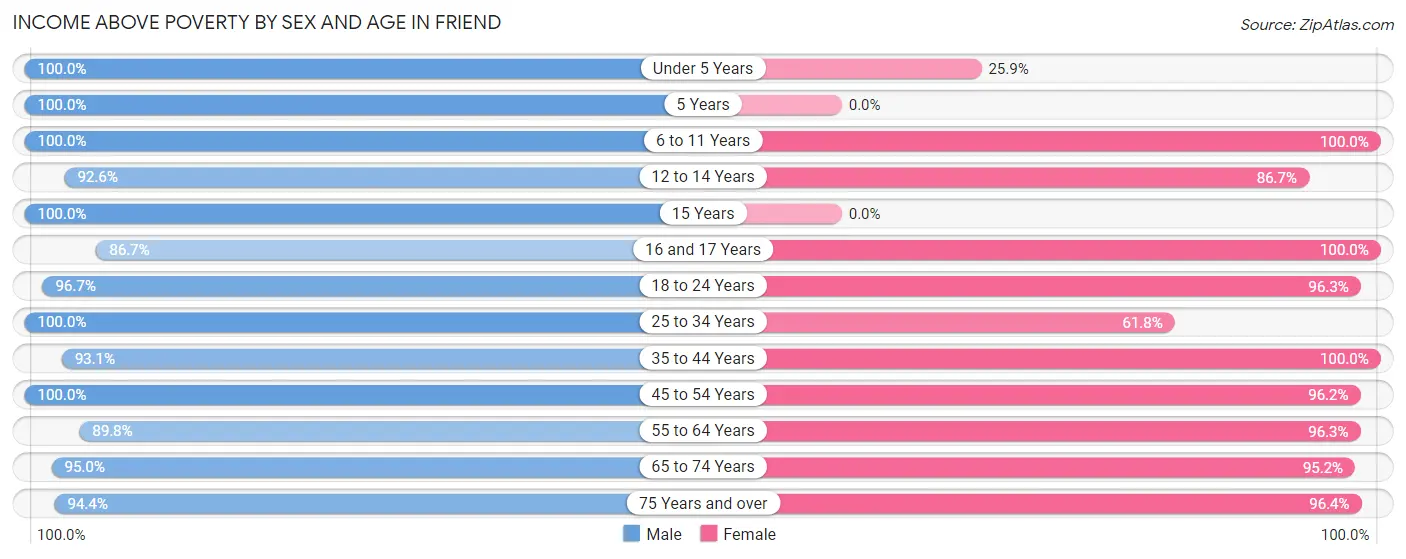
| Age Bracket | Male | Female |
| Under 5 Years | 36 (100.0%) | 7 (25.9%) |
| 5 Years | 4 (100.0%) | 0 (0.0%) |
| 6 to 11 Years | 60 (100.0%) | 56 (100.0%) |
| 12 to 14 Years | 25 (92.6%) | 13 (86.7%) |
| 15 Years | 8 (100.0%) | 0 (0.0%) |
| 16 and 17 Years | 13 (86.7%) | 25 (100.0%) |
| 18 to 24 Years | 29 (96.7%) | 52 (96.3%) |
| 25 to 34 Years | 70 (100.0%) | 21 (61.8%) |
| 35 to 44 Years | 54 (93.1%) | 131 (100.0%) |
| 45 to 54 Years | 71 (100.0%) | 51 (96.2%) |
| 55 to 64 Years | 53 (89.8%) | 77 (96.3%) |
| 65 to 74 Years | 38 (95.0%) | 20 (95.2%) |
| 75 Years and over | 51 (94.4%) | 81 (96.4%) |
| Total | 512 (96.2%) | 534 (91.3%) |
Income Below Poverty Among Married-Couple Families in Friend
The poverty statistics for married-couple families in Friend show that 0.7% or 2 of the total 287 families live below the poverty line. Families with no children have the highest poverty rate of 1.4%, comprising of 2 families. On the other hand, families with 1 or 2 children have the lowest poverty rate of 0.0%, which includes 0 families.
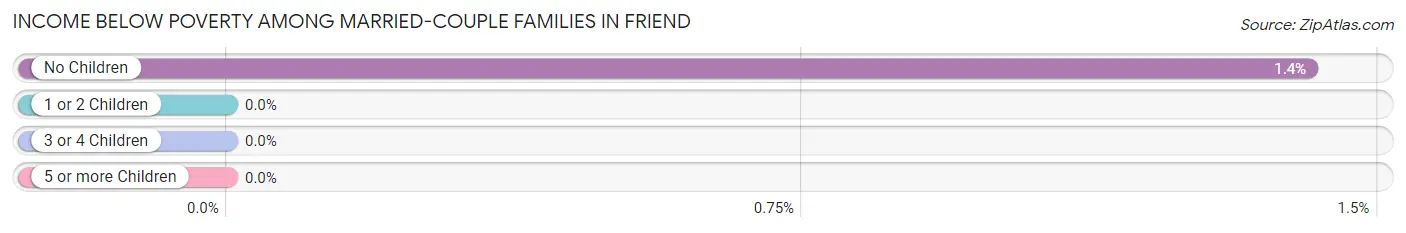
| Children | Above Poverty | Below Poverty |
| No Children | 140 (98.6%) | 2 (1.4%) |
| 1 or 2 Children | 52 (100.0%) | 0 (0.0%) |
| 3 or 4 Children | 93 (100.0%) | 0 (0.0%) |
| 5 or more Children | 0 (0.0%) | 0 (0.0%) |
| Total | 285 (99.3%) | 2 (0.7%) |
Income Below Poverty Among Single-Parent Households in Friend
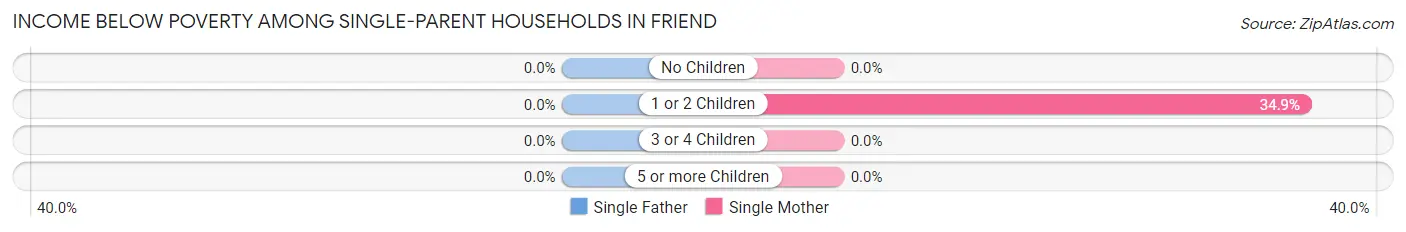
| Children | Single Father | Single Mother |
| No Children | 0 (0.0%) | 0 (0.0%) |
| 1 or 2 Children | 0 (0.0%) | 15 (34.9%) |
| 3 or 4 Children | 0 (0.0%) | 0 (0.0%) |
| 5 or more Children | 0 (0.0%) | 0 (0.0%) |
| Total | 0 (0.0%) | 15 (31.2%) |
Income Below Poverty Among Married-Couple vs Single-Parent Households in Friend
The poverty data for Friend shows that 2 of the married-couple family households (0.7%) and 15 of the single-parent households (29.4%) are living below the poverty level. Within the married-couple family households, those with no children have the highest poverty rate, with 2 households (1.4%) falling below the poverty line. Among the single-parent households, those with 1 or 2 children have the highest poverty rate, with 15 household (33.3%) living below poverty.
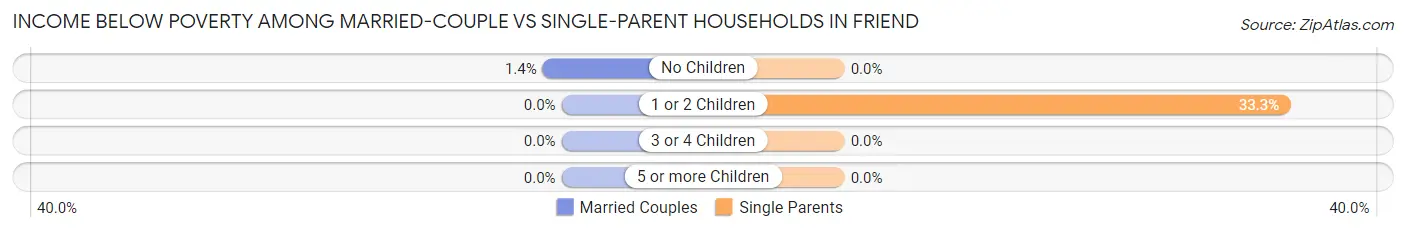
| Children | Married-Couple Families | Single-Parent Households |
| No Children | 2 (1.4%) | 0 (0.0%) |
| 1 or 2 Children | 0 (0.0%) | 15 (33.3%) |
| 3 or 4 Children | 0 (0.0%) | 0 (0.0%) |
| 5 or more Children | 0 (0.0%) | 0 (0.0%) |
| Total | 2 (0.7%) | 15 (29.4%) |
Race in Friend
The most populous races in Friend are White / Caucasian (1,096 | 98.1%), Hispanic or Latino (75 | 6.7%), and Some other Race (21 | 1.9%).
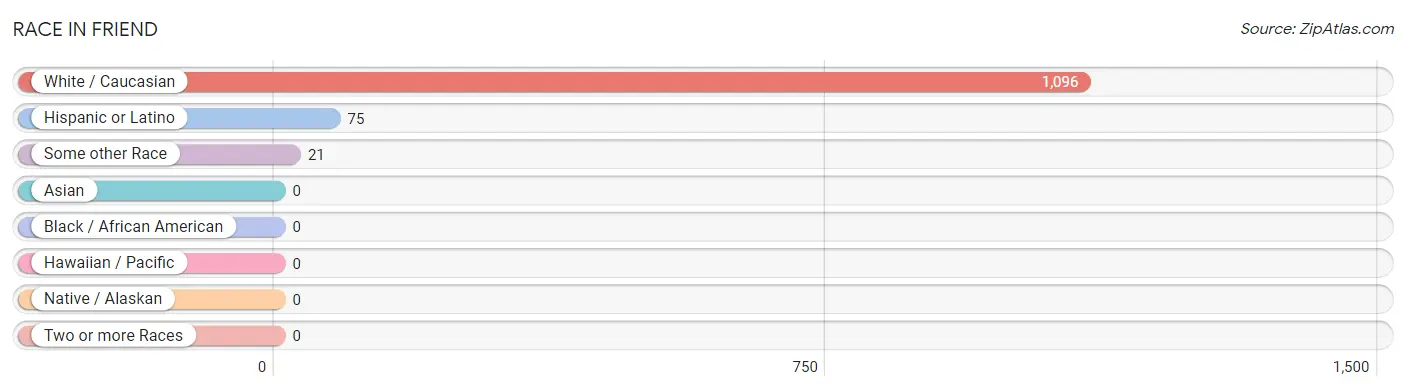
| Race | # Population | % Population |
| Asian | 0 | 0.0% |
| Black / African American | 0 | 0.0% |
| Hawaiian / Pacific | 0 | 0.0% |
| Hispanic or Latino | 75 | 6.7% |
| Native / Alaskan | 0 | 0.0% |
| White / Caucasian | 1,096 | 98.1% |
| Two or more Races | 0 | 0.0% |
| Some other Race | 21 | 1.9% |
| Total | 1,117 | 100.0% |
Ancestry in Friend
The most populous ancestries reported in Friend are German (391 | 35.0%), Irish (110 | 9.9%), Czech (98 | 8.8%), American (77 | 6.9%), and Mexican (71 | 6.4%), together accounting for 66.9% of all Friend residents.
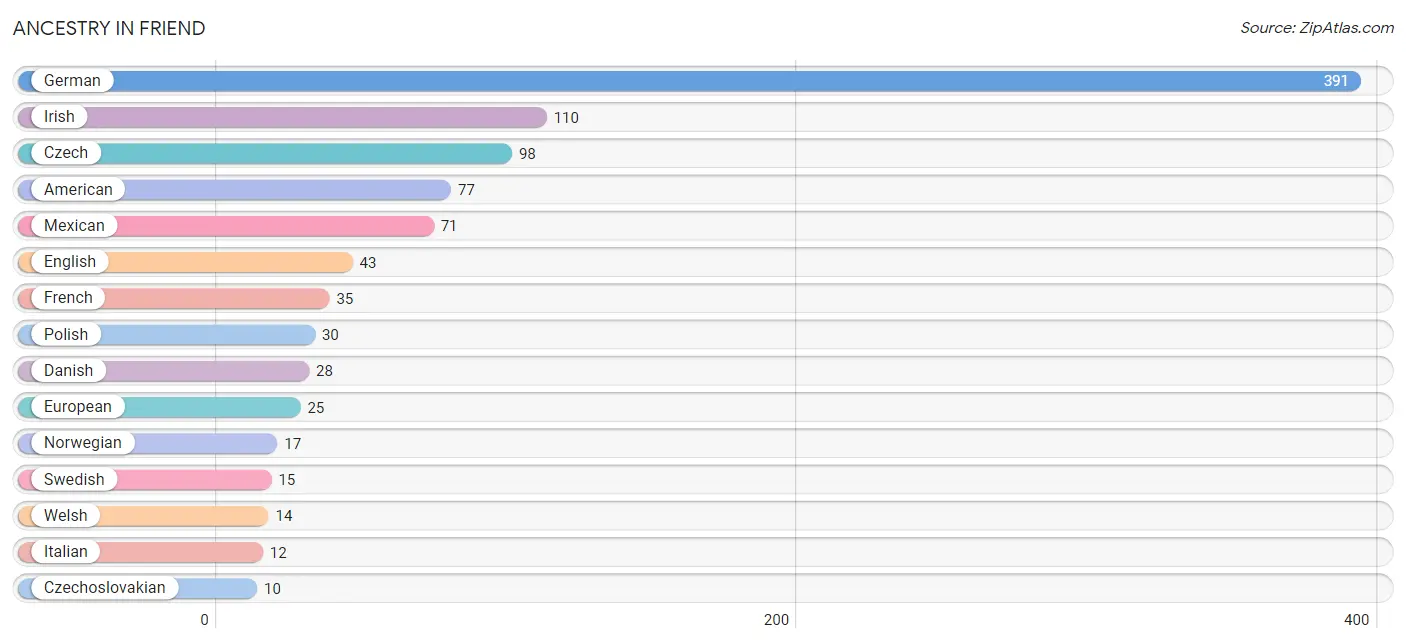
| Ancestry | # Population | % Population |
| American | 77 | 6.9% |
| Canadian | 3 | 0.3% |
| Czech | 98 | 8.8% |
| Czechoslovakian | 10 | 0.9% |
| Danish | 28 | 2.5% |
| Dutch | 8 | 0.7% |
| English | 43 | 3.8% |
| European | 25 | 2.2% |
| French | 35 | 3.1% |
| French Canadian | 3 | 0.3% |
| German | 391 | 35.0% |
| Irish | 110 | 9.9% |
| Italian | 12 | 1.1% |
| Latvian | 9 | 0.8% |
| Luxembourger | 4 | 0.4% |
| Mexican | 71 | 6.4% |
| Norwegian | 17 | 1.5% |
| Peruvian | 4 | 0.4% |
| Polish | 30 | 2.7% |
| Russian | 4 | 0.4% |
| Scotch-Irish | 6 | 0.5% |
| Scottish | 8 | 0.7% |
| South American | 4 | 0.4% |
| Swedish | 15 | 1.3% |
| Welsh | 14 | 1.3% | View All 25 Rows |
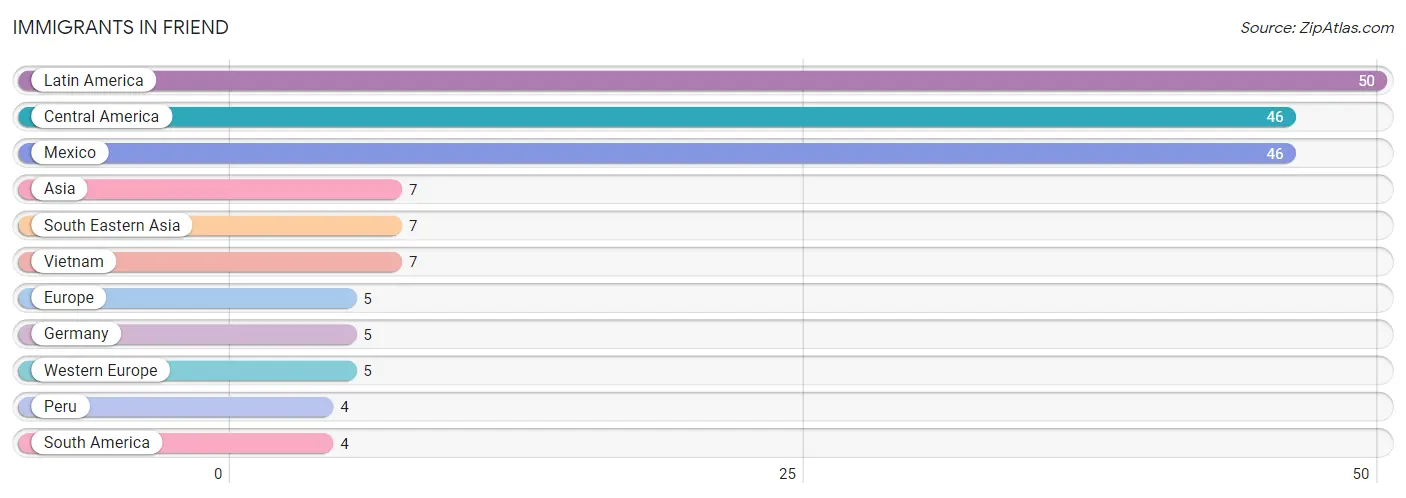
Immigrants in Friend
The most numerous immigrant groups reported in Friend came from Latin America (50 | 4.5%), Central America (46 | 4.1%), Mexico (46 | 4.1%), Asia (7 | 0.6%), and South Eastern Asia (7 | 0.6%), together accounting for 14.0% of all Friend residents.
| Immigration Origin | # Population | % Population |
| Asia | 7 | 0.6% |
| Central America | 46 | 4.1% |
| Europe | 5 | 0.4% |
| Germany | 5 | 0.4% |
| Latin America | 50 | 4.5% |
| Mexico | 46 | 4.1% |
| Peru | 4 | 0.4% |
| South America | 4 | 0.4% |
| South Eastern Asia | 7 | 0.6% |
| Vietnam | 7 | 0.6% |
| Western Europe | 5 | 0.4% | View All 11 Rows |
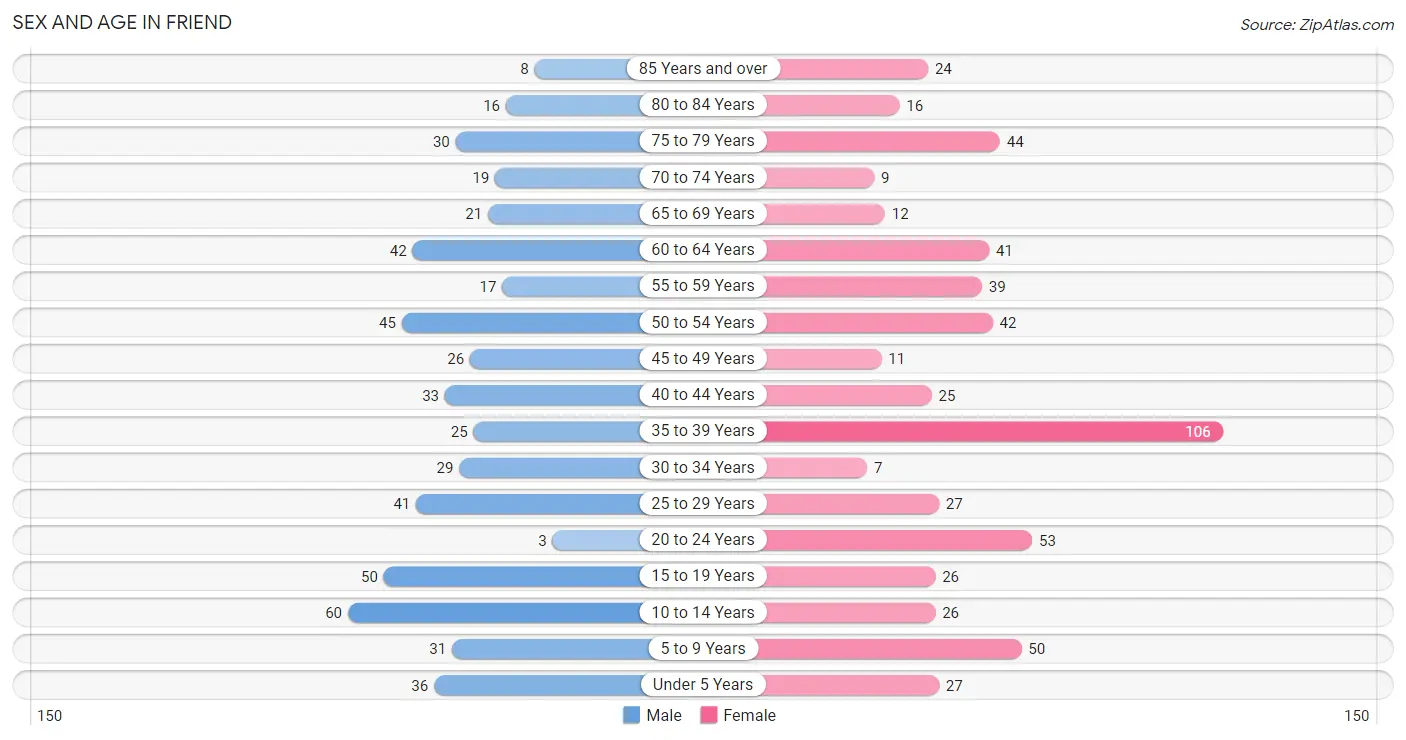
Sex and Age in Friend
Sex and Age in Friend
The most populous age groups in Friend are 10 to 14 Years (60 | 11.3%) for men and 35 to 39 Years (106 | 18.1%) for women.
| Age Bracket | Male | Female |
| Under 5 Years | 36 (6.8%) | 27 (4.6%) |
| 5 to 9 Years | 31 (5.8%) | 50 (8.6%) |
| 10 to 14 Years | 60 (11.3%) | 26 (4.4%) |
| 15 to 19 Years | 50 (9.4%) | 26 (4.4%) |
| 20 to 24 Years | 3 (0.6%) | 53 (9.1%) |
| 25 to 29 Years | 41 (7.7%) | 27 (4.6%) |
| 30 to 34 Years | 29 (5.4%) | 7 (1.2%) |
| 35 to 39 Years | 25 (4.7%) | 106 (18.1%) |
| 40 to 44 Years | 33 (6.2%) | 25 (4.3%) |
| 45 to 49 Years | 26 (4.9%) | 11 (1.9%) |
| 50 to 54 Years | 45 (8.5%) | 42 (7.2%) |
| 55 to 59 Years | 17 (3.2%) | 39 (6.7%) |
| 60 to 64 Years | 42 (7.9%) | 41 (7.0%) |
| 65 to 69 Years | 21 (4.0%) | 12 (2.1%) |
| 70 to 74 Years | 19 (3.6%) | 9 (1.5%) |
| 75 to 79 Years | 30 (5.6%) | 44 (7.5%) |
| 80 to 84 Years | 16 (3.0%) | 16 (2.7%) |
| 85 Years and over | 8 (1.5%) | 24 (4.1%) |
| Total | 532 (100.0%) | 585 (100.0%) |
Families and Households in Friend
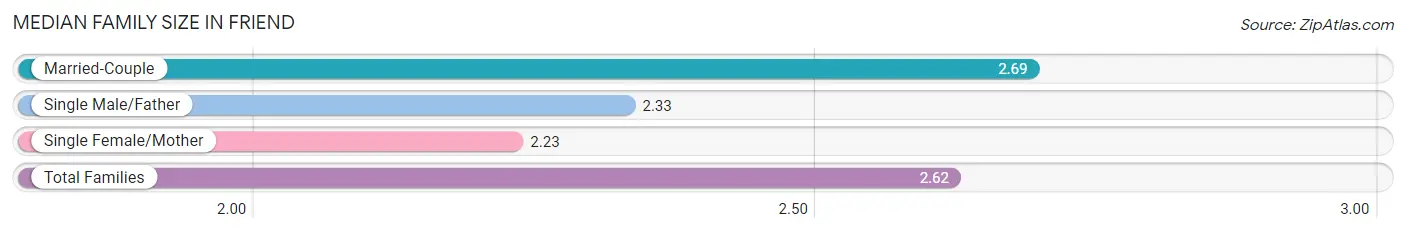
Median Family Size in Friend
The median family size in Friend is 2.62 persons per family, with married-couple families (287 | 84.9%) accounting for the largest median family size of 2.69 persons per family. On the other hand, single female/mother families (48 | 14.2%) represent the smallest median family size with 2.23 persons per family.
| Family Type | # Families | Family Size |
| Married-Couple | 287 (84.9%) | 2.69 |
| Single Male/Father | 3 (0.9%) | 2.33 |
| Single Female/Mother | 48 (14.2%) | 2.23 |
| Total Families | 338 (100.0%) | 2.62 |
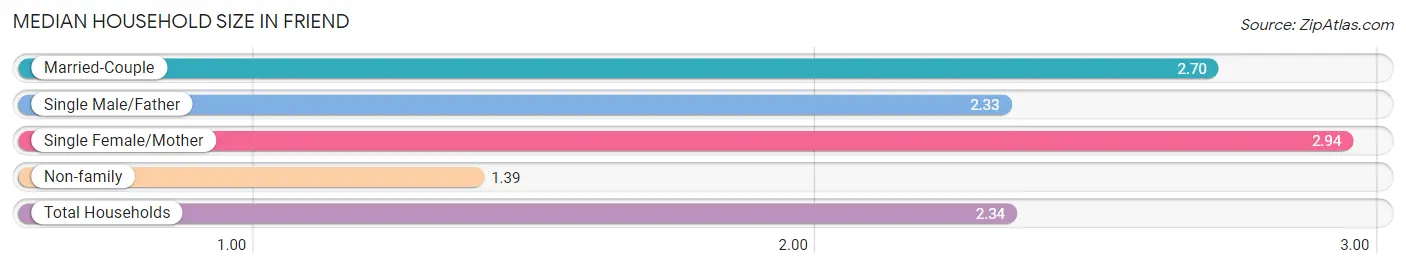
Median Household Size in Friend
The median household size in Friend is 2.34 persons per household, with single female/mother households (48 | 10.0%) accounting for the largest median household size of 2.94 persons per household. non-family households (140 | 29.3%) represent the smallest median household size with 1.39 persons per household.
| Household Type | # Households | Household Size |
| Married-Couple | 287 (60.0%) | 2.70 |
| Single Male/Father | 3 (0.6%) | 2.33 |
| Single Female/Mother | 48 (10.0%) | 2.94 |
| Non-family | 140 (29.3%) | 1.39 |
| Total Households | 478 (100.0%) | 2.34 |
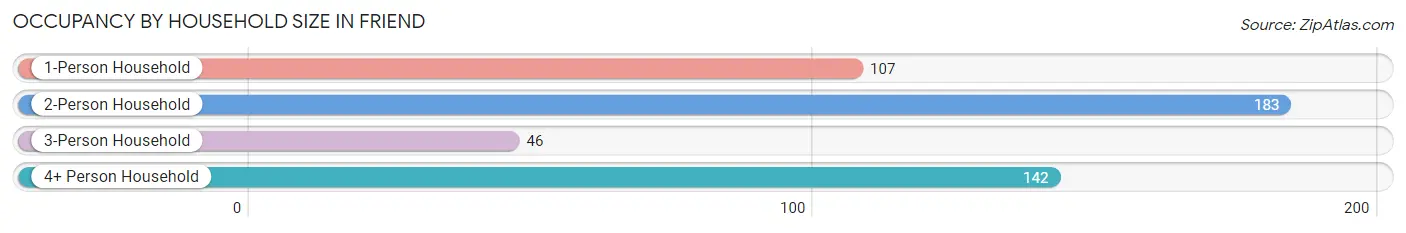
Household Size by Marriage Status in Friend
Out of a total of 478 households in Friend, 338 (70.7%) are family households, while 140 (29.3%) are nonfamily households. The most numerous type of family households are 2-person households, comprising 150, and the most common type of nonfamily households are 1-person households, comprising 107.
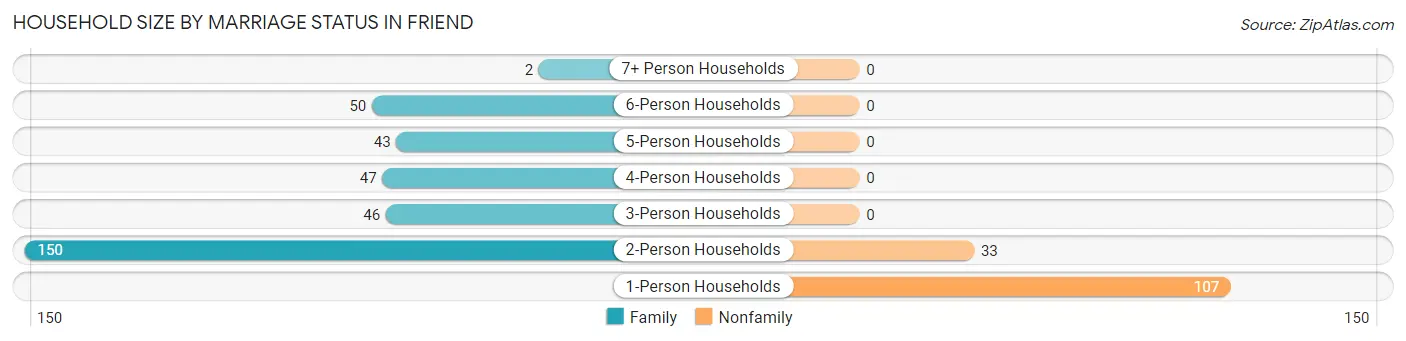
| Household Size | Family Households | Nonfamily Households |
| 1-Person Households | - | 107 (22.4%) |
| 2-Person Households | 150 (31.4%) | 33 (6.9%) |
| 3-Person Households | 46 (9.6%) | 0 (0.0%) |
| 4-Person Households | 47 (9.8%) | 0 (0.0%) |
| 5-Person Households | 43 (9.0%) | 0 (0.0%) |
| 6-Person Households | 50 (10.5%) | 0 (0.0%) |
| 7+ Person Households | 2 (0.4%) | 0 (0.0%) |
| Total | 338 (70.7%) | 140 (29.3%) |
Female Fertility in Friend
Fertility by Age in Friend
Average fertility rate in Friend is 11.0 births per 1,000 women. Women in the age bracket of 20 to 34 years have the highest fertility rate with 34.0 births per 1,000 women. Women in the age bracket of 20 to 34 years acount for 100.0% of all women with births.
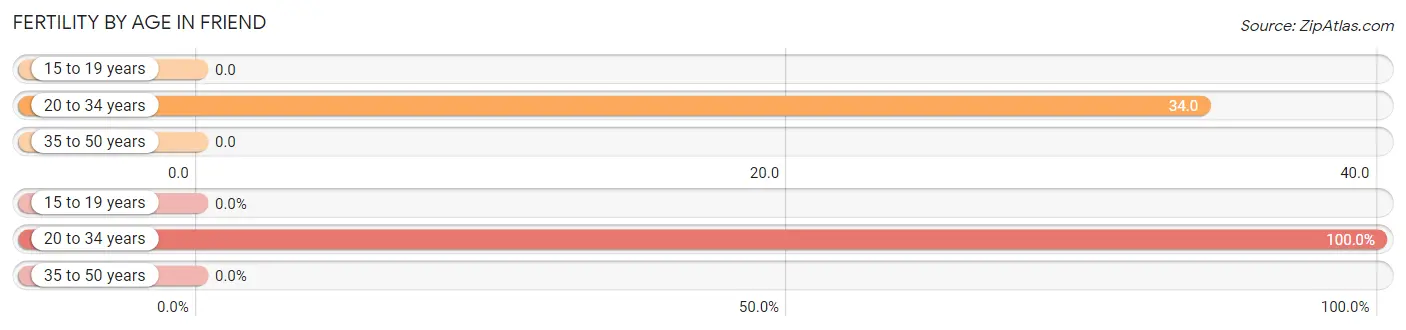
| Age Bracket | Women with Births | Births / 1,000 Women |
| 15 to 19 years | 0 (0.0%) | 0.0 |
| 20 to 34 years | 3 (100.0%) | 34.0 |
| 35 to 50 years | 0 (0.0%) | 0.0 |
| Total | 3 (100.0%) | 11.0 |
Fertility by Age by Marriage Status in Friend
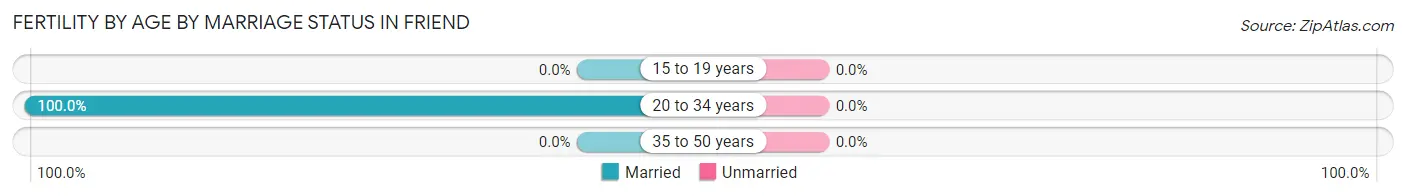
| Age Bracket | Married | Unmarried |
| 15 to 19 years | 0 (0.0%) | 0 (0.0%) |
| 20 to 34 years | 3 (100.0%) | 0 (0.0%) |
| 35 to 50 years | 0 (0.0%) | 0 (0.0%) |
| Total | 3 (100.0%) | 0 (0.0%) |
Fertility by Education in Friend
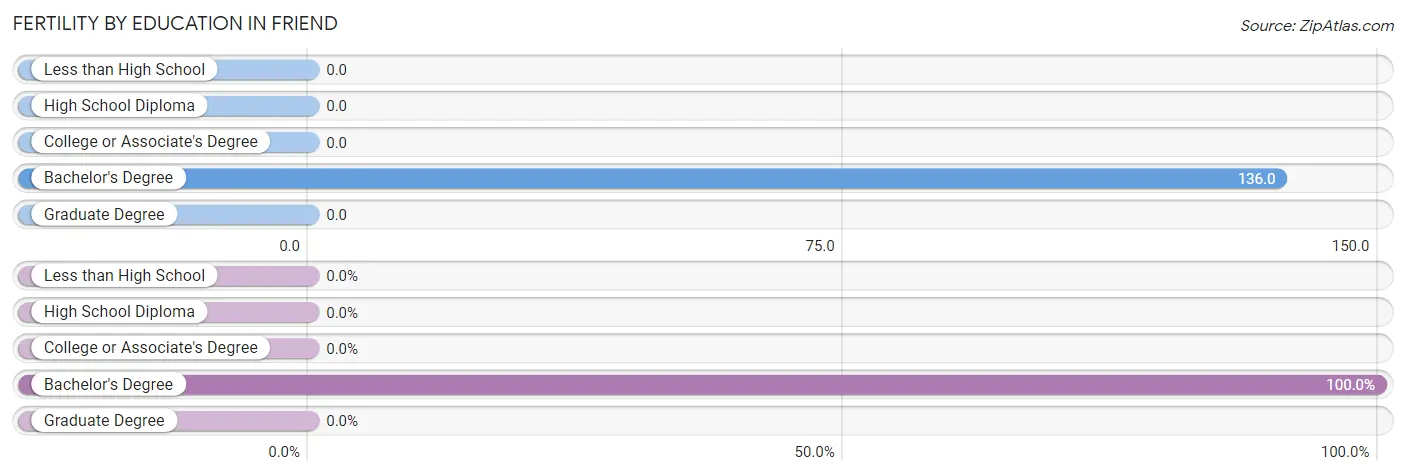
| Educational Attainment | Women with Births | Births / 1,000 Women |
| Less than High School | 0 (0.0%) | 0.0 |
| High School Diploma | 0 (0.0%) | 0.0 |
| College or Associate's Degree | 0 (0.0%) | 0.0 |
| Bachelor's Degree | 3 (100.0%) | 136.0 |
| Graduate Degree | 0 (0.0%) | 0.0 |
| Total | 3 (100.0%) | 11.0 |
Fertility by Education by Marriage Status in Friend
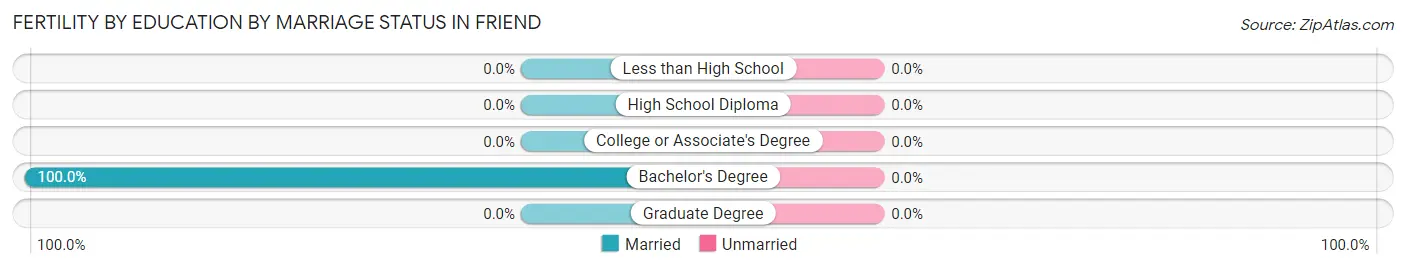
| Educational Attainment | Married | Unmarried |
| Less than High School | 0 (0.0%) | 0 (0.0%) |
| High School Diploma | 0 (0.0%) | 0 (0.0%) |
| College or Associate's Degree | 0 (0.0%) | 0 (0.0%) |
| Bachelor's Degree | 3 (100.0%) | 0 (0.0%) |
| Graduate Degree | 0 (0.0%) | 0 (0.0%) |
| Total | 3 (100.0%) | 0 (0.0%) |
Employment Characteristics in Friend
Employment by Class of Employer in Friend
Among the 610 employed individuals in Friend, private company employees (371 | 60.8%), not-for-profit organizations (130 | 21.3%), and local government employees (44 | 7.2%) make up the most common classes of employment.
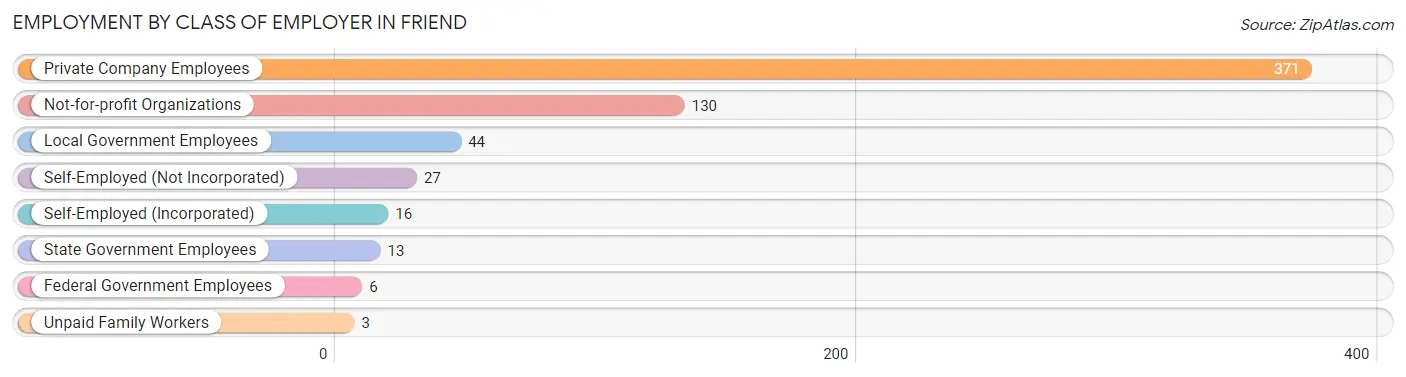
| Employer Class | # Employees | % Employees |
| Private Company Employees | 371 | 60.8% |
| Self-Employed (Incorporated) | 16 | 2.6% |
| Self-Employed (Not Incorporated) | 27 | 4.4% |
| Not-for-profit Organizations | 130 | 21.3% |
| Local Government Employees | 44 | 7.2% |
| State Government Employees | 13 | 2.1% |
| Federal Government Employees | 6 | 1.0% |
| Unpaid Family Workers | 3 | 0.5% |
| Total | 610 | 100.0% |
Employment Status by Age in Friend
According to the labor force statistics for Friend, out of the total population over 16 years of age (879), 70.8% or 622 individuals are in the labor force, with 1.4% or 9 of them unemployed. The age group with the highest labor force participation rate is 30 to 34 years, with 100.0% or 36 individuals in the labor force. Within the labor force, the 55 to 59 years age range has the highest percentage of unemployed individuals, with 15.2% or 7 of them being unemployed.
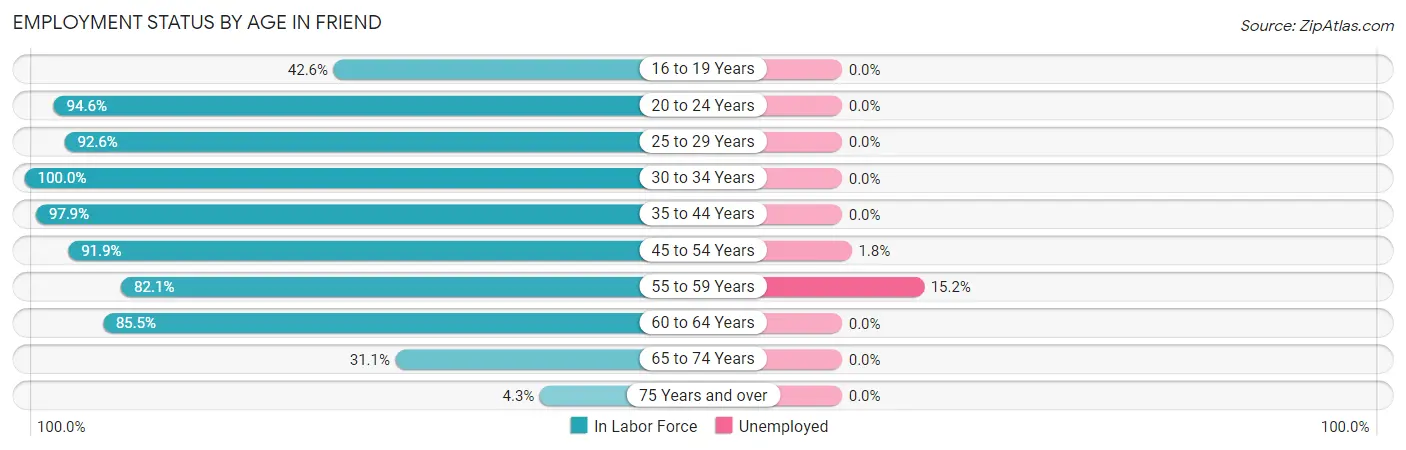
| Age Bracket | In Labor Force | Unemployed |
| 16 to 19 Years | 29 (42.6%) | 0 (0.0%) |
| 20 to 24 Years | 53 (94.6%) | 0 (0.0%) |
| 25 to 29 Years | 63 (92.6%) | 0 (0.0%) |
| 30 to 34 Years | 36 (100.0%) | 0 (0.0%) |
| 35 to 44 Years | 185 (97.9%) | 0 (0.0%) |
| 45 to 54 Years | 114 (91.9%) | 2 (1.8%) |
| 55 to 59 Years | 46 (82.1%) | 7 (15.2%) |
| 60 to 64 Years | 71 (85.5%) | 0 (0.0%) |
| 65 to 74 Years | 19 (31.1%) | 0 (0.0%) |
| 75 Years and over | 6 (4.3%) | 0 (0.0%) |
| Total | 622 (70.8%) | 9 (1.4%) |
Employment Status by Educational Attainment in Friend
According to labor force statistics for Friend, 92.6% of individuals (515) out of the total population between 25 and 64 years of age (556) are in the labor force, with 1.7% or 9 of them being unemployed. The group with the highest labor force participation rate are those with the educational attainment of bachelor's degree or higher, with 100.0% or 150 individuals in the labor force. Within the labor force, individuals with bachelor's degree or higher education have the highest percentage of unemployment, with 6.0% or 9 of them being unemployed.
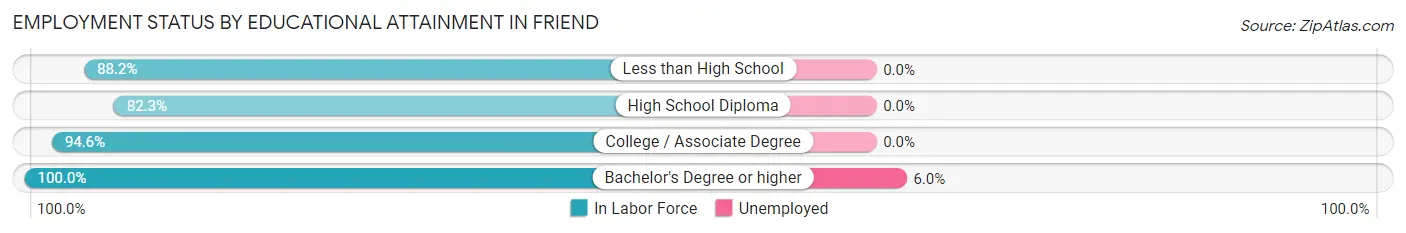
| Educational Attainment | In Labor Force | Unemployed |
| Less than High School | 15 (88.2%) | 0 (0.0%) |
| High School Diploma | 121 (82.3%) | 0 (0.0%) |
| College / Associate Degree | 229 (94.6%) | 0 (0.0%) |
| Bachelor's Degree or higher | 150 (100.0%) | 9 (6.0%) |
| Total | 515 (92.6%) | 9 (1.7%) |
Employment Occupations by Sex in Friend
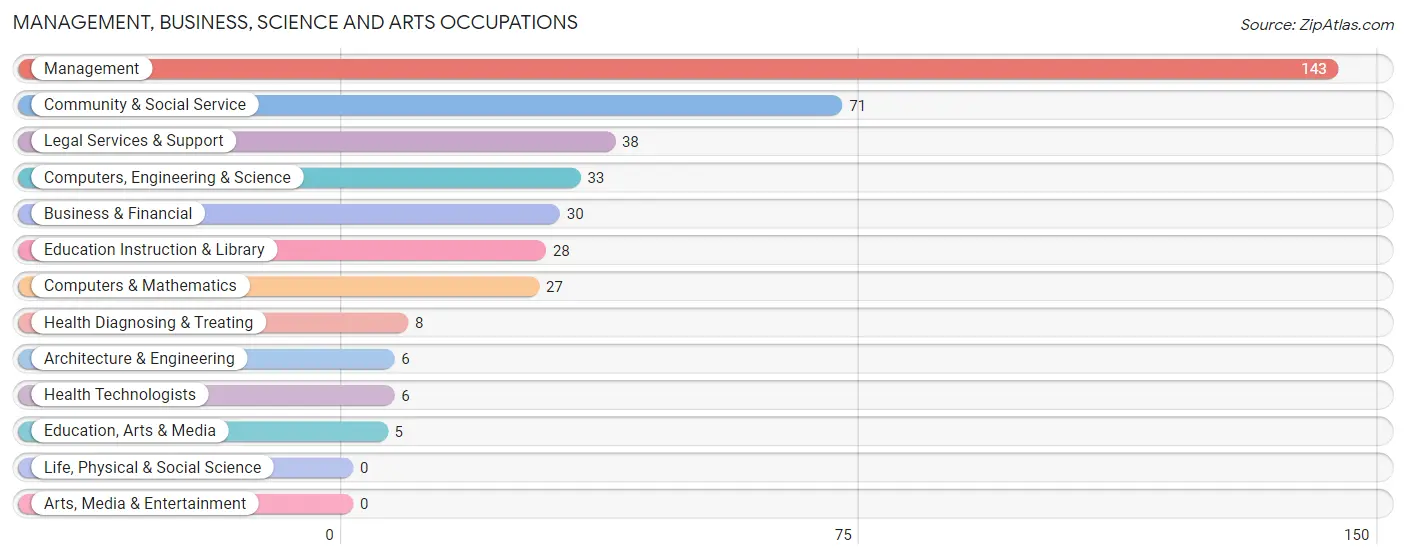
Management, Business, Science and Arts Occupations
The most common Management, Business, Science and Arts occupations in Friend are Management (143 | 23.3%), Community & Social Service (71 | 11.6%), Legal Services & Support (38 | 6.2%), Computers, Engineering & Science (33 | 5.4%), and Business & Financial (30 | 4.9%).
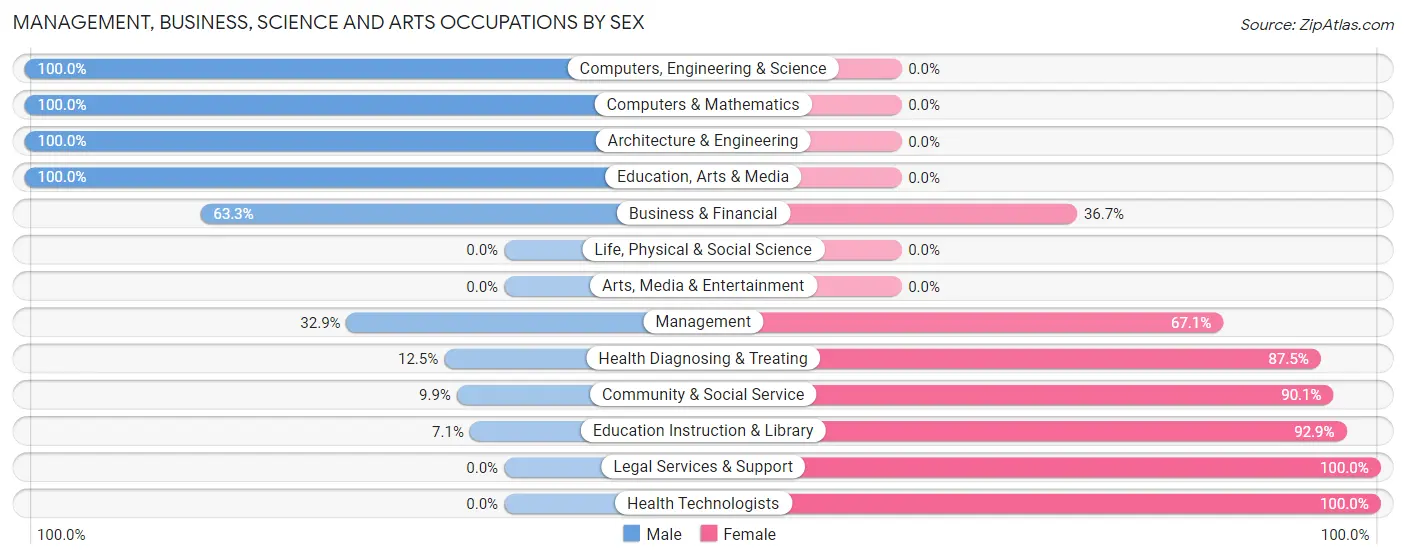
Management, Business, Science and Arts Occupations by Sex
Within the Management, Business, Science and Arts occupations in Friend, the most male-oriented occupations are Computers, Engineering & Science (100.0%), Computers & Mathematics (100.0%), and Architecture & Engineering (100.0%), while the most female-oriented occupations are Legal Services & Support (100.0%), Health Technologists (100.0%), and Education Instruction & Library (92.9%).
| Occupation | Male | Female |
| Management | 47 (32.9%) | 96 (67.1%) |
| Business & Financial | 19 (63.3%) | 11 (36.7%) |
| Computers, Engineering & Science | 33 (100.0%) | 0 (0.0%) |
| Computers & Mathematics | 27 (100.0%) | 0 (0.0%) |
| Architecture & Engineering | 6 (100.0%) | 0 (0.0%) |
| Life, Physical & Social Science | 0 (0.0%) | 0 (0.0%) |
| Community & Social Service | 7 (9.9%) | 64 (90.1%) |
| Education, Arts & Media | 5 (100.0%) | 0 (0.0%) |
| Legal Services & Support | 0 (0.0%) | 38 (100.0%) |
| Education Instruction & Library | 2 (7.1%) | 26 (92.9%) |
| Arts, Media & Entertainment | 0 (0.0%) | 0 (0.0%) |
| Health Diagnosing & Treating | 1 (12.5%) | 7 (87.5%) |
| Health Technologists | 0 (0.0%) | 6 (100.0%) |
| Total (Category) | 107 (37.5%) | 178 (62.5%) |
| Total (Overall) | 295 (48.1%) | 318 (51.9%) |
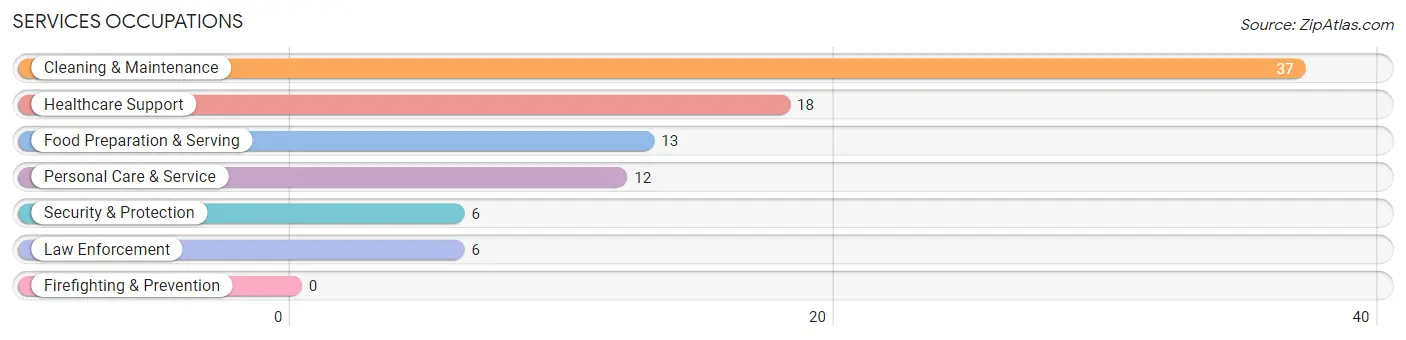
Services Occupations
The most common Services occupations in Friend are Cleaning & Maintenance (37 | 6.0%), Healthcare Support (18 | 2.9%), Food Preparation & Serving (13 | 2.1%), Personal Care & Service (12 | 2.0%), and Security & Protection (6 | 1.0%).
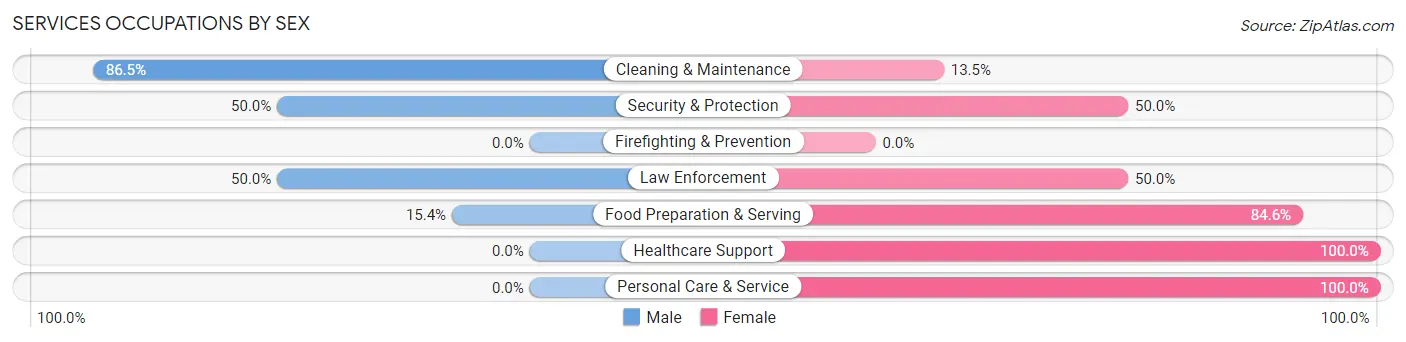
Services Occupations by Sex
Within the Services occupations in Friend, the most male-oriented occupations are Cleaning & Maintenance (86.5%), Security & Protection (50.0%), and Law Enforcement (50.0%), while the most female-oriented occupations are Healthcare Support (100.0%), Personal Care & Service (100.0%), and Food Preparation & Serving (84.6%).
| Occupation | Male | Female |
| Healthcare Support | 0 (0.0%) | 18 (100.0%) |
| Security & Protection | 3 (50.0%) | 3 (50.0%) |
| Firefighting & Prevention | 0 (0.0%) | 0 (0.0%) |
| Law Enforcement | 3 (50.0%) | 3 (50.0%) |
| Food Preparation & Serving | 2 (15.4%) | 11 (84.6%) |
| Cleaning & Maintenance | 32 (86.5%) | 5 (13.5%) |
| Personal Care & Service | 0 (0.0%) | 12 (100.0%) |
| Total (Category) | 37 (43.0%) | 49 (57.0%) |
| Total (Overall) | 295 (48.1%) | 318 (51.9%) |
Sales and Office Occupations
The most common Sales and Office occupations in Friend are Office & Administration (67 | 10.9%), and Sales & Related (39 | 6.4%).
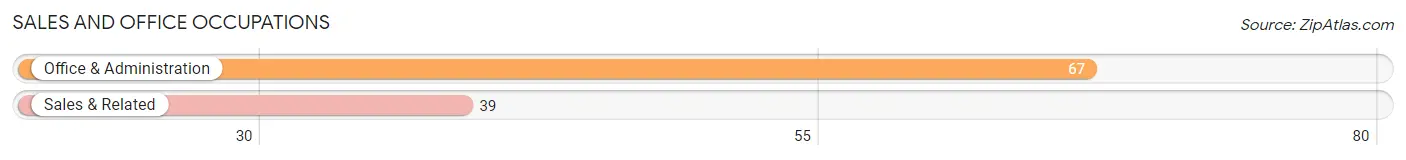
Sales and Office Occupations by Sex
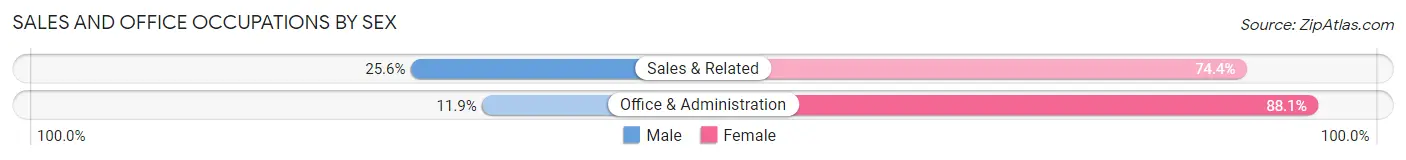
| Occupation | Male | Female |
| Sales & Related | 10 (25.6%) | 29 (74.4%) |
| Office & Administration | 8 (11.9%) | 59 (88.1%) |
| Total (Category) | 18 (17.0%) | 88 (83.0%) |
| Total (Overall) | 295 (48.1%) | 318 (51.9%) |
Natural Resources, Construction and Maintenance Occupations
The most common Natural Resources, Construction and Maintenance occupations in Friend are Construction & Extraction (21 | 3.4%), Installation, Maintenance & Repair (20 | 3.3%), and Farming, Fishing & Forestry (2 | 0.3%).
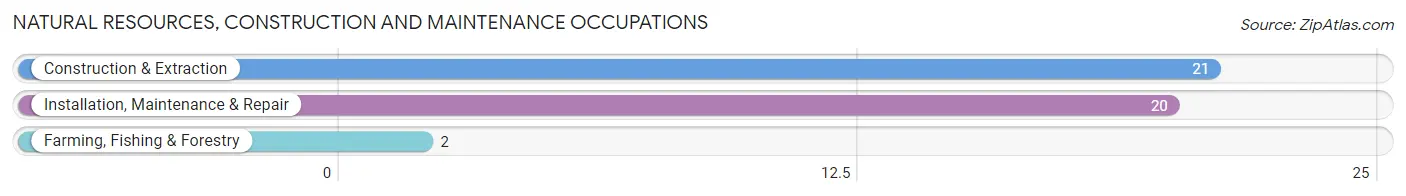
Natural Resources, Construction and Maintenance Occupations by Sex
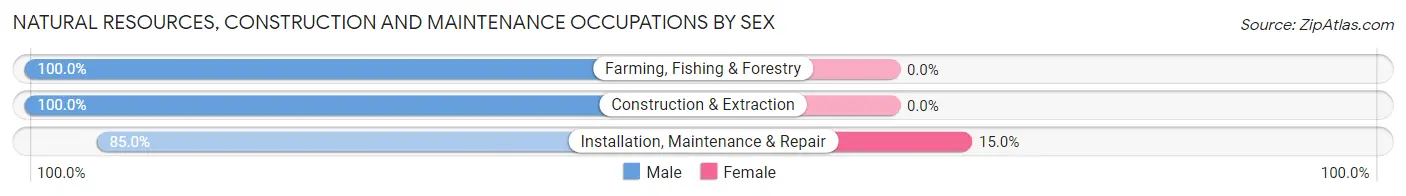
| Occupation | Male | Female |
| Farming, Fishing & Forestry | 2 (100.0%) | 0 (0.0%) |
| Construction & Extraction | 21 (100.0%) | 0 (0.0%) |
| Installation, Maintenance & Repair | 17 (85.0%) | 3 (15.0%) |
| Total (Category) | 40 (93.0%) | 3 (7.0%) |
| Total (Overall) | 295 (48.1%) | 318 (51.9%) |
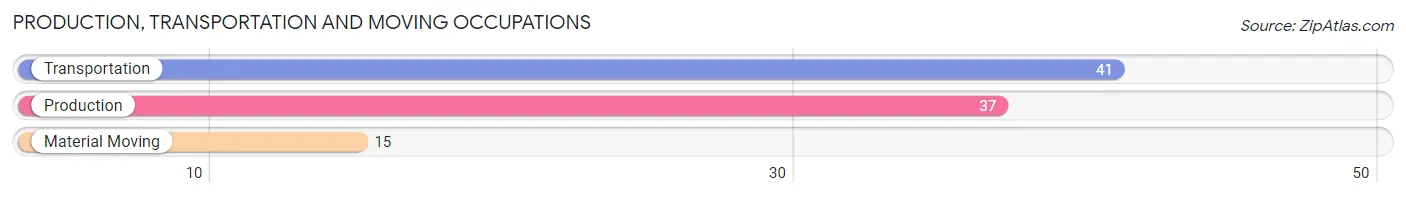
Production, Transportation and Moving Occupations
The most common Production, Transportation and Moving occupations in Friend are Transportation (41 | 6.7%), Production (37 | 6.0%), and Material Moving (15 | 2.5%).
Production, Transportation and Moving Occupations by Sex
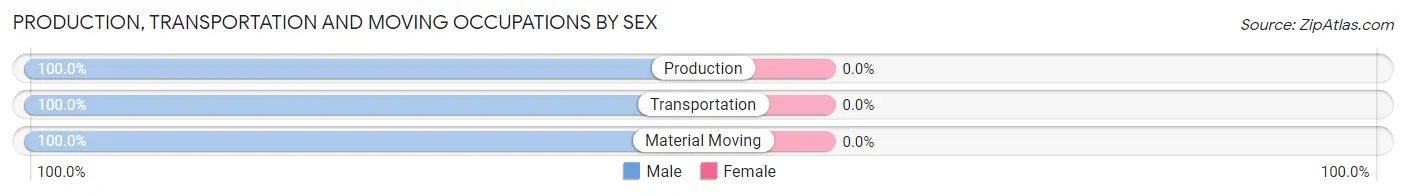
| Occupation | Male | Female |
| Production | 37 (100.0%) | 0 (0.0%) |
| Transportation | 41 (100.0%) | 0 (0.0%) |
| Material Moving | 15 (100.0%) | 0 (0.0%) |
| Total (Category) | 93 (100.0%) | 0 (0.0%) |
| Total (Overall) | 295 (48.1%) | 318 (51.9%) |
Employment Industries by Sex in Friend
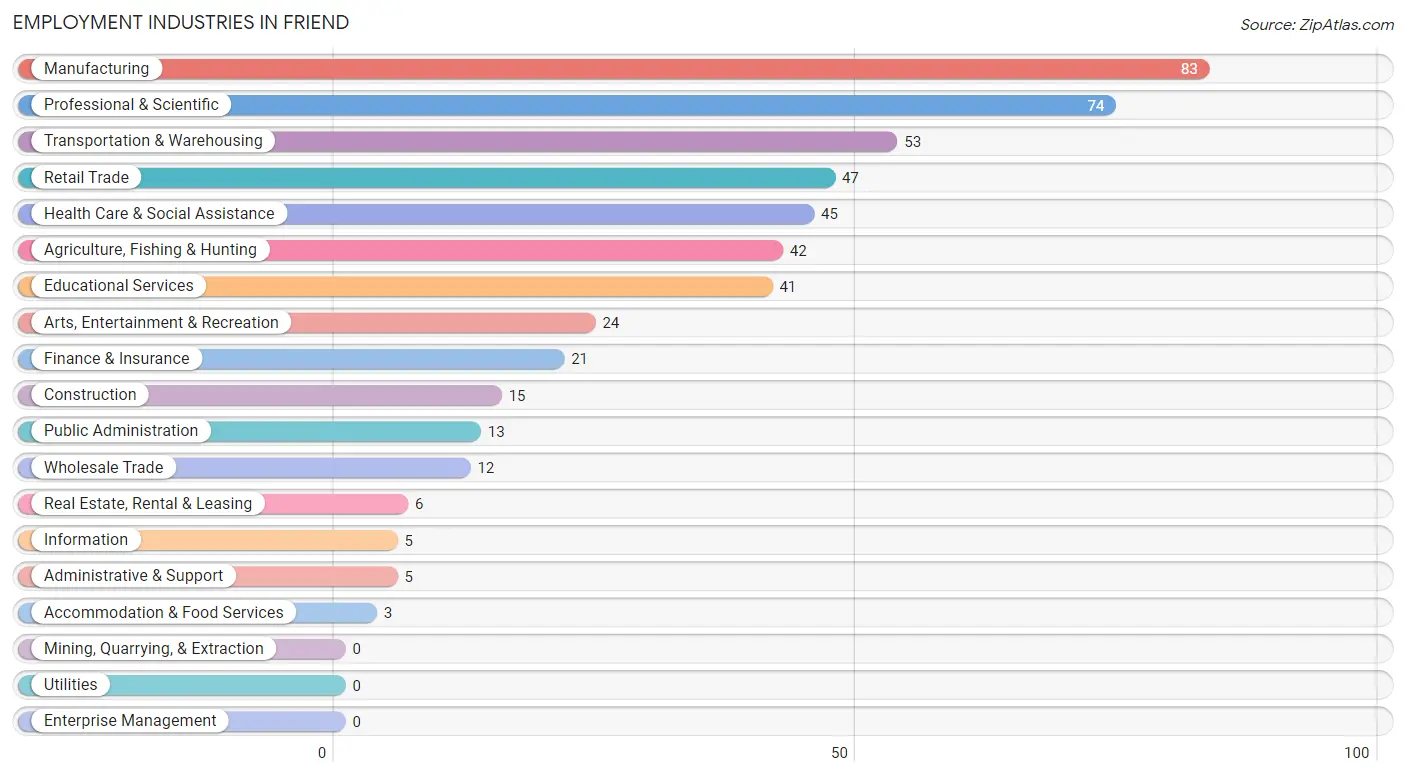
Employment Industries in Friend
The major employment industries in Friend include Manufacturing (83 | 13.5%), Professional & Scientific (74 | 12.1%), Transportation & Warehousing (53 | 8.6%), Retail Trade (47 | 7.7%), and Health Care & Social Assistance (45 | 7.3%).
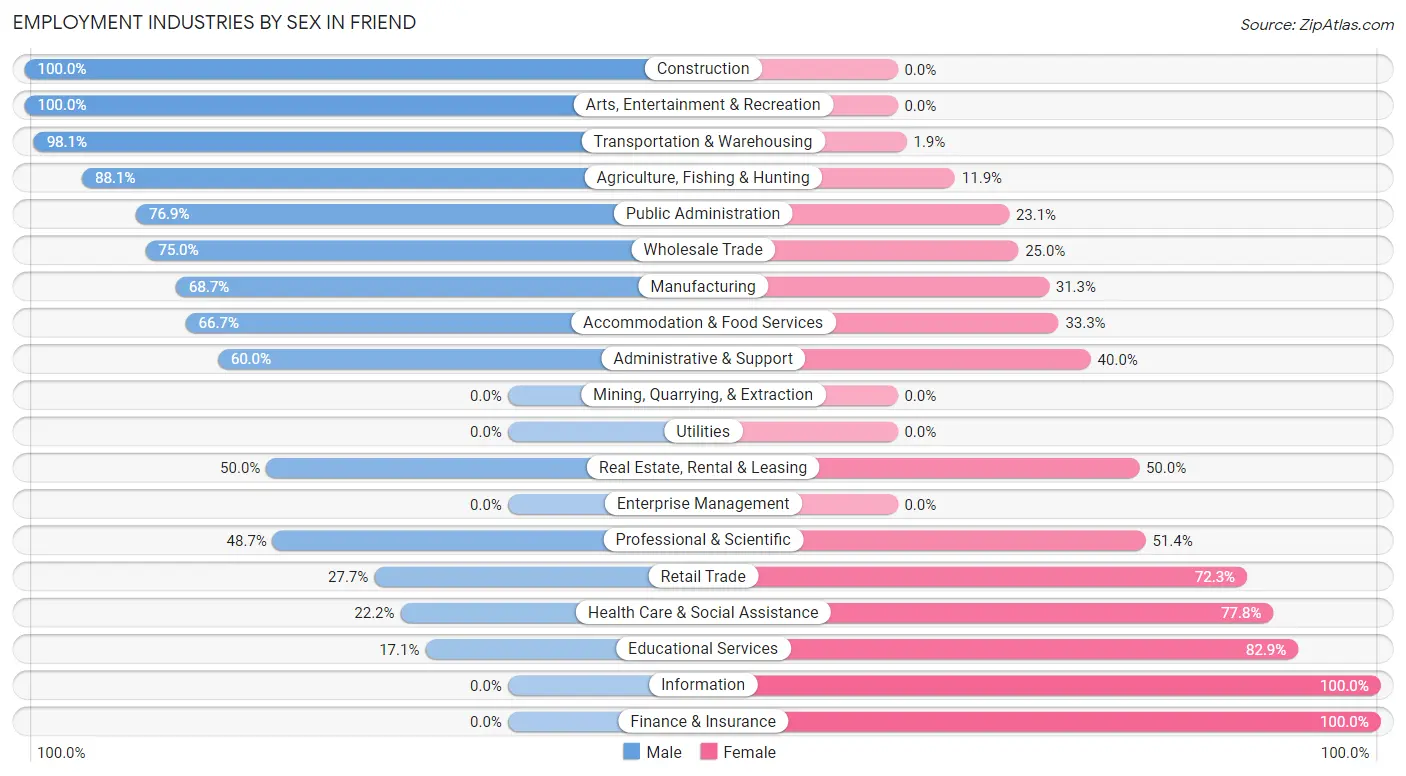
Employment Industries by Sex in Friend
The Friend industries that see more men than women are Construction (100.0%), Arts, Entertainment & Recreation (100.0%), and Transportation & Warehousing (98.1%), whereas the industries that tend to have a higher number of women are Information (100.0%), Finance & Insurance (100.0%), and Educational Services (82.9%).
| Industry | Male | Female |
| Agriculture, Fishing & Hunting | 37 (88.1%) | 5 (11.9%) |
| Mining, Quarrying, & Extraction | 0 (0.0%) | 0 (0.0%) |
| Construction | 15 (100.0%) | 0 (0.0%) |
| Manufacturing | 57 (68.7%) | 26 (31.3%) |
| Wholesale Trade | 9 (75.0%) | 3 (25.0%) |
| Retail Trade | 13 (27.7%) | 34 (72.3%) |
| Transportation & Warehousing | 52 (98.1%) | 1 (1.9%) |
| Utilities | 0 (0.0%) | 0 (0.0%) |
| Information | 0 (0.0%) | 5 (100.0%) |
| Finance & Insurance | 0 (0.0%) | 21 (100.0%) |
| Real Estate, Rental & Leasing | 3 (50.0%) | 3 (50.0%) |
| Professional & Scientific | 36 (48.6%) | 38 (51.3%) |
| Enterprise Management | 0 (0.0%) | 0 (0.0%) |
| Administrative & Support | 3 (60.0%) | 2 (40.0%) |
| Educational Services | 7 (17.1%) | 34 (82.9%) |
| Health Care & Social Assistance | 10 (22.2%) | 35 (77.8%) |
| Arts, Entertainment & Recreation | 24 (100.0%) | 0 (0.0%) |
| Accommodation & Food Services | 2 (66.7%) | 1 (33.3%) |
| Public Administration | 10 (76.9%) | 3 (23.1%) |
| Total | 295 (48.1%) | 318 (51.9%) |
Education in Friend
School Enrollment in Friend
The most common levels of schooling among the 372 students in Friend are elementary school (90 | 24.2%), high school (89 | 23.9%), and college / undergraduate (89 | 23.9%).
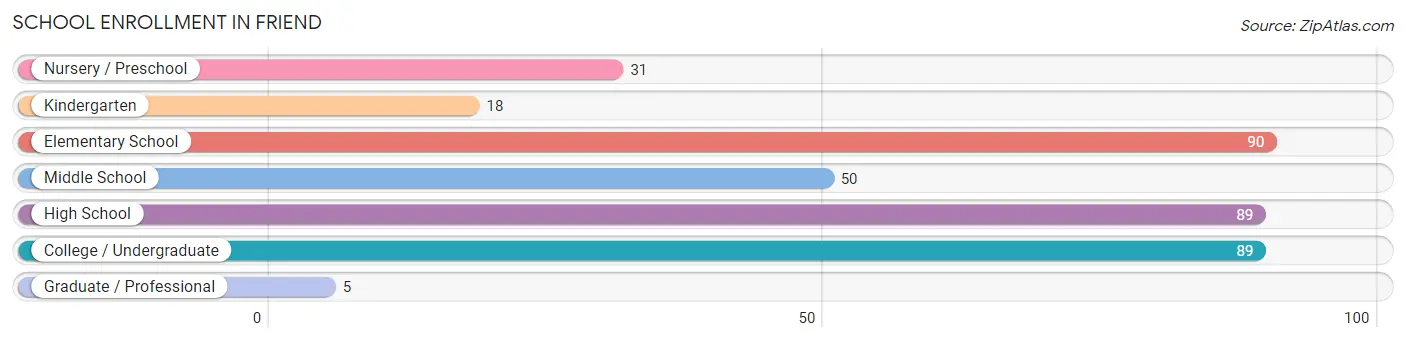
| School Level | # Students | % Students |
| Nursery / Preschool | 31 | 8.3% |
| Kindergarten | 18 | 4.8% |
| Elementary School | 90 | 24.2% |
| Middle School | 50 | 13.4% |
| High School | 89 | 23.9% |
| College / Undergraduate | 89 | 23.9% |
| Graduate / Professional | 5 | 1.3% |
| Total | 372 | 100.0% |
School Enrollment by Age by Funding Source in Friend
Out of a total of 372 students who are enrolled in schools in Friend, 24 (6.5%) attend a private institution, while the remaining 348 (93.5%) are enrolled in public schools. The age group of 35 years and over has the highest likelihood of being enrolled in private schools, with 18 (78.3% in the age bracket) enrolled. Conversely, the age group of 3 to 4 year olds has the lowest likelihood of being enrolled in a private school, with 40 (100.0% in the age bracket) attending a public institution.
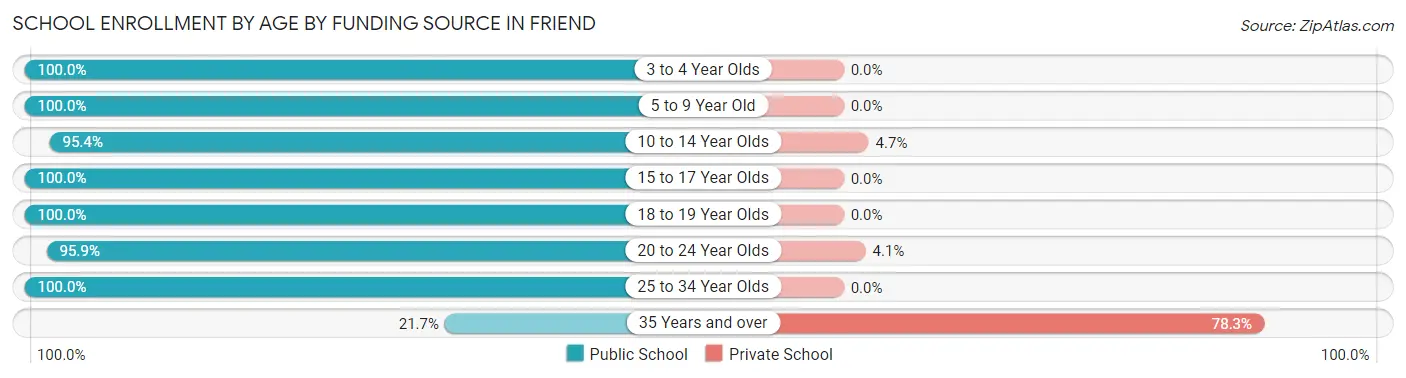
| Age Bracket | Public School | Private School |
| 3 to 4 Year Olds | 40 (100.0%) | 0 (0.0%) |
| 5 to 9 Year Old | 79 (100.0%) | 0 (0.0%) |
| 10 to 14 Year Olds | 82 (95.4%) | 4 (4.6%) |
| 15 to 17 Year Olds | 48 (100.0%) | 0 (0.0%) |
| 18 to 19 Year Olds | 25 (100.0%) | 0 (0.0%) |
| 20 to 24 Year Olds | 47 (95.9%) | 2 (4.1%) |
| 25 to 34 Year Olds | 22 (100.0%) | 0 (0.0%) |
| 35 Years and over | 5 (21.7%) | 18 (78.3%) |
| Total | 348 (93.5%) | 24 (6.5%) |
Educational Attainment by Field of Study in Friend
Multidisciplinary studies (47 | 26.4%), science & technology (34 | 19.1%), business (22 | 12.4%), bio, nature & agricultural (19 | 10.7%), and education (16 | 9.0%) are the most common fields of study among 178 individuals in Friend who have obtained a bachelor's degree or higher.
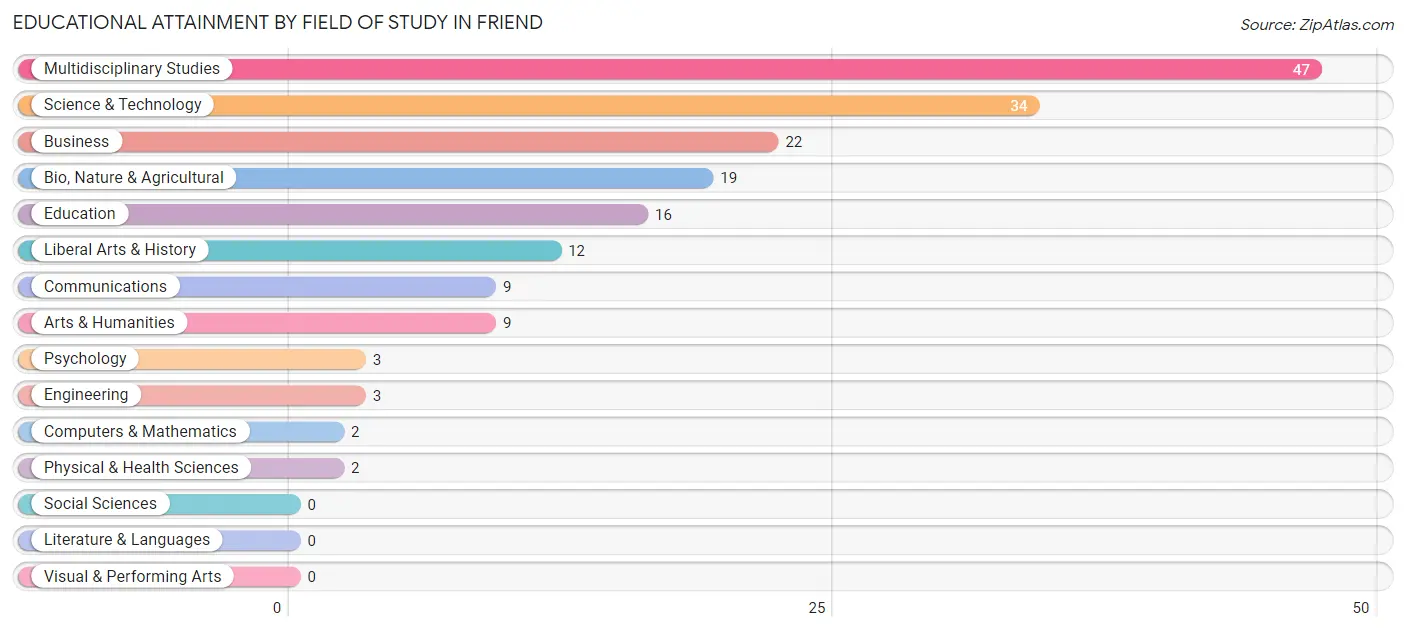
| Field of Study | # Graduates | % Graduates |
| Computers & Mathematics | 2 | 1.1% |
| Bio, Nature & Agricultural | 19 | 10.7% |
| Physical & Health Sciences | 2 | 1.1% |
| Psychology | 3 | 1.7% |
| Social Sciences | 0 | 0.0% |
| Engineering | 3 | 1.7% |
| Multidisciplinary Studies | 47 | 26.4% |
| Science & Technology | 34 | 19.1% |
| Business | 22 | 12.4% |
| Education | 16 | 9.0% |
| Literature & Languages | 0 | 0.0% |
| Liberal Arts & History | 12 | 6.7% |
| Visual & Performing Arts | 0 | 0.0% |
| Communications | 9 | 5.1% |
| Arts & Humanities | 9 | 5.1% |
| Total | 178 | 100.0% |
Transportation & Commute in Friend
Vehicle Availability by Sex in Friend
The most prevalent vehicle ownership categories in Friend are males with 3 vehicles (126, accounting for 43.1%) and females with 3 vehicles (153, making up 39.6%).
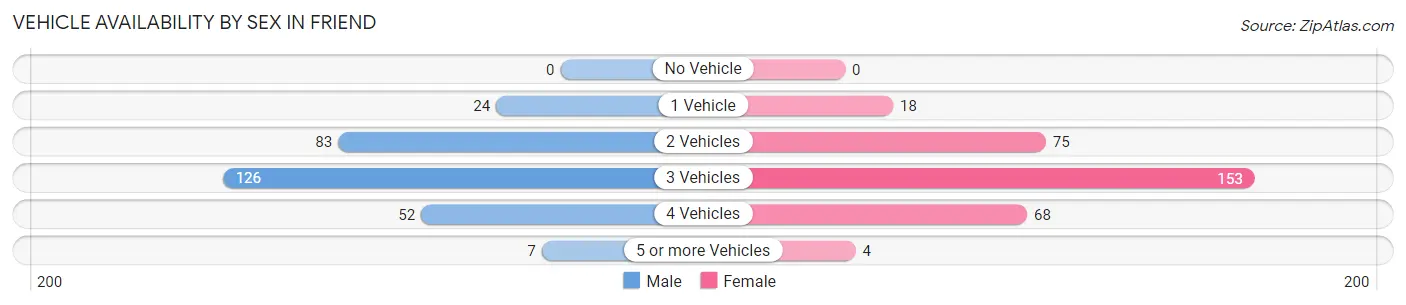
| Vehicles Available | Male | Female |
| No Vehicle | 0 (0.0%) | 0 (0.0%) |
| 1 Vehicle | 24 (8.2%) | 18 (5.7%) |
| 2 Vehicles | 83 (28.4%) | 75 (23.6%) |
| 3 Vehicles | 126 (43.1%) | 153 (48.1%) |
| 4 Vehicles | 52 (17.8%) | 68 (21.4%) |
| 5 or more Vehicles | 7 (2.4%) | 4 (1.3%) |
| Total | 292 (100.0%) | 318 (100.0%) |
Commute Time in Friend
The most frequently occuring commute durations in Friend are 20 to 24 minutes (137 commuters, 22.8%), 45 to 59 minutes (99 commuters, 16.5%), and less than 5 minutes (97 commuters, 16.2%).
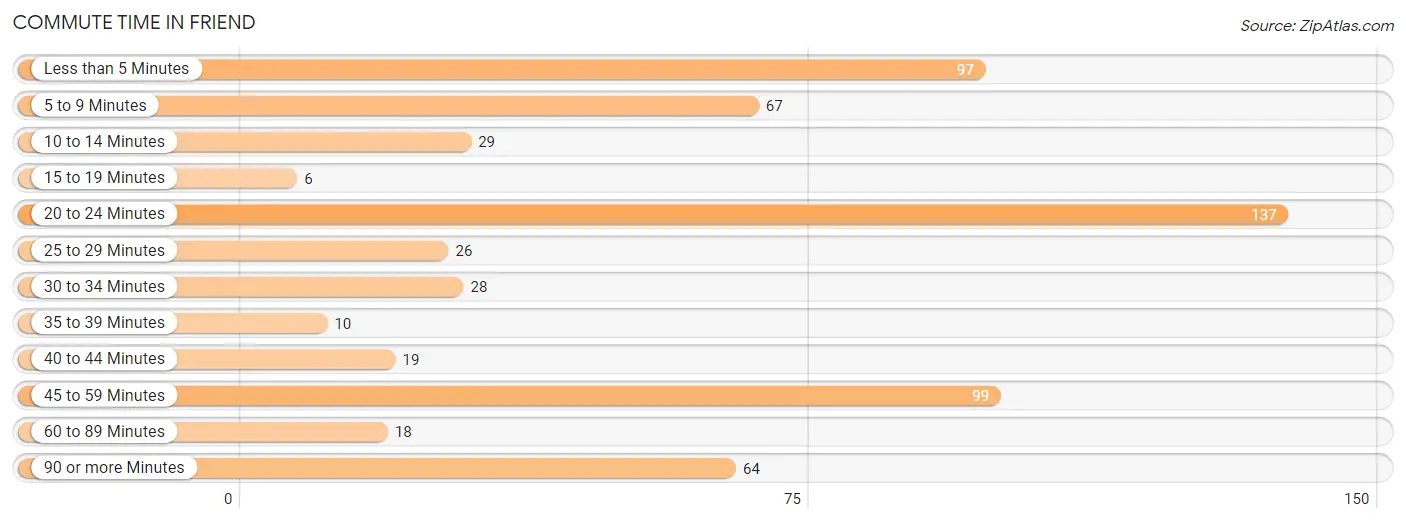
| Commute Time | # Commuters | % Commuters |
| Less than 5 Minutes | 97 | 16.2% |
| 5 to 9 Minutes | 67 | 11.2% |
| 10 to 14 Minutes | 29 | 4.8% |
| 15 to 19 Minutes | 6 | 1.0% |
| 20 to 24 Minutes | 137 | 22.8% |
| 25 to 29 Minutes | 26 | 4.3% |
| 30 to 34 Minutes | 28 | 4.7% |
| 35 to 39 Minutes | 10 | 1.7% |
| 40 to 44 Minutes | 19 | 3.2% |
| 45 to 59 Minutes | 99 | 16.5% |
| 60 to 89 Minutes | 18 | 3.0% |
| 90 or more Minutes | 64 | 10.7% |
Commute Time by Sex in Friend
The most common commute times in Friend are 20 to 24 minutes (54 commuters, 19.0%) for males and 20 to 24 minutes (83 commuters, 26.4%) for females.
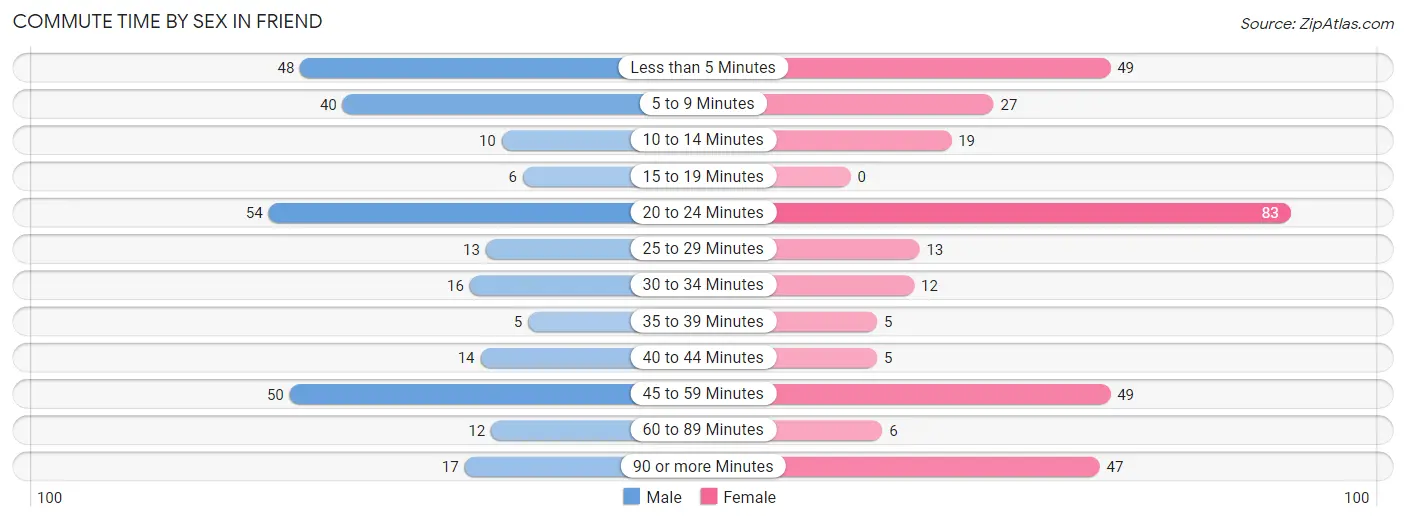
| Commute Time | Male | Female |
| Less than 5 Minutes | 48 (16.8%) | 49 (15.6%) |
| 5 to 9 Minutes | 40 (14.0%) | 27 (8.6%) |
| 10 to 14 Minutes | 10 (3.5%) | 19 (6.0%) |
| 15 to 19 Minutes | 6 (2.1%) | 0 (0.0%) |
| 20 to 24 Minutes | 54 (19.0%) | 83 (26.4%) |
| 25 to 29 Minutes | 13 (4.6%) | 13 (4.1%) |
| 30 to 34 Minutes | 16 (5.6%) | 12 (3.8%) |
| 35 to 39 Minutes | 5 (1.8%) | 5 (1.6%) |
| 40 to 44 Minutes | 14 (4.9%) | 5 (1.6%) |
| 45 to 59 Minutes | 50 (17.5%) | 49 (15.6%) |
| 60 to 89 Minutes | 12 (4.2%) | 6 (1.9%) |
| 90 or more Minutes | 17 (6.0%) | 47 (14.9%) |
Time of Departure to Work by Sex in Friend
The most frequent times of departure to work in Friend are 6:00 AM to 6:29 AM (71, 24.9%) for males and 7:00 AM to 7:29 AM (107, 34.0%) for females.
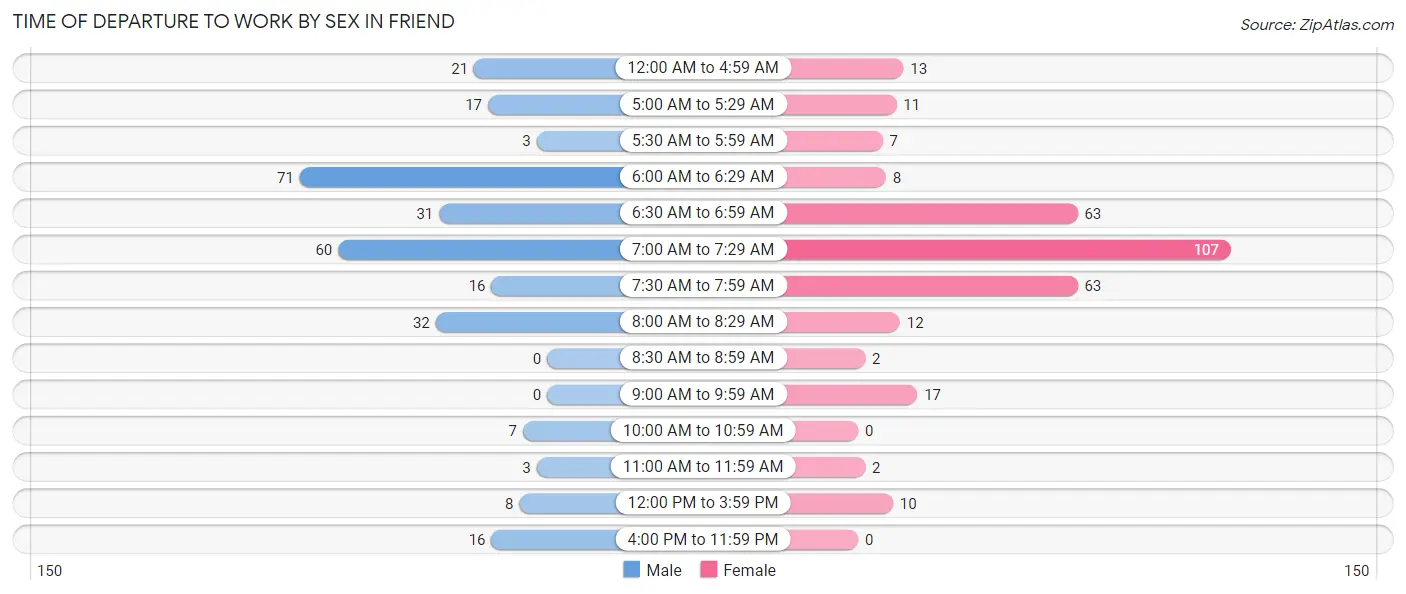
| Time of Departure | Male | Female |
| 12:00 AM to 4:59 AM | 21 (7.4%) | 13 (4.1%) |
| 5:00 AM to 5:29 AM | 17 (6.0%) | 11 (3.5%) |
| 5:30 AM to 5:59 AM | 3 (1.1%) | 7 (2.2%) |
| 6:00 AM to 6:29 AM | 71 (24.9%) | 8 (2.5%) |
| 6:30 AM to 6:59 AM | 31 (10.9%) | 63 (20.0%) |
| 7:00 AM to 7:29 AM | 60 (21.0%) | 107 (34.0%) |
| 7:30 AM to 7:59 AM | 16 (5.6%) | 63 (20.0%) |
| 8:00 AM to 8:29 AM | 32 (11.2%) | 12 (3.8%) |
| 8:30 AM to 8:59 AM | 0 (0.0%) | 2 (0.6%) |
| 9:00 AM to 9:59 AM | 0 (0.0%) | 17 (5.4%) |
| 10:00 AM to 10:59 AM | 7 (2.5%) | 0 (0.0%) |
| 11:00 AM to 11:59 AM | 3 (1.1%) | 2 (0.6%) |
| 12:00 PM to 3:59 PM | 8 (2.8%) | 10 (3.2%) |
| 4:00 PM to 11:59 PM | 16 (5.6%) | 0 (0.0%) |
| Total | 285 (100.0%) | 315 (100.0%) |
Housing Occupancy in Friend
Occupancy by Ownership in Friend
Of the total 478 dwellings in Friend, owner-occupied units account for 403 (84.3%), while renter-occupied units make up 75 (15.7%).
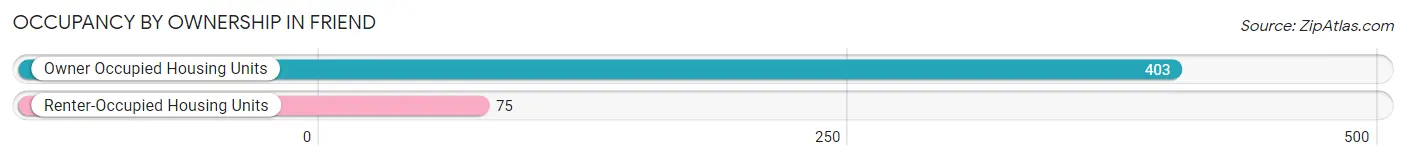
| Occupancy | # Housing Units | % Housing Units |
| Owner Occupied Housing Units | 403 | 84.3% |
| Renter-Occupied Housing Units | 75 | 15.7% |
| Total Occupied Housing Units | 478 | 100.0% |
Occupancy by Household Size in Friend
| Household Size | # Housing Units | % Housing Units |
| 1-Person Household | 107 | 22.4% |
| 2-Person Household | 183 | 38.3% |
| 3-Person Household | 46 | 9.6% |
| 4+ Person Household | 142 | 29.7% |
| Total Housing Units | 478 | 100.0% |
Occupancy by Ownership by Household Size in Friend
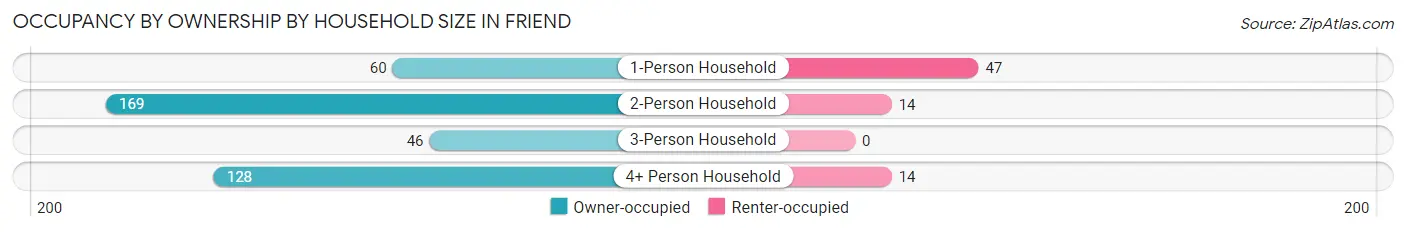
| Household Size | Owner-occupied | Renter-occupied |
| 1-Person Household | 60 (56.1%) | 47 (43.9%) |
| 2-Person Household | 169 (92.3%) | 14 (7.6%) |
| 3-Person Household | 46 (100.0%) | 0 (0.0%) |
| 4+ Person Household | 128 (90.1%) | 14 (9.9%) |
| Total Housing Units | 403 (84.3%) | 75 (15.7%) |
Occupancy by Educational Attainment in Friend
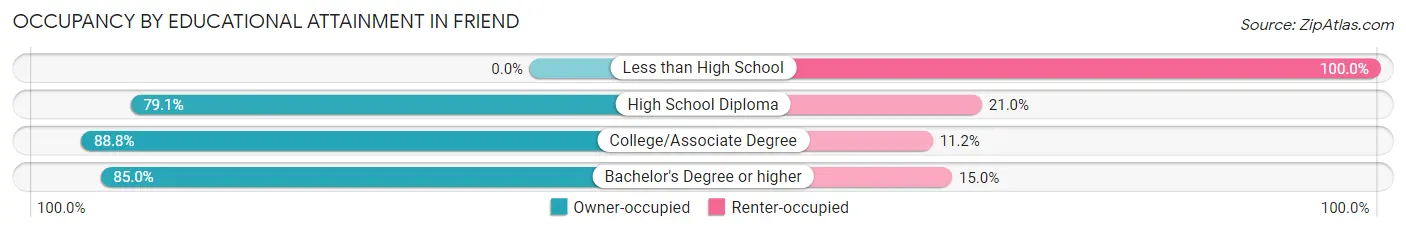
| Household Size | Owner-occupied | Renter-occupied |
| Less than High School | 0 (0.0%) | 3 (100.0%) |
| High School Diploma | 117 (79.0%) | 31 (20.9%) |
| College/Associate Degree | 190 (88.8%) | 24 (11.2%) |
| Bachelor's Degree or higher | 96 (85.0%) | 17 (15.0%) |
Occupancy by Age of Householder in Friend
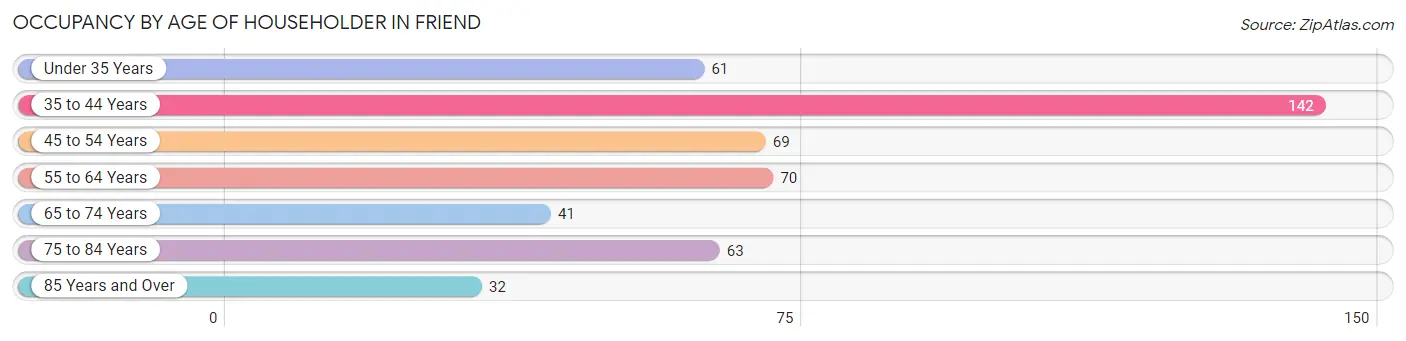
| Age Bracket | # Households | % Households |
| Under 35 Years | 61 | 12.8% |
| 35 to 44 Years | 142 | 29.7% |
| 45 to 54 Years | 69 | 14.4% |
| 55 to 64 Years | 70 | 14.6% |
| 65 to 74 Years | 41 | 8.6% |
| 75 to 84 Years | 63 | 13.2% |
| 85 Years and Over | 32 | 6.7% |
| Total | 478 | 100.0% |
Housing Finances in Friend
Median Income by Occupancy in Friend
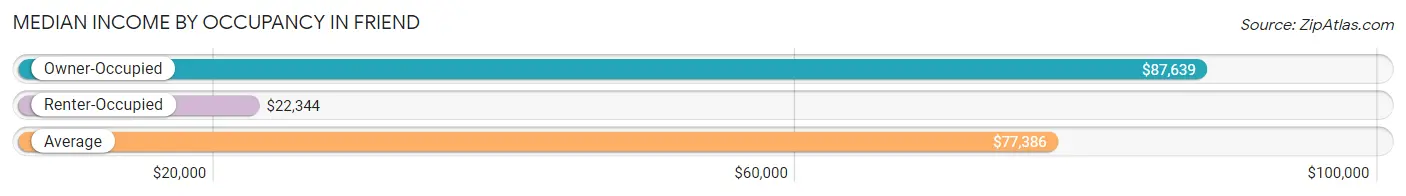
| Occupancy Type | # Households | Median Income |
| Owner-Occupied | 403 (84.3%) | $87,639 |
| Renter-Occupied | 75 (15.7%) | $22,344 |
| Average | 478 (100.0%) | $77,386 |
Occupancy by Householder Income Bracket in Friend
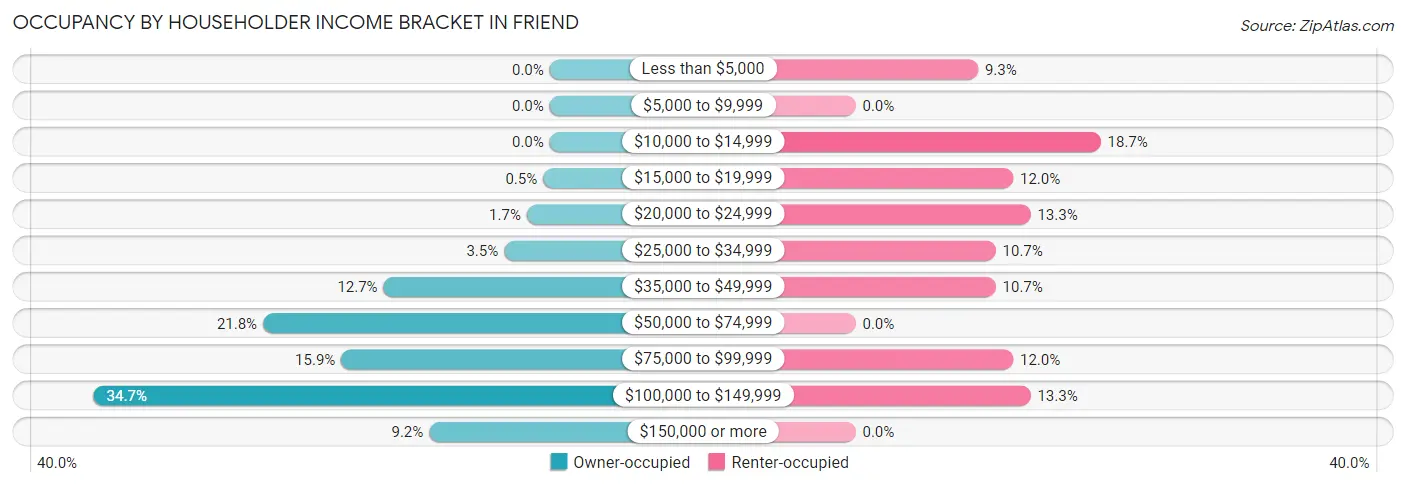
| Income Bracket | Owner-occupied | Renter-occupied |
| Less than $5,000 | 0 (0.0%) | 7 (9.3%) |
| $5,000 to $9,999 | 0 (0.0%) | 0 (0.0%) |
| $10,000 to $14,999 | 0 (0.0%) | 14 (18.7%) |
| $15,000 to $19,999 | 2 (0.5%) | 9 (12.0%) |
| $20,000 to $24,999 | 7 (1.7%) | 10 (13.3%) |
| $25,000 to $34,999 | 14 (3.5%) | 8 (10.7%) |
| $35,000 to $49,999 | 51 (12.7%) | 8 (10.7%) |
| $50,000 to $74,999 | 88 (21.8%) | 0 (0.0%) |
| $75,000 to $99,999 | 64 (15.9%) | 9 (12.0%) |
| $100,000 to $149,999 | 140 (34.7%) | 10 (13.3%) |
| $150,000 or more | 37 (9.2%) | 0 (0.0%) |
| Total | 403 (100.0%) | 75 (100.0%) |
Monthly Housing Cost Tiers in Friend
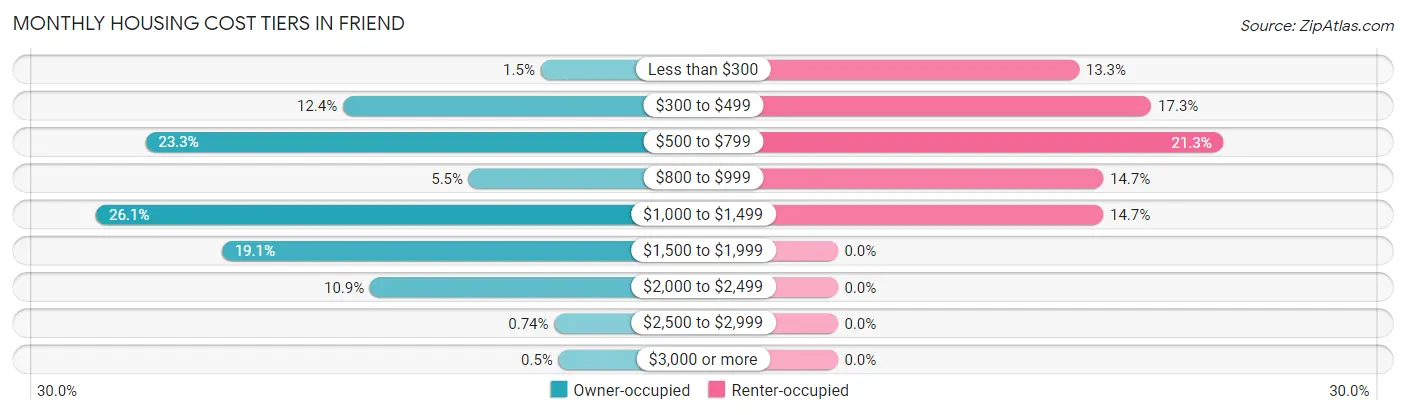
| Monthly Cost | Owner-occupied | Renter-occupied |
| Less than $300 | 6 (1.5%) | 10 (13.3%) |
| $300 to $499 | 50 (12.4%) | 13 (17.3%) |
| $500 to $799 | 94 (23.3%) | 16 (21.3%) |
| $800 to $999 | 22 (5.5%) | 11 (14.7%) |
| $1,000 to $1,499 | 105 (26.1%) | 11 (14.7%) |
| $1,500 to $1,999 | 77 (19.1%) | 0 (0.0%) |
| $2,000 to $2,499 | 44 (10.9%) | 0 (0.0%) |
| $2,500 to $2,999 | 3 (0.7%) | 0 (0.0%) |
| $3,000 or more | 2 (0.5%) | 0 (0.0%) |
| Total | 403 (100.0%) | 75 (100.0%) |
Physical Housing Characteristics in Friend
Housing Structures in Friend
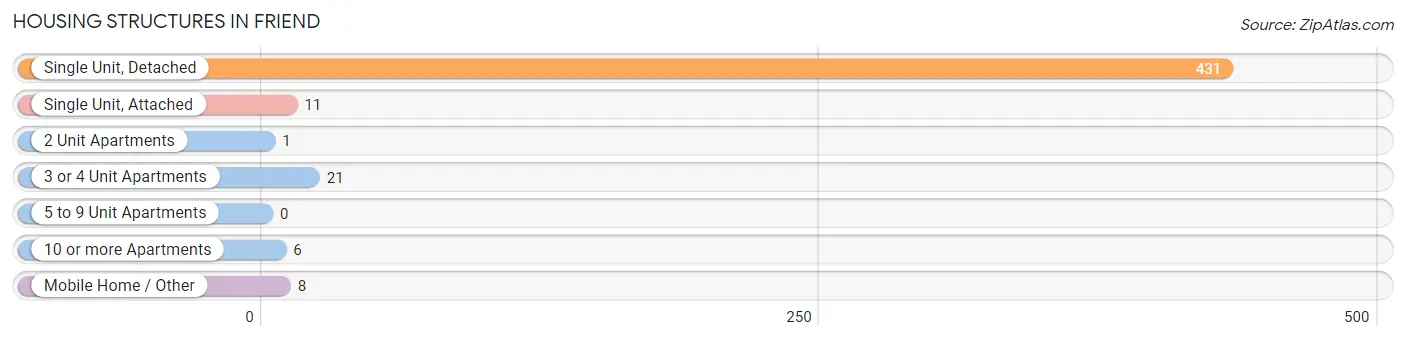
| Structure Type | # Housing Units | % Housing Units |
| Single Unit, Detached | 431 | 90.2% |
| Single Unit, Attached | 11 | 2.3% |
| 2 Unit Apartments | 1 | 0.2% |
| 3 or 4 Unit Apartments | 21 | 4.4% |
| 5 to 9 Unit Apartments | 0 | 0.0% |
| 10 or more Apartments | 6 | 1.3% |
| Mobile Home / Other | 8 | 1.7% |
| Total | 478 | 100.0% |
Housing Structures by Occupancy in Friend
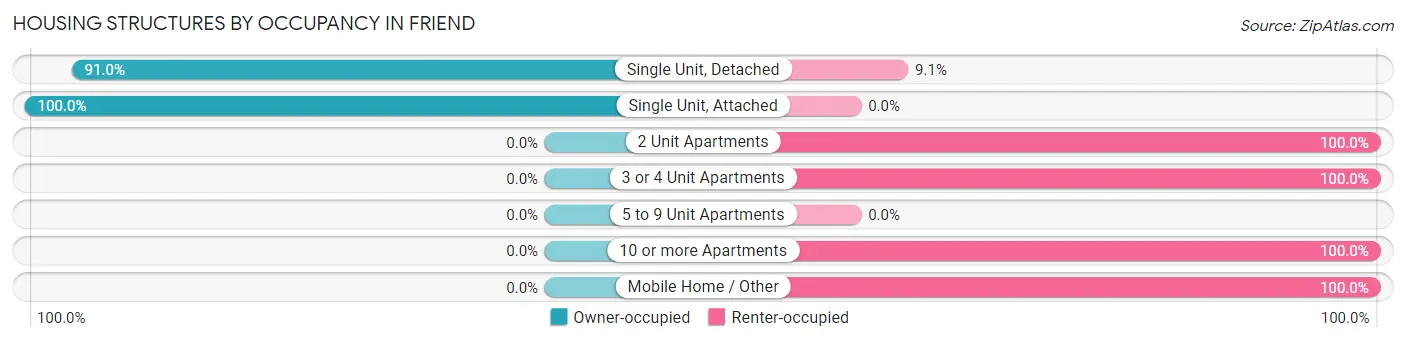
| Structure Type | Owner-occupied | Renter-occupied |
| Single Unit, Detached | 392 (90.9%) | 39 (9.0%) |
| Single Unit, Attached | 11 (100.0%) | 0 (0.0%) |
| 2 Unit Apartments | 0 (0.0%) | 1 (100.0%) |
| 3 or 4 Unit Apartments | 0 (0.0%) | 21 (100.0%) |
| 5 to 9 Unit Apartments | 0 (0.0%) | 0 (0.0%) |
| 10 or more Apartments | 0 (0.0%) | 6 (100.0%) |
| Mobile Home / Other | 0 (0.0%) | 8 (100.0%) |
| Total | 403 (84.3%) | 75 (15.7%) |
Housing Structures by Number of Rooms in Friend
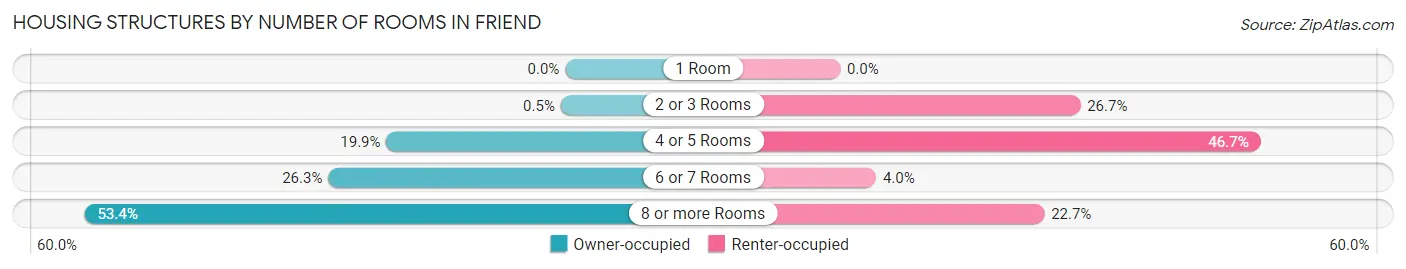
| Number of Rooms | Owner-occupied | Renter-occupied |
| 1 Room | 0 (0.0%) | 0 (0.0%) |
| 2 or 3 Rooms | 2 (0.5%) | 20 (26.7%) |
| 4 or 5 Rooms | 80 (19.9%) | 35 (46.7%) |
| 6 or 7 Rooms | 106 (26.3%) | 3 (4.0%) |
| 8 or more Rooms | 215 (53.3%) | 17 (22.7%) |
| Total | 403 (100.0%) | 75 (100.0%) |
Housing Structure by Heating Type in Friend
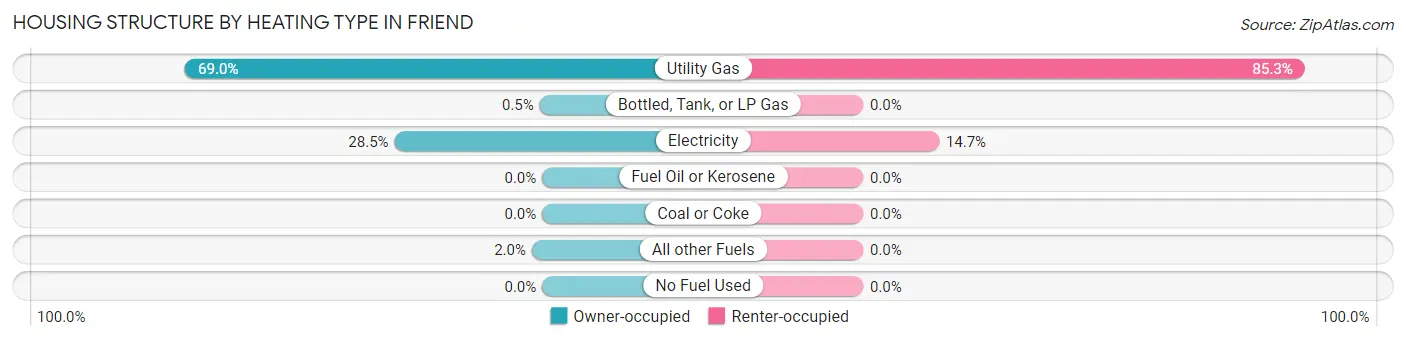
| Heating Type | Owner-occupied | Renter-occupied |
| Utility Gas | 278 (69.0%) | 64 (85.3%) |
| Bottled, Tank, or LP Gas | 2 (0.5%) | 0 (0.0%) |
| Electricity | 115 (28.5%) | 11 (14.7%) |
| Fuel Oil or Kerosene | 0 (0.0%) | 0 (0.0%) |
| Coal or Coke | 0 (0.0%) | 0 (0.0%) |
| All other Fuels | 8 (2.0%) | 0 (0.0%) |
| No Fuel Used | 0 (0.0%) | 0 (0.0%) |
| Total | 403 (100.0%) | 75 (100.0%) |
Household Vehicle Usage in Friend
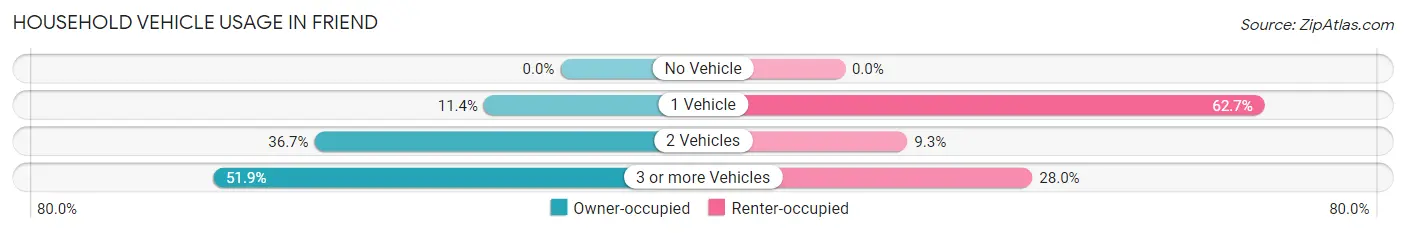
| Vehicles per Household | Owner-occupied | Renter-occupied |
| No Vehicle | 0 (0.0%) | 0 (0.0%) |
| 1 Vehicle | 46 (11.4%) | 47 (62.7%) |
| 2 Vehicles | 148 (36.7%) | 7 (9.3%) |
| 3 or more Vehicles | 209 (51.9%) | 21 (28.0%) |
| Total | 403 (100.0%) | 75 (100.0%) |
Real Estate & Mortgages in Friend
Real Estate and Mortgage Overview in Friend
| Characteristic | Without Mortgage | With Mortgage |
| Housing Units | 134 | 269 |
| Median Property Value | $140,500 | $158,700 |
| Median Household Income | $58,000 | $25 |
| Monthly Housing Costs | $600 | $2 |
| Real Estate Taxes | $2,250 | $43 |
Property Value by Mortgage Status in Friend
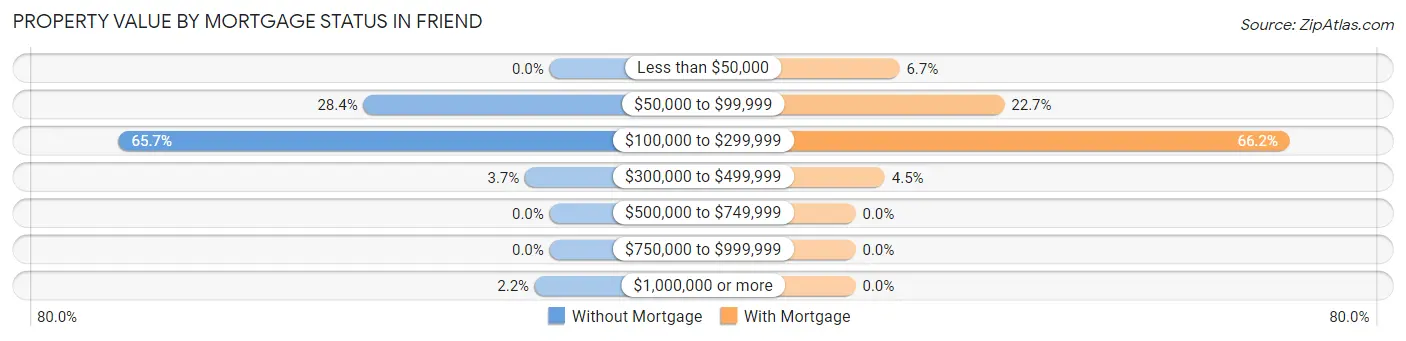
| Property Value | Without Mortgage | With Mortgage |
| Less than $50,000 | 0 (0.0%) | 18 (6.7%) |
| $50,000 to $99,999 | 38 (28.4%) | 61 (22.7%) |
| $100,000 to $299,999 | 88 (65.7%) | 178 (66.2%) |
| $300,000 to $499,999 | 5 (3.7%) | 12 (4.5%) |
| $500,000 to $749,999 | 0 (0.0%) | 0 (0.0%) |
| $750,000 to $999,999 | 0 (0.0%) | 0 (0.0%) |
| $1,000,000 or more | 3 (2.2%) | 0 (0.0%) |
| Total | 134 (100.0%) | 269 (100.0%) |
Household Income by Mortgage Status in Friend
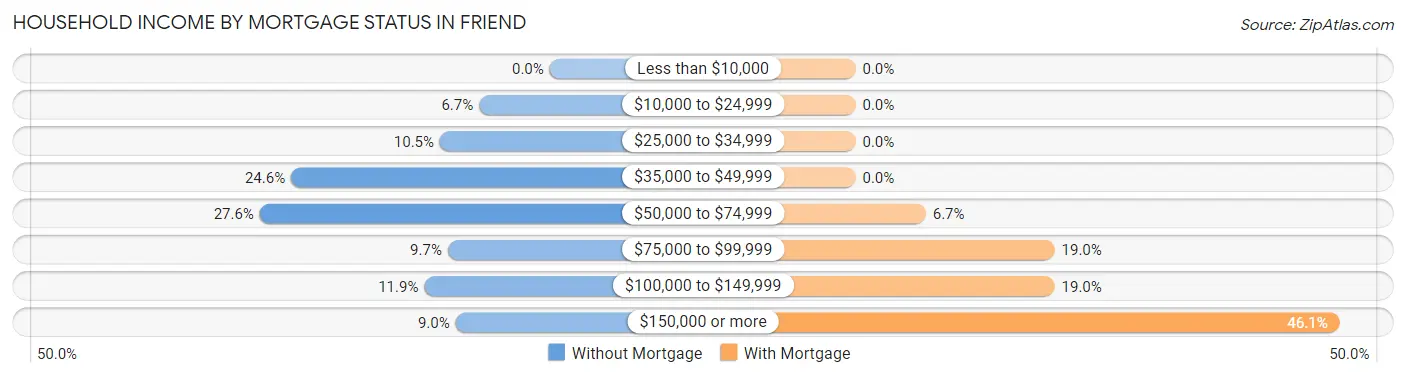
| Household Income | Without Mortgage | With Mortgage |
| Less than $10,000 | 0 (0.0%) | 0 (0.0%) |
| $10,000 to $24,999 | 9 (6.7%) | 0 (0.0%) |
| $25,000 to $34,999 | 14 (10.4%) | 0 (0.0%) |
| $35,000 to $49,999 | 33 (24.6%) | 0 (0.0%) |
| $50,000 to $74,999 | 37 (27.6%) | 18 (6.7%) |
| $75,000 to $99,999 | 13 (9.7%) | 51 (19.0%) |
| $100,000 to $149,999 | 16 (11.9%) | 51 (19.0%) |
| $150,000 or more | 12 (9.0%) | 124 (46.1%) |
| Total | 134 (100.0%) | 269 (100.0%) |
Property Value to Household Income Ratio in Friend
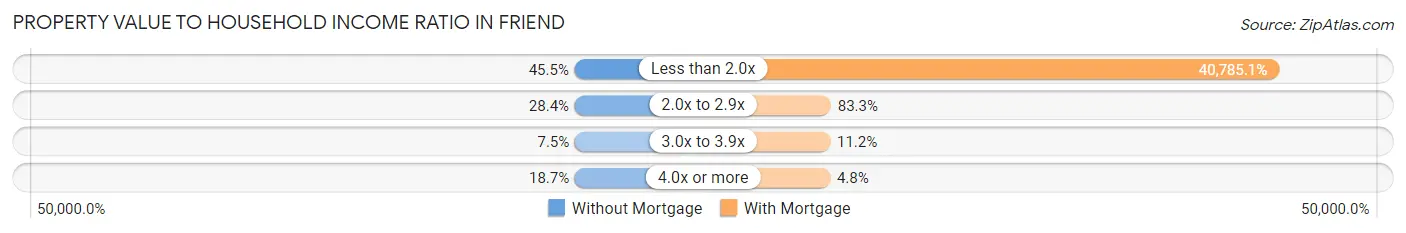
| Value-to-Income Ratio | Without Mortgage | With Mortgage |
| Less than 2.0x | 61 (45.5%) | 109,712 (40,785.1%) |
| 2.0x to 2.9x | 38 (28.4%) | 224 (83.3%) |
| 3.0x to 3.9x | 10 (7.5%) | 30 (11.2%) |
| 4.0x or more | 25 (18.7%) | 13 (4.8%) |
| Total | 134 (100.0%) | 269 (100.0%) |
Real Estate Taxes by Mortgage Status in Friend
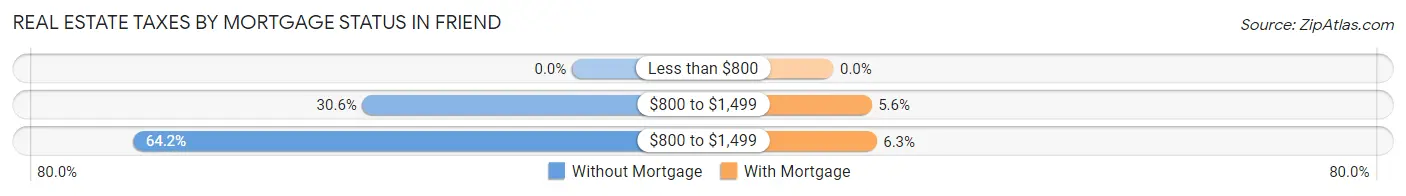
| Property Taxes | Without Mortgage | With Mortgage |
| Less than $800 | 0 (0.0%) | 0 (0.0%) |
| $800 to $1,499 | 41 (30.6%) | 15 (5.6%) |
| $800 to $1,499 | 86 (64.2%) | 17 (6.3%) |
| Total | 134 (100.0%) | 269 (100.0%) |
Health & Disability in Friend
Health Insurance Coverage by Age in Friend
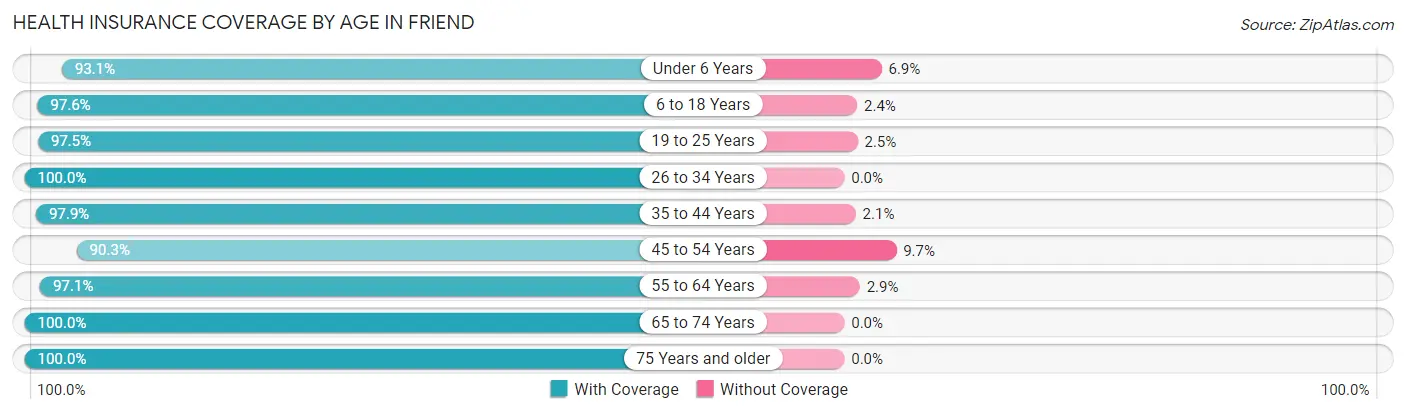
| Age Bracket | With Coverage | Without Coverage |
| Under 6 Years | 67 (93.1%) | 5 (6.9%) |
| 6 to 18 Years | 204 (97.6%) | 5 (2.4%) |
| 19 to 25 Years | 79 (97.5%) | 2 (2.5%) |
| 26 to 34 Years | 104 (100.0%) | 0 (0.0%) |
| 35 to 44 Years | 185 (97.9%) | 4 (2.1%) |
| 45 to 54 Years | 112 (90.3%) | 12 (9.7%) |
| 55 to 64 Years | 135 (97.1%) | 4 (2.9%) |
| 65 to 74 Years | 61 (100.0%) | 0 (0.0%) |
| 75 Years and older | 138 (100.0%) | 0 (0.0%) |
| Total | 1,085 (97.1%) | 32 (2.9%) |
Health Insurance Coverage by Citizenship Status in Friend
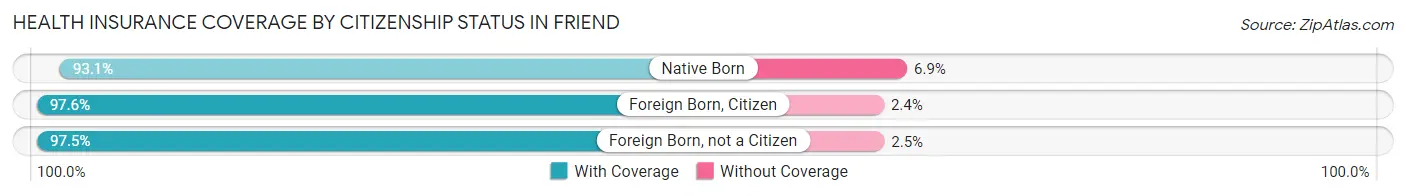
| Citizenship Status | With Coverage | Without Coverage |
| Native Born | 67 (93.1%) | 5 (6.9%) |
| Foreign Born, Citizen | 204 (97.6%) | 5 (2.4%) |
| Foreign Born, not a Citizen | 79 (97.5%) | 2 (2.5%) |
Health Insurance Coverage by Household Income in Friend
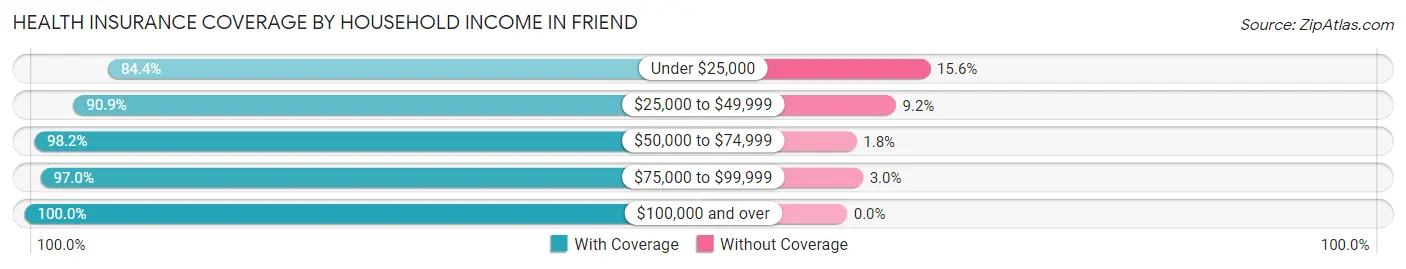
| Household Income | With Coverage | Without Coverage |
| Under $25,000 | 54 (84.4%) | 10 (15.6%) |
| $25,000 to $49,999 | 129 (90.8%) | 13 (9.1%) |
| $50,000 to $74,999 | 219 (98.2%) | 4 (1.8%) |
| $75,000 to $99,999 | 163 (97.0%) | 5 (3.0%) |
| $100,000 and over | 520 (100.0%) | 0 (0.0%) |
Public vs Private Health Insurance Coverage by Age in Friend
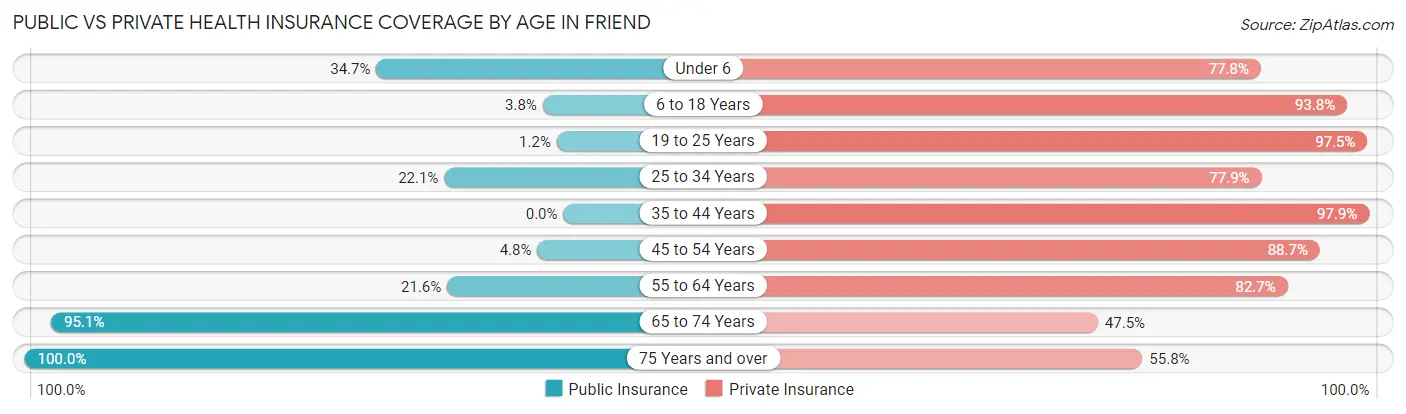
| Age Bracket | Public Insurance | Private Insurance |
| Under 6 | 25 (34.7%) | 56 (77.8%) |
| 6 to 18 Years | 8 (3.8%) | 196 (93.8%) |
| 19 to 25 Years | 1 (1.2%) | 79 (97.5%) |
| 25 to 34 Years | 23 (22.1%) | 81 (77.9%) |
| 35 to 44 Years | 0 (0.0%) | 185 (97.9%) |
| 45 to 54 Years | 6 (4.8%) | 110 (88.7%) |
| 55 to 64 Years | 30 (21.6%) | 115 (82.7%) |
| 65 to 74 Years | 58 (95.1%) | 29 (47.5%) |
| 75 Years and over | 138 (100.0%) | 77 (55.8%) |
| Total | 289 (25.9%) | 928 (83.1%) |
Disability Status by Sex by Age in Friend
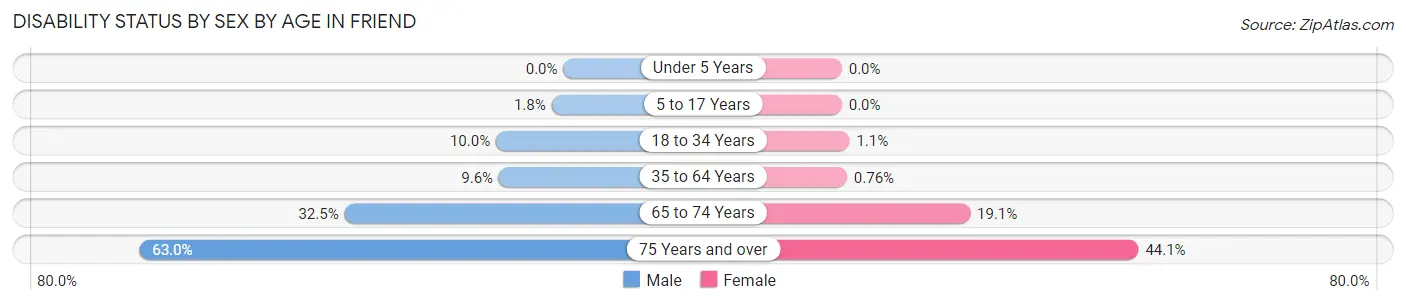
| Age Bracket | Male | Female |
| Under 5 Years | 0 (0.0%) | 0 (0.0%) |
| 5 to 17 Years | 2 (1.8%) | 0 (0.0%) |
| 18 to 34 Years | 10 (10.0%) | 1 (1.1%) |
| 35 to 64 Years | 18 (9.6%) | 2 (0.8%) |
| 65 to 74 Years | 13 (32.5%) | 4 (19.1%) |
| 75 Years and over | 34 (63.0%) | 37 (44.1%) |
Disability Class by Sex by Age in Friend
Disability Class: Hearing Difficulty
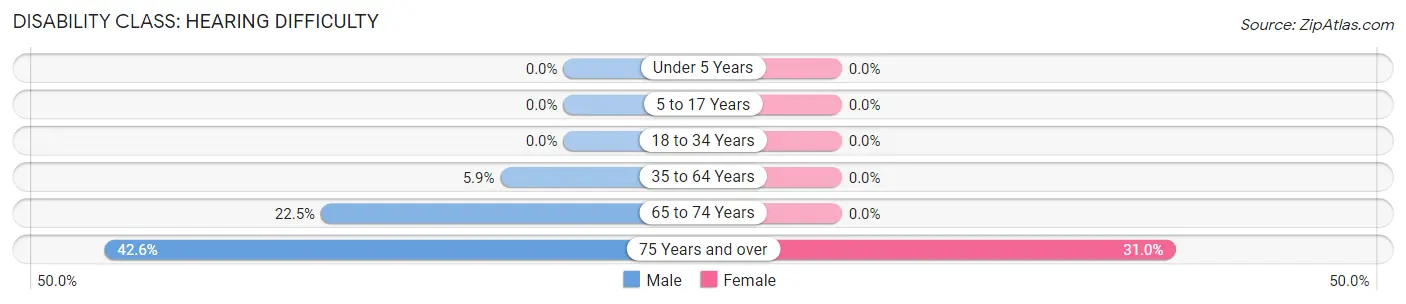
| Age Bracket | Male | Female |
| Under 5 Years | 0 (0.0%) | 0 (0.0%) |
| 5 to 17 Years | 0 (0.0%) | 0 (0.0%) |
| 18 to 34 Years | 0 (0.0%) | 0 (0.0%) |
| 35 to 64 Years | 11 (5.9%) | 0 (0.0%) |
| 65 to 74 Years | 9 (22.5%) | 0 (0.0%) |
| 75 Years and over | 23 (42.6%) | 26 (30.9%) |
Disability Class: Vision Difficulty
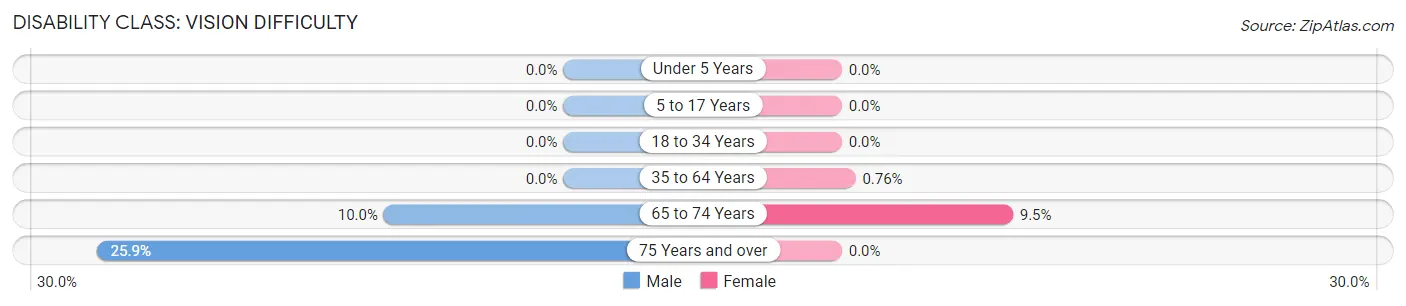
| Age Bracket | Male | Female |
| Under 5 Years | 0 (0.0%) | 0 (0.0%) |
| 5 to 17 Years | 0 (0.0%) | 0 (0.0%) |
| 18 to 34 Years | 0 (0.0%) | 0 (0.0%) |
| 35 to 64 Years | 0 (0.0%) | 2 (0.8%) |
| 65 to 74 Years | 4 (10.0%) | 2 (9.5%) |
| 75 Years and over | 14 (25.9%) | 0 (0.0%) |
Disability Class: Cognitive Difficulty
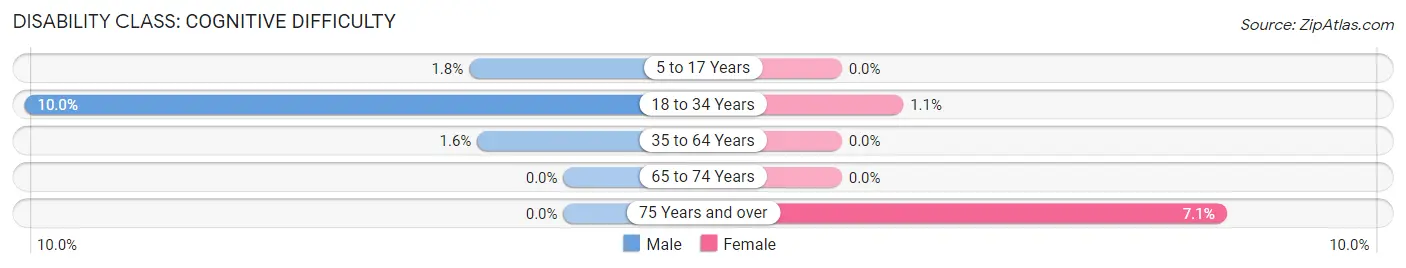
| Age Bracket | Male | Female |
| 5 to 17 Years | 2 (1.8%) | 0 (0.0%) |
| 18 to 34 Years | 10 (10.0%) | 1 (1.1%) |
| 35 to 64 Years | 3 (1.6%) | 0 (0.0%) |
| 65 to 74 Years | 0 (0.0%) | 0 (0.0%) |
| 75 Years and over | 0 (0.0%) | 6 (7.1%) |
Disability Class: Ambulatory Difficulty
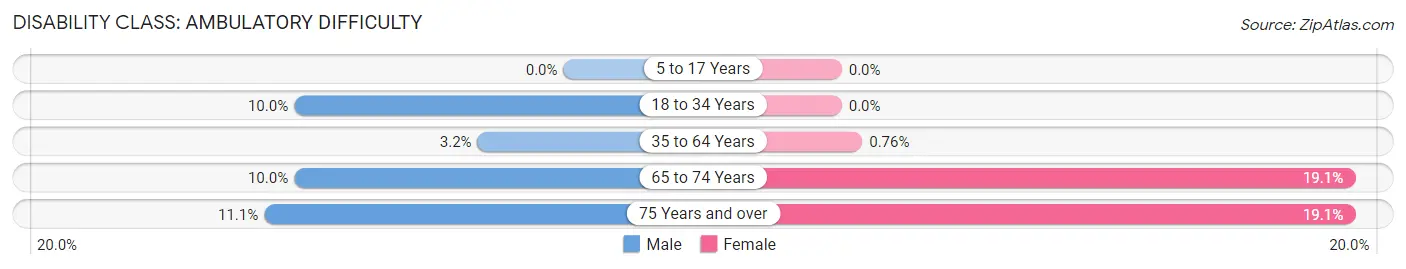
| Age Bracket | Male | Female |
| 5 to 17 Years | 0 (0.0%) | 0 (0.0%) |
| 18 to 34 Years | 10 (10.0%) | 0 (0.0%) |
| 35 to 64 Years | 6 (3.2%) | 2 (0.8%) |
| 65 to 74 Years | 4 (10.0%) | 4 (19.1%) |
| 75 Years and over | 6 (11.1%) | 16 (19.1%) |
Disability Class: Self-Care Difficulty
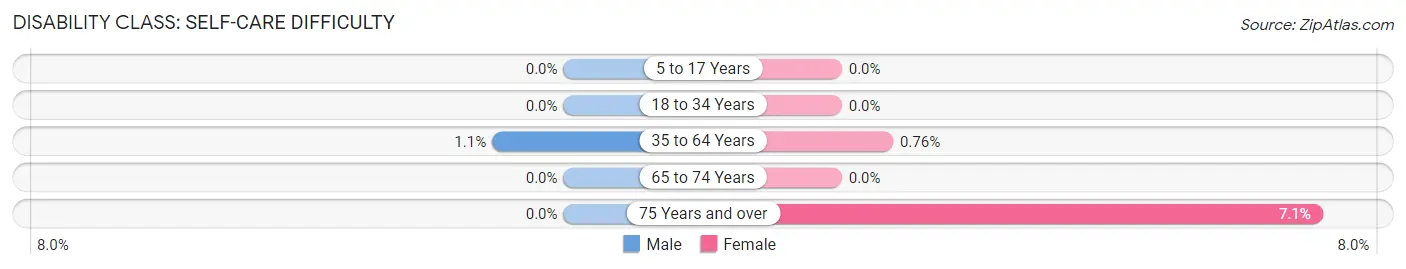
| Age Bracket | Male | Female |
| 5 to 17 Years | 0 (0.0%) | 0 (0.0%) |
| 18 to 34 Years | 0 (0.0%) | 0 (0.0%) |
| 35 to 64 Years | 2 (1.1%) | 2 (0.8%) |
| 65 to 74 Years | 0 (0.0%) | 0 (0.0%) |
| 75 Years and over | 0 (0.0%) | 6 (7.1%) |
Technology Access in Friend
Computing Device Access in Friend
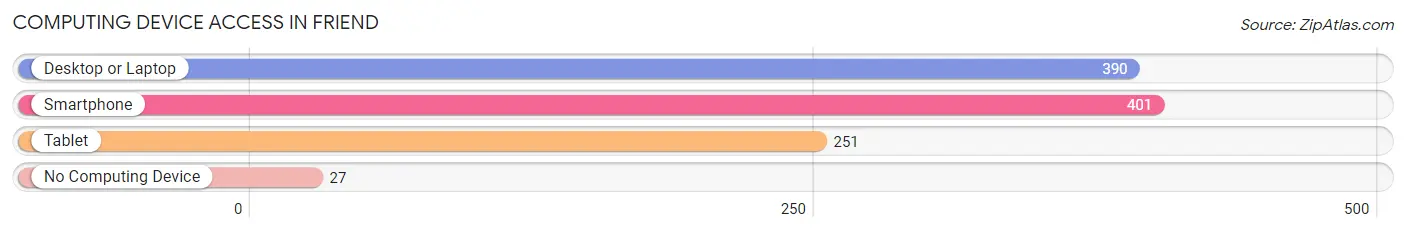
| Device Type | # Households | % Households |
| Desktop or Laptop | 390 | 81.6% |
| Smartphone | 401 | 83.9% |
| Tablet | 251 | 52.5% |
| No Computing Device | 27 | 5.7% |
| Total | 478 | 100.0% |
Internet Access in Friend
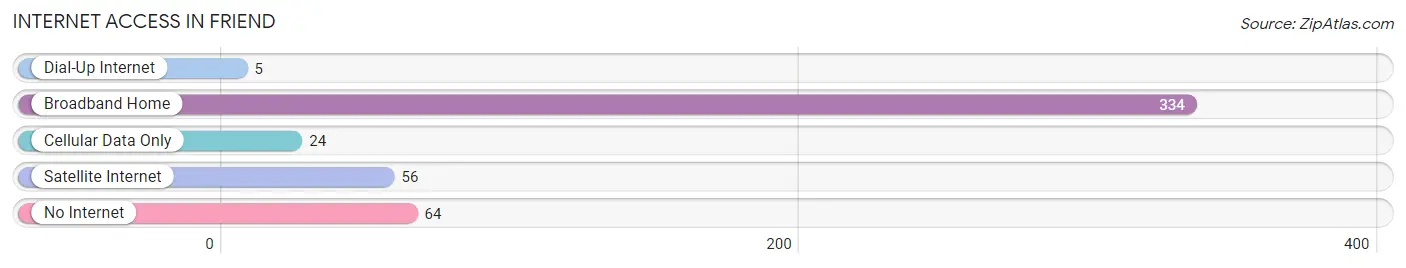
| Internet Type | # Households | % Households |
| Dial-Up Internet | 5 | 1.1% |
| Broadband Home | 334 | 69.9% |
| Cellular Data Only | 24 | 5.0% |
| Satellite Internet | 56 | 11.7% |
| No Internet | 64 | 13.4% |
| Total | 478 | 100.0% |
Friend Summary
History
The history of Nebraska dates back to the early 19th century when the area was part of the Louisiana Purchase. The first Europeans to explore the area were French fur traders, who arrived in the late 1700s. The first permanent settlement in Nebraska was established in 1823 by the American Fur Company. The area was part of the Nebraska Territory from 1854 to 1867, when it became the 37th state in the Union.
Nebraska has a rich history of Native American tribes, including the Omaha, Pawnee, and Sioux. These tribes were displaced by settlers in the mid-1800s, and many of their descendants still live in the state today.
The Homestead Act of 1862 encouraged settlers to move to Nebraska, and the population grew rapidly. The Union Pacific Railroad was completed in 1869, connecting the eastern and western parts of the state. This allowed for increased trade and commerce, and the population continued to grow.
In the late 19th century, Nebraska was a major producer of wheat and corn, and the state’s economy was largely based on agriculture. The Great Plains were also home to large herds of cattle, and the state became known as the “Cowboy State.”
The 20th century saw the growth of industry in Nebraska, with the development of the meatpacking industry and the growth of the railroad. The state also became a major producer of ethanol and other biofuels.
Geography
Nebraska is located in the Midwestern United States, bordered by South Dakota to the north, Iowa to the east, Missouri to the southeast, Kansas to the south, and Colorado to the west. The state has an area of 77,354 square miles, making it the 16th largest state in the country.
The landscape of Nebraska is mostly flat, with rolling hills in the east and the Great Plains in the west. The state is home to several rivers, including the Platte, Niobrara, and Missouri. The highest point in Nebraska is Panorama Point, which is 5,424 feet above sea level.
The climate of Nebraska is generally temperate, with hot summers and cold winters. The state receives an average of 20 inches of precipitation per year, with most of it falling in the spring and summer months.
Economy
The economy of Nebraska is largely based on agriculture, with the state being a major producer of corn, soybeans, wheat, and other crops. The state is also a major producer of beef, pork, and poultry, and is home to several large meatpacking plants.
The state’s economy is also supported by manufacturing, with the production of machinery, chemicals, and food products. Tourism is also an important part of the economy, with visitors coming to the state to enjoy its natural beauty and outdoor activities.
Demographics
As of 2019, the population of Nebraska was 1.93 million, making it the 37th most populous state in the country. The state has a population density of 24.3 people per square mile, making it the 37th most densely populated state.
The racial makeup of Nebraska is 87.3% White, 4.2% Black or African American, 1.7% Asian, 0.7% Native American, and 5.1% from other races. The state also has a large Hispanic or Latino population, making up 11.2% of the population.
The median household income in Nebraska is $58,906, and the median home value is $179,400. The state’s unemployment rate is 2.9%, which is lower than the national average.
Common Questions
What is Per Capita Income in Friend?
Per Capita income in Friend is $36,084.
What is the Median Family Income in Friend?
Median Family Income in Friend is $95,000.
What is the Median Household income in Friend?
Median Household Income in Friend is $77,386.
What is Income or Wage Gap in Friend?
Income or Wage Gap in Friend is 14.7%.
Women in Friend earn 85.3 cents for every dollar earned by a man.
What is Inequality or Gini Index in Friend?
Inequality or Gini Index in Friend is 0.36.
What is the Total Population of Friend?
Total Population of Friend is 1,117.
What is the Total Male Population of Friend?
Total Male Population of Friend is 532.
What is the Total Female Population of Friend?
Total Female Population of Friend is 585.
What is the Ratio of Males per 100 Females in Friend?
There are 90.94 Males per 100 Females in Friend.
What is the Ratio of Females per 100 Males in Friend?
There are 109.96 Females per 100 Males in Friend.
What is the Median Population Age in Friend?
Median Population Age in Friend is 38.8 Years.
What is the Average Family Size in Friend
Average Family Size in Friend is 2.6 People.
What is the Average Household Size in Friend
Average Household Size in Friend is 2.3 People.
How Large is the Labor Force in Friend?
There are 622 People in the Labor Forcein in Friend.
What is the Percentage of People in the Labor Force in Friend?
70.8% of People are in the Labor Force in Friend.
What is the Unemployment Rate in Friend?
Unemployment Rate in Friend is 1.4%.