Fairbury, NE Map & Demographics
Fairbury Map
Fairbury Overview
$26,698
PER CAPITA INCOME
$56,940
AVG FAMILY INCOME
$47,518
AVG HOUSEHOLD INCOME
22.9%
WAGE / INCOME GAP [ % ]
77.1¢/ $1
WAGE / INCOME GAP [ $ ]
0.44
INEQUALITY / GINI INDEX
3,913
TOTAL POPULATION
1,759
MALE POPULATION
2,154
FEMALE POPULATION
81.66
MALES / 100 FEMALES
122.46
FEMALES / 100 MALES
40.9
MEDIAN AGE
3.1
AVG FAMILY SIZE
2.3
AVG HOUSEHOLD SIZE
1,907
LABOR FORCE [ PEOPLE ]
59.9%
PERCENT IN LABOR FORCE
1.0%
UNEMPLOYMENT RATE
Fairbury Zip Codes
Fairbury Area Codes
Income in Fairbury
Income Overview in Fairbury
Per Capita Income in Fairbury is $26,698, while median incomes of families and households are $56,940 and $47,518 respectively.
| Characteristic | Number | Measure |
| Per Capita Income | 3,913 | $26,698 |
| Median Family Income | 847 | $56,940 |
| Mean Family Income | 847 | $73,270 |
| Median Household Income | 1,677 | $47,518 |
| Mean Household Income | 1,677 | $62,060 |
| Income Deficit | 847 | $0 |
| Wage / Income Gap (%) | 3,913 | 22.89% |
| Wage / Income Gap ($) | 3,913 | 77.11¢ per $1 |
| Gini / Inequality Index | 3,913 | 0.44 |
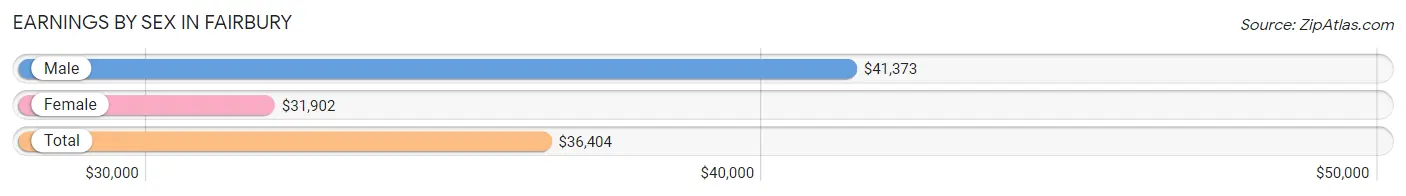
Earnings by Sex in Fairbury
Average Earnings in Fairbury are $36,404, $41,373 for men and $31,902 for women, a difference of 22.9%.
| Sex | Number | Average Earnings |
| Male | 958 (48.1%) | $41,373 |
| Female | 1,033 (51.9%) | $31,902 |
| Total | 1,991 (100.0%) | $36,404 |
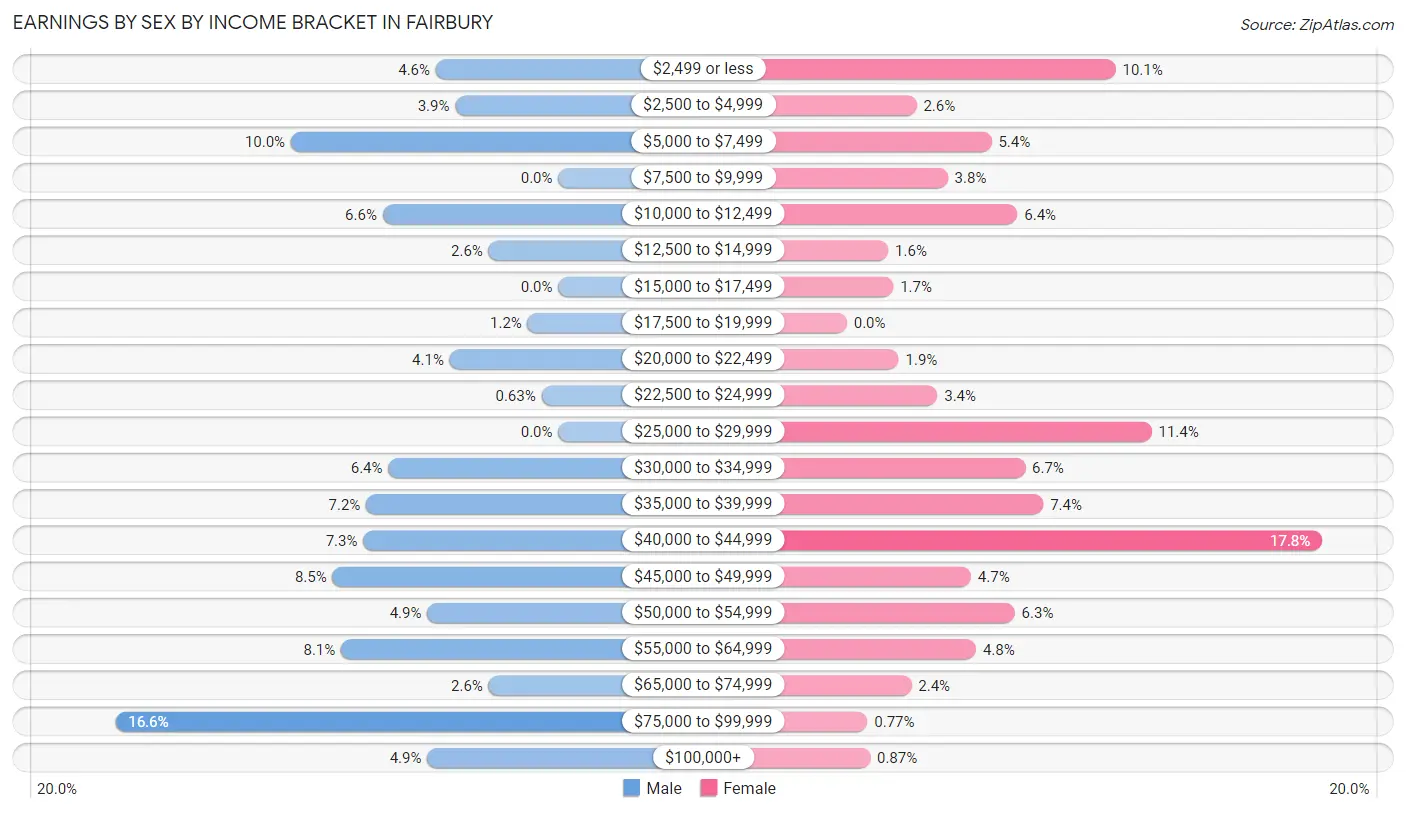
Earnings by Sex by Income Bracket in Fairbury
The most common earnings brackets in Fairbury are $75,000 to $99,999 for men (159 | 16.6%) and $40,000 to $44,999 for women (184 | 17.8%).
| Income | Male | Female |
| $2,499 or less | 44 (4.6%) | 104 (10.1%) |
| $2,500 to $4,999 | 37 (3.9%) | 27 (2.6%) |
| $5,000 to $7,499 | 96 (10.0%) | 56 (5.4%) |
| $7,500 to $9,999 | 0 (0.0%) | 39 (3.8%) |
| $10,000 to $12,499 | 63 (6.6%) | 66 (6.4%) |
| $12,500 to $14,999 | 25 (2.6%) | 16 (1.5%) |
| $15,000 to $17,499 | 0 (0.0%) | 18 (1.7%) |
| $17,500 to $19,999 | 11 (1.1%) | 0 (0.0%) |
| $20,000 to $22,499 | 39 (4.1%) | 20 (1.9%) |
| $22,500 to $24,999 | 6 (0.6%) | 35 (3.4%) |
| $25,000 to $29,999 | 0 (0.0%) | 118 (11.4%) |
| $30,000 to $34,999 | 61 (6.4%) | 69 (6.7%) |
| $35,000 to $39,999 | 69 (7.2%) | 76 (7.4%) |
| $40,000 to $44,999 | 70 (7.3%) | 184 (17.8%) |
| $45,000 to $49,999 | 81 (8.5%) | 48 (4.6%) |
| $50,000 to $54,999 | 47 (4.9%) | 65 (6.3%) |
| $55,000 to $64,999 | 78 (8.1%) | 50 (4.8%) |
| $65,000 to $74,999 | 25 (2.6%) | 25 (2.4%) |
| $75,000 to $99,999 | 159 (16.6%) | 8 (0.8%) |
| $100,000+ | 47 (4.9%) | 9 (0.9%) |
| Total | 958 (100.0%) | 1,033 (100.0%) |
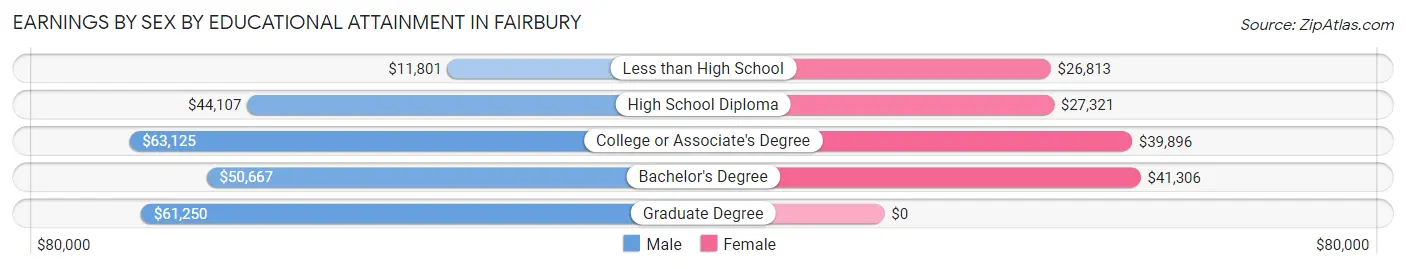
Earnings by Sex by Educational Attainment in Fairbury
Average earnings in Fairbury are $46,840 for men and $34,348 for women, a difference of 26.7%. Men with an educational attainment of college or associate's degree enjoy the highest average annual earnings of $63,125, while those with less than high school education earn the least with $11,801. Women with an educational attainment of bachelor's degree earn the most with the average annual earnings of $41,306, while those with less than high school education have the smallest earnings of $26,813.
| Educational Attainment | Male Income | Female Income |
| Less than High School | $11,801 | $26,813 |
| High School Diploma | $44,107 | $27,321 |
| College or Associate's Degree | $63,125 | $39,896 |
| Bachelor's Degree | $50,667 | $41,306 |
| Graduate Degree | $61,250 | $0 |
| Total | $46,840 | $34,348 |
Family Income in Fairbury
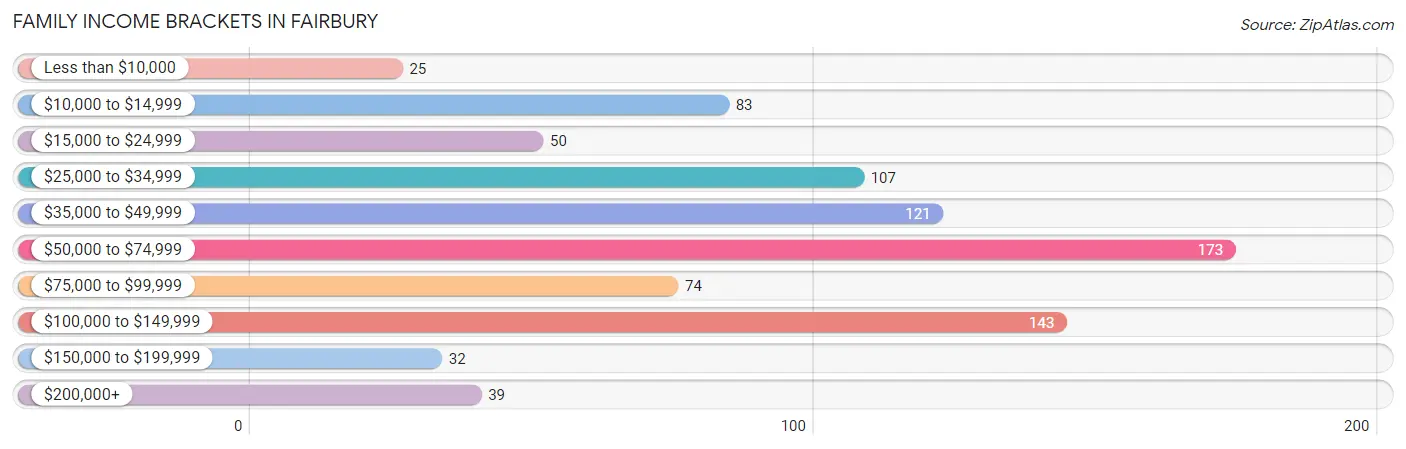
Family Income Brackets in Fairbury
According to the Fairbury family income data, there are 173 families falling into the $50,000 to $74,999 income range, which is the most common income bracket and makes up 20.4% of all families. Conversely, the less than $10,000 income bracket is the least frequent group with only 25 families (2.9%) belonging to this category.
| Income Bracket | # Families | % Families |
| Less than $10,000 | 25 | 3.0% |
| $10,000 to $14,999 | 83 | 9.8% |
| $15,000 to $24,999 | 50 | 5.9% |
| $25,000 to $34,999 | 107 | 12.6% |
| $35,000 to $49,999 | 121 | 14.3% |
| $50,000 to $74,999 | 173 | 20.4% |
| $75,000 to $99,999 | 74 | 8.7% |
| $100,000 to $149,999 | 143 | 16.9% |
| $150,000 to $199,999 | 32 | 3.8% |
| $200,000+ | 39 | 4.6% |
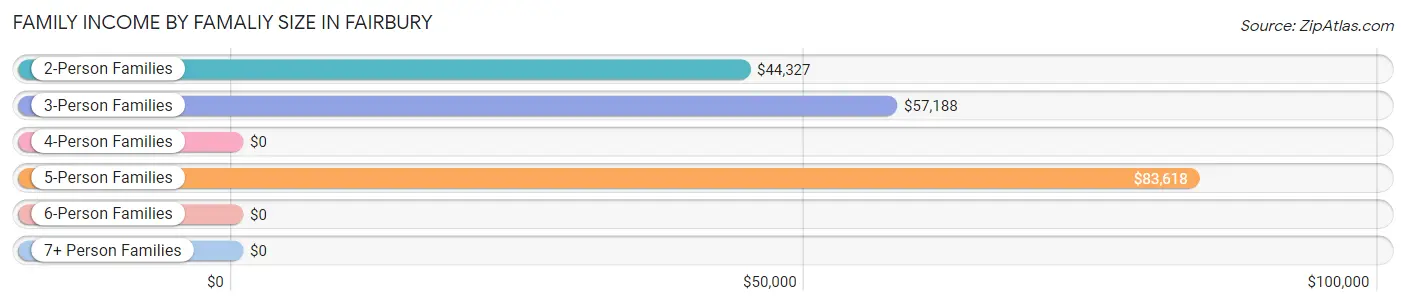
Family Income by Famaliy Size in Fairbury
5-person families (91 | 10.7%) account for the highest median family income in Fairbury with $83,618 per family, while 2-person families (530 | 62.6%) have the highest median income of $22,164 per family member.
| Income Bracket | # Families | Median Income |
| 2-Person Families | 530 (62.6%) | $44,327 |
| 3-Person Families | 125 (14.8%) | $57,188 |
| 4-Person Families | 68 (8.0%) | $0 |
| 5-Person Families | 91 (10.7%) | $83,618 |
| 6-Person Families | 24 (2.8%) | $0 |
| 7+ Person Families | 9 (1.1%) | $0 |
| Total | 847 (100.0%) | $56,940 |
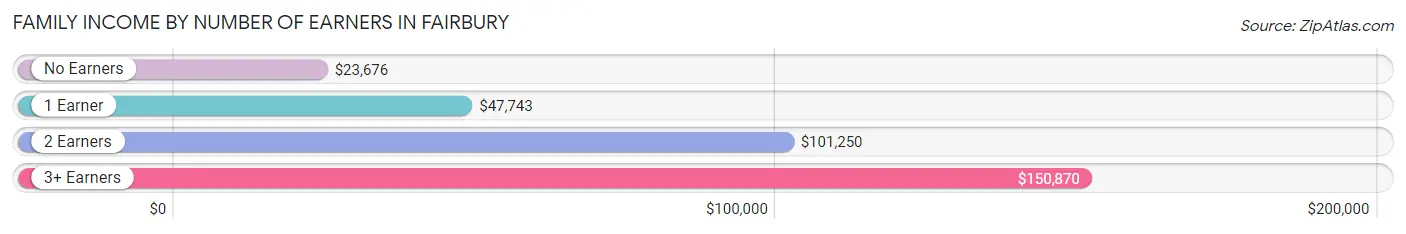
Family Income by Number of Earners in Fairbury
The median family income in Fairbury is $56,940, with families comprising 3+ earners (52) having the highest median family income of $150,870, while families with no earners (100) have the lowest median family income of $23,676, accounting for 6.1% and 11.8% of families, respectively.
| Number of Earners | # Families | Median Income |
| No Earners | 100 (11.8%) | $23,676 |
| 1 Earner | 401 (47.3%) | $47,743 |
| 2 Earners | 294 (34.7%) | $101,250 |
| 3+ Earners | 52 (6.1%) | $150,870 |
| Total | 847 (100.0%) | $56,940 |
Household Income in Fairbury
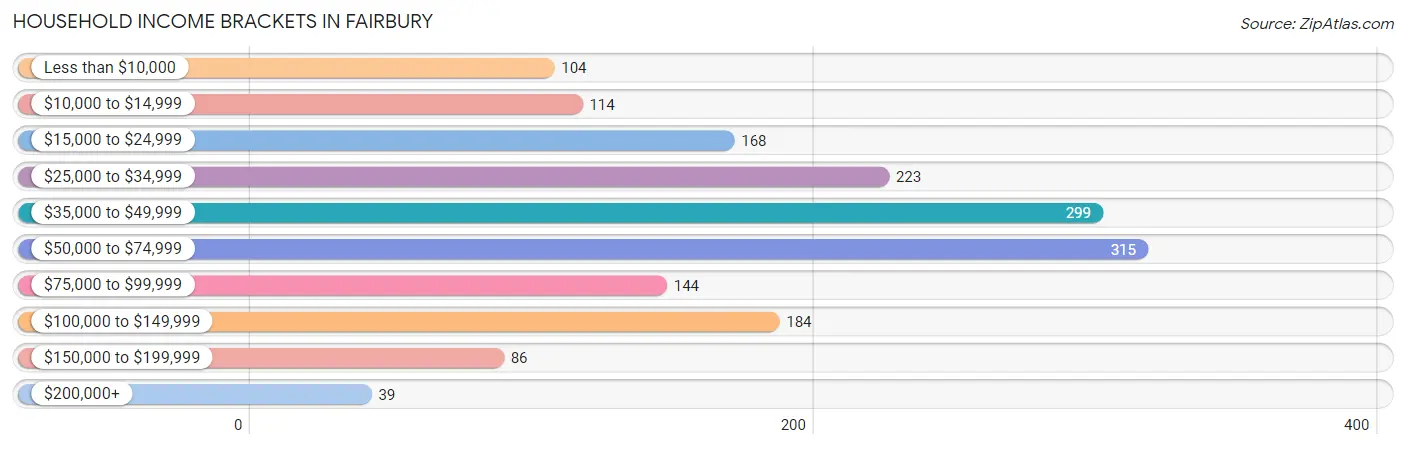
Household Income Brackets in Fairbury
With 315 households falling in the category, the $50,000 to $74,999 income range is the most frequent in Fairbury, accounting for 18.8% of all households. In contrast, only 39 households (2.3%) fall into the $200,000+ income bracket, making it the least populous group.
| Income Bracket | # Households | % Households |
| Less than $10,000 | 104 | 6.2% |
| $10,000 to $14,999 | 114 | 6.8% |
| $15,000 to $24,999 | 168 | 10.0% |
| $25,000 to $34,999 | 223 | 13.3% |
| $35,000 to $49,999 | 299 | 17.8% |
| $50,000 to $74,999 | 315 | 18.8% |
| $75,000 to $99,999 | 144 | 8.6% |
| $100,000 to $149,999 | 184 | 11.0% |
| $150,000 to $199,999 | 86 | 5.1% |
| $200,000+ | 39 | 2.3% |
Household Income by Householder Age in Fairbury
The median household income in Fairbury is $47,518, with the highest median household income of $59,167 found in the 45 to 64 years age bracket for the primary householder. A total of 504 households (30.0%) fall into this category. Meanwhile, the 65+ years age bracket for the primary householder has the lowest median household income of $34,779, with 588 households (35.1%) in this group.
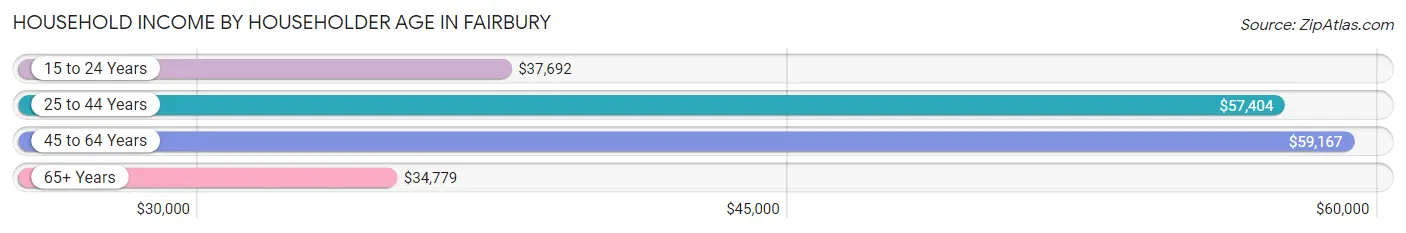
| Income Bracket | # Households | Median Income |
| 15 to 24 Years | 108 (6.4%) | $37,692 |
| 25 to 44 Years | 477 (28.4%) | $57,404 |
| 45 to 64 Years | 504 (30.0%) | $59,167 |
| 65+ Years | 588 (35.1%) | $34,779 |
| Total | 1,677 (100.0%) | $47,518 |
Poverty in Fairbury
Income Below Poverty by Sex and Age in Fairbury
With 13.5% poverty level for males and 18.5% for females among the residents of Fairbury, 35 to 44 year old males and 35 to 44 year old females are the most vulnerable to poverty, with 128 males (52.2%) and 105 females (49.1%) in their respective age groups living below the poverty level.
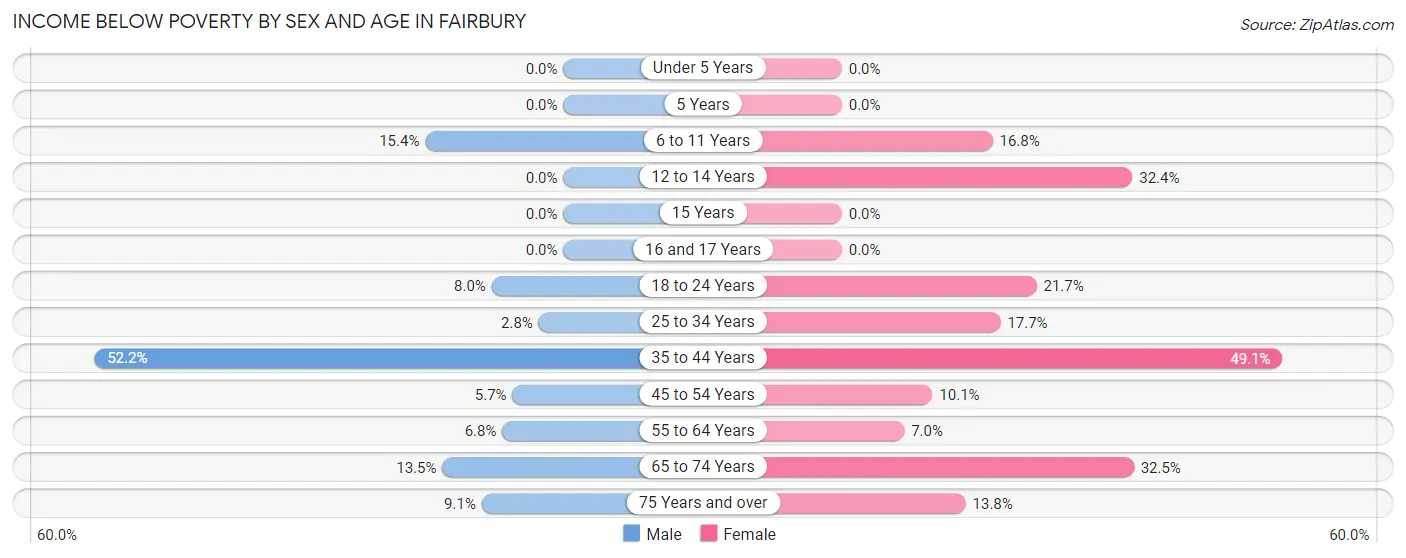
| Age Bracket | Male | Female |
| Under 5 Years | 0 (0.0%) | 0 (0.0%) |
| 5 Years | 0 (0.0%) | 0 (0.0%) |
| 6 to 11 Years | 22 (15.4%) | 22 (16.8%) |
| 12 to 14 Years | 0 (0.0%) | 22 (32.4%) |
| 15 Years | 0 (0.0%) | 0 (0.0%) |
| 16 and 17 Years | 0 (0.0%) | 0 (0.0%) |
| 18 to 24 Years | 13 (8.0%) | 36 (21.7%) |
| 25 to 34 Years | 5 (2.8%) | 47 (17.7%) |
| 35 to 44 Years | 128 (52.2%) | 105 (49.1%) |
| 45 to 54 Years | 11 (5.7%) | 22 (10.1%) |
| 55 to 64 Years | 20 (6.8%) | 18 (7.0%) |
| 65 to 74 Years | 24 (13.5%) | 79 (32.5%) |
| 75 Years and over | 8 (9.1%) | 36 (13.8%) |
| Total | 231 (13.5%) | 387 (18.5%) |
Income Above Poverty by Sex and Age in Fairbury
According to the poverty statistics in Fairbury, males aged under 5 years and females aged under 5 years are the age groups that are most secure financially, with 100.0% of males and 100.0% of females in these age groups living above the poverty line.
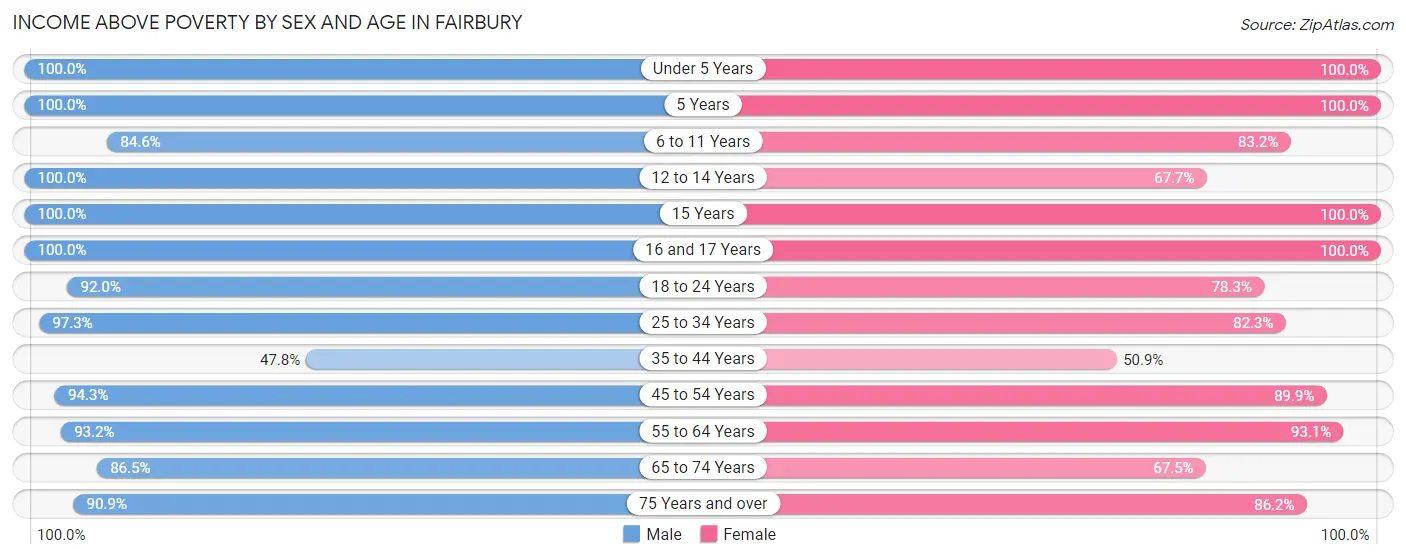
| Age Bracket | Male | Female |
| Under 5 Years | 86 (100.0%) | 143 (100.0%) |
| 5 Years | 59 (100.0%) | 27 (100.0%) |
| 6 to 11 Years | 121 (84.6%) | 109 (83.2%) |
| 12 to 14 Years | 24 (100.0%) | 46 (67.6%) |
| 15 Years | 11 (100.0%) | 34 (100.0%) |
| 16 and 17 Years | 48 (100.0%) | 56 (100.0%) |
| 18 to 24 Years | 150 (92.0%) | 130 (78.3%) |
| 25 to 34 Years | 177 (97.3%) | 219 (82.3%) |
| 35 to 44 Years | 117 (47.8%) | 109 (50.9%) |
| 45 to 54 Years | 183 (94.3%) | 196 (89.9%) |
| 55 to 64 Years | 274 (93.2%) | 241 (93.0%) |
| 65 to 74 Years | 154 (86.5%) | 164 (67.5%) |
| 75 Years and over | 80 (90.9%) | 225 (86.2%) |
| Total | 1,484 (86.5%) | 1,699 (81.5%) |
Income Below Poverty Among Married-Couple Families in Fairbury
The poverty statistics for married-couple families in Fairbury show that 17.1% or 111 of the total 651 families live below the poverty line. Families with no children have the highest poverty rate of 25.4%, comprising of 111 families. On the other hand, families with 1 or 2 children have the lowest poverty rate of 0.0%, which includes 0 families.
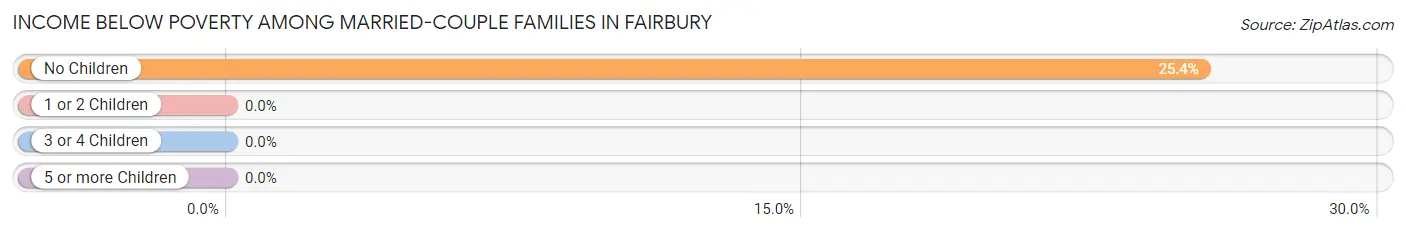
| Children | Above Poverty | Below Poverty |
| No Children | 326 (74.6%) | 111 (25.4%) |
| 1 or 2 Children | 131 (100.0%) | 0 (0.0%) |
| 3 or 4 Children | 83 (100.0%) | 0 (0.0%) |
| 5 or more Children | 0 (0.0%) | 0 (0.0%) |
| Total | 540 (83.0%) | 111 (17.1%) |
Income Below Poverty Among Single-Parent Households in Fairbury
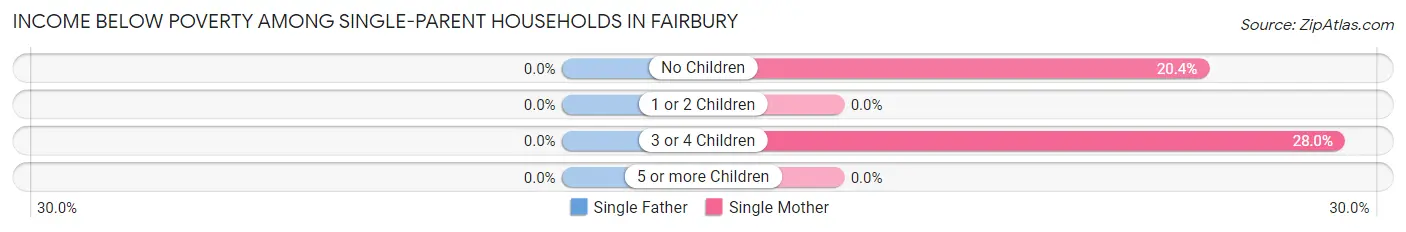
| Children | Single Father | Single Mother |
| No Children | 0 (0.0%) | 10 (20.4%) |
| 1 or 2 Children | 0 (0.0%) | 0 (0.0%) |
| 3 or 4 Children | 0 (0.0%) | 7 (28.0%) |
| 5 or more Children | 0 (0.0%) | 0 (0.0%) |
| Total | 0 (0.0%) | 17 (10.8%) |
Income Below Poverty Among Married-Couple vs Single-Parent Households in Fairbury
The poverty data for Fairbury shows that 111 of the married-couple family households (17.1%) and 17 of the single-parent households (8.7%) are living below the poverty level. Within the married-couple family households, those with no children have the highest poverty rate, with 111 households (25.4%) falling below the poverty line. Among the single-parent households, those with 3 or 4 children have the highest poverty rate, with 7 household (28.0%) living below poverty.
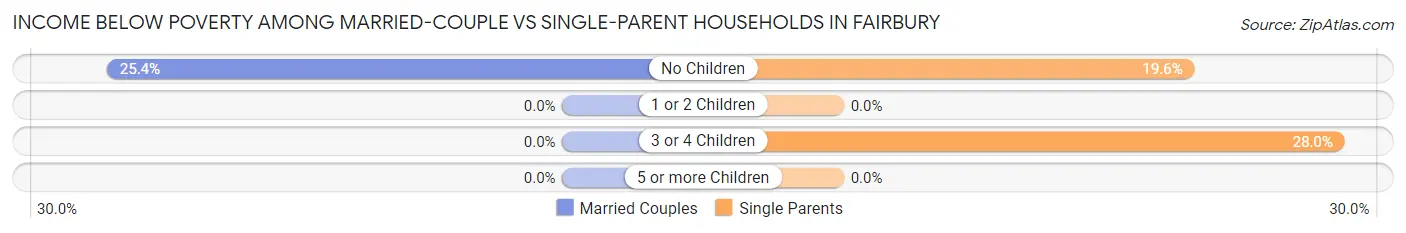
| Children | Married-Couple Families | Single-Parent Households |
| No Children | 111 (25.4%) | 10 (19.6%) |
| 1 or 2 Children | 0 (0.0%) | 0 (0.0%) |
| 3 or 4 Children | 0 (0.0%) | 7 (28.0%) |
| 5 or more Children | 0 (0.0%) | 0 (0.0%) |
| Total | 111 (17.1%) | 17 (8.7%) |
Race in Fairbury
The most populous races in Fairbury are White / Caucasian (3,599 | 92.0%), Hispanic or Latino (308 | 7.9%), and Two or more Races (228 | 5.8%).
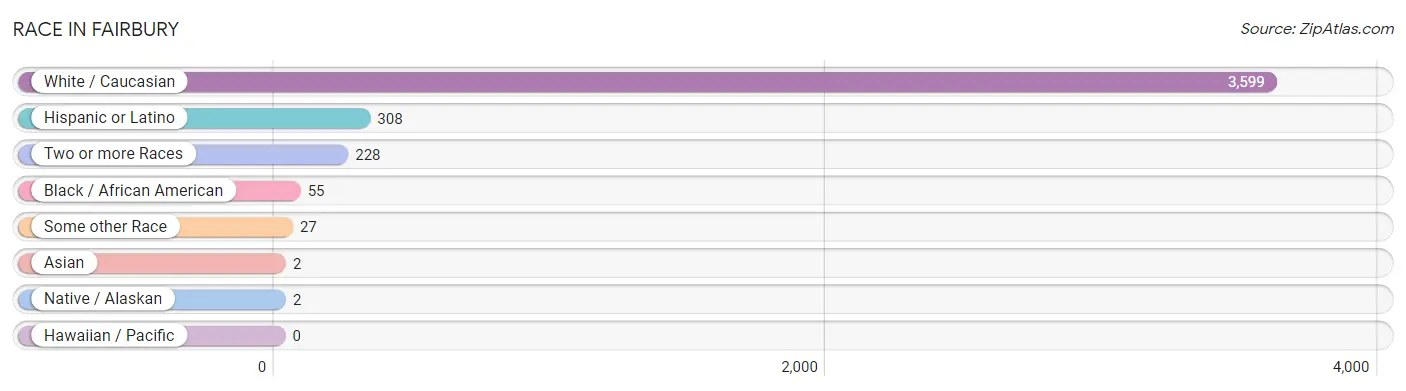
| Race | # Population | % Population |
| Asian | 2 | 0.1% |
| Black / African American | 55 | 1.4% |
| Hawaiian / Pacific | 0 | 0.0% |
| Hispanic or Latino | 308 | 7.9% |
| Native / Alaskan | 2 | 0.1% |
| White / Caucasian | 3,599 | 92.0% |
| Two or more Races | 228 | 5.8% |
| Some other Race | 27 | 0.7% |
| Total | 3,913 | 100.0% |
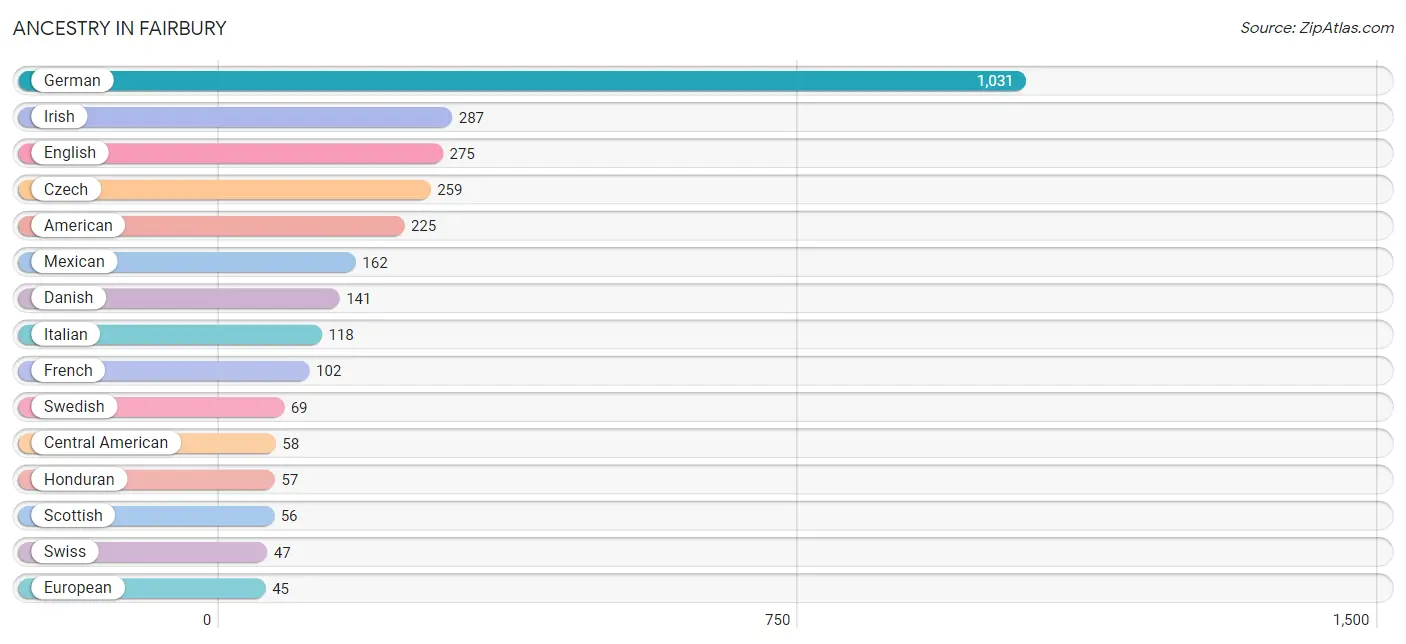
Ancestry in Fairbury
The most populous ancestries reported in Fairbury are German (1,031 | 26.4%), Irish (287 | 7.3%), English (275 | 7.0%), Czech (259 | 6.6%), and American (225 | 5.8%), together accounting for 53.1% of all Fairbury residents.
| Ancestry | # Population | % Population |
| American | 225 | 5.8% |
| Austrian | 5 | 0.1% |
| Bhutanese | 2 | 0.1% |
| British | 4 | 0.1% |
| Canadian | 13 | 0.3% |
| Central American | 58 | 1.5% |
| Cherokee | 1 | 0.0% |
| Cuban | 38 | 1.0% |
| Czech | 259 | 6.6% |
| Czechoslovakian | 7 | 0.2% |
| Danish | 141 | 3.6% |
| Dutch | 16 | 0.4% |
| English | 275 | 7.0% |
| European | 45 | 1.1% |
| French | 102 | 2.6% |
| German | 1,031 | 26.4% |
| Guatemalan | 1 | 0.0% |
| Honduran | 57 | 1.5% |
| Hungarian | 4 | 0.1% |
| Irish | 287 | 7.3% |
| Italian | 118 | 3.0% |
| Lithuanian | 38 | 1.0% |
| Mexican | 162 | 4.1% |
| Norwegian | 23 | 0.6% |
| Polish | 33 | 0.8% |
| Potawatomi | 2 | 0.1% |
| Romanian | 3 | 0.1% |
| Samoan | 10 | 0.3% |
| Scandinavian | 16 | 0.4% |
| Scotch-Irish | 13 | 0.3% |
| Scottish | 56 | 1.4% |
| Sioux | 1 | 0.0% |
| Slovak | 4 | 0.1% |
| Subsaharan African | 35 | 0.9% |
| Sudanese | 35 | 0.9% |
| Swedish | 69 | 1.8% |
| Swiss | 47 | 1.2% |
| Welsh | 7 | 0.2% | View All 38 Rows |
Immigrants in Fairbury
The most numerous immigrant groups reported in Fairbury came from Latin America (97 | 2.5%), Central America (59 | 1.5%), Honduras (57 | 1.5%), Caribbean (38 | 1.0%), and Cuba (38 | 1.0%), together accounting for 7.4% of all Fairbury residents.
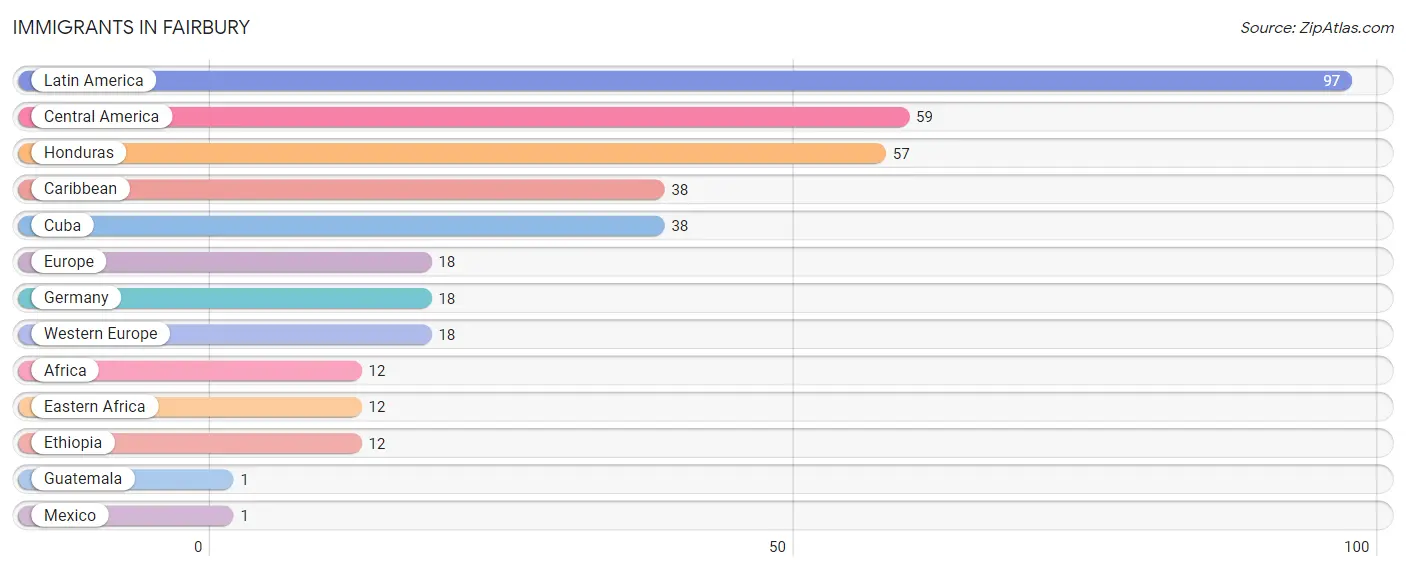
| Immigration Origin | # Population | % Population |
| Africa | 12 | 0.3% |
| Caribbean | 38 | 1.0% |
| Central America | 59 | 1.5% |
| Cuba | 38 | 1.0% |
| Eastern Africa | 12 | 0.3% |
| Ethiopia | 12 | 0.3% |
| Europe | 18 | 0.5% |
| Germany | 18 | 0.5% |
| Guatemala | 1 | 0.0% |
| Honduras | 57 | 1.5% |
| Latin America | 97 | 2.5% |
| Mexico | 1 | 0.0% |
| Western Europe | 18 | 0.5% | View All 13 Rows |
Sex and Age in Fairbury
Sex and Age in Fairbury
The most populous age groups in Fairbury are 60 to 64 Years (227 | 12.9%) for men and 25 to 29 Years (196 | 9.1%) for women.
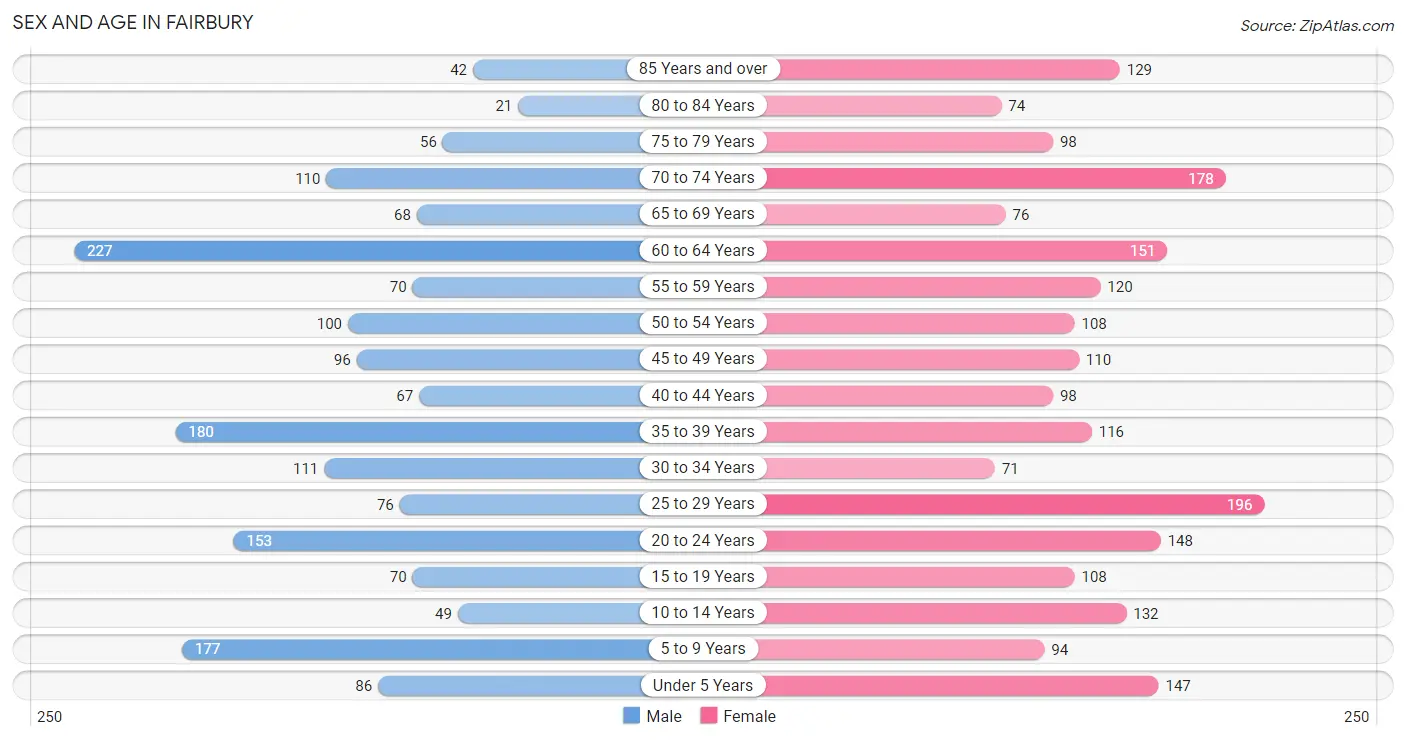
| Age Bracket | Male | Female |
| Under 5 Years | 86 (4.9%) | 147 (6.8%) |
| 5 to 9 Years | 177 (10.1%) | 94 (4.4%) |
| 10 to 14 Years | 49 (2.8%) | 132 (6.1%) |
| 15 to 19 Years | 70 (4.0%) | 108 (5.0%) |
| 20 to 24 Years | 153 (8.7%) | 148 (6.9%) |
| 25 to 29 Years | 76 (4.3%) | 196 (9.1%) |
| 30 to 34 Years | 111 (6.3%) | 71 (3.3%) |
| 35 to 39 Years | 180 (10.2%) | 116 (5.4%) |
| 40 to 44 Years | 67 (3.8%) | 98 (4.5%) |
| 45 to 49 Years | 96 (5.5%) | 110 (5.1%) |
| 50 to 54 Years | 100 (5.7%) | 108 (5.0%) |
| 55 to 59 Years | 70 (4.0%) | 120 (5.6%) |
| 60 to 64 Years | 227 (12.9%) | 151 (7.0%) |
| 65 to 69 Years | 68 (3.9%) | 76 (3.5%) |
| 70 to 74 Years | 110 (6.2%) | 178 (8.3%) |
| 75 to 79 Years | 56 (3.2%) | 98 (4.5%) |
| 80 to 84 Years | 21 (1.2%) | 74 (3.4%) |
| 85 Years and over | 42 (2.4%) | 129 (6.0%) |
| Total | 1,759 (100.0%) | 2,154 (100.0%) |
Families and Households in Fairbury
Median Family Size in Fairbury
The median family size in Fairbury is 3.12 persons per family, with single female/mother families (157 | 18.5%) accounting for the largest median family size of 3.28 persons per family. On the other hand, single male/father families (39 | 4.6%) represent the smallest median family size with 2.44 persons per family.
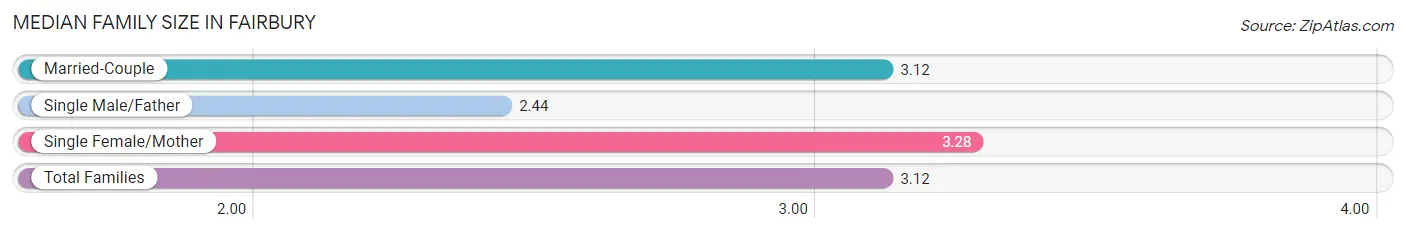
| Family Type | # Families | Family Size |
| Married-Couple | 651 (76.9%) | 3.12 |
| Single Male/Father | 39 (4.6%) | 2.44 |
| Single Female/Mother | 157 (18.5%) | 3.28 |
| Total Families | 847 (100.0%) | 3.12 |
Median Household Size in Fairbury
The median household size in Fairbury is 2.26 persons per household, with single female/mother households (157 | 9.4%) accounting for the largest median household size of 3.62 persons per household. non-family households (830 | 49.5%) represent the smallest median household size with 1.25 persons per household.
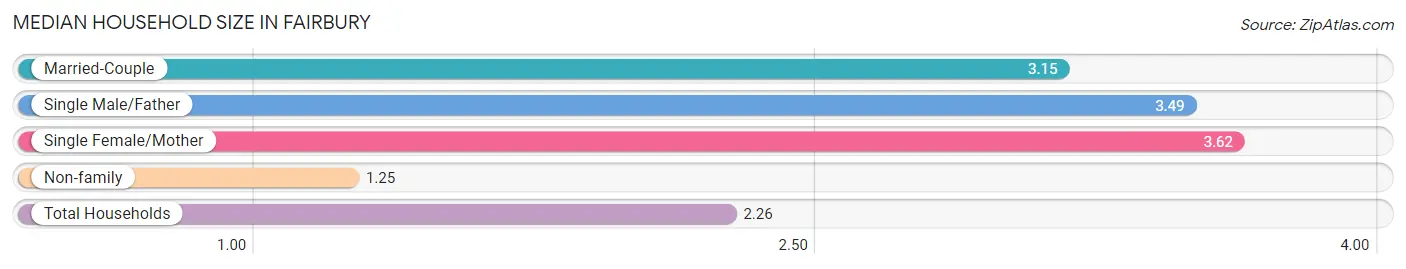
| Household Type | # Households | Household Size |
| Married-Couple | 651 (38.8%) | 3.15 |
| Single Male/Father | 39 (2.3%) | 3.49 |
| Single Female/Mother | 157 (9.4%) | 3.62 |
| Non-family | 830 (49.5%) | 1.25 |
| Total Households | 1,677 (100.0%) | 2.26 |
Household Size by Marriage Status in Fairbury
Out of a total of 1,677 households in Fairbury, 847 (50.5%) are family households, while 830 (49.5%) are nonfamily households. The most numerous type of family households are 2-person households, comprising 464, and the most common type of nonfamily households are 1-person households, comprising 649.
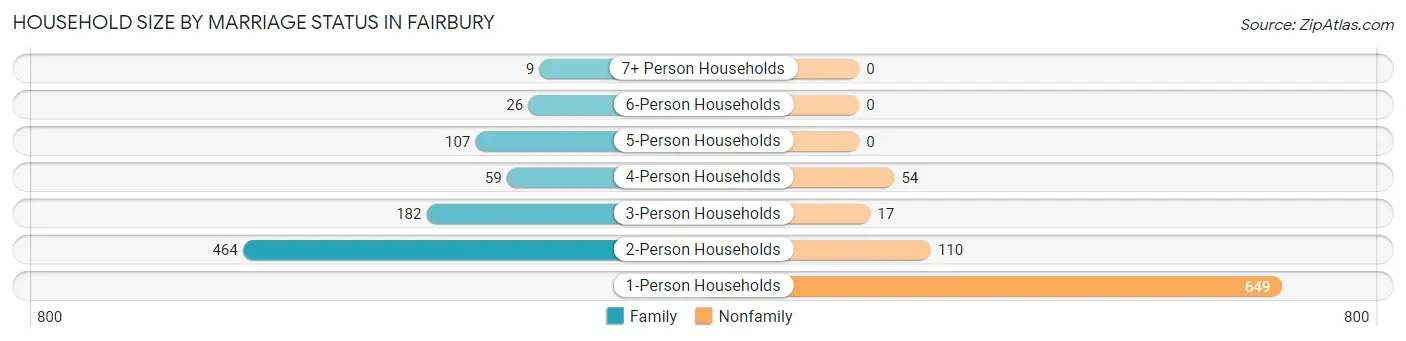
| Household Size | Family Households | Nonfamily Households |
| 1-Person Households | - | 649 (38.7%) |
| 2-Person Households | 464 (27.7%) | 110 (6.6%) |
| 3-Person Households | 182 (10.8%) | 17 (1.0%) |
| 4-Person Households | 59 (3.5%) | 54 (3.2%) |
| 5-Person Households | 107 (6.4%) | 0 (0.0%) |
| 6-Person Households | 26 (1.5%) | 0 (0.0%) |
| 7+ Person Households | 9 (0.5%) | 0 (0.0%) |
| Total | 847 (50.5%) | 830 (49.5%) |
Female Fertility in Fairbury
Fertility by Age in Fairbury
Average fertility rate in Fairbury is 74.0 births per 1,000 women. Women in the age bracket of 20 to 34 years have the highest fertility rate with 152.0 births per 1,000 women. Women in the age bracket of 20 to 34 years acount for 100.0% of all women with births.
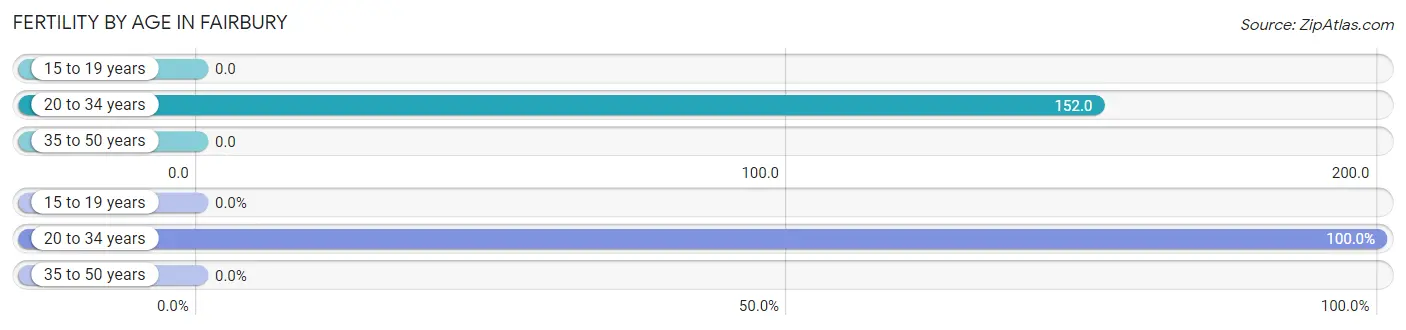
| Age Bracket | Women with Births | Births / 1,000 Women |
| 15 to 19 years | 0 (0.0%) | 0.0 |
| 20 to 34 years | 63 (100.0%) | 152.0 |
| 35 to 50 years | 0 (0.0%) | 0.0 |
| Total | 63 (100.0%) | 74.0 |
Fertility by Age by Marriage Status in Fairbury
55.6% of women with births (63) in Fairbury are married. The highest percentage of unmarried women with births falls into 20 to 34 years age bracket with 44.4% of them unmarried at the time of birth, while the lowest percentage of unmarried women with births belong to 20 to 34 years age bracket with 44.4% of them unmarried.
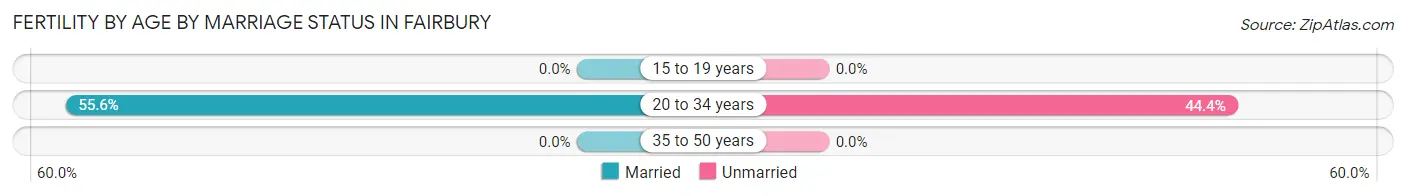
| Age Bracket | Married | Unmarried |
| 15 to 19 years | 0 (0.0%) | 0 (0.0%) |
| 20 to 34 years | 35 (55.6%) | 28 (44.4%) |
| 35 to 50 years | 0 (0.0%) | 0 (0.0%) |
| Total | 35 (55.6%) | 28 (44.4%) |
Fertility by Education in Fairbury
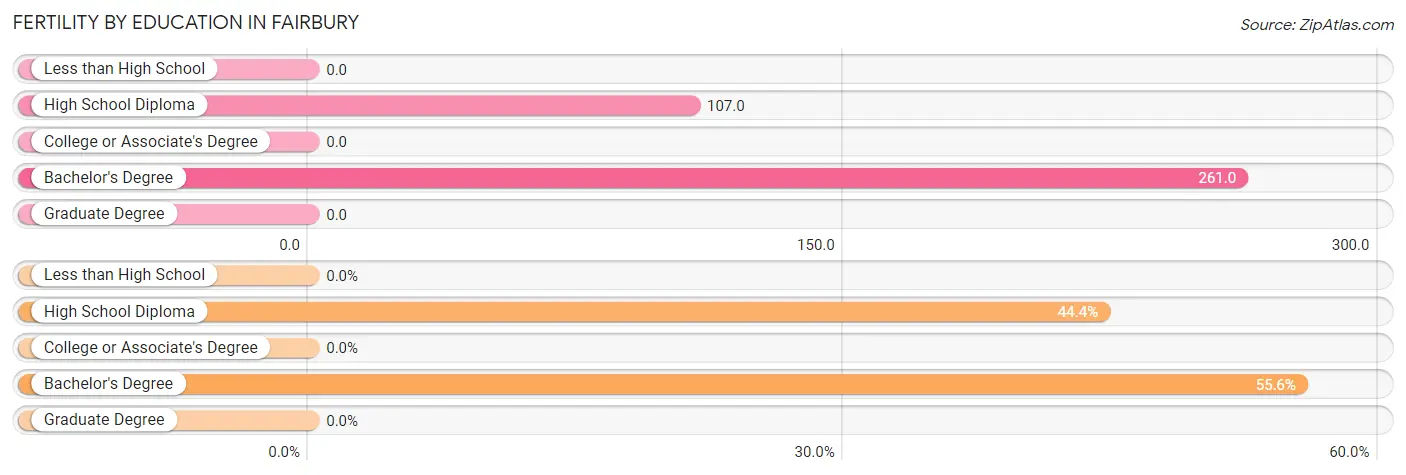
| Educational Attainment | Women with Births | Births / 1,000 Women |
| Less than High School | 0 (0.0%) | 0.0 |
| High School Diploma | 28 (44.4%) | 107.0 |
| College or Associate's Degree | 0 (0.0%) | 0.0 |
| Bachelor's Degree | 35 (55.6%) | 261.0 |
| Graduate Degree | 0 (0.0%) | 0.0 |
| Total | 63 (100.0%) | 74.0 |
Fertility by Education by Marriage Status in Fairbury
44.4% of women with births in Fairbury are unmarried. Women with the educational attainment of bachelor's degree are most likely to be married with 100.0% of them married at childbirth, while women with the educational attainment of high school diploma are least likely to be married with 100.0% of them unmarried at childbirth.
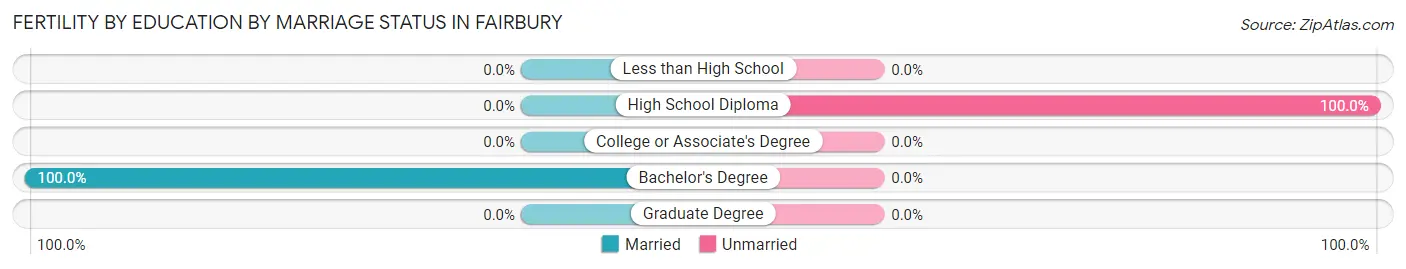
| Educational Attainment | Married | Unmarried |
| Less than High School | 0 (0.0%) | 0 (0.0%) |
| High School Diploma | 0 (0.0%) | 28 (100.0%) |
| College or Associate's Degree | 0 (0.0%) | 0 (0.0%) |
| Bachelor's Degree | 35 (100.0%) | 0 (0.0%) |
| Graduate Degree | 0 (0.0%) | 0 (0.0%) |
| Total | 35 (55.6%) | 28 (44.4%) |
Employment Characteristics in Fairbury
Employment by Class of Employer in Fairbury
Among the 1,845 employed individuals in Fairbury, private company employees (1,248 | 67.6%), not-for-profit organizations (291 | 15.8%), and local government employees (138 | 7.5%) make up the most common classes of employment.
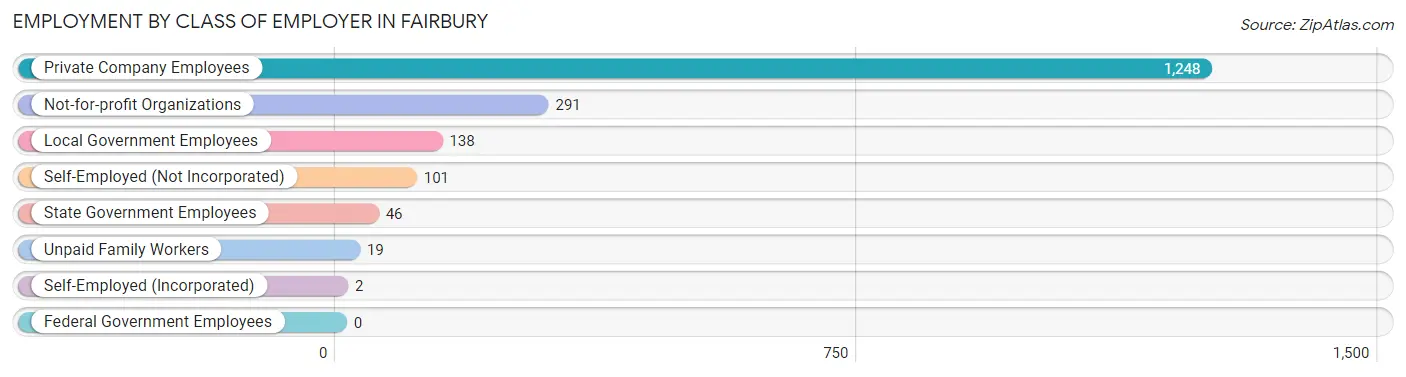
| Employer Class | # Employees | % Employees |
| Private Company Employees | 1,248 | 67.6% |
| Self-Employed (Incorporated) | 2 | 0.1% |
| Self-Employed (Not Incorporated) | 101 | 5.5% |
| Not-for-profit Organizations | 291 | 15.8% |
| Local Government Employees | 138 | 7.5% |
| State Government Employees | 46 | 2.5% |
| Federal Government Employees | 0 | 0.0% |
| Unpaid Family Workers | 19 | 1.0% |
| Total | 1,845 | 100.0% |
Employment Status by Age in Fairbury
According to the labor force statistics for Fairbury, out of the total population over 16 years of age (3,183), 59.9% or 1,907 individuals are in the labor force, with 1.0% or 19 of them unemployed. The age group with the highest labor force participation rate is 25 to 29 years, with 98.9% or 269 individuals in the labor force. Within the labor force, the 55 to 59 years age range has the highest percentage of unemployed individuals, with 5.1% or 8 of them being unemployed.
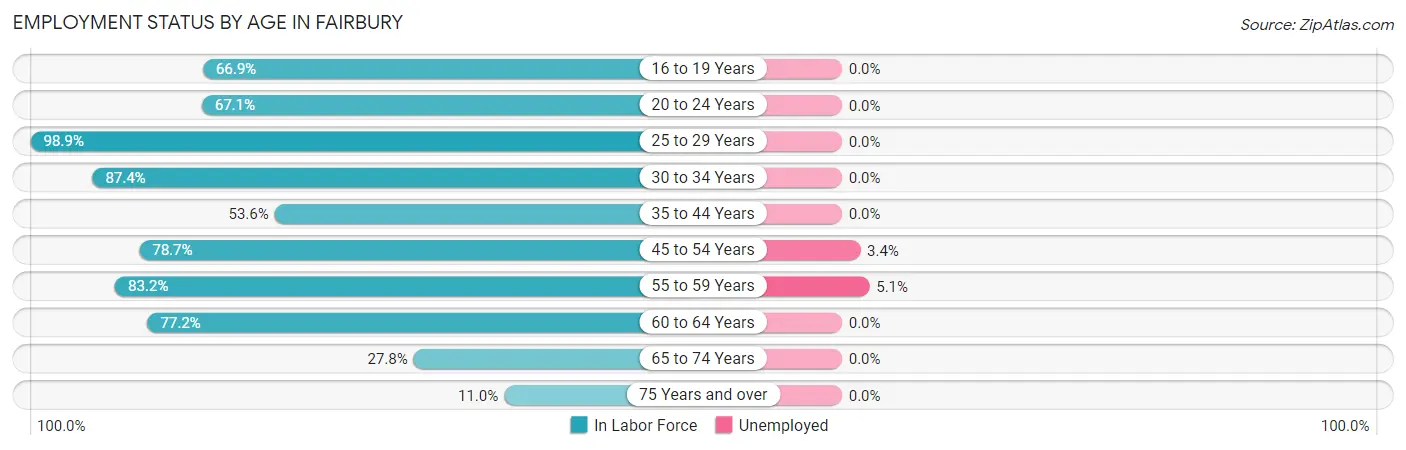
| Age Bracket | In Labor Force | Unemployed |
| 16 to 19 Years | 89 (66.9%) | 0 (0.0%) |
| 20 to 24 Years | 202 (67.1%) | 0 (0.0%) |
| 25 to 29 Years | 269 (98.9%) | 0 (0.0%) |
| 30 to 34 Years | 159 (87.4%) | 0 (0.0%) |
| 35 to 44 Years | 247 (53.6%) | 0 (0.0%) |
| 45 to 54 Years | 326 (78.7%) | 11 (3.4%) |
| 55 to 59 Years | 158 (83.2%) | 8 (5.1%) |
| 60 to 64 Years | 292 (77.2%) | 0 (0.0%) |
| 65 to 74 Years | 120 (27.8%) | 0 (0.0%) |
| 75 Years and over | 46 (11.0%) | 0 (0.0%) |
| Total | 1,907 (59.9%) | 19 (1.0%) |
Employment Status by Educational Attainment in Fairbury
According to labor force statistics for Fairbury, 76.5% of individuals (1,451) out of the total population between 25 and 64 years of age (1,897) are in the labor force, with 1.3% or 19 of them being unemployed. The group with the highest labor force participation rate are those with the educational attainment of bachelor's degree or higher, with 79.8% or 261 individuals in the labor force. Within the labor force, individuals with high school diploma education have the highest percentage of unemployment, with 2.1% or 11 of them being unemployed.
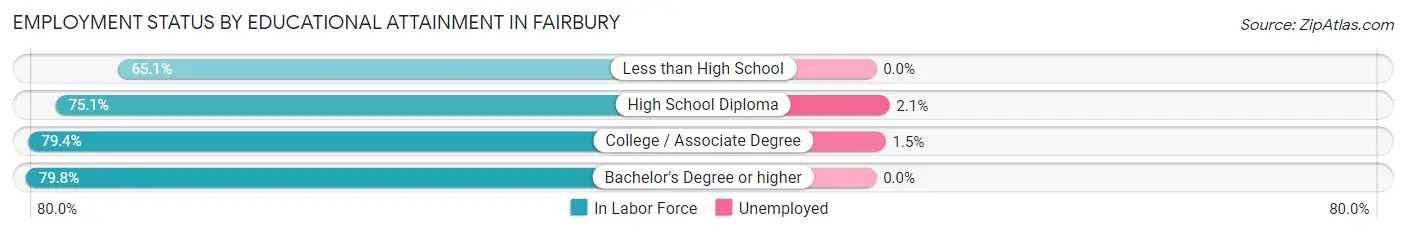
| Educational Attainment | In Labor Force | Unemployed |
| Less than High School | 123 (65.1%) | 0 (0.0%) |
| High School Diploma | 520 (75.1%) | 15 (2.1%) |
| College / Associate Degree | 547 (79.4%) | 10 (1.5%) |
| Bachelor's Degree or higher | 261 (79.8%) | 0 (0.0%) |
| Total | 1,451 (76.5%) | 25 (1.3%) |
Employment Occupations by Sex in Fairbury
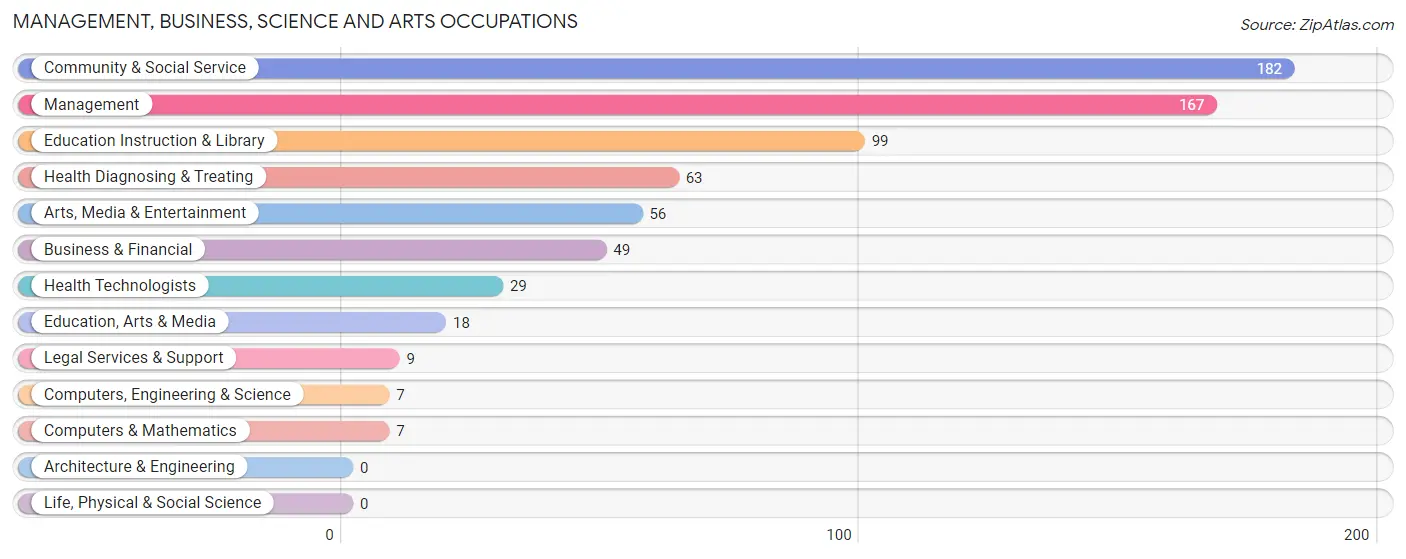
Management, Business, Science and Arts Occupations
The most common Management, Business, Science and Arts occupations in Fairbury are Community & Social Service (182 | 9.6%), Management (167 | 8.8%), Education Instruction & Library (99 | 5.2%), Health Diagnosing & Treating (63 | 3.3%), and Arts, Media & Entertainment (56 | 3.0%).
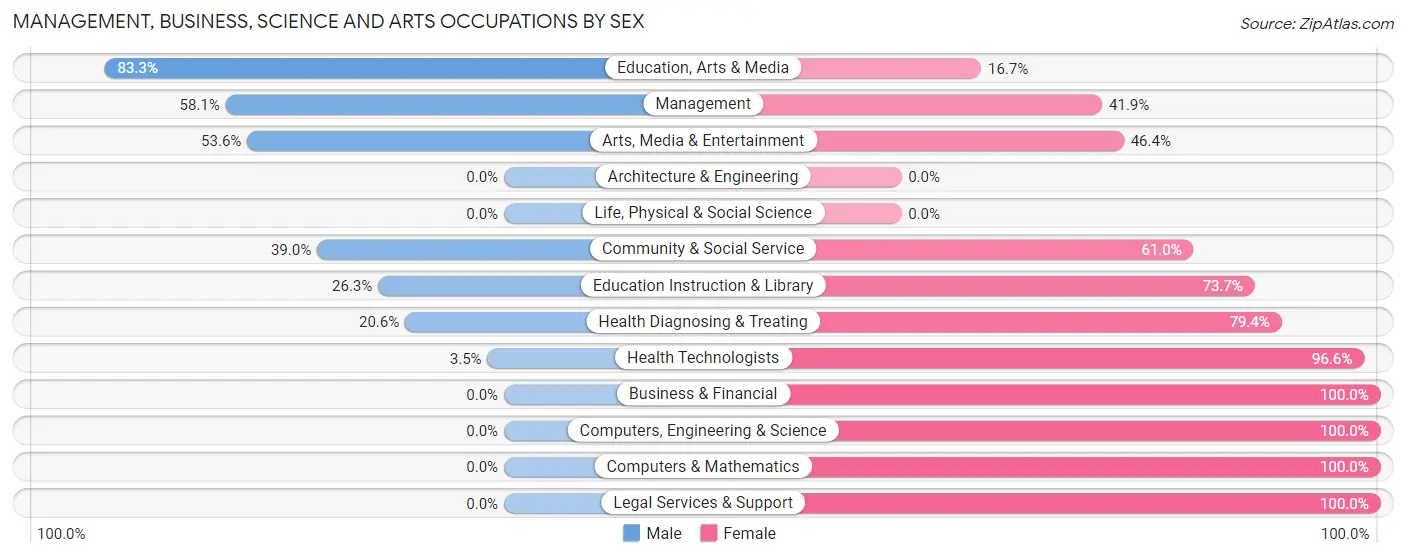
Management, Business, Science and Arts Occupations by Sex
Within the Management, Business, Science and Arts occupations in Fairbury, the most male-oriented occupations are Education, Arts & Media (83.3%), Management (58.1%), and Arts, Media & Entertainment (53.6%), while the most female-oriented occupations are Business & Financial (100.0%), Computers, Engineering & Science (100.0%), and Computers & Mathematics (100.0%).
| Occupation | Male | Female |
| Management | 97 (58.1%) | 70 (41.9%) |
| Business & Financial | 0 (0.0%) | 49 (100.0%) |
| Computers, Engineering & Science | 0 (0.0%) | 7 (100.0%) |
| Computers & Mathematics | 0 (0.0%) | 7 (100.0%) |
| Architecture & Engineering | 0 (0.0%) | 0 (0.0%) |
| Life, Physical & Social Science | 0 (0.0%) | 0 (0.0%) |
| Community & Social Service | 71 (39.0%) | 111 (61.0%) |
| Education, Arts & Media | 15 (83.3%) | 3 (16.7%) |
| Legal Services & Support | 0 (0.0%) | 9 (100.0%) |
| Education Instruction & Library | 26 (26.3%) | 73 (73.7%) |
| Arts, Media & Entertainment | 30 (53.6%) | 26 (46.4%) |
| Health Diagnosing & Treating | 13 (20.6%) | 50 (79.4%) |
| Health Technologists | 1 (3.5%) | 28 (96.6%) |
| Total (Category) | 181 (38.7%) | 287 (61.3%) |
| Total (Overall) | 884 (46.8%) | 1,005 (53.2%) |
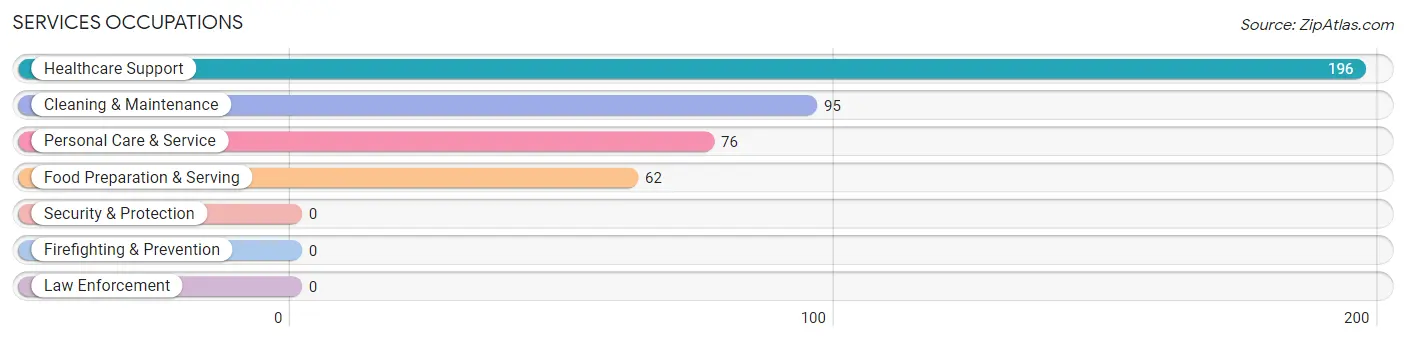
Services Occupations
The most common Services occupations in Fairbury are Healthcare Support (196 | 10.4%), Cleaning & Maintenance (95 | 5.0%), Personal Care & Service (76 | 4.0%), and Food Preparation & Serving (62 | 3.3%).
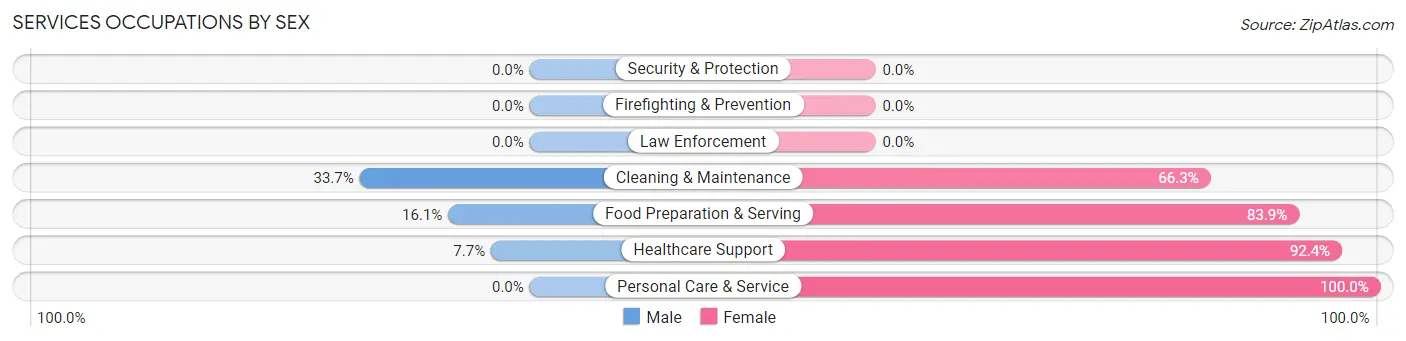
Services Occupations by Sex
Within the Services occupations in Fairbury, the most male-oriented occupations are Cleaning & Maintenance (33.7%), Food Preparation & Serving (16.1%), and Healthcare Support (7.6%), while the most female-oriented occupations are Personal Care & Service (100.0%), Healthcare Support (92.3%), and Food Preparation & Serving (83.9%).
| Occupation | Male | Female |
| Healthcare Support | 15 (7.6%) | 181 (92.3%) |
| Security & Protection | 0 (0.0%) | 0 (0.0%) |
| Firefighting & Prevention | 0 (0.0%) | 0 (0.0%) |
| Law Enforcement | 0 (0.0%) | 0 (0.0%) |
| Food Preparation & Serving | 10 (16.1%) | 52 (83.9%) |
| Cleaning & Maintenance | 32 (33.7%) | 63 (66.3%) |
| Personal Care & Service | 0 (0.0%) | 76 (100.0%) |
| Total (Category) | 57 (13.3%) | 372 (86.7%) |
| Total (Overall) | 884 (46.8%) | 1,005 (53.2%) |
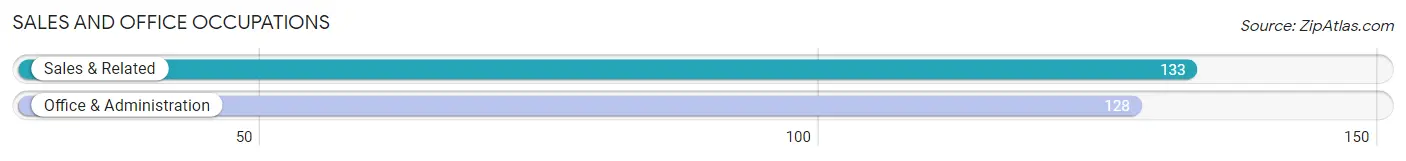
Sales and Office Occupations
The most common Sales and Office occupations in Fairbury are Sales & Related (133 | 7.0%), and Office & Administration (128 | 6.8%).
Sales and Office Occupations by Sex
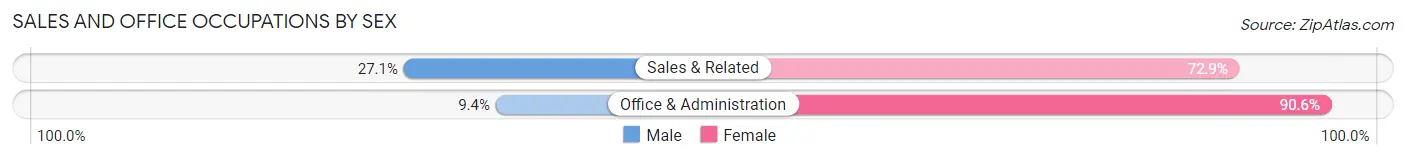
| Occupation | Male | Female |
| Sales & Related | 36 (27.1%) | 97 (72.9%) |
| Office & Administration | 12 (9.4%) | 116 (90.6%) |
| Total (Category) | 48 (18.4%) | 213 (81.6%) |
| Total (Overall) | 884 (46.8%) | 1,005 (53.2%) |
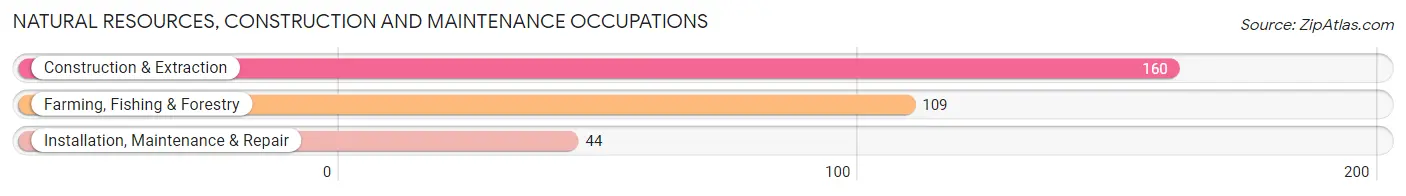
Natural Resources, Construction and Maintenance Occupations
The most common Natural Resources, Construction and Maintenance occupations in Fairbury are Construction & Extraction (160 | 8.5%), Farming, Fishing & Forestry (109 | 5.8%), and Installation, Maintenance & Repair (44 | 2.3%).
Natural Resources, Construction and Maintenance Occupations by Sex
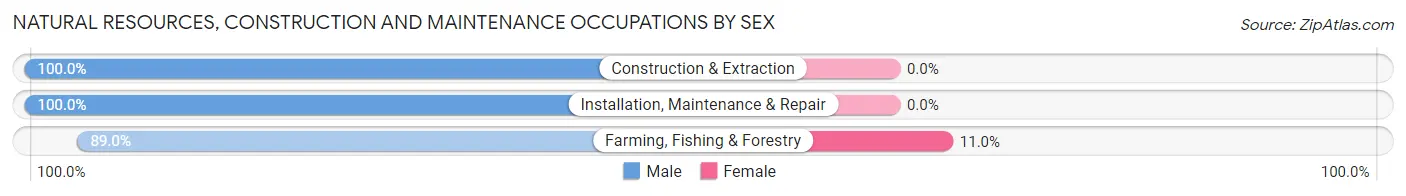
| Occupation | Male | Female |
| Farming, Fishing & Forestry | 97 (89.0%) | 12 (11.0%) |
| Construction & Extraction | 160 (100.0%) | 0 (0.0%) |
| Installation, Maintenance & Repair | 44 (100.0%) | 0 (0.0%) |
| Total (Category) | 301 (96.2%) | 12 (3.8%) |
| Total (Overall) | 884 (46.8%) | 1,005 (53.2%) |
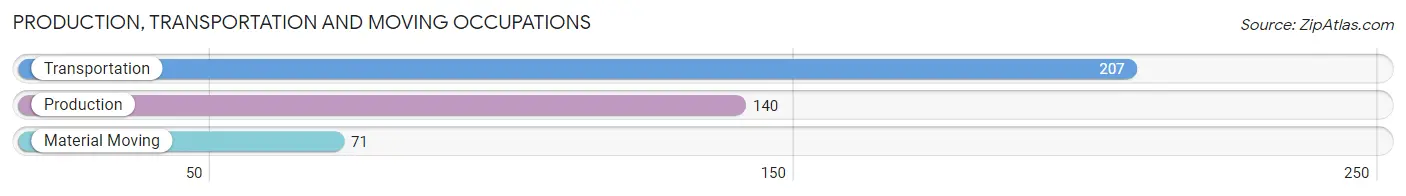
Production, Transportation and Moving Occupations
The most common Production, Transportation and Moving occupations in Fairbury are Transportation (207 | 11.0%), Production (140 | 7.4%), and Material Moving (71 | 3.8%).
Production, Transportation and Moving Occupations by Sex
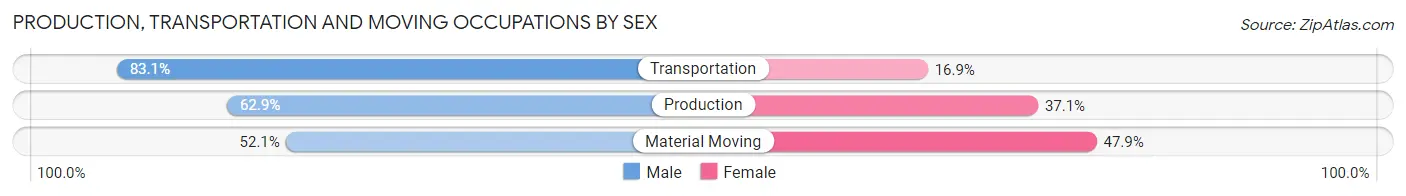
| Occupation | Male | Female |
| Production | 88 (62.9%) | 52 (37.1%) |
| Transportation | 172 (83.1%) | 35 (16.9%) |
| Material Moving | 37 (52.1%) | 34 (47.9%) |
| Total (Category) | 297 (71.1%) | 121 (28.9%) |
| Total (Overall) | 884 (46.8%) | 1,005 (53.2%) |
Employment Industries by Sex in Fairbury
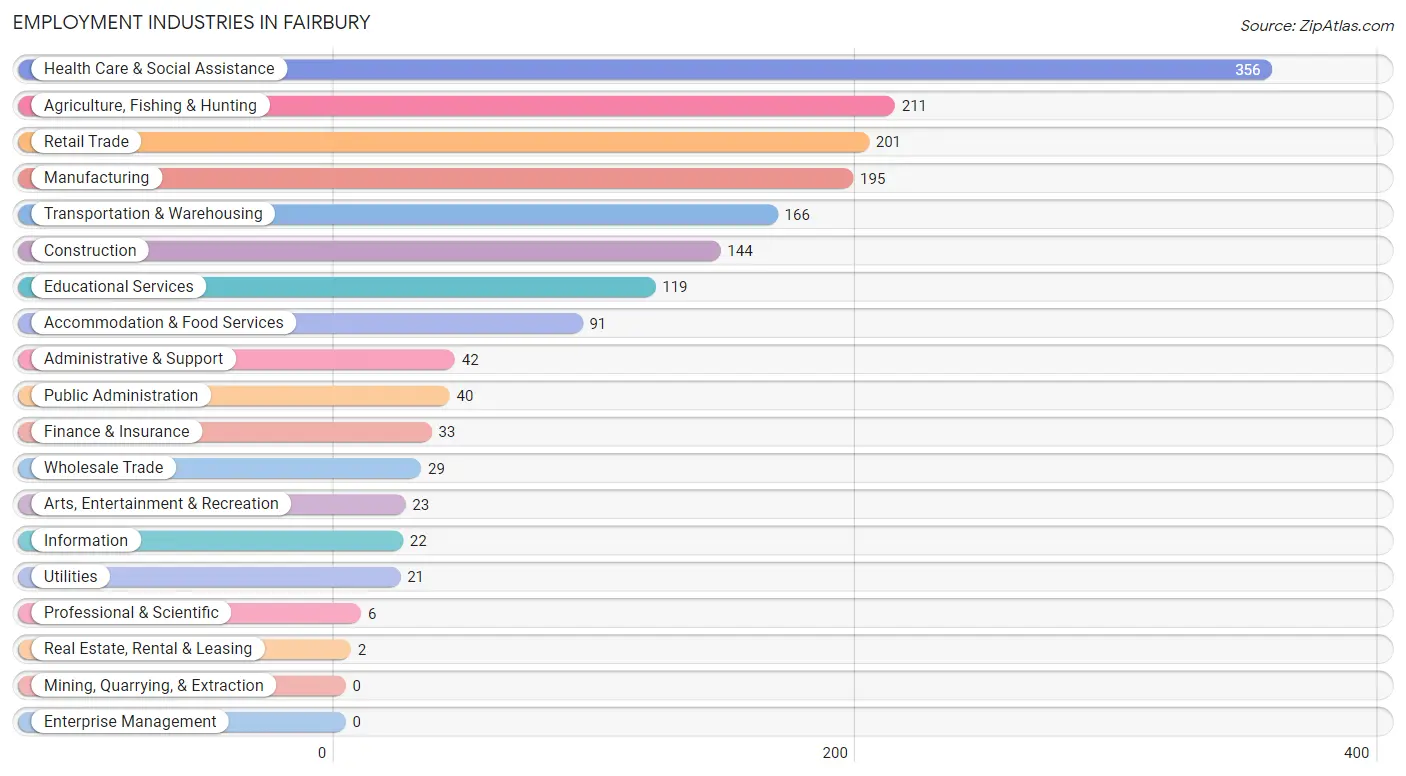
Employment Industries in Fairbury
The major employment industries in Fairbury include Health Care & Social Assistance (356 | 18.9%), Agriculture, Fishing & Hunting (211 | 11.2%), Retail Trade (201 | 10.6%), Manufacturing (195 | 10.3%), and Transportation & Warehousing (166 | 8.8%).
Employment Industries by Sex in Fairbury
The Fairbury industries that see more men than women are Construction (100.0%), Transportation & Warehousing (100.0%), and Utilities (100.0%), whereas the industries that tend to have a higher number of women are Finance & Insurance (100.0%), Administrative & Support (90.5%), and Health Care & Social Assistance (90.2%).
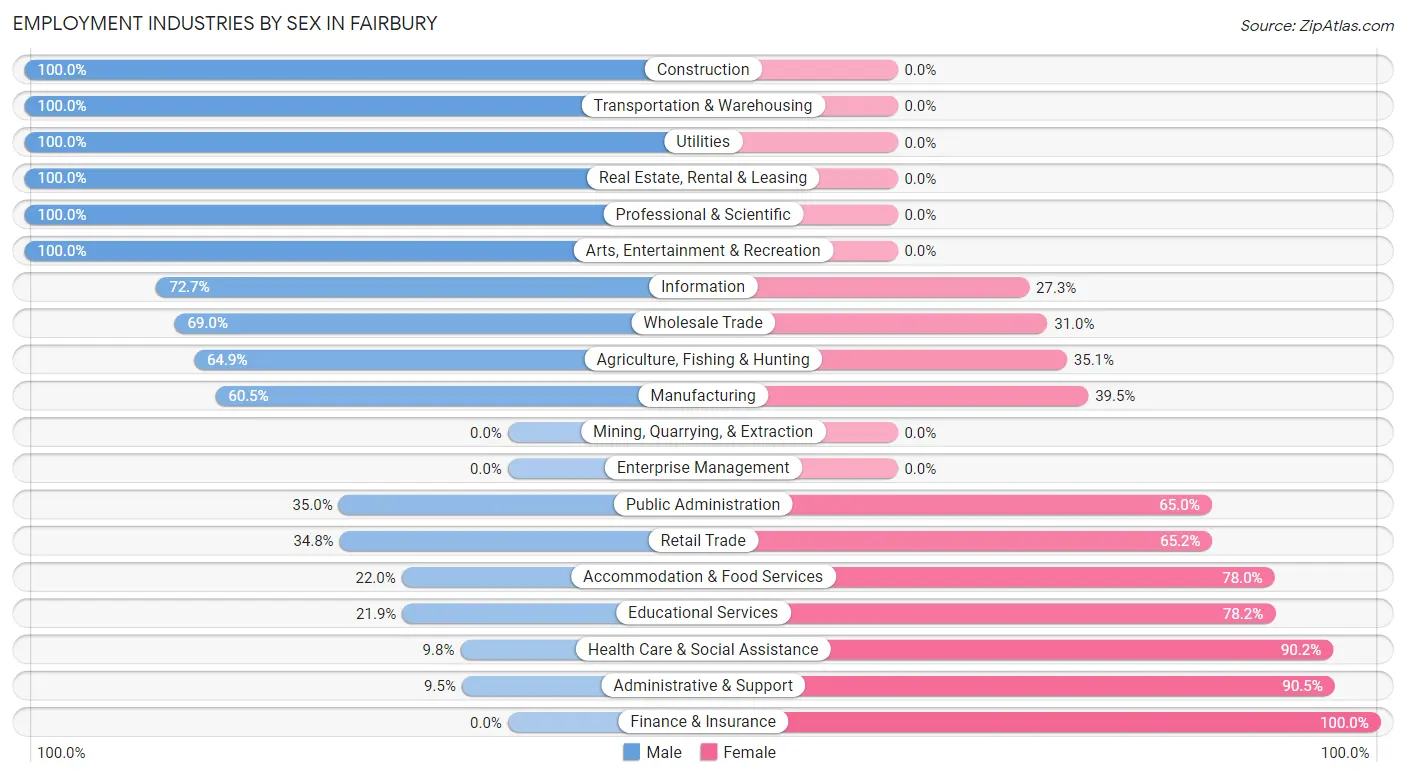
| Industry | Male | Female |
| Agriculture, Fishing & Hunting | 137 (64.9%) | 74 (35.1%) |
| Mining, Quarrying, & Extraction | 0 (0.0%) | 0 (0.0%) |
| Construction | 144 (100.0%) | 0 (0.0%) |
| Manufacturing | 118 (60.5%) | 77 (39.5%) |
| Wholesale Trade | 20 (69.0%) | 9 (31.0%) |
| Retail Trade | 70 (34.8%) | 131 (65.2%) |
| Transportation & Warehousing | 166 (100.0%) | 0 (0.0%) |
| Utilities | 21 (100.0%) | 0 (0.0%) |
| Information | 16 (72.7%) | 6 (27.3%) |
| Finance & Insurance | 0 (0.0%) | 33 (100.0%) |
| Real Estate, Rental & Leasing | 2 (100.0%) | 0 (0.0%) |
| Professional & Scientific | 6 (100.0%) | 0 (0.0%) |
| Enterprise Management | 0 (0.0%) | 0 (0.0%) |
| Administrative & Support | 4 (9.5%) | 38 (90.5%) |
| Educational Services | 26 (21.8%) | 93 (78.1%) |
| Health Care & Social Assistance | 35 (9.8%) | 321 (90.2%) |
| Arts, Entertainment & Recreation | 23 (100.0%) | 0 (0.0%) |
| Accommodation & Food Services | 20 (22.0%) | 71 (78.0%) |
| Public Administration | 14 (35.0%) | 26 (65.0%) |
| Total | 884 (46.8%) | 1,005 (53.2%) |
Education in Fairbury
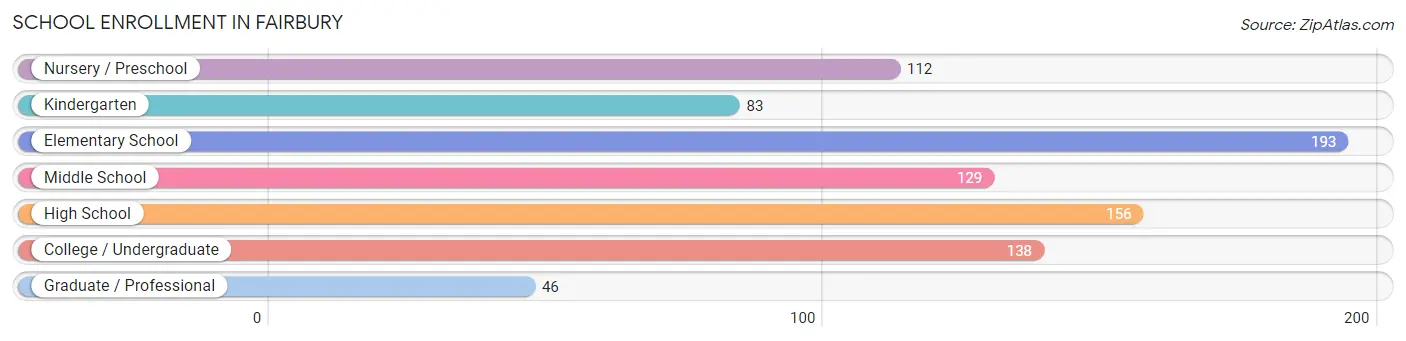
School Enrollment in Fairbury
The most common levels of schooling among the 857 students in Fairbury are elementary school (193 | 22.5%), high school (156 | 18.2%), and college / undergraduate (138 | 16.1%).
| School Level | # Students | % Students |
| Nursery / Preschool | 112 | 13.1% |
| Kindergarten | 83 | 9.7% |
| Elementary School | 193 | 22.5% |
| Middle School | 129 | 15.0% |
| High School | 156 | 18.2% |
| College / Undergraduate | 138 | 16.1% |
| Graduate / Professional | 46 | 5.4% |
| Total | 857 | 100.0% |
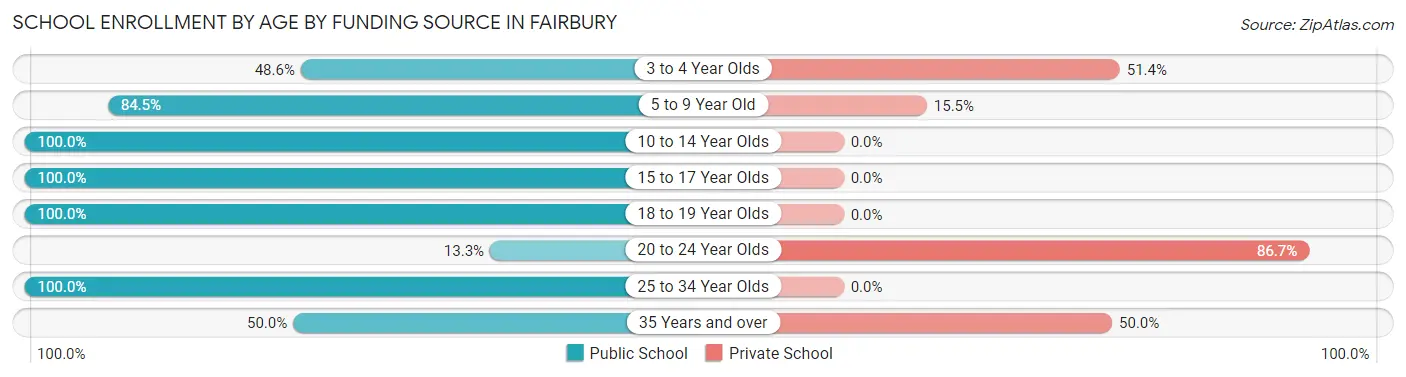
School Enrollment by Age by Funding Source in Fairbury
Out of a total of 857 students who are enrolled in schools in Fairbury, 175 (20.4%) attend a private institution, while the remaining 682 (79.6%) are enrolled in public schools. The age group of 20 to 24 year olds has the highest likelihood of being enrolled in private schools, with 91 (86.7% in the age bracket) enrolled. Conversely, the age group of 10 to 14 year olds has the lowest likelihood of being enrolled in a private school, with 181 (100.0% in the age bracket) attending a public institution.
| Age Bracket | Public School | Private School |
| 3 to 4 Year Olds | 34 (48.6%) | 36 (51.4%) |
| 5 to 9 Year Old | 229 (84.5%) | 42 (15.5%) |
| 10 to 14 Year Olds | 181 (100.0%) | 0 (0.0%) |
| 15 to 17 Year Olds | 149 (100.0%) | 0 (0.0%) |
| 18 to 19 Year Olds | 29 (100.0%) | 0 (0.0%) |
| 20 to 24 Year Olds | 14 (13.3%) | 91 (86.7%) |
| 25 to 34 Year Olds | 40 (100.0%) | 0 (0.0%) |
| 35 Years and over | 6 (50.0%) | 6 (50.0%) |
| Total | 682 (79.6%) | 175 (20.4%) |
Educational Attainment by Field of Study in Fairbury
Education (148 | 28.1%), bio, nature & agricultural (95 | 18.1%), arts & humanities (63 | 12.0%), business (61 | 11.6%), and communications (41 | 7.8%) are the most common fields of study among 526 individuals in Fairbury who have obtained a bachelor's degree or higher.
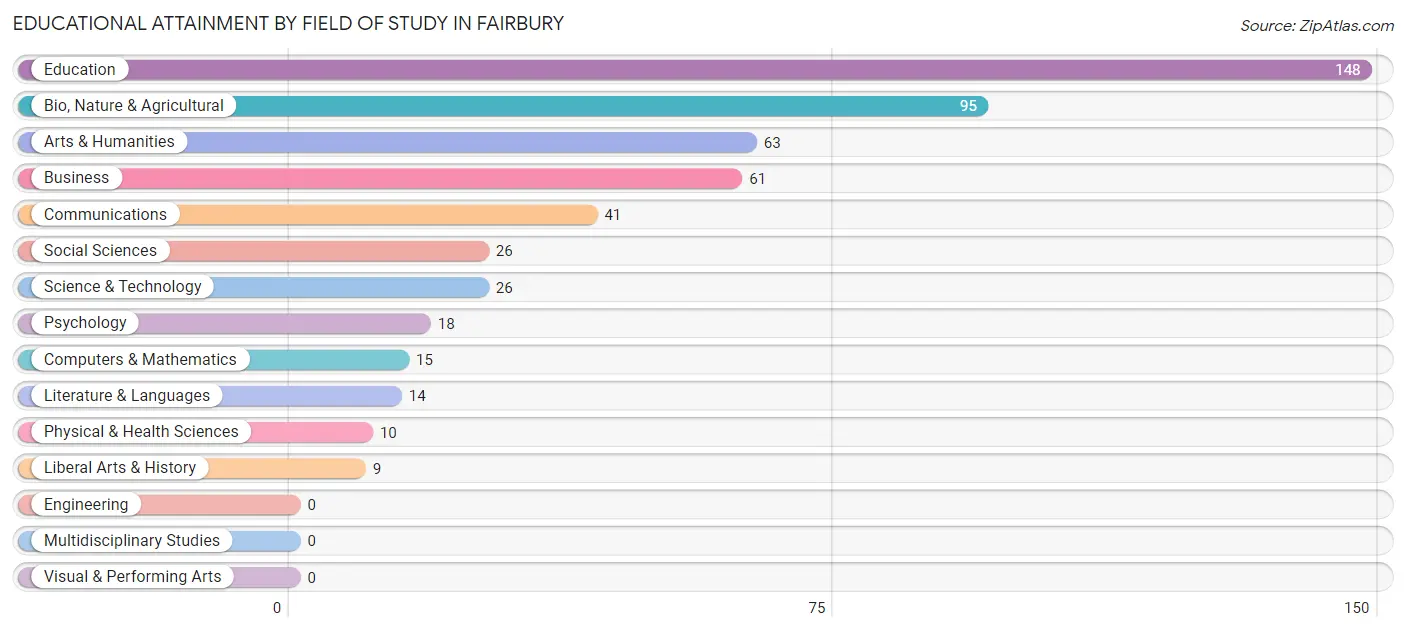
| Field of Study | # Graduates | % Graduates |
| Computers & Mathematics | 15 | 2.9% |
| Bio, Nature & Agricultural | 95 | 18.1% |
| Physical & Health Sciences | 10 | 1.9% |
| Psychology | 18 | 3.4% |
| Social Sciences | 26 | 4.9% |
| Engineering | 0 | 0.0% |
| Multidisciplinary Studies | 0 | 0.0% |
| Science & Technology | 26 | 4.9% |
| Business | 61 | 11.6% |
| Education | 148 | 28.1% |
| Literature & Languages | 14 | 2.7% |
| Liberal Arts & History | 9 | 1.7% |
| Visual & Performing Arts | 0 | 0.0% |
| Communications | 41 | 7.8% |
| Arts & Humanities | 63 | 12.0% |
| Total | 526 | 100.0% |
Transportation & Commute in Fairbury
Vehicle Availability by Sex in Fairbury
The most prevalent vehicle ownership categories in Fairbury are males with 2 vehicles (273, accounting for 30.9%) and females with 2 vehicles (298, making up 28.4%).
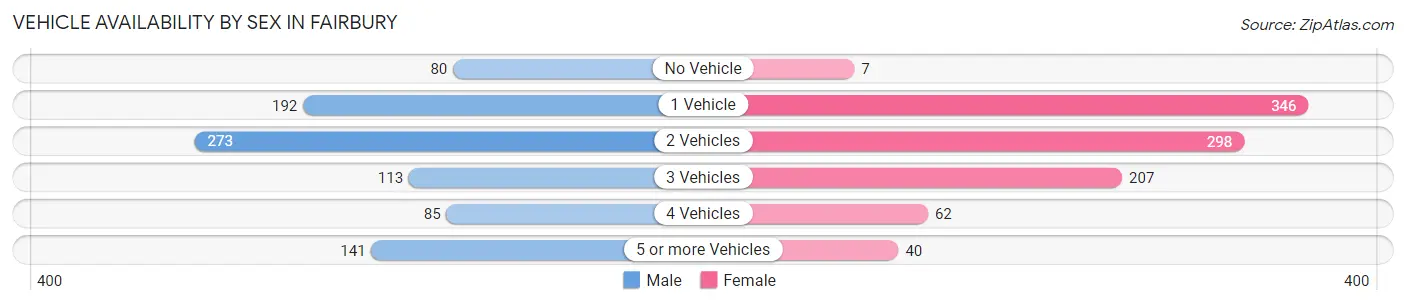
| Vehicles Available | Male | Female |
| No Vehicle | 80 (9.0%) | 7 (0.7%) |
| 1 Vehicle | 192 (21.7%) | 346 (36.0%) |
| 2 Vehicles | 273 (30.9%) | 298 (31.0%) |
| 3 Vehicles | 113 (12.8%) | 207 (21.6%) |
| 4 Vehicles | 85 (9.6%) | 62 (6.5%) |
| 5 or more Vehicles | 141 (16.0%) | 40 (4.2%) |
| Total | 884 (100.0%) | 960 (100.0%) |
Commute Time in Fairbury
The most frequently occuring commute durations in Fairbury are 5 to 9 minutes (803 commuters, 46.3%), less than 5 minutes (373 commuters, 21.5%), and 15 to 19 minutes (170 commuters, 9.8%).
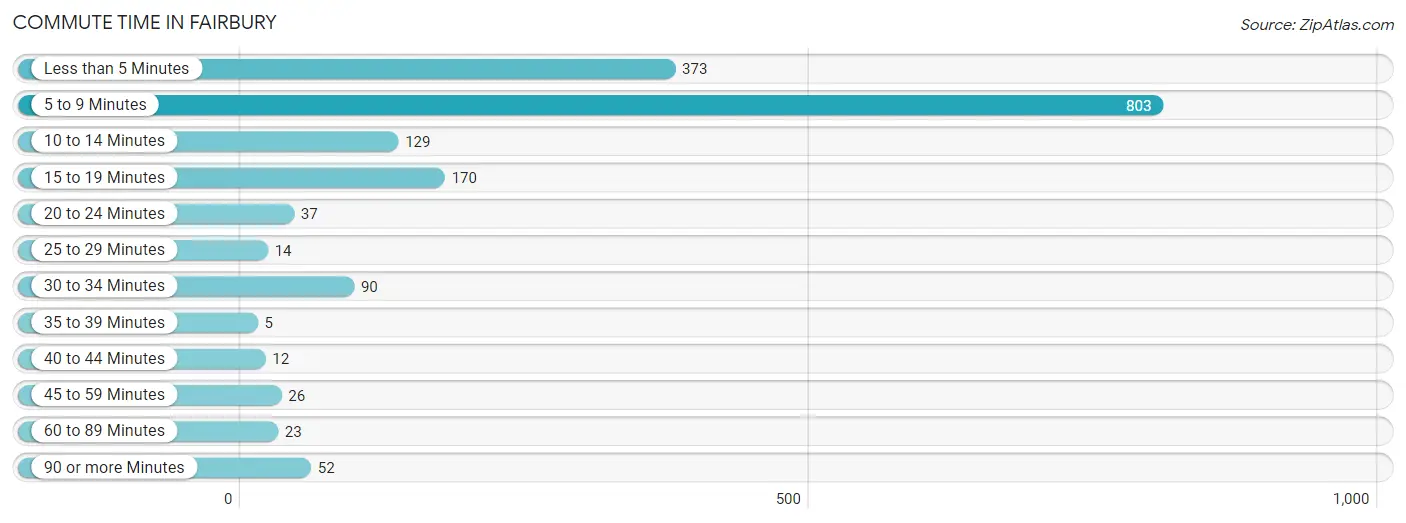
| Commute Time | # Commuters | % Commuters |
| Less than 5 Minutes | 373 | 21.5% |
| 5 to 9 Minutes | 803 | 46.3% |
| 10 to 14 Minutes | 129 | 7.4% |
| 15 to 19 Minutes | 170 | 9.8% |
| 20 to 24 Minutes | 37 | 2.1% |
| 25 to 29 Minutes | 14 | 0.8% |
| 30 to 34 Minutes | 90 | 5.2% |
| 35 to 39 Minutes | 5 | 0.3% |
| 40 to 44 Minutes | 12 | 0.7% |
| 45 to 59 Minutes | 26 | 1.5% |
| 60 to 89 Minutes | 23 | 1.3% |
| 90 or more Minutes | 52 | 3.0% |
Commute Time by Sex in Fairbury
The most common commute times in Fairbury are 5 to 9 minutes (331 commuters, 39.6%) for males and 5 to 9 minutes (472 commuters, 52.6%) for females.
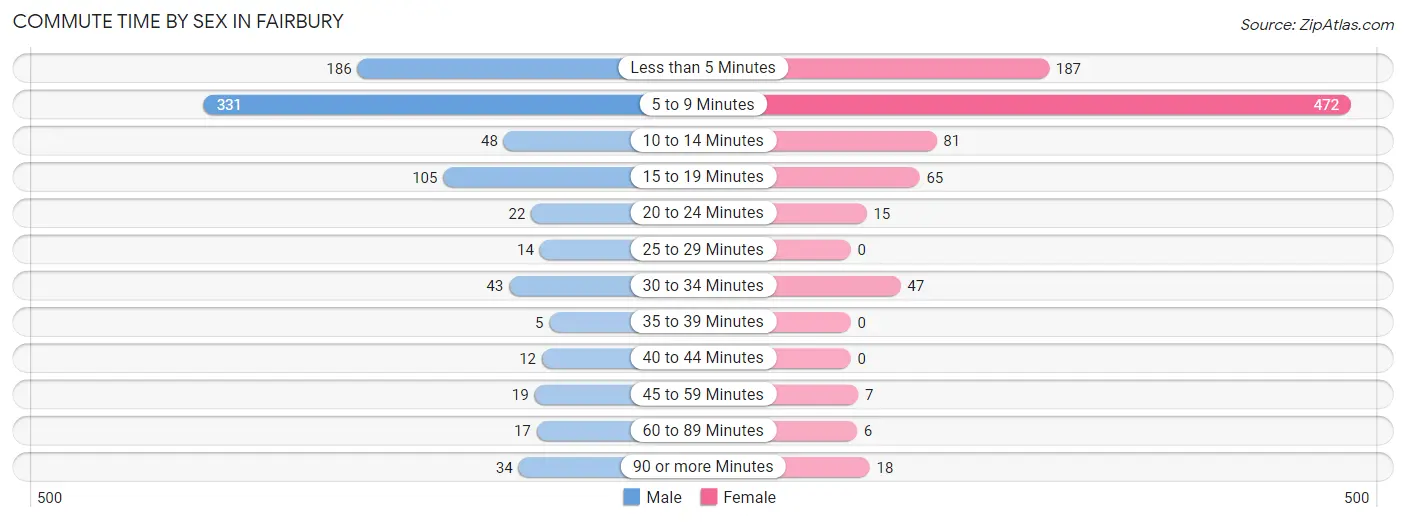
| Commute Time | Male | Female |
| Less than 5 Minutes | 186 (22.3%) | 187 (20.8%) |
| 5 to 9 Minutes | 331 (39.6%) | 472 (52.6%) |
| 10 to 14 Minutes | 48 (5.7%) | 81 (9.0%) |
| 15 to 19 Minutes | 105 (12.6%) | 65 (7.2%) |
| 20 to 24 Minutes | 22 (2.6%) | 15 (1.7%) |
| 25 to 29 Minutes | 14 (1.7%) | 0 (0.0%) |
| 30 to 34 Minutes | 43 (5.1%) | 47 (5.2%) |
| 35 to 39 Minutes | 5 (0.6%) | 0 (0.0%) |
| 40 to 44 Minutes | 12 (1.4%) | 0 (0.0%) |
| 45 to 59 Minutes | 19 (2.3%) | 7 (0.8%) |
| 60 to 89 Minutes | 17 (2.0%) | 6 (0.7%) |
| 90 or more Minutes | 34 (4.1%) | 18 (2.0%) |
Time of Departure to Work by Sex in Fairbury
The most frequent times of departure to work in Fairbury are 7:30 AM to 7:59 AM (161, 19.3%) for males and 8:00 AM to 8:29 AM (165, 18.4%) for females.
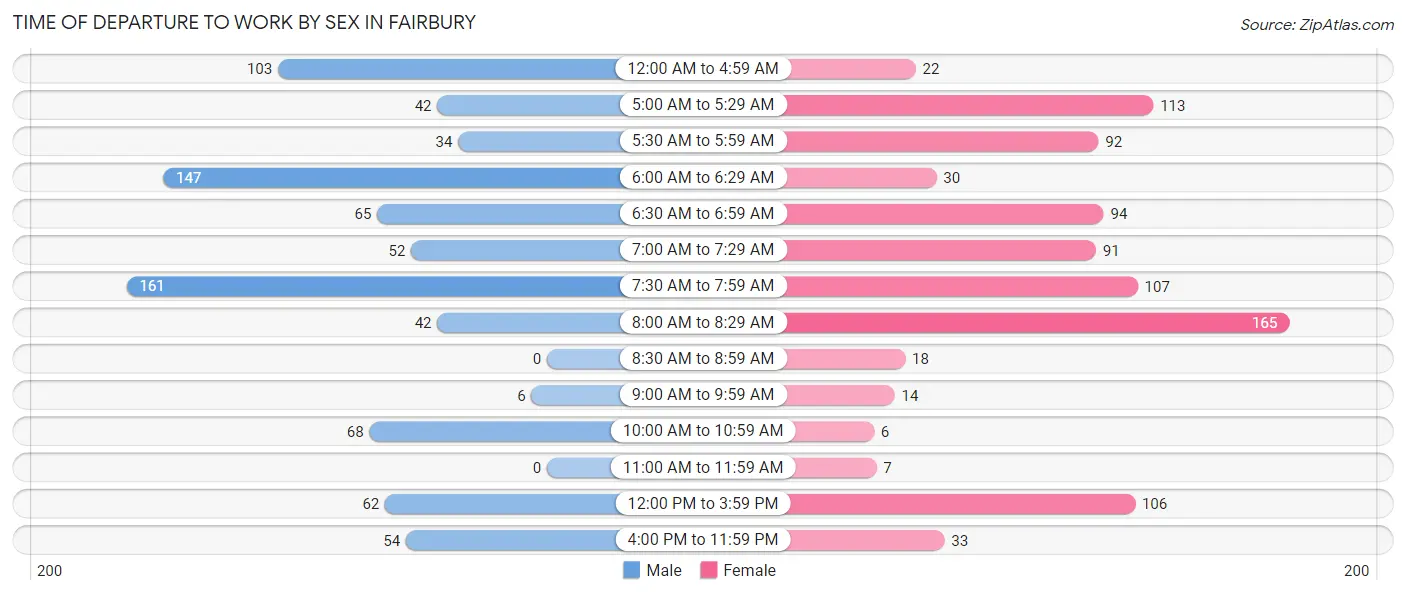
| Time of Departure | Male | Female |
| 12:00 AM to 4:59 AM | 103 (12.3%) | 22 (2.5%) |
| 5:00 AM to 5:29 AM | 42 (5.0%) | 113 (12.6%) |
| 5:30 AM to 5:59 AM | 34 (4.1%) | 92 (10.2%) |
| 6:00 AM to 6:29 AM | 147 (17.6%) | 30 (3.3%) |
| 6:30 AM to 6:59 AM | 65 (7.8%) | 94 (10.5%) |
| 7:00 AM to 7:29 AM | 52 (6.2%) | 91 (10.1%) |
| 7:30 AM to 7:59 AM | 161 (19.3%) | 107 (11.9%) |
| 8:00 AM to 8:29 AM | 42 (5.0%) | 165 (18.4%) |
| 8:30 AM to 8:59 AM | 0 (0.0%) | 18 (2.0%) |
| 9:00 AM to 9:59 AM | 6 (0.7%) | 14 (1.6%) |
| 10:00 AM to 10:59 AM | 68 (8.1%) | 6 (0.7%) |
| 11:00 AM to 11:59 AM | 0 (0.0%) | 7 (0.8%) |
| 12:00 PM to 3:59 PM | 62 (7.4%) | 106 (11.8%) |
| 4:00 PM to 11:59 PM | 54 (6.5%) | 33 (3.7%) |
| Total | 836 (100.0%) | 898 (100.0%) |
Housing Occupancy in Fairbury
Occupancy by Ownership in Fairbury
Of the total 1,677 dwellings in Fairbury, owner-occupied units account for 1,000 (59.6%), while renter-occupied units make up 677 (40.4%).
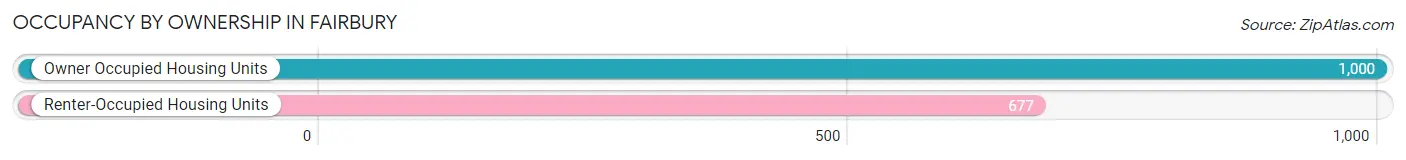
| Occupancy | # Housing Units | % Housing Units |
| Owner Occupied Housing Units | 1,000 | 59.6% |
| Renter-Occupied Housing Units | 677 | 40.4% |
| Total Occupied Housing Units | 1,677 | 100.0% |
Occupancy by Household Size in Fairbury
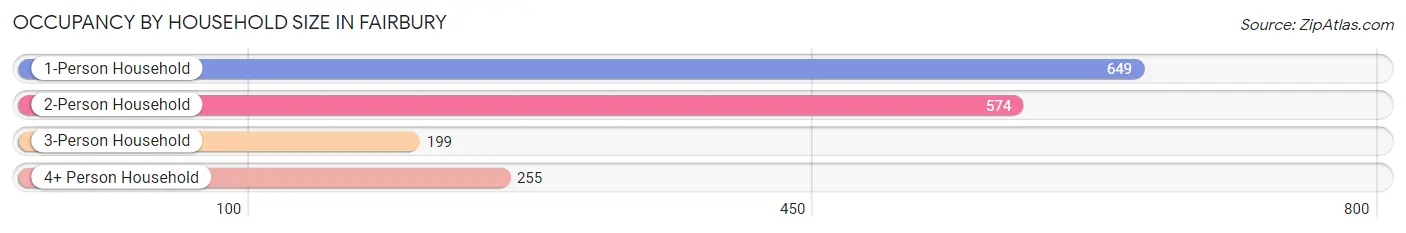
| Household Size | # Housing Units | % Housing Units |
| 1-Person Household | 649 | 38.7% |
| 2-Person Household | 574 | 34.2% |
| 3-Person Household | 199 | 11.9% |
| 4+ Person Household | 255 | 15.2% |
| Total Housing Units | 1,677 | 100.0% |
Occupancy by Ownership by Household Size in Fairbury
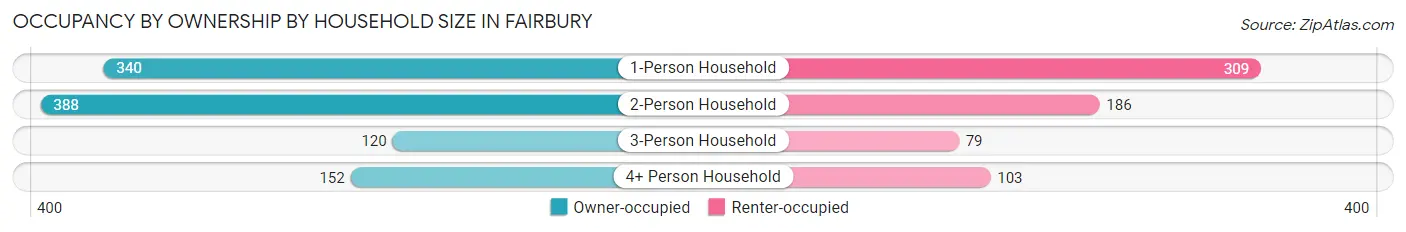
| Household Size | Owner-occupied | Renter-occupied |
| 1-Person Household | 340 (52.4%) | 309 (47.6%) |
| 2-Person Household | 388 (67.6%) | 186 (32.4%) |
| 3-Person Household | 120 (60.3%) | 79 (39.7%) |
| 4+ Person Household | 152 (59.6%) | 103 (40.4%) |
| Total Housing Units | 1,000 (59.6%) | 677 (40.4%) |
Occupancy by Educational Attainment in Fairbury
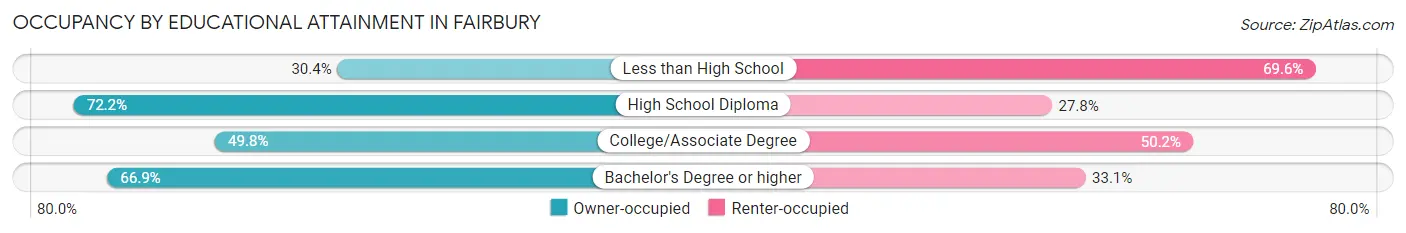
| Household Size | Owner-occupied | Renter-occupied |
| Less than High School | 65 (30.4%) | 149 (69.6%) |
| High School Diploma | 475 (72.2%) | 183 (27.8%) |
| College/Associate Degree | 228 (49.8%) | 230 (50.2%) |
| Bachelor's Degree or higher | 232 (66.9%) | 115 (33.1%) |
Occupancy by Age of Householder in Fairbury
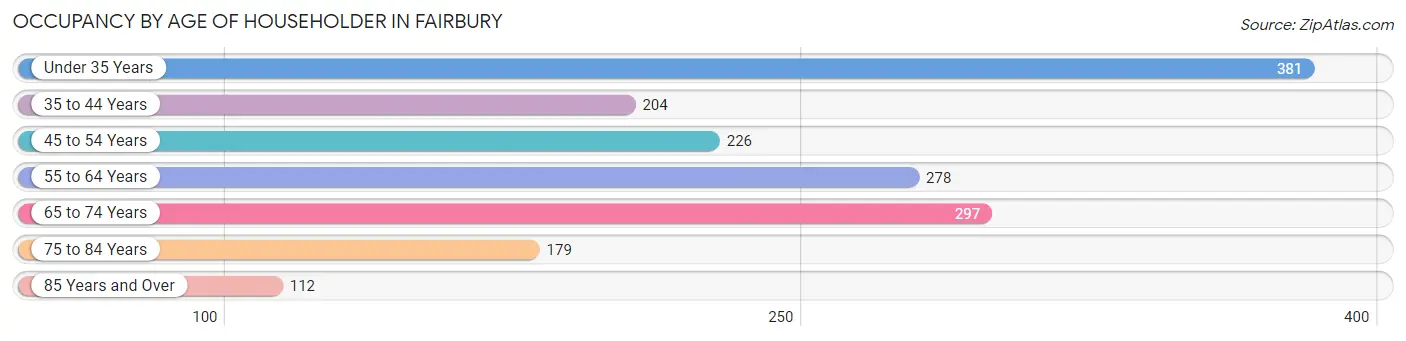
| Age Bracket | # Households | % Households |
| Under 35 Years | 381 | 22.7% |
| 35 to 44 Years | 204 | 12.2% |
| 45 to 54 Years | 226 | 13.5% |
| 55 to 64 Years | 278 | 16.6% |
| 65 to 74 Years | 297 | 17.7% |
| 75 to 84 Years | 179 | 10.7% |
| 85 Years and Over | 112 | 6.7% |
| Total | 1,677 | 100.0% |
Housing Finances in Fairbury
Median Income by Occupancy in Fairbury
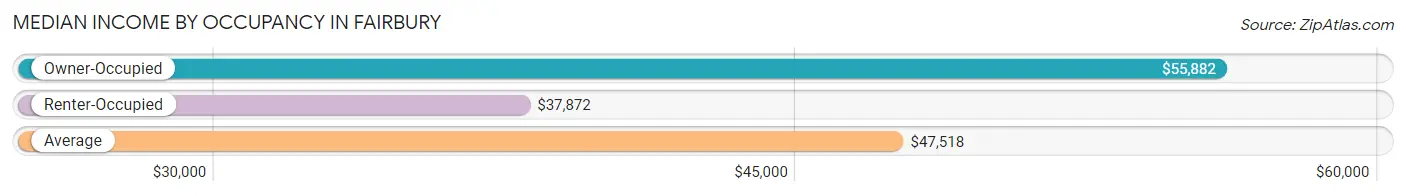
| Occupancy Type | # Households | Median Income |
| Owner-Occupied | 1,000 (59.6%) | $55,882 |
| Renter-Occupied | 677 (40.4%) | $37,872 |
| Average | 1,677 (100.0%) | $47,518 |
Occupancy by Householder Income Bracket in Fairbury
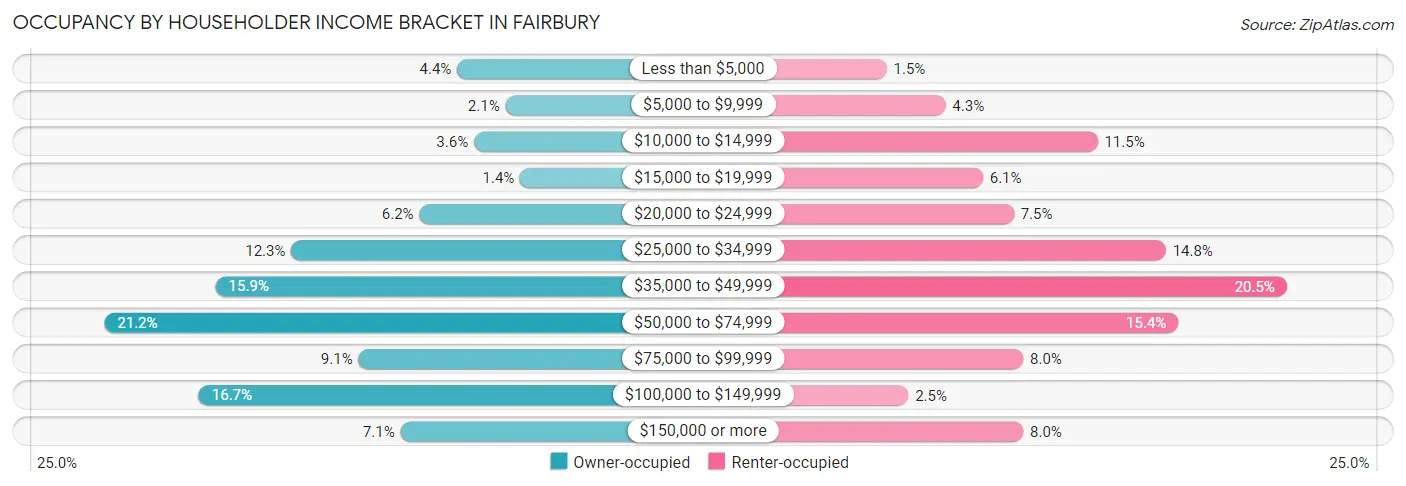
| Income Bracket | Owner-occupied | Renter-occupied |
| Less than $5,000 | 44 (4.4%) | 10 (1.5%) |
| $5,000 to $9,999 | 21 (2.1%) | 29 (4.3%) |
| $10,000 to $14,999 | 36 (3.6%) | 78 (11.5%) |
| $15,000 to $19,999 | 14 (1.4%) | 41 (6.1%) |
| $20,000 to $24,999 | 62 (6.2%) | 51 (7.5%) |
| $25,000 to $34,999 | 123 (12.3%) | 100 (14.8%) |
| $35,000 to $49,999 | 159 (15.9%) | 139 (20.5%) |
| $50,000 to $74,999 | 212 (21.2%) | 104 (15.4%) |
| $75,000 to $99,999 | 91 (9.1%) | 54 (8.0%) |
| $100,000 to $149,999 | 167 (16.7%) | 17 (2.5%) |
| $150,000 or more | 71 (7.1%) | 54 (8.0%) |
| Total | 1,000 (100.0%) | 677 (100.0%) |
Monthly Housing Cost Tiers in Fairbury
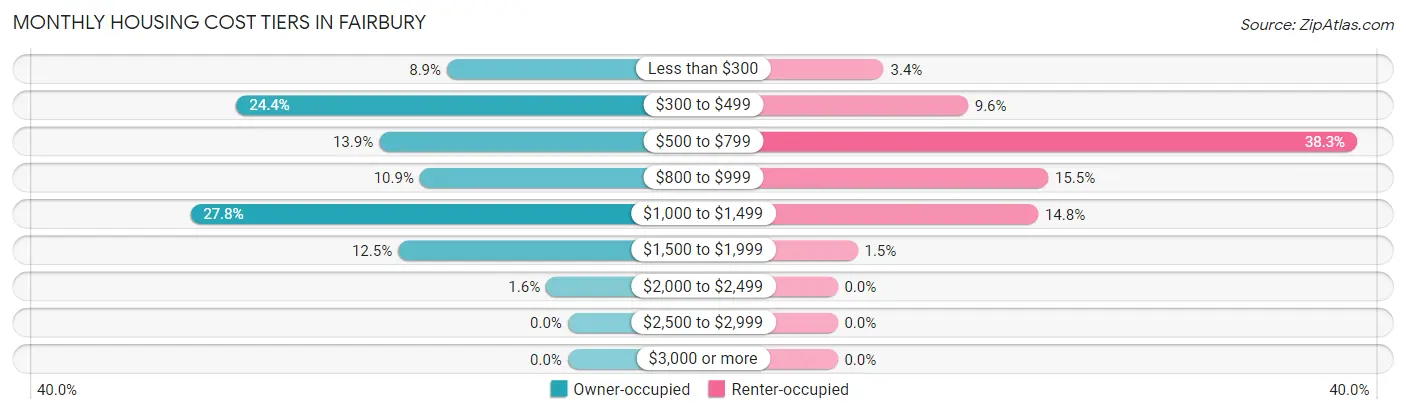
| Monthly Cost | Owner-occupied | Renter-occupied |
| Less than $300 | 89 (8.9%) | 23 (3.4%) |
| $300 to $499 | 244 (24.4%) | 65 (9.6%) |
| $500 to $799 | 139 (13.9%) | 259 (38.3%) |
| $800 to $999 | 109 (10.9%) | 105 (15.5%) |
| $1,000 to $1,499 | 278 (27.8%) | 100 (14.8%) |
| $1,500 to $1,999 | 125 (12.5%) | 10 (1.5%) |
| $2,000 to $2,499 | 16 (1.6%) | 0 (0.0%) |
| $2,500 to $2,999 | 0 (0.0%) | 0 (0.0%) |
| $3,000 or more | 0 (0.0%) | 0 (0.0%) |
| Total | 1,000 (100.0%) | 677 (100.0%) |
Physical Housing Characteristics in Fairbury
Housing Structures in Fairbury
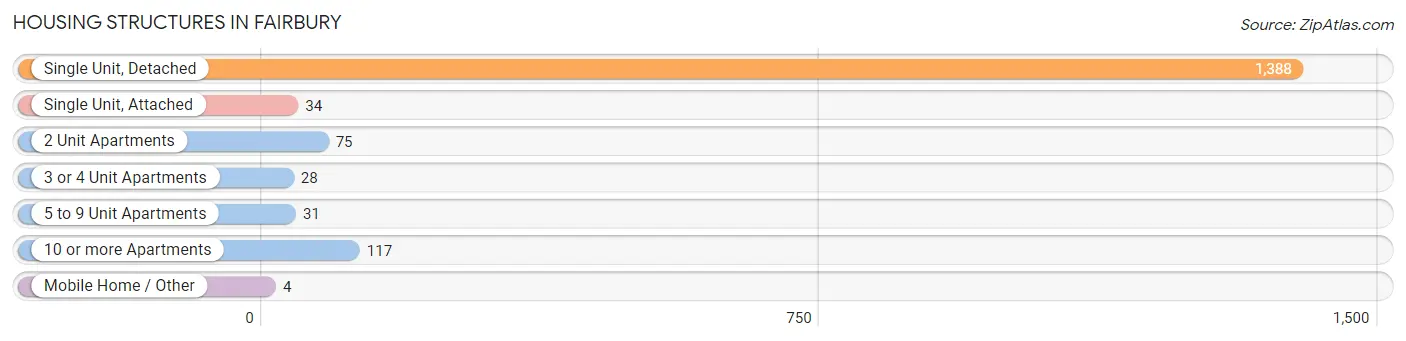
| Structure Type | # Housing Units | % Housing Units |
| Single Unit, Detached | 1,388 | 82.8% |
| Single Unit, Attached | 34 | 2.0% |
| 2 Unit Apartments | 75 | 4.5% |
| 3 or 4 Unit Apartments | 28 | 1.7% |
| 5 to 9 Unit Apartments | 31 | 1.8% |
| 10 or more Apartments | 117 | 7.0% |
| Mobile Home / Other | 4 | 0.2% |
| Total | 1,677 | 100.0% |
Housing Structures by Occupancy in Fairbury
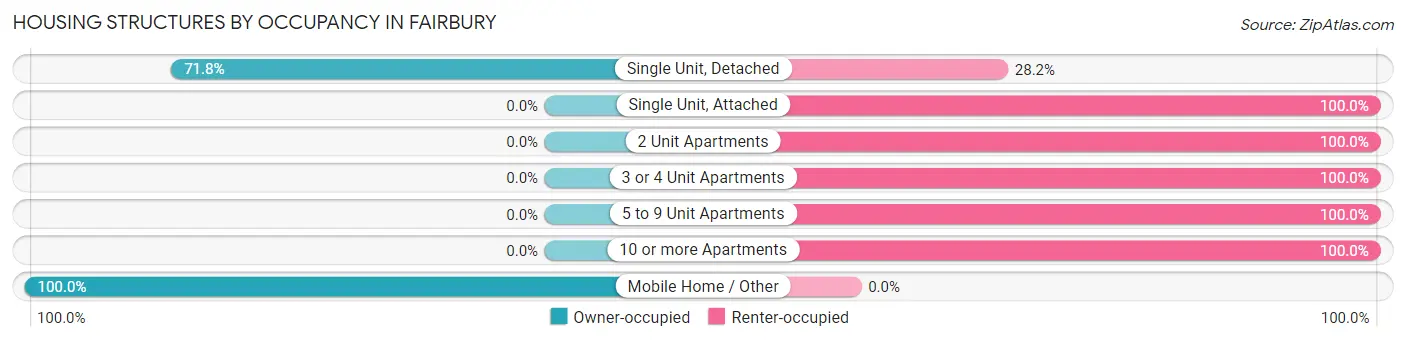
| Structure Type | Owner-occupied | Renter-occupied |
| Single Unit, Detached | 996 (71.8%) | 392 (28.2%) |
| Single Unit, Attached | 0 (0.0%) | 34 (100.0%) |
| 2 Unit Apartments | 0 (0.0%) | 75 (100.0%) |
| 3 or 4 Unit Apartments | 0 (0.0%) | 28 (100.0%) |
| 5 to 9 Unit Apartments | 0 (0.0%) | 31 (100.0%) |
| 10 or more Apartments | 0 (0.0%) | 117 (100.0%) |
| Mobile Home / Other | 4 (100.0%) | 0 (0.0%) |
| Total | 1,000 (59.6%) | 677 (40.4%) |
Housing Structures by Number of Rooms in Fairbury
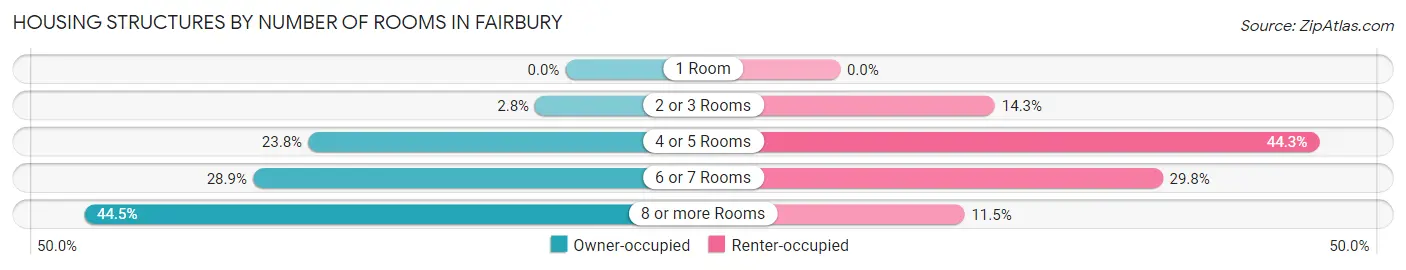
| Number of Rooms | Owner-occupied | Renter-occupied |
| 1 Room | 0 (0.0%) | 0 (0.0%) |
| 2 or 3 Rooms | 28 (2.8%) | 97 (14.3%) |
| 4 or 5 Rooms | 238 (23.8%) | 300 (44.3%) |
| 6 or 7 Rooms | 289 (28.9%) | 202 (29.8%) |
| 8 or more Rooms | 445 (44.5%) | 78 (11.5%) |
| Total | 1,000 (100.0%) | 677 (100.0%) |
Housing Structure by Heating Type in Fairbury
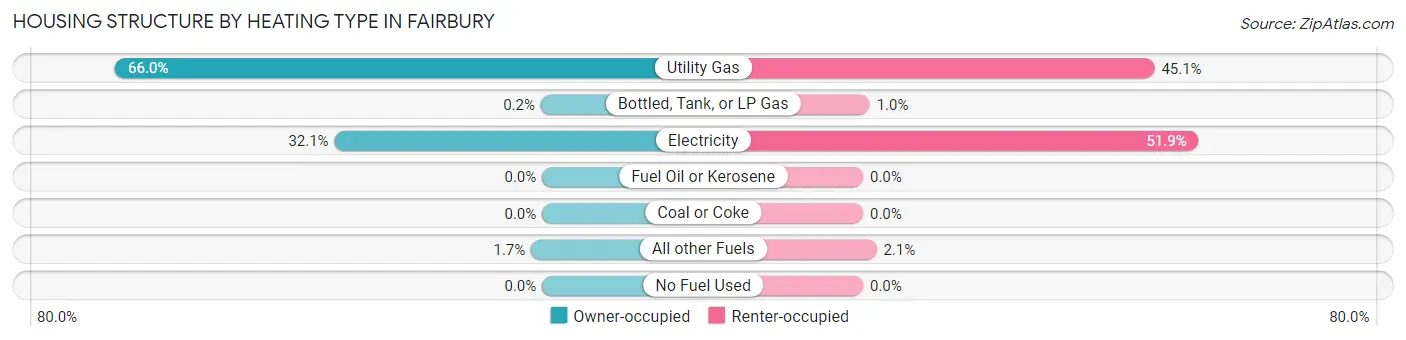
| Heating Type | Owner-occupied | Renter-occupied |
| Utility Gas | 660 (66.0%) | 305 (45.1%) |
| Bottled, Tank, or LP Gas | 2 (0.2%) | 7 (1.0%) |
| Electricity | 321 (32.1%) | 351 (51.8%) |
| Fuel Oil or Kerosene | 0 (0.0%) | 0 (0.0%) |
| Coal or Coke | 0 (0.0%) | 0 (0.0%) |
| All other Fuels | 17 (1.7%) | 14 (2.1%) |
| No Fuel Used | 0 (0.0%) | 0 (0.0%) |
| Total | 1,000 (100.0%) | 677 (100.0%) |
Household Vehicle Usage in Fairbury
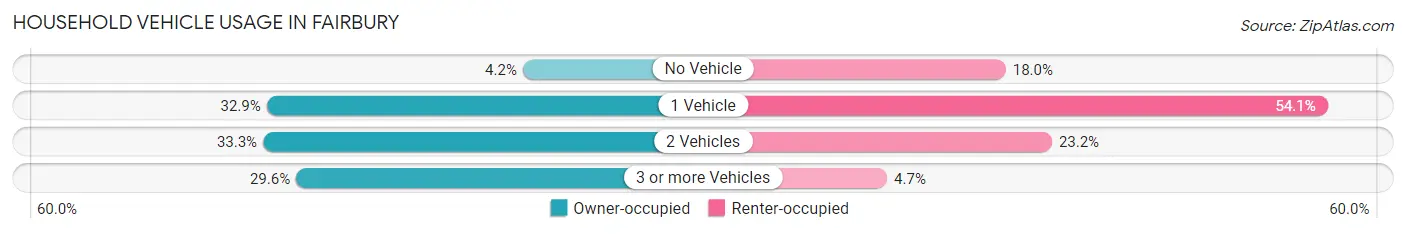
| Vehicles per Household | Owner-occupied | Renter-occupied |
| No Vehicle | 42 (4.2%) | 122 (18.0%) |
| 1 Vehicle | 329 (32.9%) | 366 (54.1%) |
| 2 Vehicles | 333 (33.3%) | 157 (23.2%) |
| 3 or more Vehicles | 296 (29.6%) | 32 (4.7%) |
| Total | 1,000 (100.0%) | 677 (100.0%) |
Real Estate & Mortgages in Fairbury
Real Estate and Mortgage Overview in Fairbury
| Characteristic | Without Mortgage | With Mortgage |
| Housing Units | 527 | 473 |
| Median Property Value | $55,900 | $121,800 |
| Median Household Income | $43,188 | $56 |
| Monthly Housing Costs | $435 | $0 |
| Real Estate Taxes | $1,317 | $21 |
Property Value by Mortgage Status in Fairbury
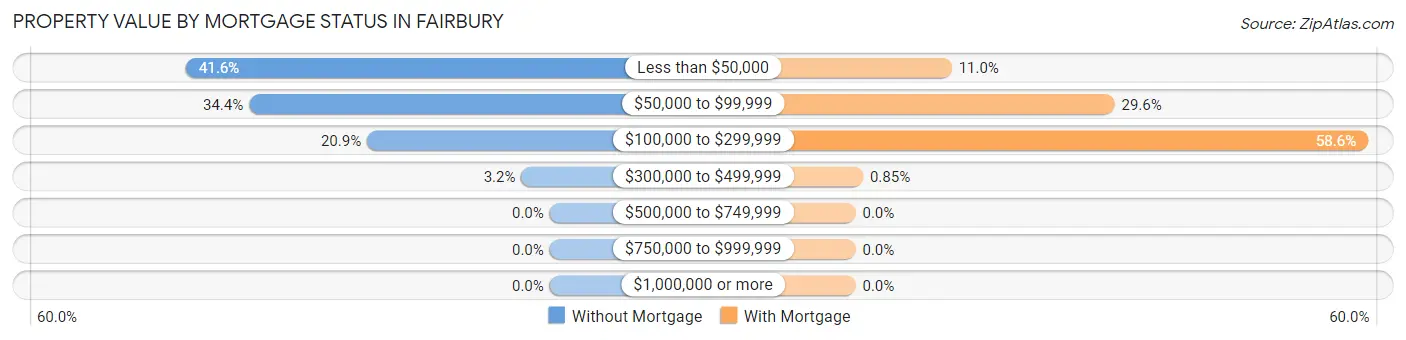
| Property Value | Without Mortgage | With Mortgage |
| Less than $50,000 | 219 (41.6%) | 52 (11.0%) |
| $50,000 to $99,999 | 181 (34.4%) | 140 (29.6%) |
| $100,000 to $299,999 | 110 (20.9%) | 277 (58.6%) |
| $300,000 to $499,999 | 17 (3.2%) | 4 (0.9%) |
| $500,000 to $749,999 | 0 (0.0%) | 0 (0.0%) |
| $750,000 to $999,999 | 0 (0.0%) | 0 (0.0%) |
| $1,000,000 or more | 0 (0.0%) | 0 (0.0%) |
| Total | 527 (100.0%) | 473 (100.0%) |
Household Income by Mortgage Status in Fairbury
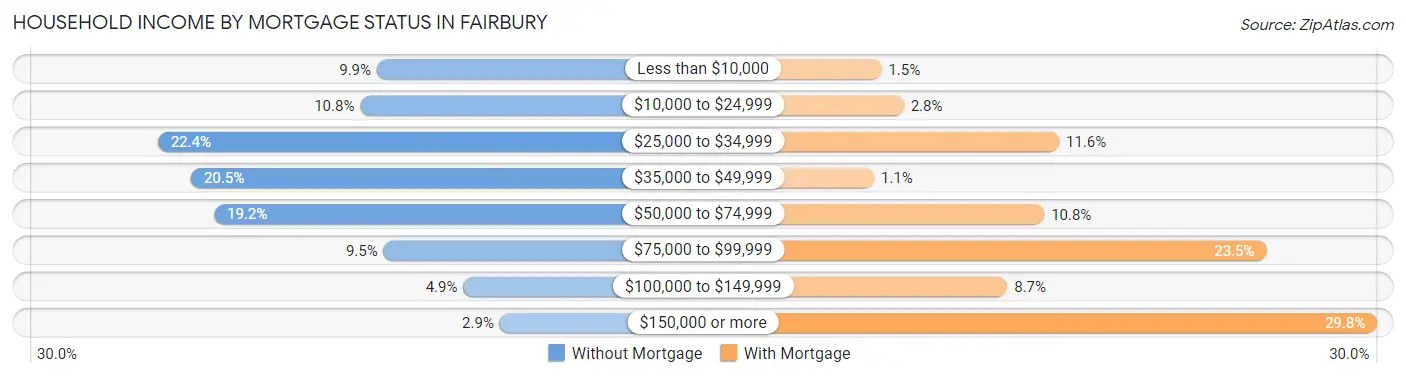
| Household Income | Without Mortgage | With Mortgage |
| Less than $10,000 | 52 (9.9%) | 7 (1.5%) |
| $10,000 to $24,999 | 57 (10.8%) | 13 (2.8%) |
| $25,000 to $34,999 | 118 (22.4%) | 55 (11.6%) |
| $35,000 to $49,999 | 108 (20.5%) | 5 (1.1%) |
| $50,000 to $74,999 | 101 (19.2%) | 51 (10.8%) |
| $75,000 to $99,999 | 50 (9.5%) | 111 (23.5%) |
| $100,000 to $149,999 | 26 (4.9%) | 41 (8.7%) |
| $150,000 or more | 15 (2.9%) | 141 (29.8%) |
| Total | 527 (100.0%) | 473 (100.0%) |
Property Value to Household Income Ratio in Fairbury
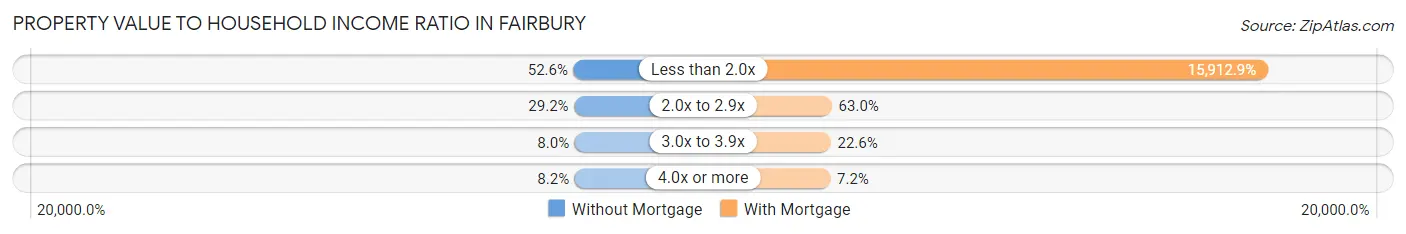
| Value-to-Income Ratio | Without Mortgage | With Mortgage |
| Less than 2.0x | 277 (52.6%) | 75,268 (15,912.9%) |
| 2.0x to 2.9x | 154 (29.2%) | 298 (63.0%) |
| 3.0x to 3.9x | 42 (8.0%) | 107 (22.6%) |
| 4.0x or more | 43 (8.2%) | 34 (7.2%) |
| Total | 527 (100.0%) | 473 (100.0%) |
Real Estate Taxes by Mortgage Status in Fairbury
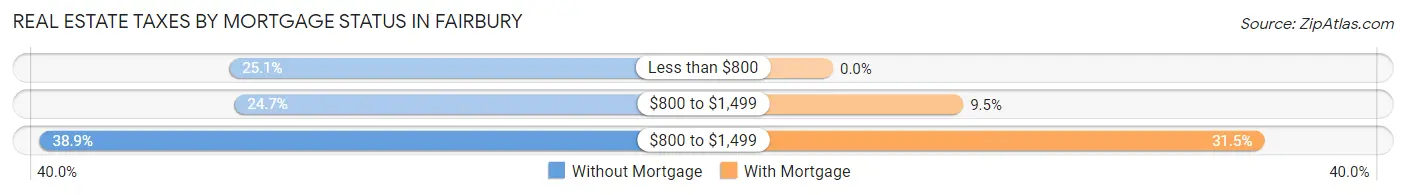
| Property Taxes | Without Mortgage | With Mortgage |
| Less than $800 | 132 (25.1%) | 0 (0.0%) |
| $800 to $1,499 | 130 (24.7%) | 45 (9.5%) |
| $800 to $1,499 | 205 (38.9%) | 149 (31.5%) |
| Total | 527 (100.0%) | 473 (100.0%) |
Health & Disability in Fairbury
Health Insurance Coverage by Age in Fairbury
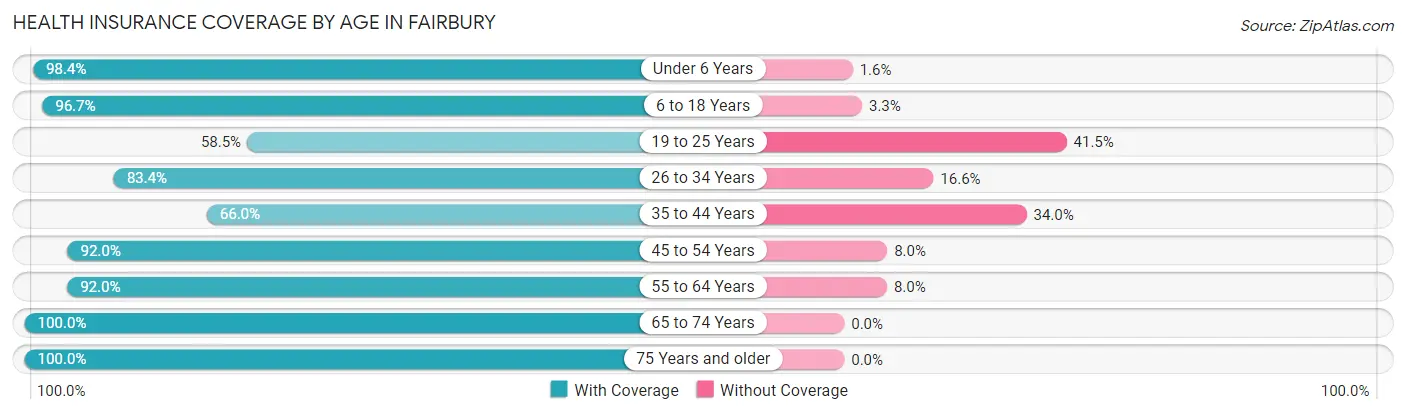
| Age Bracket | With Coverage | Without Coverage |
| Under 6 Years | 314 (98.4%) | 5 (1.6%) |
| 6 to 18 Years | 526 (96.7%) | 18 (3.3%) |
| 19 to 25 Years | 216 (58.5%) | 153 (41.5%) |
| 26 to 34 Years | 316 (83.4%) | 63 (16.6%) |
| 35 to 44 Years | 303 (66.0%) | 156 (34.0%) |
| 45 to 54 Years | 379 (92.0%) | 33 (8.0%) |
| 55 to 64 Years | 509 (92.0%) | 44 (8.0%) |
| 65 to 74 Years | 421 (100.0%) | 0 (0.0%) |
| 75 Years and older | 349 (100.0%) | 0 (0.0%) |
| Total | 3,333 (87.6%) | 472 (12.4%) |
Health Insurance Coverage by Citizenship Status in Fairbury
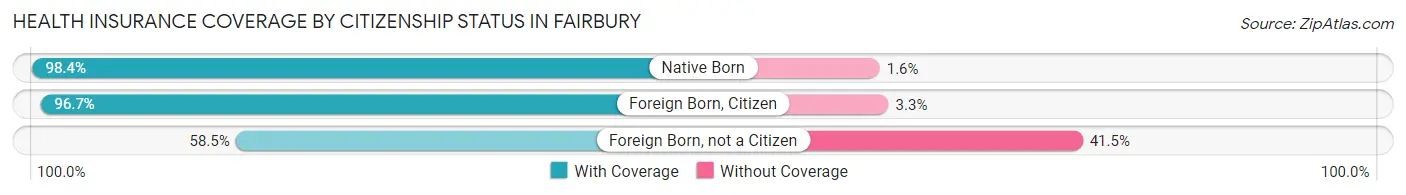
| Citizenship Status | With Coverage | Without Coverage |
| Native Born | 314 (98.4%) | 5 (1.6%) |
| Foreign Born, Citizen | 526 (96.7%) | 18 (3.3%) |
| Foreign Born, not a Citizen | 216 (58.5%) | 153 (41.5%) |
Health Insurance Coverage by Household Income in Fairbury
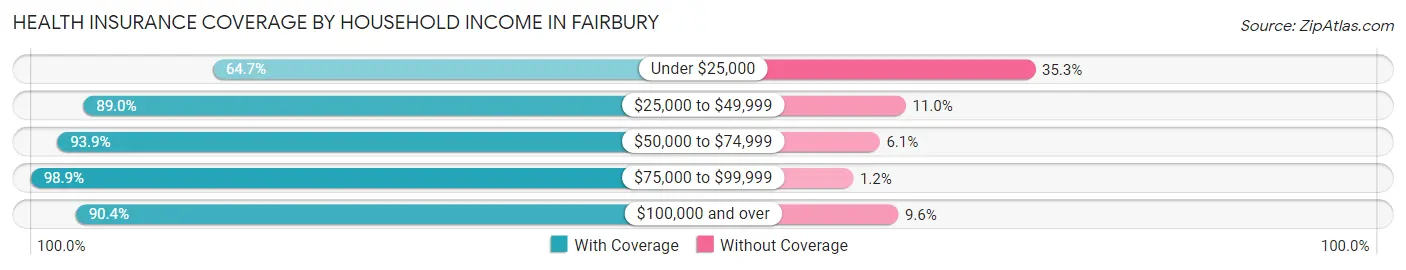
| Household Income | With Coverage | Without Coverage |
| Under $25,000 | 389 (64.7%) | 212 (35.3%) |
| $25,000 to $49,999 | 752 (89.0%) | 93 (11.0%) |
| $50,000 to $74,999 | 843 (93.9%) | 55 (6.1%) |
| $75,000 to $99,999 | 345 (98.9%) | 4 (1.1%) |
| $100,000 and over | 999 (90.4%) | 106 (9.6%) |
Public vs Private Health Insurance Coverage by Age in Fairbury
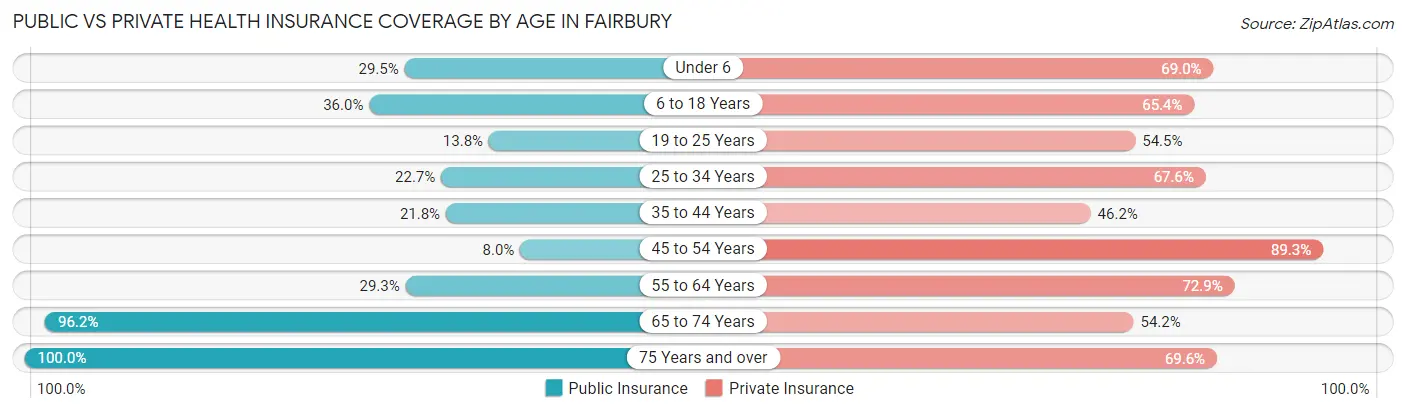
| Age Bracket | Public Insurance | Private Insurance |
| Under 6 | 94 (29.5%) | 220 (69.0%) |
| 6 to 18 Years | 196 (36.0%) | 356 (65.4%) |
| 19 to 25 Years | 51 (13.8%) | 201 (54.5%) |
| 25 to 34 Years | 86 (22.7%) | 256 (67.5%) |
| 35 to 44 Years | 100 (21.8%) | 212 (46.2%) |
| 45 to 54 Years | 33 (8.0%) | 368 (89.3%) |
| 55 to 64 Years | 162 (29.3%) | 403 (72.9%) |
| 65 to 74 Years | 405 (96.2%) | 228 (54.2%) |
| 75 Years and over | 349 (100.0%) | 243 (69.6%) |
| Total | 1,476 (38.8%) | 2,487 (65.4%) |
Disability Status by Sex by Age in Fairbury
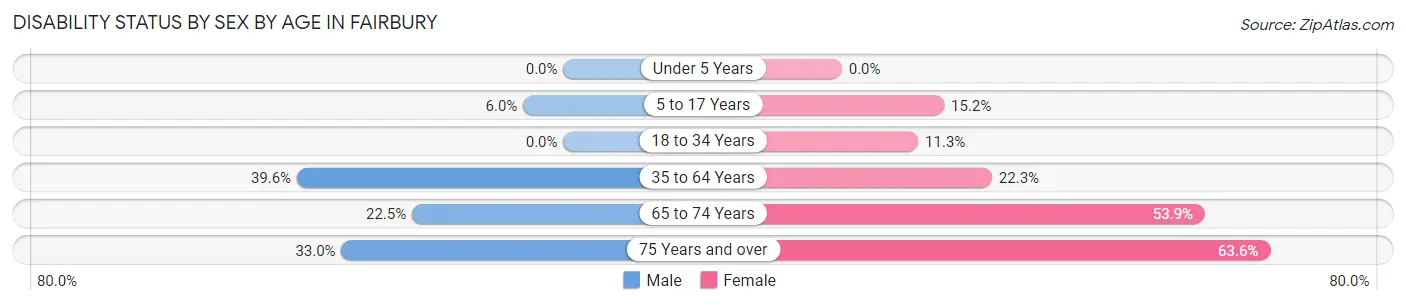
| Age Bracket | Male | Female |
| Under 5 Years | 0 (0.0%) | 0 (0.0%) |
| 5 to 17 Years | 17 (6.0%) | 48 (15.2%) |
| 18 to 34 Years | 0 (0.0%) | 49 (11.3%) |
| 35 to 64 Years | 290 (39.6%) | 154 (22.3%) |
| 65 to 74 Years | 40 (22.5%) | 131 (53.9%) |
| 75 Years and over | 29 (33.0%) | 166 (63.6%) |
Disability Class by Sex by Age in Fairbury
Disability Class: Hearing Difficulty
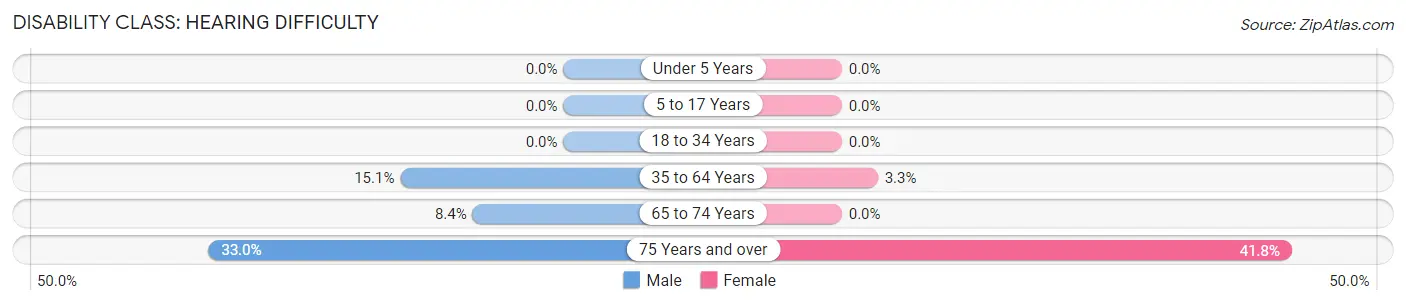
| Age Bracket | Male | Female |
| Under 5 Years | 0 (0.0%) | 0 (0.0%) |
| 5 to 17 Years | 0 (0.0%) | 0 (0.0%) |
| 18 to 34 Years | 0 (0.0%) | 0 (0.0%) |
| 35 to 64 Years | 111 (15.1%) | 23 (3.3%) |
| 65 to 74 Years | 15 (8.4%) | 0 (0.0%) |
| 75 Years and over | 29 (33.0%) | 109 (41.8%) |
Disability Class: Vision Difficulty
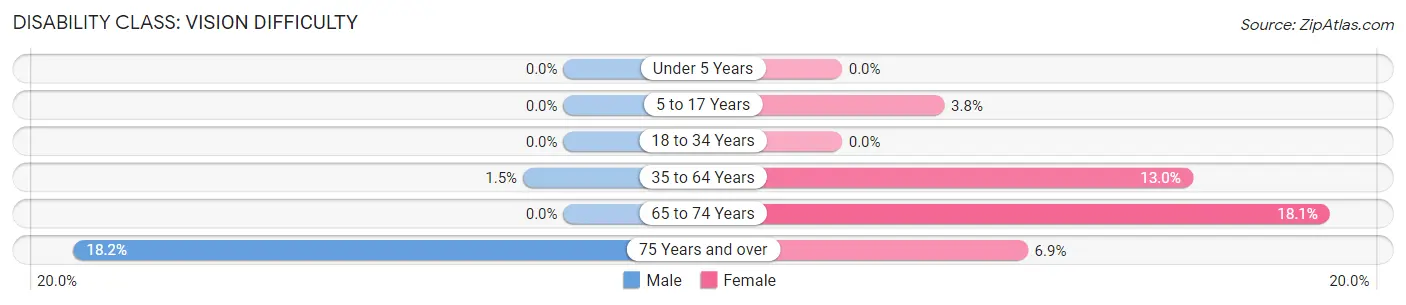
| Age Bracket | Male | Female |
| Under 5 Years | 0 (0.0%) | 0 (0.0%) |
| 5 to 17 Years | 0 (0.0%) | 12 (3.8%) |
| 18 to 34 Years | 0 (0.0%) | 0 (0.0%) |
| 35 to 64 Years | 11 (1.5%) | 90 (13.0%) |
| 65 to 74 Years | 0 (0.0%) | 44 (18.1%) |
| 75 Years and over | 16 (18.2%) | 18 (6.9%) |
Disability Class: Cognitive Difficulty
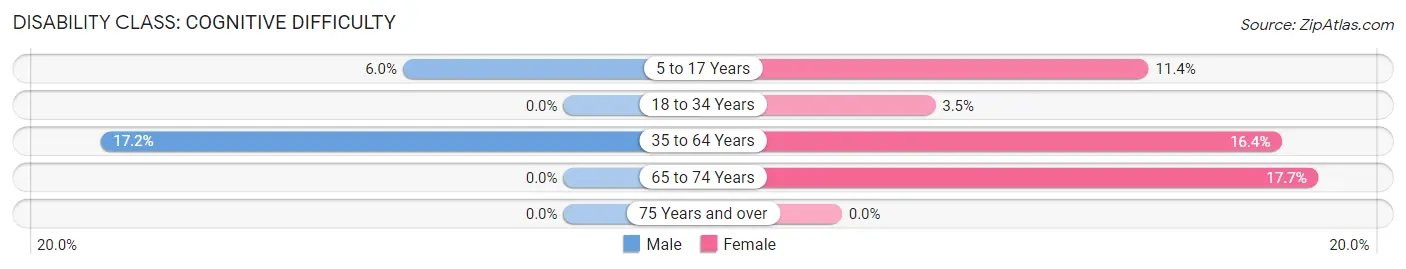
| Age Bracket | Male | Female |
| 5 to 17 Years | 17 (6.0%) | 36 (11.4%) |
| 18 to 34 Years | 0 (0.0%) | 15 (3.5%) |
| 35 to 64 Years | 126 (17.2%) | 113 (16.4%) |
| 65 to 74 Years | 0 (0.0%) | 43 (17.7%) |
| 75 Years and over | 0 (0.0%) | 0 (0.0%) |
Disability Class: Ambulatory Difficulty
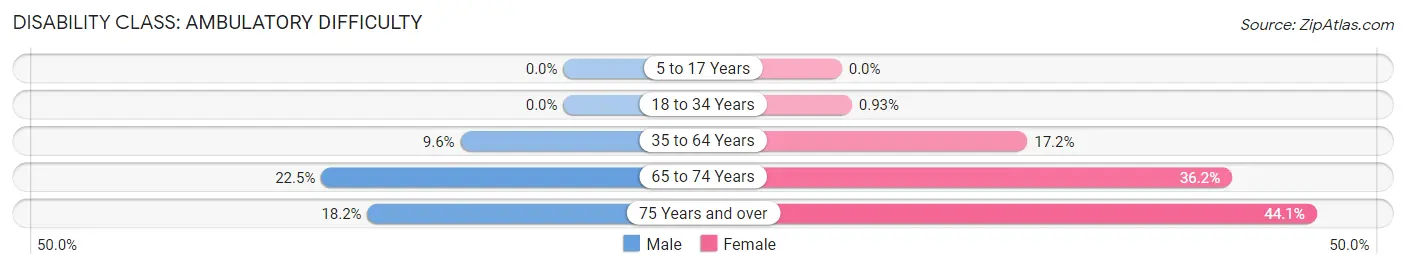
| Age Bracket | Male | Female |
| 5 to 17 Years | 0 (0.0%) | 0 (0.0%) |
| 18 to 34 Years | 0 (0.0%) | 4 (0.9%) |
| 35 to 64 Years | 70 (9.6%) | 119 (17.2%) |
| 65 to 74 Years | 40 (22.5%) | 88 (36.2%) |
| 75 Years and over | 16 (18.2%) | 115 (44.1%) |
Disability Class: Self-Care Difficulty
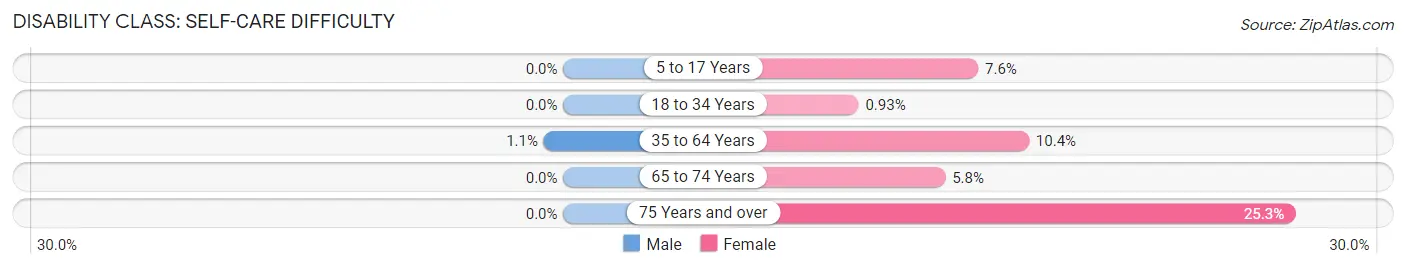
| Age Bracket | Male | Female |
| 5 to 17 Years | 0 (0.0%) | 24 (7.6%) |
| 18 to 34 Years | 0 (0.0%) | 4 (0.9%) |
| 35 to 64 Years | 8 (1.1%) | 72 (10.4%) |
| 65 to 74 Years | 0 (0.0%) | 14 (5.8%) |
| 75 Years and over | 0 (0.0%) | 66 (25.3%) |
Technology Access in Fairbury
Computing Device Access in Fairbury
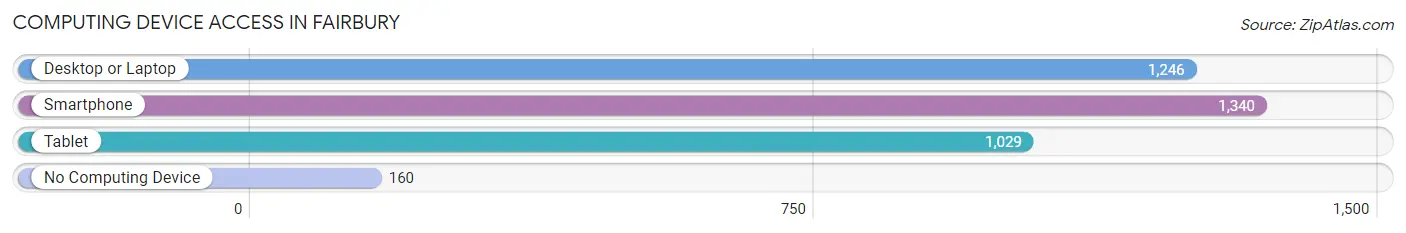
| Device Type | # Households | % Households |
| Desktop or Laptop | 1,246 | 74.3% |
| Smartphone | 1,340 | 79.9% |
| Tablet | 1,029 | 61.4% |
| No Computing Device | 160 | 9.5% |
| Total | 1,677 | 100.0% |
Internet Access in Fairbury
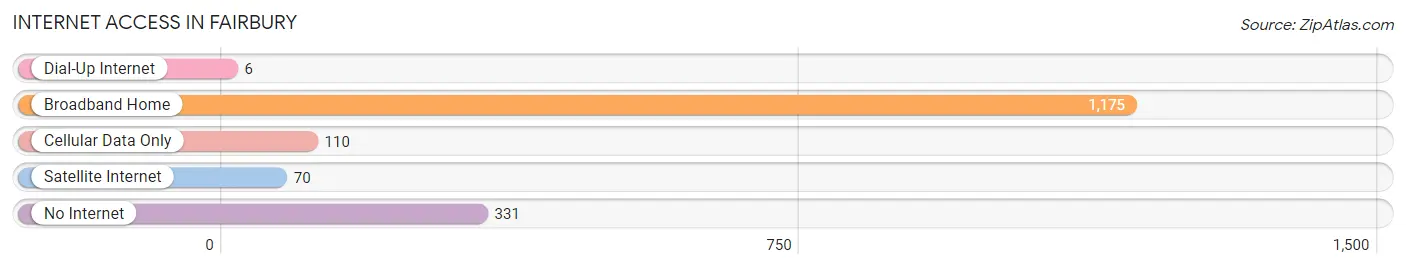
| Internet Type | # Households | % Households |
| Dial-Up Internet | 6 | 0.4% |
| Broadband Home | 1,175 | 70.1% |
| Cellular Data Only | 110 | 6.6% |
| Satellite Internet | 70 | 4.2% |
| No Internet | 331 | 19.7% |
| Total | 1,677 | 100.0% |
Fairbury Summary
Fairbury, Nebraska is a small city located in Jefferson County, Nebraska. It is situated along the Little Blue River and is home to a population of approximately 3,000 people. The city is known for its historic downtown area, which is home to a variety of shops, restaurants, and other businesses.
History
Fairbury was founded in 1871 by a group of settlers from Fairbury, Illinois. The city was named after the Illinois town, and the settlers brought with them many of the same traditions and customs. The city was incorporated in 1873 and quickly grew to become a thriving agricultural and commercial center.
In the late 19th century, Fairbury was a major stop on the Union Pacific Railroad. The railroad brought many new businesses to the city, including a flour mill, a creamery, and a brickyard. The city also became a major shipping point for livestock and grain.
In the early 20th century, Fairbury experienced a period of growth and prosperity. The city was home to several large businesses, including a furniture factory, a canning factory, and a brewery. The city also had a thriving downtown area, which was home to a variety of shops, restaurants, and other businesses.
Geography
Fairbury is located in southeastern Nebraska, approximately 50 miles south of Lincoln. The city is situated along the Little Blue River and is surrounded by rolling hills and farmland. The city has a total area of 2.3 square miles, all of which is land.
Economy
Fairbury’s economy is largely based on agriculture and manufacturing. The city is home to several large agricultural businesses, including a feed mill, a grain elevator, and a dairy. The city is also home to several manufacturing businesses, including a furniture factory, a canning factory, and a brewery.
In addition to these businesses, Fairbury is home to a variety of shops, restaurants, and other businesses. The city is also home to a number of government offices, including the Jefferson County Courthouse and the Fairbury Public Library.
Demographics
As of the 2010 census, Fairbury had a population of 3,000 people. The racial makeup of the city was 95.3% White, 0.7% African American, 0.3% Native American, 0.7% Asian, 0.3% from other races, and 2.0% from two or more races. Hispanic or Latino of any race were 1.7% of the population.
The median income for a household in Fairbury was $37,500, and the median income for a family was $45,000. The per capita income for the city was $18,000. About 11.7% of families and 14.3% of the population were below the poverty line, including 19.3% of those under age 18 and 8.3% of those age 65 or over.
Common Questions
What is Per Capita Income in Fairbury?
Per Capita income in Fairbury is $26,698.
What is the Median Family Income in Fairbury?
Median Family Income in Fairbury is $56,940.
What is the Median Household income in Fairbury?
Median Household Income in Fairbury is $47,518.
What is Income or Wage Gap in Fairbury?
Income or Wage Gap in Fairbury is 22.9%.
Women in Fairbury earn 77.1 cents for every dollar earned by a man.
What is Inequality or Gini Index in Fairbury?
Inequality or Gini Index in Fairbury is 0.44.
What is the Total Population of Fairbury?
Total Population of Fairbury is 3,913.
What is the Total Male Population of Fairbury?
Total Male Population of Fairbury is 1,759.
What is the Total Female Population of Fairbury?
Total Female Population of Fairbury is 2,154.
What is the Ratio of Males per 100 Females in Fairbury?
There are 81.66 Males per 100 Females in Fairbury.
What is the Ratio of Females per 100 Males in Fairbury?
There are 122.46 Females per 100 Males in Fairbury.
What is the Median Population Age in Fairbury?
Median Population Age in Fairbury is 40.9 Years.
What is the Average Family Size in Fairbury
Average Family Size in Fairbury is 3.1 People.
What is the Average Household Size in Fairbury
Average Household Size in Fairbury is 2.3 People.
How Large is the Labor Force in Fairbury?
There are 1,907 People in the Labor Forcein in Fairbury.
What is the Percentage of People in the Labor Force in Fairbury?
59.9% of People are in the Labor Force in Fairbury.
What is the Unemployment Rate in Fairbury?
Unemployment Rate in Fairbury is 1.0%.