Dunbar, NE Map & Demographics
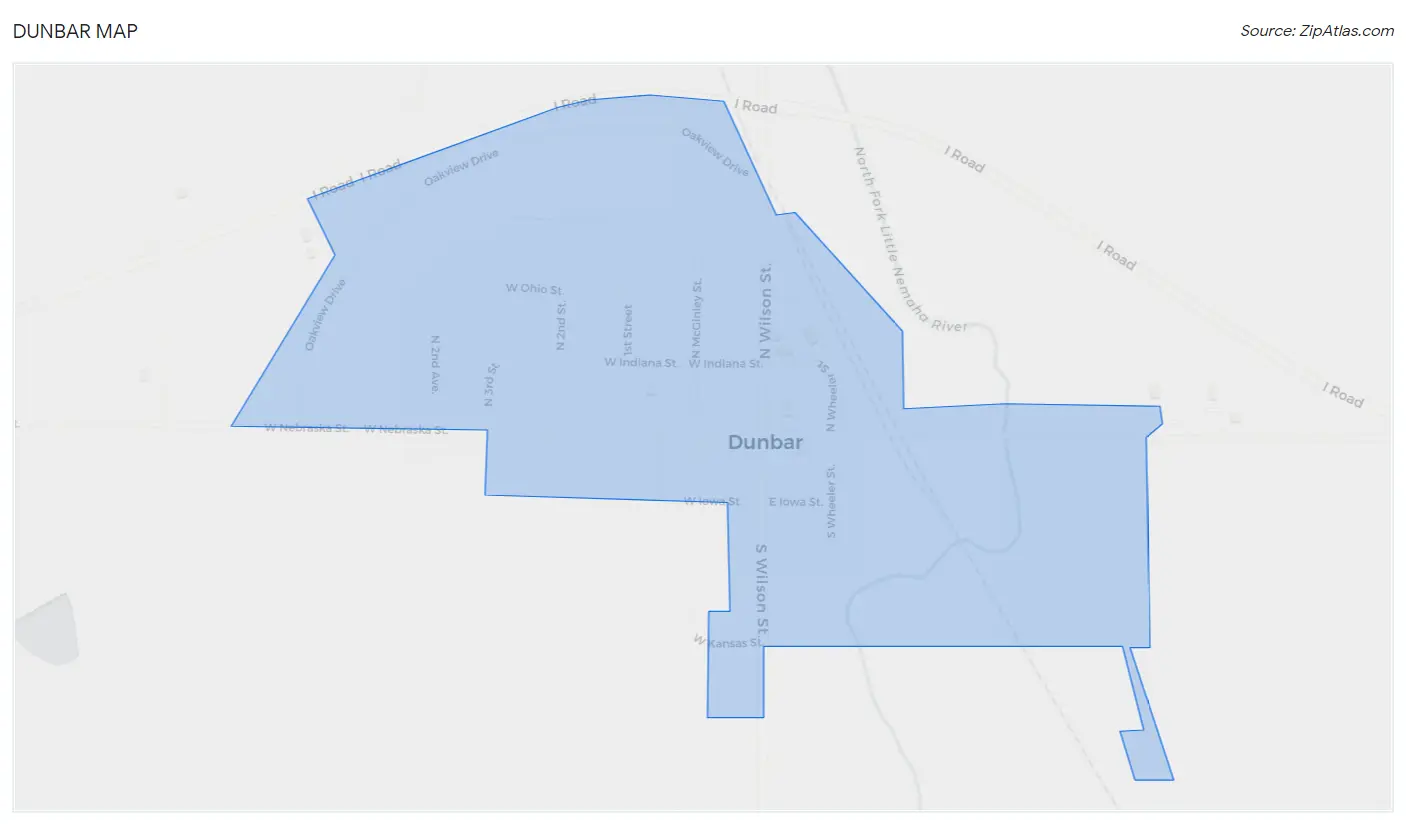
Dunbar Map
Dunbar Overview
$39,204
PER CAPITA INCOME
$111,250
AVG FAMILY INCOME
$87,500
AVG HOUSEHOLD INCOME
0.30
INEQUALITY / GINI INDEX
201
TOTAL POPULATION
96
MALE POPULATION
105
FEMALE POPULATION
91.43
MALES / 100 FEMALES
109.38
FEMALES / 100 MALES
56.0
MEDIAN AGE
2.2
AVG FAMILY SIZE
2.0
AVG HOUSEHOLD SIZE
141
LABOR FORCE [ PEOPLE ]
77.9%
PERCENT IN LABOR FORCE
26.2%
UNEMPLOYMENT RATE
Dunbar Zip Codes
Dunbar Area Codes
Income in Dunbar
Income Overview in Dunbar
Per Capita Income in Dunbar is $39,204, while median incomes of families and households are $111,250 and $87,500 respectively.
| Characteristic | Number | Measure |
| Per Capita Income | 201 | $39,204 |
| Median Family Income | 72 | $111,250 |
| Mean Family Income | 72 | $91,446 |
| Median Household Income | 102 | $87,500 |
| Mean Household Income | 102 | $81,113 |
| Income Deficit | 72 | $0 |
| Wage / Income Gap (%) | 201 | 0.00% |
| Wage / Income Gap ($) | 201 | 100.00¢ per $1 |
| Gini / Inequality Index | 201 | 0.30 |
Earnings by Sex in Dunbar
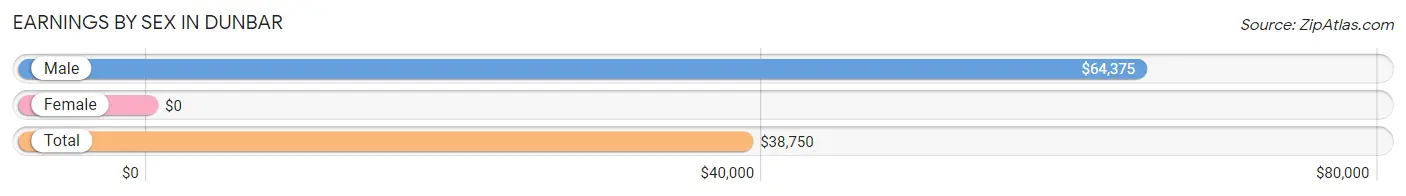
| Sex | Number | Average Earnings |
| Male | 71 (49.0%) | $64,375 |
| Female | 74 (51.0%) | $0 |
| Total | 145 (100.0%) | $38,750 |
Earnings by Sex by Income Bracket in Dunbar
The most common earnings brackets in Dunbar are $100,000+ for men (19 | 26.8%) and $12,500 to $14,999 for women (25 | 33.8%).
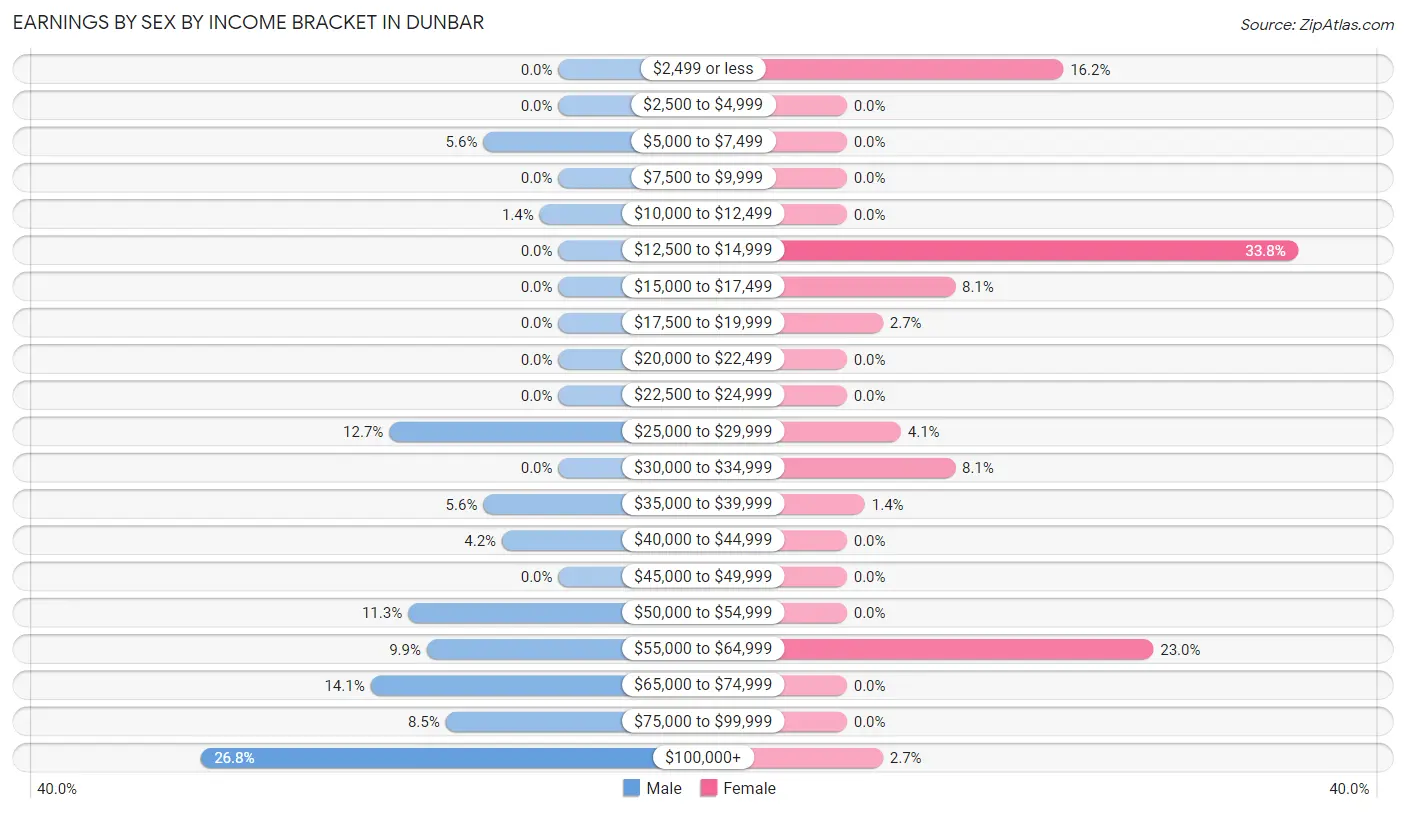
| Income | Male | Female |
| $2,499 or less | 0 (0.0%) | 12 (16.2%) |
| $2,500 to $4,999 | 0 (0.0%) | 0 (0.0%) |
| $5,000 to $7,499 | 4 (5.6%) | 0 (0.0%) |
| $7,500 to $9,999 | 0 (0.0%) | 0 (0.0%) |
| $10,000 to $12,499 | 1 (1.4%) | 0 (0.0%) |
| $12,500 to $14,999 | 0 (0.0%) | 25 (33.8%) |
| $15,000 to $17,499 | 0 (0.0%) | 6 (8.1%) |
| $17,500 to $19,999 | 0 (0.0%) | 2 (2.7%) |
| $20,000 to $22,499 | 0 (0.0%) | 0 (0.0%) |
| $22,500 to $24,999 | 0 (0.0%) | 0 (0.0%) |
| $25,000 to $29,999 | 9 (12.7%) | 3 (4.1%) |
| $30,000 to $34,999 | 0 (0.0%) | 6 (8.1%) |
| $35,000 to $39,999 | 4 (5.6%) | 1 (1.3%) |
| $40,000 to $44,999 | 3 (4.2%) | 0 (0.0%) |
| $45,000 to $49,999 | 0 (0.0%) | 0 (0.0%) |
| $50,000 to $54,999 | 8 (11.3%) | 0 (0.0%) |
| $55,000 to $64,999 | 7 (9.9%) | 17 (23.0%) |
| $65,000 to $74,999 | 10 (14.1%) | 0 (0.0%) |
| $75,000 to $99,999 | 6 (8.5%) | 0 (0.0%) |
| $100,000+ | 19 (26.8%) | 2 (2.7%) |
| Total | 71 (100.0%) | 74 (100.0%) |
Earnings by Sex by Educational Attainment in Dunbar
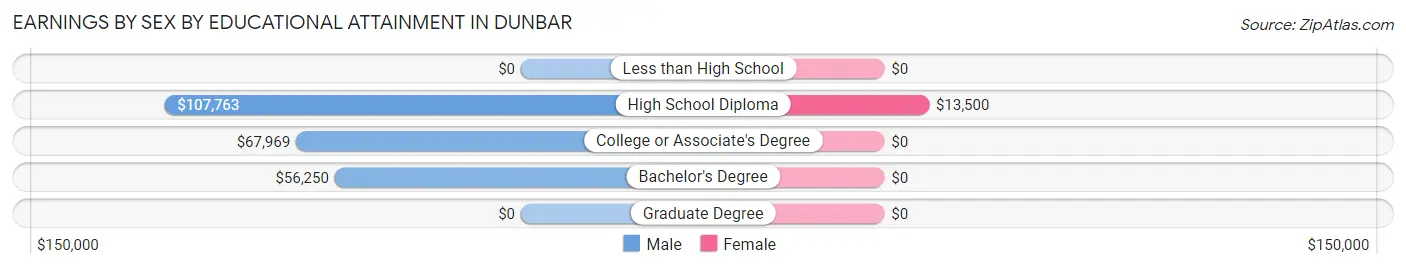
| Educational Attainment | Male Income | Female Income |
| Less than High School | - | - |
| High School Diploma | $107,763 | $13,500 |
| College or Associate's Degree | $67,969 | $0 |
| Bachelor's Degree | $56,250 | $0 |
| Graduate Degree | - | - |
| Total | $68,000 | $0 |
Family Income in Dunbar
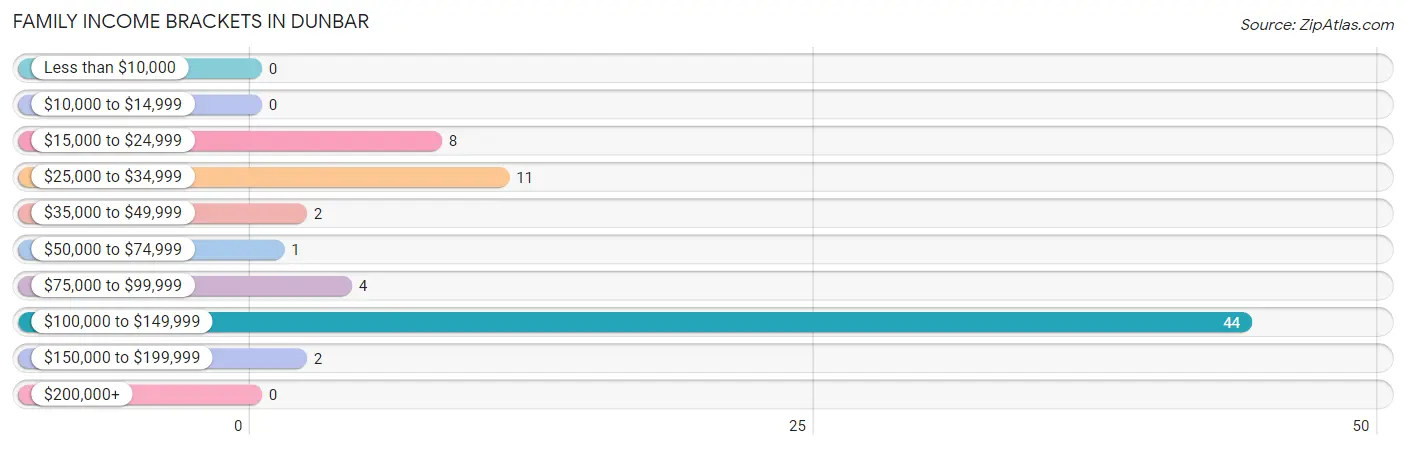
Family Income Brackets in Dunbar
According to the Dunbar family income data, there are 44 families falling into the $100,000 to $149,999 income range, which is the most common income bracket and makes up 61.1% of all families.
| Income Bracket | # Families | % Families |
| Less than $10,000 | 0 | 0.0% |
| $10,000 to $14,999 | 0 | 0.0% |
| $15,000 to $24,999 | 8 | 11.1% |
| $25,000 to $34,999 | 11 | 15.3% |
| $35,000 to $49,999 | 2 | 2.8% |
| $50,000 to $74,999 | 1 | 1.4% |
| $75,000 to $99,999 | 4 | 5.6% |
| $100,000 to $149,999 | 44 | 61.1% |
| $150,000 to $199,999 | 2 | 2.8% |
| $200,000+ | 0 | 0.0% |
Family Income by Famaliy Size in Dunbar
2-person families (62 | 86.1%) account for the highest median family income in Dunbar with $122,685 per family, while 2-person families (62 | 86.1%) have the highest median income of $61,342 per family member.
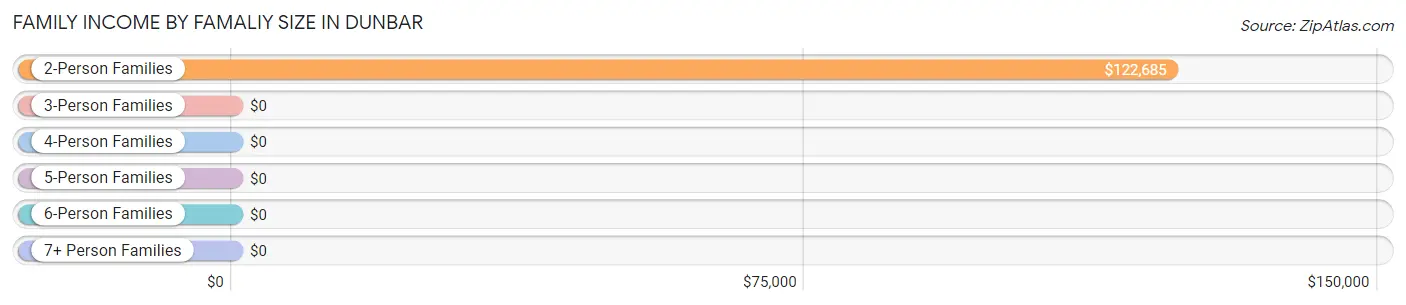
| Income Bracket | # Families | Median Income |
| 2-Person Families | 62 (86.1%) | $122,685 |
| 3-Person Families | 8 (11.1%) | $0 |
| 4-Person Families | 2 (2.8%) | $0 |
| 5-Person Families | 0 (0.0%) | $0 |
| 6-Person Families | 0 (0.0%) | $0 |
| 7+ Person Families | 0 (0.0%) | $0 |
| Total | 72 (100.0%) | $111,250 |
Family Income by Number of Earners in Dunbar
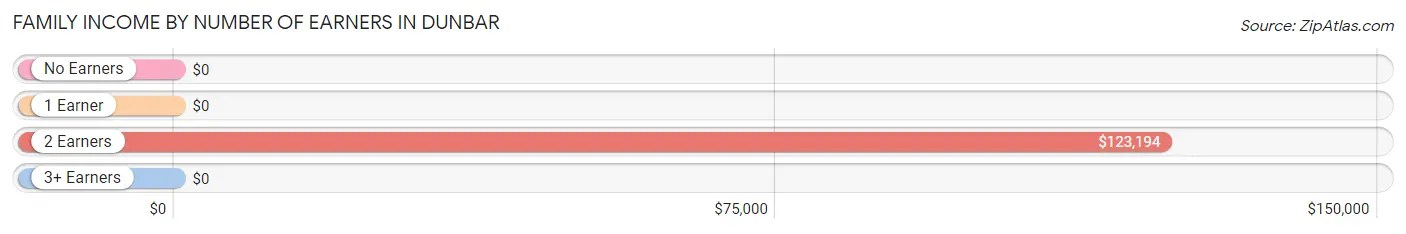
| Number of Earners | # Families | Median Income |
| No Earners | 4 (5.6%) | $0 |
| 1 Earner | 20 (27.8%) | $0 |
| 2 Earners | 43 (59.7%) | $123,194 |
| 3+ Earners | 5 (6.9%) | $0 |
| Total | 72 (100.0%) | $111,250 |
Household Income in Dunbar
Household Income Brackets in Dunbar
With 46 households falling in the category, the $100,000 to $149,999 income range is the most frequent in Dunbar, accounting for 45.1% of all households.
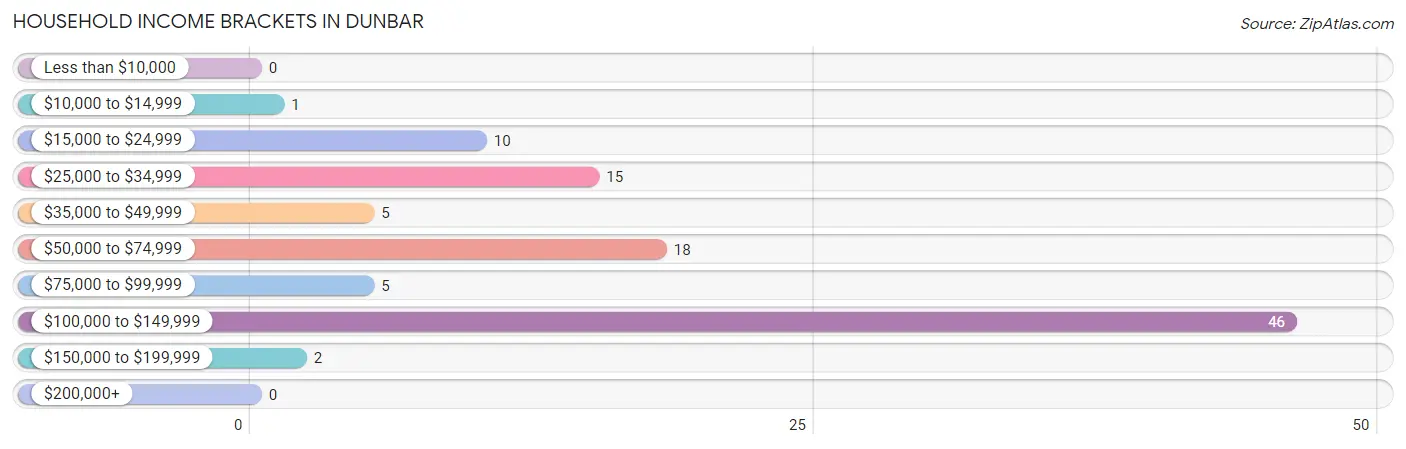
| Income Bracket | # Households | % Households |
| Less than $10,000 | 0 | 0.0% |
| $10,000 to $14,999 | 1 | 1.0% |
| $15,000 to $24,999 | 10 | 9.8% |
| $25,000 to $34,999 | 15 | 14.7% |
| $35,000 to $49,999 | 5 | 4.9% |
| $50,000 to $74,999 | 18 | 17.6% |
| $75,000 to $99,999 | 5 | 4.9% |
| $100,000 to $149,999 | 46 | 45.1% |
| $150,000 to $199,999 | 2 | 2.0% |
| $200,000+ | 0 | 0.0% |
Household Income by Householder Age in Dunbar
The median household income in Dunbar is $87,500, with the highest median household income of $111,875 found in the 45 to 64 years age bracket for the primary householder. A total of 51 households (50.0%) fall into this category. Meanwhile, the 15 to 24 years age bracket for the primary householder has the lowest median household income of $0, with 2 households (2.0%) in this group.
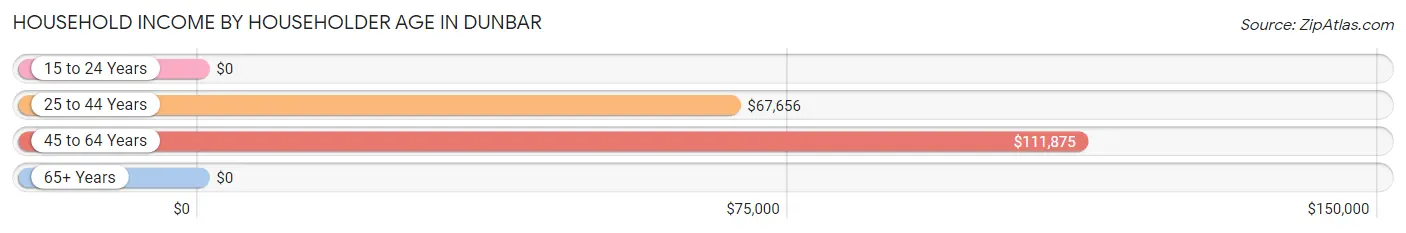
| Income Bracket | # Households | Median Income |
| 15 to 24 Years | 2 (2.0%) | $0 |
| 25 to 44 Years | 27 (26.5%) | $67,656 |
| 45 to 64 Years | 51 (50.0%) | $111,875 |
| 65+ Years | 22 (21.6%) | $0 |
| Total | 102 (100.0%) | $87,500 |
Poverty in Dunbar
Income Below Poverty by Sex and Age in Dunbar
With 5.3% poverty level for males and 6.9% for females among the residents of Dunbar, under 5 year old males and 25 to 34 year old females are the most vulnerable to poverty, with 5 males (41.7%) and 6 females (18.2%) in their respective age groups living below the poverty level.
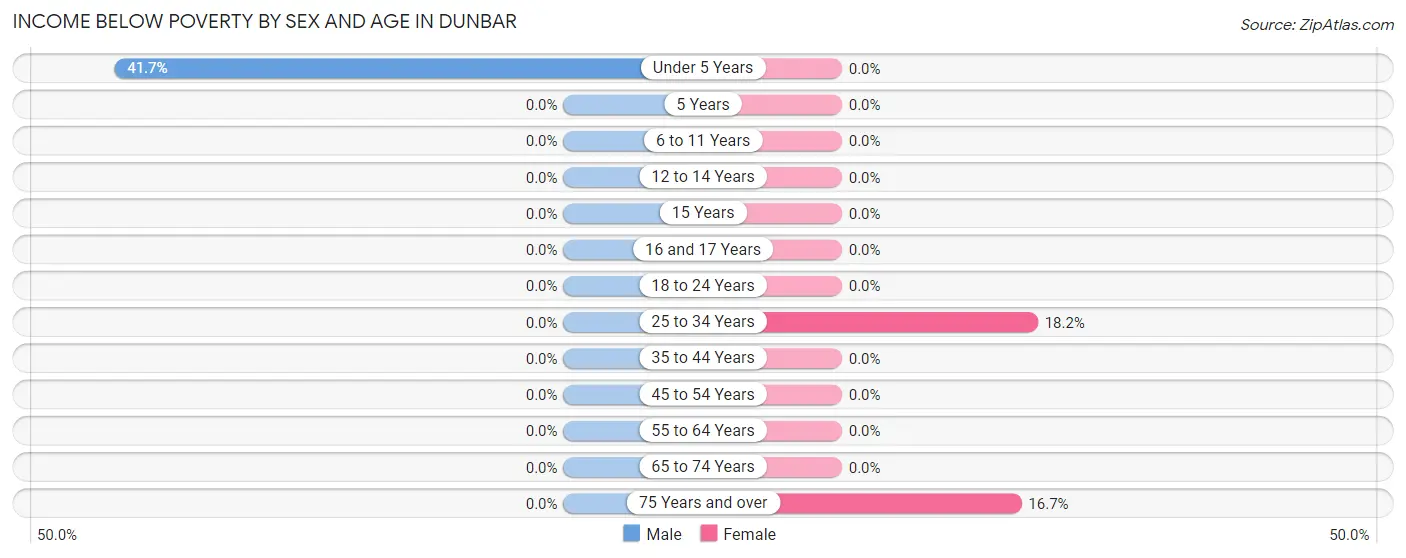
| Age Bracket | Male | Female |
| Under 5 Years | 5 (41.7%) | 0 (0.0%) |
| 5 Years | 0 (0.0%) | 0 (0.0%) |
| 6 to 11 Years | 0 (0.0%) | 0 (0.0%) |
| 12 to 14 Years | 0 (0.0%) | 0 (0.0%) |
| 15 Years | 0 (0.0%) | 0 (0.0%) |
| 16 and 17 Years | 0 (0.0%) | 0 (0.0%) |
| 18 to 24 Years | 0 (0.0%) | 0 (0.0%) |
| 25 to 34 Years | 0 (0.0%) | 6 (18.2%) |
| 35 to 44 Years | 0 (0.0%) | 0 (0.0%) |
| 45 to 54 Years | 0 (0.0%) | 0 (0.0%) |
| 55 to 64 Years | 0 (0.0%) | 0 (0.0%) |
| 65 to 74 Years | 0 (0.0%) | 0 (0.0%) |
| 75 Years and over | 0 (0.0%) | 1 (16.7%) |
| Total | 5 (5.3%) | 7 (6.9%) |
Income Above Poverty by Sex and Age in Dunbar
According to the poverty statistics in Dunbar, males aged 18 to 24 years and females aged under 5 years are the age groups that are most secure financially, with 100.0% of males and 100.0% of females in these age groups living above the poverty line.
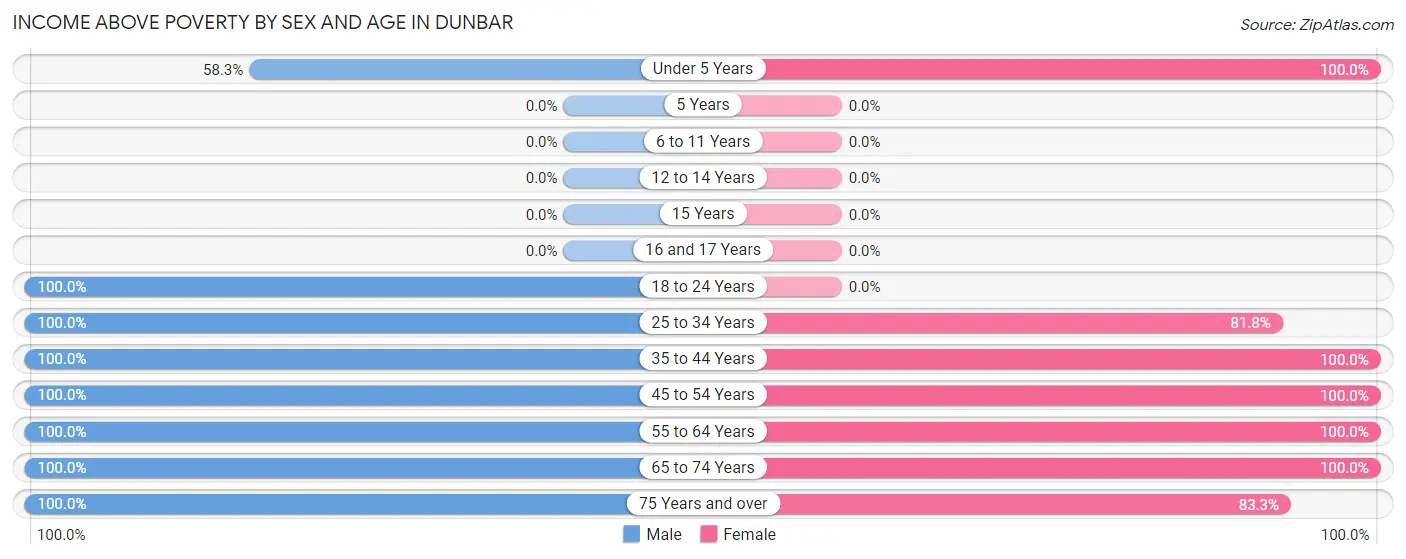
| Age Bracket | Male | Female |
| Under 5 Years | 7 (58.3%) | 2 (100.0%) |
| 5 Years | 0 (0.0%) | 0 (0.0%) |
| 6 to 11 Years | 0 (0.0%) | 0 (0.0%) |
| 12 to 14 Years | 0 (0.0%) | 0 (0.0%) |
| 15 Years | 0 (0.0%) | 0 (0.0%) |
| 16 and 17 Years | 0 (0.0%) | 0 (0.0%) |
| 18 to 24 Years | 5 (100.0%) | 0 (0.0%) |
| 25 to 34 Years | 12 (100.0%) | 27 (81.8%) |
| 35 to 44 Years | 3 (100.0%) | 2 (100.0%) |
| 45 to 54 Years | 12 (100.0%) | 13 (100.0%) |
| 55 to 64 Years | 32 (100.0%) | 35 (100.0%) |
| 65 to 74 Years | 8 (100.0%) | 10 (100.0%) |
| 75 Years and over | 10 (100.0%) | 5 (83.3%) |
| Total | 89 (94.7%) | 94 (93.1%) |
Income Below Poverty Among Married-Couple Families in Dunbar
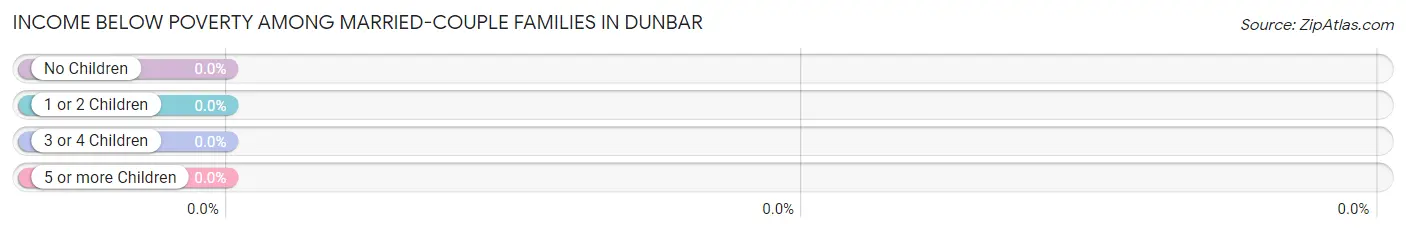
| Children | Above Poverty | Below Poverty |
| No Children | 55 (100.0%) | 0 (0.0%) |
| 1 or 2 Children | 1 (100.0%) | 0 (0.0%) |
| 3 or 4 Children | 0 (0.0%) | 0 (0.0%) |
| 5 or more Children | 0 (0.0%) | 0 (0.0%) |
| Total | 56 (100.0%) | 0 (0.0%) |
Income Below Poverty Among Single-Parent Households in Dunbar
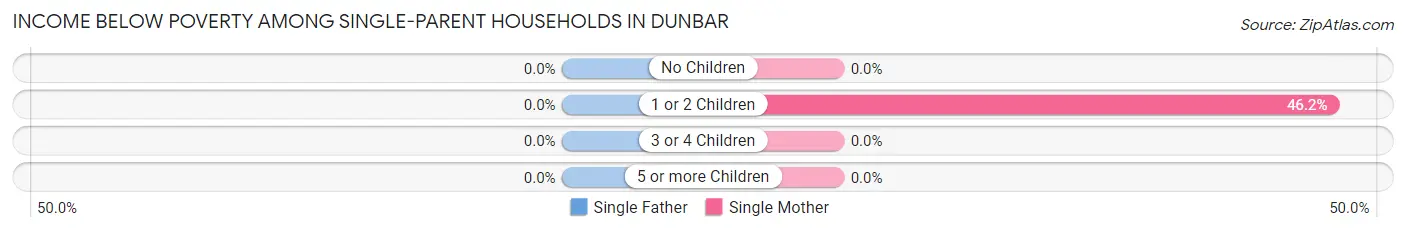
| Children | Single Father | Single Mother |
| No Children | 0 (0.0%) | 0 (0.0%) |
| 1 or 2 Children | 0 (0.0%) | 6 (46.2%) |
| 3 or 4 Children | 0 (0.0%) | 0 (0.0%) |
| 5 or more Children | 0 (0.0%) | 0 (0.0%) |
| Total | 0 (0.0%) | 6 (40.0%) |
Income Below Poverty Among Married-Couple vs Single-Parent Households in Dunbar
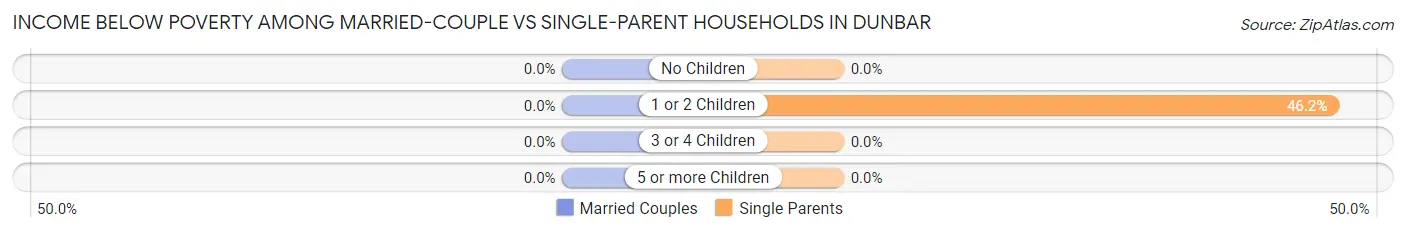
| Children | Married-Couple Families | Single-Parent Households |
| No Children | 0 (0.0%) | 0 (0.0%) |
| 1 or 2 Children | 0 (0.0%) | 6 (46.2%) |
| 3 or 4 Children | 0 (0.0%) | 0 (0.0%) |
| 5 or more Children | 0 (0.0%) | 0 (0.0%) |
| Total | 0 (0.0%) | 6 (37.5%) |
Race in Dunbar
The most populous races in Dunbar are White / Caucasian (191 | 95.0%), Hispanic or Latino (30 | 14.9%), and Some other Race (9 | 4.5%).
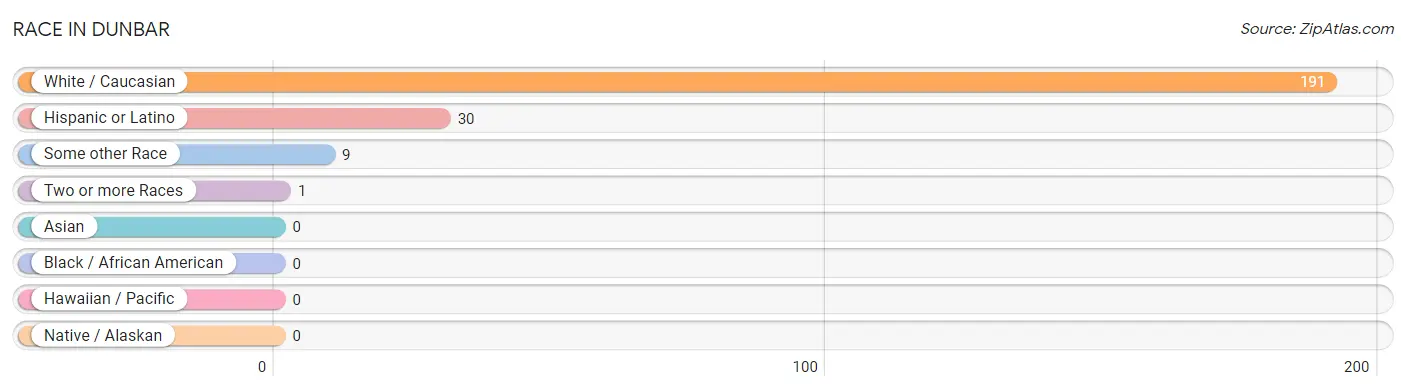
| Race | # Population | % Population |
| Asian | 0 | 0.0% |
| Black / African American | 0 | 0.0% |
| Hawaiian / Pacific | 0 | 0.0% |
| Hispanic or Latino | 30 | 14.9% |
| Native / Alaskan | 0 | 0.0% |
| White / Caucasian | 191 | 95.0% |
| Two or more Races | 1 | 0.5% |
| Some other Race | 9 | 4.5% |
| Total | 201 | 100.0% |
Ancestry in Dunbar
The most populous ancestries reported in Dunbar are German (108 | 53.7%), Irish (55 | 27.4%), Colombian (21 | 10.4%), South American (21 | 10.4%), and Italian (15 | 7.5%), together accounting for 109.5% of all Dunbar residents.
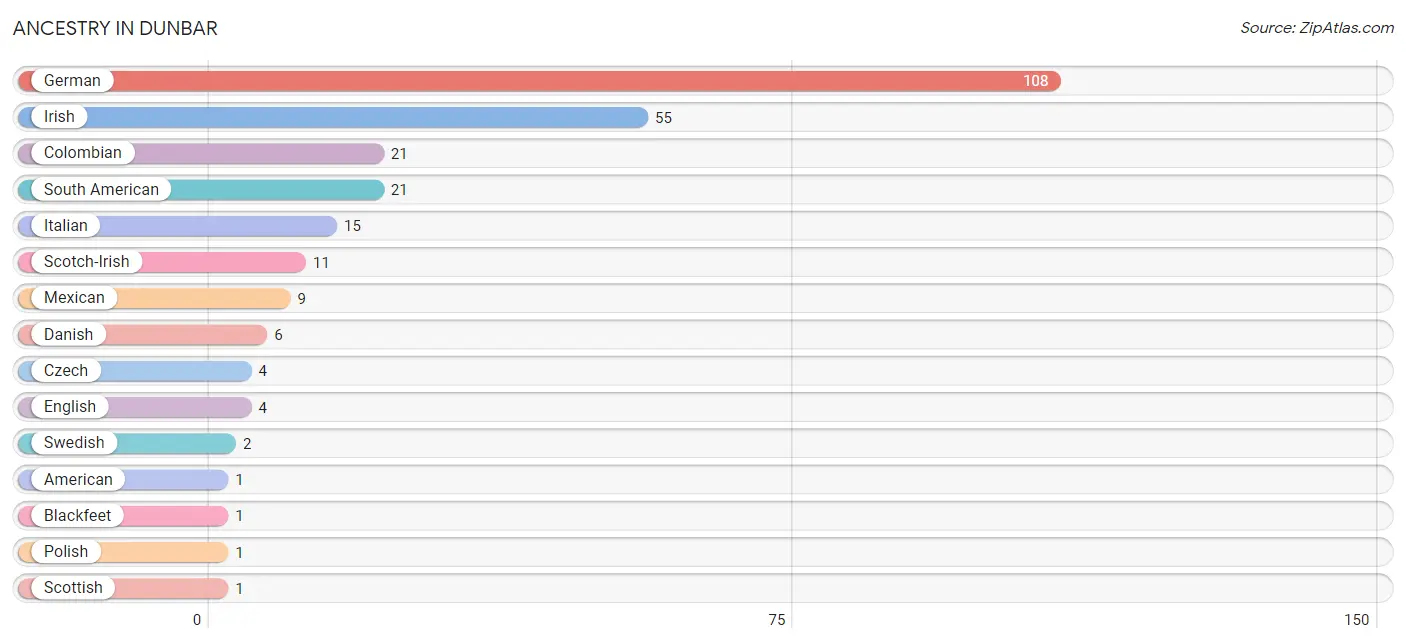
| Ancestry | # Population | % Population |
| American | 1 | 0.5% |
| Blackfeet | 1 | 0.5% |
| Colombian | 21 | 10.4% |
| Czech | 4 | 2.0% |
| Danish | 6 | 3.0% |
| English | 4 | 2.0% |
| German | 108 | 53.7% |
| Irish | 55 | 27.4% |
| Italian | 15 | 7.5% |
| Mexican | 9 | 4.5% |
| Polish | 1 | 0.5% |
| Scotch-Irish | 11 | 5.5% |
| Scottish | 1 | 0.5% |
| South American | 21 | 10.4% |
| Swedish | 2 | 1.0% | View All 15 Rows |
Immigrants in Dunbar
The most numerous immigrant groups reported in Dunbar came from Latin America (23 | 11.4%), Colombia (21 | 10.4%), South America (21 | 10.4%), Central America (2 | 1.0%), and Mexico (2 | 1.0%), together accounting for 34.3% of all Dunbar residents.
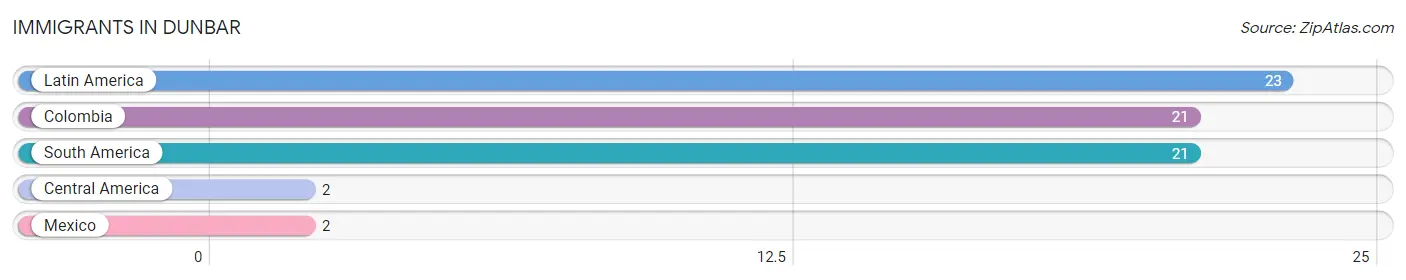
| Immigration Origin | # Population | % Population |
| Central America | 2 | 1.0% |
| Colombia | 21 | 10.4% |
| Latin America | 23 | 11.4% |
| Mexico | 2 | 1.0% |
| South America | 21 | 10.4% | View All 5 Rows |
Sex and Age in Dunbar
Sex and Age in Dunbar
The most populous age groups in Dunbar are 55 to 59 Years (21 | 21.9%) for men and 55 to 59 Years (26 | 24.8%) for women.
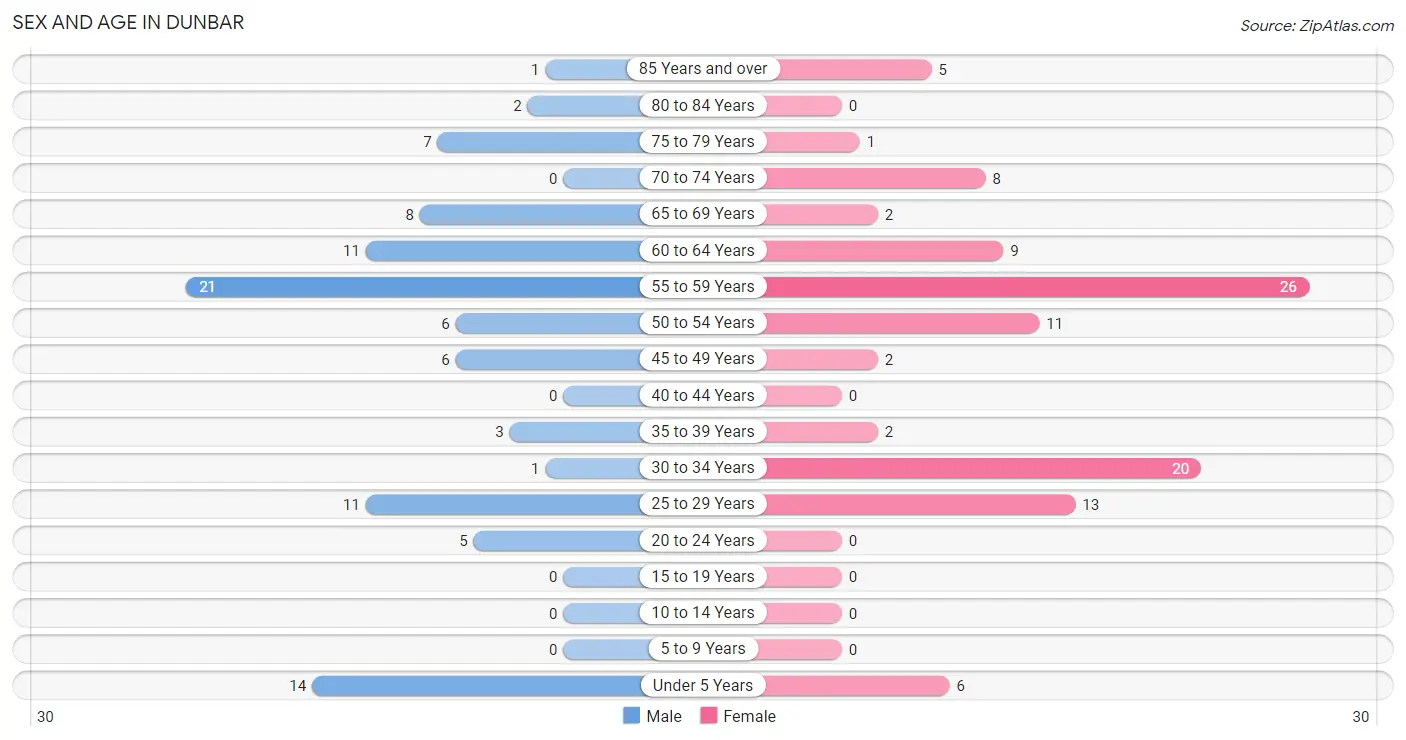
| Age Bracket | Male | Female |
| Under 5 Years | 14 (14.6%) | 6 (5.7%) |
| 5 to 9 Years | 0 (0.0%) | 0 (0.0%) |
| 10 to 14 Years | 0 (0.0%) | 0 (0.0%) |
| 15 to 19 Years | 0 (0.0%) | 0 (0.0%) |
| 20 to 24 Years | 5 (5.2%) | 0 (0.0%) |
| 25 to 29 Years | 11 (11.5%) | 13 (12.4%) |
| 30 to 34 Years | 1 (1.0%) | 20 (19.1%) |
| 35 to 39 Years | 3 (3.1%) | 2 (1.9%) |
| 40 to 44 Years | 0 (0.0%) | 0 (0.0%) |
| 45 to 49 Years | 6 (6.2%) | 2 (1.9%) |
| 50 to 54 Years | 6 (6.2%) | 11 (10.5%) |
| 55 to 59 Years | 21 (21.9%) | 26 (24.8%) |
| 60 to 64 Years | 11 (11.5%) | 9 (8.6%) |
| 65 to 69 Years | 8 (8.3%) | 2 (1.9%) |
| 70 to 74 Years | 0 (0.0%) | 8 (7.6%) |
| 75 to 79 Years | 7 (7.3%) | 1 (0.9%) |
| 80 to 84 Years | 2 (2.1%) | 0 (0.0%) |
| 85 Years and over | 1 (1.0%) | 5 (4.8%) |
| Total | 96 (100.0%) | 105 (100.0%) |
Families and Households in Dunbar
Median Family Size in Dunbar
The median family size in Dunbar is 2.19 persons per family, with single male/father families (1 | 1.4%) accounting for the largest median family size of 3 persons per family. On the other hand, single female/mother families (15 | 20.8%) represent the smallest median family size with 2.07 persons per family.
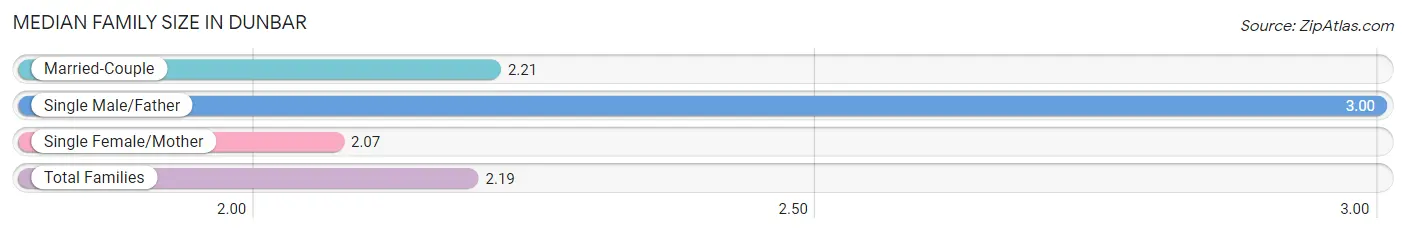
| Family Type | # Families | Family Size |
| Married-Couple | 56 (77.8%) | 2.21 |
| Single Male/Father | 1 (1.4%) | 3.00 |
| Single Female/Mother | 15 (20.8%) | 2.07 |
| Total Families | 72 (100.0%) | 2.19 |
Median Household Size in Dunbar
The median household size in Dunbar is 1.97 persons per household, with single male/father households (1 | 1.0%) accounting for the largest median household size of 3 persons per household. non-family households (30 | 29.4%) represent the smallest median household size with 1.13 persons per household.
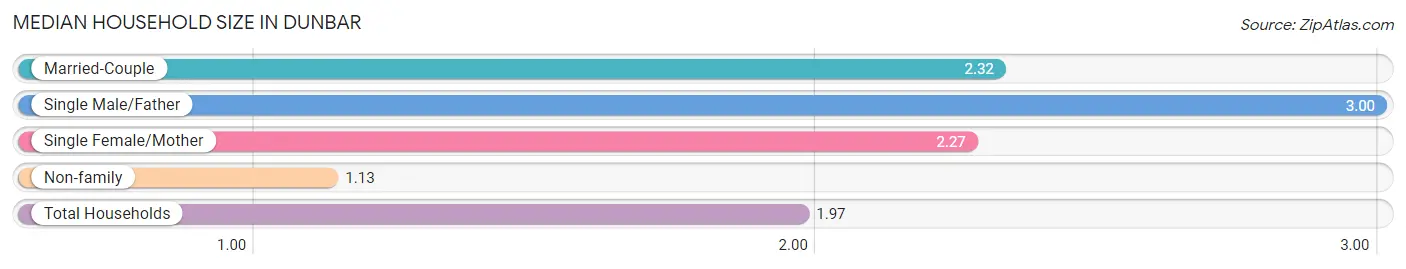
| Household Type | # Households | Household Size |
| Married-Couple | 56 (54.9%) | 2.32 |
| Single Male/Father | 1 (1.0%) | 3.00 |
| Single Female/Mother | 15 (14.7%) | 2.27 |
| Non-family | 30 (29.4%) | 1.13 |
| Total Households | 102 (100.0%) | 1.97 |
Household Size by Marriage Status in Dunbar
Out of a total of 102 households in Dunbar, 72 (70.6%) are family households, while 30 (29.4%) are nonfamily households. The most numerous type of family households are 2-person households, comprising 59, and the most common type of nonfamily households are 1-person households, comprising 28.
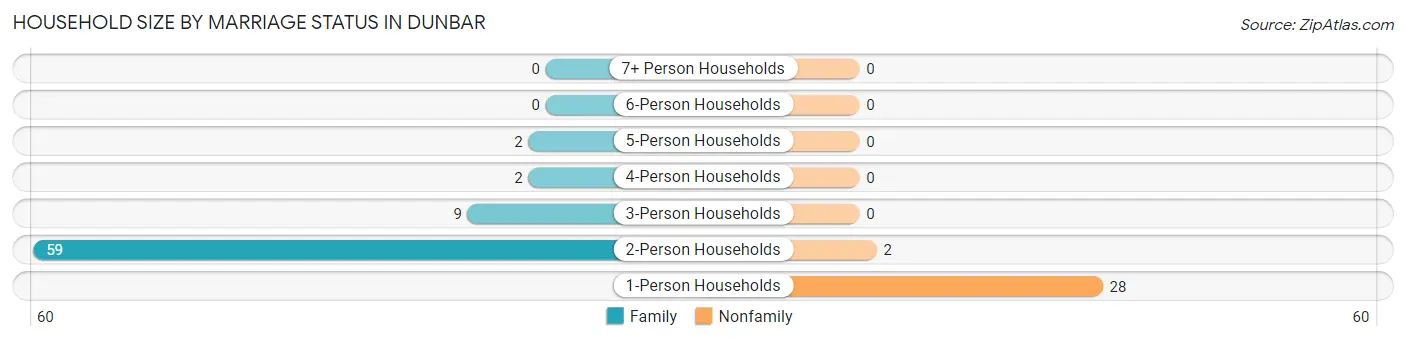
| Household Size | Family Households | Nonfamily Households |
| 1-Person Households | - | 28 (27.5%) |
| 2-Person Households | 59 (57.8%) | 2 (2.0%) |
| 3-Person Households | 9 (8.8%) | 0 (0.0%) |
| 4-Person Households | 2 (2.0%) | 0 (0.0%) |
| 5-Person Households | 2 (2.0%) | 0 (0.0%) |
| 6-Person Households | 0 (0.0%) | 0 (0.0%) |
| 7+ Person Households | 0 (0.0%) | 0 (0.0%) |
| Total | 72 (70.6%) | 30 (29.4%) |
Female Fertility in Dunbar
Fertility by Age in Dunbar
| Age Bracket | Women with Births | Births / 1,000 Women |
| 15 to 19 years | 0 (0.0%) | 0.0 |
| 20 to 34 years | 0 (0.0%) | 0.0 |
| 35 to 50 years | 0 (0.0%) | 0.0 |
| Total | 0 (0.0%) | 0.0 |
Fertility by Age by Marriage Status in Dunbar
| Age Bracket | Married | Unmarried |
| 15 to 19 years | 0 (0.0%) | 0 (0.0%) |
| 20 to 34 years | 0 (0.0%) | 0 (0.0%) |
| 35 to 50 years | 0 (0.0%) | 0 (0.0%) |
| Total | 0 (0.0%) | 0 (0.0%) |
Fertility by Education in Dunbar
| Educational Attainment | Women with Births | Births / 1,000 Women |
| Less than High School | 0 (0.0%) | 0.0 |
| High School Diploma | 0 (0.0%) | 0.0 |
| College or Associate's Degree | 0 (0.0%) | 0.0 |
| Bachelor's Degree | 0 (0.0%) | 0.0 |
| Graduate Degree | 0 (0.0%) | 0.0 |
| Total | 0 (0.0%) | 0.0 |
Fertility by Education by Marriage Status in Dunbar
| Educational Attainment | Married | Unmarried |
| Less than High School | 0 (0.0%) | 0 (0.0%) |
| High School Diploma | 0 (0.0%) | 0 (0.0%) |
| College or Associate's Degree | 0 (0.0%) | 0 (0.0%) |
| Bachelor's Degree | 0 (0.0%) | 0 (0.0%) |
| Graduate Degree | 0 (0.0%) | 0 (0.0%) |
| Total | 0 (0.0%) | 0 (0.0%) |
Employment Characteristics in Dunbar
Employment by Class of Employer in Dunbar
Among the 104 employed individuals in Dunbar, private company employees (82 | 78.8%), federal government employees (13 | 12.5%), and not-for-profit organizations (5 | 4.8%) make up the most common classes of employment.
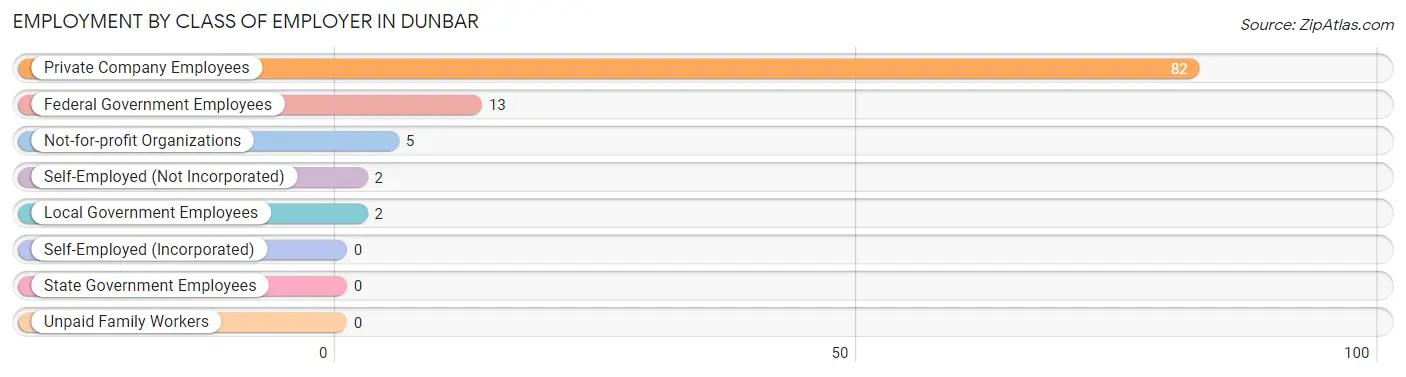
| Employer Class | # Employees | % Employees |
| Private Company Employees | 82 | 78.8% |
| Self-Employed (Incorporated) | 0 | 0.0% |
| Self-Employed (Not Incorporated) | 2 | 1.9% |
| Not-for-profit Organizations | 5 | 4.8% |
| Local Government Employees | 2 | 1.9% |
| State Government Employees | 0 | 0.0% |
| Federal Government Employees | 13 | 12.5% |
| Unpaid Family Workers | 0 | 0.0% |
| Total | 104 | 100.0% |
Employment Status by Age in Dunbar
According to the labor force statistics for Dunbar, out of the total population over 16 years of age (181), 77.9% or 141 individuals are in the labor force, with 26.2% or 37 of them unemployed. The age group with the highest labor force participation rate is 20 to 24 years, with 100.0% or 5 individuals in the labor force. Within the labor force, the 55 to 59 years age range has the highest percentage of unemployed individuals, with 55.6% or 25 of them being unemployed.
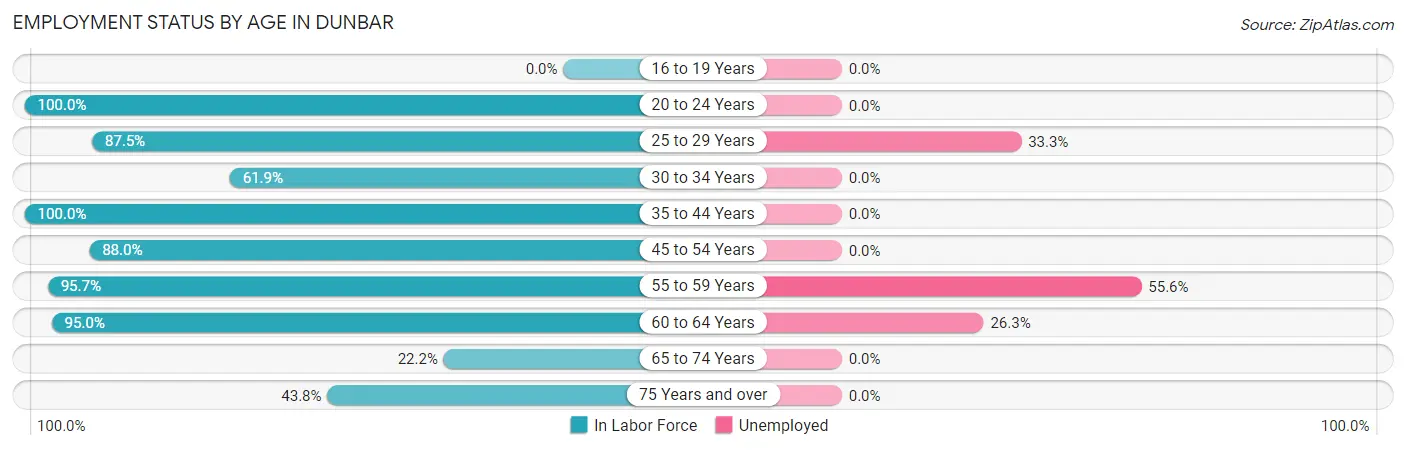
| Age Bracket | In Labor Force | Unemployed |
| 16 to 19 Years | 0 (0.0%) | 0 (0.0%) |
| 20 to 24 Years | 5 (100.0%) | 0 (0.0%) |
| 25 to 29 Years | 21 (87.5%) | 7 (33.3%) |
| 30 to 34 Years | 13 (61.9%) | 0 (0.0%) |
| 35 to 44 Years | 5 (100.0%) | 0 (0.0%) |
| 45 to 54 Years | 22 (88.0%) | 0 (0.0%) |
| 55 to 59 Years | 45 (95.7%) | 25 (55.6%) |
| 60 to 64 Years | 19 (95.0%) | 5 (26.3%) |
| 65 to 74 Years | 4 (22.2%) | 0 (0.0%) |
| 75 Years and over | 7 (43.8%) | 0 (0.0%) |
| Total | 141 (77.9%) | 37 (26.2%) |
Employment Status by Educational Attainment in Dunbar
According to labor force statistics for Dunbar, 88.0% of individuals (125) out of the total population between 25 and 64 years of age (142) are in the labor force, with 29.6% or 37 of them being unemployed. The group with the highest labor force participation rate are those with the educational attainment of less than high school, with 100.0% or 3 individuals in the labor force. Within the labor force, individuals with high school diploma education have the highest percentage of unemployment, with 50.7% or 37 of them being unemployed.
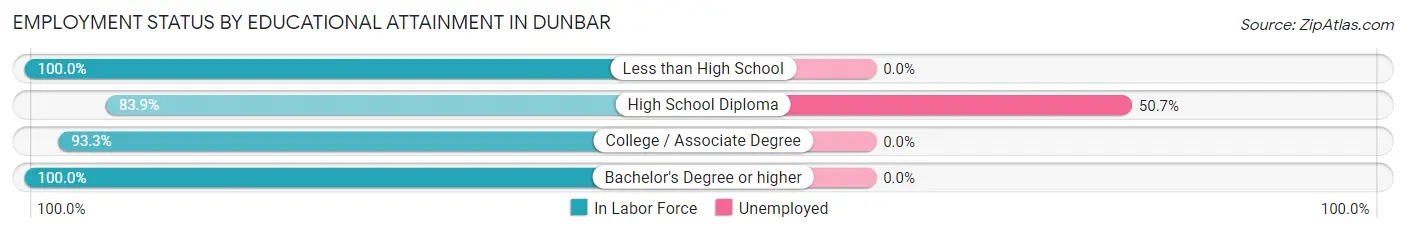
| Educational Attainment | In Labor Force | Unemployed |
| Less than High School | 3 (100.0%) | 0 (0.0%) |
| High School Diploma | 73 (83.9%) | 44 (50.7%) |
| College / Associate Degree | 42 (93.3%) | 0 (0.0%) |
| Bachelor's Degree or higher | 7 (100.0%) | 0 (0.0%) |
| Total | 125 (88.0%) | 42 (29.6%) |
Employment Occupations by Sex in Dunbar
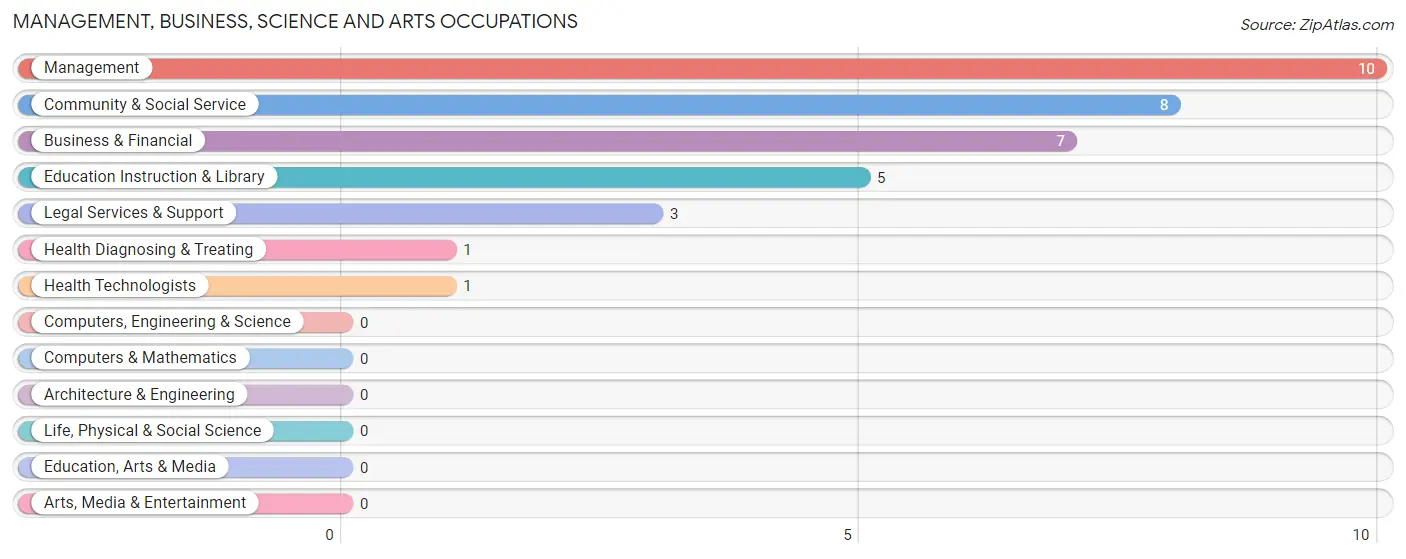
Management, Business, Science and Arts Occupations
The most common Management, Business, Science and Arts occupations in Dunbar are Management (10 | 9.6%), Community & Social Service (8 | 7.7%), Business & Financial (7 | 6.7%), Education Instruction & Library (5 | 4.8%), and Legal Services & Support (3 | 2.9%).
Management, Business, Science and Arts Occupations by Sex
Within the Management, Business, Science and Arts occupations in Dunbar, the most male-oriented occupations are Health Diagnosing & Treating (100.0%), Health Technologists (100.0%), and Management (80.0%), while the most female-oriented occupations are Business & Financial (100.0%), Community & Social Service (100.0%), and Legal Services & Support (100.0%).
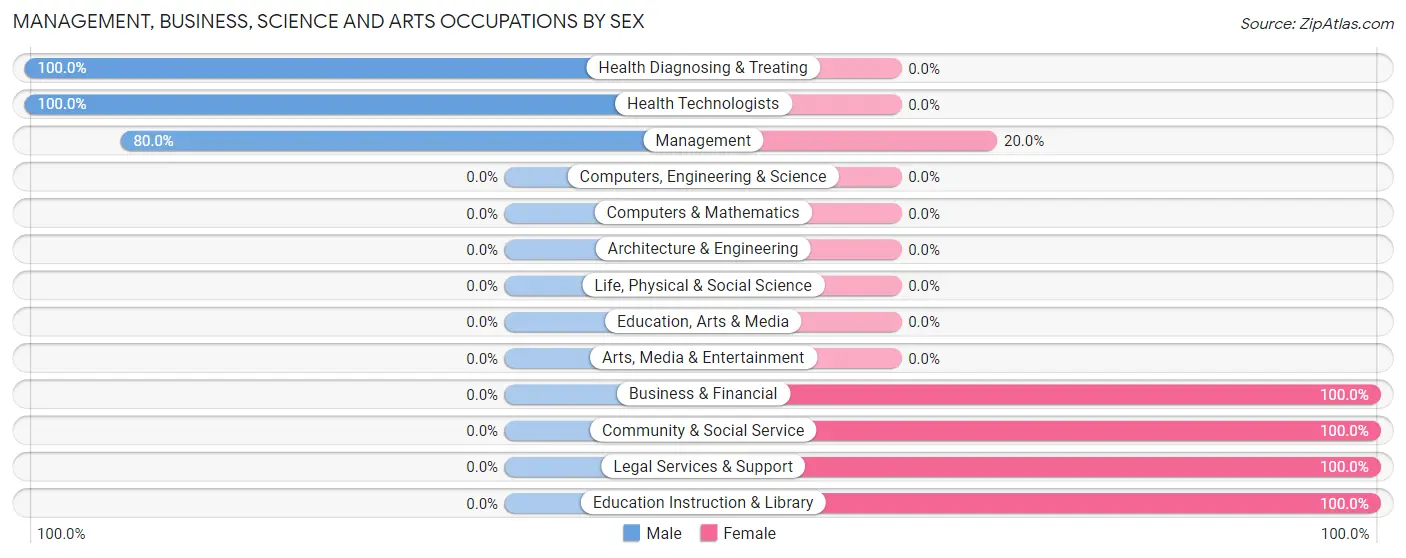
| Occupation | Male | Female |
| Management | 8 (80.0%) | 2 (20.0%) |
| Business & Financial | 0 (0.0%) | 7 (100.0%) |
| Computers, Engineering & Science | 0 (0.0%) | 0 (0.0%) |
| Computers & Mathematics | 0 (0.0%) | 0 (0.0%) |
| Architecture & Engineering | 0 (0.0%) | 0 (0.0%) |
| Life, Physical & Social Science | 0 (0.0%) | 0 (0.0%) |
| Community & Social Service | 0 (0.0%) | 8 (100.0%) |
| Education, Arts & Media | 0 (0.0%) | 0 (0.0%) |
| Legal Services & Support | 0 (0.0%) | 3 (100.0%) |
| Education Instruction & Library | 0 (0.0%) | 5 (100.0%) |
| Arts, Media & Entertainment | 0 (0.0%) | 0 (0.0%) |
| Health Diagnosing & Treating | 1 (100.0%) | 0 (0.0%) |
| Health Technologists | 1 (100.0%) | 0 (0.0%) |
| Total (Category) | 9 (34.6%) | 17 (65.4%) |
| Total (Overall) | 67 (64.4%) | 37 (35.6%) |
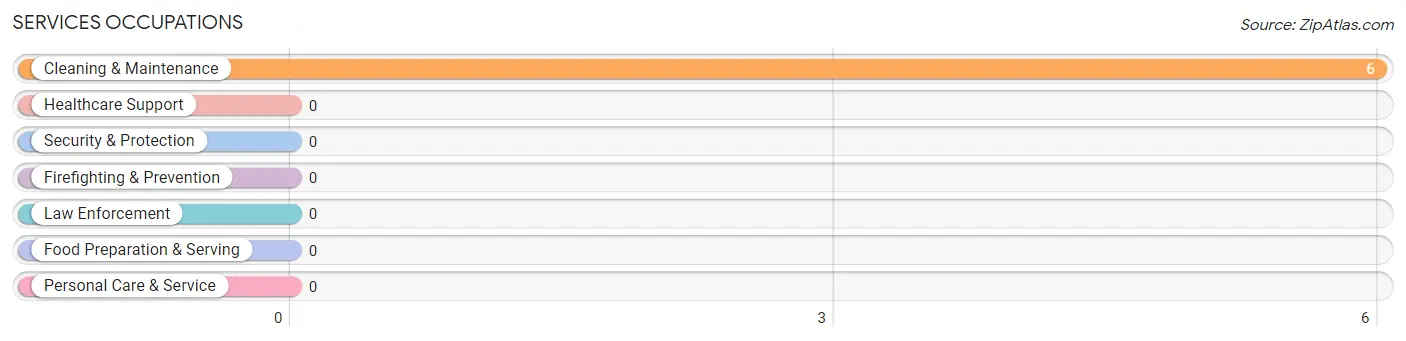
Services Occupations
The most common Services occupations in Dunbar are , and Cleaning & Maintenance (6 | 5.8%).
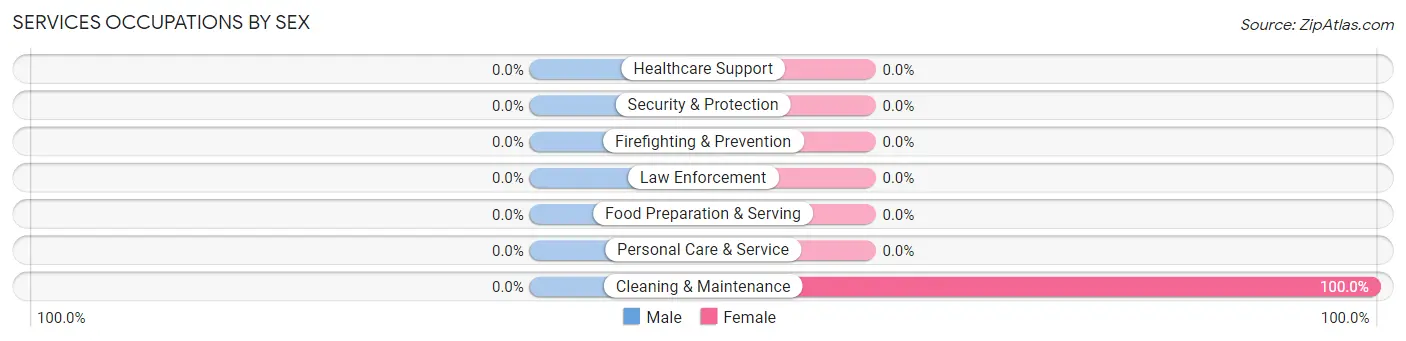
Services Occupations by Sex
| Occupation | Male | Female |
| Healthcare Support | 0 (0.0%) | 0 (0.0%) |
| Security & Protection | 0 (0.0%) | 0 (0.0%) |
| Firefighting & Prevention | 0 (0.0%) | 0 (0.0%) |
| Law Enforcement | 0 (0.0%) | 0 (0.0%) |
| Food Preparation & Serving | 0 (0.0%) | 0 (0.0%) |
| Cleaning & Maintenance | 0 (0.0%) | 6 (100.0%) |
| Personal Care & Service | 0 (0.0%) | 0 (0.0%) |
| Total (Category) | 0 (0.0%) | 6 (100.0%) |
| Total (Overall) | 67 (64.4%) | 37 (35.6%) |
Sales and Office Occupations
The most common Sales and Office occupations in Dunbar are Sales & Related (3 | 2.9%), and Office & Administration (2 | 1.9%).
Sales and Office Occupations by Sex
| Occupation | Male | Female |
| Sales & Related | 3 (100.0%) | 0 (0.0%) |
| Office & Administration | 2 (100.0%) | 0 (0.0%) |
| Total (Category) | 5 (100.0%) | 0 (0.0%) |
| Total (Overall) | 67 (64.4%) | 37 (35.6%) |
Natural Resources, Construction and Maintenance Occupations
The most common Natural Resources, Construction and Maintenance occupations in Dunbar are Construction & Extraction (21 | 20.2%), Farming, Fishing & Forestry (13 | 12.5%), and Installation, Maintenance & Repair (9 | 8.6%).
Natural Resources, Construction and Maintenance Occupations by Sex
| Occupation | Male | Female |
| Farming, Fishing & Forestry | 2 (15.4%) | 11 (84.6%) |
| Construction & Extraction | 20 (95.2%) | 1 (4.8%) |
| Installation, Maintenance & Repair | 9 (100.0%) | 0 (0.0%) |
| Total (Category) | 31 (72.1%) | 12 (27.9%) |
| Total (Overall) | 67 (64.4%) | 37 (35.6%) |
Production, Transportation and Moving Occupations
The most common Production, Transportation and Moving occupations in Dunbar are Production (16 | 15.4%), Material Moving (5 | 4.8%), and Transportation (3 | 2.9%).
Production, Transportation and Moving Occupations by Sex
| Occupation | Male | Female |
| Production | 14 (87.5%) | 2 (12.5%) |
| Transportation | 3 (100.0%) | 0 (0.0%) |
| Material Moving | 5 (100.0%) | 0 (0.0%) |
| Total (Category) | 22 (91.7%) | 2 (8.3%) |
| Total (Overall) | 67 (64.4%) | 37 (35.6%) |
Employment Industries by Sex in Dunbar
Employment Industries in Dunbar
The major employment industries in Dunbar include Mining, Quarrying, & Extraction (19 | 18.3%), Manufacturing (16 | 15.4%), Public Administration (11 | 10.6%), Health Care & Social Assistance (10 | 9.6%), and Construction (7 | 6.7%).
Employment Industries by Sex in Dunbar
The Dunbar industries that see more men than women are Agriculture, Fishing & Hunting (100.0%), Mining, Quarrying, & Extraction (100.0%), and Construction (100.0%), whereas the industries that tend to have a higher number of women are Finance & Insurance (100.0%), Professional & Scientific (100.0%), and Educational Services (100.0%).
| Industry | Male | Female |
| Agriculture, Fishing & Hunting | 4 (100.0%) | 0 (0.0%) |
| Mining, Quarrying, & Extraction | 19 (100.0%) | 0 (0.0%) |
| Construction | 7 (100.0%) | 0 (0.0%) |
| Manufacturing | 14 (87.5%) | 2 (12.5%) |
| Wholesale Trade | 1 (100.0%) | 0 (0.0%) |
| Retail Trade | 3 (100.0%) | 0 (0.0%) |
| Transportation & Warehousing | 6 (100.0%) | 0 (0.0%) |
| Utilities | 0 (0.0%) | 0 (0.0%) |
| Information | 0 (0.0%) | 0 (0.0%) |
| Finance & Insurance | 0 (0.0%) | 3 (100.0%) |
| Real Estate, Rental & Leasing | 0 (0.0%) | 0 (0.0%) |
| Professional & Scientific | 0 (0.0%) | 2 (100.0%) |
| Enterprise Management | 0 (0.0%) | 0 (0.0%) |
| Administrative & Support | 4 (100.0%) | 0 (0.0%) |
| Educational Services | 0 (0.0%) | 4 (100.0%) |
| Health Care & Social Assistance | 1 (10.0%) | 9 (90.0%) |
| Arts, Entertainment & Recreation | 0 (0.0%) | 0 (0.0%) |
| Accommodation & Food Services | 0 (0.0%) | 6 (100.0%) |
| Public Administration | 0 (0.0%) | 11 (100.0%) |
| Total | 67 (64.4%) | 37 (35.6%) |
Education in Dunbar
School Enrollment in Dunbar
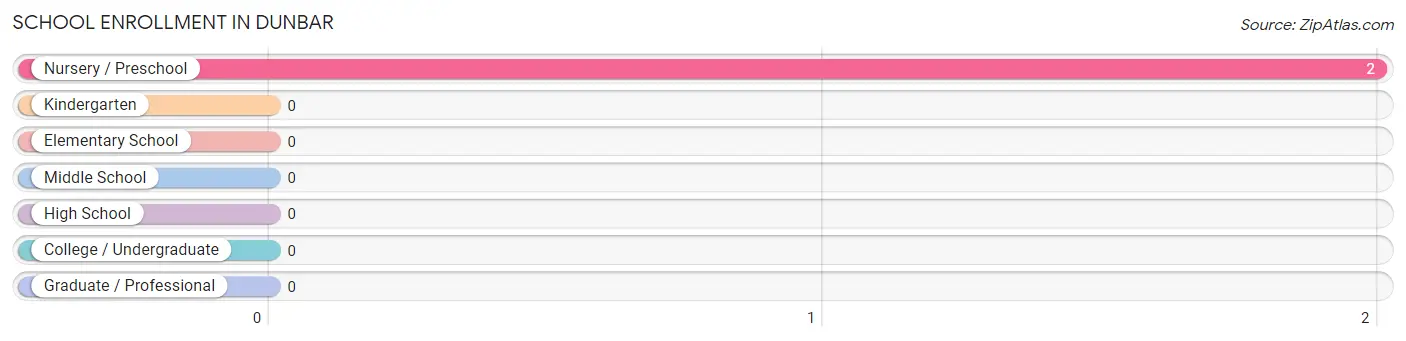
| School Level | # Students | % Students |
| Nursery / Preschool | 2 | 100.0% |
| Kindergarten | 0 | 0.0% |
| Elementary School | 0 | 0.0% |
| Middle School | 0 | 0.0% |
| High School | 0 | 0.0% |
| College / Undergraduate | 0 | 0.0% |
| Graduate / Professional | 0 | 0.0% |
| Total | 2 | 100.0% |
School Enrollment by Age by Funding Source in Dunbar
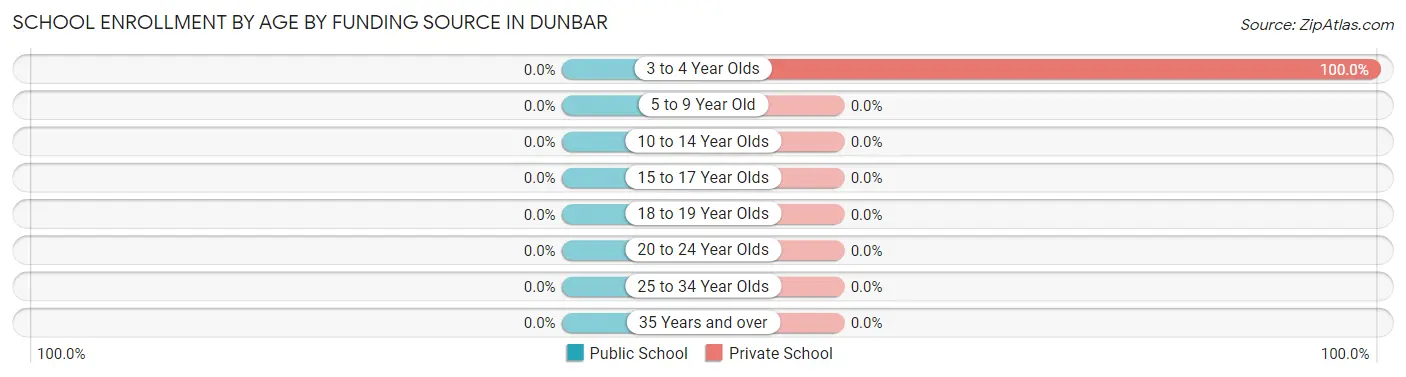
| Age Bracket | Public School | Private School |
| 3 to 4 Year Olds | 0 (0.0%) | 2 (100.0%) |
| 5 to 9 Year Old | 0 (0.0%) | 0 (0.0%) |
| 10 to 14 Year Olds | 0 (0.0%) | 0 (0.0%) |
| 15 to 17 Year Olds | 0 (0.0%) | 0 (0.0%) |
| 18 to 19 Year Olds | 0 (0.0%) | 0 (0.0%) |
| 20 to 24 Year Olds | 0 (0.0%) | 0 (0.0%) |
| 25 to 34 Year Olds | 0 (0.0%) | 0 (0.0%) |
| 35 Years and over | 0 (0.0%) | 0 (0.0%) |
| Total | 0 (0.0%) | 2 (100.0%) |
Educational Attainment by Field of Study in Dunbar
Business (5 | 55.6%), bio, nature & agricultural (2 | 22.2%), and social sciences (2 | 22.2%) are the most common fields of study among 9 individuals in Dunbar who have obtained a bachelor's degree or higher.
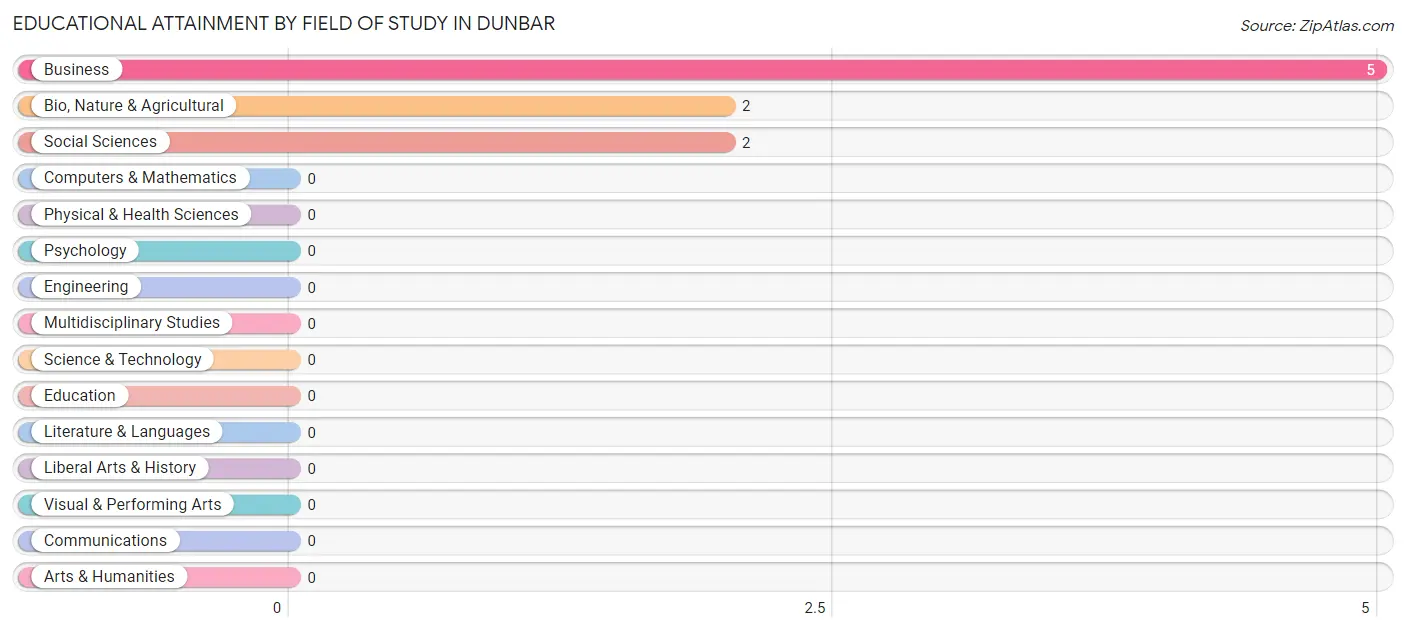
| Field of Study | # Graduates | % Graduates |
| Computers & Mathematics | 0 | 0.0% |
| Bio, Nature & Agricultural | 2 | 22.2% |
| Physical & Health Sciences | 0 | 0.0% |
| Psychology | 0 | 0.0% |
| Social Sciences | 2 | 22.2% |
| Engineering | 0 | 0.0% |
| Multidisciplinary Studies | 0 | 0.0% |
| Science & Technology | 0 | 0.0% |
| Business | 5 | 55.6% |
| Education | 0 | 0.0% |
| Literature & Languages | 0 | 0.0% |
| Liberal Arts & History | 0 | 0.0% |
| Visual & Performing Arts | 0 | 0.0% |
| Communications | 0 | 0.0% |
| Arts & Humanities | 0 | 0.0% |
| Total | 9 | 100.0% |
Transportation & Commute in Dunbar
Vehicle Availability by Sex in Dunbar
The most prevalent vehicle ownership categories in Dunbar are males with 4 vehicles (29, accounting for 43.3%) and females with 4 vehicles (11, making up 78.4%).
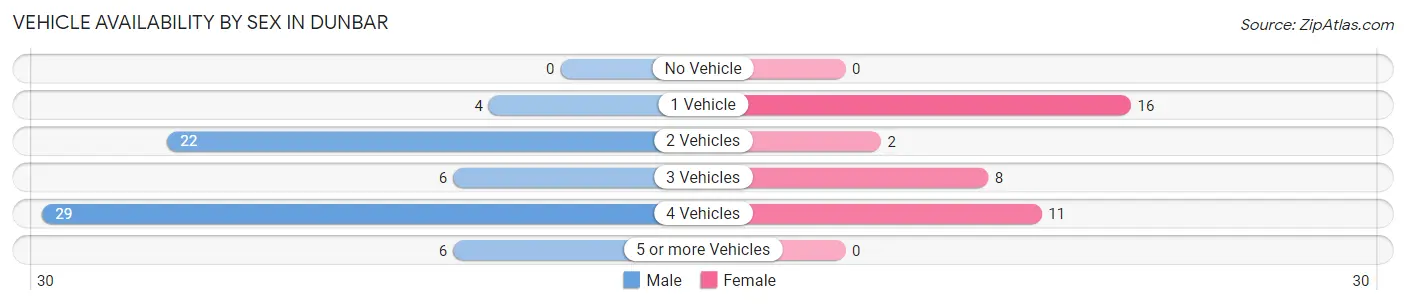
| Vehicles Available | Male | Female |
| No Vehicle | 0 (0.0%) | 0 (0.0%) |
| 1 Vehicle | 4 (6.0%) | 16 (43.2%) |
| 2 Vehicles | 22 (32.8%) | 2 (5.4%) |
| 3 Vehicles | 6 (9.0%) | 8 (21.6%) |
| 4 Vehicles | 29 (43.3%) | 11 (29.7%) |
| 5 or more Vehicles | 6 (9.0%) | 0 (0.0%) |
| Total | 67 (100.0%) | 37 (100.0%) |
Commute Time in Dunbar
The most frequently occuring commute durations in Dunbar are 10 to 14 minutes (21 commuters, 20.2%), 30 to 34 minutes (19 commuters, 18.3%), and 45 to 59 minutes (15 commuters, 14.4%).
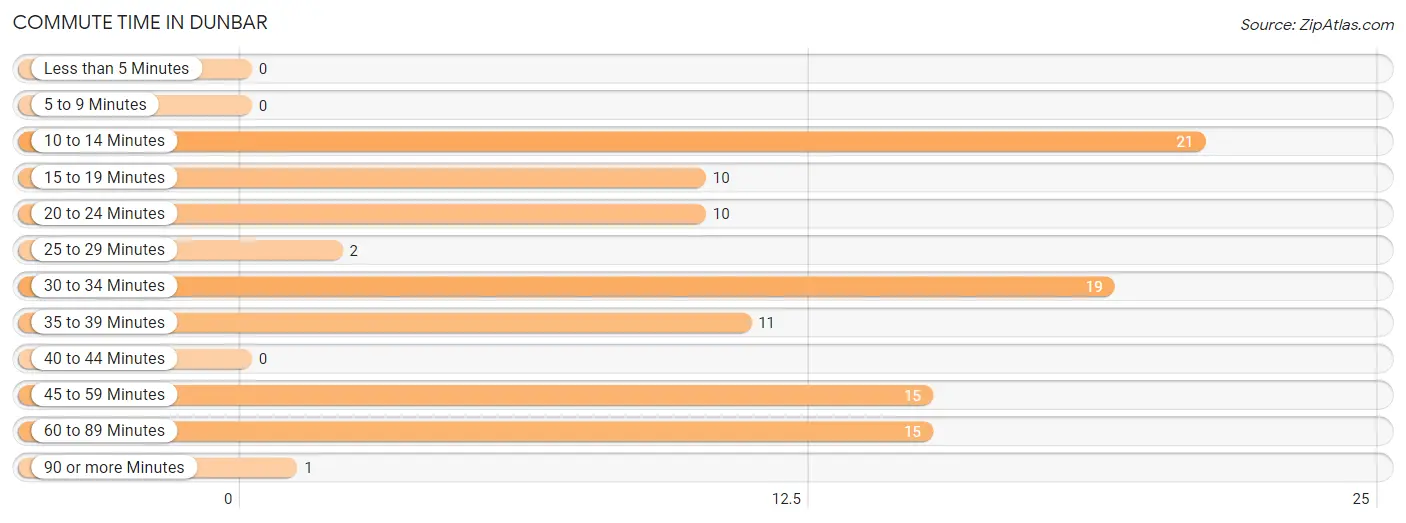
| Commute Time | # Commuters | % Commuters |
| Less than 5 Minutes | 0 | 0.0% |
| 5 to 9 Minutes | 0 | 0.0% |
| 10 to 14 Minutes | 21 | 20.2% |
| 15 to 19 Minutes | 10 | 9.6% |
| 20 to 24 Minutes | 10 | 9.6% |
| 25 to 29 Minutes | 2 | 1.9% |
| 30 to 34 Minutes | 19 | 18.3% |
| 35 to 39 Minutes | 11 | 10.6% |
| 40 to 44 Minutes | 0 | 0.0% |
| 45 to 59 Minutes | 15 | 14.4% |
| 60 to 89 Minutes | 15 | 14.4% |
| 90 or more Minutes | 1 | 1.0% |
Commute Time by Sex in Dunbar
The most common commute times in Dunbar are 30 to 34 minutes (19 commuters, 28.4%) for males and 10 to 14 minutes (12 commuters, 32.4%) for females.
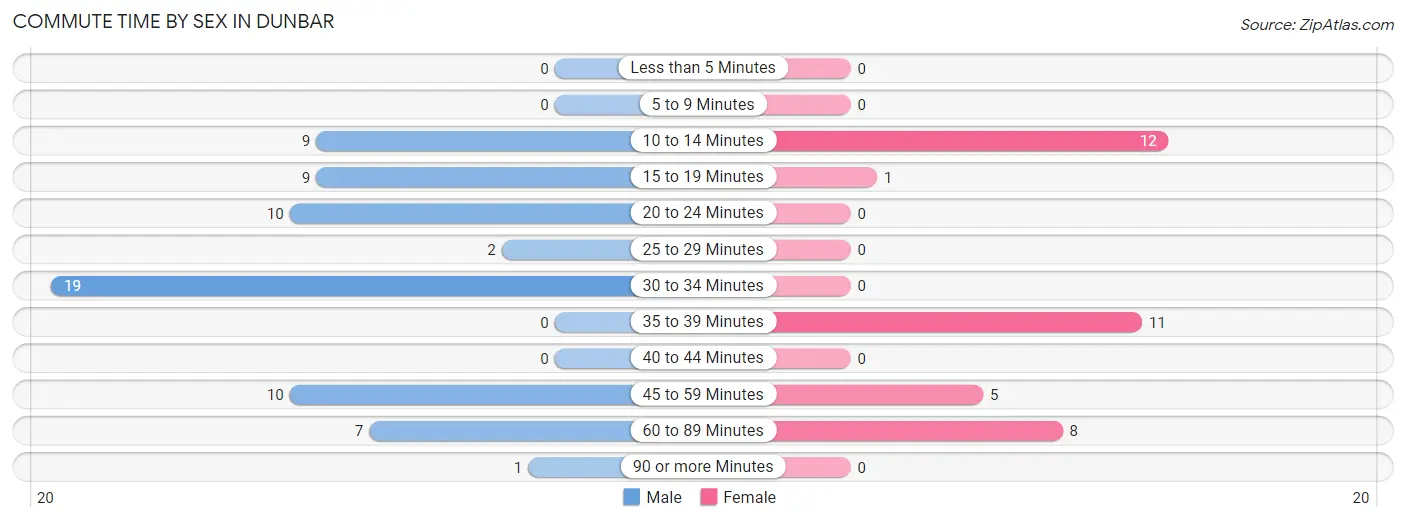
| Commute Time | Male | Female |
| Less than 5 Minutes | 0 (0.0%) | 0 (0.0%) |
| 5 to 9 Minutes | 0 (0.0%) | 0 (0.0%) |
| 10 to 14 Minutes | 9 (13.4%) | 12 (32.4%) |
| 15 to 19 Minutes | 9 (13.4%) | 1 (2.7%) |
| 20 to 24 Minutes | 10 (14.9%) | 0 (0.0%) |
| 25 to 29 Minutes | 2 (3.0%) | 0 (0.0%) |
| 30 to 34 Minutes | 19 (28.4%) | 0 (0.0%) |
| 35 to 39 Minutes | 0 (0.0%) | 11 (29.7%) |
| 40 to 44 Minutes | 0 (0.0%) | 0 (0.0%) |
| 45 to 59 Minutes | 10 (14.9%) | 5 (13.5%) |
| 60 to 89 Minutes | 7 (10.4%) | 8 (21.6%) |
| 90 or more Minutes | 1 (1.5%) | 0 (0.0%) |
Time of Departure to Work by Sex in Dunbar
The most frequent times of departure to work in Dunbar are 4:00 PM to 11:59 PM (37, 55.2%) for males and 12:00 AM to 4:59 AM (11, 29.7%) for females.
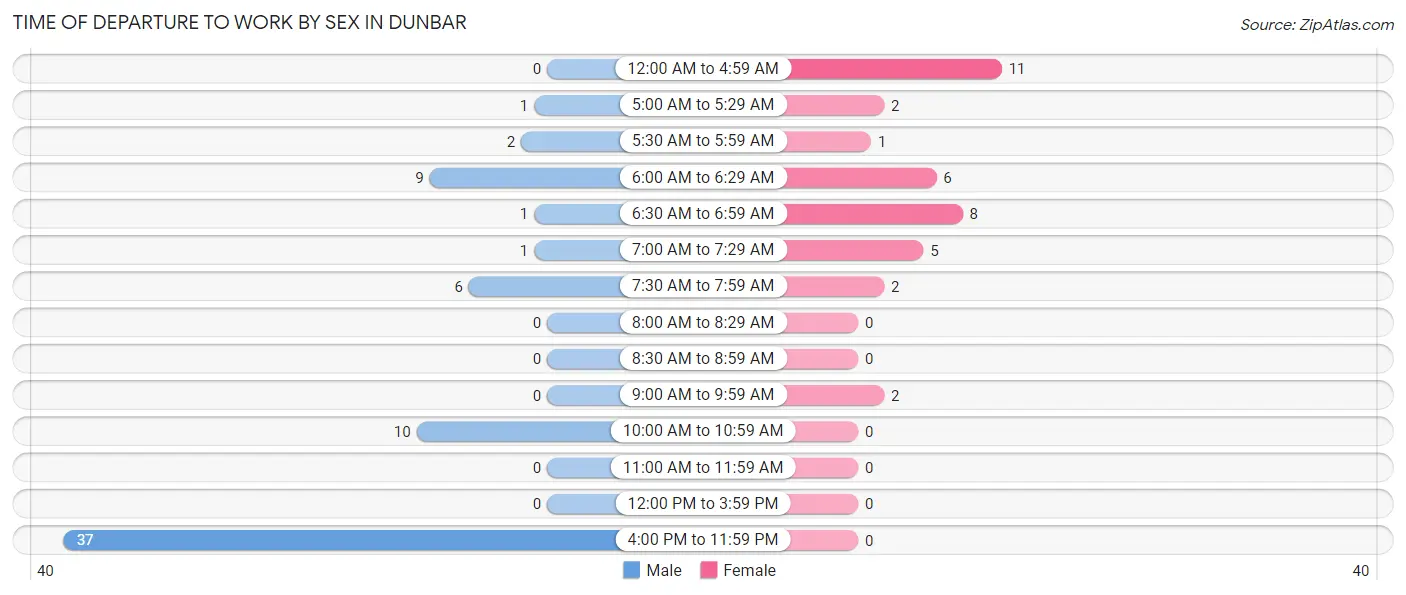
| Time of Departure | Male | Female |
| 12:00 AM to 4:59 AM | 0 (0.0%) | 11 (29.7%) |
| 5:00 AM to 5:29 AM | 1 (1.5%) | 2 (5.4%) |
| 5:30 AM to 5:59 AM | 2 (3.0%) | 1 (2.7%) |
| 6:00 AM to 6:29 AM | 9 (13.4%) | 6 (16.2%) |
| 6:30 AM to 6:59 AM | 1 (1.5%) | 8 (21.6%) |
| 7:00 AM to 7:29 AM | 1 (1.5%) | 5 (13.5%) |
| 7:30 AM to 7:59 AM | 6 (9.0%) | 2 (5.4%) |
| 8:00 AM to 8:29 AM | 0 (0.0%) | 0 (0.0%) |
| 8:30 AM to 8:59 AM | 0 (0.0%) | 0 (0.0%) |
| 9:00 AM to 9:59 AM | 0 (0.0%) | 2 (5.4%) |
| 10:00 AM to 10:59 AM | 10 (14.9%) | 0 (0.0%) |
| 11:00 AM to 11:59 AM | 0 (0.0%) | 0 (0.0%) |
| 12:00 PM to 3:59 PM | 0 (0.0%) | 0 (0.0%) |
| 4:00 PM to 11:59 PM | 37 (55.2%) | 0 (0.0%) |
| Total | 67 (100.0%) | 37 (100.0%) |
Housing Occupancy in Dunbar
Occupancy by Ownership in Dunbar
Of the total 102 dwellings in Dunbar, owner-occupied units account for 80 (78.4%), while renter-occupied units make up 22 (21.6%).
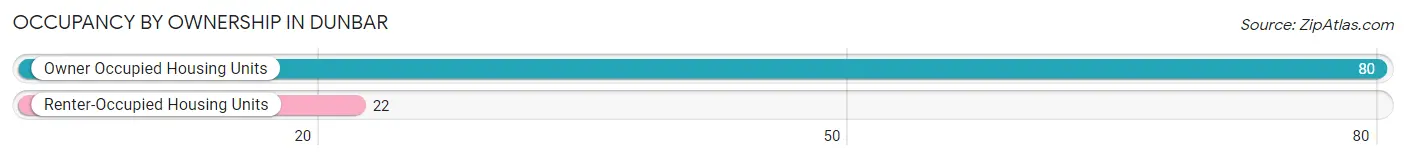
| Occupancy | # Housing Units | % Housing Units |
| Owner Occupied Housing Units | 80 | 78.4% |
| Renter-Occupied Housing Units | 22 | 21.6% |
| Total Occupied Housing Units | 102 | 100.0% |
Occupancy by Household Size in Dunbar
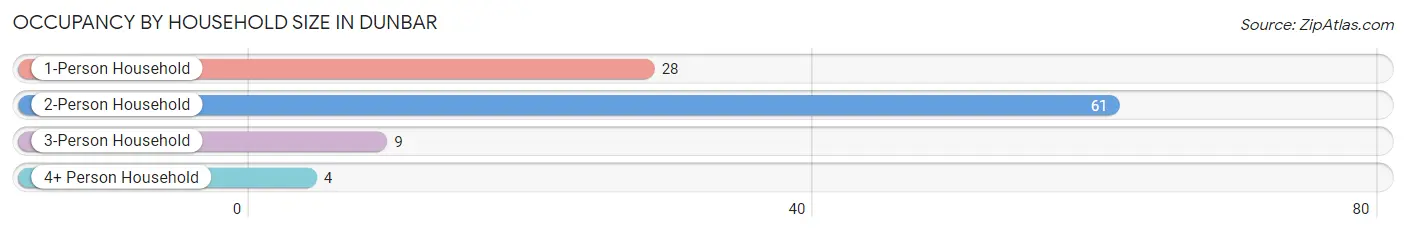
| Household Size | # Housing Units | % Housing Units |
| 1-Person Household | 28 | 27.5% |
| 2-Person Household | 61 | 59.8% |
| 3-Person Household | 9 | 8.8% |
| 4+ Person Household | 4 | 3.9% |
| Total Housing Units | 102 | 100.0% |
Occupancy by Ownership by Household Size in Dunbar
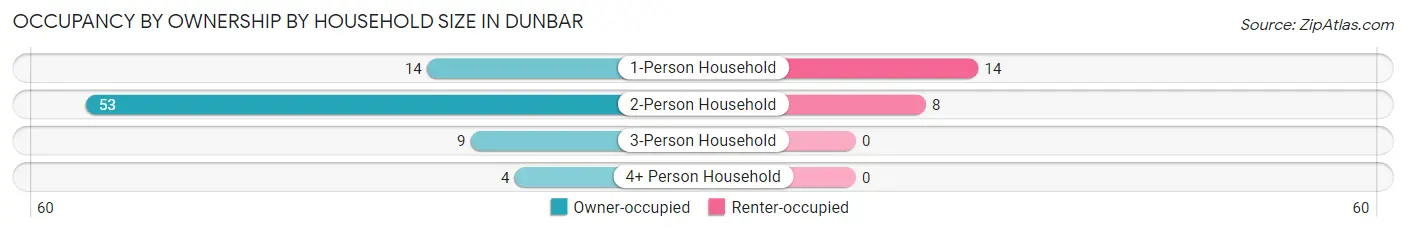
| Household Size | Owner-occupied | Renter-occupied |
| 1-Person Household | 14 (50.0%) | 14 (50.0%) |
| 2-Person Household | 53 (86.9%) | 8 (13.1%) |
| 3-Person Household | 9 (100.0%) | 0 (0.0%) |
| 4+ Person Household | 4 (100.0%) | 0 (0.0%) |
| Total Housing Units | 80 (78.4%) | 22 (21.6%) |
Occupancy by Educational Attainment in Dunbar
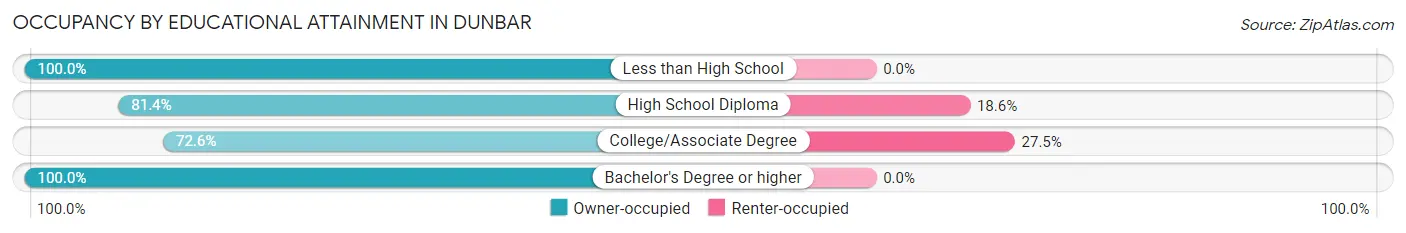
| Household Size | Owner-occupied | Renter-occupied |
| Less than High School | 3 (100.0%) | 0 (0.0%) |
| High School Diploma | 35 (81.4%) | 8 (18.6%) |
| College/Associate Degree | 37 (72.6%) | 14 (27.5%) |
| Bachelor's Degree or higher | 5 (100.0%) | 0 (0.0%) |
Occupancy by Age of Householder in Dunbar
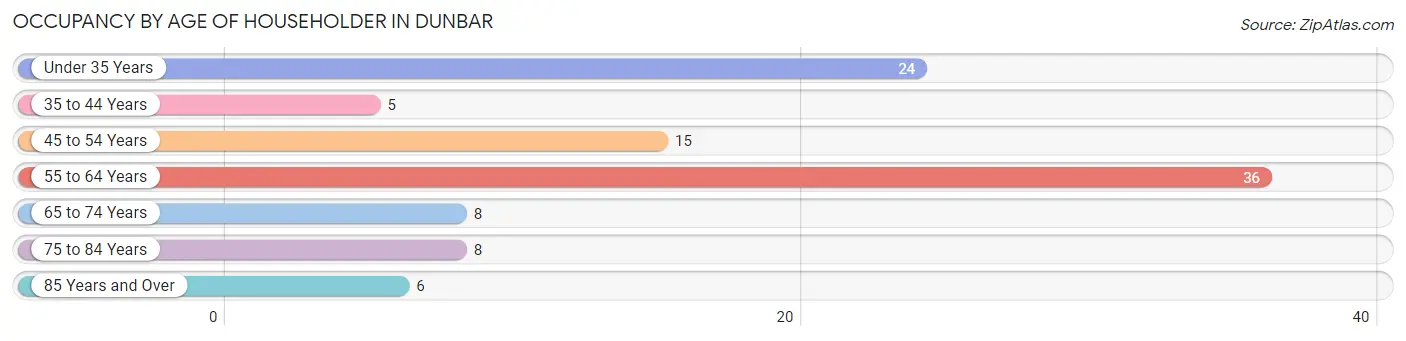
| Age Bracket | # Households | % Households |
| Under 35 Years | 24 | 23.5% |
| 35 to 44 Years | 5 | 4.9% |
| 45 to 54 Years | 15 | 14.7% |
| 55 to 64 Years | 36 | 35.3% |
| 65 to 74 Years | 8 | 7.8% |
| 75 to 84 Years | 8 | 7.8% |
| 85 Years and Over | 6 | 5.9% |
| Total | 102 | 100.0% |
Housing Finances in Dunbar
Median Income by Occupancy in Dunbar
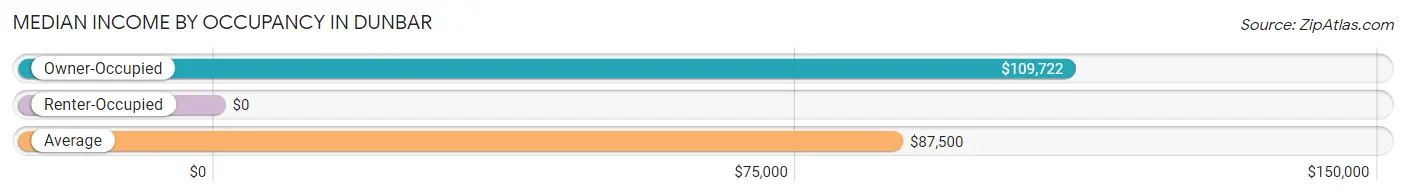
| Occupancy Type | # Households | Median Income |
| Owner-Occupied | 80 (78.4%) | $109,722 |
| Renter-Occupied | 22 (21.6%) | $0 |
| Average | 102 (100.0%) | $87,500 |
Occupancy by Householder Income Bracket in Dunbar
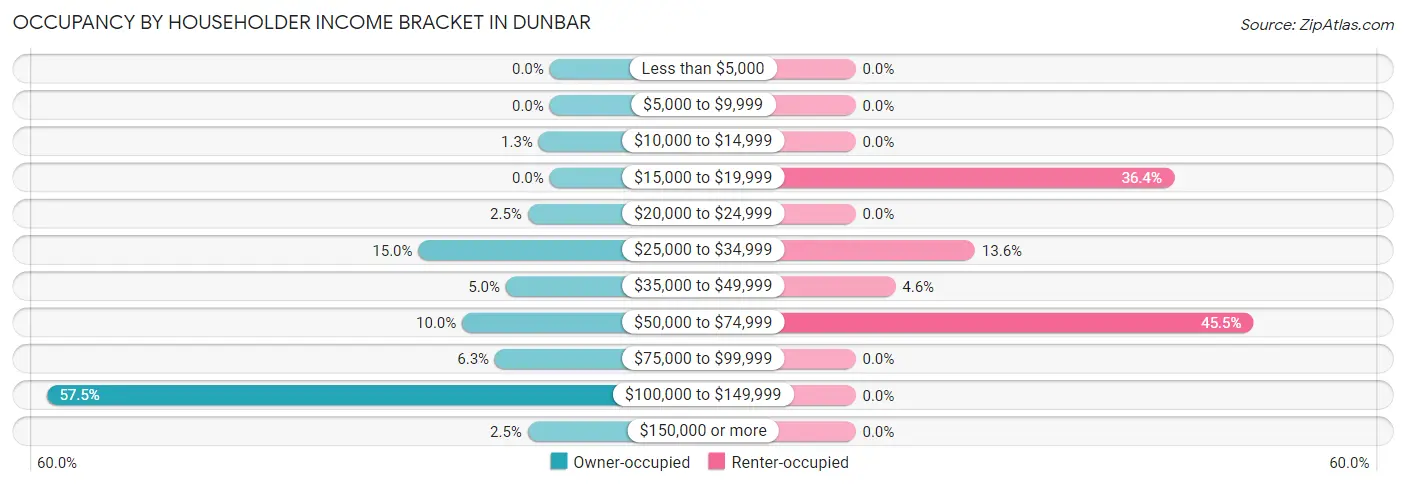
| Income Bracket | Owner-occupied | Renter-occupied |
| Less than $5,000 | 0 (0.0%) | 0 (0.0%) |
| $5,000 to $9,999 | 0 (0.0%) | 0 (0.0%) |
| $10,000 to $14,999 | 1 (1.3%) | 0 (0.0%) |
| $15,000 to $19,999 | 0 (0.0%) | 8 (36.4%) |
| $20,000 to $24,999 | 2 (2.5%) | 0 (0.0%) |
| $25,000 to $34,999 | 12 (15.0%) | 3 (13.6%) |
| $35,000 to $49,999 | 4 (5.0%) | 1 (4.5%) |
| $50,000 to $74,999 | 8 (10.0%) | 10 (45.5%) |
| $75,000 to $99,999 | 5 (6.2%) | 0 (0.0%) |
| $100,000 to $149,999 | 46 (57.5%) | 0 (0.0%) |
| $150,000 or more | 2 (2.5%) | 0 (0.0%) |
| Total | 80 (100.0%) | 22 (100.0%) |
Monthly Housing Cost Tiers in Dunbar
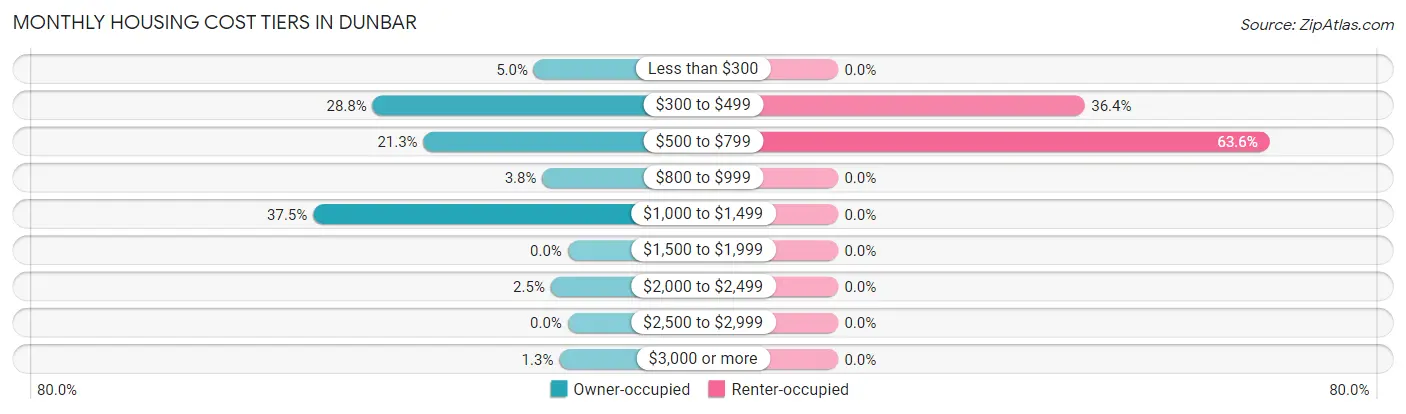
| Monthly Cost | Owner-occupied | Renter-occupied |
| Less than $300 | 4 (5.0%) | 0 (0.0%) |
| $300 to $499 | 23 (28.7%) | 8 (36.4%) |
| $500 to $799 | 17 (21.2%) | 14 (63.6%) |
| $800 to $999 | 3 (3.7%) | 0 (0.0%) |
| $1,000 to $1,499 | 30 (37.5%) | 0 (0.0%) |
| $1,500 to $1,999 | 0 (0.0%) | 0 (0.0%) |
| $2,000 to $2,499 | 2 (2.5%) | 0 (0.0%) |
| $2,500 to $2,999 | 0 (0.0%) | 0 (0.0%) |
| $3,000 or more | 1 (1.3%) | 0 (0.0%) |
| Total | 80 (100.0%) | 22 (100.0%) |
Physical Housing Characteristics in Dunbar
Housing Structures in Dunbar
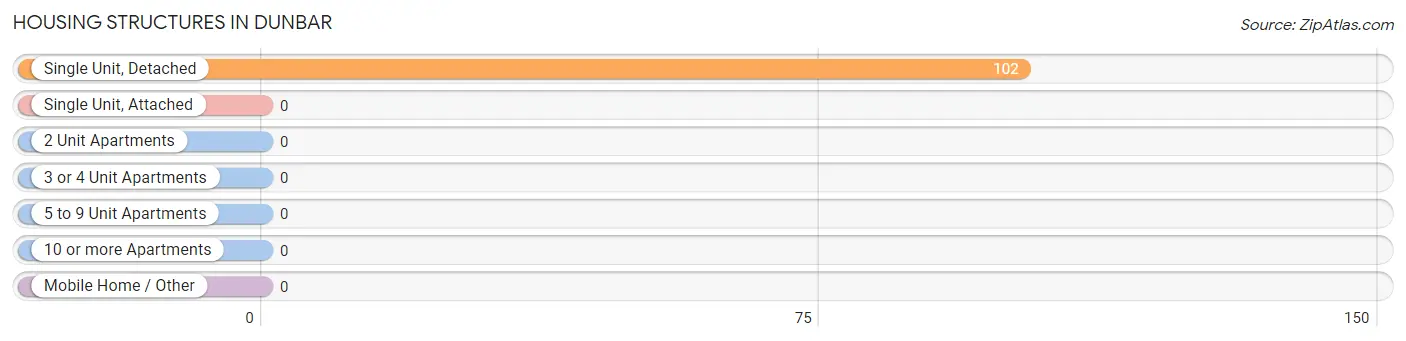
| Structure Type | # Housing Units | % Housing Units |
| Single Unit, Detached | 102 | 100.0% |
| Single Unit, Attached | 0 | 0.0% |
| 2 Unit Apartments | 0 | 0.0% |
| 3 or 4 Unit Apartments | 0 | 0.0% |
| 5 to 9 Unit Apartments | 0 | 0.0% |
| 10 or more Apartments | 0 | 0.0% |
| Mobile Home / Other | 0 | 0.0% |
| Total | 102 | 100.0% |
Housing Structures by Occupancy in Dunbar
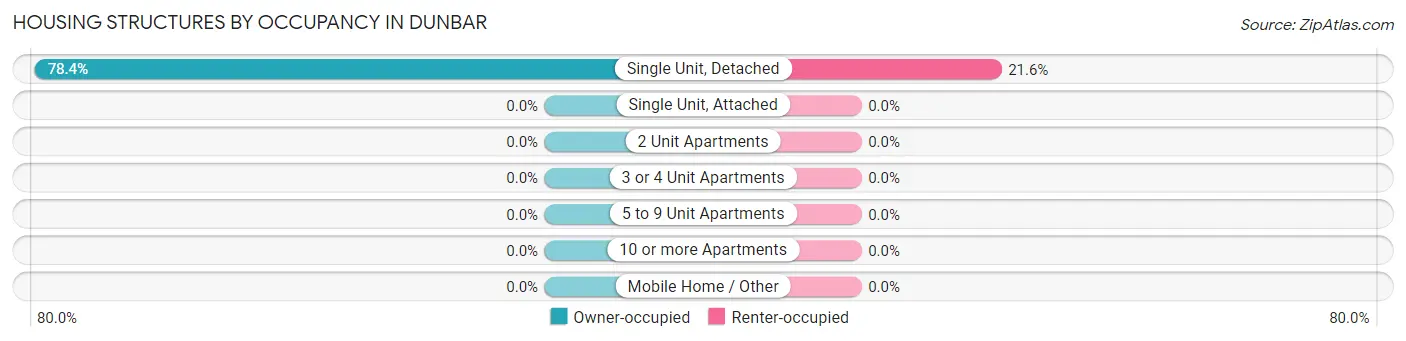
| Structure Type | Owner-occupied | Renter-occupied |
| Single Unit, Detached | 80 (78.4%) | 22 (21.6%) |
| Single Unit, Attached | 0 (0.0%) | 0 (0.0%) |
| 2 Unit Apartments | 0 (0.0%) | 0 (0.0%) |
| 3 or 4 Unit Apartments | 0 (0.0%) | 0 (0.0%) |
| 5 to 9 Unit Apartments | 0 (0.0%) | 0 (0.0%) |
| 10 or more Apartments | 0 (0.0%) | 0 (0.0%) |
| Mobile Home / Other | 0 (0.0%) | 0 (0.0%) |
| Total | 80 (78.4%) | 22 (21.6%) |
Housing Structures by Number of Rooms in Dunbar
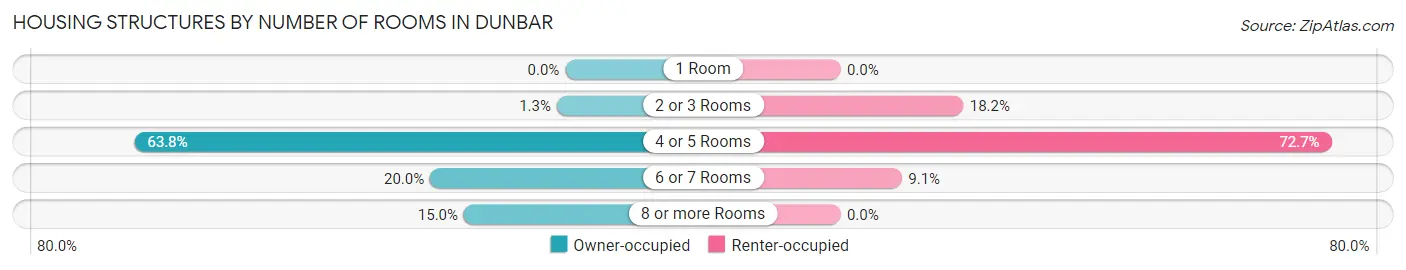
| Number of Rooms | Owner-occupied | Renter-occupied |
| 1 Room | 0 (0.0%) | 0 (0.0%) |
| 2 or 3 Rooms | 1 (1.3%) | 4 (18.2%) |
| 4 or 5 Rooms | 51 (63.7%) | 16 (72.7%) |
| 6 or 7 Rooms | 16 (20.0%) | 2 (9.1%) |
| 8 or more Rooms | 12 (15.0%) | 0 (0.0%) |
| Total | 80 (100.0%) | 22 (100.0%) |
Housing Structure by Heating Type in Dunbar
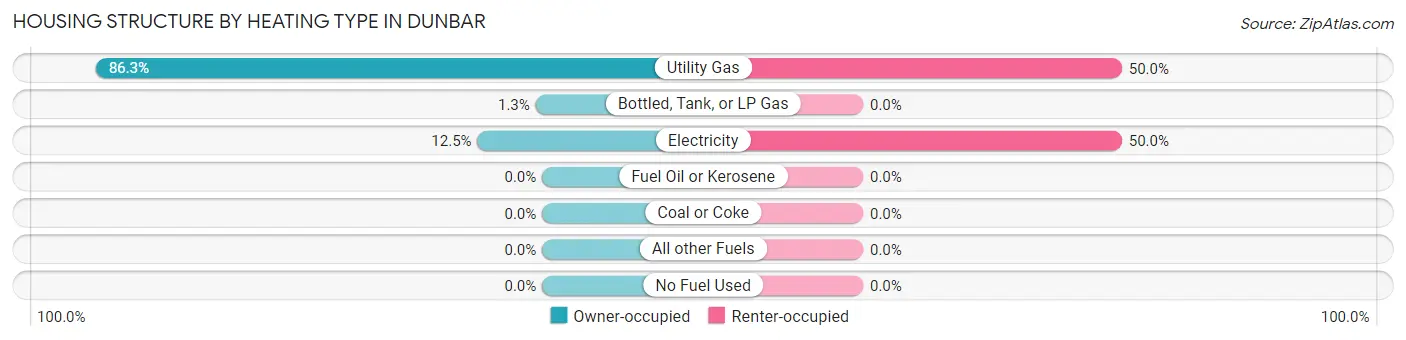
| Heating Type | Owner-occupied | Renter-occupied |
| Utility Gas | 69 (86.3%) | 11 (50.0%) |
| Bottled, Tank, or LP Gas | 1 (1.3%) | 0 (0.0%) |
| Electricity | 10 (12.5%) | 11 (50.0%) |
| Fuel Oil or Kerosene | 0 (0.0%) | 0 (0.0%) |
| Coal or Coke | 0 (0.0%) | 0 (0.0%) |
| All other Fuels | 0 (0.0%) | 0 (0.0%) |
| No Fuel Used | 0 (0.0%) | 0 (0.0%) |
| Total | 80 (100.0%) | 22 (100.0%) |
Household Vehicle Usage in Dunbar
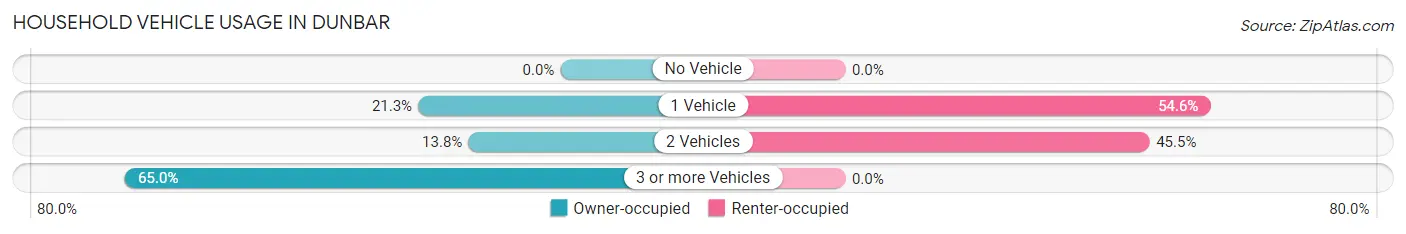
| Vehicles per Household | Owner-occupied | Renter-occupied |
| No Vehicle | 0 (0.0%) | 0 (0.0%) |
| 1 Vehicle | 17 (21.2%) | 12 (54.5%) |
| 2 Vehicles | 11 (13.8%) | 10 (45.5%) |
| 3 or more Vehicles | 52 (65.0%) | 0 (0.0%) |
| Total | 80 (100.0%) | 22 (100.0%) |
Real Estate & Mortgages in Dunbar
Real Estate and Mortgage Overview in Dunbar
| Characteristic | Without Mortgage | With Mortgage |
| Housing Units | 41 | 39 |
| Median Property Value | $55,800 | $57,000 |
| Median Household Income | - | - |
| Monthly Housing Costs | $435 | $1 |
| Real Estate Taxes | $833 | $1 |
Property Value by Mortgage Status in Dunbar
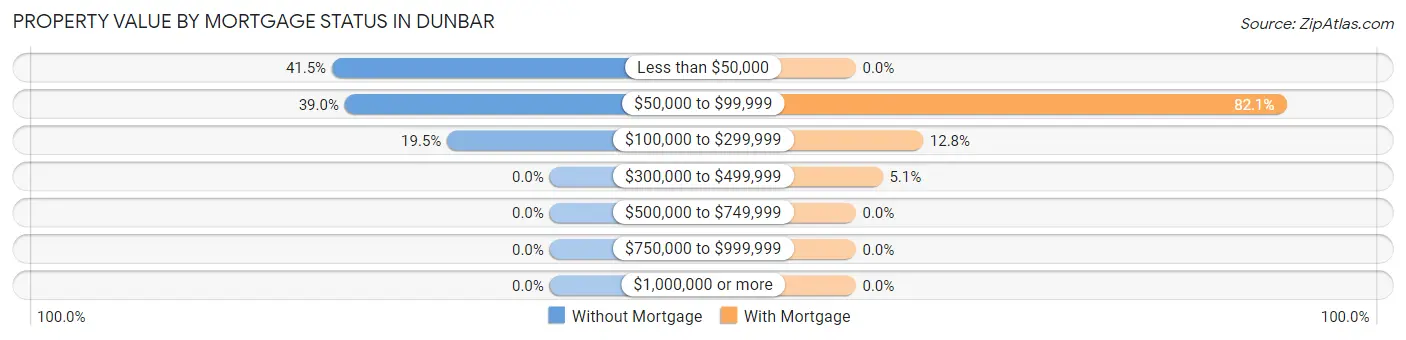
| Property Value | Without Mortgage | With Mortgage |
| Less than $50,000 | 17 (41.5%) | 0 (0.0%) |
| $50,000 to $99,999 | 16 (39.0%) | 32 (82.1%) |
| $100,000 to $299,999 | 8 (19.5%) | 5 (12.8%) |
| $300,000 to $499,999 | 0 (0.0%) | 2 (5.1%) |
| $500,000 to $749,999 | 0 (0.0%) | 0 (0.0%) |
| $750,000 to $999,999 | 0 (0.0%) | 0 (0.0%) |
| $1,000,000 or more | 0 (0.0%) | 0 (0.0%) |
| Total | 41 (100.0%) | 39 (100.0%) |
Household Income by Mortgage Status in Dunbar
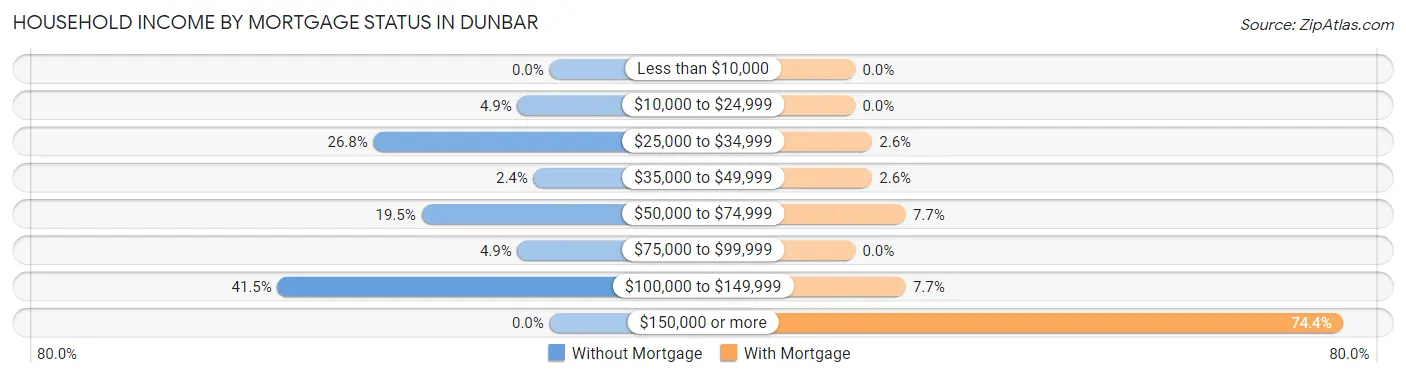
| Household Income | Without Mortgage | With Mortgage |
| Less than $10,000 | 0 (0.0%) | 0 (0.0%) |
| $10,000 to $24,999 | 2 (4.9%) | 0 (0.0%) |
| $25,000 to $34,999 | 11 (26.8%) | 1 (2.6%) |
| $35,000 to $49,999 | 1 (2.4%) | 1 (2.6%) |
| $50,000 to $74,999 | 8 (19.5%) | 3 (7.7%) |
| $75,000 to $99,999 | 2 (4.9%) | 0 (0.0%) |
| $100,000 to $149,999 | 17 (41.5%) | 3 (7.7%) |
| $150,000 or more | 0 (0.0%) | 29 (74.4%) |
| Total | 41 (100.0%) | 39 (100.0%) |
Property Value to Household Income Ratio in Dunbar
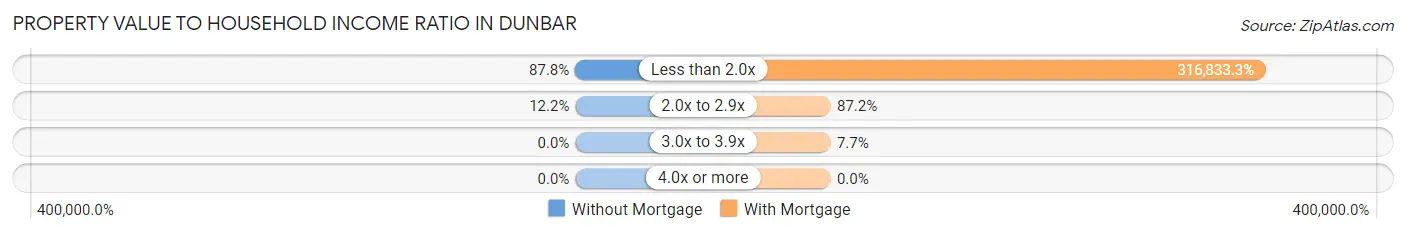
| Value-to-Income Ratio | Without Mortgage | With Mortgage |
| Less than 2.0x | 36 (87.8%) | 123,565 (316,833.3%) |
| 2.0x to 2.9x | 5 (12.2%) | 34 (87.2%) |
| 3.0x to 3.9x | 0 (0.0%) | 3 (7.7%) |
| 4.0x or more | 0 (0.0%) | 0 (0.0%) |
| Total | 41 (100.0%) | 39 (100.0%) |
Real Estate Taxes by Mortgage Status in Dunbar
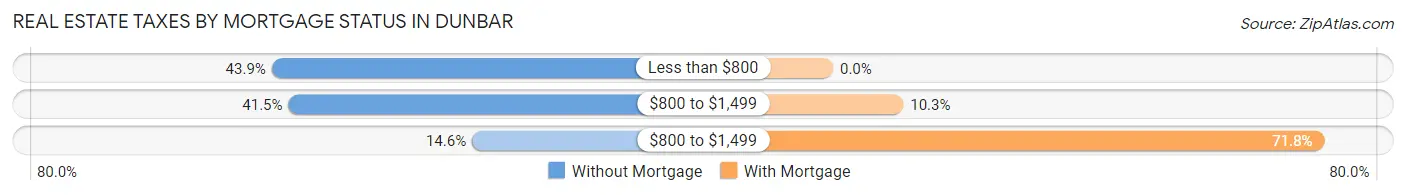
| Property Taxes | Without Mortgage | With Mortgage |
| Less than $800 | 18 (43.9%) | 0 (0.0%) |
| $800 to $1,499 | 17 (41.5%) | 4 (10.3%) |
| $800 to $1,499 | 6 (14.6%) | 28 (71.8%) |
| Total | 41 (100.0%) | 39 (100.0%) |
Health & Disability in Dunbar
Health Insurance Coverage by Age in Dunbar
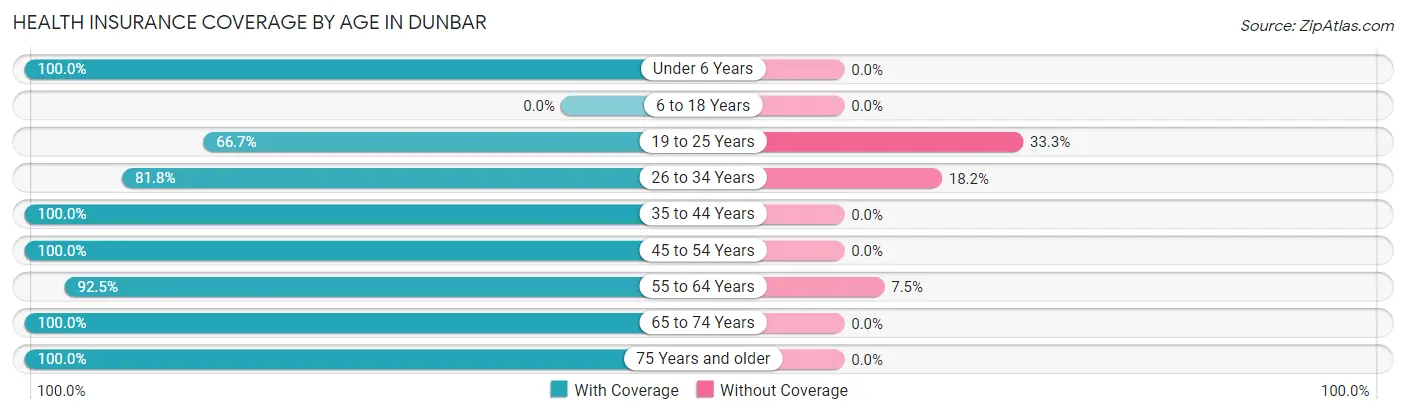
| Age Bracket | With Coverage | Without Coverage |
| Under 6 Years | 20 (100.0%) | 0 (0.0%) |
| 6 to 18 Years | 0 (0.0%) | 0 (0.0%) |
| 19 to 25 Years | 4 (66.7%) | 2 (33.3%) |
| 26 to 34 Years | 36 (81.8%) | 8 (18.2%) |
| 35 to 44 Years | 5 (100.0%) | 0 (0.0%) |
| 45 to 54 Years | 25 (100.0%) | 0 (0.0%) |
| 55 to 64 Years | 62 (92.5%) | 5 (7.5%) |
| 65 to 74 Years | 18 (100.0%) | 0 (0.0%) |
| 75 Years and older | 16 (100.0%) | 0 (0.0%) |
| Total | 186 (92.5%) | 15 (7.5%) |
Health Insurance Coverage by Citizenship Status in Dunbar
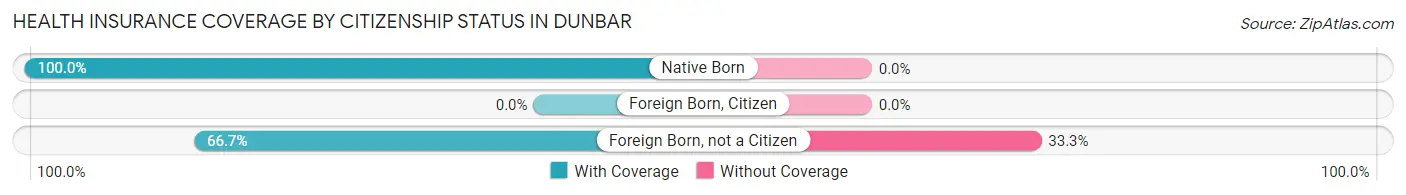
| Citizenship Status | With Coverage | Without Coverage |
| Native Born | 20 (100.0%) | 0 (0.0%) |
| Foreign Born, Citizen | 0 (0.0%) | 0 (0.0%) |
| Foreign Born, not a Citizen | 4 (66.7%) | 2 (33.3%) |
Health Insurance Coverage by Household Income in Dunbar
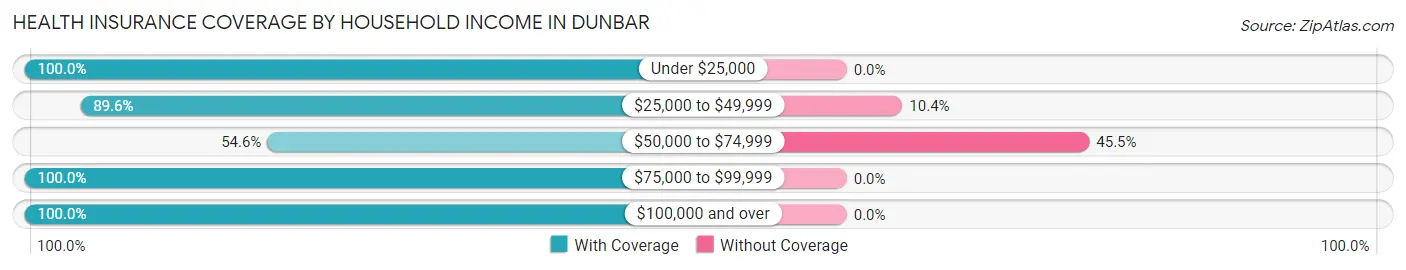
| Household Income | With Coverage | Without Coverage |
| Under $25,000 | 17 (100.0%) | 0 (0.0%) |
| $25,000 to $49,999 | 43 (89.6%) | 5 (10.4%) |
| $50,000 to $74,999 | 12 (54.5%) | 10 (45.5%) |
| $75,000 to $99,999 | 18 (100.0%) | 0 (0.0%) |
| $100,000 and over | 96 (100.0%) | 0 (0.0%) |
Public vs Private Health Insurance Coverage by Age in Dunbar
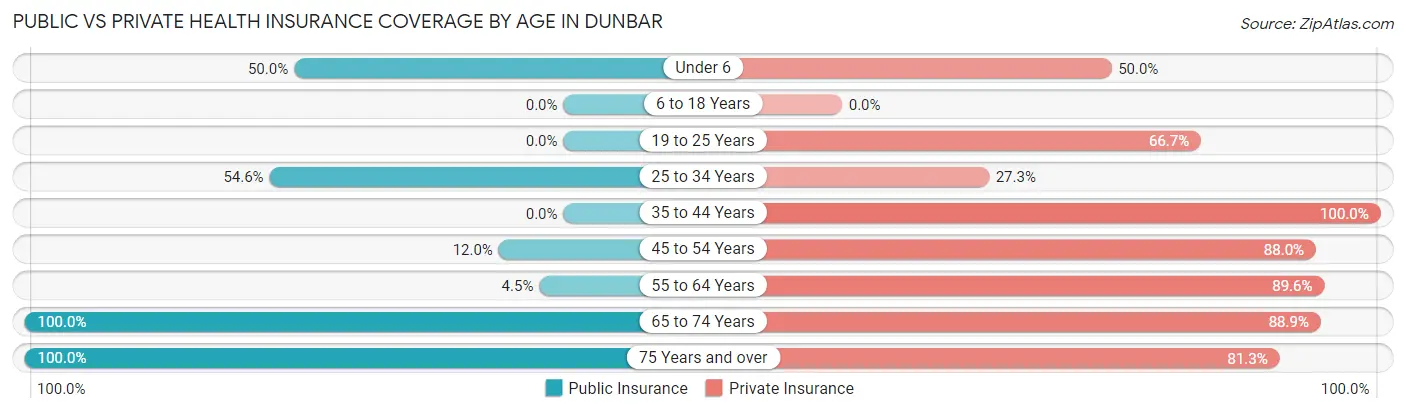
| Age Bracket | Public Insurance | Private Insurance |
| Under 6 | 10 (50.0%) | 10 (50.0%) |
| 6 to 18 Years | 0 (0.0%) | 0 (0.0%) |
| 19 to 25 Years | 0 (0.0%) | 4 (66.7%) |
| 25 to 34 Years | 24 (54.5%) | 12 (27.3%) |
| 35 to 44 Years | 0 (0.0%) | 5 (100.0%) |
| 45 to 54 Years | 3 (12.0%) | 22 (88.0%) |
| 55 to 64 Years | 3 (4.5%) | 60 (89.5%) |
| 65 to 74 Years | 18 (100.0%) | 16 (88.9%) |
| 75 Years and over | 16 (100.0%) | 13 (81.2%) |
| Total | 74 (36.8%) | 142 (70.7%) |
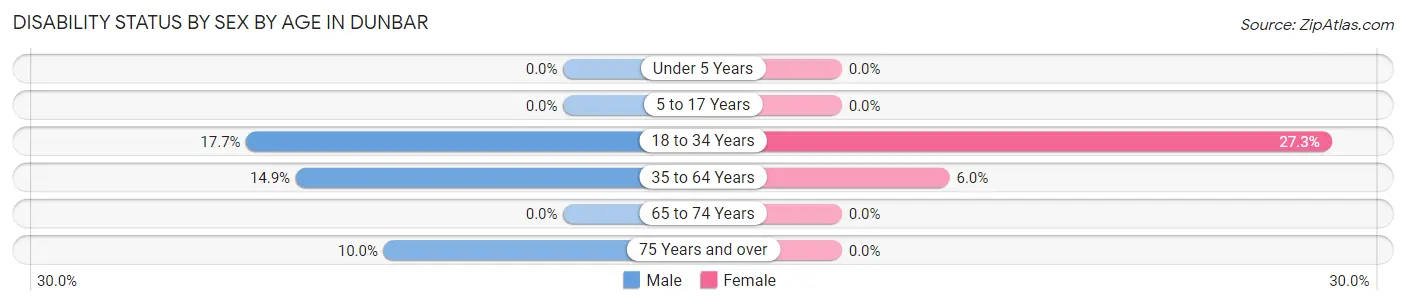
Disability Status by Sex by Age in Dunbar
| Age Bracket | Male | Female |
| Under 5 Years | 0 (0.0%) | 0 (0.0%) |
| 5 to 17 Years | 0 (0.0%) | 0 (0.0%) |
| 18 to 34 Years | 3 (17.6%) | 9 (27.3%) |
| 35 to 64 Years | 7 (14.9%) | 3 (6.0%) |
| 65 to 74 Years | 0 (0.0%) | 0 (0.0%) |
| 75 Years and over | 1 (10.0%) | 0 (0.0%) |
Disability Class by Sex by Age in Dunbar
Disability Class: Hearing Difficulty
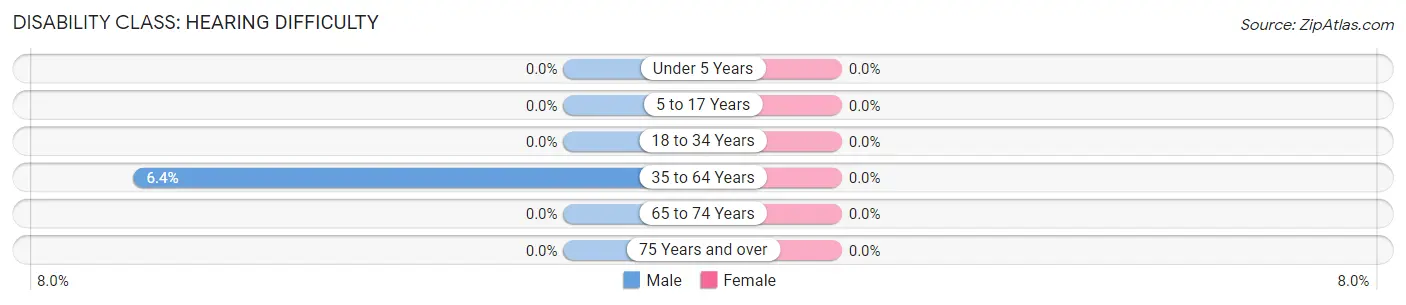
| Age Bracket | Male | Female |
| Under 5 Years | 0 (0.0%) | 0 (0.0%) |
| 5 to 17 Years | 0 (0.0%) | 0 (0.0%) |
| 18 to 34 Years | 0 (0.0%) | 0 (0.0%) |
| 35 to 64 Years | 3 (6.4%) | 0 (0.0%) |
| 65 to 74 Years | 0 (0.0%) | 0 (0.0%) |
| 75 Years and over | 0 (0.0%) | 0 (0.0%) |
Disability Class: Vision Difficulty
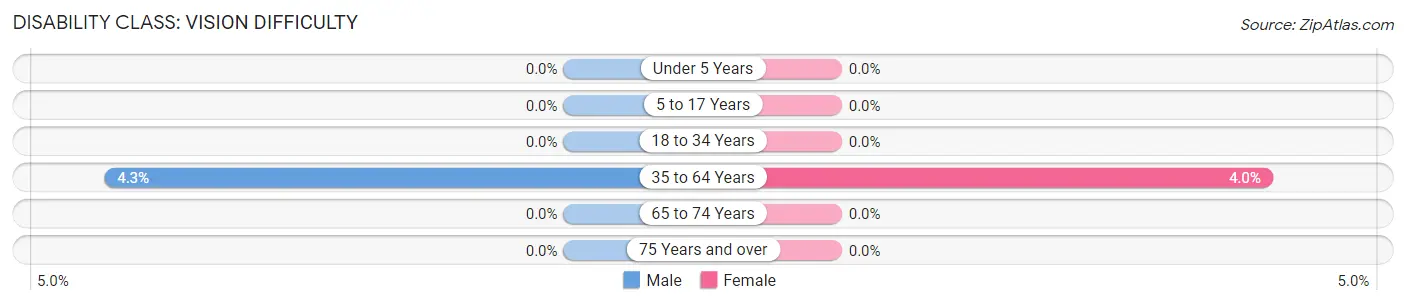
| Age Bracket | Male | Female |
| Under 5 Years | 0 (0.0%) | 0 (0.0%) |
| 5 to 17 Years | 0 (0.0%) | 0 (0.0%) |
| 18 to 34 Years | 0 (0.0%) | 0 (0.0%) |
| 35 to 64 Years | 2 (4.3%) | 2 (4.0%) |
| 65 to 74 Years | 0 (0.0%) | 0 (0.0%) |
| 75 Years and over | 0 (0.0%) | 0 (0.0%) |
Disability Class: Cognitive Difficulty
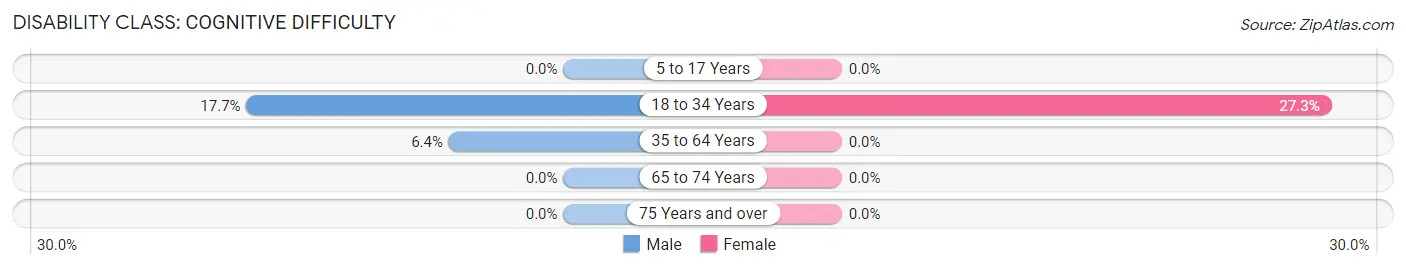
| Age Bracket | Male | Female |
| 5 to 17 Years | 0 (0.0%) | 0 (0.0%) |
| 18 to 34 Years | 3 (17.6%) | 9 (27.3%) |
| 35 to 64 Years | 3 (6.4%) | 0 (0.0%) |
| 65 to 74 Years | 0 (0.0%) | 0 (0.0%) |
| 75 Years and over | 0 (0.0%) | 0 (0.0%) |
Disability Class: Ambulatory Difficulty
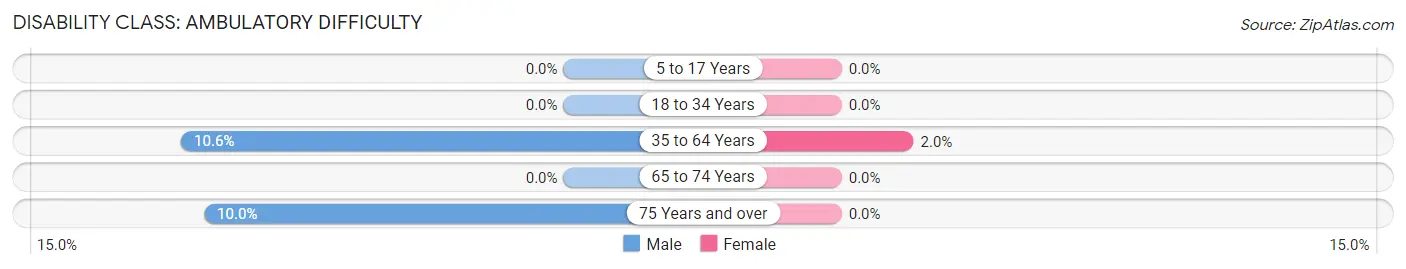
| Age Bracket | Male | Female |
| 5 to 17 Years | 0 (0.0%) | 0 (0.0%) |
| 18 to 34 Years | 0 (0.0%) | 0 (0.0%) |
| 35 to 64 Years | 5 (10.6%) | 1 (2.0%) |
| 65 to 74 Years | 0 (0.0%) | 0 (0.0%) |
| 75 Years and over | 1 (10.0%) | 0 (0.0%) |
Disability Class: Self-Care Difficulty
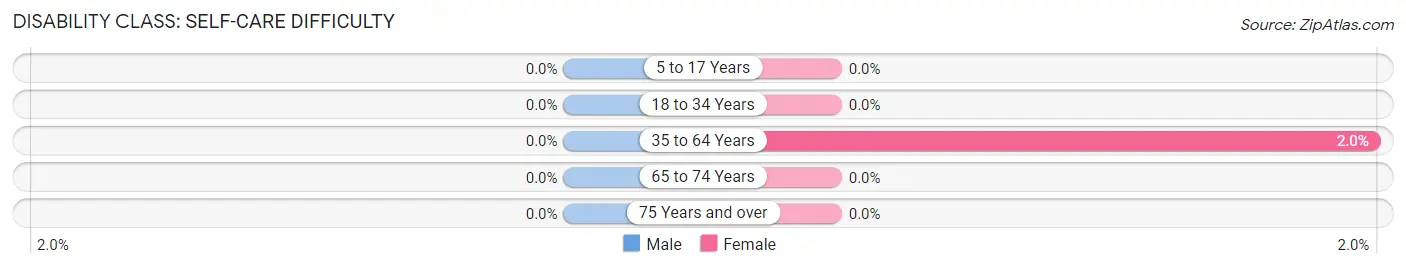
| Age Bracket | Male | Female |
| 5 to 17 Years | 0 (0.0%) | 0 (0.0%) |
| 18 to 34 Years | 0 (0.0%) | 0 (0.0%) |
| 35 to 64 Years | 0 (0.0%) | 1 (2.0%) |
| 65 to 74 Years | 0 (0.0%) | 0 (0.0%) |
| 75 Years and over | 0 (0.0%) | 0 (0.0%) |
Technology Access in Dunbar
Computing Device Access in Dunbar
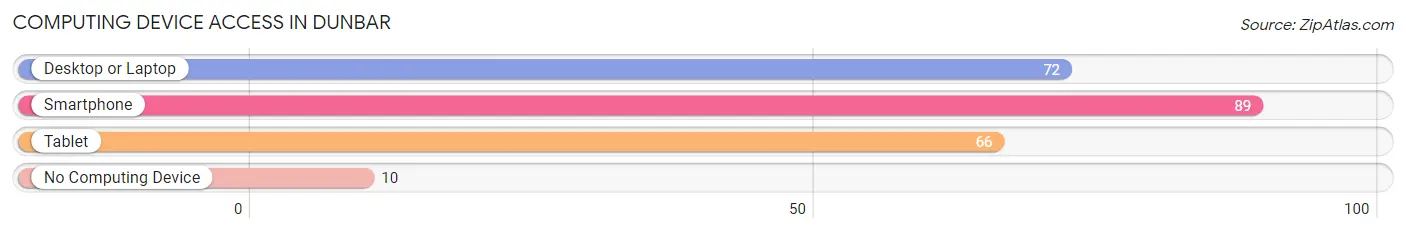
| Device Type | # Households | % Households |
| Desktop or Laptop | 72 | 70.6% |
| Smartphone | 89 | 87.3% |
| Tablet | 66 | 64.7% |
| No Computing Device | 10 | 9.8% |
| Total | 102 | 100.0% |
Internet Access in Dunbar
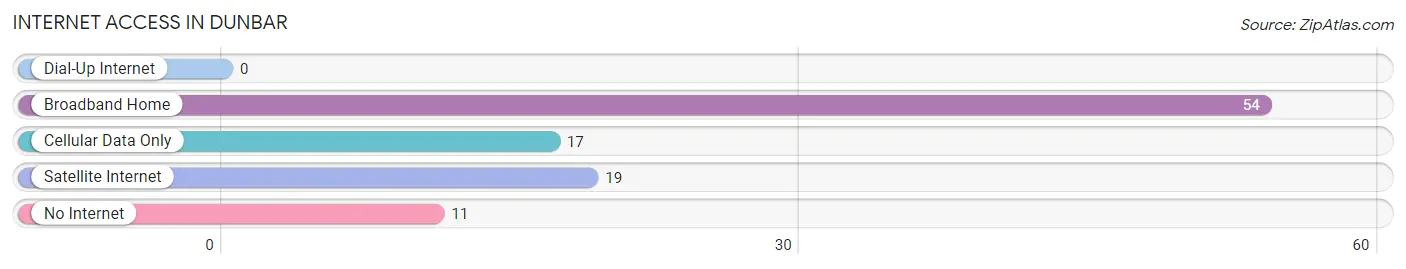
| Internet Type | # Households | % Households |
| Dial-Up Internet | 0 | 0.0% |
| Broadband Home | 54 | 52.9% |
| Cellular Data Only | 17 | 16.7% |
| Satellite Internet | 19 | 18.6% |
| No Internet | 11 | 10.8% |
| Total | 102 | 100.0% |
Dunbar Summary
Dunbar, Nebraska is a small town located in Otoe County, Nebraska. It is situated on the banks of the Missouri River, approximately 25 miles south of Lincoln. The town was founded in 1856 by a group of settlers from Ohio, and was named after the nearby Dunbar Creek. The population of Dunbar was estimated to be 545 in 2020.
History
The first settlers in Dunbar were a group of Ohioans who arrived in 1856. They were led by a man named John Dunbar, who had been a soldier in the Mexican-American War. The settlers chose the area because of its proximity to the Missouri River, which provided them with a reliable source of water and transportation. The town was officially incorporated in 1858.
In the early years, Dunbar was a small farming community. The town was home to a variety of businesses, including a general store, a blacksmith shop, a hotel, and a post office. The town also had a school, which was established in 1868.
In the late 19th century, Dunbar began to experience a period of growth. The town was connected to the railroad in 1887, which allowed for increased trade and commerce. The town also experienced a population boom, as many people moved to the area to take advantage of the new opportunities.
Geography
Dunbar is located in Otoe County, Nebraska, approximately 25 miles south of Lincoln. The town is situated on the banks of the Missouri River, which provides a reliable source of water and transportation. The town is surrounded by rolling hills and farmland, and is located in the heart of the Great Plains.
Economy
The economy of Dunbar is largely based on agriculture. The town is home to several farms, which produce a variety of crops, including corn, soybeans, and wheat. The town also has a few small businesses, including a general store, a hardware store, and a restaurant.
Demographics
The population of Dunbar was estimated to be 545 in 2020. The town is predominantly white, with a small minority population. The median household income in Dunbar is $45,000, and the median home value is $125,000. The town has a low unemployment rate, and the majority of the population is employed in the agricultural sector.
Conclusion
Dunbar, Nebraska is a small town located in Otoe County, Nebraska. It was founded in 1856 by a group of settlers from Ohio, and was named after the nearby Dunbar Creek. The town is situated on the banks of the Missouri River, and is surrounded by rolling hills and farmland. The economy of Dunbar is largely based on agriculture, and the town has a population of 545. The town is predominantly white, with a small minority population, and the median household income is $45,000.
Common Questions
What is Per Capita Income in Dunbar?
Per Capita income in Dunbar is $39,204.
What is the Median Family Income in Dunbar?
Median Family Income in Dunbar is $111,250.
What is the Median Household income in Dunbar?
Median Household Income in Dunbar is $87,500.
What is Inequality or Gini Index in Dunbar?
Inequality or Gini Index in Dunbar is 0.30.
What is the Total Population of Dunbar?
Total Population of Dunbar is 201.
What is the Total Male Population of Dunbar?
Total Male Population of Dunbar is 96.
What is the Total Female Population of Dunbar?
Total Female Population of Dunbar is 105.
What is the Ratio of Males per 100 Females in Dunbar?
There are 91.43 Males per 100 Females in Dunbar.
What is the Ratio of Females per 100 Males in Dunbar?
There are 109.38 Females per 100 Males in Dunbar.
What is the Median Population Age in Dunbar?
Median Population Age in Dunbar is 56.0 Years.
What is the Average Family Size in Dunbar
Average Family Size in Dunbar is 2.2 People.
What is the Average Household Size in Dunbar
Average Household Size in Dunbar is 2.0 People.
How Large is the Labor Force in Dunbar?
There are 141 People in the Labor Forcein in Dunbar.
What is the Percentage of People in the Labor Force in Dunbar?
77.9% of People are in the Labor Force in Dunbar.
What is the Unemployment Rate in Dunbar?
Unemployment Rate in Dunbar is 26.2%.