De Witt, NE Map & Demographics
De Witt Map
De Witt Overview
$37,621
PER CAPITA INCOME
$90,962
AVG FAMILY INCOME
$79,000
AVG HOUSEHOLD INCOME
16.8%
WAGE / INCOME GAP [ % ]
83.2¢/ $1
WAGE / INCOME GAP [ $ ]
0.37
INEQUALITY / GINI INDEX
512
TOTAL POPULATION
248
MALE POPULATION
264
FEMALE POPULATION
93.94
MALES / 100 FEMALES
106.45
FEMALES / 100 MALES
41.9
MEDIAN AGE
2.8
AVG FAMILY SIZE
2.4
AVG HOUSEHOLD SIZE
290
LABOR FORCE [ PEOPLE ]
70.9%
PERCENT IN LABOR FORCE
1.0%
UNEMPLOYMENT RATE
De Witt Zip Codes
De Witt Area Codes
Income in De Witt
Income Overview in De Witt
Per Capita Income in De Witt is $37,621, while median incomes of families and households are $90,962 and $79,000 respectively.
| Characteristic | Number | Measure |
| Per Capita Income | 512 | $37,621 |
| Median Family Income | 148 | $90,962 |
| Mean Family Income | 148 | $88,159 |
| Median Household Income | 216 | $79,000 |
| Mean Household Income | 216 | $91,844 |
| Income Deficit | 148 | $0 |
| Wage / Income Gap (%) | 512 | 16.81% |
| Wage / Income Gap ($) | 512 | 83.19¢ per $1 |
| Gini / Inequality Index | 512 | 0.37 |
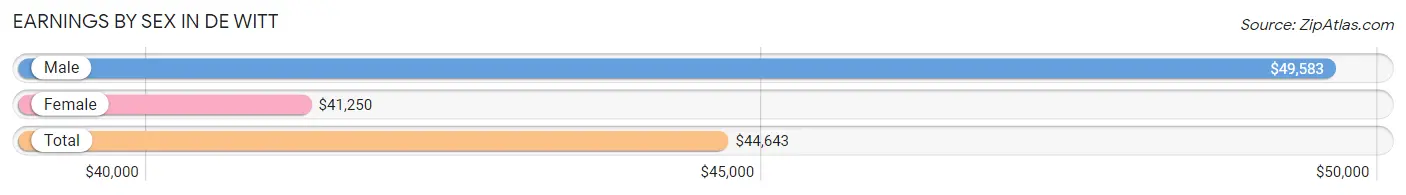
Earnings by Sex in De Witt
Average Earnings in De Witt are $44,643, $49,583 for men and $41,250 for women, a difference of 16.8%.
| Sex | Number | Average Earnings |
| Male | 165 (55.0%) | $49,583 |
| Female | 135 (45.0%) | $41,250 |
| Total | 300 (100.0%) | $44,643 |
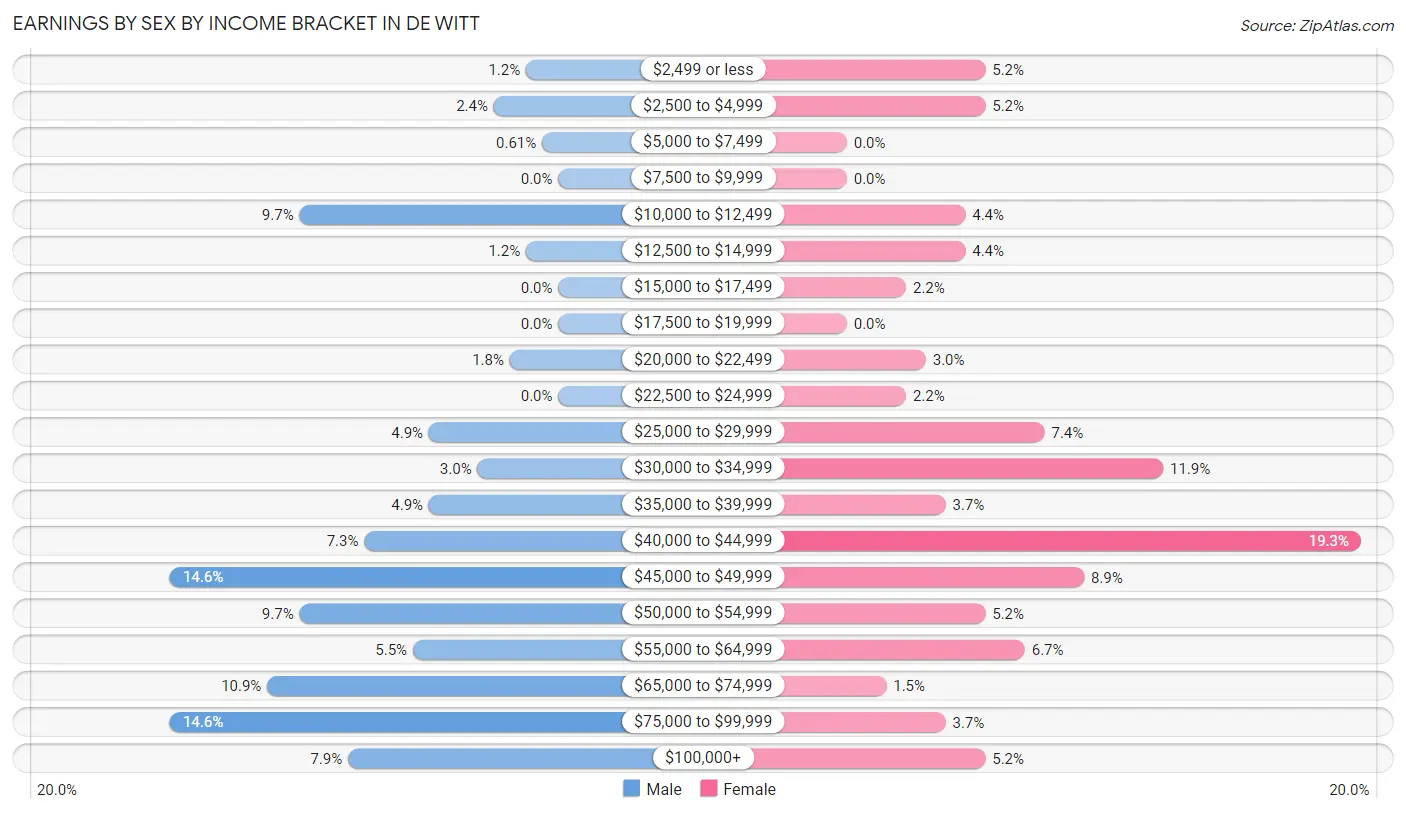
Earnings by Sex by Income Bracket in De Witt
The most common earnings brackets in De Witt are $45,000 to $49,999 for men (24 | 14.5%) and $40,000 to $44,999 for women (26 | 19.3%).
| Income | Male | Female |
| $2,499 or less | 2 (1.2%) | 7 (5.2%) |
| $2,500 to $4,999 | 4 (2.4%) | 7 (5.2%) |
| $5,000 to $7,499 | 1 (0.6%) | 0 (0.0%) |
| $7,500 to $9,999 | 0 (0.0%) | 0 (0.0%) |
| $10,000 to $12,499 | 16 (9.7%) | 6 (4.4%) |
| $12,500 to $14,999 | 2 (1.2%) | 6 (4.4%) |
| $15,000 to $17,499 | 0 (0.0%) | 3 (2.2%) |
| $17,500 to $19,999 | 0 (0.0%) | 0 (0.0%) |
| $20,000 to $22,499 | 3 (1.8%) | 4 (3.0%) |
| $22,500 to $24,999 | 0 (0.0%) | 3 (2.2%) |
| $25,000 to $29,999 | 8 (4.9%) | 10 (7.4%) |
| $30,000 to $34,999 | 5 (3.0%) | 16 (11.8%) |
| $35,000 to $39,999 | 8 (4.9%) | 5 (3.7%) |
| $40,000 to $44,999 | 12 (7.3%) | 26 (19.3%) |
| $45,000 to $49,999 | 24 (14.5%) | 12 (8.9%) |
| $50,000 to $54,999 | 16 (9.7%) | 7 (5.2%) |
| $55,000 to $64,999 | 9 (5.4%) | 9 (6.7%) |
| $65,000 to $74,999 | 18 (10.9%) | 2 (1.5%) |
| $75,000 to $99,999 | 24 (14.5%) | 5 (3.7%) |
| $100,000+ | 13 (7.9%) | 7 (5.2%) |
| Total | 165 (100.0%) | 135 (100.0%) |
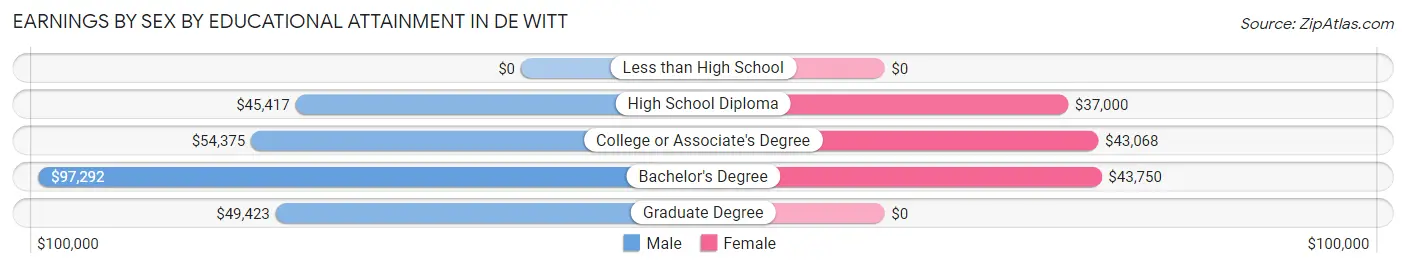
Earnings by Sex by Educational Attainment in De Witt
Average earnings in De Witt are $49,750 for men and $42,600 for women, a difference of 14.4%. Men with an educational attainment of bachelor's degree enjoy the highest average annual earnings of $97,292, while those with high school diploma education earn the least with $45,417. Women with an educational attainment of bachelor's degree earn the most with the average annual earnings of $43,750, while those with high school diploma education have the smallest earnings of $37,000.
| Educational Attainment | Male Income | Female Income |
| Less than High School | - | - |
| High School Diploma | $45,417 | $37,000 |
| College or Associate's Degree | $54,375 | $43,068 |
| Bachelor's Degree | $97,292 | $43,750 |
| Graduate Degree | $49,423 | $0 |
| Total | $49,750 | $42,600 |
Family Income in De Witt
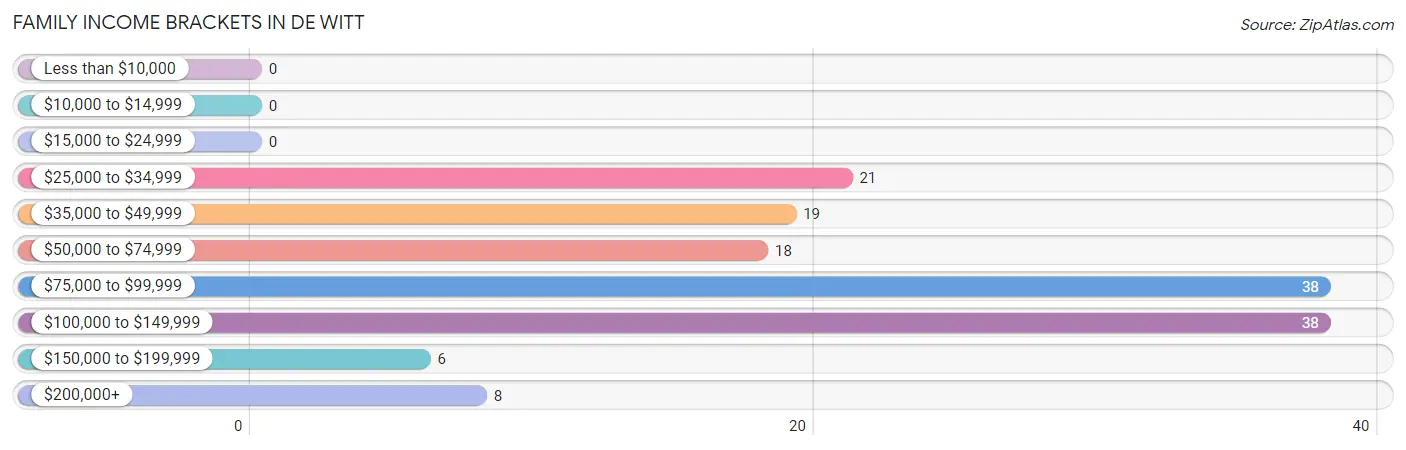
Family Income Brackets in De Witt
According to the De Witt family income data, there are 38 families falling into the $75,000 to $99,999 income range, which is the most common income bracket and makes up 25.7% of all families.
| Income Bracket | # Families | % Families |
| Less than $10,000 | 0 | 0.0% |
| $10,000 to $14,999 | 0 | 0.0% |
| $15,000 to $24,999 | 0 | 0.0% |
| $25,000 to $34,999 | 21 | 14.2% |
| $35,000 to $49,999 | 19 | 12.8% |
| $50,000 to $74,999 | 18 | 12.2% |
| $75,000 to $99,999 | 38 | 25.7% |
| $100,000 to $149,999 | 38 | 25.7% |
| $150,000 to $199,999 | 6 | 4.1% |
| $200,000+ | 8 | 5.4% |
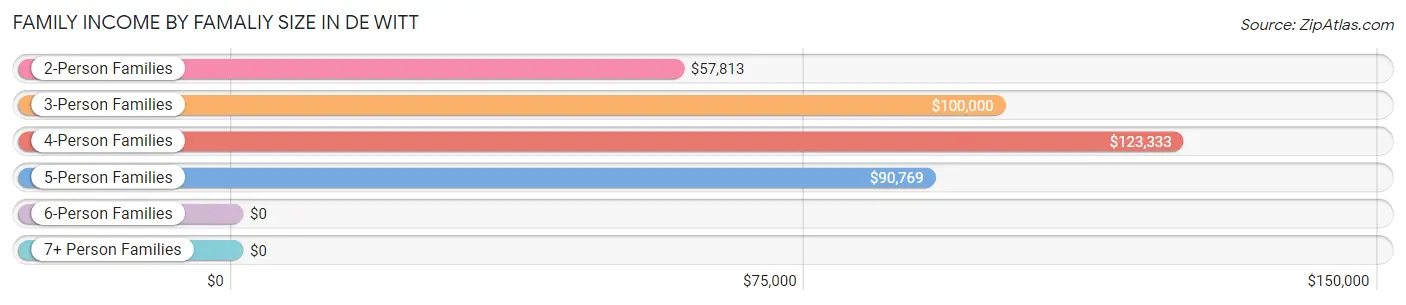
Family Income by Famaliy Size in De Witt
4-person families (26 | 17.6%) account for the highest median family income in De Witt with $123,333 per family, while 3-person families (36 | 24.3%) have the highest median income of $33,333 per family member.
| Income Bracket | # Families | Median Income |
| 2-Person Families | 65 (43.9%) | $57,813 |
| 3-Person Families | 36 (24.3%) | $100,000 |
| 4-Person Families | 26 (17.6%) | $123,333 |
| 5-Person Families | 18 (12.2%) | $90,769 |
| 6-Person Families | 3 (2.0%) | $0 |
| 7+ Person Families | 0 (0.0%) | $0 |
| Total | 148 (100.0%) | $90,962 |
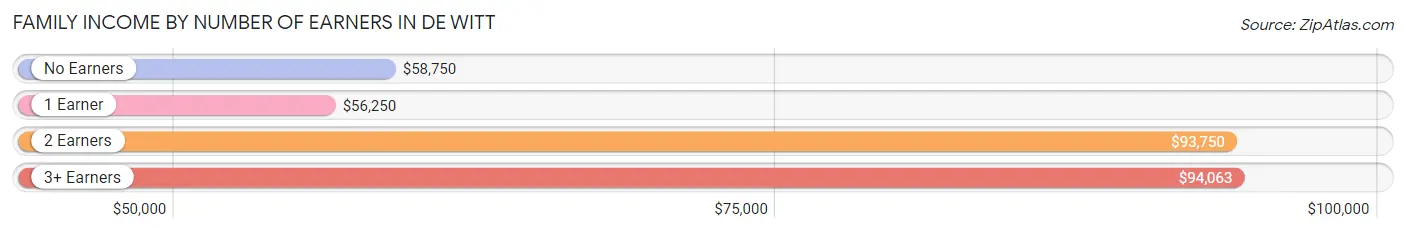
Family Income by Number of Earners in De Witt
The median family income in De Witt is $90,962, with families comprising 3+ earners (14) having the highest median family income of $94,063, while families with 1 earner (34) have the lowest median family income of $56,250, accounting for 9.5% and 23.0% of families, respectively.
| Number of Earners | # Families | Median Income |
| No Earners | 16 (10.8%) | $58,750 |
| 1 Earner | 34 (23.0%) | $56,250 |
| 2 Earners | 84 (56.8%) | $93,750 |
| 3+ Earners | 14 (9.5%) | $94,063 |
| Total | 148 (100.0%) | $90,962 |
Household Income in De Witt
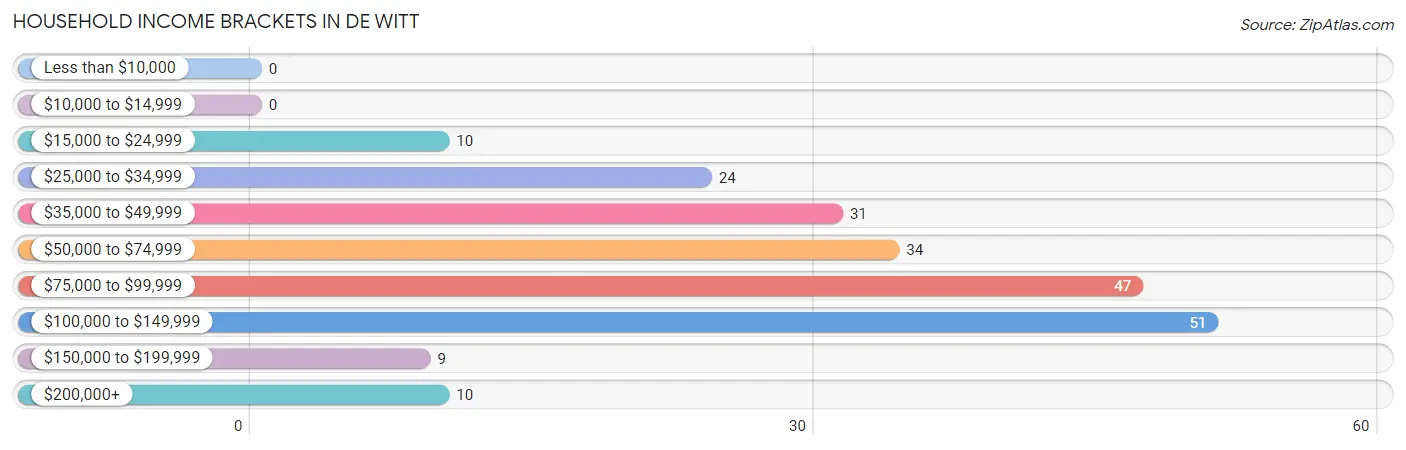
Household Income Brackets in De Witt
With 51 households falling in the category, the $100,000 to $149,999 income range is the most frequent in De Witt, accounting for 23.6% of all households.
| Income Bracket | # Households | % Households |
| Less than $10,000 | 0 | 0.0% |
| $10,000 to $14,999 | 0 | 0.0% |
| $15,000 to $24,999 | 10 | 4.6% |
| $25,000 to $34,999 | 24 | 11.1% |
| $35,000 to $49,999 | 31 | 14.4% |
| $50,000 to $74,999 | 34 | 15.7% |
| $75,000 to $99,999 | 47 | 21.8% |
| $100,000 to $149,999 | 51 | 23.6% |
| $150,000 to $199,999 | 9 | 4.2% |
| $200,000+ | 10 | 4.6% |
Household Income by Householder Age in De Witt
The median household income in De Witt is $79,000, with the highest median household income of $91,827 found in the 25 to 44 years age bracket for the primary householder. A total of 77 households (35.6%) fall into this category. Meanwhile, the 15 to 24 years age bracket for the primary householder has the lowest median household income of $0, with 2 households (0.9%) in this group.
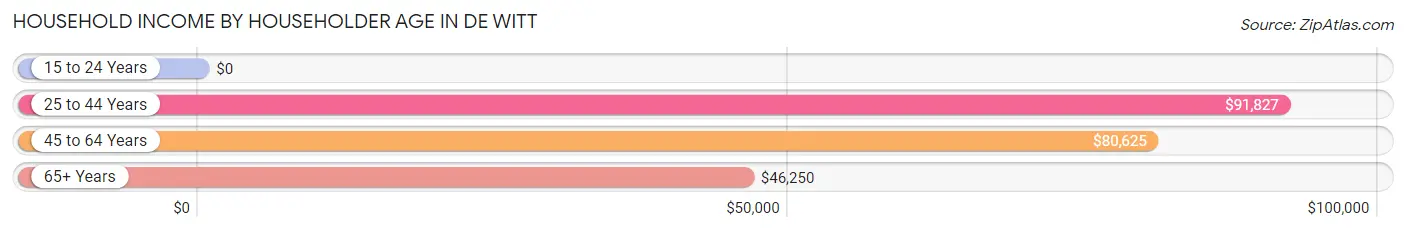
| Income Bracket | # Households | Median Income |
| 15 to 24 Years | 2 (0.9%) | $0 |
| 25 to 44 Years | 77 (35.6%) | $91,827 |
| 45 to 64 Years | 81 (37.5%) | $80,625 |
| 65+ Years | 56 (25.9%) | $46,250 |
| Total | 216 (100.0%) | $79,000 |
Poverty in De Witt
Income Below Poverty by Sex and Age in De Witt
With 2.4% poverty level for males and 1.9% for females among the residents of De Witt, 16 and 17 year old males and 12 to 14 year old females are the most vulnerable to poverty, with 2 males (100.0%) and 2 females (100.0%) in their respective age groups living below the poverty level.
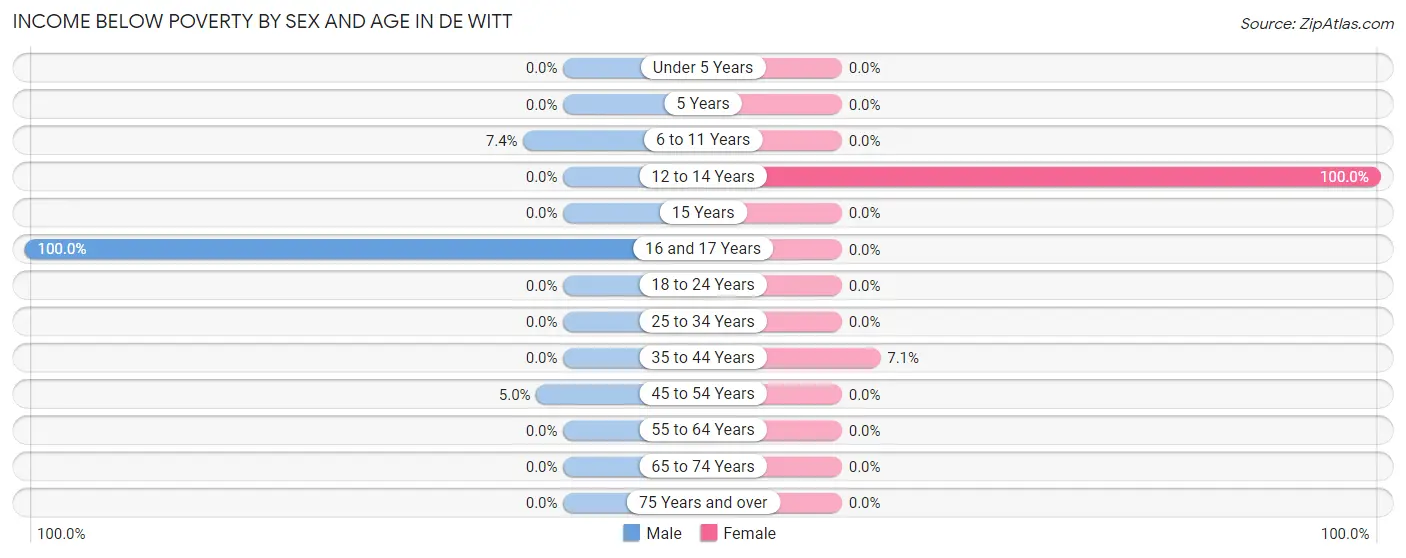
| Age Bracket | Male | Female |
| Under 5 Years | 0 (0.0%) | 0 (0.0%) |
| 5 Years | 0 (0.0%) | 0 (0.0%) |
| 6 to 11 Years | 2 (7.4%) | 0 (0.0%) |
| 12 to 14 Years | 0 (0.0%) | 2 (100.0%) |
| 15 Years | 0 (0.0%) | 0 (0.0%) |
| 16 and 17 Years | 2 (100.0%) | 0 (0.0%) |
| 18 to 24 Years | 0 (0.0%) | 0 (0.0%) |
| 25 to 34 Years | 0 (0.0%) | 0 (0.0%) |
| 35 to 44 Years | 0 (0.0%) | 3 (7.1%) |
| 45 to 54 Years | 2 (5.0%) | 0 (0.0%) |
| 55 to 64 Years | 0 (0.0%) | 0 (0.0%) |
| 65 to 74 Years | 0 (0.0%) | 0 (0.0%) |
| 75 Years and over | 0 (0.0%) | 0 (0.0%) |
| Total | 6 (2.4%) | 5 (1.9%) |
Income Above Poverty by Sex and Age in De Witt
According to the poverty statistics in De Witt, males aged under 5 years and females aged under 5 years are the age groups that are most secure financially, with 100.0% of males and 100.0% of females in these age groups living above the poverty line.
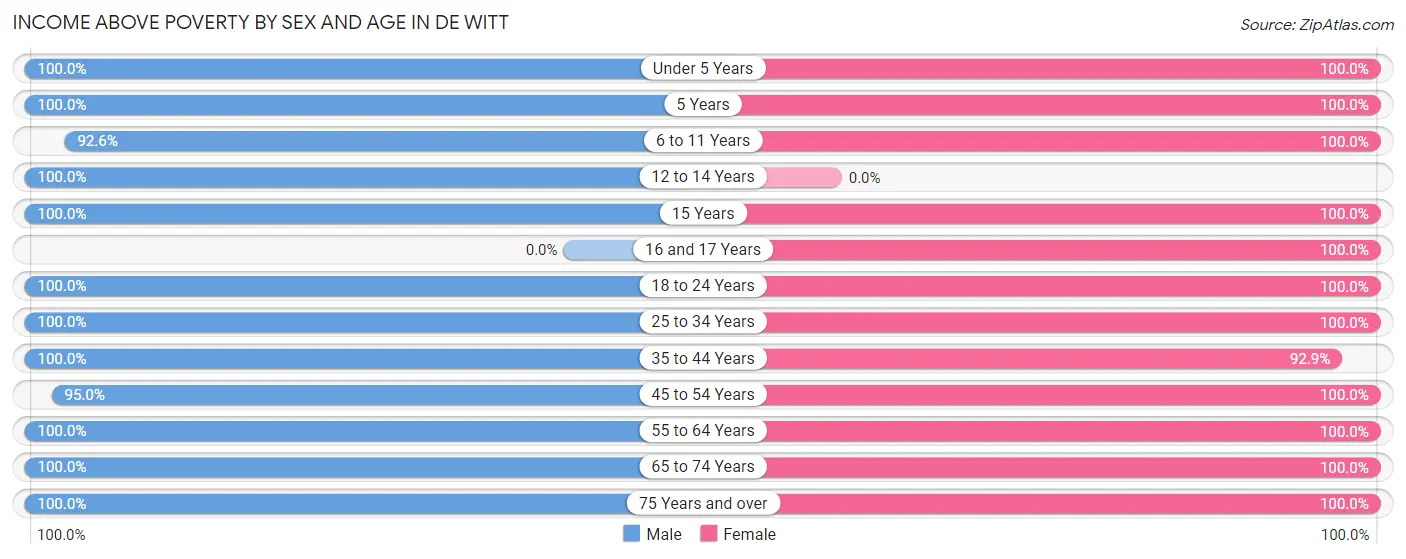
| Age Bracket | Male | Female |
| Under 5 Years | 9 (100.0%) | 8 (100.0%) |
| 5 Years | 10 (100.0%) | 2 (100.0%) |
| 6 to 11 Years | 25 (92.6%) | 32 (100.0%) |
| 12 to 14 Years | 6 (100.0%) | 0 (0.0%) |
| 15 Years | 3 (100.0%) | 2 (100.0%) |
| 16 and 17 Years | 0 (0.0%) | 20 (100.0%) |
| 18 to 24 Years | 5 (100.0%) | 5 (100.0%) |
| 25 to 34 Years | 32 (100.0%) | 16 (100.0%) |
| 35 to 44 Years | 53 (100.0%) | 39 (92.9%) |
| 45 to 54 Years | 38 (95.0%) | 38 (100.0%) |
| 55 to 64 Years | 25 (100.0%) | 43 (100.0%) |
| 65 to 74 Years | 21 (100.0%) | 23 (100.0%) |
| 75 Years and over | 13 (100.0%) | 31 (100.0%) |
| Total | 240 (97.6%) | 259 (98.1%) |
Income Below Poverty Among Married-Couple Families in De Witt
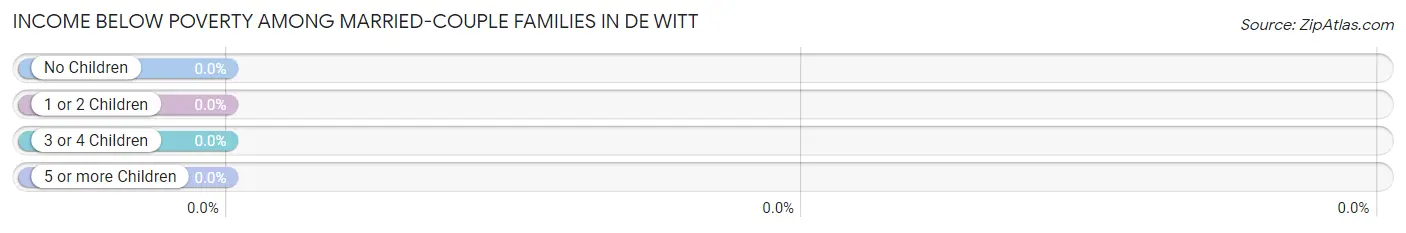
| Children | Above Poverty | Below Poverty |
| No Children | 62 (100.0%) | 0 (0.0%) |
| 1 or 2 Children | 42 (100.0%) | 0 (0.0%) |
| 3 or 4 Children | 18 (100.0%) | 0 (0.0%) |
| 5 or more Children | 0 (0.0%) | 0 (0.0%) |
| Total | 122 (100.0%) | 0 (0.0%) |
Income Below Poverty Among Single-Parent Households in De Witt
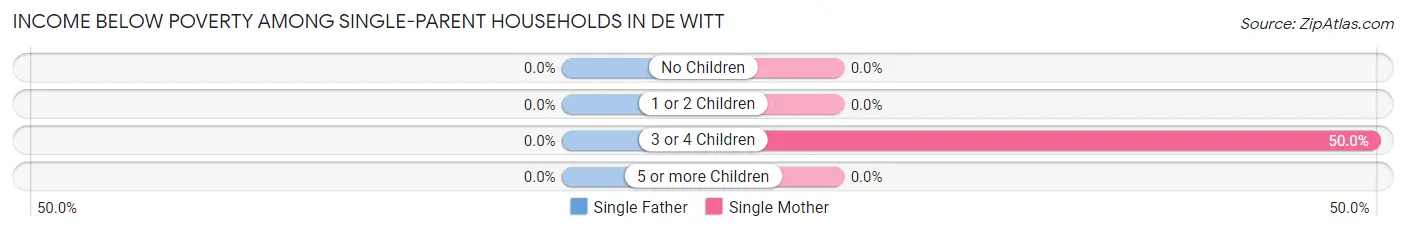
| Children | Single Father | Single Mother |
| No Children | 0 (0.0%) | 0 (0.0%) |
| 1 or 2 Children | 0 (0.0%) | 0 (0.0%) |
| 3 or 4 Children | 0 (0.0%) | 3 (50.0%) |
| 5 or more Children | 0 (0.0%) | 0 (0.0%) |
| Total | 0 (0.0%) | 3 (33.3%) |
Income Below Poverty Among Married-Couple vs Single-Parent Households in De Witt
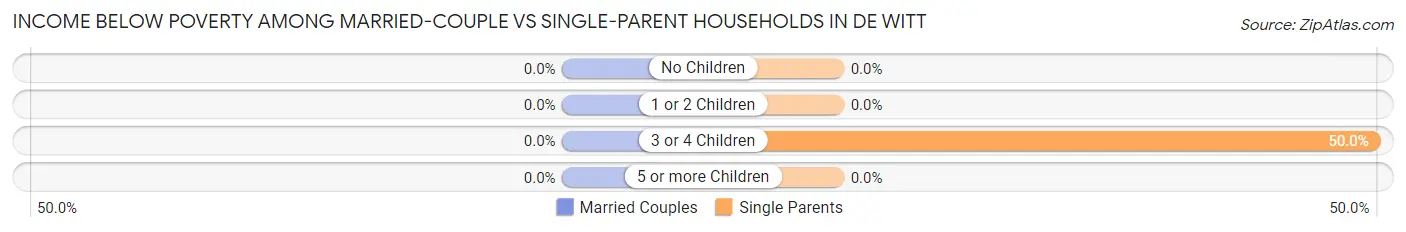
| Children | Married-Couple Families | Single-Parent Households |
| No Children | 0 (0.0%) | 0 (0.0%) |
| 1 or 2 Children | 0 (0.0%) | 0 (0.0%) |
| 3 or 4 Children | 0 (0.0%) | 3 (50.0%) |
| 5 or more Children | 0 (0.0%) | 0 (0.0%) |
| Total | 0 (0.0%) | 3 (11.5%) |
Race in De Witt
The most populous races in De Witt are White / Caucasian (488 | 95.3%), Hispanic or Latino (24 | 4.7%), and Two or more Races (24 | 4.7%).
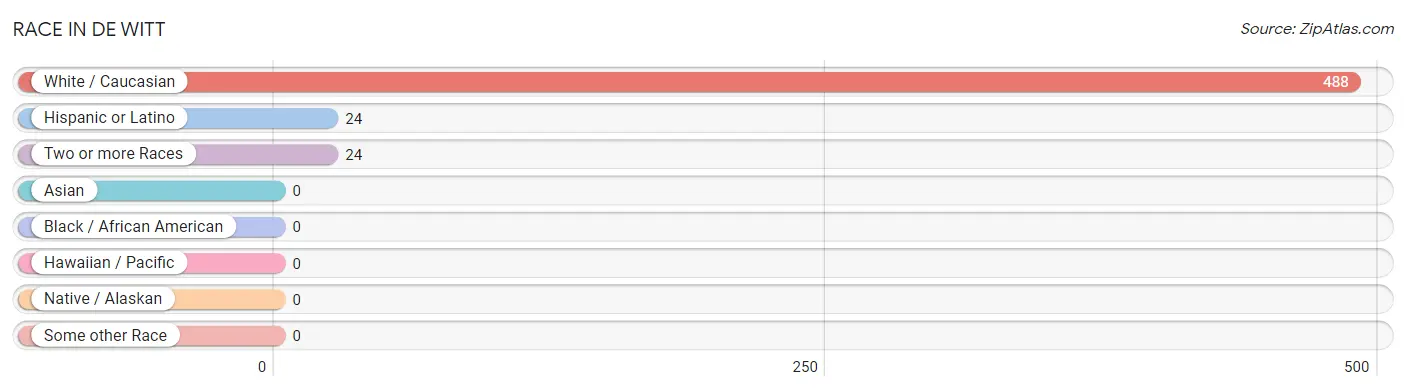
| Race | # Population | % Population |
| Asian | 0 | 0.0% |
| Black / African American | 0 | 0.0% |
| Hawaiian / Pacific | 0 | 0.0% |
| Hispanic or Latino | 24 | 4.7% |
| Native / Alaskan | 0 | 0.0% |
| White / Caucasian | 488 | 95.3% |
| Two or more Races | 24 | 4.7% |
| Some other Race | 0 | 0.0% |
| Total | 512 | 100.0% |
Ancestry in De Witt
The most populous ancestries reported in De Witt are German (255 | 49.8%), Czech (40 | 7.8%), English (38 | 7.4%), Norwegian (36 | 7.0%), and French Canadian (34 | 6.6%), together accounting for 78.7% of all De Witt residents.
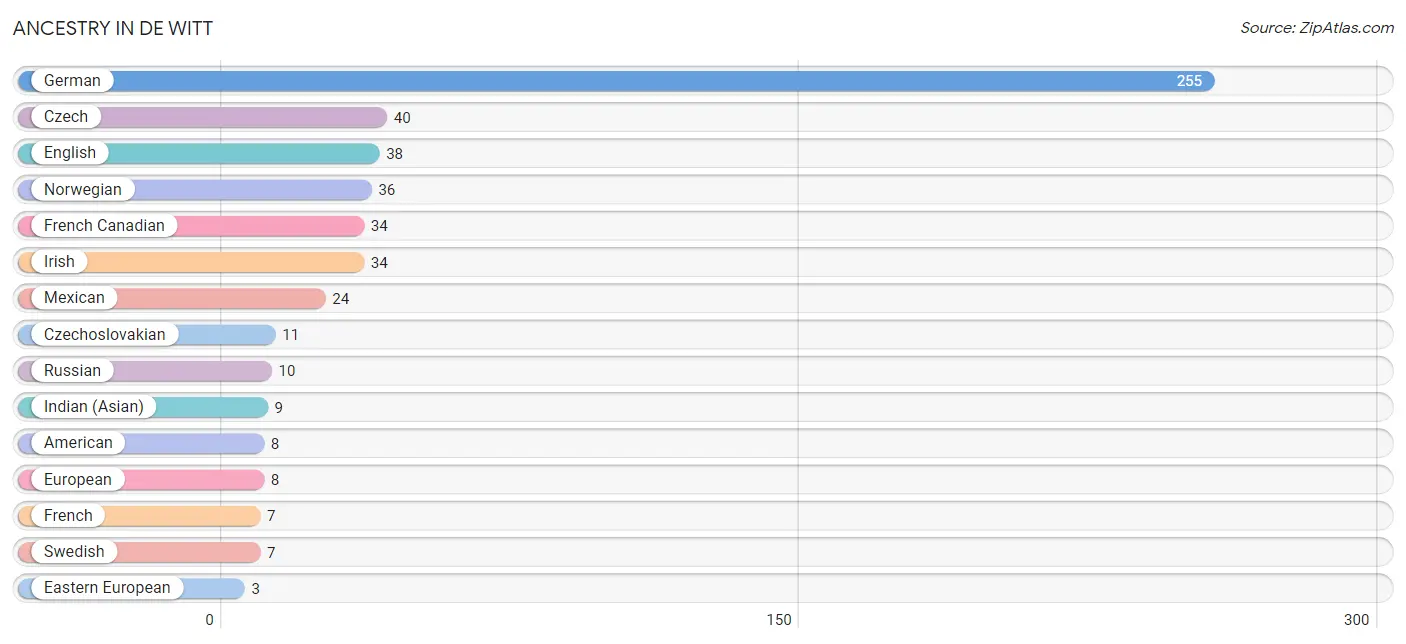
| Ancestry | # Population | % Population |
| American | 8 | 1.6% |
| Czech | 40 | 7.8% |
| Czechoslovakian | 11 | 2.1% |
| Dutch | 1 | 0.2% |
| Eastern European | 3 | 0.6% |
| English | 38 | 7.4% |
| European | 8 | 1.6% |
| French | 7 | 1.4% |
| French Canadian | 34 | 6.6% |
| German | 255 | 49.8% |
| Indian (Asian) | 9 | 1.8% |
| Irish | 34 | 6.6% |
| Italian | 1 | 0.2% |
| Mexican | 24 | 4.7% |
| Norwegian | 36 | 7.0% |
| Polish | 1 | 0.2% |
| Russian | 10 | 1.9% |
| Scotch-Irish | 2 | 0.4% |
| Scottish | 2 | 0.4% |
| Swedish | 7 | 1.4% |
| Welsh | 3 | 0.6% | View All 21 Rows |
Immigrants in De Witt
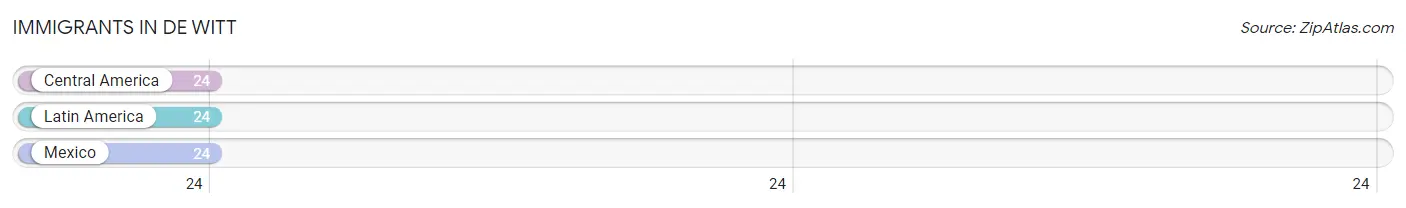
The most numerous immigrant groups reported in De Witt came from Central America (24 | 4.7%), Latin America (24 | 4.7%), and Mexico (24 | 4.7%), together accounting for 14.1% of all De Witt residents.
| Immigration Origin | # Population | % Population |
| Central America | 24 | 4.7% |
| Latin America | 24 | 4.7% |
| Mexico | 24 | 4.7% | View All 3 Rows |
Sex and Age in De Witt
Sex and Age in De Witt
The most populous age groups in De Witt are 40 to 44 Years (40 | 16.1%) for men and 60 to 64 Years (32 | 12.1%) for women.
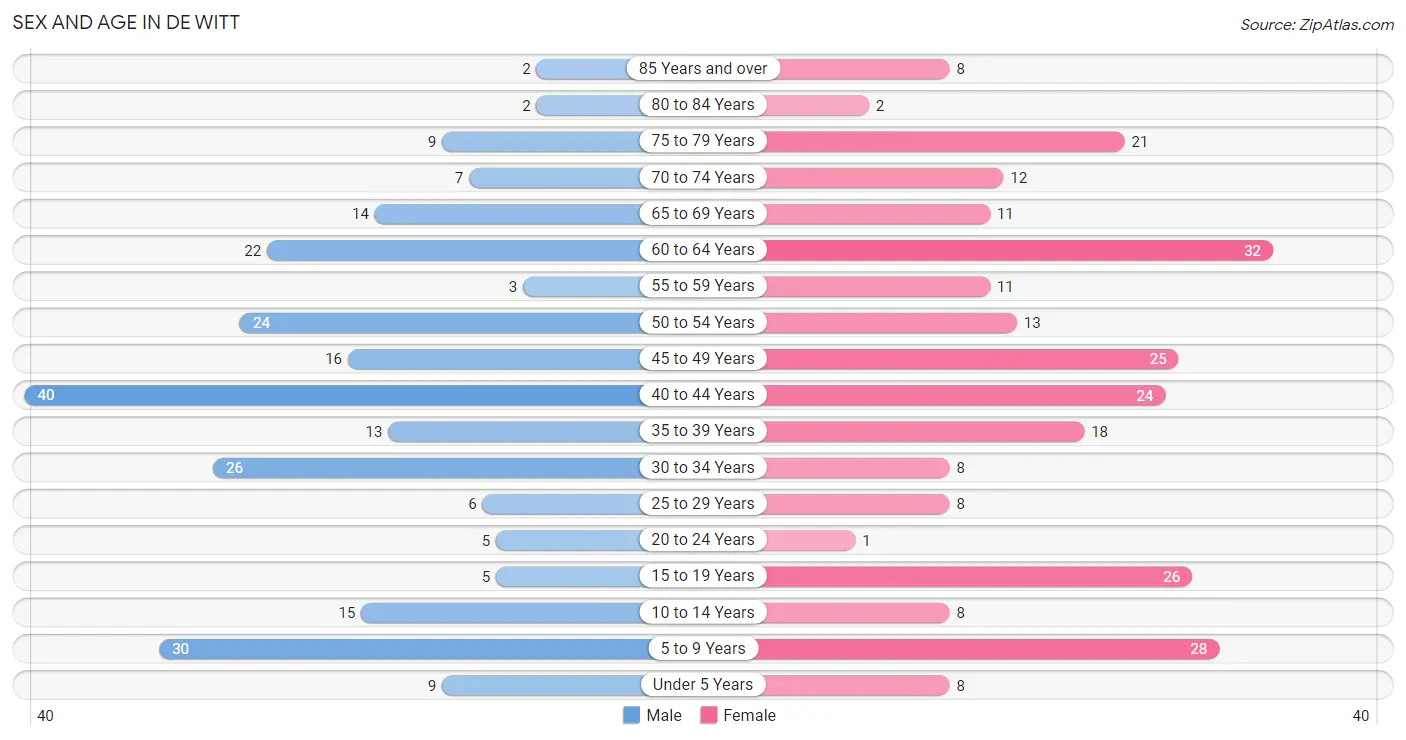
| Age Bracket | Male | Female |
| Under 5 Years | 9 (3.6%) | 8 (3.0%) |
| 5 to 9 Years | 30 (12.1%) | 28 (10.6%) |
| 10 to 14 Years | 15 (6.0%) | 8 (3.0%) |
| 15 to 19 Years | 5 (2.0%) | 26 (9.9%) |
| 20 to 24 Years | 5 (2.0%) | 1 (0.4%) |
| 25 to 29 Years | 6 (2.4%) | 8 (3.0%) |
| 30 to 34 Years | 26 (10.5%) | 8 (3.0%) |
| 35 to 39 Years | 13 (5.2%) | 18 (6.8%) |
| 40 to 44 Years | 40 (16.1%) | 24 (9.1%) |
| 45 to 49 Years | 16 (6.5%) | 25 (9.5%) |
| 50 to 54 Years | 24 (9.7%) | 13 (4.9%) |
| 55 to 59 Years | 3 (1.2%) | 11 (4.2%) |
| 60 to 64 Years | 22 (8.9%) | 32 (12.1%) |
| 65 to 69 Years | 14 (5.7%) | 11 (4.2%) |
| 70 to 74 Years | 7 (2.8%) | 12 (4.5%) |
| 75 to 79 Years | 9 (3.6%) | 21 (8.0%) |
| 80 to 84 Years | 2 (0.8%) | 2 (0.8%) |
| 85 Years and over | 2 (0.8%) | 8 (3.0%) |
| Total | 248 (100.0%) | 264 (100.0%) |
Families and Households in De Witt
Median Family Size in De Witt
The median family size in De Witt is 2.84 persons per family, with single female/mother families (9 | 6.1%) accounting for the largest median family size of 3.22 persons per family. On the other hand, married-couple families (122 | 82.4%) represent the smallest median family size with 2.80 persons per family.
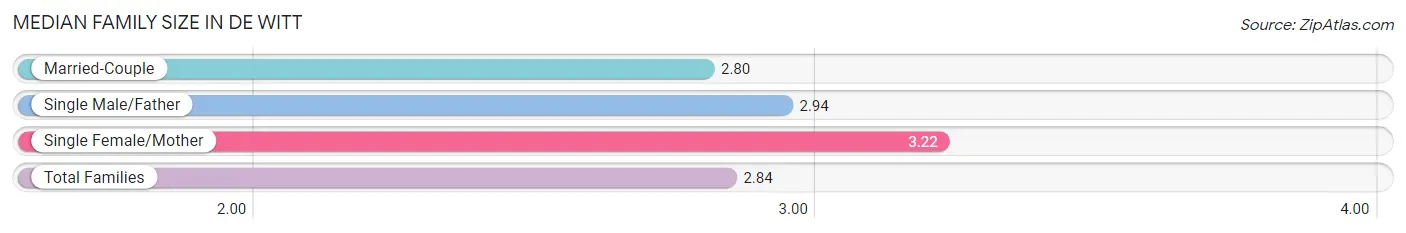
| Family Type | # Families | Family Size |
| Married-Couple | 122 (82.4%) | 2.80 |
| Single Male/Father | 17 (11.5%) | 2.94 |
| Single Female/Mother | 9 (6.1%) | 3.22 |
| Total Families | 148 (100.0%) | 2.84 |
Median Household Size in De Witt
The median household size in De Witt is 2.37 persons per household, with single female/mother households (9 | 4.2%) accounting for the largest median household size of 3.67 persons per household. non-family households (68 | 31.5%) represent the smallest median household size with 1.24 persons per household.
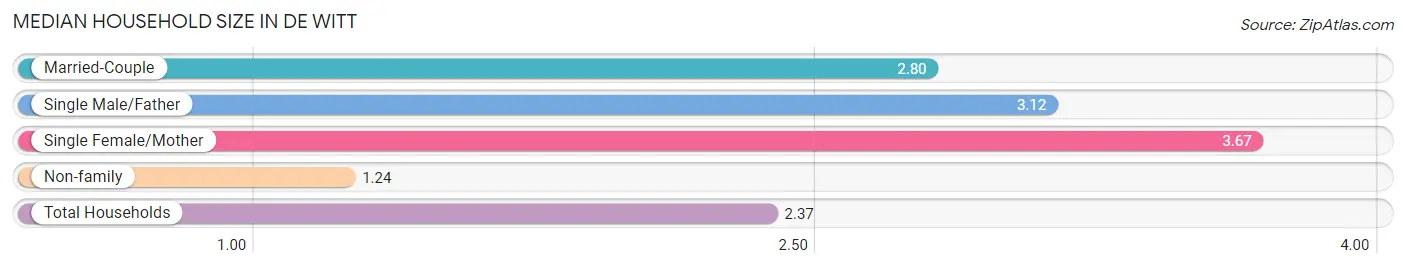
| Household Type | # Households | Household Size |
| Married-Couple | 122 (56.5%) | 2.80 |
| Single Male/Father | 17 (7.9%) | 3.12 |
| Single Female/Mother | 9 (4.2%) | 3.67 |
| Non-family | 68 (31.5%) | 1.24 |
| Total Households | 216 (100.0%) | 2.37 |
Household Size by Marriage Status in De Witt
Out of a total of 216 households in De Witt, 148 (68.5%) are family households, while 68 (31.5%) are nonfamily households. The most numerous type of family households are 2-person households, comprising 65, and the most common type of nonfamily households are 1-person households, comprising 48.
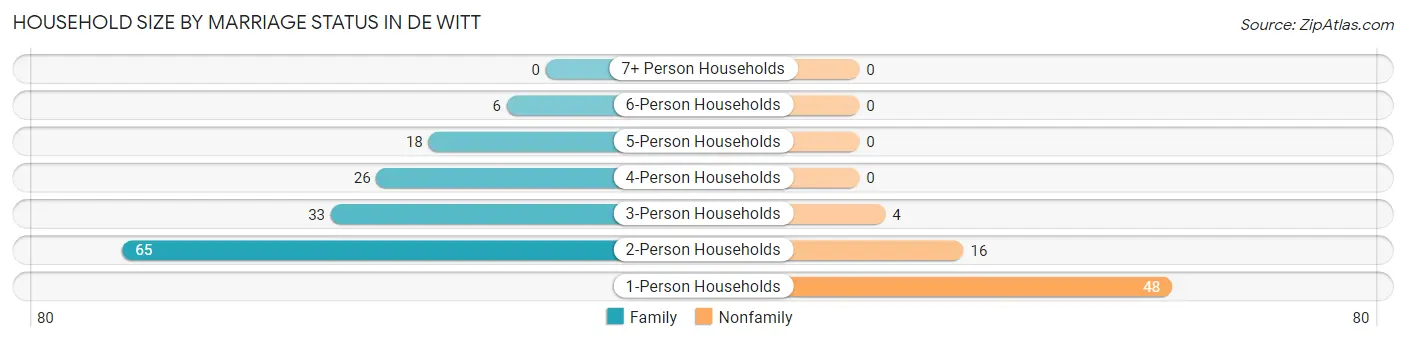
| Household Size | Family Households | Nonfamily Households |
| 1-Person Households | - | 48 (22.2%) |
| 2-Person Households | 65 (30.1%) | 16 (7.4%) |
| 3-Person Households | 33 (15.3%) | 4 (1.8%) |
| 4-Person Households | 26 (12.0%) | 0 (0.0%) |
| 5-Person Households | 18 (8.3%) | 0 (0.0%) |
| 6-Person Households | 6 (2.8%) | 0 (0.0%) |
| 7+ Person Households | 0 (0.0%) | 0 (0.0%) |
| Total | 148 (68.5%) | 68 (31.5%) |
Female Fertility in De Witt
Fertility by Age in De Witt
Average fertility rate in De Witt is 72.0 births per 1,000 women. Women in the age bracket of 20 to 34 years have the highest fertility rate with 471.0 births per 1,000 women. Women in the age bracket of 20 to 34 years acount for 100.0% of all women with births.
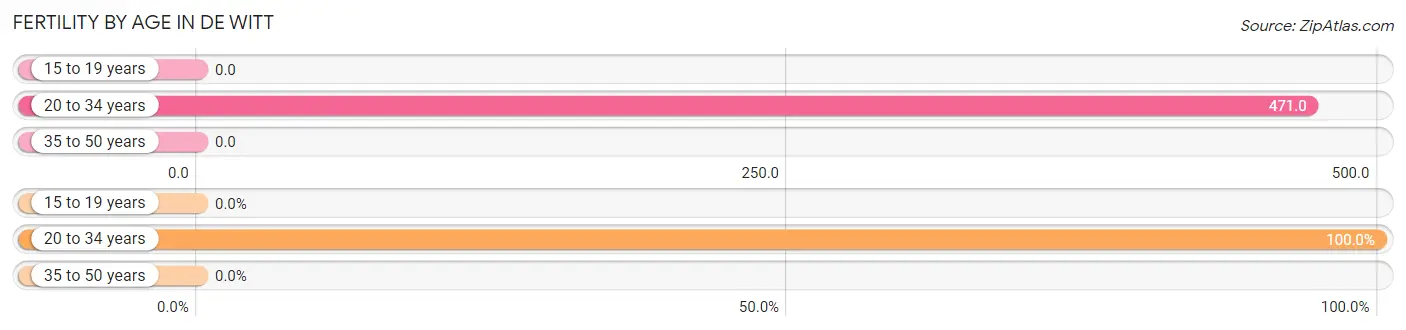
| Age Bracket | Women with Births | Births / 1,000 Women |
| 15 to 19 years | 0 (0.0%) | 0.0 |
| 20 to 34 years | 8 (100.0%) | 471.0 |
| 35 to 50 years | 0 (0.0%) | 0.0 |
| Total | 8 (100.0%) | 72.0 |
Fertility by Age by Marriage Status in De Witt
62.5% of women with births (8) in De Witt are married. The highest percentage of unmarried women with births falls into 20 to 34 years age bracket with 37.5% of them unmarried at the time of birth, while the lowest percentage of unmarried women with births belong to 20 to 34 years age bracket with 37.5% of them unmarried.
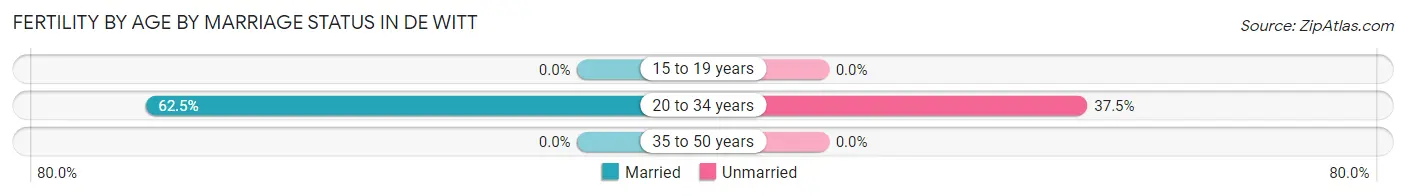
| Age Bracket | Married | Unmarried |
| 15 to 19 years | 0 (0.0%) | 0 (0.0%) |
| 20 to 34 years | 5 (62.5%) | 3 (37.5%) |
| 35 to 50 years | 0 (0.0%) | 0 (0.0%) |
| Total | 5 (62.5%) | 3 (37.5%) |
Fertility by Education in De Witt
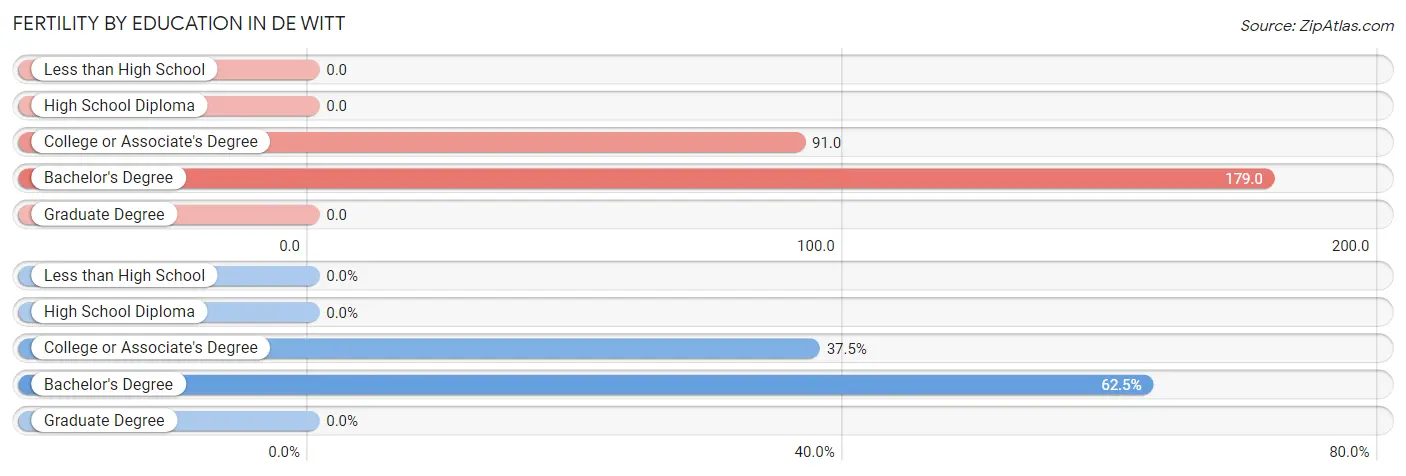
| Educational Attainment | Women with Births | Births / 1,000 Women |
| Less than High School | 0 (0.0%) | 0.0 |
| High School Diploma | 0 (0.0%) | 0.0 |
| College or Associate's Degree | 3 (37.5%) | 91.0 |
| Bachelor's Degree | 5 (62.5%) | 179.0 |
| Graduate Degree | 0 (0.0%) | 0.0 |
| Total | 8 (100.0%) | 72.0 |
Fertility by Education by Marriage Status in De Witt
37.5% of women with births in De Witt are unmarried. Women with the educational attainment of bachelor's degree are most likely to be married with 100.0% of them married at childbirth, while women with the educational attainment of college or associate's degree are least likely to be married with 100.0% of them unmarried at childbirth.
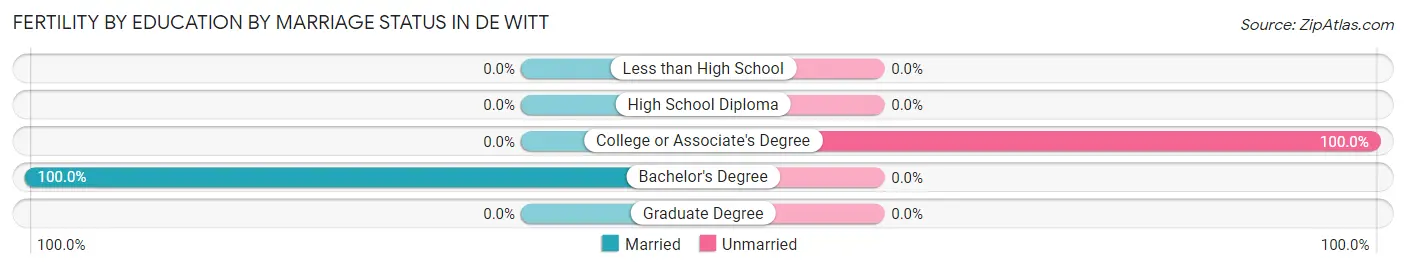
| Educational Attainment | Married | Unmarried |
| Less than High School | 0 (0.0%) | 0 (0.0%) |
| High School Diploma | 0 (0.0%) | 0 (0.0%) |
| College or Associate's Degree | 0 (0.0%) | 3 (100.0%) |
| Bachelor's Degree | 5 (100.0%) | 0 (0.0%) |
| Graduate Degree | 0 (0.0%) | 0 (0.0%) |
| Total | 5 (62.5%) | 3 (37.5%) |
Employment Characteristics in De Witt
Employment by Class of Employer in De Witt
Among the 279 employed individuals in De Witt, private company employees (177 | 63.4%), not-for-profit organizations (51 | 18.3%), and state government employees (21 | 7.5%) make up the most common classes of employment.
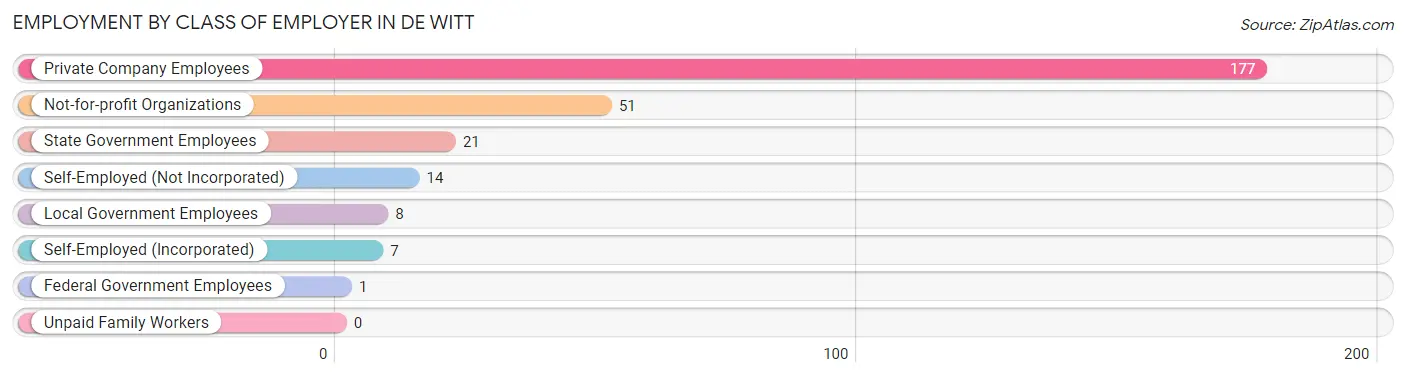
| Employer Class | # Employees | % Employees |
| Private Company Employees | 177 | 63.4% |
| Self-Employed (Incorporated) | 7 | 2.5% |
| Self-Employed (Not Incorporated) | 14 | 5.0% |
| Not-for-profit Organizations | 51 | 18.3% |
| Local Government Employees | 8 | 2.9% |
| State Government Employees | 21 | 7.5% |
| Federal Government Employees | 1 | 0.4% |
| Unpaid Family Workers | 0 | 0.0% |
| Total | 279 | 100.0% |
Employment Status by Age in De Witt
According to the labor force statistics for De Witt, out of the total population over 16 years of age (409), 70.9% or 290 individuals are in the labor force, with 1.0% or 3 of them unemployed. The age group with the highest labor force participation rate is 25 to 29 years, with 100.0% or 14 individuals in the labor force. Within the labor force, the 20 to 24 years age range has the highest percentage of unemployed individuals, with 20.0% or 1 of them being unemployed.
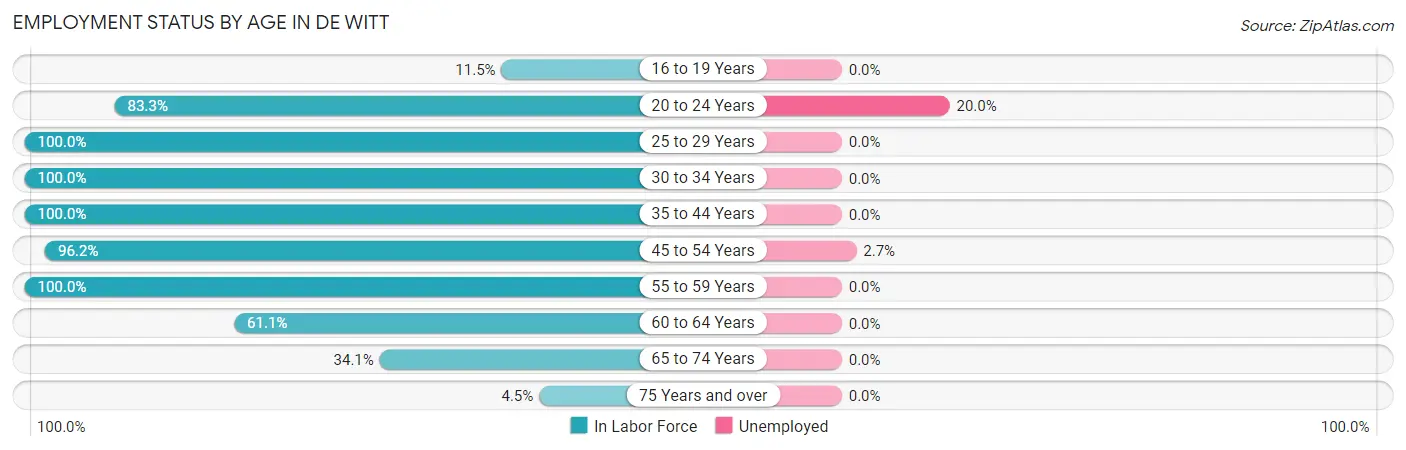
| Age Bracket | In Labor Force | Unemployed |
| 16 to 19 Years | 3 (11.5%) | 0 (0.0%) |
| 20 to 24 Years | 5 (83.3%) | 1 (20.0%) |
| 25 to 29 Years | 14 (100.0%) | 0 (0.0%) |
| 30 to 34 Years | 34 (100.0%) | 0 (0.0%) |
| 35 to 44 Years | 95 (100.0%) | 0 (0.0%) |
| 45 to 54 Years | 75 (96.2%) | 2 (2.7%) |
| 55 to 59 Years | 14 (100.0%) | 0 (0.0%) |
| 60 to 64 Years | 33 (61.1%) | 0 (0.0%) |
| 65 to 74 Years | 15 (34.1%) | 0 (0.0%) |
| 75 Years and over | 2 (4.5%) | 0 (0.0%) |
| Total | 290 (70.9%) | 3 (1.0%) |
Employment Status by Educational Attainment in De Witt
According to labor force statistics for De Witt, 91.7% of individuals (265) out of the total population between 25 and 64 years of age (289) are in the labor force, with 0.8% or 2 of them being unemployed. The group with the highest labor force participation rate are those with the educational attainment of bachelor's degree or higher, with 100.0% or 69 individuals in the labor force. Within the labor force, individuals with college / associate degree education have the highest percentage of unemployment, with 2.0% or 2 of them being unemployed.
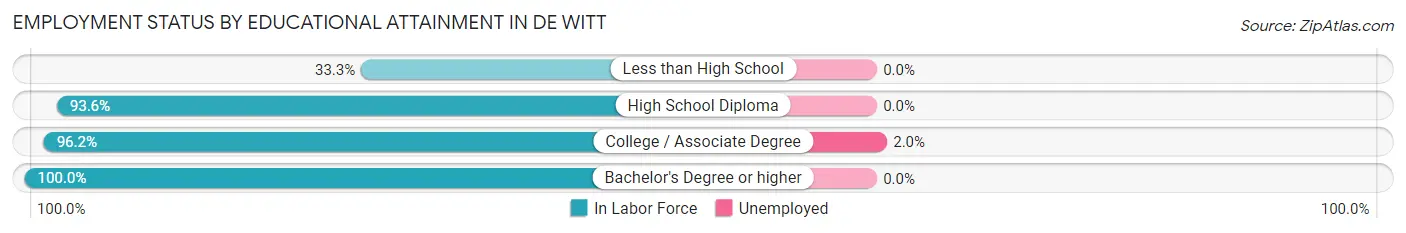
| Educational Attainment | In Labor Force | Unemployed |
| Less than High School | 7 (33.3%) | 0 (0.0%) |
| High School Diploma | 88 (93.6%) | 0 (0.0%) |
| College / Associate Degree | 101 (96.2%) | 2 (2.0%) |
| Bachelor's Degree or higher | 69 (100.0%) | 0 (0.0%) |
| Total | 265 (91.7%) | 2 (0.8%) |
Employment Occupations by Sex in De Witt
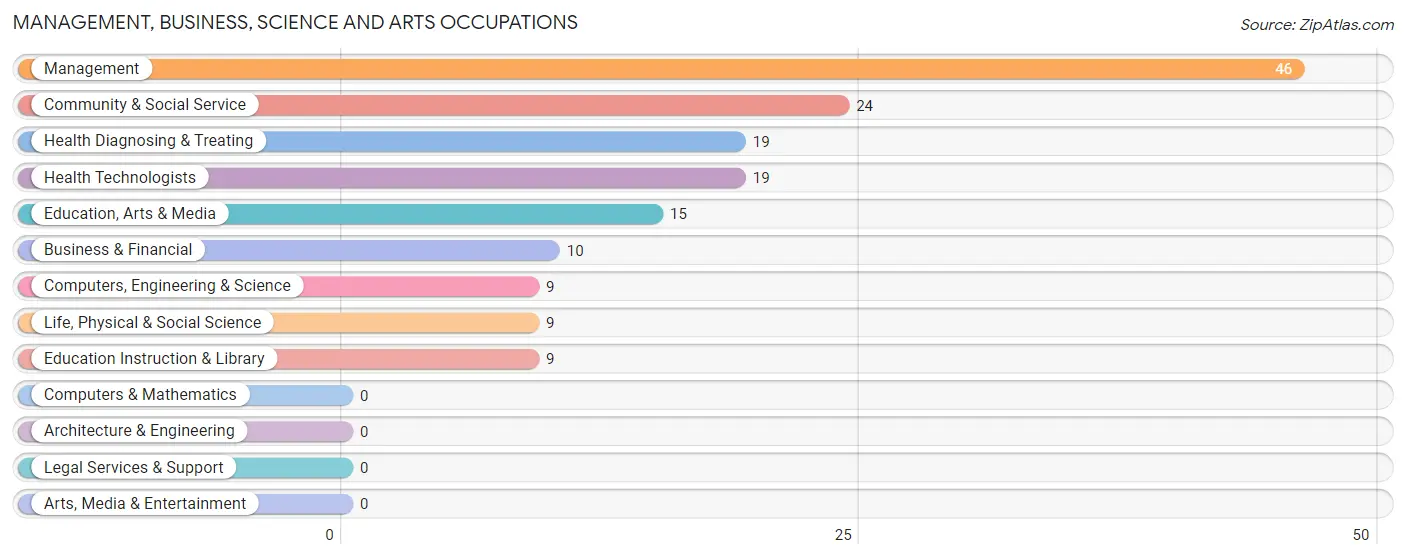
Management, Business, Science and Arts Occupations
The most common Management, Business, Science and Arts occupations in De Witt are Management (46 | 16.0%), Community & Social Service (24 | 8.4%), Health Diagnosing & Treating (19 | 6.6%), Health Technologists (19 | 6.6%), and Education, Arts & Media (15 | 5.2%).
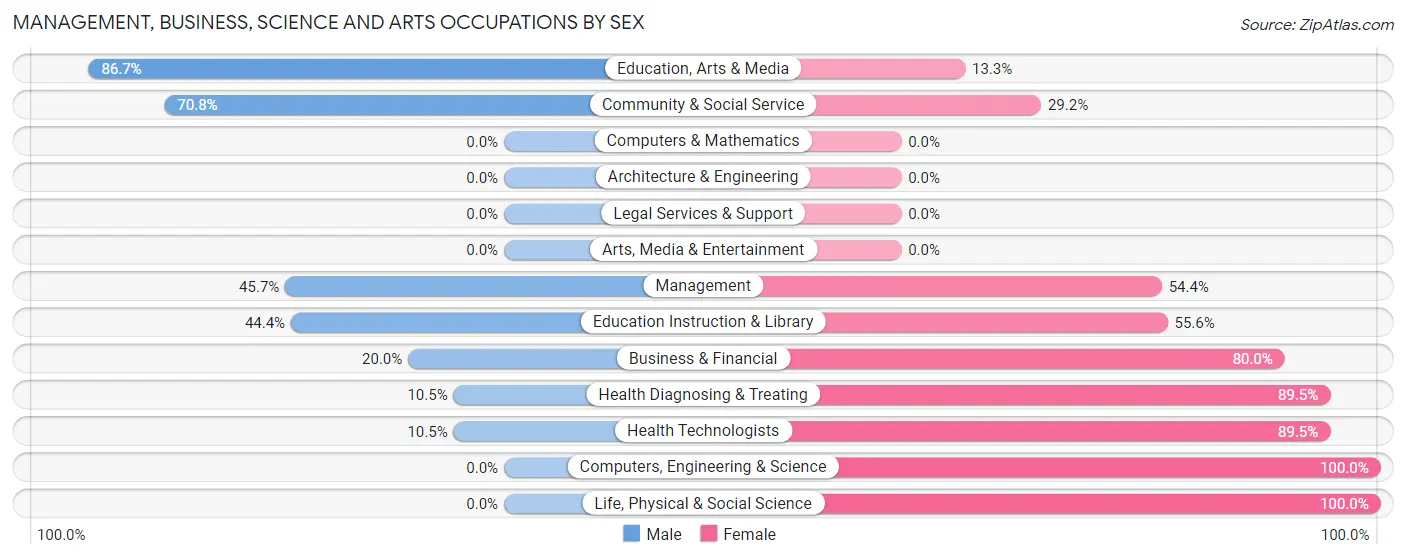
Management, Business, Science and Arts Occupations by Sex
Within the Management, Business, Science and Arts occupations in De Witt, the most male-oriented occupations are Education, Arts & Media (86.7%), Community & Social Service (70.8%), and Management (45.7%), while the most female-oriented occupations are Computers, Engineering & Science (100.0%), Life, Physical & Social Science (100.0%), and Health Diagnosing & Treating (89.5%).
| Occupation | Male | Female |
| Management | 21 (45.7%) | 25 (54.3%) |
| Business & Financial | 2 (20.0%) | 8 (80.0%) |
| Computers, Engineering & Science | 0 (0.0%) | 9 (100.0%) |
| Computers & Mathematics | 0 (0.0%) | 0 (0.0%) |
| Architecture & Engineering | 0 (0.0%) | 0 (0.0%) |
| Life, Physical & Social Science | 0 (0.0%) | 9 (100.0%) |
| Community & Social Service | 17 (70.8%) | 7 (29.2%) |
| Education, Arts & Media | 13 (86.7%) | 2 (13.3%) |
| Legal Services & Support | 0 (0.0%) | 0 (0.0%) |
| Education Instruction & Library | 4 (44.4%) | 5 (55.6%) |
| Arts, Media & Entertainment | 0 (0.0%) | 0 (0.0%) |
| Health Diagnosing & Treating | 2 (10.5%) | 17 (89.5%) |
| Health Technologists | 2 (10.5%) | 17 (89.5%) |
| Total (Category) | 42 (38.9%) | 66 (61.1%) |
| Total (Overall) | 156 (54.4%) | 131 (45.6%) |
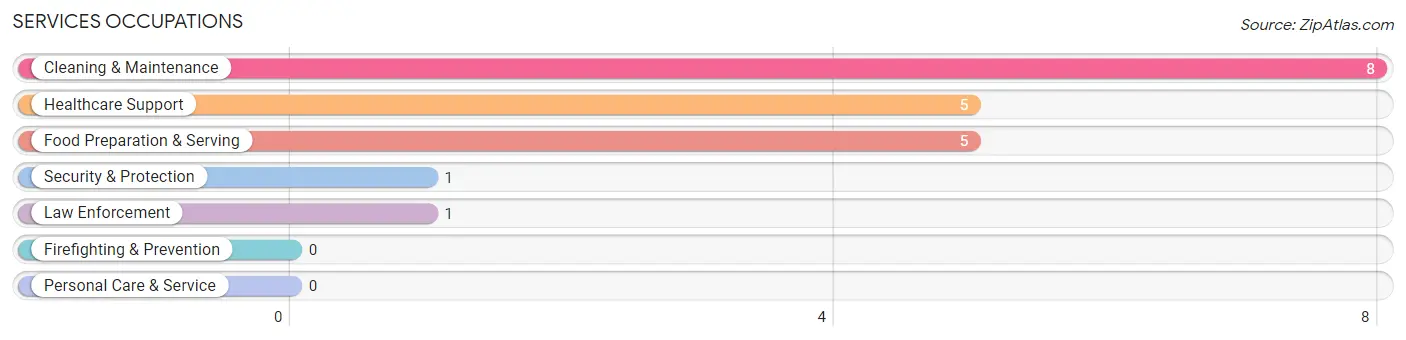
Services Occupations
The most common Services occupations in De Witt are Cleaning & Maintenance (8 | 2.8%), Healthcare Support (5 | 1.7%), Food Preparation & Serving (5 | 1.7%), Security & Protection (1 | 0.4%), and Law Enforcement (1 | 0.4%).
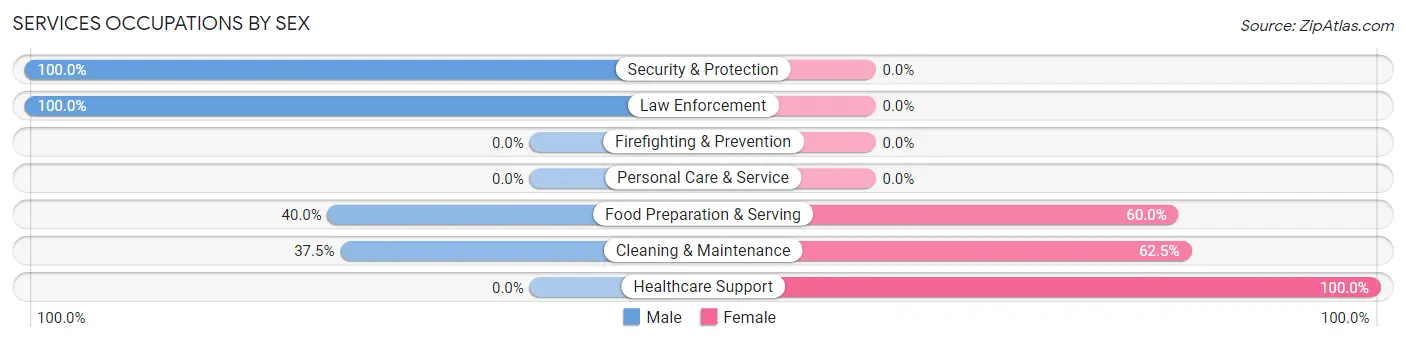
Services Occupations by Sex
Within the Services occupations in De Witt, the most male-oriented occupations are Security & Protection (100.0%), Law Enforcement (100.0%), and Food Preparation & Serving (40.0%), while the most female-oriented occupations are Healthcare Support (100.0%), Cleaning & Maintenance (62.5%), and Food Preparation & Serving (60.0%).
| Occupation | Male | Female |
| Healthcare Support | 0 (0.0%) | 5 (100.0%) |
| Security & Protection | 1 (100.0%) | 0 (0.0%) |
| Firefighting & Prevention | 0 (0.0%) | 0 (0.0%) |
| Law Enforcement | 1 (100.0%) | 0 (0.0%) |
| Food Preparation & Serving | 2 (40.0%) | 3 (60.0%) |
| Cleaning & Maintenance | 3 (37.5%) | 5 (62.5%) |
| Personal Care & Service | 0 (0.0%) | 0 (0.0%) |
| Total (Category) | 6 (31.6%) | 13 (68.4%) |
| Total (Overall) | 156 (54.4%) | 131 (45.6%) |
Sales and Office Occupations
The most common Sales and Office occupations in De Witt are Office & Administration (33 | 11.5%), and Sales & Related (24 | 8.4%).
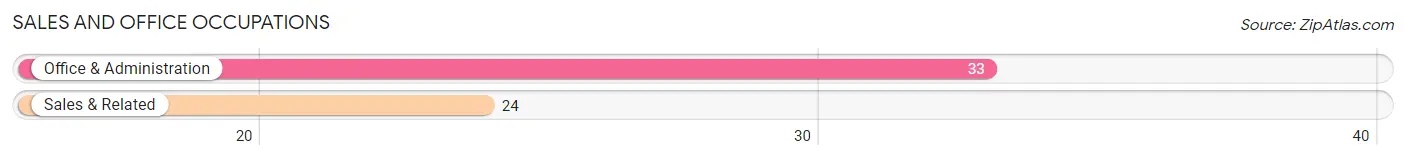
Sales and Office Occupations by Sex

| Occupation | Male | Female |
| Sales & Related | 5 (20.8%) | 19 (79.2%) |
| Office & Administration | 6 (18.2%) | 27 (81.8%) |
| Total (Category) | 11 (19.3%) | 46 (80.7%) |
| Total (Overall) | 156 (54.4%) | 131 (45.6%) |
Natural Resources, Construction and Maintenance Occupations
The most common Natural Resources, Construction and Maintenance occupations in De Witt are Installation, Maintenance & Repair (26 | 9.1%), Construction & Extraction (7 | 2.4%), and Farming, Fishing & Forestry (6 | 2.1%).
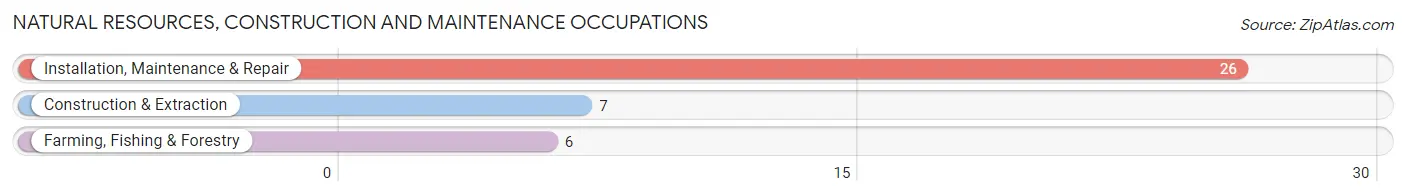
Natural Resources, Construction and Maintenance Occupations by Sex
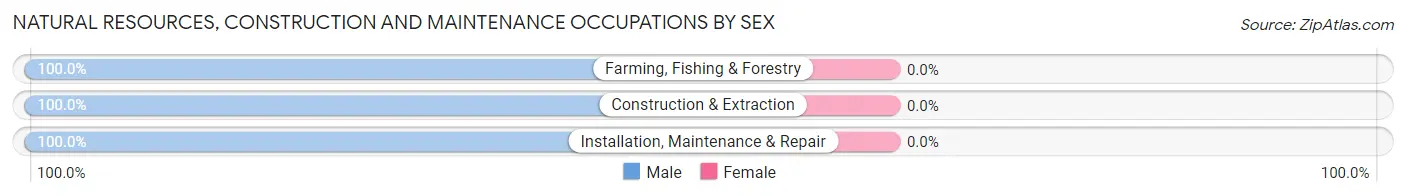
| Occupation | Male | Female |
| Farming, Fishing & Forestry | 6 (100.0%) | 0 (0.0%) |
| Construction & Extraction | 7 (100.0%) | 0 (0.0%) |
| Installation, Maintenance & Repair | 26 (100.0%) | 0 (0.0%) |
| Total (Category) | 39 (100.0%) | 0 (0.0%) |
| Total (Overall) | 156 (54.4%) | 131 (45.6%) |
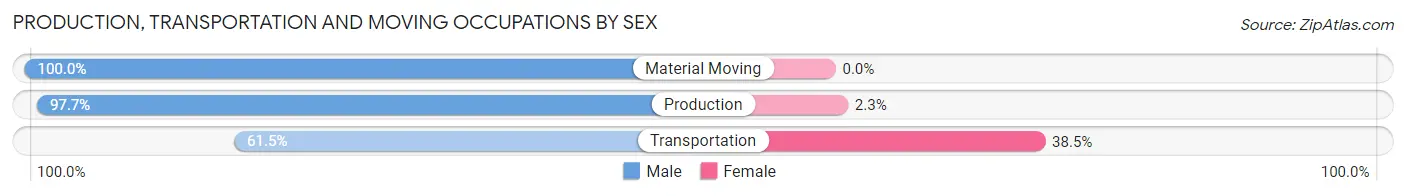
Production, Transportation and Moving Occupations
The most common Production, Transportation and Moving occupations in De Witt are Production (44 | 15.3%), Transportation (13 | 4.5%), and Material Moving (7 | 2.4%).
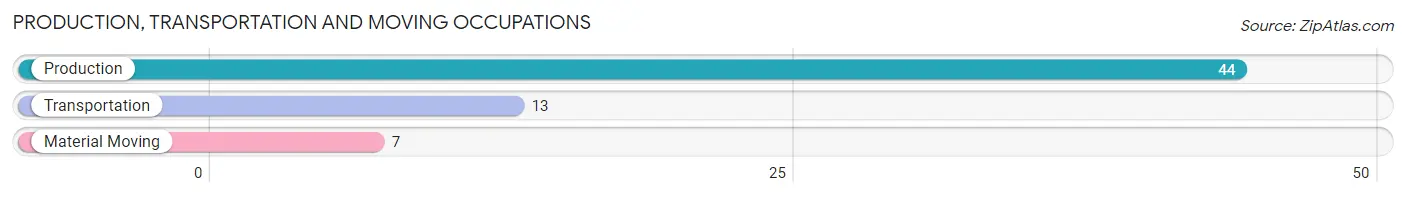
Production, Transportation and Moving Occupations by Sex
| Occupation | Male | Female |
| Production | 43 (97.7%) | 1 (2.3%) |
| Transportation | 8 (61.5%) | 5 (38.5%) |
| Material Moving | 7 (100.0%) | 0 (0.0%) |
| Total (Category) | 58 (90.6%) | 6 (9.4%) |
| Total (Overall) | 156 (54.4%) | 131 (45.6%) |
Employment Industries by Sex in De Witt
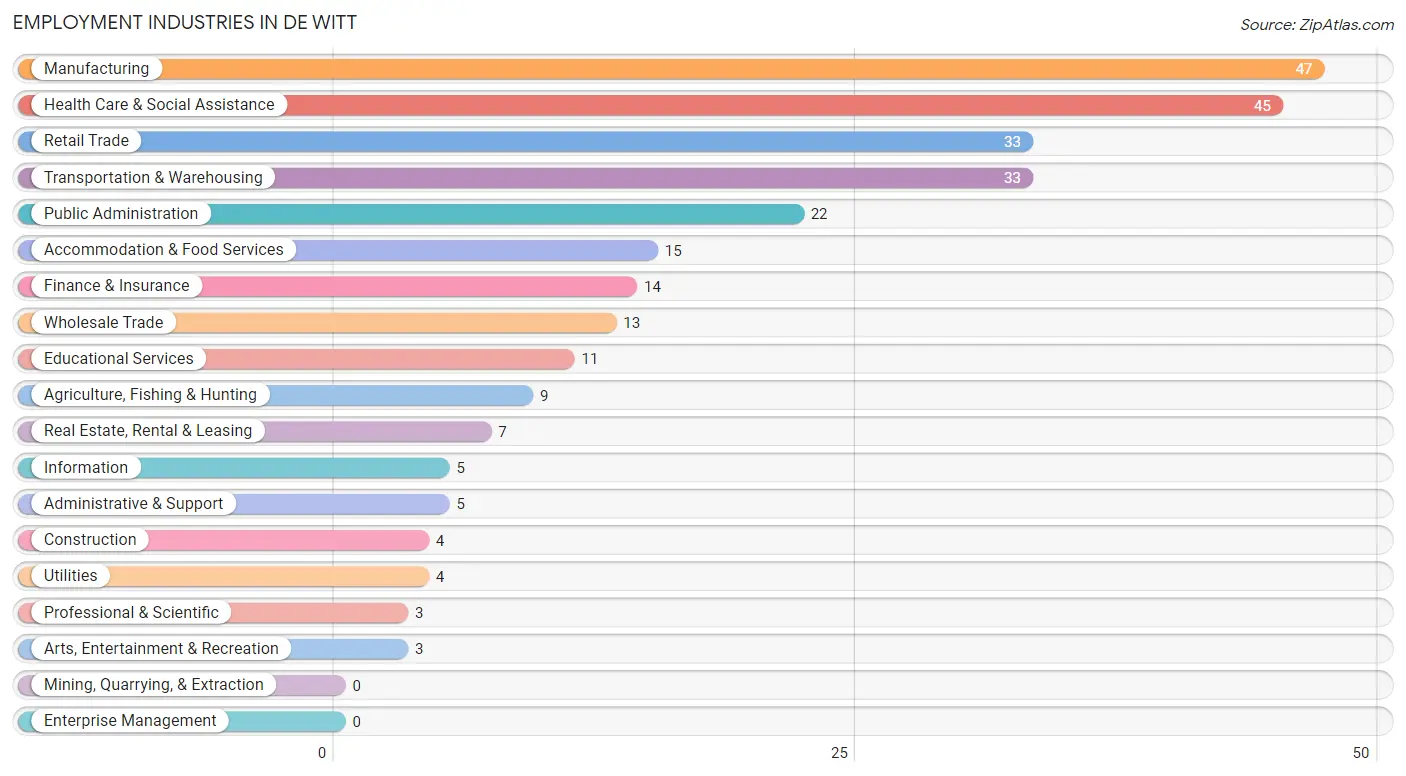
Employment Industries in De Witt
The major employment industries in De Witt include Manufacturing (47 | 16.4%), Health Care & Social Assistance (45 | 15.7%), Retail Trade (33 | 11.5%), Transportation & Warehousing (33 | 11.5%), and Public Administration (22 | 7.7%).
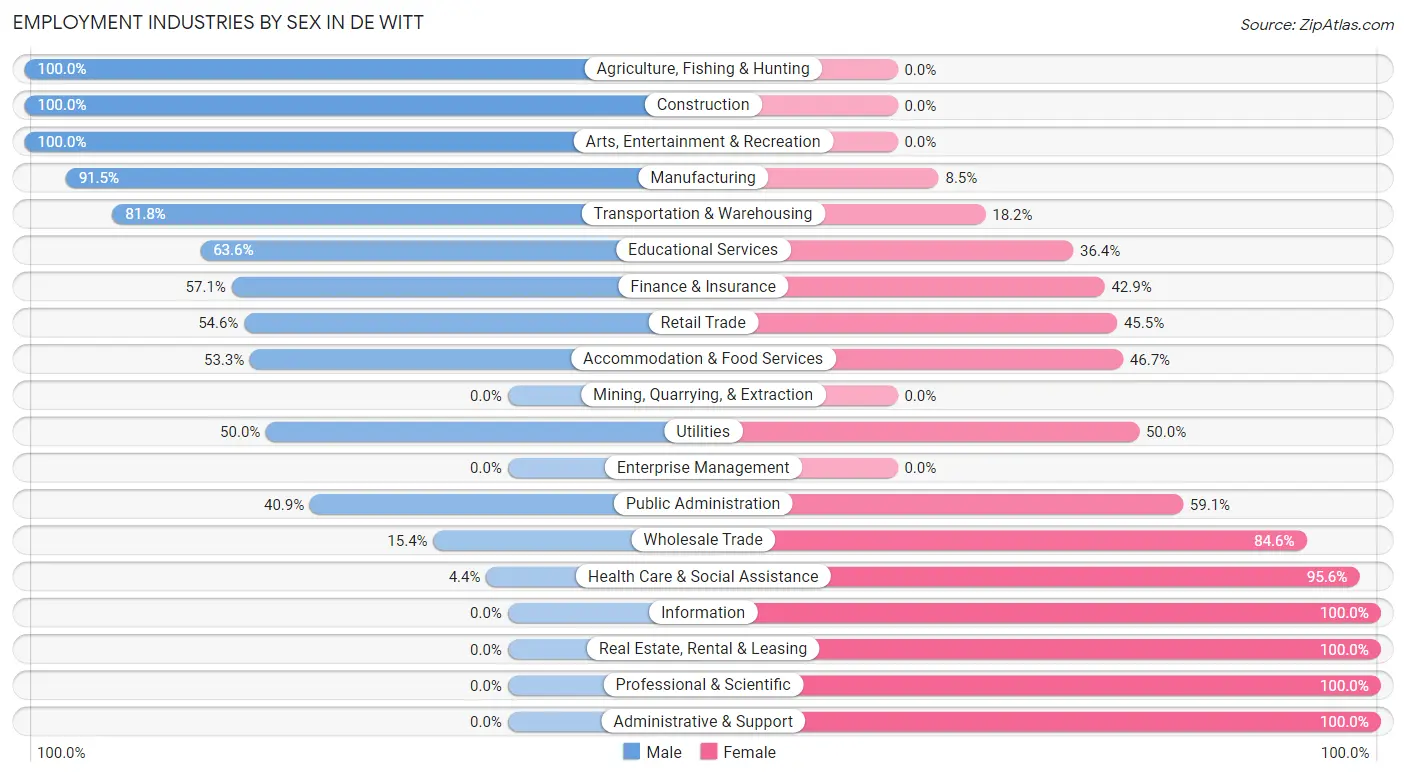
Employment Industries by Sex in De Witt
The De Witt industries that see more men than women are Agriculture, Fishing & Hunting (100.0%), Construction (100.0%), and Arts, Entertainment & Recreation (100.0%), whereas the industries that tend to have a higher number of women are Information (100.0%), Real Estate, Rental & Leasing (100.0%), and Professional & Scientific (100.0%).
| Industry | Male | Female |
| Agriculture, Fishing & Hunting | 9 (100.0%) | 0 (0.0%) |
| Mining, Quarrying, & Extraction | 0 (0.0%) | 0 (0.0%) |
| Construction | 4 (100.0%) | 0 (0.0%) |
| Manufacturing | 43 (91.5%) | 4 (8.5%) |
| Wholesale Trade | 2 (15.4%) | 11 (84.6%) |
| Retail Trade | 18 (54.5%) | 15 (45.5%) |
| Transportation & Warehousing | 27 (81.8%) | 6 (18.2%) |
| Utilities | 2 (50.0%) | 2 (50.0%) |
| Information | 0 (0.0%) | 5 (100.0%) |
| Finance & Insurance | 8 (57.1%) | 6 (42.9%) |
| Real Estate, Rental & Leasing | 0 (0.0%) | 7 (100.0%) |
| Professional & Scientific | 0 (0.0%) | 3 (100.0%) |
| Enterprise Management | 0 (0.0%) | 0 (0.0%) |
| Administrative & Support | 0 (0.0%) | 5 (100.0%) |
| Educational Services | 7 (63.6%) | 4 (36.4%) |
| Health Care & Social Assistance | 2 (4.4%) | 43 (95.6%) |
| Arts, Entertainment & Recreation | 3 (100.0%) | 0 (0.0%) |
| Accommodation & Food Services | 8 (53.3%) | 7 (46.7%) |
| Public Administration | 9 (40.9%) | 13 (59.1%) |
| Total | 156 (54.4%) | 131 (45.6%) |
Education in De Witt
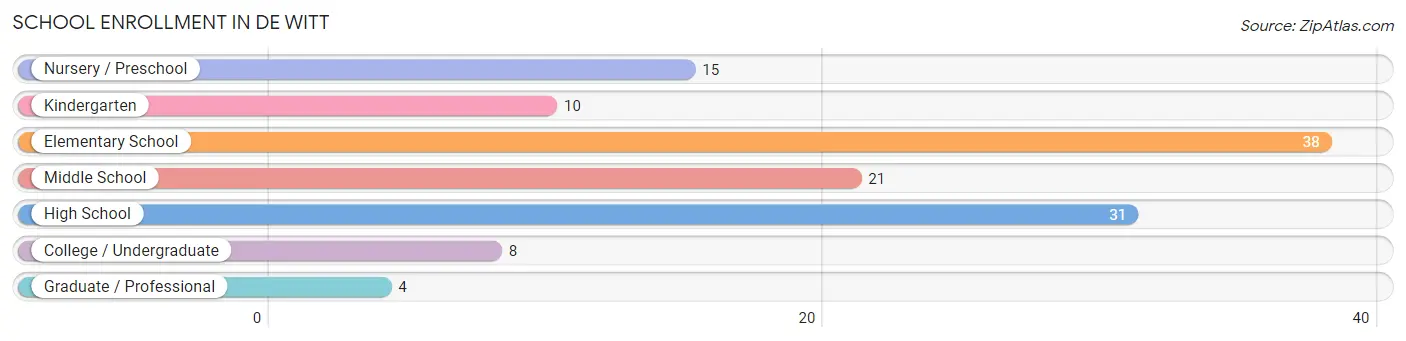
School Enrollment in De Witt
The most common levels of schooling among the 127 students in De Witt are elementary school (38 | 29.9%), high school (31 | 24.4%), and middle school (21 | 16.5%).
| School Level | # Students | % Students |
| Nursery / Preschool | 15 | 11.8% |
| Kindergarten | 10 | 7.9% |
| Elementary School | 38 | 29.9% |
| Middle School | 21 | 16.5% |
| High School | 31 | 24.4% |
| College / Undergraduate | 8 | 6.3% |
| Graduate / Professional | 4 | 3.2% |
| Total | 127 | 100.0% |
School Enrollment by Age by Funding Source in De Witt
Out of a total of 127 students who are enrolled in schools in De Witt, 1 (0.8%) attend a private institution, while the remaining 126 (99.2%) are enrolled in public schools. The age group of 20 to 24 year olds has the highest likelihood of being enrolled in private schools, with 1 (50.0% in the age bracket) enrolled. Conversely, the age group of 3 to 4 year olds has the lowest likelihood of being enrolled in a private school, with 6 (100.0% in the age bracket) attending a public institution.
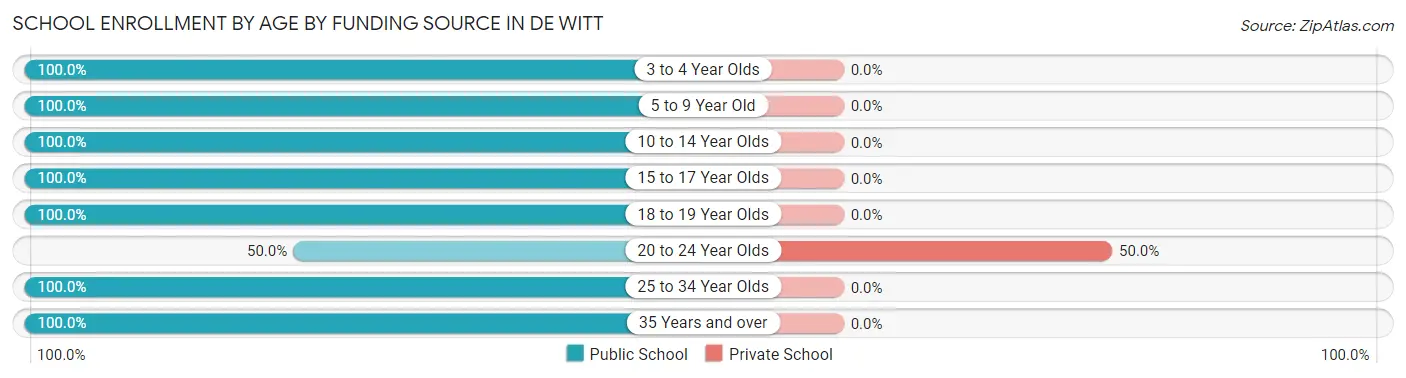
| Age Bracket | Public School | Private School |
| 3 to 4 Year Olds | 6 (100.0%) | 0 (0.0%) |
| 5 to 9 Year Old | 55 (100.0%) | 0 (0.0%) |
| 10 to 14 Year Olds | 23 (100.0%) | 0 (0.0%) |
| 15 to 17 Year Olds | 24 (100.0%) | 0 (0.0%) |
| 18 to 19 Year Olds | 4 (100.0%) | 0 (0.0%) |
| 20 to 24 Year Olds | 1 (50.0%) | 1 (50.0%) |
| 25 to 34 Year Olds | 2 (100.0%) | 0 (0.0%) |
| 35 Years and over | 11 (100.0%) | 0 (0.0%) |
| Total | 126 (99.2%) | 1 (0.8%) |
Educational Attainment by Field of Study in De Witt
Business (35 | 42.2%), arts & humanities (16 | 19.3%), education (7 | 8.4%), bio, nature & agricultural (6 | 7.2%), and engineering (6 | 7.2%) are the most common fields of study among 83 individuals in De Witt who have obtained a bachelor's degree or higher.
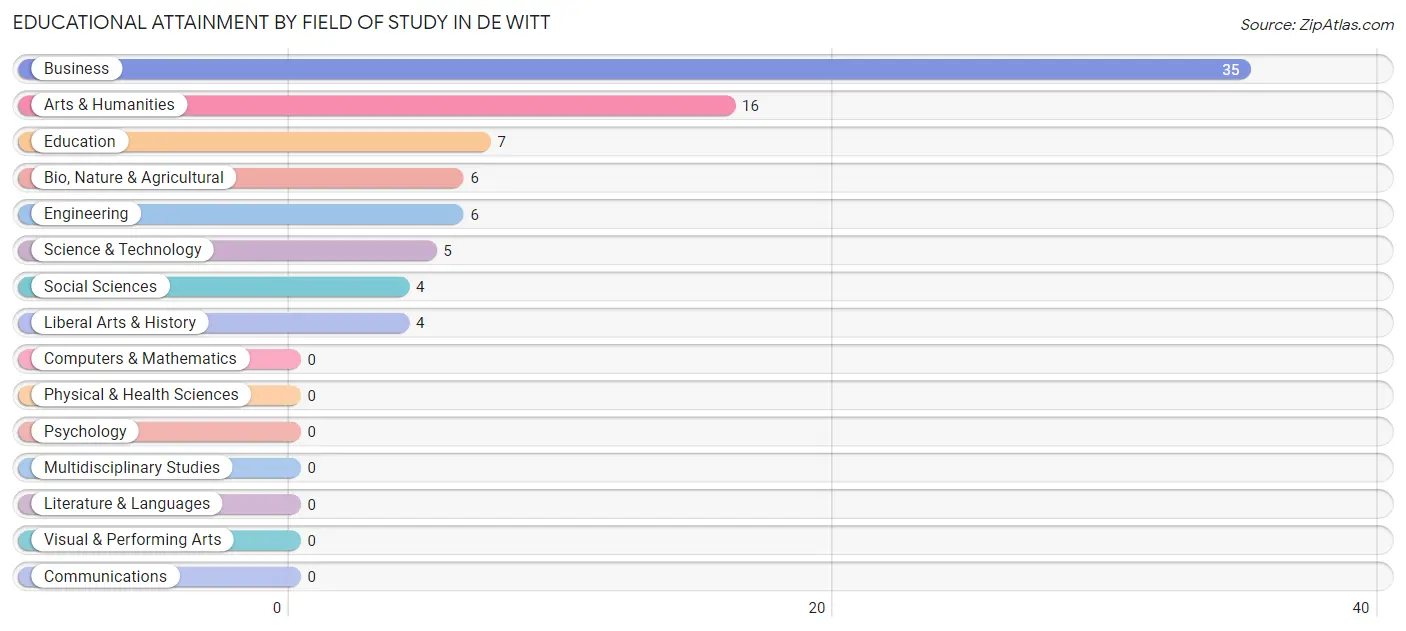
| Field of Study | # Graduates | % Graduates |
| Computers & Mathematics | 0 | 0.0% |
| Bio, Nature & Agricultural | 6 | 7.2% |
| Physical & Health Sciences | 0 | 0.0% |
| Psychology | 0 | 0.0% |
| Social Sciences | 4 | 4.8% |
| Engineering | 6 | 7.2% |
| Multidisciplinary Studies | 0 | 0.0% |
| Science & Technology | 5 | 6.0% |
| Business | 35 | 42.2% |
| Education | 7 | 8.4% |
| Literature & Languages | 0 | 0.0% |
| Liberal Arts & History | 4 | 4.8% |
| Visual & Performing Arts | 0 | 0.0% |
| Communications | 0 | 0.0% |
| Arts & Humanities | 16 | 19.3% |
| Total | 83 | 100.0% |
Transportation & Commute in De Witt
Vehicle Availability by Sex in De Witt
The most prevalent vehicle ownership categories in De Witt are males with 2 vehicles (56, accounting for 37.8%) and females with 2 vehicles (56, making up 42.7%).
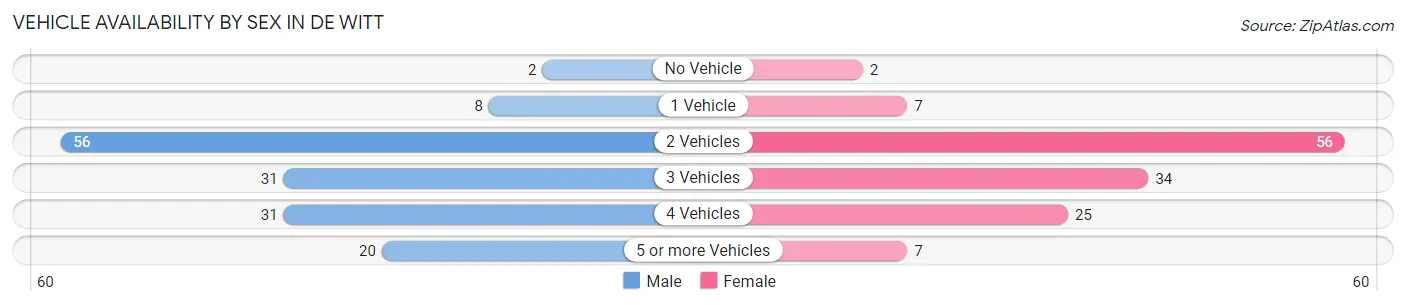
| Vehicles Available | Male | Female |
| No Vehicle | 2 (1.3%) | 2 (1.5%) |
| 1 Vehicle | 8 (5.4%) | 7 (5.3%) |
| 2 Vehicles | 56 (37.8%) | 56 (42.7%) |
| 3 Vehicles | 31 (20.9%) | 34 (26.0%) |
| 4 Vehicles | 31 (20.9%) | 25 (19.1%) |
| 5 or more Vehicles | 20 (13.5%) | 7 (5.3%) |
| Total | 148 (100.0%) | 131 (100.0%) |
Commute Time in De Witt
The most frequently occuring commute durations in De Witt are 30 to 34 minutes (48 commuters, 18.8%), 45 to 59 minutes (36 commuters, 14.1%), and 20 to 24 minutes (33 commuters, 12.9%).
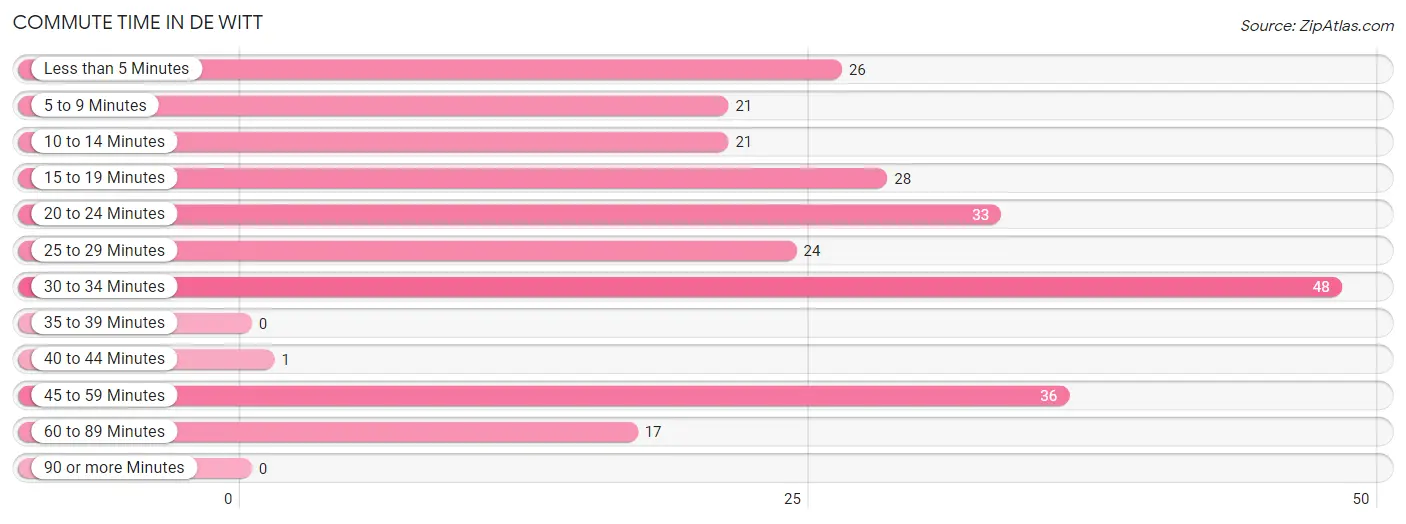
| Commute Time | # Commuters | % Commuters |
| Less than 5 Minutes | 26 | 10.2% |
| 5 to 9 Minutes | 21 | 8.2% |
| 10 to 14 Minutes | 21 | 8.2% |
| 15 to 19 Minutes | 28 | 11.0% |
| 20 to 24 Minutes | 33 | 12.9% |
| 25 to 29 Minutes | 24 | 9.4% |
| 30 to 34 Minutes | 48 | 18.8% |
| 35 to 39 Minutes | 0 | 0.0% |
| 40 to 44 Minutes | 1 | 0.4% |
| 45 to 59 Minutes | 36 | 14.1% |
| 60 to 89 Minutes | 17 | 6.7% |
| 90 or more Minutes | 0 | 0.0% |
Commute Time by Sex in De Witt
The most common commute times in De Witt are 30 to 34 minutes (24 commuters, 16.6%) for males and 20 to 24 minutes (27 commuters, 24.5%) for females.
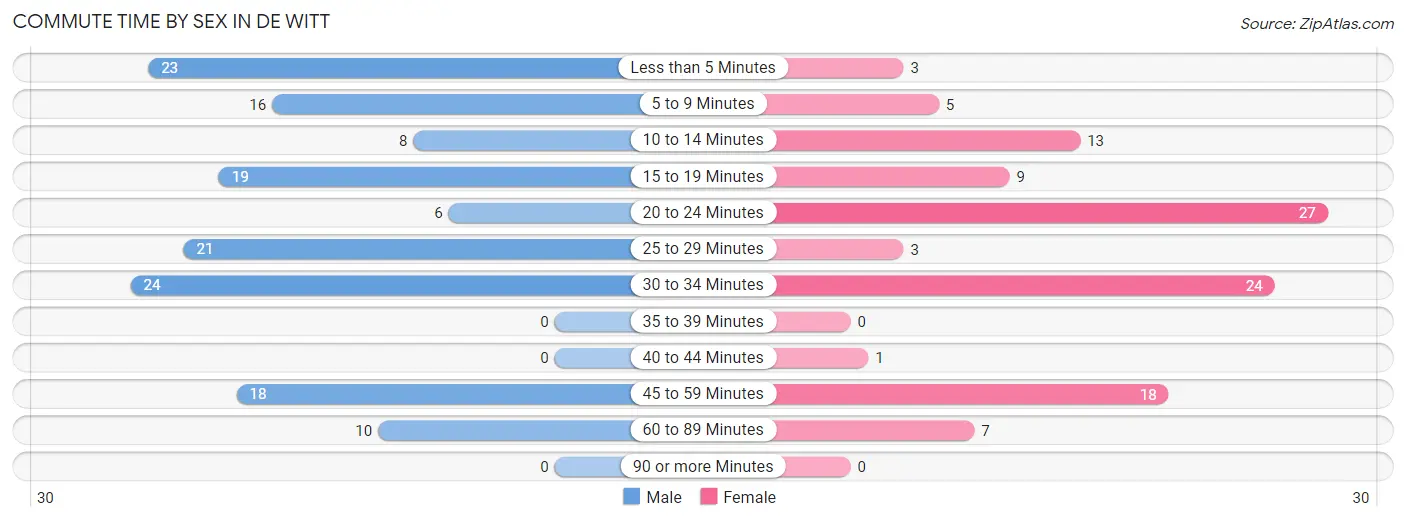
| Commute Time | Male | Female |
| Less than 5 Minutes | 23 (15.9%) | 3 (2.7%) |
| 5 to 9 Minutes | 16 (11.0%) | 5 (4.5%) |
| 10 to 14 Minutes | 8 (5.5%) | 13 (11.8%) |
| 15 to 19 Minutes | 19 (13.1%) | 9 (8.2%) |
| 20 to 24 Minutes | 6 (4.1%) | 27 (24.5%) |
| 25 to 29 Minutes | 21 (14.5%) | 3 (2.7%) |
| 30 to 34 Minutes | 24 (16.6%) | 24 (21.8%) |
| 35 to 39 Minutes | 0 (0.0%) | 0 (0.0%) |
| 40 to 44 Minutes | 0 (0.0%) | 1 (0.9%) |
| 45 to 59 Minutes | 18 (12.4%) | 18 (16.4%) |
| 60 to 89 Minutes | 10 (6.9%) | 7 (6.4%) |
| 90 or more Minutes | 0 (0.0%) | 0 (0.0%) |
Time of Departure to Work by Sex in De Witt
The most frequent times of departure to work in De Witt are 12:00 PM to 3:59 PM (34, 23.4%) for males and 7:30 AM to 7:59 AM (26, 23.6%) for females.
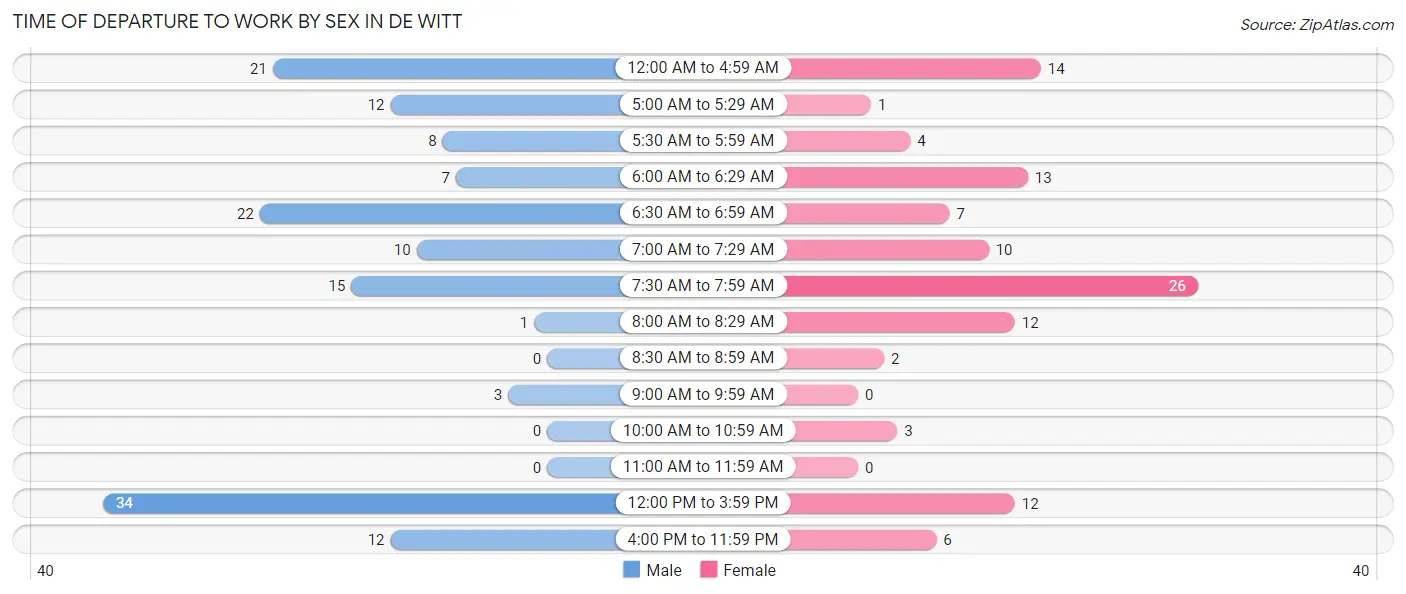
| Time of Departure | Male | Female |
| 12:00 AM to 4:59 AM | 21 (14.5%) | 14 (12.7%) |
| 5:00 AM to 5:29 AM | 12 (8.3%) | 1 (0.9%) |
| 5:30 AM to 5:59 AM | 8 (5.5%) | 4 (3.6%) |
| 6:00 AM to 6:29 AM | 7 (4.8%) | 13 (11.8%) |
| 6:30 AM to 6:59 AM | 22 (15.2%) | 7 (6.4%) |
| 7:00 AM to 7:29 AM | 10 (6.9%) | 10 (9.1%) |
| 7:30 AM to 7:59 AM | 15 (10.3%) | 26 (23.6%) |
| 8:00 AM to 8:29 AM | 1 (0.7%) | 12 (10.9%) |
| 8:30 AM to 8:59 AM | 0 (0.0%) | 2 (1.8%) |
| 9:00 AM to 9:59 AM | 3 (2.1%) | 0 (0.0%) |
| 10:00 AM to 10:59 AM | 0 (0.0%) | 3 (2.7%) |
| 11:00 AM to 11:59 AM | 0 (0.0%) | 0 (0.0%) |
| 12:00 PM to 3:59 PM | 34 (23.4%) | 12 (10.9%) |
| 4:00 PM to 11:59 PM | 12 (8.3%) | 6 (5.4%) |
| Total | 145 (100.0%) | 110 (100.0%) |
Housing Occupancy in De Witt
Occupancy by Ownership in De Witt
Of the total 216 dwellings in De Witt, owner-occupied units account for 162 (75.0%), while renter-occupied units make up 54 (25.0%).
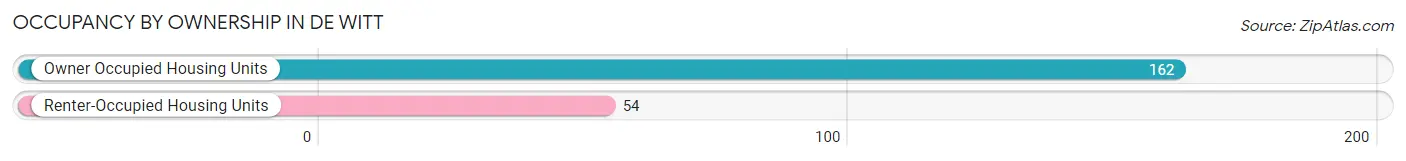
| Occupancy | # Housing Units | % Housing Units |
| Owner Occupied Housing Units | 162 | 75.0% |
| Renter-Occupied Housing Units | 54 | 25.0% |
| Total Occupied Housing Units | 216 | 100.0% |
Occupancy by Household Size in De Witt
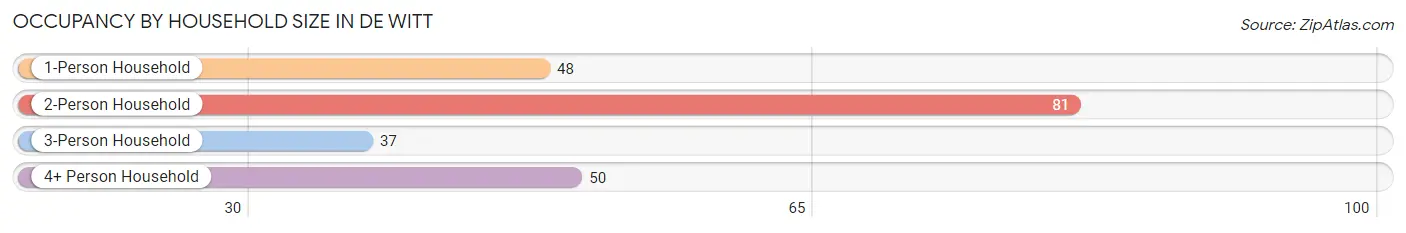
| Household Size | # Housing Units | % Housing Units |
| 1-Person Household | 48 | 22.2% |
| 2-Person Household | 81 | 37.5% |
| 3-Person Household | 37 | 17.1% |
| 4+ Person Household | 50 | 23.2% |
| Total Housing Units | 216 | 100.0% |
Occupancy by Ownership by Household Size in De Witt
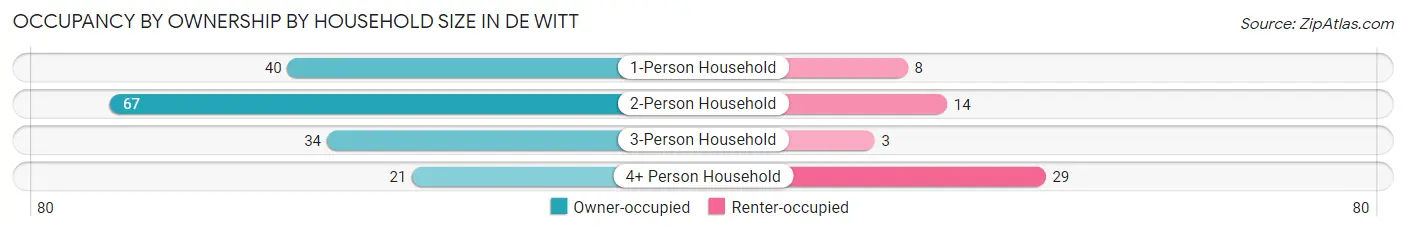
| Household Size | Owner-occupied | Renter-occupied |
| 1-Person Household | 40 (83.3%) | 8 (16.7%) |
| 2-Person Household | 67 (82.7%) | 14 (17.3%) |
| 3-Person Household | 34 (91.9%) | 3 (8.1%) |
| 4+ Person Household | 21 (42.0%) | 29 (58.0%) |
| Total Housing Units | 162 (75.0%) | 54 (25.0%) |
Occupancy by Educational Attainment in De Witt
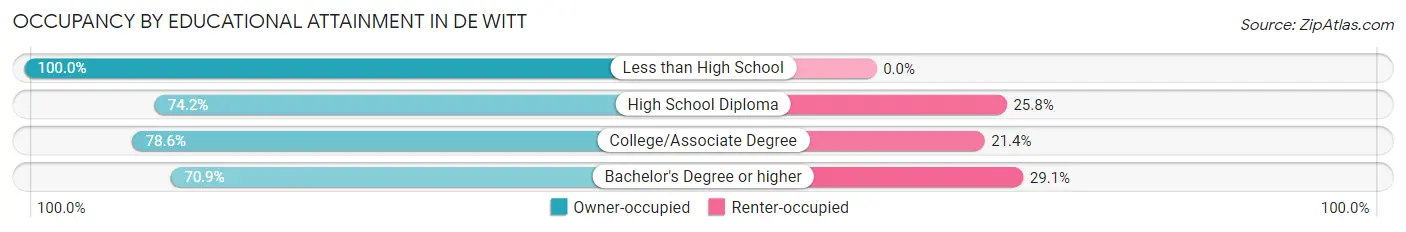
| Household Size | Owner-occupied | Renter-occupied |
| Less than High School | 2 (100.0%) | 0 (0.0%) |
| High School Diploma | 66 (74.2%) | 23 (25.8%) |
| College/Associate Degree | 55 (78.6%) | 15 (21.4%) |
| Bachelor's Degree or higher | 39 (70.9%) | 16 (29.1%) |
Occupancy by Age of Householder in De Witt
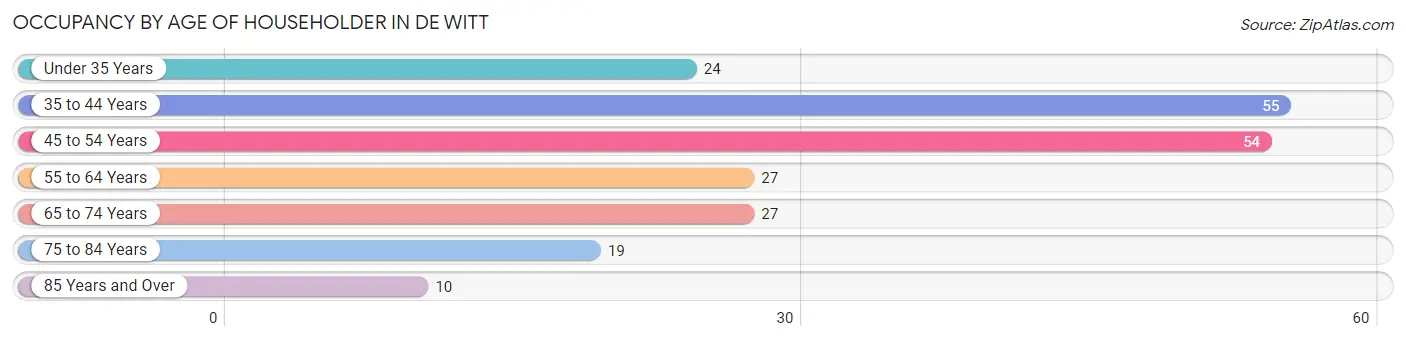
| Age Bracket | # Households | % Households |
| Under 35 Years | 24 | 11.1% |
| 35 to 44 Years | 55 | 25.5% |
| 45 to 54 Years | 54 | 25.0% |
| 55 to 64 Years | 27 | 12.5% |
| 65 to 74 Years | 27 | 12.5% |
| 75 to 84 Years | 19 | 8.8% |
| 85 Years and Over | 10 | 4.6% |
| Total | 216 | 100.0% |
Housing Finances in De Witt
Median Income by Occupancy in De Witt
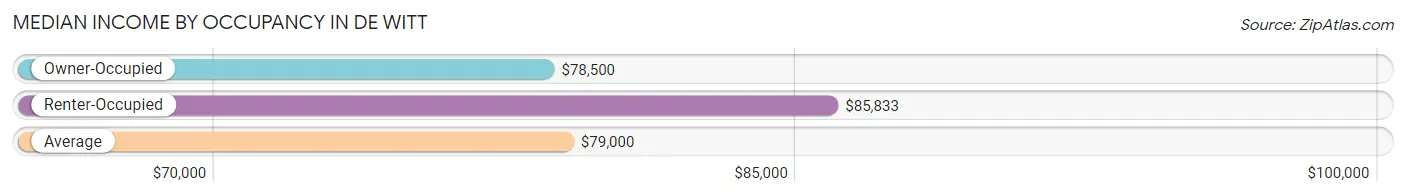
| Occupancy Type | # Households | Median Income |
| Owner-Occupied | 162 (75.0%) | $78,500 |
| Renter-Occupied | 54 (25.0%) | $85,833 |
| Average | 216 (100.0%) | $79,000 |
Occupancy by Householder Income Bracket in De Witt
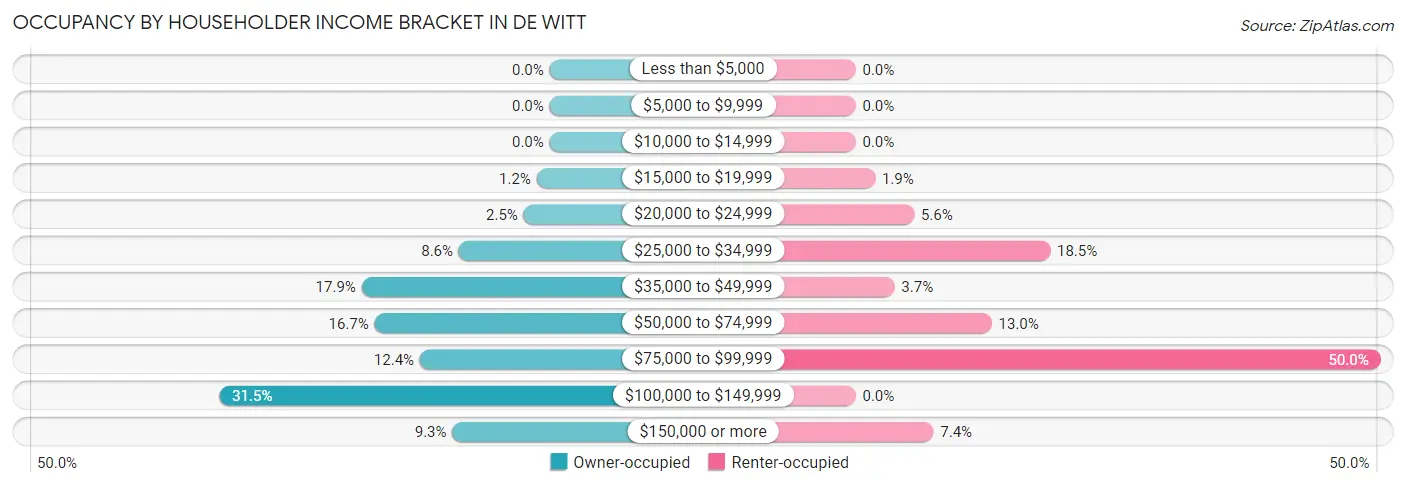
| Income Bracket | Owner-occupied | Renter-occupied |
| Less than $5,000 | 0 (0.0%) | 0 (0.0%) |
| $5,000 to $9,999 | 0 (0.0%) | 0 (0.0%) |
| $10,000 to $14,999 | 0 (0.0%) | 0 (0.0%) |
| $15,000 to $19,999 | 2 (1.2%) | 1 (1.8%) |
| $20,000 to $24,999 | 4 (2.5%) | 3 (5.6%) |
| $25,000 to $34,999 | 14 (8.6%) | 10 (18.5%) |
| $35,000 to $49,999 | 29 (17.9%) | 2 (3.7%) |
| $50,000 to $74,999 | 27 (16.7%) | 7 (13.0%) |
| $75,000 to $99,999 | 20 (12.3%) | 27 (50.0%) |
| $100,000 to $149,999 | 51 (31.5%) | 0 (0.0%) |
| $150,000 or more | 15 (9.3%) | 4 (7.4%) |
| Total | 162 (100.0%) | 54 (100.0%) |
Monthly Housing Cost Tiers in De Witt
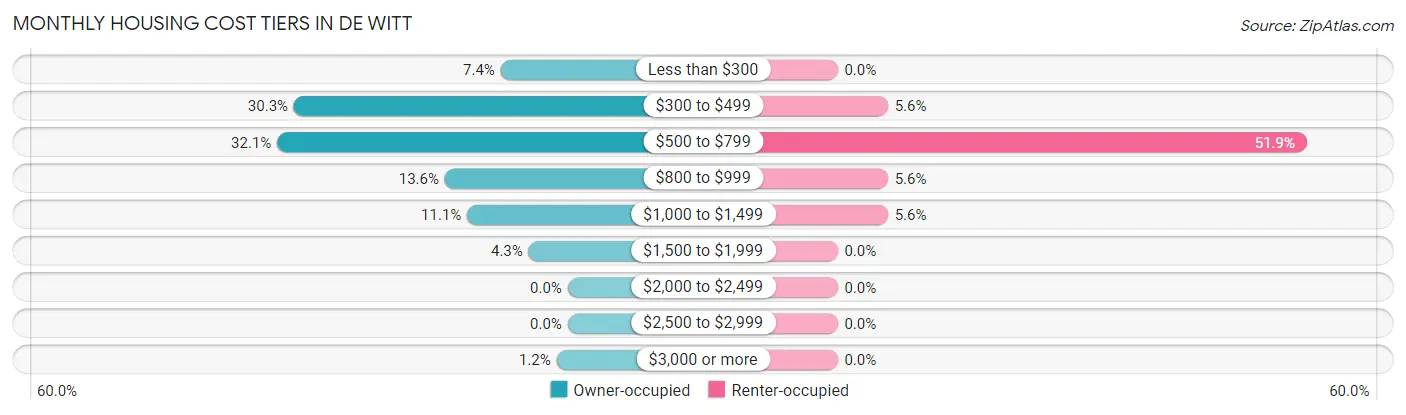
| Monthly Cost | Owner-occupied | Renter-occupied |
| Less than $300 | 12 (7.4%) | 0 (0.0%) |
| $300 to $499 | 49 (30.2%) | 3 (5.6%) |
| $500 to $799 | 52 (32.1%) | 28 (51.8%) |
| $800 to $999 | 22 (13.6%) | 3 (5.6%) |
| $1,000 to $1,499 | 18 (11.1%) | 3 (5.6%) |
| $1,500 to $1,999 | 7 (4.3%) | 0 (0.0%) |
| $2,000 to $2,499 | 0 (0.0%) | 0 (0.0%) |
| $2,500 to $2,999 | 0 (0.0%) | 0 (0.0%) |
| $3,000 or more | 2 (1.2%) | 0 (0.0%) |
| Total | 162 (100.0%) | 54 (100.0%) |
Physical Housing Characteristics in De Witt
Housing Structures in De Witt
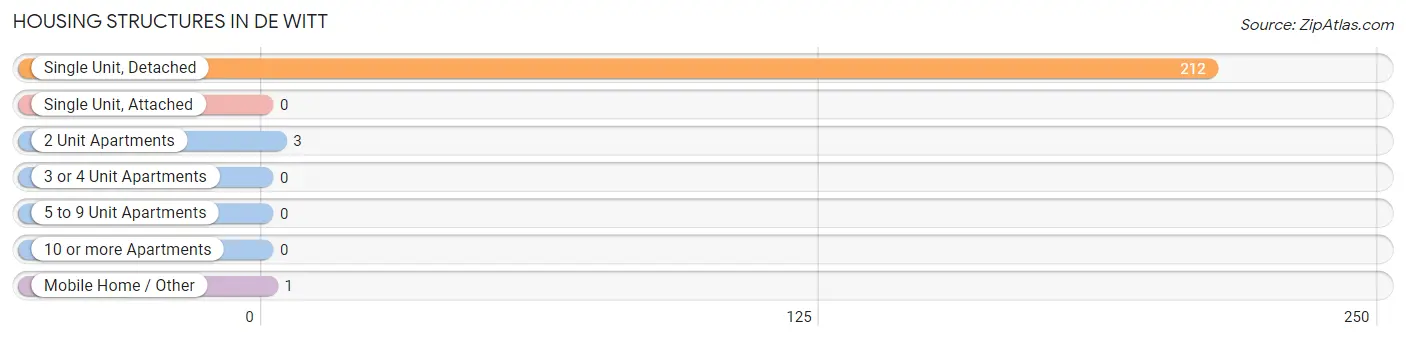
| Structure Type | # Housing Units | % Housing Units |
| Single Unit, Detached | 212 | 98.2% |
| Single Unit, Attached | 0 | 0.0% |
| 2 Unit Apartments | 3 | 1.4% |
| 3 or 4 Unit Apartments | 0 | 0.0% |
| 5 to 9 Unit Apartments | 0 | 0.0% |
| 10 or more Apartments | 0 | 0.0% |
| Mobile Home / Other | 1 | 0.5% |
| Total | 216 | 100.0% |
Housing Structures by Occupancy in De Witt
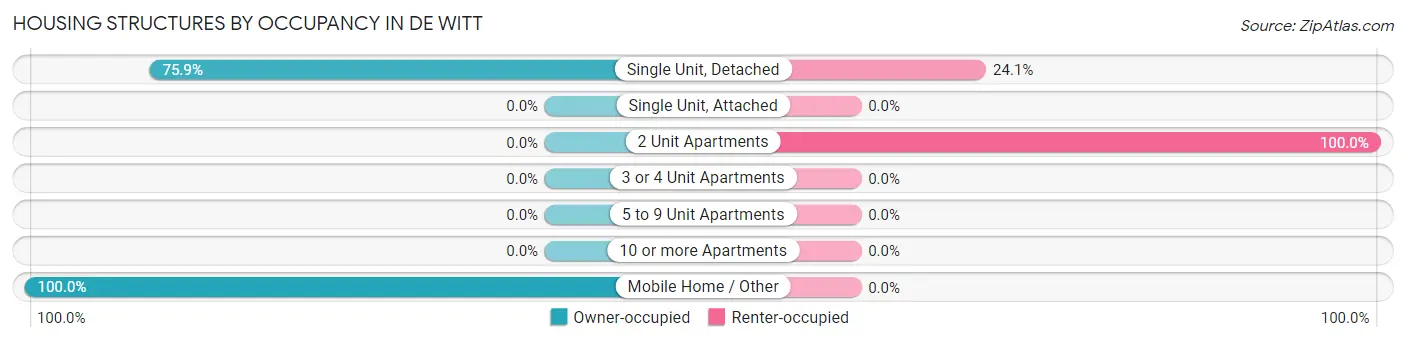
| Structure Type | Owner-occupied | Renter-occupied |
| Single Unit, Detached | 161 (75.9%) | 51 (24.1%) |
| Single Unit, Attached | 0 (0.0%) | 0 (0.0%) |
| 2 Unit Apartments | 0 (0.0%) | 3 (100.0%) |
| 3 or 4 Unit Apartments | 0 (0.0%) | 0 (0.0%) |
| 5 to 9 Unit Apartments | 0 (0.0%) | 0 (0.0%) |
| 10 or more Apartments | 0 (0.0%) | 0 (0.0%) |
| Mobile Home / Other | 1 (100.0%) | 0 (0.0%) |
| Total | 162 (75.0%) | 54 (25.0%) |
Housing Structures by Number of Rooms in De Witt
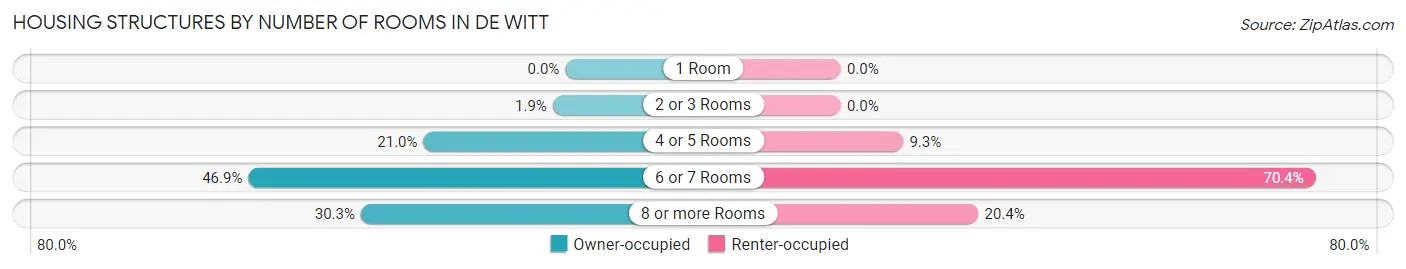
| Number of Rooms | Owner-occupied | Renter-occupied |
| 1 Room | 0 (0.0%) | 0 (0.0%) |
| 2 or 3 Rooms | 3 (1.8%) | 0 (0.0%) |
| 4 or 5 Rooms | 34 (21.0%) | 5 (9.3%) |
| 6 or 7 Rooms | 76 (46.9%) | 38 (70.4%) |
| 8 or more Rooms | 49 (30.2%) | 11 (20.4%) |
| Total | 162 (100.0%) | 54 (100.0%) |
Housing Structure by Heating Type in De Witt
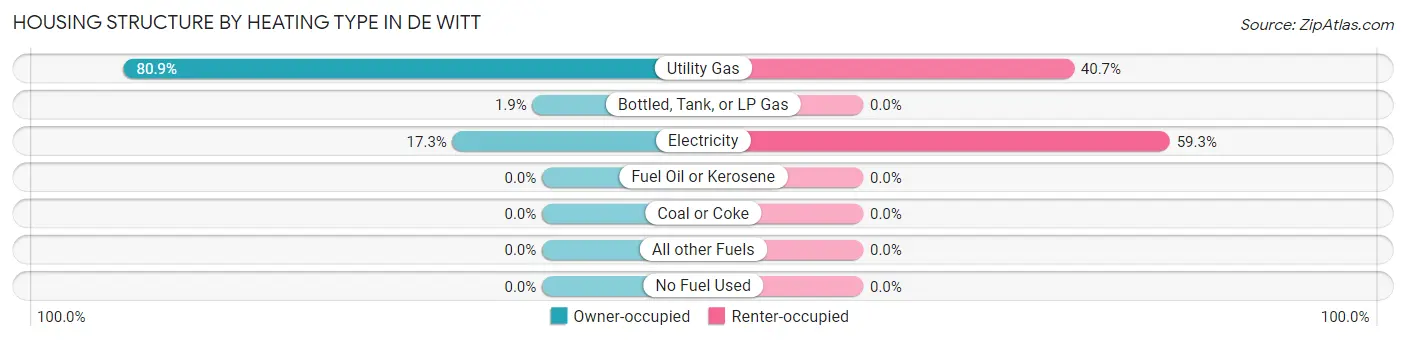
| Heating Type | Owner-occupied | Renter-occupied |
| Utility Gas | 131 (80.9%) | 22 (40.7%) |
| Bottled, Tank, or LP Gas | 3 (1.8%) | 0 (0.0%) |
| Electricity | 28 (17.3%) | 32 (59.3%) |
| Fuel Oil or Kerosene | 0 (0.0%) | 0 (0.0%) |
| Coal or Coke | 0 (0.0%) | 0 (0.0%) |
| All other Fuels | 0 (0.0%) | 0 (0.0%) |
| No Fuel Used | 0 (0.0%) | 0 (0.0%) |
| Total | 162 (100.0%) | 54 (100.0%) |
Household Vehicle Usage in De Witt
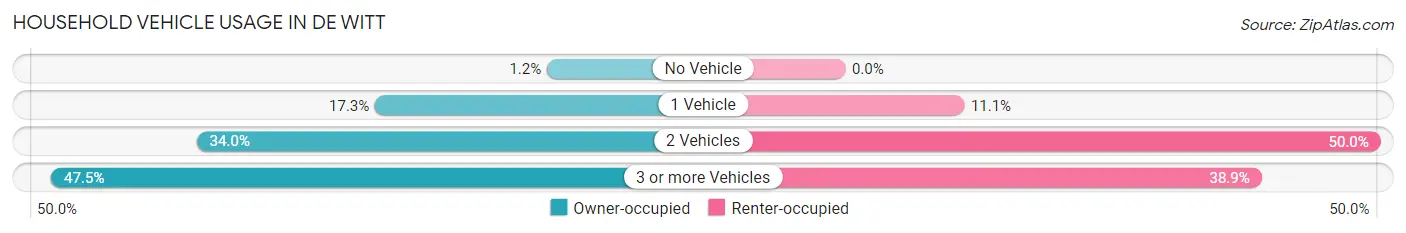
| Vehicles per Household | Owner-occupied | Renter-occupied |
| No Vehicle | 2 (1.2%) | 0 (0.0%) |
| 1 Vehicle | 28 (17.3%) | 6 (11.1%) |
| 2 Vehicles | 55 (34.0%) | 27 (50.0%) |
| 3 or more Vehicles | 77 (47.5%) | 21 (38.9%) |
| Total | 162 (100.0%) | 54 (100.0%) |
Real Estate & Mortgages in De Witt
Real Estate and Mortgage Overview in De Witt
| Characteristic | Without Mortgage | With Mortgage |
| Housing Units | 95 | 67 |
| Median Property Value | $103,400 | $100,700 |
| Median Household Income | $61,250 | $11 |
| Monthly Housing Costs | $464 | $2 |
| Real Estate Taxes | $1,221 | $0 |
Property Value by Mortgage Status in De Witt
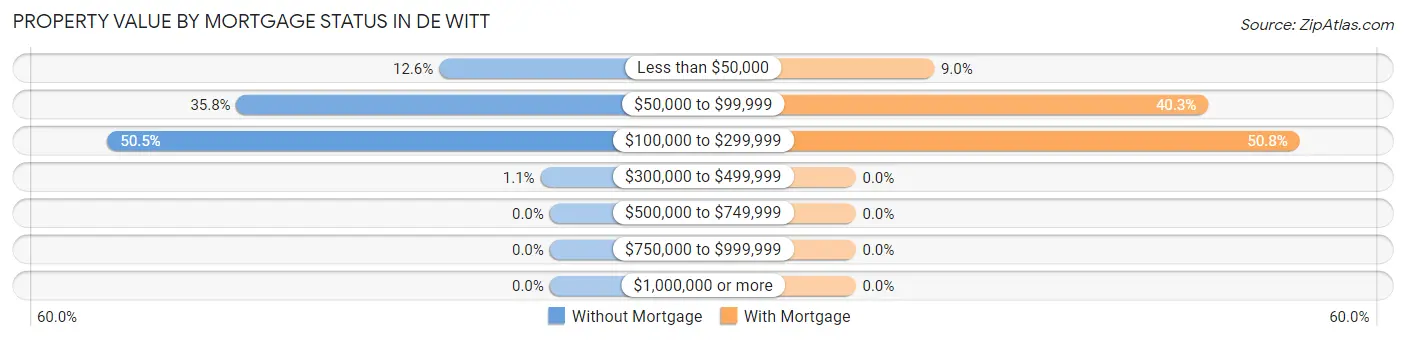
| Property Value | Without Mortgage | With Mortgage |
| Less than $50,000 | 12 (12.6%) | 6 (9.0%) |
| $50,000 to $99,999 | 34 (35.8%) | 27 (40.3%) |
| $100,000 to $299,999 | 48 (50.5%) | 34 (50.7%) |
| $300,000 to $499,999 | 1 (1.1%) | 0 (0.0%) |
| $500,000 to $749,999 | 0 (0.0%) | 0 (0.0%) |
| $750,000 to $999,999 | 0 (0.0%) | 0 (0.0%) |
| $1,000,000 or more | 0 (0.0%) | 0 (0.0%) |
| Total | 95 (100.0%) | 67 (100.0%) |
Household Income by Mortgage Status in De Witt
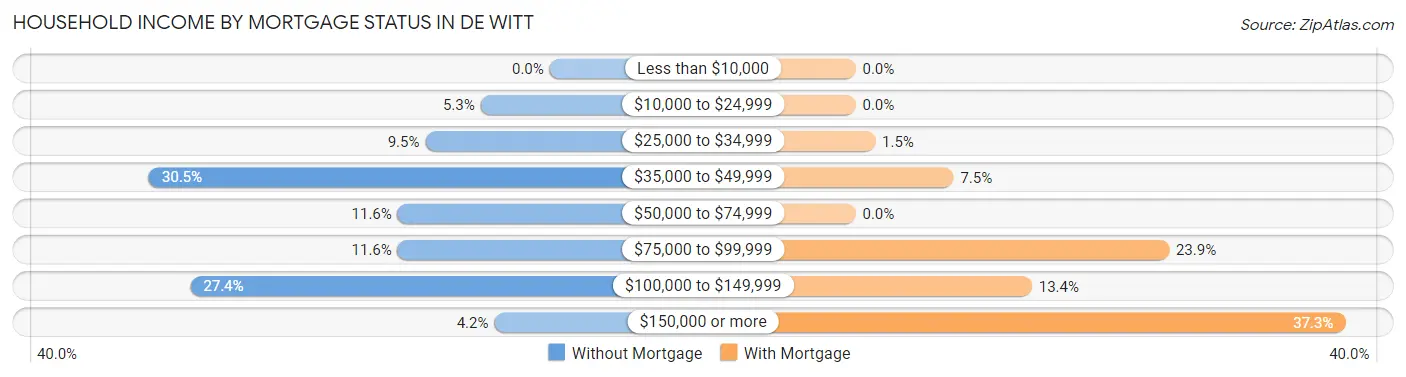
| Household Income | Without Mortgage | With Mortgage |
| Less than $10,000 | 0 (0.0%) | 0 (0.0%) |
| $10,000 to $24,999 | 5 (5.3%) | 0 (0.0%) |
| $25,000 to $34,999 | 9 (9.5%) | 1 (1.5%) |
| $35,000 to $49,999 | 29 (30.5%) | 5 (7.5%) |
| $50,000 to $74,999 | 11 (11.6%) | 0 (0.0%) |
| $75,000 to $99,999 | 11 (11.6%) | 16 (23.9%) |
| $100,000 to $149,999 | 26 (27.4%) | 9 (13.4%) |
| $150,000 or more | 4 (4.2%) | 25 (37.3%) |
| Total | 95 (100.0%) | 67 (100.0%) |
Property Value to Household Income Ratio in De Witt
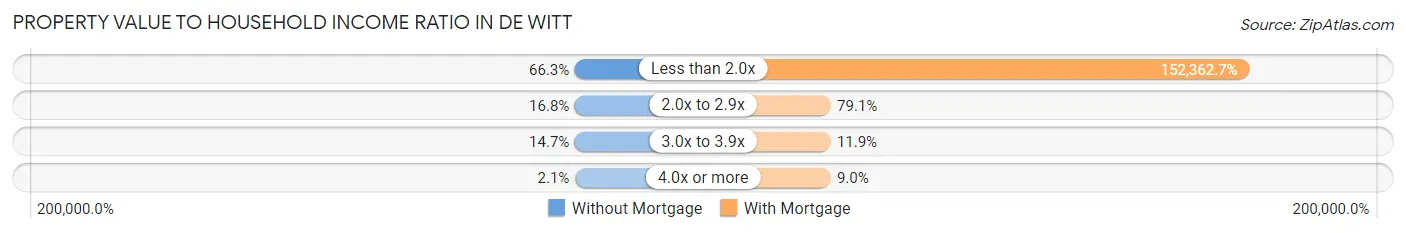
| Value-to-Income Ratio | Without Mortgage | With Mortgage |
| Less than 2.0x | 63 (66.3%) | 102,083 (152,362.7%) |
| 2.0x to 2.9x | 16 (16.8%) | 53 (79.1%) |
| 3.0x to 3.9x | 14 (14.7%) | 8 (11.9%) |
| 4.0x or more | 2 (2.1%) | 6 (9.0%) |
| Total | 95 (100.0%) | 67 (100.0%) |
Real Estate Taxes by Mortgage Status in De Witt
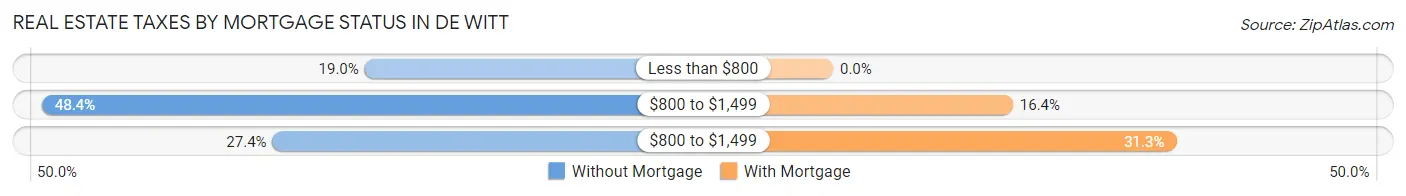
| Property Taxes | Without Mortgage | With Mortgage |
| Less than $800 | 18 (19.0%) | 0 (0.0%) |
| $800 to $1,499 | 46 (48.4%) | 11 (16.4%) |
| $800 to $1,499 | 26 (27.4%) | 21 (31.3%) |
| Total | 95 (100.0%) | 67 (100.0%) |
Health & Disability in De Witt
Health Insurance Coverage by Age in De Witt
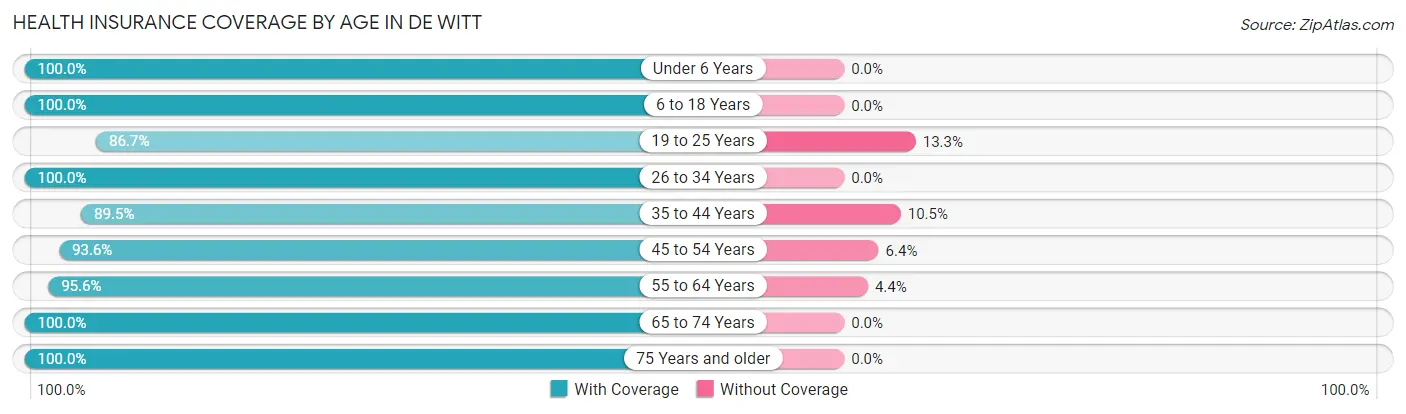
| Age Bracket | With Coverage | Without Coverage |
| Under 6 Years | 29 (100.0%) | 0 (0.0%) |
| 6 to 18 Years | 97 (100.0%) | 0 (0.0%) |
| 19 to 25 Years | 13 (86.7%) | 2 (13.3%) |
| 26 to 34 Years | 42 (100.0%) | 0 (0.0%) |
| 35 to 44 Years | 85 (89.5%) | 10 (10.5%) |
| 45 to 54 Years | 73 (93.6%) | 5 (6.4%) |
| 55 to 64 Years | 65 (95.6%) | 3 (4.4%) |
| 65 to 74 Years | 44 (100.0%) | 0 (0.0%) |
| 75 Years and older | 44 (100.0%) | 0 (0.0%) |
| Total | 492 (96.1%) | 20 (3.9%) |
Health Insurance Coverage by Citizenship Status in De Witt
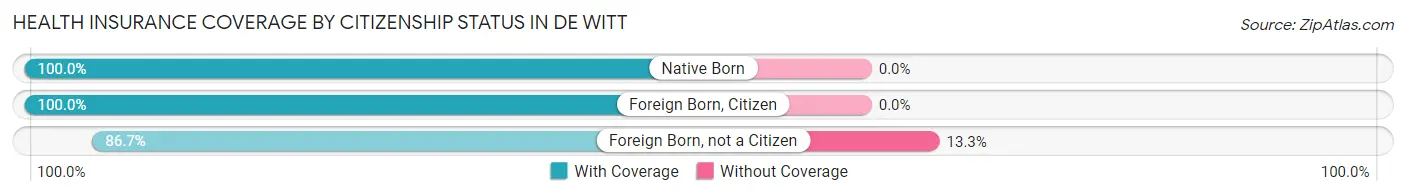
| Citizenship Status | With Coverage | Without Coverage |
| Native Born | 29 (100.0%) | 0 (0.0%) |
| Foreign Born, Citizen | 97 (100.0%) | 0 (0.0%) |
| Foreign Born, not a Citizen | 13 (86.7%) | 2 (13.3%) |
Health Insurance Coverage by Household Income in De Witt
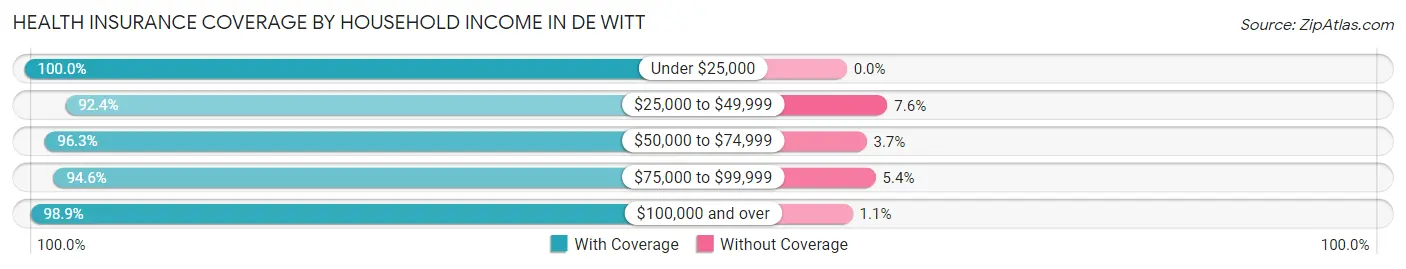
| Household Income | With Coverage | Without Coverage |
| Under $25,000 | 10 (100.0%) | 0 (0.0%) |
| $25,000 to $49,999 | 85 (92.4%) | 7 (7.6%) |
| $50,000 to $74,999 | 78 (96.3%) | 3 (3.7%) |
| $75,000 to $99,999 | 140 (94.6%) | 8 (5.4%) |
| $100,000 and over | 179 (98.9%) | 2 (1.1%) |
Public vs Private Health Insurance Coverage by Age in De Witt
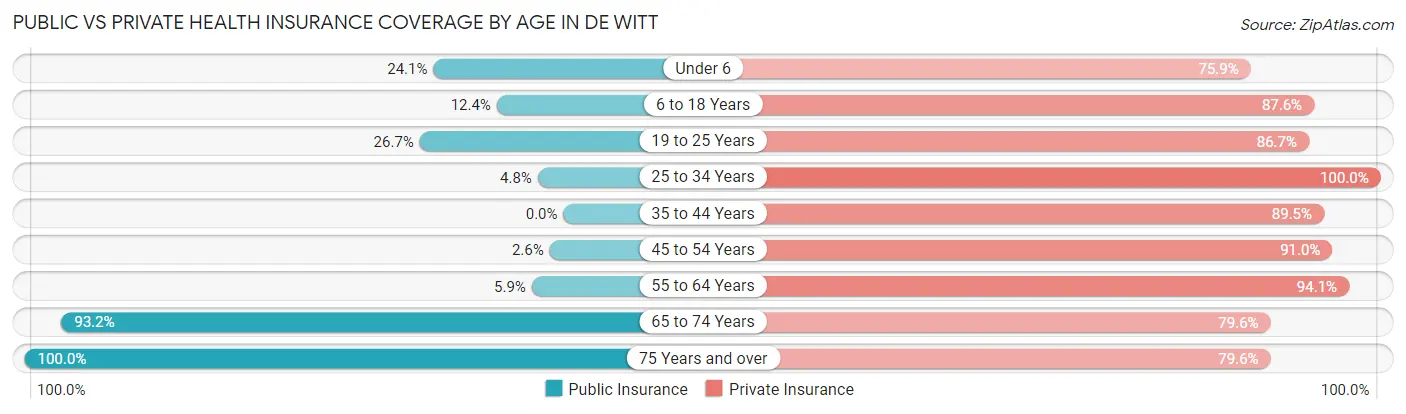
| Age Bracket | Public Insurance | Private Insurance |
| Under 6 | 7 (24.1%) | 22 (75.9%) |
| 6 to 18 Years | 12 (12.4%) | 85 (87.6%) |
| 19 to 25 Years | 4 (26.7%) | 13 (86.7%) |
| 25 to 34 Years | 2 (4.8%) | 42 (100.0%) |
| 35 to 44 Years | 0 (0.0%) | 85 (89.5%) |
| 45 to 54 Years | 2 (2.6%) | 71 (91.0%) |
| 55 to 64 Years | 4 (5.9%) | 64 (94.1%) |
| 65 to 74 Years | 41 (93.2%) | 35 (79.5%) |
| 75 Years and over | 44 (100.0%) | 35 (79.5%) |
| Total | 116 (22.7%) | 452 (88.3%) |
Disability Status by Sex by Age in De Witt
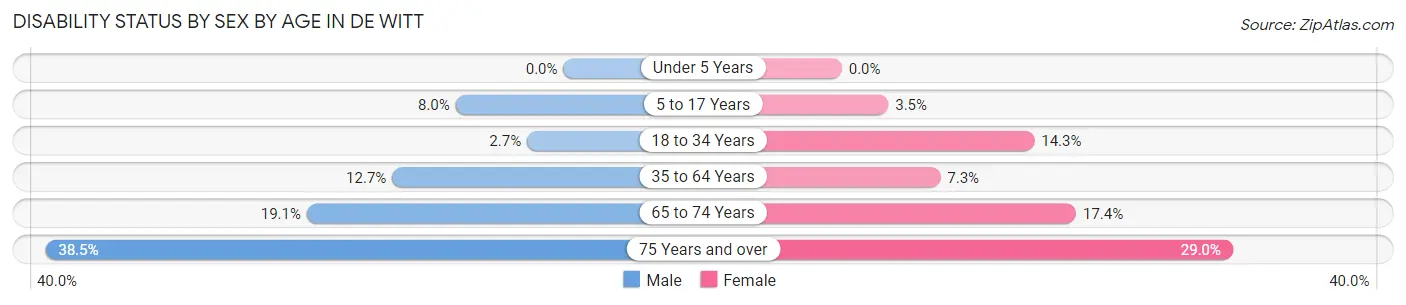
| Age Bracket | Male | Female |
| Under 5 Years | 0 (0.0%) | 0 (0.0%) |
| 5 to 17 Years | 4 (8.0%) | 2 (3.5%) |
| 18 to 34 Years | 1 (2.7%) | 3 (14.3%) |
| 35 to 64 Years | 15 (12.7%) | 9 (7.3%) |
| 65 to 74 Years | 4 (19.1%) | 4 (17.4%) |
| 75 Years and over | 5 (38.5%) | 9 (29.0%) |
Disability Class by Sex by Age in De Witt
Disability Class: Hearing Difficulty
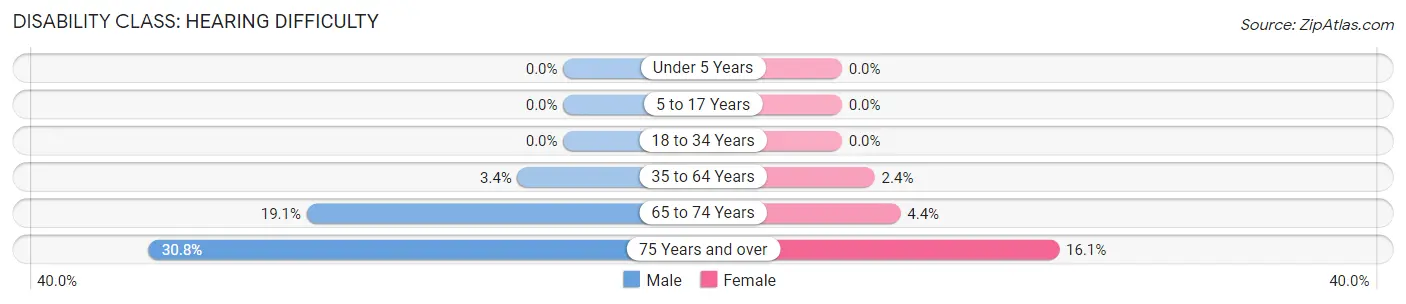
| Age Bracket | Male | Female |
| Under 5 Years | 0 (0.0%) | 0 (0.0%) |
| 5 to 17 Years | 0 (0.0%) | 0 (0.0%) |
| 18 to 34 Years | 0 (0.0%) | 0 (0.0%) |
| 35 to 64 Years | 4 (3.4%) | 3 (2.4%) |
| 65 to 74 Years | 4 (19.1%) | 1 (4.3%) |
| 75 Years and over | 4 (30.8%) | 5 (16.1%) |
Disability Class: Vision Difficulty
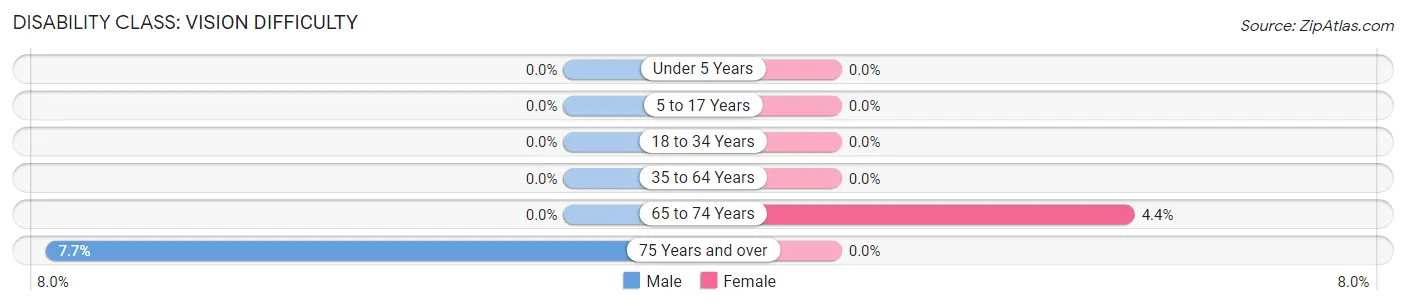
| Age Bracket | Male | Female |
| Under 5 Years | 0 (0.0%) | 0 (0.0%) |
| 5 to 17 Years | 0 (0.0%) | 0 (0.0%) |
| 18 to 34 Years | 0 (0.0%) | 0 (0.0%) |
| 35 to 64 Years | 0 (0.0%) | 0 (0.0%) |
| 65 to 74 Years | 0 (0.0%) | 1 (4.3%) |
| 75 Years and over | 1 (7.7%) | 0 (0.0%) |
Disability Class: Cognitive Difficulty
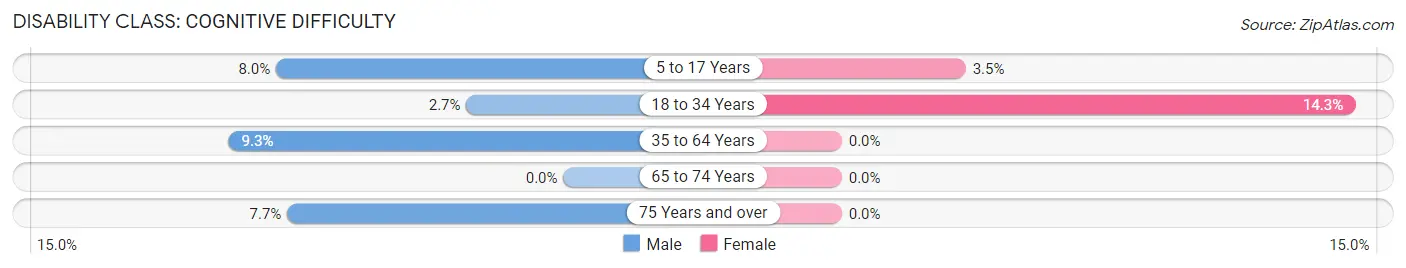
| Age Bracket | Male | Female |
| 5 to 17 Years | 4 (8.0%) | 2 (3.5%) |
| 18 to 34 Years | 1 (2.7%) | 3 (14.3%) |
| 35 to 64 Years | 11 (9.3%) | 0 (0.0%) |
| 65 to 74 Years | 0 (0.0%) | 0 (0.0%) |
| 75 Years and over | 1 (7.7%) | 0 (0.0%) |
Disability Class: Ambulatory Difficulty
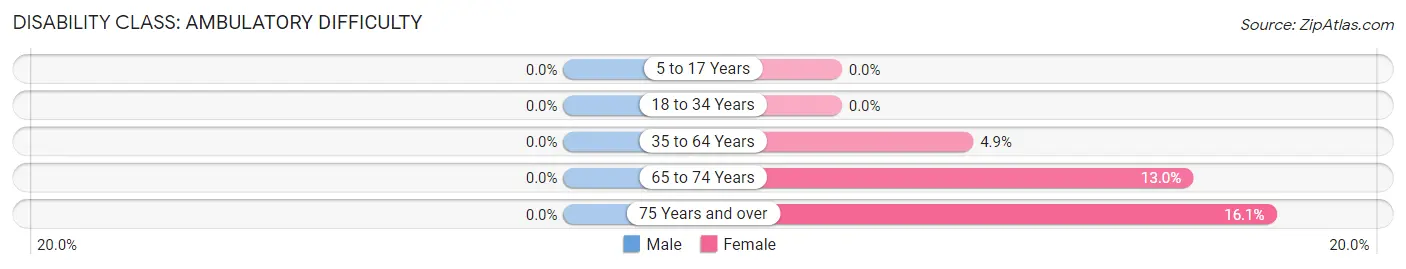
| Age Bracket | Male | Female |
| 5 to 17 Years | 0 (0.0%) | 0 (0.0%) |
| 18 to 34 Years | 0 (0.0%) | 0 (0.0%) |
| 35 to 64 Years | 0 (0.0%) | 6 (4.9%) |
| 65 to 74 Years | 0 (0.0%) | 3 (13.0%) |
| 75 Years and over | 0 (0.0%) | 5 (16.1%) |
Disability Class: Self-Care Difficulty
| Age Bracket | Male | Female |
| 5 to 17 Years | 0 (0.0%) | 0 (0.0%) |
| 18 to 34 Years | 0 (0.0%) | 0 (0.0%) |
| 35 to 64 Years | 0 (0.0%) | 0 (0.0%) |
| 65 to 74 Years | 0 (0.0%) | 0 (0.0%) |
| 75 Years and over | 0 (0.0%) | 0 (0.0%) |
Technology Access in De Witt
Computing Device Access in De Witt
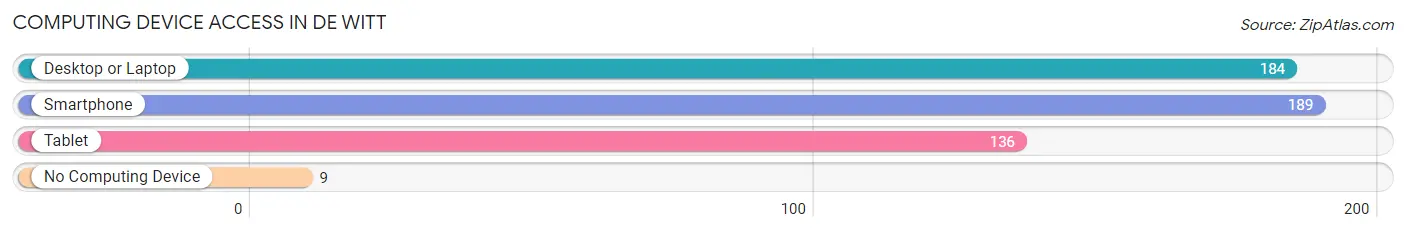
| Device Type | # Households | % Households |
| Desktop or Laptop | 184 | 85.2% |
| Smartphone | 189 | 87.5% |
| Tablet | 136 | 63.0% |
| No Computing Device | 9 | 4.2% |
| Total | 216 | 100.0% |
Internet Access in De Witt
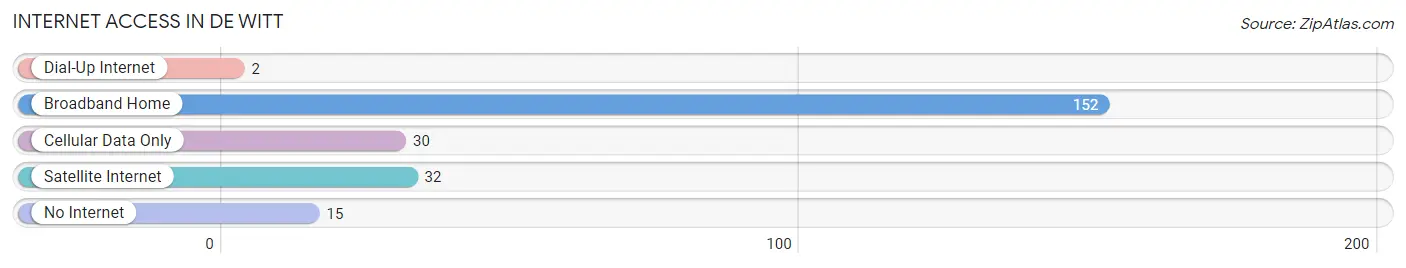
| Internet Type | # Households | % Households |
| Dial-Up Internet | 2 | 0.9% |
| Broadband Home | 152 | 70.4% |
| Cellular Data Only | 30 | 13.9% |
| Satellite Internet | 32 | 14.8% |
| No Internet | 15 | 6.9% |
| Total | 216 | 100.0% |
De Witt Summary
De Witt, Nebraska is a small town located in Saline County, Nebraska. It is situated on the banks of the Platte River, approximately 25 miles south of Lincoln. The town was founded in 1871 and was named after the first settler, William De Witt. The population of De Witt was estimated to be 845 in 2020.
Geography
De Witt is located in the southeastern corner of Saline County, Nebraska. It is situated on the banks of the Platte River, approximately 25 miles south of Lincoln. The town is surrounded by rolling hills and farmland. The climate in De Witt is generally mild, with temperatures ranging from the low 30s in the winter to the mid-80s in the summer.
Economy
De Witt’s economy is largely based on agriculture. The town is home to several farms, which produce corn, soybeans, and wheat. The town also has a few small businesses, including a grocery store, a hardware store, and a few restaurants.
Demographics
As of 2020, the population of De Witt was estimated to be 845. The racial makeup of the town was 97.3% White, 0.6% African American, 0.3% Native American, 0.3% Asian, 0.2% from other races, and 1.3% from two or more races. The median household income in De Witt was $50,000, and the median age was 40.
History
De Witt was founded in 1871 by William De Witt, who was the first settler in the area. The town was originally called “De Witt’s Station”, but the name was changed to De Witt in 1873. The town grew slowly over the years, and by the early 1900s, it had a population of around 500.
In the early 1900s, De Witt was a thriving agricultural community. The town was home to several farms, which produced corn, soybeans, and wheat. The town also had a few small businesses, including a grocery store, a hardware store, and a few restaurants.
In the late 1900s, De Witt began to decline. The town’s population decreased, and many of the businesses closed. However, in recent years, the town has seen a resurgence. The population has increased, and new businesses have opened.
Today, De Witt is a small but vibrant town. It is home to several farms, which produce corn, soybeans, and wheat. The town also has a few small businesses, including a grocery store, a hardware store, and a few restaurants. The town is also home to a few parks and recreational areas, which provide residents with a place to relax and enjoy the outdoors.
Common Questions
What is Per Capita Income in De Witt?
Per Capita income in De Witt is $37,621.
What is the Median Family Income in De Witt?
Median Family Income in De Witt is $90,962.
What is the Median Household income in De Witt?
Median Household Income in De Witt is $79,000.
What is Income or Wage Gap in De Witt?
Income or Wage Gap in De Witt is 16.8%.
Women in De Witt earn 83.2 cents for every dollar earned by a man.
What is Inequality or Gini Index in De Witt?
Inequality or Gini Index in De Witt is 0.37.
What is the Total Population of De Witt?
Total Population of De Witt is 512.
What is the Total Male Population of De Witt?
Total Male Population of De Witt is 248.
What is the Total Female Population of De Witt?
Total Female Population of De Witt is 264.
What is the Ratio of Males per 100 Females in De Witt?
There are 93.94 Males per 100 Females in De Witt.
What is the Ratio of Females per 100 Males in De Witt?
There are 106.45 Females per 100 Males in De Witt.
What is the Median Population Age in De Witt?
Median Population Age in De Witt is 41.9 Years.
What is the Average Family Size in De Witt
Average Family Size in De Witt is 2.8 People.
What is the Average Household Size in De Witt
Average Household Size in De Witt is 2.4 People.
How Large is the Labor Force in De Witt?
There are 290 People in the Labor Forcein in De Witt.
What is the Percentage of People in the Labor Force in De Witt?
70.9% of People are in the Labor Force in De Witt.
What is the Unemployment Rate in De Witt?
Unemployment Rate in De Witt is 1.0%.