Culbertson, NE Map & Demographics
Culbertson Map
Culbertson Overview
$21,700
PER CAPITA INCOME
$68,229
AVG FAMILY INCOME
$51,875
AVG HOUSEHOLD INCOME
21.8%
WAGE / INCOME GAP [ % ]
78.2¢/ $1
WAGE / INCOME GAP [ $ ]
$18,270
FAMILY INCOME DEFICIT
0.38
INEQUALITY / GINI INDEX
621
TOTAL POPULATION
329
MALE POPULATION
292
FEMALE POPULATION
112.67
MALES / 100 FEMALES
88.75
FEMALES / 100 MALES
30.4
MEDIAN AGE
3.8
AVG FAMILY SIZE
2.9
AVG HOUSEHOLD SIZE
296
LABOR FORCE [ PEOPLE ]
71.0%
PERCENT IN LABOR FORCE
3.4%
UNEMPLOYMENT RATE
Culbertson Zip Codes
Culbertson Area Codes
Income in Culbertson
Income Overview in Culbertson
Per Capita Income in Culbertson is $21,700, while median incomes of families and households are $68,229 and $51,875 respectively.
| Characteristic | Number | Measure |
| Per Capita Income | 621 | $21,700 |
| Median Family Income | 135 | $68,229 |
| Mean Family Income | 135 | $69,153 |
| Median Household Income | 217 | $51,875 |
| Mean Household Income | 217 | $55,699 |
| Income Deficit | 135 | $18,270 |
| Wage / Income Gap (%) | 621 | 21.84% |
| Wage / Income Gap ($) | 621 | 78.16¢ per $1 |
| Gini / Inequality Index | 621 | 0.38 |
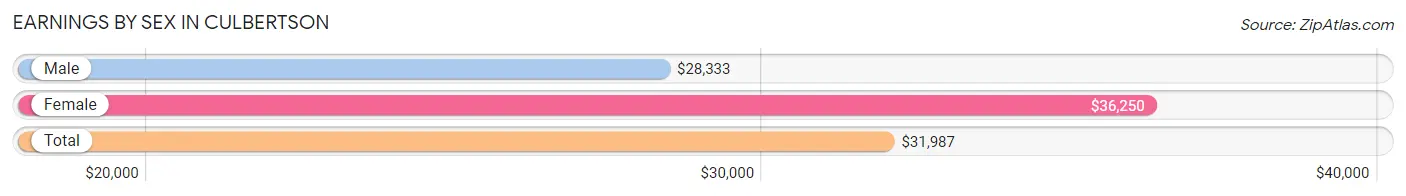
Earnings by Sex in Culbertson
Average Earnings in Culbertson are $31,987, $28,333 for men and $36,250 for women, a difference of 21.8%.
| Sex | Number | Average Earnings |
| Male | 152 (53.1%) | $28,333 |
| Female | 134 (46.9%) | $36,250 |
| Total | 286 (100.0%) | $31,987 |
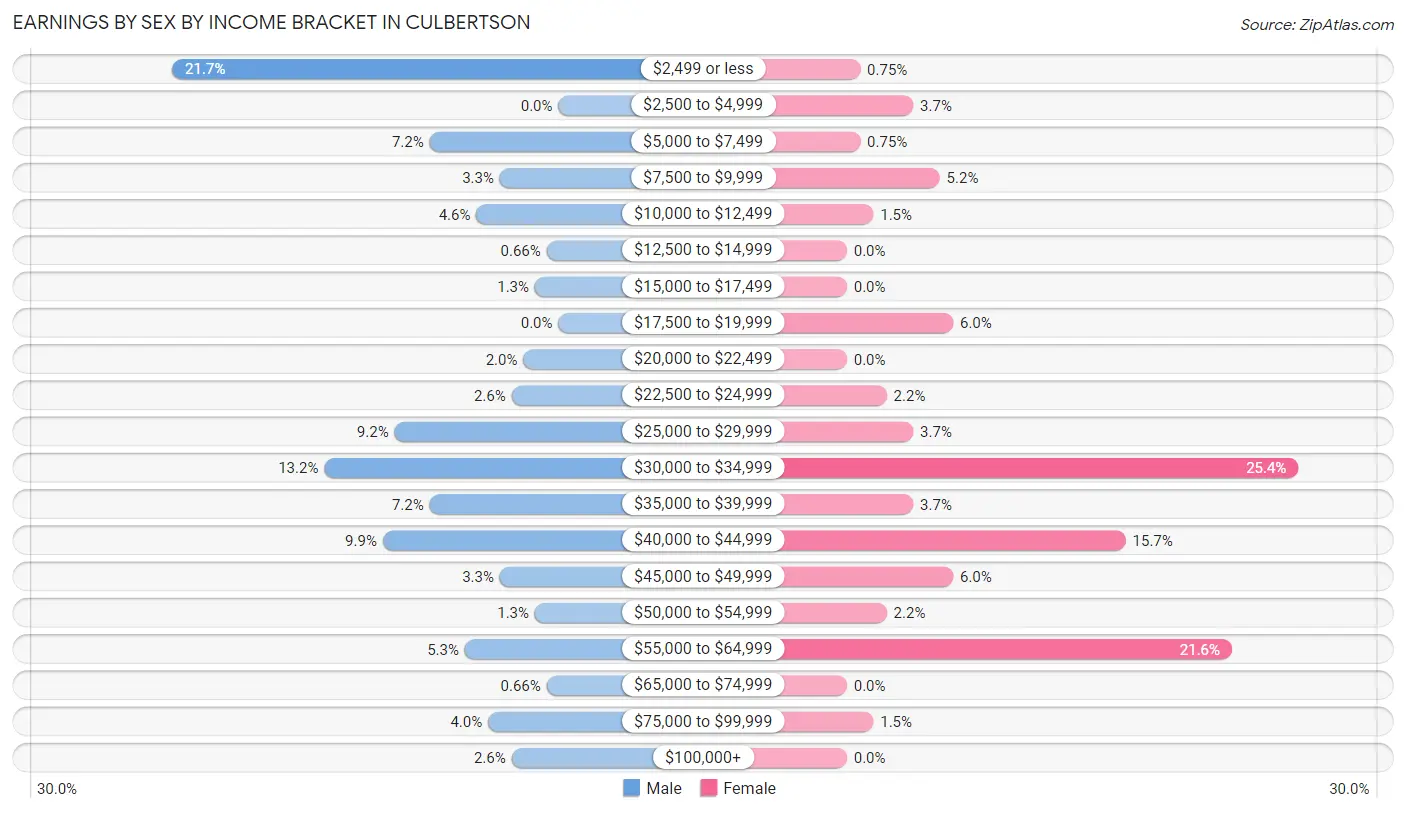
Earnings by Sex by Income Bracket in Culbertson
The most common earnings brackets in Culbertson are $2,499 or less for men (33 | 21.7%) and $30,000 to $34,999 for women (34 | 25.4%).
| Income | Male | Female |
| $2,499 or less | 33 (21.7%) | 1 (0.7%) |
| $2,500 to $4,999 | 0 (0.0%) | 5 (3.7%) |
| $5,000 to $7,499 | 11 (7.2%) | 1 (0.7%) |
| $7,500 to $9,999 | 5 (3.3%) | 7 (5.2%) |
| $10,000 to $12,499 | 7 (4.6%) | 2 (1.5%) |
| $12,500 to $14,999 | 1 (0.7%) | 0 (0.0%) |
| $15,000 to $17,499 | 2 (1.3%) | 0 (0.0%) |
| $17,500 to $19,999 | 0 (0.0%) | 8 (6.0%) |
| $20,000 to $22,499 | 3 (2.0%) | 0 (0.0%) |
| $22,500 to $24,999 | 4 (2.6%) | 3 (2.2%) |
| $25,000 to $29,999 | 14 (9.2%) | 5 (3.7%) |
| $30,000 to $34,999 | 20 (13.2%) | 34 (25.4%) |
| $35,000 to $39,999 | 11 (7.2%) | 5 (3.7%) |
| $40,000 to $44,999 | 15 (9.9%) | 21 (15.7%) |
| $45,000 to $49,999 | 5 (3.3%) | 8 (6.0%) |
| $50,000 to $54,999 | 2 (1.3%) | 3 (2.2%) |
| $55,000 to $64,999 | 8 (5.3%) | 29 (21.6%) |
| $65,000 to $74,999 | 1 (0.7%) | 0 (0.0%) |
| $75,000 to $99,999 | 6 (4.0%) | 2 (1.5%) |
| $100,000+ | 4 (2.6%) | 0 (0.0%) |
| Total | 152 (100.0%) | 134 (100.0%) |
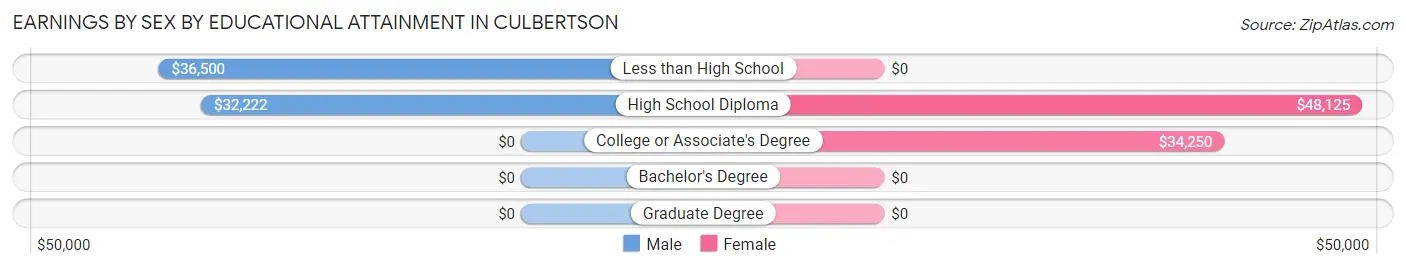
Earnings by Sex by Educational Attainment in Culbertson
Average earnings in Culbertson are $30,938 for men and $39,167 for women, a difference of 21.0%. Men with an educational attainment of less than high school enjoy the highest average annual earnings of $36,500, while those with high school diploma education earn the least with $32,222. Women with an educational attainment of high school diploma earn the most with the average annual earnings of $48,125, while those with college or associate's degree education have the smallest earnings of $34,250.
| Educational Attainment | Male Income | Female Income |
| Less than High School | $36,500 | $0 |
| High School Diploma | $32,222 | $48,125 |
| College or Associate's Degree | - | - |
| Bachelor's Degree | - | - |
| Graduate Degree | - | - |
| Total | $30,938 | $39,167 |
Family Income in Culbertson
Family Income Brackets in Culbertson
According to the Culbertson family income data, there are 46 families falling into the $50,000 to $74,999 income range, which is the most common income bracket and makes up 34.1% of all families.
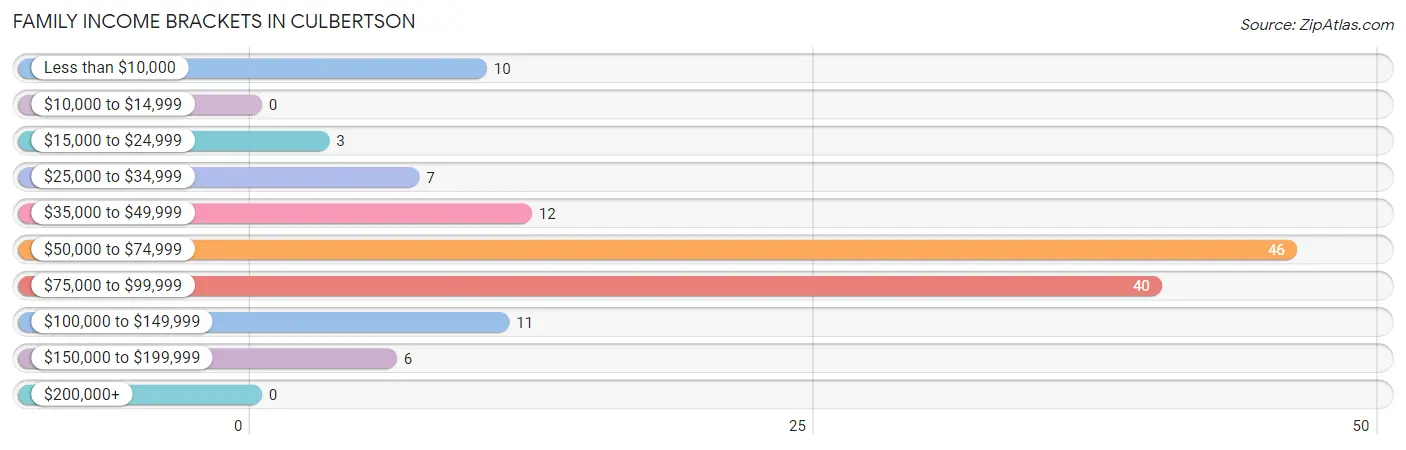
| Income Bracket | # Families | % Families |
| Less than $10,000 | 10 | 7.4% |
| $10,000 to $14,999 | 0 | 0.0% |
| $15,000 to $24,999 | 3 | 2.2% |
| $25,000 to $34,999 | 7 | 5.2% |
| $35,000 to $49,999 | 12 | 8.9% |
| $50,000 to $74,999 | 46 | 34.1% |
| $75,000 to $99,999 | 40 | 29.6% |
| $100,000 to $149,999 | 11 | 8.1% |
| $150,000 to $199,999 | 6 | 4.4% |
| $200,000+ | 0 | 0.0% |
Family Income by Famaliy Size in Culbertson
2-person families (58 | 43.0%) account for the highest median family income in Culbertson with $71,250 per family, while 2-person families (58 | 43.0%) have the highest median income of $35,625 per family member.
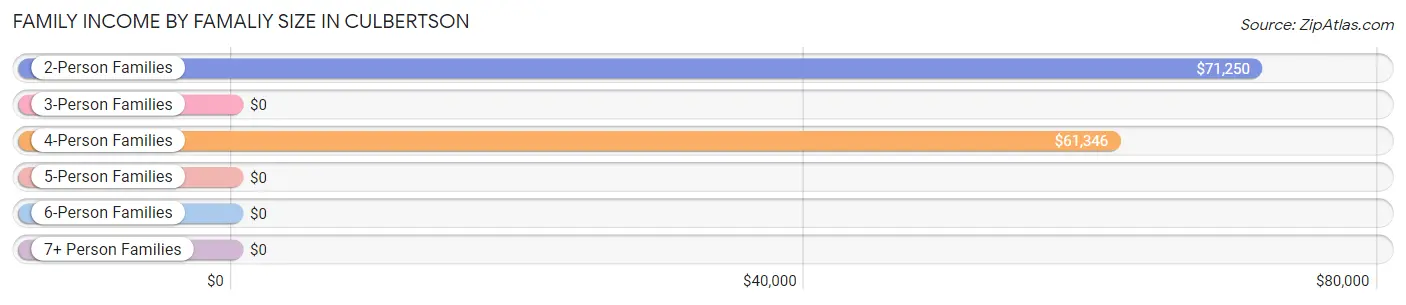
| Income Bracket | # Families | Median Income |
| 2-Person Families | 58 (43.0%) | $71,250 |
| 3-Person Families | 19 (14.1%) | $0 |
| 4-Person Families | 36 (26.7%) | $61,346 |
| 5-Person Families | 2 (1.5%) | $0 |
| 6-Person Families | 8 (5.9%) | $0 |
| 7+ Person Families | 12 (8.9%) | $0 |
| Total | 135 (100.0%) | $68,229 |
Family Income by Number of Earners in Culbertson
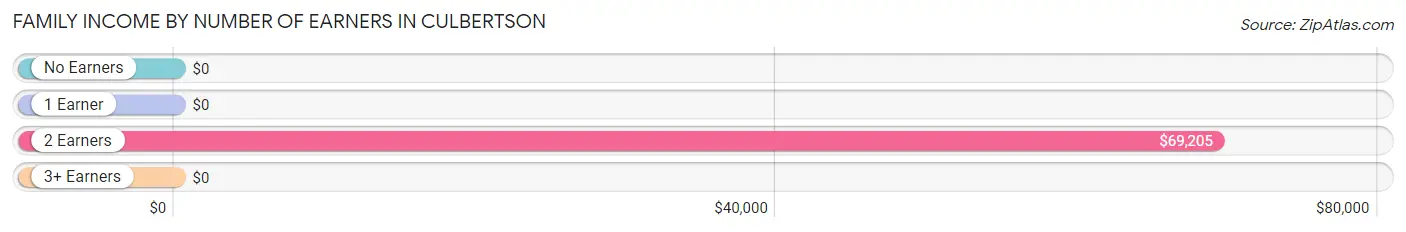
| Number of Earners | # Families | Median Income |
| No Earners | 19 (14.1%) | $0 |
| 1 Earner | 35 (25.9%) | $0 |
| 2 Earners | 79 (58.5%) | $69,205 |
| 3+ Earners | 2 (1.5%) | $0 |
| Total | 135 (100.0%) | $68,229 |
Household Income in Culbertson
Household Income Brackets in Culbertson
With 54 households falling in the category, the $50,000 to $74,999 income range is the most frequent in Culbertson, accounting for 24.9% of all households.
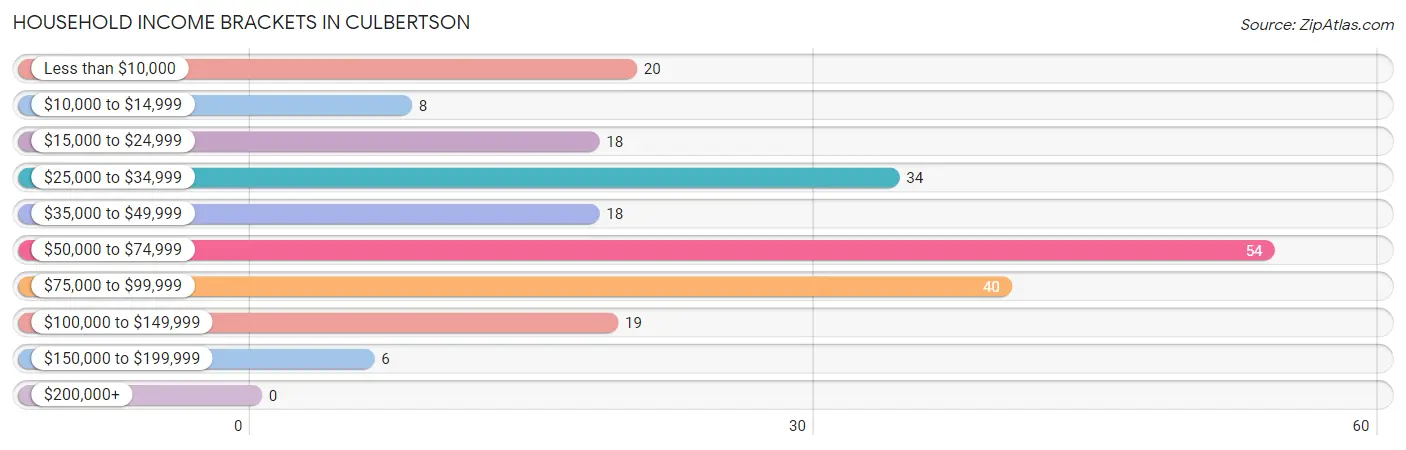
| Income Bracket | # Households | % Households |
| Less than $10,000 | 20 | 9.2% |
| $10,000 to $14,999 | 8 | 3.7% |
| $15,000 to $24,999 | 18 | 8.3% |
| $25,000 to $34,999 | 34 | 15.7% |
| $35,000 to $49,999 | 18 | 8.3% |
| $50,000 to $74,999 | 54 | 24.9% |
| $75,000 to $99,999 | 40 | 18.4% |
| $100,000 to $149,999 | 19 | 8.8% |
| $150,000 to $199,999 | 6 | 2.8% |
| $200,000+ | 0 | 0.0% |
Household Income by Householder Age in Culbertson
The median household income in Culbertson is $51,875, with the highest median household income of $62,115 found in the 25 to 44 years age bracket for the primary householder. A total of 78 households (35.9%) fall into this category. Meanwhile, the 15 to 24 years age bracket for the primary householder has the lowest median household income of $0, with 10 households (4.6%) in this group.
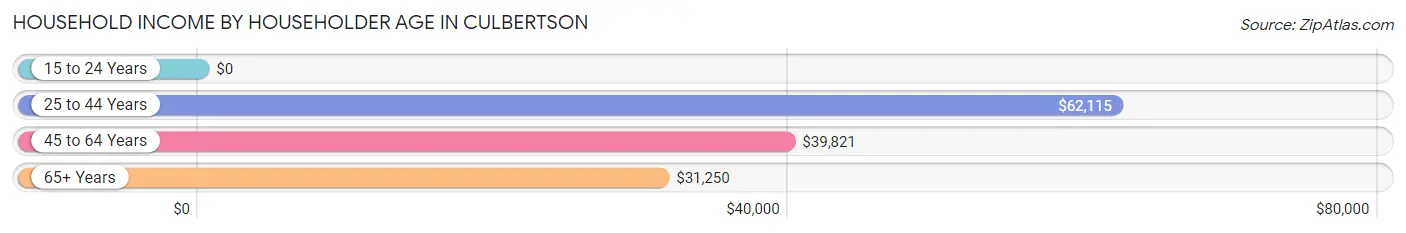
| Income Bracket | # Households | Median Income |
| 15 to 24 Years | 10 (4.6%) | $0 |
| 25 to 44 Years | 78 (35.9%) | $62,115 |
| 45 to 64 Years | 43 (19.8%) | $39,821 |
| 65+ Years | 86 (39.6%) | $31,250 |
| Total | 217 (100.0%) | $51,875 |
Poverty in Culbertson
Income Below Poverty by Sex and Age in Culbertson
With 12.8% poverty level for males and 6.5% for females among the residents of Culbertson, 18 to 24 year old males and 18 to 24 year old females are the most vulnerable to poverty, with 6 males (37.5%) and 5 females (55.6%) in their respective age groups living below the poverty level.
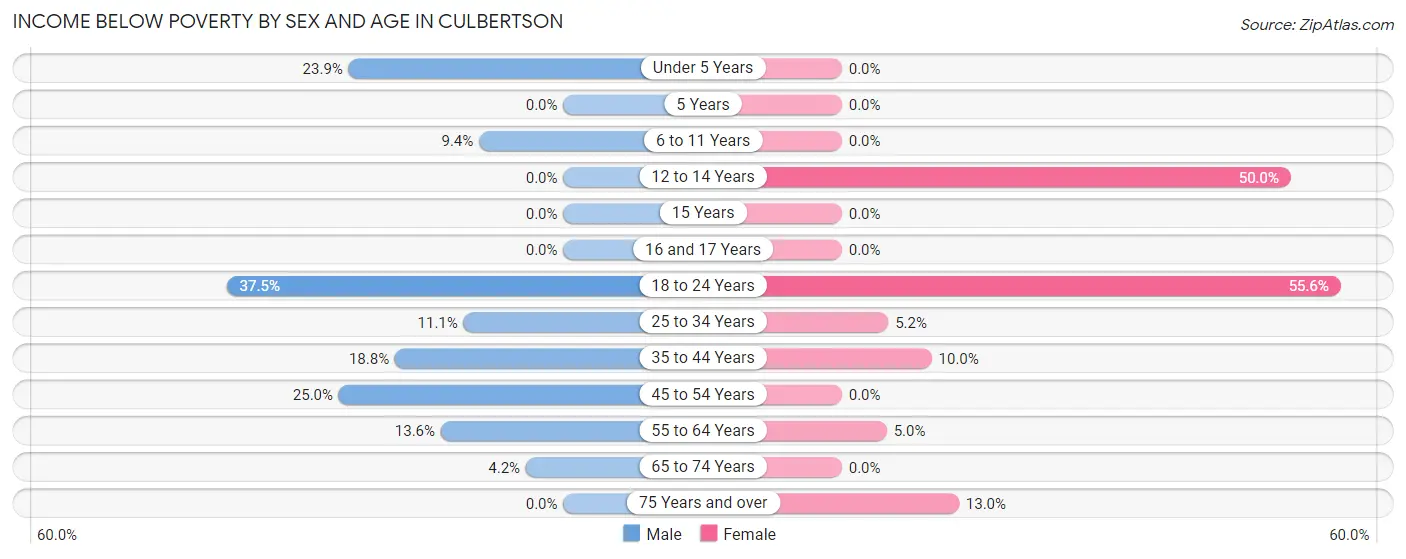
| Age Bracket | Male | Female |
| Under 5 Years | 11 (23.9%) | 0 (0.0%) |
| 5 Years | 0 (0.0%) | 0 (0.0%) |
| 6 to 11 Years | 3 (9.4%) | 0 (0.0%) |
| 12 to 14 Years | 0 (0.0%) | 3 (50.0%) |
| 15 Years | 0 (0.0%) | 0 (0.0%) |
| 16 and 17 Years | 0 (0.0%) | 0 (0.0%) |
| 18 to 24 Years | 6 (37.5%) | 5 (55.6%) |
| 25 to 34 Years | 5 (11.1%) | 3 (5.2%) |
| 35 to 44 Years | 9 (18.8%) | 4 (10.0%) |
| 45 to 54 Years | 3 (25.0%) | 0 (0.0%) |
| 55 to 64 Years | 3 (13.6%) | 1 (5.0%) |
| 65 to 74 Years | 2 (4.2%) | 0 (0.0%) |
| 75 Years and over | 0 (0.0%) | 3 (13.0%) |
| Total | 42 (12.8%) | 19 (6.5%) |
Income Above Poverty by Sex and Age in Culbertson
According to the poverty statistics in Culbertson, males aged 5 years and females aged under 5 years are the age groups that are most secure financially, with 100.0% of males and 100.0% of females in these age groups living above the poverty line.
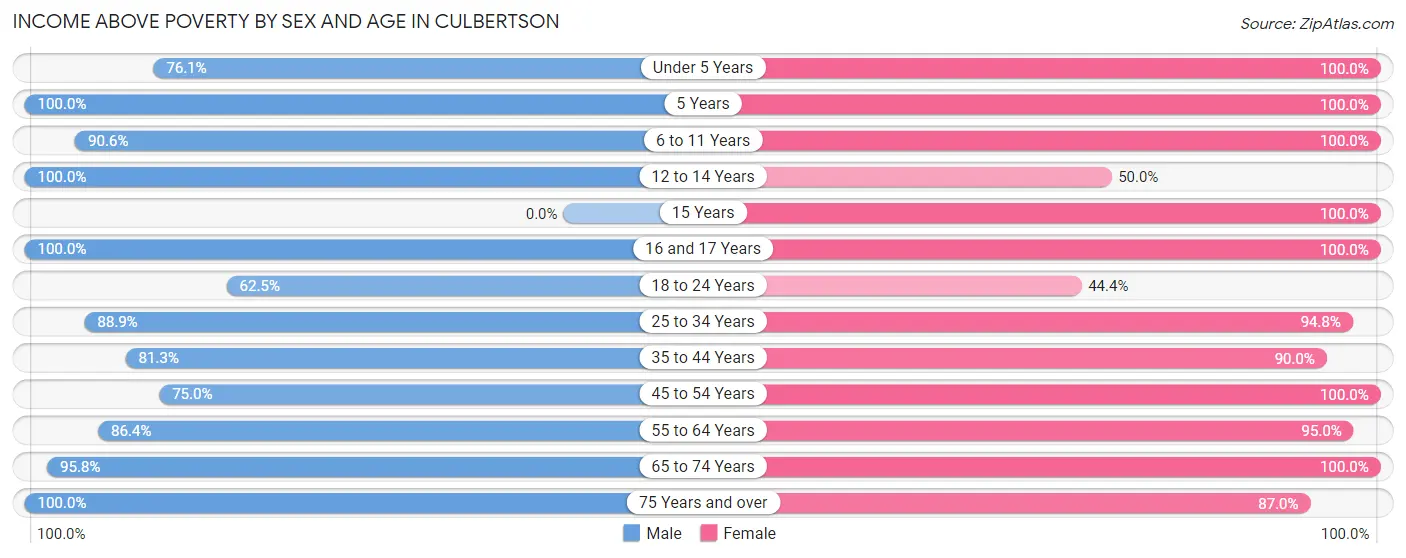
| Age Bracket | Male | Female |
| Under 5 Years | 35 (76.1%) | 33 (100.0%) |
| 5 Years | 8 (100.0%) | 5 (100.0%) |
| 6 to 11 Years | 29 (90.6%) | 40 (100.0%) |
| 12 to 14 Years | 29 (100.0%) | 3 (50.0%) |
| 15 Years | 0 (0.0%) | 5 (100.0%) |
| 16 and 17 Years | 15 (100.0%) | 2 (100.0%) |
| 18 to 24 Years | 10 (62.5%) | 4 (44.4%) |
| 25 to 34 Years | 40 (88.9%) | 55 (94.8%) |
| 35 to 44 Years | 39 (81.2%) | 36 (90.0%) |
| 45 to 54 Years | 9 (75.0%) | 13 (100.0%) |
| 55 to 64 Years | 19 (86.4%) | 19 (95.0%) |
| 65 to 74 Years | 46 (95.8%) | 38 (100.0%) |
| 75 Years and over | 8 (100.0%) | 20 (87.0%) |
| Total | 287 (87.2%) | 273 (93.5%) |
Income Below Poverty Among Married-Couple Families in Culbertson
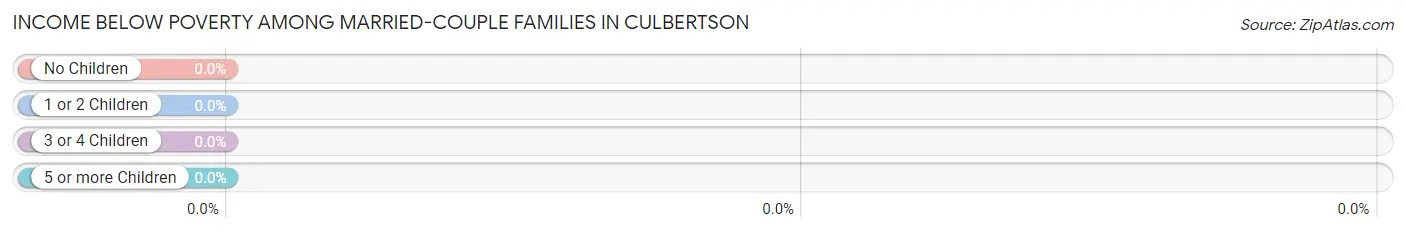
| Children | Above Poverty | Below Poverty |
| No Children | 46 (100.0%) | 0 (0.0%) |
| 1 or 2 Children | 40 (100.0%) | 0 (0.0%) |
| 3 or 4 Children | 10 (100.0%) | 0 (0.0%) |
| 5 or more Children | 12 (100.0%) | 0 (0.0%) |
| Total | 108 (100.0%) | 0 (0.0%) |
Income Below Poverty Among Single-Parent Households in Culbertson
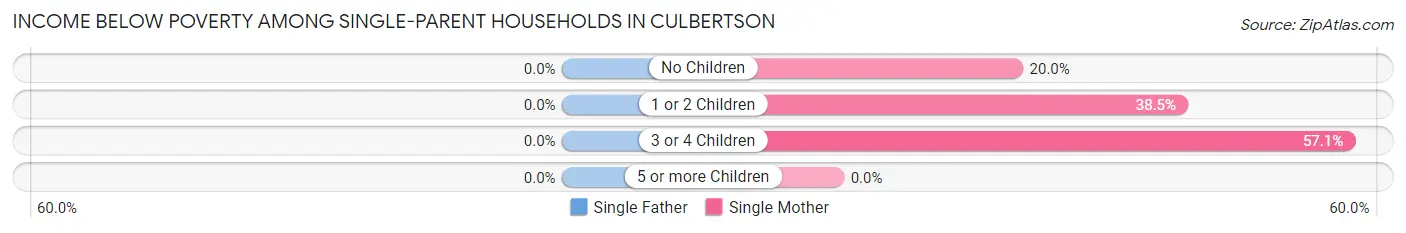
| Children | Single Father | Single Mother |
| No Children | 0 (0.0%) | 1 (20.0%) |
| 1 or 2 Children | 0 (0.0%) | 5 (38.5%) |
| 3 or 4 Children | 0 (0.0%) | 4 (57.1%) |
| 5 or more Children | 0 (0.0%) | 0 (0.0%) |
| Total | 0 (0.0%) | 10 (40.0%) |
Income Below Poverty Among Married-Couple vs Single-Parent Households in Culbertson
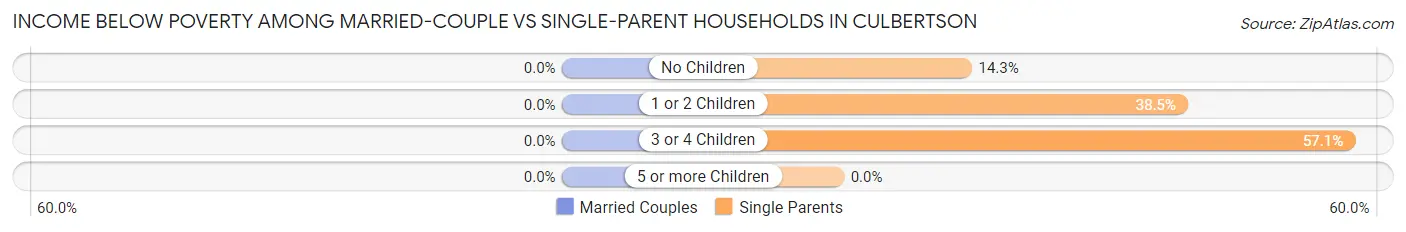
| Children | Married-Couple Families | Single-Parent Households |
| No Children | 0 (0.0%) | 1 (14.3%) |
| 1 or 2 Children | 0 (0.0%) | 5 (38.5%) |
| 3 or 4 Children | 0 (0.0%) | 4 (57.1%) |
| 5 or more Children | 0 (0.0%) | 0 (0.0%) |
| Total | 0 (0.0%) | 10 (37.0%) |
Race in Culbertson
The most populous races in Culbertson are White / Caucasian (606 | 97.6%), Hispanic or Latino (73 | 11.8%), and Two or more Races (7 | 1.1%).
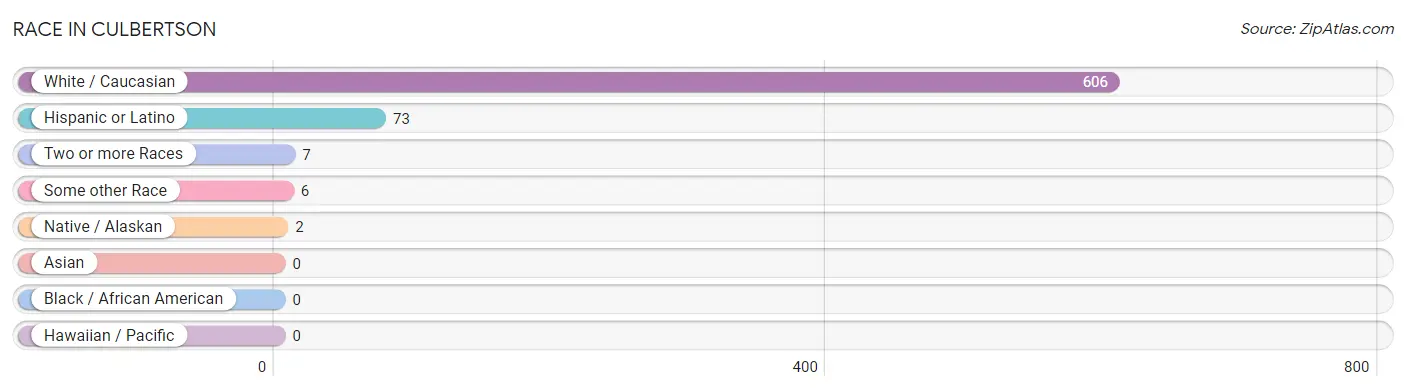
| Race | # Population | % Population |
| Asian | 0 | 0.0% |
| Black / African American | 0 | 0.0% |
| Hawaiian / Pacific | 0 | 0.0% |
| Hispanic or Latino | 73 | 11.8% |
| Native / Alaskan | 2 | 0.3% |
| White / Caucasian | 606 | 97.6% |
| Two or more Races | 7 | 1.1% |
| Some other Race | 6 | 1.0% |
| Total | 621 | 100.0% |
Ancestry in Culbertson
The most populous ancestries reported in Culbertson are German (179 | 28.8%), English (53 | 8.5%), Irish (45 | 7.2%), Cuban (34 | 5.5%), and Mexican (32 | 5.1%), together accounting for 55.2% of all Culbertson residents.
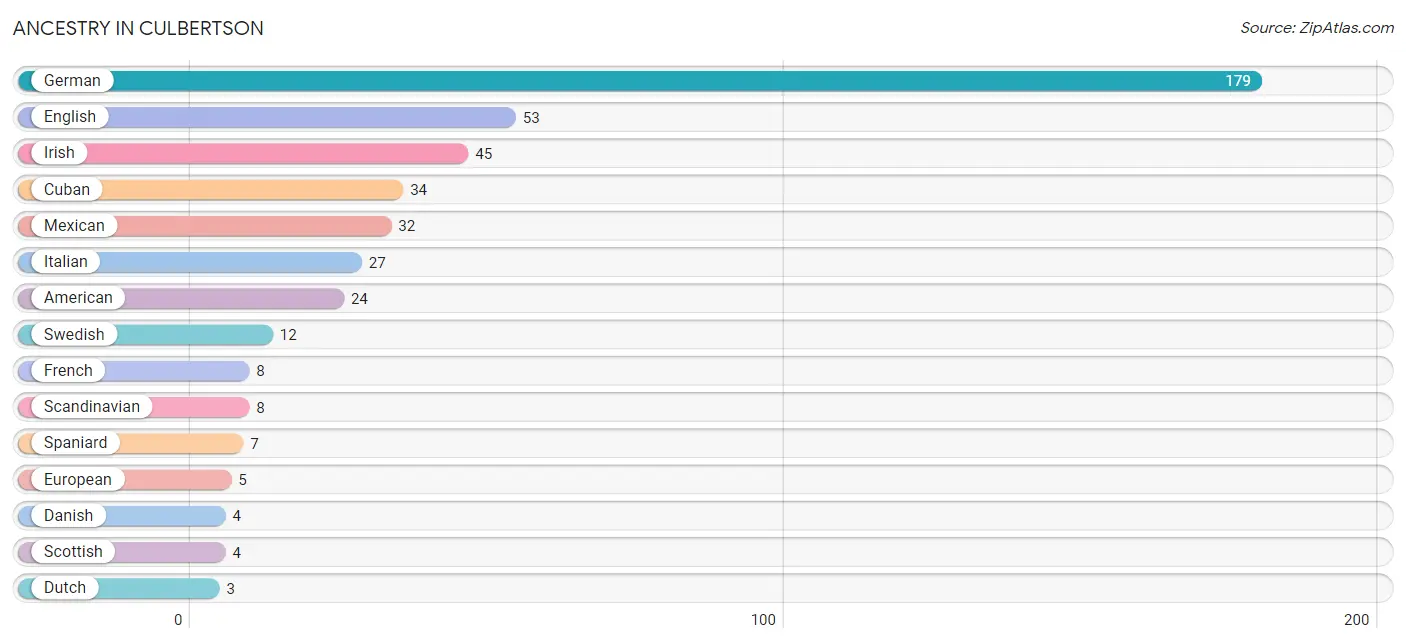
| Ancestry | # Population | % Population |
| American | 24 | 3.9% |
| Cuban | 34 | 5.5% |
| Czech | 1 | 0.2% |
| Danish | 4 | 0.6% |
| Dutch | 3 | 0.5% |
| English | 53 | 8.5% |
| European | 5 | 0.8% |
| French | 8 | 1.3% |
| German | 179 | 28.8% |
| Irish | 45 | 7.2% |
| Italian | 27 | 4.3% |
| Mexican | 32 | 5.1% |
| Scandinavian | 8 | 1.3% |
| Scottish | 4 | 0.6% |
| Sioux | 2 | 0.3% |
| Slavic | 3 | 0.5% |
| Spaniard | 7 | 1.1% |
| Swedish | 12 | 1.9% | View All 18 Rows |
Immigrants in Culbertson

| Immigration Origin | # Population | % Population | View All 0 Rows |
Sex and Age in Culbertson
Sex and Age in Culbertson
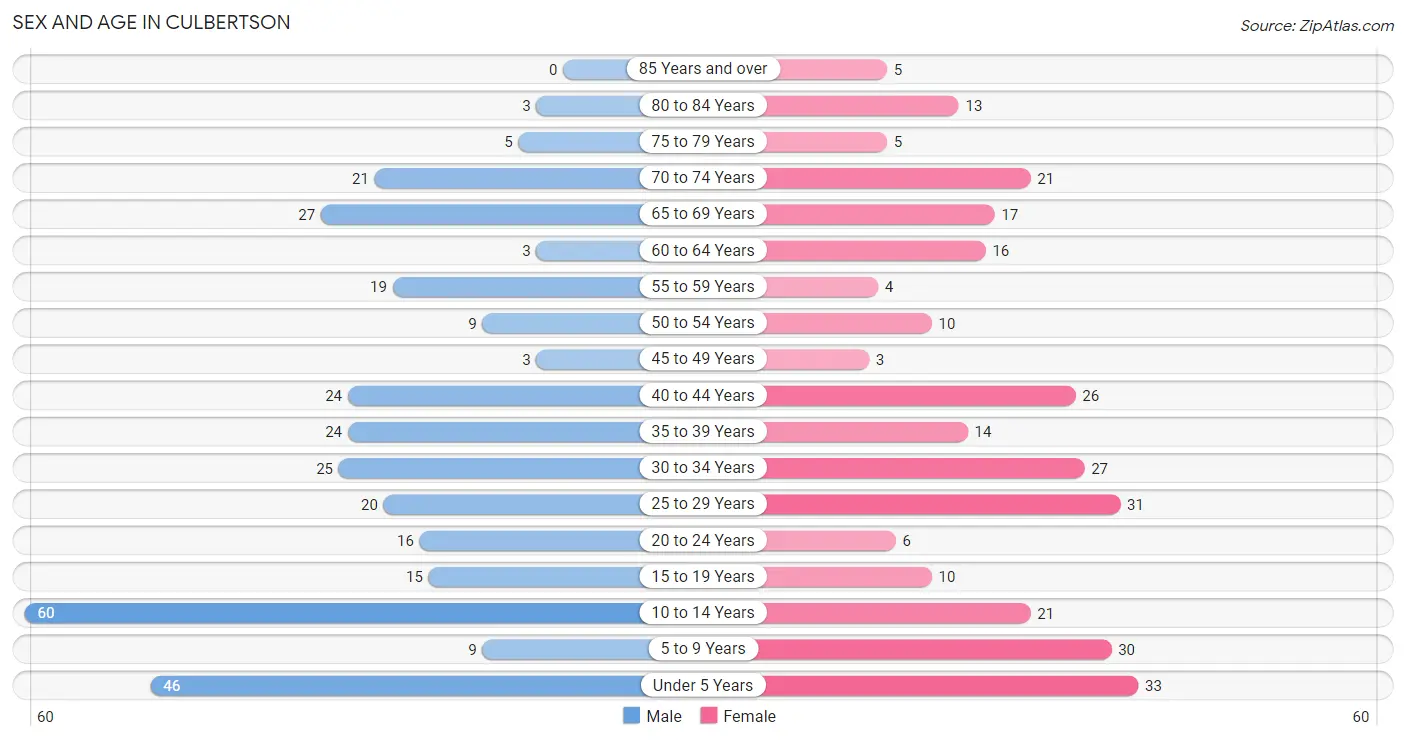
The most populous age groups in Culbertson are 10 to 14 Years (60 | 18.2%) for men and Under 5 Years (33 | 11.3%) for women.
| Age Bracket | Male | Female |
| Under 5 Years | 46 (14.0%) | 33 (11.3%) |
| 5 to 9 Years | 9 (2.7%) | 30 (10.3%) |
| 10 to 14 Years | 60 (18.2%) | 21 (7.2%) |
| 15 to 19 Years | 15 (4.6%) | 10 (3.4%) |
| 20 to 24 Years | 16 (4.9%) | 6 (2.1%) |
| 25 to 29 Years | 20 (6.1%) | 31 (10.6%) |
| 30 to 34 Years | 25 (7.6%) | 27 (9.2%) |
| 35 to 39 Years | 24 (7.3%) | 14 (4.8%) |
| 40 to 44 Years | 24 (7.3%) | 26 (8.9%) |
| 45 to 49 Years | 3 (0.9%) | 3 (1.0%) |
| 50 to 54 Years | 9 (2.7%) | 10 (3.4%) |
| 55 to 59 Years | 19 (5.8%) | 4 (1.4%) |
| 60 to 64 Years | 3 (0.9%) | 16 (5.5%) |
| 65 to 69 Years | 27 (8.2%) | 17 (5.8%) |
| 70 to 74 Years | 21 (6.4%) | 21 (7.2%) |
| 75 to 79 Years | 5 (1.5%) | 5 (1.7%) |
| 80 to 84 Years | 3 (0.9%) | 13 (4.4%) |
| 85 Years and over | 0 (0.0%) | 5 (1.7%) |
| Total | 329 (100.0%) | 292 (100.0%) |
Families and Households in Culbertson
Median Family Size in Culbertson
The median family size in Culbertson is 3.78 persons per family, with married-couple families (108 | 80.0%) accounting for the largest median family size of 3.98 persons per family. On the other hand, single male/father families (2 | 1.5%) represent the smallest median family size with 2.50 persons per family.
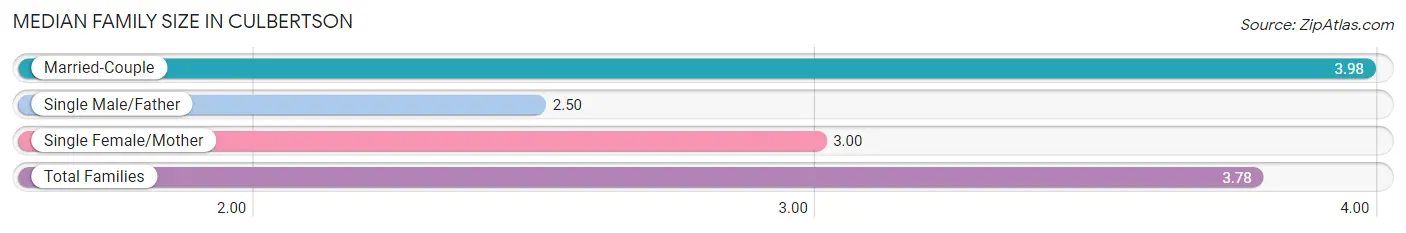
| Family Type | # Families | Family Size |
| Married-Couple | 108 (80.0%) | 3.98 |
| Single Male/Father | 2 (1.5%) | 2.50 |
| Single Female/Mother | 25 (18.5%) | 3.00 |
| Total Families | 135 (100.0%) | 3.78 |
Median Household Size in Culbertson
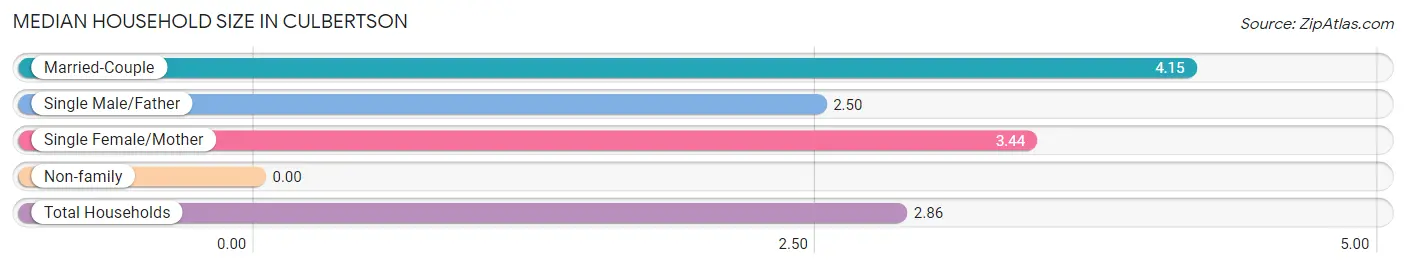
| Household Type | # Households | Household Size |
| Married-Couple | 108 (49.8%) | 4.15 |
| Single Male/Father | 2 (0.9%) | 2.50 |
| Single Female/Mother | 25 (11.5%) | 3.44 |
| Non-family | 82 (37.8%) | - |
| Total Households | 217 (100.0%) | 2.86 |
Household Size by Marriage Status in Culbertson
Out of a total of 217 households in Culbertson, 135 (62.2%) are family households, while 82 (37.8%) are nonfamily households. The most numerous type of family households are 2-person households, comprising 58, and the most common type of nonfamily households are 1-person households, comprising 82.
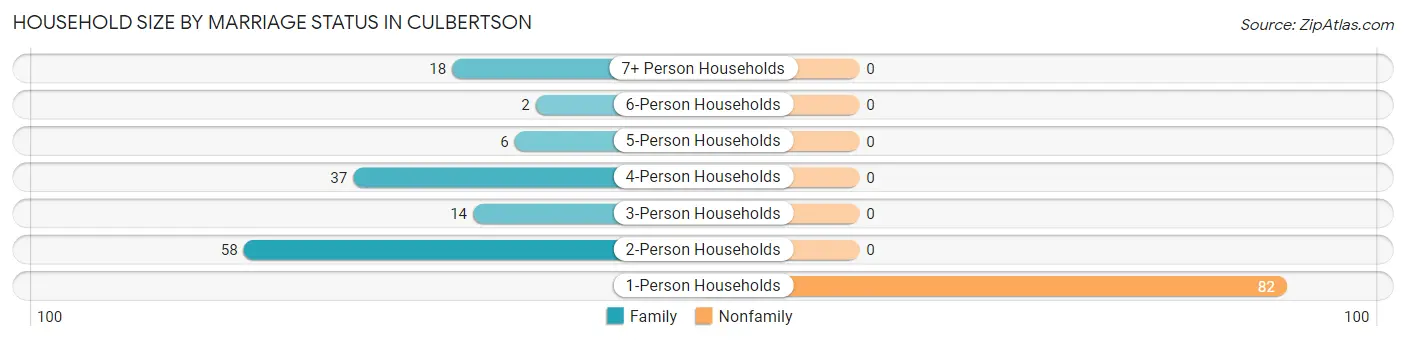
| Household Size | Family Households | Nonfamily Households |
| 1-Person Households | - | 82 (37.8%) |
| 2-Person Households | 58 (26.7%) | 0 (0.0%) |
| 3-Person Households | 14 (6.5%) | 0 (0.0%) |
| 4-Person Households | 37 (17.1%) | 0 (0.0%) |
| 5-Person Households | 6 (2.8%) | 0 (0.0%) |
| 6-Person Households | 2 (0.9%) | 0 (0.0%) |
| 7+ Person Households | 18 (8.3%) | 0 (0.0%) |
| Total | 135 (62.2%) | 82 (37.8%) |
Female Fertility in Culbertson
Fertility by Age in Culbertson
Average fertility rate in Culbertson is 359.0 births per 1,000 women. Women in the age bracket of 20 to 34 years have the highest fertility rate with 578.0 births per 1,000 women. Women in the age bracket of 20 to 34 years acount for 88.1% of all women with births.
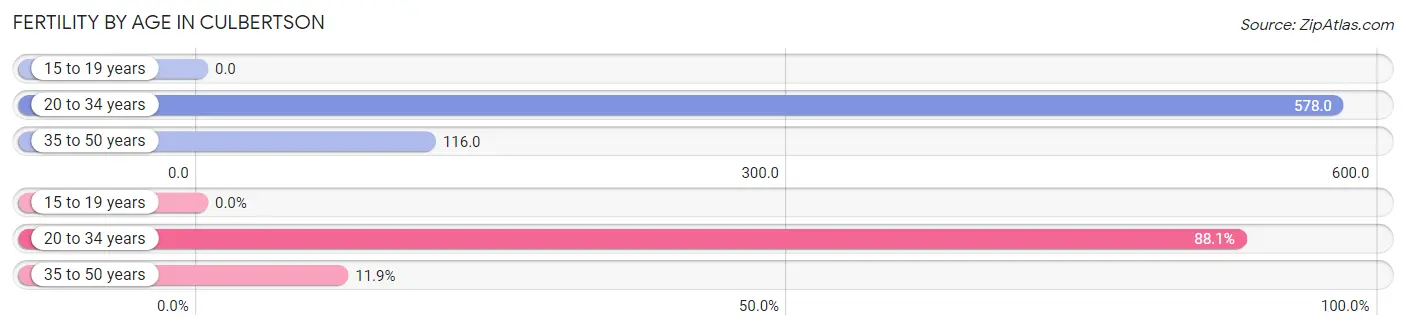
| Age Bracket | Women with Births | Births / 1,000 Women |
| 15 to 19 years | 0 (0.0%) | 0.0 |
| 20 to 34 years | 37 (88.1%) | 578.0 |
| 35 to 50 years | 5 (11.9%) | 116.0 |
| Total | 42 (100.0%) | 359.0 |
Fertility by Age by Marriage Status in Culbertson
88.1% of women with births (42) in Culbertson are married. The highest percentage of unmarried women with births falls into 20 to 34 years age bracket with 13.5% of them unmarried at the time of birth, while the lowest percentage of unmarried women with births belong to 35 to 50 years age bracket with 0.0% of them unmarried.
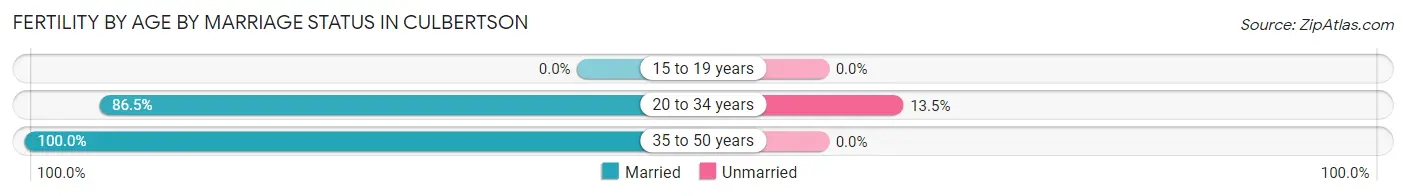
| Age Bracket | Married | Unmarried |
| 15 to 19 years | 0 (0.0%) | 0 (0.0%) |
| 20 to 34 years | 32 (86.5%) | 5 (13.5%) |
| 35 to 50 years | 5 (100.0%) | 0 (0.0%) |
| Total | 37 (88.1%) | 5 (11.9%) |
Fertility by Education in Culbertson
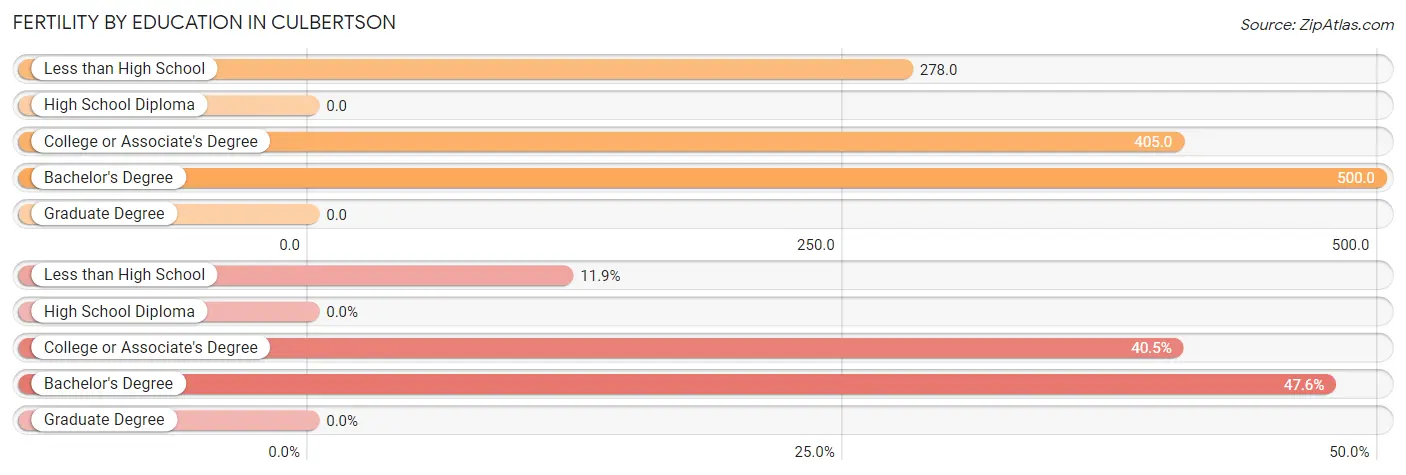
| Educational Attainment | Women with Births | Births / 1,000 Women |
| Less than High School | 5 (11.9%) | 278.0 |
| High School Diploma | 0 (0.0%) | 0.0 |
| College or Associate's Degree | 17 (40.5%) | 405.0 |
| Bachelor's Degree | 20 (47.6%) | 500.0 |
| Graduate Degree | 0 (0.0%) | 0.0 |
| Total | 42 (100.0%) | 359.0 |
Fertility by Education by Marriage Status in Culbertson
11.9% of women with births in Culbertson are unmarried. Women with the educational attainment of less than high school are most likely to be married with 100.0% of them married at childbirth, while women with the educational attainment of college or associate's degree are least likely to be married with 29.4% of them unmarried at childbirth.
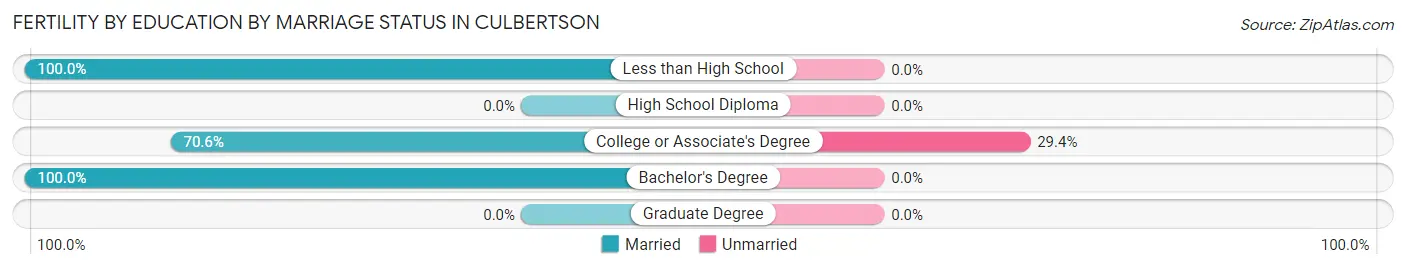
| Educational Attainment | Married | Unmarried |
| Less than High School | 5 (100.0%) | 0 (0.0%) |
| High School Diploma | 0 (0.0%) | 0 (0.0%) |
| College or Associate's Degree | 12 (70.6%) | 5 (29.4%) |
| Bachelor's Degree | 20 (100.0%) | 0 (0.0%) |
| Graduate Degree | 0 (0.0%) | 0 (0.0%) |
| Total | 37 (88.1%) | 5 (11.9%) |
Employment Characteristics in Culbertson
Employment by Class of Employer in Culbertson
Among the 261 employed individuals in Culbertson, private company employees (163 | 62.5%), local government employees (37 | 14.2%), and self-employed (not incorporated) (30 | 11.5%) make up the most common classes of employment.
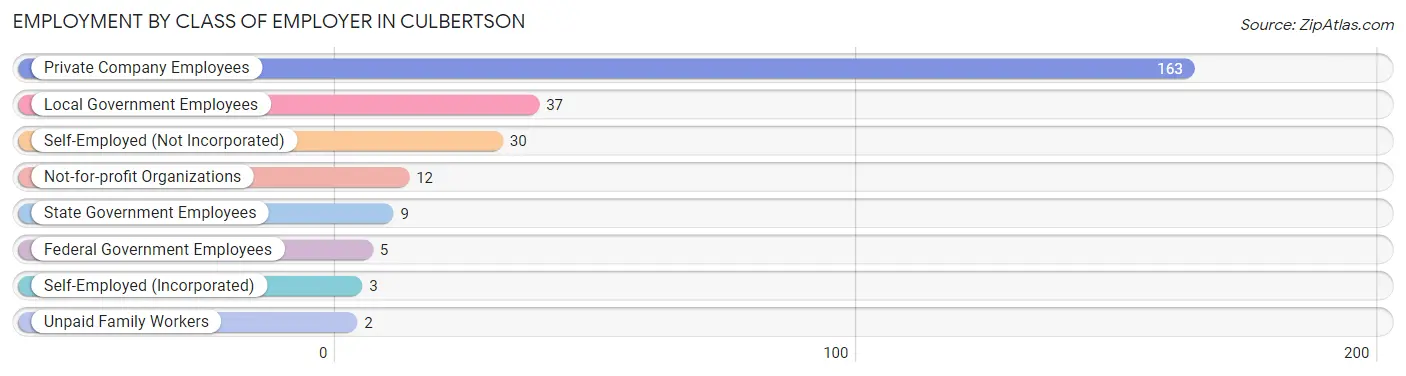
| Employer Class | # Employees | % Employees |
| Private Company Employees | 163 | 62.5% |
| Self-Employed (Incorporated) | 3 | 1.1% |
| Self-Employed (Not Incorporated) | 30 | 11.5% |
| Not-for-profit Organizations | 12 | 4.6% |
| Local Government Employees | 37 | 14.2% |
| State Government Employees | 9 | 3.5% |
| Federal Government Employees | 5 | 1.9% |
| Unpaid Family Workers | 2 | 0.8% |
| Total | 261 | 100.0% |
Employment Status by Age in Culbertson
According to the labor force statistics for Culbertson, out of the total population over 16 years of age (417), 71.0% or 296 individuals are in the labor force, with 3.4% or 10 of them unemployed. The age group with the highest labor force participation rate is 20 to 24 years, with 100.0% or 22 individuals in the labor force. Within the labor force, the 35 to 44 years age range has the highest percentage of unemployed individuals, with 8.1% or 7 of them being unemployed.
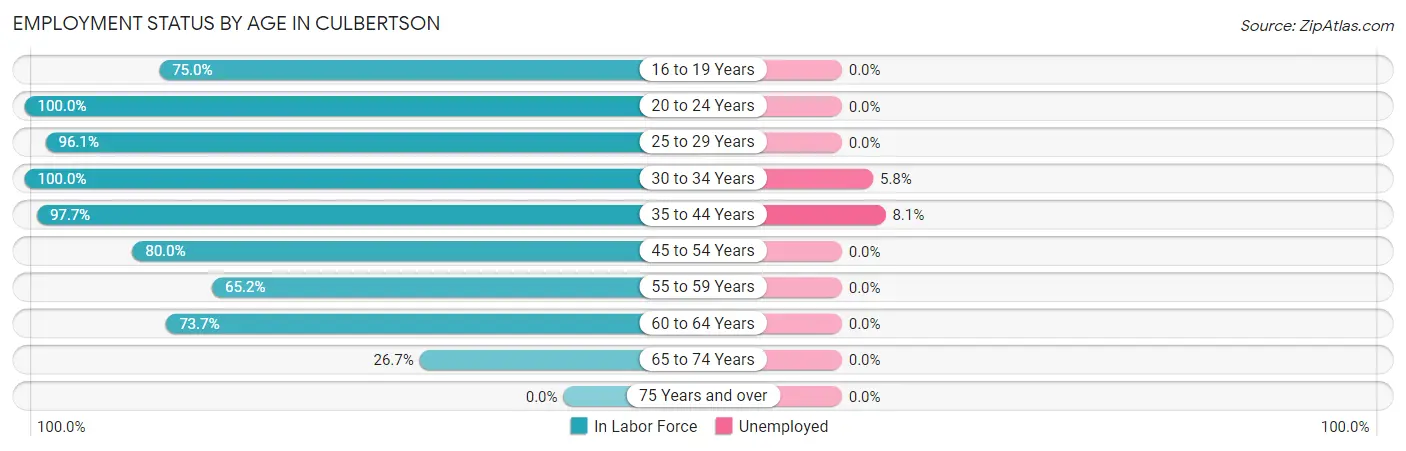
| Age Bracket | In Labor Force | Unemployed |
| 16 to 19 Years | 15 (75.0%) | 0 (0.0%) |
| 20 to 24 Years | 22 (100.0%) | 0 (0.0%) |
| 25 to 29 Years | 49 (96.1%) | 0 (0.0%) |
| 30 to 34 Years | 52 (100.0%) | 3 (5.8%) |
| 35 to 44 Years | 86 (97.7%) | 7 (8.1%) |
| 45 to 54 Years | 20 (80.0%) | 0 (0.0%) |
| 55 to 59 Years | 15 (65.2%) | 0 (0.0%) |
| 60 to 64 Years | 14 (73.7%) | 0 (0.0%) |
| 65 to 74 Years | 23 (26.7%) | 0 (0.0%) |
| 75 Years and over | 0 (0.0%) | 0 (0.0%) |
| Total | 296 (71.0%) | 10 (3.4%) |
Employment Status by Educational Attainment in Culbertson
According to labor force statistics for Culbertson, 91.5% of individuals (236) out of the total population between 25 and 64 years of age (258) are in the labor force, with 4.2% or 10 of them being unemployed. The group with the highest labor force participation rate are those with the educational attainment of college / associate degree, with 98.9% or 90 individuals in the labor force. Within the labor force, individuals with less than high school education have the highest percentage of unemployment, with 14.3% or 3 of them being unemployed.
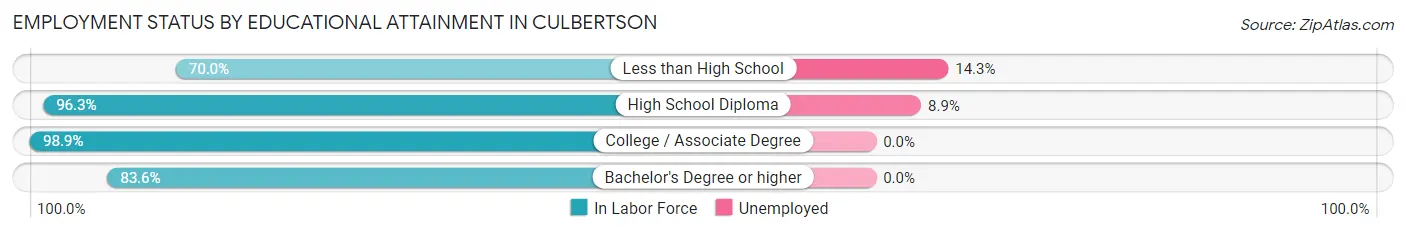
| Educational Attainment | In Labor Force | Unemployed |
| Less than High School | 21 (70.0%) | 4 (14.3%) |
| High School Diploma | 79 (96.3%) | 7 (8.9%) |
| College / Associate Degree | 90 (98.9%) | 0 (0.0%) |
| Bachelor's Degree or higher | 46 (83.6%) | 0 (0.0%) |
| Total | 236 (91.5%) | 11 (4.2%) |
Employment Occupations by Sex in Culbertson
Management, Business, Science and Arts Occupations
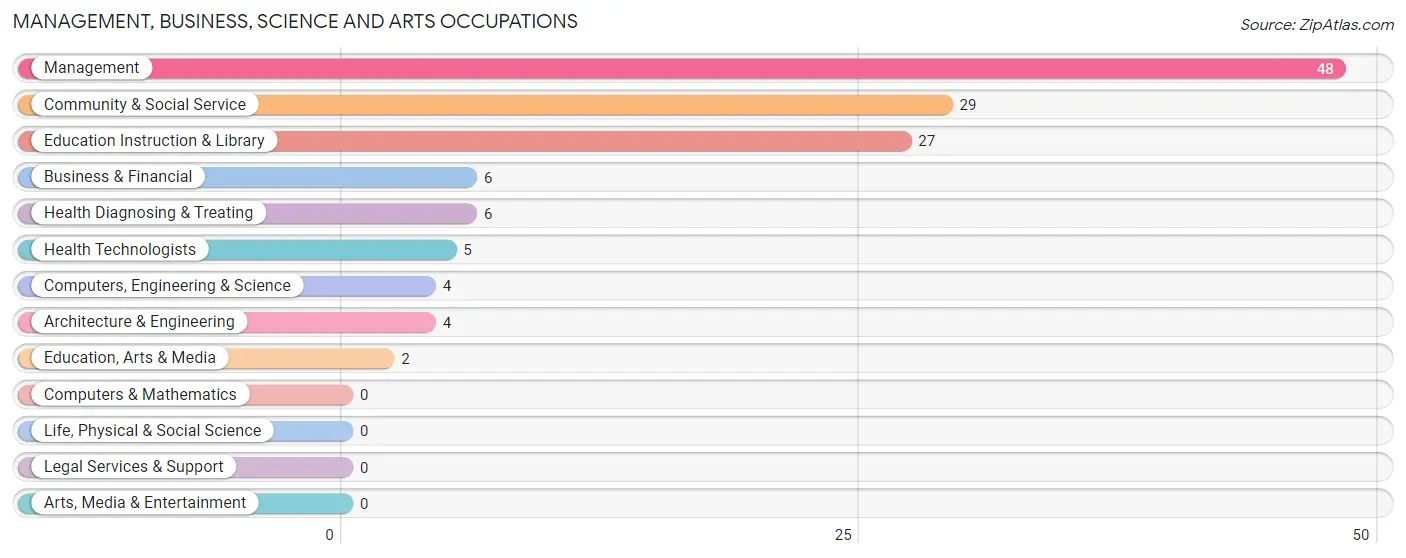
The most common Management, Business, Science and Arts occupations in Culbertson are Management (48 | 16.8%), Community & Social Service (29 | 10.1%), Education Instruction & Library (27 | 9.4%), Business & Financial (6 | 2.1%), and Health Diagnosing & Treating (6 | 2.1%).
Management, Business, Science and Arts Occupations by Sex
Within the Management, Business, Science and Arts occupations in Culbertson, the most male-oriented occupations are Education, Arts & Media (100.0%), Management (68.8%), and Business & Financial (50.0%), while the most female-oriented occupations are Health Diagnosing & Treating (100.0%), Health Technologists (100.0%), and Education Instruction & Library (92.6%).
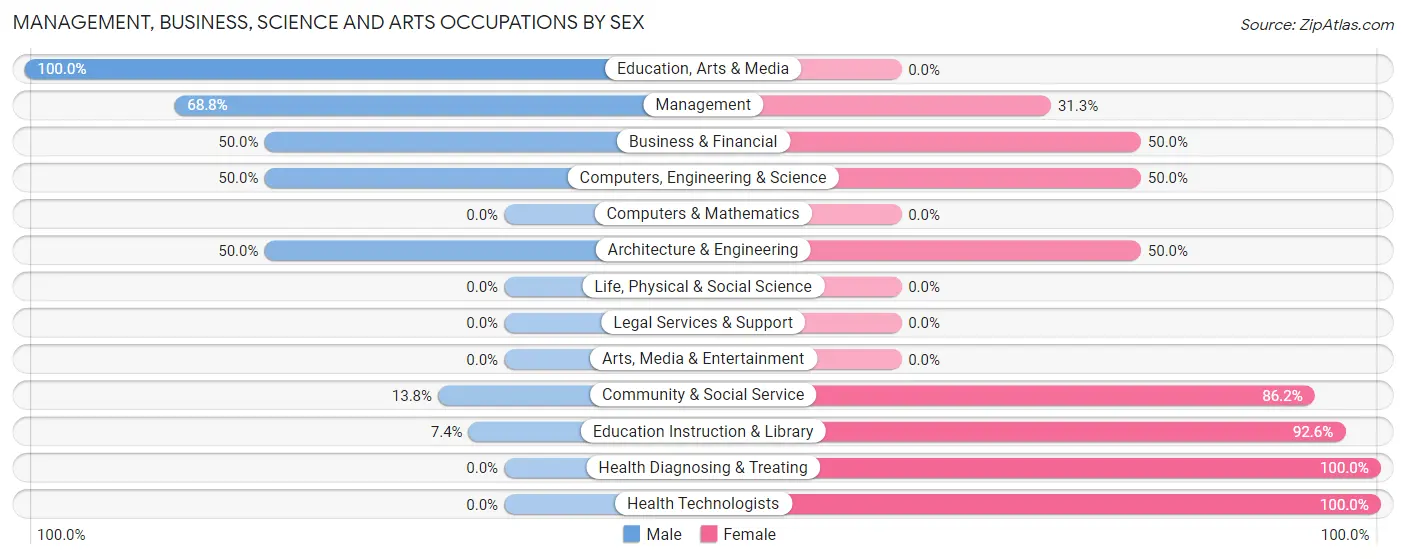
| Occupation | Male | Female |
| Management | 33 (68.8%) | 15 (31.2%) |
| Business & Financial | 3 (50.0%) | 3 (50.0%) |
| Computers, Engineering & Science | 2 (50.0%) | 2 (50.0%) |
| Computers & Mathematics | 0 (0.0%) | 0 (0.0%) |
| Architecture & Engineering | 2 (50.0%) | 2 (50.0%) |
| Life, Physical & Social Science | 0 (0.0%) | 0 (0.0%) |
| Community & Social Service | 4 (13.8%) | 25 (86.2%) |
| Education, Arts & Media | 2 (100.0%) | 0 (0.0%) |
| Legal Services & Support | 0 (0.0%) | 0 (0.0%) |
| Education Instruction & Library | 2 (7.4%) | 25 (92.6%) |
| Arts, Media & Entertainment | 0 (0.0%) | 0 (0.0%) |
| Health Diagnosing & Treating | 0 (0.0%) | 6 (100.0%) |
| Health Technologists | 0 (0.0%) | 5 (100.0%) |
| Total (Category) | 42 (45.2%) | 51 (54.8%) |
| Total (Overall) | 152 (53.1%) | 134 (46.9%) |
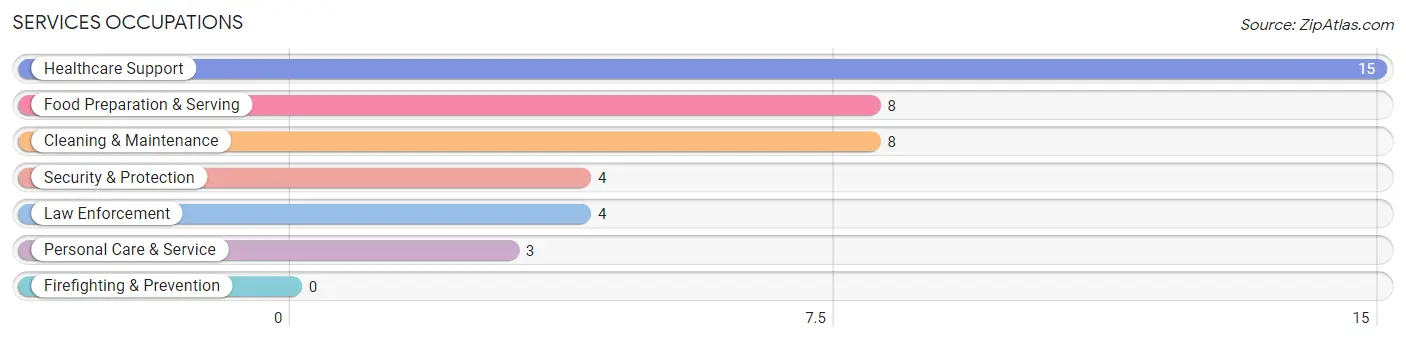
Services Occupations
The most common Services occupations in Culbertson are Healthcare Support (15 | 5.2%), Food Preparation & Serving (8 | 2.8%), Cleaning & Maintenance (8 | 2.8%), Security & Protection (4 | 1.4%), and Law Enforcement (4 | 1.4%).
Services Occupations by Sex
Within the Services occupations in Culbertson, the most male-oriented occupations are Cleaning & Maintenance (50.0%), Security & Protection (25.0%), and Law Enforcement (25.0%), while the most female-oriented occupations are Healthcare Support (100.0%), Personal Care & Service (100.0%), and Security & Protection (75.0%).
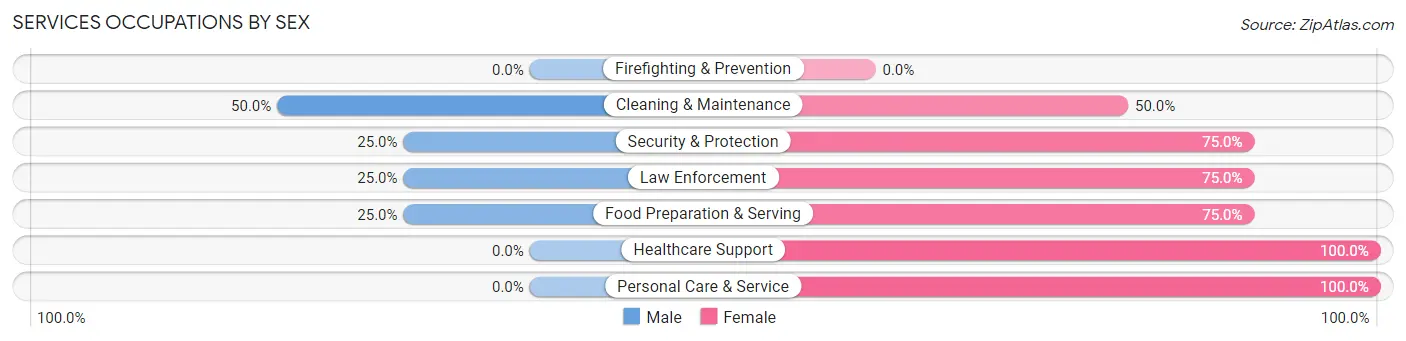
| Occupation | Male | Female |
| Healthcare Support | 0 (0.0%) | 15 (100.0%) |
| Security & Protection | 1 (25.0%) | 3 (75.0%) |
| Firefighting & Prevention | 0 (0.0%) | 0 (0.0%) |
| Law Enforcement | 1 (25.0%) | 3 (75.0%) |
| Food Preparation & Serving | 2 (25.0%) | 6 (75.0%) |
| Cleaning & Maintenance | 4 (50.0%) | 4 (50.0%) |
| Personal Care & Service | 0 (0.0%) | 3 (100.0%) |
| Total (Category) | 7 (18.4%) | 31 (81.6%) |
| Total (Overall) | 152 (53.1%) | 134 (46.9%) |
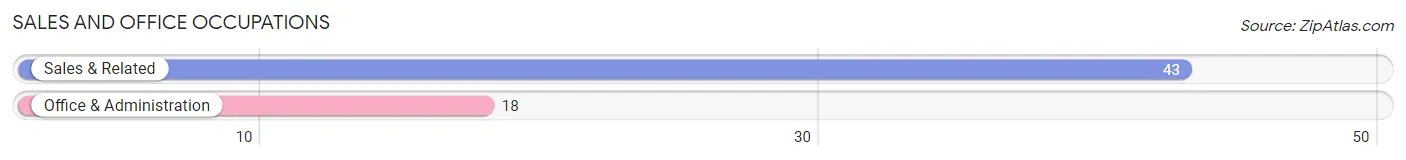
Sales and Office Occupations
The most common Sales and Office occupations in Culbertson are Sales & Related (43 | 15.0%), and Office & Administration (18 | 6.3%).
Sales and Office Occupations by Sex
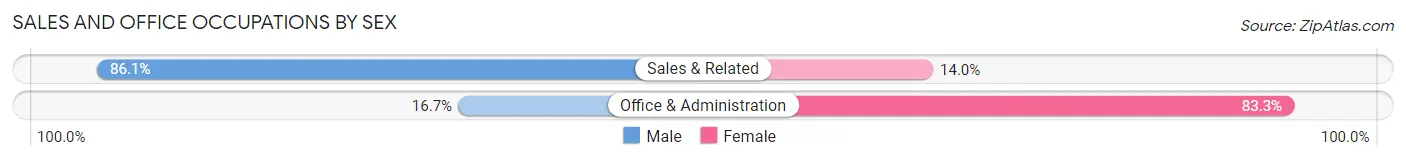
| Occupation | Male | Female |
| Sales & Related | 37 (86.1%) | 6 (14.0%) |
| Office & Administration | 3 (16.7%) | 15 (83.3%) |
| Total (Category) | 40 (65.6%) | 21 (34.4%) |
| Total (Overall) | 152 (53.1%) | 134 (46.9%) |
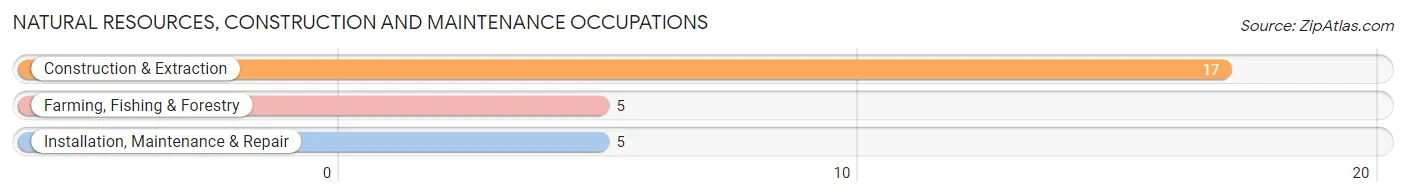
Natural Resources, Construction and Maintenance Occupations
The most common Natural Resources, Construction and Maintenance occupations in Culbertson are Construction & Extraction (17 | 5.9%), Farming, Fishing & Forestry (5 | 1.8%), and Installation, Maintenance & Repair (5 | 1.8%).
Natural Resources, Construction and Maintenance Occupations by Sex
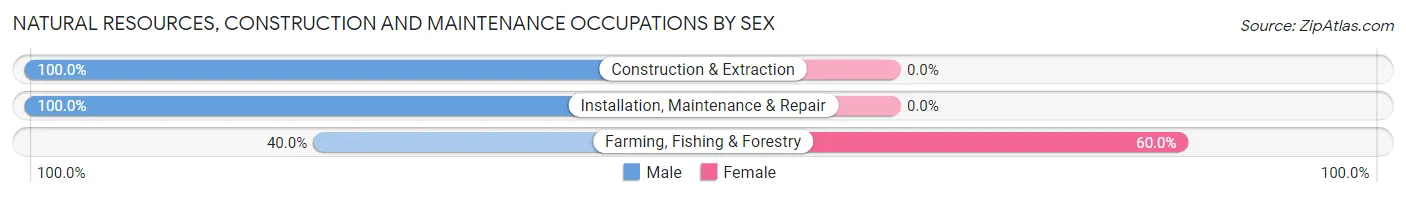
| Occupation | Male | Female |
| Farming, Fishing & Forestry | 2 (40.0%) | 3 (60.0%) |
| Construction & Extraction | 17 (100.0%) | 0 (0.0%) |
| Installation, Maintenance & Repair | 5 (100.0%) | 0 (0.0%) |
| Total (Category) | 24 (88.9%) | 3 (11.1%) |
| Total (Overall) | 152 (53.1%) | 134 (46.9%) |
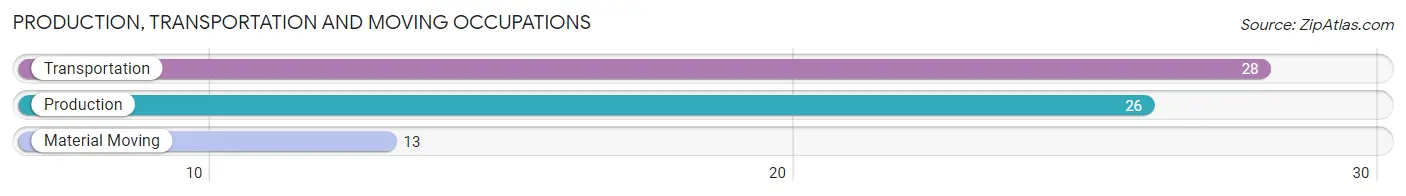
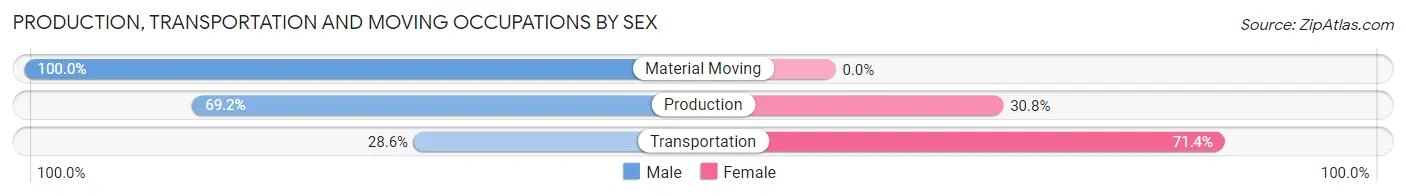
Production, Transportation and Moving Occupations
The most common Production, Transportation and Moving occupations in Culbertson are Transportation (28 | 9.8%), Production (26 | 9.1%), and Material Moving (13 | 4.5%).
Production, Transportation and Moving Occupations by Sex
| Occupation | Male | Female |
| Production | 18 (69.2%) | 8 (30.8%) |
| Transportation | 8 (28.6%) | 20 (71.4%) |
| Material Moving | 13 (100.0%) | 0 (0.0%) |
| Total (Category) | 39 (58.2%) | 28 (41.8%) |
| Total (Overall) | 152 (53.1%) | 134 (46.9%) |
Employment Industries by Sex in Culbertson
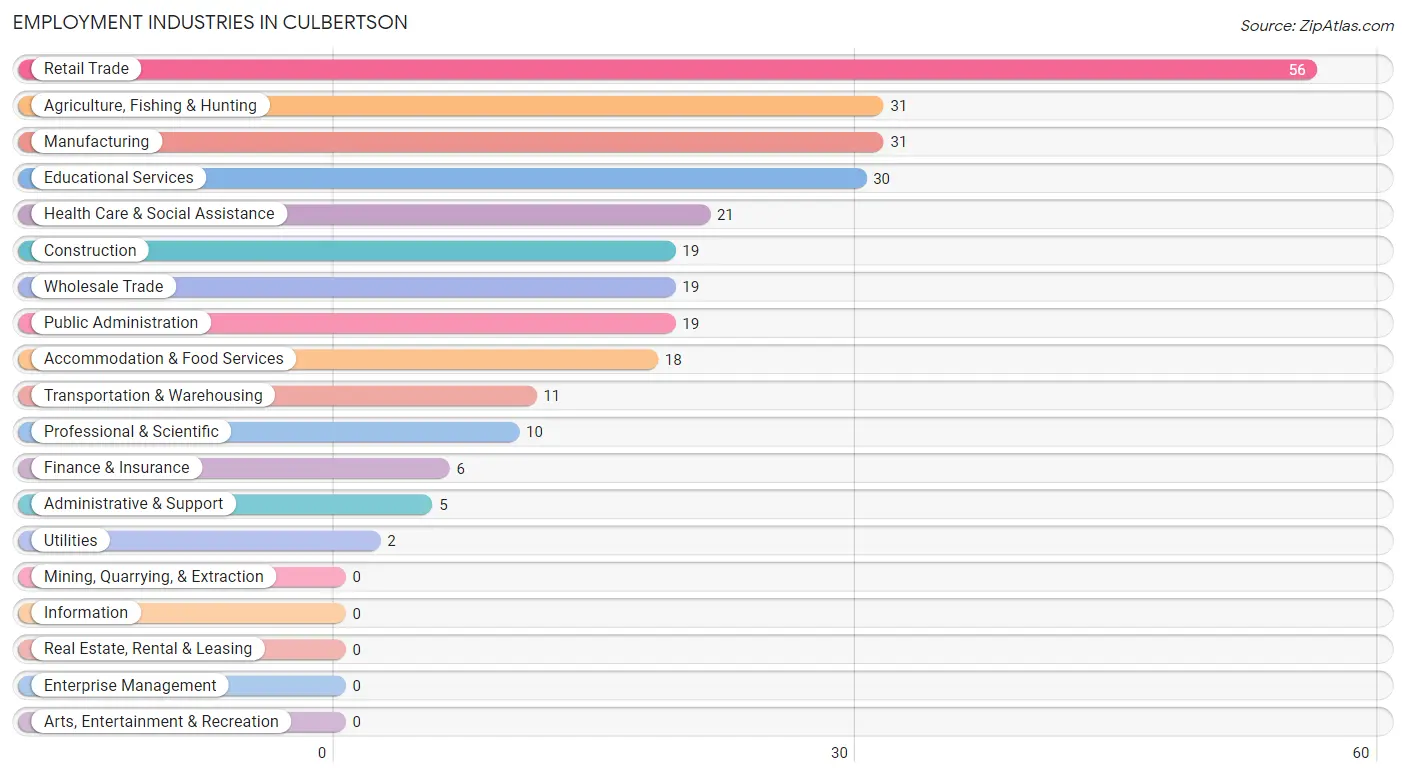
Employment Industries in Culbertson
The major employment industries in Culbertson include Retail Trade (56 | 19.6%), Agriculture, Fishing & Hunting (31 | 10.8%), Manufacturing (31 | 10.8%), Educational Services (30 | 10.5%), and Health Care & Social Assistance (21 | 7.3%).
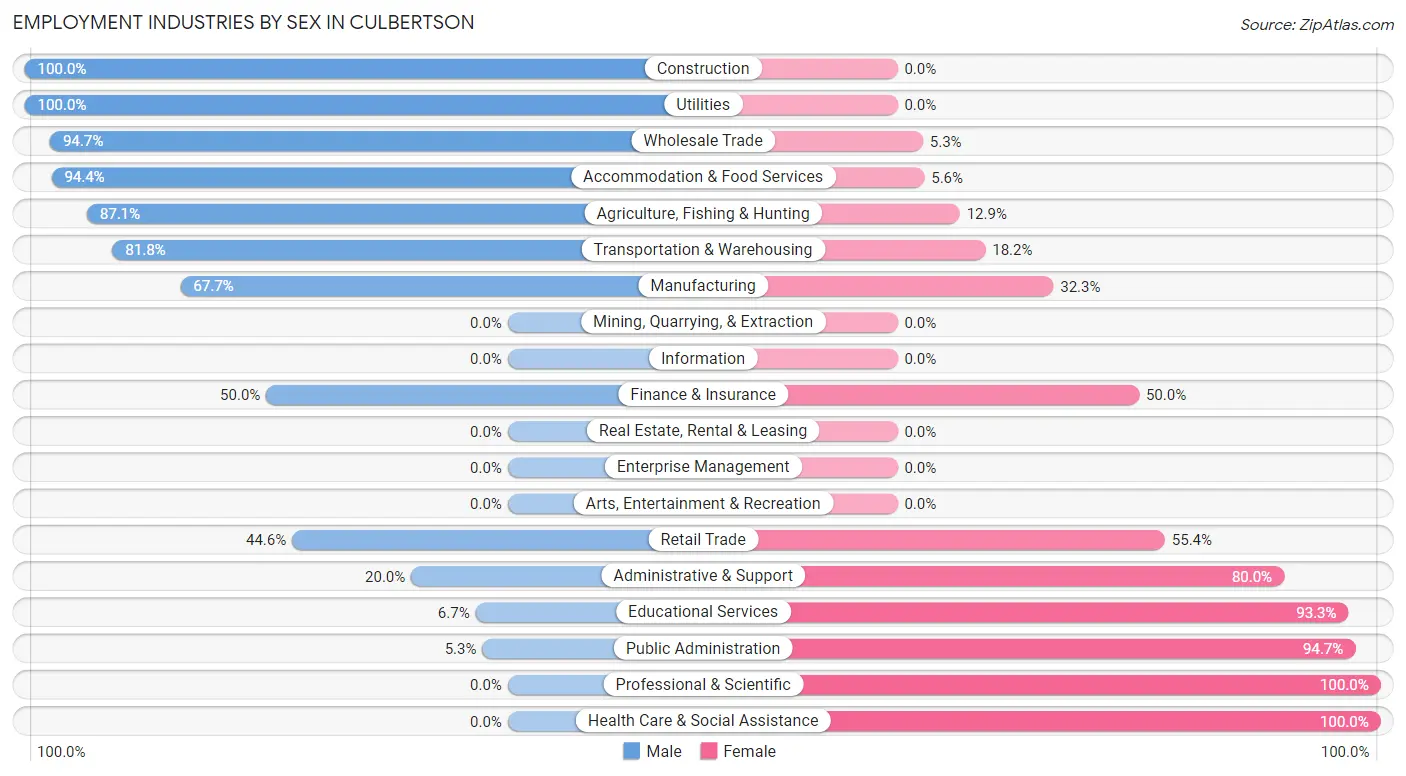
Employment Industries by Sex in Culbertson
The Culbertson industries that see more men than women are Construction (100.0%), Utilities (100.0%), and Wholesale Trade (94.7%), whereas the industries that tend to have a higher number of women are Professional & Scientific (100.0%), Health Care & Social Assistance (100.0%), and Public Administration (94.7%).
| Industry | Male | Female |
| Agriculture, Fishing & Hunting | 27 (87.1%) | 4 (12.9%) |
| Mining, Quarrying, & Extraction | 0 (0.0%) | 0 (0.0%) |
| Construction | 19 (100.0%) | 0 (0.0%) |
| Manufacturing | 21 (67.7%) | 10 (32.3%) |
| Wholesale Trade | 18 (94.7%) | 1 (5.3%) |
| Retail Trade | 25 (44.6%) | 31 (55.4%) |
| Transportation & Warehousing | 9 (81.8%) | 2 (18.2%) |
| Utilities | 2 (100.0%) | 0 (0.0%) |
| Information | 0 (0.0%) | 0 (0.0%) |
| Finance & Insurance | 3 (50.0%) | 3 (50.0%) |
| Real Estate, Rental & Leasing | 0 (0.0%) | 0 (0.0%) |
| Professional & Scientific | 0 (0.0%) | 10 (100.0%) |
| Enterprise Management | 0 (0.0%) | 0 (0.0%) |
| Administrative & Support | 1 (20.0%) | 4 (80.0%) |
| Educational Services | 2 (6.7%) | 28 (93.3%) |
| Health Care & Social Assistance | 0 (0.0%) | 21 (100.0%) |
| Arts, Entertainment & Recreation | 0 (0.0%) | 0 (0.0%) |
| Accommodation & Food Services | 17 (94.4%) | 1 (5.6%) |
| Public Administration | 1 (5.3%) | 18 (94.7%) |
| Total | 152 (53.1%) | 134 (46.9%) |
Education in Culbertson
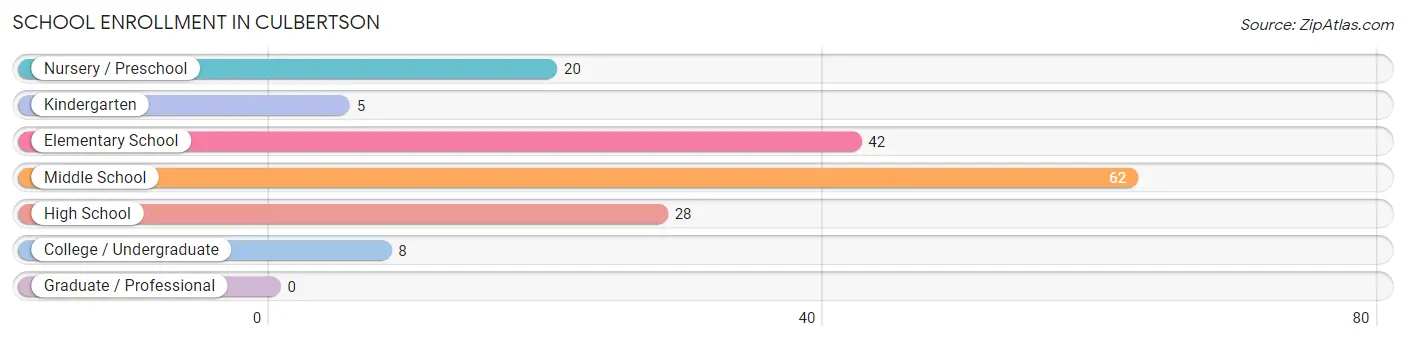
School Enrollment in Culbertson
The most common levels of schooling among the 165 students in Culbertson are middle school (62 | 37.6%), elementary school (42 | 25.5%), and high school (28 | 17.0%).
| School Level | # Students | % Students |
| Nursery / Preschool | 20 | 12.1% |
| Kindergarten | 5 | 3.0% |
| Elementary School | 42 | 25.5% |
| Middle School | 62 | 37.6% |
| High School | 28 | 17.0% |
| College / Undergraduate | 8 | 4.9% |
| Graduate / Professional | 0 | 0.0% |
| Total | 165 | 100.0% |
School Enrollment by Age by Funding Source in Culbertson
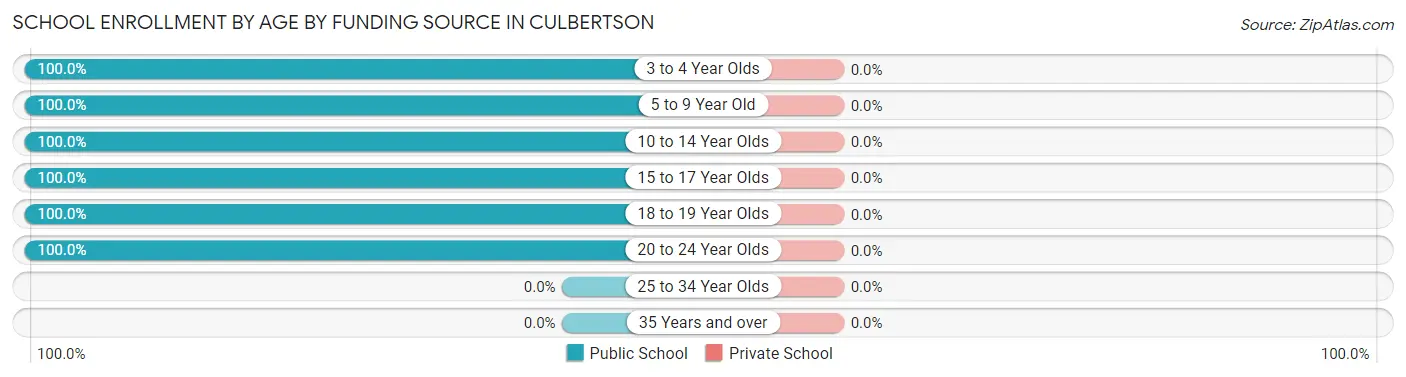
| Age Bracket | Public School | Private School |
| 3 to 4 Year Olds | 12 (100.0%) | 0 (0.0%) |
| 5 to 9 Year Old | 39 (100.0%) | 0 (0.0%) |
| 10 to 14 Year Olds | 81 (100.0%) | 0 (0.0%) |
| 15 to 17 Year Olds | 22 (100.0%) | 0 (0.0%) |
| 18 to 19 Year Olds | 3 (100.0%) | 0 (0.0%) |
| 20 to 24 Year Olds | 8 (100.0%) | 0 (0.0%) |
| 25 to 34 Year Olds | 0 (0.0%) | 0 (0.0%) |
| 35 Years and over | 0 (0.0%) | 0 (0.0%) |
| Total | 165 (100.0%) | 0 (0.0%) |
Educational Attainment by Field of Study in Culbertson
Education (41 | 51.2%), bio, nature & agricultural (23 | 28.7%), science & technology (4 | 5.0%), business (4 | 5.0%), and visual & performing arts (3 | 3.7%) are the most common fields of study among 80 individuals in Culbertson who have obtained a bachelor's degree or higher.
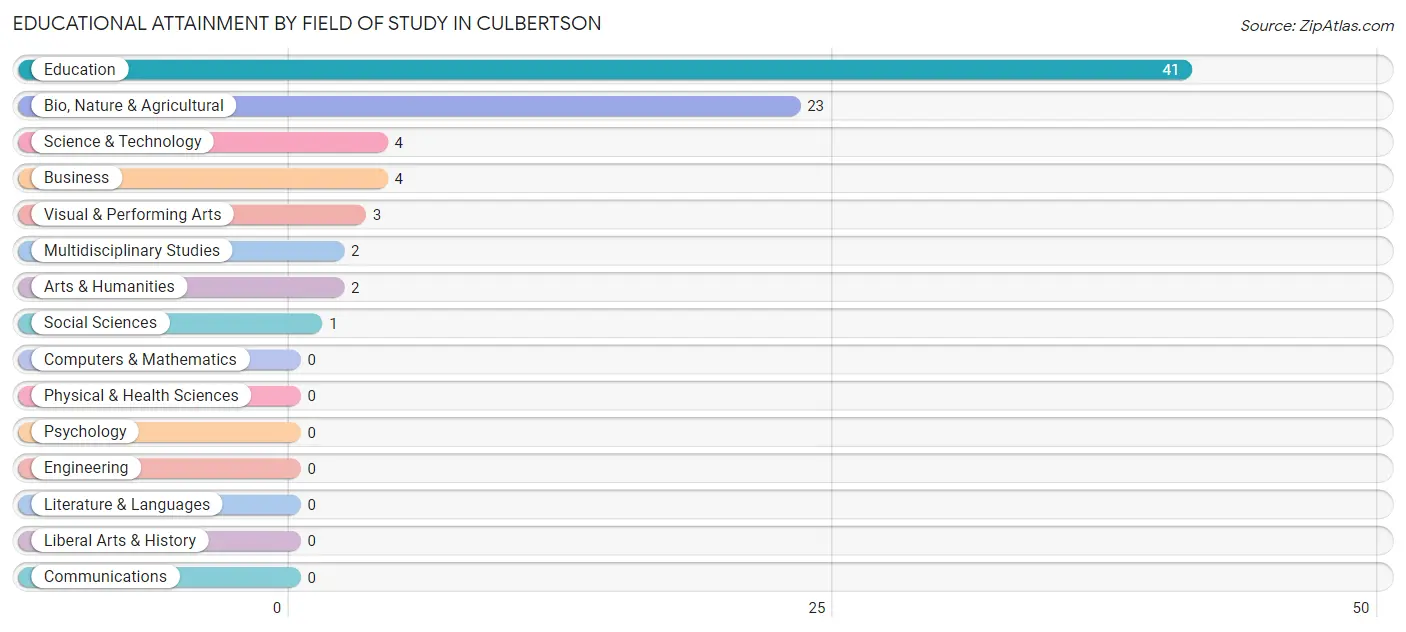
| Field of Study | # Graduates | % Graduates |
| Computers & Mathematics | 0 | 0.0% |
| Bio, Nature & Agricultural | 23 | 28.7% |
| Physical & Health Sciences | 0 | 0.0% |
| Psychology | 0 | 0.0% |
| Social Sciences | 1 | 1.3% |
| Engineering | 0 | 0.0% |
| Multidisciplinary Studies | 2 | 2.5% |
| Science & Technology | 4 | 5.0% |
| Business | 4 | 5.0% |
| Education | 41 | 51.2% |
| Literature & Languages | 0 | 0.0% |
| Liberal Arts & History | 0 | 0.0% |
| Visual & Performing Arts | 3 | 3.7% |
| Communications | 0 | 0.0% |
| Arts & Humanities | 2 | 2.5% |
| Total | 80 | 100.0% |
Transportation & Commute in Culbertson
Vehicle Availability by Sex in Culbertson
The most prevalent vehicle ownership categories in Culbertson are males with 2 vehicles (53, accounting for 38.1%) and females with 2 vehicles (50, making up 43.4%).
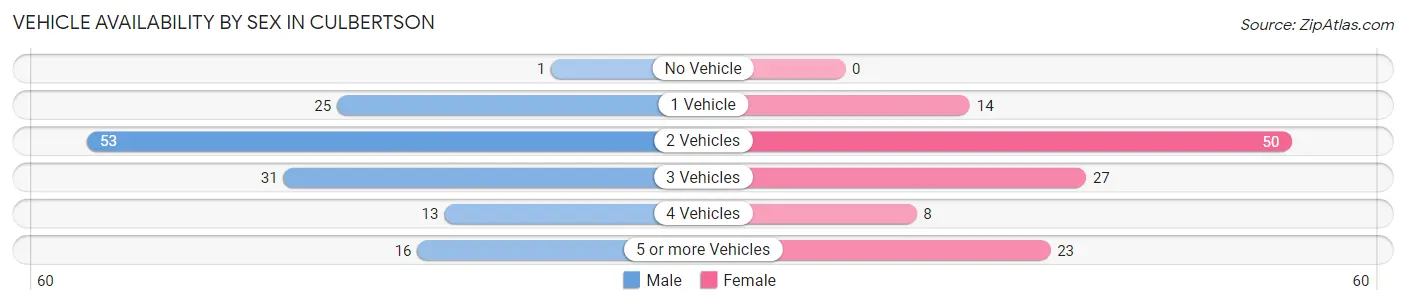
| Vehicles Available | Male | Female |
| No Vehicle | 1 (0.7%) | 0 (0.0%) |
| 1 Vehicle | 25 (18.0%) | 14 (11.5%) |
| 2 Vehicles | 53 (38.1%) | 50 (41.0%) |
| 3 Vehicles | 31 (22.3%) | 27 (22.1%) |
| 4 Vehicles | 13 (9.3%) | 8 (6.6%) |
| 5 or more Vehicles | 16 (11.5%) | 23 (18.9%) |
| Total | 139 (100.0%) | 122 (100.0%) |
Commute Time in Culbertson
The most frequently occuring commute durations in Culbertson are 15 to 19 minutes (106 commuters, 40.9%), 10 to 14 minutes (43 commuters, 16.6%), and 20 to 24 minutes (41 commuters, 15.8%).
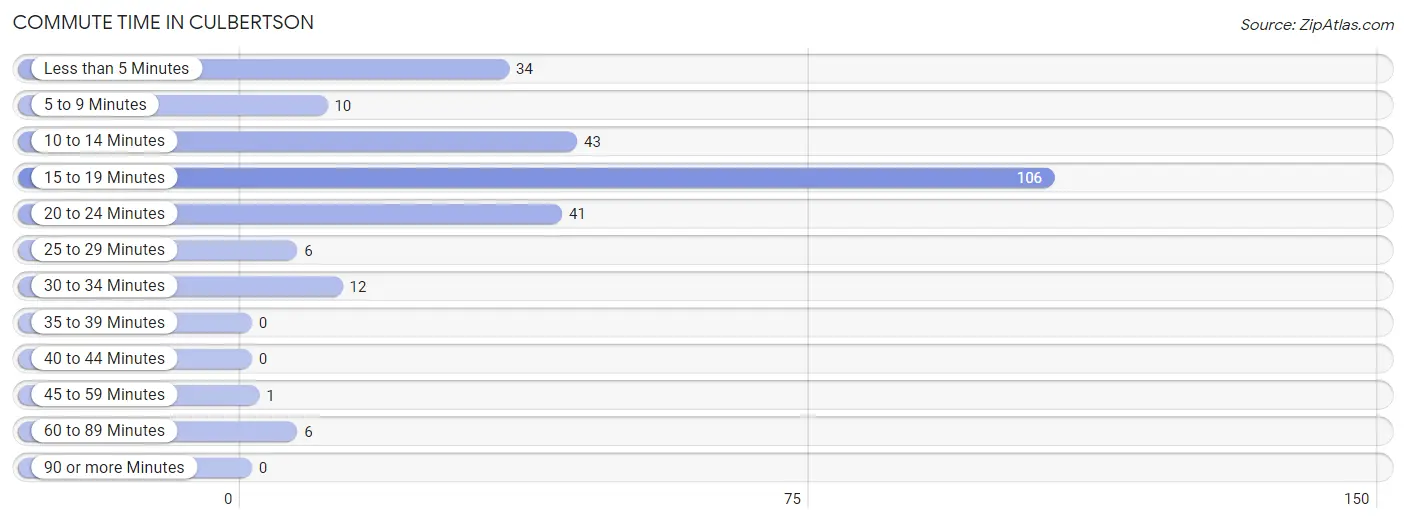
| Commute Time | # Commuters | % Commuters |
| Less than 5 Minutes | 34 | 13.1% |
| 5 to 9 Minutes | 10 | 3.9% |
| 10 to 14 Minutes | 43 | 16.6% |
| 15 to 19 Minutes | 106 | 40.9% |
| 20 to 24 Minutes | 41 | 15.8% |
| 25 to 29 Minutes | 6 | 2.3% |
| 30 to 34 Minutes | 12 | 4.6% |
| 35 to 39 Minutes | 0 | 0.0% |
| 40 to 44 Minutes | 0 | 0.0% |
| 45 to 59 Minutes | 1 | 0.4% |
| 60 to 89 Minutes | 6 | 2.3% |
| 90 or more Minutes | 0 | 0.0% |
Commute Time by Sex in Culbertson
The most common commute times in Culbertson are 15 to 19 minutes (46 commuters, 33.3%) for males and 15 to 19 minutes (60 commuters, 49.6%) for females.
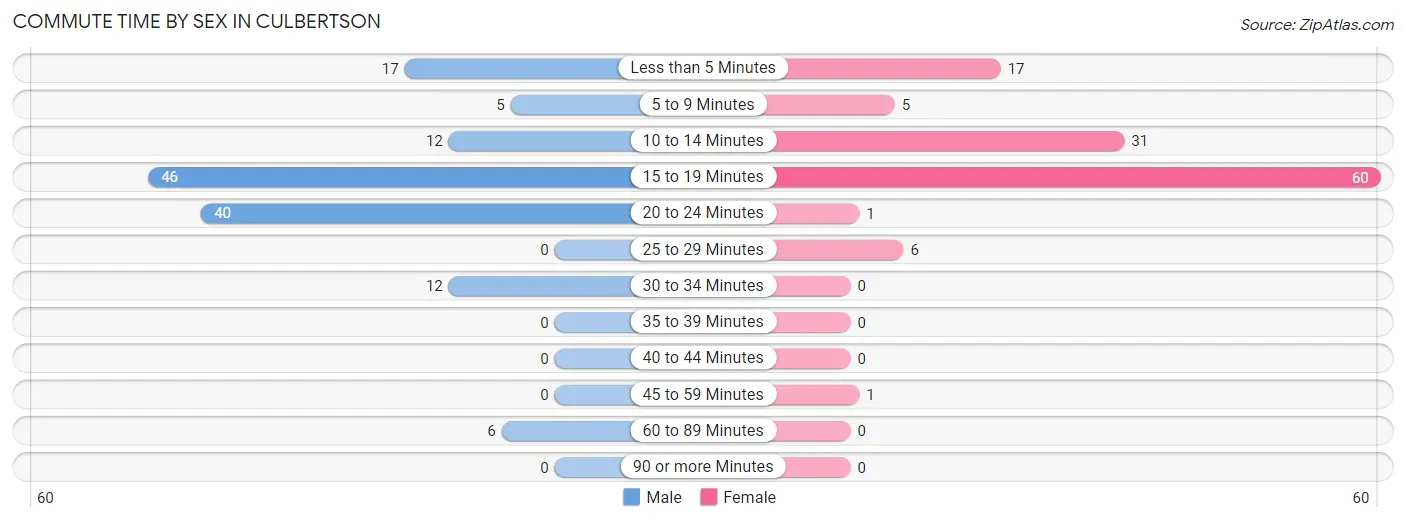
| Commute Time | Male | Female |
| Less than 5 Minutes | 17 (12.3%) | 17 (14.1%) |
| 5 to 9 Minutes | 5 (3.6%) | 5 (4.1%) |
| 10 to 14 Minutes | 12 (8.7%) | 31 (25.6%) |
| 15 to 19 Minutes | 46 (33.3%) | 60 (49.6%) |
| 20 to 24 Minutes | 40 (29.0%) | 1 (0.8%) |
| 25 to 29 Minutes | 0 (0.0%) | 6 (5.0%) |
| 30 to 34 Minutes | 12 (8.7%) | 0 (0.0%) |
| 35 to 39 Minutes | 0 (0.0%) | 0 (0.0%) |
| 40 to 44 Minutes | 0 (0.0%) | 0 (0.0%) |
| 45 to 59 Minutes | 0 (0.0%) | 1 (0.8%) |
| 60 to 89 Minutes | 6 (4.3%) | 0 (0.0%) |
| 90 or more Minutes | 0 (0.0%) | 0 (0.0%) |
Time of Departure to Work by Sex in Culbertson
The most frequent times of departure to work in Culbertson are 7:00 AM to 7:29 AM (48, 34.8%) for males and 7:30 AM to 7:59 AM (39, 32.2%) for females.
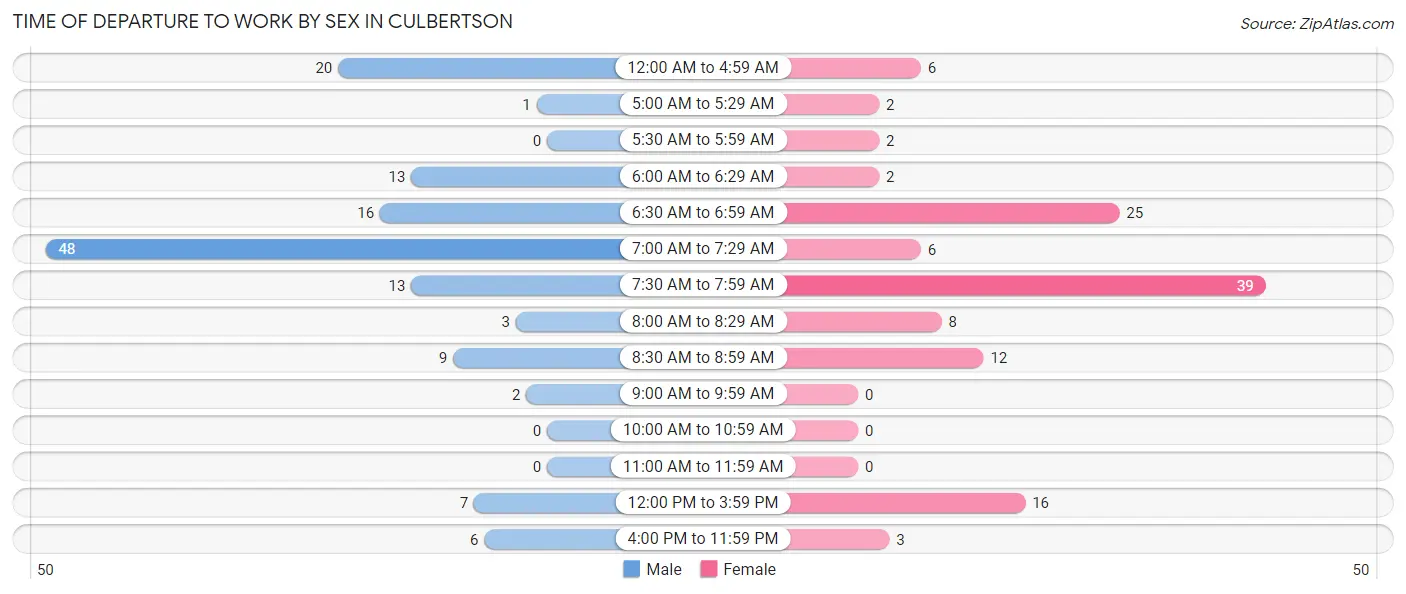
| Time of Departure | Male | Female |
| 12:00 AM to 4:59 AM | 20 (14.5%) | 6 (5.0%) |
| 5:00 AM to 5:29 AM | 1 (0.7%) | 2 (1.7%) |
| 5:30 AM to 5:59 AM | 0 (0.0%) | 2 (1.7%) |
| 6:00 AM to 6:29 AM | 13 (9.4%) | 2 (1.7%) |
| 6:30 AM to 6:59 AM | 16 (11.6%) | 25 (20.7%) |
| 7:00 AM to 7:29 AM | 48 (34.8%) | 6 (5.0%) |
| 7:30 AM to 7:59 AM | 13 (9.4%) | 39 (32.2%) |
| 8:00 AM to 8:29 AM | 3 (2.2%) | 8 (6.6%) |
| 8:30 AM to 8:59 AM | 9 (6.5%) | 12 (9.9%) |
| 9:00 AM to 9:59 AM | 2 (1.5%) | 0 (0.0%) |
| 10:00 AM to 10:59 AM | 0 (0.0%) | 0 (0.0%) |
| 11:00 AM to 11:59 AM | 0 (0.0%) | 0 (0.0%) |
| 12:00 PM to 3:59 PM | 7 (5.1%) | 16 (13.2%) |
| 4:00 PM to 11:59 PM | 6 (4.3%) | 3 (2.5%) |
| Total | 138 (100.0%) | 121 (100.0%) |
Housing Occupancy in Culbertson
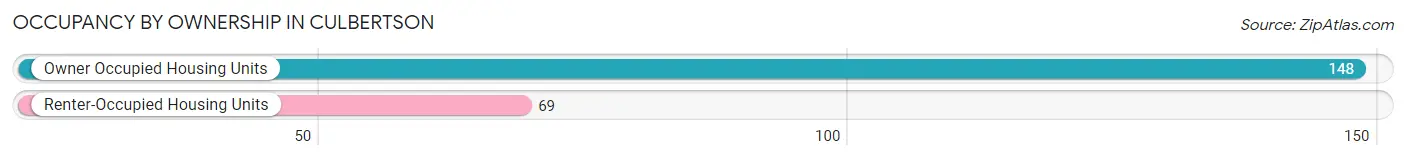
Occupancy by Ownership in Culbertson
Of the total 217 dwellings in Culbertson, owner-occupied units account for 148 (68.2%), while renter-occupied units make up 69 (31.8%).
| Occupancy | # Housing Units | % Housing Units |
| Owner Occupied Housing Units | 148 | 68.2% |
| Renter-Occupied Housing Units | 69 | 31.8% |
| Total Occupied Housing Units | 217 | 100.0% |
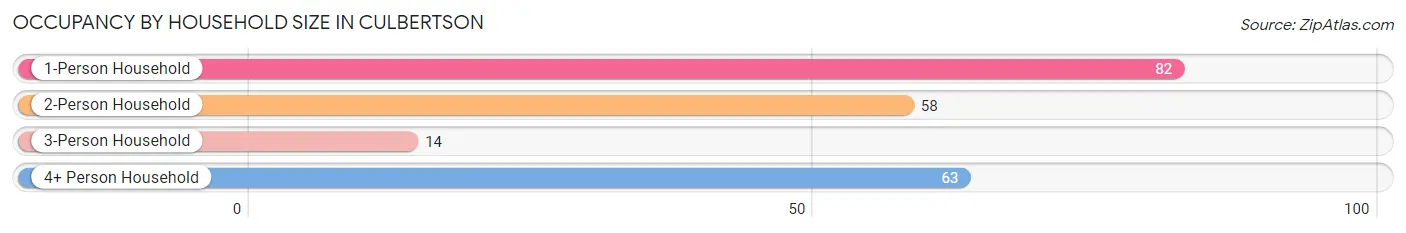
Occupancy by Household Size in Culbertson
| Household Size | # Housing Units | % Housing Units |
| 1-Person Household | 82 | 37.8% |
| 2-Person Household | 58 | 26.7% |
| 3-Person Household | 14 | 6.5% |
| 4+ Person Household | 63 | 29.0% |
| Total Housing Units | 217 | 100.0% |
Occupancy by Ownership by Household Size in Culbertson
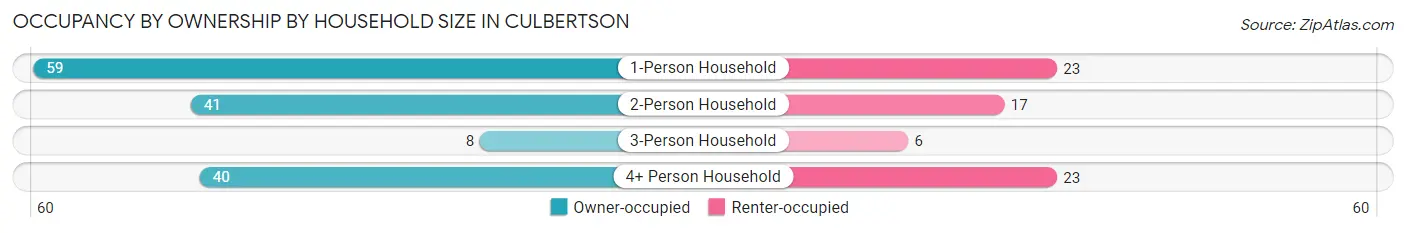
| Household Size | Owner-occupied | Renter-occupied |
| 1-Person Household | 59 (72.0%) | 23 (28.1%) |
| 2-Person Household | 41 (70.7%) | 17 (29.3%) |
| 3-Person Household | 8 (57.1%) | 6 (42.9%) |
| 4+ Person Household | 40 (63.5%) | 23 (36.5%) |
| Total Housing Units | 148 (68.2%) | 69 (31.8%) |
Occupancy by Educational Attainment in Culbertson
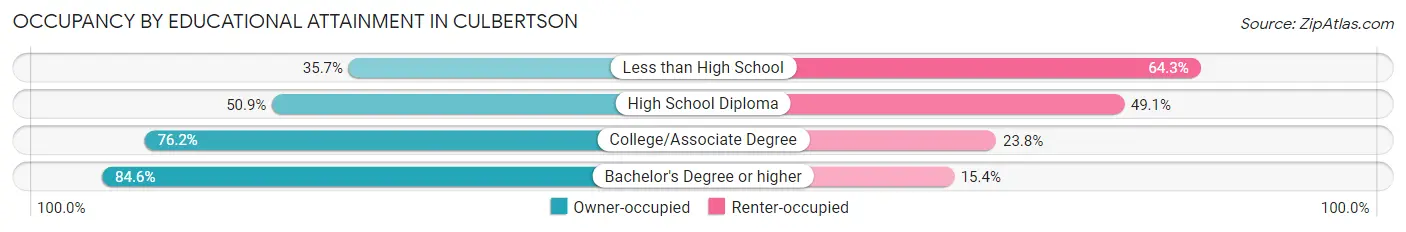
| Household Size | Owner-occupied | Renter-occupied |
| Less than High School | 5 (35.7%) | 9 (64.3%) |
| High School Diploma | 28 (50.9%) | 27 (49.1%) |
| College/Associate Degree | 93 (76.2%) | 29 (23.8%) |
| Bachelor's Degree or higher | 22 (84.6%) | 4 (15.4%) |
Occupancy by Age of Householder in Culbertson
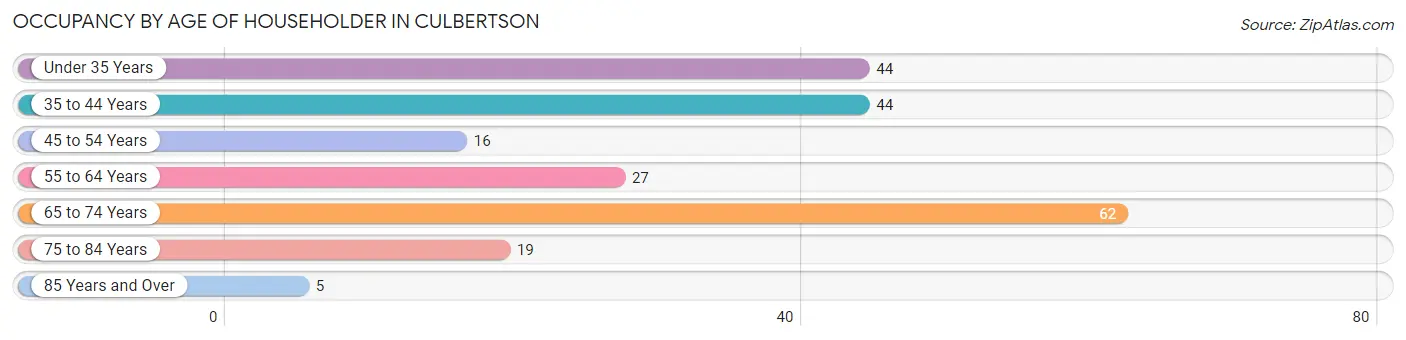
| Age Bracket | # Households | % Households |
| Under 35 Years | 44 | 20.3% |
| 35 to 44 Years | 44 | 20.3% |
| 45 to 54 Years | 16 | 7.4% |
| 55 to 64 Years | 27 | 12.4% |
| 65 to 74 Years | 62 | 28.6% |
| 75 to 84 Years | 19 | 8.8% |
| 85 Years and Over | 5 | 2.3% |
| Total | 217 | 100.0% |
Housing Finances in Culbertson
Median Income by Occupancy in Culbertson
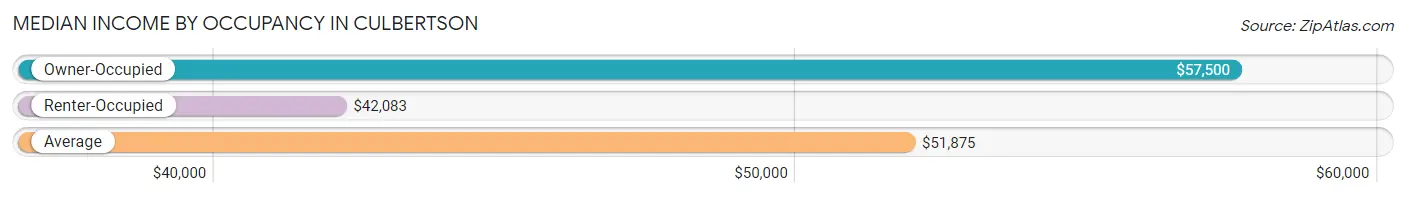
| Occupancy Type | # Households | Median Income |
| Owner-Occupied | 148 (68.2%) | $57,500 |
| Renter-Occupied | 69 (31.8%) | $42,083 |
| Average | 217 (100.0%) | $51,875 |
Occupancy by Householder Income Bracket in Culbertson
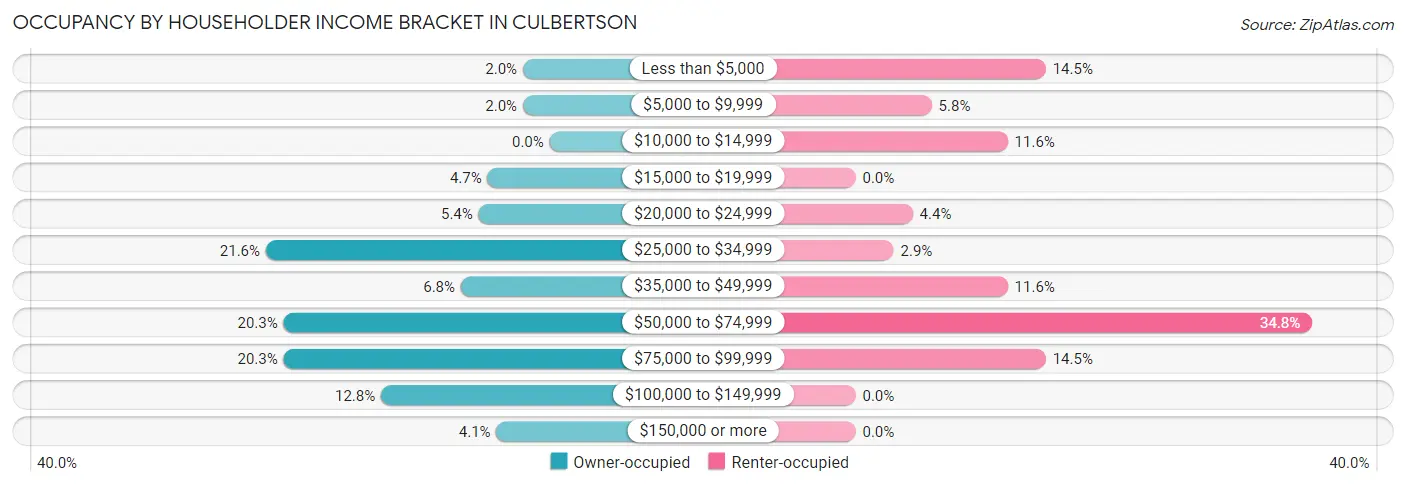
| Income Bracket | Owner-occupied | Renter-occupied |
| Less than $5,000 | 3 (2.0%) | 10 (14.5%) |
| $5,000 to $9,999 | 3 (2.0%) | 4 (5.8%) |
| $10,000 to $14,999 | 0 (0.0%) | 8 (11.6%) |
| $15,000 to $19,999 | 7 (4.7%) | 0 (0.0%) |
| $20,000 to $24,999 | 8 (5.4%) | 3 (4.3%) |
| $25,000 to $34,999 | 32 (21.6%) | 2 (2.9%) |
| $35,000 to $49,999 | 10 (6.8%) | 8 (11.6%) |
| $50,000 to $74,999 | 30 (20.3%) | 24 (34.8%) |
| $75,000 to $99,999 | 30 (20.3%) | 10 (14.5%) |
| $100,000 to $149,999 | 19 (12.8%) | 0 (0.0%) |
| $150,000 or more | 6 (4.1%) | 0 (0.0%) |
| Total | 148 (100.0%) | 69 (100.0%) |
Monthly Housing Cost Tiers in Culbertson
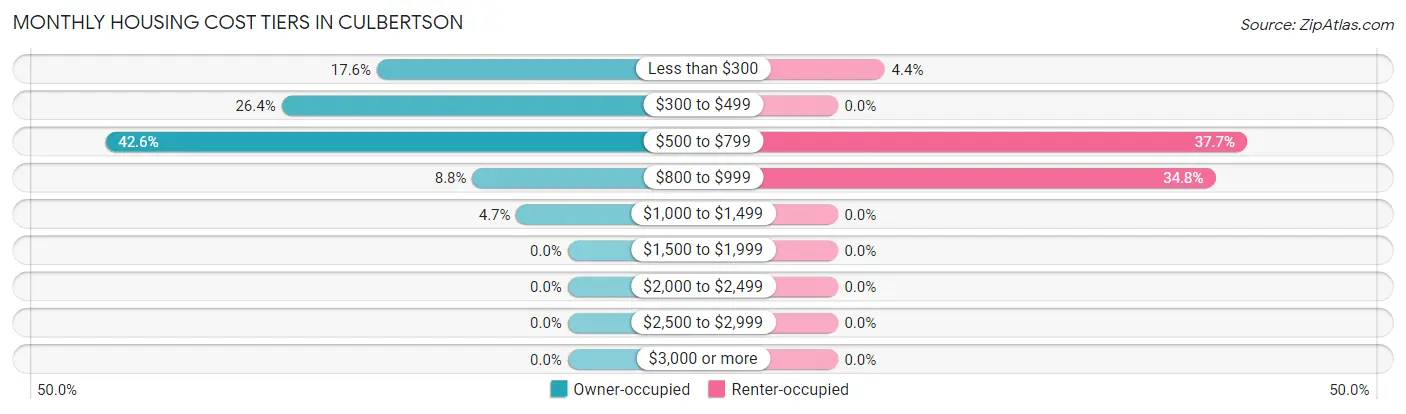
| Monthly Cost | Owner-occupied | Renter-occupied |
| Less than $300 | 26 (17.6%) | 3 (4.3%) |
| $300 to $499 | 39 (26.4%) | 0 (0.0%) |
| $500 to $799 | 63 (42.6%) | 26 (37.7%) |
| $800 to $999 | 13 (8.8%) | 24 (34.8%) |
| $1,000 to $1,499 | 7 (4.7%) | 0 (0.0%) |
| $1,500 to $1,999 | 0 (0.0%) | 0 (0.0%) |
| $2,000 to $2,499 | 0 (0.0%) | 0 (0.0%) |
| $2,500 to $2,999 | 0 (0.0%) | 0 (0.0%) |
| $3,000 or more | 0 (0.0%) | 0 (0.0%) |
| Total | 148 (100.0%) | 69 (100.0%) |
Physical Housing Characteristics in Culbertson
Housing Structures in Culbertson
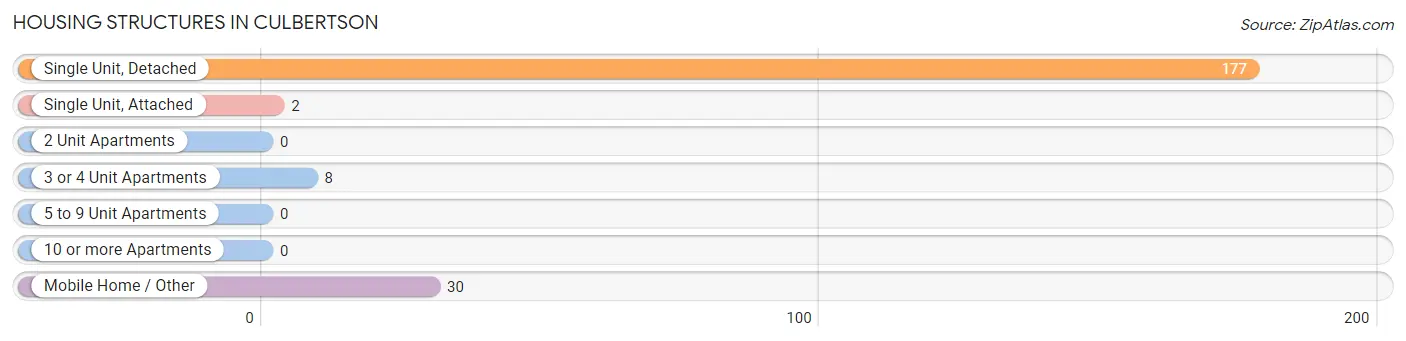
| Structure Type | # Housing Units | % Housing Units |
| Single Unit, Detached | 177 | 81.6% |
| Single Unit, Attached | 2 | 0.9% |
| 2 Unit Apartments | 0 | 0.0% |
| 3 or 4 Unit Apartments | 8 | 3.7% |
| 5 to 9 Unit Apartments | 0 | 0.0% |
| 10 or more Apartments | 0 | 0.0% |
| Mobile Home / Other | 30 | 13.8% |
| Total | 217 | 100.0% |
Housing Structures by Occupancy in Culbertson
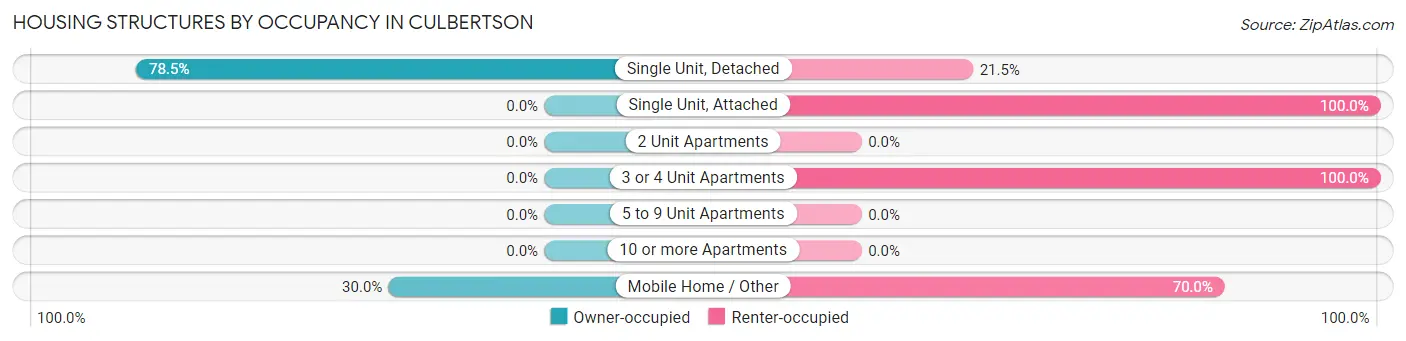
| Structure Type | Owner-occupied | Renter-occupied |
| Single Unit, Detached | 139 (78.5%) | 38 (21.5%) |
| Single Unit, Attached | 0 (0.0%) | 2 (100.0%) |
| 2 Unit Apartments | 0 (0.0%) | 0 (0.0%) |
| 3 or 4 Unit Apartments | 0 (0.0%) | 8 (100.0%) |
| 5 to 9 Unit Apartments | 0 (0.0%) | 0 (0.0%) |
| 10 or more Apartments | 0 (0.0%) | 0 (0.0%) |
| Mobile Home / Other | 9 (30.0%) | 21 (70.0%) |
| Total | 148 (68.2%) | 69 (31.8%) |
Housing Structures by Number of Rooms in Culbertson
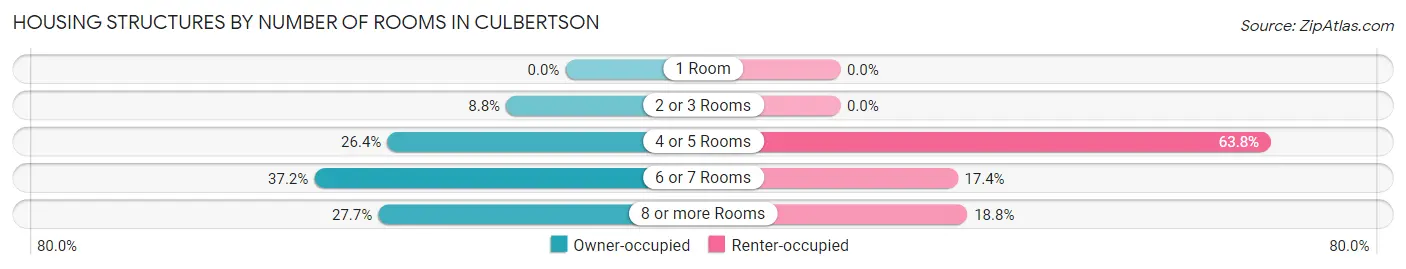
| Number of Rooms | Owner-occupied | Renter-occupied |
| 1 Room | 0 (0.0%) | 0 (0.0%) |
| 2 or 3 Rooms | 13 (8.8%) | 0 (0.0%) |
| 4 or 5 Rooms | 39 (26.4%) | 44 (63.8%) |
| 6 or 7 Rooms | 55 (37.2%) | 12 (17.4%) |
| 8 or more Rooms | 41 (27.7%) | 13 (18.8%) |
| Total | 148 (100.0%) | 69 (100.0%) |
Housing Structure by Heating Type in Culbertson
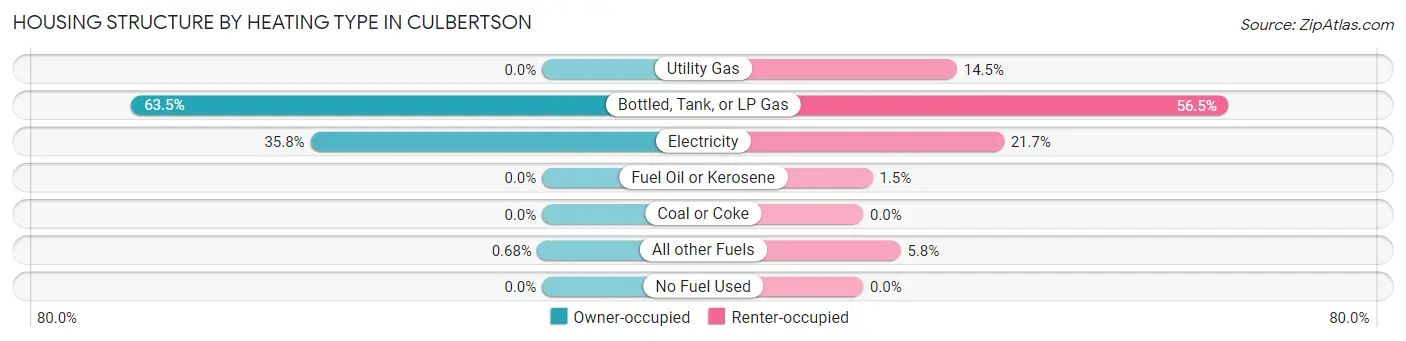
| Heating Type | Owner-occupied | Renter-occupied |
| Utility Gas | 0 (0.0%) | 10 (14.5%) |
| Bottled, Tank, or LP Gas | 94 (63.5%) | 39 (56.5%) |
| Electricity | 53 (35.8%) | 15 (21.7%) |
| Fuel Oil or Kerosene | 0 (0.0%) | 1 (1.5%) |
| Coal or Coke | 0 (0.0%) | 0 (0.0%) |
| All other Fuels | 1 (0.7%) | 4 (5.8%) |
| No Fuel Used | 0 (0.0%) | 0 (0.0%) |
| Total | 148 (100.0%) | 69 (100.0%) |
Household Vehicle Usage in Culbertson
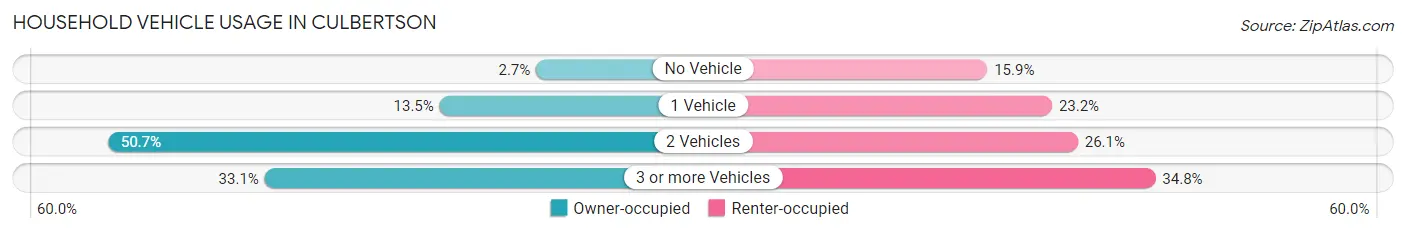
| Vehicles per Household | Owner-occupied | Renter-occupied |
| No Vehicle | 4 (2.7%) | 11 (15.9%) |
| 1 Vehicle | 20 (13.5%) | 16 (23.2%) |
| 2 Vehicles | 75 (50.7%) | 18 (26.1%) |
| 3 or more Vehicles | 49 (33.1%) | 24 (34.8%) |
| Total | 148 (100.0%) | 69 (100.0%) |
Real Estate & Mortgages in Culbertson
Real Estate and Mortgage Overview in Culbertson
| Characteristic | Without Mortgage | With Mortgage |
| Housing Units | 105 | 43 |
| Median Property Value | $80,600 | $69,500 |
| Median Household Income | $50,250 | $0 |
| Monthly Housing Costs | $423 | $0 |
| Real Estate Taxes | $1,100 | $0 |
Property Value by Mortgage Status in Culbertson
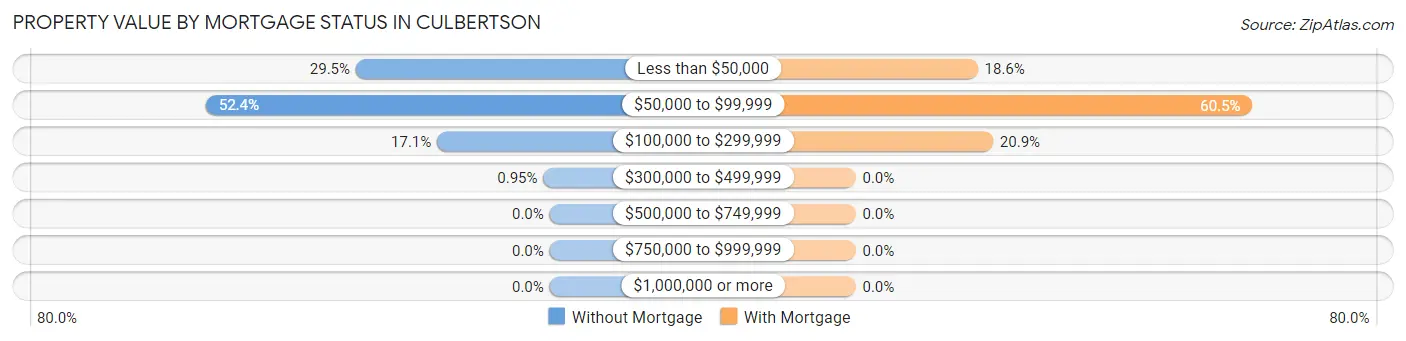
| Property Value | Without Mortgage | With Mortgage |
| Less than $50,000 | 31 (29.5%) | 8 (18.6%) |
| $50,000 to $99,999 | 55 (52.4%) | 26 (60.5%) |
| $100,000 to $299,999 | 18 (17.1%) | 9 (20.9%) |
| $300,000 to $499,999 | 1 (0.9%) | 0 (0.0%) |
| $500,000 to $749,999 | 0 (0.0%) | 0 (0.0%) |
| $750,000 to $999,999 | 0 (0.0%) | 0 (0.0%) |
| $1,000,000 or more | 0 (0.0%) | 0 (0.0%) |
| Total | 105 (100.0%) | 43 (100.0%) |
Household Income by Mortgage Status in Culbertson
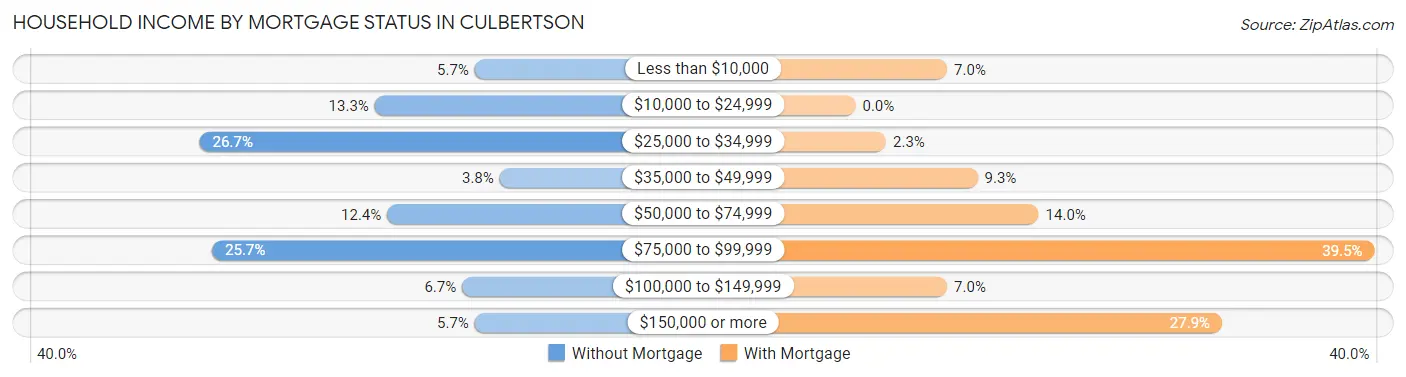
| Household Income | Without Mortgage | With Mortgage |
| Less than $10,000 | 6 (5.7%) | 3 (7.0%) |
| $10,000 to $24,999 | 14 (13.3%) | 0 (0.0%) |
| $25,000 to $34,999 | 28 (26.7%) | 1 (2.3%) |
| $35,000 to $49,999 | 4 (3.8%) | 4 (9.3%) |
| $50,000 to $74,999 | 13 (12.4%) | 6 (14.0%) |
| $75,000 to $99,999 | 27 (25.7%) | 17 (39.5%) |
| $100,000 to $149,999 | 7 (6.7%) | 3 (7.0%) |
| $150,000 or more | 6 (5.7%) | 12 (27.9%) |
| Total | 105 (100.0%) | 43 (100.0%) |
Property Value to Household Income Ratio in Culbertson
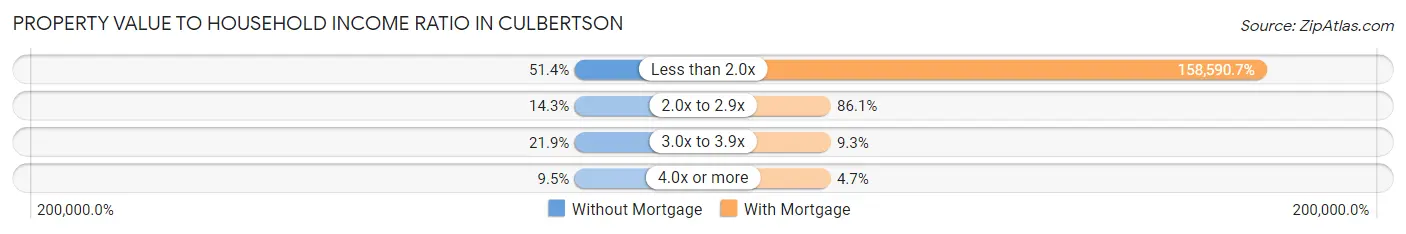
| Value-to-Income Ratio | Without Mortgage | With Mortgage |
| Less than 2.0x | 54 (51.4%) | 68,194 (158,590.7%) |
| 2.0x to 2.9x | 15 (14.3%) | 37 (86.1%) |
| 3.0x to 3.9x | 23 (21.9%) | 4 (9.3%) |
| 4.0x or more | 10 (9.5%) | 2 (4.6%) |
| Total | 105 (100.0%) | 43 (100.0%) |
Real Estate Taxes by Mortgage Status in Culbertson
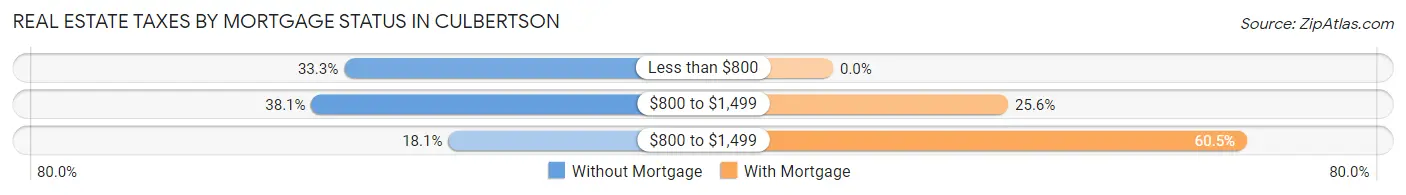
| Property Taxes | Without Mortgage | With Mortgage |
| Less than $800 | 35 (33.3%) | 0 (0.0%) |
| $800 to $1,499 | 40 (38.1%) | 11 (25.6%) |
| $800 to $1,499 | 19 (18.1%) | 26 (60.5%) |
| Total | 105 (100.0%) | 43 (100.0%) |
Health & Disability in Culbertson
Health Insurance Coverage by Age in Culbertson
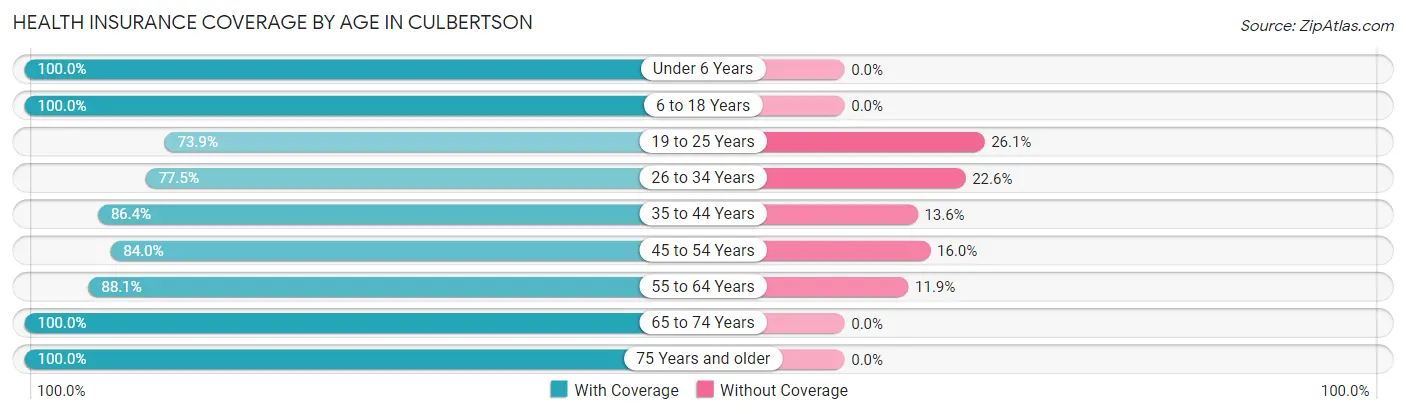
| Age Bracket | With Coverage | Without Coverage |
| Under 6 Years | 92 (100.0%) | 0 (0.0%) |
| 6 to 18 Years | 132 (100.0%) | 0 (0.0%) |
| 19 to 25 Years | 17 (73.9%) | 6 (26.1%) |
| 26 to 34 Years | 79 (77.4%) | 23 (22.6%) |
| 35 to 44 Years | 76 (86.4%) | 12 (13.6%) |
| 45 to 54 Years | 21 (84.0%) | 4 (16.0%) |
| 55 to 64 Years | 37 (88.1%) | 5 (11.9%) |
| 65 to 74 Years | 86 (100.0%) | 0 (0.0%) |
| 75 Years and older | 31 (100.0%) | 0 (0.0%) |
| Total | 571 (91.9%) | 50 (8.1%) |
Health Insurance Coverage by Citizenship Status in Culbertson
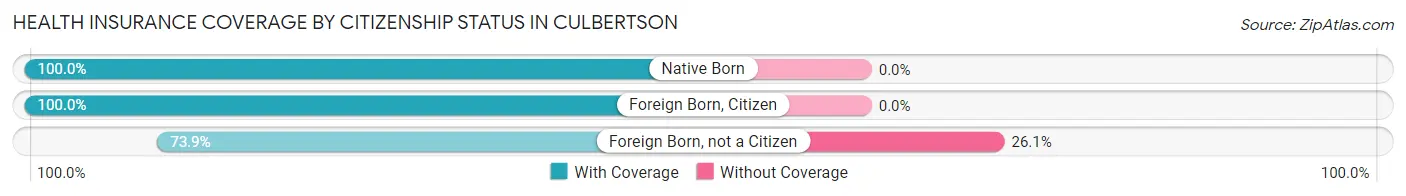
| Citizenship Status | With Coverage | Without Coverage |
| Native Born | 92 (100.0%) | 0 (0.0%) |
| Foreign Born, Citizen | 132 (100.0%) | 0 (0.0%) |
| Foreign Born, not a Citizen | 17 (73.9%) | 6 (26.1%) |
Health Insurance Coverage by Household Income in Culbertson
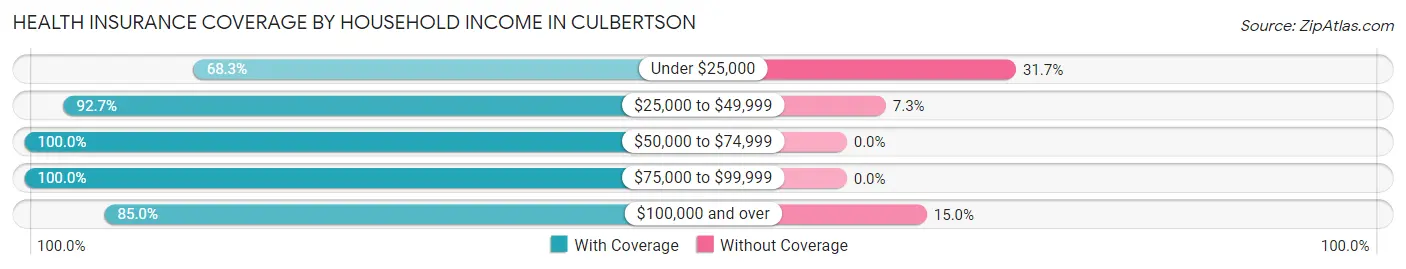
| Household Income | With Coverage | Without Coverage |
| Under $25,000 | 56 (68.3%) | 26 (31.7%) |
| $25,000 to $49,999 | 76 (92.7%) | 6 (7.3%) |
| $50,000 to $74,999 | 185 (100.0%) | 0 (0.0%) |
| $75,000 to $99,999 | 152 (100.0%) | 0 (0.0%) |
| $100,000 and over | 102 (85.0%) | 18 (15.0%) |
Public vs Private Health Insurance Coverage by Age in Culbertson
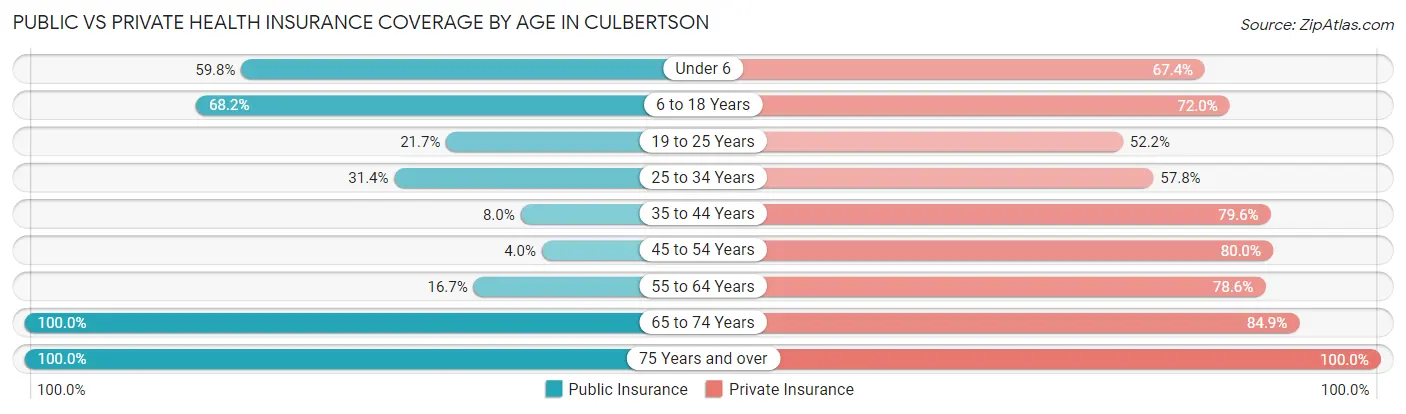
| Age Bracket | Public Insurance | Private Insurance |
| Under 6 | 55 (59.8%) | 62 (67.4%) |
| 6 to 18 Years | 90 (68.2%) | 95 (72.0%) |
| 19 to 25 Years | 5 (21.7%) | 12 (52.2%) |
| 25 to 34 Years | 32 (31.4%) | 59 (57.8%) |
| 35 to 44 Years | 7 (8.0%) | 70 (79.5%) |
| 45 to 54 Years | 1 (4.0%) | 20 (80.0%) |
| 55 to 64 Years | 7 (16.7%) | 33 (78.6%) |
| 65 to 74 Years | 86 (100.0%) | 73 (84.9%) |
| 75 Years and over | 31 (100.0%) | 31 (100.0%) |
| Total | 314 (50.6%) | 455 (73.3%) |
Disability Status by Sex by Age in Culbertson
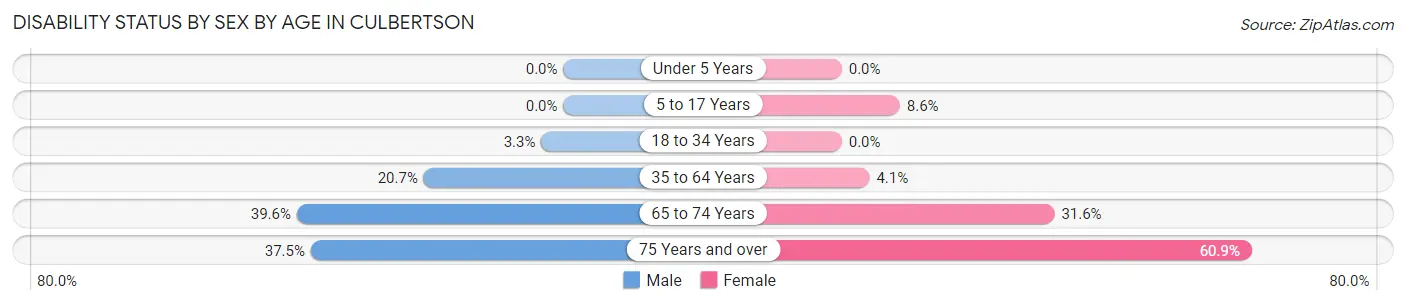
| Age Bracket | Male | Female |
| Under 5 Years | 0 (0.0%) | 0 (0.0%) |
| 5 to 17 Years | 0 (0.0%) | 5 (8.6%) |
| 18 to 34 Years | 2 (3.3%) | 0 (0.0%) |
| 35 to 64 Years | 17 (20.7%) | 3 (4.1%) |
| 65 to 74 Years | 19 (39.6%) | 12 (31.6%) |
| 75 Years and over | 3 (37.5%) | 14 (60.9%) |
Disability Class by Sex by Age in Culbertson
Disability Class: Hearing Difficulty
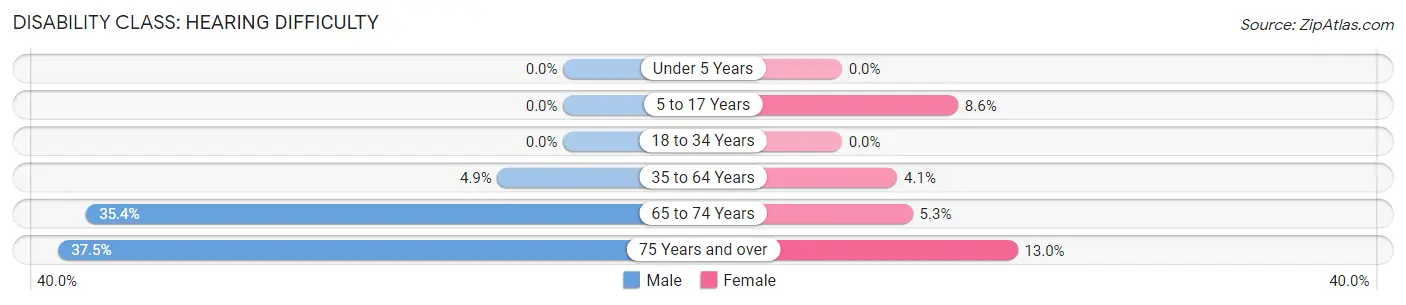
| Age Bracket | Male | Female |
| Under 5 Years | 0 (0.0%) | 0 (0.0%) |
| 5 to 17 Years | 0 (0.0%) | 5 (8.6%) |
| 18 to 34 Years | 0 (0.0%) | 0 (0.0%) |
| 35 to 64 Years | 4 (4.9%) | 3 (4.1%) |
| 65 to 74 Years | 17 (35.4%) | 2 (5.3%) |
| 75 Years and over | 3 (37.5%) | 3 (13.0%) |
Disability Class: Vision Difficulty
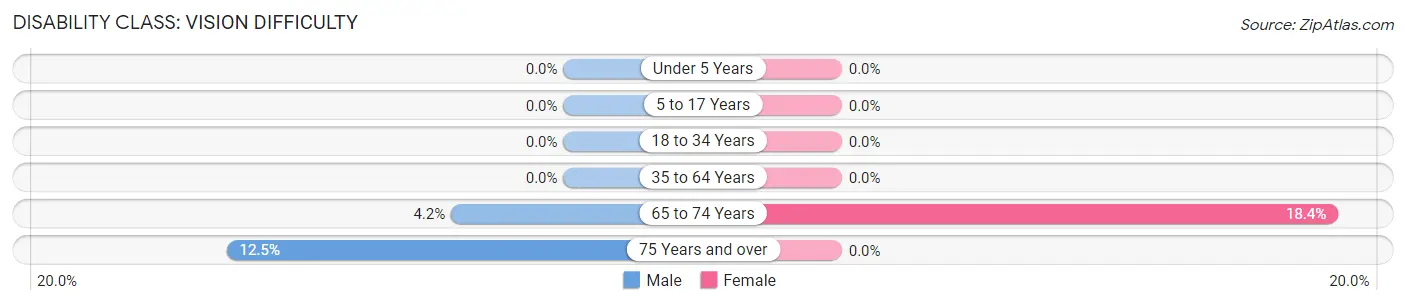
| Age Bracket | Male | Female |
| Under 5 Years | 0 (0.0%) | 0 (0.0%) |
| 5 to 17 Years | 0 (0.0%) | 0 (0.0%) |
| 18 to 34 Years | 0 (0.0%) | 0 (0.0%) |
| 35 to 64 Years | 0 (0.0%) | 0 (0.0%) |
| 65 to 74 Years | 2 (4.2%) | 7 (18.4%) |
| 75 Years and over | 1 (12.5%) | 0 (0.0%) |
Disability Class: Cognitive Difficulty
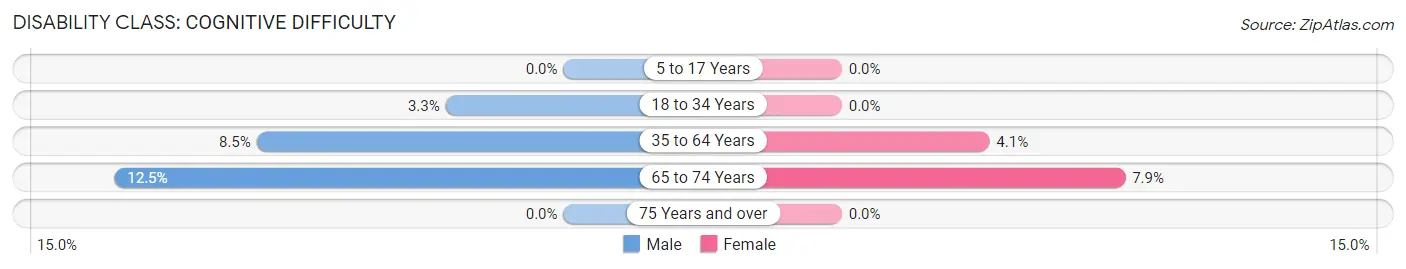
| Age Bracket | Male | Female |
| 5 to 17 Years | 0 (0.0%) | 0 (0.0%) |
| 18 to 34 Years | 2 (3.3%) | 0 (0.0%) |
| 35 to 64 Years | 7 (8.5%) | 3 (4.1%) |
| 65 to 74 Years | 6 (12.5%) | 3 (7.9%) |
| 75 Years and over | 0 (0.0%) | 0 (0.0%) |
Disability Class: Ambulatory Difficulty
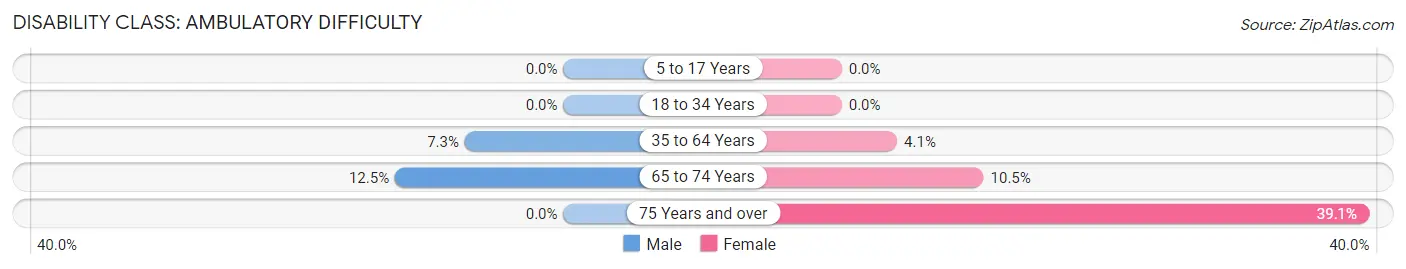
| Age Bracket | Male | Female |
| 5 to 17 Years | 0 (0.0%) | 0 (0.0%) |
| 18 to 34 Years | 0 (0.0%) | 0 (0.0%) |
| 35 to 64 Years | 6 (7.3%) | 3 (4.1%) |
| 65 to 74 Years | 6 (12.5%) | 4 (10.5%) |
| 75 Years and over | 0 (0.0%) | 9 (39.1%) |
Disability Class: Self-Care Difficulty
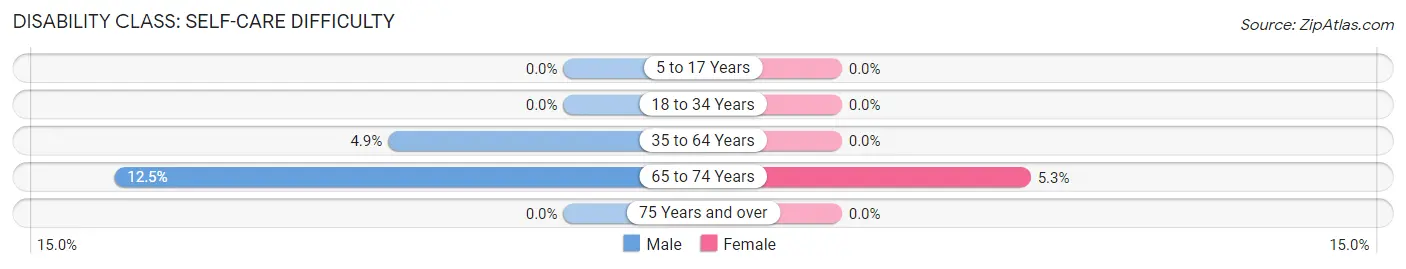
| Age Bracket | Male | Female |
| 5 to 17 Years | 0 (0.0%) | 0 (0.0%) |
| 18 to 34 Years | 0 (0.0%) | 0 (0.0%) |
| 35 to 64 Years | 4 (4.9%) | 0 (0.0%) |
| 65 to 74 Years | 6 (12.5%) | 2 (5.3%) |
| 75 Years and over | 0 (0.0%) | 0 (0.0%) |
Technology Access in Culbertson
Computing Device Access in Culbertson
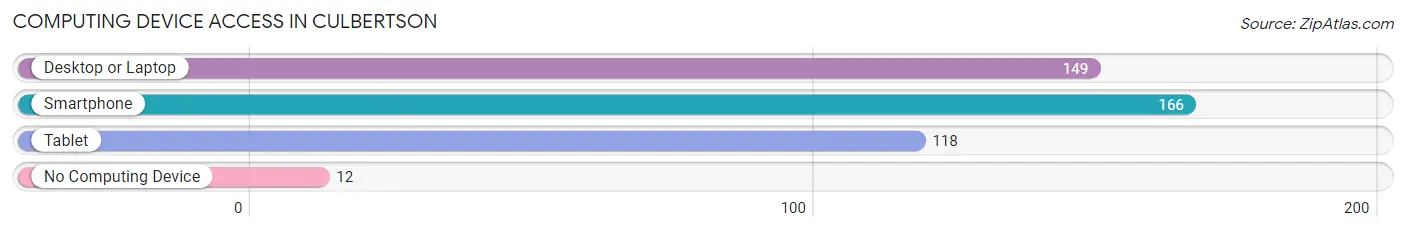
| Device Type | # Households | % Households |
| Desktop or Laptop | 149 | 68.7% |
| Smartphone | 166 | 76.5% |
| Tablet | 118 | 54.4% |
| No Computing Device | 12 | 5.5% |
| Total | 217 | 100.0% |
Internet Access in Culbertson
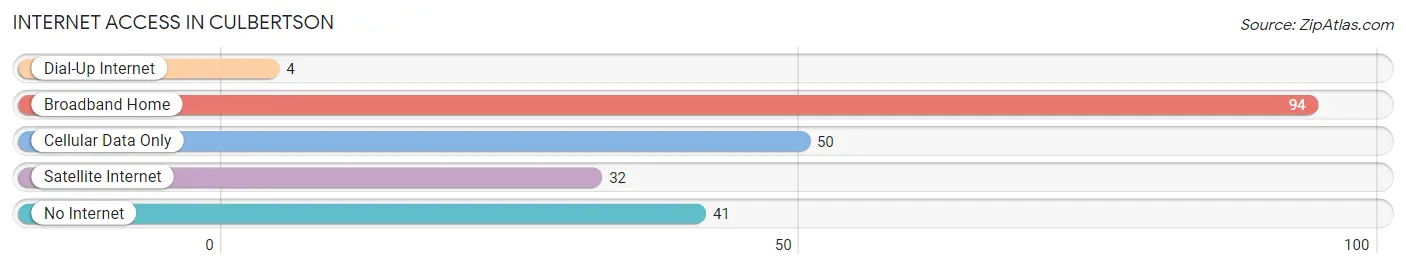
| Internet Type | # Households | % Households |
| Dial-Up Internet | 4 | 1.8% |
| Broadband Home | 94 | 43.3% |
| Cellular Data Only | 50 | 23.0% |
| Satellite Internet | 32 | 14.7% |
| No Internet | 41 | 18.9% |
| Total | 217 | 100.0% |
Culbertson Summary
Culbertson is a small town located in the northeastern corner of Nebraska, in the United States. It is situated in the Republican River Valley, and is the county seat of Hitchcock County. The town was founded in 1887 and has a population of approximately 1,000 people.
History
The town of Culbertson was founded in 1887 by the Union Pacific Railroad. The town was named after the railroad's president, William Culbertson. The railroad was instrumental in the development of the town, as it provided transportation for settlers and goods. The town quickly grew, and by 1890, it had a population of over 500 people.
The town was incorporated in 1891, and the first mayor was elected in 1892. The town continued to grow, and by 1900, it had a population of over 1,000 people.
In the early 1900s, the town was a major agricultural center, with many farmers growing wheat, corn, and other crops. The town also had a number of businesses, including a bank, a hotel, a newspaper, and a variety of stores.
In the 1920s, the town experienced a period of decline, as the railroad began to move away from the area. The town's population decreased, and many businesses closed.
In the 1950s, the town began to experience a resurgence, as new businesses opened and the population began to increase. The town was also home to a number of manufacturing plants, including a furniture factory and a canning factory.
Geography
Culbertson is located in the Republican River Valley, in the northeastern corner of Nebraska. The town is situated on the banks of the Republican River, and is surrounded by rolling hills and farmland. The town is located approximately 50 miles from the state capital of Lincoln.
The climate in Culbertson is generally mild, with hot summers and cold winters. The average annual temperature is around 50 degrees Fahrenheit. The town receives an average of 25 inches of precipitation per year.
Economy
The economy of Culbertson is largely based on agriculture. The town is home to a number of farms, which grow a variety of crops, including wheat, corn, and soybeans. The town is also home to a number of manufacturing plants, including a furniture factory and a canning factory.
The town is also home to a number of businesses, including restaurants, stores, and other services. The town is also home to a number of tourist attractions, including a museum and a golf course.
Demographics
As of the 2010 census, the population of Culbertson was 1,000 people. The town is predominantly white, with a small Hispanic population. The median household income is around $40,000, and the median home value is around $90,000. The town has a low unemployment rate, and the poverty rate is below the national average.
Common Questions
What is Per Capita Income in Culbertson?
Per Capita income in Culbertson is $21,700.
What is the Median Family Income in Culbertson?
Median Family Income in Culbertson is $68,229.
What is the Median Household income in Culbertson?
Median Household Income in Culbertson is $51,875.
What is Income or Wage Gap in Culbertson?
Income or Wage Gap in Culbertson is 21.8%.
Women in Culbertson earn 78.2 cents for every dollar earned by a man.
What is Family Income Deficit in Culbertson?
Family Income Deficit in Culbertson is $18,270.
Families that are below poverty line in Culbertson earn $18,270 less on average than the poverty threshold level.
What is Inequality or Gini Index in Culbertson?
Inequality or Gini Index in Culbertson is 0.38.
What is the Total Population of Culbertson?
Total Population of Culbertson is 621.
What is the Total Male Population of Culbertson?
Total Male Population of Culbertson is 329.
What is the Total Female Population of Culbertson?
Total Female Population of Culbertson is 292.
What is the Ratio of Males per 100 Females in Culbertson?
There are 112.67 Males per 100 Females in Culbertson.
What is the Ratio of Females per 100 Males in Culbertson?
There are 88.75 Females per 100 Males in Culbertson.
What is the Median Population Age in Culbertson?
Median Population Age in Culbertson is 30.4 Years.
What is the Average Family Size in Culbertson
Average Family Size in Culbertson is 3.8 People.
What is the Average Household Size in Culbertson
Average Household Size in Culbertson is 2.9 People.
How Large is the Labor Force in Culbertson?
There are 296 People in the Labor Forcein in Culbertson.
What is the Percentage of People in the Labor Force in Culbertson?
71.0% of People are in the Labor Force in Culbertson.
What is the Unemployment Rate in Culbertson?
Unemployment Rate in Culbertson is 3.4%.