Creighton, NE Map & Demographics
Creighton Map
Creighton Overview
$31,383
PER CAPITA INCOME
$70,125
AVG FAMILY INCOME
$52,656
AVG HOUSEHOLD INCOME
23.4%
WAGE / INCOME GAP [ % ]
76.6¢/ $1
WAGE / INCOME GAP [ $ ]
$13,545
FAMILY INCOME DEFICIT
0.46
INEQUALITY / GINI INDEX
1,241
TOTAL POPULATION
670
MALE POPULATION
571
FEMALE POPULATION
117.34
MALES / 100 FEMALES
85.22
FEMALES / 100 MALES
44.8
MEDIAN AGE
3.2
AVG FAMILY SIZE
2.4
AVG HOUSEHOLD SIZE
563
LABOR FORCE [ PEOPLE ]
58.8%
PERCENT IN LABOR FORCE
2.5%
UNEMPLOYMENT RATE
Creighton Zip Codes
Creighton Area Codes
Income in Creighton
Income Overview in Creighton
Per Capita Income in Creighton is $31,383, while median incomes of families and households are $70,125 and $52,656 respectively.
| Characteristic | Number | Measure |
| Per Capita Income | 1,241 | $31,383 |
| Median Family Income | 318 | $70,125 |
| Mean Family Income | 318 | $87,901 |
| Median Household Income | 499 | $52,656 |
| Mean Household Income | 499 | $71,045 |
| Income Deficit | 318 | $13,545 |
| Wage / Income Gap (%) | 1,241 | 23.41% |
| Wage / Income Gap ($) | 1,241 | 76.59¢ per $1 |
| Gini / Inequality Index | 1,241 | 0.46 |
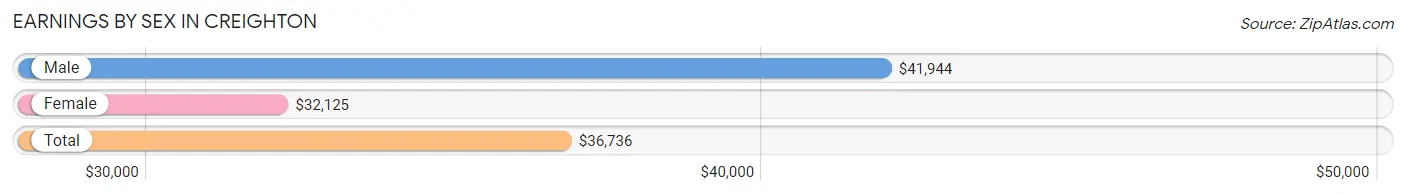
Earnings by Sex in Creighton
Average Earnings in Creighton are $36,736, $41,944 for men and $32,125 for women, a difference of 23.4%.
| Sex | Number | Average Earnings |
| Male | 366 (61.1%) | $41,944 |
| Female | 233 (38.9%) | $32,125 |
| Total | 599 (100.0%) | $36,736 |
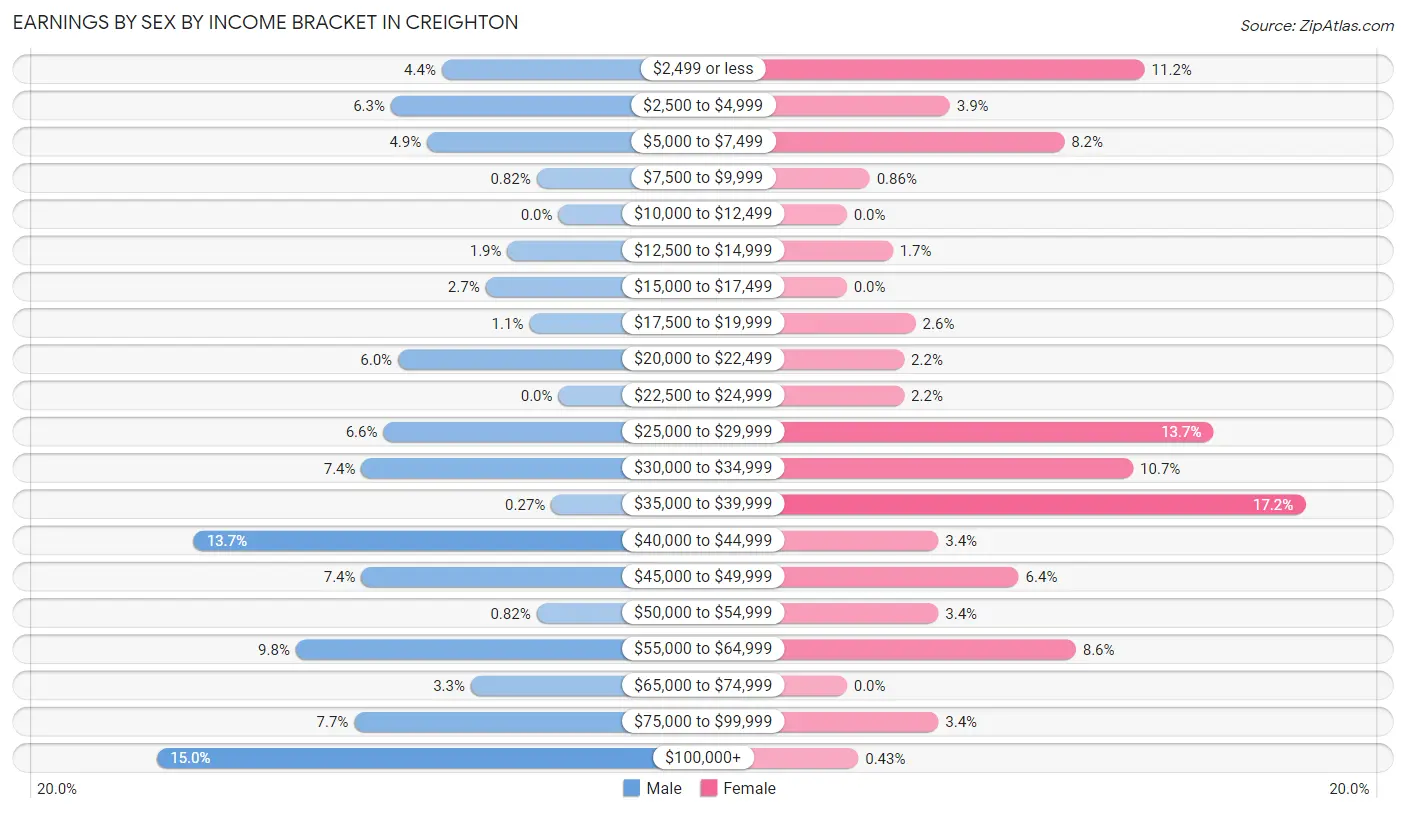
Earnings by Sex by Income Bracket in Creighton
The most common earnings brackets in Creighton are $100,000+ for men (55 | 15.0%) and $35,000 to $39,999 for women (40 | 17.2%).
| Income | Male | Female |
| $2,499 or less | 16 (4.4%) | 26 (11.2%) |
| $2,500 to $4,999 | 23 (6.3%) | 9 (3.9%) |
| $5,000 to $7,499 | 18 (4.9%) | 19 (8.2%) |
| $7,500 to $9,999 | 3 (0.8%) | 2 (0.9%) |
| $10,000 to $12,499 | 0 (0.0%) | 0 (0.0%) |
| $12,500 to $14,999 | 7 (1.9%) | 4 (1.7%) |
| $15,000 to $17,499 | 10 (2.7%) | 0 (0.0%) |
| $17,500 to $19,999 | 4 (1.1%) | 6 (2.6%) |
| $20,000 to $22,499 | 22 (6.0%) | 5 (2.1%) |
| $22,500 to $24,999 | 0 (0.0%) | 5 (2.1%) |
| $25,000 to $29,999 | 24 (6.6%) | 32 (13.7%) |
| $30,000 to $34,999 | 27 (7.4%) | 25 (10.7%) |
| $35,000 to $39,999 | 1 (0.3%) | 40 (17.2%) |
| $40,000 to $44,999 | 50 (13.7%) | 8 (3.4%) |
| $45,000 to $49,999 | 27 (7.4%) | 15 (6.4%) |
| $50,000 to $54,999 | 3 (0.8%) | 8 (3.4%) |
| $55,000 to $64,999 | 36 (9.8%) | 20 (8.6%) |
| $65,000 to $74,999 | 12 (3.3%) | 0 (0.0%) |
| $75,000 to $99,999 | 28 (7.6%) | 8 (3.4%) |
| $100,000+ | 55 (15.0%) | 1 (0.4%) |
| Total | 366 (100.0%) | 233 (100.0%) |
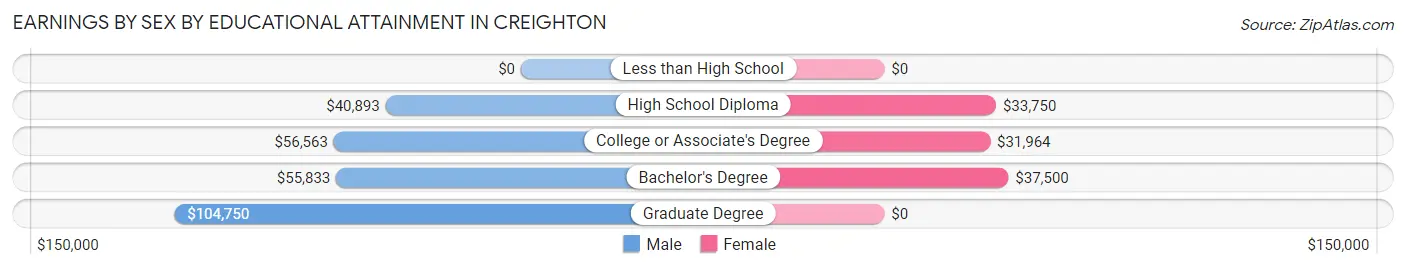
Earnings by Sex by Educational Attainment in Creighton
Average earnings in Creighton are $46,333 for men and $34,417 for women, a difference of 25.7%. Men with an educational attainment of graduate degree enjoy the highest average annual earnings of $104,750, while those with high school diploma education earn the least with $40,893. Women with an educational attainment of bachelor's degree earn the most with the average annual earnings of $37,500, while those with college or associate's degree education have the smallest earnings of $31,964.
| Educational Attainment | Male Income | Female Income |
| Less than High School | - | - |
| High School Diploma | $40,893 | $33,750 |
| College or Associate's Degree | $56,563 | $31,964 |
| Bachelor's Degree | $55,833 | $37,500 |
| Graduate Degree | $104,750 | $0 |
| Total | $46,333 | $34,417 |
Family Income in Creighton
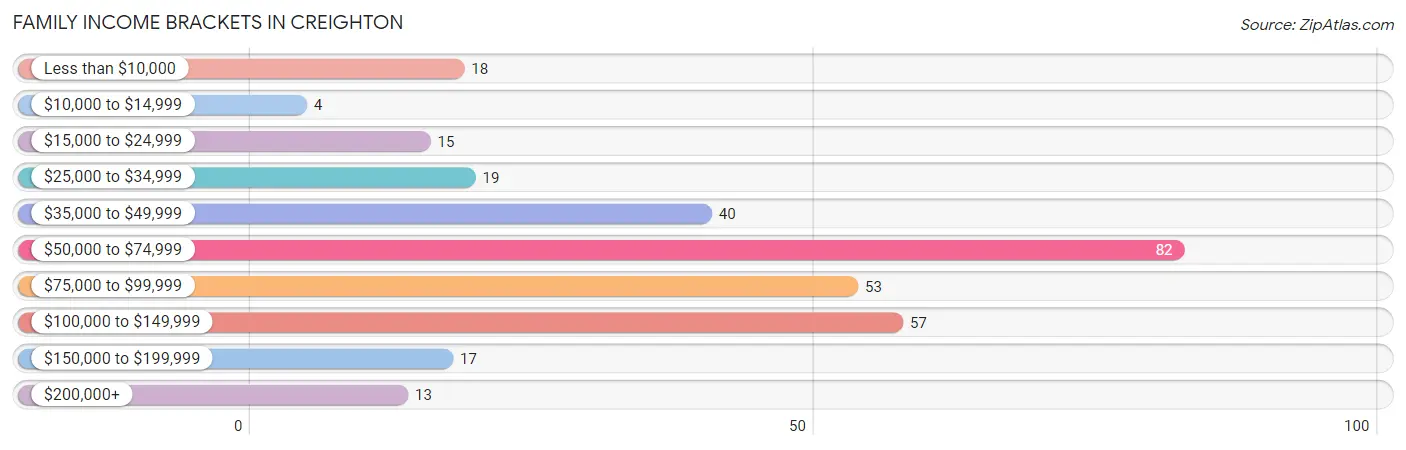
Family Income Brackets in Creighton
According to the Creighton family income data, there are 82 families falling into the $50,000 to $74,999 income range, which is the most common income bracket and makes up 25.8% of all families. Conversely, the $10,000 to $14,999 income bracket is the least frequent group with only 4 families (1.3%) belonging to this category.
| Income Bracket | # Families | % Families |
| Less than $10,000 | 18 | 5.7% |
| $10,000 to $14,999 | 4 | 1.3% |
| $15,000 to $24,999 | 15 | 4.7% |
| $25,000 to $34,999 | 19 | 6.0% |
| $35,000 to $49,999 | 40 | 12.6% |
| $50,000 to $74,999 | 82 | 25.8% |
| $75,000 to $99,999 | 53 | 16.7% |
| $100,000 to $149,999 | 57 | 17.9% |
| $150,000 to $199,999 | 17 | 5.3% |
| $200,000+ | 13 | 4.1% |
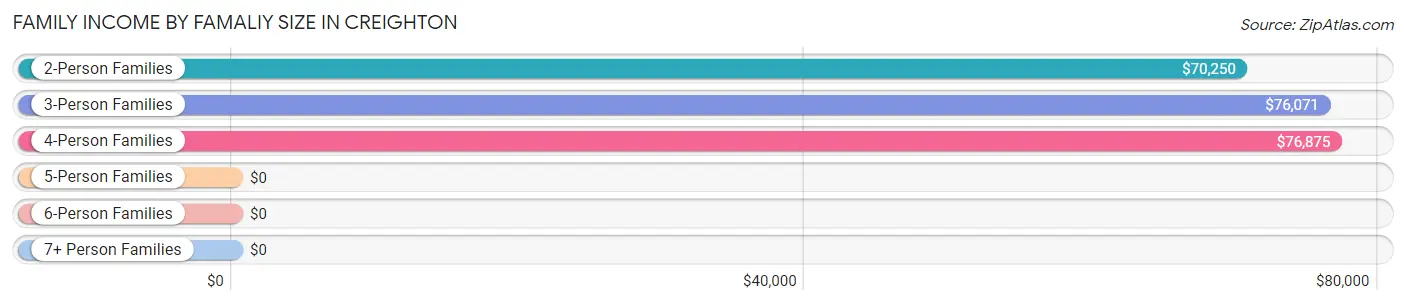
Family Income by Famaliy Size in Creighton
4-person families (35 | 11.0%) account for the highest median family income in Creighton with $76,875 per family, while 2-person families (194 | 61.0%) have the highest median income of $35,125 per family member.
| Income Bracket | # Families | Median Income |
| 2-Person Families | 194 (61.0%) | $70,250 |
| 3-Person Families | 48 (15.1%) | $76,071 |
| 4-Person Families | 35 (11.0%) | $76,875 |
| 5-Person Families | 5 (1.6%) | $0 |
| 6-Person Families | 25 (7.9%) | $0 |
| 7+ Person Families | 11 (3.5%) | $0 |
| Total | 318 (100.0%) | $70,125 |
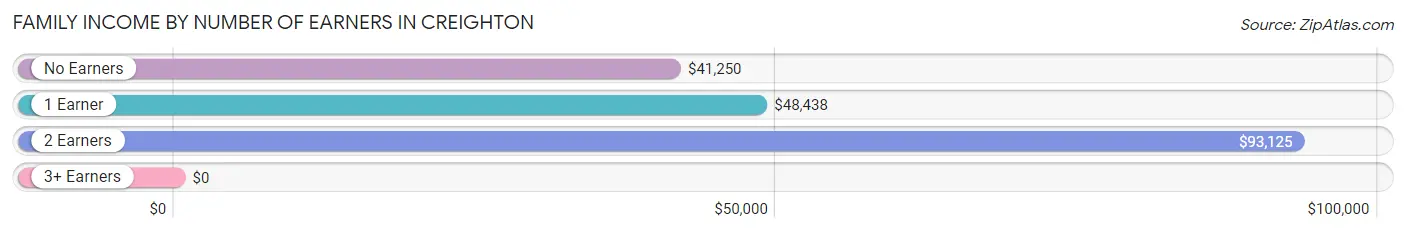
Family Income by Number of Earners in Creighton
| Number of Earners | # Families | Median Income |
| No Earners | 67 (21.1%) | $41,250 |
| 1 Earner | 82 (25.8%) | $48,438 |
| 2 Earners | 147 (46.2%) | $93,125 |
| 3+ Earners | 22 (6.9%) | $0 |
| Total | 318 (100.0%) | $70,125 |
Household Income in Creighton
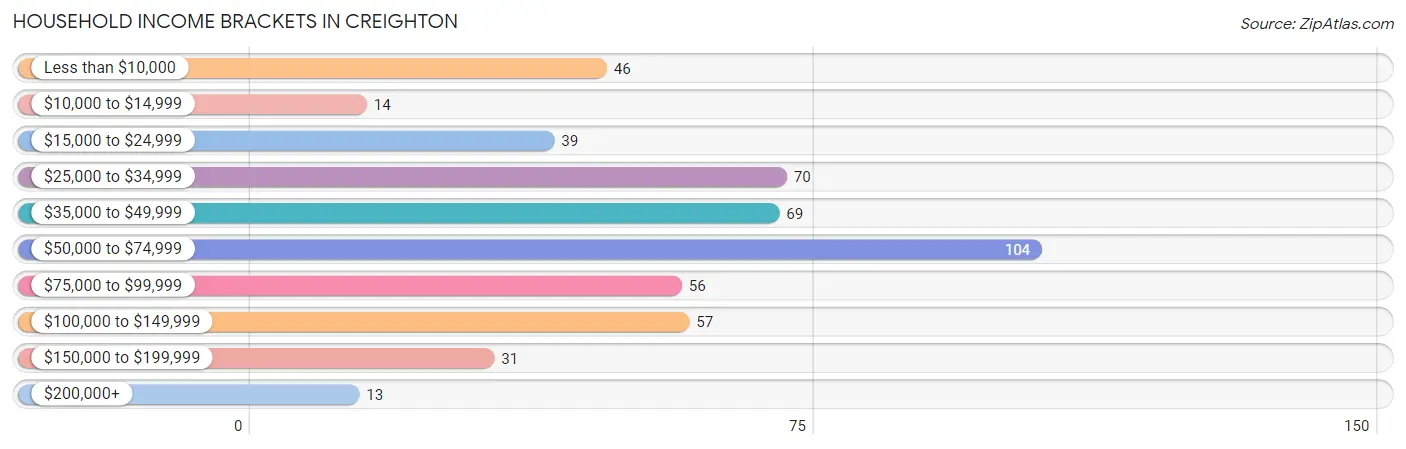
Household Income Brackets in Creighton
With 104 households falling in the category, the $50,000 to $74,999 income range is the most frequent in Creighton, accounting for 20.8% of all households. In contrast, only 13 households (2.6%) fall into the $200,000+ income bracket, making it the least populous group.
| Income Bracket | # Households | % Households |
| Less than $10,000 | 46 | 9.2% |
| $10,000 to $14,999 | 14 | 2.8% |
| $15,000 to $24,999 | 39 | 7.8% |
| $25,000 to $34,999 | 70 | 14.0% |
| $35,000 to $49,999 | 69 | 13.8% |
| $50,000 to $74,999 | 104 | 20.8% |
| $75,000 to $99,999 | 56 | 11.2% |
| $100,000 to $149,999 | 57 | 11.4% |
| $150,000 to $199,999 | 31 | 6.2% |
| $200,000+ | 13 | 2.6% |
Household Income by Householder Age in Creighton
The median household income in Creighton is $52,656, with the highest median household income of $67,368 found in the 25 to 44 years age bracket for the primary householder. A total of 126 households (25.3%) fall into this category. Meanwhile, the 15 to 24 years age bracket for the primary householder has the lowest median household income of $0, with 7 households (1.4%) in this group.
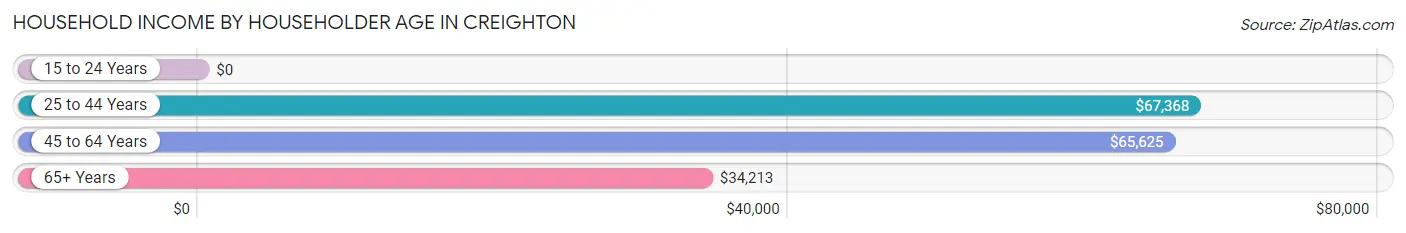
| Income Bracket | # Households | Median Income |
| 15 to 24 Years | 7 (1.4%) | $0 |
| 25 to 44 Years | 126 (25.3%) | $67,368 |
| 45 to 64 Years | 145 (29.1%) | $65,625 |
| 65+ Years | 221 (44.3%) | $34,213 |
| Total | 499 (100.0%) | $52,656 |
Poverty in Creighton
Income Below Poverty by Sex and Age in Creighton
With 6.2% poverty level for males and 17.2% for females among the residents of Creighton, 15 year old males and 18 to 24 year old females are the most vulnerable to poverty, with 4 males (100.0%) and 14 females (100.0%) in their respective age groups living below the poverty level.
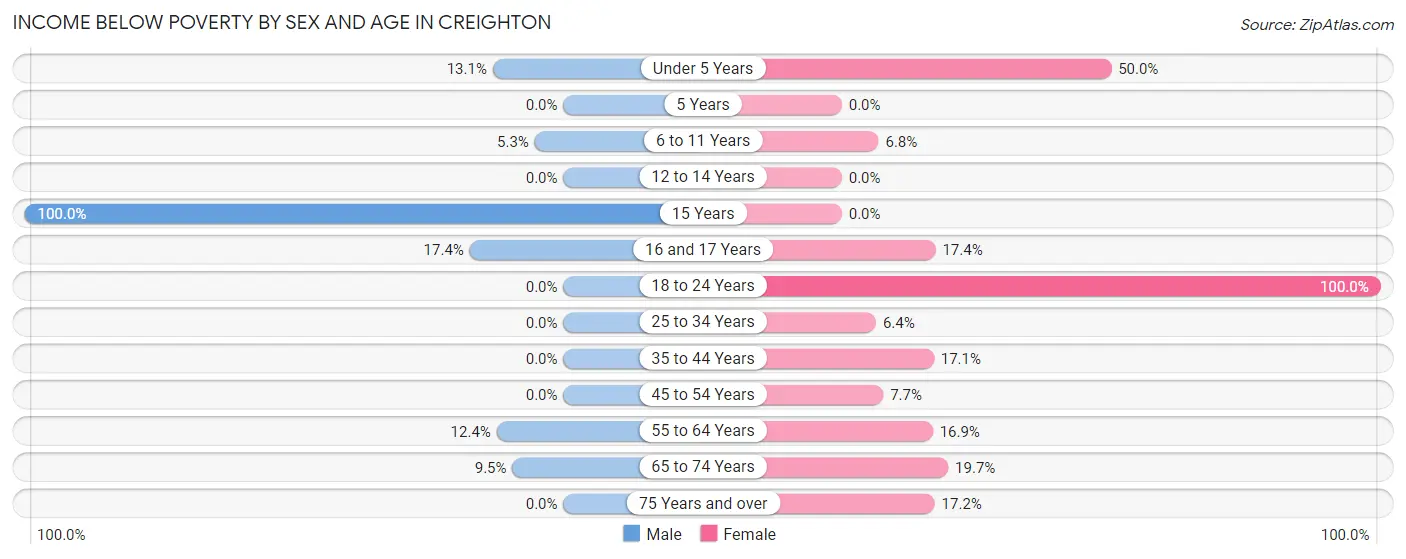
| Age Bracket | Male | Female |
| Under 5 Years | 8 (13.1%) | 9 (50.0%) |
| 5 Years | 0 (0.0%) | 0 (0.0%) |
| 6 to 11 Years | 5 (5.3%) | 3 (6.8%) |
| 12 to 14 Years | 0 (0.0%) | 0 (0.0%) |
| 15 Years | 4 (100.0%) | 0 (0.0%) |
| 16 and 17 Years | 4 (17.4%) | 4 (17.4%) |
| 18 to 24 Years | 0 (0.0%) | 14 (100.0%) |
| 25 to 34 Years | 0 (0.0%) | 4 (6.4%) |
| 35 to 44 Years | 0 (0.0%) | 7 (17.1%) |
| 45 to 54 Years | 0 (0.0%) | 3 (7.7%) |
| 55 to 64 Years | 13 (12.4%) | 14 (16.9%) |
| 65 to 74 Years | 7 (9.5%) | 15 (19.7%) |
| 75 Years and over | 0 (0.0%) | 20 (17.2%) |
| Total | 41 (6.2%) | 93 (17.2%) |
Income Above Poverty by Sex and Age in Creighton
According to the poverty statistics in Creighton, males aged 5 years and females aged 5 years are the age groups that are most secure financially, with 100.0% of males and 100.0% of females in these age groups living above the poverty line.
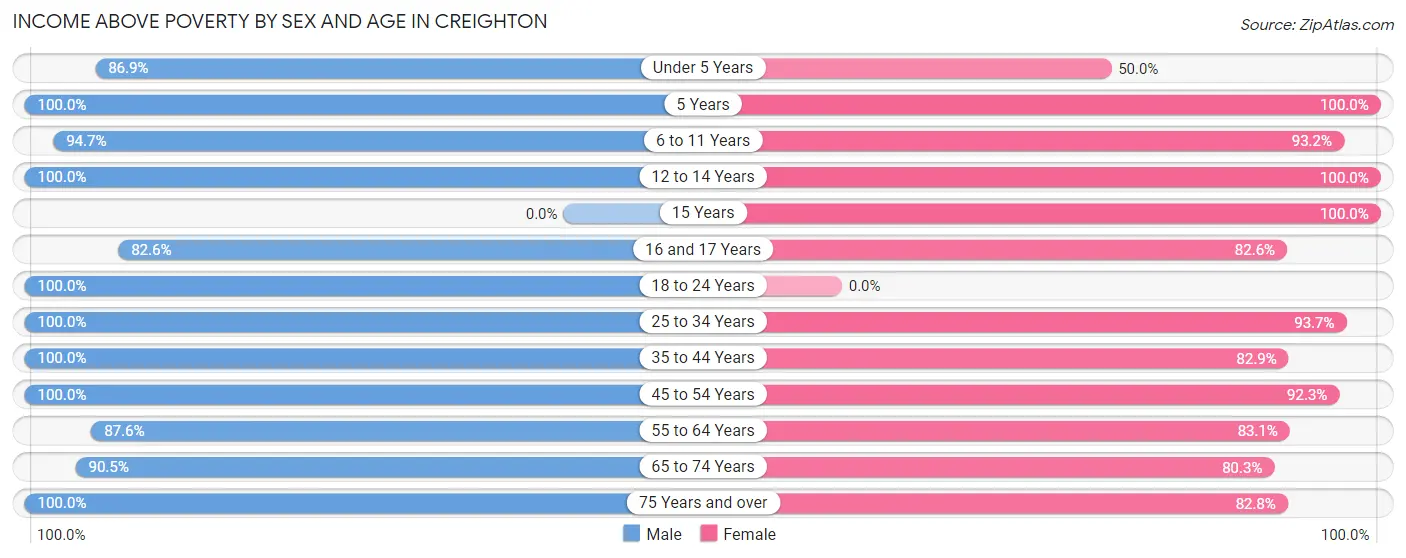
| Age Bracket | Male | Female |
| Under 5 Years | 53 (86.9%) | 9 (50.0%) |
| 5 Years | 16 (100.0%) | 17 (100.0%) |
| 6 to 11 Years | 89 (94.7%) | 41 (93.2%) |
| 12 to 14 Years | 24 (100.0%) | 3 (100.0%) |
| 15 Years | 0 (0.0%) | 3 (100.0%) |
| 16 and 17 Years | 19 (82.6%) | 19 (82.6%) |
| 18 to 24 Years | 50 (100.0%) | 0 (0.0%) |
| 25 to 34 Years | 62 (100.0%) | 59 (93.6%) |
| 35 to 44 Years | 62 (100.0%) | 34 (82.9%) |
| 45 to 54 Years | 32 (100.0%) | 36 (92.3%) |
| 55 to 64 Years | 92 (87.6%) | 69 (83.1%) |
| 65 to 74 Years | 67 (90.5%) | 61 (80.3%) |
| 75 Years and over | 56 (100.0%) | 96 (82.8%) |
| Total | 622 (93.8%) | 447 (82.8%) |
Income Below Poverty Among Married-Couple Families in Creighton
The poverty statistics for married-couple families in Creighton show that 5.1% or 13 of the total 256 families live below the poverty line. Families with 1 or 2 children have the highest poverty rate of 9.3%, comprising of 4 families. On the other hand, families with 3 or 4 children have the lowest poverty rate of 0.0%, which includes 0 families.
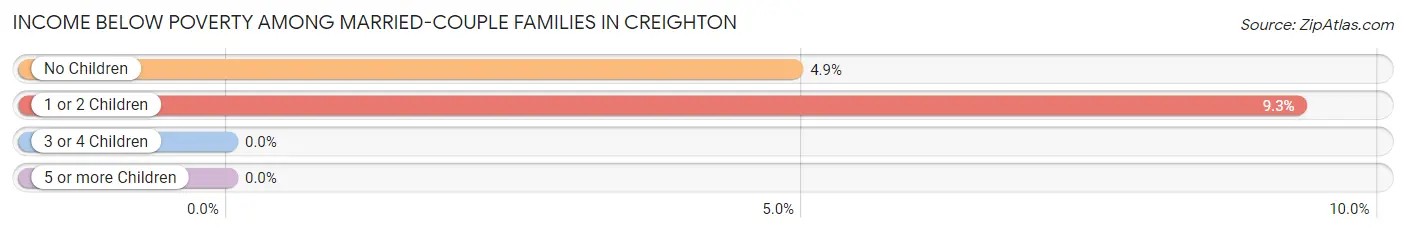
| Children | Above Poverty | Below Poverty |
| No Children | 174 (95.1%) | 9 (4.9%) |
| 1 or 2 Children | 39 (90.7%) | 4 (9.3%) |
| 3 or 4 Children | 30 (100.0%) | 0 (0.0%) |
| 5 or more Children | 0 (0.0%) | 0 (0.0%) |
| Total | 243 (94.9%) | 13 (5.1%) |
Income Below Poverty Among Single-Parent Households in Creighton
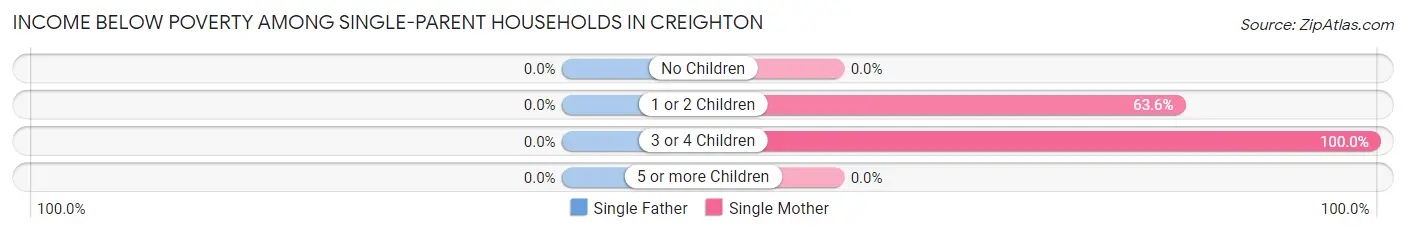
| Children | Single Father | Single Mother |
| No Children | 0 (0.0%) | 0 (0.0%) |
| 1 or 2 Children | 0 (0.0%) | 14 (63.6%) |
| 3 or 4 Children | 0 (0.0%) | 4 (100.0%) |
| 5 or more Children | 0 (0.0%) | 0 (0.0%) |
| Total | 0 (0.0%) | 18 (43.9%) |
Income Below Poverty Among Married-Couple vs Single-Parent Households in Creighton
The poverty data for Creighton shows that 13 of the married-couple family households (5.1%) and 18 of the single-parent households (29.0%) are living below the poverty level. Within the married-couple family households, those with 1 or 2 children have the highest poverty rate, with 4 households (9.3%) falling below the poverty line. Among the single-parent households, those with 3 or 4 children have the highest poverty rate, with 4 household (100.0%) living below poverty.
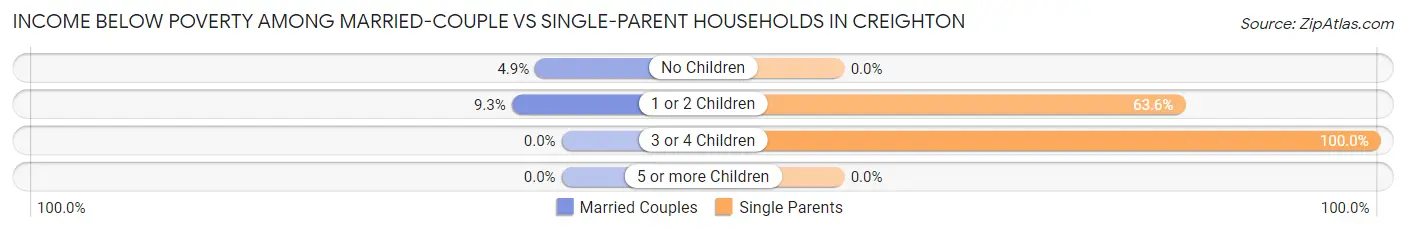
| Children | Married-Couple Families | Single-Parent Households |
| No Children | 9 (4.9%) | 0 (0.0%) |
| 1 or 2 Children | 4 (9.3%) | 14 (63.6%) |
| 3 or 4 Children | 0 (0.0%) | 4 (100.0%) |
| 5 or more Children | 0 (0.0%) | 0 (0.0%) |
| Total | 13 (5.1%) | 18 (29.0%) |
Race in Creighton
The most populous races in Creighton are White / Caucasian (1,143 | 92.1%), Two or more Races (48 | 3.9%), and Black / African American (36 | 2.9%).
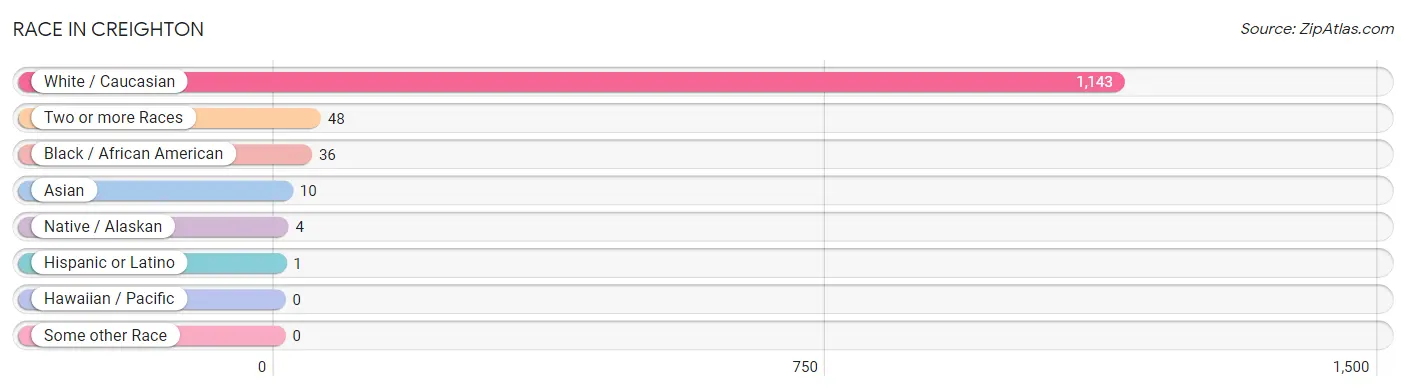
| Race | # Population | % Population |
| Asian | 10 | 0.8% |
| Black / African American | 36 | 2.9% |
| Hawaiian / Pacific | 0 | 0.0% |
| Hispanic or Latino | 1 | 0.1% |
| Native / Alaskan | 4 | 0.3% |
| White / Caucasian | 1,143 | 92.1% |
| Two or more Races | 48 | 3.9% |
| Some other Race | 0 | 0.0% |
| Total | 1,241 | 100.0% |
Ancestry in Creighton
The most populous ancestries reported in Creighton are German (422 | 34.0%), Irish (146 | 11.8%), English (102 | 8.2%), Dutch (99 | 8.0%), and Czech (70 | 5.6%), together accounting for 67.6% of all Creighton residents.
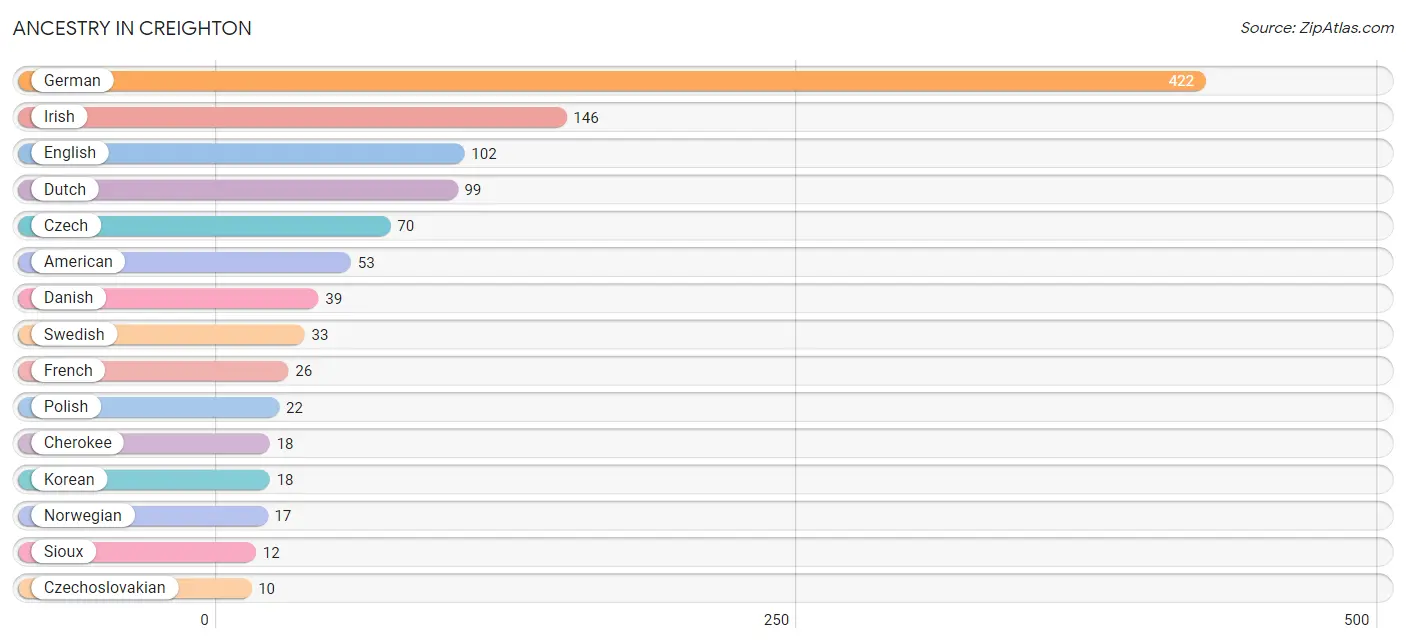
| Ancestry | # Population | % Population |
| American | 53 | 4.3% |
| Belgian | 2 | 0.2% |
| Burmese | 3 | 0.2% |
| Cherokee | 18 | 1.5% |
| Czech | 70 | 5.6% |
| Czechoslovakian | 10 | 0.8% |
| Danish | 39 | 3.1% |
| Dutch | 99 | 8.0% |
| English | 102 | 8.2% |
| European | 4 | 0.3% |
| French | 26 | 2.1% |
| German | 422 | 34.0% |
| Irish | 146 | 11.8% |
| Italian | 2 | 0.2% |
| Korean | 18 | 1.5% |
| Mexican | 1 | 0.1% |
| Norwegian | 17 | 1.4% |
| Polish | 22 | 1.8% |
| Russian | 4 | 0.3% |
| Scandinavian | 2 | 0.2% |
| Scotch-Irish | 2 | 0.2% |
| Scottish | 8 | 0.6% |
| Seminole | 1 | 0.1% |
| Sioux | 12 | 1.0% |
| Slovak | 1 | 0.1% |
| Swedish | 33 | 2.7% |
| Welsh | 9 | 0.7% | View All 27 Rows |
Immigrants in Creighton
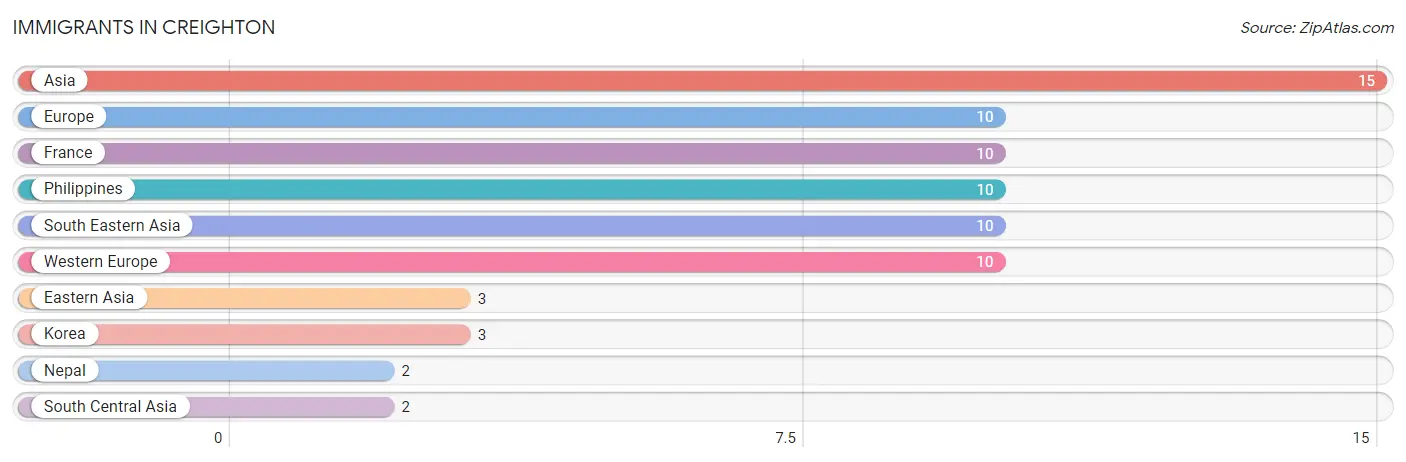
The most numerous immigrant groups reported in Creighton came from Asia (15 | 1.2%), Europe (10 | 0.8%), France (10 | 0.8%), Philippines (10 | 0.8%), and South Eastern Asia (10 | 0.8%), together accounting for 4.4% of all Creighton residents.
| Immigration Origin | # Population | % Population |
| Asia | 15 | 1.2% |
| Eastern Asia | 3 | 0.2% |
| Europe | 10 | 0.8% |
| France | 10 | 0.8% |
| Korea | 3 | 0.2% |
| Nepal | 2 | 0.2% |
| Philippines | 10 | 0.8% |
| South Central Asia | 2 | 0.2% |
| South Eastern Asia | 10 | 0.8% |
| Western Europe | 10 | 0.8% | View All 10 Rows |
Sex and Age in Creighton
Sex and Age in Creighton
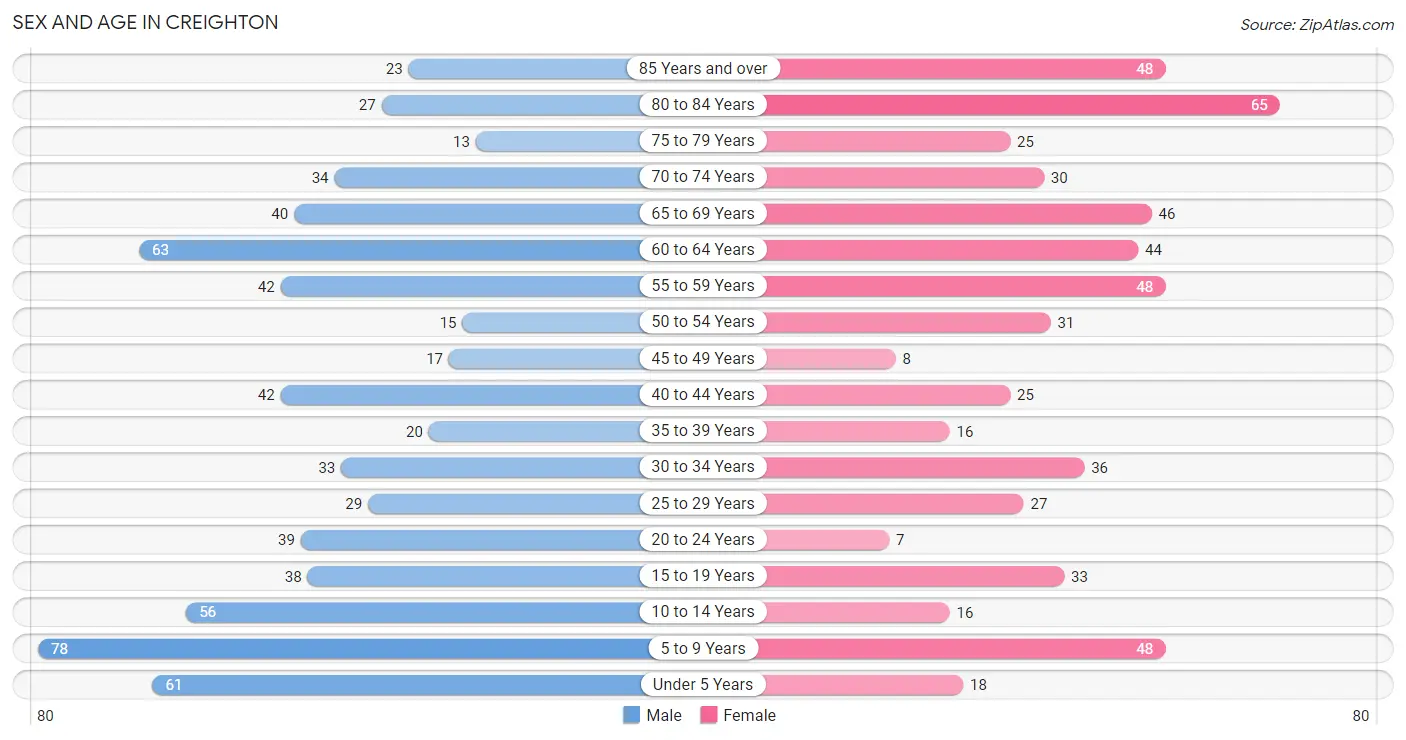
The most populous age groups in Creighton are 5 to 9 Years (78 | 11.6%) for men and 80 to 84 Years (65 | 11.4%) for women.
| Age Bracket | Male | Female |
| Under 5 Years | 61 (9.1%) | 18 (3.2%) |
| 5 to 9 Years | 78 (11.6%) | 48 (8.4%) |
| 10 to 14 Years | 56 (8.4%) | 16 (2.8%) |
| 15 to 19 Years | 38 (5.7%) | 33 (5.8%) |
| 20 to 24 Years | 39 (5.8%) | 7 (1.2%) |
| 25 to 29 Years | 29 (4.3%) | 27 (4.7%) |
| 30 to 34 Years | 33 (4.9%) | 36 (6.3%) |
| 35 to 39 Years | 20 (3.0%) | 16 (2.8%) |
| 40 to 44 Years | 42 (6.3%) | 25 (4.4%) |
| 45 to 49 Years | 17 (2.5%) | 8 (1.4%) |
| 50 to 54 Years | 15 (2.2%) | 31 (5.4%) |
| 55 to 59 Years | 42 (6.3%) | 48 (8.4%) |
| 60 to 64 Years | 63 (9.4%) | 44 (7.7%) |
| 65 to 69 Years | 40 (6.0%) | 46 (8.1%) |
| 70 to 74 Years | 34 (5.1%) | 30 (5.2%) |
| 75 to 79 Years | 13 (1.9%) | 25 (4.4%) |
| 80 to 84 Years | 27 (4.0%) | 65 (11.4%) |
| 85 Years and over | 23 (3.4%) | 48 (8.4%) |
| Total | 670 (100.0%) | 571 (100.0%) |
Families and Households in Creighton
Median Family Size in Creighton
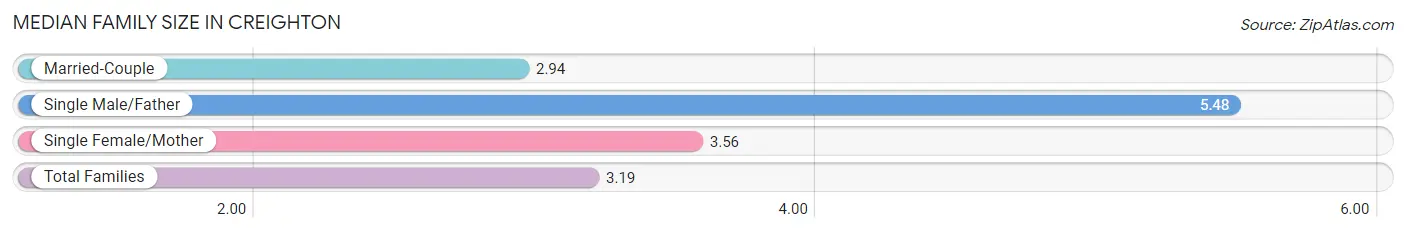
The median family size in Creighton is 3.19 persons per family, with single male/father families (21 | 6.6%) accounting for the largest median family size of 5.48 persons per family. On the other hand, married-couple families (256 | 80.5%) represent the smallest median family size with 2.94 persons per family.
| Family Type | # Families | Family Size |
| Married-Couple | 256 (80.5%) | 2.94 |
| Single Male/Father | 21 (6.6%) | 5.48 |
| Single Female/Mother | 41 (12.9%) | 3.56 |
| Total Families | 318 (100.0%) | 3.19 |
Median Household Size in Creighton
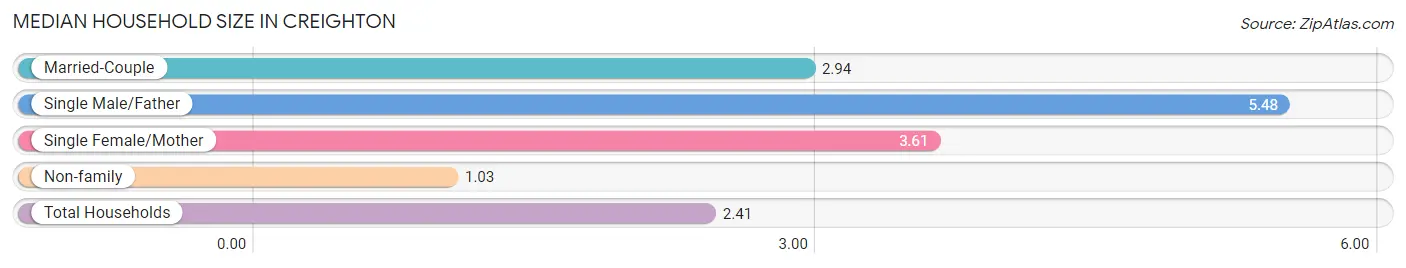
The median household size in Creighton is 2.41 persons per household, with single male/father households (21 | 4.2%) accounting for the largest median household size of 5.48 persons per household. non-family households (181 | 36.3%) represent the smallest median household size with 1.03 persons per household.
| Household Type | # Households | Household Size |
| Married-Couple | 256 (51.3%) | 2.94 |
| Single Male/Father | 21 (4.2%) | 5.48 |
| Single Female/Mother | 41 (8.2%) | 3.61 |
| Non-family | 181 (36.3%) | 1.03 |
| Total Households | 499 (100.0%) | 2.41 |
Household Size by Marriage Status in Creighton
Out of a total of 499 households in Creighton, 318 (63.7%) are family households, while 181 (36.3%) are nonfamily households. The most numerous type of family households are 2-person households, comprising 194, and the most common type of nonfamily households are 1-person households, comprising 176.
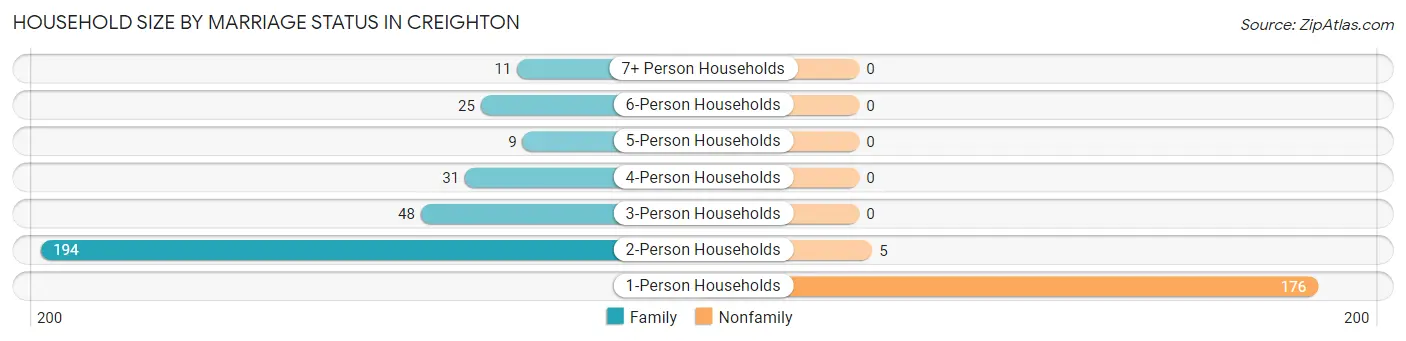
| Household Size | Family Households | Nonfamily Households |
| 1-Person Households | - | 176 (35.3%) |
| 2-Person Households | 194 (38.9%) | 5 (1.0%) |
| 3-Person Households | 48 (9.6%) | 0 (0.0%) |
| 4-Person Households | 31 (6.2%) | 0 (0.0%) |
| 5-Person Households | 9 (1.8%) | 0 (0.0%) |
| 6-Person Households | 25 (5.0%) | 0 (0.0%) |
| 7+ Person Households | 11 (2.2%) | 0 (0.0%) |
| Total | 318 (63.7%) | 181 (36.3%) |
Female Fertility in Creighton
Fertility by Age in Creighton
Average fertility rate in Creighton is 105.0 births per 1,000 women. Women in the age bracket of 20 to 34 years have the highest fertility rate with 186.0 births per 1,000 women. Women in the age bracket of 20 to 34 years acount for 81.2% of all women with births.
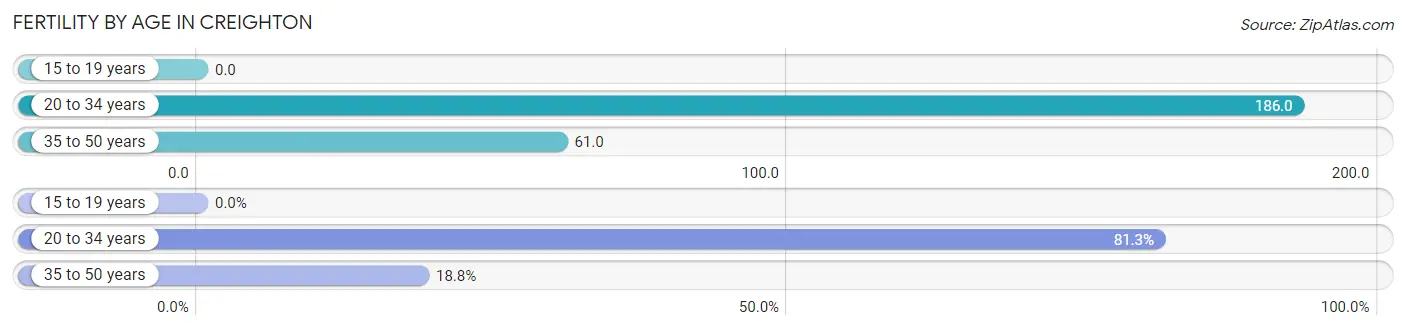
| Age Bracket | Women with Births | Births / 1,000 Women |
| 15 to 19 years | 0 (0.0%) | 0.0 |
| 20 to 34 years | 13 (81.2%) | 186.0 |
| 35 to 50 years | 3 (18.8%) | 61.0 |
| Total | 16 (100.0%) | 105.0 |
Fertility by Age by Marriage Status in Creighton
56.2% of women with births (16) in Creighton are married. The highest percentage of unmarried women with births falls into 35 to 50 years age bracket with 100.0% of them unmarried at the time of birth, while the lowest percentage of unmarried women with births belong to 20 to 34 years age bracket with 30.8% of them unmarried.
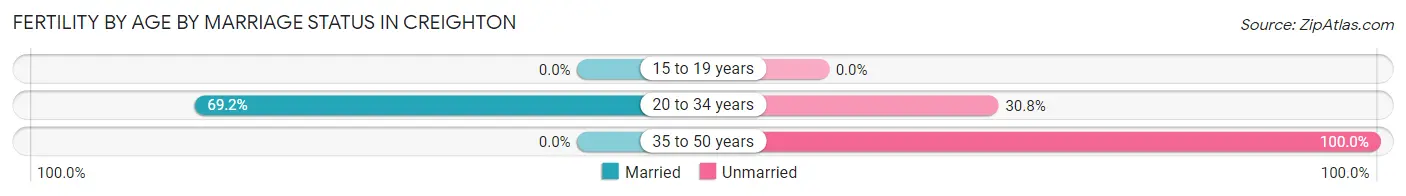
| Age Bracket | Married | Unmarried |
| 15 to 19 years | 0 (0.0%) | 0 (0.0%) |
| 20 to 34 years | 9 (69.2%) | 4 (30.8%) |
| 35 to 50 years | 0 (0.0%) | 3 (100.0%) |
| Total | 9 (56.2%) | 7 (43.8%) |
Fertility by Education in Creighton
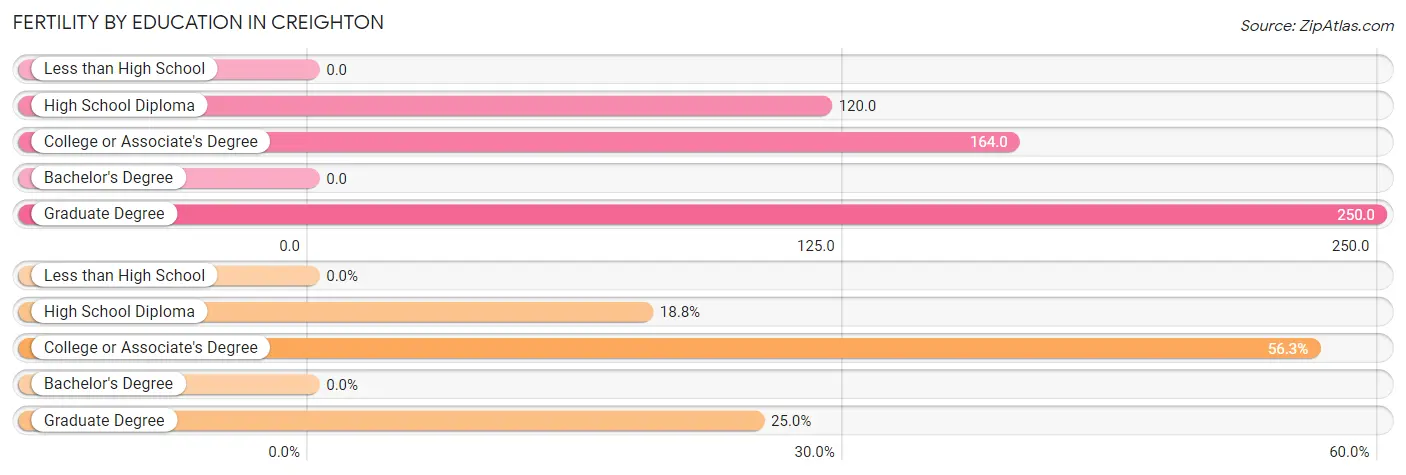
| Educational Attainment | Women with Births | Births / 1,000 Women |
| Less than High School | 0 (0.0%) | 0.0 |
| High School Diploma | 3 (18.8%) | 120.0 |
| College or Associate's Degree | 9 (56.2%) | 164.0 |
| Bachelor's Degree | 0 (0.0%) | 0.0 |
| Graduate Degree | 4 (25.0%) | 250.0 |
| Total | 16 (100.0%) | 105.0 |
Fertility by Education by Marriage Status in Creighton
43.8% of women with births in Creighton are unmarried. Women with the educational attainment of college or associate's degree are most likely to be married with 100.0% of them married at childbirth, while women with the educational attainment of high school diploma are least likely to be married with 100.0% of them unmarried at childbirth.
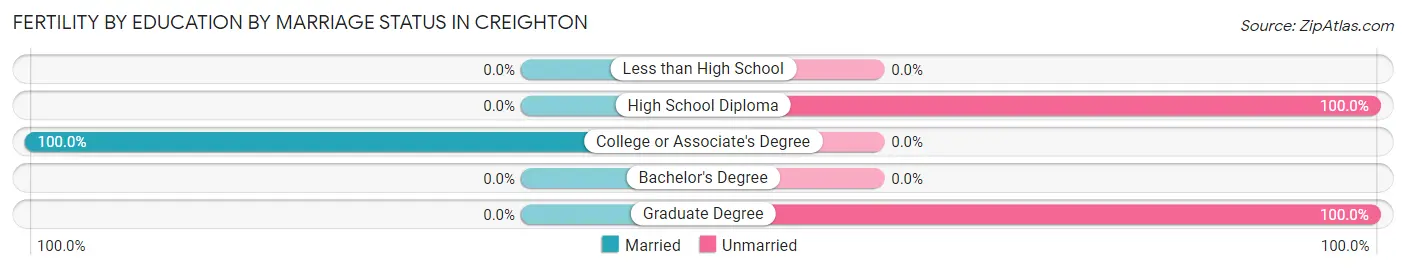
| Educational Attainment | Married | Unmarried |
| Less than High School | 0 (0.0%) | 0 (0.0%) |
| High School Diploma | 0 (0.0%) | 3 (100.0%) |
| College or Associate's Degree | 9 (100.0%) | 0 (0.0%) |
| Bachelor's Degree | 0 (0.0%) | 0 (0.0%) |
| Graduate Degree | 0 (0.0%) | 4 (100.0%) |
| Total | 9 (56.2%) | 7 (43.8%) |
Employment Characteristics in Creighton
Employment by Class of Employer in Creighton
Among the 534 employed individuals in Creighton, private company employees (330 | 61.8%), not-for-profit organizations (61 | 11.4%), and local government employees (47 | 8.8%) make up the most common classes of employment.
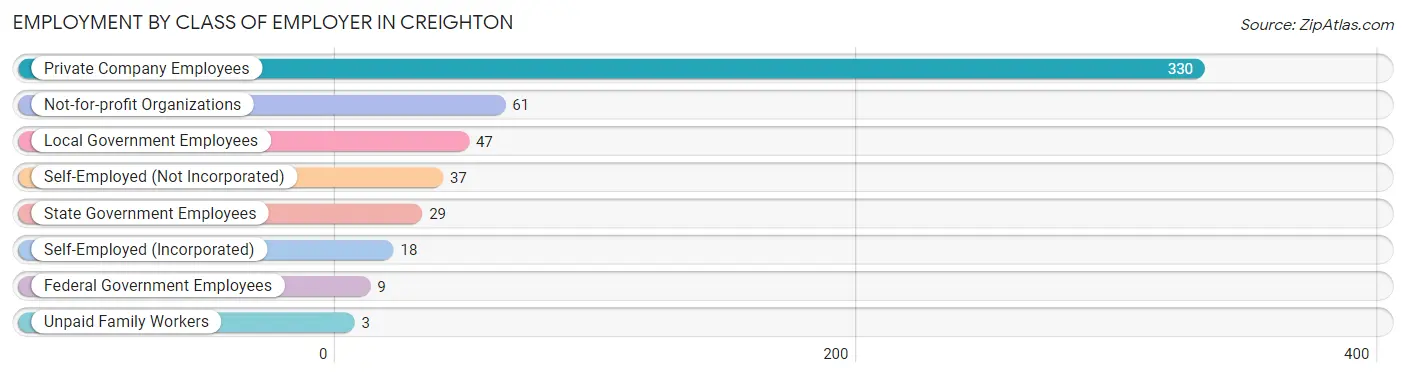
| Employer Class | # Employees | % Employees |
| Private Company Employees | 330 | 61.8% |
| Self-Employed (Incorporated) | 18 | 3.4% |
| Self-Employed (Not Incorporated) | 37 | 6.9% |
| Not-for-profit Organizations | 61 | 11.4% |
| Local Government Employees | 47 | 8.8% |
| State Government Employees | 29 | 5.4% |
| Federal Government Employees | 9 | 1.7% |
| Unpaid Family Workers | 3 | 0.6% |
| Total | 534 | 100.0% |
Employment Status by Age in Creighton
According to the labor force statistics for Creighton, out of the total population over 16 years of age (957), 58.8% or 563 individuals are in the labor force, with 2.5% or 14 of them unemployed. The age group with the highest labor force participation rate is 25 to 29 years, with 100.0% or 56 individuals in the labor force. Within the labor force, the 30 to 34 years age range has the highest percentage of unemployed individuals, with 17.4% or 12 of them being unemployed.
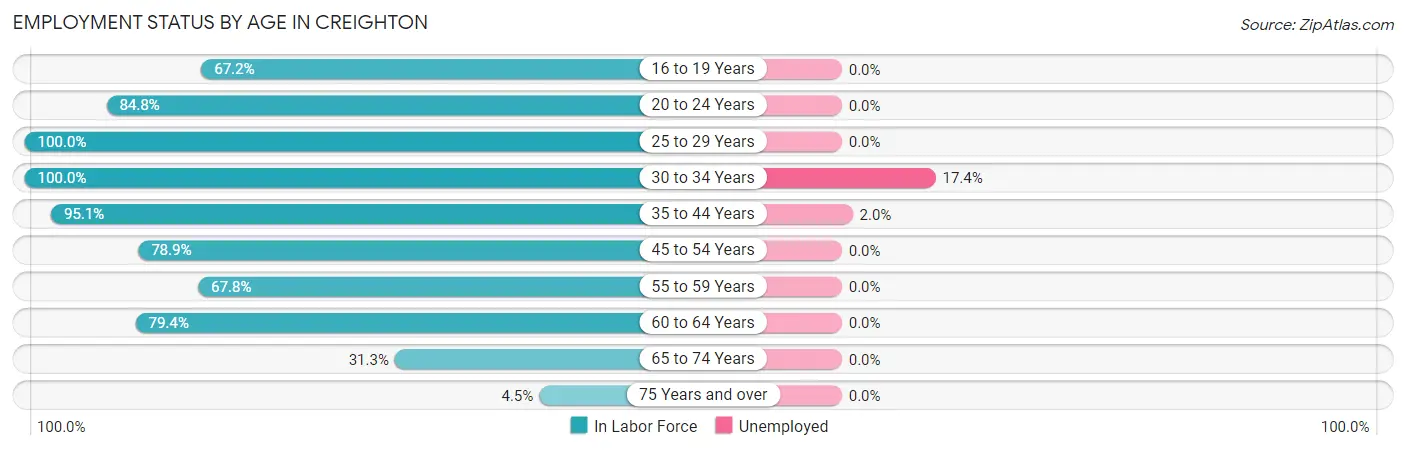
| Age Bracket | In Labor Force | Unemployed |
| 16 to 19 Years | 43 (67.2%) | 0 (0.0%) |
| 20 to 24 Years | 39 (84.8%) | 0 (0.0%) |
| 25 to 29 Years | 56 (100.0%) | 0 (0.0%) |
| 30 to 34 Years | 69 (100.0%) | 12 (17.4%) |
| 35 to 44 Years | 98 (95.1%) | 2 (2.0%) |
| 45 to 54 Years | 56 (78.9%) | 0 (0.0%) |
| 55 to 59 Years | 61 (67.8%) | 0 (0.0%) |
| 60 to 64 Years | 85 (79.4%) | 0 (0.0%) |
| 65 to 74 Years | 47 (31.3%) | 0 (0.0%) |
| 75 Years and over | 9 (4.5%) | 0 (0.0%) |
| Total | 563 (58.8%) | 14 (2.5%) |
Employment Status by Educational Attainment in Creighton
According to labor force statistics for Creighton, 85.7% of individuals (425) out of the total population between 25 and 64 years of age (496) are in the labor force, with 3.3% or 14 of them being unemployed. The group with the highest labor force participation rate are those with the educational attainment of college / associate degree, with 94.4% or 201 individuals in the labor force. Within the labor force, individuals with high school diploma education have the highest percentage of unemployment, with 11.3% or 12 of them being unemployed.
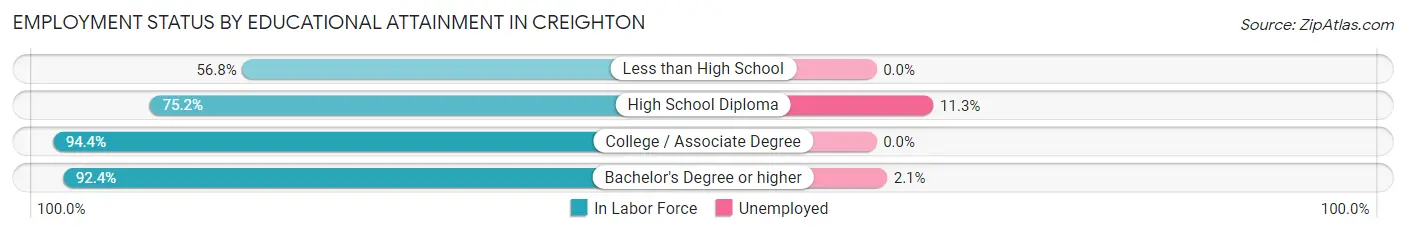
| Educational Attainment | In Labor Force | Unemployed |
| Less than High School | 21 (56.8%) | 0 (0.0%) |
| High School Diploma | 106 (75.2%) | 16 (11.3%) |
| College / Associate Degree | 201 (94.4%) | 0 (0.0%) |
| Bachelor's Degree or higher | 97 (92.4%) | 2 (2.1%) |
| Total | 425 (85.7%) | 16 (3.3%) |
Employment Occupations by Sex in Creighton
Management, Business, Science and Arts Occupations
The most common Management, Business, Science and Arts occupations in Creighton are Management (90 | 16.4%), Community & Social Service (44 | 8.0%), Health Diagnosing & Treating (42 | 7.6%), Education Instruction & Library (40 | 7.3%), and Business & Financial (23 | 4.2%).

Management, Business, Science and Arts Occupations by Sex
Within the Management, Business, Science and Arts occupations in Creighton, the most male-oriented occupations are Computers, Engineering & Science (100.0%), Architecture & Engineering (100.0%), and Arts, Media & Entertainment (100.0%), while the most female-oriented occupations are Legal Services & Support (100.0%), Education Instruction & Library (92.5%), and Community & Social Service (88.6%).
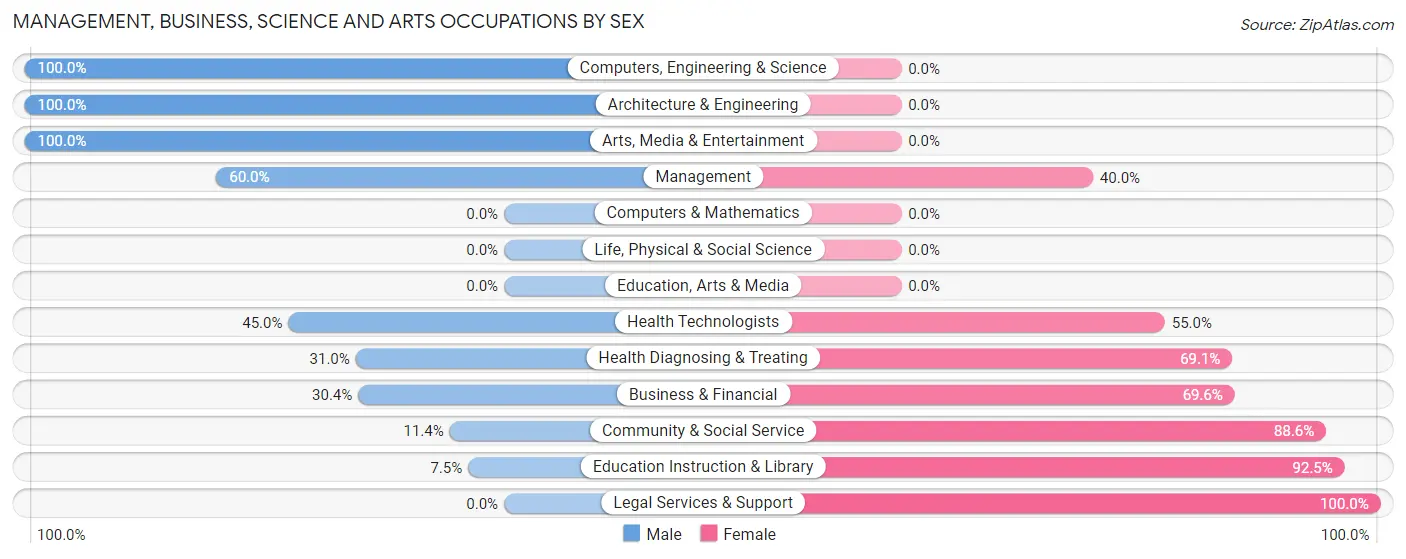
| Occupation | Male | Female |
| Management | 54 (60.0%) | 36 (40.0%) |
| Business & Financial | 7 (30.4%) | 16 (69.6%) |
| Computers, Engineering & Science | 5 (100.0%) | 0 (0.0%) |
| Computers & Mathematics | 0 (0.0%) | 0 (0.0%) |
| Architecture & Engineering | 5 (100.0%) | 0 (0.0%) |
| Life, Physical & Social Science | 0 (0.0%) | 0 (0.0%) |
| Community & Social Service | 5 (11.4%) | 39 (88.6%) |
| Education, Arts & Media | 0 (0.0%) | 0 (0.0%) |
| Legal Services & Support | 0 (0.0%) | 2 (100.0%) |
| Education Instruction & Library | 3 (7.5%) | 37 (92.5%) |
| Arts, Media & Entertainment | 2 (100.0%) | 0 (0.0%) |
| Health Diagnosing & Treating | 13 (30.9%) | 29 (69.1%) |
| Health Technologists | 9 (45.0%) | 11 (55.0%) |
| Total (Category) | 84 (41.2%) | 120 (58.8%) |
| Total (Overall) | 328 (59.7%) | 221 (40.3%) |
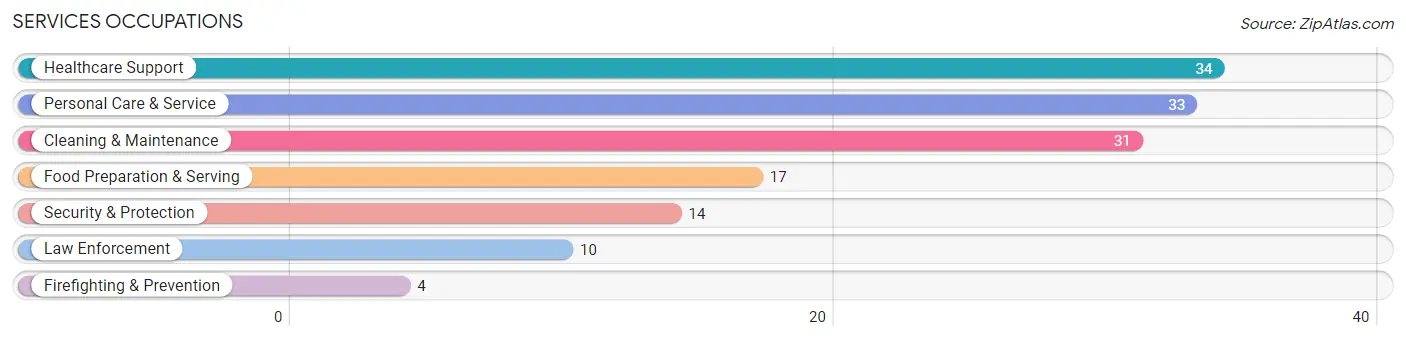
Services Occupations
The most common Services occupations in Creighton are Healthcare Support (34 | 6.2%), Personal Care & Service (33 | 6.0%), Cleaning & Maintenance (31 | 5.7%), Food Preparation & Serving (17 | 3.1%), and Security & Protection (14 | 2.5%).
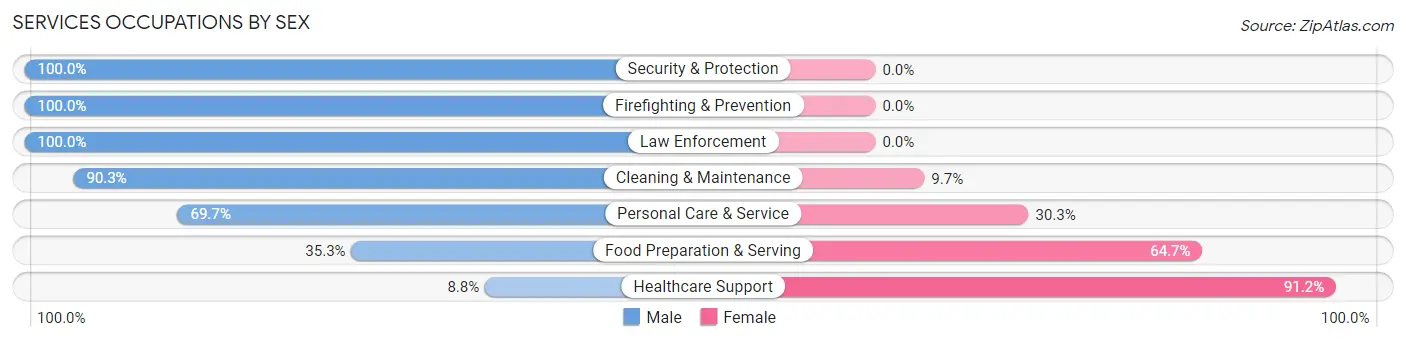
Services Occupations by Sex
Within the Services occupations in Creighton, the most male-oriented occupations are Security & Protection (100.0%), Firefighting & Prevention (100.0%), and Law Enforcement (100.0%), while the most female-oriented occupations are Healthcare Support (91.2%), Food Preparation & Serving (64.7%), and Personal Care & Service (30.3%).
| Occupation | Male | Female |
| Healthcare Support | 3 (8.8%) | 31 (91.2%) |
| Security & Protection | 14 (100.0%) | 0 (0.0%) |
| Firefighting & Prevention | 4 (100.0%) | 0 (0.0%) |
| Law Enforcement | 10 (100.0%) | 0 (0.0%) |
| Food Preparation & Serving | 6 (35.3%) | 11 (64.7%) |
| Cleaning & Maintenance | 28 (90.3%) | 3 (9.7%) |
| Personal Care & Service | 23 (69.7%) | 10 (30.3%) |
| Total (Category) | 74 (57.4%) | 55 (42.6%) |
| Total (Overall) | 328 (59.7%) | 221 (40.3%) |
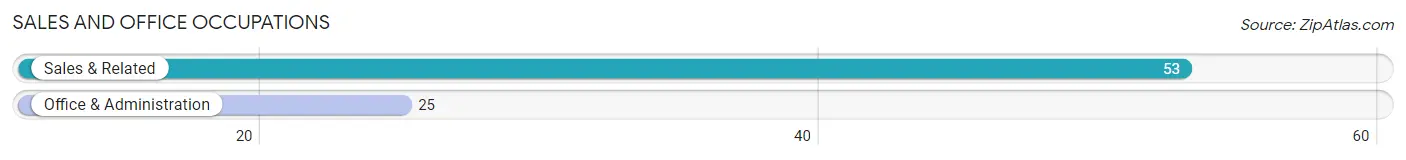
Sales and Office Occupations
The most common Sales and Office occupations in Creighton are Sales & Related (53 | 9.7%), and Office & Administration (25 | 4.5%).
Sales and Office Occupations by Sex
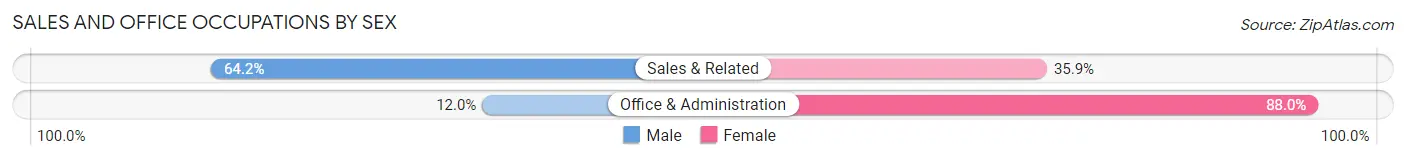
| Occupation | Male | Female |
| Sales & Related | 34 (64.1%) | 19 (35.8%) |
| Office & Administration | 3 (12.0%) | 22 (88.0%) |
| Total (Category) | 37 (47.4%) | 41 (52.6%) |
| Total (Overall) | 328 (59.7%) | 221 (40.3%) |
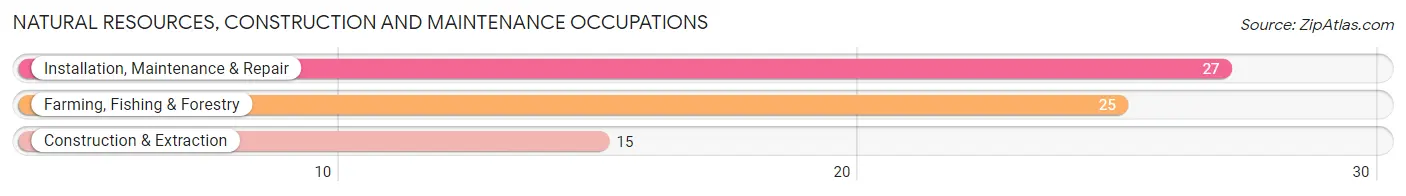
Natural Resources, Construction and Maintenance Occupations
The most common Natural Resources, Construction and Maintenance occupations in Creighton are Installation, Maintenance & Repair (27 | 4.9%), Farming, Fishing & Forestry (25 | 4.5%), and Construction & Extraction (15 | 2.7%).
Natural Resources, Construction and Maintenance Occupations by Sex
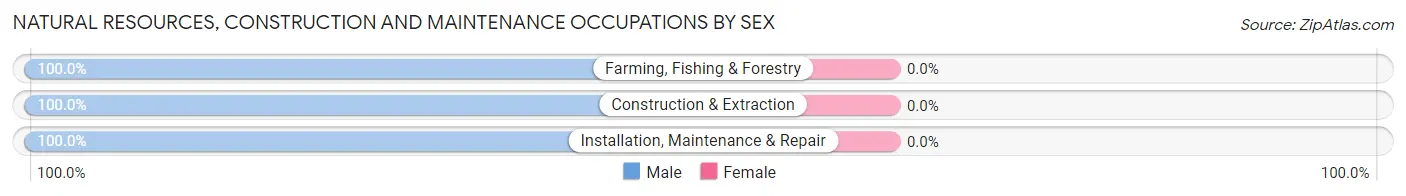
| Occupation | Male | Female |
| Farming, Fishing & Forestry | 25 (100.0%) | 0 (0.0%) |
| Construction & Extraction | 15 (100.0%) | 0 (0.0%) |
| Installation, Maintenance & Repair | 27 (100.0%) | 0 (0.0%) |
| Total (Category) | 67 (100.0%) | 0 (0.0%) |
| Total (Overall) | 328 (59.7%) | 221 (40.3%) |
Production, Transportation and Moving Occupations
The most common Production, Transportation and Moving occupations in Creighton are Production (40 | 7.3%), Transportation (21 | 3.8%), and Material Moving (10 | 1.8%).
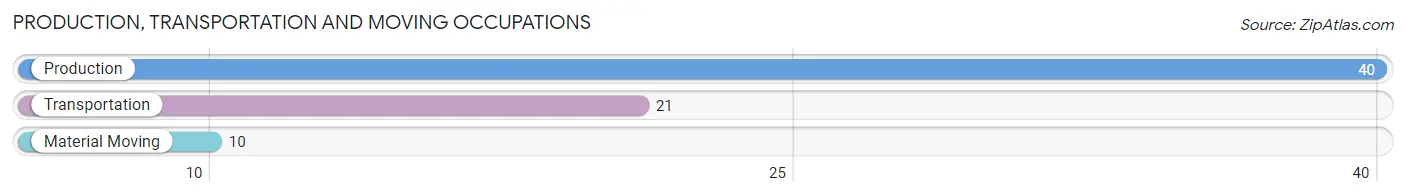
Production, Transportation and Moving Occupations by Sex
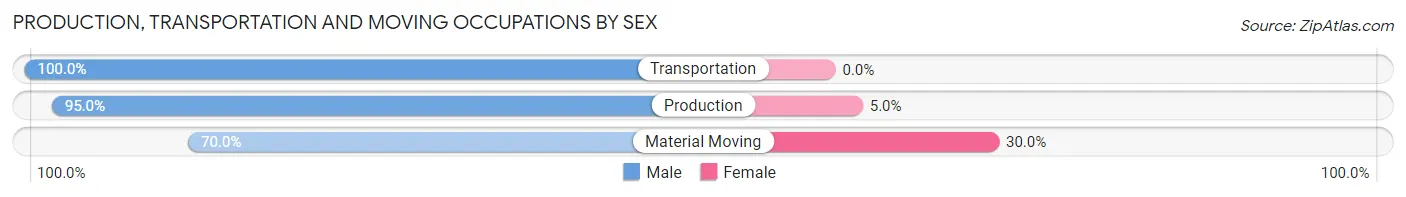
| Occupation | Male | Female |
| Production | 38 (95.0%) | 2 (5.0%) |
| Transportation | 21 (100.0%) | 0 (0.0%) |
| Material Moving | 7 (70.0%) | 3 (30.0%) |
| Total (Category) | 66 (93.0%) | 5 (7.0%) |
| Total (Overall) | 328 (59.7%) | 221 (40.3%) |
Employment Industries by Sex in Creighton
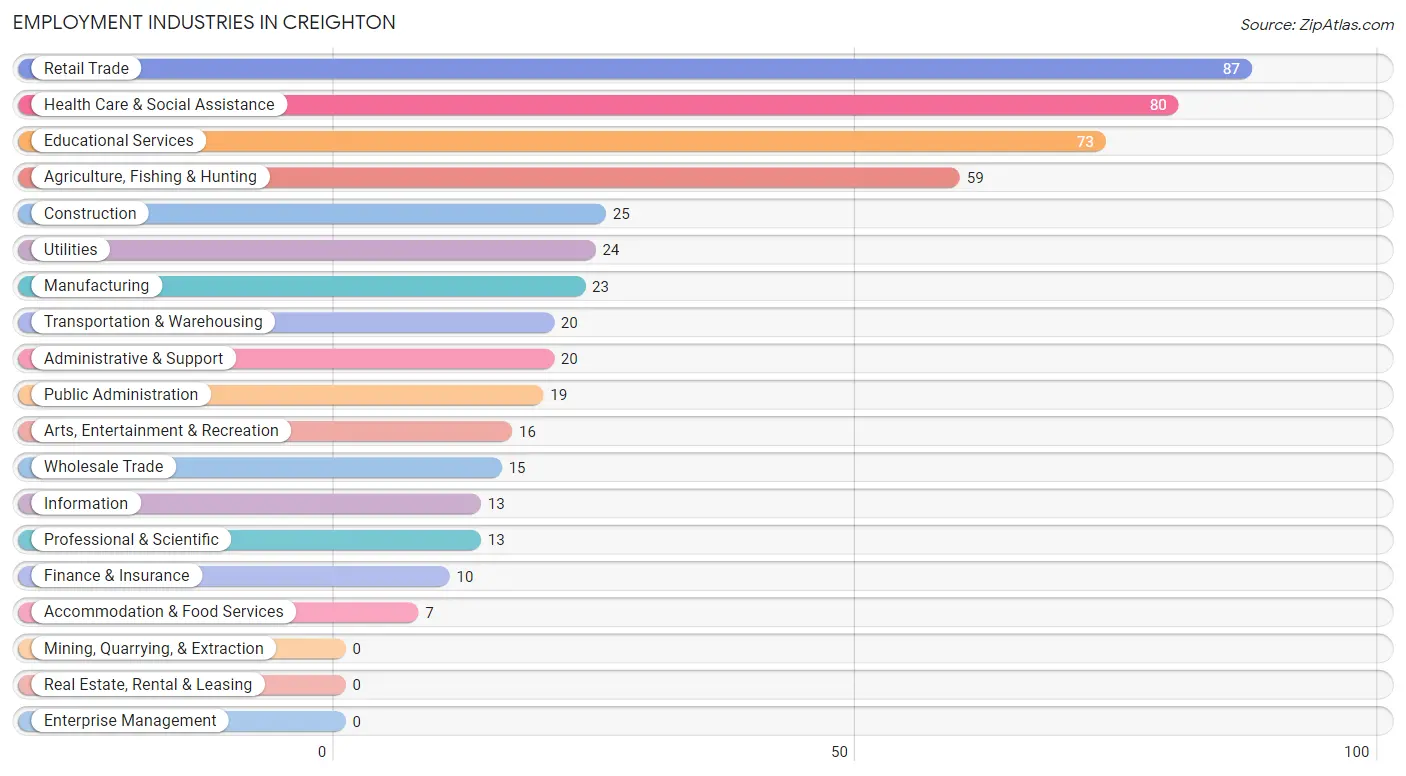
Employment Industries in Creighton
The major employment industries in Creighton include Retail Trade (87 | 15.9%), Health Care & Social Assistance (80 | 14.6%), Educational Services (73 | 13.3%), Agriculture, Fishing & Hunting (59 | 10.7%), and Construction (25 | 4.5%).
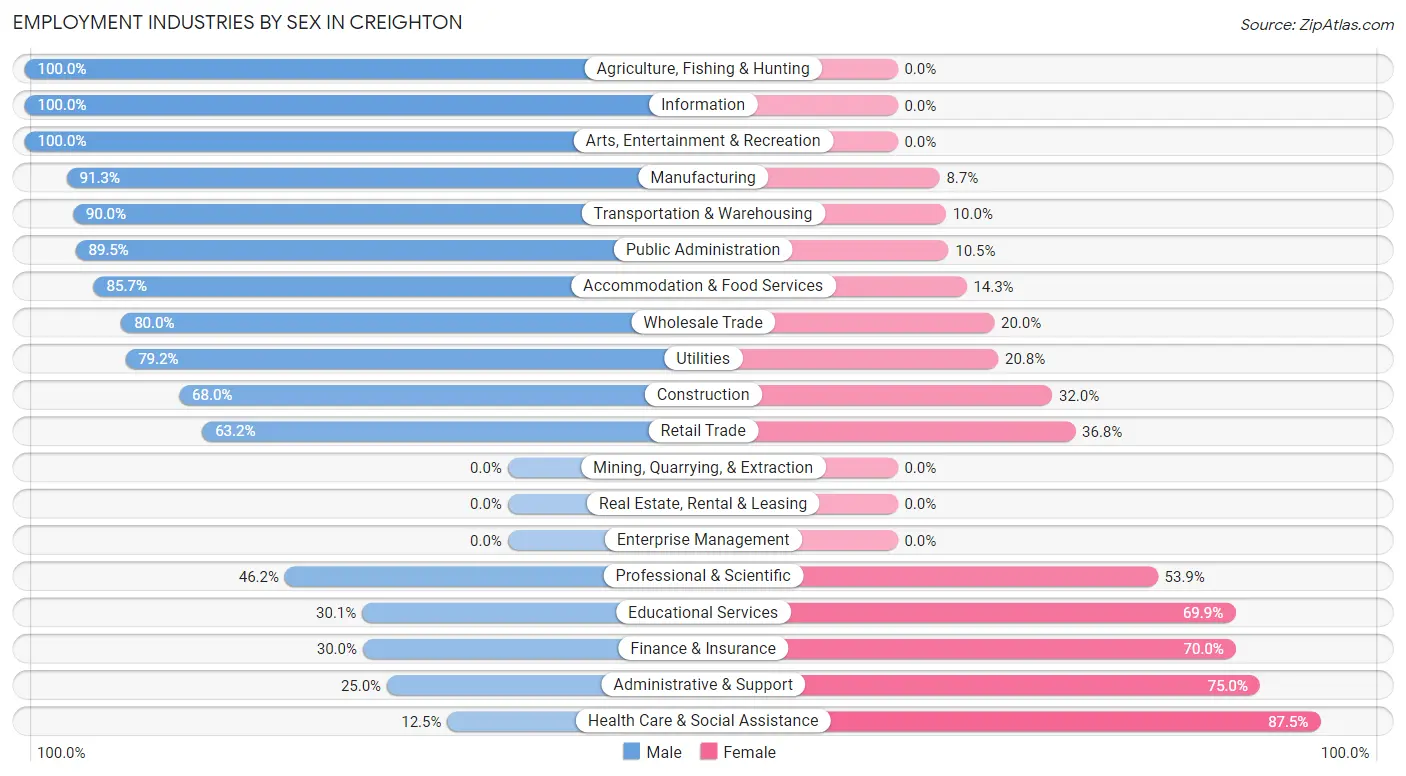
Employment Industries by Sex in Creighton
The Creighton industries that see more men than women are Agriculture, Fishing & Hunting (100.0%), Information (100.0%), and Arts, Entertainment & Recreation (100.0%), whereas the industries that tend to have a higher number of women are Health Care & Social Assistance (87.5%), Administrative & Support (75.0%), and Finance & Insurance (70.0%).
| Industry | Male | Female |
| Agriculture, Fishing & Hunting | 59 (100.0%) | 0 (0.0%) |
| Mining, Quarrying, & Extraction | 0 (0.0%) | 0 (0.0%) |
| Construction | 17 (68.0%) | 8 (32.0%) |
| Manufacturing | 21 (91.3%) | 2 (8.7%) |
| Wholesale Trade | 12 (80.0%) | 3 (20.0%) |
| Retail Trade | 55 (63.2%) | 32 (36.8%) |
| Transportation & Warehousing | 18 (90.0%) | 2 (10.0%) |
| Utilities | 19 (79.2%) | 5 (20.8%) |
| Information | 13 (100.0%) | 0 (0.0%) |
| Finance & Insurance | 3 (30.0%) | 7 (70.0%) |
| Real Estate, Rental & Leasing | 0 (0.0%) | 0 (0.0%) |
| Professional & Scientific | 6 (46.2%) | 7 (53.8%) |
| Enterprise Management | 0 (0.0%) | 0 (0.0%) |
| Administrative & Support | 5 (25.0%) | 15 (75.0%) |
| Educational Services | 22 (30.1%) | 51 (69.9%) |
| Health Care & Social Assistance | 10 (12.5%) | 70 (87.5%) |
| Arts, Entertainment & Recreation | 16 (100.0%) | 0 (0.0%) |
| Accommodation & Food Services | 6 (85.7%) | 1 (14.3%) |
| Public Administration | 17 (89.5%) | 2 (10.5%) |
| Total | 328 (59.7%) | 221 (40.3%) |
Education in Creighton
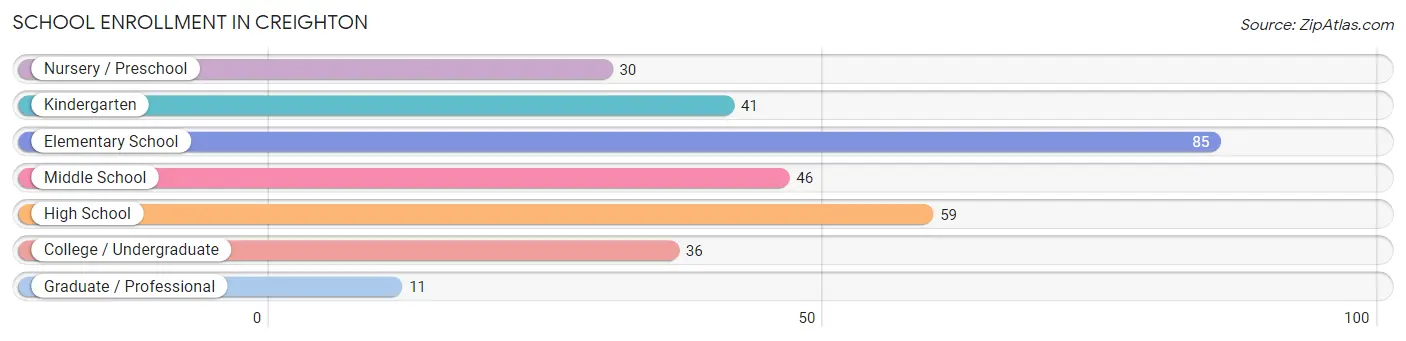
School Enrollment in Creighton
The most common levels of schooling among the 308 students in Creighton are elementary school (85 | 27.6%), high school (59 | 19.2%), and middle school (46 | 14.9%).
| School Level | # Students | % Students |
| Nursery / Preschool | 30 | 9.7% |
| Kindergarten | 41 | 13.3% |
| Elementary School | 85 | 27.6% |
| Middle School | 46 | 14.9% |
| High School | 59 | 19.2% |
| College / Undergraduate | 36 | 11.7% |
| Graduate / Professional | 11 | 3.6% |
| Total | 308 | 100.0% |
School Enrollment by Age by Funding Source in Creighton
Out of a total of 308 students who are enrolled in schools in Creighton, 136 (44.2%) attend a private institution, while the remaining 172 (55.8%) are enrolled in public schools. The age group of 3 to 4 year olds has the highest likelihood of being enrolled in private schools, with 10 (100.0% in the age bracket) enrolled. Conversely, the age group of 15 to 17 year olds has the lowest likelihood of being enrolled in a private school, with 53 (100.0% in the age bracket) attending a public institution.
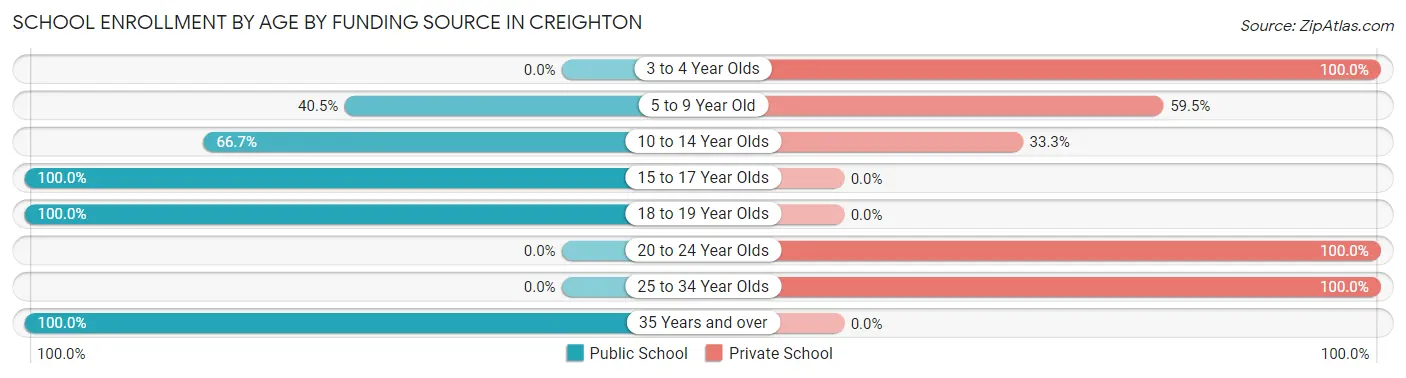
| Age Bracket | Public School | Private School |
| 3 to 4 Year Olds | 0 (0.0%) | 10 (100.0%) |
| 5 to 9 Year Old | 51 (40.5%) | 75 (59.5%) |
| 10 to 14 Year Olds | 48 (66.7%) | 24 (33.3%) |
| 15 to 17 Year Olds | 53 (100.0%) | 0 (0.0%) |
| 18 to 19 Year Olds | 11 (100.0%) | 0 (0.0%) |
| 20 to 24 Year Olds | 0 (0.0%) | 16 (100.0%) |
| 25 to 34 Year Olds | 0 (0.0%) | 11 (100.0%) |
| 35 Years and over | 9 (100.0%) | 0 (0.0%) |
| Total | 172 (55.8%) | 136 (44.2%) |
Educational Attainment by Field of Study in Creighton
Education (67 | 42.7%), business (29 | 18.5%), science & technology (24 | 15.3%), arts & humanities (11 | 7.0%), and bio, nature & agricultural (9 | 5.7%) are the most common fields of study among 157 individuals in Creighton who have obtained a bachelor's degree or higher.
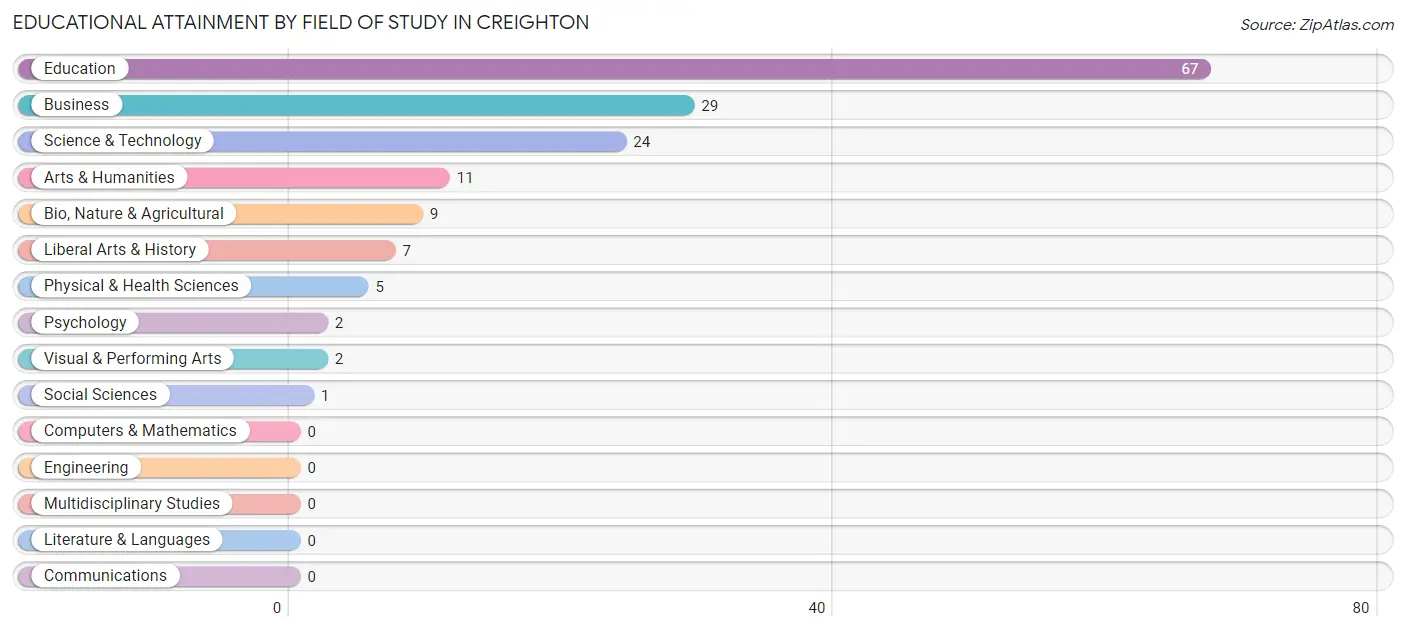
| Field of Study | # Graduates | % Graduates |
| Computers & Mathematics | 0 | 0.0% |
| Bio, Nature & Agricultural | 9 | 5.7% |
| Physical & Health Sciences | 5 | 3.2% |
| Psychology | 2 | 1.3% |
| Social Sciences | 1 | 0.6% |
| Engineering | 0 | 0.0% |
| Multidisciplinary Studies | 0 | 0.0% |
| Science & Technology | 24 | 15.3% |
| Business | 29 | 18.5% |
| Education | 67 | 42.7% |
| Literature & Languages | 0 | 0.0% |
| Liberal Arts & History | 7 | 4.5% |
| Visual & Performing Arts | 2 | 1.3% |
| Communications | 0 | 0.0% |
| Arts & Humanities | 11 | 7.0% |
| Total | 157 | 100.0% |
Transportation & Commute in Creighton
Vehicle Availability by Sex in Creighton
The most prevalent vehicle ownership categories in Creighton are males with 2 vehicles (106, accounting for 33.8%) and females with 2 vehicles (58, making up 48.2%).
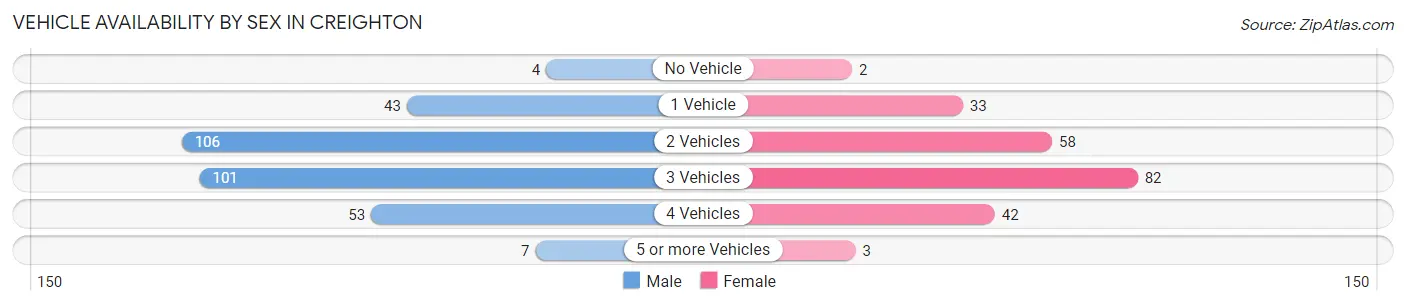
| Vehicles Available | Male | Female |
| No Vehicle | 4 (1.3%) | 2 (0.9%) |
| 1 Vehicle | 43 (13.7%) | 33 (15.0%) |
| 2 Vehicles | 106 (33.8%) | 58 (26.4%) |
| 3 Vehicles | 101 (32.2%) | 82 (37.3%) |
| 4 Vehicles | 53 (16.9%) | 42 (19.1%) |
| 5 or more Vehicles | 7 (2.2%) | 3 (1.4%) |
| Total | 314 (100.0%) | 220 (100.0%) |
Commute Time in Creighton
The most frequently occuring commute durations in Creighton are 5 to 9 minutes (122 commuters, 23.7%), less than 5 minutes (101 commuters, 19.7%), and 10 to 14 minutes (86 commuters, 16.7%).
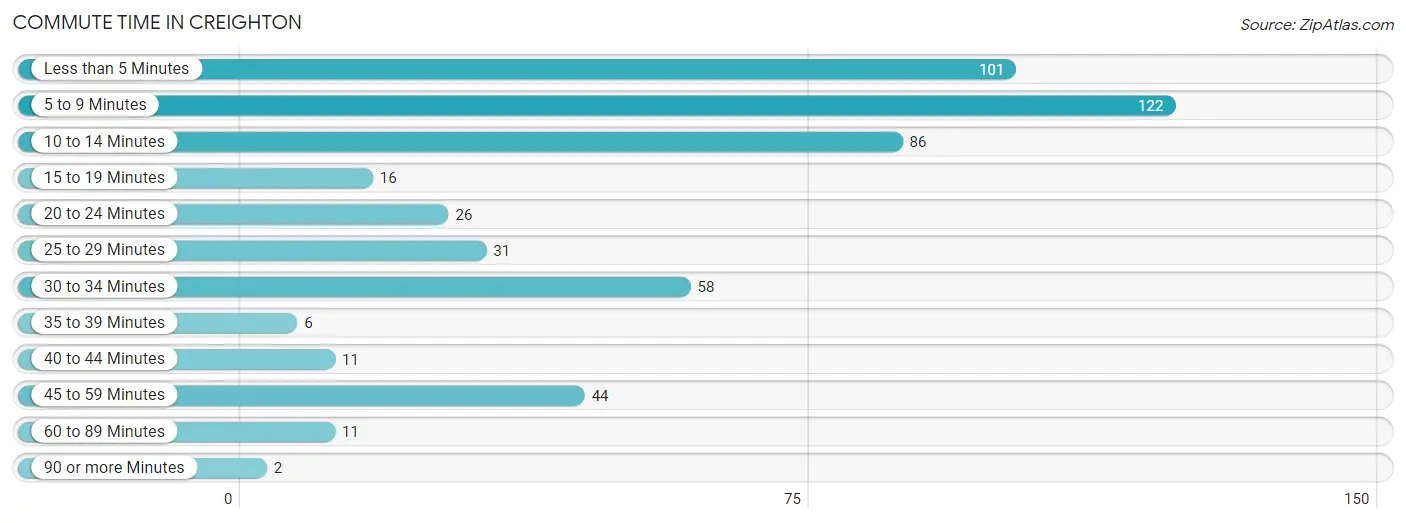
| Commute Time | # Commuters | % Commuters |
| Less than 5 Minutes | 101 | 19.7% |
| 5 to 9 Minutes | 122 | 23.7% |
| 10 to 14 Minutes | 86 | 16.7% |
| 15 to 19 Minutes | 16 | 3.1% |
| 20 to 24 Minutes | 26 | 5.1% |
| 25 to 29 Minutes | 31 | 6.0% |
| 30 to 34 Minutes | 58 | 11.3% |
| 35 to 39 Minutes | 6 | 1.2% |
| 40 to 44 Minutes | 11 | 2.1% |
| 45 to 59 Minutes | 44 | 8.6% |
| 60 to 89 Minutes | 11 | 2.1% |
| 90 or more Minutes | 2 | 0.4% |
Commute Time by Sex in Creighton
The most common commute times in Creighton are 5 to 9 minutes (74 commuters, 24.5%) for males and 5 to 9 minutes (48 commuters, 22.6%) for females.
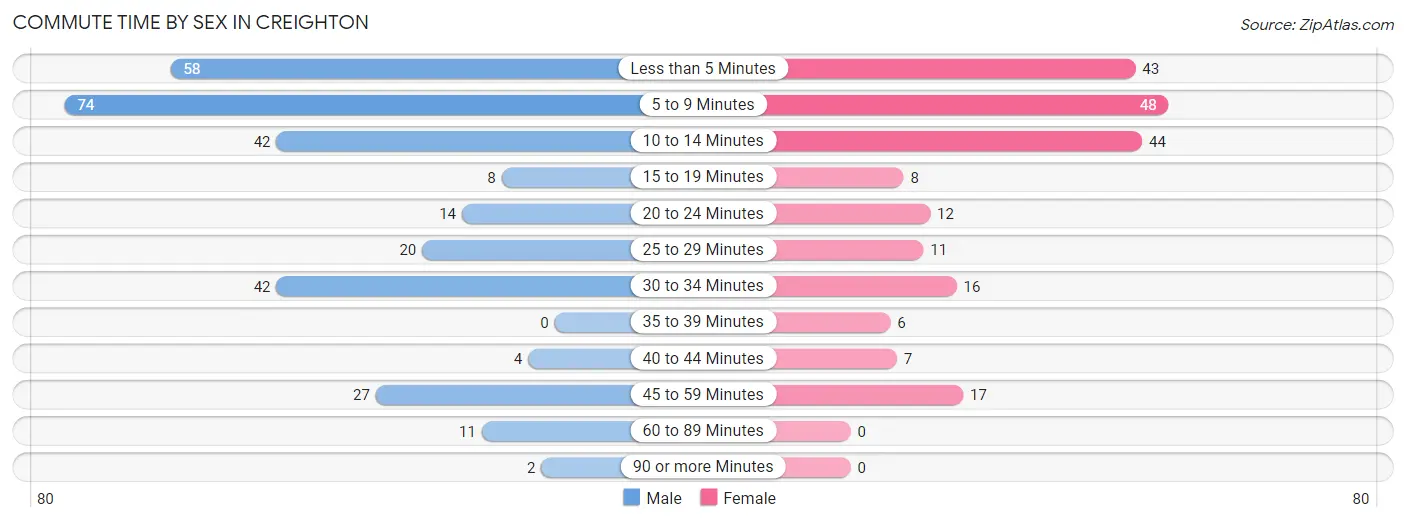
| Commute Time | Male | Female |
| Less than 5 Minutes | 58 (19.2%) | 43 (20.3%) |
| 5 to 9 Minutes | 74 (24.5%) | 48 (22.6%) |
| 10 to 14 Minutes | 42 (13.9%) | 44 (20.7%) |
| 15 to 19 Minutes | 8 (2.6%) | 8 (3.8%) |
| 20 to 24 Minutes | 14 (4.6%) | 12 (5.7%) |
| 25 to 29 Minutes | 20 (6.6%) | 11 (5.2%) |
| 30 to 34 Minutes | 42 (13.9%) | 16 (7.5%) |
| 35 to 39 Minutes | 0 (0.0%) | 6 (2.8%) |
| 40 to 44 Minutes | 4 (1.3%) | 7 (3.3%) |
| 45 to 59 Minutes | 27 (8.9%) | 17 (8.0%) |
| 60 to 89 Minutes | 11 (3.6%) | 0 (0.0%) |
| 90 or more Minutes | 2 (0.7%) | 0 (0.0%) |
Time of Departure to Work by Sex in Creighton
The most frequent times of departure to work in Creighton are 7:30 AM to 7:59 AM (66, 21.8%) for males and 7:30 AM to 7:59 AM (58, 27.4%) for females.
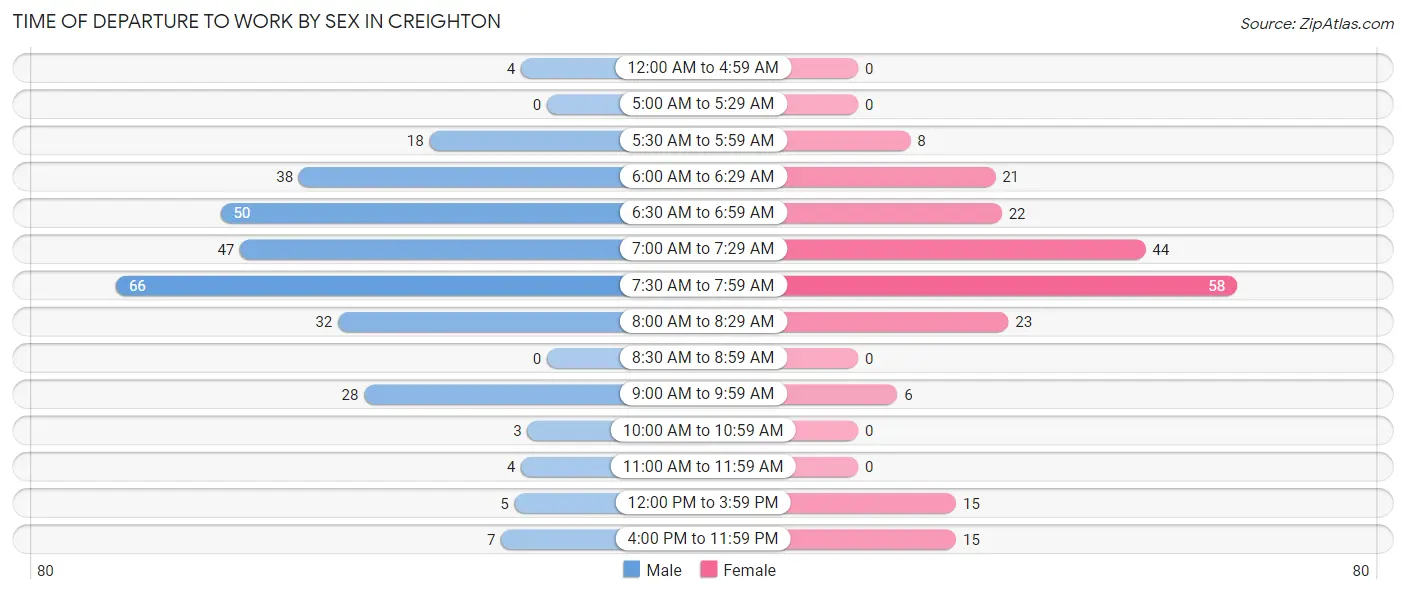
| Time of Departure | Male | Female |
| 12:00 AM to 4:59 AM | 4 (1.3%) | 0 (0.0%) |
| 5:00 AM to 5:29 AM | 0 (0.0%) | 0 (0.0%) |
| 5:30 AM to 5:59 AM | 18 (6.0%) | 8 (3.8%) |
| 6:00 AM to 6:29 AM | 38 (12.6%) | 21 (9.9%) |
| 6:30 AM to 6:59 AM | 50 (16.6%) | 22 (10.4%) |
| 7:00 AM to 7:29 AM | 47 (15.6%) | 44 (20.7%) |
| 7:30 AM to 7:59 AM | 66 (21.8%) | 58 (27.4%) |
| 8:00 AM to 8:29 AM | 32 (10.6%) | 23 (10.8%) |
| 8:30 AM to 8:59 AM | 0 (0.0%) | 0 (0.0%) |
| 9:00 AM to 9:59 AM | 28 (9.3%) | 6 (2.8%) |
| 10:00 AM to 10:59 AM | 3 (1.0%) | 0 (0.0%) |
| 11:00 AM to 11:59 AM | 4 (1.3%) | 0 (0.0%) |
| 12:00 PM to 3:59 PM | 5 (1.7%) | 15 (7.1%) |
| 4:00 PM to 11:59 PM | 7 (2.3%) | 15 (7.1%) |
| Total | 302 (100.0%) | 212 (100.0%) |
Housing Occupancy in Creighton
Occupancy by Ownership in Creighton
Of the total 499 dwellings in Creighton, owner-occupied units account for 381 (76.3%), while renter-occupied units make up 118 (23.6%).
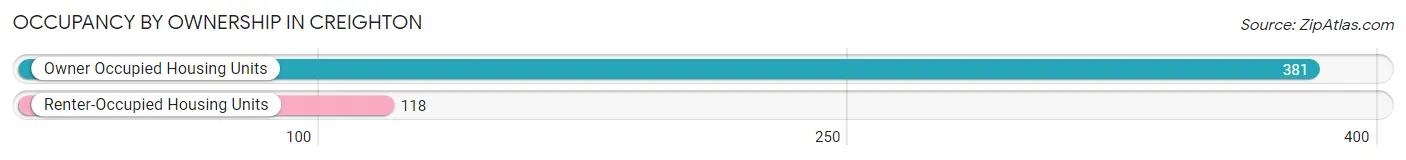
| Occupancy | # Housing Units | % Housing Units |
| Owner Occupied Housing Units | 381 | 76.3% |
| Renter-Occupied Housing Units | 118 | 23.6% |
| Total Occupied Housing Units | 499 | 100.0% |
Occupancy by Household Size in Creighton
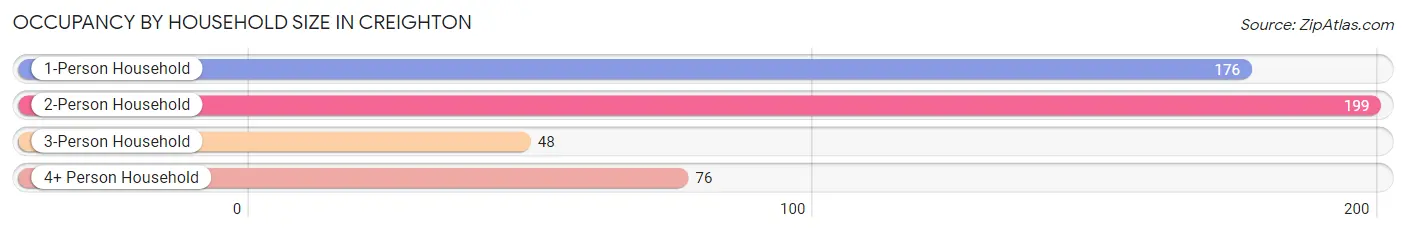
| Household Size | # Housing Units | % Housing Units |
| 1-Person Household | 176 | 35.3% |
| 2-Person Household | 199 | 39.9% |
| 3-Person Household | 48 | 9.6% |
| 4+ Person Household | 76 | 15.2% |
| Total Housing Units | 499 | 100.0% |
Occupancy by Ownership by Household Size in Creighton
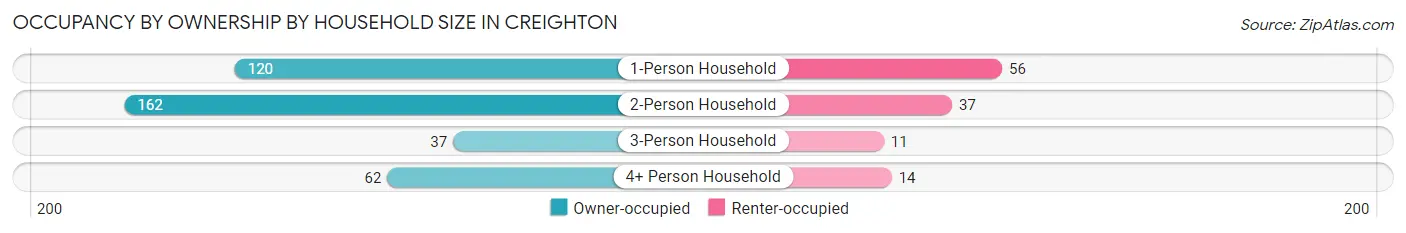
| Household Size | Owner-occupied | Renter-occupied |
| 1-Person Household | 120 (68.2%) | 56 (31.8%) |
| 2-Person Household | 162 (81.4%) | 37 (18.6%) |
| 3-Person Household | 37 (77.1%) | 11 (22.9%) |
| 4+ Person Household | 62 (81.6%) | 14 (18.4%) |
| Total Housing Units | 381 (76.3%) | 118 (23.6%) |
Occupancy by Educational Attainment in Creighton
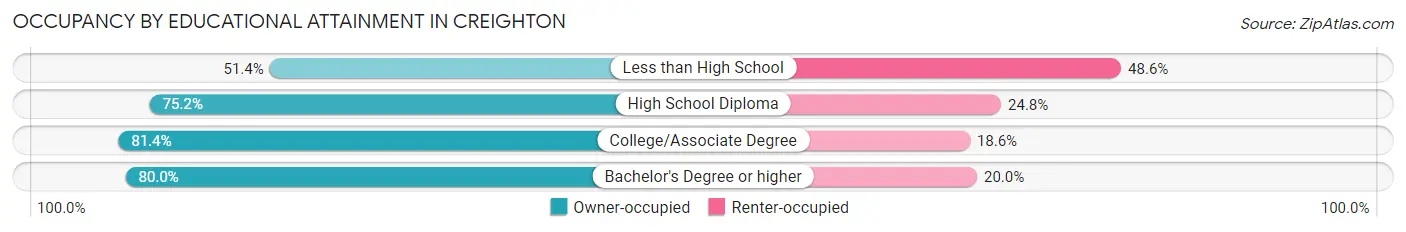
| Household Size | Owner-occupied | Renter-occupied |
| Less than High School | 18 (51.4%) | 17 (48.6%) |
| High School Diploma | 164 (75.2%) | 54 (24.8%) |
| College/Associate Degree | 127 (81.4%) | 29 (18.6%) |
| Bachelor's Degree or higher | 72 (80.0%) | 18 (20.0%) |
Occupancy by Age of Householder in Creighton
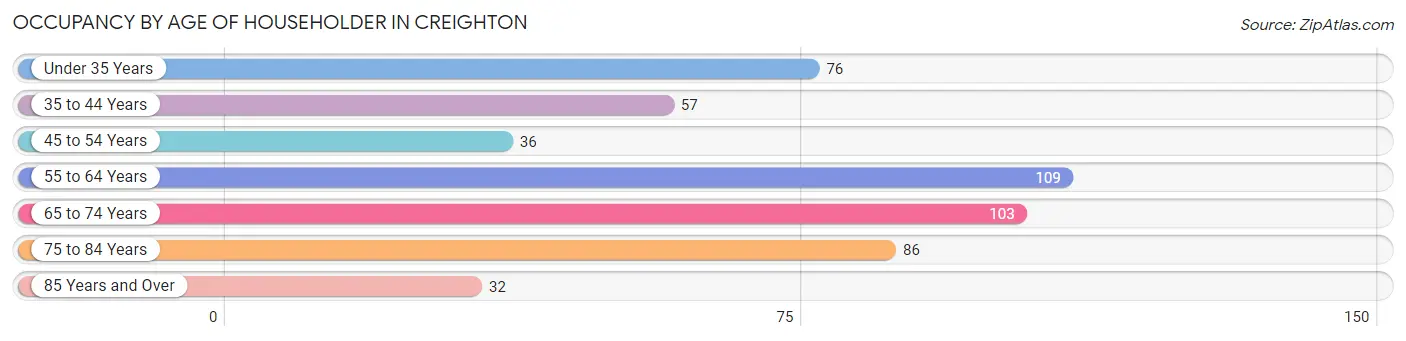
| Age Bracket | # Households | % Households |
| Under 35 Years | 76 | 15.2% |
| 35 to 44 Years | 57 | 11.4% |
| 45 to 54 Years | 36 | 7.2% |
| 55 to 64 Years | 109 | 21.8% |
| 65 to 74 Years | 103 | 20.6% |
| 75 to 84 Years | 86 | 17.2% |
| 85 Years and Over | 32 | 6.4% |
| Total | 499 | 100.0% |
Housing Finances in Creighton
Median Income by Occupancy in Creighton
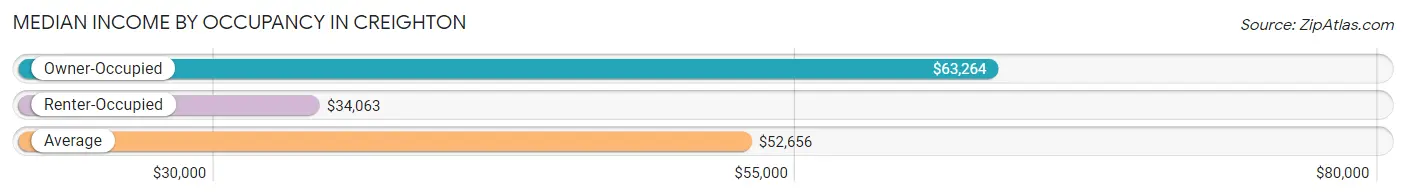
| Occupancy Type | # Households | Median Income |
| Owner-Occupied | 381 (76.3%) | $63,264 |
| Renter-Occupied | 118 (23.6%) | $34,063 |
| Average | 499 (100.0%) | $52,656 |
Occupancy by Householder Income Bracket in Creighton
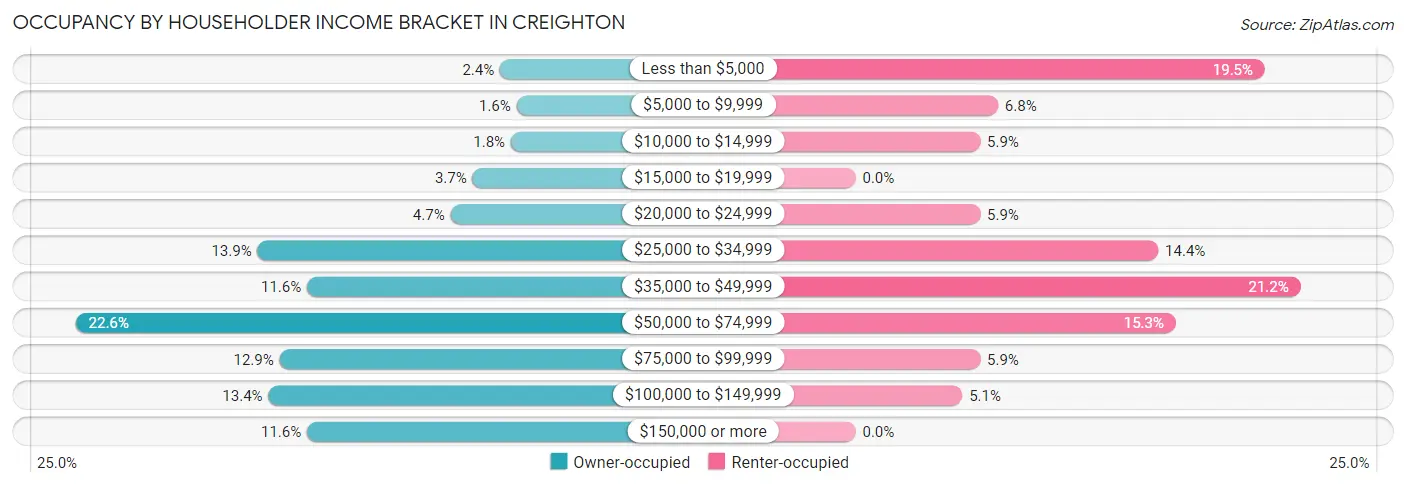
| Income Bracket | Owner-occupied | Renter-occupied |
| Less than $5,000 | 9 (2.4%) | 23 (19.5%) |
| $5,000 to $9,999 | 6 (1.6%) | 8 (6.8%) |
| $10,000 to $14,999 | 7 (1.8%) | 7 (5.9%) |
| $15,000 to $19,999 | 14 (3.7%) | 0 (0.0%) |
| $20,000 to $24,999 | 18 (4.7%) | 7 (5.9%) |
| $25,000 to $34,999 | 53 (13.9%) | 17 (14.4%) |
| $35,000 to $49,999 | 44 (11.6%) | 25 (21.2%) |
| $50,000 to $74,999 | 86 (22.6%) | 18 (15.2%) |
| $75,000 to $99,999 | 49 (12.9%) | 7 (5.9%) |
| $100,000 to $149,999 | 51 (13.4%) | 6 (5.1%) |
| $150,000 or more | 44 (11.6%) | 0 (0.0%) |
| Total | 381 (100.0%) | 118 (100.0%) |
Monthly Housing Cost Tiers in Creighton
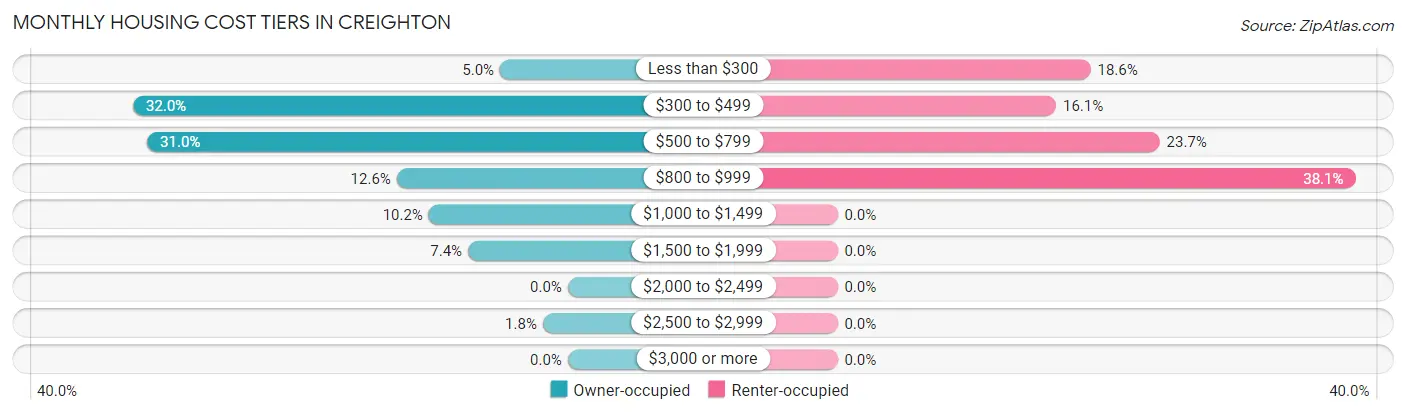
| Monthly Cost | Owner-occupied | Renter-occupied |
| Less than $300 | 19 (5.0%) | 22 (18.6%) |
| $300 to $499 | 122 (32.0%) | 19 (16.1%) |
| $500 to $799 | 118 (31.0%) | 28 (23.7%) |
| $800 to $999 | 48 (12.6%) | 45 (38.1%) |
| $1,000 to $1,499 | 39 (10.2%) | 0 (0.0%) |
| $1,500 to $1,999 | 28 (7.3%) | 0 (0.0%) |
| $2,000 to $2,499 | 0 (0.0%) | 0 (0.0%) |
| $2,500 to $2,999 | 7 (1.8%) | 0 (0.0%) |
| $3,000 or more | 0 (0.0%) | 0 (0.0%) |
| Total | 381 (100.0%) | 118 (100.0%) |
Physical Housing Characteristics in Creighton
Housing Structures in Creighton
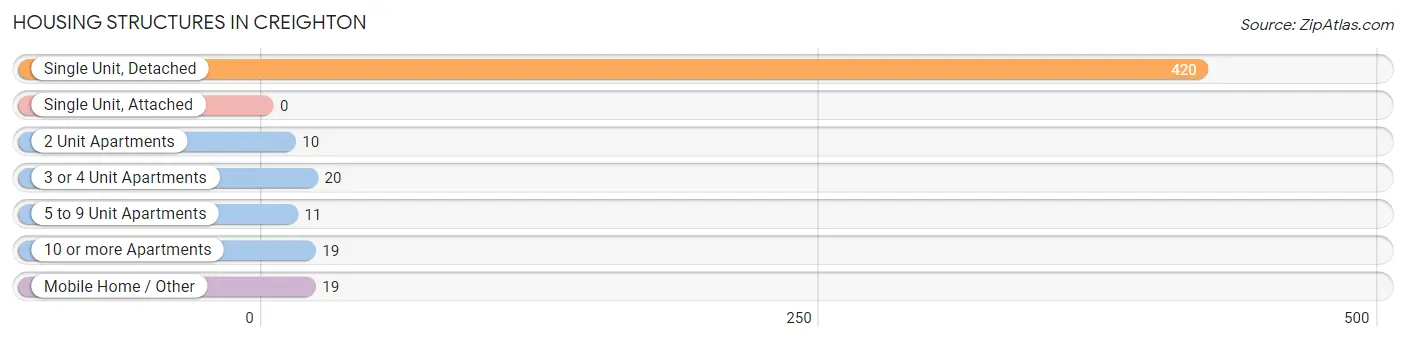
| Structure Type | # Housing Units | % Housing Units |
| Single Unit, Detached | 420 | 84.2% |
| Single Unit, Attached | 0 | 0.0% |
| 2 Unit Apartments | 10 | 2.0% |
| 3 or 4 Unit Apartments | 20 | 4.0% |
| 5 to 9 Unit Apartments | 11 | 2.2% |
| 10 or more Apartments | 19 | 3.8% |
| Mobile Home / Other | 19 | 3.8% |
| Total | 499 | 100.0% |
Housing Structures by Occupancy in Creighton
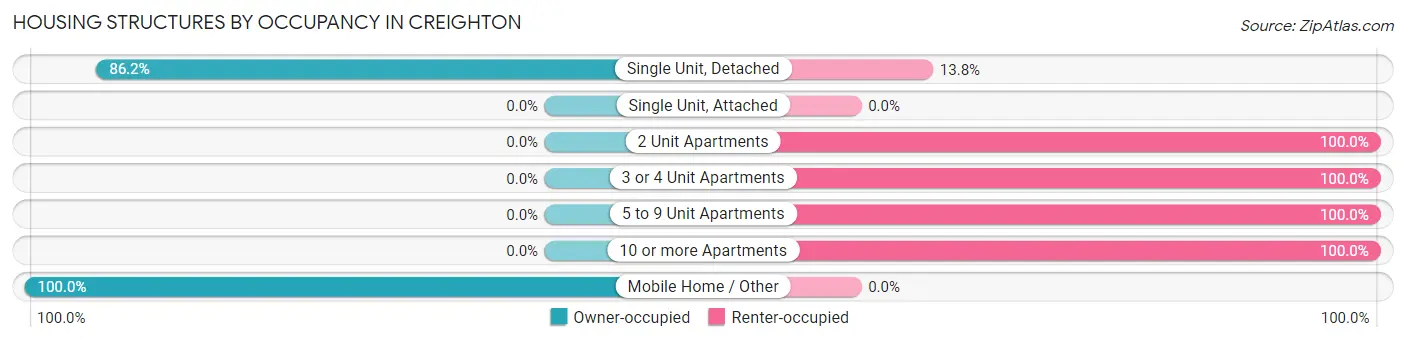
| Structure Type | Owner-occupied | Renter-occupied |
| Single Unit, Detached | 362 (86.2%) | 58 (13.8%) |
| Single Unit, Attached | 0 (0.0%) | 0 (0.0%) |
| 2 Unit Apartments | 0 (0.0%) | 10 (100.0%) |
| 3 or 4 Unit Apartments | 0 (0.0%) | 20 (100.0%) |
| 5 to 9 Unit Apartments | 0 (0.0%) | 11 (100.0%) |
| 10 or more Apartments | 0 (0.0%) | 19 (100.0%) |
| Mobile Home / Other | 19 (100.0%) | 0 (0.0%) |
| Total | 381 (76.3%) | 118 (23.6%) |
Housing Structures by Number of Rooms in Creighton
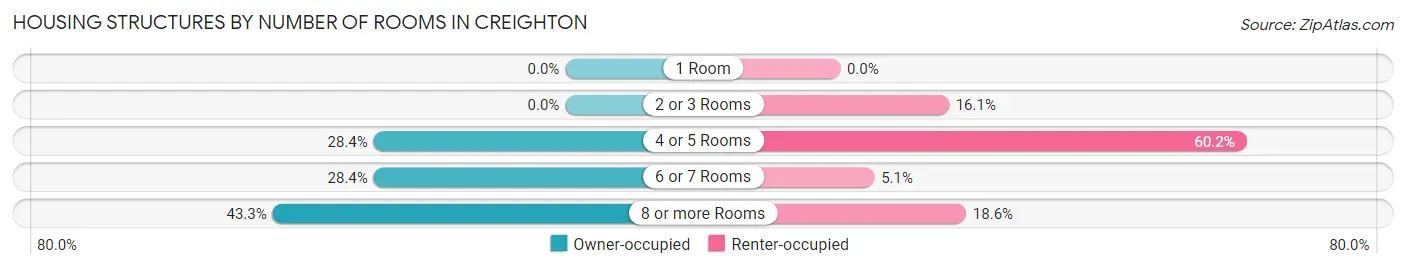
| Number of Rooms | Owner-occupied | Renter-occupied |
| 1 Room | 0 (0.0%) | 0 (0.0%) |
| 2 or 3 Rooms | 0 (0.0%) | 19 (16.1%) |
| 4 or 5 Rooms | 108 (28.3%) | 71 (60.2%) |
| 6 or 7 Rooms | 108 (28.3%) | 6 (5.1%) |
| 8 or more Rooms | 165 (43.3%) | 22 (18.6%) |
| Total | 381 (100.0%) | 118 (100.0%) |
Housing Structure by Heating Type in Creighton
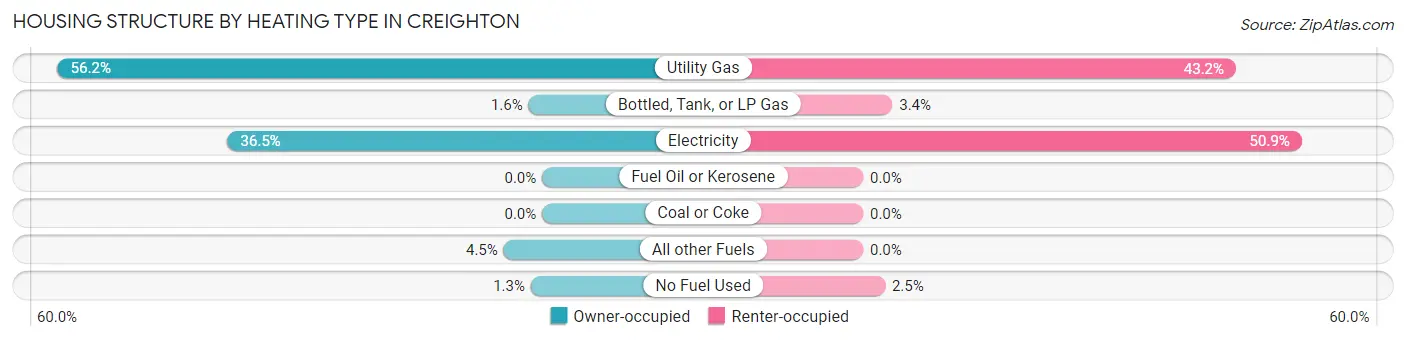
| Heating Type | Owner-occupied | Renter-occupied |
| Utility Gas | 214 (56.2%) | 51 (43.2%) |
| Bottled, Tank, or LP Gas | 6 (1.6%) | 4 (3.4%) |
| Electricity | 139 (36.5%) | 60 (50.8%) |
| Fuel Oil or Kerosene | 0 (0.0%) | 0 (0.0%) |
| Coal or Coke | 0 (0.0%) | 0 (0.0%) |
| All other Fuels | 17 (4.5%) | 0 (0.0%) |
| No Fuel Used | 5 (1.3%) | 3 (2.5%) |
| Total | 381 (100.0%) | 118 (100.0%) |
Household Vehicle Usage in Creighton
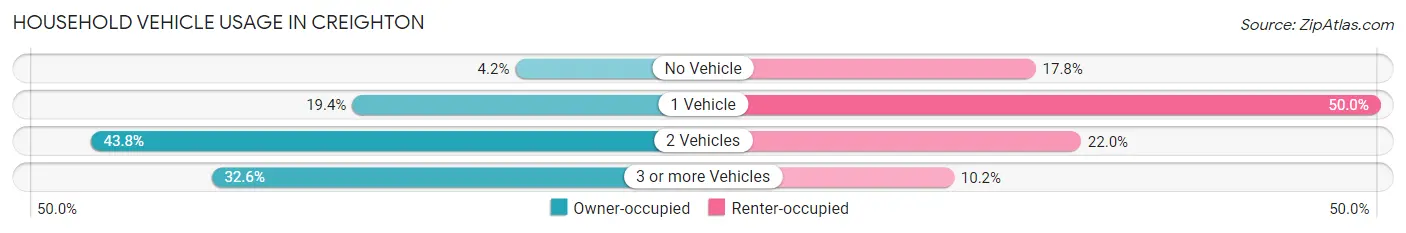
| Vehicles per Household | Owner-occupied | Renter-occupied |
| No Vehicle | 16 (4.2%) | 21 (17.8%) |
| 1 Vehicle | 74 (19.4%) | 59 (50.0%) |
| 2 Vehicles | 167 (43.8%) | 26 (22.0%) |
| 3 or more Vehicles | 124 (32.6%) | 12 (10.2%) |
| Total | 381 (100.0%) | 118 (100.0%) |
Real Estate & Mortgages in Creighton
Real Estate and Mortgage Overview in Creighton
| Characteristic | Without Mortgage | With Mortgage |
| Housing Units | 261 | 120 |
| Median Property Value | $96,600 | $137,500 |
| Median Household Income | $52,083 | $32 |
| Monthly Housing Costs | $501 | $0 |
| Real Estate Taxes | $962 | $3 |
Property Value by Mortgage Status in Creighton
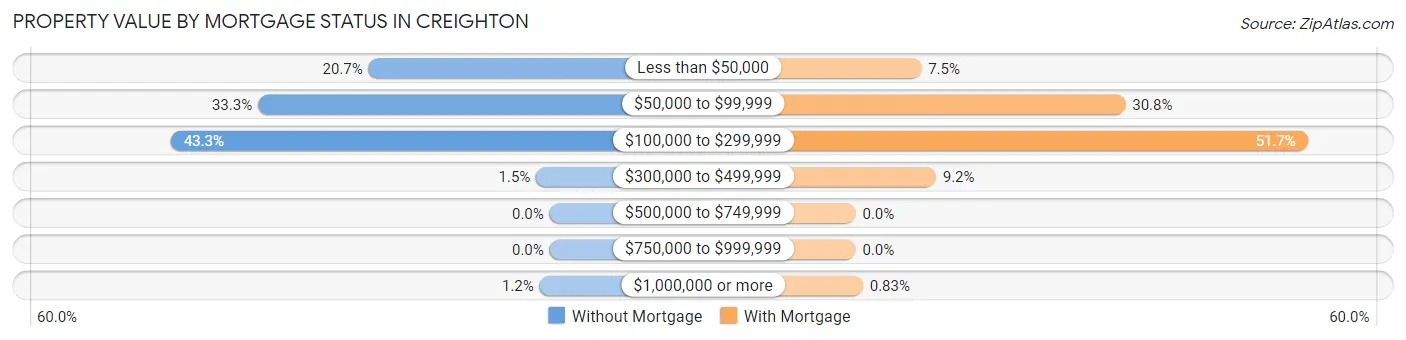
| Property Value | Without Mortgage | With Mortgage |
| Less than $50,000 | 54 (20.7%) | 9 (7.5%) |
| $50,000 to $99,999 | 87 (33.3%) | 37 (30.8%) |
| $100,000 to $299,999 | 113 (43.3%) | 62 (51.7%) |
| $300,000 to $499,999 | 4 (1.5%) | 11 (9.2%) |
| $500,000 to $749,999 | 0 (0.0%) | 0 (0.0%) |
| $750,000 to $999,999 | 0 (0.0%) | 0 (0.0%) |
| $1,000,000 or more | 3 (1.1%) | 1 (0.8%) |
| Total | 261 (100.0%) | 120 (100.0%) |
Household Income by Mortgage Status in Creighton
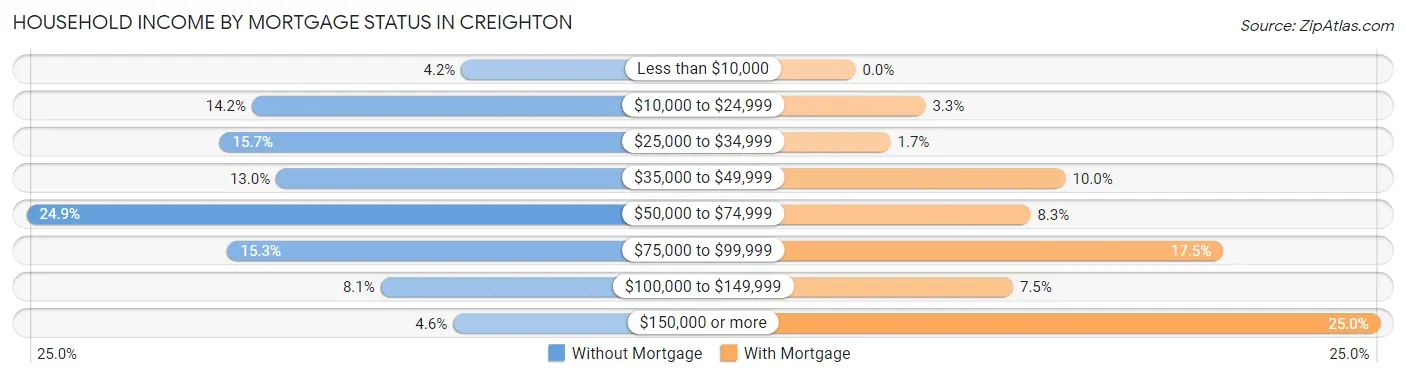
| Household Income | Without Mortgage | With Mortgage |
| Less than $10,000 | 11 (4.2%) | 0 (0.0%) |
| $10,000 to $24,999 | 37 (14.2%) | 4 (3.3%) |
| $25,000 to $34,999 | 41 (15.7%) | 2 (1.7%) |
| $35,000 to $49,999 | 34 (13.0%) | 12 (10.0%) |
| $50,000 to $74,999 | 65 (24.9%) | 10 (8.3%) |
| $75,000 to $99,999 | 40 (15.3%) | 21 (17.5%) |
| $100,000 to $149,999 | 21 (8.1%) | 9 (7.5%) |
| $150,000 or more | 12 (4.6%) | 30 (25.0%) |
| Total | 261 (100.0%) | 120 (100.0%) |
Property Value to Household Income Ratio in Creighton
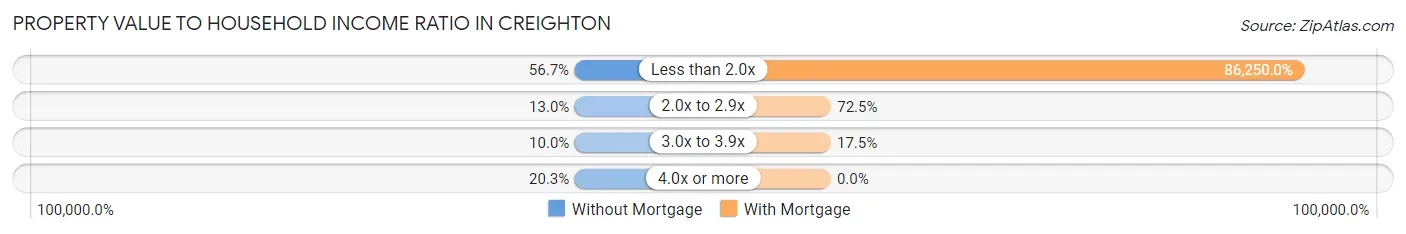
| Value-to-Income Ratio | Without Mortgage | With Mortgage |
| Less than 2.0x | 148 (56.7%) | 103,500 (86,250.0%) |
| 2.0x to 2.9x | 34 (13.0%) | 87 (72.5%) |
| 3.0x to 3.9x | 26 (10.0%) | 21 (17.5%) |
| 4.0x or more | 53 (20.3%) | 0 (0.0%) |
| Total | 261 (100.0%) | 120 (100.0%) |
Real Estate Taxes by Mortgage Status in Creighton
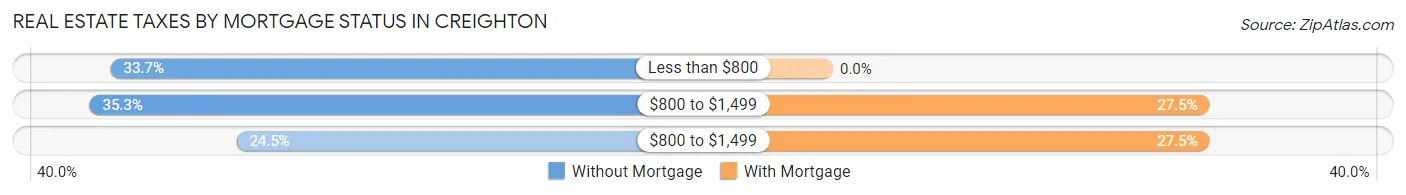
| Property Taxes | Without Mortgage | With Mortgage |
| Less than $800 | 88 (33.7%) | 0 (0.0%) |
| $800 to $1,499 | 92 (35.2%) | 33 (27.5%) |
| $800 to $1,499 | 64 (24.5%) | 33 (27.5%) |
| Total | 261 (100.0%) | 120 (100.0%) |
Health & Disability in Creighton
Health Insurance Coverage by Age in Creighton
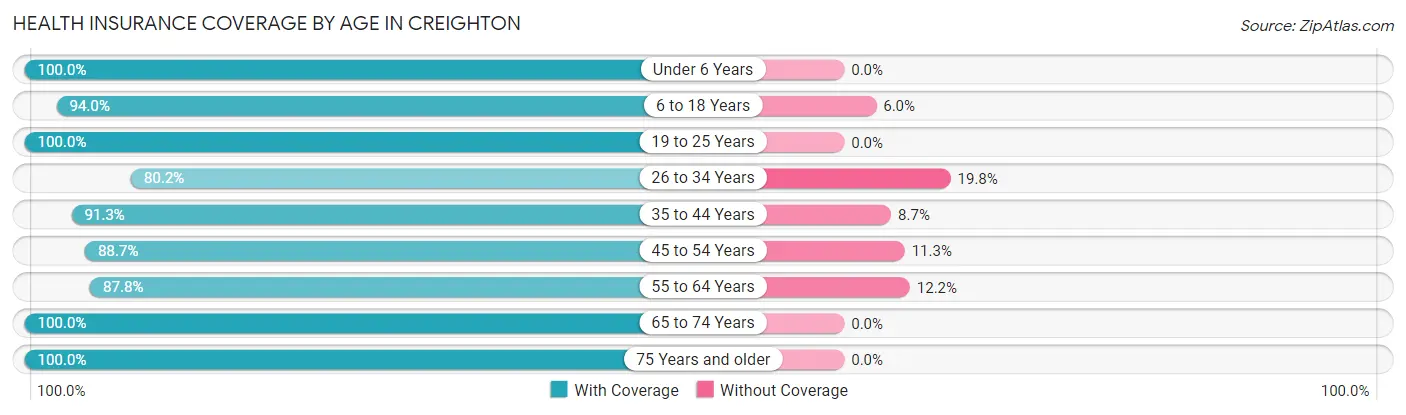
| Age Bracket | With Coverage | Without Coverage |
| Under 6 Years | 112 (100.0%) | 0 (0.0%) |
| 6 to 18 Years | 205 (94.0%) | 13 (6.0%) |
| 19 to 25 Years | 73 (100.0%) | 0 (0.0%) |
| 26 to 34 Years | 93 (80.2%) | 23 (19.8%) |
| 35 to 44 Years | 94 (91.3%) | 9 (8.7%) |
| 45 to 54 Years | 63 (88.7%) | 8 (11.3%) |
| 55 to 64 Years | 165 (87.8%) | 23 (12.2%) |
| 65 to 74 Years | 150 (100.0%) | 0 (0.0%) |
| 75 Years and older | 172 (100.0%) | 0 (0.0%) |
| Total | 1,127 (93.7%) | 76 (6.3%) |
Health Insurance Coverage by Citizenship Status in Creighton
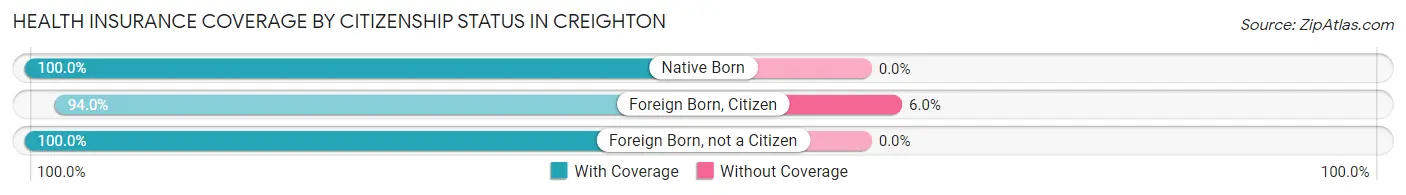
| Citizenship Status | With Coverage | Without Coverage |
| Native Born | 112 (100.0%) | 0 (0.0%) |
| Foreign Born, Citizen | 205 (94.0%) | 13 (6.0%) |
| Foreign Born, not a Citizen | 73 (100.0%) | 0 (0.0%) |
Health Insurance Coverage by Household Income in Creighton
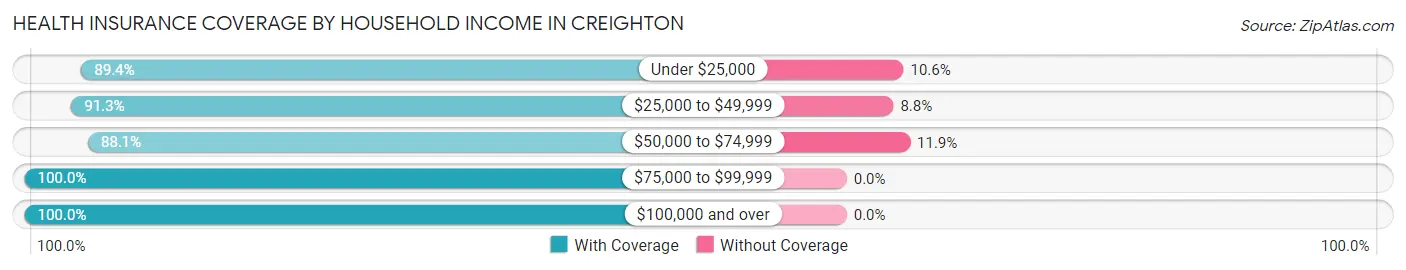
| Household Income | With Coverage | Without Coverage |
| Under $25,000 | 126 (89.4%) | 15 (10.6%) |
| $25,000 to $49,999 | 271 (91.2%) | 26 (8.7%) |
| $50,000 to $74,999 | 260 (88.1%) | 35 (11.9%) |
| $75,000 to $99,999 | 146 (100.0%) | 0 (0.0%) |
| $100,000 and over | 324 (100.0%) | 0 (0.0%) |
Public vs Private Health Insurance Coverage by Age in Creighton
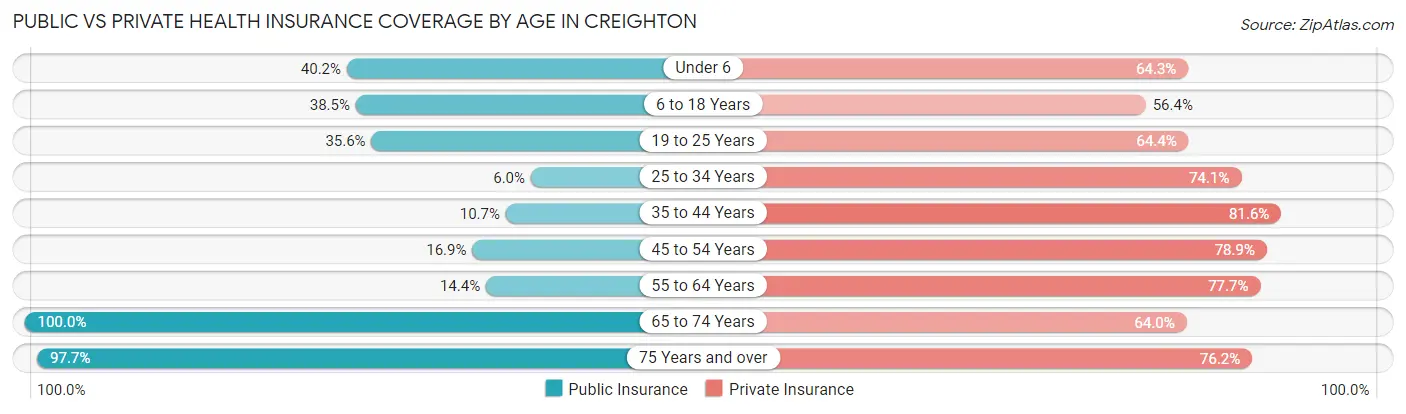
| Age Bracket | Public Insurance | Private Insurance |
| Under 6 | 45 (40.2%) | 72 (64.3%) |
| 6 to 18 Years | 84 (38.5%) | 123 (56.4%) |
| 19 to 25 Years | 26 (35.6%) | 47 (64.4%) |
| 25 to 34 Years | 7 (6.0%) | 86 (74.1%) |
| 35 to 44 Years | 11 (10.7%) | 84 (81.6%) |
| 45 to 54 Years | 12 (16.9%) | 56 (78.9%) |
| 55 to 64 Years | 27 (14.4%) | 146 (77.7%) |
| 65 to 74 Years | 150 (100.0%) | 96 (64.0%) |
| 75 Years and over | 168 (97.7%) | 131 (76.2%) |
| Total | 530 (44.1%) | 841 (69.9%) |
Disability Status by Sex by Age in Creighton
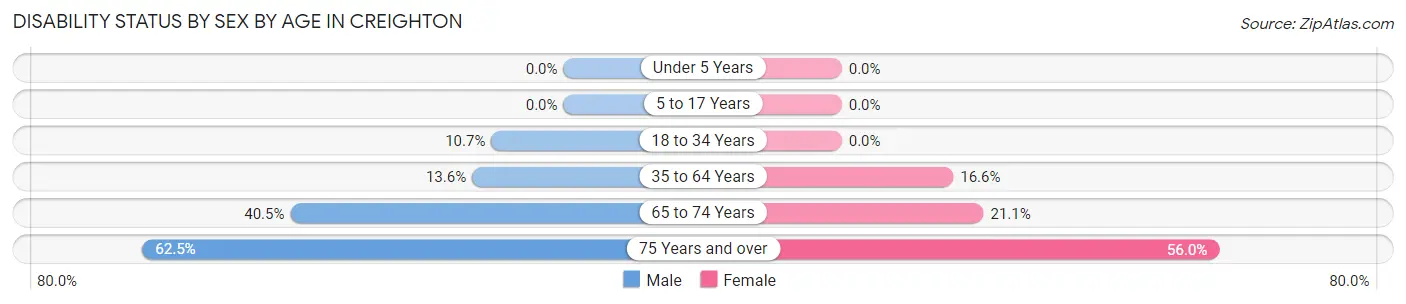
| Age Bracket | Male | Female |
| Under 5 Years | 0 (0.0%) | 0 (0.0%) |
| 5 to 17 Years | 0 (0.0%) | 0 (0.0%) |
| 18 to 34 Years | 12 (10.7%) | 0 (0.0%) |
| 35 to 64 Years | 27 (13.6%) | 27 (16.6%) |
| 65 to 74 Years | 30 (40.5%) | 16 (21.0%) |
| 75 Years and over | 35 (62.5%) | 65 (56.0%) |
Disability Class by Sex by Age in Creighton
Disability Class: Hearing Difficulty
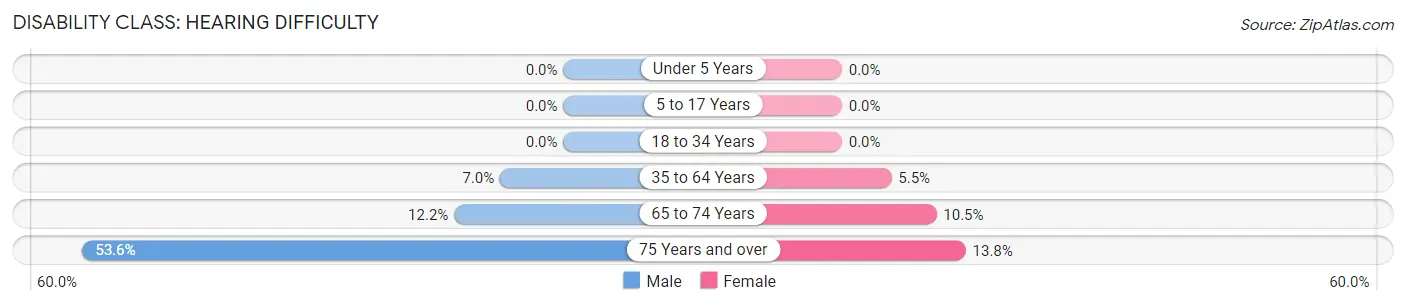
| Age Bracket | Male | Female |
| Under 5 Years | 0 (0.0%) | 0 (0.0%) |
| 5 to 17 Years | 0 (0.0%) | 0 (0.0%) |
| 18 to 34 Years | 0 (0.0%) | 0 (0.0%) |
| 35 to 64 Years | 14 (7.0%) | 9 (5.5%) |
| 65 to 74 Years | 9 (12.2%) | 8 (10.5%) |
| 75 Years and over | 30 (53.6%) | 16 (13.8%) |
Disability Class: Vision Difficulty
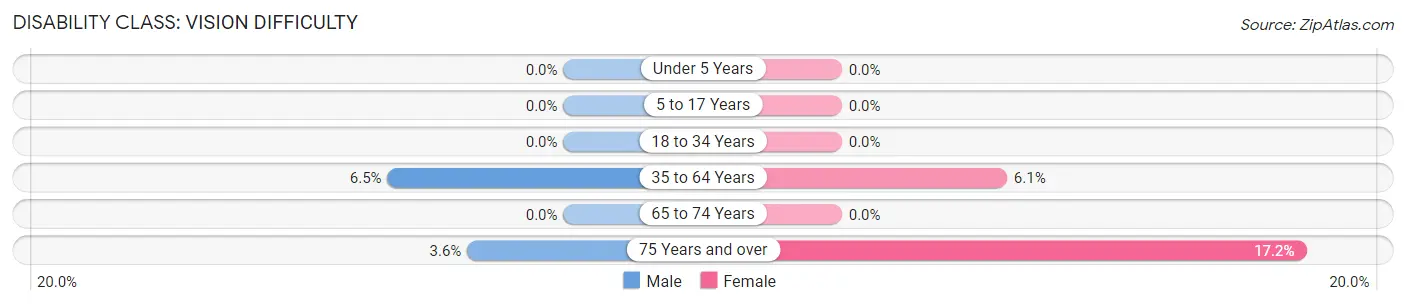
| Age Bracket | Male | Female |
| Under 5 Years | 0 (0.0%) | 0 (0.0%) |
| 5 to 17 Years | 0 (0.0%) | 0 (0.0%) |
| 18 to 34 Years | 0 (0.0%) | 0 (0.0%) |
| 35 to 64 Years | 13 (6.5%) | 10 (6.1%) |
| 65 to 74 Years | 0 (0.0%) | 0 (0.0%) |
| 75 Years and over | 2 (3.6%) | 20 (17.2%) |
Disability Class: Cognitive Difficulty
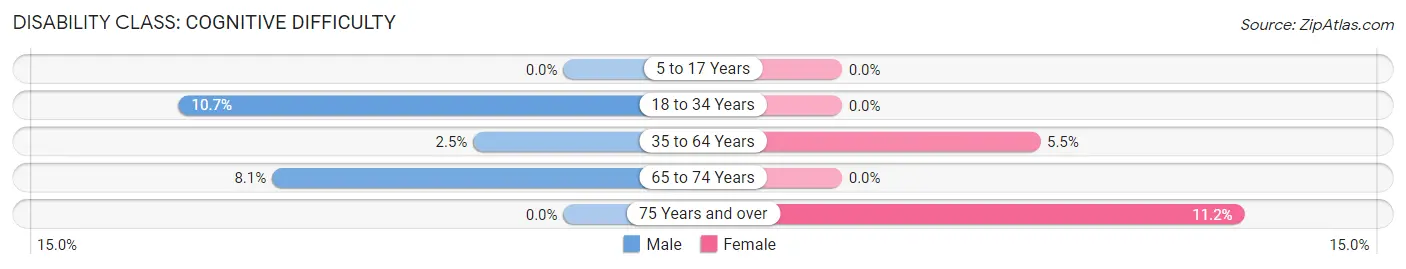
| Age Bracket | Male | Female |
| 5 to 17 Years | 0 (0.0%) | 0 (0.0%) |
| 18 to 34 Years | 12 (10.7%) | 0 (0.0%) |
| 35 to 64 Years | 5 (2.5%) | 9 (5.5%) |
| 65 to 74 Years | 6 (8.1%) | 0 (0.0%) |
| 75 Years and over | 0 (0.0%) | 13 (11.2%) |
Disability Class: Ambulatory Difficulty
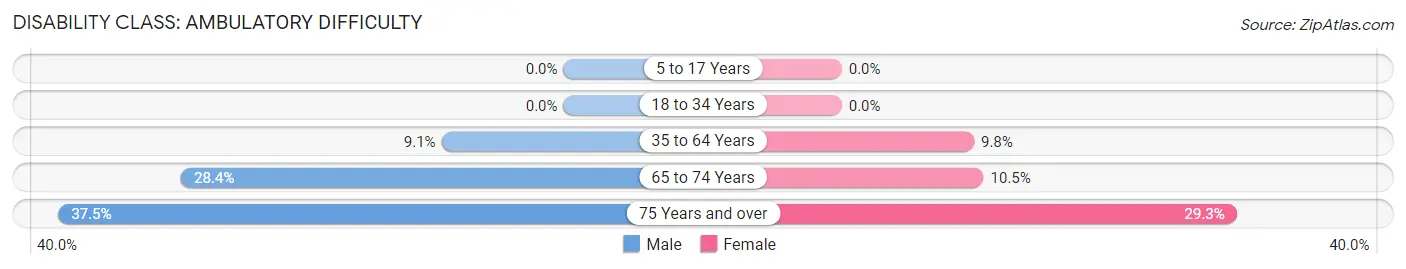
| Age Bracket | Male | Female |
| 5 to 17 Years | 0 (0.0%) | 0 (0.0%) |
| 18 to 34 Years | 0 (0.0%) | 0 (0.0%) |
| 35 to 64 Years | 18 (9.0%) | 16 (9.8%) |
| 65 to 74 Years | 21 (28.4%) | 8 (10.5%) |
| 75 Years and over | 21 (37.5%) | 34 (29.3%) |
Disability Class: Self-Care Difficulty
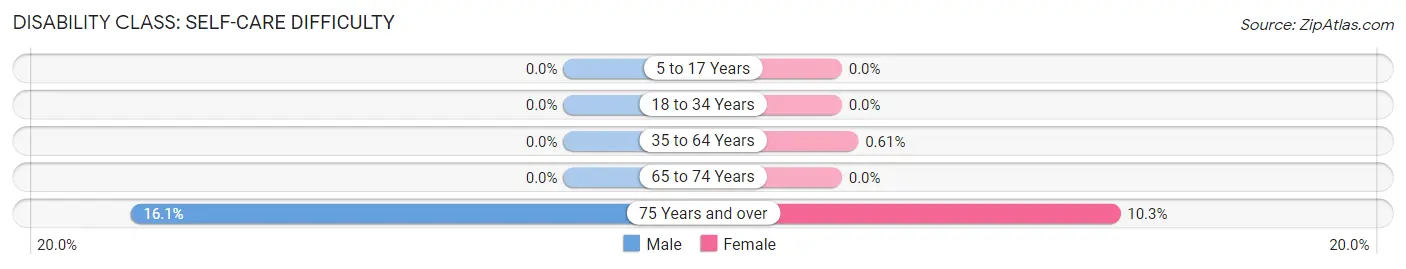
| Age Bracket | Male | Female |
| 5 to 17 Years | 0 (0.0%) | 0 (0.0%) |
| 18 to 34 Years | 0 (0.0%) | 0 (0.0%) |
| 35 to 64 Years | 0 (0.0%) | 1 (0.6%) |
| 65 to 74 Years | 0 (0.0%) | 0 (0.0%) |
| 75 Years and over | 9 (16.1%) | 12 (10.3%) |
Technology Access in Creighton
Computing Device Access in Creighton
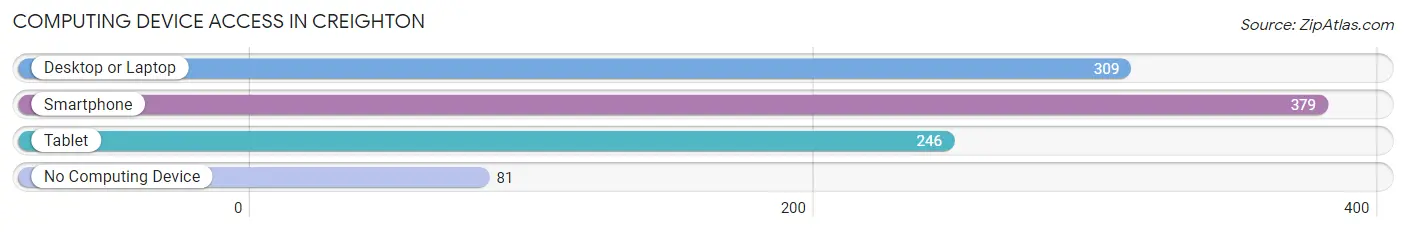
| Device Type | # Households | % Households |
| Desktop or Laptop | 309 | 61.9% |
| Smartphone | 379 | 75.9% |
| Tablet | 246 | 49.3% |
| No Computing Device | 81 | 16.2% |
| Total | 499 | 100.0% |
Internet Access in Creighton
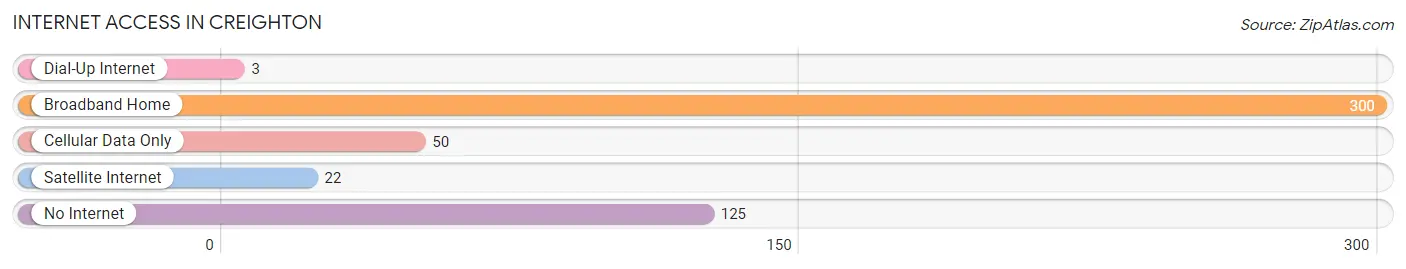
| Internet Type | # Households | % Households |
| Dial-Up Internet | 3 | 0.6% |
| Broadband Home | 300 | 60.1% |
| Cellular Data Only | 50 | 10.0% |
| Satellite Internet | 22 | 4.4% |
| No Internet | 125 | 25.1% |
| Total | 499 | 100.0% |
Creighton Summary
Creighton, Nebraska is a small city located in Knox County in the northeastern corner of the state. It is situated on the banks of the Missouri River, and is the county seat of Knox County. The city has a population of approximately 1,500 people, and is part of the Sioux City, Iowa-Nebraska-South Dakota metropolitan area.
History
Creighton was founded in 1871 by a group of settlers from Iowa and Nebraska. The city was named after the Reverend John Creighton, a Methodist minister who had been instrumental in the settlement of the area. The city was incorporated in 1887, and the first mayor was elected in 1888.
The city was an important stop on the Union Pacific Railroad, and the railroad was instrumental in the growth of the city. In the early 1900s, the city was a major center for the cattle industry, and the city was home to several large stockyards.
Geography
Creighton is located in the northeastern corner of Nebraska, on the banks of the Missouri River. The city is situated in the Loess Hills, a region of rolling hills and bluffs that were formed by wind-blown silt deposits. The city is located in the Central Plains region of the United States, and is part of the Great Plains region.
The city has a total area of 1.3 square miles, all of which is land. The city is located at an elevation of 1,637 feet above sea level.
Economy
The economy of Creighton is largely based on agriculture and manufacturing. The city is home to several large agricultural operations, including a large cattle ranch and a large dairy farm. The city is also home to several manufacturing companies, including a furniture manufacturer and a plastics manufacturer.
The city is also home to several retail stores, including a grocery store, a hardware store, and a clothing store. The city is also home to several restaurants, including a steakhouse and a Mexican restaurant.
Demographics
As of the 2010 census, the population of Creighton was 1,500 people. The racial makeup of the city was 97.3% White, 0.7% African American, 0.3% Native American, 0.3% Asian, 0.3% from other races, and 1.3% from two or more races. Hispanic or Latino of any race were 1.3% of the population.
The median income for a household in the city was $37,500, and the median income for a family was $45,000. The per capita income for the city was $18,000. About 11.3% of families and 14.3% of the population were below the poverty line, including 18.3% of those under age 18 and 8.3% of those age 65 or over.
Common Questions
What is Per Capita Income in Creighton?
Per Capita income in Creighton is $31,383.
What is the Median Family Income in Creighton?
Median Family Income in Creighton is $70,125.
What is the Median Household income in Creighton?
Median Household Income in Creighton is $52,656.
What is Income or Wage Gap in Creighton?
Income or Wage Gap in Creighton is 23.4%.
Women in Creighton earn 76.6 cents for every dollar earned by a man.
What is Family Income Deficit in Creighton?
Family Income Deficit in Creighton is $13,545.
Families that are below poverty line in Creighton earn $13,545 less on average than the poverty threshold level.
What is Inequality or Gini Index in Creighton?
Inequality or Gini Index in Creighton is 0.46.
What is the Total Population of Creighton?
Total Population of Creighton is 1,241.
What is the Total Male Population of Creighton?
Total Male Population of Creighton is 670.
What is the Total Female Population of Creighton?
Total Female Population of Creighton is 571.
What is the Ratio of Males per 100 Females in Creighton?
There are 117.34 Males per 100 Females in Creighton.
What is the Ratio of Females per 100 Males in Creighton?
There are 85.22 Females per 100 Males in Creighton.
What is the Median Population Age in Creighton?
Median Population Age in Creighton is 44.8 Years.
What is the Average Family Size in Creighton
Average Family Size in Creighton is 3.2 People.
What is the Average Household Size in Creighton
Average Household Size in Creighton is 2.4 People.
How Large is the Labor Force in Creighton?
There are 563 People in the Labor Forcein in Creighton.
What is the Percentage of People in the Labor Force in Creighton?
58.8% of People are in the Labor Force in Creighton.
What is the Unemployment Rate in Creighton?
Unemployment Rate in Creighton is 2.5%.