Crawford, NE Map & Demographics
Crawford Map
Crawford Overview
$27,364
PER CAPITA INCOME
$62,440
AVG FAMILY INCOME
$54,167
AVG HOUSEHOLD INCOME
41.3%
WAGE / INCOME GAP [ % ]
58.7¢/ $1
WAGE / INCOME GAP [ $ ]
$1,767
FAMILY INCOME DEFICIT
0.36
INEQUALITY / GINI INDEX
962
TOTAL POPULATION
435
MALE POPULATION
527
FEMALE POPULATION
82.54
MALES / 100 FEMALES
121.15
FEMALES / 100 MALES
52.1
MEDIAN AGE
2.9
AVG FAMILY SIZE
2.4
AVG HOUSEHOLD SIZE
369
LABOR FORCE [ PEOPLE ]
48.3%
PERCENT IN LABOR FORCE
1.1%
UNEMPLOYMENT RATE
Crawford Zip Codes
Crawford Area Codes
Income in Crawford
Income Overview in Crawford
Per Capita Income in Crawford is $27,364, while median incomes of families and households are $62,440 and $54,167 respectively.
| Characteristic | Number | Measure |
| Per Capita Income | 962 | $27,364 |
| Median Family Income | 277 | $62,440 |
| Mean Family Income | 277 | $76,373 |
| Median Household Income | 396 | $54,167 |
| Mean Household Income | 396 | $65,647 |
| Income Deficit | 277 | $1,767 |
| Wage / Income Gap (%) | 962 | 41.26% |
| Wage / Income Gap ($) | 962 | 58.74¢ per $1 |
| Gini / Inequality Index | 962 | 0.36 |
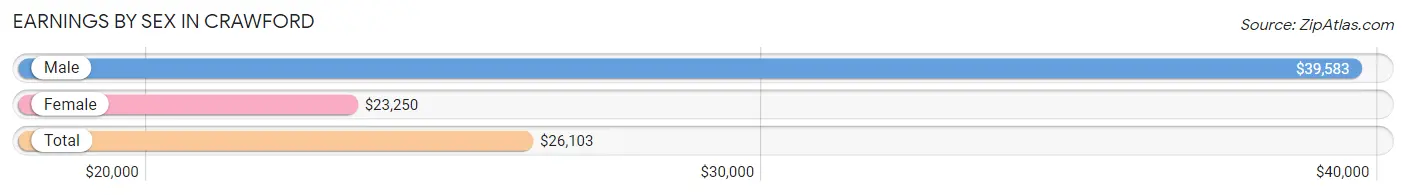
Earnings by Sex in Crawford
Average Earnings in Crawford are $26,103, $39,583 for men and $23,250 for women, a difference of 41.3%.
| Sex | Number | Average Earnings |
| Male | 235 (52.1%) | $39,583 |
| Female | 216 (47.9%) | $23,250 |
| Total | 451 (100.0%) | $26,103 |
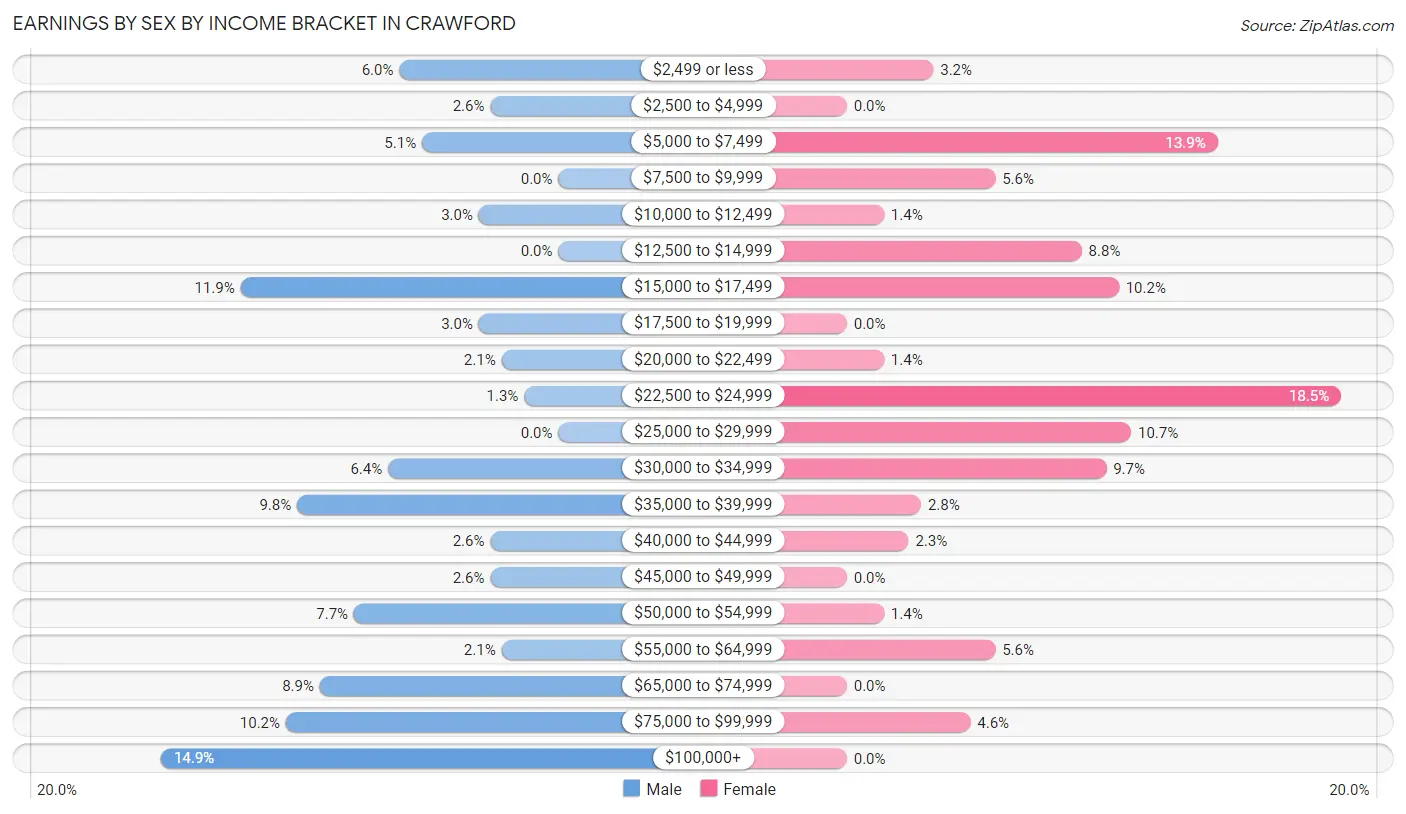
Earnings by Sex by Income Bracket in Crawford
The most common earnings brackets in Crawford are $100,000+ for men (35 | 14.9%) and $22,500 to $24,999 for women (40 | 18.5%).
| Income | Male | Female |
| $2,499 or less | 14 (6.0%) | 7 (3.2%) |
| $2,500 to $4,999 | 6 (2.5%) | 0 (0.0%) |
| $5,000 to $7,499 | 12 (5.1%) | 30 (13.9%) |
| $7,500 to $9,999 | 0 (0.0%) | 12 (5.6%) |
| $10,000 to $12,499 | 7 (3.0%) | 3 (1.4%) |
| $12,500 to $14,999 | 0 (0.0%) | 19 (8.8%) |
| $15,000 to $17,499 | 28 (11.9%) | 22 (10.2%) |
| $17,500 to $19,999 | 7 (3.0%) | 0 (0.0%) |
| $20,000 to $22,499 | 5 (2.1%) | 3 (1.4%) |
| $22,500 to $24,999 | 3 (1.3%) | 40 (18.5%) |
| $25,000 to $29,999 | 0 (0.0%) | 23 (10.6%) |
| $30,000 to $34,999 | 15 (6.4%) | 21 (9.7%) |
| $35,000 to $39,999 | 23 (9.8%) | 6 (2.8%) |
| $40,000 to $44,999 | 6 (2.5%) | 5 (2.3%) |
| $45,000 to $49,999 | 6 (2.5%) | 0 (0.0%) |
| $50,000 to $54,999 | 18 (7.7%) | 3 (1.4%) |
| $55,000 to $64,999 | 5 (2.1%) | 12 (5.6%) |
| $65,000 to $74,999 | 21 (8.9%) | 0 (0.0%) |
| $75,000 to $99,999 | 24 (10.2%) | 10 (4.6%) |
| $100,000+ | 35 (14.9%) | 0 (0.0%) |
| Total | 235 (100.0%) | 216 (100.0%) |
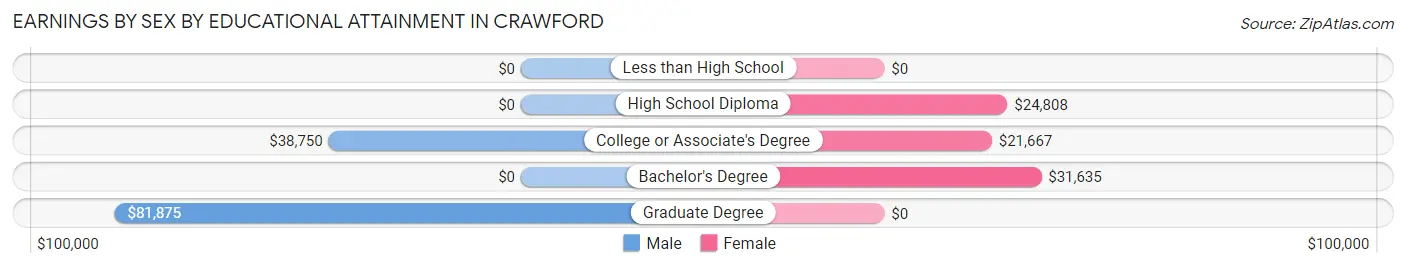
Earnings by Sex by Educational Attainment in Crawford
Average earnings in Crawford are $48,500 for men and $24,537 for women, a difference of 49.4%. Men with an educational attainment of graduate degree enjoy the highest average annual earnings of $81,875, while those with college or associate's degree education earn the least with $38,750. Women with an educational attainment of bachelor's degree earn the most with the average annual earnings of $31,635, while those with college or associate's degree education have the smallest earnings of $21,667.
| Educational Attainment | Male Income | Female Income |
| Less than High School | - | - |
| High School Diploma | - | - |
| College or Associate's Degree | $38,750 | $21,667 |
| Bachelor's Degree | - | - |
| Graduate Degree | $81,875 | $0 |
| Total | $48,500 | $24,537 |
Family Income in Crawford
Family Income Brackets in Crawford
According to the Crawford family income data, there are 76 families falling into the $100,000 to $149,999 income range, which is the most common income bracket and makes up 27.4% of all families.
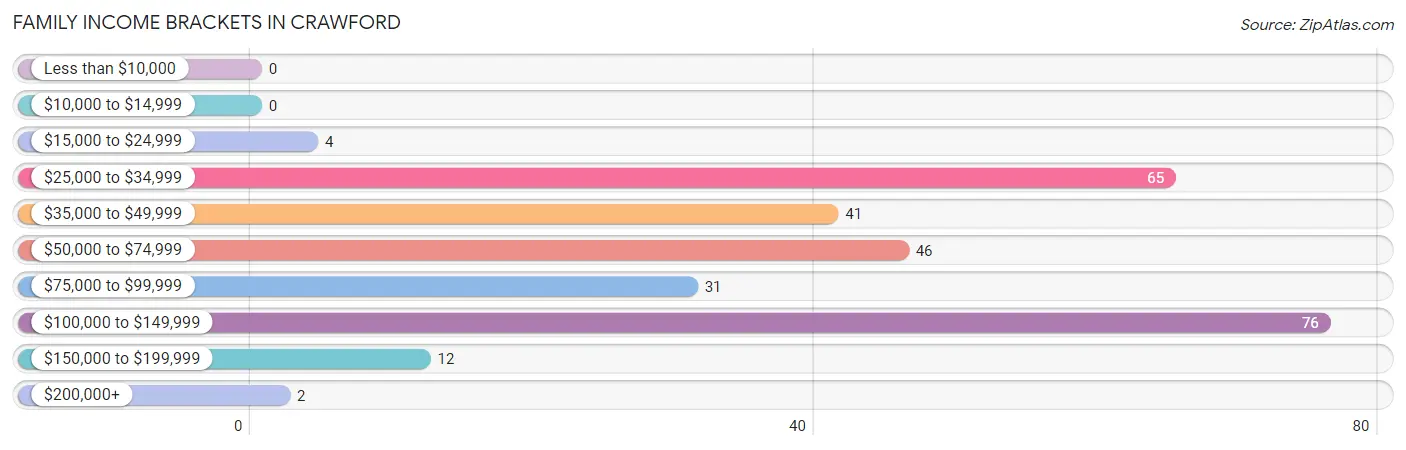
| Income Bracket | # Families | % Families |
| Less than $10,000 | 0 | 0.0% |
| $10,000 to $14,999 | 0 | 0.0% |
| $15,000 to $24,999 | 4 | 1.4% |
| $25,000 to $34,999 | 65 | 23.5% |
| $35,000 to $49,999 | 41 | 14.8% |
| $50,000 to $74,999 | 46 | 16.6% |
| $75,000 to $99,999 | 31 | 11.2% |
| $100,000 to $149,999 | 76 | 27.4% |
| $150,000 to $199,999 | 12 | 4.3% |
| $200,000+ | 2 | 0.7% |
Family Income by Famaliy Size in Crawford
3-person families (25 | 9.0%) account for the highest median family income in Crawford with $123,229 per family, while 3-person families (25 | 9.0%) have the highest median income of $41,076 per family member.
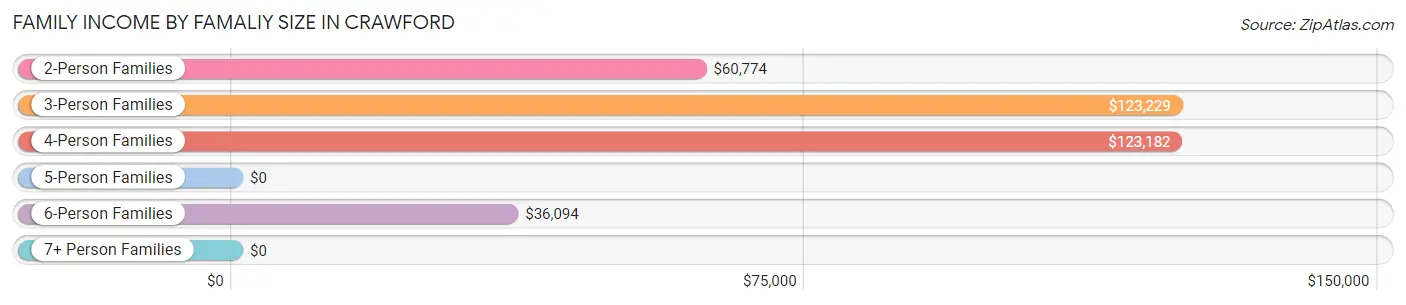
| Income Bracket | # Families | Median Income |
| 2-Person Families | 171 (61.7%) | $60,774 |
| 3-Person Families | 25 (9.0%) | $123,229 |
| 4-Person Families | 44 (15.9%) | $123,182 |
| 5-Person Families | 3 (1.1%) | $0 |
| 6-Person Families | 15 (5.4%) | $36,094 |
| 7+ Person Families | 19 (6.9%) | $0 |
| Total | 277 (100.0%) | $62,440 |
Family Income by Number of Earners in Crawford
The median family income in Crawford is $62,440, with families comprising 3+ earners (32) having the highest median family income of $123,125, while families with 1 earner (99) have the lowest median family income of $37,031, accounting for 11.6% and 35.7% of families, respectively.
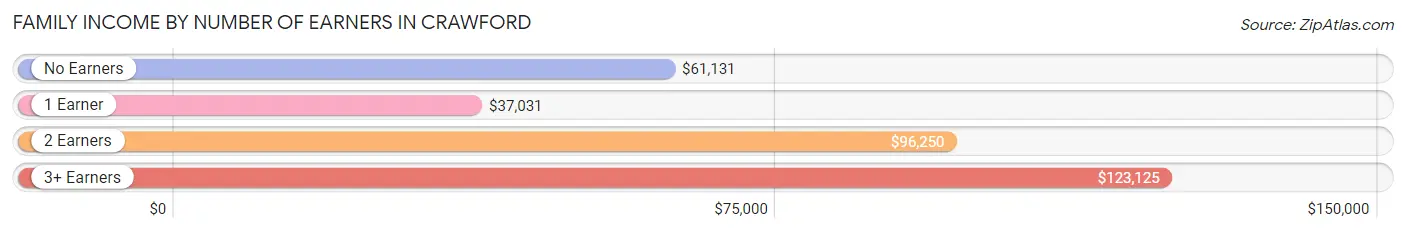
| Number of Earners | # Families | Median Income |
| No Earners | 49 (17.7%) | $61,131 |
| 1 Earner | 99 (35.7%) | $37,031 |
| 2 Earners | 97 (35.0%) | $96,250 |
| 3+ Earners | 32 (11.6%) | $123,125 |
| Total | 277 (100.0%) | $62,440 |
Household Income in Crawford
Household Income Brackets in Crawford
With 88 households falling in the category, the $25,000 to $34,999 income range is the most frequent in Crawford, accounting for 22.2% of all households. In contrast, only 2 households (0.5%) fall into the $200,000+ income bracket, making it the least populous group.
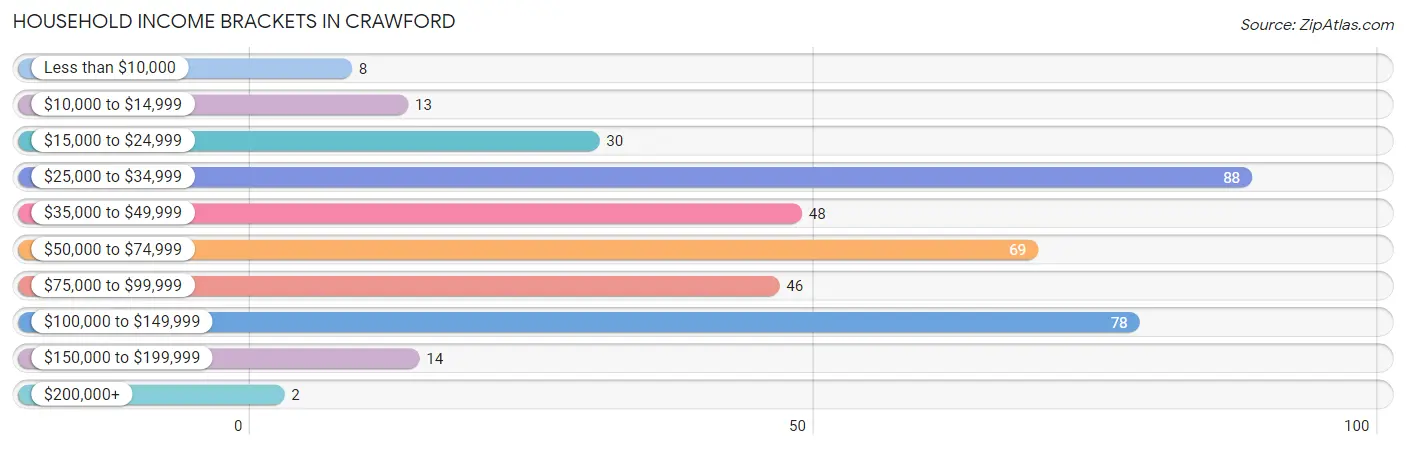
| Income Bracket | # Households | % Households |
| Less than $10,000 | 8 | 2.0% |
| $10,000 to $14,999 | 13 | 3.3% |
| $15,000 to $24,999 | 30 | 7.6% |
| $25,000 to $34,999 | 88 | 22.2% |
| $35,000 to $49,999 | 48 | 12.1% |
| $50,000 to $74,999 | 69 | 17.4% |
| $75,000 to $99,999 | 46 | 11.6% |
| $100,000 to $149,999 | 78 | 19.7% |
| $150,000 to $199,999 | 14 | 3.5% |
| $200,000+ | 2 | 0.5% |
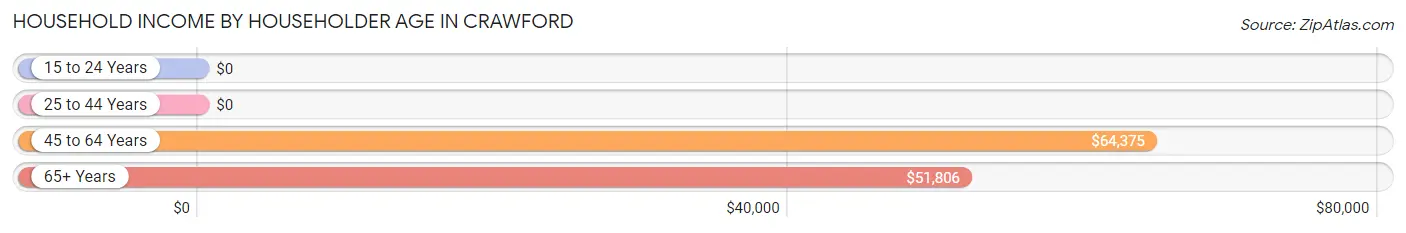
Household Income by Householder Age in Crawford
The median household income in Crawford is $54,167, with the highest median household income of $64,375 found in the 45 to 64 years age bracket for the primary householder. A total of 160 households (40.4%) fall into this category.
| Income Bracket | # Households | Median Income |
| 15 to 24 Years | 0 (0.0%) | $0 |
| 25 to 44 Years | 91 (23.0%) | $0 |
| 45 to 64 Years | 160 (40.4%) | $64,375 |
| 65+ Years | 145 (36.6%) | $51,806 |
| Total | 396 (100.0%) | $54,167 |
Poverty in Crawford
Income Below Poverty by Sex and Age in Crawford
With 23.3% poverty level for males and 15.7% for females among the residents of Crawford, 6 to 11 year old males and 12 to 14 year old females are the most vulnerable to poverty, with 23 males (63.9%) and 21 females (70.0%) in their respective age groups living below the poverty level.
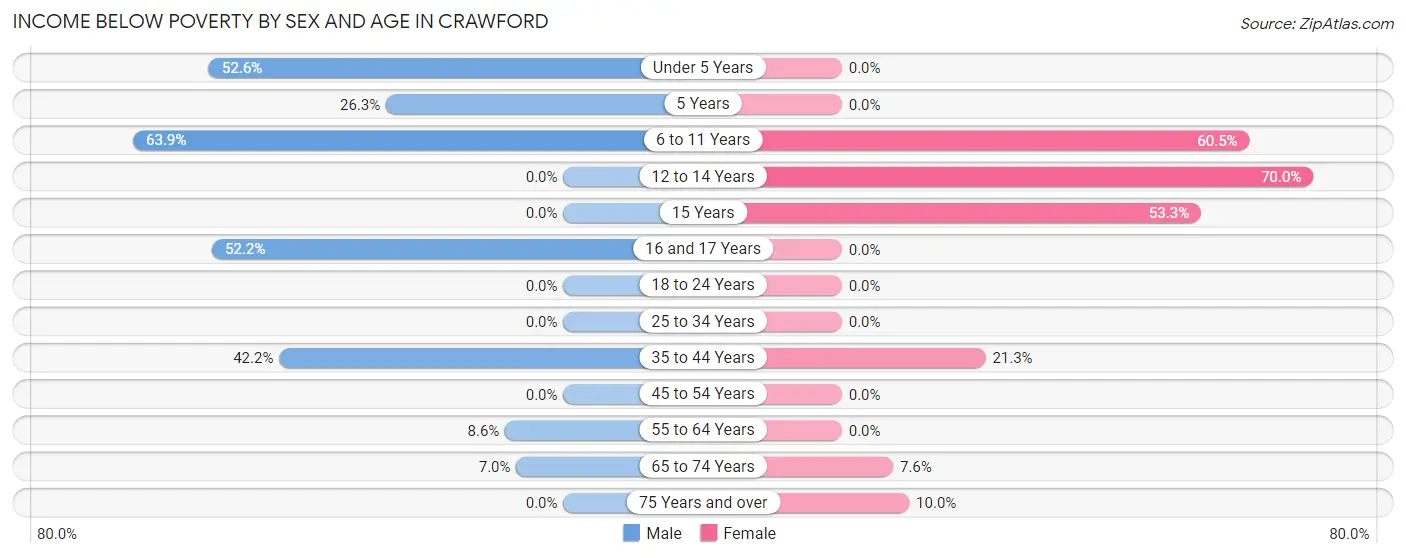
| Age Bracket | Male | Female |
| Under 5 Years | 20 (52.6%) | 0 (0.0%) |
| 5 Years | 5 (26.3%) | 0 (0.0%) |
| 6 to 11 Years | 23 (63.9%) | 23 (60.5%) |
| 12 to 14 Years | 0 (0.0%) | 21 (70.0%) |
| 15 Years | 0 (0.0%) | 8 (53.3%) |
| 16 and 17 Years | 12 (52.2%) | 0 (0.0%) |
| 18 to 24 Years | 0 (0.0%) | 0 (0.0%) |
| 25 to 34 Years | 0 (0.0%) | 0 (0.0%) |
| 35 to 44 Years | 27 (42.2%) | 16 (21.3%) |
| 45 to 54 Years | 0 (0.0%) | 0 (0.0%) |
| 55 to 64 Years | 7 (8.6%) | 0 (0.0%) |
| 65 to 74 Years | 3 (7.0%) | 7 (7.6%) |
| 75 Years and over | 0 (0.0%) | 6 (10.0%) |
| Total | 97 (23.3%) | 81 (15.7%) |
Income Above Poverty by Sex and Age in Crawford
According to the poverty statistics in Crawford, males aged 12 to 14 years and females aged under 5 years are the age groups that are most secure financially, with 100.0% of males and 100.0% of females in these age groups living above the poverty line.
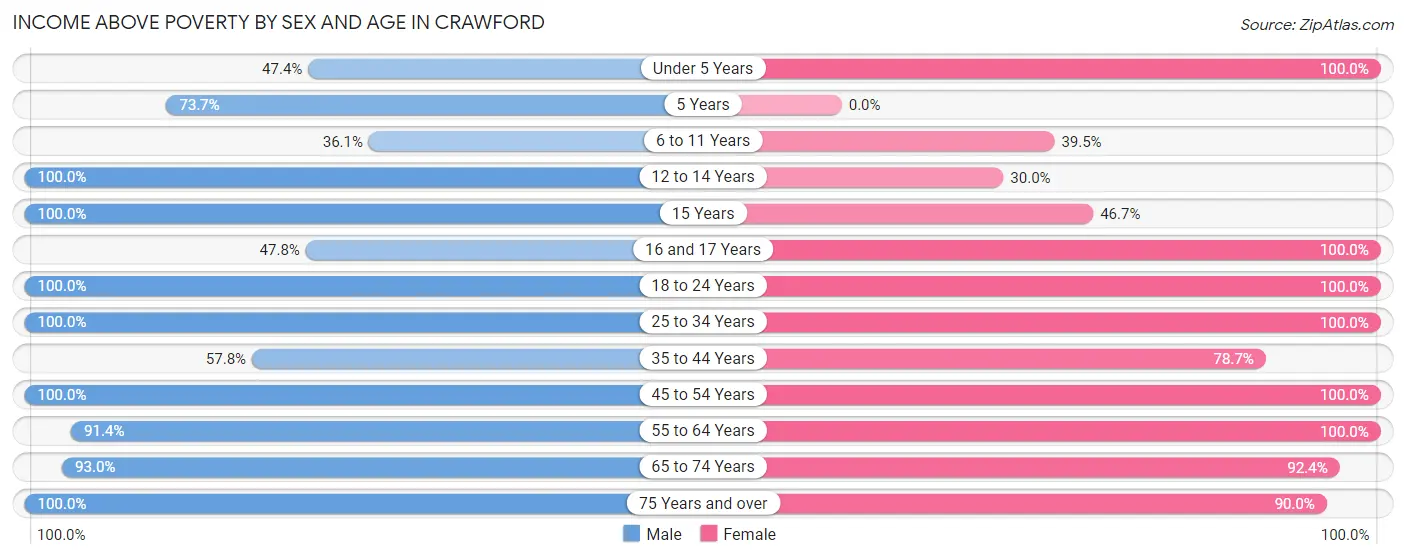
| Age Bracket | Male | Female |
| Under 5 Years | 18 (47.4%) | 13 (100.0%) |
| 5 Years | 14 (73.7%) | 0 (0.0%) |
| 6 to 11 Years | 13 (36.1%) | 15 (39.5%) |
| 12 to 14 Years | 5 (100.0%) | 9 (30.0%) |
| 15 Years | 4 (100.0%) | 7 (46.7%) |
| 16 and 17 Years | 11 (47.8%) | 9 (100.0%) |
| 18 to 24 Years | 2 (100.0%) | 46 (100.0%) |
| 25 to 34 Years | 6 (100.0%) | 8 (100.0%) |
| 35 to 44 Years | 37 (57.8%) | 59 (78.7%) |
| 45 to 54 Years | 54 (100.0%) | 65 (100.0%) |
| 55 to 64 Years | 74 (91.4%) | 66 (100.0%) |
| 65 to 74 Years | 40 (93.0%) | 85 (92.4%) |
| 75 Years and over | 42 (100.0%) | 54 (90.0%) |
| Total | 320 (76.7%) | 436 (84.3%) |
Income Below Poverty Among Married-Couple Families in Crawford
The poverty statistics for married-couple families in Crawford show that 10.6% or 27 of the total 255 families live below the poverty line. Families with 5 or more children have the highest poverty rate of 100.0%, comprising of 15 families. On the other hand, families with no children have the lowest poverty rate of 0.0%, which includes 0 families.
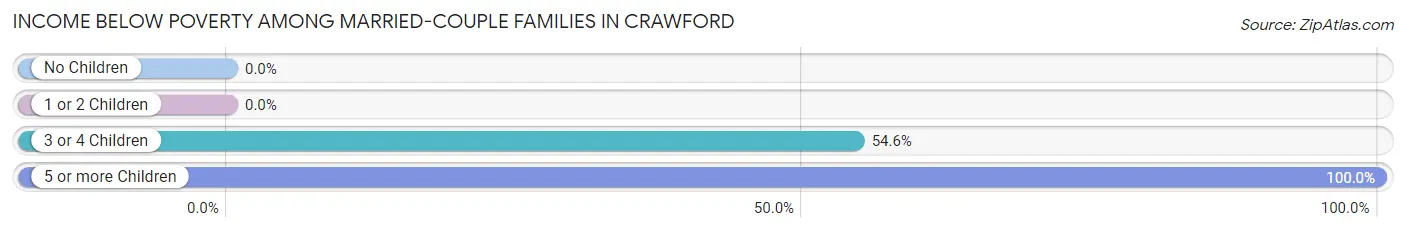
| Children | Above Poverty | Below Poverty |
| No Children | 170 (100.0%) | 0 (0.0%) |
| 1 or 2 Children | 48 (100.0%) | 0 (0.0%) |
| 3 or 4 Children | 10 (45.5%) | 12 (54.5%) |
| 5 or more Children | 0 (0.0%) | 15 (100.0%) |
| Total | 228 (89.4%) | 27 (10.6%) |
Income Below Poverty Among Single-Parent Households in Crawford
| Children | Single Father | Single Mother |
| No Children | 0 (0.0%) | 0 (0.0%) |
| 1 or 2 Children | 0 (0.0%) | 0 (0.0%) |
| 3 or 4 Children | 0 (0.0%) | 0 (0.0%) |
| 5 or more Children | 0 (0.0%) | 0 (0.0%) |
| Total | 0 (0.0%) | 0 (0.0%) |
Income Below Poverty Among Married-Couple vs Single-Parent Households in Crawford
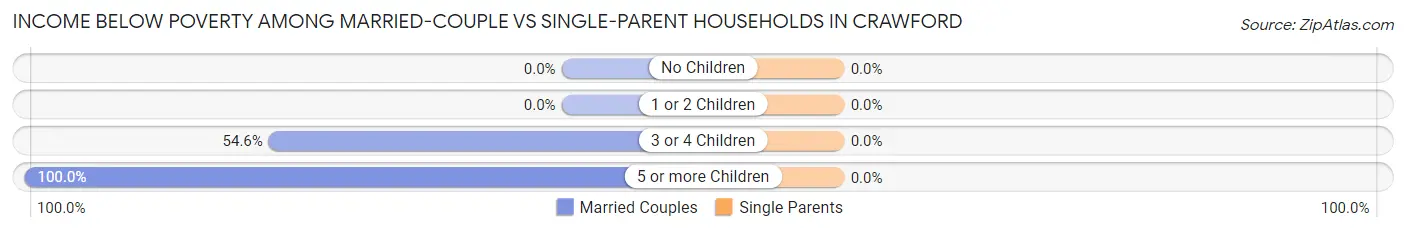
| Children | Married-Couple Families | Single-Parent Households |
| No Children | 0 (0.0%) | 0 (0.0%) |
| 1 or 2 Children | 0 (0.0%) | 0 (0.0%) |
| 3 or 4 Children | 12 (54.5%) | 0 (0.0%) |
| 5 or more Children | 15 (100.0%) | 0 (0.0%) |
| Total | 27 (10.6%) | 0 (0.0%) |
Race in Crawford
The most populous races in Crawford are White / Caucasian (891 | 92.6%), Hispanic or Latino (127 | 13.2%), and Native / Alaskan (47 | 4.9%).
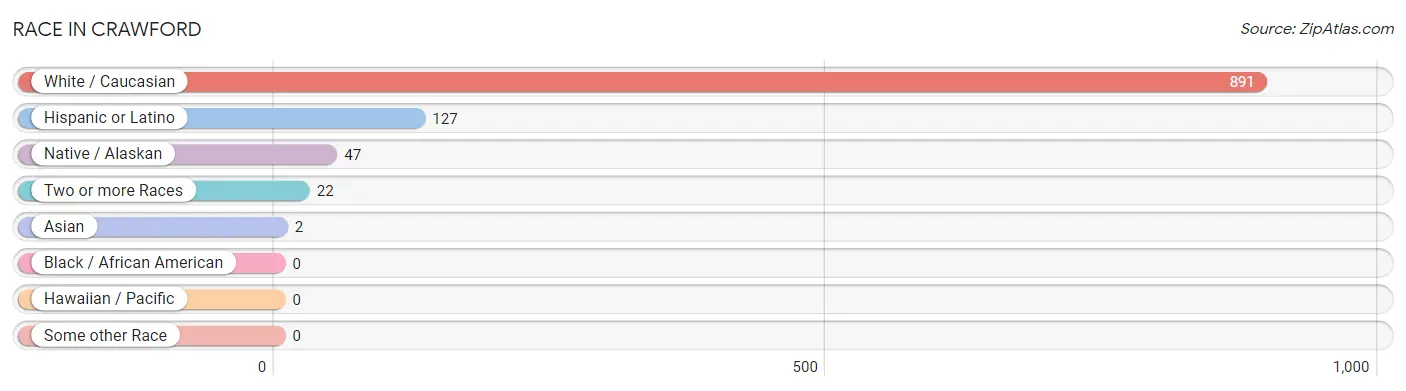
| Race | # Population | % Population |
| Asian | 2 | 0.2% |
| Black / African American | 0 | 0.0% |
| Hawaiian / Pacific | 0 | 0.0% |
| Hispanic or Latino | 127 | 13.2% |
| Native / Alaskan | 47 | 4.9% |
| White / Caucasian | 891 | 92.6% |
| Two or more Races | 22 | 2.3% |
| Some other Race | 0 | 0.0% |
| Total | 962 | 100.0% |
Ancestry in Crawford
The most populous ancestries reported in Crawford are German (400 | 41.6%), English (143 | 14.9%), Mexican (88 | 9.1%), Irish (80 | 8.3%), and Greek (70 | 7.3%), together accounting for 81.2% of all Crawford residents.
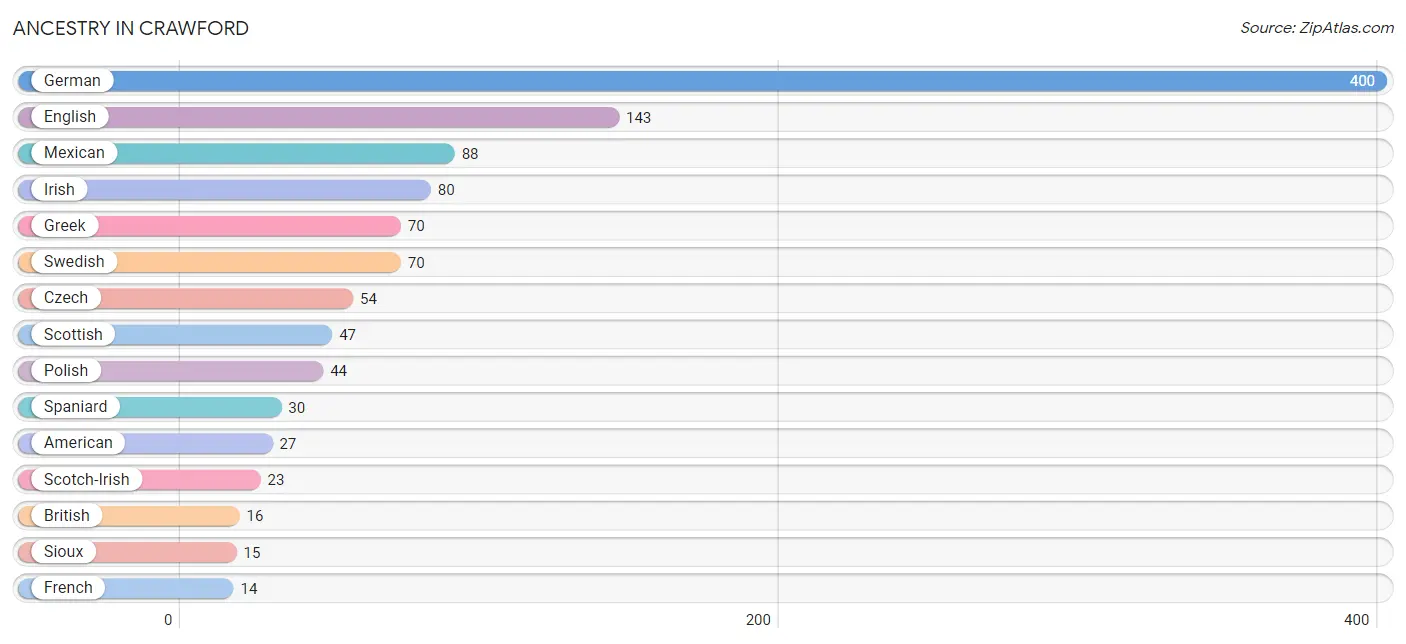
| Ancestry | # Population | % Population |
| American | 27 | 2.8% |
| British | 16 | 1.7% |
| Canadian | 3 | 0.3% |
| Cuban | 9 | 0.9% |
| Czech | 54 | 5.6% |
| Danish | 2 | 0.2% |
| Dutch | 4 | 0.4% |
| English | 143 | 14.9% |
| European | 2 | 0.2% |
| French | 14 | 1.5% |
| French Canadian | 3 | 0.3% |
| German | 400 | 41.6% |
| Greek | 70 | 7.3% |
| Indian (Asian) | 2 | 0.2% |
| Irish | 80 | 8.3% |
| Italian | 6 | 0.6% |
| Mexican | 88 | 9.1% |
| Northern European | 4 | 0.4% |
| Norwegian | 11 | 1.1% |
| Polish | 44 | 4.6% |
| Russian | 8 | 0.8% |
| Scotch-Irish | 23 | 2.4% |
| Scottish | 47 | 4.9% |
| Sioux | 15 | 1.6% |
| Spaniard | 30 | 3.1% |
| Swedish | 70 | 7.3% |
| Welsh | 2 | 0.2% | View All 27 Rows |
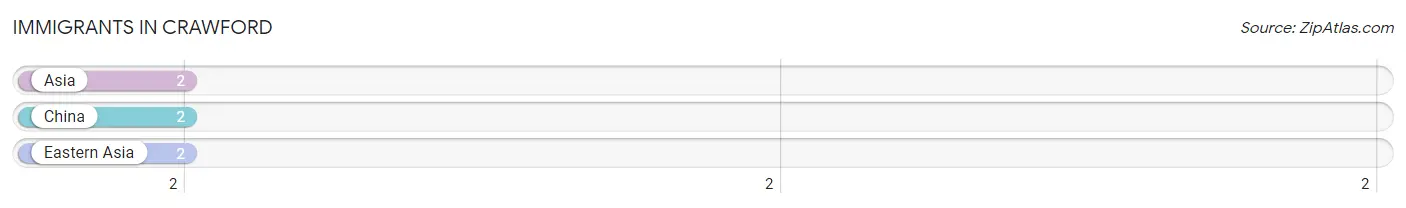
Immigrants in Crawford
The most numerous immigrant groups reported in Crawford came from Asia (2 | 0.2%), China (2 | 0.2%), and Eastern Asia (2 | 0.2%), together accounting for 0.6% of all Crawford residents.
| Immigration Origin | # Population | % Population |
| Asia | 2 | 0.2% |
| China | 2 | 0.2% |
| Eastern Asia | 2 | 0.2% | View All 3 Rows |
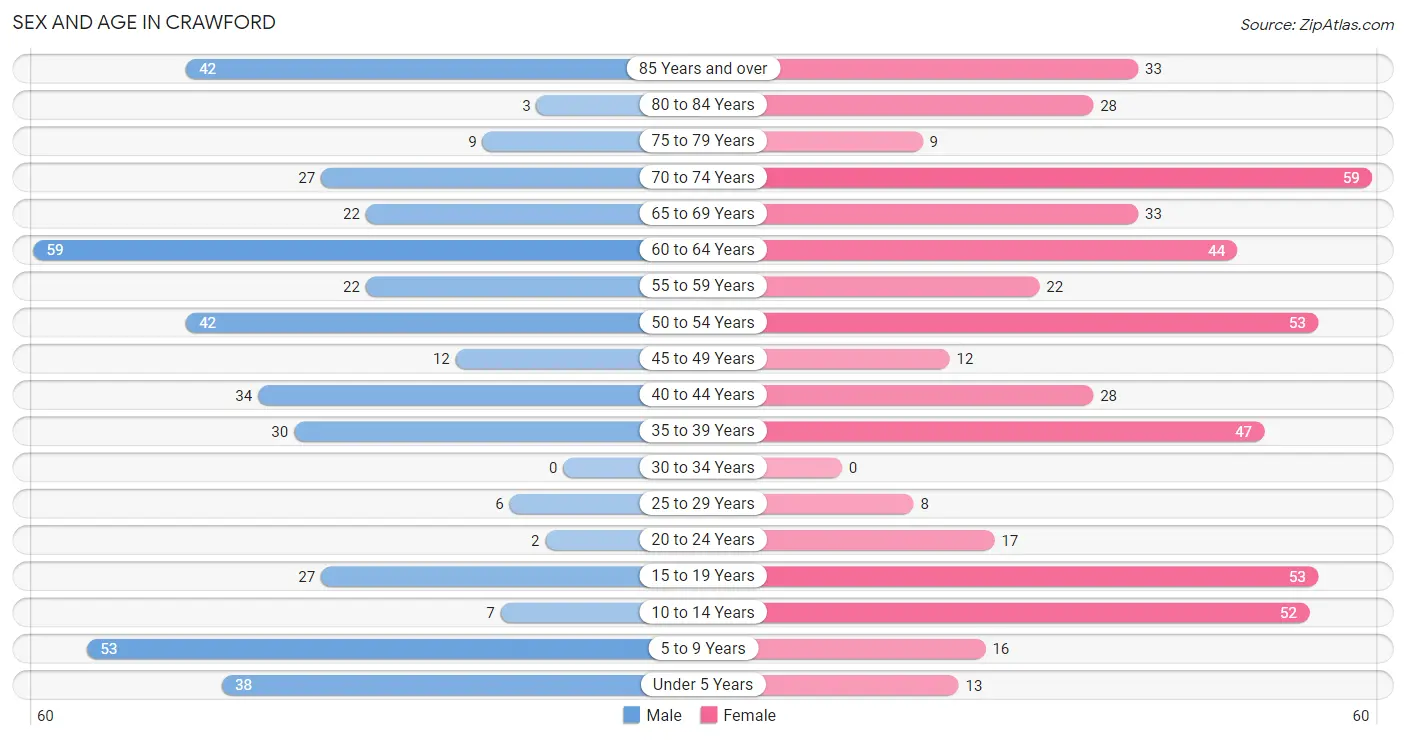
Sex and Age in Crawford
Sex and Age in Crawford
The most populous age groups in Crawford are 60 to 64 Years (59 | 13.6%) for men and 70 to 74 Years (59 | 11.2%) for women.
| Age Bracket | Male | Female |
| Under 5 Years | 38 (8.7%) | 13 (2.5%) |
| 5 to 9 Years | 53 (12.2%) | 16 (3.0%) |
| 10 to 14 Years | 7 (1.6%) | 52 (9.9%) |
| 15 to 19 Years | 27 (6.2%) | 53 (10.1%) |
| 20 to 24 Years | 2 (0.5%) | 17 (3.2%) |
| 25 to 29 Years | 6 (1.4%) | 8 (1.5%) |
| 30 to 34 Years | 0 (0.0%) | 0 (0.0%) |
| 35 to 39 Years | 30 (6.9%) | 47 (8.9%) |
| 40 to 44 Years | 34 (7.8%) | 28 (5.3%) |
| 45 to 49 Years | 12 (2.8%) | 12 (2.3%) |
| 50 to 54 Years | 42 (9.7%) | 53 (10.1%) |
| 55 to 59 Years | 22 (5.1%) | 22 (4.2%) |
| 60 to 64 Years | 59 (13.6%) | 44 (8.4%) |
| 65 to 69 Years | 22 (5.1%) | 33 (6.3%) |
| 70 to 74 Years | 27 (6.2%) | 59 (11.2%) |
| 75 to 79 Years | 9 (2.1%) | 9 (1.7%) |
| 80 to 84 Years | 3 (0.7%) | 28 (5.3%) |
| 85 Years and over | 42 (9.7%) | 33 (6.3%) |
| Total | 435 (100.0%) | 527 (100.0%) |
Families and Households in Crawford
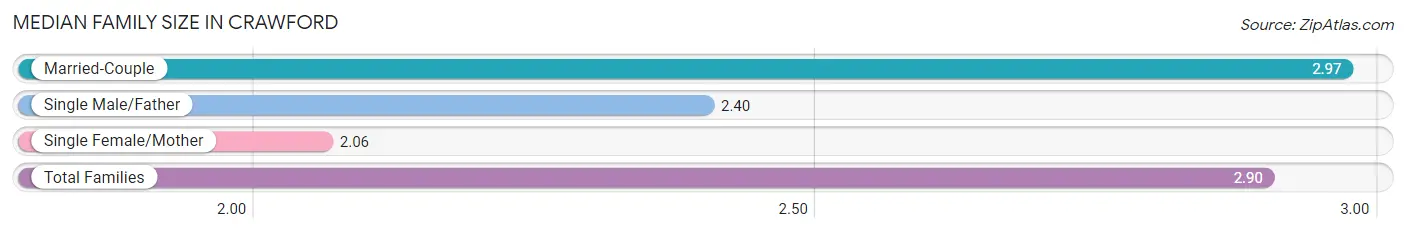
Median Family Size in Crawford
The median family size in Crawford is 2.90 persons per family, with married-couple families (255 | 92.1%) accounting for the largest median family size of 2.97 persons per family. On the other hand, single female/mother families (17 | 6.1%) represent the smallest median family size with 2.06 persons per family.
| Family Type | # Families | Family Size |
| Married-Couple | 255 (92.1%) | 2.97 |
| Single Male/Father | 5 (1.8%) | 2.40 |
| Single Female/Mother | 17 (6.1%) | 2.06 |
| Total Families | 277 (100.0%) | 2.90 |
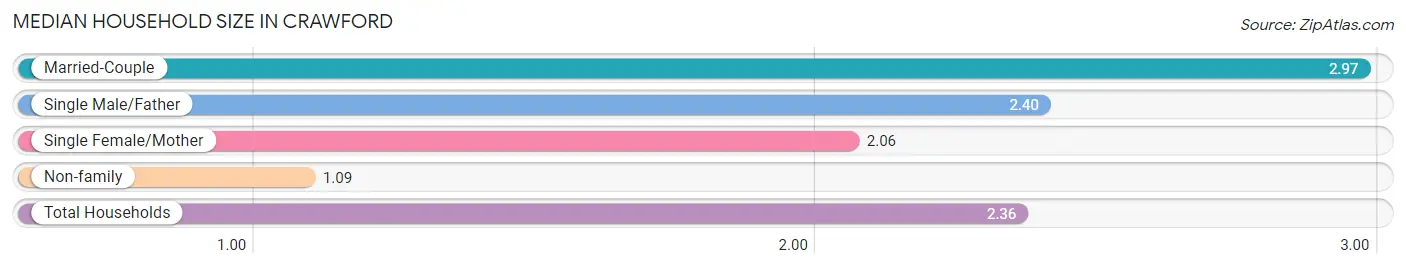
Median Household Size in Crawford
The median household size in Crawford is 2.36 persons per household, with married-couple households (255 | 64.4%) accounting for the largest median household size of 2.97 persons per household. non-family households (119 | 30.0%) represent the smallest median household size with 1.09 persons per household.
| Household Type | # Households | Household Size |
| Married-Couple | 255 (64.4%) | 2.97 |
| Single Male/Father | 5 (1.3%) | 2.40 |
| Single Female/Mother | 17 (4.3%) | 2.06 |
| Non-family | 119 (30.0%) | 1.09 |
| Total Households | 396 (100.0%) | 2.36 |
Household Size by Marriage Status in Crawford
Out of a total of 396 households in Crawford, 277 (70.0%) are family households, while 119 (30.0%) are nonfamily households. The most numerous type of family households are 2-person households, comprising 171, and the most common type of nonfamily households are 1-person households, comprising 109.
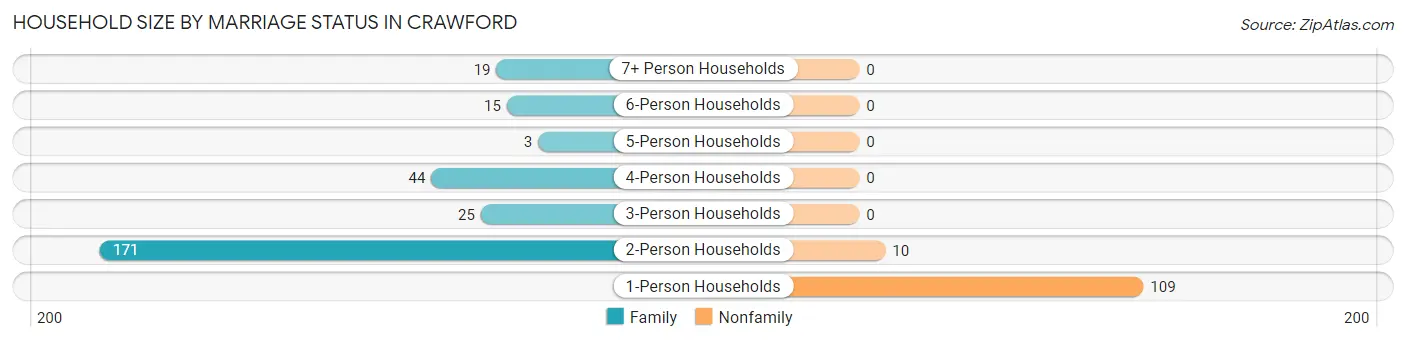
| Household Size | Family Households | Nonfamily Households |
| 1-Person Households | - | 109 (27.5%) |
| 2-Person Households | 171 (43.2%) | 10 (2.5%) |
| 3-Person Households | 25 (6.3%) | 0 (0.0%) |
| 4-Person Households | 44 (11.1%) | 0 (0.0%) |
| 5-Person Households | 3 (0.8%) | 0 (0.0%) |
| 6-Person Households | 15 (3.8%) | 0 (0.0%) |
| 7+ Person Households | 19 (4.8%) | 0 (0.0%) |
| Total | 277 (70.0%) | 119 (30.0%) |
Female Fertility in Crawford
Fertility by Age in Crawford
Average fertility rate in Crawford is 18.0 births per 1,000 women. Women in the age bracket of 20 to 34 years have the highest fertility rate with 120.0 births per 1,000 women. Women in the age bracket of 20 to 34 years acount for 100.0% of all women with births.
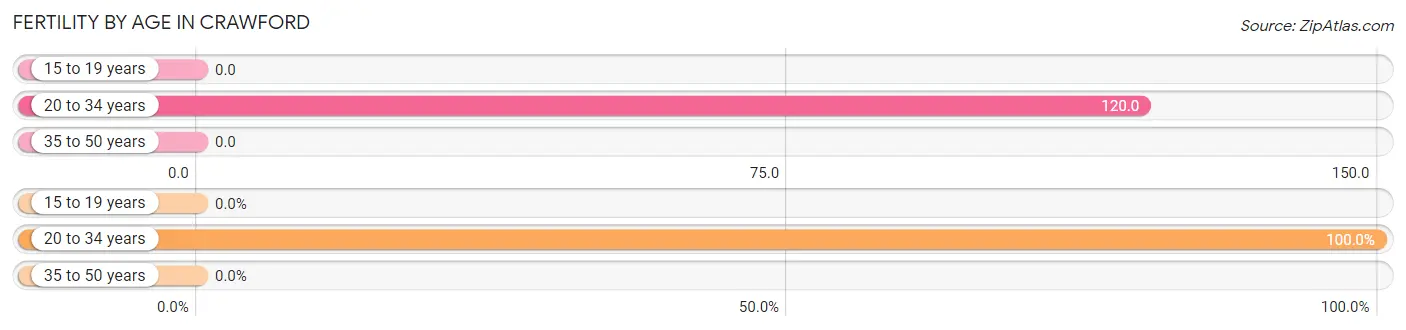
| Age Bracket | Women with Births | Births / 1,000 Women |
| 15 to 19 years | 0 (0.0%) | 0.0 |
| 20 to 34 years | 3 (100.0%) | 120.0 |
| 35 to 50 years | 0 (0.0%) | 0.0 |
| Total | 3 (100.0%) | 18.0 |
Fertility by Age by Marriage Status in Crawford
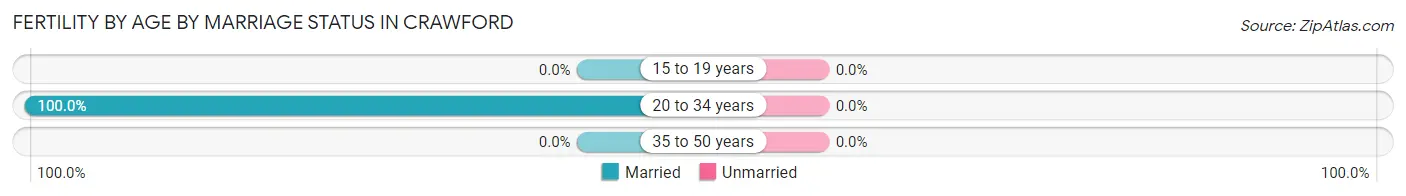
| Age Bracket | Married | Unmarried |
| 15 to 19 years | 0 (0.0%) | 0 (0.0%) |
| 20 to 34 years | 3 (100.0%) | 0 (0.0%) |
| 35 to 50 years | 0 (0.0%) | 0 (0.0%) |
| Total | 3 (100.0%) | 0 (0.0%) |
Fertility by Education in Crawford
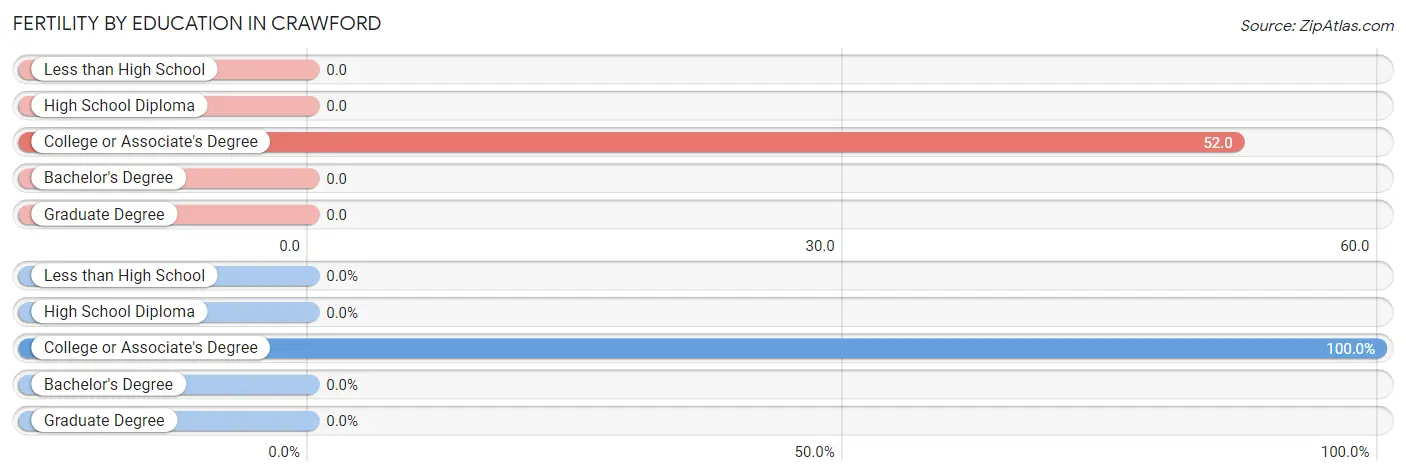
| Educational Attainment | Women with Births | Births / 1,000 Women |
| Less than High School | 0 (0.0%) | 0.0 |
| High School Diploma | 0 (0.0%) | 0.0 |
| College or Associate's Degree | 3 (100.0%) | 52.0 |
| Bachelor's Degree | 0 (0.0%) | 0.0 |
| Graduate Degree | 0 (0.0%) | 0.0 |
| Total | 3 (100.0%) | 18.0 |
Fertility by Education by Marriage Status in Crawford
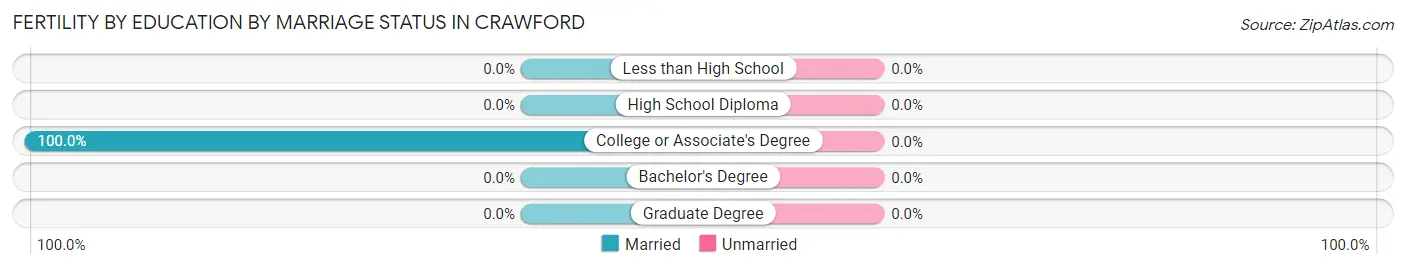
| Educational Attainment | Married | Unmarried |
| Less than High School | 0 (0.0%) | 0 (0.0%) |
| High School Diploma | 0 (0.0%) | 0 (0.0%) |
| College or Associate's Degree | 3 (100.0%) | 0 (0.0%) |
| Bachelor's Degree | 0 (0.0%) | 0 (0.0%) |
| Graduate Degree | 0 (0.0%) | 0 (0.0%) |
| Total | 3 (100.0%) | 0 (0.0%) |
Employment Characteristics in Crawford
Employment by Class of Employer in Crawford
Among the 362 employed individuals in Crawford, private company employees (175 | 48.3%), self-employed (not incorporated) (59 | 16.3%), and state government employees (49 | 13.5%) make up the most common classes of employment.
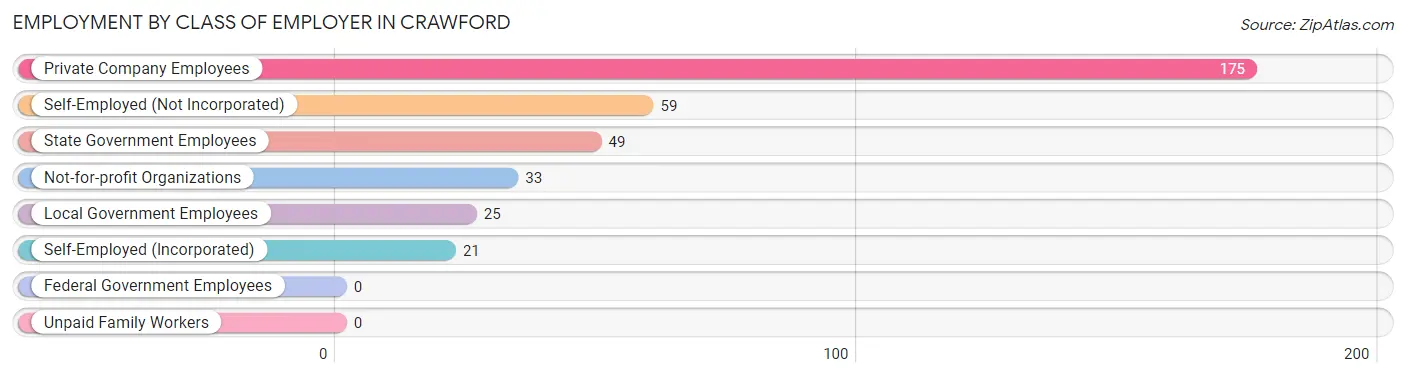
| Employer Class | # Employees | % Employees |
| Private Company Employees | 175 | 48.3% |
| Self-Employed (Incorporated) | 21 | 5.8% |
| Self-Employed (Not Incorporated) | 59 | 16.3% |
| Not-for-profit Organizations | 33 | 9.1% |
| Local Government Employees | 25 | 6.9% |
| State Government Employees | 49 | 13.5% |
| Federal Government Employees | 0 | 0.0% |
| Unpaid Family Workers | 0 | 0.0% |
| Total | 362 | 100.0% |
Employment Status by Age in Crawford
According to the labor force statistics for Crawford, out of the total population over 16 years of age (764), 48.3% or 369 individuals are in the labor force, with 1.1% or 4 of them unemployed. The age group with the highest labor force participation rate is 25 to 29 years, with 100.0% or 14 individuals in the labor force. Within the labor force, the 35 to 44 years age range has the highest percentage of unemployed individuals, with 3.4% or 4 of them being unemployed.
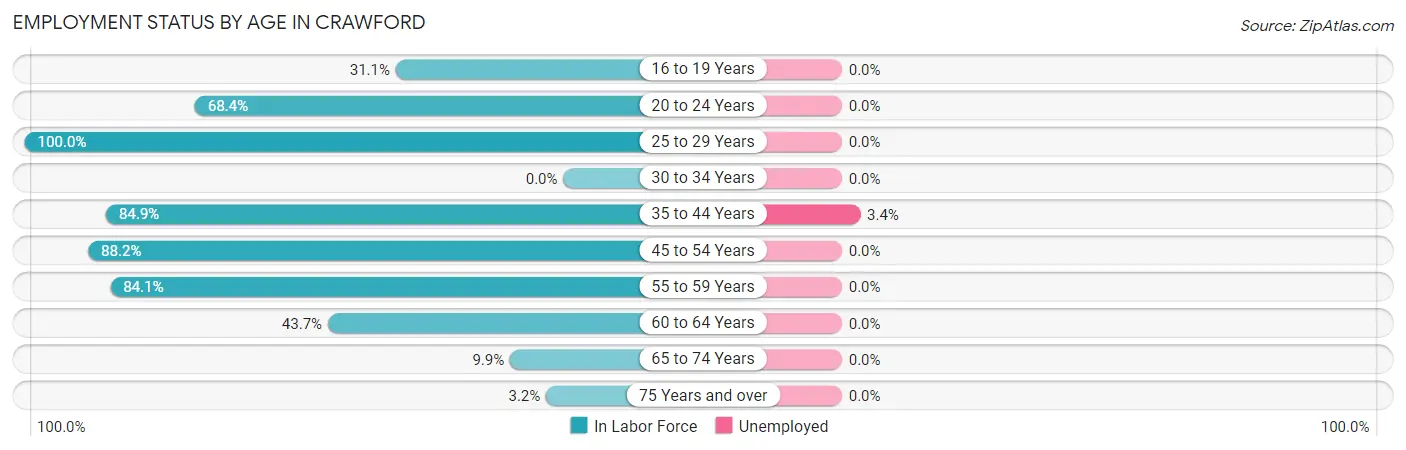
| Age Bracket | In Labor Force | Unemployed |
| 16 to 19 Years | 19 (31.1%) | 0 (0.0%) |
| 20 to 24 Years | 13 (68.4%) | 0 (0.0%) |
| 25 to 29 Years | 14 (100.0%) | 0 (0.0%) |
| 30 to 34 Years | 0 (0.0%) | 0 (0.0%) |
| 35 to 44 Years | 118 (84.9%) | 4 (3.4%) |
| 45 to 54 Years | 105 (88.2%) | 0 (0.0%) |
| 55 to 59 Years | 37 (84.1%) | 0 (0.0%) |
| 60 to 64 Years | 45 (43.7%) | 0 (0.0%) |
| 65 to 74 Years | 14 (9.9%) | 0 (0.0%) |
| 75 Years and over | 4 (3.2%) | 0 (0.0%) |
| Total | 369 (48.3%) | 4 (1.1%) |
Employment Status by Educational Attainment in Crawford
According to labor force statistics for Crawford, 76.1% of individuals (319) out of the total population between 25 and 64 years of age (419) are in the labor force, with 1.3% or 4 of them being unemployed. The group with the highest labor force participation rate are those with the educational attainment of high school diploma, with 91.7% or 110 individuals in the labor force. Within the labor force, individuals with bachelor's degree or higher education have the highest percentage of unemployment, with 4.0% or 3 of them being unemployed.
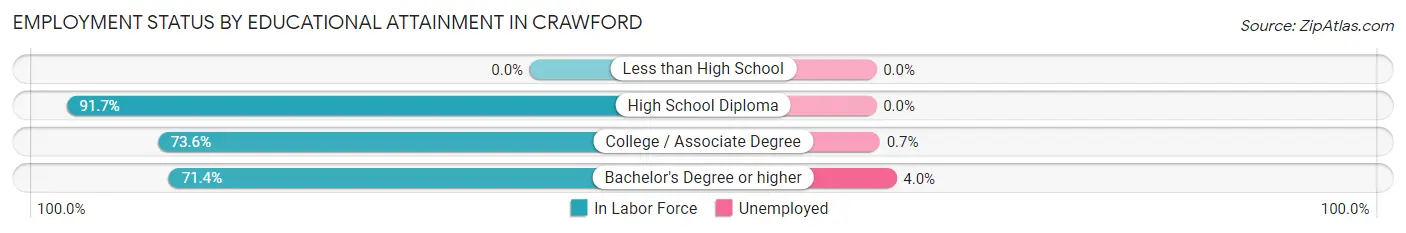
| Educational Attainment | In Labor Force | Unemployed |
| Less than High School | 0 (0.0%) | 0 (0.0%) |
| High School Diploma | 110 (91.7%) | 0 (0.0%) |
| College / Associate Degree | 134 (73.6%) | 1 (0.7%) |
| Bachelor's Degree or higher | 75 (71.4%) | 4 (4.0%) |
| Total | 319 (76.1%) | 5 (1.3%) |
Employment Occupations by Sex in Crawford
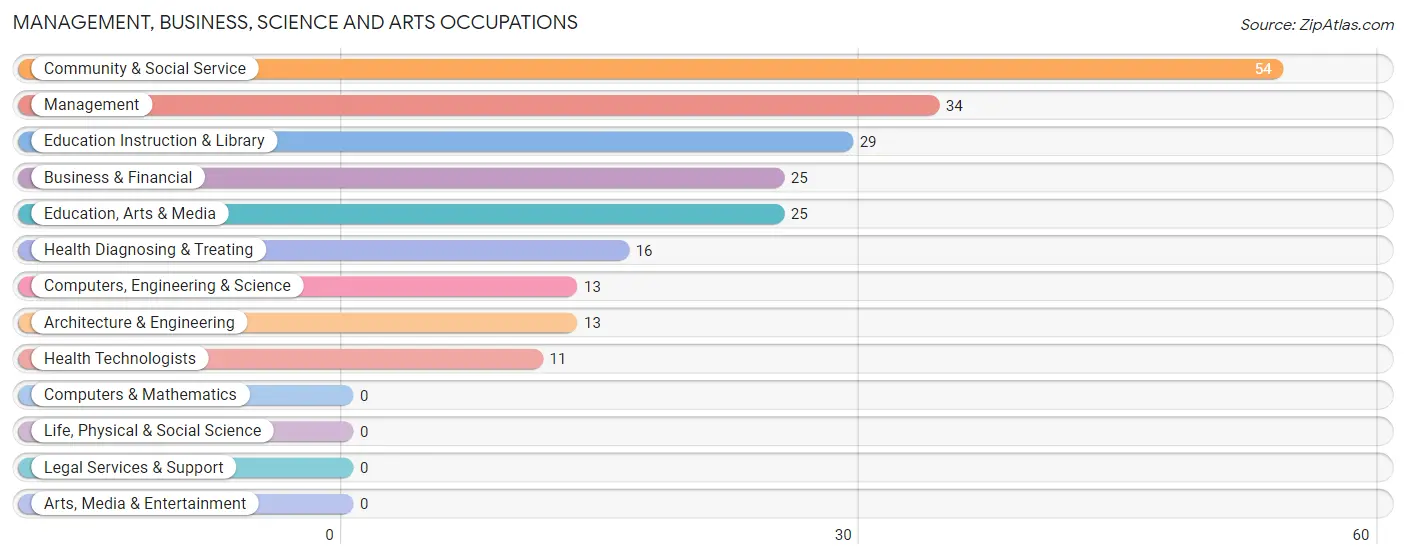
Management, Business, Science and Arts Occupations
The most common Management, Business, Science and Arts occupations in Crawford are Community & Social Service (54 | 14.8%), Management (34 | 9.3%), Education Instruction & Library (29 | 8.0%), Business & Financial (25 | 6.9%), and Education, Arts & Media (25 | 6.9%).
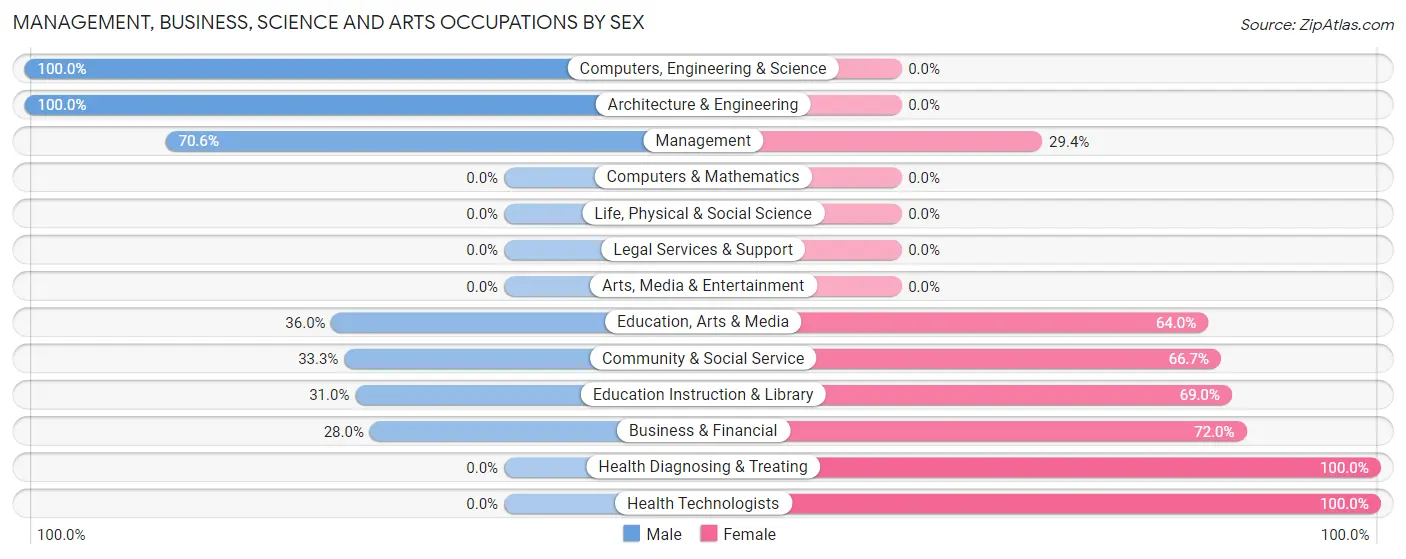
Management, Business, Science and Arts Occupations by Sex
Within the Management, Business, Science and Arts occupations in Crawford, the most male-oriented occupations are Computers, Engineering & Science (100.0%), Architecture & Engineering (100.0%), and Management (70.6%), while the most female-oriented occupations are Health Diagnosing & Treating (100.0%), Health Technologists (100.0%), and Business & Financial (72.0%).
| Occupation | Male | Female |
| Management | 24 (70.6%) | 10 (29.4%) |
| Business & Financial | 7 (28.0%) | 18 (72.0%) |
| Computers, Engineering & Science | 13 (100.0%) | 0 (0.0%) |
| Computers & Mathematics | 0 (0.0%) | 0 (0.0%) |
| Architecture & Engineering | 13 (100.0%) | 0 (0.0%) |
| Life, Physical & Social Science | 0 (0.0%) | 0 (0.0%) |
| Community & Social Service | 18 (33.3%) | 36 (66.7%) |
| Education, Arts & Media | 9 (36.0%) | 16 (64.0%) |
| Legal Services & Support | 0 (0.0%) | 0 (0.0%) |
| Education Instruction & Library | 9 (31.0%) | 20 (69.0%) |
| Arts, Media & Entertainment | 0 (0.0%) | 0 (0.0%) |
| Health Diagnosing & Treating | 0 (0.0%) | 16 (100.0%) |
| Health Technologists | 0 (0.0%) | 11 (100.0%) |
| Total (Category) | 62 (43.7%) | 80 (56.3%) |
| Total (Overall) | 182 (49.9%) | 183 (50.1%) |
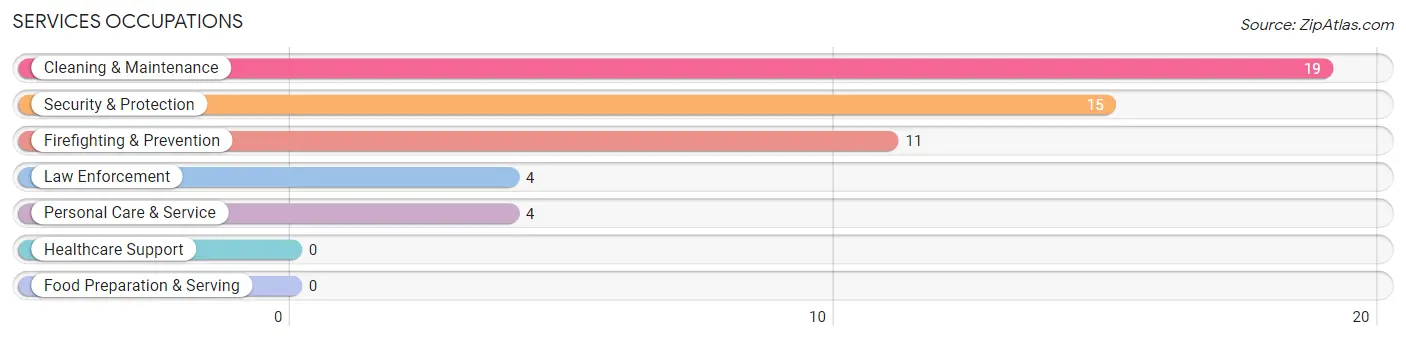
Services Occupations
The most common Services occupations in Crawford are Cleaning & Maintenance (19 | 5.2%), Security & Protection (15 | 4.1%), Firefighting & Prevention (11 | 3.0%), Law Enforcement (4 | 1.1%), and Personal Care & Service (4 | 1.1%).
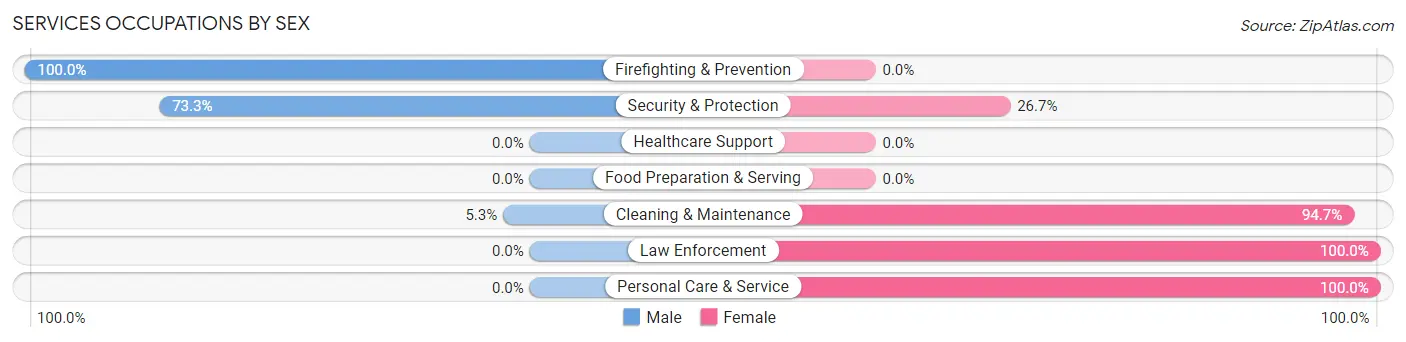
Services Occupations by Sex
Within the Services occupations in Crawford, the most male-oriented occupations are Firefighting & Prevention (100.0%), Security & Protection (73.3%), and Cleaning & Maintenance (5.3%), while the most female-oriented occupations are Law Enforcement (100.0%), Personal Care & Service (100.0%), and Cleaning & Maintenance (94.7%).
| Occupation | Male | Female |
| Healthcare Support | 0 (0.0%) | 0 (0.0%) |
| Security & Protection | 11 (73.3%) | 4 (26.7%) |
| Firefighting & Prevention | 11 (100.0%) | 0 (0.0%) |
| Law Enforcement | 0 (0.0%) | 4 (100.0%) |
| Food Preparation & Serving | 0 (0.0%) | 0 (0.0%) |
| Cleaning & Maintenance | 1 (5.3%) | 18 (94.7%) |
| Personal Care & Service | 0 (0.0%) | 4 (100.0%) |
| Total (Category) | 12 (31.6%) | 26 (68.4%) |
| Total (Overall) | 182 (49.9%) | 183 (50.1%) |
Sales and Office Occupations
The most common Sales and Office occupations in Crawford are Office & Administration (49 | 13.4%), and Sales & Related (21 | 5.8%).
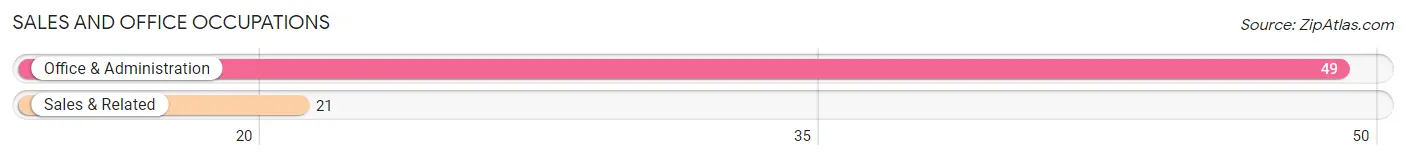
Sales and Office Occupations by Sex
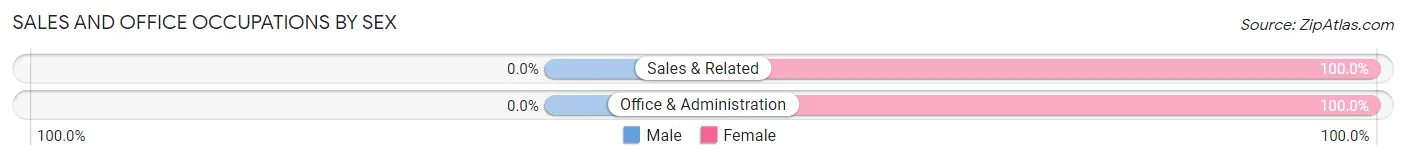
| Occupation | Male | Female |
| Sales & Related | 0 (0.0%) | 21 (100.0%) |
| Office & Administration | 0 (0.0%) | 49 (100.0%) |
| Total (Category) | 0 (0.0%) | 70 (100.0%) |
| Total (Overall) | 182 (49.9%) | 183 (50.1%) |
Natural Resources, Construction and Maintenance Occupations
The most common Natural Resources, Construction and Maintenance occupations in Crawford are Construction & Extraction (42 | 11.5%), Installation, Maintenance & Repair (10 | 2.7%), and Farming, Fishing & Forestry (9 | 2.5%).
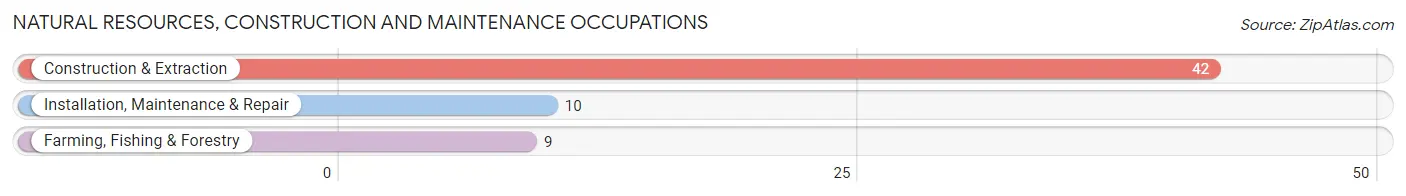
Natural Resources, Construction and Maintenance Occupations by Sex
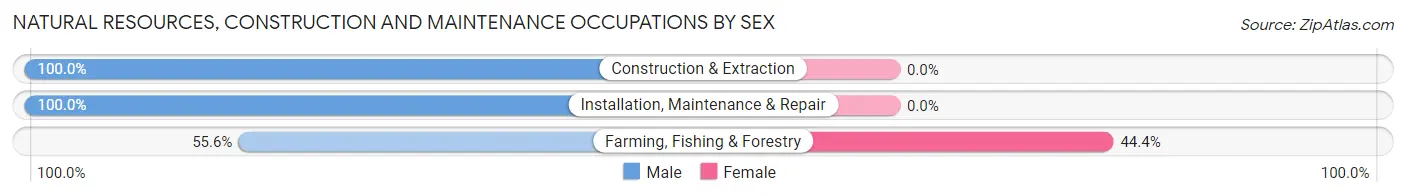
| Occupation | Male | Female |
| Farming, Fishing & Forestry | 5 (55.6%) | 4 (44.4%) |
| Construction & Extraction | 42 (100.0%) | 0 (0.0%) |
| Installation, Maintenance & Repair | 10 (100.0%) | 0 (0.0%) |
| Total (Category) | 57 (93.4%) | 4 (6.6%) |
| Total (Overall) | 182 (49.9%) | 183 (50.1%) |
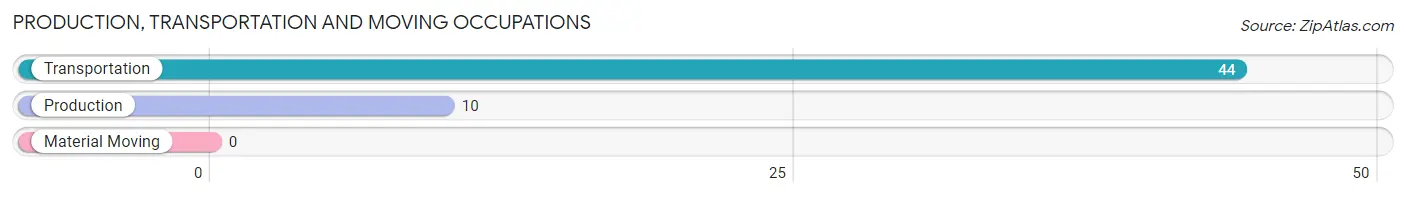
Production, Transportation and Moving Occupations
The most common Production, Transportation and Moving occupations in Crawford are Transportation (44 | 12.0%), and Production (10 | 2.7%).
Production, Transportation and Moving Occupations by Sex
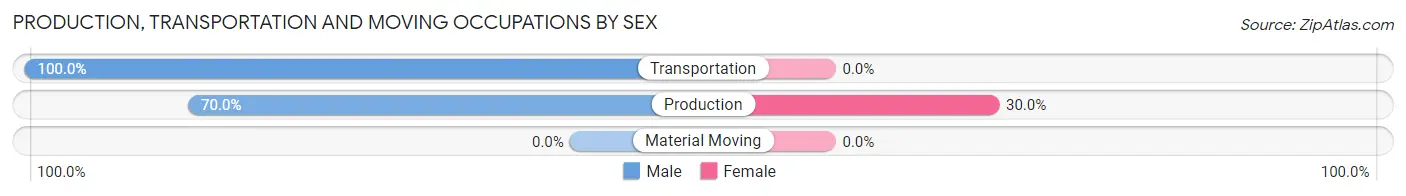
| Occupation | Male | Female |
| Production | 7 (70.0%) | 3 (30.0%) |
| Transportation | 44 (100.0%) | 0 (0.0%) |
| Material Moving | 0 (0.0%) | 0 (0.0%) |
| Total (Category) | 51 (94.4%) | 3 (5.6%) |
| Total (Overall) | 182 (49.9%) | 183 (50.1%) |
Employment Industries by Sex in Crawford
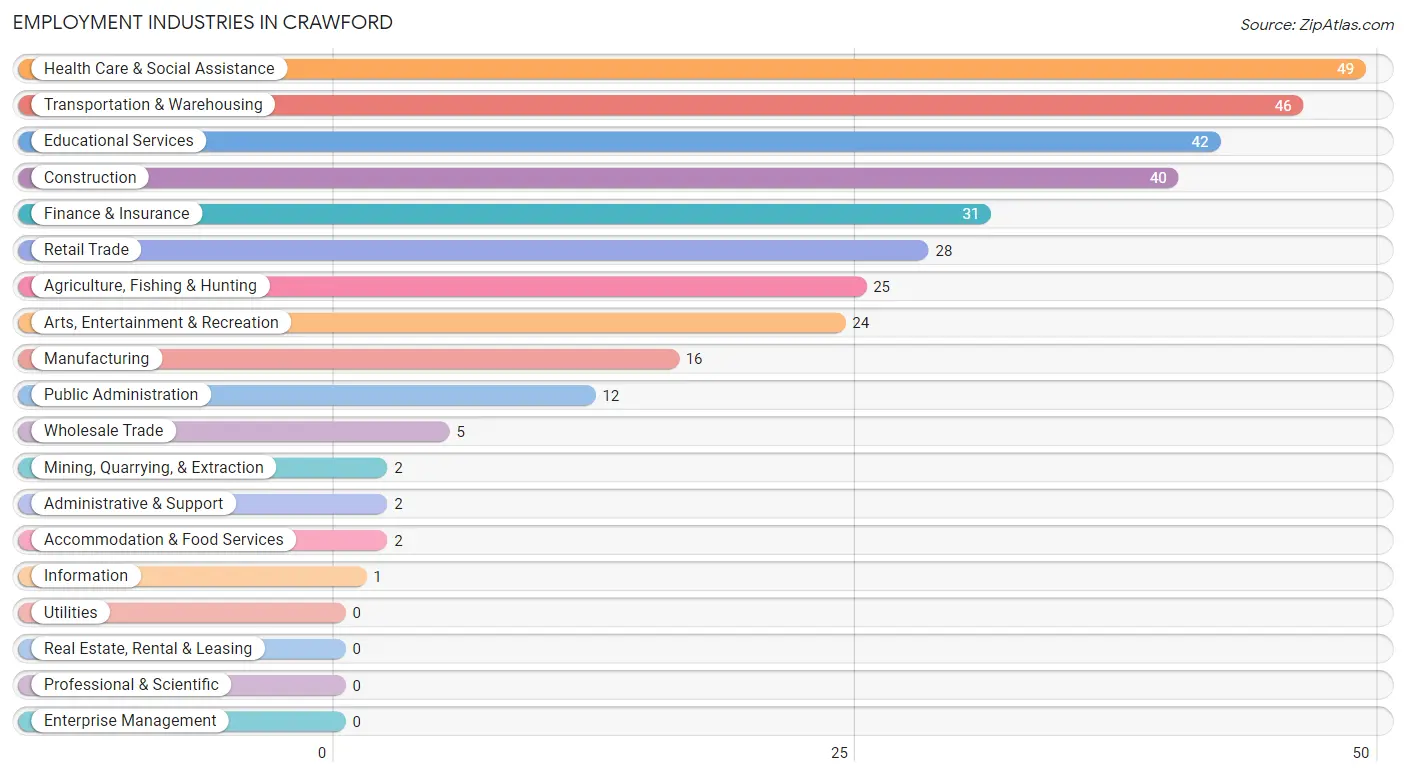
Employment Industries in Crawford
The major employment industries in Crawford include Health Care & Social Assistance (49 | 13.4%), Transportation & Warehousing (46 | 12.6%), Educational Services (42 | 11.5%), Construction (40 | 11.0%), and Finance & Insurance (31 | 8.5%).
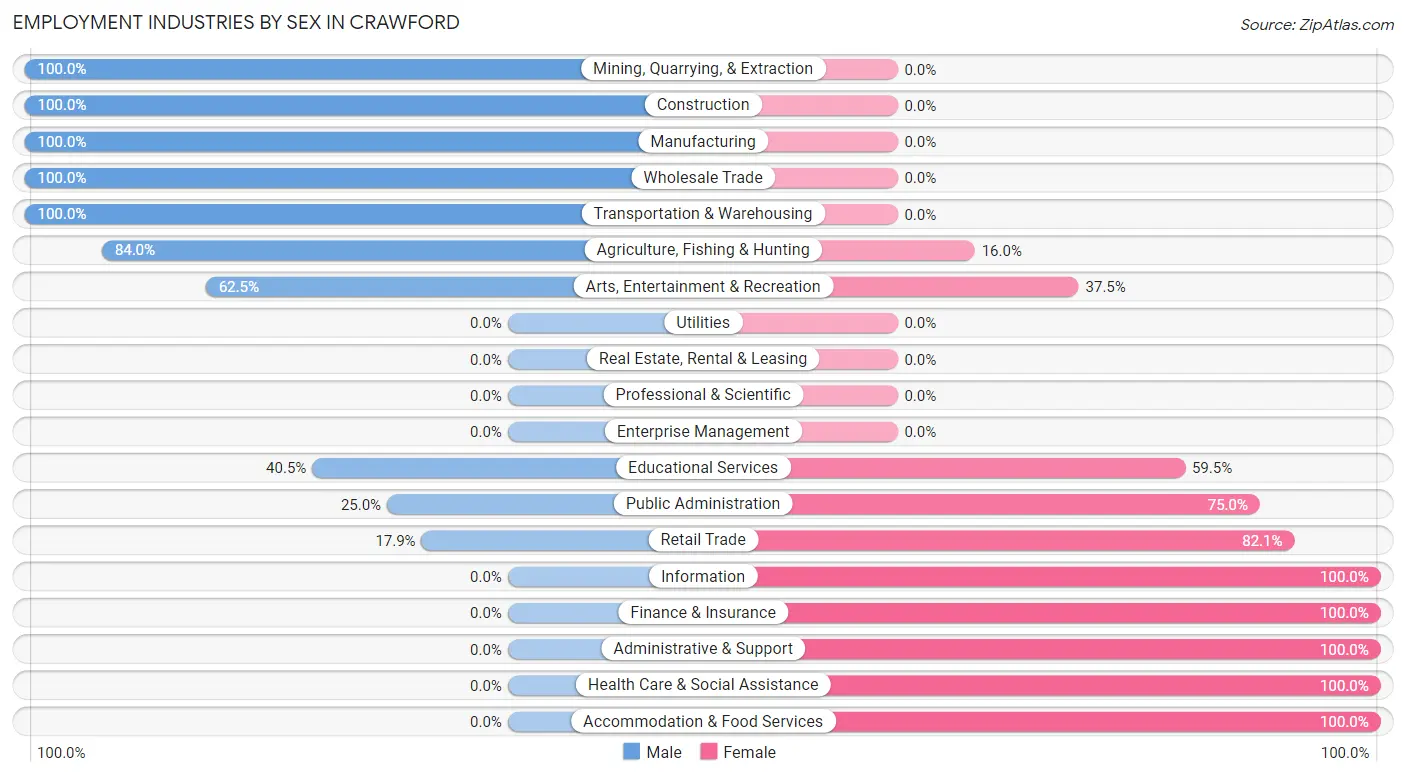
Employment Industries by Sex in Crawford
The Crawford industries that see more men than women are Mining, Quarrying, & Extraction (100.0%), Construction (100.0%), and Manufacturing (100.0%), whereas the industries that tend to have a higher number of women are Information (100.0%), Finance & Insurance (100.0%), and Administrative & Support (100.0%).
| Industry | Male | Female |
| Agriculture, Fishing & Hunting | 21 (84.0%) | 4 (16.0%) |
| Mining, Quarrying, & Extraction | 2 (100.0%) | 0 (0.0%) |
| Construction | 40 (100.0%) | 0 (0.0%) |
| Manufacturing | 16 (100.0%) | 0 (0.0%) |
| Wholesale Trade | 5 (100.0%) | 0 (0.0%) |
| Retail Trade | 5 (17.9%) | 23 (82.1%) |
| Transportation & Warehousing | 46 (100.0%) | 0 (0.0%) |
| Utilities | 0 (0.0%) | 0 (0.0%) |
| Information | 0 (0.0%) | 1 (100.0%) |
| Finance & Insurance | 0 (0.0%) | 31 (100.0%) |
| Real Estate, Rental & Leasing | 0 (0.0%) | 0 (0.0%) |
| Professional & Scientific | 0 (0.0%) | 0 (0.0%) |
| Enterprise Management | 0 (0.0%) | 0 (0.0%) |
| Administrative & Support | 0 (0.0%) | 2 (100.0%) |
| Educational Services | 17 (40.5%) | 25 (59.5%) |
| Health Care & Social Assistance | 0 (0.0%) | 49 (100.0%) |
| Arts, Entertainment & Recreation | 15 (62.5%) | 9 (37.5%) |
| Accommodation & Food Services | 0 (0.0%) | 2 (100.0%) |
| Public Administration | 3 (25.0%) | 9 (75.0%) |
| Total | 182 (49.9%) | 183 (50.1%) |
Education in Crawford
School Enrollment in Crawford
The most common levels of schooling among the 216 students in Crawford are high school (84 | 38.9%), elementary school (48 | 22.2%), and middle school (48 | 22.2%).
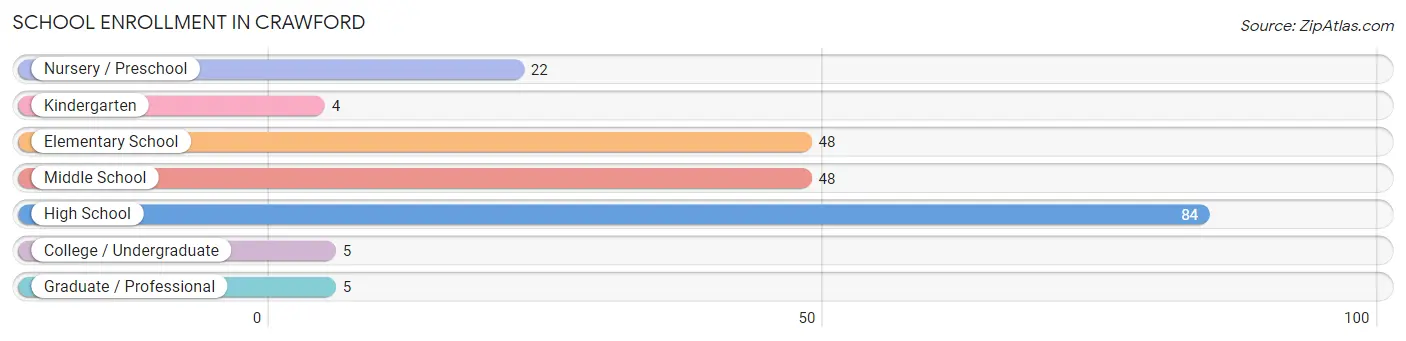
| School Level | # Students | % Students |
| Nursery / Preschool | 22 | 10.2% |
| Kindergarten | 4 | 1.8% |
| Elementary School | 48 | 22.2% |
| Middle School | 48 | 22.2% |
| High School | 84 | 38.9% |
| College / Undergraduate | 5 | 2.3% |
| Graduate / Professional | 5 | 2.3% |
| Total | 216 | 100.0% |
School Enrollment by Age by Funding Source in Crawford
Out of a total of 216 students who are enrolled in schools in Crawford, 14 (6.5%) attend a private institution, while the remaining 202 (93.5%) are enrolled in public schools. The age group of 20 to 24 year olds has the highest likelihood of being enrolled in private schools, with 2 (100.0% in the age bracket) enrolled. Conversely, the age group of 3 to 4 year olds has the lowest likelihood of being enrolled in a private school, with 12 (100.0% in the age bracket) attending a public institution.
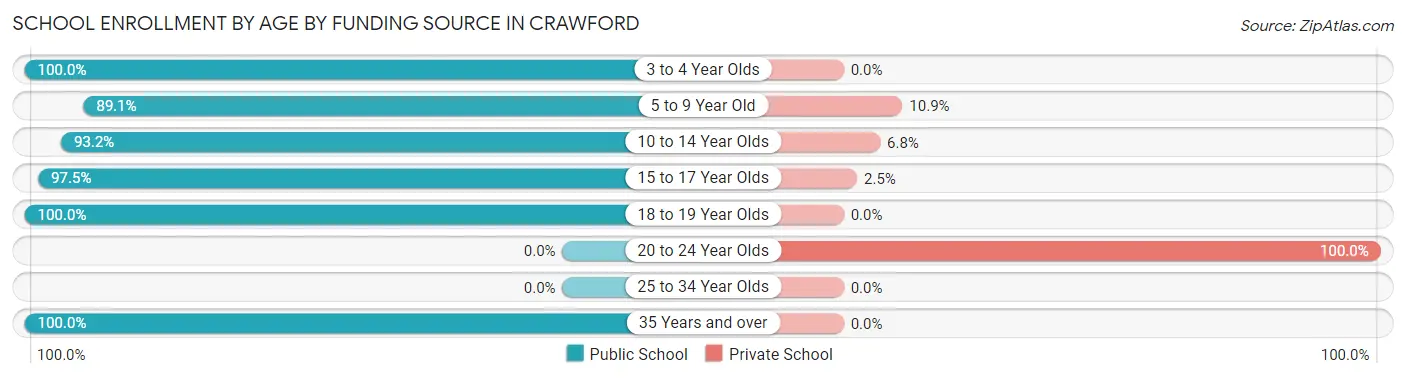
| Age Bracket | Public School | Private School |
| 3 to 4 Year Olds | 12 (100.0%) | 0 (0.0%) |
| 5 to 9 Year Old | 57 (89.1%) | 7 (10.9%) |
| 10 to 14 Year Olds | 55 (93.2%) | 4 (6.8%) |
| 15 to 17 Year Olds | 39 (97.5%) | 1 (2.5%) |
| 18 to 19 Year Olds | 29 (100.0%) | 0 (0.0%) |
| 20 to 24 Year Olds | 0 (0.0%) | 2 (100.0%) |
| 25 to 34 Year Olds | 0 (0.0%) | 0 (0.0%) |
| 35 Years and over | 10 (100.0%) | 0 (0.0%) |
| Total | 202 (93.5%) | 14 (6.5%) |
Educational Attainment by Field of Study in Crawford
Education (48 | 31.8%), arts & humanities (24 | 15.9%), business (22 | 14.6%), visual & performing arts (11 | 7.3%), and communications (11 | 7.3%) are the most common fields of study among 151 individuals in Crawford who have obtained a bachelor's degree or higher.
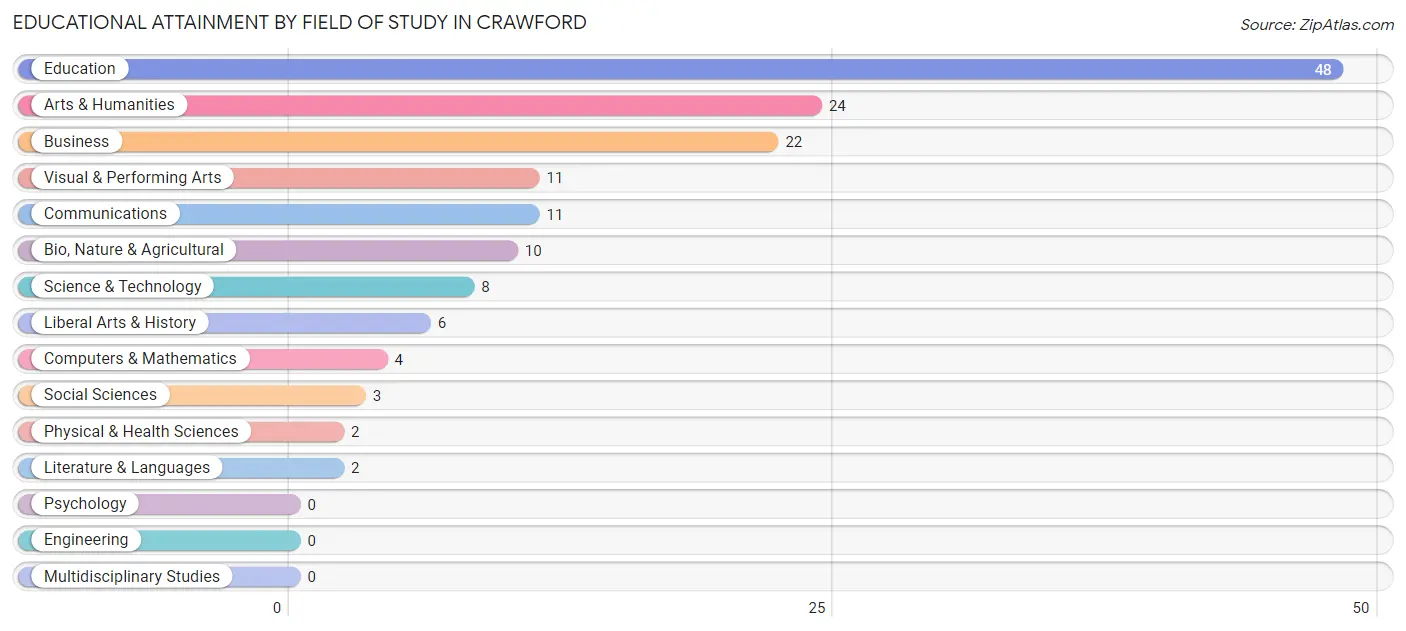
| Field of Study | # Graduates | % Graduates |
| Computers & Mathematics | 4 | 2.6% |
| Bio, Nature & Agricultural | 10 | 6.6% |
| Physical & Health Sciences | 2 | 1.3% |
| Psychology | 0 | 0.0% |
| Social Sciences | 3 | 2.0% |
| Engineering | 0 | 0.0% |
| Multidisciplinary Studies | 0 | 0.0% |
| Science & Technology | 8 | 5.3% |
| Business | 22 | 14.6% |
| Education | 48 | 31.8% |
| Literature & Languages | 2 | 1.3% |
| Liberal Arts & History | 6 | 4.0% |
| Visual & Performing Arts | 11 | 7.3% |
| Communications | 11 | 7.3% |
| Arts & Humanities | 24 | 15.9% |
| Total | 151 | 100.0% |
Transportation & Commute in Crawford
Vehicle Availability by Sex in Crawford
The most prevalent vehicle ownership categories in Crawford are males with 2 vehicles (67, accounting for 36.8%) and females with 2 vehicles (74, making up 37.2%).
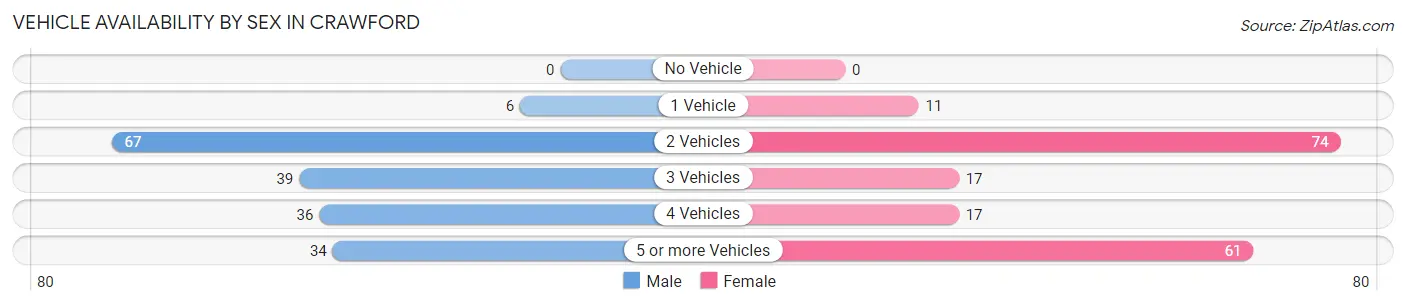
| Vehicles Available | Male | Female |
| No Vehicle | 0 (0.0%) | 0 (0.0%) |
| 1 Vehicle | 6 (3.3%) | 11 (6.1%) |
| 2 Vehicles | 67 (36.8%) | 74 (41.1%) |
| 3 Vehicles | 39 (21.4%) | 17 (9.4%) |
| 4 Vehicles | 36 (19.8%) | 17 (9.4%) |
| 5 or more Vehicles | 34 (18.7%) | 61 (33.9%) |
| Total | 182 (100.0%) | 180 (100.0%) |
Commute Time in Crawford
The most frequently occuring commute durations in Crawford are 5 to 9 minutes (78 commuters, 27.0%), less than 5 minutes (53 commuters, 18.3%), and 60 to 89 minutes (49 commuters, 17.0%).
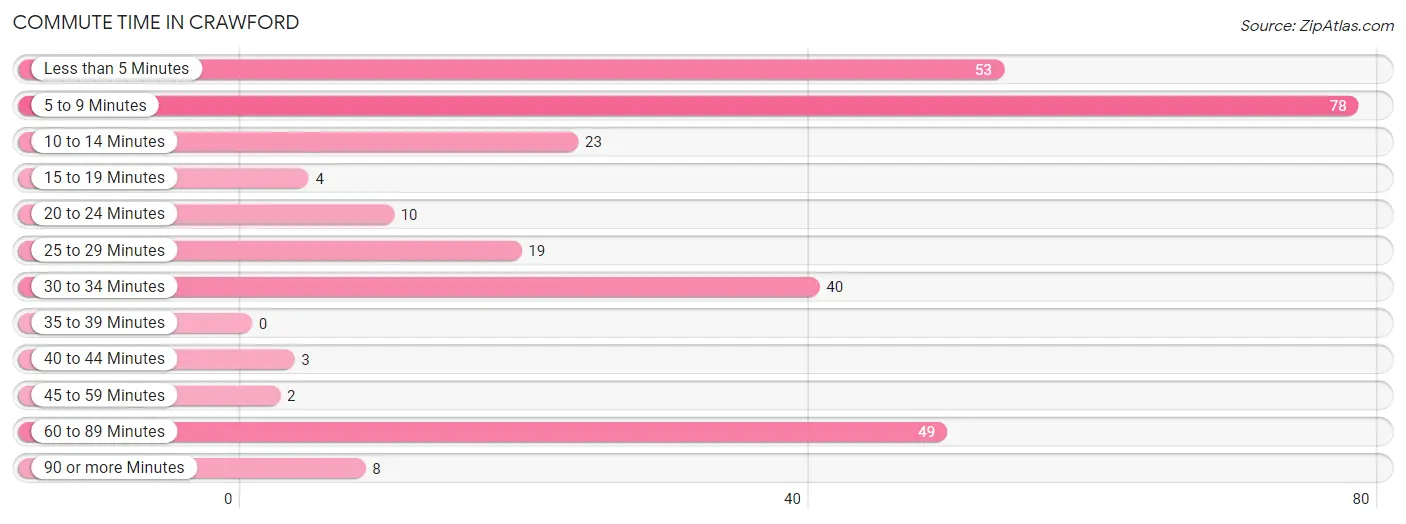
| Commute Time | # Commuters | % Commuters |
| Less than 5 Minutes | 53 | 18.3% |
| 5 to 9 Minutes | 78 | 27.0% |
| 10 to 14 Minutes | 23 | 8.0% |
| 15 to 19 Minutes | 4 | 1.4% |
| 20 to 24 Minutes | 10 | 3.5% |
| 25 to 29 Minutes | 19 | 6.6% |
| 30 to 34 Minutes | 40 | 13.8% |
| 35 to 39 Minutes | 0 | 0.0% |
| 40 to 44 Minutes | 3 | 1.0% |
| 45 to 59 Minutes | 2 | 0.7% |
| 60 to 89 Minutes | 49 | 17.0% |
| 90 or more Minutes | 8 | 2.8% |
Commute Time by Sex in Crawford
The most common commute times in Crawford are 60 to 89 minutes (45 commuters, 30.8%) for males and 5 to 9 minutes (56 commuters, 39.2%) for females.
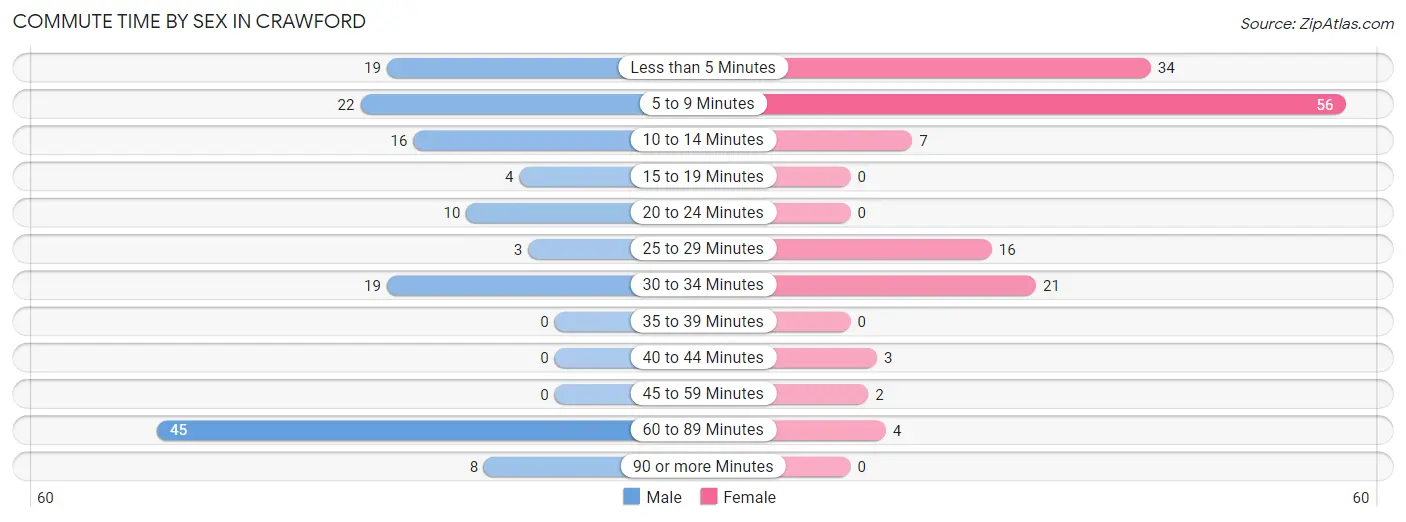
| Commute Time | Male | Female |
| Less than 5 Minutes | 19 (13.0%) | 34 (23.8%) |
| 5 to 9 Minutes | 22 (15.1%) | 56 (39.2%) |
| 10 to 14 Minutes | 16 (11.0%) | 7 (4.9%) |
| 15 to 19 Minutes | 4 (2.7%) | 0 (0.0%) |
| 20 to 24 Minutes | 10 (6.9%) | 0 (0.0%) |
| 25 to 29 Minutes | 3 (2.1%) | 16 (11.2%) |
| 30 to 34 Minutes | 19 (13.0%) | 21 (14.7%) |
| 35 to 39 Minutes | 0 (0.0%) | 0 (0.0%) |
| 40 to 44 Minutes | 0 (0.0%) | 3 (2.1%) |
| 45 to 59 Minutes | 0 (0.0%) | 2 (1.4%) |
| 60 to 89 Minutes | 45 (30.8%) | 4 (2.8%) |
| 90 or more Minutes | 8 (5.5%) | 0 (0.0%) |
Time of Departure to Work by Sex in Crawford
The most frequent times of departure to work in Crawford are 6:30 AM to 6:59 AM (39, 26.7%) for males and 7:30 AM to 7:59 AM (37, 25.9%) for females.
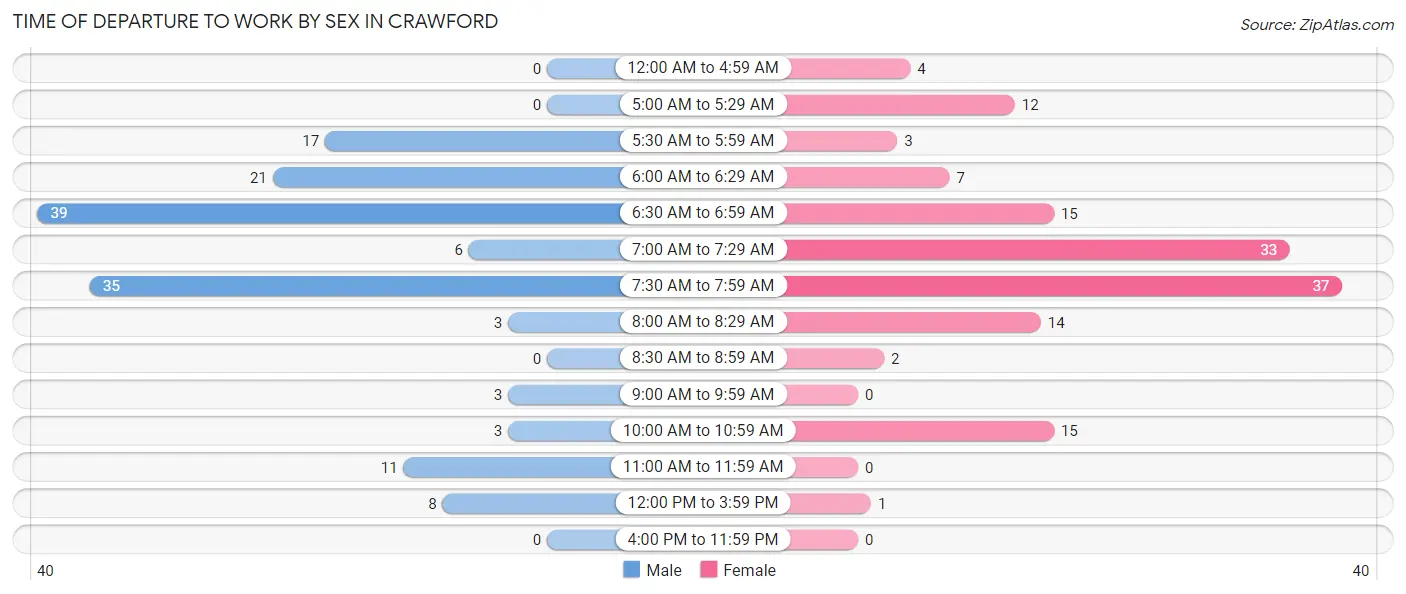
| Time of Departure | Male | Female |
| 12:00 AM to 4:59 AM | 0 (0.0%) | 4 (2.8%) |
| 5:00 AM to 5:29 AM | 0 (0.0%) | 12 (8.4%) |
| 5:30 AM to 5:59 AM | 17 (11.6%) | 3 (2.1%) |
| 6:00 AM to 6:29 AM | 21 (14.4%) | 7 (4.9%) |
| 6:30 AM to 6:59 AM | 39 (26.7%) | 15 (10.5%) |
| 7:00 AM to 7:29 AM | 6 (4.1%) | 33 (23.1%) |
| 7:30 AM to 7:59 AM | 35 (24.0%) | 37 (25.9%) |
| 8:00 AM to 8:29 AM | 3 (2.1%) | 14 (9.8%) |
| 8:30 AM to 8:59 AM | 0 (0.0%) | 2 (1.4%) |
| 9:00 AM to 9:59 AM | 3 (2.1%) | 0 (0.0%) |
| 10:00 AM to 10:59 AM | 3 (2.1%) | 15 (10.5%) |
| 11:00 AM to 11:59 AM | 11 (7.5%) | 0 (0.0%) |
| 12:00 PM to 3:59 PM | 8 (5.5%) | 1 (0.7%) |
| 4:00 PM to 11:59 PM | 0 (0.0%) | 0 (0.0%) |
| Total | 146 (100.0%) | 143 (100.0%) |
Housing Occupancy in Crawford
Occupancy by Ownership in Crawford
Of the total 396 dwellings in Crawford, owner-occupied units account for 327 (82.6%), while renter-occupied units make up 69 (17.4%).
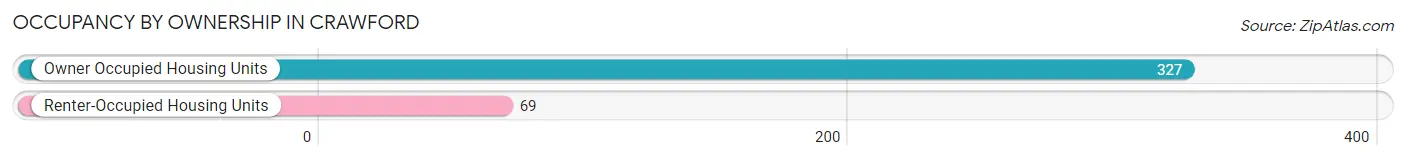
| Occupancy | # Housing Units | % Housing Units |
| Owner Occupied Housing Units | 327 | 82.6% |
| Renter-Occupied Housing Units | 69 | 17.4% |
| Total Occupied Housing Units | 396 | 100.0% |
Occupancy by Household Size in Crawford
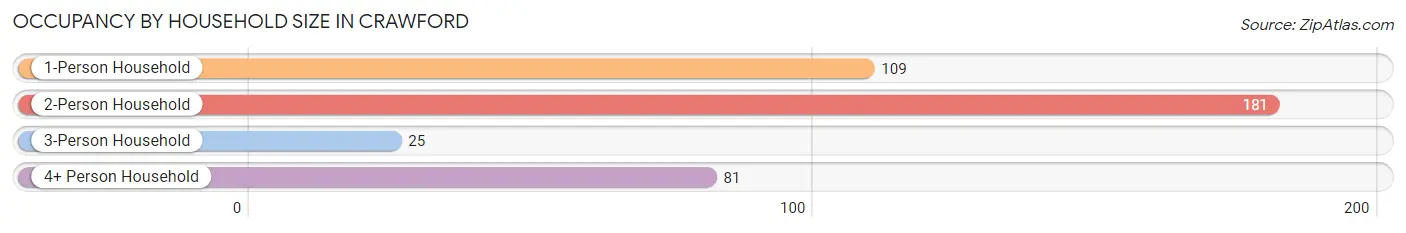
| Household Size | # Housing Units | % Housing Units |
| 1-Person Household | 109 | 27.5% |
| 2-Person Household | 181 | 45.7% |
| 3-Person Household | 25 | 6.3% |
| 4+ Person Household | 81 | 20.4% |
| Total Housing Units | 396 | 100.0% |
Occupancy by Ownership by Household Size in Crawford
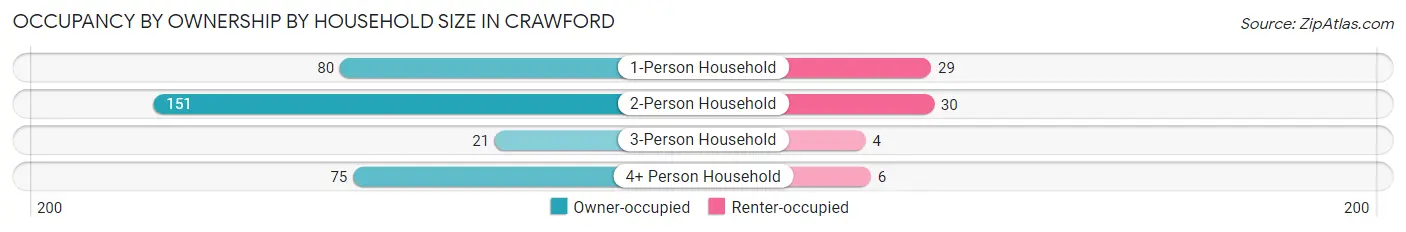
| Household Size | Owner-occupied | Renter-occupied |
| 1-Person Household | 80 (73.4%) | 29 (26.6%) |
| 2-Person Household | 151 (83.4%) | 30 (16.6%) |
| 3-Person Household | 21 (84.0%) | 4 (16.0%) |
| 4+ Person Household | 75 (92.6%) | 6 (7.4%) |
| Total Housing Units | 327 (82.6%) | 69 (17.4%) |
Occupancy by Educational Attainment in Crawford
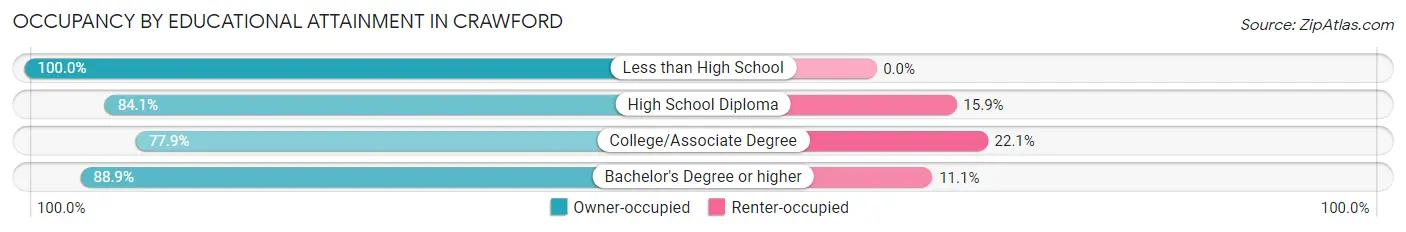
| Household Size | Owner-occupied | Renter-occupied |
| Less than High School | 2 (100.0%) | 0 (0.0%) |
| High School Diploma | 111 (84.1%) | 21 (15.9%) |
| College/Associate Degree | 134 (77.9%) | 38 (22.1%) |
| Bachelor's Degree or higher | 80 (88.9%) | 10 (11.1%) |
Occupancy by Age of Householder in Crawford
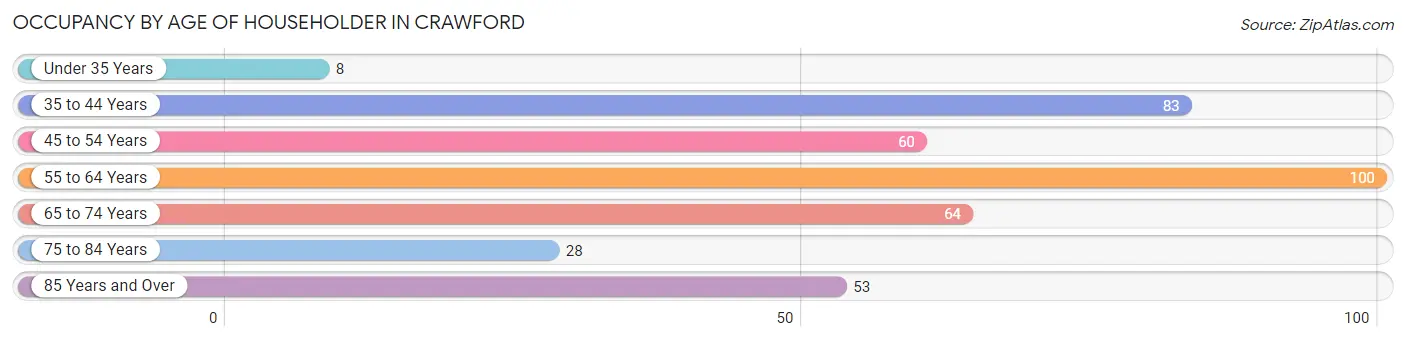
| Age Bracket | # Households | % Households |
| Under 35 Years | 8 | 2.0% |
| 35 to 44 Years | 83 | 21.0% |
| 45 to 54 Years | 60 | 15.1% |
| 55 to 64 Years | 100 | 25.3% |
| 65 to 74 Years | 64 | 16.2% |
| 75 to 84 Years | 28 | 7.1% |
| 85 Years and Over | 53 | 13.4% |
| Total | 396 | 100.0% |
Housing Finances in Crawford
Median Income by Occupancy in Crawford
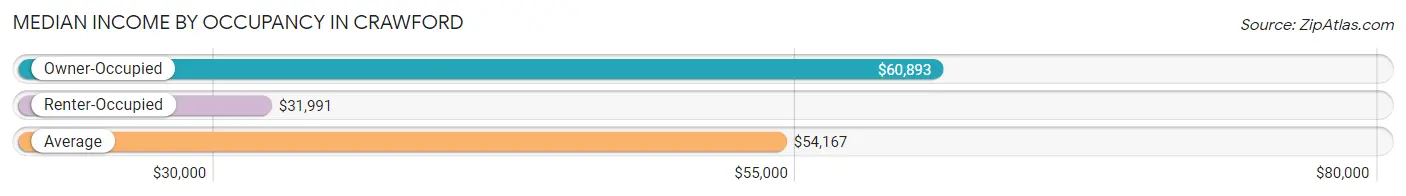
| Occupancy Type | # Households | Median Income |
| Owner-Occupied | 327 (82.6%) | $60,893 |
| Renter-Occupied | 69 (17.4%) | $31,991 |
| Average | 396 (100.0%) | $54,167 |
Occupancy by Householder Income Bracket in Crawford
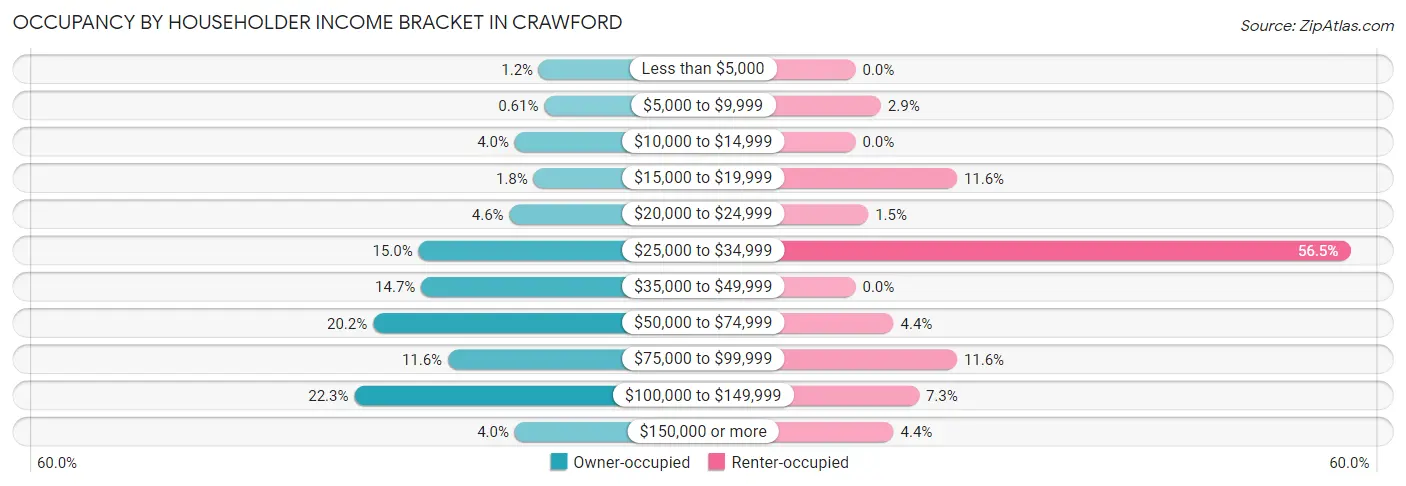
| Income Bracket | Owner-occupied | Renter-occupied |
| Less than $5,000 | 4 (1.2%) | 0 (0.0%) |
| $5,000 to $9,999 | 2 (0.6%) | 2 (2.9%) |
| $10,000 to $14,999 | 13 (4.0%) | 0 (0.0%) |
| $15,000 to $19,999 | 6 (1.8%) | 8 (11.6%) |
| $20,000 to $24,999 | 15 (4.6%) | 1 (1.5%) |
| $25,000 to $34,999 | 49 (15.0%) | 39 (56.5%) |
| $35,000 to $49,999 | 48 (14.7%) | 0 (0.0%) |
| $50,000 to $74,999 | 66 (20.2%) | 3 (4.3%) |
| $75,000 to $99,999 | 38 (11.6%) | 8 (11.6%) |
| $100,000 to $149,999 | 73 (22.3%) | 5 (7.2%) |
| $150,000 or more | 13 (4.0%) | 3 (4.3%) |
| Total | 327 (100.0%) | 69 (100.0%) |
Monthly Housing Cost Tiers in Crawford
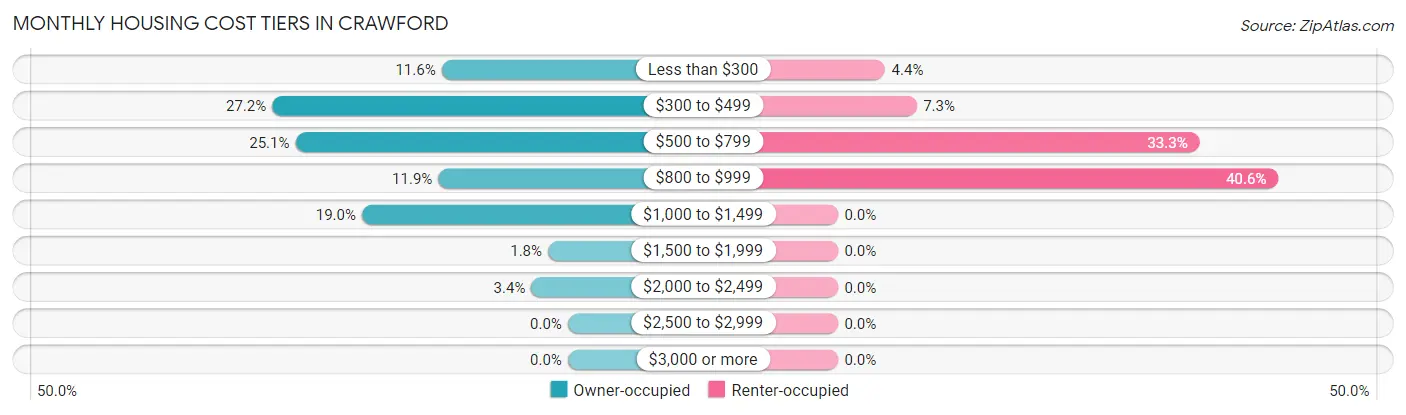
| Monthly Cost | Owner-occupied | Renter-occupied |
| Less than $300 | 38 (11.6%) | 3 (4.3%) |
| $300 to $499 | 89 (27.2%) | 5 (7.2%) |
| $500 to $799 | 82 (25.1%) | 23 (33.3%) |
| $800 to $999 | 39 (11.9%) | 28 (40.6%) |
| $1,000 to $1,499 | 62 (19.0%) | 0 (0.0%) |
| $1,500 to $1,999 | 6 (1.8%) | 0 (0.0%) |
| $2,000 to $2,499 | 11 (3.4%) | 0 (0.0%) |
| $2,500 to $2,999 | 0 (0.0%) | 0 (0.0%) |
| $3,000 or more | 0 (0.0%) | 0 (0.0%) |
| Total | 327 (100.0%) | 69 (100.0%) |
Physical Housing Characteristics in Crawford
Housing Structures in Crawford
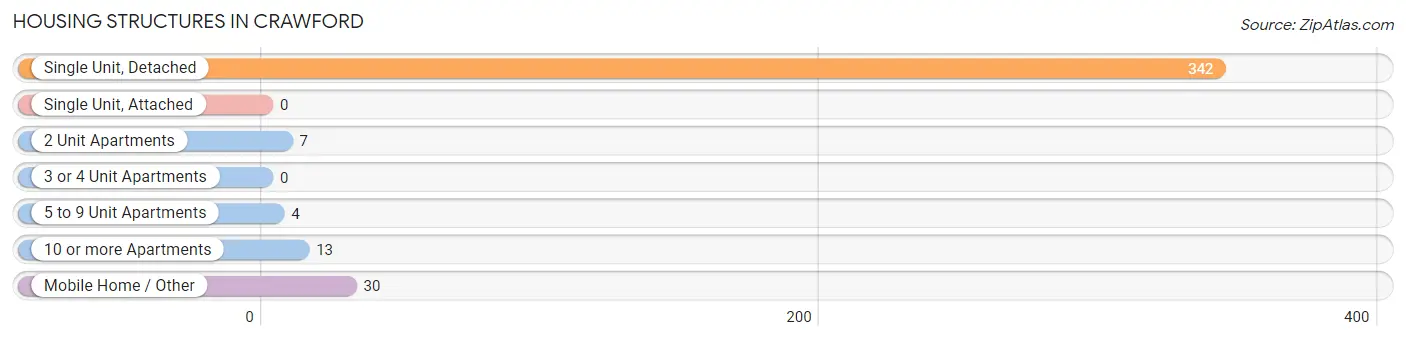
| Structure Type | # Housing Units | % Housing Units |
| Single Unit, Detached | 342 | 86.4% |
| Single Unit, Attached | 0 | 0.0% |
| 2 Unit Apartments | 7 | 1.8% |
| 3 or 4 Unit Apartments | 0 | 0.0% |
| 5 to 9 Unit Apartments | 4 | 1.0% |
| 10 or more Apartments | 13 | 3.3% |
| Mobile Home / Other | 30 | 7.6% |
| Total | 396 | 100.0% |
Housing Structures by Occupancy in Crawford
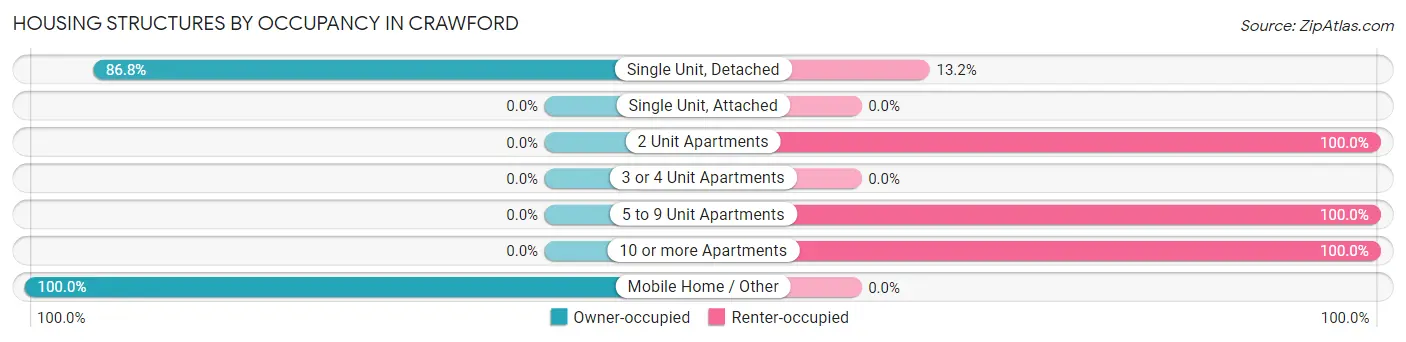
| Structure Type | Owner-occupied | Renter-occupied |
| Single Unit, Detached | 297 (86.8%) | 45 (13.2%) |
| Single Unit, Attached | 0 (0.0%) | 0 (0.0%) |
| 2 Unit Apartments | 0 (0.0%) | 7 (100.0%) |
| 3 or 4 Unit Apartments | 0 (0.0%) | 0 (0.0%) |
| 5 to 9 Unit Apartments | 0 (0.0%) | 4 (100.0%) |
| 10 or more Apartments | 0 (0.0%) | 13 (100.0%) |
| Mobile Home / Other | 30 (100.0%) | 0 (0.0%) |
| Total | 327 (82.6%) | 69 (17.4%) |
Housing Structures by Number of Rooms in Crawford
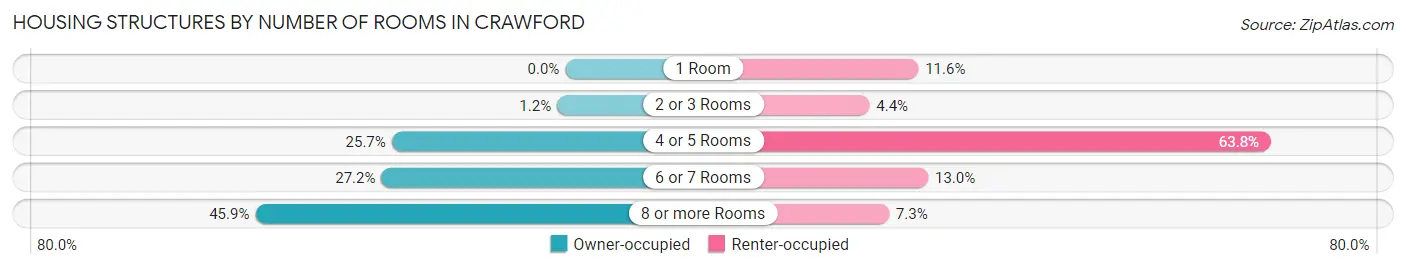
| Number of Rooms | Owner-occupied | Renter-occupied |
| 1 Room | 0 (0.0%) | 8 (11.6%) |
| 2 or 3 Rooms | 4 (1.2%) | 3 (4.3%) |
| 4 or 5 Rooms | 84 (25.7%) | 44 (63.8%) |
| 6 or 7 Rooms | 89 (27.2%) | 9 (13.0%) |
| 8 or more Rooms | 150 (45.9%) | 5 (7.2%) |
| Total | 327 (100.0%) | 69 (100.0%) |
Housing Structure by Heating Type in Crawford
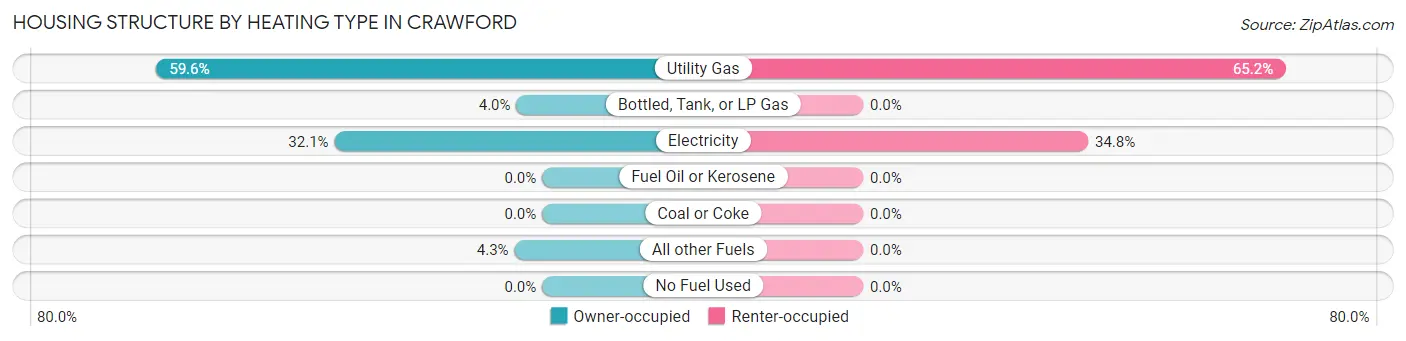
| Heating Type | Owner-occupied | Renter-occupied |
| Utility Gas | 195 (59.6%) | 45 (65.2%) |
| Bottled, Tank, or LP Gas | 13 (4.0%) | 0 (0.0%) |
| Electricity | 105 (32.1%) | 24 (34.8%) |
| Fuel Oil or Kerosene | 0 (0.0%) | 0 (0.0%) |
| Coal or Coke | 0 (0.0%) | 0 (0.0%) |
| All other Fuels | 14 (4.3%) | 0 (0.0%) |
| No Fuel Used | 0 (0.0%) | 0 (0.0%) |
| Total | 327 (100.0%) | 69 (100.0%) |
Household Vehicle Usage in Crawford
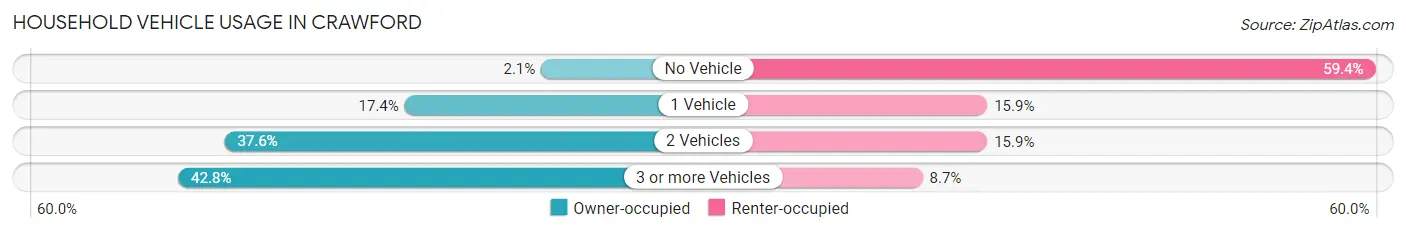
| Vehicles per Household | Owner-occupied | Renter-occupied |
| No Vehicle | 7 (2.1%) | 41 (59.4%) |
| 1 Vehicle | 57 (17.4%) | 11 (15.9%) |
| 2 Vehicles | 123 (37.6%) | 11 (15.9%) |
| 3 or more Vehicles | 140 (42.8%) | 6 (8.7%) |
| Total | 327 (100.0%) | 69 (100.0%) |
Real Estate & Mortgages in Crawford
Real Estate and Mortgage Overview in Crawford
| Characteristic | Without Mortgage | With Mortgage |
| Housing Units | 182 | 145 |
| Median Property Value | $58,800 | $88,500 |
| Median Household Income | $43,438 | $7 |
| Monthly Housing Costs | $428 | $0 |
| Real Estate Taxes | $1,034 | $10 |
Property Value by Mortgage Status in Crawford
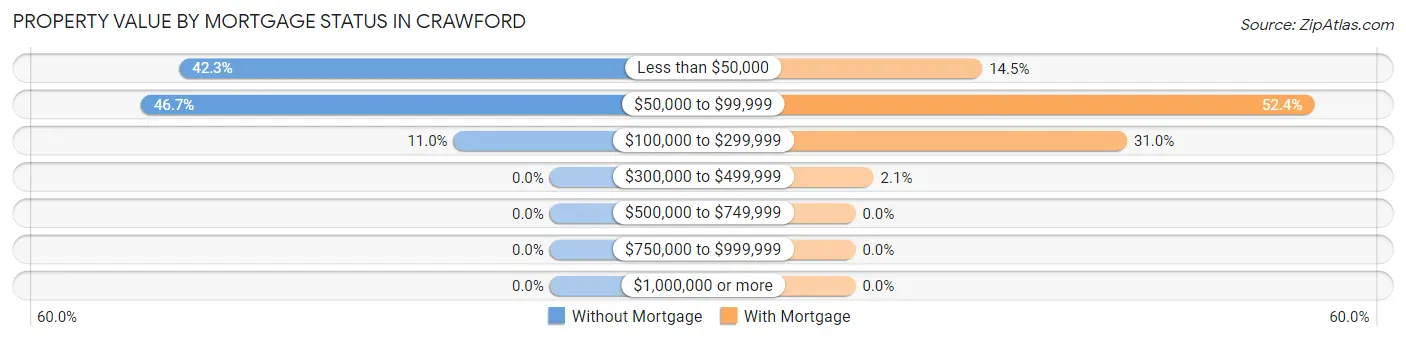
| Property Value | Without Mortgage | With Mortgage |
| Less than $50,000 | 77 (42.3%) | 21 (14.5%) |
| $50,000 to $99,999 | 85 (46.7%) | 76 (52.4%) |
| $100,000 to $299,999 | 20 (11.0%) | 45 (31.0%) |
| $300,000 to $499,999 | 0 (0.0%) | 3 (2.1%) |
| $500,000 to $749,999 | 0 (0.0%) | 0 (0.0%) |
| $750,000 to $999,999 | 0 (0.0%) | 0 (0.0%) |
| $1,000,000 or more | 0 (0.0%) | 0 (0.0%) |
| Total | 182 (100.0%) | 145 (100.0%) |
Household Income by Mortgage Status in Crawford
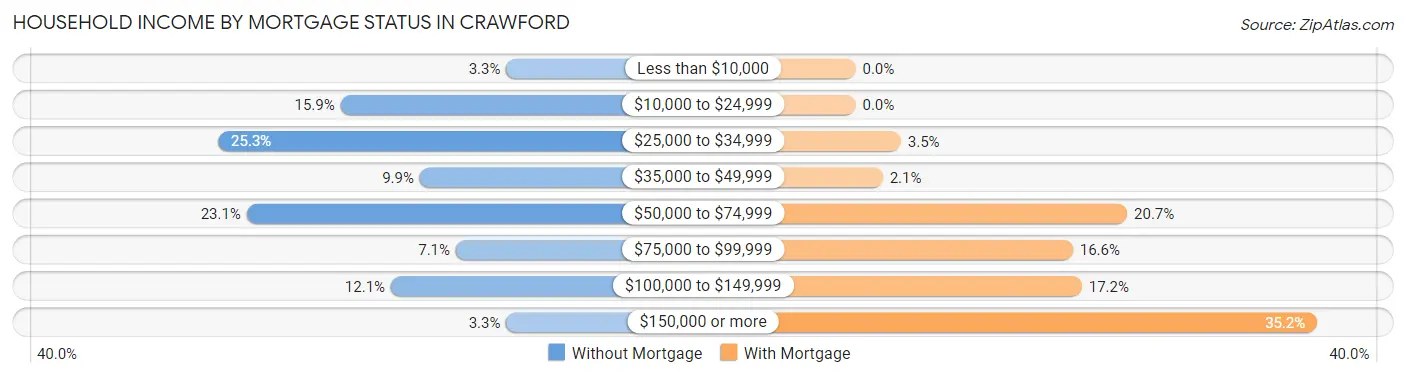
| Household Income | Without Mortgage | With Mortgage |
| Less than $10,000 | 6 (3.3%) | 0 (0.0%) |
| $10,000 to $24,999 | 29 (15.9%) | 0 (0.0%) |
| $25,000 to $34,999 | 46 (25.3%) | 5 (3.5%) |
| $35,000 to $49,999 | 18 (9.9%) | 3 (2.1%) |
| $50,000 to $74,999 | 42 (23.1%) | 30 (20.7%) |
| $75,000 to $99,999 | 13 (7.1%) | 24 (16.6%) |
| $100,000 to $149,999 | 22 (12.1%) | 25 (17.2%) |
| $150,000 or more | 6 (3.3%) | 51 (35.2%) |
| Total | 182 (100.0%) | 145 (100.0%) |
Property Value to Household Income Ratio in Crawford
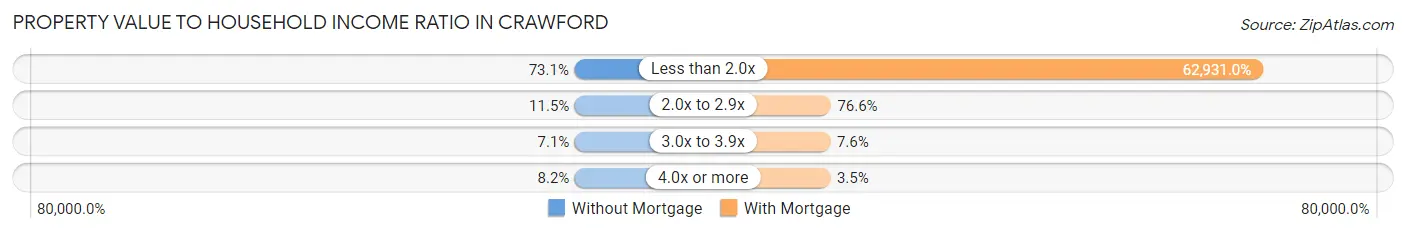
| Value-to-Income Ratio | Without Mortgage | With Mortgage |
| Less than 2.0x | 133 (73.1%) | 91,250 (62,931.0%) |
| 2.0x to 2.9x | 21 (11.5%) | 111 (76.5%) |
| 3.0x to 3.9x | 13 (7.1%) | 11 (7.6%) |
| 4.0x or more | 15 (8.2%) | 5 (3.5%) |
| Total | 182 (100.0%) | 145 (100.0%) |
Real Estate Taxes by Mortgage Status in Crawford
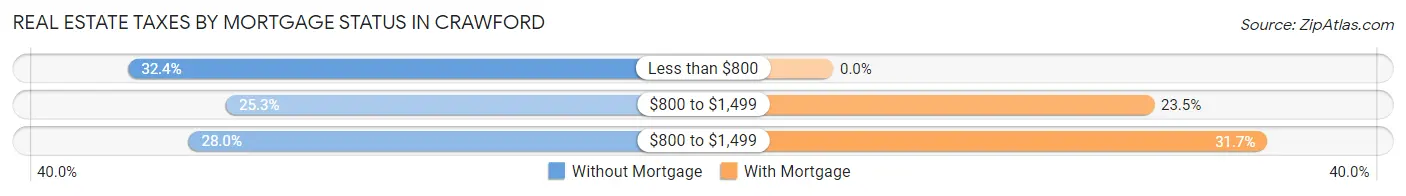
| Property Taxes | Without Mortgage | With Mortgage |
| Less than $800 | 59 (32.4%) | 0 (0.0%) |
| $800 to $1,499 | 46 (25.3%) | 34 (23.4%) |
| $800 to $1,499 | 51 (28.0%) | 46 (31.7%) |
| Total | 182 (100.0%) | 145 (100.0%) |
Health & Disability in Crawford
Health Insurance Coverage by Age in Crawford
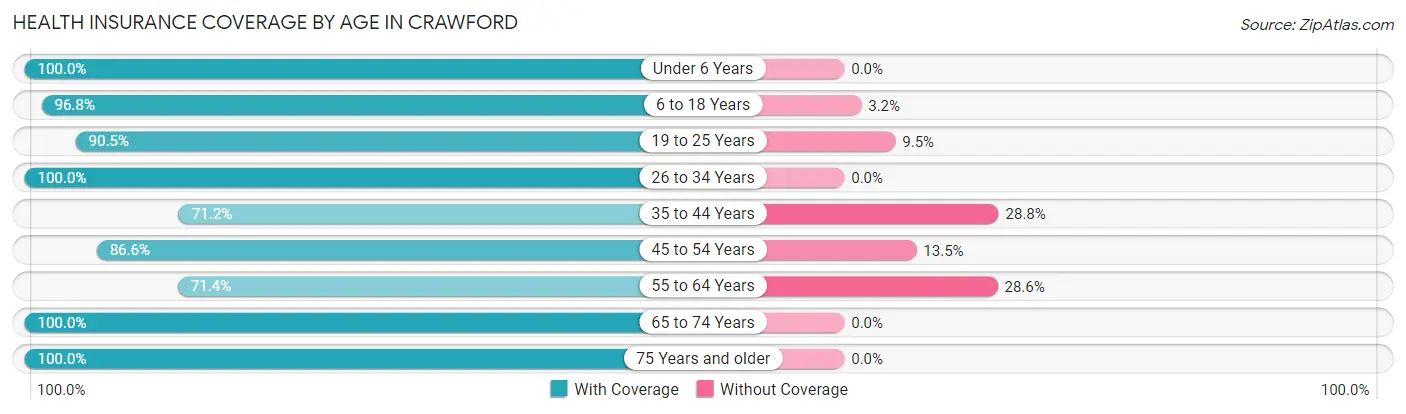
| Age Bracket | With Coverage | Without Coverage |
| Under 6 Years | 70 (100.0%) | 0 (0.0%) |
| 6 to 18 Years | 183 (96.8%) | 6 (3.2%) |
| 19 to 25 Years | 19 (90.5%) | 2 (9.5%) |
| 26 to 34 Years | 12 (100.0%) | 0 (0.0%) |
| 35 to 44 Years | 99 (71.2%) | 40 (28.8%) |
| 45 to 54 Years | 103 (86.6%) | 16 (13.5%) |
| 55 to 64 Years | 105 (71.4%) | 42 (28.6%) |
| 65 to 74 Years | 135 (100.0%) | 0 (0.0%) |
| 75 Years and older | 102 (100.0%) | 0 (0.0%) |
| Total | 828 (88.6%) | 106 (11.4%) |
Health Insurance Coverage by Citizenship Status in Crawford
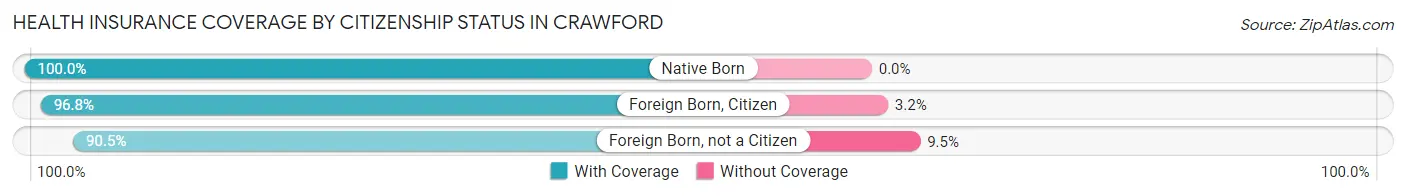
| Citizenship Status | With Coverage | Without Coverage |
| Native Born | 70 (100.0%) | 0 (0.0%) |
| Foreign Born, Citizen | 183 (96.8%) | 6 (3.2%) |
| Foreign Born, not a Citizen | 19 (90.5%) | 2 (9.5%) |
Health Insurance Coverage by Household Income in Crawford
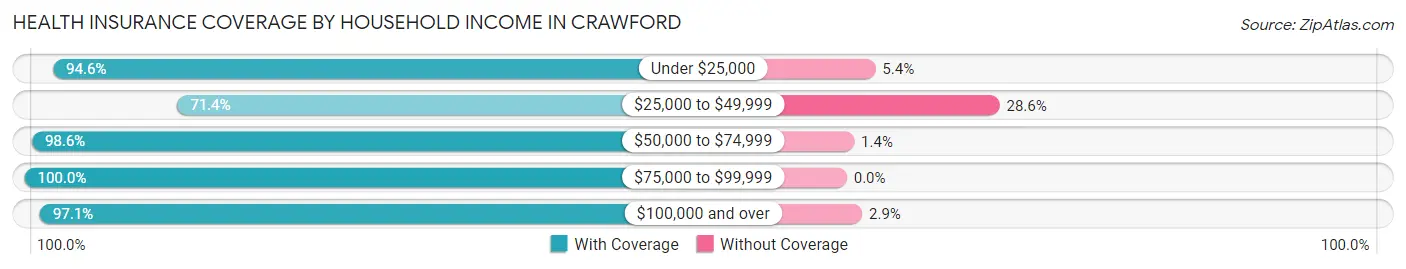
| Household Income | With Coverage | Without Coverage |
| Under $25,000 | 53 (94.6%) | 3 (5.4%) |
| $25,000 to $49,999 | 232 (71.4%) | 93 (28.6%) |
| $50,000 to $74,999 | 143 (98.6%) | 2 (1.4%) |
| $75,000 to $99,999 | 129 (100.0%) | 0 (0.0%) |
| $100,000 and over | 271 (97.1%) | 8 (2.9%) |
Public vs Private Health Insurance Coverage by Age in Crawford
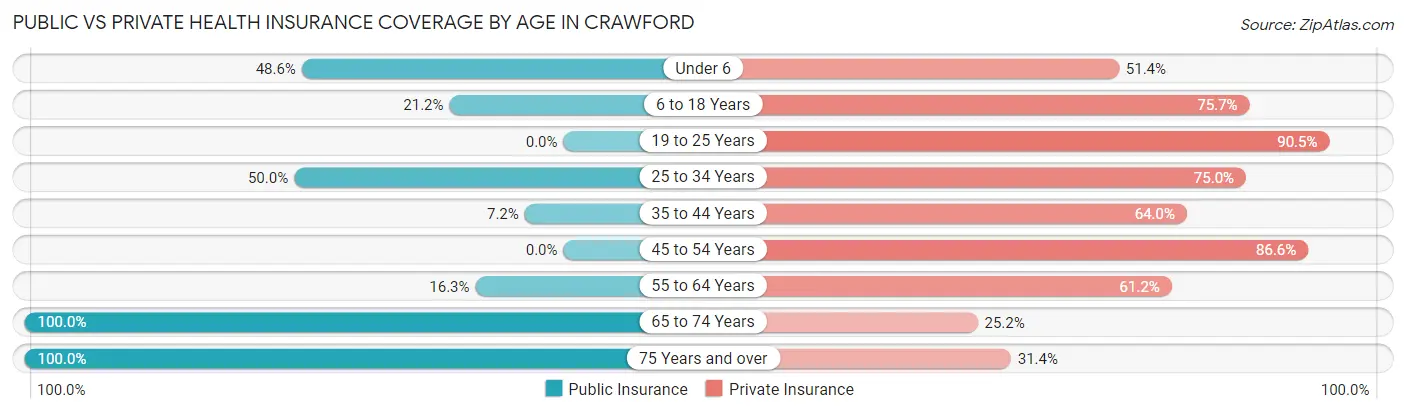
| Age Bracket | Public Insurance | Private Insurance |
| Under 6 | 34 (48.6%) | 36 (51.4%) |
| 6 to 18 Years | 40 (21.2%) | 143 (75.7%) |
| 19 to 25 Years | 0 (0.0%) | 19 (90.5%) |
| 25 to 34 Years | 6 (50.0%) | 9 (75.0%) |
| 35 to 44 Years | 10 (7.2%) | 89 (64.0%) |
| 45 to 54 Years | 0 (0.0%) | 103 (86.6%) |
| 55 to 64 Years | 24 (16.3%) | 90 (61.2%) |
| 65 to 74 Years | 135 (100.0%) | 34 (25.2%) |
| 75 Years and over | 102 (100.0%) | 32 (31.4%) |
| Total | 351 (37.6%) | 555 (59.4%) |
Disability Status by Sex by Age in Crawford
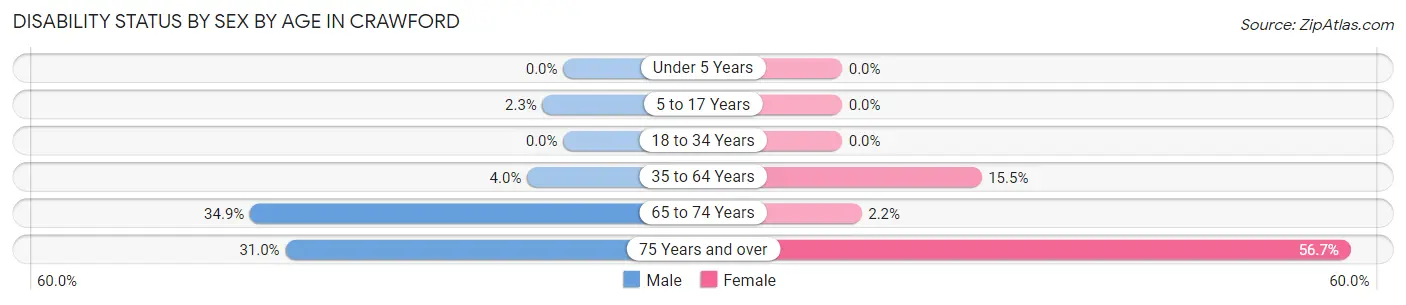
| Age Bracket | Male | Female |
| Under 5 Years | 0 (0.0%) | 0 (0.0%) |
| 5 to 17 Years | 2 (2.3%) | 0 (0.0%) |
| 18 to 34 Years | 0 (0.0%) | 0 (0.0%) |
| 35 to 64 Years | 8 (4.0%) | 32 (15.5%) |
| 65 to 74 Years | 15 (34.9%) | 2 (2.2%) |
| 75 Years and over | 13 (30.9%) | 34 (56.7%) |
Disability Class by Sex by Age in Crawford
Disability Class: Hearing Difficulty
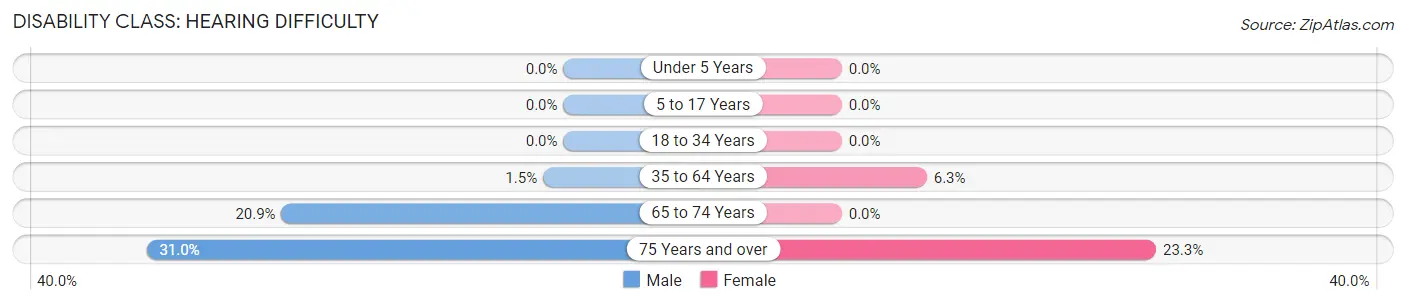
| Age Bracket | Male | Female |
| Under 5 Years | 0 (0.0%) | 0 (0.0%) |
| 5 to 17 Years | 0 (0.0%) | 0 (0.0%) |
| 18 to 34 Years | 0 (0.0%) | 0 (0.0%) |
| 35 to 64 Years | 3 (1.5%) | 13 (6.3%) |
| 65 to 74 Years | 9 (20.9%) | 0 (0.0%) |
| 75 Years and over | 13 (30.9%) | 14 (23.3%) |
Disability Class: Vision Difficulty
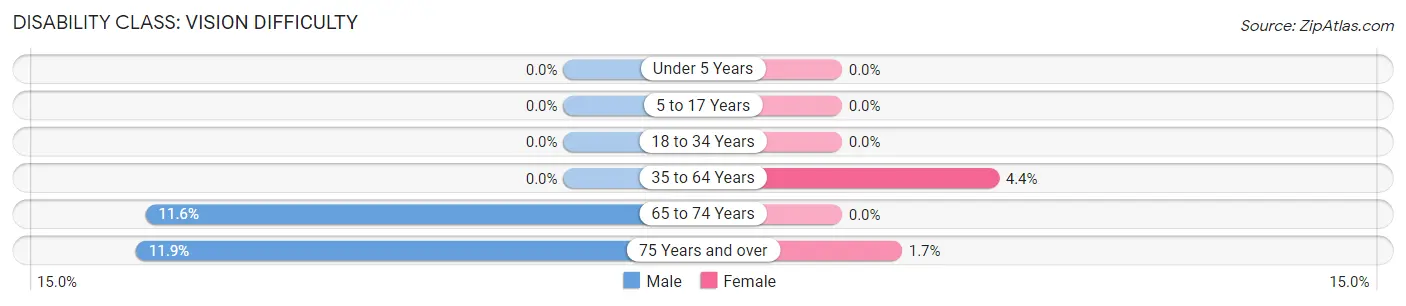
| Age Bracket | Male | Female |
| Under 5 Years | 0 (0.0%) | 0 (0.0%) |
| 5 to 17 Years | 0 (0.0%) | 0 (0.0%) |
| 18 to 34 Years | 0 (0.0%) | 0 (0.0%) |
| 35 to 64 Years | 0 (0.0%) | 9 (4.4%) |
| 65 to 74 Years | 5 (11.6%) | 0 (0.0%) |
| 75 Years and over | 5 (11.9%) | 1 (1.7%) |
Disability Class: Cognitive Difficulty
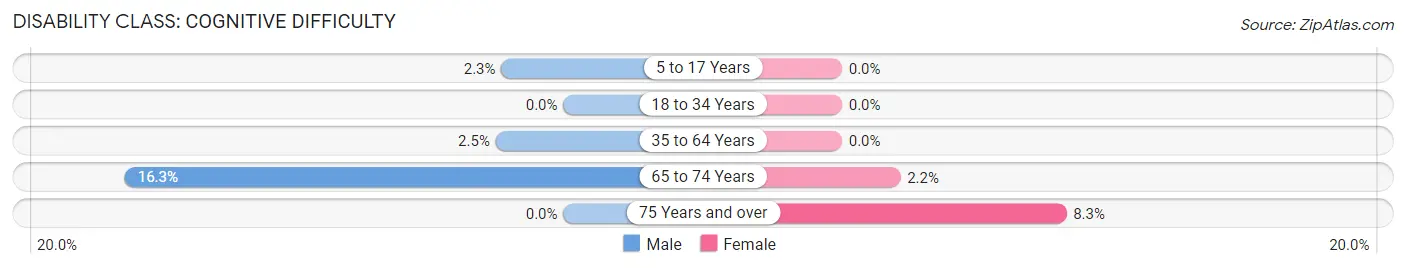
| Age Bracket | Male | Female |
| 5 to 17 Years | 2 (2.3%) | 0 (0.0%) |
| 18 to 34 Years | 0 (0.0%) | 0 (0.0%) |
| 35 to 64 Years | 5 (2.5%) | 0 (0.0%) |
| 65 to 74 Years | 7 (16.3%) | 2 (2.2%) |
| 75 Years and over | 0 (0.0%) | 5 (8.3%) |
Disability Class: Ambulatory Difficulty
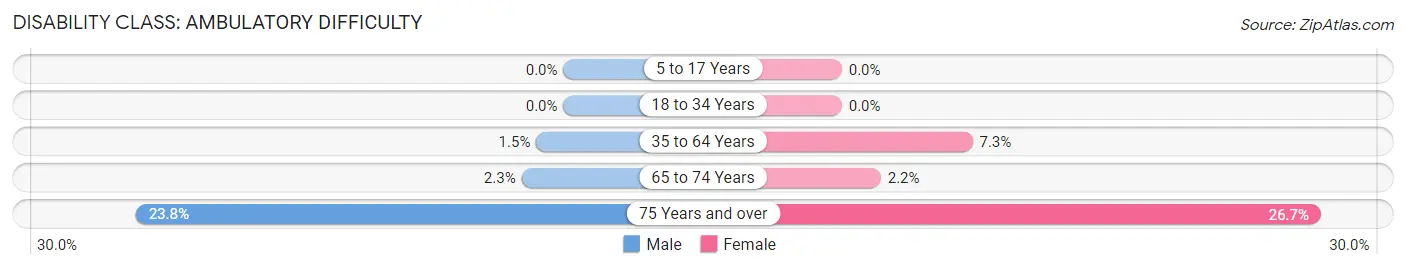
| Age Bracket | Male | Female |
| 5 to 17 Years | 0 (0.0%) | 0 (0.0%) |
| 18 to 34 Years | 0 (0.0%) | 0 (0.0%) |
| 35 to 64 Years | 3 (1.5%) | 15 (7.3%) |
| 65 to 74 Years | 1 (2.3%) | 2 (2.2%) |
| 75 Years and over | 10 (23.8%) | 16 (26.7%) |
Disability Class: Self-Care Difficulty
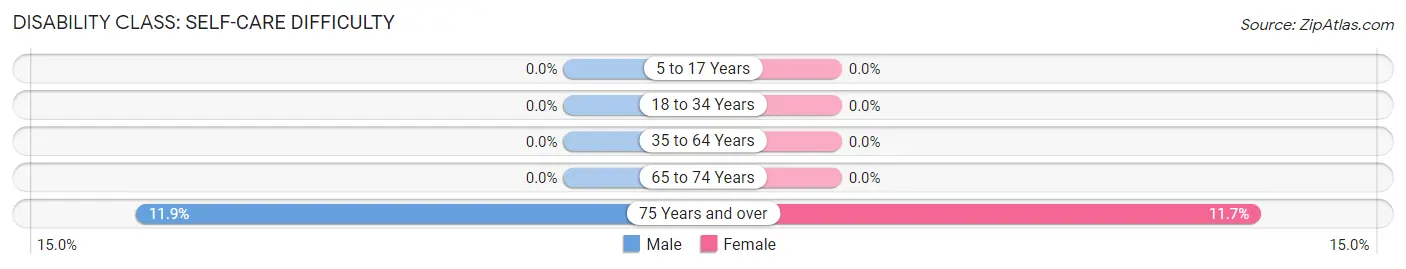
| Age Bracket | Male | Female |
| 5 to 17 Years | 0 (0.0%) | 0 (0.0%) |
| 18 to 34 Years | 0 (0.0%) | 0 (0.0%) |
| 35 to 64 Years | 0 (0.0%) | 0 (0.0%) |
| 65 to 74 Years | 0 (0.0%) | 0 (0.0%) |
| 75 Years and over | 5 (11.9%) | 7 (11.7%) |
Technology Access in Crawford
Computing Device Access in Crawford
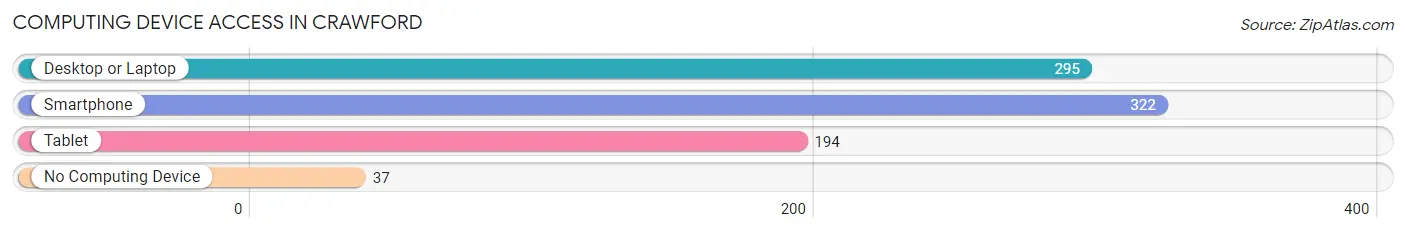
| Device Type | # Households | % Households |
| Desktop or Laptop | 295 | 74.5% |
| Smartphone | 322 | 81.3% |
| Tablet | 194 | 49.0% |
| No Computing Device | 37 | 9.3% |
| Total | 396 | 100.0% |
Internet Access in Crawford
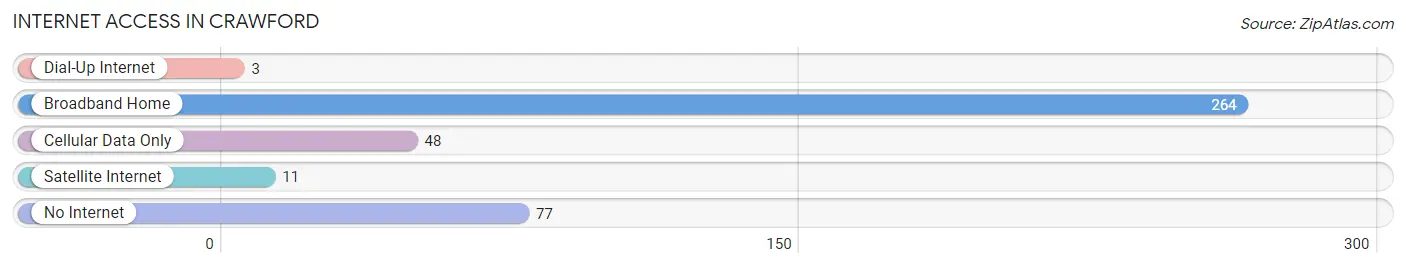
| Internet Type | # Households | % Households |
| Dial-Up Internet | 3 | 0.8% |
| Broadband Home | 264 | 66.7% |
| Cellular Data Only | 48 | 12.1% |
| Satellite Internet | 11 | 2.8% |
| No Internet | 77 | 19.4% |
| Total | 396 | 100.0% |
Crawford Summary
Crawford is a small city located in Dawes County, Nebraska. It is situated in the northwestern corner of the state, near the South Dakota border. The city has a population of 1,093 as of the 2010 census, making it the smallest incorporated city in the state.
History
Crawford was founded in 1887 by a group of settlers from Crawford County, Iowa. The city was named after the county in Iowa, and was incorporated in 1891. The city was originally a farming community, and the main crops grown were wheat, corn, and hay.
In the early 1900s, the city began to grow and develop. The first bank was established in 1906, and the first newspaper was published in 1907. The city also had a school, a post office, and a few stores.
In the 1920s, the city began to experience a period of growth and prosperity. The population increased from 545 in 1920 to 1,093 in 1930. During this time, the city was home to several businesses, including a hotel, a movie theater, a grocery store, and a hardware store.
Geography
Crawford is located in the northwestern corner of Nebraska, near the South Dakota border. The city is situated in the Sandhills region of the state, and is surrounded by rolling hills and grasslands. The city is located at an elevation of 3,845 feet above sea level.
The city is located along the White River, which flows through the city and provides a source of water for the city. The city is also located near the Niobrara National Scenic River, which is a popular destination for canoeing and fishing.
Economy
The economy of Crawford is largely based on agriculture. The city is home to several farms, which produce wheat, corn, hay, and other crops. The city is also home to several businesses, including a grocery store, a hardware store, and a few restaurants.
The city is also home to a few manufacturing companies, which produce a variety of products, including furniture, clothing, and electronics. The city is also home to a few small businesses, such as a gas station, a car dealership, and a few other retail stores.
Demographics
As of the 2010 census, the population of Crawford was 1,093. The racial makeup of the city was 97.3% White, 0.7% African American, 0.2% Native American, 0.2% Asian, 0.2% from other races, and 1.6% from two or more races. Hispanic or Latino of any race were 1.2% of the population.
The median income for a household in the city was $37,500, and the median income for a family was $45,000. The per capita income for the city was $18,845. About 11.2% of families and 14.2% of the population were below the poverty line, including 18.2% of those under age 18 and 8.3% of those age 65 or over.
Common Questions
What is Per Capita Income in Crawford?
Per Capita income in Crawford is $27,364.
What is the Median Family Income in Crawford?
Median Family Income in Crawford is $62,440.
What is the Median Household income in Crawford?
Median Household Income in Crawford is $54,167.
What is Income or Wage Gap in Crawford?
Income or Wage Gap in Crawford is 41.3%.
Women in Crawford earn 58.7 cents for every dollar earned by a man.
What is Family Income Deficit in Crawford?
Family Income Deficit in Crawford is $1,767.
Families that are below poverty line in Crawford earn $1,767 less on average than the poverty threshold level.
What is Inequality or Gini Index in Crawford?
Inequality or Gini Index in Crawford is 0.36.
What is the Total Population of Crawford?
Total Population of Crawford is 962.
What is the Total Male Population of Crawford?
Total Male Population of Crawford is 435.
What is the Total Female Population of Crawford?
Total Female Population of Crawford is 527.
What is the Ratio of Males per 100 Females in Crawford?
There are 82.54 Males per 100 Females in Crawford.
What is the Ratio of Females per 100 Males in Crawford?
There are 121.15 Females per 100 Males in Crawford.
What is the Median Population Age in Crawford?
Median Population Age in Crawford is 52.1 Years.
What is the Average Family Size in Crawford
Average Family Size in Crawford is 2.9 People.
What is the Average Household Size in Crawford
Average Household Size in Crawford is 2.4 People.
How Large is the Labor Force in Crawford?
There are 369 People in the Labor Forcein in Crawford.
What is the Percentage of People in the Labor Force in Crawford?
48.3% of People are in the Labor Force in Crawford.
What is the Unemployment Rate in Crawford?
Unemployment Rate in Crawford is 1.1%.