Cordova, NE Map & Demographics
Cordova Map
Cordova Overview
$35,464
PER CAPITA INCOME
$53,750
AVG FAMILY INCOME
$57,500
AVG HOUSEHOLD INCOME
24.3%
WAGE / INCOME GAP [ % ]
75.7¢/ $1
WAGE / INCOME GAP [ $ ]
0.43
INEQUALITY / GINI INDEX
110
TOTAL POPULATION
54
MALE POPULATION
56
FEMALE POPULATION
96.43
MALES / 100 FEMALES
103.70
FEMALES / 100 MALES
50.1
MEDIAN AGE
3.1
AVG FAMILY SIZE
2.3
AVG HOUSEHOLD SIZE
48
LABOR FORCE [ PEOPLE ]
52.7%
PERCENT IN LABOR FORCE
Cordova Zip Codes
Cordova Area Codes
Income in Cordova
Income Overview in Cordova
Per Capita Income in Cordova is $35,464, while median incomes of families and households are $53,750 and $57,500 respectively.
| Characteristic | Number | Measure |
| Per Capita Income | 110 | $35,464 |
| Median Family Income | 29 | $53,750 |
| Mean Family Income | 29 | $93,555 |
| Median Household Income | 48 | $57,500 |
| Mean Household Income | 48 | $79,190 |
| Income Deficit | 29 | $0 |
| Wage / Income Gap (%) | 110 | 24.27% |
| Wage / Income Gap ($) | 110 | 75.73¢ per $1 |
| Gini / Inequality Index | 110 | 0.43 |
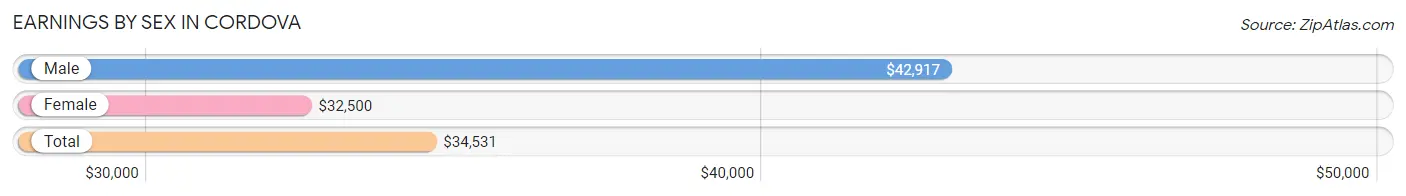
Earnings by Sex in Cordova
Average Earnings in Cordova are $34,531, $42,917 for men and $32,500 for women, a difference of 24.3%.
| Sex | Number | Average Earnings |
| Male | 31 (47.7%) | $42,917 |
| Female | 34 (52.3%) | $32,500 |
| Total | 65 (100.0%) | $34,531 |
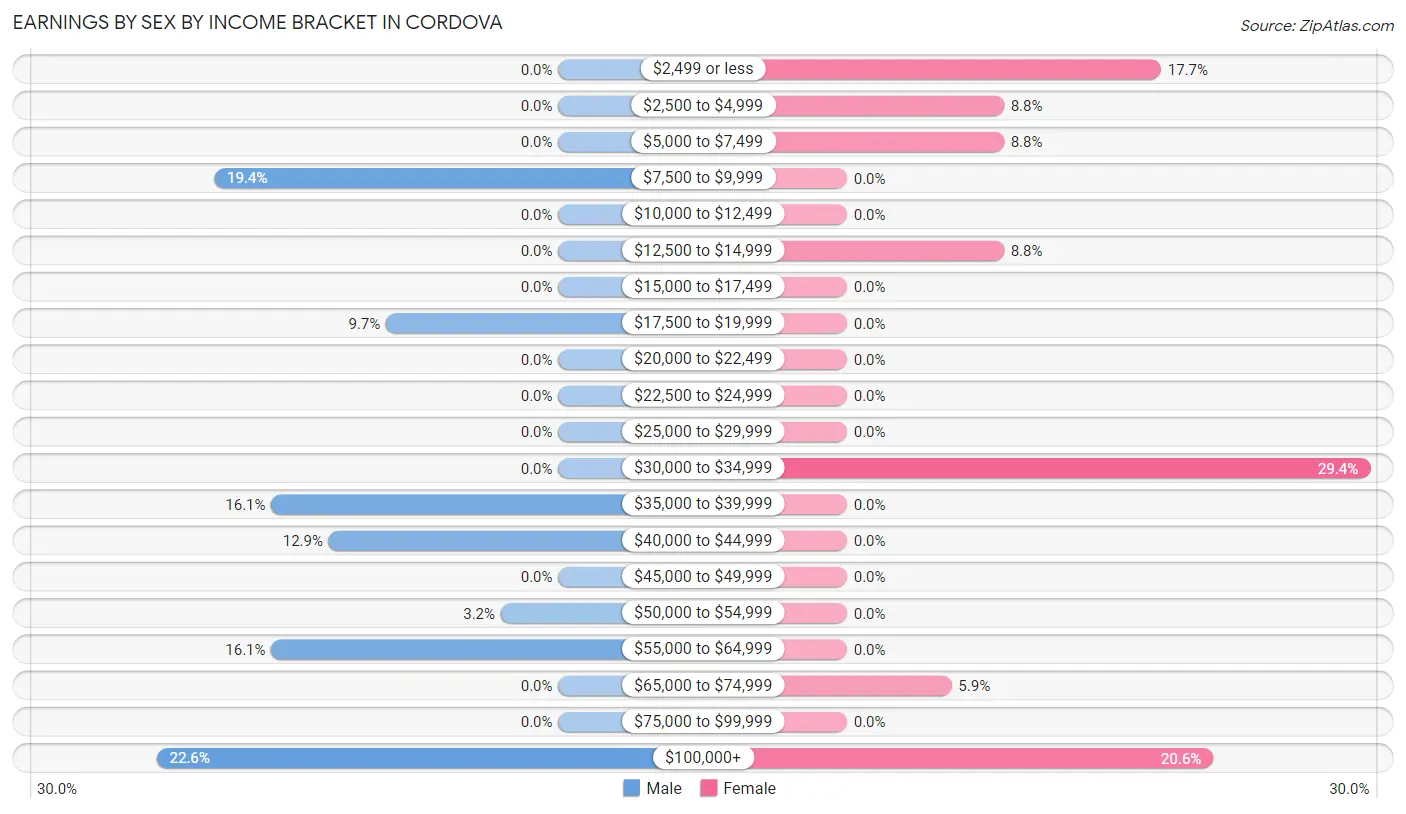
Earnings by Sex by Income Bracket in Cordova
The most common earnings brackets in Cordova are $100,000+ for men (7 | 22.6%) and $30,000 to $34,999 for women (10 | 29.4%).
| Income | Male | Female |
| $2,499 or less | 0 (0.0%) | 6 (17.6%) |
| $2,500 to $4,999 | 0 (0.0%) | 3 (8.8%) |
| $5,000 to $7,499 | 0 (0.0%) | 3 (8.8%) |
| $7,500 to $9,999 | 6 (19.4%) | 0 (0.0%) |
| $10,000 to $12,499 | 0 (0.0%) | 0 (0.0%) |
| $12,500 to $14,999 | 0 (0.0%) | 3 (8.8%) |
| $15,000 to $17,499 | 0 (0.0%) | 0 (0.0%) |
| $17,500 to $19,999 | 3 (9.7%) | 0 (0.0%) |
| $20,000 to $22,499 | 0 (0.0%) | 0 (0.0%) |
| $22,500 to $24,999 | 0 (0.0%) | 0 (0.0%) |
| $25,000 to $29,999 | 0 (0.0%) | 0 (0.0%) |
| $30,000 to $34,999 | 0 (0.0%) | 10 (29.4%) |
| $35,000 to $39,999 | 5 (16.1%) | 0 (0.0%) |
| $40,000 to $44,999 | 4 (12.9%) | 0 (0.0%) |
| $45,000 to $49,999 | 0 (0.0%) | 0 (0.0%) |
| $50,000 to $54,999 | 1 (3.2%) | 0 (0.0%) |
| $55,000 to $64,999 | 5 (16.1%) | 0 (0.0%) |
| $65,000 to $74,999 | 0 (0.0%) | 2 (5.9%) |
| $75,000 to $99,999 | 0 (0.0%) | 0 (0.0%) |
| $100,000+ | 7 (22.6%) | 7 (20.6%) |
| Total | 31 (100.0%) | 34 (100.0%) |
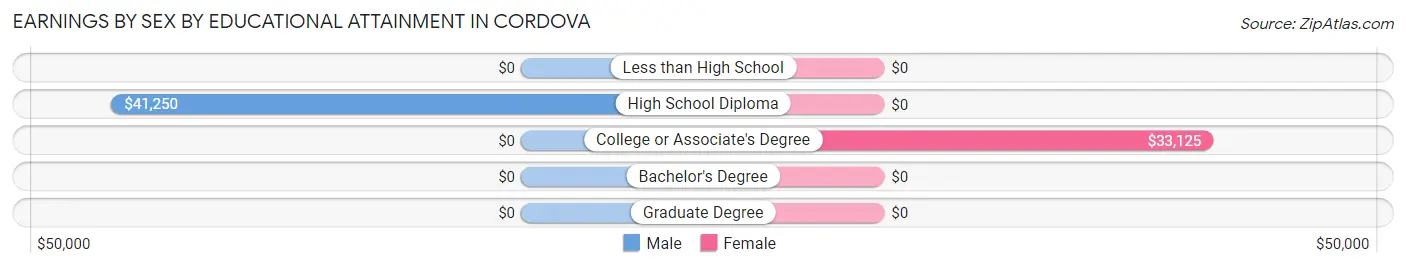
Earnings by Sex by Educational Attainment in Cordova
Average earnings in Cordova are $42,917 for men and $33,281 for women, a difference of 22.5%. Men with an educational attainment of high school diploma enjoy the highest average annual earnings of $41,250, while those with high school diploma education earn the least with $41,250. Women with an educational attainment of college or associate's degree earn the most with the average annual earnings of $33,125, while those with college or associate's degree education have the smallest earnings of $33,125.
| Educational Attainment | Male Income | Female Income |
| Less than High School | - | - |
| High School Diploma | $41,250 | $0 |
| College or Associate's Degree | - | - |
| Bachelor's Degree | - | - |
| Graduate Degree | - | - |
| Total | $42,917 | $33,281 |
Family Income in Cordova
Family Income Brackets in Cordova
According to the Cordova family income data, there are 8 families falling into the $35,000 to $49,999 income range, which is the most common income bracket and makes up 27.6% of all families.
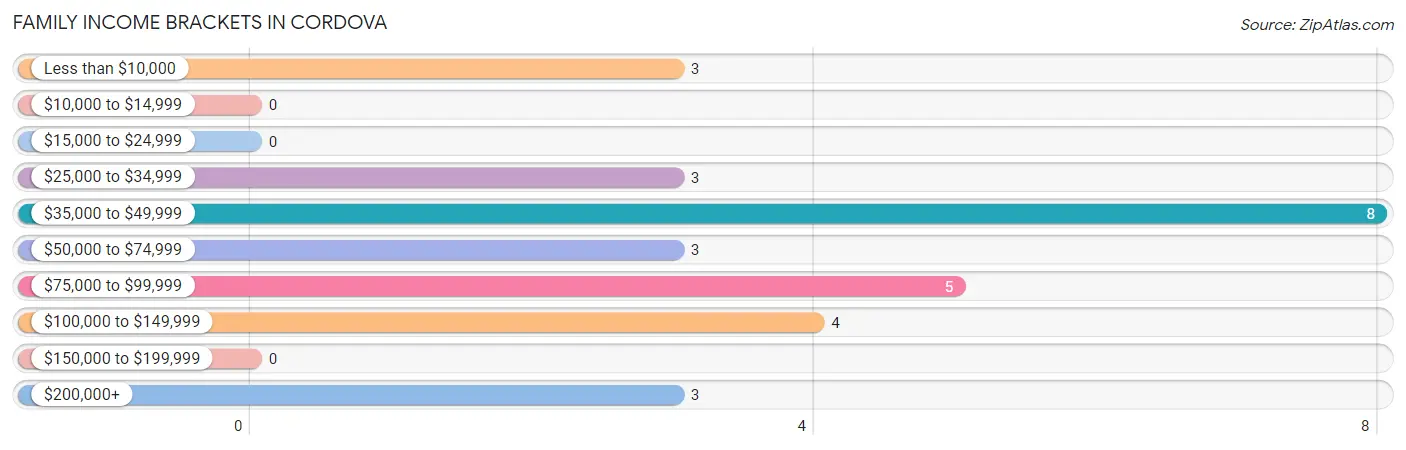
| Income Bracket | # Families | % Families |
| Less than $10,000 | 3 | 10.3% |
| $10,000 to $14,999 | 0 | 0.0% |
| $15,000 to $24,999 | 0 | 0.0% |
| $25,000 to $34,999 | 3 | 10.3% |
| $35,000 to $49,999 | 8 | 27.6% |
| $50,000 to $74,999 | 3 | 10.3% |
| $75,000 to $99,999 | 5 | 17.2% |
| $100,000 to $149,999 | 4 | 13.8% |
| $150,000 to $199,999 | 0 | 0.0% |
| $200,000+ | 3 | 10.3% |
Family Income by Famaliy Size in Cordova
2-person families (17 | 58.6%) account for the highest median family income in Cordova with $94,063 per family, while 2-person families (17 | 58.6%) have the highest median income of $47,032 per family member.
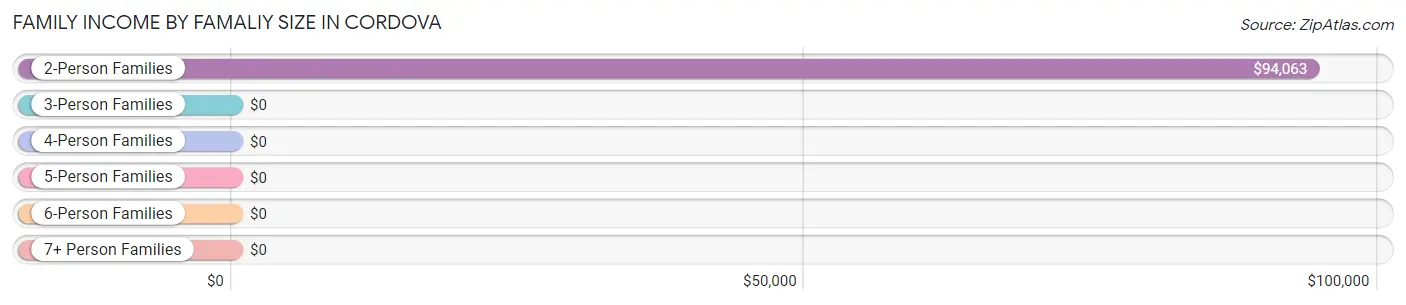
| Income Bracket | # Families | Median Income |
| 2-Person Families | 17 (58.6%) | $94,063 |
| 3-Person Families | 6 (20.7%) | $0 |
| 4-Person Families | 0 (0.0%) | $0 |
| 5-Person Families | 1 (3.5%) | $0 |
| 6-Person Families | 5 (17.2%) | $0 |
| 7+ Person Families | 0 (0.0%) | $0 |
| Total | 29 (100.0%) | $53,750 |
Family Income by Number of Earners in Cordova
| Number of Earners | # Families | Median Income |
| No Earners | 0 (0.0%) | $0 |
| 1 Earner | 10 (34.5%) | $0 |
| 2 Earners | 12 (41.4%) | $0 |
| 3+ Earners | 7 (24.1%) | $0 |
| Total | 29 (100.0%) | $53,750 |
Household Income in Cordova
Household Income Brackets in Cordova
With 13 households falling in the category, the $35,000 to $49,999 income range is the most frequent in Cordova, accounting for 27.1% of all households.
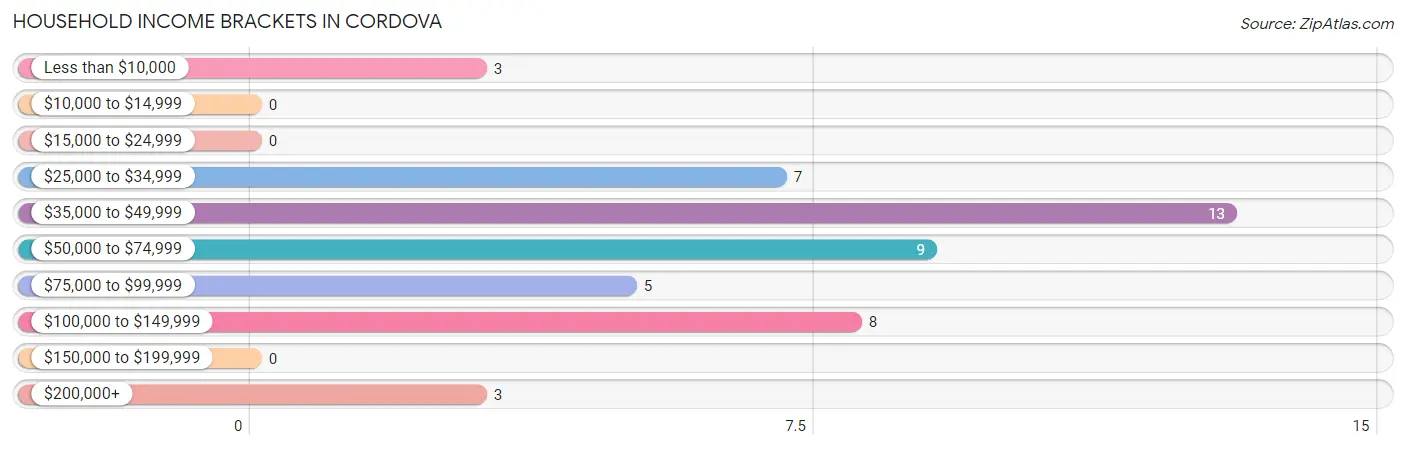
| Income Bracket | # Households | % Households |
| Less than $10,000 | 3 | 6.3% |
| $10,000 to $14,999 | 0 | 0.0% |
| $15,000 to $24,999 | 0 | 0.0% |
| $25,000 to $34,999 | 7 | 14.6% |
| $35,000 to $49,999 | 13 | 27.1% |
| $50,000 to $74,999 | 9 | 18.8% |
| $75,000 to $99,999 | 5 | 10.4% |
| $100,000 to $149,999 | 8 | 16.7% |
| $150,000 to $199,999 | 0 | 0.0% |
| $200,000+ | 3 | 6.3% |
Household Income by Householder Age in Cordova
The median household income in Cordova is $57,500, with the highest median household income of $94,063 found in the 45 to 64 years age bracket for the primary householder. A total of 25 households (52.1%) fall into this category.
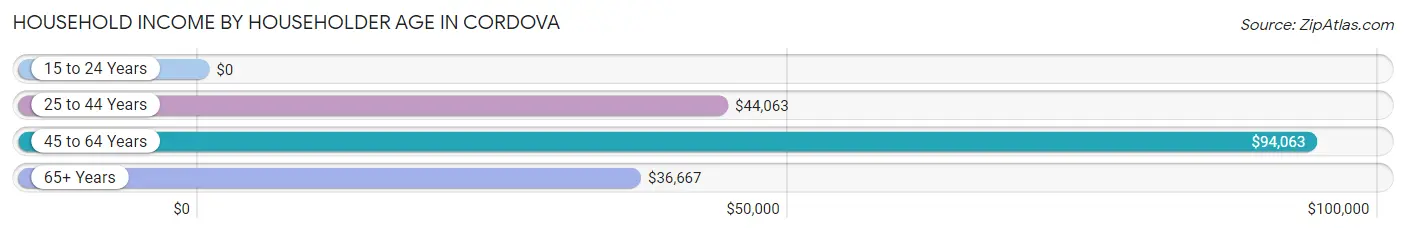
| Income Bracket | # Households | Median Income |
| 15 to 24 Years | 0 (0.0%) | $0 |
| 25 to 44 Years | 11 (22.9%) | $44,063 |
| 45 to 64 Years | 25 (52.1%) | $94,063 |
| 65+ Years | 12 (25.0%) | $36,667 |
| Total | 48 (100.0%) | $57,500 |
Poverty in Cordova
Income Below Poverty by Sex and Age in Cordova
With 5.6% poverty level for males and 5.4% for females among the residents of Cordova, 12 to 14 year old males and 45 to 54 year old females are the most vulnerable to poverty, with 3 males (100.0%) and 3 females (16.7%) in their respective age groups living below the poverty level.
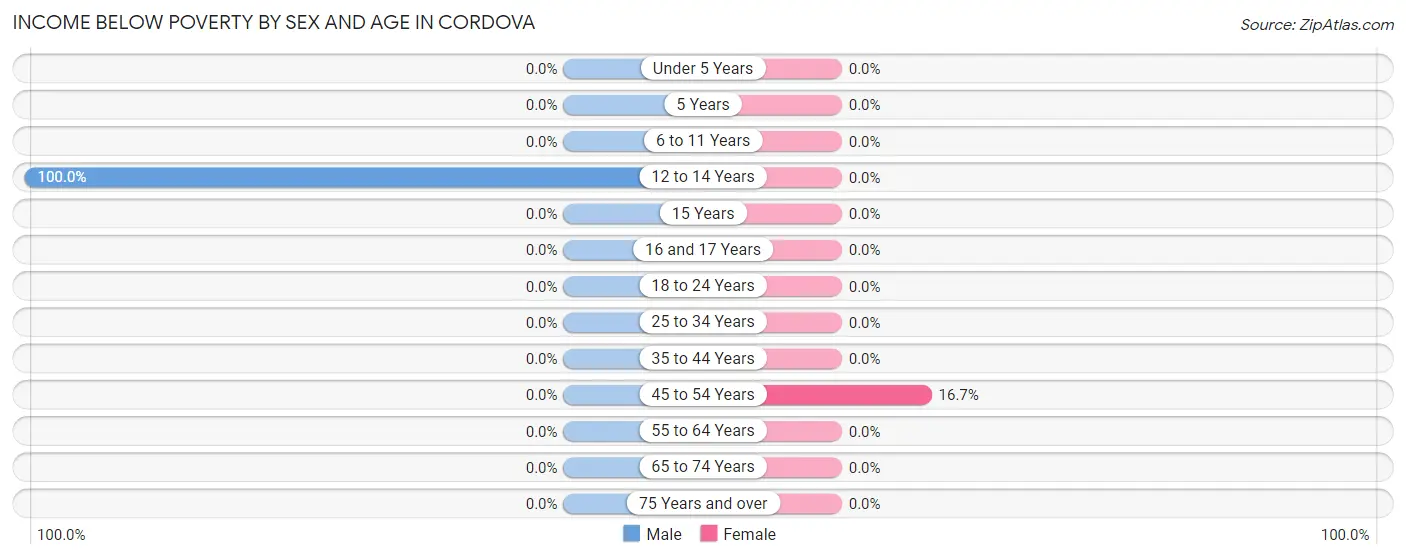
| Age Bracket | Male | Female |
| Under 5 Years | 0 (0.0%) | 0 (0.0%) |
| 5 Years | 0 (0.0%) | 0 (0.0%) |
| 6 to 11 Years | 0 (0.0%) | 0 (0.0%) |
| 12 to 14 Years | 3 (100.0%) | 0 (0.0%) |
| 15 Years | 0 (0.0%) | 0 (0.0%) |
| 16 and 17 Years | 0 (0.0%) | 0 (0.0%) |
| 18 to 24 Years | 0 (0.0%) | 0 (0.0%) |
| 25 to 34 Years | 0 (0.0%) | 0 (0.0%) |
| 35 to 44 Years | 0 (0.0%) | 0 (0.0%) |
| 45 to 54 Years | 0 (0.0%) | 3 (16.7%) |
| 55 to 64 Years | 0 (0.0%) | 0 (0.0%) |
| 65 to 74 Years | 0 (0.0%) | 0 (0.0%) |
| 75 Years and over | 0 (0.0%) | 0 (0.0%) |
| Total | 3 (5.6%) | 3 (5.4%) |
Income Above Poverty by Sex and Age in Cordova
According to the poverty statistics in Cordova, males aged under 5 years and females aged under 5 years are the age groups that are most secure financially, with 100.0% of males and 100.0% of females in these age groups living above the poverty line.
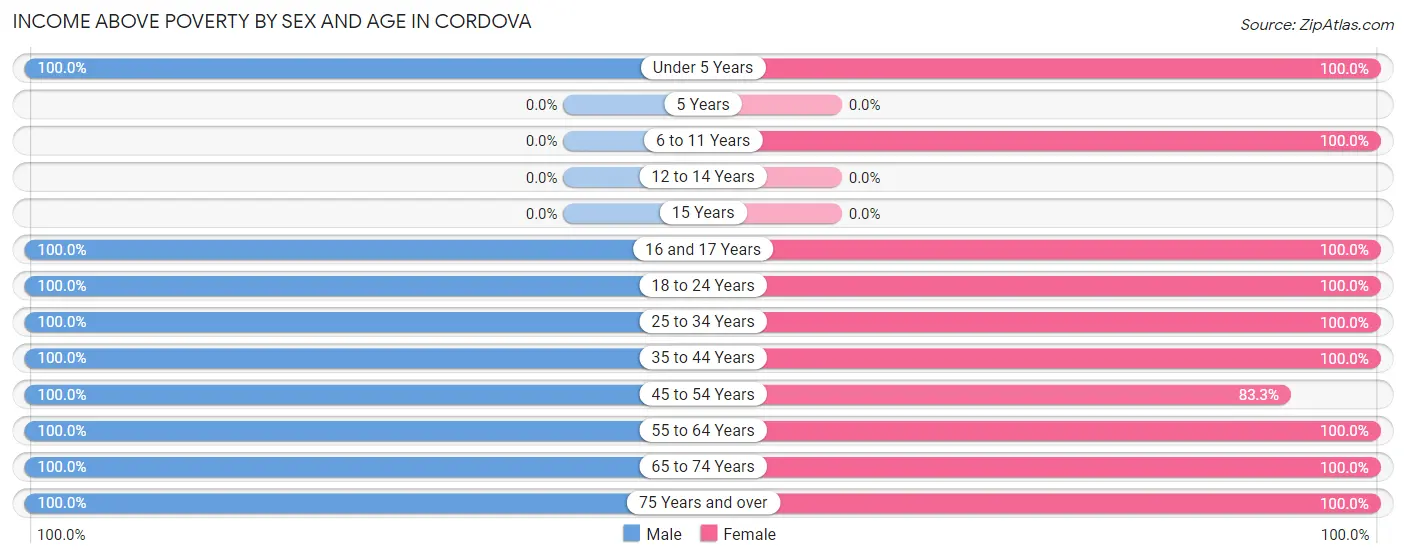
| Age Bracket | Male | Female |
| Under 5 Years | 7 (100.0%) | 2 (100.0%) |
| 5 Years | 0 (0.0%) | 0 (0.0%) |
| 6 to 11 Years | 0 (0.0%) | 7 (100.0%) |
| 12 to 14 Years | 0 (0.0%) | 0 (0.0%) |
| 15 Years | 0 (0.0%) | 0 (0.0%) |
| 16 and 17 Years | 3 (100.0%) | 1 (100.0%) |
| 18 to 24 Years | 2 (100.0%) | 9 (100.0%) |
| 25 to 34 Years | 3 (100.0%) | 1 (100.0%) |
| 35 to 44 Years | 5 (100.0%) | 8 (100.0%) |
| 45 to 54 Years | 10 (100.0%) | 15 (83.3%) |
| 55 to 64 Years | 11 (100.0%) | 7 (100.0%) |
| 65 to 74 Years | 7 (100.0%) | 1 (100.0%) |
| 75 Years and over | 3 (100.0%) | 2 (100.0%) |
| Total | 51 (94.4%) | 53 (94.6%) |
Income Below Poverty Among Married-Couple Families in Cordova
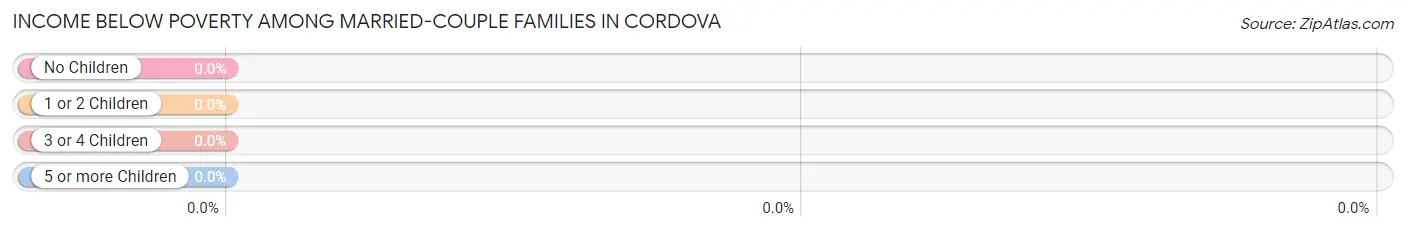
| Children | Above Poverty | Below Poverty |
| No Children | 14 (100.0%) | 0 (0.0%) |
| 1 or 2 Children | 10 (100.0%) | 0 (0.0%) |
| 3 or 4 Children | 2 (100.0%) | 0 (0.0%) |
| 5 or more Children | 0 (0.0%) | 0 (0.0%) |
| Total | 26 (100.0%) | 0 (0.0%) |
Income Below Poverty Among Single-Parent Households in Cordova
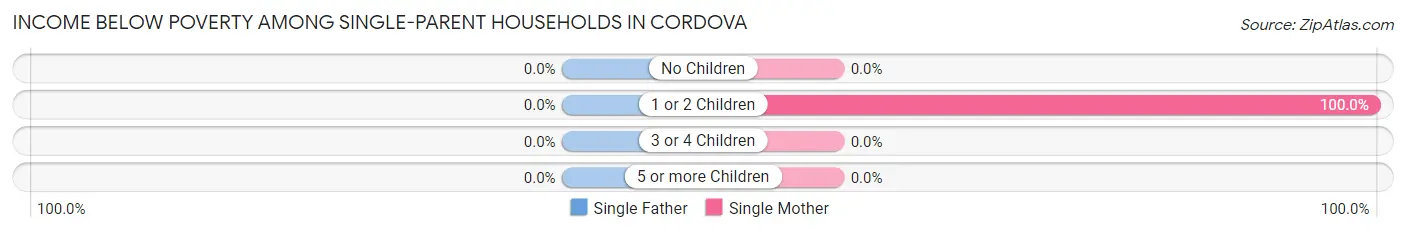
| Children | Single Father | Single Mother |
| No Children | 0 (0.0%) | 0 (0.0%) |
| 1 or 2 Children | 0 (0.0%) | 3 (100.0%) |
| 3 or 4 Children | 0 (0.0%) | 0 (0.0%) |
| 5 or more Children | 0 (0.0%) | 0 (0.0%) |
| Total | 0 (0.0%) | 3 (100.0%) |
Income Below Poverty Among Married-Couple vs Single-Parent Households in Cordova
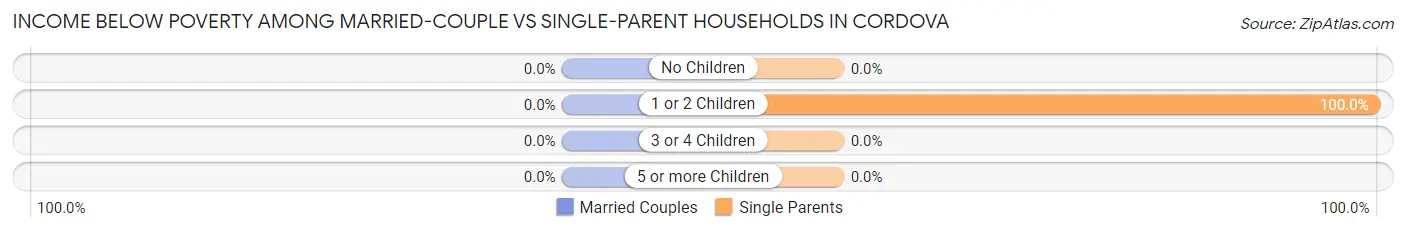
| Children | Married-Couple Families | Single-Parent Households |
| No Children | 0 (0.0%) | 0 (0.0%) |
| 1 or 2 Children | 0 (0.0%) | 3 (100.0%) |
| 3 or 4 Children | 0 (0.0%) | 0 (0.0%) |
| 5 or more Children | 0 (0.0%) | 0 (0.0%) |
| Total | 0 (0.0%) | 3 (100.0%) |
Race in Cordova
The most populous races in Cordova are White / Caucasian (108 | 98.2%), and Two or more Races (2 | 1.8%).
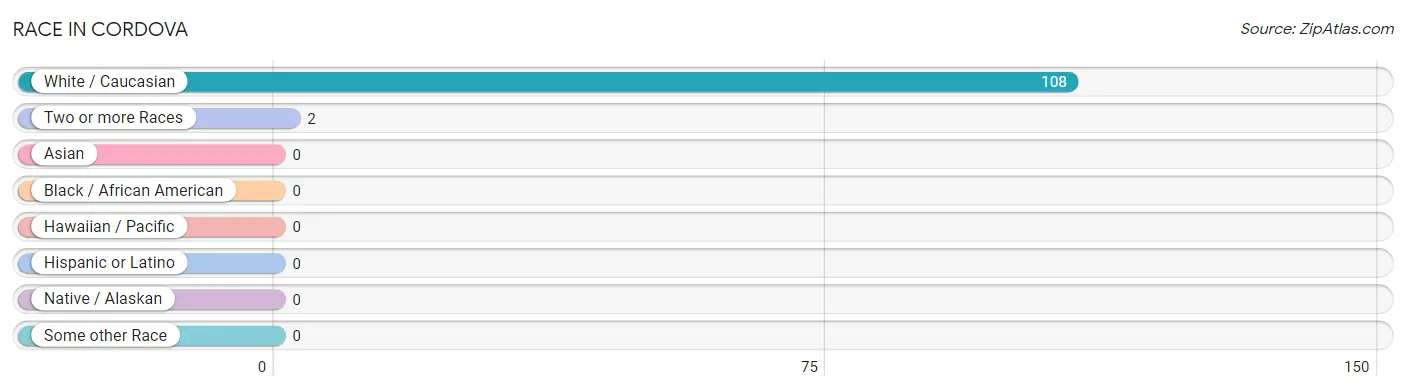
| Race | # Population | % Population |
| Asian | 0 | 0.0% |
| Black / African American | 0 | 0.0% |
| Hawaiian / Pacific | 0 | 0.0% |
| Hispanic or Latino | 0 | 0.0% |
| Native / Alaskan | 0 | 0.0% |
| White / Caucasian | 108 | 98.2% |
| Two or more Races | 2 | 1.8% |
| Some other Race | 0 | 0.0% |
| Total | 110 | 100.0% |
Ancestry in Cordova
The most populous ancestries reported in Cordova are German (27 | 24.5%), American (17 | 15.4%), Czech (9 | 8.2%), Danish (9 | 8.2%), and Irish (7 | 6.4%), together accounting for 62.7% of all Cordova residents.
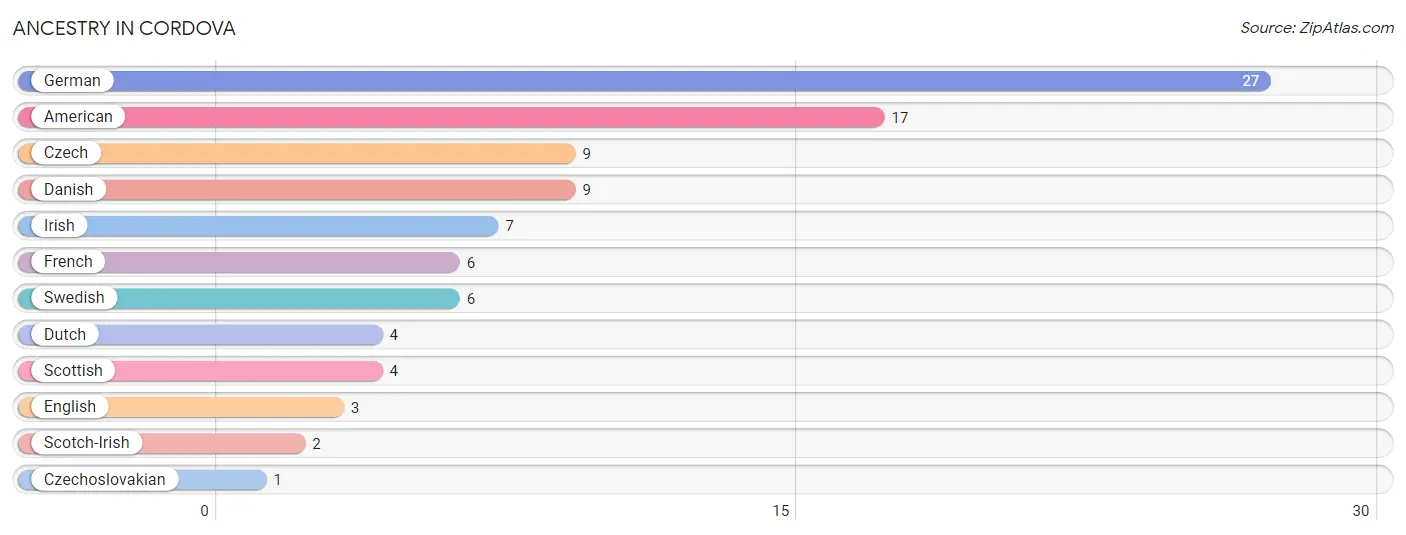
| Ancestry | # Population | % Population |
| American | 17 | 15.4% |
| Czech | 9 | 8.2% |
| Czechoslovakian | 1 | 0.9% |
| Danish | 9 | 8.2% |
| Dutch | 4 | 3.6% |
| English | 3 | 2.7% |
| French | 6 | 5.4% |
| German | 27 | 24.5% |
| Irish | 7 | 6.4% |
| Scotch-Irish | 2 | 1.8% |
| Scottish | 4 | 3.6% |
| Swedish | 6 | 5.4% | View All 12 Rows |
Immigrants in Cordova

| Immigration Origin | # Population | % Population | View All 0 Rows |
Sex and Age in Cordova
Sex and Age in Cordova
The most populous age groups in Cordova are 50 to 54 Years (10 | 18.5%) for men and 50 to 54 Years (15 | 26.8%) for women.
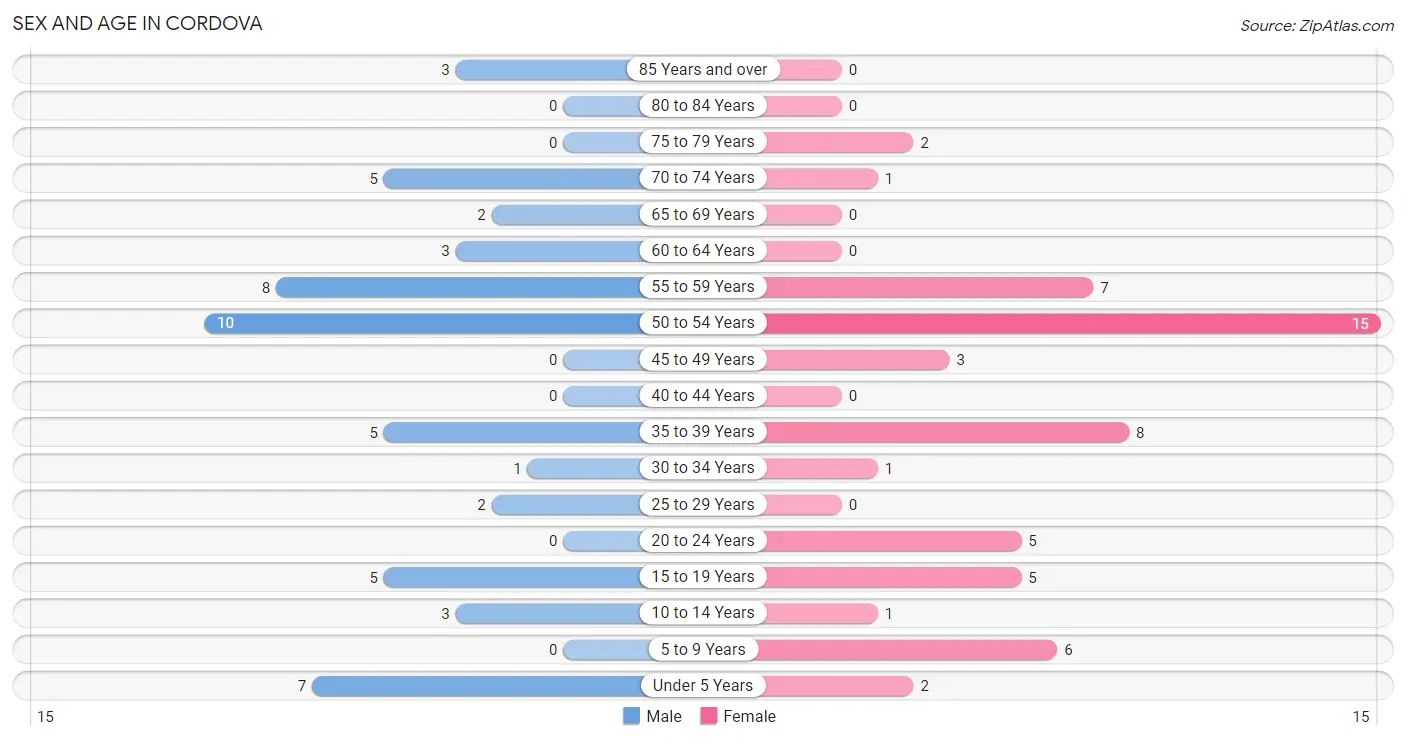
| Age Bracket | Male | Female |
| Under 5 Years | 7 (13.0%) | 2 (3.6%) |
| 5 to 9 Years | 0 (0.0%) | 6 (10.7%) |
| 10 to 14 Years | 3 (5.6%) | 1 (1.8%) |
| 15 to 19 Years | 5 (9.3%) | 5 (8.9%) |
| 20 to 24 Years | 0 (0.0%) | 5 (8.9%) |
| 25 to 29 Years | 2 (3.7%) | 0 (0.0%) |
| 30 to 34 Years | 1 (1.8%) | 1 (1.8%) |
| 35 to 39 Years | 5 (9.3%) | 8 (14.3%) |
| 40 to 44 Years | 0 (0.0%) | 0 (0.0%) |
| 45 to 49 Years | 0 (0.0%) | 3 (5.4%) |
| 50 to 54 Years | 10 (18.5%) | 15 (26.8%) |
| 55 to 59 Years | 8 (14.8%) | 7 (12.5%) |
| 60 to 64 Years | 3 (5.6%) | 0 (0.0%) |
| 65 to 69 Years | 2 (3.7%) | 0 (0.0%) |
| 70 to 74 Years | 5 (9.3%) | 1 (1.8%) |
| 75 to 79 Years | 0 (0.0%) | 2 (3.6%) |
| 80 to 84 Years | 0 (0.0%) | 0 (0.0%) |
| 85 Years and over | 3 (5.6%) | 0 (0.0%) |
| Total | 54 (100.0%) | 56 (100.0%) |
Families and Households in Cordova
Median Family Size in Cordova
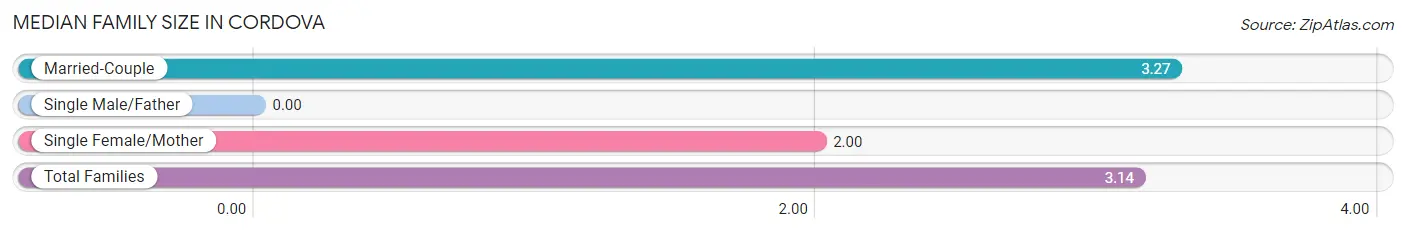
| Family Type | # Families | Family Size |
| Married-Couple | 26 (89.7%) | 3.27 |
| Single Male/Father | 0 (0.0%) | - |
| Single Female/Mother | 3 (10.3%) | 2.00 |
| Total Families | 29 (100.0%) | 3.14 |
Median Household Size in Cordova
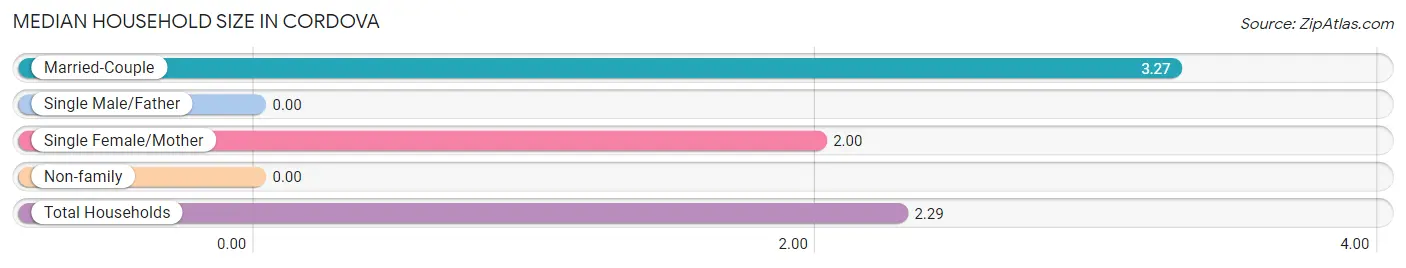
| Household Type | # Households | Household Size |
| Married-Couple | 26 (54.2%) | 3.27 |
| Single Male/Father | 0 (0.0%) | - |
| Single Female/Mother | 3 (6.2%) | 2.00 |
| Non-family | 19 (39.6%) | - |
| Total Households | 48 (100.0%) | 2.29 |
Household Size by Marriage Status in Cordova
Out of a total of 48 households in Cordova, 29 (60.4%) are family households, while 19 (39.6%) are nonfamily households. The most numerous type of family households are 2-person households, comprising 17, and the most common type of nonfamily households are 1-person households, comprising 19.
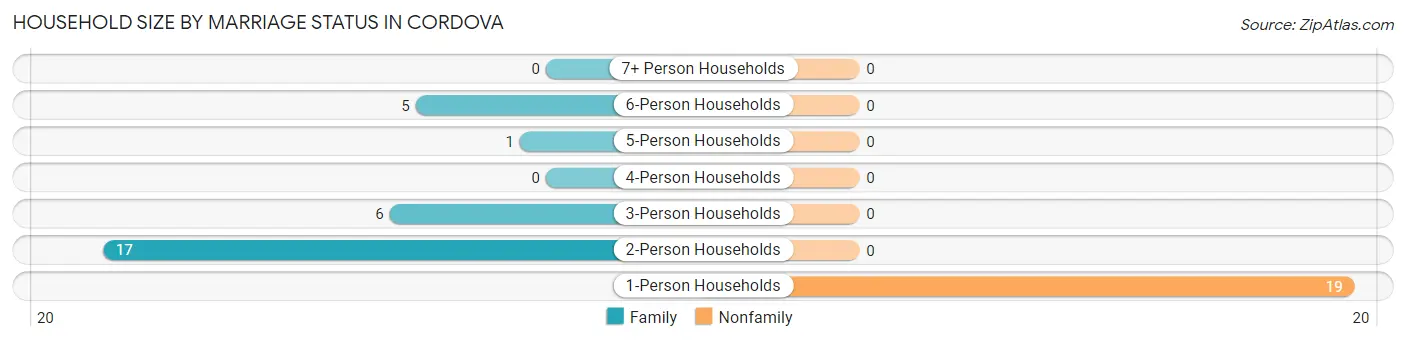
| Household Size | Family Households | Nonfamily Households |
| 1-Person Households | - | 19 (39.6%) |
| 2-Person Households | 17 (35.4%) | 0 (0.0%) |
| 3-Person Households | 6 (12.5%) | 0 (0.0%) |
| 4-Person Households | 0 (0.0%) | 0 (0.0%) |
| 5-Person Households | 1 (2.1%) | 0 (0.0%) |
| 6-Person Households | 5 (10.4%) | 0 (0.0%) |
| 7+ Person Households | 0 (0.0%) | 0 (0.0%) |
| Total | 29 (60.4%) | 19 (39.6%) |
Female Fertility in Cordova
Fertility by Age in Cordova
Average fertility rate in Cordova is 188.0 births per 1,000 women. Women in the age bracket of 20 to 34 years have the highest fertility rate with 1,000.0 births per 1,000 women. Women in the age bracket of 20 to 34 years acount for 100.0% of all women with births.
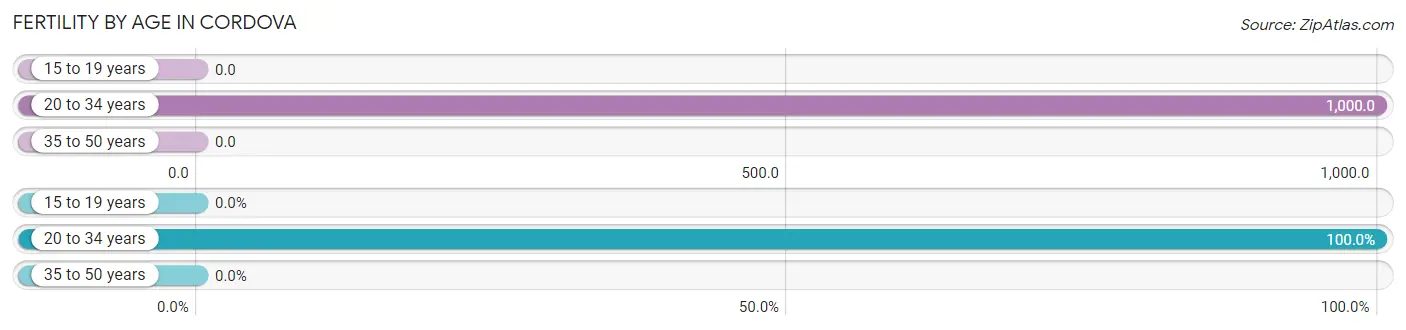
| Age Bracket | Women with Births | Births / 1,000 Women |
| 15 to 19 years | 0 (0.0%) | 0.0 |
| 20 to 34 years | 6 (100.0%) | 1,000.0 |
| 35 to 50 years | 0 (0.0%) | 0.0 |
| Total | 6 (100.0%) | 188.0 |
Fertility by Age by Marriage Status in Cordova
16.7% of women with births (6) in Cordova are married. The highest percentage of unmarried women with births falls into 20 to 34 years age bracket with 83.3% of them unmarried at the time of birth, while the lowest percentage of unmarried women with births belong to 20 to 34 years age bracket with 83.3% of them unmarried.
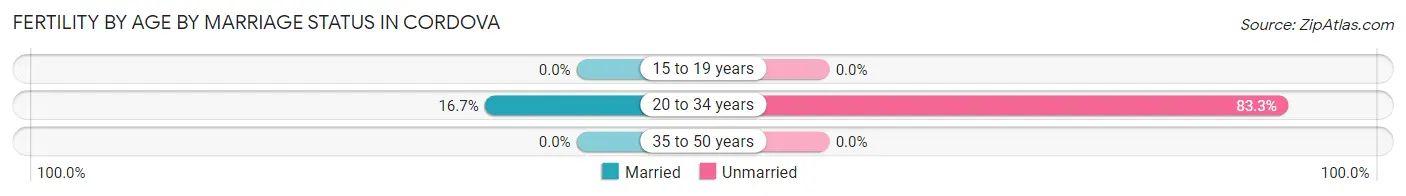
| Age Bracket | Married | Unmarried |
| 15 to 19 years | 0 (0.0%) | 0 (0.0%) |
| 20 to 34 years | 1 (16.7%) | 5 (83.3%) |
| 35 to 50 years | 0 (0.0%) | 0 (0.0%) |
| Total | 1 (16.7%) | 5 (83.3%) |
Fertility by Education in Cordova
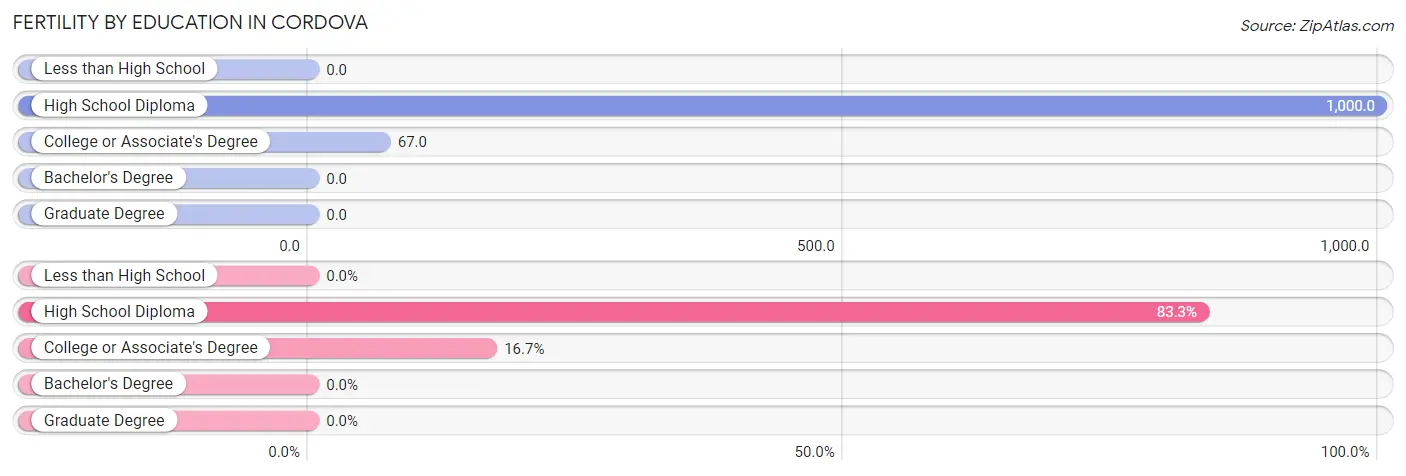
| Educational Attainment | Women with Births | Births / 1,000 Women |
| Less than High School | 0 (0.0%) | 0.0 |
| High School Diploma | 5 (83.3%) | 1,000.0 |
| College or Associate's Degree | 1 (16.7%) | 67.0 |
| Bachelor's Degree | 0 (0.0%) | 0.0 |
| Graduate Degree | 0 (0.0%) | 0.0 |
| Total | 6 (100.0%) | 188.0 |
Fertility by Education by Marriage Status in Cordova
83.3% of women with births in Cordova are unmarried. Women with the educational attainment of college or associate's degree are most likely to be married with 100.0% of them married at childbirth, while women with the educational attainment of high school diploma are least likely to be married with 100.0% of them unmarried at childbirth.
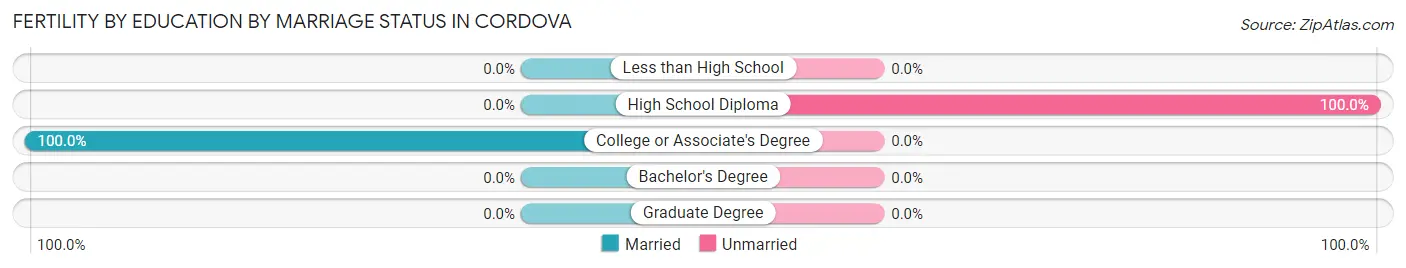
| Educational Attainment | Married | Unmarried |
| Less than High School | 0 (0.0%) | 0 (0.0%) |
| High School Diploma | 0 (0.0%) | 5 (100.0%) |
| College or Associate's Degree | 1 (100.0%) | 0 (0.0%) |
| Bachelor's Degree | 0 (0.0%) | 0 (0.0%) |
| Graduate Degree | 0 (0.0%) | 0 (0.0%) |
| Total | 1 (16.7%) | 5 (83.3%) |
Employment Characteristics in Cordova
Employment by Class of Employer in Cordova
Among the 44 employed individuals in Cordova, private company employees (23 | 52.3%), self-employed (incorporated) (10 | 22.7%), and not-for-profit organizations (5 | 11.4%) make up the most common classes of employment.
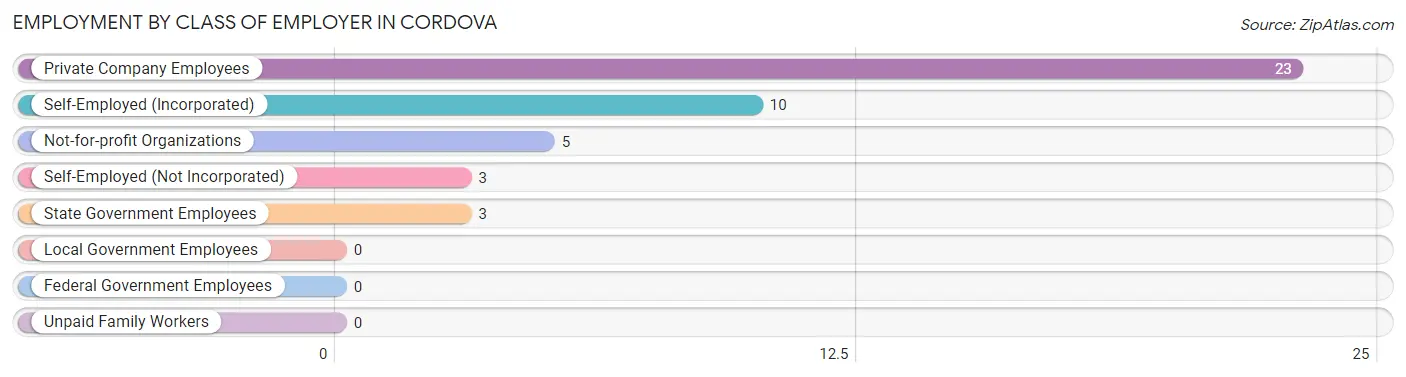
| Employer Class | # Employees | % Employees |
| Private Company Employees | 23 | 52.3% |
| Self-Employed (Incorporated) | 10 | 22.7% |
| Self-Employed (Not Incorporated) | 3 | 6.8% |
| Not-for-profit Organizations | 5 | 11.4% |
| Local Government Employees | 0 | 0.0% |
| State Government Employees | 3 | 6.8% |
| Federal Government Employees | 0 | 0.0% |
| Unpaid Family Workers | 0 | 0.0% |
| Total | 44 | 100.0% |
Employment Status by Age in Cordova
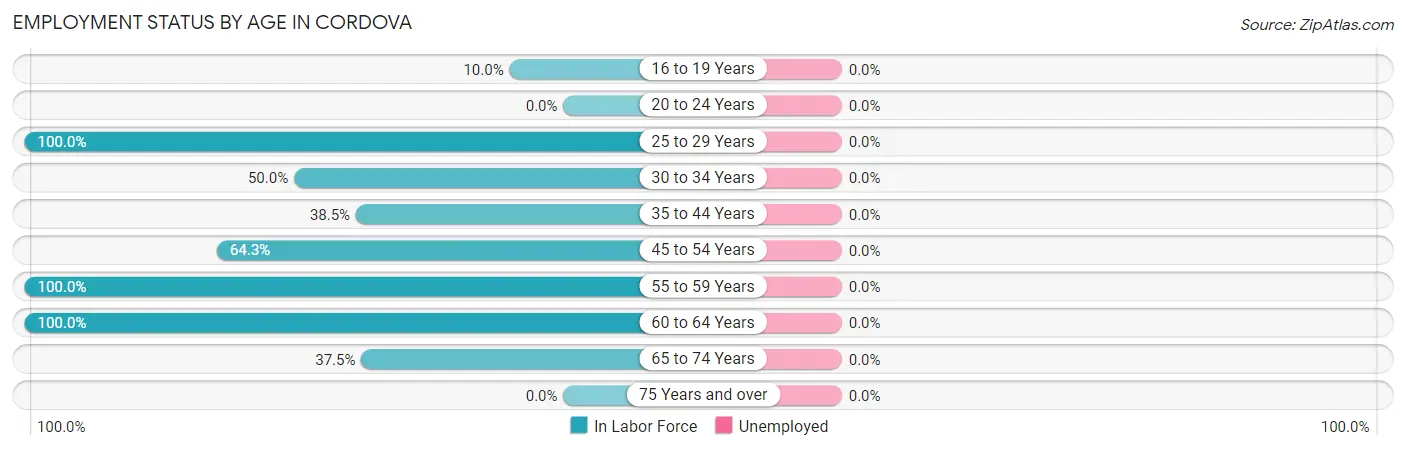
| Age Bracket | In Labor Force | Unemployed |
| 16 to 19 Years | 1 (10.0%) | 0 (0.0%) |
| 20 to 24 Years | 0 (0.0%) | 0 (0.0%) |
| 25 to 29 Years | 2 (100.0%) | 0 (0.0%) |
| 30 to 34 Years | 1 (50.0%) | 0 (0.0%) |
| 35 to 44 Years | 5 (38.5%) | 0 (0.0%) |
| 45 to 54 Years | 18 (64.3%) | 0 (0.0%) |
| 55 to 59 Years | 15 (100.0%) | 0 (0.0%) |
| 60 to 64 Years | 3 (100.0%) | 0 (0.0%) |
| 65 to 74 Years | 3 (37.5%) | 0 (0.0%) |
| 75 Years and over | 0 (0.0%) | 0 (0.0%) |
| Total | 48 (52.7%) | 0 (0.0%) |
Employment Status by Educational Attainment in Cordova
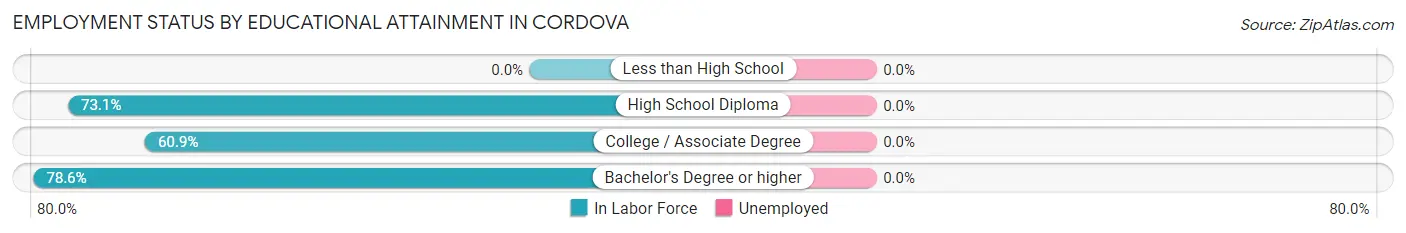
| Educational Attainment | In Labor Force | Unemployed |
| Less than High School | 0 (0.0%) | 0 (0.0%) |
| High School Diploma | 19 (73.1%) | 0 (0.0%) |
| College / Associate Degree | 14 (60.9%) | 0 (0.0%) |
| Bachelor's Degree or higher | 11 (78.6%) | 0 (0.0%) |
| Total | 44 (69.8%) | 0 (0.0%) |
Employment Occupations by Sex in Cordova
Management, Business, Science and Arts Occupations
The most common Management, Business, Science and Arts occupations in Cordova are Community & Social Service (8 | 16.7%), Management (6 | 12.5%), Business & Financial (4 | 8.3%), Education, Arts & Media (4 | 8.3%), and Education Instruction & Library (4 | 8.3%).
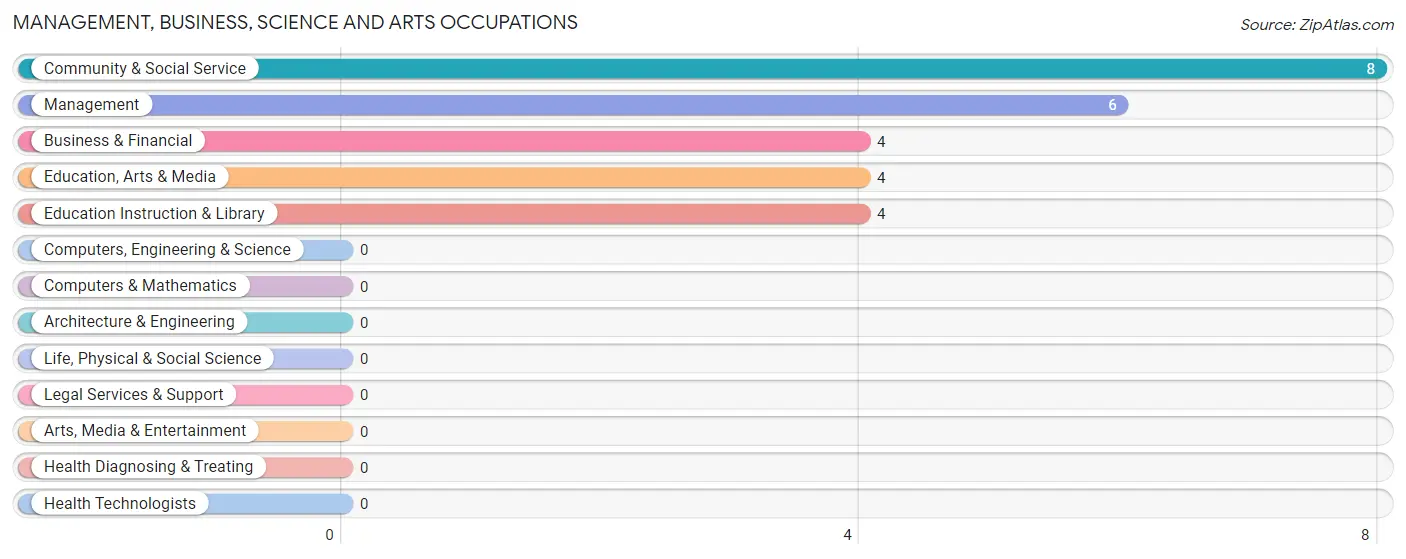
Management, Business, Science and Arts Occupations by Sex
Within the Management, Business, Science and Arts occupations in Cordova, the most male-oriented occupations are Education, Arts & Media (100.0%), Community & Social Service (50.0%), and Management (16.7%), while the most female-oriented occupations are Business & Financial (100.0%), Education Instruction & Library (100.0%), and Management (83.3%).
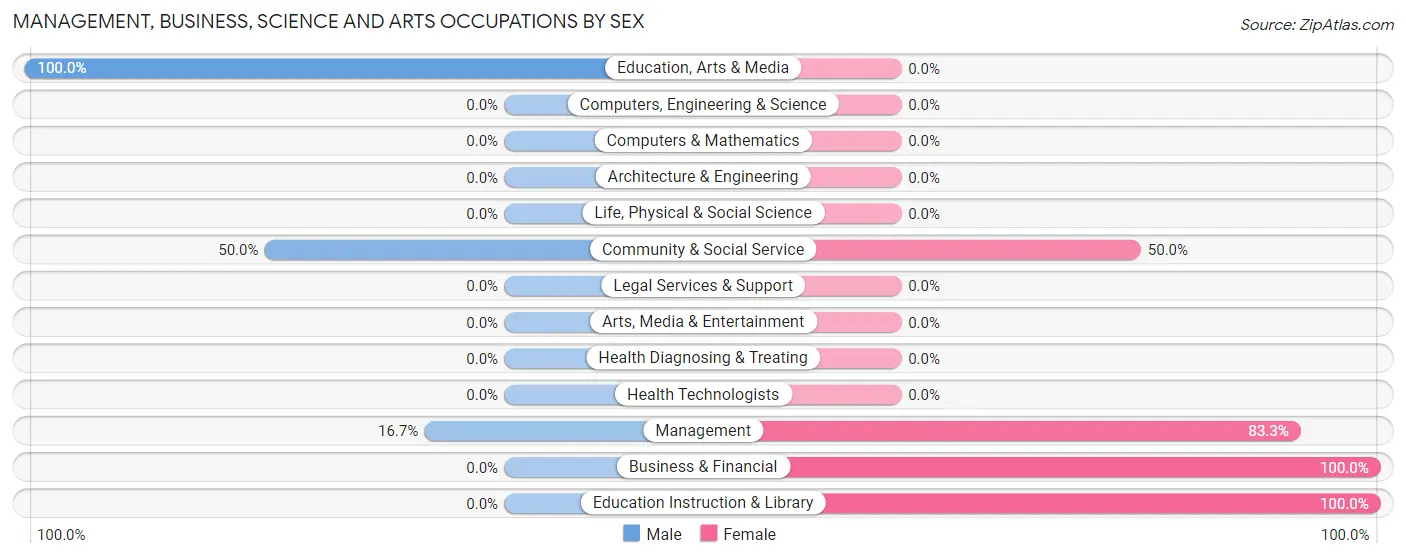
| Occupation | Male | Female |
| Management | 1 (16.7%) | 5 (83.3%) |
| Business & Financial | 0 (0.0%) | 4 (100.0%) |
| Computers, Engineering & Science | 0 (0.0%) | 0 (0.0%) |
| Computers & Mathematics | 0 (0.0%) | 0 (0.0%) |
| Architecture & Engineering | 0 (0.0%) | 0 (0.0%) |
| Life, Physical & Social Science | 0 (0.0%) | 0 (0.0%) |
| Community & Social Service | 4 (50.0%) | 4 (50.0%) |
| Education, Arts & Media | 4 (100.0%) | 0 (0.0%) |
| Legal Services & Support | 0 (0.0%) | 0 (0.0%) |
| Education Instruction & Library | 0 (0.0%) | 4 (100.0%) |
| Arts, Media & Entertainment | 0 (0.0%) | 0 (0.0%) |
| Health Diagnosing & Treating | 0 (0.0%) | 0 (0.0%) |
| Health Technologists | 0 (0.0%) | 0 (0.0%) |
| Total (Category) | 5 (27.8%) | 13 (72.2%) |
| Total (Overall) | 24 (50.0%) | 24 (50.0%) |
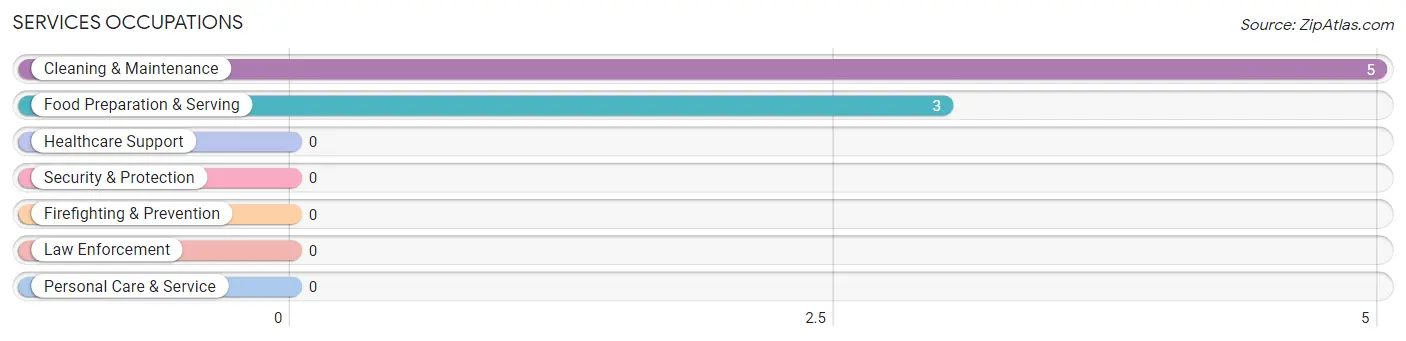
Services Occupations
The most common Services occupations in Cordova are Cleaning & Maintenance (5 | 10.4%), and Food Preparation & Serving (3 | 6.2%).
Services Occupations by Sex
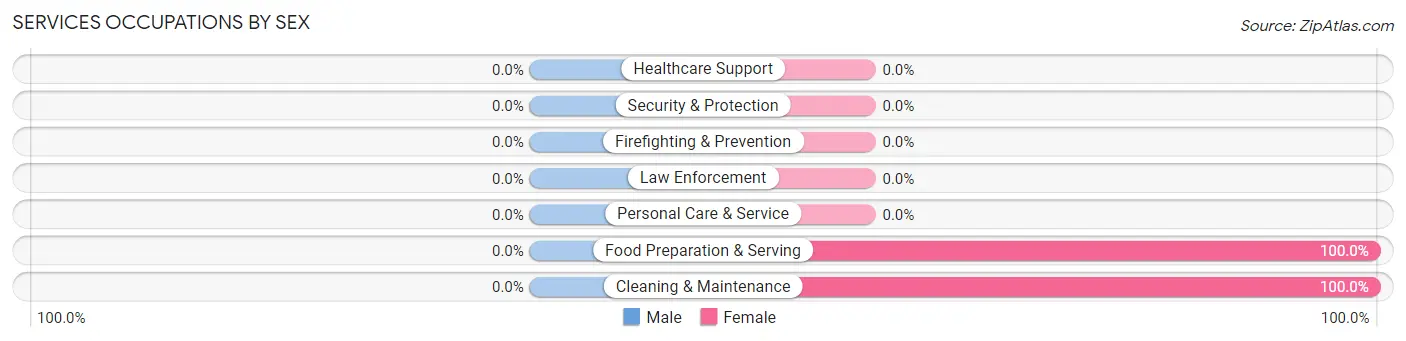
| Occupation | Male | Female |
| Healthcare Support | 0 (0.0%) | 0 (0.0%) |
| Security & Protection | 0 (0.0%) | 0 (0.0%) |
| Firefighting & Prevention | 0 (0.0%) | 0 (0.0%) |
| Law Enforcement | 0 (0.0%) | 0 (0.0%) |
| Food Preparation & Serving | 0 (0.0%) | 3 (100.0%) |
| Cleaning & Maintenance | 0 (0.0%) | 5 (100.0%) |
| Personal Care & Service | 0 (0.0%) | 0 (0.0%) |
| Total (Category) | 0 (0.0%) | 8 (100.0%) |
| Total (Overall) | 24 (50.0%) | 24 (50.0%) |
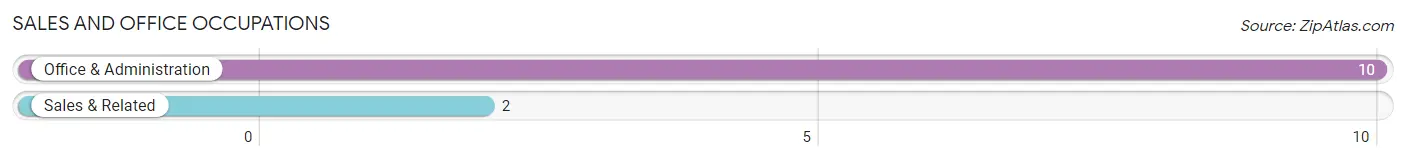
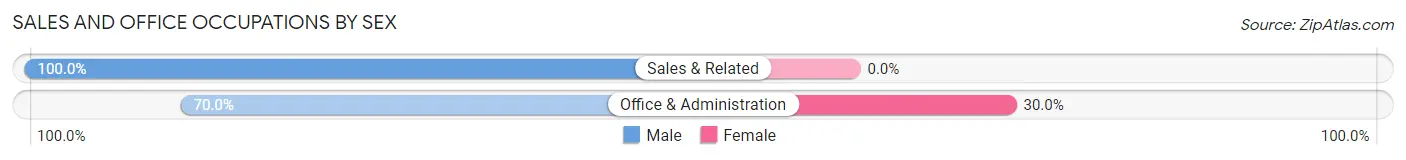
Sales and Office Occupations
The most common Sales and Office occupations in Cordova are Office & Administration (10 | 20.8%), and Sales & Related (2 | 4.2%).
Sales and Office Occupations by Sex
| Occupation | Male | Female |
| Sales & Related | 2 (100.0%) | 0 (0.0%) |
| Office & Administration | 7 (70.0%) | 3 (30.0%) |
| Total (Category) | 9 (75.0%) | 3 (25.0%) |
| Total (Overall) | 24 (50.0%) | 24 (50.0%) |
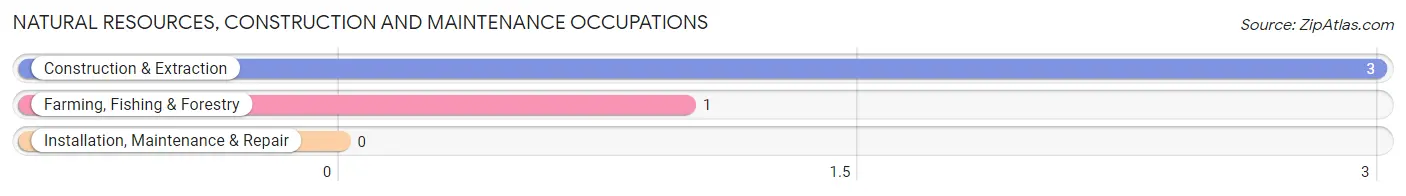
Natural Resources, Construction and Maintenance Occupations
The most common Natural Resources, Construction and Maintenance occupations in Cordova are Construction & Extraction (3 | 6.2%), and Farming, Fishing & Forestry (1 | 2.1%).
Natural Resources, Construction and Maintenance Occupations by Sex
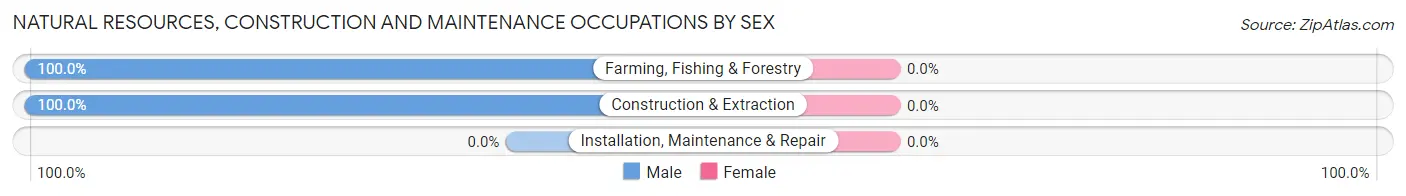
| Occupation | Male | Female |
| Farming, Fishing & Forestry | 1 (100.0%) | 0 (0.0%) |
| Construction & Extraction | 3 (100.0%) | 0 (0.0%) |
| Installation, Maintenance & Repair | 0 (0.0%) | 0 (0.0%) |
| Total (Category) | 4 (100.0%) | 0 (0.0%) |
| Total (Overall) | 24 (50.0%) | 24 (50.0%) |
Production, Transportation and Moving Occupations
The most common Production, Transportation and Moving occupations in Cordova are Production (3 | 6.2%), and Transportation (3 | 6.2%).
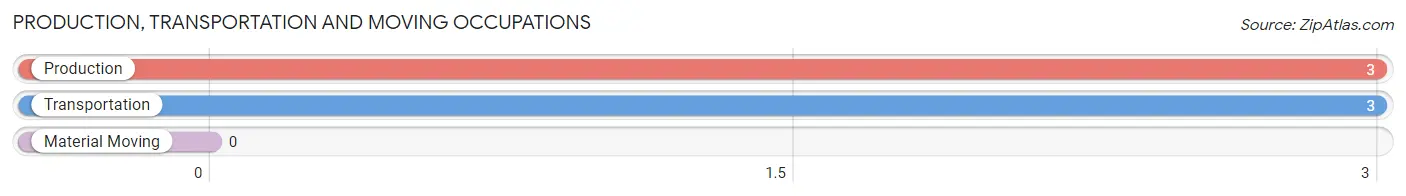
Production, Transportation and Moving Occupations by Sex
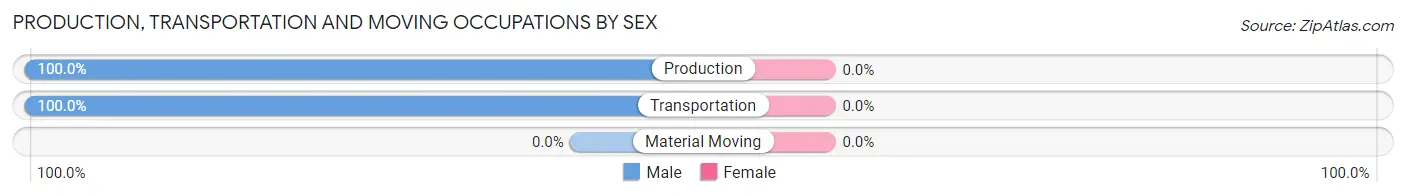
| Occupation | Male | Female |
| Production | 3 (100.0%) | 0 (0.0%) |
| Transportation | 3 (100.0%) | 0 (0.0%) |
| Material Moving | 0 (0.0%) | 0 (0.0%) |
| Total (Category) | 6 (100.0%) | 0 (0.0%) |
| Total (Overall) | 24 (50.0%) | 24 (50.0%) |
Employment Industries by Sex in Cordova
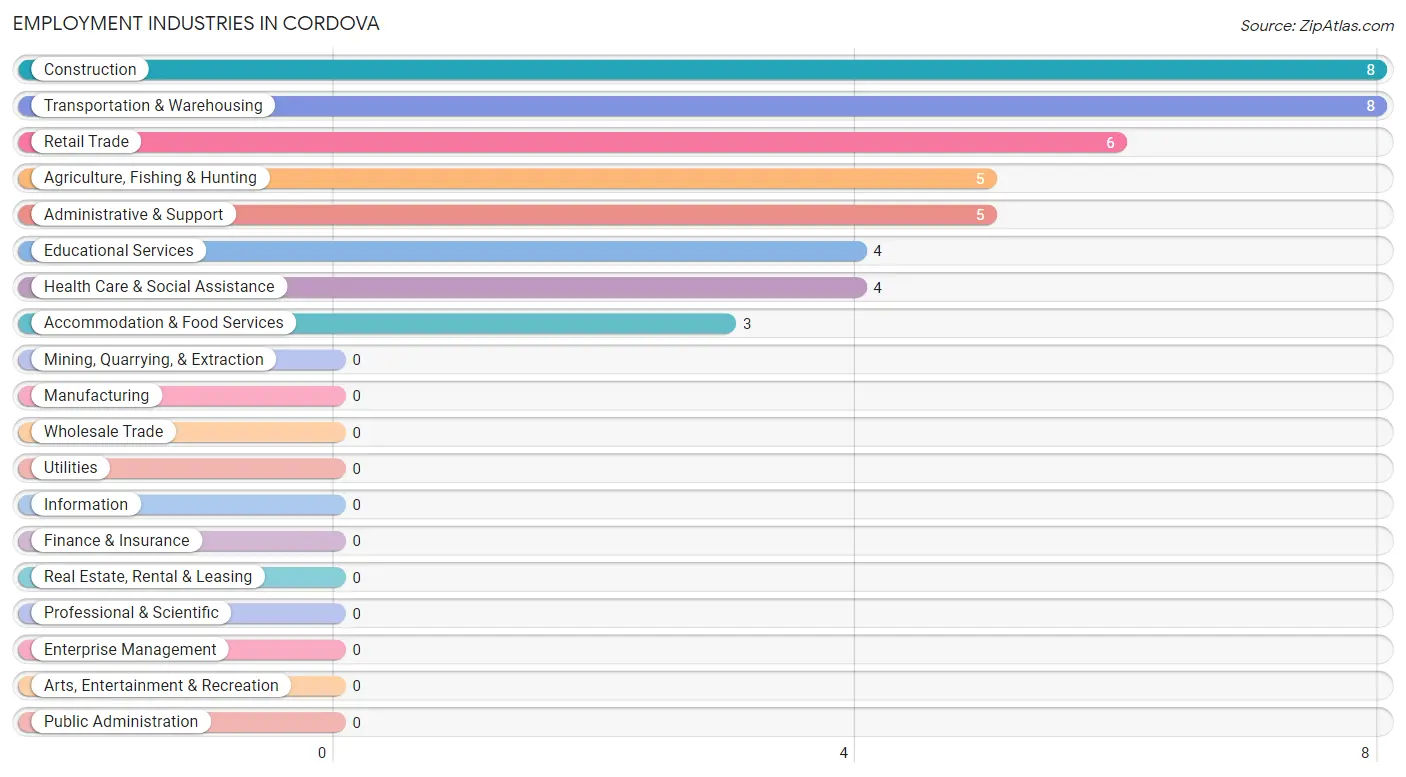
Employment Industries in Cordova
The major employment industries in Cordova include Construction (8 | 16.7%), Transportation & Warehousing (8 | 16.7%), Retail Trade (6 | 12.5%), Agriculture, Fishing & Hunting (5 | 10.4%), and Administrative & Support (5 | 10.4%).
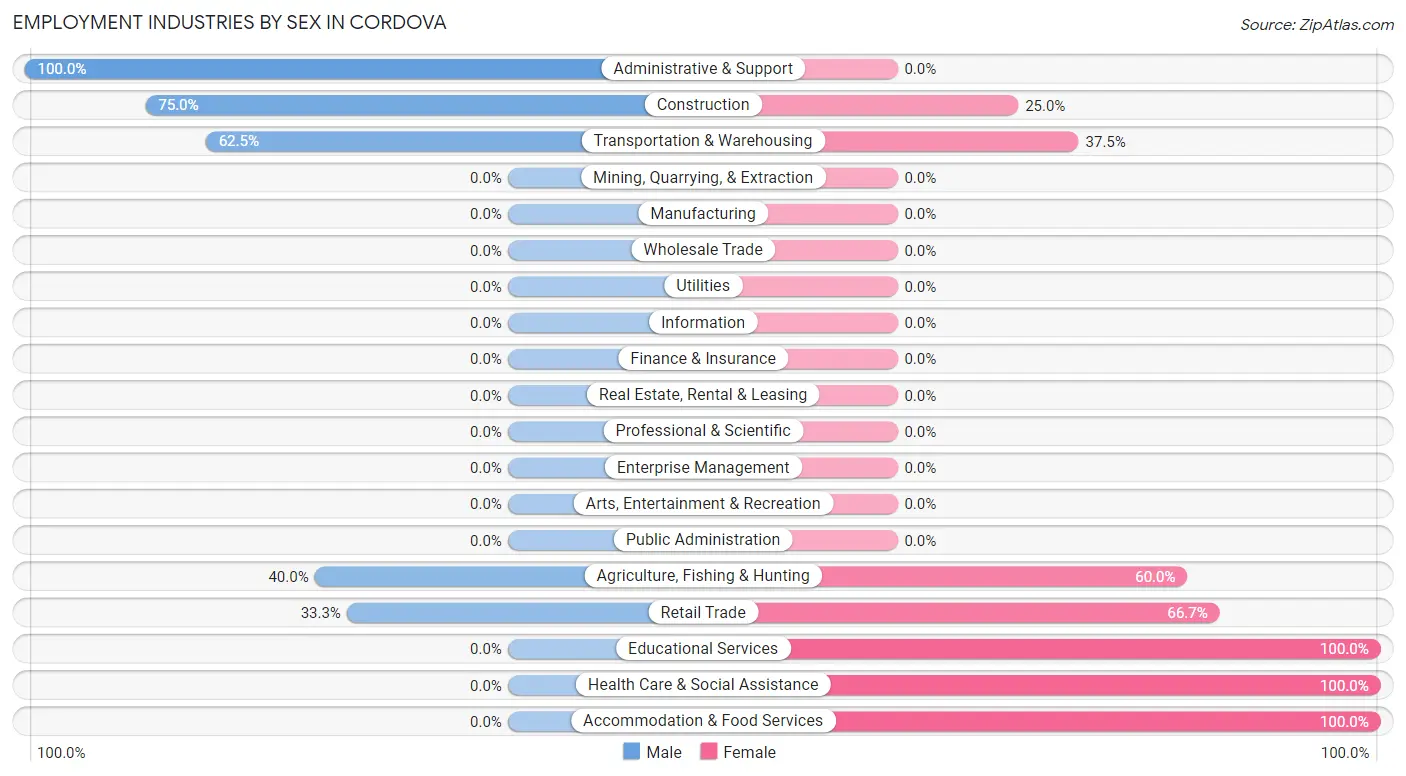
Employment Industries by Sex in Cordova
The Cordova industries that see more men than women are Administrative & Support (100.0%), Construction (75.0%), and Transportation & Warehousing (62.5%), whereas the industries that tend to have a higher number of women are Educational Services (100.0%), Health Care & Social Assistance (100.0%), and Accommodation & Food Services (100.0%).
| Industry | Male | Female |
| Agriculture, Fishing & Hunting | 2 (40.0%) | 3 (60.0%) |
| Mining, Quarrying, & Extraction | 0 (0.0%) | 0 (0.0%) |
| Construction | 6 (75.0%) | 2 (25.0%) |
| Manufacturing | 0 (0.0%) | 0 (0.0%) |
| Wholesale Trade | 0 (0.0%) | 0 (0.0%) |
| Retail Trade | 2 (33.3%) | 4 (66.7%) |
| Transportation & Warehousing | 5 (62.5%) | 3 (37.5%) |
| Utilities | 0 (0.0%) | 0 (0.0%) |
| Information | 0 (0.0%) | 0 (0.0%) |
| Finance & Insurance | 0 (0.0%) | 0 (0.0%) |
| Real Estate, Rental & Leasing | 0 (0.0%) | 0 (0.0%) |
| Professional & Scientific | 0 (0.0%) | 0 (0.0%) |
| Enterprise Management | 0 (0.0%) | 0 (0.0%) |
| Administrative & Support | 5 (100.0%) | 0 (0.0%) |
| Educational Services | 0 (0.0%) | 4 (100.0%) |
| Health Care & Social Assistance | 0 (0.0%) | 4 (100.0%) |
| Arts, Entertainment & Recreation | 0 (0.0%) | 0 (0.0%) |
| Accommodation & Food Services | 0 (0.0%) | 3 (100.0%) |
| Public Administration | 0 (0.0%) | 0 (0.0%) |
| Total | 24 (50.0%) | 24 (50.0%) |
Education in Cordova
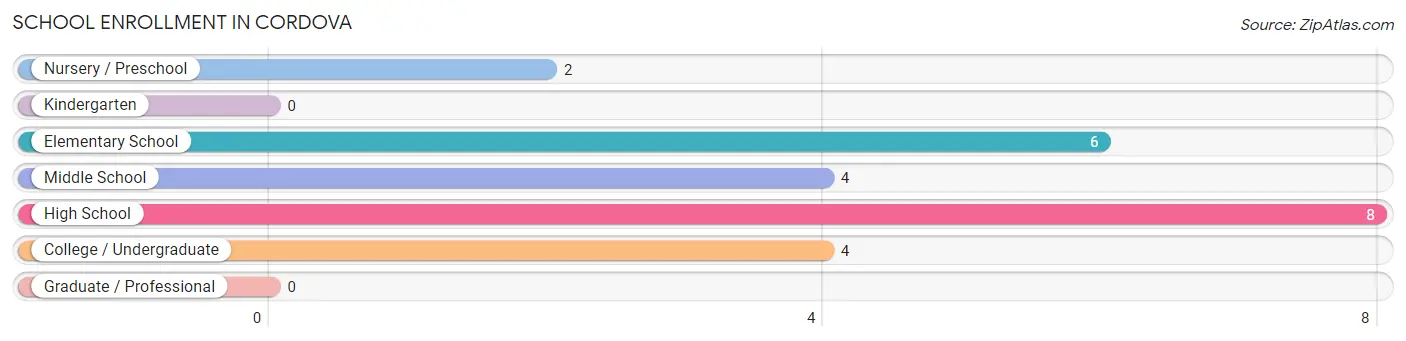
School Enrollment in Cordova
The most common levels of schooling among the 24 students in Cordova are high school (8 | 33.3%), elementary school (6 | 25.0%), and middle school (4 | 16.7%).
| School Level | # Students | % Students |
| Nursery / Preschool | 2 | 8.3% |
| Kindergarten | 0 | 0.0% |
| Elementary School | 6 | 25.0% |
| Middle School | 4 | 16.7% |
| High School | 8 | 33.3% |
| College / Undergraduate | 4 | 16.7% |
| Graduate / Professional | 0 | 0.0% |
| Total | 24 | 100.0% |
School Enrollment by Age by Funding Source in Cordova
Out of a total of 24 students who are enrolled in schools in Cordova, 5 (20.8%) attend a private institution, while the remaining 19 (79.2%) are enrolled in public schools. The age group of 3 to 4 year olds has the highest likelihood of being enrolled in private schools, with 2 (100.0% in the age bracket) enrolled. Conversely, the age group of 10 to 14 year olds has the lowest likelihood of being enrolled in a private school, with 4 (100.0% in the age bracket) attending a public institution.
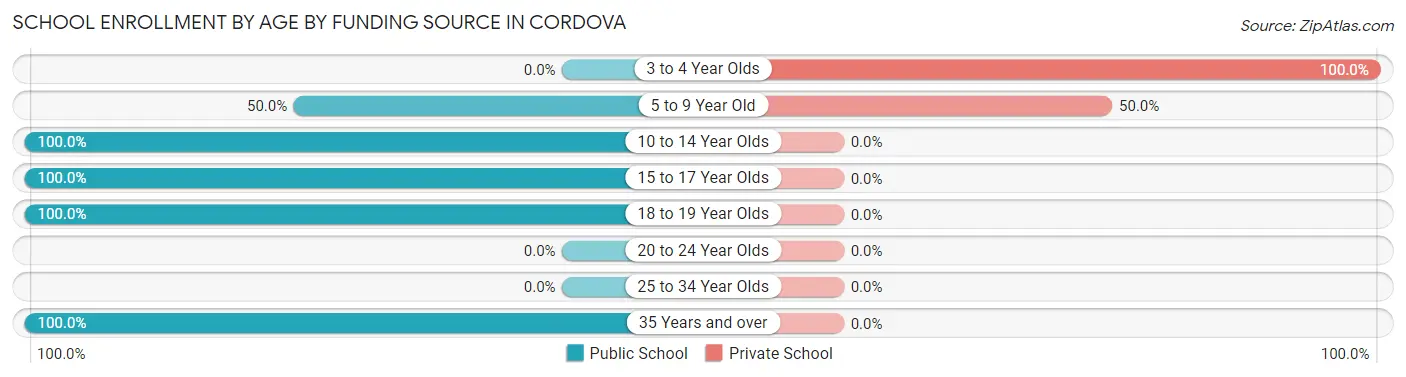
| Age Bracket | Public School | Private School |
| 3 to 4 Year Olds | 0 (0.0%) | 2 (100.0%) |
| 5 to 9 Year Old | 3 (50.0%) | 3 (50.0%) |
| 10 to 14 Year Olds | 4 (100.0%) | 0 (0.0%) |
| 15 to 17 Year Olds | 4 (100.0%) | 0 (0.0%) |
| 18 to 19 Year Olds | 4 (100.0%) | 0 (0.0%) |
| 20 to 24 Year Olds | 0 (0.0%) | 0 (0.0%) |
| 25 to 34 Year Olds | 0 (0.0%) | 0 (0.0%) |
| 35 Years and over | 4 (100.0%) | 0 (0.0%) |
| Total | 19 (79.2%) | 5 (20.8%) |
Educational Attainment by Field of Study in Cordova
Education (7 | 33.3%), bio, nature & agricultural (4 | 19.1%), multidisciplinary studies (4 | 19.1%), business (3 | 14.3%), and liberal arts & history (3 | 14.3%) are the most common fields of study among 21 individuals in Cordova who have obtained a bachelor's degree or higher.
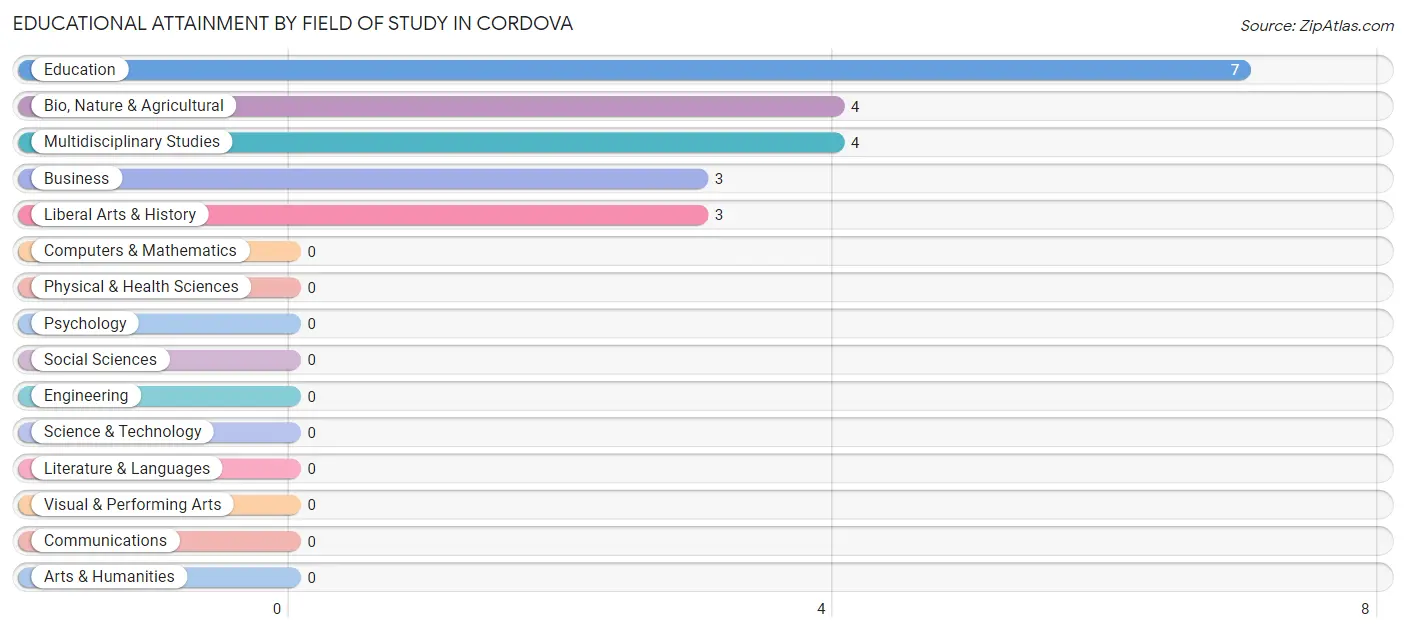
| Field of Study | # Graduates | % Graduates |
| Computers & Mathematics | 0 | 0.0% |
| Bio, Nature & Agricultural | 4 | 19.1% |
| Physical & Health Sciences | 0 | 0.0% |
| Psychology | 0 | 0.0% |
| Social Sciences | 0 | 0.0% |
| Engineering | 0 | 0.0% |
| Multidisciplinary Studies | 4 | 19.1% |
| Science & Technology | 0 | 0.0% |
| Business | 3 | 14.3% |
| Education | 7 | 33.3% |
| Literature & Languages | 0 | 0.0% |
| Liberal Arts & History | 3 | 14.3% |
| Visual & Performing Arts | 0 | 0.0% |
| Communications | 0 | 0.0% |
| Arts & Humanities | 0 | 0.0% |
| Total | 21 | 100.0% |
Transportation & Commute in Cordova
Vehicle Availability by Sex in Cordova
The most prevalent vehicle ownership categories in Cordova are males with 2 vehicles (13, accounting for 54.2%) and females with 2 vehicles (4, making up 65.0%).
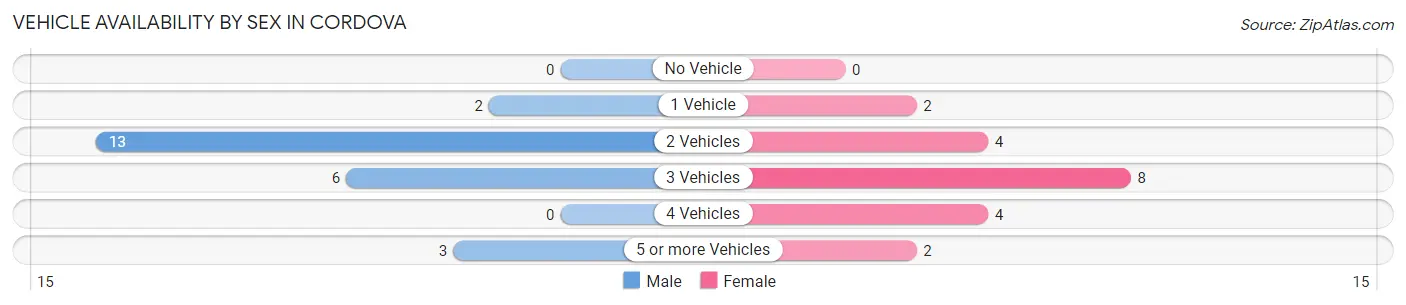
| Vehicles Available | Male | Female |
| No Vehicle | 0 (0.0%) | 0 (0.0%) |
| 1 Vehicle | 2 (8.3%) | 2 (10.0%) |
| 2 Vehicles | 13 (54.2%) | 4 (20.0%) |
| 3 Vehicles | 6 (25.0%) | 8 (40.0%) |
| 4 Vehicles | 0 (0.0%) | 4 (20.0%) |
| 5 or more Vehicles | 3 (12.5%) | 2 (10.0%) |
| Total | 24 (100.0%) | 20 (100.0%) |
Commute Time in Cordova
The most frequently occuring commute durations in Cordova are less than 5 minutes (10 commuters, 22.7%), 30 to 34 minutes (8 commuters, 18.2%), and 5 to 9 minutes (6 commuters, 13.6%).
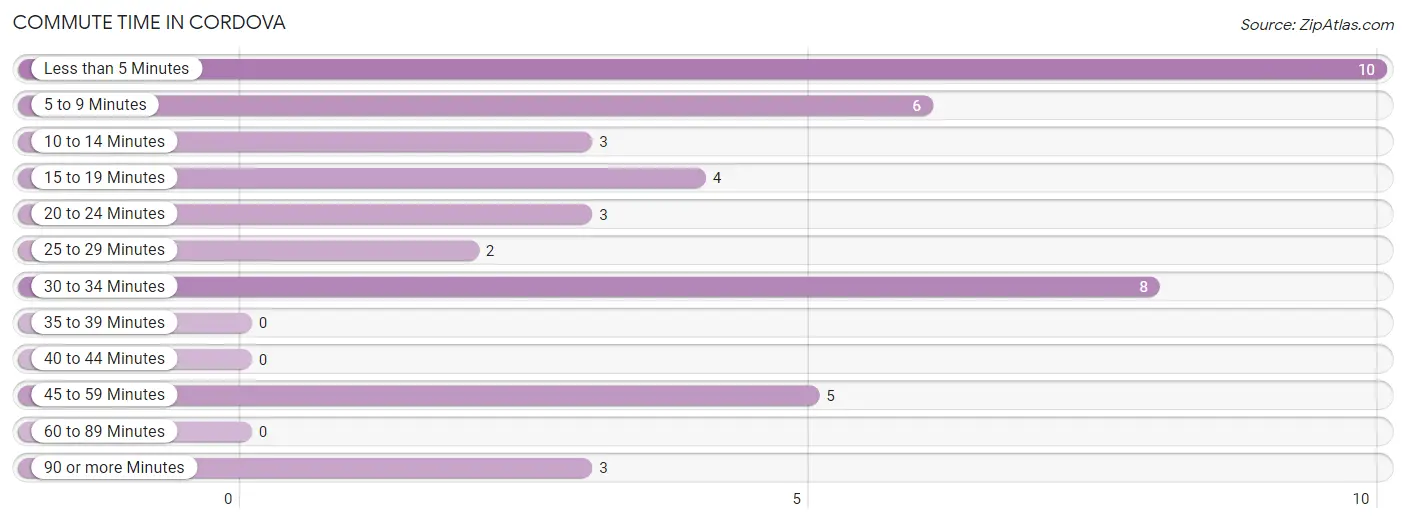
| Commute Time | # Commuters | % Commuters |
| Less than 5 Minutes | 10 | 22.7% |
| 5 to 9 Minutes | 6 | 13.6% |
| 10 to 14 Minutes | 3 | 6.8% |
| 15 to 19 Minutes | 4 | 9.1% |
| 20 to 24 Minutes | 3 | 6.8% |
| 25 to 29 Minutes | 2 | 4.5% |
| 30 to 34 Minutes | 8 | 18.2% |
| 35 to 39 Minutes | 0 | 0.0% |
| 40 to 44 Minutes | 0 | 0.0% |
| 45 to 59 Minutes | 5 | 11.4% |
| 60 to 89 Minutes | 0 | 0.0% |
| 90 or more Minutes | 3 | 6.8% |
Commute Time by Sex in Cordova
The most common commute times in Cordova are 45 to 59 minutes (5 commuters, 20.8%) for males and less than 5 minutes (6 commuters, 30.0%) for females.
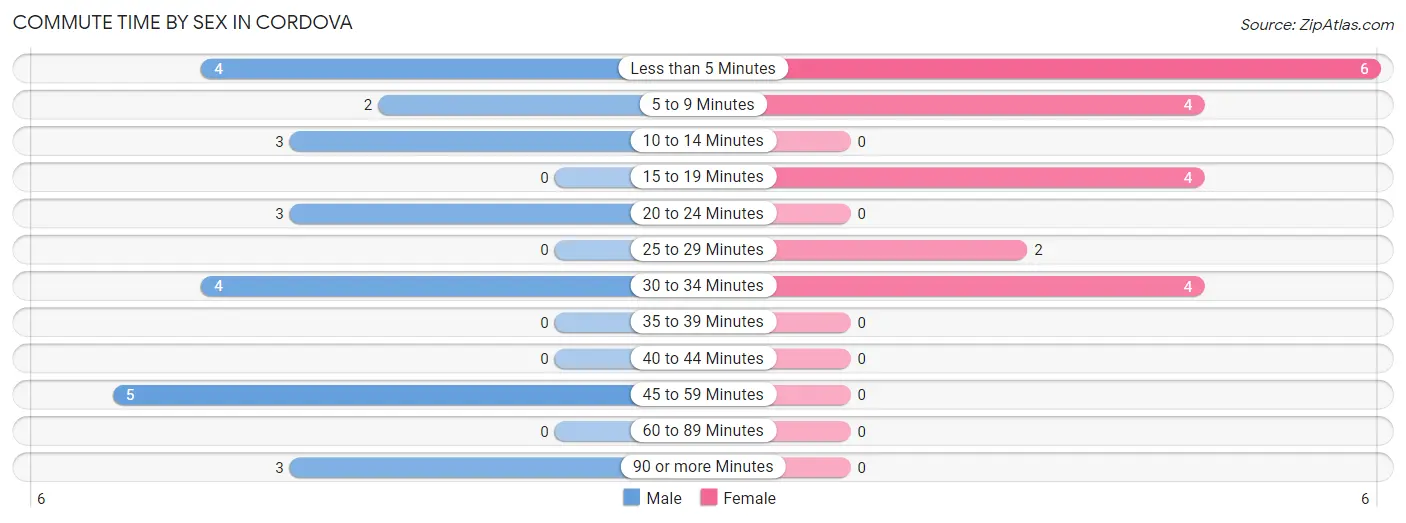
| Commute Time | Male | Female |
| Less than 5 Minutes | 4 (16.7%) | 6 (30.0%) |
| 5 to 9 Minutes | 2 (8.3%) | 4 (20.0%) |
| 10 to 14 Minutes | 3 (12.5%) | 0 (0.0%) |
| 15 to 19 Minutes | 0 (0.0%) | 4 (20.0%) |
| 20 to 24 Minutes | 3 (12.5%) | 0 (0.0%) |
| 25 to 29 Minutes | 0 (0.0%) | 2 (10.0%) |
| 30 to 34 Minutes | 4 (16.7%) | 4 (20.0%) |
| 35 to 39 Minutes | 0 (0.0%) | 0 (0.0%) |
| 40 to 44 Minutes | 0 (0.0%) | 0 (0.0%) |
| 45 to 59 Minutes | 5 (20.8%) | 0 (0.0%) |
| 60 to 89 Minutes | 0 (0.0%) | 0 (0.0%) |
| 90 or more Minutes | 3 (12.5%) | 0 (0.0%) |
Time of Departure to Work by Sex in Cordova
The most frequent times of departure to work in Cordova are 7:00 AM to 7:29 AM (7, 29.2%) for males and 7:00 AM to 7:29 AM (10, 50.0%) for females.
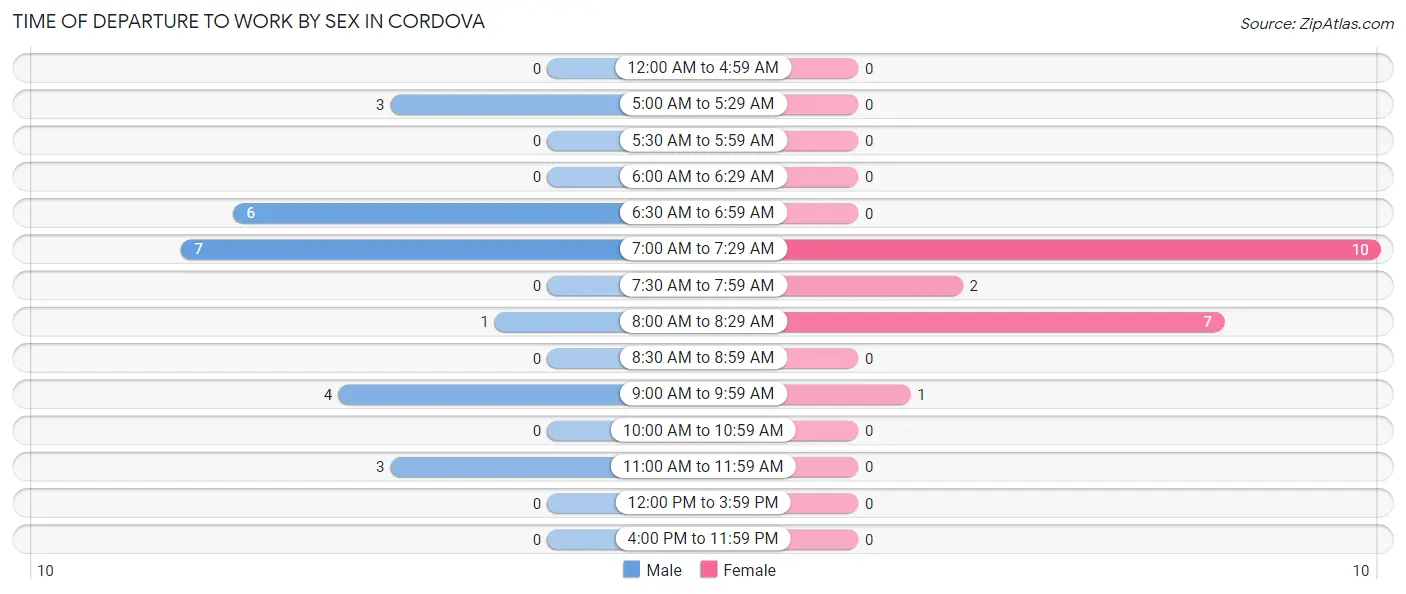
| Time of Departure | Male | Female |
| 12:00 AM to 4:59 AM | 0 (0.0%) | 0 (0.0%) |
| 5:00 AM to 5:29 AM | 3 (12.5%) | 0 (0.0%) |
| 5:30 AM to 5:59 AM | 0 (0.0%) | 0 (0.0%) |
| 6:00 AM to 6:29 AM | 0 (0.0%) | 0 (0.0%) |
| 6:30 AM to 6:59 AM | 6 (25.0%) | 0 (0.0%) |
| 7:00 AM to 7:29 AM | 7 (29.2%) | 10 (50.0%) |
| 7:30 AM to 7:59 AM | 0 (0.0%) | 2 (10.0%) |
| 8:00 AM to 8:29 AM | 1 (4.2%) | 7 (35.0%) |
| 8:30 AM to 8:59 AM | 0 (0.0%) | 0 (0.0%) |
| 9:00 AM to 9:59 AM | 4 (16.7%) | 1 (5.0%) |
| 10:00 AM to 10:59 AM | 0 (0.0%) | 0 (0.0%) |
| 11:00 AM to 11:59 AM | 3 (12.5%) | 0 (0.0%) |
| 12:00 PM to 3:59 PM | 0 (0.0%) | 0 (0.0%) |
| 4:00 PM to 11:59 PM | 0 (0.0%) | 0 (0.0%) |
| Total | 24 (100.0%) | 20 (100.0%) |
Housing Occupancy in Cordova
Occupancy by Ownership in Cordova
Of the total 48 dwellings in Cordova, owner-occupied units account for 39 (81.2%), while renter-occupied units make up 9 (18.8%).
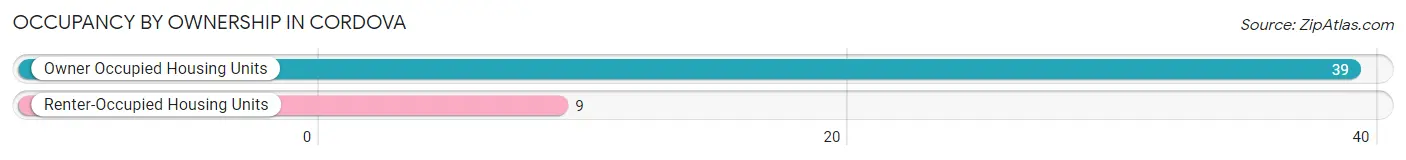
| Occupancy | # Housing Units | % Housing Units |
| Owner Occupied Housing Units | 39 | 81.2% |
| Renter-Occupied Housing Units | 9 | 18.8% |
| Total Occupied Housing Units | 48 | 100.0% |
Occupancy by Household Size in Cordova
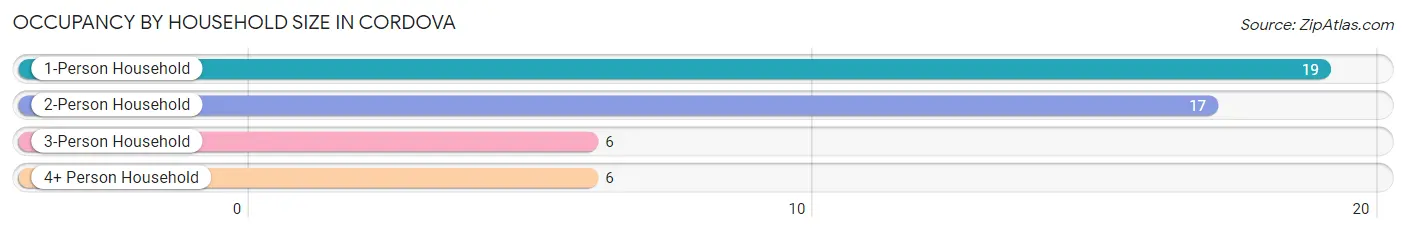
| Household Size | # Housing Units | % Housing Units |
| 1-Person Household | 19 | 39.6% |
| 2-Person Household | 17 | 35.4% |
| 3-Person Household | 6 | 12.5% |
| 4+ Person Household | 6 | 12.5% |
| Total Housing Units | 48 | 100.0% |
Occupancy by Ownership by Household Size in Cordova
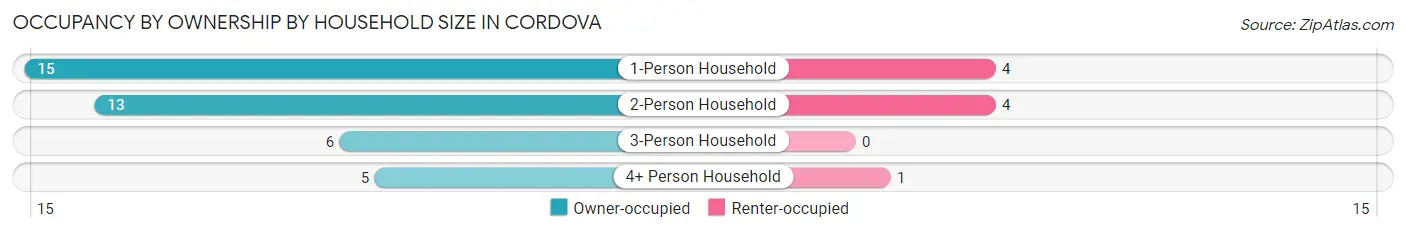
| Household Size | Owner-occupied | Renter-occupied |
| 1-Person Household | 15 (78.9%) | 4 (21.0%) |
| 2-Person Household | 13 (76.5%) | 4 (23.5%) |
| 3-Person Household | 6 (100.0%) | 0 (0.0%) |
| 4+ Person Household | 5 (83.3%) | 1 (16.7%) |
| Total Housing Units | 39 (81.2%) | 9 (18.8%) |
Occupancy by Educational Attainment in Cordova
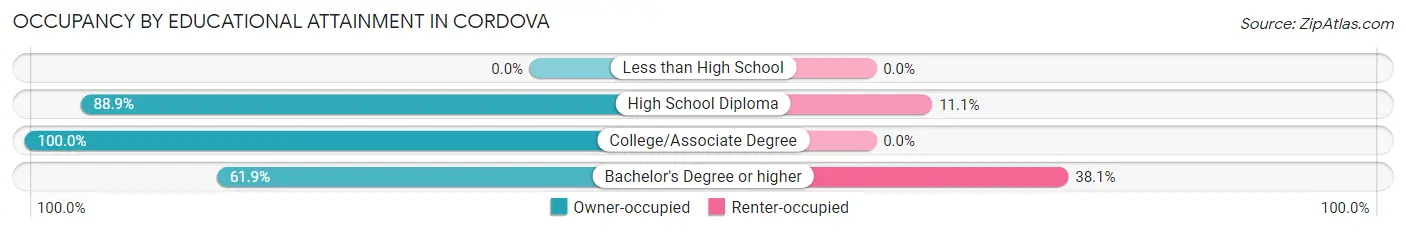
| Household Size | Owner-occupied | Renter-occupied |
| Less than High School | 0 (0.0%) | 0 (0.0%) |
| High School Diploma | 8 (88.9%) | 1 (11.1%) |
| College/Associate Degree | 18 (100.0%) | 0 (0.0%) |
| Bachelor's Degree or higher | 13 (61.9%) | 8 (38.1%) |
Occupancy by Age of Householder in Cordova
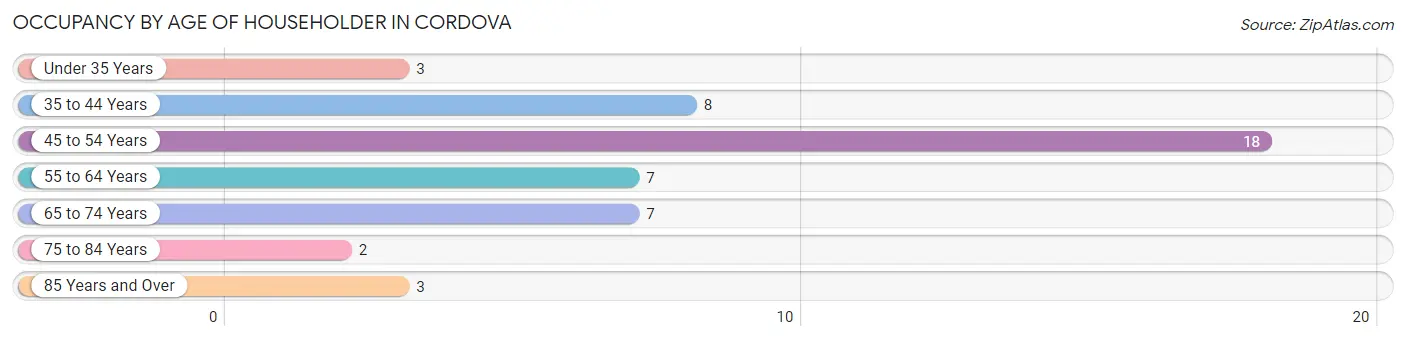
| Age Bracket | # Households | % Households |
| Under 35 Years | 3 | 6.2% |
| 35 to 44 Years | 8 | 16.7% |
| 45 to 54 Years | 18 | 37.5% |
| 55 to 64 Years | 7 | 14.6% |
| 65 to 74 Years | 7 | 14.6% |
| 75 to 84 Years | 2 | 4.2% |
| 85 Years and Over | 3 | 6.2% |
| Total | 48 | 100.0% |
Housing Finances in Cordova
Median Income by Occupancy in Cordova
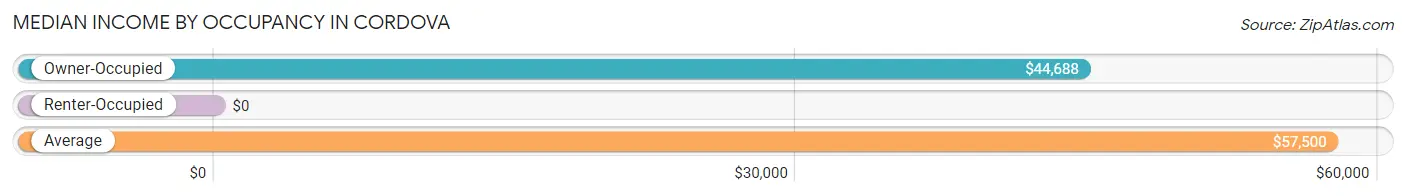
| Occupancy Type | # Households | Median Income |
| Owner-Occupied | 39 (81.2%) | $44,688 |
| Renter-Occupied | 9 (18.8%) | $0 |
| Average | 48 (100.0%) | $57,500 |
Occupancy by Householder Income Bracket in Cordova
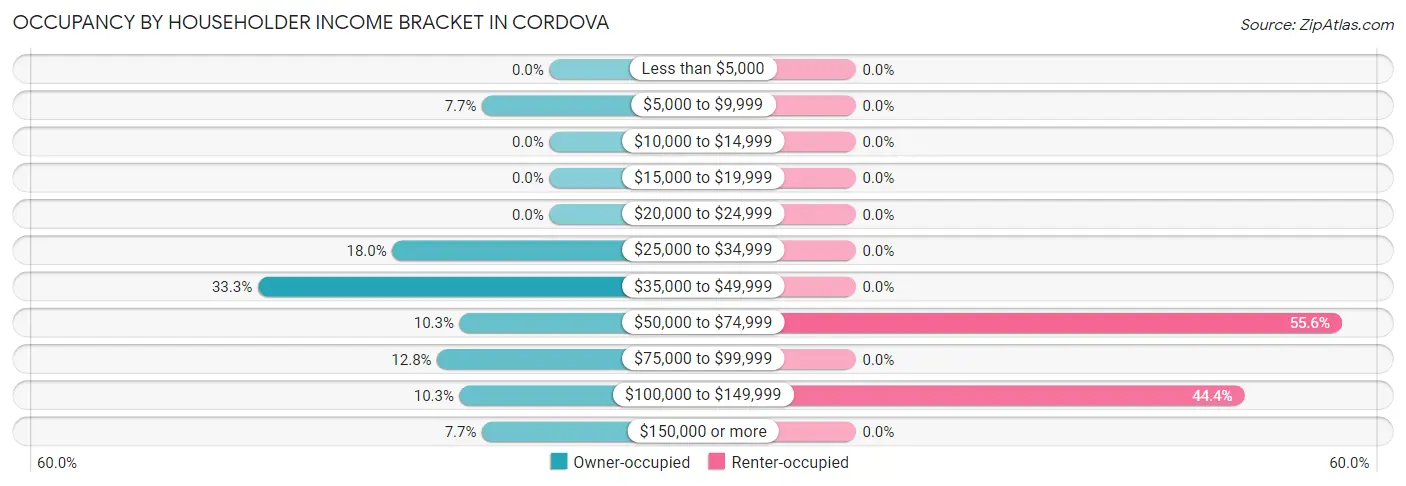
| Income Bracket | Owner-occupied | Renter-occupied |
| Less than $5,000 | 0 (0.0%) | 0 (0.0%) |
| $5,000 to $9,999 | 3 (7.7%) | 0 (0.0%) |
| $10,000 to $14,999 | 0 (0.0%) | 0 (0.0%) |
| $15,000 to $19,999 | 0 (0.0%) | 0 (0.0%) |
| $20,000 to $24,999 | 0 (0.0%) | 0 (0.0%) |
| $25,000 to $34,999 | 7 (17.9%) | 0 (0.0%) |
| $35,000 to $49,999 | 13 (33.3%) | 0 (0.0%) |
| $50,000 to $74,999 | 4 (10.3%) | 5 (55.6%) |
| $75,000 to $99,999 | 5 (12.8%) | 0 (0.0%) |
| $100,000 to $149,999 | 4 (10.3%) | 4 (44.4%) |
| $150,000 or more | 3 (7.7%) | 0 (0.0%) |
| Total | 39 (100.0%) | 9 (100.0%) |
Monthly Housing Cost Tiers in Cordova
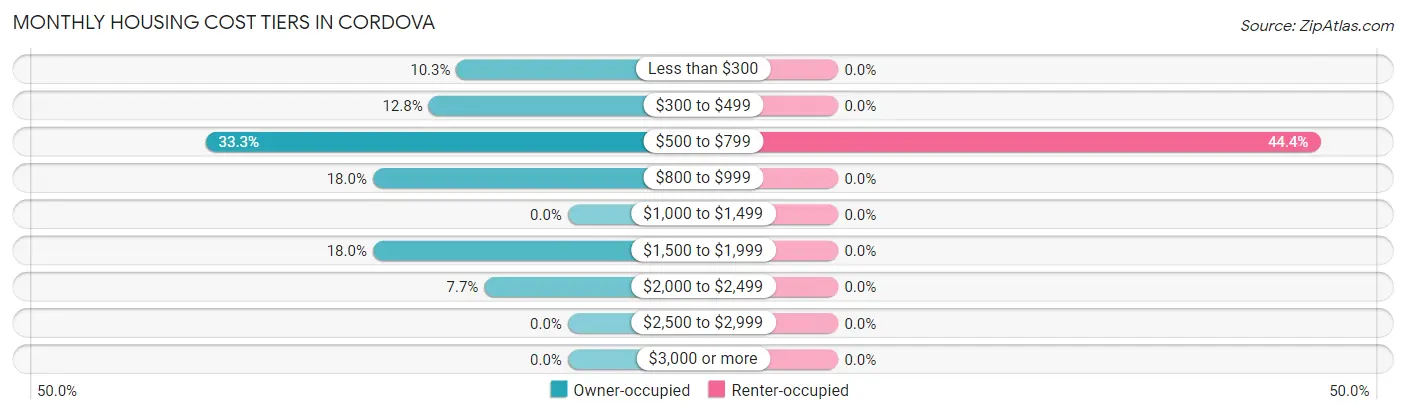
| Monthly Cost | Owner-occupied | Renter-occupied |
| Less than $300 | 4 (10.3%) | 0 (0.0%) |
| $300 to $499 | 5 (12.8%) | 0 (0.0%) |
| $500 to $799 | 13 (33.3%) | 4 (44.4%) |
| $800 to $999 | 7 (17.9%) | 0 (0.0%) |
| $1,000 to $1,499 | 0 (0.0%) | 0 (0.0%) |
| $1,500 to $1,999 | 7 (17.9%) | 0 (0.0%) |
| $2,000 to $2,499 | 3 (7.7%) | 0 (0.0%) |
| $2,500 to $2,999 | 0 (0.0%) | 0 (0.0%) |
| $3,000 or more | 0 (0.0%) | 0 (0.0%) |
| Total | 39 (100.0%) | 9 (100.0%) |
Physical Housing Characteristics in Cordova
Housing Structures in Cordova
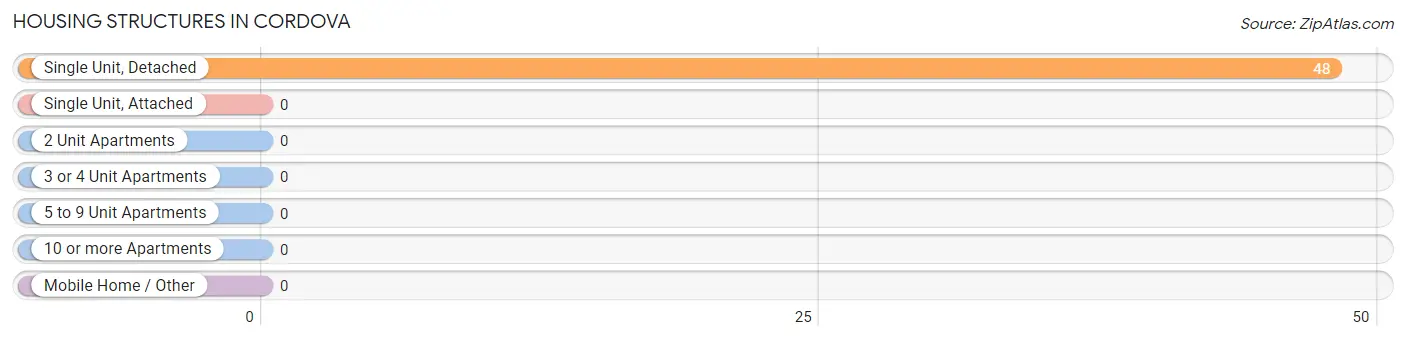
| Structure Type | # Housing Units | % Housing Units |
| Single Unit, Detached | 48 | 100.0% |
| Single Unit, Attached | 0 | 0.0% |
| 2 Unit Apartments | 0 | 0.0% |
| 3 or 4 Unit Apartments | 0 | 0.0% |
| 5 to 9 Unit Apartments | 0 | 0.0% |
| 10 or more Apartments | 0 | 0.0% |
| Mobile Home / Other | 0 | 0.0% |
| Total | 48 | 100.0% |
Housing Structures by Occupancy in Cordova
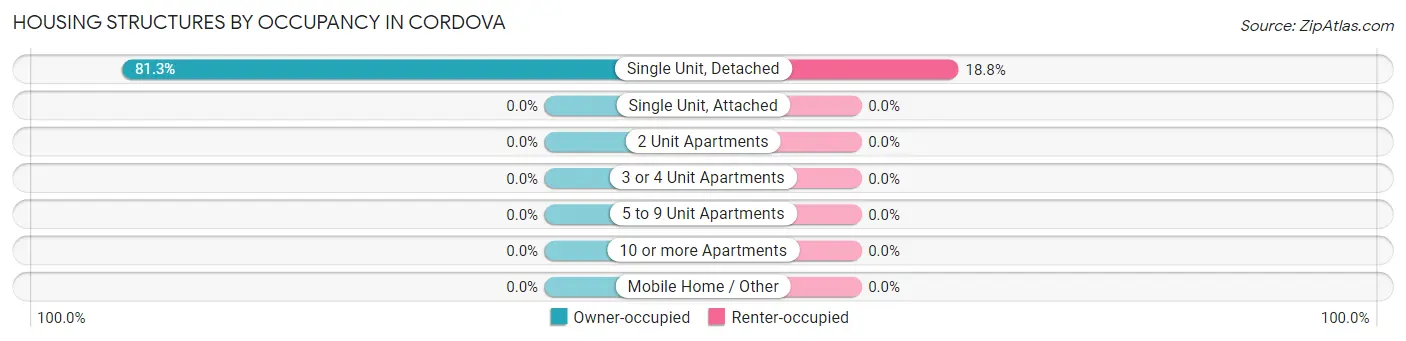
| Structure Type | Owner-occupied | Renter-occupied |
| Single Unit, Detached | 39 (81.2%) | 9 (18.8%) |
| Single Unit, Attached | 0 (0.0%) | 0 (0.0%) |
| 2 Unit Apartments | 0 (0.0%) | 0 (0.0%) |
| 3 or 4 Unit Apartments | 0 (0.0%) | 0 (0.0%) |
| 5 to 9 Unit Apartments | 0 (0.0%) | 0 (0.0%) |
| 10 or more Apartments | 0 (0.0%) | 0 (0.0%) |
| Mobile Home / Other | 0 (0.0%) | 0 (0.0%) |
| Total | 39 (81.2%) | 9 (18.8%) |
Housing Structures by Number of Rooms in Cordova
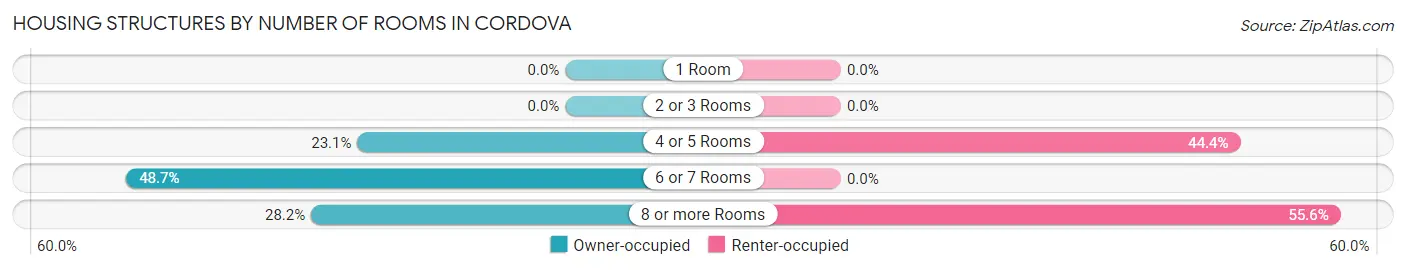
| Number of Rooms | Owner-occupied | Renter-occupied |
| 1 Room | 0 (0.0%) | 0 (0.0%) |
| 2 or 3 Rooms | 0 (0.0%) | 0 (0.0%) |
| 4 or 5 Rooms | 9 (23.1%) | 4 (44.4%) |
| 6 or 7 Rooms | 19 (48.7%) | 0 (0.0%) |
| 8 or more Rooms | 11 (28.2%) | 5 (55.6%) |
| Total | 39 (100.0%) | 9 (100.0%) |
Housing Structure by Heating Type in Cordova
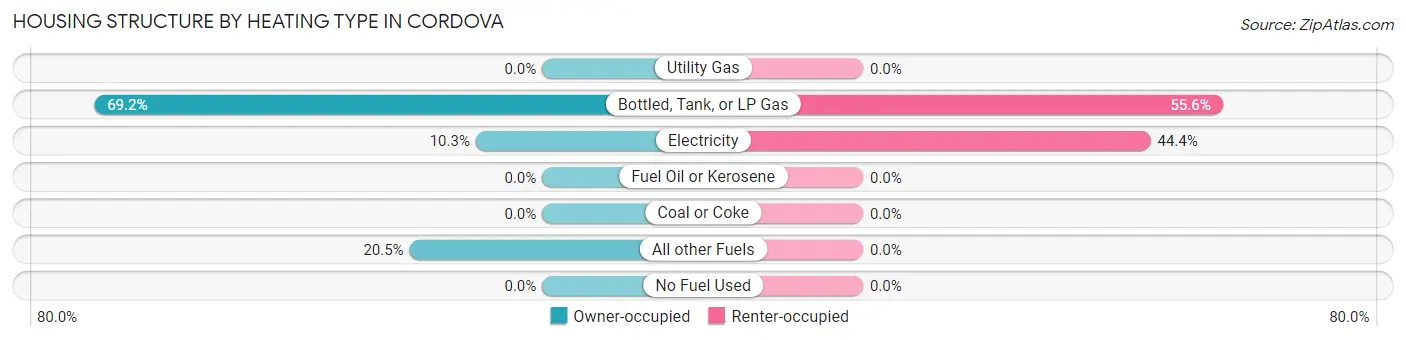
| Heating Type | Owner-occupied | Renter-occupied |
| Utility Gas | 0 (0.0%) | 0 (0.0%) |
| Bottled, Tank, or LP Gas | 27 (69.2%) | 5 (55.6%) |
| Electricity | 4 (10.3%) | 4 (44.4%) |
| Fuel Oil or Kerosene | 0 (0.0%) | 0 (0.0%) |
| Coal or Coke | 0 (0.0%) | 0 (0.0%) |
| All other Fuels | 8 (20.5%) | 0 (0.0%) |
| No Fuel Used | 0 (0.0%) | 0 (0.0%) |
| Total | 39 (100.0%) | 9 (100.0%) |
Household Vehicle Usage in Cordova
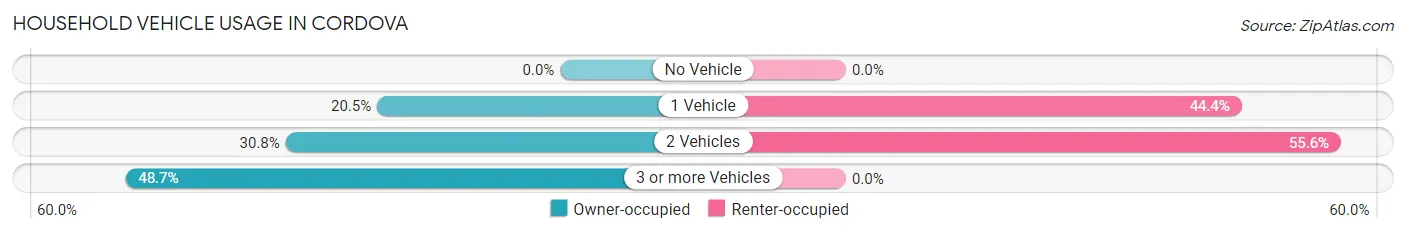
| Vehicles per Household | Owner-occupied | Renter-occupied |
| No Vehicle | 0 (0.0%) | 0 (0.0%) |
| 1 Vehicle | 8 (20.5%) | 4 (44.4%) |
| 2 Vehicles | 12 (30.8%) | 5 (55.6%) |
| 3 or more Vehicles | 19 (48.7%) | 0 (0.0%) |
| Total | 39 (100.0%) | 9 (100.0%) |
Real Estate & Mortgages in Cordova
Real Estate and Mortgage Overview in Cordova
| Characteristic | Without Mortgage | With Mortgage |
| Housing Units | 18 | 21 |
| Median Property Value | $83,300 | $73,600 |
| Median Household Income | $75,000 | $3 |
| Monthly Housing Costs | $550 | $0 |
| Real Estate Taxes | $1,389 | $0 |
Property Value by Mortgage Status in Cordova
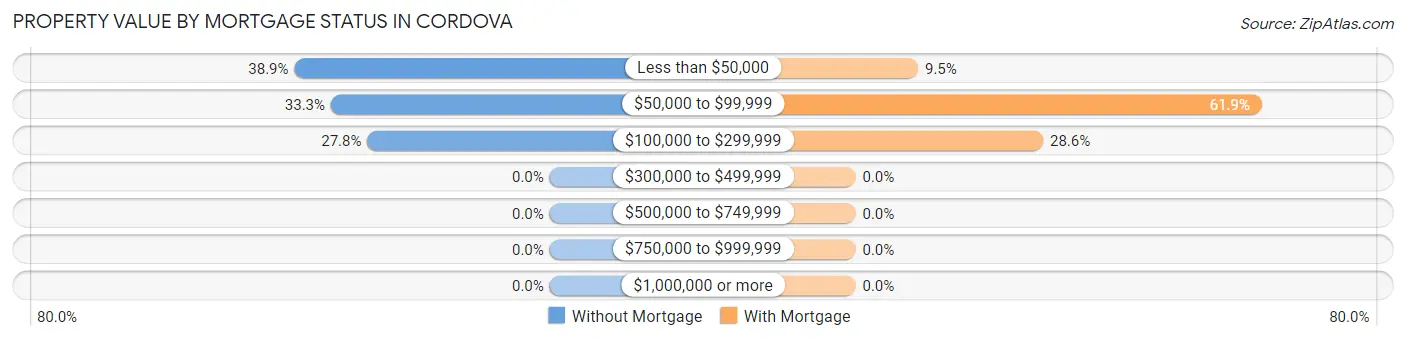
| Property Value | Without Mortgage | With Mortgage |
| Less than $50,000 | 7 (38.9%) | 2 (9.5%) |
| $50,000 to $99,999 | 6 (33.3%) | 13 (61.9%) |
| $100,000 to $299,999 | 5 (27.8%) | 6 (28.6%) |
| $300,000 to $499,999 | 0 (0.0%) | 0 (0.0%) |
| $500,000 to $749,999 | 0 (0.0%) | 0 (0.0%) |
| $750,000 to $999,999 | 0 (0.0%) | 0 (0.0%) |
| $1,000,000 or more | 0 (0.0%) | 0 (0.0%) |
| Total | 18 (100.0%) | 21 (100.0%) |
Household Income by Mortgage Status in Cordova
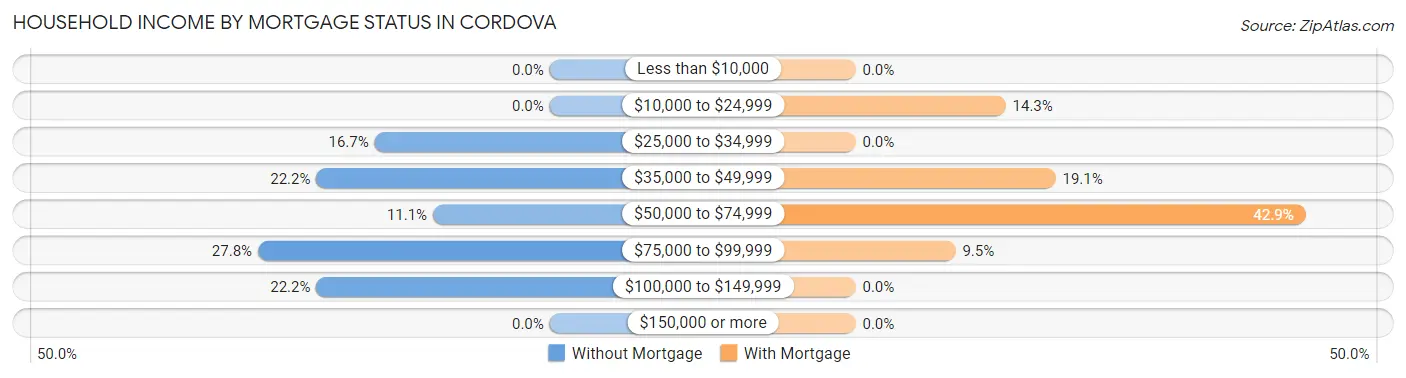
| Household Income | Without Mortgage | With Mortgage |
| Less than $10,000 | 0 (0.0%) | 0 (0.0%) |
| $10,000 to $24,999 | 0 (0.0%) | 3 (14.3%) |
| $25,000 to $34,999 | 3 (16.7%) | 0 (0.0%) |
| $35,000 to $49,999 | 4 (22.2%) | 4 (19.1%) |
| $50,000 to $74,999 | 2 (11.1%) | 9 (42.9%) |
| $75,000 to $99,999 | 5 (27.8%) | 2 (9.5%) |
| $100,000 to $149,999 | 4 (22.2%) | 0 (0.0%) |
| $150,000 or more | 0 (0.0%) | 0 (0.0%) |
| Total | 18 (100.0%) | 21 (100.0%) |
Property Value to Household Income Ratio in Cordova
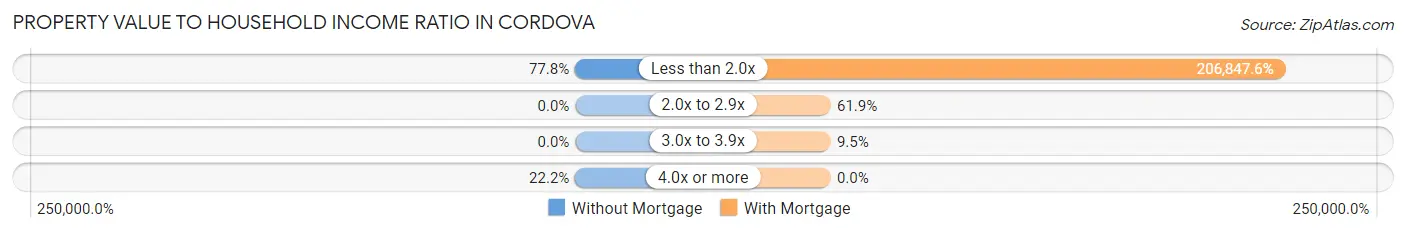
| Value-to-Income Ratio | Without Mortgage | With Mortgage |
| Less than 2.0x | 14 (77.8%) | 43,438 (206,847.6%) |
| 2.0x to 2.9x | 0 (0.0%) | 13 (61.9%) |
| 3.0x to 3.9x | 0 (0.0%) | 2 (9.5%) |
| 4.0x or more | 4 (22.2%) | 0 (0.0%) |
| Total | 18 (100.0%) | 21 (100.0%) |
Real Estate Taxes by Mortgage Status in Cordova
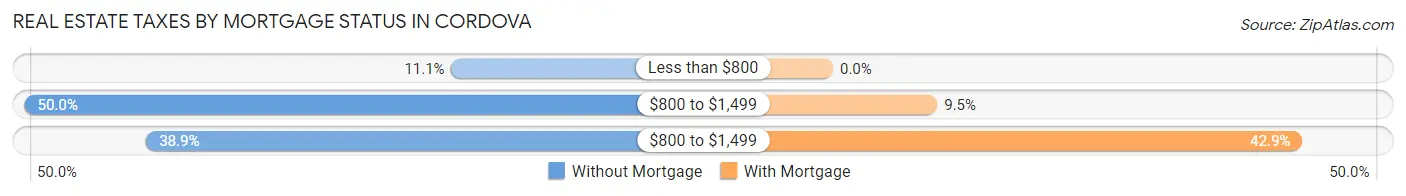
| Property Taxes | Without Mortgage | With Mortgage |
| Less than $800 | 2 (11.1%) | 0 (0.0%) |
| $800 to $1,499 | 9 (50.0%) | 2 (9.5%) |
| $800 to $1,499 | 7 (38.9%) | 9 (42.9%) |
| Total | 18 (100.0%) | 21 (100.0%) |
Health & Disability in Cordova
Health Insurance Coverage by Age in Cordova
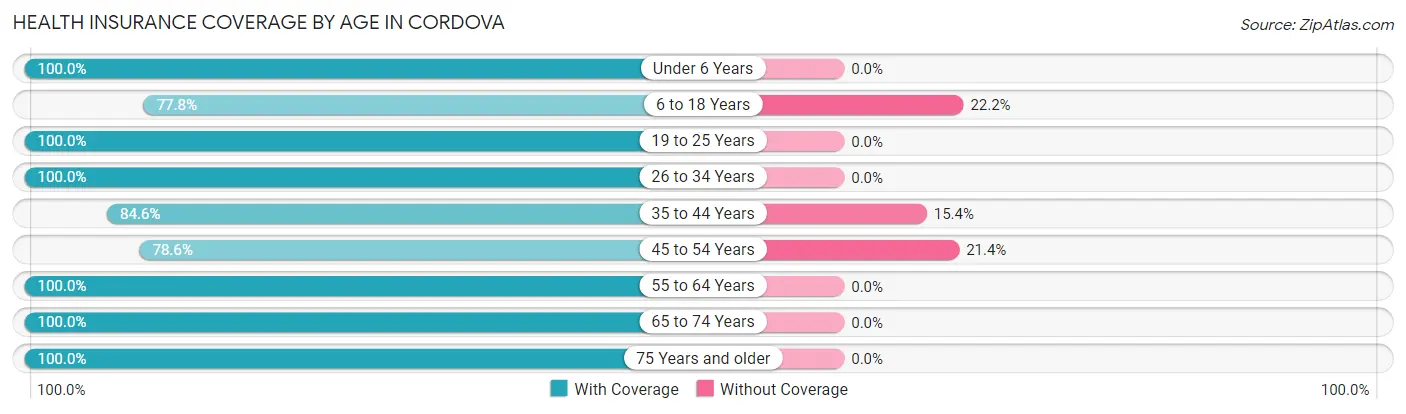
| Age Bracket | With Coverage | Without Coverage |
| Under 6 Years | 9 (100.0%) | 0 (0.0%) |
| 6 to 18 Years | 14 (77.8%) | 4 (22.2%) |
| 19 to 25 Years | 7 (100.0%) | 0 (0.0%) |
| 26 to 34 Years | 4 (100.0%) | 0 (0.0%) |
| 35 to 44 Years | 11 (84.6%) | 2 (15.4%) |
| 45 to 54 Years | 22 (78.6%) | 6 (21.4%) |
| 55 to 64 Years | 18 (100.0%) | 0 (0.0%) |
| 65 to 74 Years | 8 (100.0%) | 0 (0.0%) |
| 75 Years and older | 5 (100.0%) | 0 (0.0%) |
| Total | 98 (89.1%) | 12 (10.9%) |
Health Insurance Coverage by Citizenship Status in Cordova
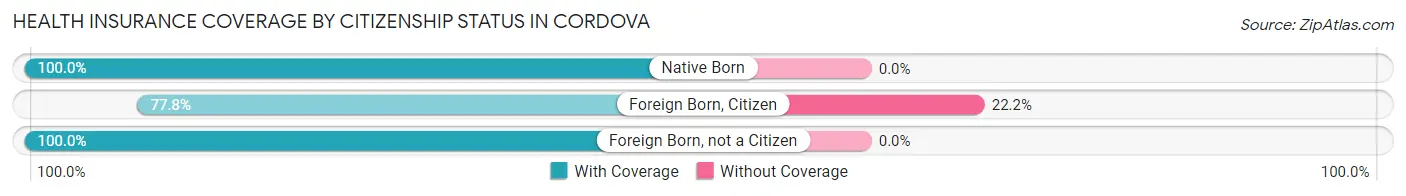
| Citizenship Status | With Coverage | Without Coverage |
| Native Born | 9 (100.0%) | 0 (0.0%) |
| Foreign Born, Citizen | 14 (77.8%) | 4 (22.2%) |
| Foreign Born, not a Citizen | 7 (100.0%) | 0 (0.0%) |
Health Insurance Coverage by Household Income in Cordova
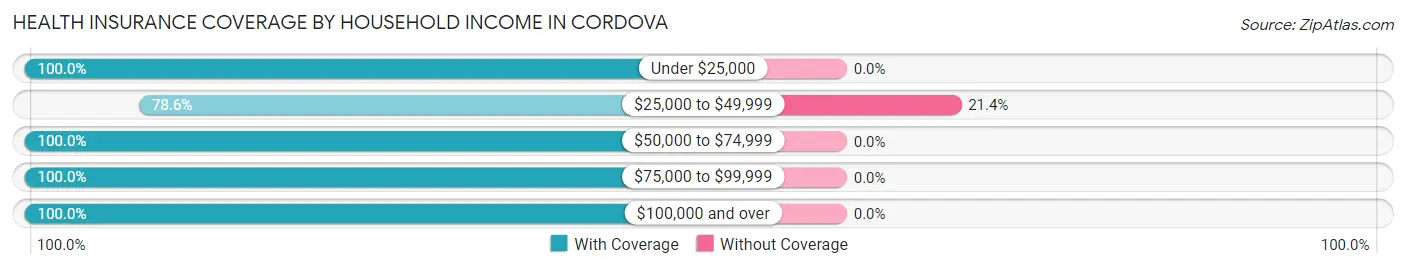
| Household Income | With Coverage | Without Coverage |
| Under $25,000 | 6 (100.0%) | 0 (0.0%) |
| $25,000 to $49,999 | 44 (78.6%) | 12 (21.4%) |
| $50,000 to $74,999 | 19 (100.0%) | 0 (0.0%) |
| $75,000 to $99,999 | 11 (100.0%) | 0 (0.0%) |
| $100,000 and over | 18 (100.0%) | 0 (0.0%) |
Public vs Private Health Insurance Coverage by Age in Cordova
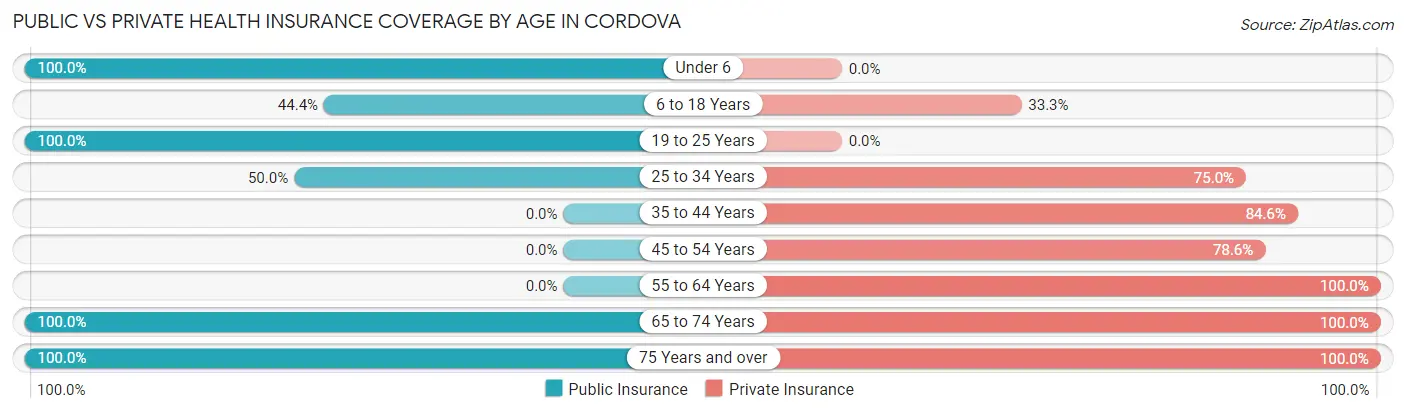
| Age Bracket | Public Insurance | Private Insurance |
| Under 6 | 9 (100.0%) | 0 (0.0%) |
| 6 to 18 Years | 8 (44.4%) | 6 (33.3%) |
| 19 to 25 Years | 7 (100.0%) | 0 (0.0%) |
| 25 to 34 Years | 2 (50.0%) | 3 (75.0%) |
| 35 to 44 Years | 0 (0.0%) | 11 (84.6%) |
| 45 to 54 Years | 0 (0.0%) | 22 (78.6%) |
| 55 to 64 Years | 0 (0.0%) | 18 (100.0%) |
| 65 to 74 Years | 8 (100.0%) | 8 (100.0%) |
| 75 Years and over | 5 (100.0%) | 5 (100.0%) |
| Total | 39 (35.4%) | 73 (66.4%) |
Disability Status by Sex by Age in Cordova
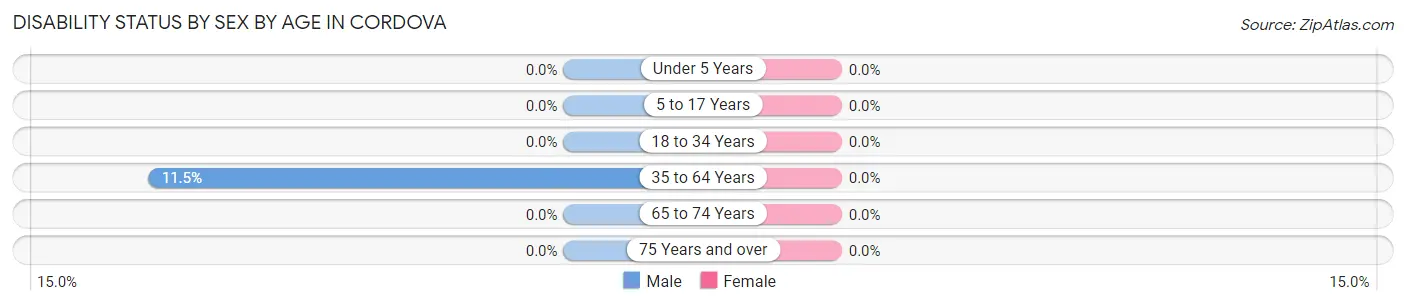
| Age Bracket | Male | Female |
| Under 5 Years | 0 (0.0%) | 0 (0.0%) |
| 5 to 17 Years | 0 (0.0%) | 0 (0.0%) |
| 18 to 34 Years | 0 (0.0%) | 0 (0.0%) |
| 35 to 64 Years | 3 (11.5%) | 0 (0.0%) |
| 65 to 74 Years | 0 (0.0%) | 0 (0.0%) |
| 75 Years and over | 0 (0.0%) | 0 (0.0%) |
Disability Class by Sex by Age in Cordova
Disability Class: Hearing Difficulty
| Age Bracket | Male | Female |
| Under 5 Years | 0 (0.0%) | 0 (0.0%) |
| 5 to 17 Years | 0 (0.0%) | 0 (0.0%) |
| 18 to 34 Years | 0 (0.0%) | 0 (0.0%) |
| 35 to 64 Years | 0 (0.0%) | 0 (0.0%) |
| 65 to 74 Years | 0 (0.0%) | 0 (0.0%) |
| 75 Years and over | 0 (0.0%) | 0 (0.0%) |
Disability Class: Vision Difficulty
| Age Bracket | Male | Female |
| Under 5 Years | 0 (0.0%) | 0 (0.0%) |
| 5 to 17 Years | 0 (0.0%) | 0 (0.0%) |
| 18 to 34 Years | 0 (0.0%) | 0 (0.0%) |
| 35 to 64 Years | 0 (0.0%) | 0 (0.0%) |
| 65 to 74 Years | 0 (0.0%) | 0 (0.0%) |
| 75 Years and over | 0 (0.0%) | 0 (0.0%) |
Disability Class: Cognitive Difficulty
| Age Bracket | Male | Female |
| 5 to 17 Years | 0 (0.0%) | 0 (0.0%) |
| 18 to 34 Years | 0 (0.0%) | 0 (0.0%) |
| 35 to 64 Years | 0 (0.0%) | 0 (0.0%) |
| 65 to 74 Years | 0 (0.0%) | 0 (0.0%) |
| 75 Years and over | 0 (0.0%) | 0 (0.0%) |
Disability Class: Ambulatory Difficulty
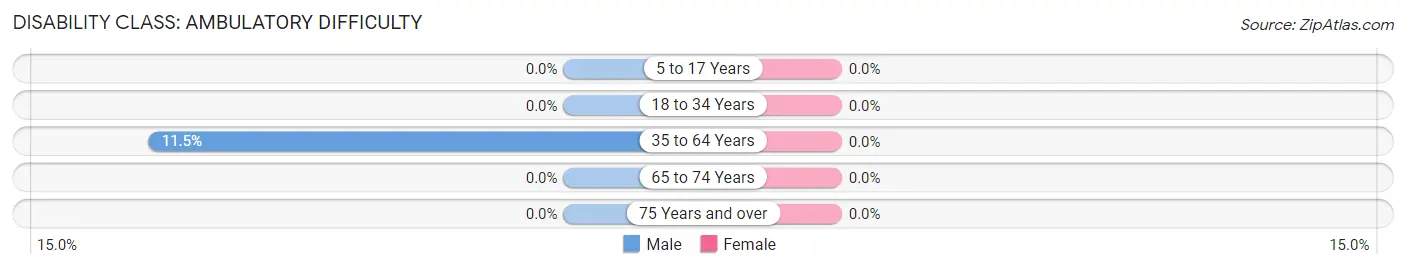
| Age Bracket | Male | Female |
| 5 to 17 Years | 0 (0.0%) | 0 (0.0%) |
| 18 to 34 Years | 0 (0.0%) | 0 (0.0%) |
| 35 to 64 Years | 3 (11.5%) | 0 (0.0%) |
| 65 to 74 Years | 0 (0.0%) | 0 (0.0%) |
| 75 Years and over | 0 (0.0%) | 0 (0.0%) |
Disability Class: Self-Care Difficulty
| Age Bracket | Male | Female |
| 5 to 17 Years | 0 (0.0%) | 0 (0.0%) |
| 18 to 34 Years | 0 (0.0%) | 0 (0.0%) |
| 35 to 64 Years | 0 (0.0%) | 0 (0.0%) |
| 65 to 74 Years | 0 (0.0%) | 0 (0.0%) |
| 75 Years and over | 0 (0.0%) | 0 (0.0%) |
Technology Access in Cordova
Computing Device Access in Cordova
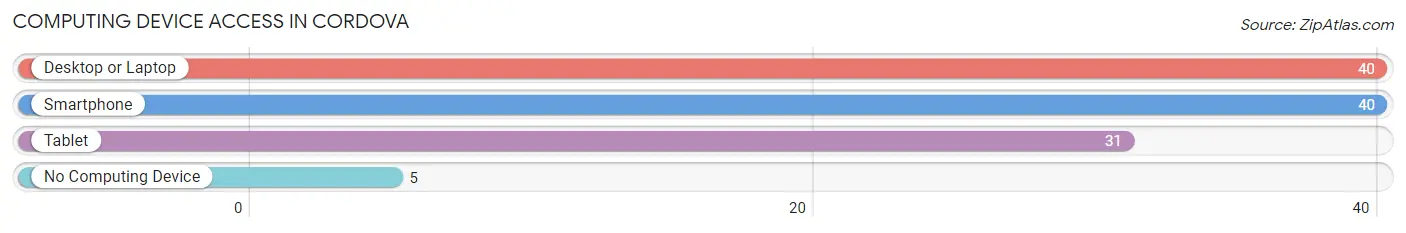
| Device Type | # Households | % Households |
| Desktop or Laptop | 40 | 83.3% |
| Smartphone | 40 | 83.3% |
| Tablet | 31 | 64.6% |
| No Computing Device | 5 | 10.4% |
| Total | 48 | 100.0% |
Internet Access in Cordova
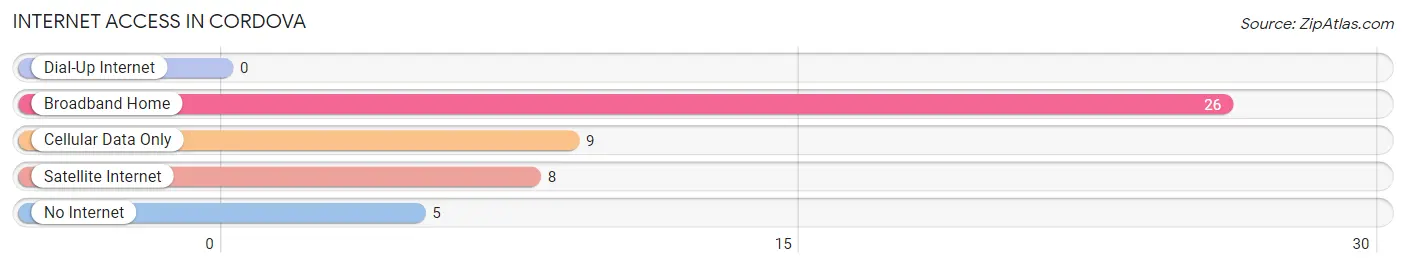
| Internet Type | # Households | % Households |
| Dial-Up Internet | 0 | 0.0% |
| Broadband Home | 26 | 54.2% |
| Cellular Data Only | 9 | 18.8% |
| Satellite Internet | 8 | 16.7% |
| No Internet | 5 | 10.4% |
| Total | 48 | 100.0% |
Cordova Summary
Cordova is a small city located in Saunders County, Nebraska, United States. It is situated on the banks of the Platte River, approximately 30 miles west of Omaha. The city has a population of 1,845 as of the 2010 census.
History
Cordova was founded in 1856 by a group of settlers from the nearby town of Wahoo. The settlers named the town after the Spanish city of Cordoba, which was the birthplace of one of the settlers. The town was originally a farming community, but it soon became a trading post for the surrounding area.
In 1867, the Union Pacific Railroad was built through Cordova, connecting it to Omaha and other cities in the region. This allowed the town to become a major shipping hub for the surrounding area.
In the late 19th century, Cordova became a popular destination for tourists. The town was known for its natural beauty, and it was a popular spot for fishing and hunting.
In the early 20th century, Cordova began to experience a decline in population. This was due to the Great Depression and the Dust Bowl, which caused many people to leave the area in search of work.
Geography
Cordova is located in Saunders County, Nebraska, approximately 30 miles west of Omaha. The city is situated on the banks of the Platte River. The city has a total area of 1.2 square miles, all of which is land.
The climate in Cordova is classified as humid continental, with hot summers and cold winters. The average temperature in the summer is around 80 degrees Fahrenheit, and the average temperature in the winter is around 20 degrees Fahrenheit.
Economy
Cordova’s economy is largely based on agriculture. The city is home to several large farms, which produce corn, soybeans, and other crops. The city also has several businesses, including a grocery store, a hardware store, and a few restaurants.
The city is also home to a few manufacturing companies, which produce a variety of products, including furniture, clothing, and electronics.
Demographics
As of the 2010 census, Cordova had a population of 1,845. The racial makeup of the city was 95.3% White, 0.7% African American, 0.3% Native American, 0.2% Asian, 0.1% Pacific Islander, 1.2% from other races, and 2.4% from two or more races. Hispanic or Latino of any race were 3.2% of the population.
The median income for a household in Cordova was $41,250, and the median income for a family was $50,000. The per capita income for the city was $20,845. About 8.3% of families and 10.2% of the population were below the poverty line, including 14.2% of those under age 18 and 8.3% of those age 65 or over.
Conclusion
Cordova is a small city located in Saunders County, Nebraska, United States. It is situated on the banks of the Platte River, approximately 30 miles west of Omaha. The city has a population of 1,845 as of the 2010 census. The city’s economy is largely based on agriculture, and it is also home to several manufacturing companies. The racial makeup of the city is predominantly White, with a small percentage of African American, Native American, Asian, and Pacific Islander residents. The median income for a household in Cordova was $41,250, and the median income for a family was $50,000.
Common Questions
What is Per Capita Income in Cordova?
Per Capita income in Cordova is $35,464.
What is the Median Family Income in Cordova?
Median Family Income in Cordova is $53,750.
What is the Median Household income in Cordova?
Median Household Income in Cordova is $57,500.
What is Income or Wage Gap in Cordova?
Income or Wage Gap in Cordova is 24.3%.
Women in Cordova earn 75.7 cents for every dollar earned by a man.
What is Inequality or Gini Index in Cordova?
Inequality or Gini Index in Cordova is 0.43.
What is the Total Population of Cordova?
Total Population of Cordova is 110.
What is the Total Male Population of Cordova?
Total Male Population of Cordova is 54.
What is the Total Female Population of Cordova?
Total Female Population of Cordova is 56.
What is the Ratio of Males per 100 Females in Cordova?
There are 96.43 Males per 100 Females in Cordova.
What is the Ratio of Females per 100 Males in Cordova?
There are 103.70 Females per 100 Males in Cordova.
What is the Median Population Age in Cordova?
Median Population Age in Cordova is 50.1 Years.
What is the Average Family Size in Cordova
Average Family Size in Cordova is 3.1 People.
What is the Average Household Size in Cordova
Average Household Size in Cordova is 2.3 People.
How Large is the Labor Force in Cordova?
There are 48 People in the Labor Forcein in Cordova.
What is the Percentage of People in the Labor Force in Cordova?
52.7% of People are in the Labor Force in Cordova.