Clinton, NE Map & Demographics
Clinton Map
Clinton Overview
$42,144
PER CAPITA INCOME
0.28
INEQUALITY / GINI INDEX
57
TOTAL POPULATION
31
MALE POPULATION
26
FEMALE POPULATION
119.23
MALES / 100 FEMALES
83.87
FEMALES / 100 MALES
60.4
MEDIAN AGE
1.9
AVG FAMILY SIZE
1.8
AVG HOUSEHOLD SIZE
32
LABOR FORCE [ PEOPLE ]
56.1%
PERCENT IN LABOR FORCE
Income in Clinton
Income Overview in Clinton
| Characteristic | Number | Measure |
| Per Capita Income | 57 | $42,144 |
| Median Family Income | 26 | $0 |
| Mean Family Income | 26 | $84,531 |
| Median Household Income | 31 | $0 |
| Mean Household Income | 31 | $81,177 |
| Income Deficit | 26 | $0 |
| Wage / Income Gap (%) | 57 | 0.00% |
| Wage / Income Gap ($) | 57 | 100.00¢ per $1 |
| Gini / Inequality Index | 57 | 0.28 |
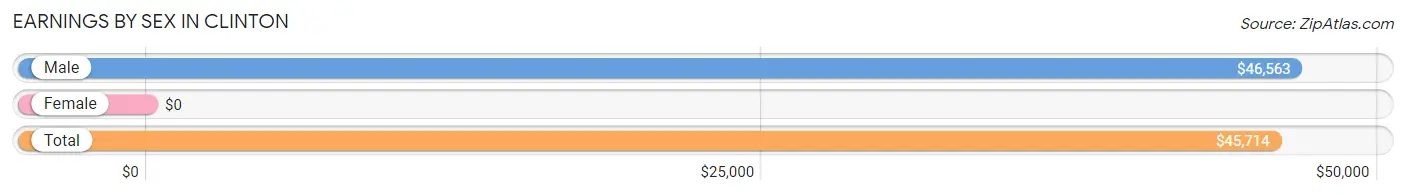
Earnings by Sex in Clinton
| Sex | Number | Average Earnings |
| Male | 17 (50.0%) | $46,563 |
| Female | 17 (50.0%) | $0 |
| Total | 34 (100.0%) | $45,714 |
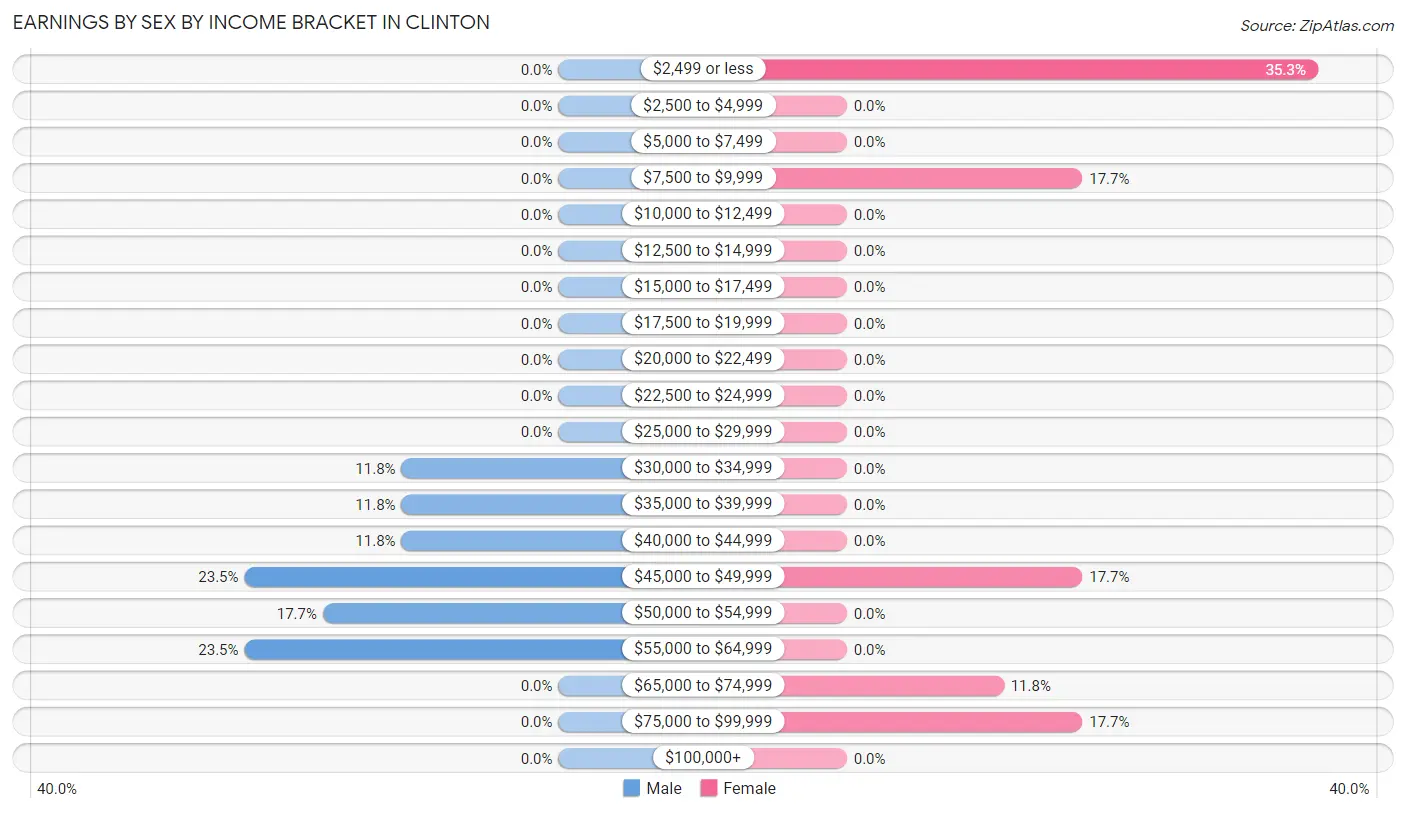
Earnings by Sex by Income Bracket in Clinton
The most common earnings brackets in Clinton are $45,000 to $49,999 for men (4 | 23.5%) and $2,499 or less for women (6 | 35.3%).
| Income | Male | Female |
| $2,499 or less | 0 (0.0%) | 6 (35.3%) |
| $2,500 to $4,999 | 0 (0.0%) | 0 (0.0%) |
| $5,000 to $7,499 | 0 (0.0%) | 0 (0.0%) |
| $7,500 to $9,999 | 0 (0.0%) | 3 (17.6%) |
| $10,000 to $12,499 | 0 (0.0%) | 0 (0.0%) |
| $12,500 to $14,999 | 0 (0.0%) | 0 (0.0%) |
| $15,000 to $17,499 | 0 (0.0%) | 0 (0.0%) |
| $17,500 to $19,999 | 0 (0.0%) | 0 (0.0%) |
| $20,000 to $22,499 | 0 (0.0%) | 0 (0.0%) |
| $22,500 to $24,999 | 0 (0.0%) | 0 (0.0%) |
| $25,000 to $29,999 | 0 (0.0%) | 0 (0.0%) |
| $30,000 to $34,999 | 2 (11.8%) | 0 (0.0%) |
| $35,000 to $39,999 | 2 (11.8%) | 0 (0.0%) |
| $40,000 to $44,999 | 2 (11.8%) | 0 (0.0%) |
| $45,000 to $49,999 | 4 (23.5%) | 3 (17.6%) |
| $50,000 to $54,999 | 3 (17.6%) | 0 (0.0%) |
| $55,000 to $64,999 | 4 (23.5%) | 0 (0.0%) |
| $65,000 to $74,999 | 0 (0.0%) | 2 (11.8%) |
| $75,000 to $99,999 | 0 (0.0%) | 3 (17.6%) |
| $100,000+ | 0 (0.0%) | 0 (0.0%) |
| Total | 17 (100.0%) | 17 (100.0%) |
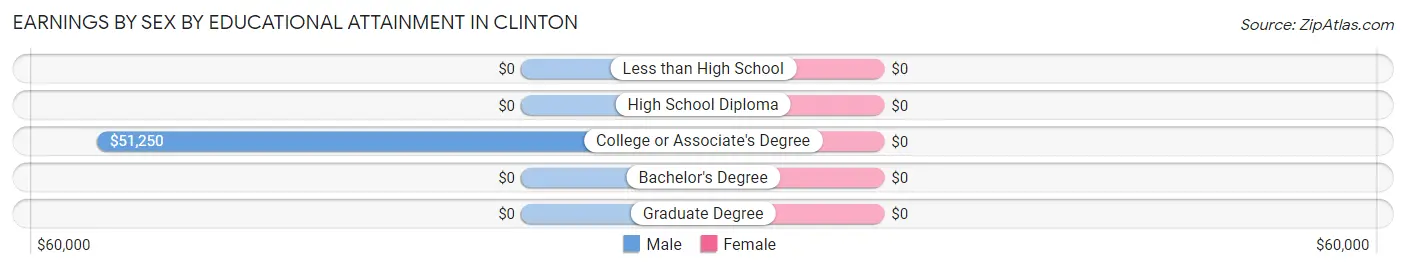
Earnings by Sex by Educational Attainment in Clinton
| Educational Attainment | Male Income | Female Income |
| Less than High School | - | - |
| High School Diploma | - | - |
| College or Associate's Degree | $51,250 | $0 |
| Bachelor's Degree | - | - |
| Graduate Degree | - | - |
| Total | $46,563 | $0 |
Family Income in Clinton
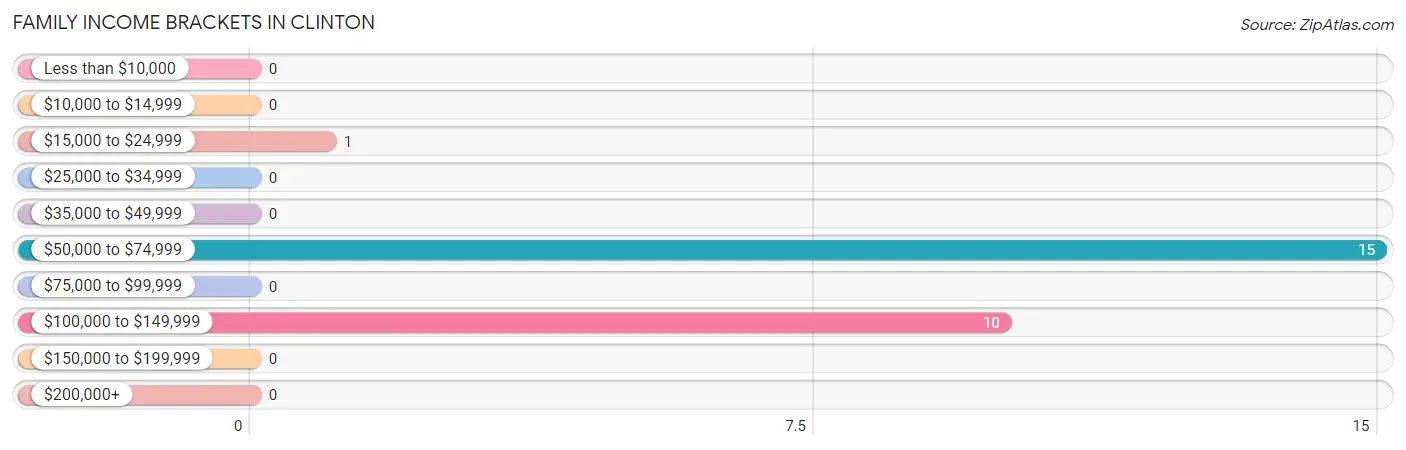
Family Income Brackets in Clinton
According to the Clinton family income data, there are 15 families falling into the $50,000 to $74,999 income range, which is the most common income bracket and makes up 57.7% of all families.
| Income Bracket | # Families | % Families |
| Less than $10,000 | 0 | 0.0% |
| $10,000 to $14,999 | 0 | 0.0% |
| $15,000 to $24,999 | 1 | 3.8% |
| $25,000 to $34,999 | 0 | 0.0% |
| $35,000 to $49,999 | 0 | 0.0% |
| $50,000 to $74,999 | 15 | 57.7% |
| $75,000 to $99,999 | 0 | 0.0% |
| $100,000 to $149,999 | 10 | 38.5% |
| $150,000 to $199,999 | 0 | 0.0% |
| $200,000+ | 0 | 0.0% |
Family Income by Famaliy Size in Clinton
| Income Bracket | # Families | Median Income |
| 2-Person Families | 24 (92.3%) | $0 |
| 3-Person Families | 2 (7.7%) | $0 |
| 4-Person Families | 0 (0.0%) | $0 |
| 5-Person Families | 0 (0.0%) | $0 |
| 6-Person Families | 0 (0.0%) | $0 |
| 7+ Person Families | 0 (0.0%) | $0 |
| Total | 26 (100.0%) | $0 |
Family Income by Number of Earners in Clinton
| Number of Earners | # Families | Median Income |
| No Earners | 12 (46.2%) | $0 |
| 1 Earner | 4 (15.4%) | $0 |
| 2 Earners | 8 (30.8%) | $0 |
| 3+ Earners | 2 (7.7%) | $0 |
| Total | 26 (100.0%) | $0 |
Household Income in Clinton
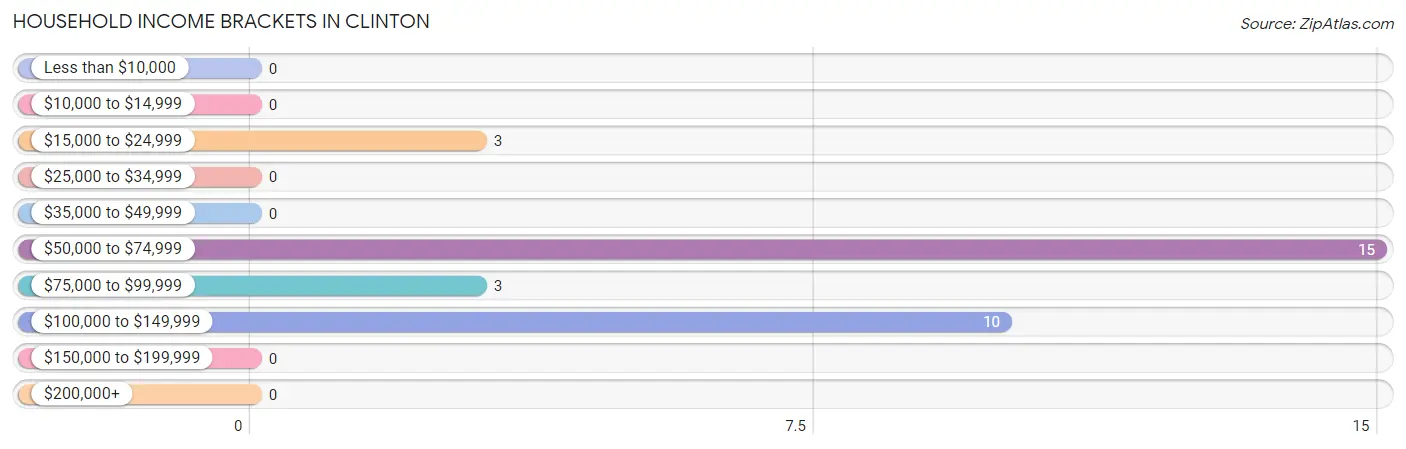
Household Income Brackets in Clinton
With 15 households falling in the category, the $50,000 to $74,999 income range is the most frequent in Clinton, accounting for 48.4% of all households.
| Income Bracket | # Households | % Households |
| Less than $10,000 | 0 | 0.0% |
| $10,000 to $14,999 | 0 | 0.0% |
| $15,000 to $24,999 | 3 | 9.7% |
| $25,000 to $34,999 | 0 | 0.0% |
| $35,000 to $49,999 | 0 | 0.0% |
| $50,000 to $74,999 | 15 | 48.4% |
| $75,000 to $99,999 | 3 | 9.7% |
| $100,000 to $149,999 | 10 | 32.3% |
| $150,000 to $199,999 | 0 | 0.0% |
| $200,000+ | 0 | 0.0% |
Household Income by Householder Age in Clinton
The median household income in Clinton is $0, with the highest median household income of $130,000 found in the 45 to 64 years age bracket for the primary householder. A total of 12 households (38.7%) fall into this category.
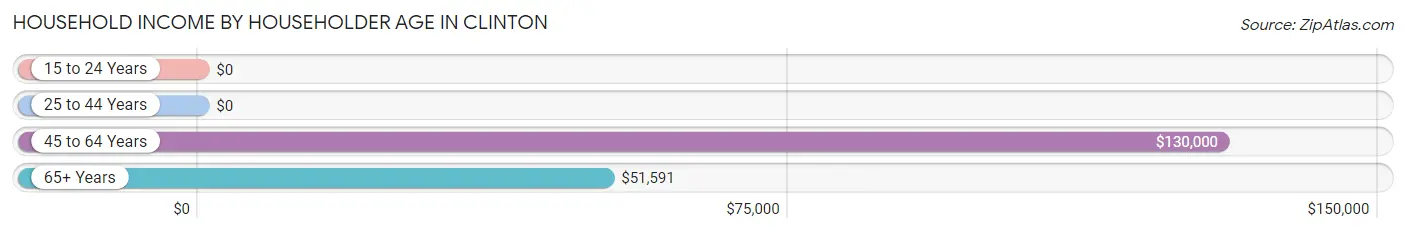
| Income Bracket | # Households | Median Income |
| 15 to 24 Years | 0 (0.0%) | $0 |
| 25 to 44 Years | 3 (9.7%) | $0 |
| 45 to 64 Years | 12 (38.7%) | $130,000 |
| 65+ Years | 16 (51.6%) | $51,591 |
| Total | 31 (100.0%) | $0 |
Poverty in Clinton
Income Below Poverty by Sex and Age in Clinton
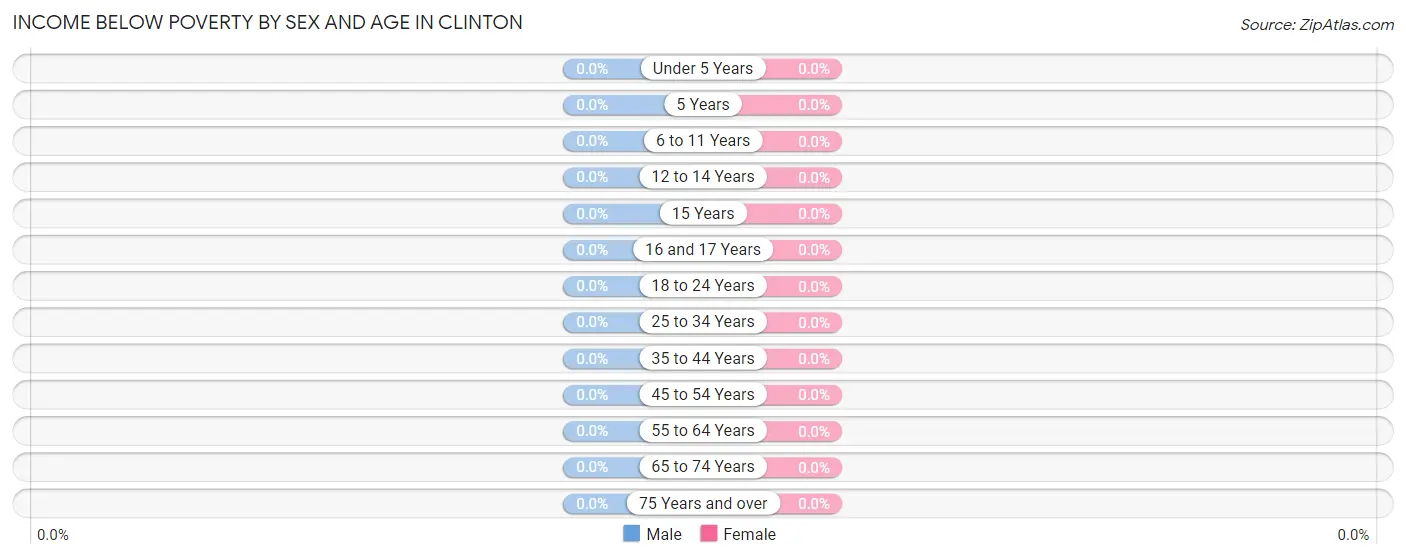
| Age Bracket | Male | Female |
| Under 5 Years | 0 (0.0%) | 0 (0.0%) |
| 5 Years | 0 (0.0%) | 0 (0.0%) |
| 6 to 11 Years | 0 (0.0%) | 0 (0.0%) |
| 12 to 14 Years | 0 (0.0%) | 0 (0.0%) |
| 15 Years | 0 (0.0%) | 0 (0.0%) |
| 16 and 17 Years | 0 (0.0%) | 0 (0.0%) |
| 18 to 24 Years | 0 (0.0%) | 0 (0.0%) |
| 25 to 34 Years | 0 (0.0%) | 0 (0.0%) |
| 35 to 44 Years | 0 (0.0%) | 0 (0.0%) |
| 45 to 54 Years | 0 (0.0%) | 0 (0.0%) |
| 55 to 64 Years | 0 (0.0%) | 0 (0.0%) |
| 65 to 74 Years | 0 (0.0%) | 0 (0.0%) |
| 75 Years and over | 0 (0.0%) | 0 (0.0%) |
| Total | 0 (0.0%) | 0 (0.0%) |
Income Above Poverty by Sex and Age in Clinton
According to the poverty statistics in Clinton, males aged 35 to 44 years and females aged 18 to 24 years are the age groups that are most secure financially, with 100.0% of males and 100.0% of females in these age groups living above the poverty line.
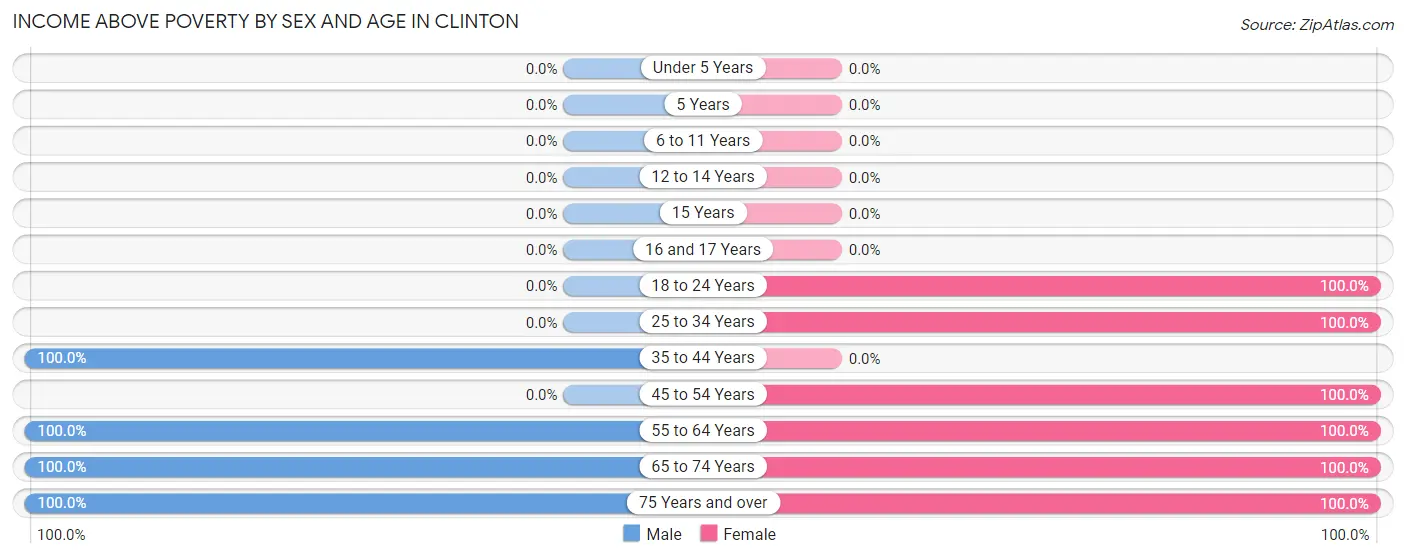
| Age Bracket | Male | Female |
| Under 5 Years | 0 (0.0%) | 0 (0.0%) |
| 5 Years | 0 (0.0%) | 0 (0.0%) |
| 6 to 11 Years | 0 (0.0%) | 0 (0.0%) |
| 12 to 14 Years | 0 (0.0%) | 0 (0.0%) |
| 15 Years | 0 (0.0%) | 0 (0.0%) |
| 16 and 17 Years | 0 (0.0%) | 0 (0.0%) |
| 18 to 24 Years | 0 (0.0%) | 3 (100.0%) |
| 25 to 34 Years | 0 (0.0%) | 3 (100.0%) |
| 35 to 44 Years | 4 (100.0%) | 0 (0.0%) |
| 45 to 54 Years | 0 (0.0%) | 3 (100.0%) |
| 55 to 64 Years | 11 (100.0%) | 13 (100.0%) |
| 65 to 74 Years | 14 (100.0%) | 2 (100.0%) |
| 75 Years and over | 2 (100.0%) | 2 (100.0%) |
| Total | 31 (100.0%) | 26 (100.0%) |
Income Below Poverty Among Married-Couple Families in Clinton
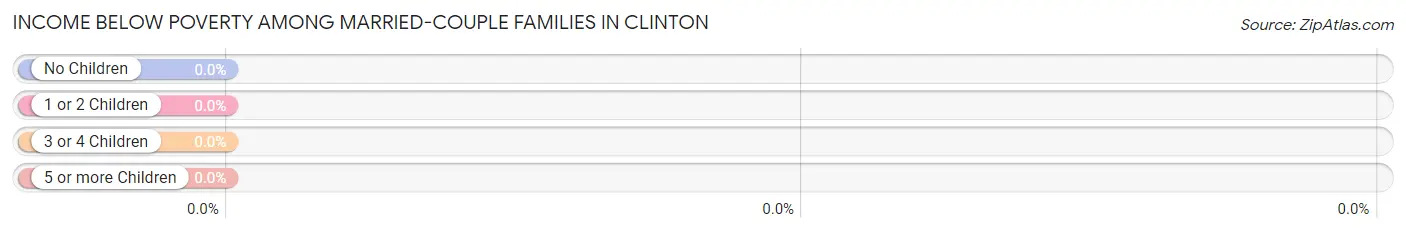
| Children | Above Poverty | Below Poverty |
| No Children | 26 (100.0%) | 0 (0.0%) |
| 1 or 2 Children | 0 (0.0%) | 0 (0.0%) |
| 3 or 4 Children | 0 (0.0%) | 0 (0.0%) |
| 5 or more Children | 0 (0.0%) | 0 (0.0%) |
| Total | 26 (100.0%) | 0 (0.0%) |
Income Below Poverty Among Single-Parent Households in Clinton
| Children | Single Father | Single Mother |
| No Children | 0 (0.0%) | 0 (0.0%) |
| 1 or 2 Children | 0 (0.0%) | 0 (0.0%) |
| 3 or 4 Children | 0 (0.0%) | 0 (0.0%) |
| 5 or more Children | 0 (0.0%) | 0 (0.0%) |
| Total | 0 (0.0%) | 0 (0.0%) |
Income Below Poverty Among Married-Couple vs Single-Parent Households in Clinton
| Children | Married-Couple Families | Single-Parent Households |
| No Children | 0 (0.0%) | 0 (0.0%) |
| 1 or 2 Children | 0 (0.0%) | 0 (0.0%) |
| 3 or 4 Children | 0 (0.0%) | 0 (0.0%) |
| 5 or more Children | 0 (0.0%) | 0 (0.0%) |
| Total | 0 (0.0%) | 0 (0.0%) |
Race in Clinton
The most populous races in Clinton are White / Caucasian (43 | 75.4%), Two or more Races (8 | 14.0%), and Native / Alaskan (6 | 10.5%).
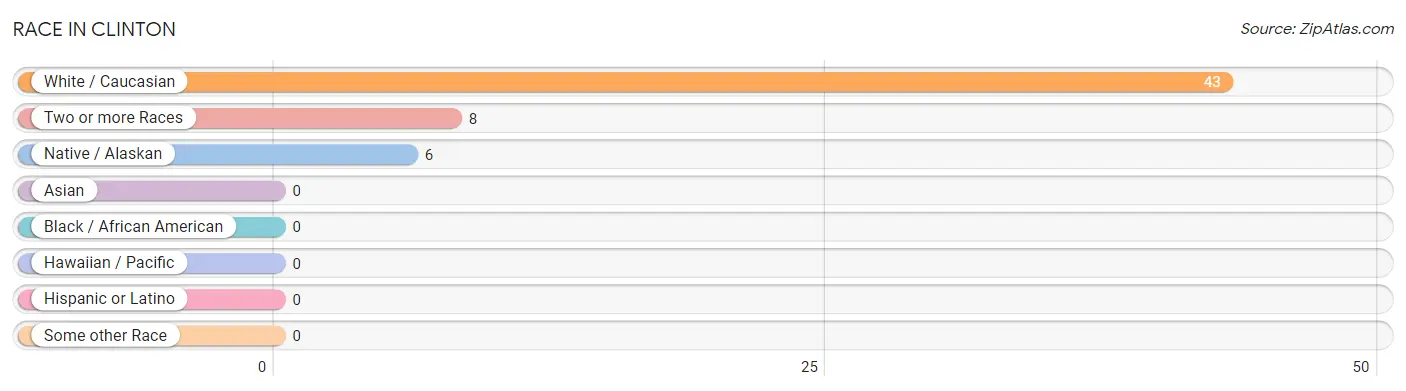
| Race | # Population | % Population |
| Asian | 0 | 0.0% |
| Black / African American | 0 | 0.0% |
| Hawaiian / Pacific | 0 | 0.0% |
| Hispanic or Latino | 0 | 0.0% |
| Native / Alaskan | 6 | 10.5% |
| White / Caucasian | 43 | 75.4% |
| Two or more Races | 8 | 14.0% |
| Some other Race | 0 | 0.0% |
| Total | 57 | 100.0% |
Ancestry in Clinton
The most populous ancestries reported in Clinton are German (26 | 45.6%), English (20 | 35.1%), Sioux (11 | 19.3%), Czech (6 | 10.5%), and Czechoslovakian (3 | 5.3%), together accounting for 115.8% of all Clinton residents.
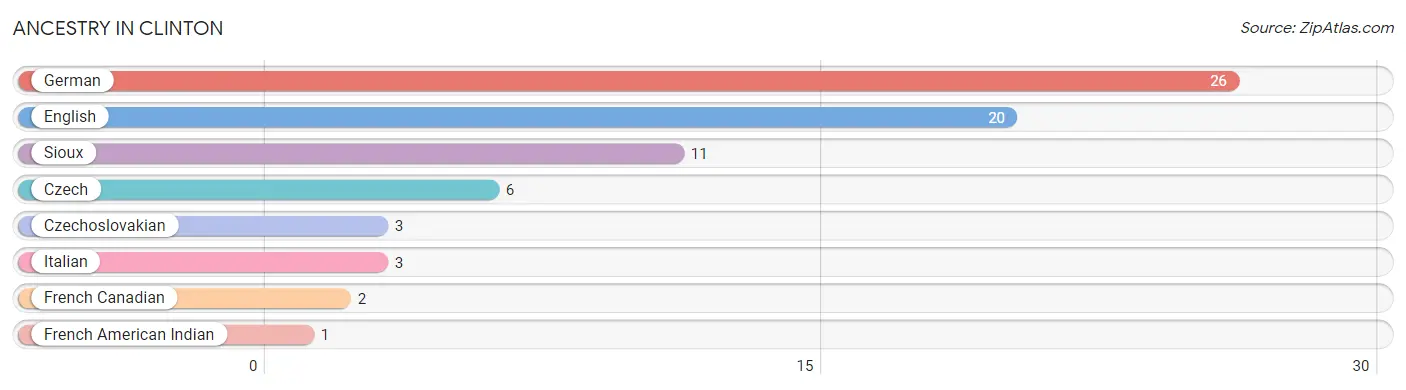
| Ancestry | # Population | % Population |
| Czech | 6 | 10.5% |
| Czechoslovakian | 3 | 5.3% |
| English | 20 | 35.1% |
| French American Indian | 1 | 1.8% |
| French Canadian | 2 | 3.5% |
| German | 26 | 45.6% |
| Italian | 3 | 5.3% |
| Sioux | 11 | 19.3% | View All 8 Rows |
Immigrants in Clinton

| Immigration Origin | # Population | % Population | View All 0 Rows |
Sex and Age in Clinton
Sex and Age in Clinton
The most populous age groups in Clinton are 65 to 69 Years (12 | 38.7%) for men and 55 to 59 Years (7 | 26.9%) for women.
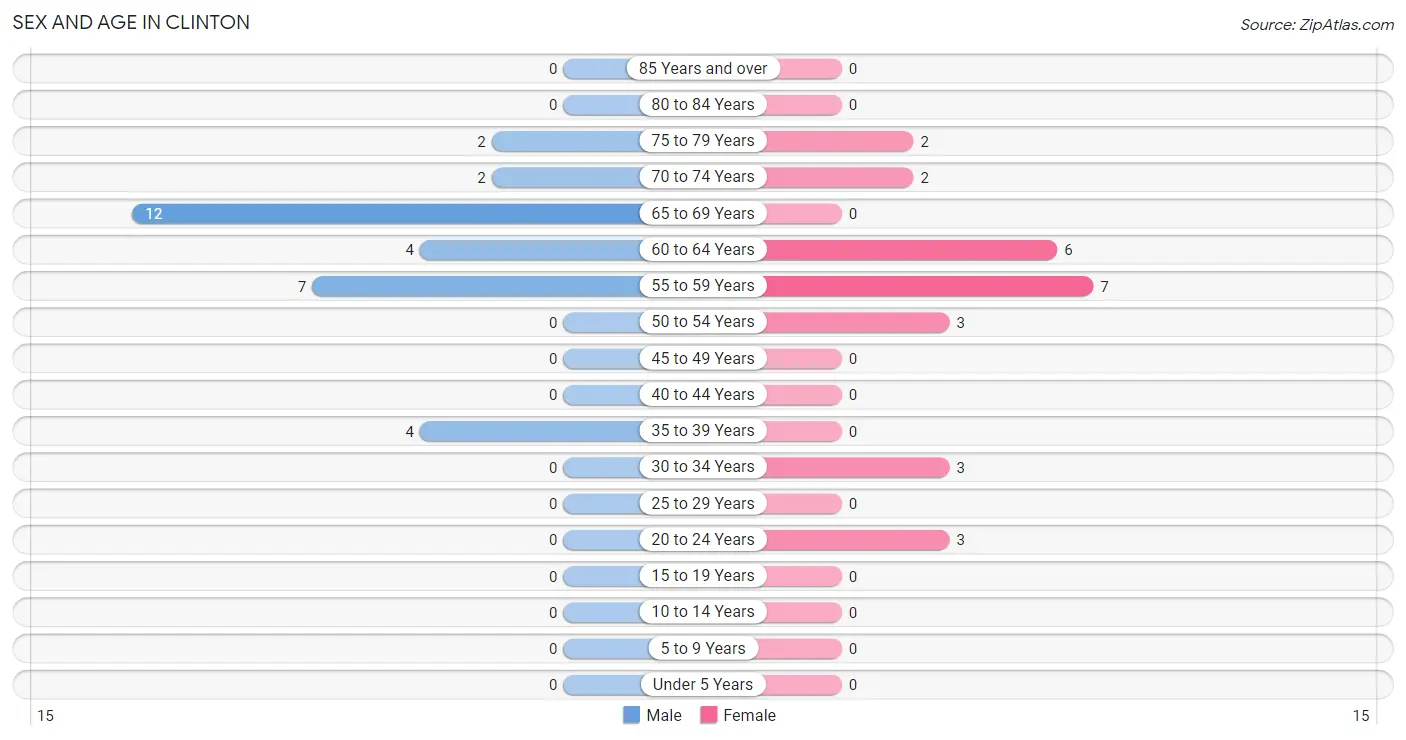
| Age Bracket | Male | Female |
| Under 5 Years | 0 (0.0%) | 0 (0.0%) |
| 5 to 9 Years | 0 (0.0%) | 0 (0.0%) |
| 10 to 14 Years | 0 (0.0%) | 0 (0.0%) |
| 15 to 19 Years | 0 (0.0%) | 0 (0.0%) |
| 20 to 24 Years | 0 (0.0%) | 3 (11.5%) |
| 25 to 29 Years | 0 (0.0%) | 0 (0.0%) |
| 30 to 34 Years | 0 (0.0%) | 3 (11.5%) |
| 35 to 39 Years | 4 (12.9%) | 0 (0.0%) |
| 40 to 44 Years | 0 (0.0%) | 0 (0.0%) |
| 45 to 49 Years | 0 (0.0%) | 0 (0.0%) |
| 50 to 54 Years | 0 (0.0%) | 3 (11.5%) |
| 55 to 59 Years | 7 (22.6%) | 7 (26.9%) |
| 60 to 64 Years | 4 (12.9%) | 6 (23.1%) |
| 65 to 69 Years | 12 (38.7%) | 0 (0.0%) |
| 70 to 74 Years | 2 (6.5%) | 2 (7.7%) |
| 75 to 79 Years | 2 (6.5%) | 2 (7.7%) |
| 80 to 84 Years | 0 (0.0%) | 0 (0.0%) |
| 85 Years and over | 0 (0.0%) | 0 (0.0%) |
| Total | 31 (100.0%) | 26 (100.0%) |
Families and Households in Clinton
Median Family Size in Clinton
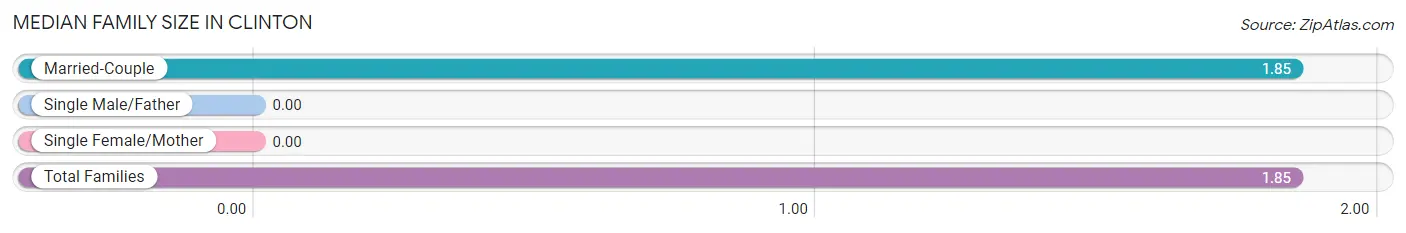
| Family Type | # Families | Family Size |
| Married-Couple | 26 (100.0%) | 1.85 |
| Single Male/Father | 0 (0.0%) | - |
| Single Female/Mother | 0 (0.0%) | - |
| Total Families | 26 (100.0%) | 1.85 |
Median Household Size in Clinton
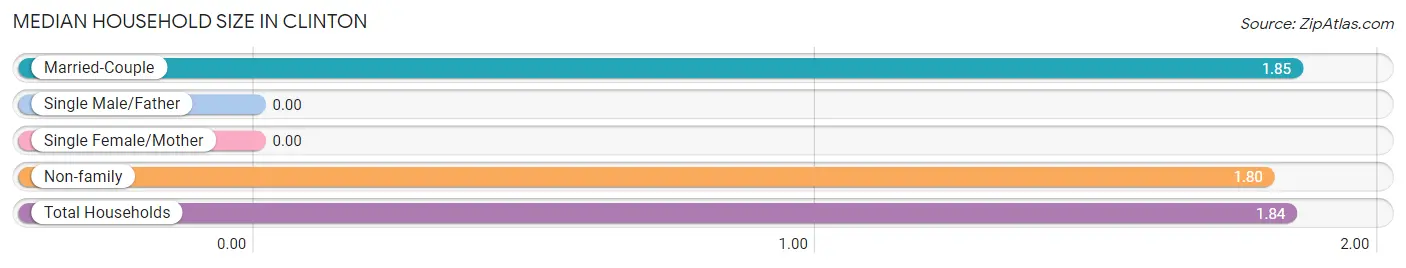
| Household Type | # Households | Household Size |
| Married-Couple | 26 (83.9%) | 1.85 |
| Single Male/Father | 0 (0.0%) | - |
| Single Female/Mother | 0 (0.0%) | - |
| Non-family | 5 (16.1%) | 1.80 |
| Total Households | 31 (100.0%) | 1.84 |
Household Size by Marriage Status in Clinton
Out of a total of 31 households in Clinton, 26 (83.9%) are family households, while 5 (16.1%) are nonfamily households. The most numerous type of family households are 2-person households, comprising 24, and the most common type of nonfamily households are 2-person households, comprising 3.
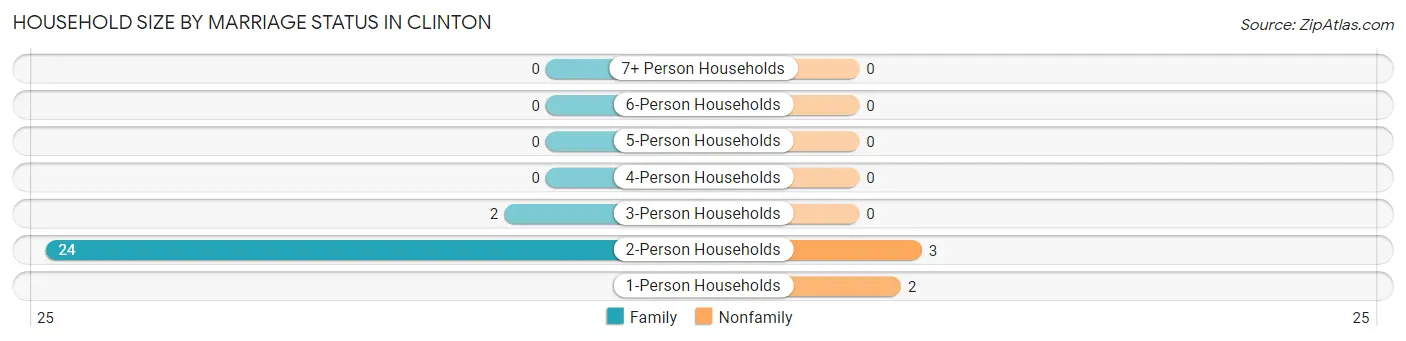
| Household Size | Family Households | Nonfamily Households |
| 1-Person Households | - | 2 (6.5%) |
| 2-Person Households | 24 (77.4%) | 3 (9.7%) |
| 3-Person Households | 2 (6.5%) | 0 (0.0%) |
| 4-Person Households | 0 (0.0%) | 0 (0.0%) |
| 5-Person Households | 0 (0.0%) | 0 (0.0%) |
| 6-Person Households | 0 (0.0%) | 0 (0.0%) |
| 7+ Person Households | 0 (0.0%) | 0 (0.0%) |
| Total | 26 (83.9%) | 5 (16.1%) |
Female Fertility in Clinton
Fertility by Age in Clinton
| Age Bracket | Women with Births | Births / 1,000 Women |
| 15 to 19 years | 0 (0.0%) | 0.0 |
| 20 to 34 years | 0 (0.0%) | 0.0 |
| 35 to 50 years | 0 (0.0%) | 0.0 |
| Total | 0 (0.0%) | 0.0 |
Fertility by Age by Marriage Status in Clinton
| Age Bracket | Married | Unmarried |
| 15 to 19 years | 0 (0.0%) | 0 (0.0%) |
| 20 to 34 years | 0 (0.0%) | 0 (0.0%) |
| 35 to 50 years | 0 (0.0%) | 0 (0.0%) |
| Total | 0 (0.0%) | 0 (0.0%) |
Fertility by Education in Clinton
| Educational Attainment | Women with Births | Births / 1,000 Women |
| Less than High School | 0 (0.0%) | 0.0 |
| High School Diploma | 0 (0.0%) | 0.0 |
| College or Associate's Degree | 0 (0.0%) | 0.0 |
| Bachelor's Degree | 0 (0.0%) | 0.0 |
| Graduate Degree | 0 (0.0%) | 0.0 |
| Total | 0 (0.0%) | 0.0 |
Fertility by Education by Marriage Status in Clinton
| Educational Attainment | Married | Unmarried |
| Less than High School | 0 (0.0%) | 0 (0.0%) |
| High School Diploma | 0 (0.0%) | 0 (0.0%) |
| College or Associate's Degree | 0 (0.0%) | 0 (0.0%) |
| Bachelor's Degree | 0 (0.0%) | 0 (0.0%) |
| Graduate Degree | 0 (0.0%) | 0 (0.0%) |
| Total | 0 (0.0%) | 0 (0.0%) |
Employment Characteristics in Clinton
Employment by Class of Employer in Clinton
Among the 32 employed individuals in Clinton, private company employees (18 | 56.2%), not-for-profit organizations (6 | 18.8%), and self-employed (not incorporated) (3 | 9.4%) make up the most common classes of employment.
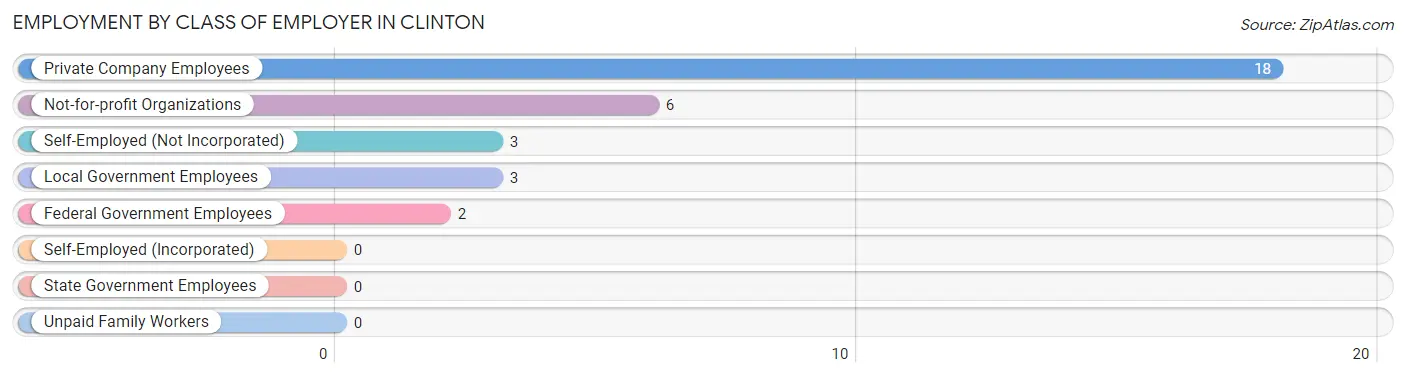
| Employer Class | # Employees | % Employees |
| Private Company Employees | 18 | 56.2% |
| Self-Employed (Incorporated) | 0 | 0.0% |
| Self-Employed (Not Incorporated) | 3 | 9.4% |
| Not-for-profit Organizations | 6 | 18.8% |
| Local Government Employees | 3 | 9.4% |
| State Government Employees | 0 | 0.0% |
| Federal Government Employees | 2 | 6.2% |
| Unpaid Family Workers | 0 | 0.0% |
| Total | 32 | 100.0% |
Employment Status by Age in Clinton
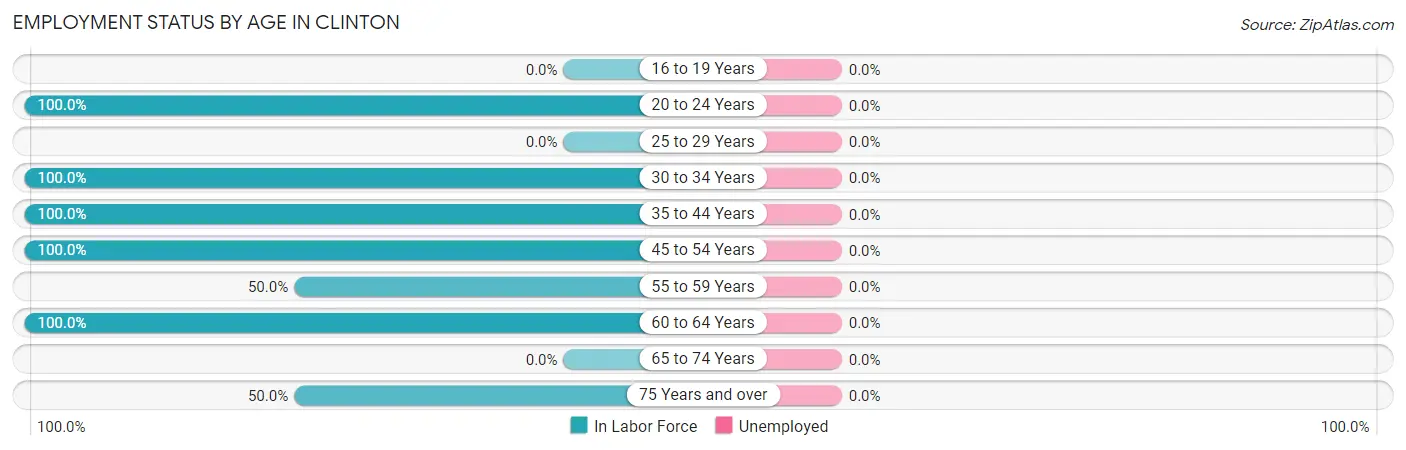
| Age Bracket | In Labor Force | Unemployed |
| 16 to 19 Years | 0 (0.0%) | 0 (0.0%) |
| 20 to 24 Years | 3 (100.0%) | 0 (0.0%) |
| 25 to 29 Years | 0 (0.0%) | 0 (0.0%) |
| 30 to 34 Years | 3 (100.0%) | 0 (0.0%) |
| 35 to 44 Years | 4 (100.0%) | 0 (0.0%) |
| 45 to 54 Years | 3 (100.0%) | 0 (0.0%) |
| 55 to 59 Years | 7 (50.0%) | 0 (0.0%) |
| 60 to 64 Years | 10 (100.0%) | 0 (0.0%) |
| 65 to 74 Years | 0 (0.0%) | 0 (0.0%) |
| 75 Years and over | 2 (50.0%) | 0 (0.0%) |
| Total | 32 (56.1%) | 0 (0.0%) |
Employment Status by Educational Attainment in Clinton
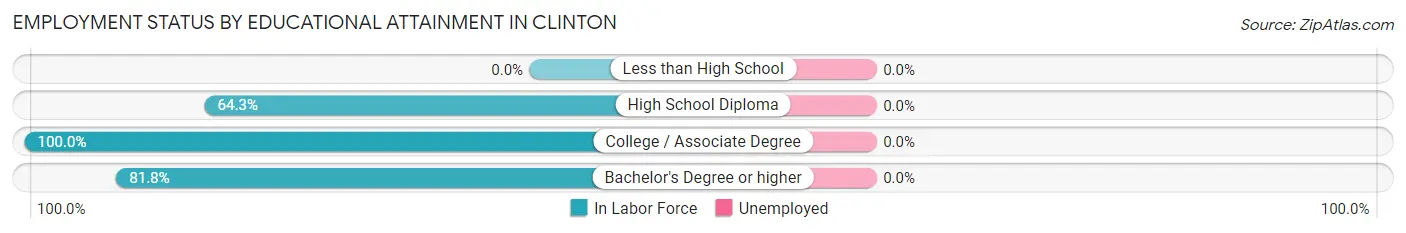
| Educational Attainment | In Labor Force | Unemployed |
| Less than High School | 0 (0.0%) | 0 (0.0%) |
| High School Diploma | 9 (64.3%) | 0 (0.0%) |
| College / Associate Degree | 9 (100.0%) | 0 (0.0%) |
| Bachelor's Degree or higher | 9 (81.8%) | 0 (0.0%) |
| Total | 27 (79.4%) | 0 (0.0%) |
Employment Occupations by Sex in Clinton
Management, Business, Science and Arts Occupations
The most common Management, Business, Science and Arts occupations in Clinton are Management (5 | 15.6%), Community & Social Service (3 | 9.4%), Education Instruction & Library (3 | 9.4%), Health Diagnosing & Treating (3 | 9.4%), and Health Technologists (3 | 9.4%).
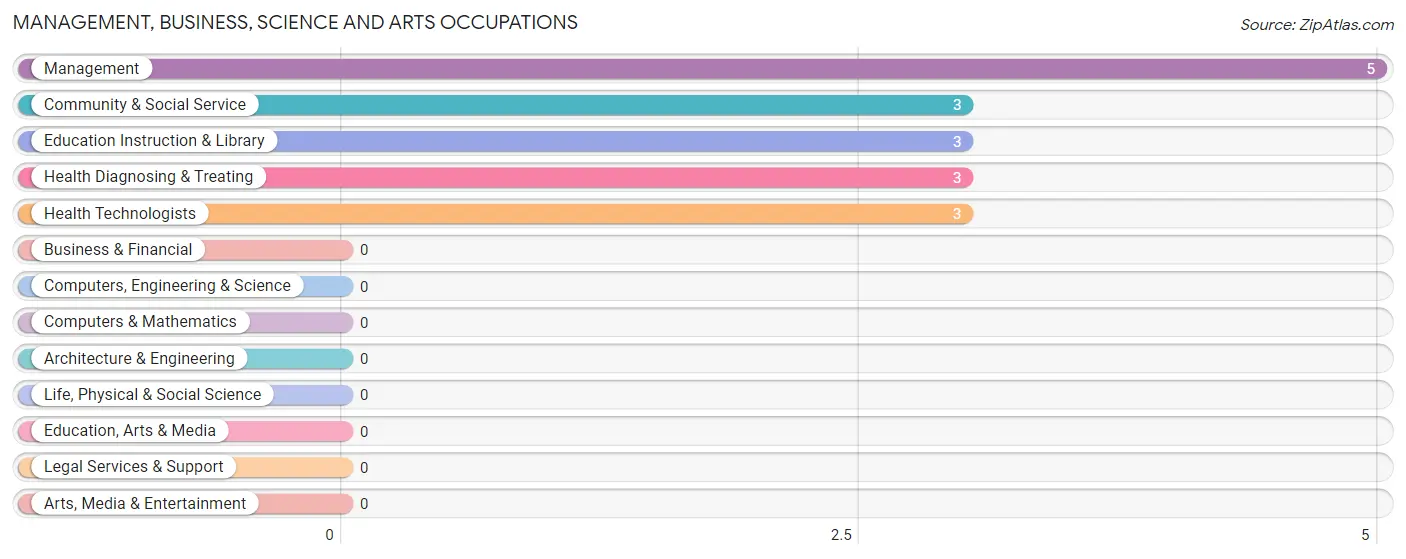
Management, Business, Science and Arts Occupations by Sex
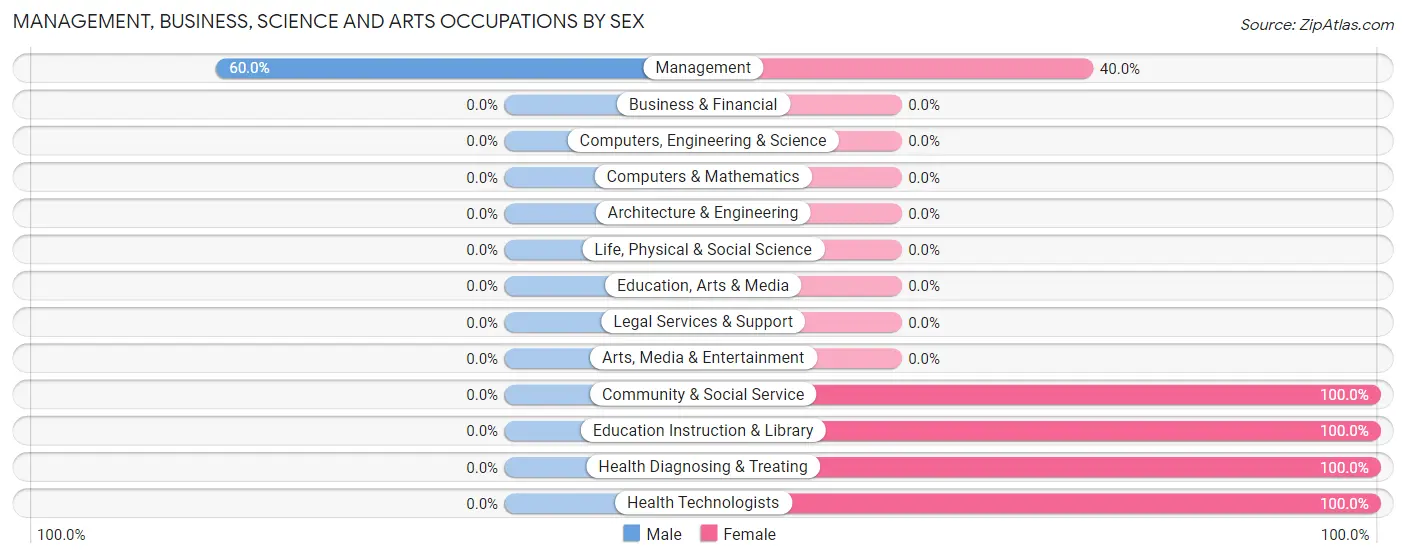
| Occupation | Male | Female |
| Management | 3 (60.0%) | 2 (40.0%) |
| Business & Financial | 0 (0.0%) | 0 (0.0%) |
| Computers, Engineering & Science | 0 (0.0%) | 0 (0.0%) |
| Computers & Mathematics | 0 (0.0%) | 0 (0.0%) |
| Architecture & Engineering | 0 (0.0%) | 0 (0.0%) |
| Life, Physical & Social Science | 0 (0.0%) | 0 (0.0%) |
| Community & Social Service | 0 (0.0%) | 3 (100.0%) |
| Education, Arts & Media | 0 (0.0%) | 0 (0.0%) |
| Legal Services & Support | 0 (0.0%) | 0 (0.0%) |
| Education Instruction & Library | 0 (0.0%) | 3 (100.0%) |
| Arts, Media & Entertainment | 0 (0.0%) | 0 (0.0%) |
| Health Diagnosing & Treating | 0 (0.0%) | 3 (100.0%) |
| Health Technologists | 0 (0.0%) | 3 (100.0%) |
| Total (Category) | 3 (27.3%) | 8 (72.7%) |
| Total (Overall) | 15 (46.9%) | 17 (53.1%) |
Services Occupations
The most common Services occupations in Clinton are , and Cleaning & Maintenance (6 | 18.8%).
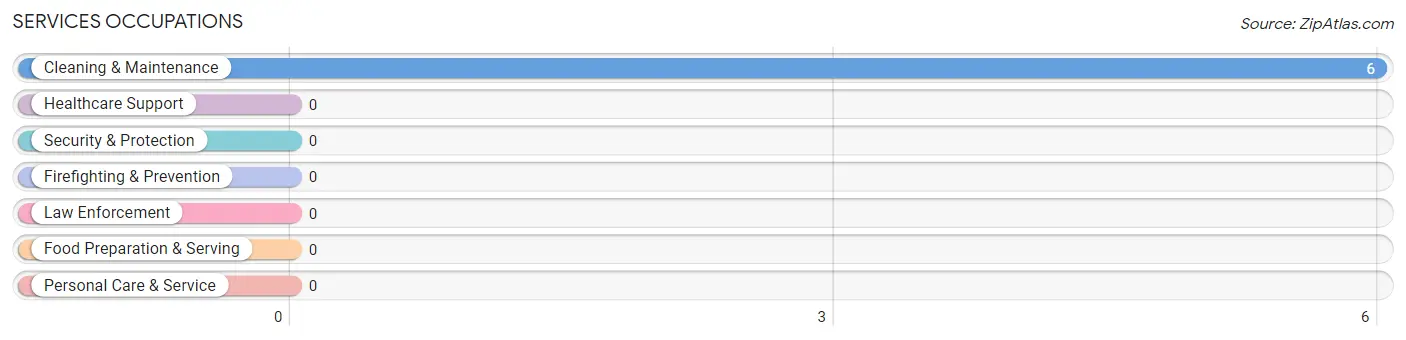
Services Occupations by Sex
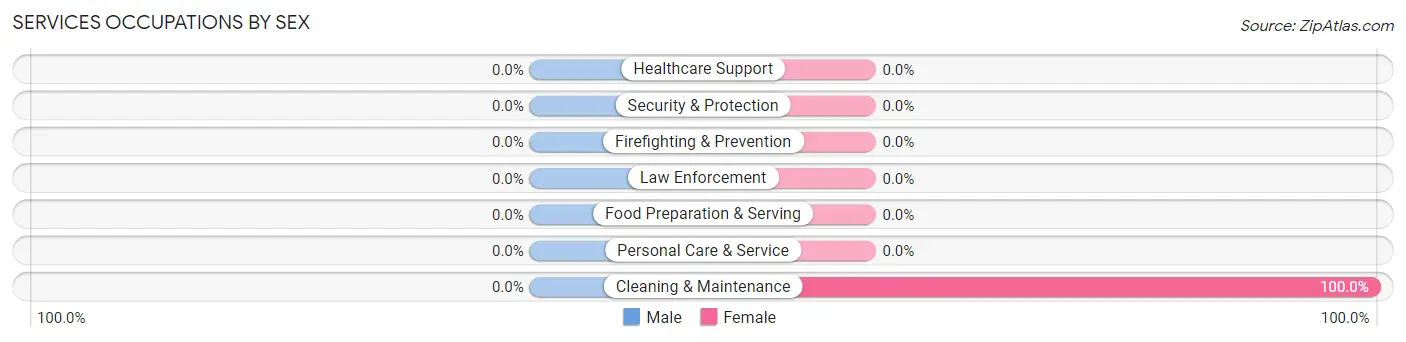
| Occupation | Male | Female |
| Healthcare Support | 0 (0.0%) | 0 (0.0%) |
| Security & Protection | 0 (0.0%) | 0 (0.0%) |
| Firefighting & Prevention | 0 (0.0%) | 0 (0.0%) |
| Law Enforcement | 0 (0.0%) | 0 (0.0%) |
| Food Preparation & Serving | 0 (0.0%) | 0 (0.0%) |
| Cleaning & Maintenance | 0 (0.0%) | 6 (100.0%) |
| Personal Care & Service | 0 (0.0%) | 0 (0.0%) |
| Total (Category) | 0 (0.0%) | 6 (100.0%) |
| Total (Overall) | 15 (46.9%) | 17 (53.1%) |
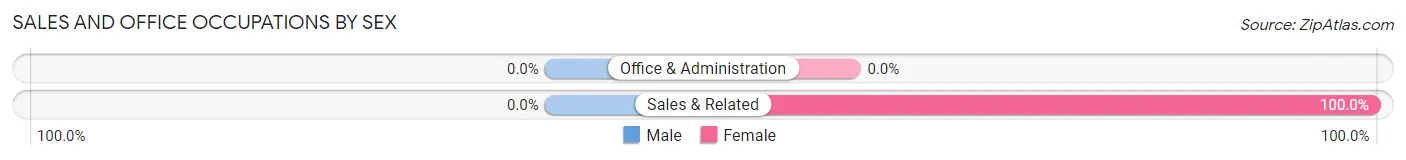
Sales and Office Occupations
The most common Sales and Office occupations in Clinton are , and Sales & Related (3 | 9.4%).
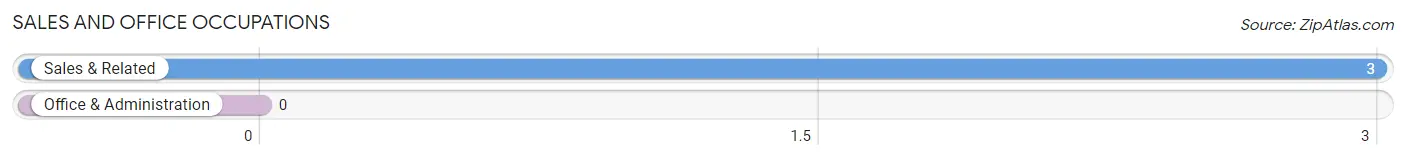
Sales and Office Occupations by Sex
| Occupation | Male | Female |
| Sales & Related | 0 (0.0%) | 3 (100.0%) |
| Office & Administration | 0 (0.0%) | 0 (0.0%) |
| Total (Category) | 0 (0.0%) | 3 (100.0%) |
| Total (Overall) | 15 (46.9%) | 17 (53.1%) |
Natural Resources, Construction and Maintenance Occupations
The most common Natural Resources, Construction and Maintenance occupations in Clinton are Farming, Fishing & Forestry (8 | 25.0%), and Installation, Maintenance & Repair (4 | 12.5%).
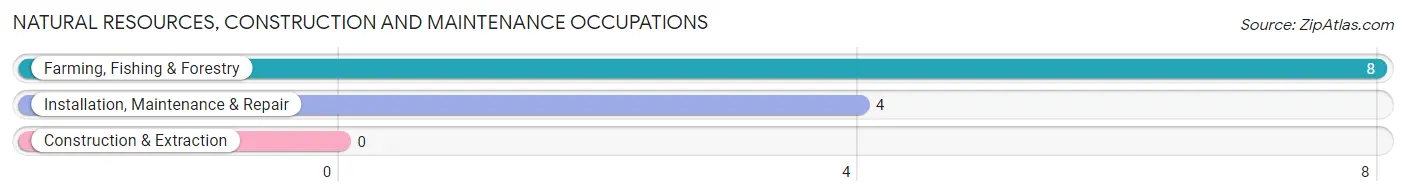
Natural Resources, Construction and Maintenance Occupations by Sex
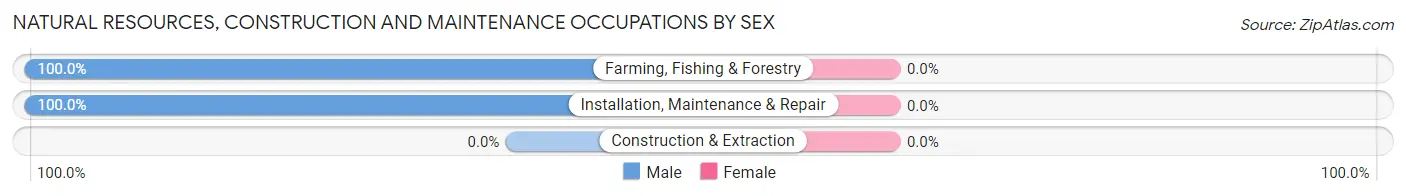
| Occupation | Male | Female |
| Farming, Fishing & Forestry | 8 (100.0%) | 0 (0.0%) |
| Construction & Extraction | 0 (0.0%) | 0 (0.0%) |
| Installation, Maintenance & Repair | 4 (100.0%) | 0 (0.0%) |
| Total (Category) | 12 (100.0%) | 0 (0.0%) |
| Total (Overall) | 15 (46.9%) | 17 (53.1%) |
Production, Transportation and Moving Occupations
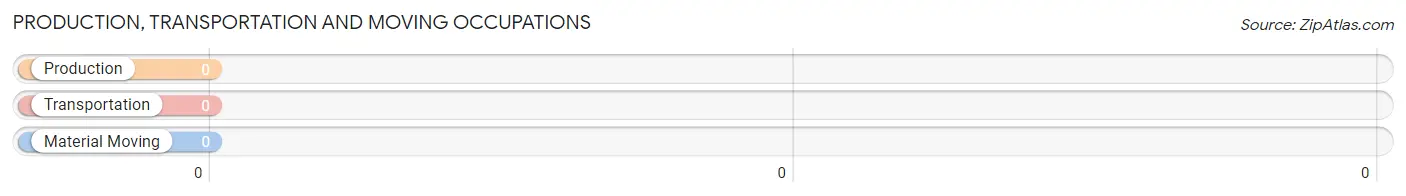
Production, Transportation and Moving Occupations by Sex
| Occupation | Male | Female |
| Production | 0 (0.0%) | 0 (0.0%) |
| Transportation | 0 (0.0%) | 0 (0.0%) |
| Material Moving | 0 (0.0%) | 0 (0.0%) |
| Total (Category) | 0 (0.0%) | 0 (0.0%) |
| Total (Overall) | 15 (46.9%) | 17 (53.1%) |
Employment Industries by Sex in Clinton
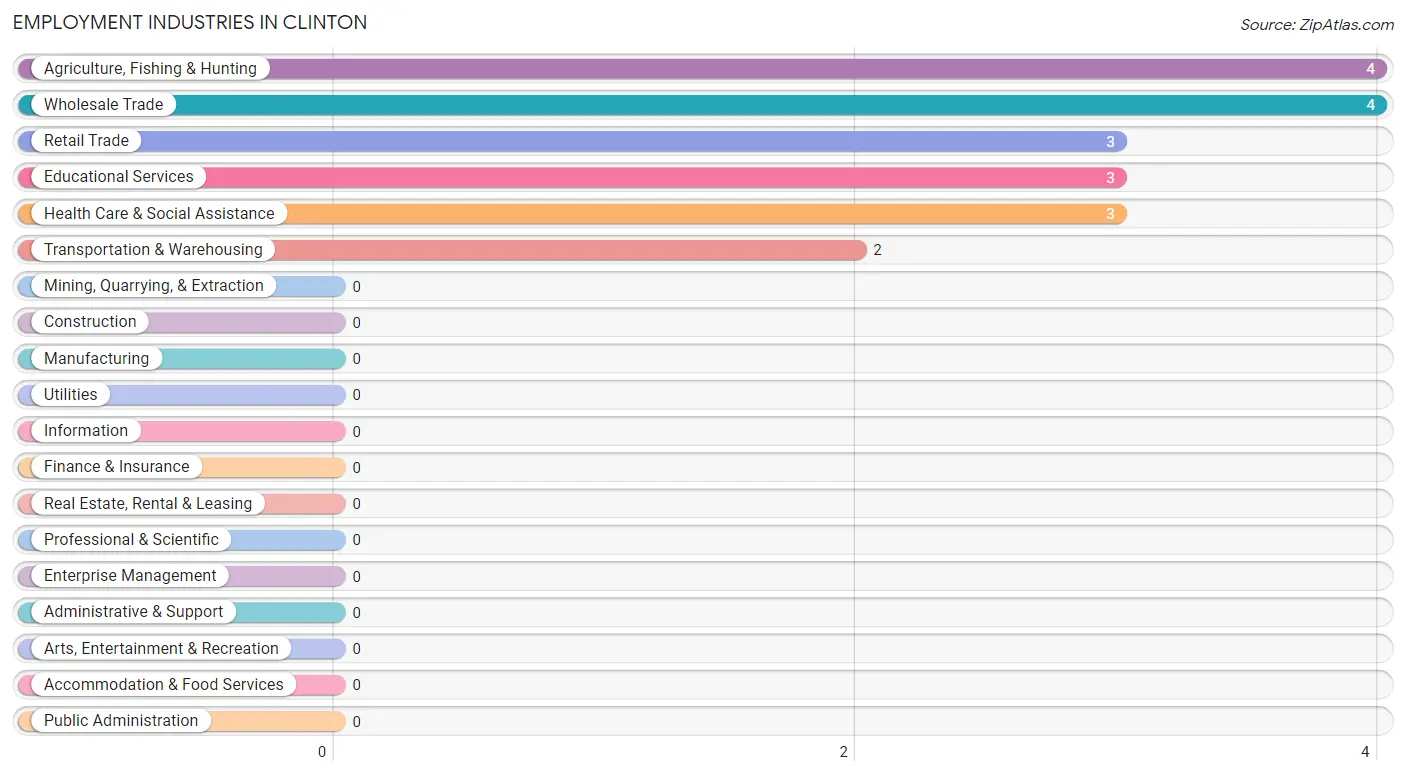
Employment Industries in Clinton
The major employment industries in Clinton include Agriculture, Fishing & Hunting (4 | 12.5%), Wholesale Trade (4 | 12.5%), Retail Trade (3 | 9.4%), Educational Services (3 | 9.4%), and Health Care & Social Assistance (3 | 9.4%).
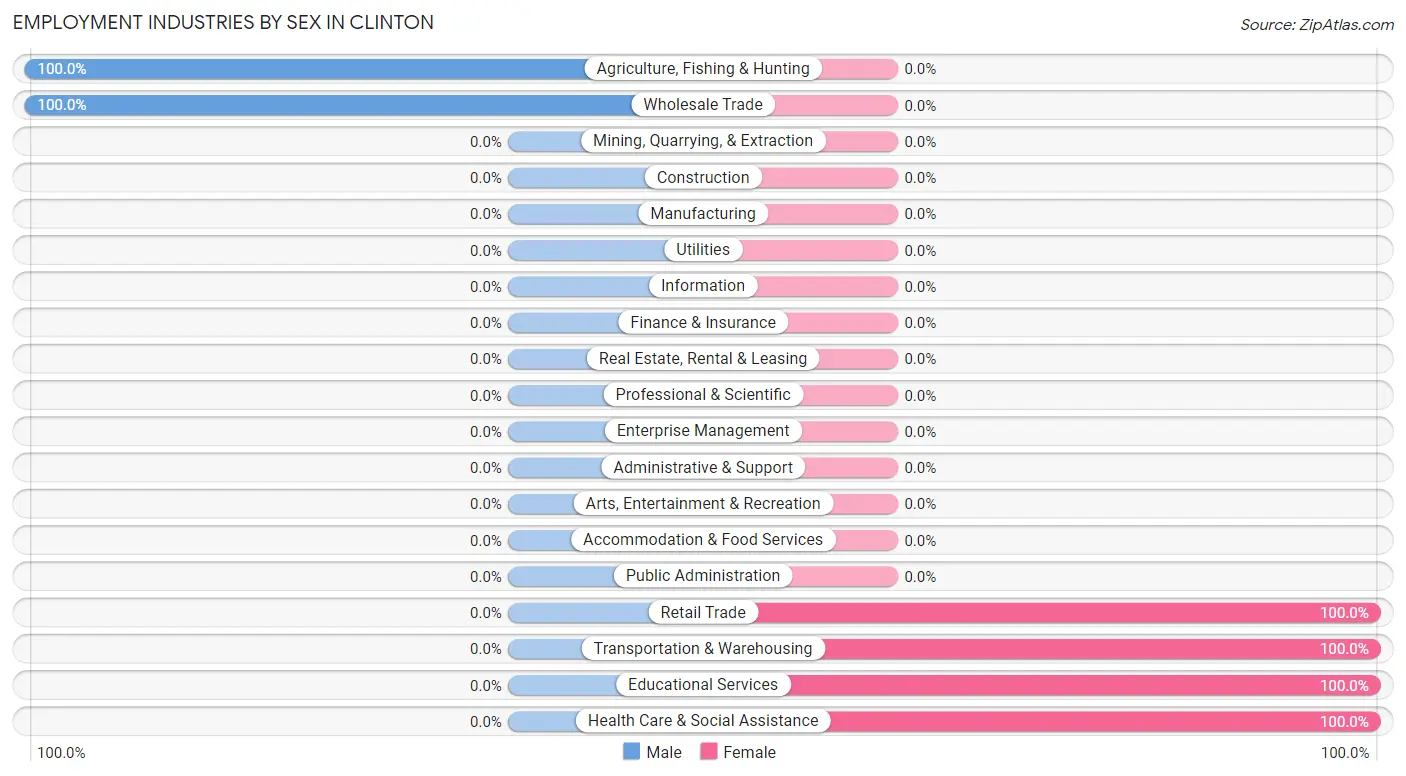
Employment Industries by Sex in Clinton
The Clinton industries that see more men than women are Agriculture, Fishing & Hunting (100.0%), and Wholesale Trade (100.0%), whereas the industries that tend to have a higher number of women are Retail Trade (100.0%), Transportation & Warehousing (100.0%), and Educational Services (100.0%).
| Industry | Male | Female |
| Agriculture, Fishing & Hunting | 4 (100.0%) | 0 (0.0%) |
| Mining, Quarrying, & Extraction | 0 (0.0%) | 0 (0.0%) |
| Construction | 0 (0.0%) | 0 (0.0%) |
| Manufacturing | 0 (0.0%) | 0 (0.0%) |
| Wholesale Trade | 4 (100.0%) | 0 (0.0%) |
| Retail Trade | 0 (0.0%) | 3 (100.0%) |
| Transportation & Warehousing | 0 (0.0%) | 2 (100.0%) |
| Utilities | 0 (0.0%) | 0 (0.0%) |
| Information | 0 (0.0%) | 0 (0.0%) |
| Finance & Insurance | 0 (0.0%) | 0 (0.0%) |
| Real Estate, Rental & Leasing | 0 (0.0%) | 0 (0.0%) |
| Professional & Scientific | 0 (0.0%) | 0 (0.0%) |
| Enterprise Management | 0 (0.0%) | 0 (0.0%) |
| Administrative & Support | 0 (0.0%) | 0 (0.0%) |
| Educational Services | 0 (0.0%) | 3 (100.0%) |
| Health Care & Social Assistance | 0 (0.0%) | 3 (100.0%) |
| Arts, Entertainment & Recreation | 0 (0.0%) | 0 (0.0%) |
| Accommodation & Food Services | 0 (0.0%) | 0 (0.0%) |
| Public Administration | 0 (0.0%) | 0 (0.0%) |
| Total | 15 (46.9%) | 17 (53.1%) |
Education in Clinton
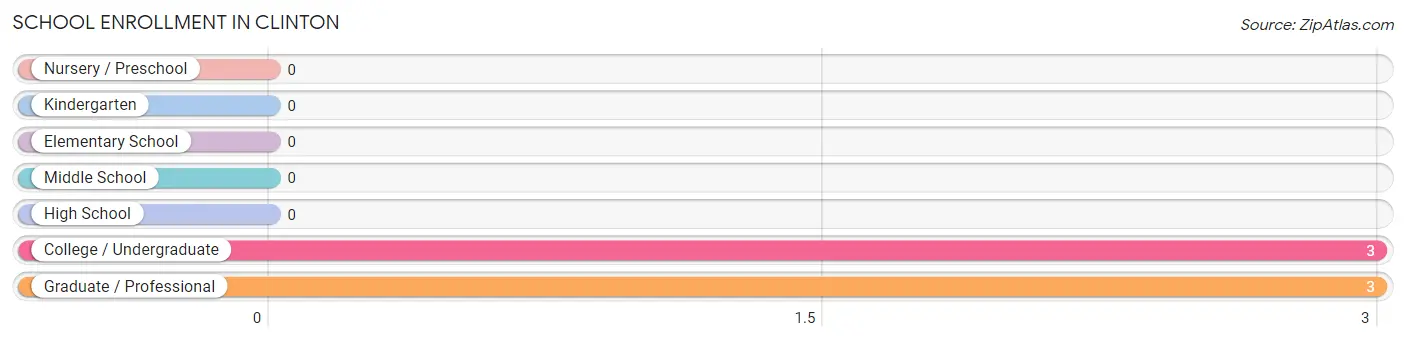
School Enrollment in Clinton
The most common levels of schooling among the 6 students in Clinton are college / undergraduate (3 | 50.0%), and graduate / professional (3 | 50.0%).
| School Level | # Students | % Students |
| Nursery / Preschool | 0 | 0.0% |
| Kindergarten | 0 | 0.0% |
| Elementary School | 0 | 0.0% |
| Middle School | 0 | 0.0% |
| High School | 0 | 0.0% |
| College / Undergraduate | 3 | 50.0% |
| Graduate / Professional | 3 | 50.0% |
| Total | 6 | 100.0% |
School Enrollment by Age by Funding Source in Clinton
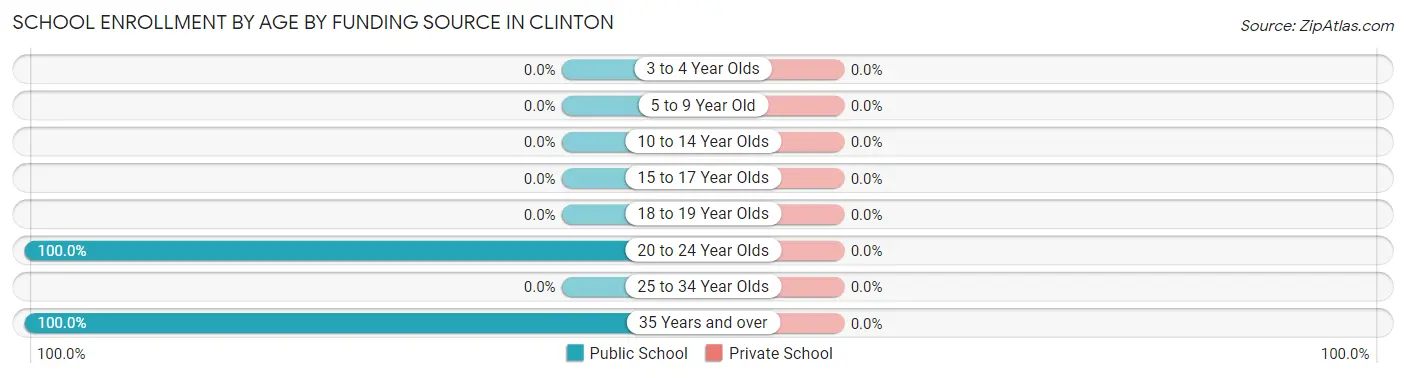
| Age Bracket | Public School | Private School |
| 3 to 4 Year Olds | 0 (0.0%) | 0 (0.0%) |
| 5 to 9 Year Old | 0 (0.0%) | 0 (0.0%) |
| 10 to 14 Year Olds | 0 (0.0%) | 0 (0.0%) |
| 15 to 17 Year Olds | 0 (0.0%) | 0 (0.0%) |
| 18 to 19 Year Olds | 0 (0.0%) | 0 (0.0%) |
| 20 to 24 Year Olds | 3 (100.0%) | 0 (0.0%) |
| 25 to 34 Year Olds | 0 (0.0%) | 0 (0.0%) |
| 35 Years and over | 3 (100.0%) | 0 (0.0%) |
| Total | 6 (100.0%) | 0 (0.0%) |
Educational Attainment by Field of Study in Clinton
Science & technology (11 | 84.6%), and psychology (2 | 15.4%) are the most common fields of study among 13 individuals in Clinton who have obtained a bachelor's degree or higher.
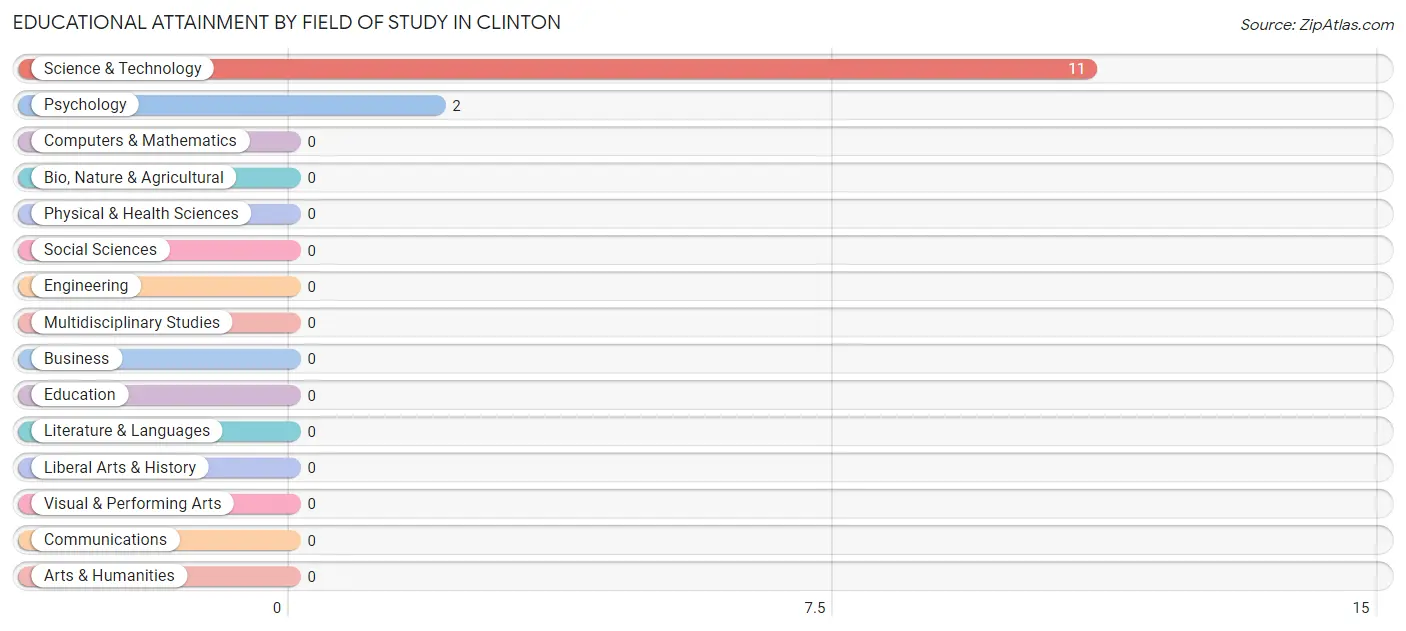
| Field of Study | # Graduates | % Graduates |
| Computers & Mathematics | 0 | 0.0% |
| Bio, Nature & Agricultural | 0 | 0.0% |
| Physical & Health Sciences | 0 | 0.0% |
| Psychology | 2 | 15.4% |
| Social Sciences | 0 | 0.0% |
| Engineering | 0 | 0.0% |
| Multidisciplinary Studies | 0 | 0.0% |
| Science & Technology | 11 | 84.6% |
| Business | 0 | 0.0% |
| Education | 0 | 0.0% |
| Literature & Languages | 0 | 0.0% |
| Liberal Arts & History | 0 | 0.0% |
| Visual & Performing Arts | 0 | 0.0% |
| Communications | 0 | 0.0% |
| Arts & Humanities | 0 | 0.0% |
| Total | 13 | 100.0% |
Transportation & Commute in Clinton
Vehicle Availability by Sex in Clinton
The most prevalent vehicle ownership categories in Clinton are males with 3 vehicles (6, accounting for 40.0%) and females with 3 vehicles (3, making up 35.3%).
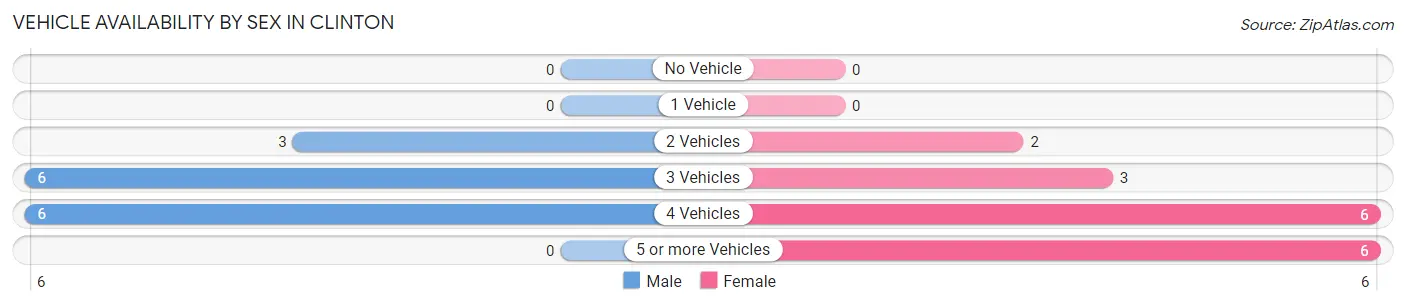
| Vehicles Available | Male | Female |
| No Vehicle | 0 (0.0%) | 0 (0.0%) |
| 1 Vehicle | 0 (0.0%) | 0 (0.0%) |
| 2 Vehicles | 3 (20.0%) | 2 (11.8%) |
| 3 Vehicles | 6 (40.0%) | 3 (17.6%) |
| 4 Vehicles | 6 (40.0%) | 6 (35.3%) |
| 5 or more Vehicles | 0 (0.0%) | 6 (35.3%) |
| Total | 15 (100.0%) | 17 (100.0%) |
Commute Time in Clinton
The most frequently occuring commute durations in Clinton are 10 to 14 minutes (8 commuters, 25.0%), 5 to 9 minutes (6 commuters, 18.8%), and 15 to 19 minutes (6 commuters, 18.8%).
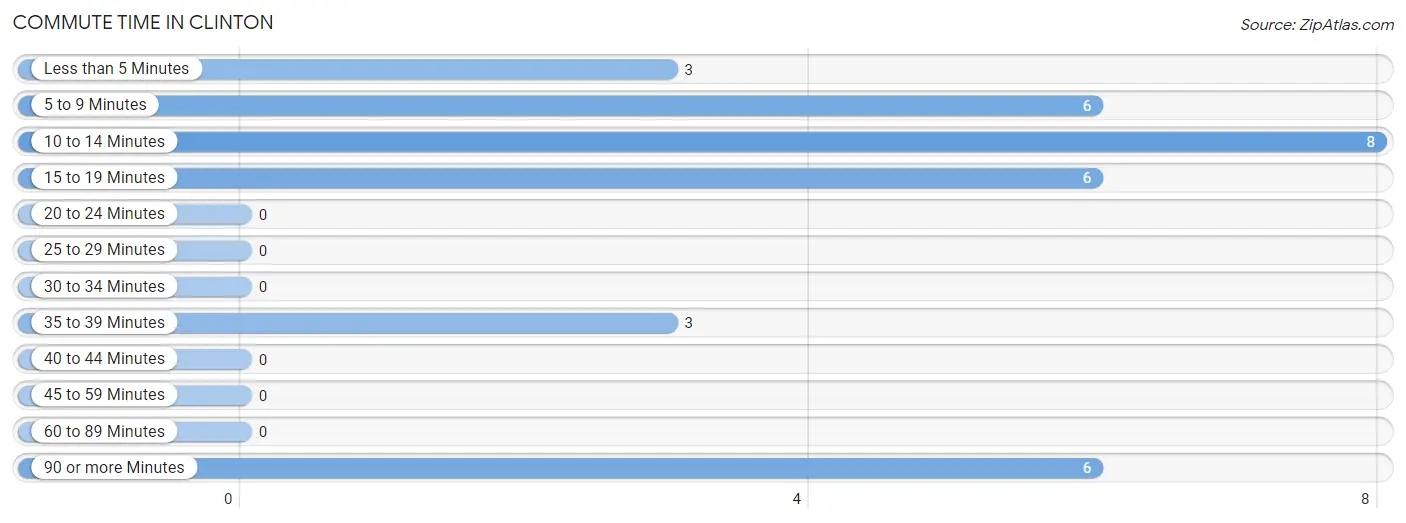
| Commute Time | # Commuters | % Commuters |
| Less than 5 Minutes | 3 | 9.4% |
| 5 to 9 Minutes | 6 | 18.8% |
| 10 to 14 Minutes | 8 | 25.0% |
| 15 to 19 Minutes | 6 | 18.8% |
| 20 to 24 Minutes | 0 | 0.0% |
| 25 to 29 Minutes | 0 | 0.0% |
| 30 to 34 Minutes | 0 | 0.0% |
| 35 to 39 Minutes | 3 | 9.4% |
| 40 to 44 Minutes | 0 | 0.0% |
| 45 to 59 Minutes | 0 | 0.0% |
| 60 to 89 Minutes | 0 | 0.0% |
| 90 or more Minutes | 6 | 18.8% |
Commute Time by Sex in Clinton
The most common commute times in Clinton are 10 to 14 minutes (6 commuters, 40.0%) for males and 5 to 9 minutes (6 commuters, 35.3%) for females.
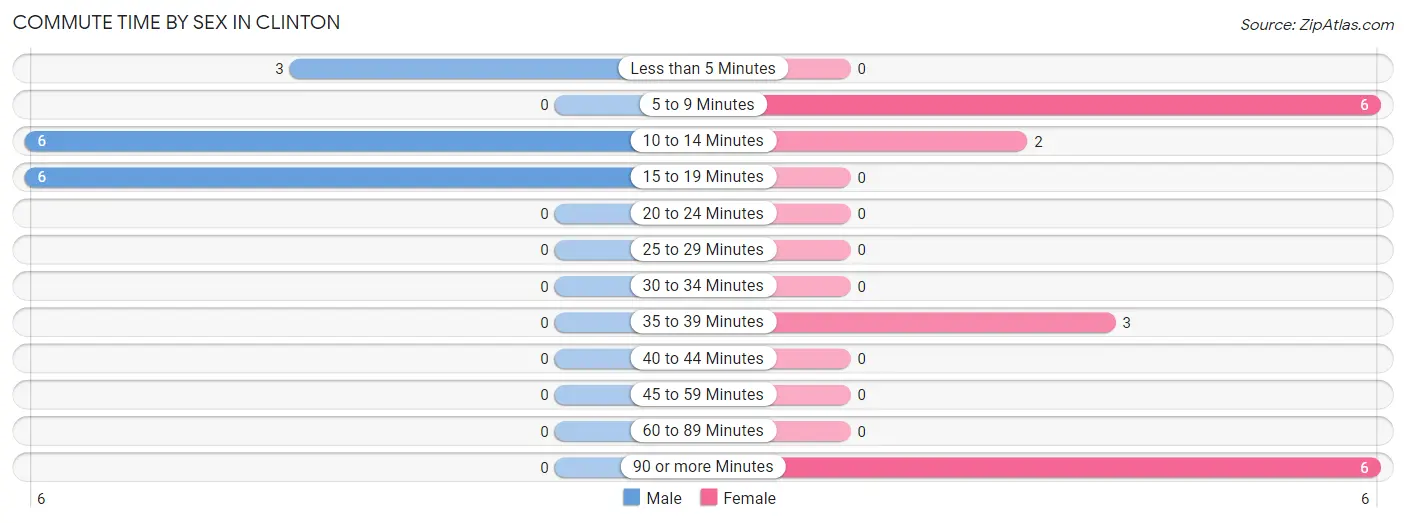
| Commute Time | Male | Female |
| Less than 5 Minutes | 3 (20.0%) | 0 (0.0%) |
| 5 to 9 Minutes | 0 (0.0%) | 6 (35.3%) |
| 10 to 14 Minutes | 6 (40.0%) | 2 (11.8%) |
| 15 to 19 Minutes | 6 (40.0%) | 0 (0.0%) |
| 20 to 24 Minutes | 0 (0.0%) | 0 (0.0%) |
| 25 to 29 Minutes | 0 (0.0%) | 0 (0.0%) |
| 30 to 34 Minutes | 0 (0.0%) | 0 (0.0%) |
| 35 to 39 Minutes | 0 (0.0%) | 3 (17.6%) |
| 40 to 44 Minutes | 0 (0.0%) | 0 (0.0%) |
| 45 to 59 Minutes | 0 (0.0%) | 0 (0.0%) |
| 60 to 89 Minutes | 0 (0.0%) | 0 (0.0%) |
| 90 or more Minutes | 0 (0.0%) | 6 (35.3%) |
Time of Departure to Work by Sex in Clinton
The most frequent times of departure to work in Clinton are 6:30 AM to 6:59 AM (4, 26.7%) for males and 8:00 AM to 8:29 AM (6, 35.3%) for females.
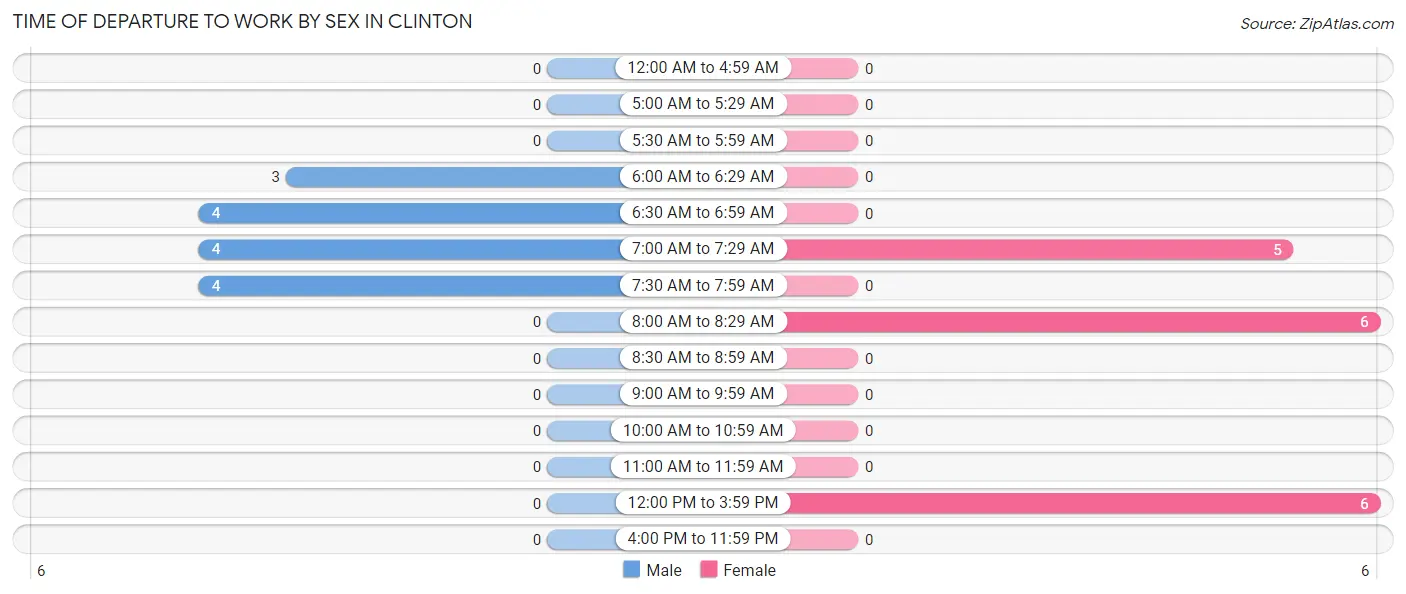
| Time of Departure | Male | Female |
| 12:00 AM to 4:59 AM | 0 (0.0%) | 0 (0.0%) |
| 5:00 AM to 5:29 AM | 0 (0.0%) | 0 (0.0%) |
| 5:30 AM to 5:59 AM | 0 (0.0%) | 0 (0.0%) |
| 6:00 AM to 6:29 AM | 3 (20.0%) | 0 (0.0%) |
| 6:30 AM to 6:59 AM | 4 (26.7%) | 0 (0.0%) |
| 7:00 AM to 7:29 AM | 4 (26.7%) | 5 (29.4%) |
| 7:30 AM to 7:59 AM | 4 (26.7%) | 0 (0.0%) |
| 8:00 AM to 8:29 AM | 0 (0.0%) | 6 (35.3%) |
| 8:30 AM to 8:59 AM | 0 (0.0%) | 0 (0.0%) |
| 9:00 AM to 9:59 AM | 0 (0.0%) | 0 (0.0%) |
| 10:00 AM to 10:59 AM | 0 (0.0%) | 0 (0.0%) |
| 11:00 AM to 11:59 AM | 0 (0.0%) | 0 (0.0%) |
| 12:00 PM to 3:59 PM | 0 (0.0%) | 6 (35.3%) |
| 4:00 PM to 11:59 PM | 0 (0.0%) | 0 (0.0%) |
| Total | 15 (100.0%) | 17 (100.0%) |
Housing Occupancy in Clinton
Occupancy by Ownership in Clinton
Of the total 31 dwellings in Clinton, owner-occupied units account for 19 (61.3%), while renter-occupied units make up 12 (38.7%).
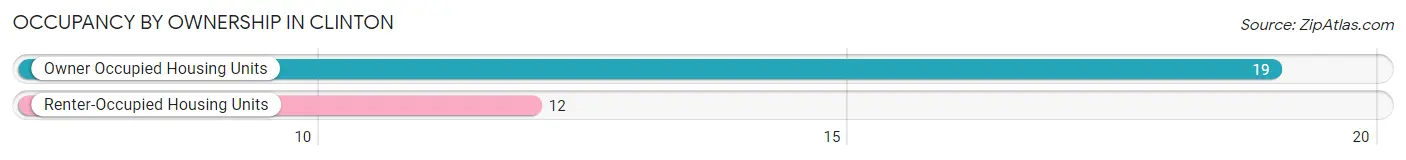
| Occupancy | # Housing Units | % Housing Units |
| Owner Occupied Housing Units | 19 | 61.3% |
| Renter-Occupied Housing Units | 12 | 38.7% |
| Total Occupied Housing Units | 31 | 100.0% |
Occupancy by Household Size in Clinton
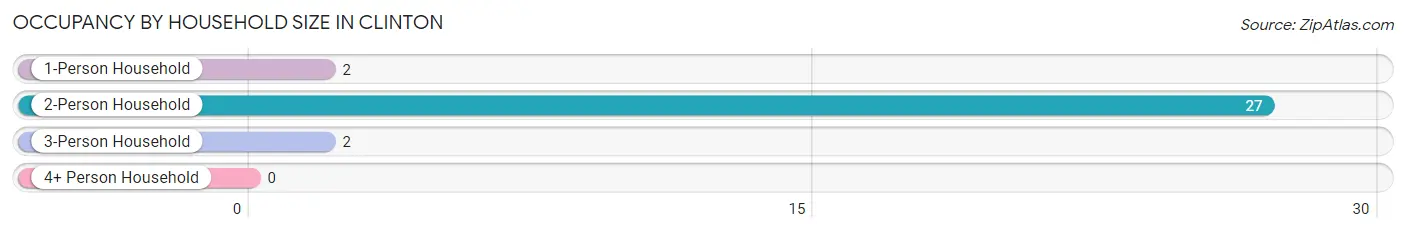
| Household Size | # Housing Units | % Housing Units |
| 1-Person Household | 2 | 6.5% |
| 2-Person Household | 27 | 87.1% |
| 3-Person Household | 2 | 6.5% |
| 4+ Person Household | 0 | 0.0% |
| Total Housing Units | 31 | 100.0% |
Occupancy by Ownership by Household Size in Clinton
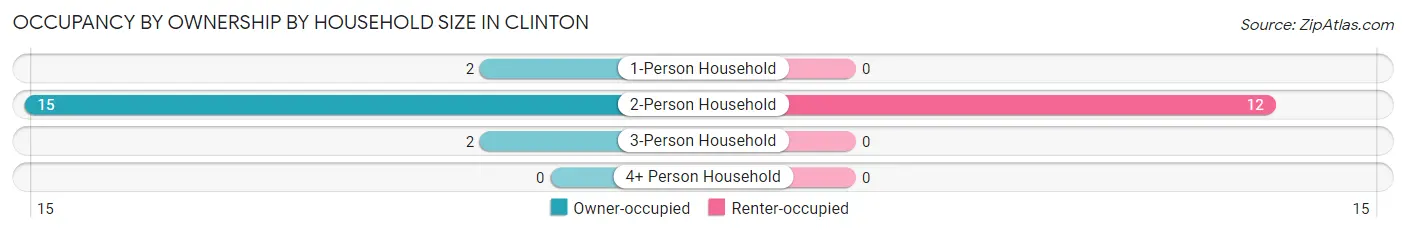
| Household Size | Owner-occupied | Renter-occupied |
| 1-Person Household | 2 (100.0%) | 0 (0.0%) |
| 2-Person Household | 15 (55.6%) | 12 (44.4%) |
| 3-Person Household | 2 (100.0%) | 0 (0.0%) |
| 4+ Person Household | 0 (0.0%) | 0 (0.0%) |
| Total Housing Units | 19 (61.3%) | 12 (38.7%) |
Occupancy by Educational Attainment in Clinton
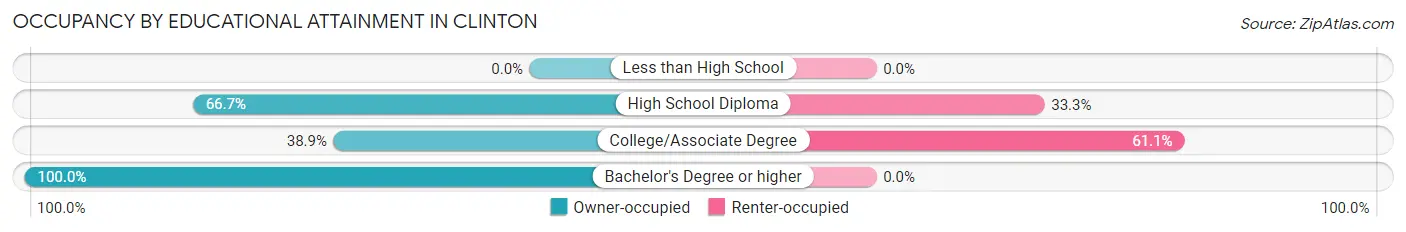
| Household Size | Owner-occupied | Renter-occupied |
| Less than High School | 0 (0.0%) | 0 (0.0%) |
| High School Diploma | 2 (66.7%) | 1 (33.3%) |
| College/Associate Degree | 7 (38.9%) | 11 (61.1%) |
| Bachelor's Degree or higher | 10 (100.0%) | 0 (0.0%) |
Occupancy by Age of Householder in Clinton
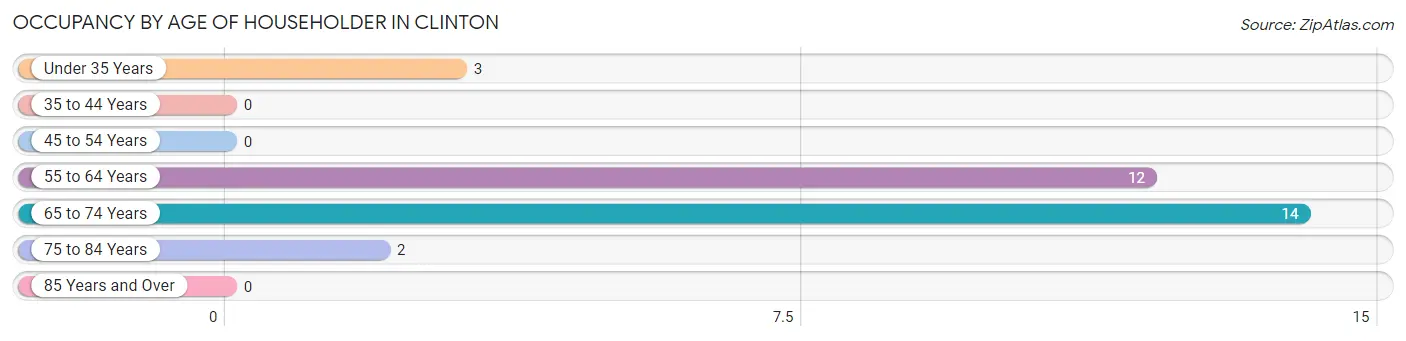
| Age Bracket | # Households | % Households |
| Under 35 Years | 3 | 9.7% |
| 35 to 44 Years | 0 | 0.0% |
| 45 to 54 Years | 0 | 0.0% |
| 55 to 64 Years | 12 | 38.7% |
| 65 to 74 Years | 14 | 45.2% |
| 75 to 84 Years | 2 | 6.5% |
| 85 Years and Over | 0 | 0.0% |
| Total | 31 | 100.0% |
Housing Finances in Clinton
Median Income by Occupancy in Clinton
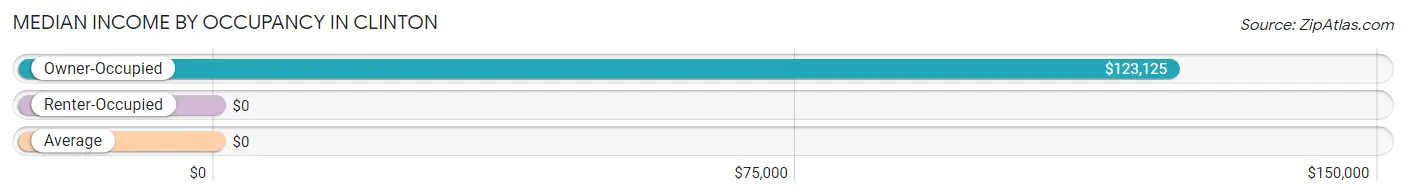
| Occupancy Type | # Households | Median Income |
| Owner-Occupied | 19 (61.3%) | $123,125 |
| Renter-Occupied | 12 (38.7%) | $0 |
| Average | 31 (100.0%) | $0 |
Occupancy by Householder Income Bracket in Clinton
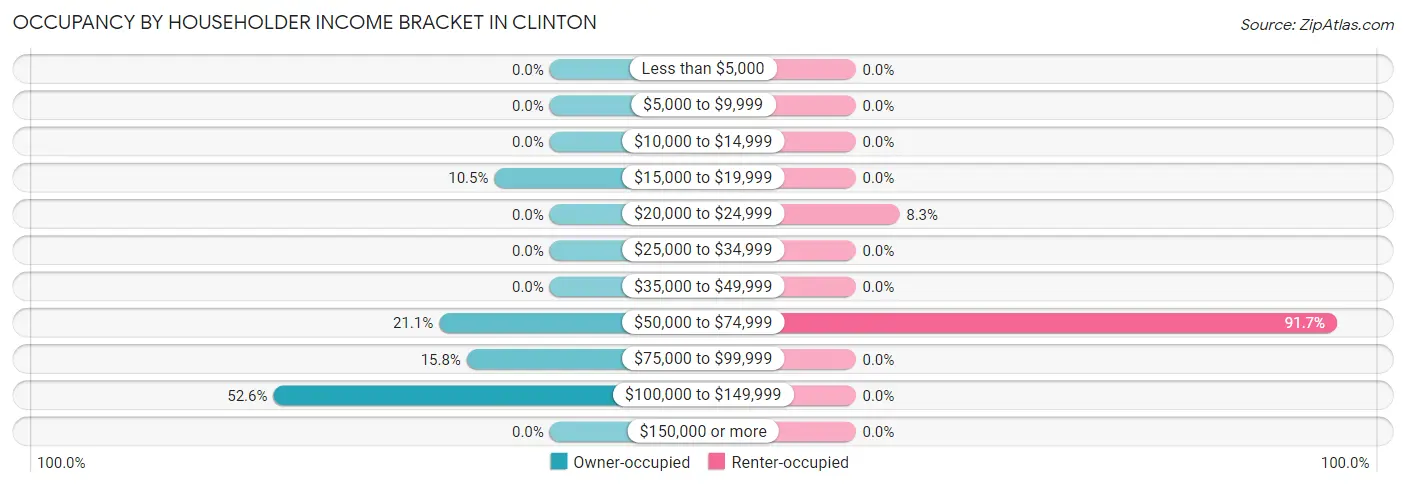
| Income Bracket | Owner-occupied | Renter-occupied |
| Less than $5,000 | 0 (0.0%) | 0 (0.0%) |
| $5,000 to $9,999 | 0 (0.0%) | 0 (0.0%) |
| $10,000 to $14,999 | 0 (0.0%) | 0 (0.0%) |
| $15,000 to $19,999 | 2 (10.5%) | 0 (0.0%) |
| $20,000 to $24,999 | 0 (0.0%) | 1 (8.3%) |
| $25,000 to $34,999 | 0 (0.0%) | 0 (0.0%) |
| $35,000 to $49,999 | 0 (0.0%) | 0 (0.0%) |
| $50,000 to $74,999 | 4 (21.0%) | 11 (91.7%) |
| $75,000 to $99,999 | 3 (15.8%) | 0 (0.0%) |
| $100,000 to $149,999 | 10 (52.6%) | 0 (0.0%) |
| $150,000 or more | 0 (0.0%) | 0 (0.0%) |
| Total | 19 (100.0%) | 12 (100.0%) |
Monthly Housing Cost Tiers in Clinton
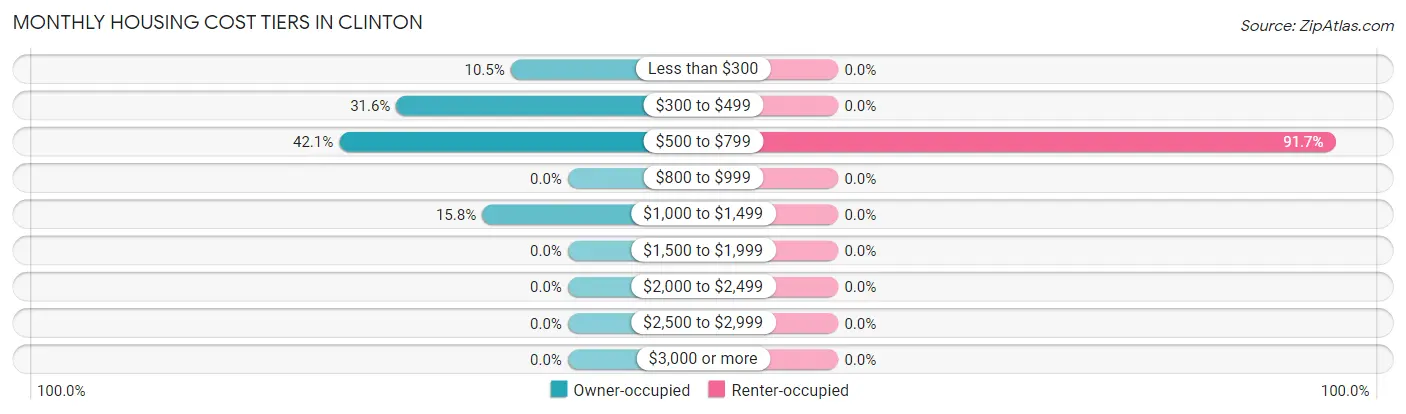
| Monthly Cost | Owner-occupied | Renter-occupied |
| Less than $300 | 2 (10.5%) | 0 (0.0%) |
| $300 to $499 | 6 (31.6%) | 0 (0.0%) |
| $500 to $799 | 8 (42.1%) | 11 (91.7%) |
| $800 to $999 | 0 (0.0%) | 0 (0.0%) |
| $1,000 to $1,499 | 3 (15.8%) | 0 (0.0%) |
| $1,500 to $1,999 | 0 (0.0%) | 0 (0.0%) |
| $2,000 to $2,499 | 0 (0.0%) | 0 (0.0%) |
| $2,500 to $2,999 | 0 (0.0%) | 0 (0.0%) |
| $3,000 or more | 0 (0.0%) | 0 (0.0%) |
| Total | 19 (100.0%) | 12 (100.0%) |
Physical Housing Characteristics in Clinton
Housing Structures in Clinton
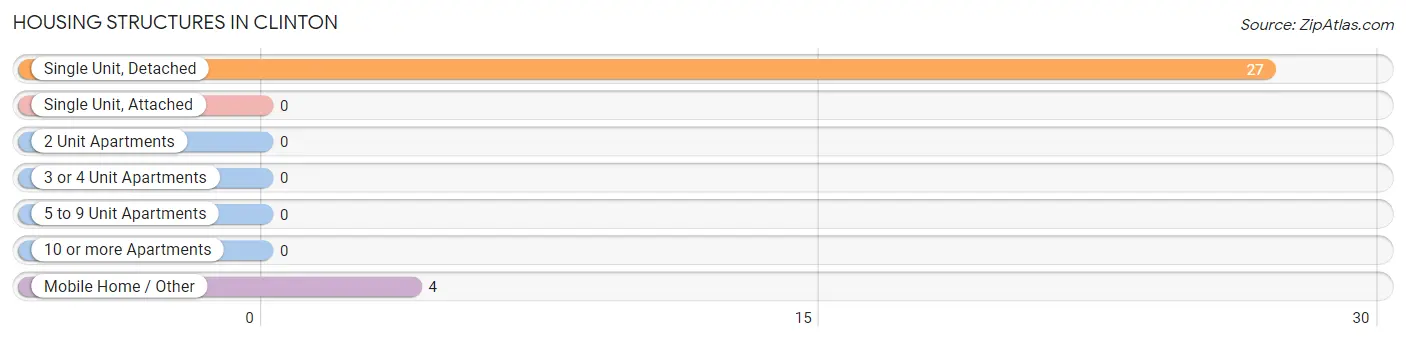
| Structure Type | # Housing Units | % Housing Units |
| Single Unit, Detached | 27 | 87.1% |
| Single Unit, Attached | 0 | 0.0% |
| 2 Unit Apartments | 0 | 0.0% |
| 3 or 4 Unit Apartments | 0 | 0.0% |
| 5 to 9 Unit Apartments | 0 | 0.0% |
| 10 or more Apartments | 0 | 0.0% |
| Mobile Home / Other | 4 | 12.9% |
| Total | 31 | 100.0% |
Housing Structures by Occupancy in Clinton
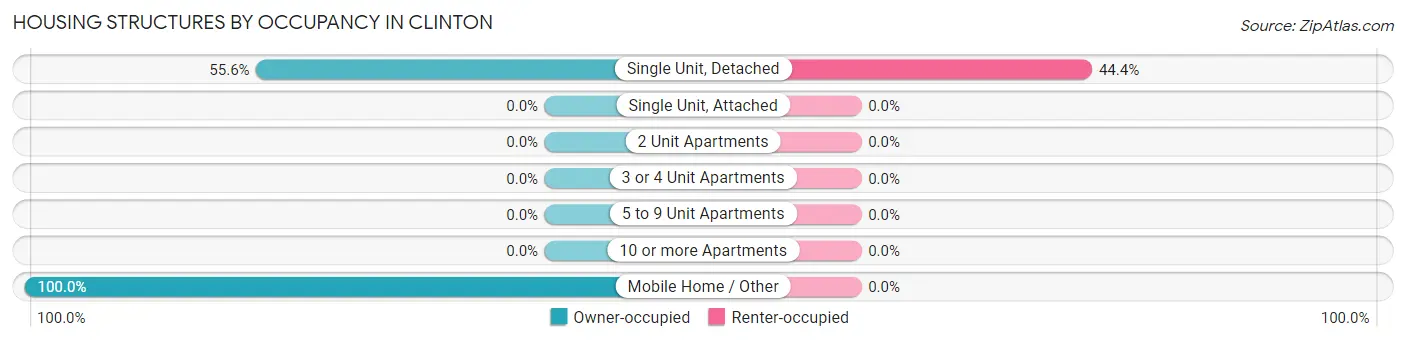
| Structure Type | Owner-occupied | Renter-occupied |
| Single Unit, Detached | 15 (55.6%) | 12 (44.4%) |
| Single Unit, Attached | 0 (0.0%) | 0 (0.0%) |
| 2 Unit Apartments | 0 (0.0%) | 0 (0.0%) |
| 3 or 4 Unit Apartments | 0 (0.0%) | 0 (0.0%) |
| 5 to 9 Unit Apartments | 0 (0.0%) | 0 (0.0%) |
| 10 or more Apartments | 0 (0.0%) | 0 (0.0%) |
| Mobile Home / Other | 4 (100.0%) | 0 (0.0%) |
| Total | 19 (61.3%) | 12 (38.7%) |
Housing Structures by Number of Rooms in Clinton
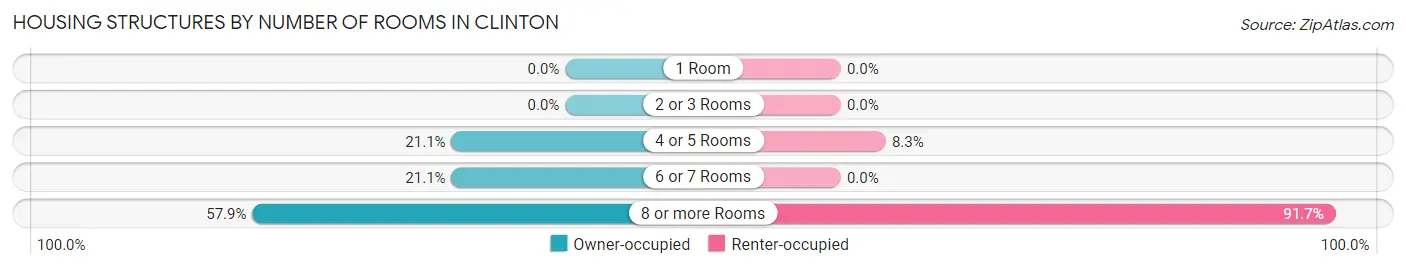
| Number of Rooms | Owner-occupied | Renter-occupied |
| 1 Room | 0 (0.0%) | 0 (0.0%) |
| 2 or 3 Rooms | 0 (0.0%) | 0 (0.0%) |
| 4 or 5 Rooms | 4 (21.0%) | 1 (8.3%) |
| 6 or 7 Rooms | 4 (21.0%) | 0 (0.0%) |
| 8 or more Rooms | 11 (57.9%) | 11 (91.7%) |
| Total | 19 (100.0%) | 12 (100.0%) |
Housing Structure by Heating Type in Clinton
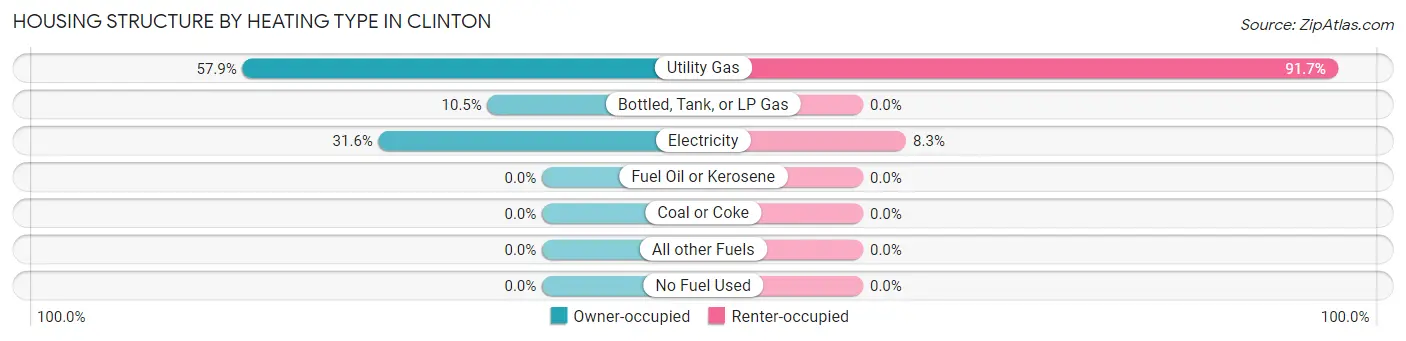
| Heating Type | Owner-occupied | Renter-occupied |
| Utility Gas | 11 (57.9%) | 11 (91.7%) |
| Bottled, Tank, or LP Gas | 2 (10.5%) | 0 (0.0%) |
| Electricity | 6 (31.6%) | 1 (8.3%) |
| Fuel Oil or Kerosene | 0 (0.0%) | 0 (0.0%) |
| Coal or Coke | 0 (0.0%) | 0 (0.0%) |
| All other Fuels | 0 (0.0%) | 0 (0.0%) |
| No Fuel Used | 0 (0.0%) | 0 (0.0%) |
| Total | 19 (100.0%) | 12 (100.0%) |
Household Vehicle Usage in Clinton
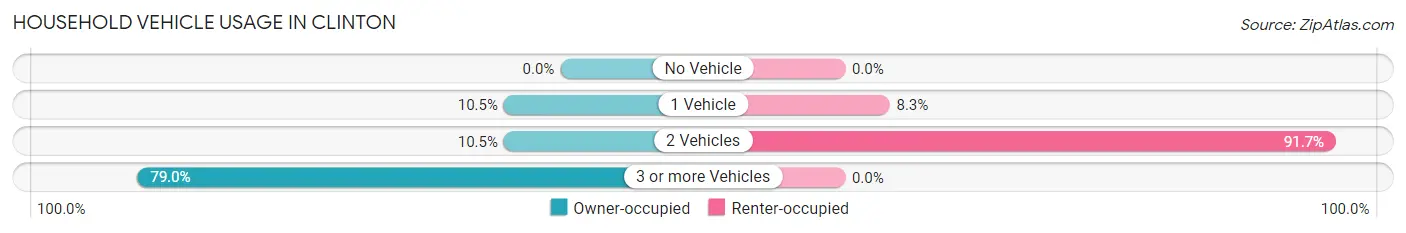
| Vehicles per Household | Owner-occupied | Renter-occupied |
| No Vehicle | 0 (0.0%) | 0 (0.0%) |
| 1 Vehicle | 2 (10.5%) | 1 (8.3%) |
| 2 Vehicles | 2 (10.5%) | 11 (91.7%) |
| 3 or more Vehicles | 15 (78.9%) | 0 (0.0%) |
| Total | 19 (100.0%) | 12 (100.0%) |
Real Estate & Mortgages in Clinton
Real Estate and Mortgage Overview in Clinton
| Characteristic | Without Mortgage | With Mortgage |
| Housing Units | 16 | 3 |
| Median Property Value | $137,500 | $0 |
| Median Household Income | $130,000 | $0 |
| Monthly Housing Costs | $500 | $0 |
| Real Estate Taxes | - | - |
Property Value by Mortgage Status in Clinton
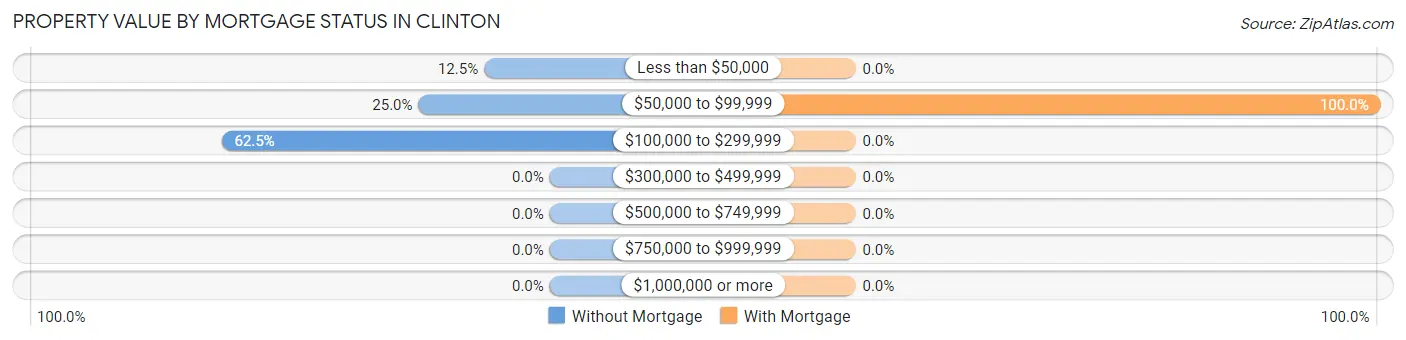
| Property Value | Without Mortgage | With Mortgage |
| Less than $50,000 | 2 (12.5%) | 0 (0.0%) |
| $50,000 to $99,999 | 4 (25.0%) | 3 (100.0%) |
| $100,000 to $299,999 | 10 (62.5%) | 0 (0.0%) |
| $300,000 to $499,999 | 0 (0.0%) | 0 (0.0%) |
| $500,000 to $749,999 | 0 (0.0%) | 0 (0.0%) |
| $750,000 to $999,999 | 0 (0.0%) | 0 (0.0%) |
| $1,000,000 or more | 0 (0.0%) | 0 (0.0%) |
| Total | 16 (100.0%) | 3 (100.0%) |
Household Income by Mortgage Status in Clinton
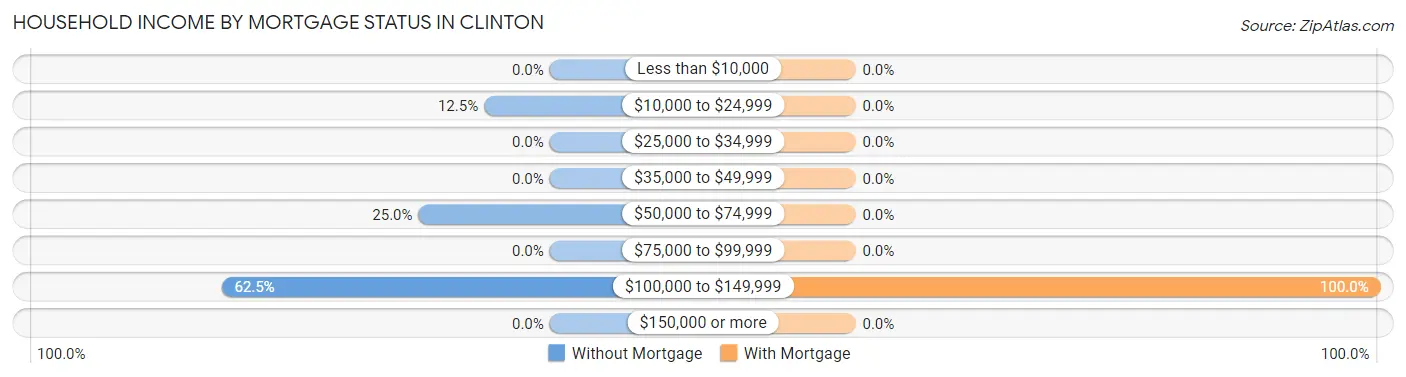
| Household Income | Without Mortgage | With Mortgage |
| Less than $10,000 | 0 (0.0%) | 0 (0.0%) |
| $10,000 to $24,999 | 2 (12.5%) | 0 (0.0%) |
| $25,000 to $34,999 | 0 (0.0%) | 0 (0.0%) |
| $35,000 to $49,999 | 0 (0.0%) | 0 (0.0%) |
| $50,000 to $74,999 | 4 (25.0%) | 0 (0.0%) |
| $75,000 to $99,999 | 0 (0.0%) | 0 (0.0%) |
| $100,000 to $149,999 | 10 (62.5%) | 3 (100.0%) |
| $150,000 or more | 0 (0.0%) | 0 (0.0%) |
| Total | 16 (100.0%) | 3 (100.0%) |
Property Value to Household Income Ratio in Clinton
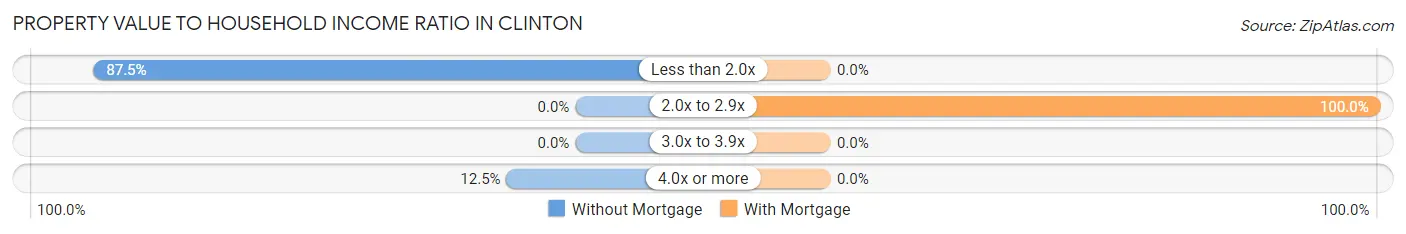
| Value-to-Income Ratio | Without Mortgage | With Mortgage |
| Less than 2.0x | 14 (87.5%) | 0 (0.0%) |
| 2.0x to 2.9x | 0 (0.0%) | 3 (100.0%) |
| 3.0x to 3.9x | 0 (0.0%) | 0 (0.0%) |
| 4.0x or more | 2 (12.5%) | 0 (0.0%) |
| Total | 16 (100.0%) | 3 (100.0%) |
Real Estate Taxes by Mortgage Status in Clinton
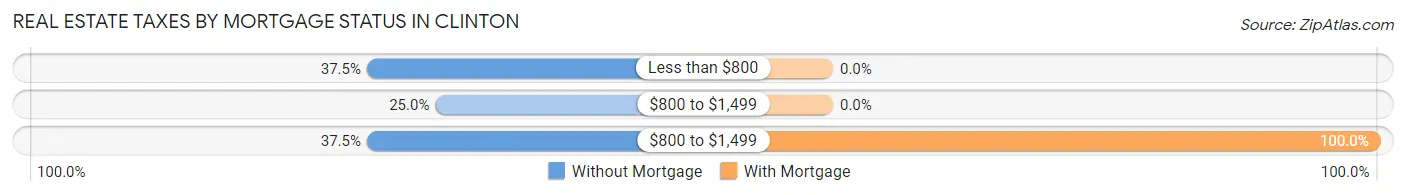
| Property Taxes | Without Mortgage | With Mortgage |
| Less than $800 | 6 (37.5%) | 0 (0.0%) |
| $800 to $1,499 | 4 (25.0%) | 0 (0.0%) |
| $800 to $1,499 | 6 (37.5%) | 3 (100.0%) |
| Total | 16 (100.0%) | 3 (100.0%) |
Health & Disability in Clinton
Health Insurance Coverage by Age in Clinton
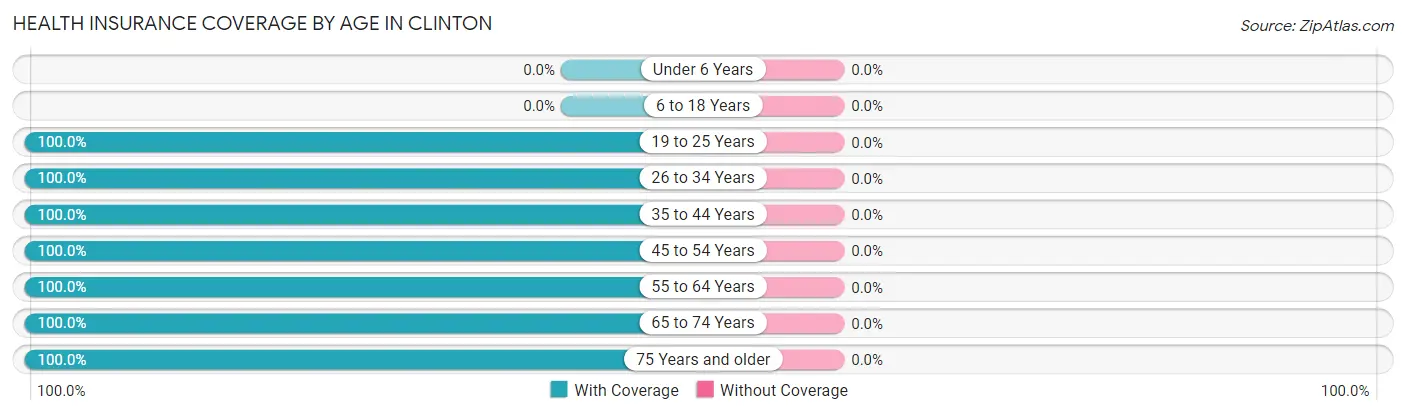
| Age Bracket | With Coverage | Without Coverage |
| Under 6 Years | 0 (0.0%) | 0 (0.0%) |
| 6 to 18 Years | 0 (0.0%) | 0 (0.0%) |
| 19 to 25 Years | 3 (100.0%) | 0 (0.0%) |
| 26 to 34 Years | 3 (100.0%) | 0 (0.0%) |
| 35 to 44 Years | 4 (100.0%) | 0 (0.0%) |
| 45 to 54 Years | 3 (100.0%) | 0 (0.0%) |
| 55 to 64 Years | 24 (100.0%) | 0 (0.0%) |
| 65 to 74 Years | 16 (100.0%) | 0 (0.0%) |
| 75 Years and older | 4 (100.0%) | 0 (0.0%) |
| Total | 57 (100.0%) | 0 (0.0%) |
Health Insurance Coverage by Citizenship Status in Clinton
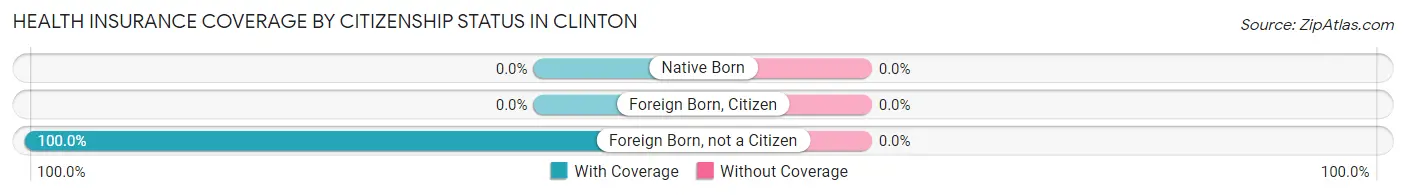
| Citizenship Status | With Coverage | Without Coverage |
| Native Born | 0 (0.0%) | 0 (0.0%) |
| Foreign Born, Citizen | 0 (0.0%) | 0 (0.0%) |
| Foreign Born, not a Citizen | 3 (100.0%) | 0 (0.0%) |
Health Insurance Coverage by Household Income in Clinton
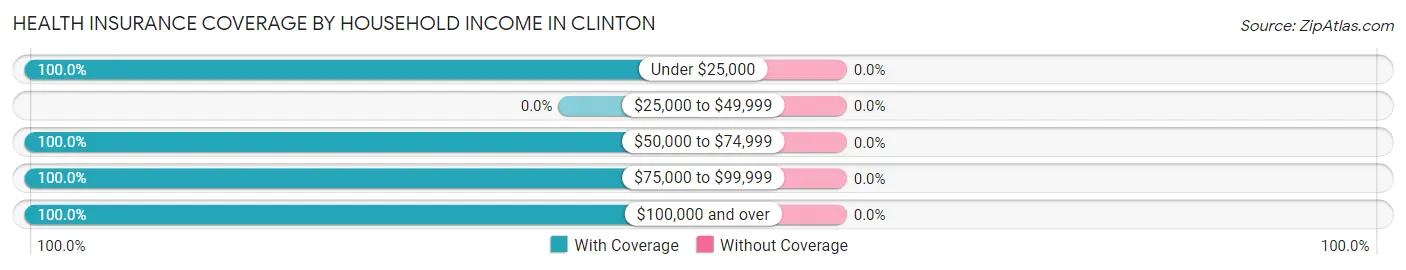
| Household Income | With Coverage | Without Coverage |
| Under $25,000 | 4 (100.0%) | 0 (0.0%) |
| $25,000 to $49,999 | 0 (0.0%) | 0 (0.0%) |
| $50,000 to $74,999 | 23 (100.0%) | 0 (0.0%) |
| $75,000 to $99,999 | 7 (100.0%) | 0 (0.0%) |
| $100,000 and over | 23 (100.0%) | 0 (0.0%) |
Public vs Private Health Insurance Coverage by Age in Clinton
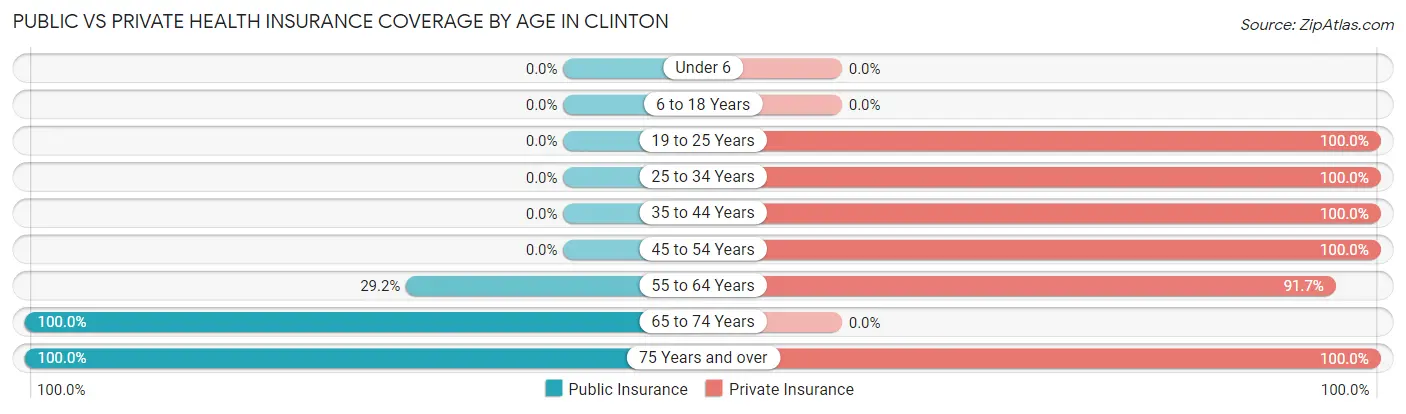
| Age Bracket | Public Insurance | Private Insurance |
| Under 6 | 0 (0.0%) | 0 (0.0%) |
| 6 to 18 Years | 0 (0.0%) | 0 (0.0%) |
| 19 to 25 Years | 0 (0.0%) | 3 (100.0%) |
| 25 to 34 Years | 0 (0.0%) | 3 (100.0%) |
| 35 to 44 Years | 0 (0.0%) | 4 (100.0%) |
| 45 to 54 Years | 0 (0.0%) | 3 (100.0%) |
| 55 to 64 Years | 7 (29.2%) | 22 (91.7%) |
| 65 to 74 Years | 16 (100.0%) | 0 (0.0%) |
| 75 Years and over | 4 (100.0%) | 4 (100.0%) |
| Total | 27 (47.4%) | 39 (68.4%) |
Disability Status by Sex by Age in Clinton
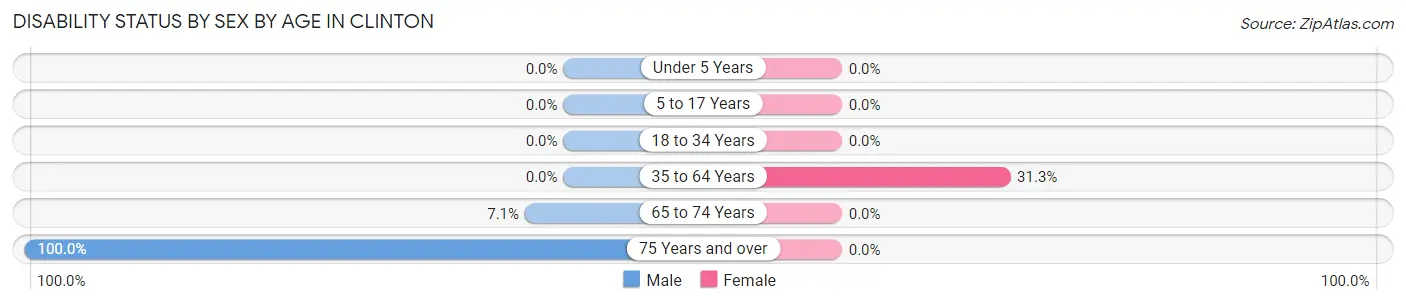
| Age Bracket | Male | Female |
| Under 5 Years | 0 (0.0%) | 0 (0.0%) |
| 5 to 17 Years | 0 (0.0%) | 0 (0.0%) |
| 18 to 34 Years | 0 (0.0%) | 0 (0.0%) |
| 35 to 64 Years | 0 (0.0%) | 5 (31.2%) |
| 65 to 74 Years | 1 (7.1%) | 0 (0.0%) |
| 75 Years and over | 2 (100.0%) | 0 (0.0%) |
Disability Class by Sex by Age in Clinton
Disability Class: Hearing Difficulty
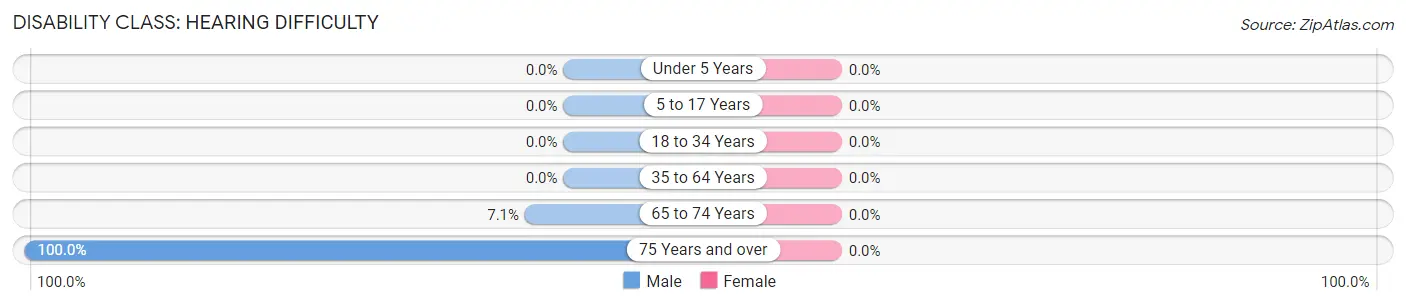
| Age Bracket | Male | Female |
| Under 5 Years | 0 (0.0%) | 0 (0.0%) |
| 5 to 17 Years | 0 (0.0%) | 0 (0.0%) |
| 18 to 34 Years | 0 (0.0%) | 0 (0.0%) |
| 35 to 64 Years | 0 (0.0%) | 0 (0.0%) |
| 65 to 74 Years | 1 (7.1%) | 0 (0.0%) |
| 75 Years and over | 2 (100.0%) | 0 (0.0%) |
Disability Class: Vision Difficulty
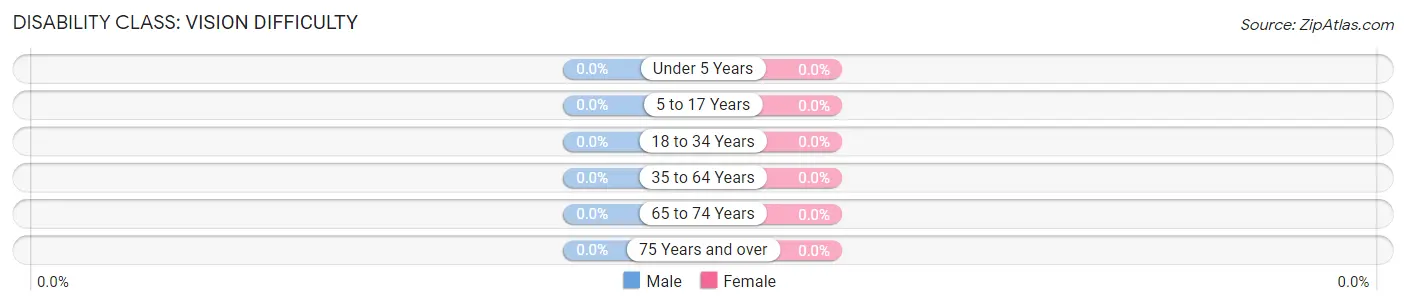
| Age Bracket | Male | Female |
| Under 5 Years | 0 (0.0%) | 0 (0.0%) |
| 5 to 17 Years | 0 (0.0%) | 0 (0.0%) |
| 18 to 34 Years | 0 (0.0%) | 0 (0.0%) |
| 35 to 64 Years | 0 (0.0%) | 0 (0.0%) |
| 65 to 74 Years | 0 (0.0%) | 0 (0.0%) |
| 75 Years and over | 0 (0.0%) | 0 (0.0%) |
Disability Class: Cognitive Difficulty

| Age Bracket | Male | Female |
| 5 to 17 Years | 0 (0.0%) | 0 (0.0%) |
| 18 to 34 Years | 0 (0.0%) | 0 (0.0%) |
| 35 to 64 Years | 0 (0.0%) | 0 (0.0%) |
| 65 to 74 Years | 0 (0.0%) | 0 (0.0%) |
| 75 Years and over | 0 (0.0%) | 0 (0.0%) |
Disability Class: Ambulatory Difficulty
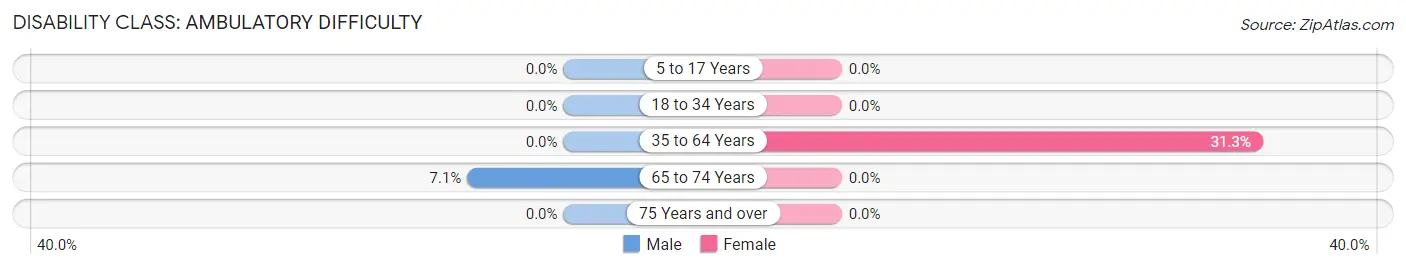
| Age Bracket | Male | Female |
| 5 to 17 Years | 0 (0.0%) | 0 (0.0%) |
| 18 to 34 Years | 0 (0.0%) | 0 (0.0%) |
| 35 to 64 Years | 0 (0.0%) | 5 (31.2%) |
| 65 to 74 Years | 1 (7.1%) | 0 (0.0%) |
| 75 Years and over | 0 (0.0%) | 0 (0.0%) |
Disability Class: Self-Care Difficulty
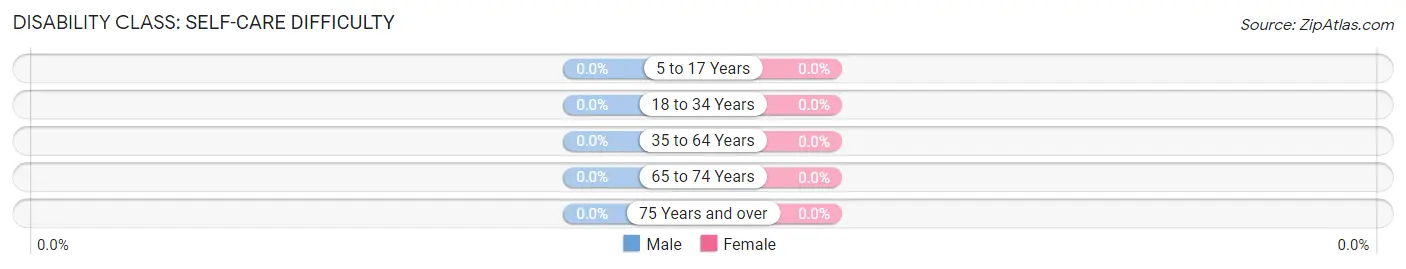
| Age Bracket | Male | Female |
| 5 to 17 Years | 0 (0.0%) | 0 (0.0%) |
| 18 to 34 Years | 0 (0.0%) | 0 (0.0%) |
| 35 to 64 Years | 0 (0.0%) | 0 (0.0%) |
| 65 to 74 Years | 0 (0.0%) | 0 (0.0%) |
| 75 Years and over | 0 (0.0%) | 0 (0.0%) |
Technology Access in Clinton
Computing Device Access in Clinton
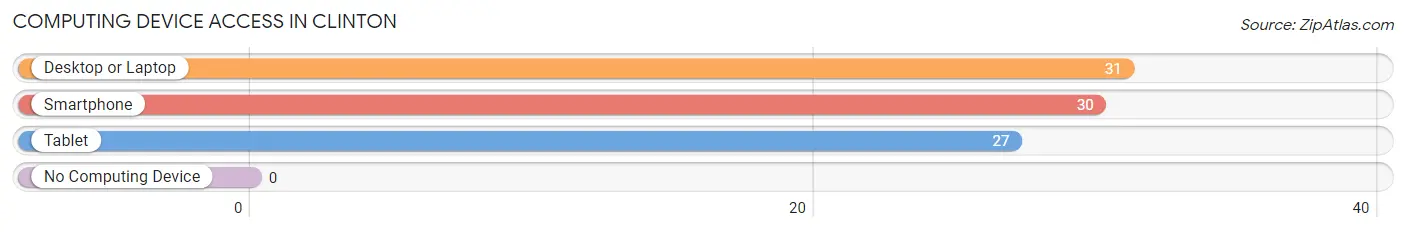
| Device Type | # Households | % Households |
| Desktop or Laptop | 31 | 100.0% |
| Smartphone | 30 | 96.8% |
| Tablet | 27 | 87.1% |
| No Computing Device | 0 | 0.0% |
| Total | 31 | 100.0% |
Internet Access in Clinton
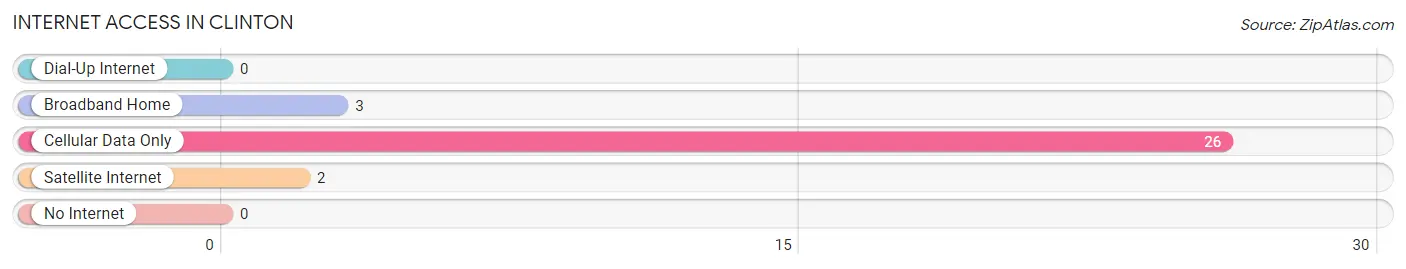
| Internet Type | # Households | % Households |
| Dial-Up Internet | 0 | 0.0% |
| Broadband Home | 3 | 9.7% |
| Cellular Data Only | 26 | 83.9% |
| Satellite Internet | 2 | 6.5% |
| No Internet | 0 | 0.0% |
| Total | 31 | 100.0% |
Clinton Summary
Clinton, Nebraska is a small city located in the southeastern corner of the state. It is situated in the Platte River Valley, and is part of the Lincoln metropolitan area. The city has a population of approximately 1,500 people, and is the county seat of Lancaster County.
History
The area that is now Clinton was first settled in 1856 by a group of settlers from Ohio. The town was originally known as “Lancaster”, but was renamed “Clinton” in 1867 in honor of DeWitt Clinton, the former governor of New York. The town was officially incorporated in 1871.
In the late 19th century, Clinton was a thriving agricultural community. The town was home to several grain elevators, a flour mill, and a creamery. The town also had a number of businesses, including a hotel, a bank, and a newspaper.
In the early 20th century, Clinton began to experience a decline in population as many of its residents moved away to larger cities. The Great Depression of the 1930s further exacerbated the decline, and by 1940 the population had dropped to just over 500 people.
Geography
Clinton is located in the southeastern corner of Nebraska, in the Platte River Valley. The city is situated at an elevation of 1,400 feet above sea level. The city is located approximately 25 miles south of Lincoln, and is part of the Lincoln metropolitan area.
The city is surrounded by rolling hills and farmland. The Platte River runs through the city, and is a popular spot for fishing and boating. The city is also home to several parks, including Clinton Park, which features a playground, picnic areas, and a walking trail.
Economy
The economy of Clinton is largely based on agriculture. The city is home to several grain elevators, and the surrounding area is used for growing corn, soybeans, and other crops. The city is also home to several businesses, including a grocery store, a hardware store, and a restaurant.
The city is also home to a number of manufacturing companies, including a plastics manufacturer and a metal fabrication company. The city is also home to a number of small businesses, including a bakery, a florist, and a furniture store.
Demographics
As of the 2010 census, the population of Clinton was 1,500 people. The racial makeup of the city was 95.3% White, 0.7% African American, 0.7% Native American, 0.3% Asian, and 2.7% from other races. The median household income was $41,250, and the median family income was $50,000.
The city is home to a number of churches, including the First United Methodist Church, the First Presbyterian Church, and the St. John’s Lutheran Church. The city is also home to a number of schools, including Clinton Elementary School, Clinton Middle School, and Clinton High School.
Common Questions
What is Per Capita Income in Clinton?
Per Capita income in Clinton is $42,144.
What is Inequality or Gini Index in Clinton?
Inequality or Gini Index in Clinton is 0.28.
What is the Total Population of Clinton?
Total Population of Clinton is 57.
What is the Total Male Population of Clinton?
Total Male Population of Clinton is 31.
What is the Total Female Population of Clinton?
Total Female Population of Clinton is 26.
What is the Ratio of Males per 100 Females in Clinton?
There are 119.23 Males per 100 Females in Clinton.
What is the Ratio of Females per 100 Males in Clinton?
There are 83.87 Females per 100 Males in Clinton.
What is the Median Population Age in Clinton?
Median Population Age in Clinton is 60.4 Years.
What is the Average Family Size in Clinton
Average Family Size in Clinton is 1.9 People.
What is the Average Household Size in Clinton
Average Household Size in Clinton is 1.8 People.
How Large is the Labor Force in Clinton?
There are 32 People in the Labor Forcein in Clinton.
What is the Percentage of People in the Labor Force in Clinton?
56.1% of People are in the Labor Force in Clinton.