Chappell, NE Map & Demographics
Chappell Map
Chappell Overview
$31,973
PER CAPITA INCOME
$56,188
AVG FAMILY INCOME
$53,276
AVG HOUSEHOLD INCOME
32.0%
WAGE / INCOME GAP [ % ]
68.0¢/ $1
WAGE / INCOME GAP [ $ ]
0.43
INEQUALITY / GINI INDEX
889
TOTAL POPULATION
432
MALE POPULATION
457
FEMALE POPULATION
94.53
MALES / 100 FEMALES
105.79
FEMALES / 100 MALES
50.8
MEDIAN AGE
2.7
AVG FAMILY SIZE
2.1
AVG HOUSEHOLD SIZE
392
LABOR FORCE [ PEOPLE ]
52.3%
PERCENT IN LABOR FORCE
3.3%
UNEMPLOYMENT RATE
Chappell Zip Codes
Chappell Area Codes
Income in Chappell
Income Overview in Chappell
Per Capita Income in Chappell is $31,973, while median incomes of families and households are $56,188 and $53,276 respectively.
| Characteristic | Number | Measure |
| Per Capita Income | 889 | $31,973 |
| Median Family Income | 261 | $56,188 |
| Mean Family Income | 261 | $82,320 |
| Median Household Income | 412 | $53,276 |
| Mean Household Income | 412 | $69,190 |
| Income Deficit | 261 | $0 |
| Wage / Income Gap (%) | 889 | 31.96% |
| Wage / Income Gap ($) | 889 | 68.04¢ per $1 |
| Gini / Inequality Index | 889 | 0.43 |
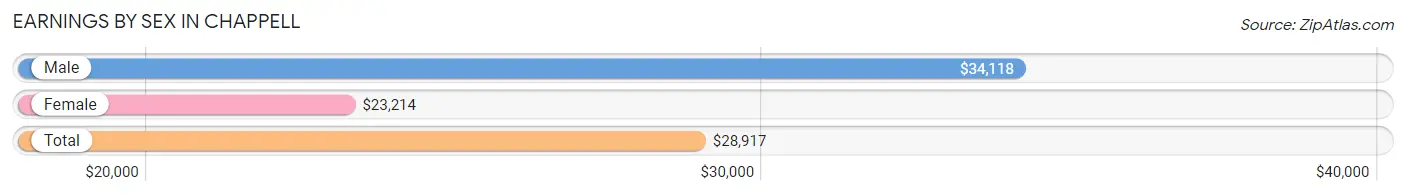
Earnings by Sex in Chappell
Average Earnings in Chappell are $28,917, $34,118 for men and $23,214 for women, a difference of 32.0%.
| Sex | Number | Average Earnings |
| Male | 242 (50.2%) | $34,118 |
| Female | 240 (49.8%) | $23,214 |
| Total | 482 (100.0%) | $28,917 |
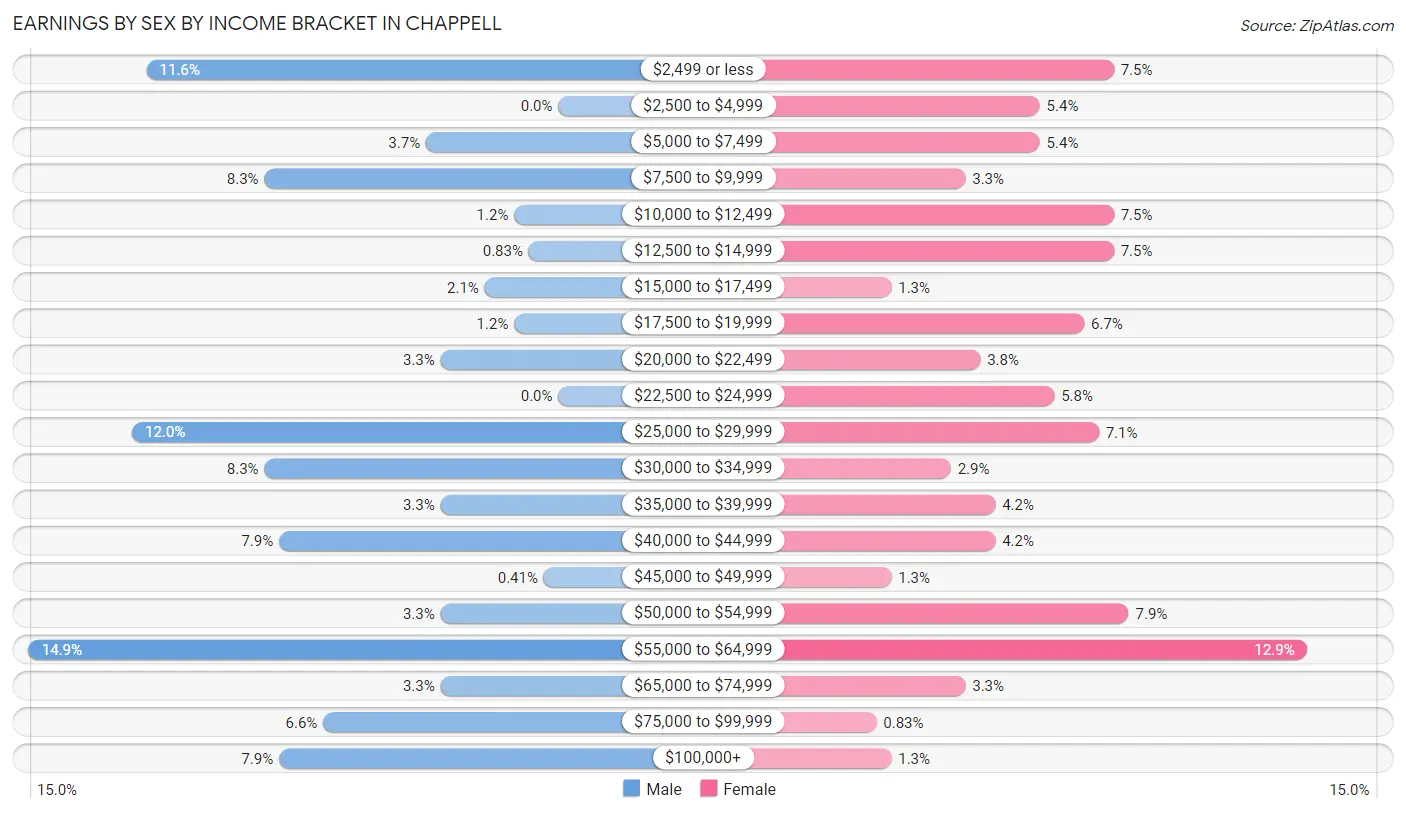
Earnings by Sex by Income Bracket in Chappell
The most common earnings brackets in Chappell are $55,000 to $64,999 for men (36 | 14.9%) and $55,000 to $64,999 for women (31 | 12.9%).
| Income | Male | Female |
| $2,499 or less | 28 (11.6%) | 18 (7.5%) |
| $2,500 to $4,999 | 0 (0.0%) | 13 (5.4%) |
| $5,000 to $7,499 | 9 (3.7%) | 13 (5.4%) |
| $7,500 to $9,999 | 20 (8.3%) | 8 (3.3%) |
| $10,000 to $12,499 | 3 (1.2%) | 18 (7.5%) |
| $12,500 to $14,999 | 2 (0.8%) | 18 (7.5%) |
| $15,000 to $17,499 | 5 (2.1%) | 3 (1.3%) |
| $17,500 to $19,999 | 3 (1.2%) | 16 (6.7%) |
| $20,000 to $22,499 | 8 (3.3%) | 9 (3.7%) |
| $22,500 to $24,999 | 0 (0.0%) | 14 (5.8%) |
| $25,000 to $29,999 | 29 (12.0%) | 17 (7.1%) |
| $30,000 to $34,999 | 20 (8.3%) | 7 (2.9%) |
| $35,000 to $39,999 | 8 (3.3%) | 10 (4.2%) |
| $40,000 to $44,999 | 19 (7.9%) | 10 (4.2%) |
| $45,000 to $49,999 | 1 (0.4%) | 3 (1.3%) |
| $50,000 to $54,999 | 8 (3.3%) | 19 (7.9%) |
| $55,000 to $64,999 | 36 (14.9%) | 31 (12.9%) |
| $65,000 to $74,999 | 8 (3.3%) | 8 (3.3%) |
| $75,000 to $99,999 | 16 (6.6%) | 2 (0.8%) |
| $100,000+ | 19 (7.9%) | 3 (1.3%) |
| Total | 242 (100.0%) | 240 (100.0%) |
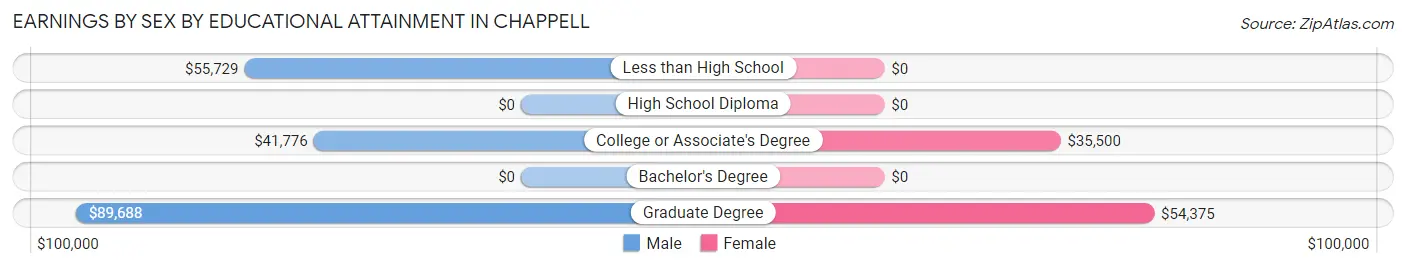
Earnings by Sex by Educational Attainment in Chappell
Average earnings in Chappell are $37,344 for men and $29,107 for women, a difference of 22.1%. Men with an educational attainment of graduate degree enjoy the highest average annual earnings of $89,688, while those with college or associate's degree education earn the least with $41,776. Women with an educational attainment of graduate degree earn the most with the average annual earnings of $54,375, while those with college or associate's degree education have the smallest earnings of $35,500.
| Educational Attainment | Male Income | Female Income |
| Less than High School | $55,729 | $0 |
| High School Diploma | - | - |
| College or Associate's Degree | $41,776 | $35,500 |
| Bachelor's Degree | - | - |
| Graduate Degree | $89,688 | $54,375 |
| Total | $37,344 | $29,107 |
Family Income in Chappell
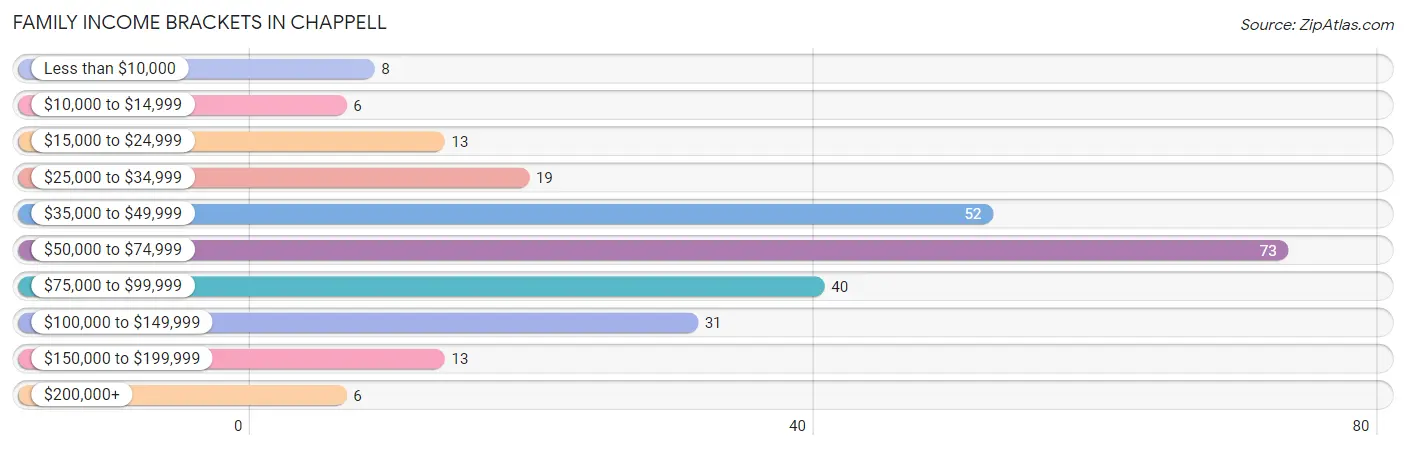
Family Income Brackets in Chappell
According to the Chappell family income data, there are 73 families falling into the $50,000 to $74,999 income range, which is the most common income bracket and makes up 28.0% of all families. Conversely, the $10,000 to $14,999 income bracket is the least frequent group with only 6 families (2.3%) belonging to this category.
| Income Bracket | # Families | % Families |
| Less than $10,000 | 8 | 3.1% |
| $10,000 to $14,999 | 6 | 2.3% |
| $15,000 to $24,999 | 13 | 5.0% |
| $25,000 to $34,999 | 19 | 7.3% |
| $35,000 to $49,999 | 52 | 19.9% |
| $50,000 to $74,999 | 73 | 28.0% |
| $75,000 to $99,999 | 40 | 15.3% |
| $100,000 to $149,999 | 31 | 11.9% |
| $150,000 to $199,999 | 13 | 5.0% |
| $200,000+ | 6 | 2.3% |
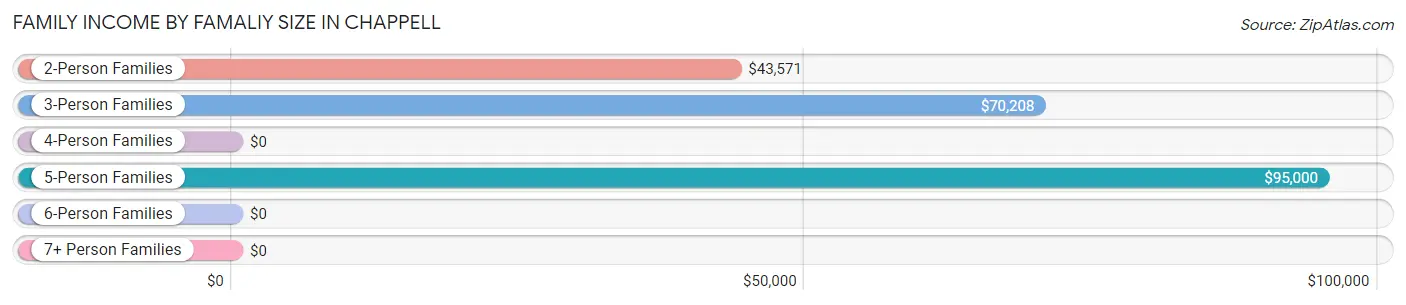
Family Income by Famaliy Size in Chappell
5-person families (14 | 5.4%) account for the highest median family income in Chappell with $95,000 per family, while 3-person families (75 | 28.7%) have the highest median income of $23,403 per family member.
| Income Bracket | # Families | Median Income |
| 2-Person Families | 150 (57.5%) | $43,571 |
| 3-Person Families | 75 (28.7%) | $70,208 |
| 4-Person Families | 11 (4.2%) | $0 |
| 5-Person Families | 14 (5.4%) | $95,000 |
| 6-Person Families | 11 (4.2%) | $0 |
| 7+ Person Families | 0 (0.0%) | $0 |
| Total | 261 (100.0%) | $56,188 |
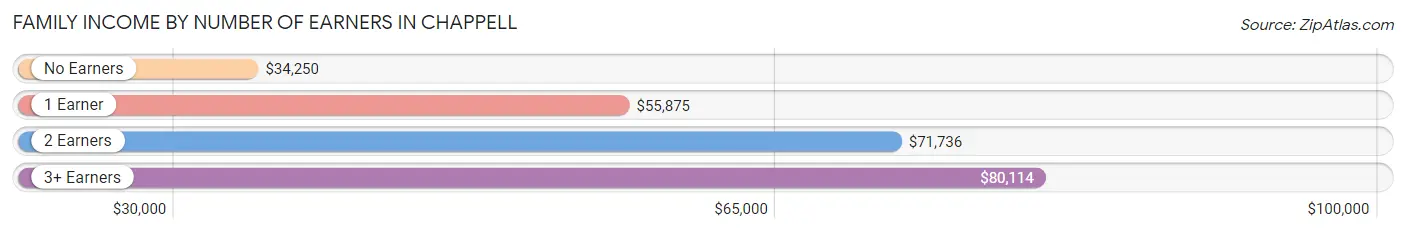
Family Income by Number of Earners in Chappell
The median family income in Chappell is $56,188, with families comprising 3+ earners (27) having the highest median family income of $80,114, while families with no earners (57) have the lowest median family income of $34,250, accounting for 10.3% and 21.8% of families, respectively.
| Number of Earners | # Families | Median Income |
| No Earners | 57 (21.8%) | $34,250 |
| 1 Earner | 76 (29.1%) | $55,875 |
| 2 Earners | 101 (38.7%) | $71,736 |
| 3+ Earners | 27 (10.3%) | $80,114 |
| Total | 261 (100.0%) | $56,188 |
Household Income in Chappell
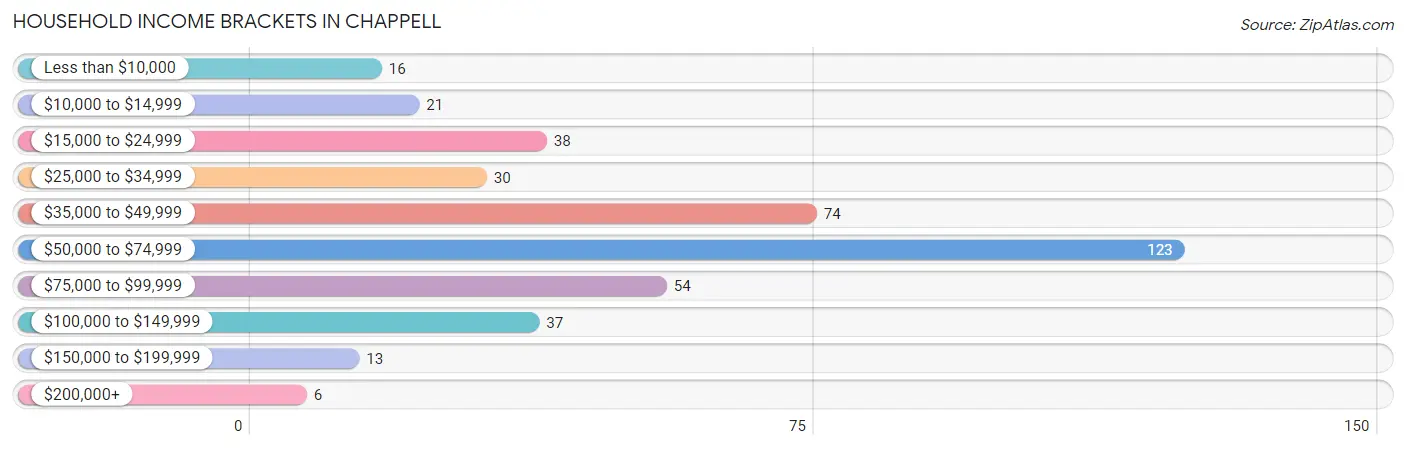
Household Income Brackets in Chappell
With 123 households falling in the category, the $50,000 to $74,999 income range is the most frequent in Chappell, accounting for 29.8% of all households. In contrast, only 6 households (1.5%) fall into the $200,000+ income bracket, making it the least populous group.
| Income Bracket | # Households | % Households |
| Less than $10,000 | 16 | 3.9% |
| $10,000 to $14,999 | 21 | 5.1% |
| $15,000 to $24,999 | 38 | 9.2% |
| $25,000 to $34,999 | 30 | 7.3% |
| $35,000 to $49,999 | 74 | 18.0% |
| $50,000 to $74,999 | 123 | 29.9% |
| $75,000 to $99,999 | 54 | 13.1% |
| $100,000 to $149,999 | 37 | 9.0% |
| $150,000 to $199,999 | 13 | 3.2% |
| $200,000+ | 6 | 1.5% |
Household Income by Householder Age in Chappell
The median household income in Chappell is $53,276, with the highest median household income of $68,000 found in the 25 to 44 years age bracket for the primary householder. A total of 78 households (18.9%) fall into this category. Meanwhile, the 15 to 24 years age bracket for the primary householder has the lowest median household income of $0, with 21 households (5.1%) in this group.
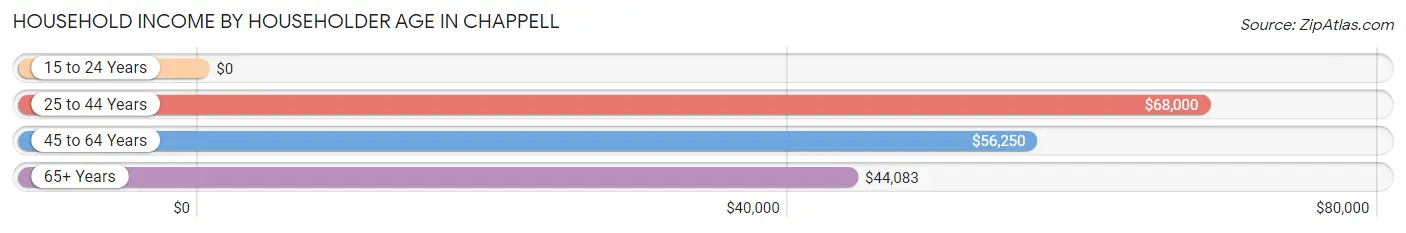
| Income Bracket | # Households | Median Income |
| 15 to 24 Years | 21 (5.1%) | $0 |
| 25 to 44 Years | 78 (18.9%) | $68,000 |
| 45 to 64 Years | 152 (36.9%) | $56,250 |
| 65+ Years | 161 (39.1%) | $44,083 |
| Total | 412 (100.0%) | $53,276 |
Poverty in Chappell
Income Below Poverty by Sex and Age in Chappell
With 6.7% poverty level for males and 6.9% for females among the residents of Chappell, 65 to 74 year old males and 75 year old and over females are the most vulnerable to poverty, with 18 males (19.0%) and 8 females (22.2%) in their respective age groups living below the poverty level.
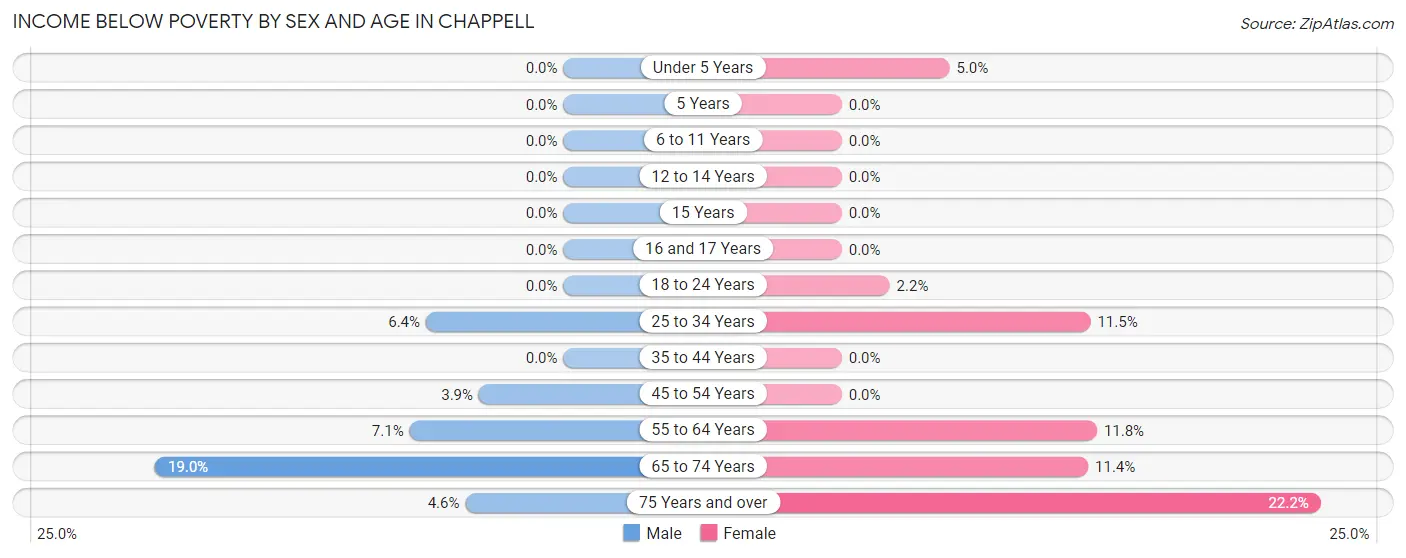
| Age Bracket | Male | Female |
| Under 5 Years | 0 (0.0%) | 2 (5.0%) |
| 5 Years | 0 (0.0%) | 0 (0.0%) |
| 6 to 11 Years | 0 (0.0%) | 0 (0.0%) |
| 12 to 14 Years | 0 (0.0%) | 0 (0.0%) |
| 15 Years | 0 (0.0%) | 0 (0.0%) |
| 16 and 17 Years | 0 (0.0%) | 0 (0.0%) |
| 18 to 24 Years | 0 (0.0%) | 1 (2.2%) |
| 25 to 34 Years | 3 (6.4%) | 3 (11.5%) |
| 35 to 44 Years | 0 (0.0%) | 0 (0.0%) |
| 45 to 54 Years | 2 (3.9%) | 0 (0.0%) |
| 55 to 64 Years | 4 (7.1%) | 9 (11.8%) |
| 65 to 74 Years | 18 (19.0%) | 8 (11.4%) |
| 75 Years and over | 2 (4.5%) | 8 (22.2%) |
| Total | 29 (6.7%) | 31 (6.9%) |
Income Above Poverty by Sex and Age in Chappell
According to the poverty statistics in Chappell, males aged under 5 years and females aged 5 years are the age groups that are most secure financially, with 100.0% of males and 100.0% of females in these age groups living above the poverty line.
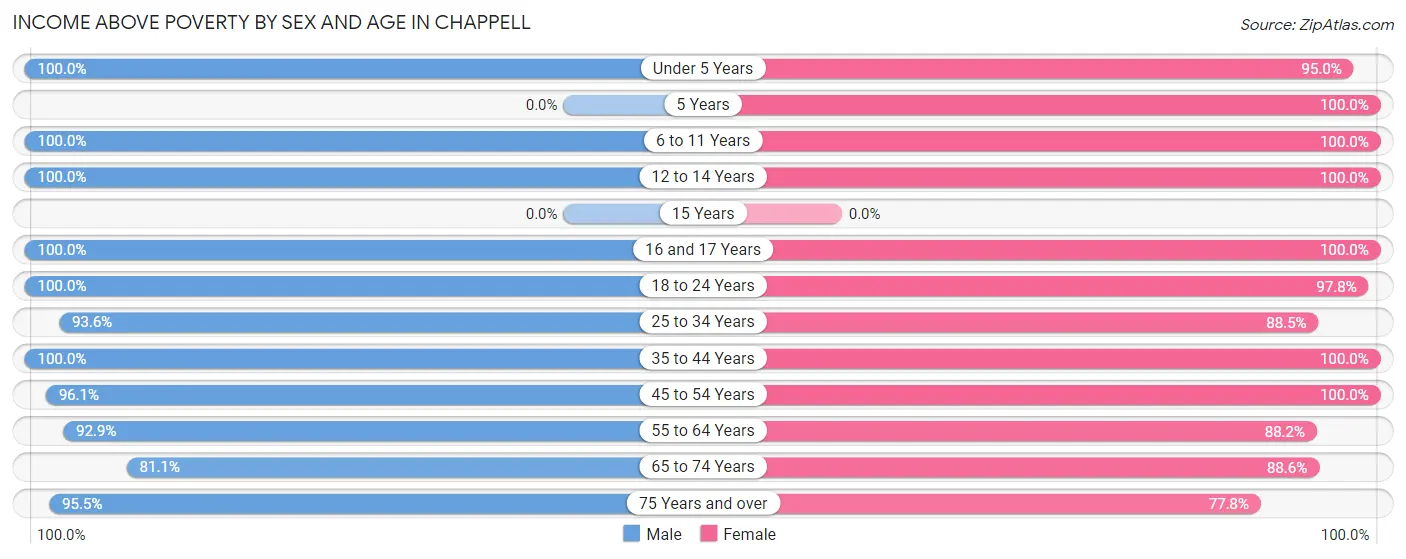
| Age Bracket | Male | Female |
| Under 5 Years | 27 (100.0%) | 38 (95.0%) |
| 5 Years | 0 (0.0%) | 2 (100.0%) |
| 6 to 11 Years | 25 (100.0%) | 11 (100.0%) |
| 12 to 14 Years | 11 (100.0%) | 24 (100.0%) |
| 15 Years | 0 (0.0%) | 0 (0.0%) |
| 16 and 17 Years | 3 (100.0%) | 5 (100.0%) |
| 18 to 24 Years | 24 (100.0%) | 44 (97.8%) |
| 25 to 34 Years | 44 (93.6%) | 23 (88.5%) |
| 35 to 44 Years | 49 (100.0%) | 52 (100.0%) |
| 45 to 54 Years | 49 (96.1%) | 63 (100.0%) |
| 55 to 64 Years | 52 (92.9%) | 67 (88.2%) |
| 65 to 74 Years | 77 (81.0%) | 62 (88.6%) |
| 75 Years and over | 42 (95.5%) | 28 (77.8%) |
| Total | 403 (93.3%) | 419 (93.1%) |
Income Below Poverty Among Married-Couple Families in Chappell
The poverty statistics for married-couple families in Chappell show that 5.4% or 11 of the total 203 families live below the poverty line. Families with 1 or 2 children have the highest poverty rate of 6.0%, comprising of 3 families. On the other hand, families with 3 or 4 children have the lowest poverty rate of 0.0%, which includes 0 families.
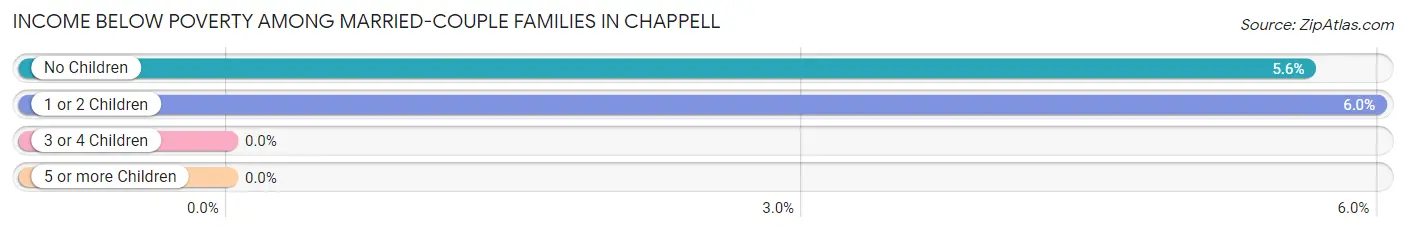
| Children | Above Poverty | Below Poverty |
| No Children | 134 (94.4%) | 8 (5.6%) |
| 1 or 2 Children | 47 (94.0%) | 3 (6.0%) |
| 3 or 4 Children | 11 (100.0%) | 0 (0.0%) |
| 5 or more Children | 0 (0.0%) | 0 (0.0%) |
| Total | 192 (94.6%) | 11 (5.4%) |
Income Below Poverty Among Single-Parent Households in Chappell
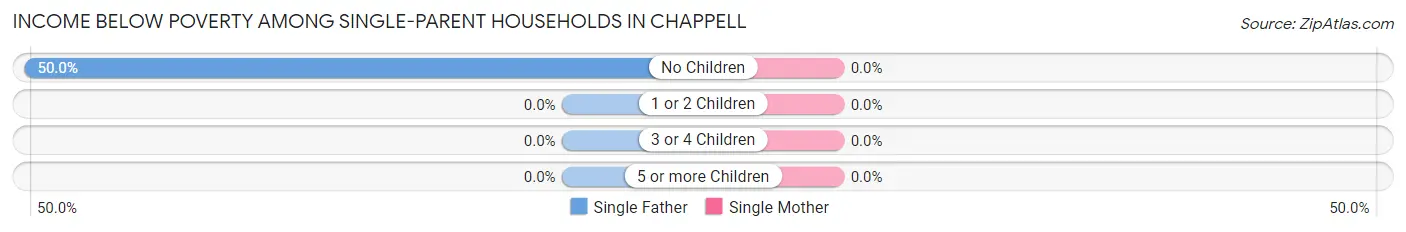
| Children | Single Father | Single Mother |
| No Children | 6 (50.0%) | 0 (0.0%) |
| 1 or 2 Children | 0 (0.0%) | 0 (0.0%) |
| 3 or 4 Children | 0 (0.0%) | 0 (0.0%) |
| 5 or more Children | 0 (0.0%) | 0 (0.0%) |
| Total | 6 (24.0%) | 0 (0.0%) |
Income Below Poverty Among Married-Couple vs Single-Parent Households in Chappell
The poverty data for Chappell shows that 11 of the married-couple family households (5.4%) and 6 of the single-parent households (10.3%) are living below the poverty level. Within the married-couple family households, those with 1 or 2 children have the highest poverty rate, with 3 households (6.0%) falling below the poverty line. Among the single-parent households, those with no children have the highest poverty rate, with 6 household (24.0%) living below poverty.
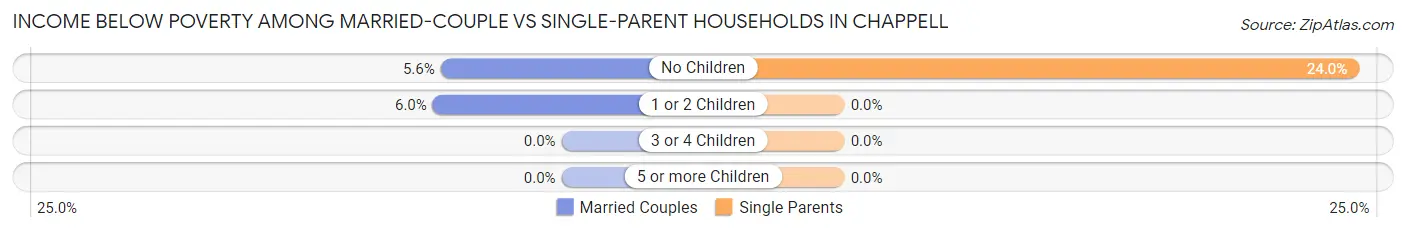
| Children | Married-Couple Families | Single-Parent Households |
| No Children | 8 (5.6%) | 6 (24.0%) |
| 1 or 2 Children | 3 (6.0%) | 0 (0.0%) |
| 3 or 4 Children | 0 (0.0%) | 0 (0.0%) |
| 5 or more Children | 0 (0.0%) | 0 (0.0%) |
| Total | 11 (5.4%) | 6 (10.3%) |
Race in Chappell
The most populous races in Chappell are White / Caucasian (787 | 88.5%), Hispanic or Latino (122 | 13.7%), and Two or more Races (72 | 8.1%).
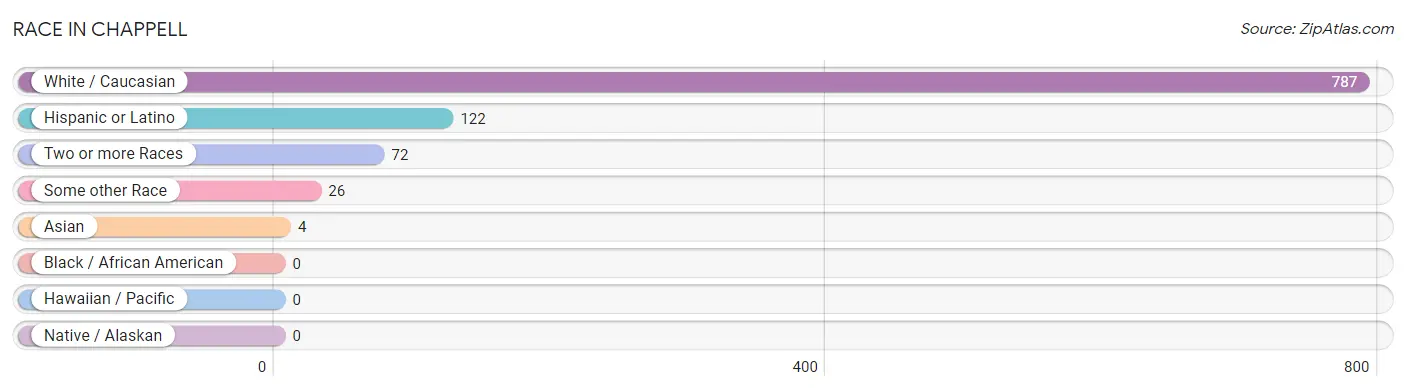
| Race | # Population | % Population |
| Asian | 4 | 0.4% |
| Black / African American | 0 | 0.0% |
| Hawaiian / Pacific | 0 | 0.0% |
| Hispanic or Latino | 122 | 13.7% |
| Native / Alaskan | 0 | 0.0% |
| White / Caucasian | 787 | 88.5% |
| Two or more Races | 72 | 8.1% |
| Some other Race | 26 | 2.9% |
| Total | 889 | 100.0% |
Ancestry in Chappell
The most populous ancestries reported in Chappell are German (361 | 40.6%), Mexican (121 | 13.6%), Irish (92 | 10.3%), English (83 | 9.3%), and Polish (36 | 4.1%), together accounting for 78.0% of all Chappell residents.
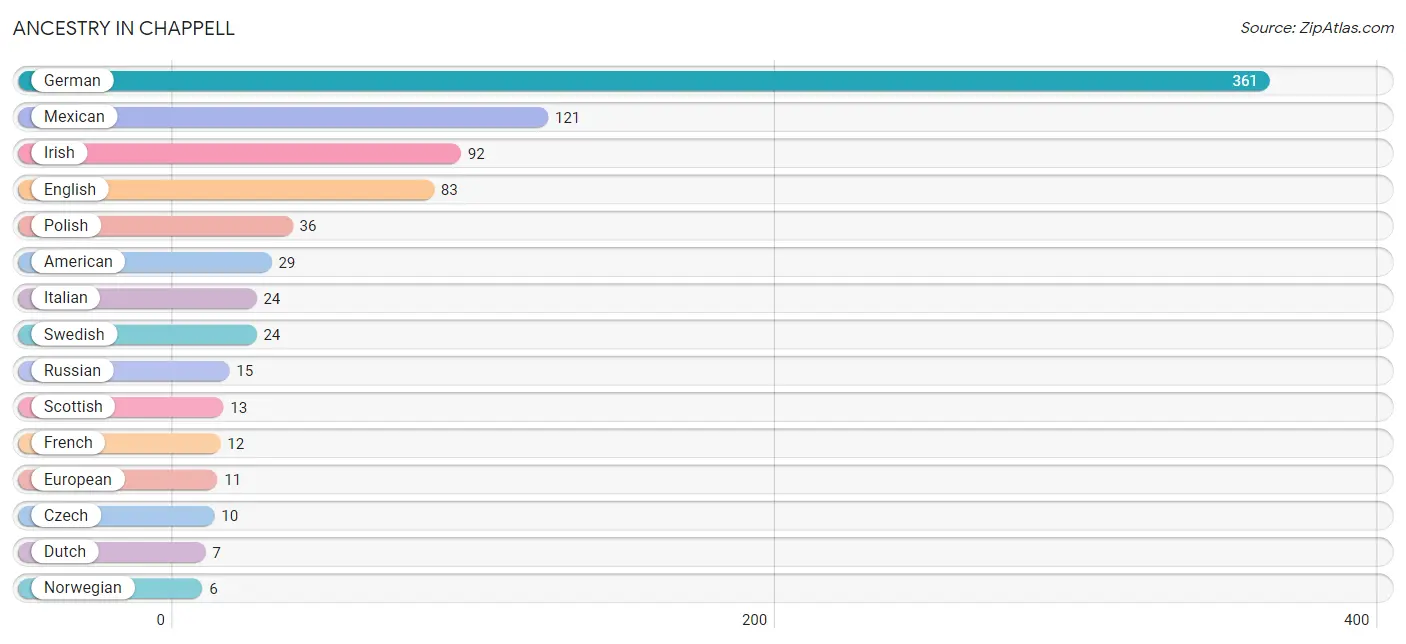
| Ancestry | # Population | % Population |
| American | 29 | 3.3% |
| Austrian | 2 | 0.2% |
| Bhutanese | 4 | 0.4% |
| British | 4 | 0.4% |
| Czech | 10 | 1.1% |
| Danish | 4 | 0.4% |
| Dutch | 7 | 0.8% |
| English | 83 | 9.3% |
| European | 11 | 1.2% |
| French | 12 | 1.3% |
| German | 361 | 40.6% |
| Irish | 92 | 10.3% |
| Italian | 24 | 2.7% |
| Mexican | 121 | 13.6% |
| Norwegian | 6 | 0.7% |
| Polish | 36 | 4.1% |
| Potawatomi | 2 | 0.2% |
| Russian | 15 | 1.7% |
| Scandinavian | 3 | 0.3% |
| Scotch-Irish | 6 | 0.7% |
| Scottish | 13 | 1.5% |
| Sioux | 3 | 0.3% |
| Swedish | 24 | 2.7% |
| Welsh | 3 | 0.3% | View All 24 Rows |
Immigrants in Chappell
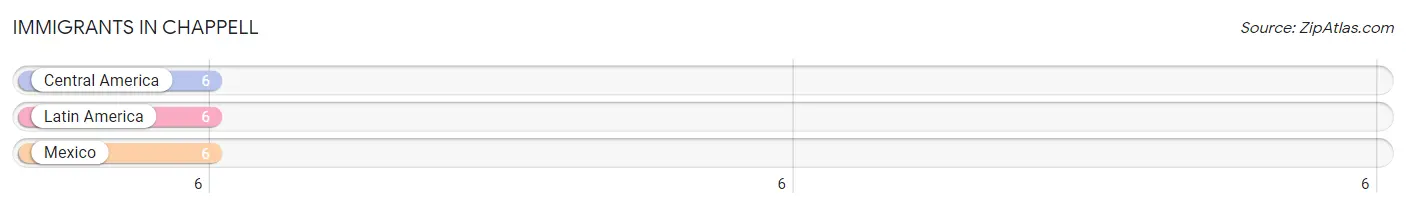
The most numerous immigrant groups reported in Chappell came from Central America (6 | 0.7%), Latin America (6 | 0.7%), and Mexico (6 | 0.7%), together accounting for 2.0% of all Chappell residents.
| Immigration Origin | # Population | % Population |
| Central America | 6 | 0.7% |
| Latin America | 6 | 0.7% |
| Mexico | 6 | 0.7% | View All 3 Rows |
Sex and Age in Chappell
Sex and Age in Chappell
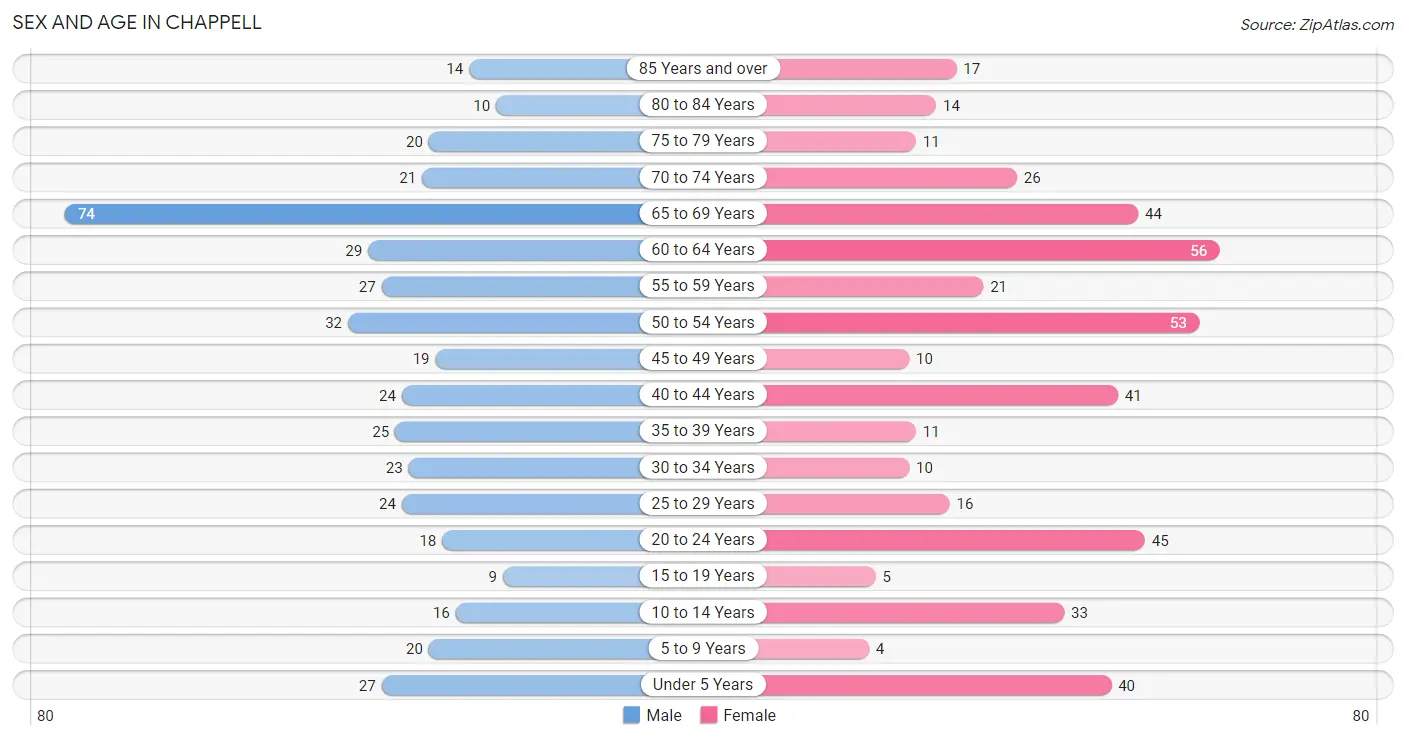
The most populous age groups in Chappell are 65 to 69 Years (74 | 17.1%) for men and 60 to 64 Years (56 | 12.2%) for women.
| Age Bracket | Male | Female |
| Under 5 Years | 27 (6.2%) | 40 (8.7%) |
| 5 to 9 Years | 20 (4.6%) | 4 (0.9%) |
| 10 to 14 Years | 16 (3.7%) | 33 (7.2%) |
| 15 to 19 Years | 9 (2.1%) | 5 (1.1%) |
| 20 to 24 Years | 18 (4.2%) | 45 (9.9%) |
| 25 to 29 Years | 24 (5.6%) | 16 (3.5%) |
| 30 to 34 Years | 23 (5.3%) | 10 (2.2%) |
| 35 to 39 Years | 25 (5.8%) | 11 (2.4%) |
| 40 to 44 Years | 24 (5.6%) | 41 (9.0%) |
| 45 to 49 Years | 19 (4.4%) | 10 (2.2%) |
| 50 to 54 Years | 32 (7.4%) | 53 (11.6%) |
| 55 to 59 Years | 27 (6.2%) | 21 (4.6%) |
| 60 to 64 Years | 29 (6.7%) | 56 (12.2%) |
| 65 to 69 Years | 74 (17.1%) | 44 (9.6%) |
| 70 to 74 Years | 21 (4.9%) | 26 (5.7%) |
| 75 to 79 Years | 20 (4.6%) | 11 (2.4%) |
| 80 to 84 Years | 10 (2.3%) | 14 (3.1%) |
| 85 Years and over | 14 (3.2%) | 17 (3.7%) |
| Total | 432 (100.0%) | 457 (100.0%) |
Families and Households in Chappell
Median Family Size in Chappell
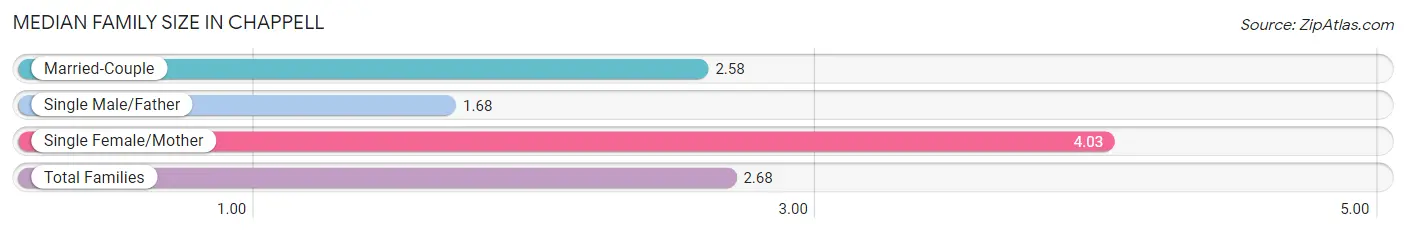
The median family size in Chappell is 2.68 persons per family, with single female/mother families (33 | 12.6%) accounting for the largest median family size of 4.03 persons per family. On the other hand, single male/father families (25 | 9.6%) represent the smallest median family size with 1.68 persons per family.
| Family Type | # Families | Family Size |
| Married-Couple | 203 (77.8%) | 2.58 |
| Single Male/Father | 25 (9.6%) | 1.68 |
| Single Female/Mother | 33 (12.6%) | 4.03 |
| Total Families | 261 (100.0%) | 2.68 |
Median Household Size in Chappell
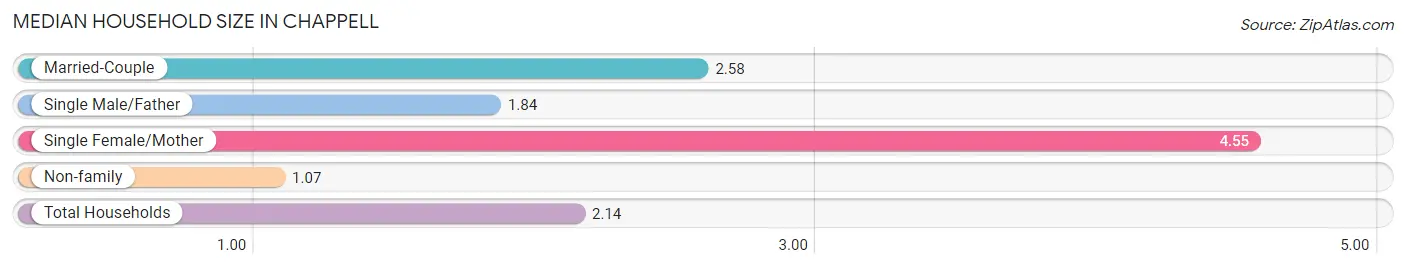
The median household size in Chappell is 2.14 persons per household, with single female/mother households (33 | 8.0%) accounting for the largest median household size of 4.55 persons per household. non-family households (151 | 36.6%) represent the smallest median household size with 1.07 persons per household.
| Household Type | # Households | Household Size |
| Married-Couple | 203 (49.3%) | 2.58 |
| Single Male/Father | 25 (6.1%) | 1.84 |
| Single Female/Mother | 33 (8.0%) | 4.55 |
| Non-family | 151 (36.6%) | 1.07 |
| Total Households | 412 (100.0%) | 2.14 |
Household Size by Marriage Status in Chappell
Out of a total of 412 households in Chappell, 261 (63.3%) are family households, while 151 (36.6%) are nonfamily households. The most numerous type of family households are 2-person households, comprising 136, and the most common type of nonfamily households are 1-person households, comprising 141.
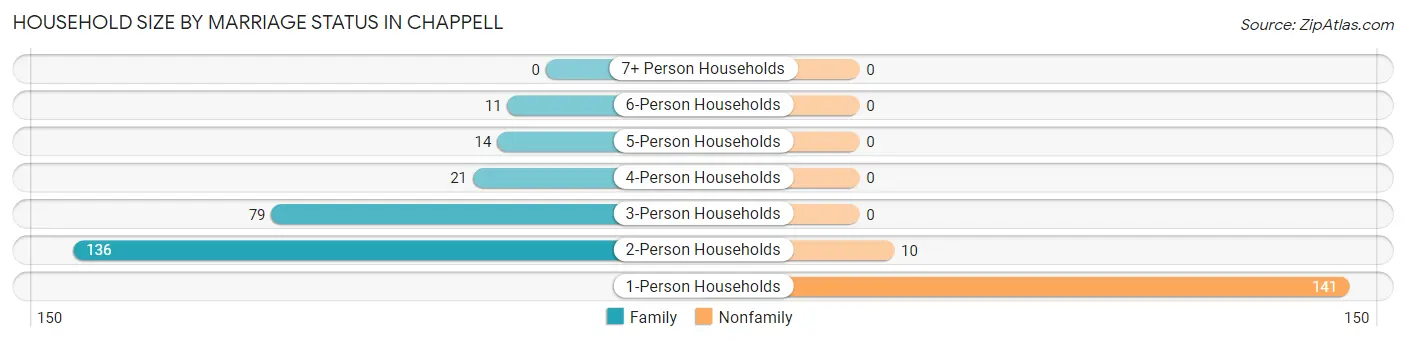
| Household Size | Family Households | Nonfamily Households |
| 1-Person Households | - | 141 (34.2%) |
| 2-Person Households | 136 (33.0%) | 10 (2.4%) |
| 3-Person Households | 79 (19.2%) | 0 (0.0%) |
| 4-Person Households | 21 (5.1%) | 0 (0.0%) |
| 5-Person Households | 14 (3.4%) | 0 (0.0%) |
| 6-Person Households | 11 (2.7%) | 0 (0.0%) |
| 7+ Person Households | 0 (0.0%) | 0 (0.0%) |
| Total | 261 (63.3%) | 151 (36.6%) |
Female Fertility in Chappell
Fertility by Age in Chappell
Average fertility rate in Chappell is 190.0 births per 1,000 women. Women in the age bracket of 20 to 34 years have the highest fertility rate with 423.0 births per 1,000 women. Women in the age bracket of 20 to 34 years acount for 93.8% of all women with births.
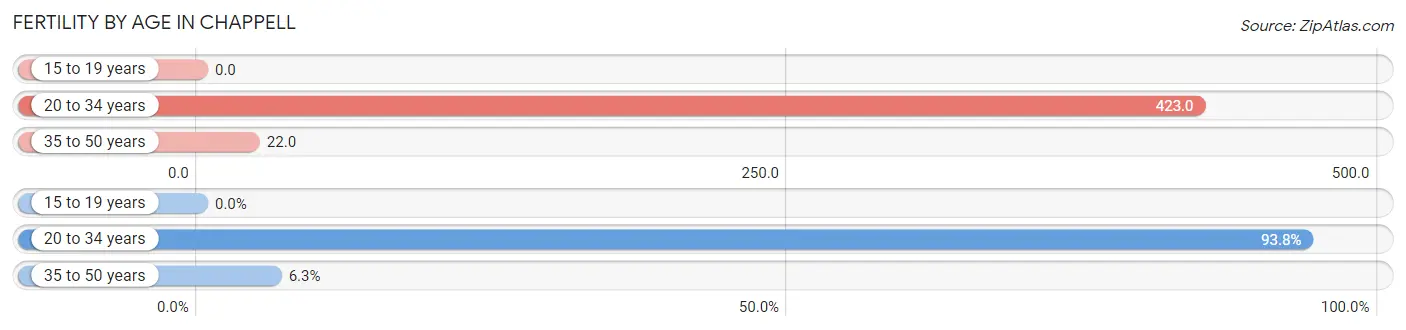
| Age Bracket | Women with Births | Births / 1,000 Women |
| 15 to 19 years | 0 (0.0%) | 0.0 |
| 20 to 34 years | 30 (93.8%) | 423.0 |
| 35 to 50 years | 2 (6.2%) | 22.0 |
| Total | 32 (100.0%) | 190.0 |
Fertility by Age by Marriage Status in Chappell
90.6% of women with births (32) in Chappell are married. The highest percentage of unmarried women with births falls into 35 to 50 years age bracket with 100.0% of them unmarried at the time of birth, while the lowest percentage of unmarried women with births belong to 20 to 34 years age bracket with 3.3% of them unmarried.
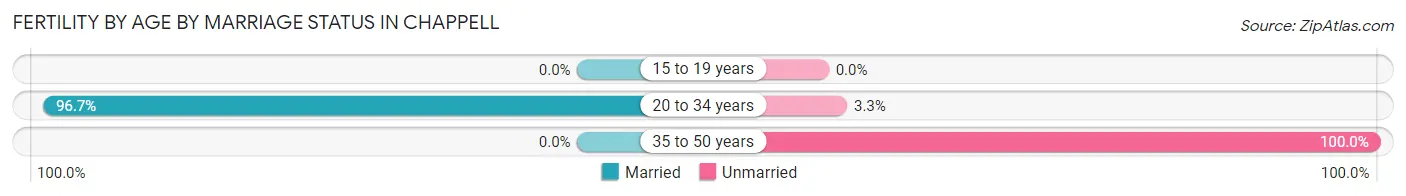
| Age Bracket | Married | Unmarried |
| 15 to 19 years | 0 (0.0%) | 0 (0.0%) |
| 20 to 34 years | 29 (96.7%) | 1 (3.3%) |
| 35 to 50 years | 0 (0.0%) | 2 (100.0%) |
| Total | 29 (90.6%) | 3 (9.4%) |
Fertility by Education in Chappell
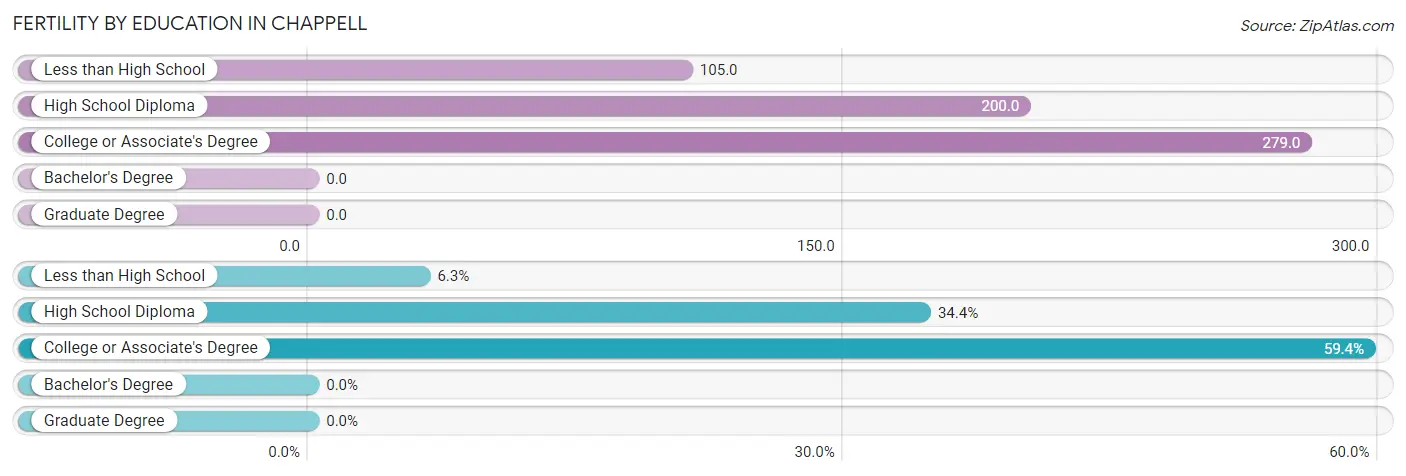
| Educational Attainment | Women with Births | Births / 1,000 Women |
| Less than High School | 2 (6.2%) | 105.0 |
| High School Diploma | 11 (34.4%) | 200.0 |
| College or Associate's Degree | 19 (59.4%) | 279.0 |
| Bachelor's Degree | 0 (0.0%) | 0.0 |
| Graduate Degree | 0 (0.0%) | 0.0 |
| Total | 32 (100.0%) | 190.0 |
Fertility by Education by Marriage Status in Chappell
9.4% of women with births in Chappell are unmarried. Women with the educational attainment of high school diploma are most likely to be married with 100.0% of them married at childbirth, while women with the educational attainment of less than high school are least likely to be married with 100.0% of them unmarried at childbirth.
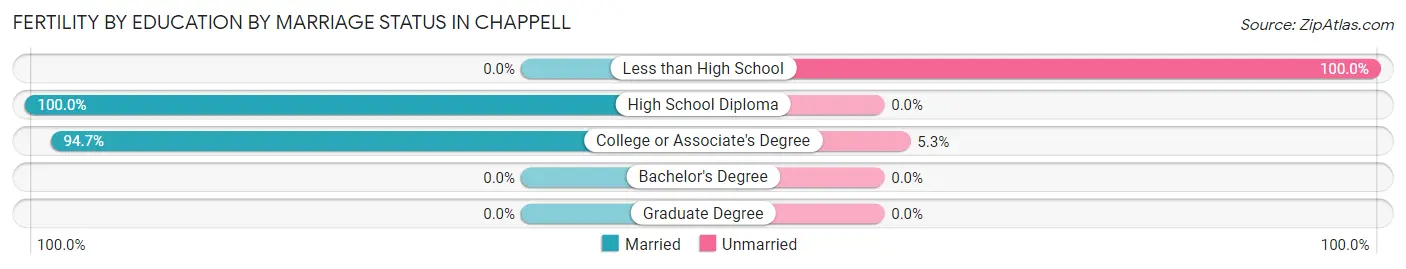
| Educational Attainment | Married | Unmarried |
| Less than High School | 0 (0.0%) | 2 (100.0%) |
| High School Diploma | 11 (100.0%) | 0 (0.0%) |
| College or Associate's Degree | 18 (94.7%) | 1 (5.3%) |
| Bachelor's Degree | 0 (0.0%) | 0 (0.0%) |
| Graduate Degree | 0 (0.0%) | 0 (0.0%) |
| Total | 29 (90.6%) | 3 (9.4%) |
Employment Characteristics in Chappell
Employment by Class of Employer in Chappell
Among the 374 employed individuals in Chappell, private company employees (224 | 59.9%), local government employees (53 | 14.2%), and self-employed (not incorporated) (46 | 12.3%) make up the most common classes of employment.
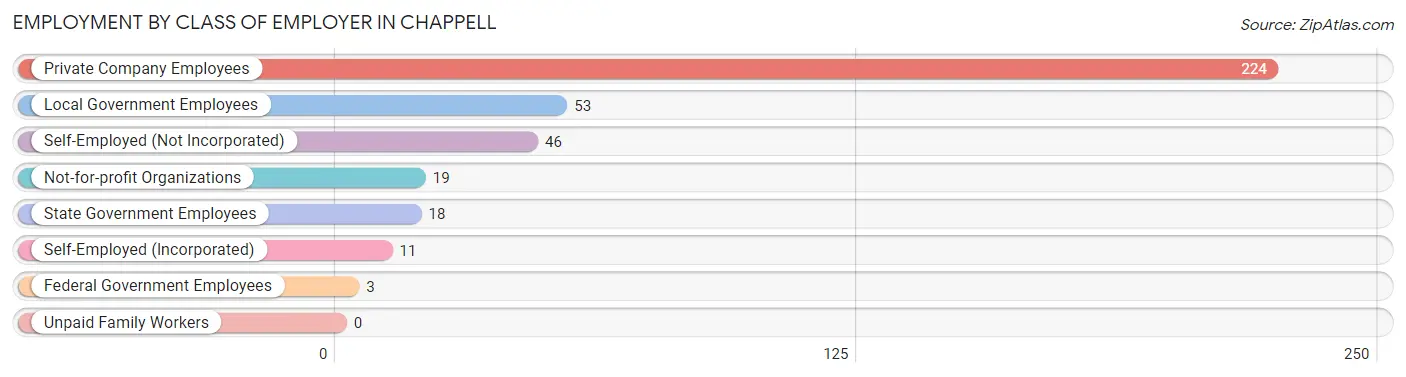
| Employer Class | # Employees | % Employees |
| Private Company Employees | 224 | 59.9% |
| Self-Employed (Incorporated) | 11 | 2.9% |
| Self-Employed (Not Incorporated) | 46 | 12.3% |
| Not-for-profit Organizations | 19 | 5.1% |
| Local Government Employees | 53 | 14.2% |
| State Government Employees | 18 | 4.8% |
| Federal Government Employees | 3 | 0.8% |
| Unpaid Family Workers | 0 | 0.0% |
| Total | 374 | 100.0% |
Employment Status by Age in Chappell
According to the labor force statistics for Chappell, out of the total population over 16 years of age (749), 52.3% or 392 individuals are in the labor force, with 3.3% or 13 of them unemployed. The age group with the highest labor force participation rate is 16 to 19 years, with 100.0% or 14 individuals in the labor force. Within the labor force, the 35 to 44 years age range has the highest percentage of unemployed individuals, with 13.6% or 9 of them being unemployed.
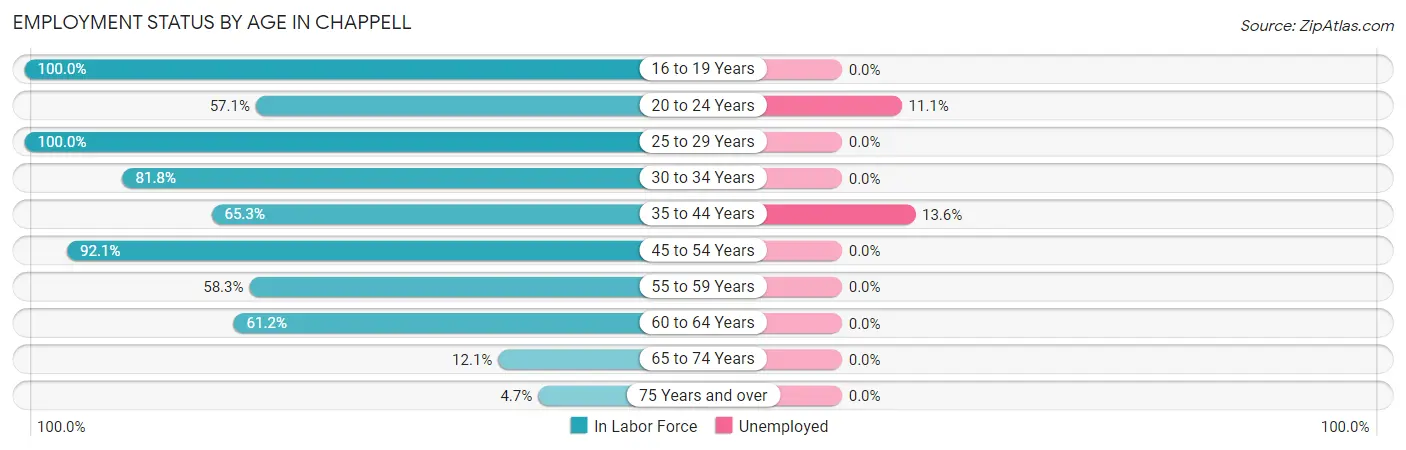
| Age Bracket | In Labor Force | Unemployed |
| 16 to 19 Years | 14 (100.0%) | 0 (0.0%) |
| 20 to 24 Years | 36 (57.1%) | 4 (11.1%) |
| 25 to 29 Years | 40 (100.0%) | 0 (0.0%) |
| 30 to 34 Years | 27 (81.8%) | 0 (0.0%) |
| 35 to 44 Years | 66 (65.3%) | 9 (13.6%) |
| 45 to 54 Years | 105 (92.1%) | 0 (0.0%) |
| 55 to 59 Years | 28 (58.3%) | 0 (0.0%) |
| 60 to 64 Years | 52 (61.2%) | 0 (0.0%) |
| 65 to 74 Years | 20 (12.1%) | 0 (0.0%) |
| 75 Years and over | 4 (4.7%) | 0 (0.0%) |
| Total | 392 (52.3%) | 13 (3.3%) |
Employment Status by Educational Attainment in Chappell
According to labor force statistics for Chappell, 75.5% of individuals (318) out of the total population between 25 and 64 years of age (421) are in the labor force, with 2.8% or 9 of them being unemployed. The group with the highest labor force participation rate are those with the educational attainment of bachelor's degree or higher, with 95.2% or 59 individuals in the labor force. Within the labor force, individuals with less than high school education have the highest percentage of unemployment, with 24.3% or 9 of them being unemployed.
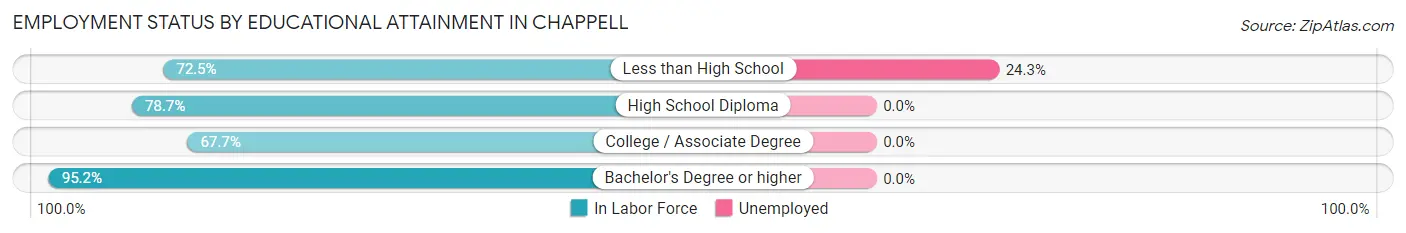
| Educational Attainment | In Labor Force | Unemployed |
| Less than High School | 37 (72.5%) | 12 (24.3%) |
| High School Diploma | 96 (78.7%) | 0 (0.0%) |
| College / Associate Degree | 126 (67.7%) | 0 (0.0%) |
| Bachelor's Degree or higher | 59 (95.2%) | 0 (0.0%) |
| Total | 318 (75.5%) | 12 (2.8%) |
Employment Occupations by Sex in Chappell
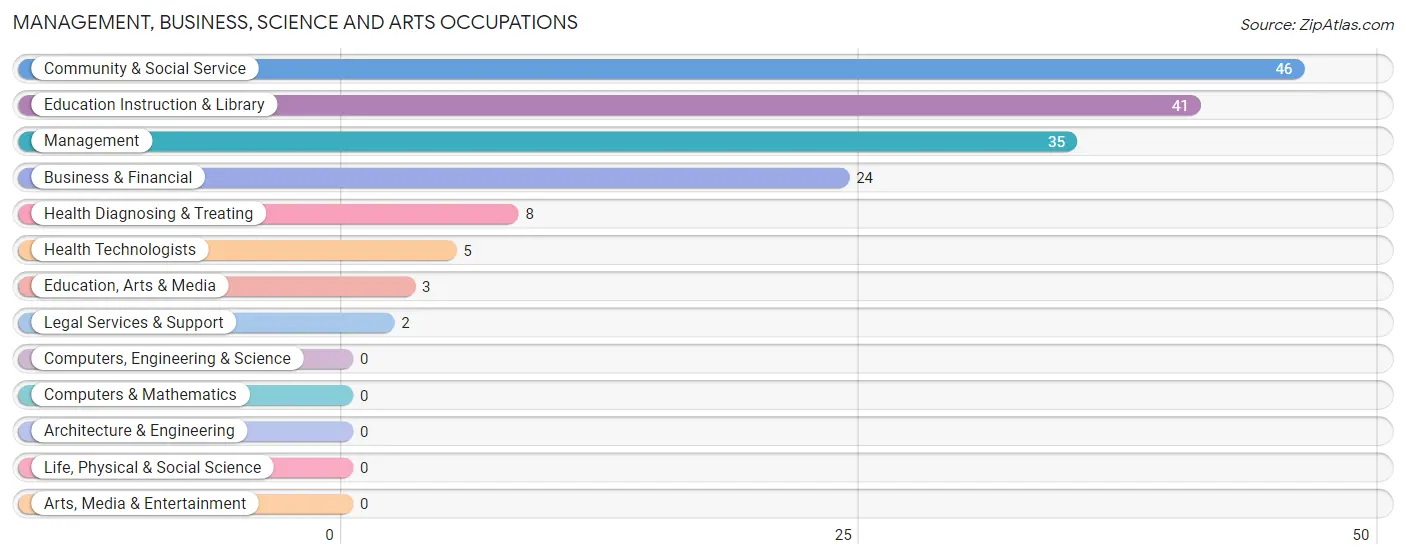
Management, Business, Science and Arts Occupations
The most common Management, Business, Science and Arts occupations in Chappell are Community & Social Service (46 | 12.1%), Education Instruction & Library (41 | 10.8%), Management (35 | 9.2%), Business & Financial (24 | 6.3%), and Health Diagnosing & Treating (8 | 2.1%).
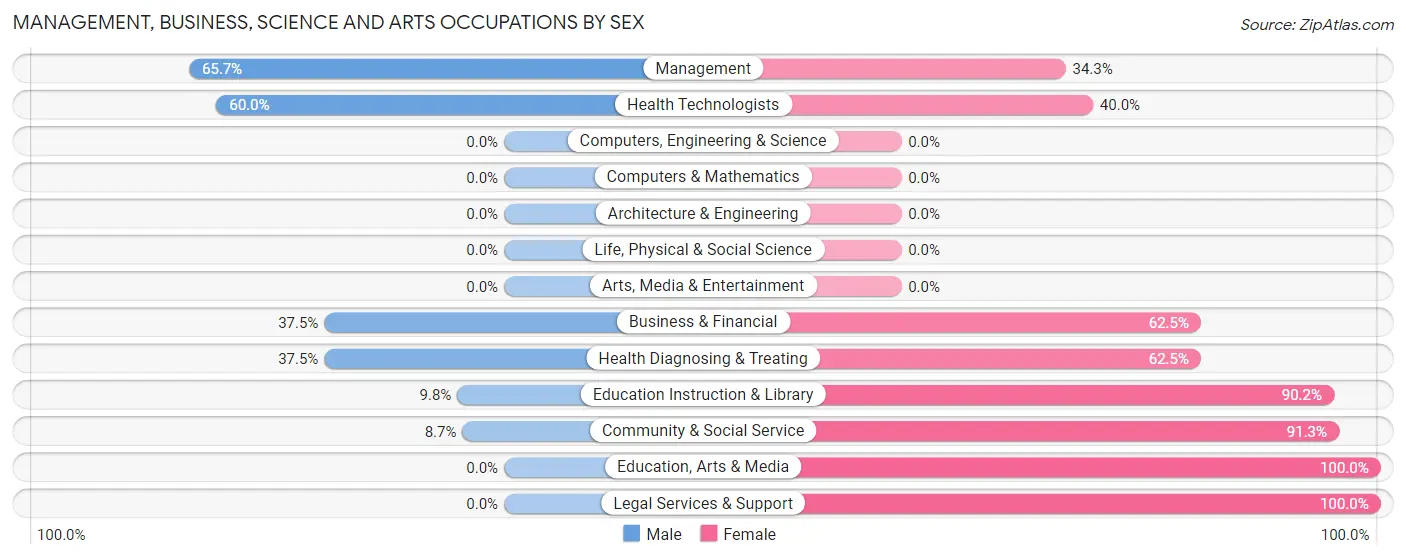
Management, Business, Science and Arts Occupations by Sex
Within the Management, Business, Science and Arts occupations in Chappell, the most male-oriented occupations are Management (65.7%), Health Technologists (60.0%), and Business & Financial (37.5%), while the most female-oriented occupations are Education, Arts & Media (100.0%), Legal Services & Support (100.0%), and Community & Social Service (91.3%).
| Occupation | Male | Female |
| Management | 23 (65.7%) | 12 (34.3%) |
| Business & Financial | 9 (37.5%) | 15 (62.5%) |
| Computers, Engineering & Science | 0 (0.0%) | 0 (0.0%) |
| Computers & Mathematics | 0 (0.0%) | 0 (0.0%) |
| Architecture & Engineering | 0 (0.0%) | 0 (0.0%) |
| Life, Physical & Social Science | 0 (0.0%) | 0 (0.0%) |
| Community & Social Service | 4 (8.7%) | 42 (91.3%) |
| Education, Arts & Media | 0 (0.0%) | 3 (100.0%) |
| Legal Services & Support | 0 (0.0%) | 2 (100.0%) |
| Education Instruction & Library | 4 (9.8%) | 37 (90.2%) |
| Arts, Media & Entertainment | 0 (0.0%) | 0 (0.0%) |
| Health Diagnosing & Treating | 3 (37.5%) | 5 (62.5%) |
| Health Technologists | 3 (60.0%) | 2 (40.0%) |
| Total (Category) | 39 (34.5%) | 74 (65.5%) |
| Total (Overall) | 197 (52.0%) | 182 (48.0%) |
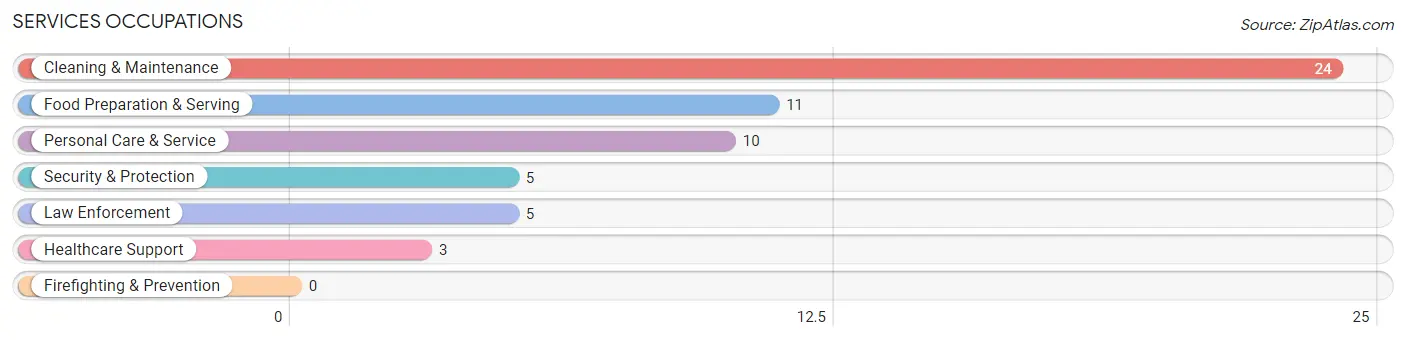
Services Occupations
The most common Services occupations in Chappell are Cleaning & Maintenance (24 | 6.3%), Food Preparation & Serving (11 | 2.9%), Personal Care & Service (10 | 2.6%), Security & Protection (5 | 1.3%), and Law Enforcement (5 | 1.3%).
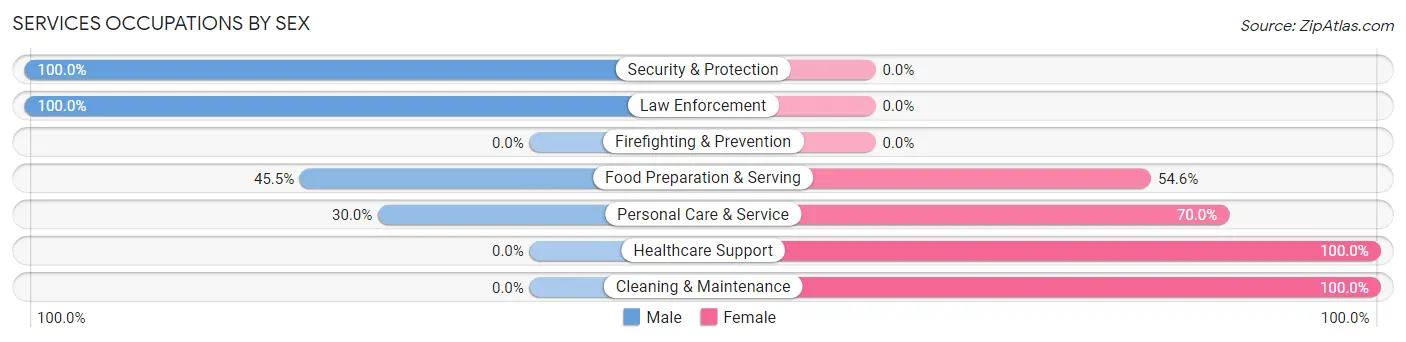
Services Occupations by Sex
Within the Services occupations in Chappell, the most male-oriented occupations are Security & Protection (100.0%), Law Enforcement (100.0%), and Food Preparation & Serving (45.5%), while the most female-oriented occupations are Healthcare Support (100.0%), Cleaning & Maintenance (100.0%), and Personal Care & Service (70.0%).
| Occupation | Male | Female |
| Healthcare Support | 0 (0.0%) | 3 (100.0%) |
| Security & Protection | 5 (100.0%) | 0 (0.0%) |
| Firefighting & Prevention | 0 (0.0%) | 0 (0.0%) |
| Law Enforcement | 5 (100.0%) | 0 (0.0%) |
| Food Preparation & Serving | 5 (45.5%) | 6 (54.5%) |
| Cleaning & Maintenance | 0 (0.0%) | 24 (100.0%) |
| Personal Care & Service | 3 (30.0%) | 7 (70.0%) |
| Total (Category) | 13 (24.5%) | 40 (75.5%) |
| Total (Overall) | 197 (52.0%) | 182 (48.0%) |
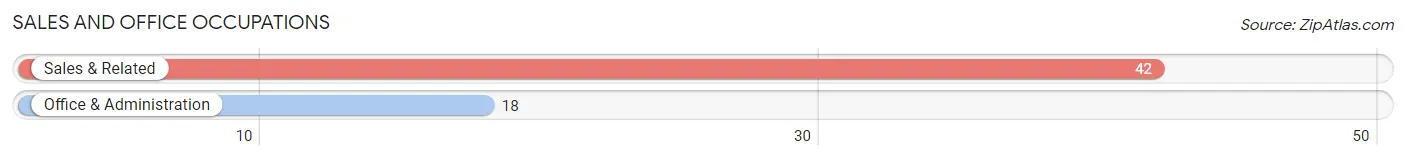
Sales and Office Occupations
The most common Sales and Office occupations in Chappell are Sales & Related (42 | 11.1%), and Office & Administration (18 | 4.8%).
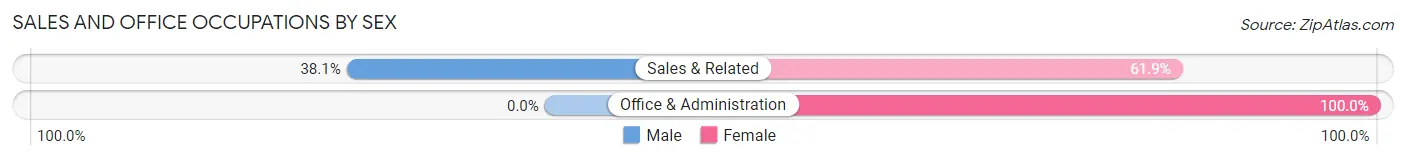
Sales and Office Occupations by Sex
| Occupation | Male | Female |
| Sales & Related | 16 (38.1%) | 26 (61.9%) |
| Office & Administration | 0 (0.0%) | 18 (100.0%) |
| Total (Category) | 16 (26.7%) | 44 (73.3%) |
| Total (Overall) | 197 (52.0%) | 182 (48.0%) |
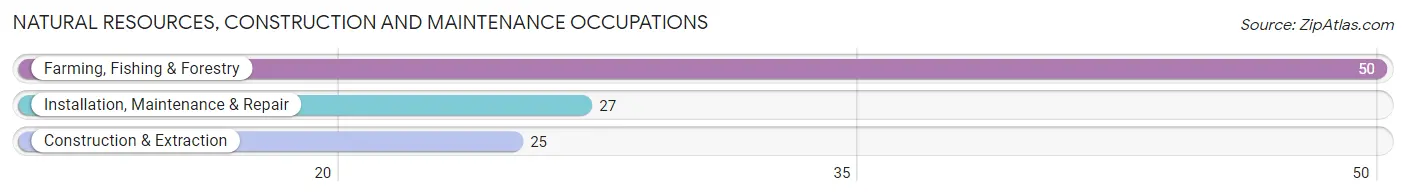
Natural Resources, Construction and Maintenance Occupations
The most common Natural Resources, Construction and Maintenance occupations in Chappell are Farming, Fishing & Forestry (50 | 13.2%), Installation, Maintenance & Repair (27 | 7.1%), and Construction & Extraction (25 | 6.6%).
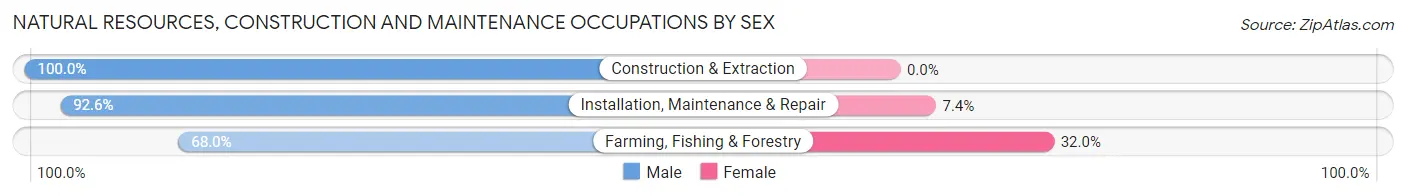
Natural Resources, Construction and Maintenance Occupations by Sex
| Occupation | Male | Female |
| Farming, Fishing & Forestry | 34 (68.0%) | 16 (32.0%) |
| Construction & Extraction | 25 (100.0%) | 0 (0.0%) |
| Installation, Maintenance & Repair | 25 (92.6%) | 2 (7.4%) |
| Total (Category) | 84 (82.4%) | 18 (17.6%) |
| Total (Overall) | 197 (52.0%) | 182 (48.0%) |
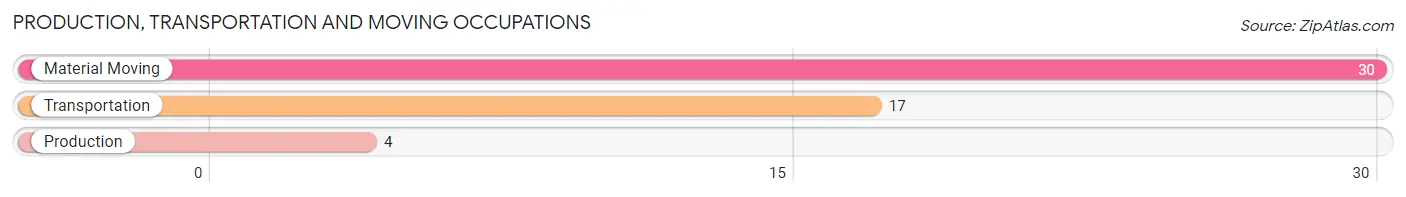
Production, Transportation and Moving Occupations
The most common Production, Transportation and Moving occupations in Chappell are Material Moving (30 | 7.9%), Transportation (17 | 4.5%), and Production (4 | 1.1%).
Production, Transportation and Moving Occupations by Sex
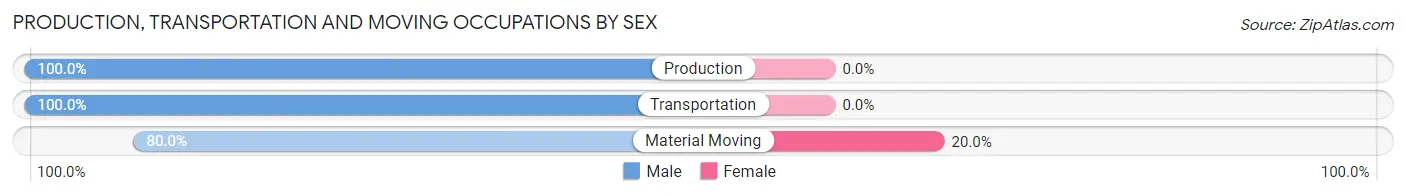
| Occupation | Male | Female |
| Production | 4 (100.0%) | 0 (0.0%) |
| Transportation | 17 (100.0%) | 0 (0.0%) |
| Material Moving | 24 (80.0%) | 6 (20.0%) |
| Total (Category) | 45 (88.2%) | 6 (11.8%) |
| Total (Overall) | 197 (52.0%) | 182 (48.0%) |
Employment Industries by Sex in Chappell
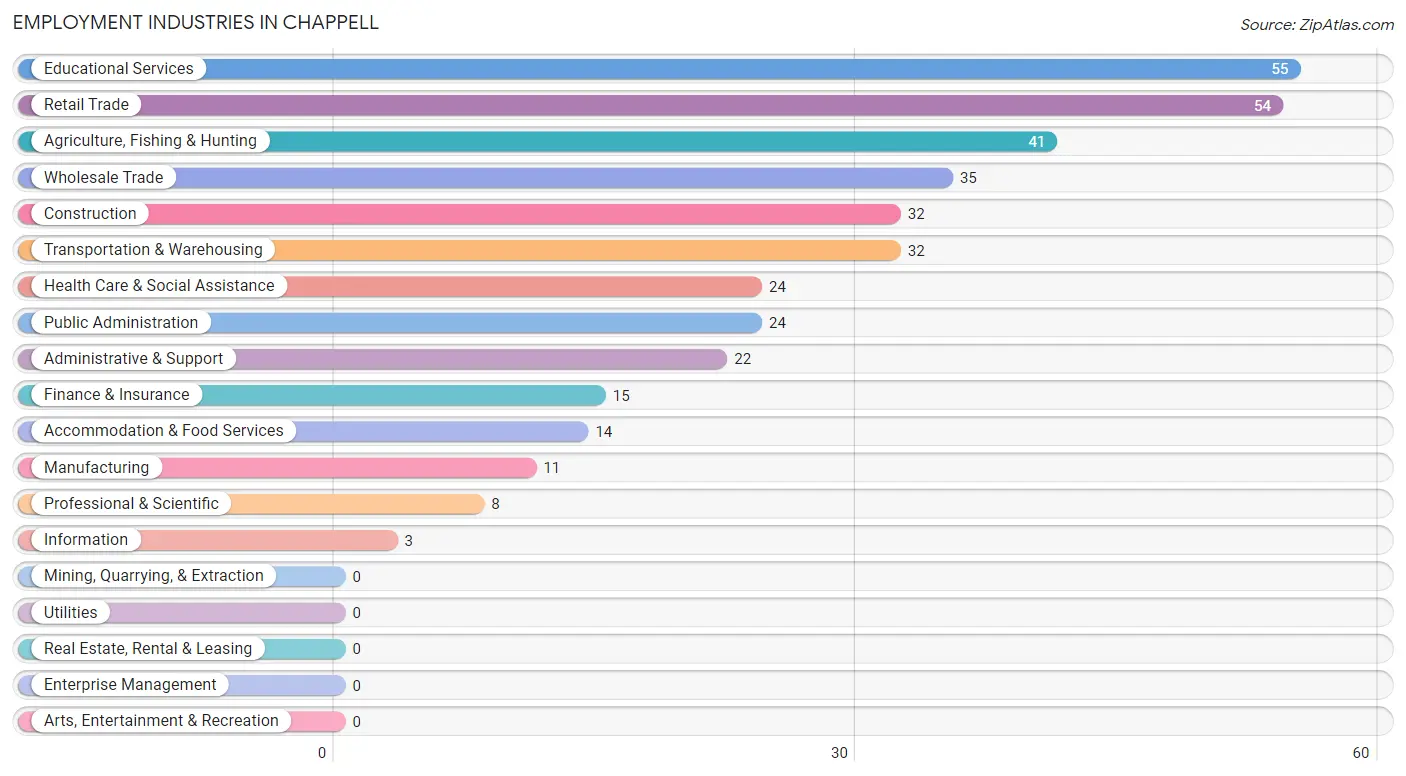
Employment Industries in Chappell
The major employment industries in Chappell include Educational Services (55 | 14.5%), Retail Trade (54 | 14.2%), Agriculture, Fishing & Hunting (41 | 10.8%), Wholesale Trade (35 | 9.2%), and Construction (32 | 8.4%).
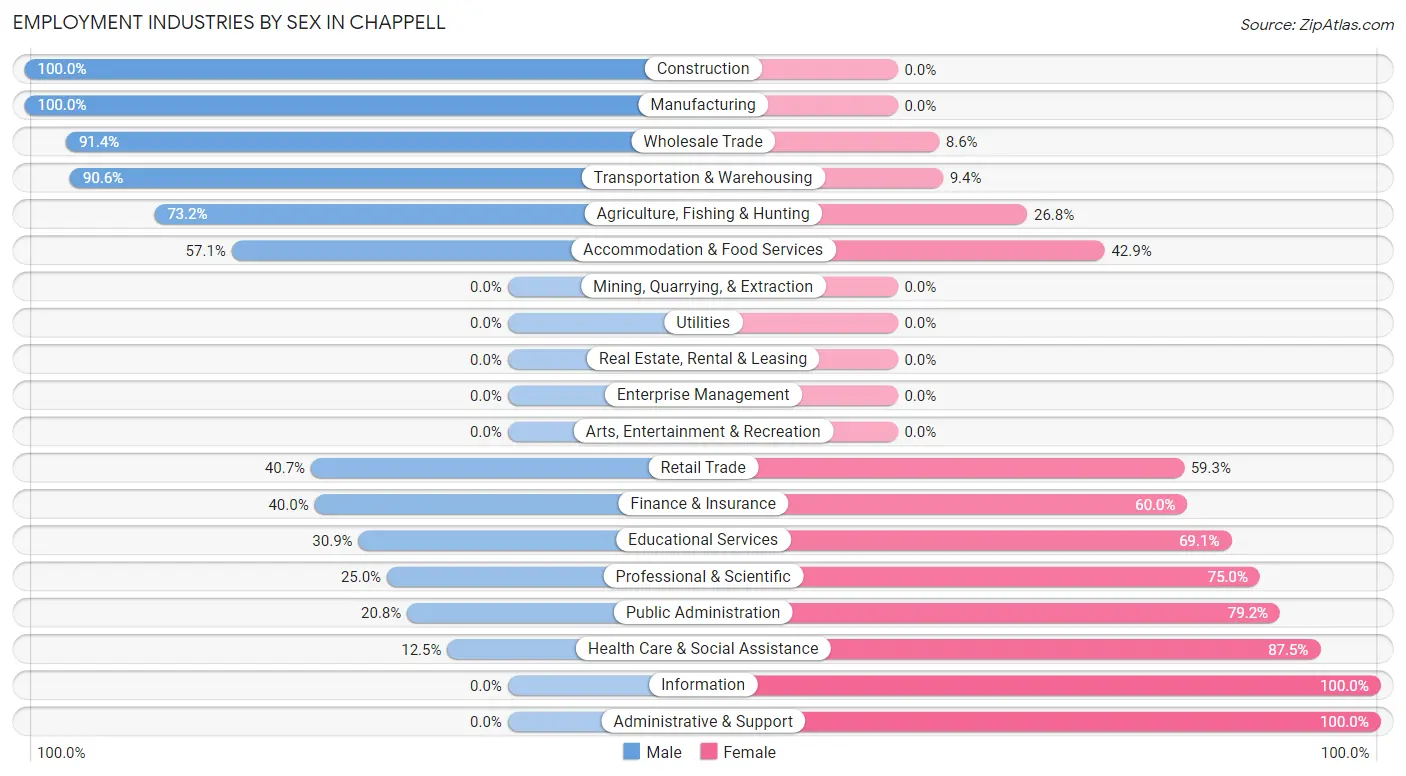
Employment Industries by Sex in Chappell
The Chappell industries that see more men than women are Construction (100.0%), Manufacturing (100.0%), and Wholesale Trade (91.4%), whereas the industries that tend to have a higher number of women are Information (100.0%), Administrative & Support (100.0%), and Health Care & Social Assistance (87.5%).
| Industry | Male | Female |
| Agriculture, Fishing & Hunting | 30 (73.2%) | 11 (26.8%) |
| Mining, Quarrying, & Extraction | 0 (0.0%) | 0 (0.0%) |
| Construction | 32 (100.0%) | 0 (0.0%) |
| Manufacturing | 11 (100.0%) | 0 (0.0%) |
| Wholesale Trade | 32 (91.4%) | 3 (8.6%) |
| Retail Trade | 22 (40.7%) | 32 (59.3%) |
| Transportation & Warehousing | 29 (90.6%) | 3 (9.4%) |
| Utilities | 0 (0.0%) | 0 (0.0%) |
| Information | 0 (0.0%) | 3 (100.0%) |
| Finance & Insurance | 6 (40.0%) | 9 (60.0%) |
| Real Estate, Rental & Leasing | 0 (0.0%) | 0 (0.0%) |
| Professional & Scientific | 2 (25.0%) | 6 (75.0%) |
| Enterprise Management | 0 (0.0%) | 0 (0.0%) |
| Administrative & Support | 0 (0.0%) | 22 (100.0%) |
| Educational Services | 17 (30.9%) | 38 (69.1%) |
| Health Care & Social Assistance | 3 (12.5%) | 21 (87.5%) |
| Arts, Entertainment & Recreation | 0 (0.0%) | 0 (0.0%) |
| Accommodation & Food Services | 8 (57.1%) | 6 (42.9%) |
| Public Administration | 5 (20.8%) | 19 (79.2%) |
| Total | 197 (52.0%) | 182 (48.0%) |
Education in Chappell
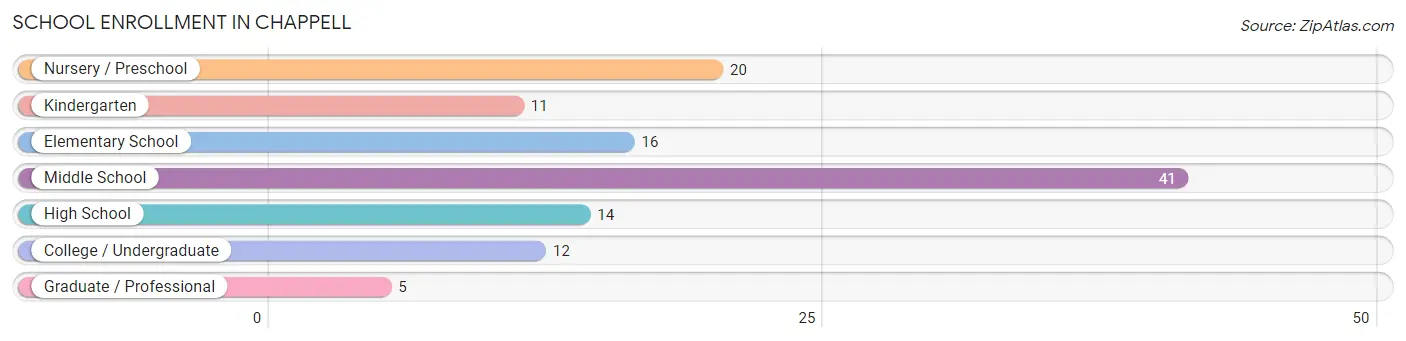
School Enrollment in Chappell
The most common levels of schooling among the 119 students in Chappell are middle school (41 | 34.4%), nursery / preschool (20 | 16.8%), and elementary school (16 | 13.5%).
| School Level | # Students | % Students |
| Nursery / Preschool | 20 | 16.8% |
| Kindergarten | 11 | 9.2% |
| Elementary School | 16 | 13.5% |
| Middle School | 41 | 34.4% |
| High School | 14 | 11.8% |
| College / Undergraduate | 12 | 10.1% |
| Graduate / Professional | 5 | 4.2% |
| Total | 119 | 100.0% |
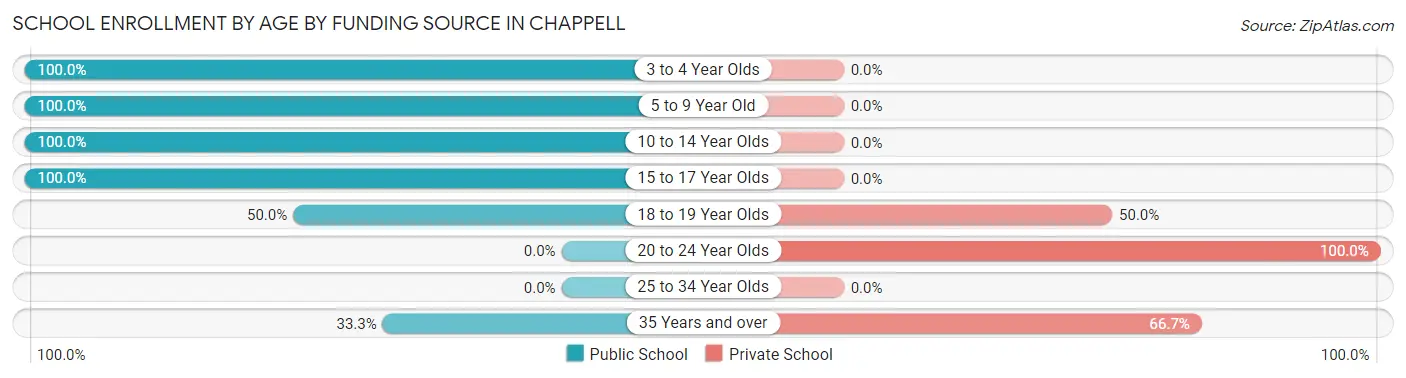
School Enrollment by Age by Funding Source in Chappell
Out of a total of 119 students who are enrolled in schools in Chappell, 15 (12.6%) attend a private institution, while the remaining 104 (87.4%) are enrolled in public schools. The age group of 20 to 24 year olds has the highest likelihood of being enrolled in private schools, with 8 (100.0% in the age bracket) enrolled. Conversely, the age group of 3 to 4 year olds has the lowest likelihood of being enrolled in a private school, with 18 (100.0% in the age bracket) attending a public institution.
| Age Bracket | Public School | Private School |
| 3 to 4 Year Olds | 18 (100.0%) | 0 (0.0%) |
| 5 to 9 Year Old | 24 (100.0%) | 0 (0.0%) |
| 10 to 14 Year Olds | 49 (100.0%) | 0 (0.0%) |
| 15 to 17 Year Olds | 8 (100.0%) | 0 (0.0%) |
| 18 to 19 Year Olds | 3 (50.0%) | 3 (50.0%) |
| 20 to 24 Year Olds | 0 (0.0%) | 8 (100.0%) |
| 25 to 34 Year Olds | 0 (0.0%) | 0 (0.0%) |
| 35 Years and over | 2 (33.3%) | 4 (66.7%) |
| Total | 104 (87.4%) | 15 (12.6%) |
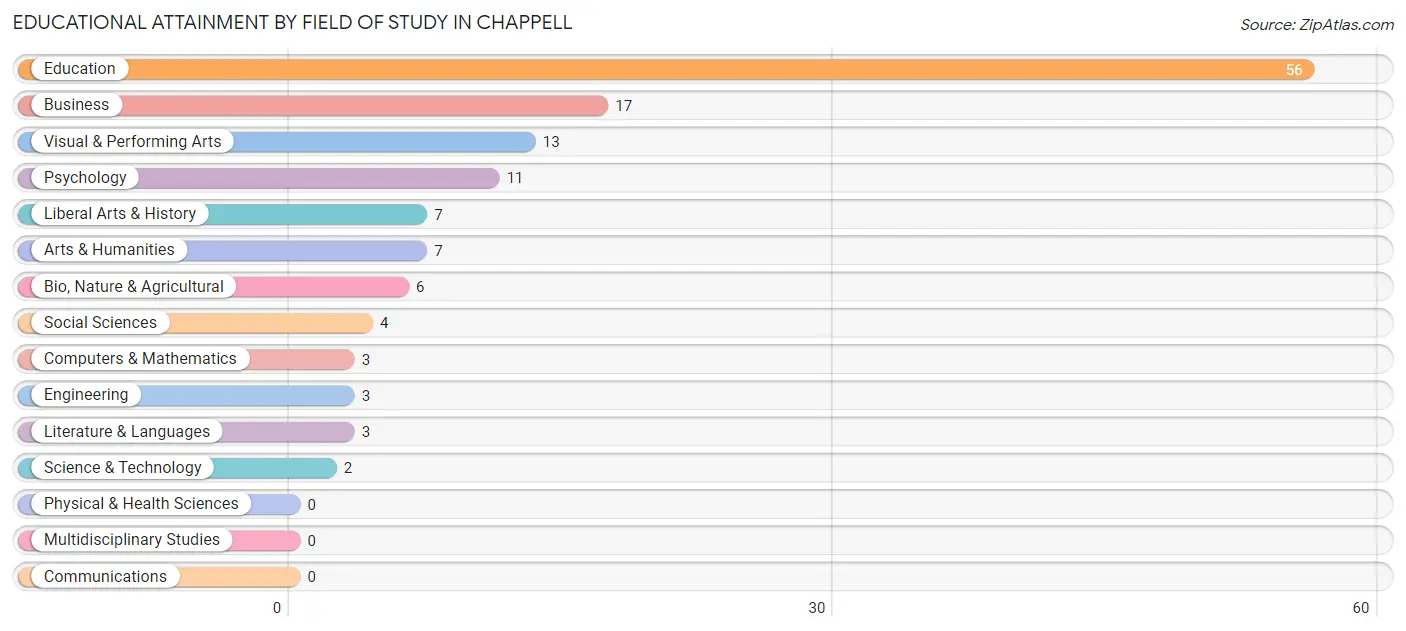
Educational Attainment by Field of Study in Chappell
Education (56 | 42.4%), business (17 | 12.9%), visual & performing arts (13 | 9.9%), psychology (11 | 8.3%), and liberal arts & history (7 | 5.3%) are the most common fields of study among 132 individuals in Chappell who have obtained a bachelor's degree or higher.
| Field of Study | # Graduates | % Graduates |
| Computers & Mathematics | 3 | 2.3% |
| Bio, Nature & Agricultural | 6 | 4.5% |
| Physical & Health Sciences | 0 | 0.0% |
| Psychology | 11 | 8.3% |
| Social Sciences | 4 | 3.0% |
| Engineering | 3 | 2.3% |
| Multidisciplinary Studies | 0 | 0.0% |
| Science & Technology | 2 | 1.5% |
| Business | 17 | 12.9% |
| Education | 56 | 42.4% |
| Literature & Languages | 3 | 2.3% |
| Liberal Arts & History | 7 | 5.3% |
| Visual & Performing Arts | 13 | 9.9% |
| Communications | 0 | 0.0% |
| Arts & Humanities | 7 | 5.3% |
| Total | 132 | 100.0% |
Transportation & Commute in Chappell
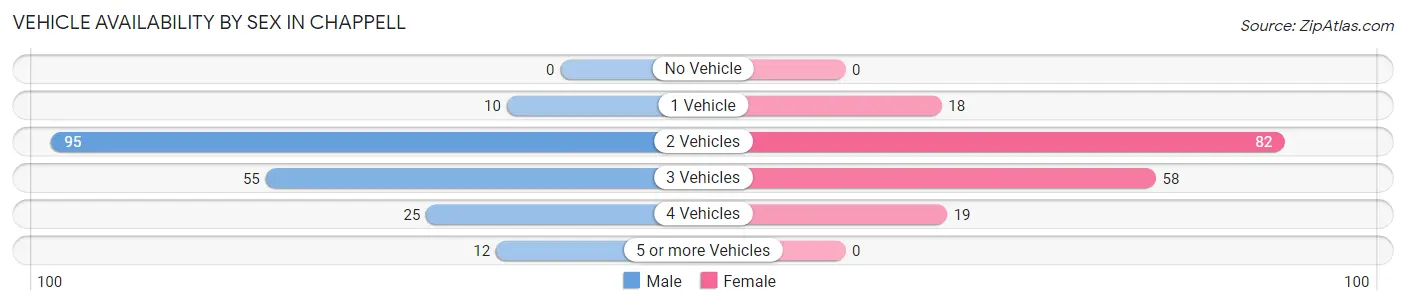
Vehicle Availability by Sex in Chappell
The most prevalent vehicle ownership categories in Chappell are males with 2 vehicles (95, accounting for 48.2%) and females with 2 vehicles (82, making up 53.7%).
| Vehicles Available | Male | Female |
| No Vehicle | 0 (0.0%) | 0 (0.0%) |
| 1 Vehicle | 10 (5.1%) | 18 (10.2%) |
| 2 Vehicles | 95 (48.2%) | 82 (46.3%) |
| 3 Vehicles | 55 (27.9%) | 58 (32.8%) |
| 4 Vehicles | 25 (12.7%) | 19 (10.7%) |
| 5 or more Vehicles | 12 (6.1%) | 0 (0.0%) |
| Total | 197 (100.0%) | 177 (100.0%) |
Commute Time in Chappell
The most frequently occuring commute durations in Chappell are less than 5 minutes (87 commuters, 24.3%), 5 to 9 minutes (77 commuters, 21.5%), and 20 to 24 minutes (48 commuters, 13.4%).
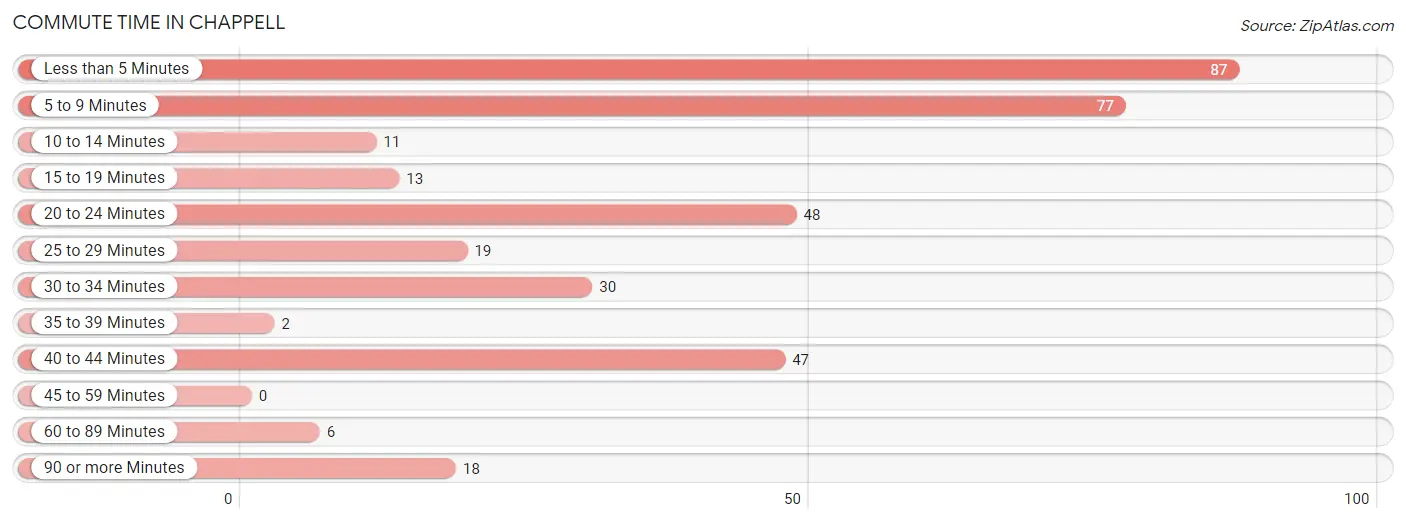
| Commute Time | # Commuters | % Commuters |
| Less than 5 Minutes | 87 | 24.3% |
| 5 to 9 Minutes | 77 | 21.5% |
| 10 to 14 Minutes | 11 | 3.1% |
| 15 to 19 Minutes | 13 | 3.6% |
| 20 to 24 Minutes | 48 | 13.4% |
| 25 to 29 Minutes | 19 | 5.3% |
| 30 to 34 Minutes | 30 | 8.4% |
| 35 to 39 Minutes | 2 | 0.6% |
| 40 to 44 Minutes | 47 | 13.1% |
| 45 to 59 Minutes | 0 | 0.0% |
| 60 to 89 Minutes | 6 | 1.7% |
| 90 or more Minutes | 18 | 5.0% |
Commute Time by Sex in Chappell
The most common commute times in Chappell are less than 5 minutes (43 commuters, 22.4%) for males and 5 to 9 minutes (56 commuters, 33.7%) for females.
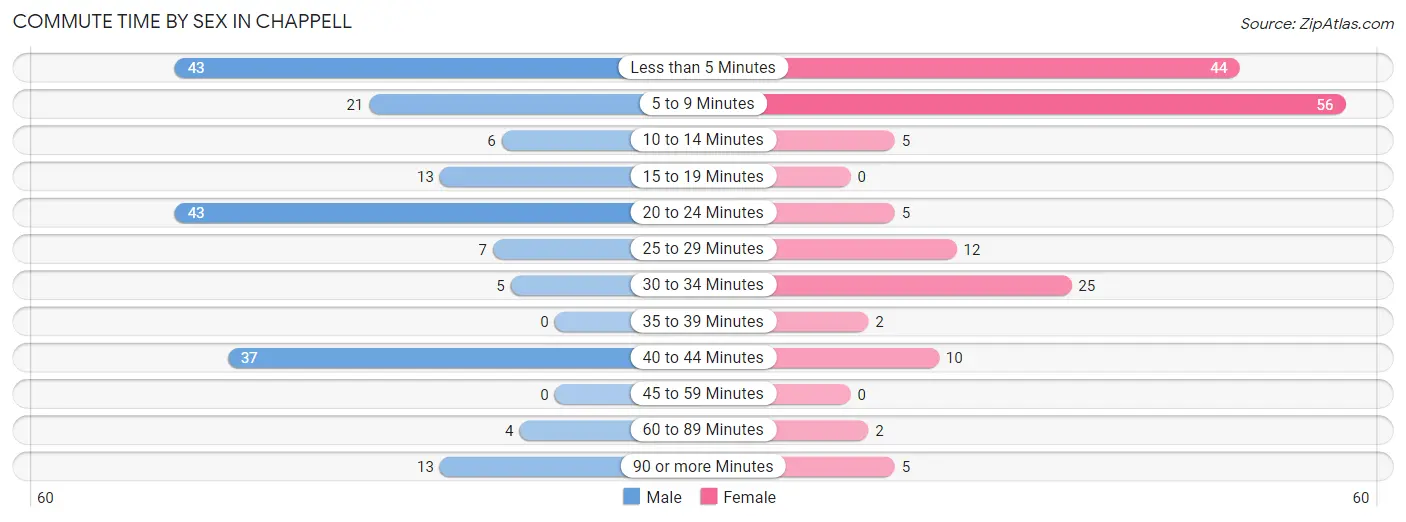
| Commute Time | Male | Female |
| Less than 5 Minutes | 43 (22.4%) | 44 (26.5%) |
| 5 to 9 Minutes | 21 (10.9%) | 56 (33.7%) |
| 10 to 14 Minutes | 6 (3.1%) | 5 (3.0%) |
| 15 to 19 Minutes | 13 (6.8%) | 0 (0.0%) |
| 20 to 24 Minutes | 43 (22.4%) | 5 (3.0%) |
| 25 to 29 Minutes | 7 (3.6%) | 12 (7.2%) |
| 30 to 34 Minutes | 5 (2.6%) | 25 (15.1%) |
| 35 to 39 Minutes | 0 (0.0%) | 2 (1.2%) |
| 40 to 44 Minutes | 37 (19.3%) | 10 (6.0%) |
| 45 to 59 Minutes | 0 (0.0%) | 0 (0.0%) |
| 60 to 89 Minutes | 4 (2.1%) | 2 (1.2%) |
| 90 or more Minutes | 13 (6.8%) | 5 (3.0%) |
Time of Departure to Work by Sex in Chappell
The most frequent times of departure to work in Chappell are 6:00 AM to 6:29 AM (53, 27.6%) for males and 7:30 AM to 7:59 AM (37, 22.3%) for females.
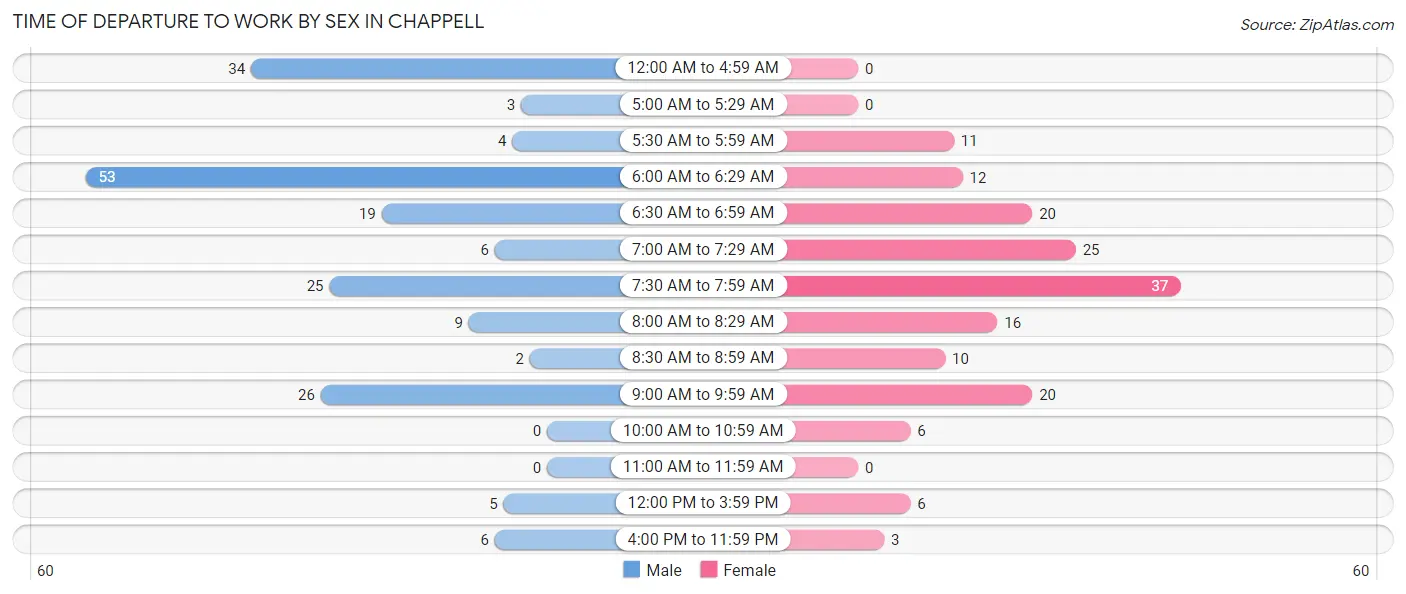
| Time of Departure | Male | Female |
| 12:00 AM to 4:59 AM | 34 (17.7%) | 0 (0.0%) |
| 5:00 AM to 5:29 AM | 3 (1.6%) | 0 (0.0%) |
| 5:30 AM to 5:59 AM | 4 (2.1%) | 11 (6.6%) |
| 6:00 AM to 6:29 AM | 53 (27.6%) | 12 (7.2%) |
| 6:30 AM to 6:59 AM | 19 (9.9%) | 20 (12.0%) |
| 7:00 AM to 7:29 AM | 6 (3.1%) | 25 (15.1%) |
| 7:30 AM to 7:59 AM | 25 (13.0%) | 37 (22.3%) |
| 8:00 AM to 8:29 AM | 9 (4.7%) | 16 (9.6%) |
| 8:30 AM to 8:59 AM | 2 (1.0%) | 10 (6.0%) |
| 9:00 AM to 9:59 AM | 26 (13.5%) | 20 (12.0%) |
| 10:00 AM to 10:59 AM | 0 (0.0%) | 6 (3.6%) |
| 11:00 AM to 11:59 AM | 0 (0.0%) | 0 (0.0%) |
| 12:00 PM to 3:59 PM | 5 (2.6%) | 6 (3.6%) |
| 4:00 PM to 11:59 PM | 6 (3.1%) | 3 (1.8%) |
| Total | 192 (100.0%) | 166 (100.0%) |
Housing Occupancy in Chappell
Occupancy by Ownership in Chappell
Of the total 412 dwellings in Chappell, owner-occupied units account for 354 (85.9%), while renter-occupied units make up 58 (14.1%).
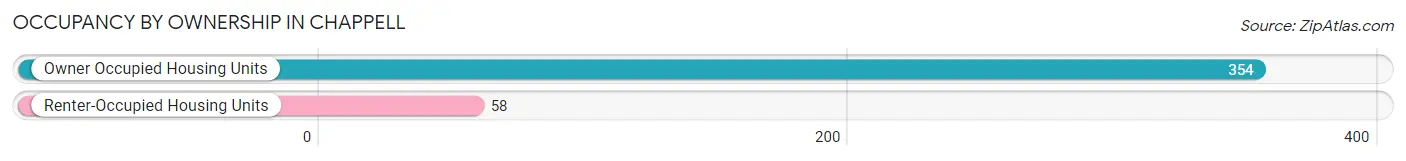
| Occupancy | # Housing Units | % Housing Units |
| Owner Occupied Housing Units | 354 | 85.9% |
| Renter-Occupied Housing Units | 58 | 14.1% |
| Total Occupied Housing Units | 412 | 100.0% |
Occupancy by Household Size in Chappell
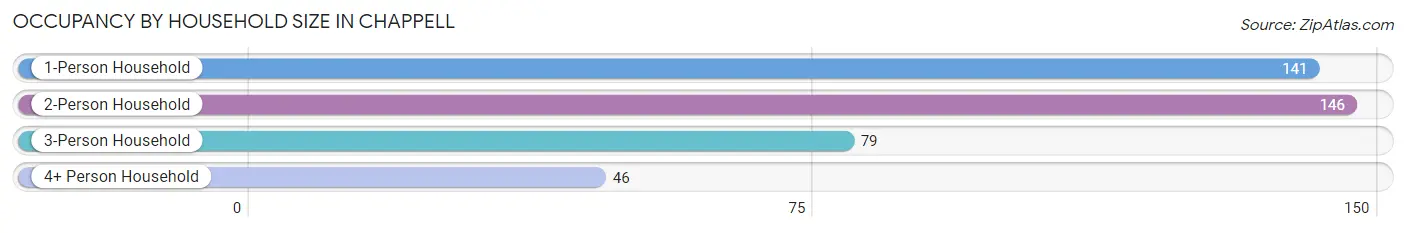
| Household Size | # Housing Units | % Housing Units |
| 1-Person Household | 141 | 34.2% |
| 2-Person Household | 146 | 35.4% |
| 3-Person Household | 79 | 19.2% |
| 4+ Person Household | 46 | 11.2% |
| Total Housing Units | 412 | 100.0% |
Occupancy by Ownership by Household Size in Chappell
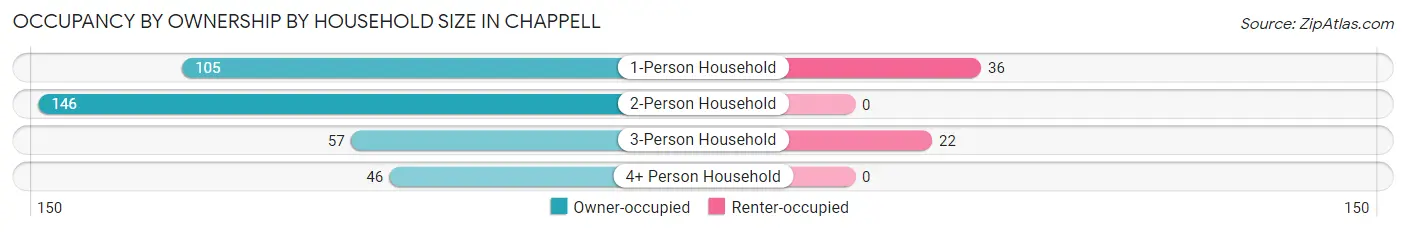
| Household Size | Owner-occupied | Renter-occupied |
| 1-Person Household | 105 (74.5%) | 36 (25.5%) |
| 2-Person Household | 146 (100.0%) | 0 (0.0%) |
| 3-Person Household | 57 (72.2%) | 22 (27.9%) |
| 4+ Person Household | 46 (100.0%) | 0 (0.0%) |
| Total Housing Units | 354 (85.9%) | 58 (14.1%) |
Occupancy by Educational Attainment in Chappell
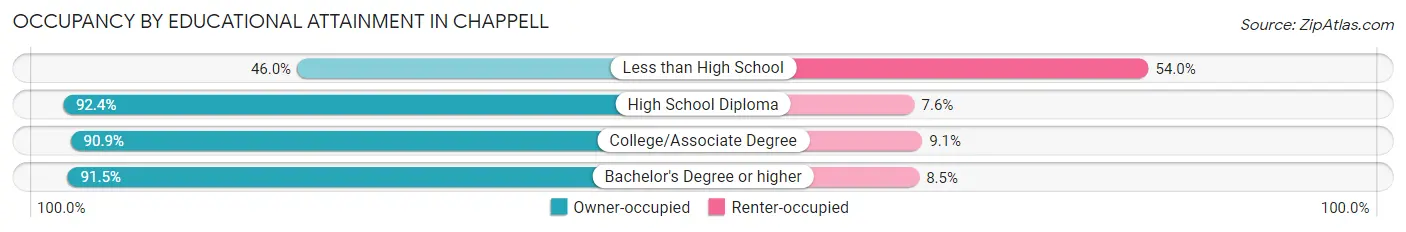
| Household Size | Owner-occupied | Renter-occupied |
| Less than High School | 23 (46.0%) | 27 (54.0%) |
| High School Diploma | 97 (92.4%) | 8 (7.6%) |
| College/Associate Degree | 159 (90.9%) | 16 (9.1%) |
| Bachelor's Degree or higher | 75 (91.5%) | 7 (8.5%) |
Occupancy by Age of Householder in Chappell
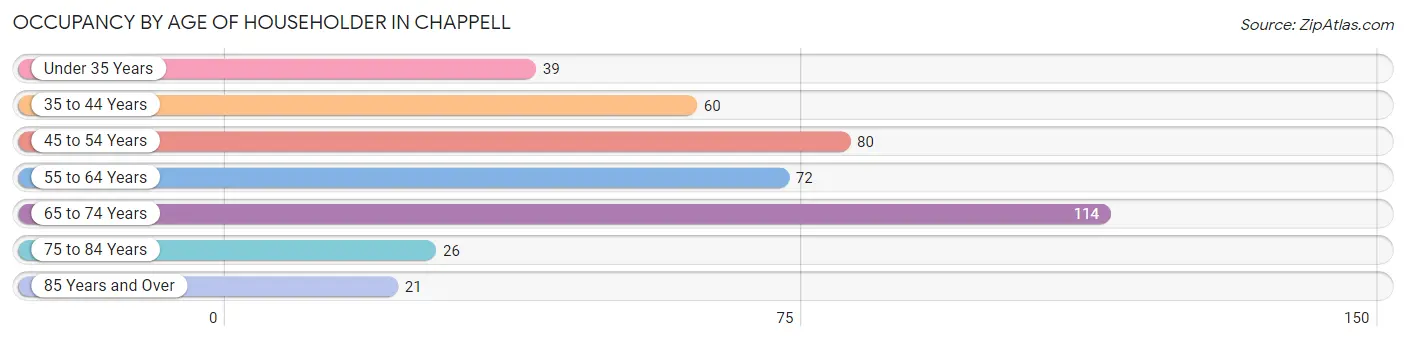
| Age Bracket | # Households | % Households |
| Under 35 Years | 39 | 9.5% |
| 35 to 44 Years | 60 | 14.6% |
| 45 to 54 Years | 80 | 19.4% |
| 55 to 64 Years | 72 | 17.5% |
| 65 to 74 Years | 114 | 27.7% |
| 75 to 84 Years | 26 | 6.3% |
| 85 Years and Over | 21 | 5.1% |
| Total | 412 | 100.0% |
Housing Finances in Chappell
Median Income by Occupancy in Chappell
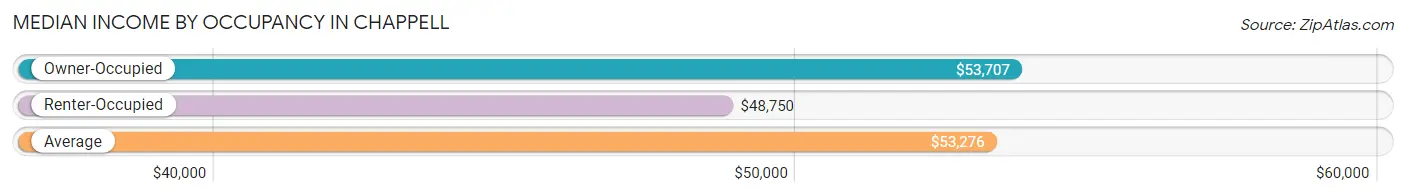
| Occupancy Type | # Households | Median Income |
| Owner-Occupied | 354 (85.9%) | $53,707 |
| Renter-Occupied | 58 (14.1%) | $48,750 |
| Average | 412 (100.0%) | $53,276 |
Occupancy by Householder Income Bracket in Chappell
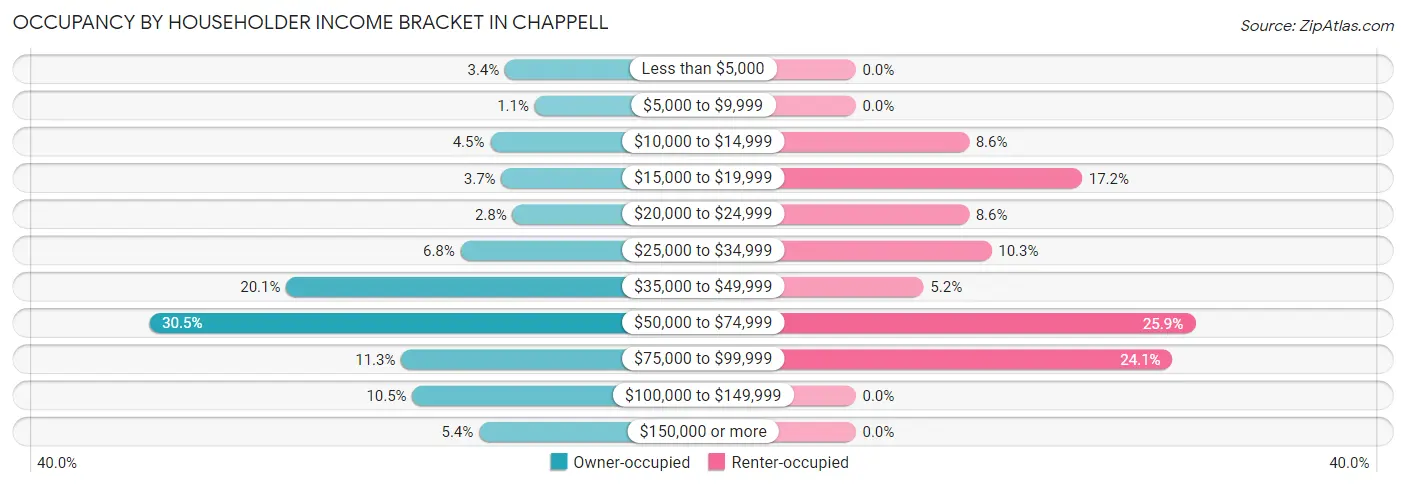
| Income Bracket | Owner-occupied | Renter-occupied |
| Less than $5,000 | 12 (3.4%) | 0 (0.0%) |
| $5,000 to $9,999 | 4 (1.1%) | 0 (0.0%) |
| $10,000 to $14,999 | 16 (4.5%) | 5 (8.6%) |
| $15,000 to $19,999 | 13 (3.7%) | 10 (17.2%) |
| $20,000 to $24,999 | 10 (2.8%) | 5 (8.6%) |
| $25,000 to $34,999 | 24 (6.8%) | 6 (10.3%) |
| $35,000 to $49,999 | 71 (20.1%) | 3 (5.2%) |
| $50,000 to $74,999 | 108 (30.5%) | 15 (25.9%) |
| $75,000 to $99,999 | 40 (11.3%) | 14 (24.1%) |
| $100,000 to $149,999 | 37 (10.4%) | 0 (0.0%) |
| $150,000 or more | 19 (5.4%) | 0 (0.0%) |
| Total | 354 (100.0%) | 58 (100.0%) |
Monthly Housing Cost Tiers in Chappell
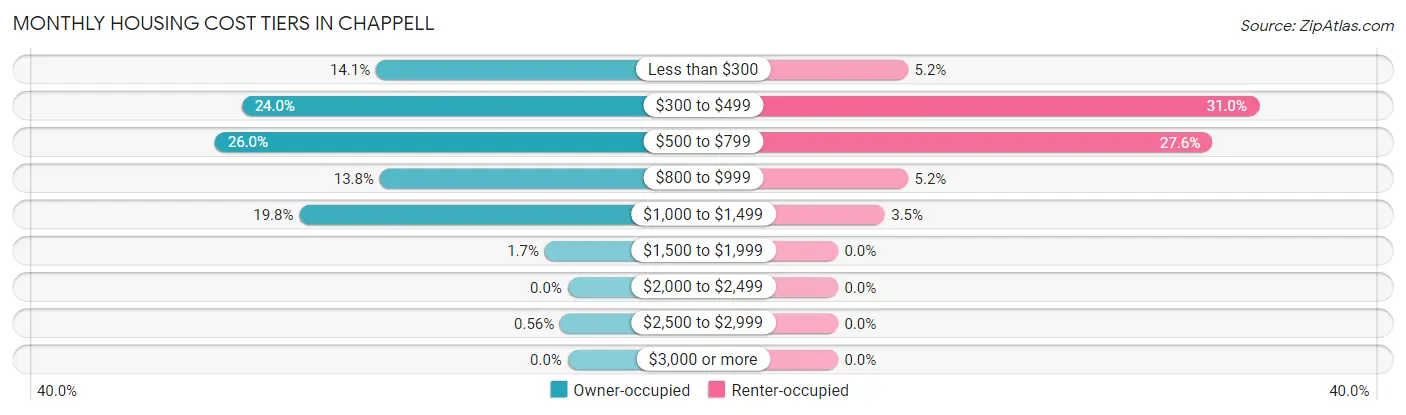
| Monthly Cost | Owner-occupied | Renter-occupied |
| Less than $300 | 50 (14.1%) | 3 (5.2%) |
| $300 to $499 | 85 (24.0%) | 18 (31.0%) |
| $500 to $799 | 92 (26.0%) | 16 (27.6%) |
| $800 to $999 | 49 (13.8%) | 3 (5.2%) |
| $1,000 to $1,499 | 70 (19.8%) | 2 (3.5%) |
| $1,500 to $1,999 | 6 (1.7%) | 0 (0.0%) |
| $2,000 to $2,499 | 0 (0.0%) | 0 (0.0%) |
| $2,500 to $2,999 | 2 (0.6%) | 0 (0.0%) |
| $3,000 or more | 0 (0.0%) | 0 (0.0%) |
| Total | 354 (100.0%) | 58 (100.0%) |
Physical Housing Characteristics in Chappell
Housing Structures in Chappell
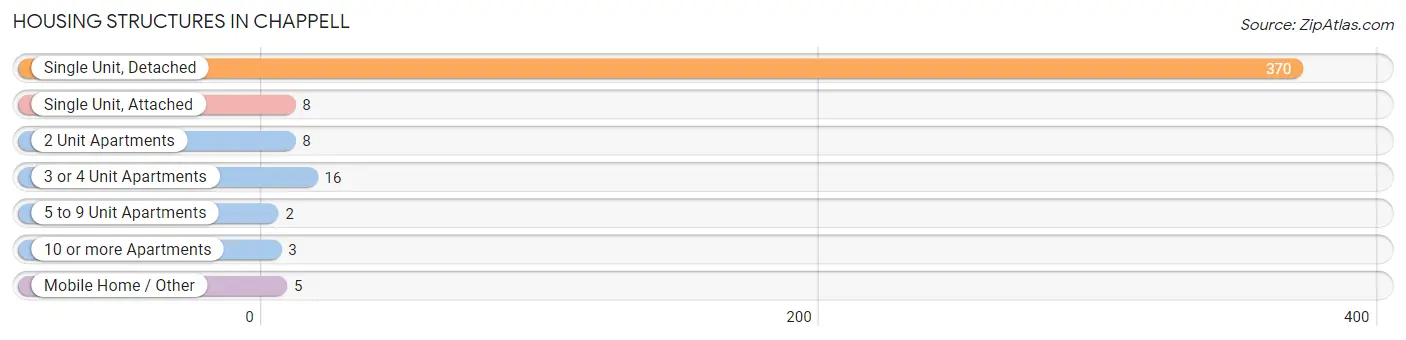
| Structure Type | # Housing Units | % Housing Units |
| Single Unit, Detached | 370 | 89.8% |
| Single Unit, Attached | 8 | 1.9% |
| 2 Unit Apartments | 8 | 1.9% |
| 3 or 4 Unit Apartments | 16 | 3.9% |
| 5 to 9 Unit Apartments | 2 | 0.5% |
| 10 or more Apartments | 3 | 0.7% |
| Mobile Home / Other | 5 | 1.2% |
| Total | 412 | 100.0% |
Housing Structures by Occupancy in Chappell
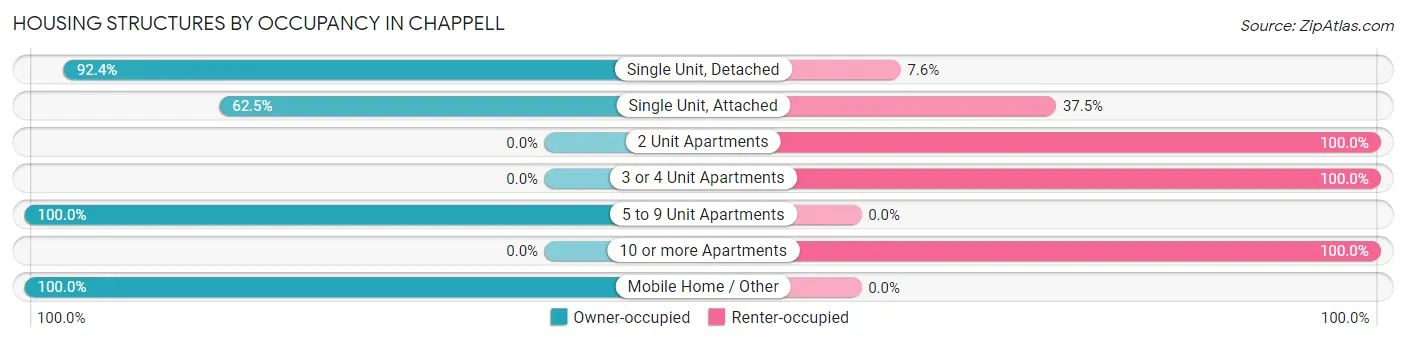
| Structure Type | Owner-occupied | Renter-occupied |
| Single Unit, Detached | 342 (92.4%) | 28 (7.6%) |
| Single Unit, Attached | 5 (62.5%) | 3 (37.5%) |
| 2 Unit Apartments | 0 (0.0%) | 8 (100.0%) |
| 3 or 4 Unit Apartments | 0 (0.0%) | 16 (100.0%) |
| 5 to 9 Unit Apartments | 2 (100.0%) | 0 (0.0%) |
| 10 or more Apartments | 0 (0.0%) | 3 (100.0%) |
| Mobile Home / Other | 5 (100.0%) | 0 (0.0%) |
| Total | 354 (85.9%) | 58 (14.1%) |
Housing Structures by Number of Rooms in Chappell
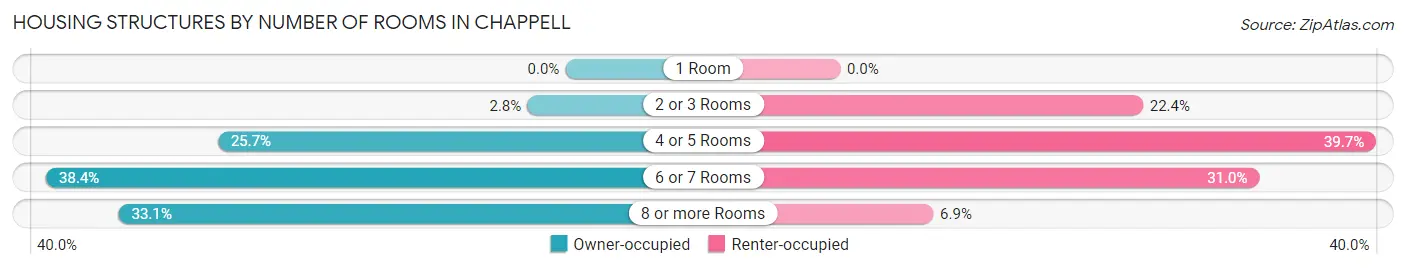
| Number of Rooms | Owner-occupied | Renter-occupied |
| 1 Room | 0 (0.0%) | 0 (0.0%) |
| 2 or 3 Rooms | 10 (2.8%) | 13 (22.4%) |
| 4 or 5 Rooms | 91 (25.7%) | 23 (39.7%) |
| 6 or 7 Rooms | 136 (38.4%) | 18 (31.0%) |
| 8 or more Rooms | 117 (33.1%) | 4 (6.9%) |
| Total | 354 (100.0%) | 58 (100.0%) |
Housing Structure by Heating Type in Chappell
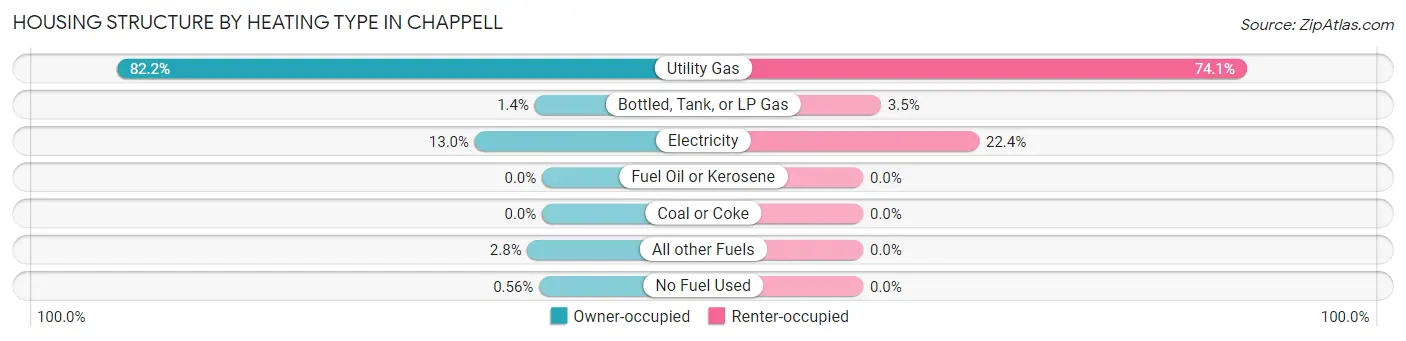
| Heating Type | Owner-occupied | Renter-occupied |
| Utility Gas | 291 (82.2%) | 43 (74.1%) |
| Bottled, Tank, or LP Gas | 5 (1.4%) | 2 (3.5%) |
| Electricity | 46 (13.0%) | 13 (22.4%) |
| Fuel Oil or Kerosene | 0 (0.0%) | 0 (0.0%) |
| Coal or Coke | 0 (0.0%) | 0 (0.0%) |
| All other Fuels | 10 (2.8%) | 0 (0.0%) |
| No Fuel Used | 2 (0.6%) | 0 (0.0%) |
| Total | 354 (100.0%) | 58 (100.0%) |
Household Vehicle Usage in Chappell
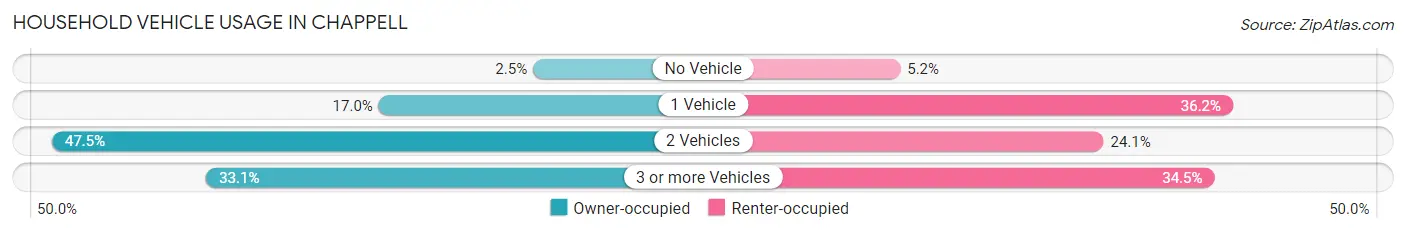
| Vehicles per Household | Owner-occupied | Renter-occupied |
| No Vehicle | 9 (2.5%) | 3 (5.2%) |
| 1 Vehicle | 60 (17.0%) | 21 (36.2%) |
| 2 Vehicles | 168 (47.5%) | 14 (24.1%) |
| 3 or more Vehicles | 117 (33.1%) | 20 (34.5%) |
| Total | 354 (100.0%) | 58 (100.0%) |
Real Estate & Mortgages in Chappell
Real Estate and Mortgage Overview in Chappell
| Characteristic | Without Mortgage | With Mortgage |
| Housing Units | 231 | 123 |
| Median Property Value | $72,100 | $85,900 |
| Median Household Income | $44,917 | $5 |
| Monthly Housing Costs | $457 | $0 |
| Real Estate Taxes | $1,014 | $6 |
Property Value by Mortgage Status in Chappell
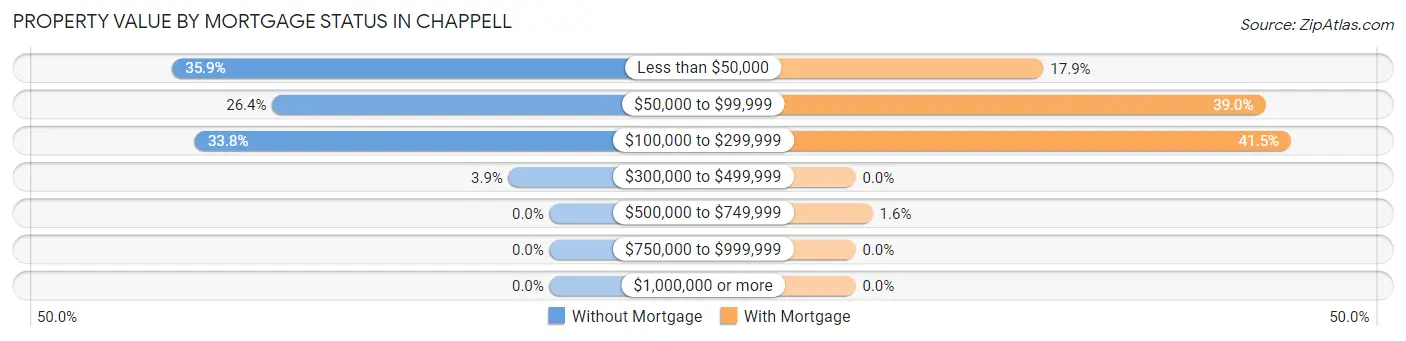
| Property Value | Without Mortgage | With Mortgage |
| Less than $50,000 | 83 (35.9%) | 22 (17.9%) |
| $50,000 to $99,999 | 61 (26.4%) | 48 (39.0%) |
| $100,000 to $299,999 | 78 (33.8%) | 51 (41.5%) |
| $300,000 to $499,999 | 9 (3.9%) | 0 (0.0%) |
| $500,000 to $749,999 | 0 (0.0%) | 2 (1.6%) |
| $750,000 to $999,999 | 0 (0.0%) | 0 (0.0%) |
| $1,000,000 or more | 0 (0.0%) | 0 (0.0%) |
| Total | 231 (100.0%) | 123 (100.0%) |
Household Income by Mortgage Status in Chappell
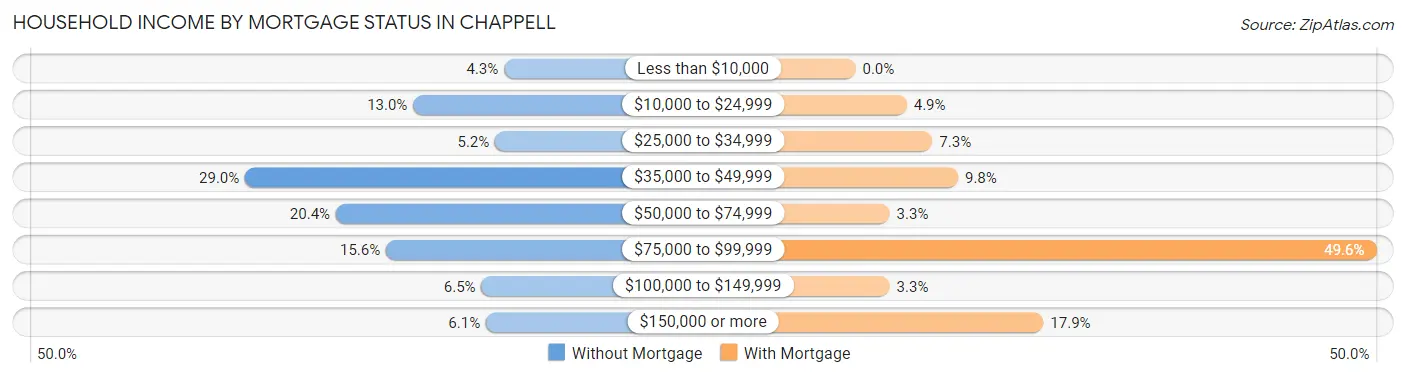
| Household Income | Without Mortgage | With Mortgage |
| Less than $10,000 | 10 (4.3%) | 0 (0.0%) |
| $10,000 to $24,999 | 30 (13.0%) | 6 (4.9%) |
| $25,000 to $34,999 | 12 (5.2%) | 9 (7.3%) |
| $35,000 to $49,999 | 67 (29.0%) | 12 (9.8%) |
| $50,000 to $74,999 | 47 (20.3%) | 4 (3.3%) |
| $75,000 to $99,999 | 36 (15.6%) | 61 (49.6%) |
| $100,000 to $149,999 | 15 (6.5%) | 4 (3.3%) |
| $150,000 or more | 14 (6.1%) | 22 (17.9%) |
| Total | 231 (100.0%) | 123 (100.0%) |
Property Value to Household Income Ratio in Chappell
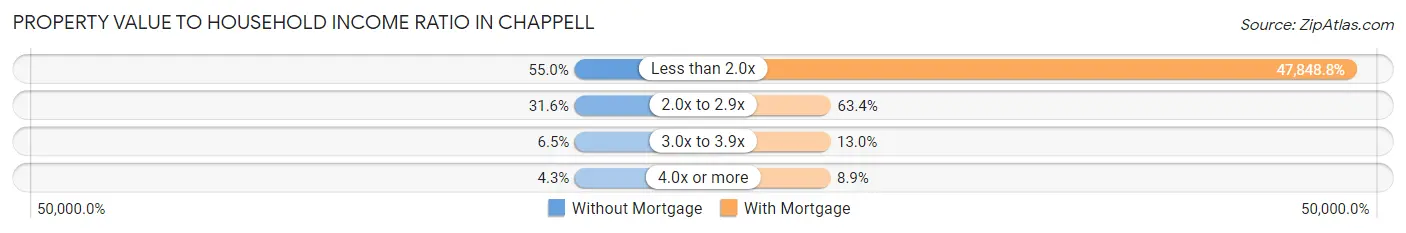
| Value-to-Income Ratio | Without Mortgage | With Mortgage |
| Less than 2.0x | 127 (55.0%) | 58,854 (47,848.8%) |
| 2.0x to 2.9x | 73 (31.6%) | 78 (63.4%) |
| 3.0x to 3.9x | 15 (6.5%) | 16 (13.0%) |
| 4.0x or more | 10 (4.3%) | 11 (8.9%) |
| Total | 231 (100.0%) | 123 (100.0%) |
Real Estate Taxes by Mortgage Status in Chappell
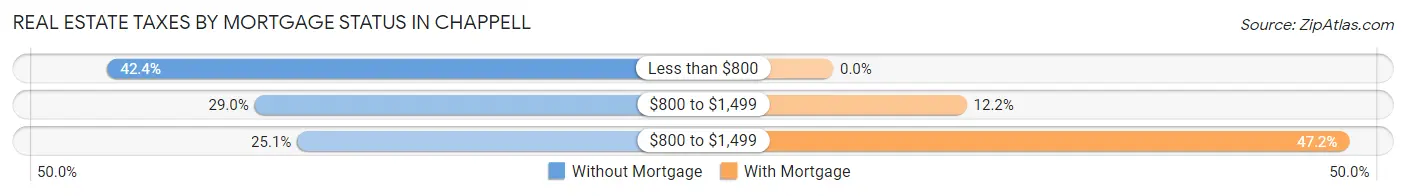
| Property Taxes | Without Mortgage | With Mortgage |
| Less than $800 | 98 (42.4%) | 0 (0.0%) |
| $800 to $1,499 | 67 (29.0%) | 15 (12.2%) |
| $800 to $1,499 | 58 (25.1%) | 58 (47.1%) |
| Total | 231 (100.0%) | 123 (100.0%) |
Health & Disability in Chappell
Health Insurance Coverage by Age in Chappell
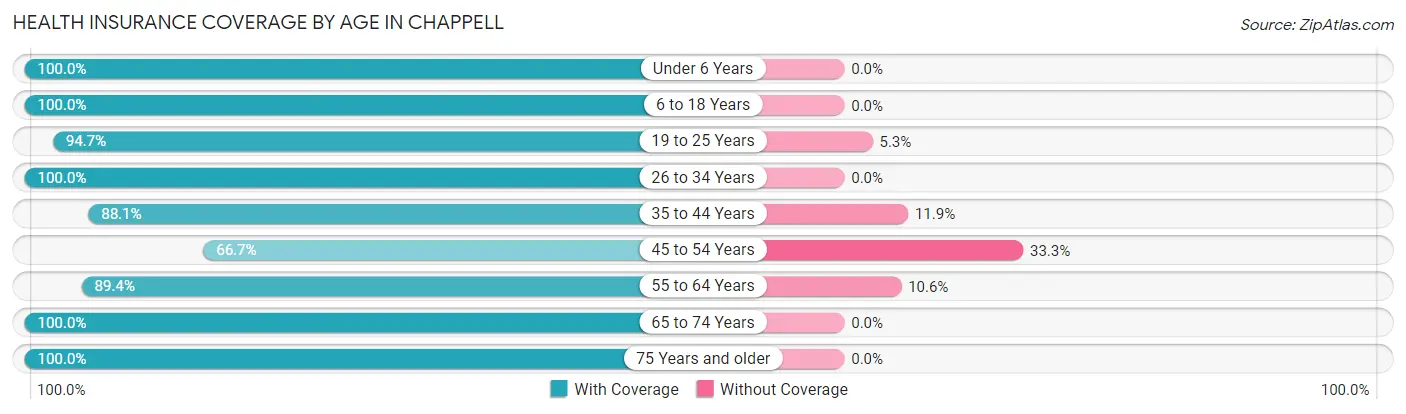
| Age Bracket | With Coverage | Without Coverage |
| Under 6 Years | 69 (100.0%) | 0 (0.0%) |
| 6 to 18 Years | 82 (100.0%) | 0 (0.0%) |
| 19 to 25 Years | 72 (94.7%) | 4 (5.3%) |
| 26 to 34 Years | 63 (100.0%) | 0 (0.0%) |
| 35 to 44 Years | 89 (88.1%) | 12 (11.9%) |
| 45 to 54 Years | 76 (66.7%) | 38 (33.3%) |
| 55 to 64 Years | 118 (89.4%) | 14 (10.6%) |
| 65 to 74 Years | 165 (100.0%) | 0 (0.0%) |
| 75 Years and older | 80 (100.0%) | 0 (0.0%) |
| Total | 814 (92.3%) | 68 (7.7%) |
Health Insurance Coverage by Citizenship Status in Chappell
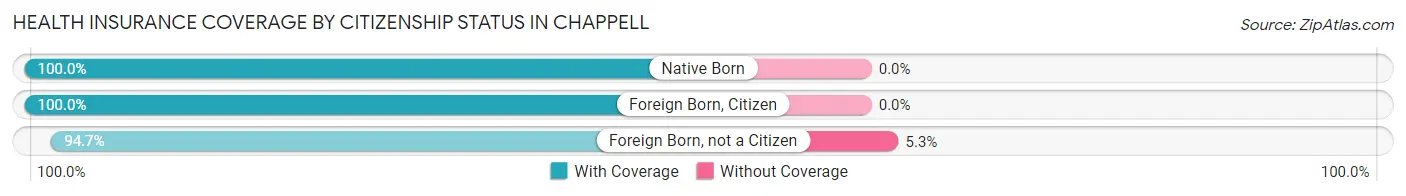
| Citizenship Status | With Coverage | Without Coverage |
| Native Born | 69 (100.0%) | 0 (0.0%) |
| Foreign Born, Citizen | 82 (100.0%) | 0 (0.0%) |
| Foreign Born, not a Citizen | 72 (94.7%) | 4 (5.3%) |
Health Insurance Coverage by Household Income in Chappell
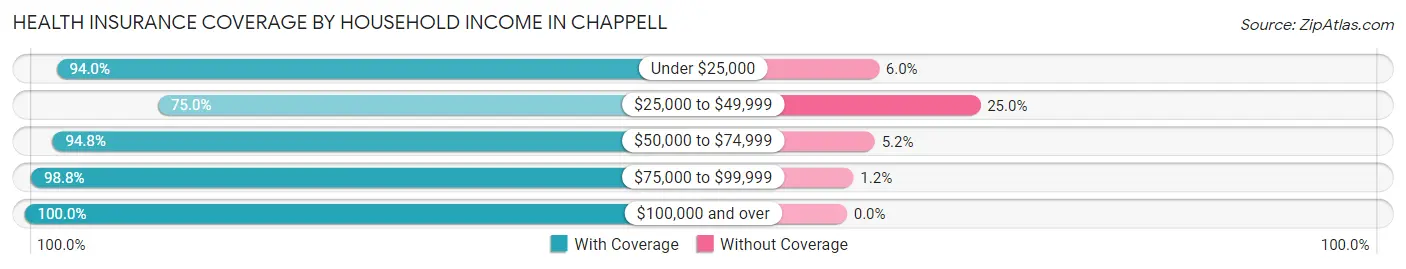
| Household Income | With Coverage | Without Coverage |
| Under $25,000 | 94 (94.0%) | 6 (6.0%) |
| $25,000 to $49,999 | 138 (75.0%) | 46 (25.0%) |
| $50,000 to $74,999 | 253 (94.8%) | 14 (5.2%) |
| $75,000 to $99,999 | 159 (98.8%) | 2 (1.2%) |
| $100,000 and over | 170 (100.0%) | 0 (0.0%) |
Public vs Private Health Insurance Coverage by Age in Chappell
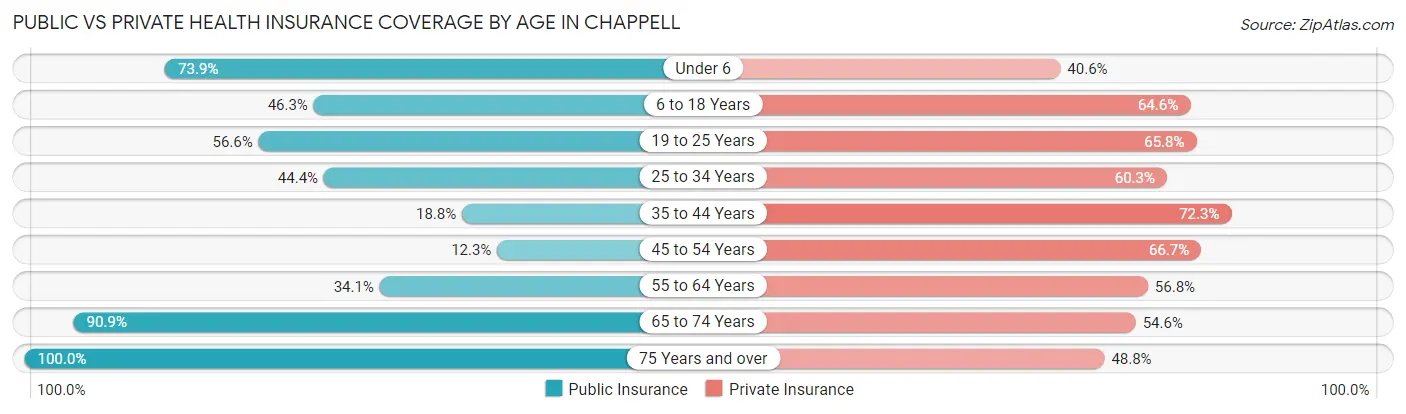
| Age Bracket | Public Insurance | Private Insurance |
| Under 6 | 51 (73.9%) | 28 (40.6%) |
| 6 to 18 Years | 38 (46.3%) | 53 (64.6%) |
| 19 to 25 Years | 43 (56.6%) | 50 (65.8%) |
| 25 to 34 Years | 28 (44.4%) | 38 (60.3%) |
| 35 to 44 Years | 19 (18.8%) | 73 (72.3%) |
| 45 to 54 Years | 14 (12.3%) | 76 (66.7%) |
| 55 to 64 Years | 45 (34.1%) | 75 (56.8%) |
| 65 to 74 Years | 150 (90.9%) | 90 (54.5%) |
| 75 Years and over | 80 (100.0%) | 39 (48.7%) |
| Total | 468 (53.1%) | 522 (59.2%) |
Disability Status by Sex by Age in Chappell
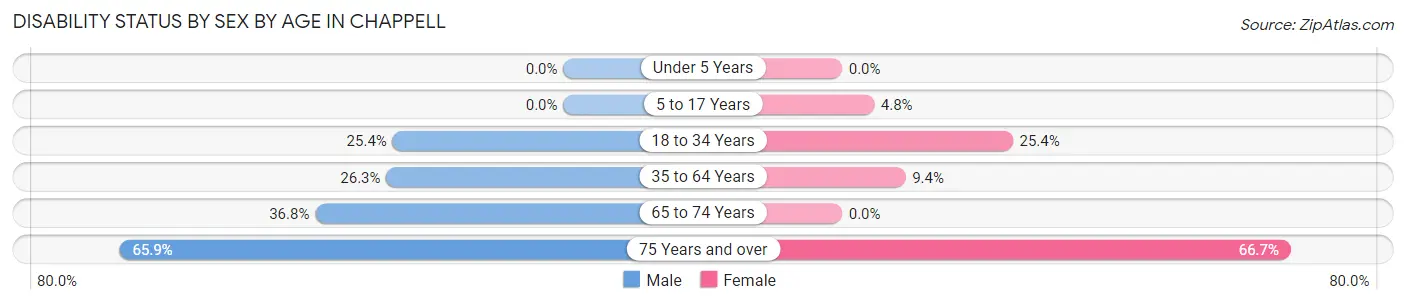
| Age Bracket | Male | Female |
| Under 5 Years | 0 (0.0%) | 0 (0.0%) |
| 5 to 17 Years | 0 (0.0%) | 2 (4.8%) |
| 18 to 34 Years | 18 (25.4%) | 18 (25.4%) |
| 35 to 64 Years | 41 (26.3%) | 18 (9.4%) |
| 65 to 74 Years | 35 (36.8%) | 0 (0.0%) |
| 75 Years and over | 29 (65.9%) | 24 (66.7%) |
Disability Class by Sex by Age in Chappell
Disability Class: Hearing Difficulty
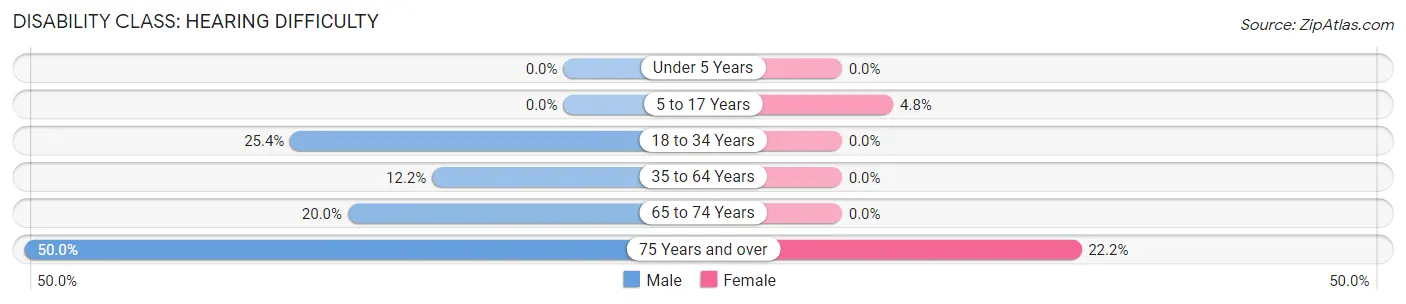
| Age Bracket | Male | Female |
| Under 5 Years | 0 (0.0%) | 0 (0.0%) |
| 5 to 17 Years | 0 (0.0%) | 2 (4.8%) |
| 18 to 34 Years | 18 (25.4%) | 0 (0.0%) |
| 35 to 64 Years | 19 (12.2%) | 0 (0.0%) |
| 65 to 74 Years | 19 (20.0%) | 0 (0.0%) |
| 75 Years and over | 22 (50.0%) | 8 (22.2%) |
Disability Class: Vision Difficulty
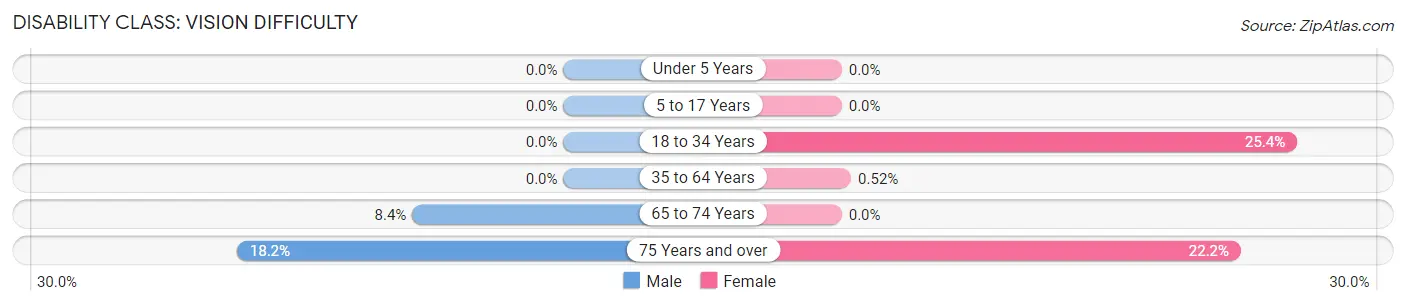
| Age Bracket | Male | Female |
| Under 5 Years | 0 (0.0%) | 0 (0.0%) |
| 5 to 17 Years | 0 (0.0%) | 0 (0.0%) |
| 18 to 34 Years | 0 (0.0%) | 18 (25.4%) |
| 35 to 64 Years | 0 (0.0%) | 1 (0.5%) |
| 65 to 74 Years | 8 (8.4%) | 0 (0.0%) |
| 75 Years and over | 8 (18.2%) | 8 (22.2%) |
Disability Class: Cognitive Difficulty
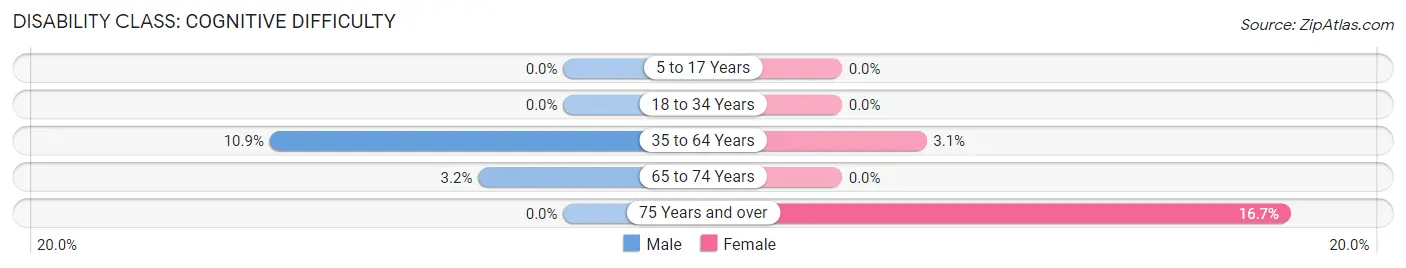
| Age Bracket | Male | Female |
| 5 to 17 Years | 0 (0.0%) | 0 (0.0%) |
| 18 to 34 Years | 0 (0.0%) | 0 (0.0%) |
| 35 to 64 Years | 17 (10.9%) | 6 (3.1%) |
| 65 to 74 Years | 3 (3.2%) | 0 (0.0%) |
| 75 Years and over | 0 (0.0%) | 6 (16.7%) |
Disability Class: Ambulatory Difficulty
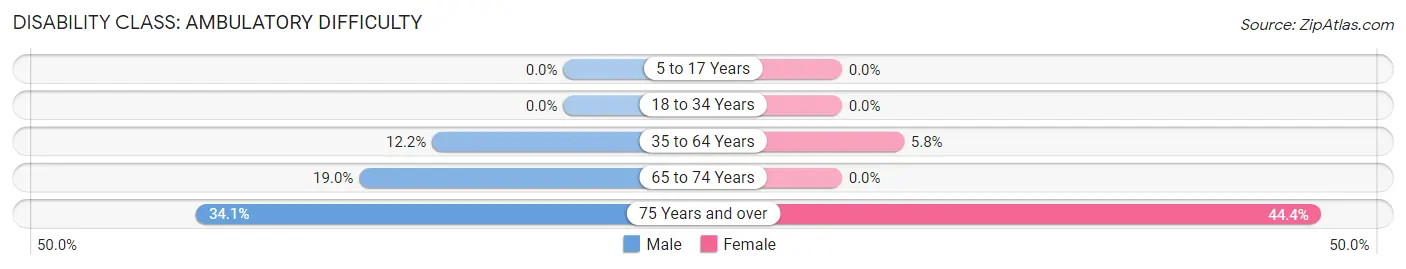
| Age Bracket | Male | Female |
| 5 to 17 Years | 0 (0.0%) | 0 (0.0%) |
| 18 to 34 Years | 0 (0.0%) | 0 (0.0%) |
| 35 to 64 Years | 19 (12.2%) | 11 (5.8%) |
| 65 to 74 Years | 18 (19.0%) | 0 (0.0%) |
| 75 Years and over | 15 (34.1%) | 16 (44.4%) |
Disability Class: Self-Care Difficulty
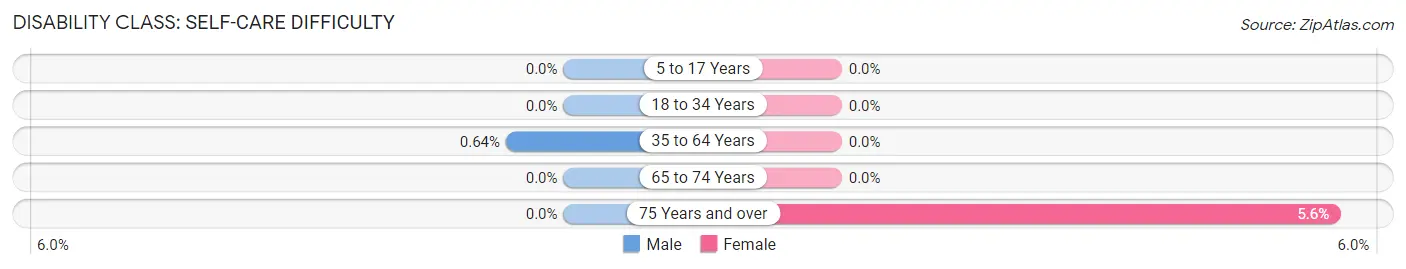
| Age Bracket | Male | Female |
| 5 to 17 Years | 0 (0.0%) | 0 (0.0%) |
| 18 to 34 Years | 0 (0.0%) | 0 (0.0%) |
| 35 to 64 Years | 1 (0.6%) | 0 (0.0%) |
| 65 to 74 Years | 0 (0.0%) | 0 (0.0%) |
| 75 Years and over | 0 (0.0%) | 2 (5.6%) |
Technology Access in Chappell
Computing Device Access in Chappell
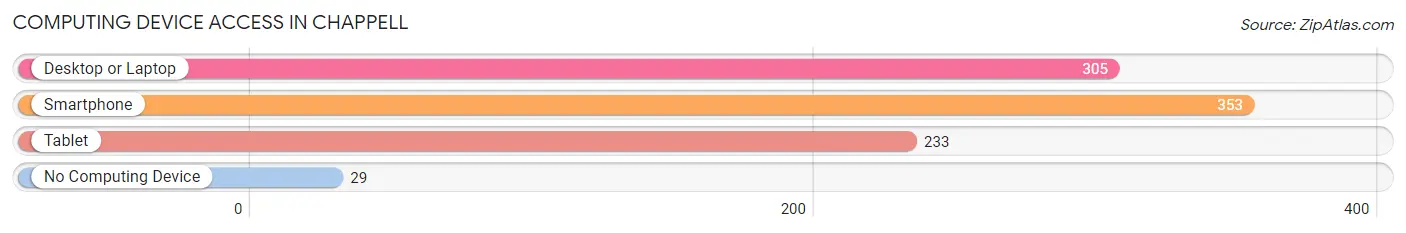
| Device Type | # Households | % Households |
| Desktop or Laptop | 305 | 74.0% |
| Smartphone | 353 | 85.7% |
| Tablet | 233 | 56.6% |
| No Computing Device | 29 | 7.0% |
| Total | 412 | 100.0% |
Internet Access in Chappell
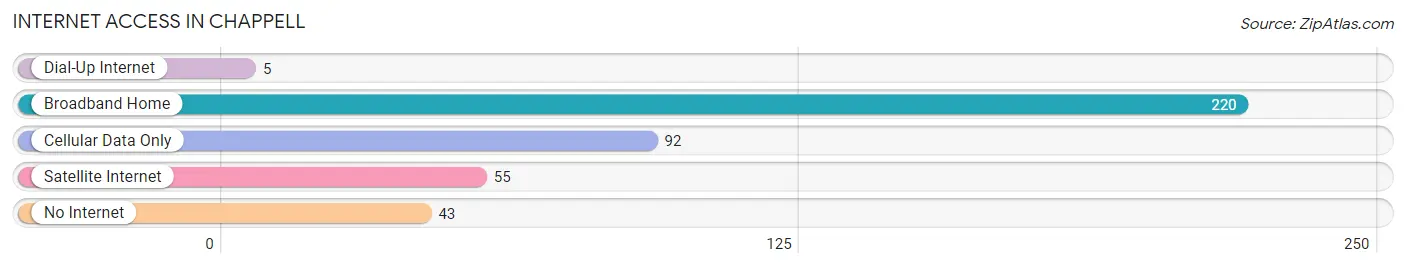
| Internet Type | # Households | % Households |
| Dial-Up Internet | 5 | 1.2% |
| Broadband Home | 220 | 53.4% |
| Cellular Data Only | 92 | 22.3% |
| Satellite Internet | 55 | 13.4% |
| No Internet | 43 | 10.4% |
| Total | 412 | 100.0% |
Chappell Summary
Chappell is a small city located in Deuel County, Nebraska. It is situated in the southwestern corner of the state, approximately 30 miles from the Colorado border. The city has a population of 1,717 people, according to the 2010 census.
History
Chappell was founded in 1887 by the Union Pacific Railroad. The city was named after the railroad's president, Thomas Chappell. The railroad was instrumental in the development of the city, as it provided transportation for settlers and goods.
The city was incorporated in 1891 and quickly grew to become a thriving agricultural center. The city was home to a variety of businesses, including a bank, a hotel, a newspaper, and a variety of stores.
Geography
Chappell is located in the High Plains region of Nebraska. The city is situated on the banks of the North Platte River, which provides irrigation for the surrounding agricultural lands. The city is surrounded by rolling hills and grasslands, and is located in the heart of the Sandhills region.
The city has a total area of 1.2 square miles, all of which is land. The elevation of the city is 4,092 feet above sea level.
Economy
The economy of Chappell is largely based on agriculture. The city is home to a variety of farms, which produce a variety of crops, including corn, wheat, and soybeans. The city is also home to a variety of businesses, including a bank, a hotel, a newspaper, and a variety of stores.
Demographics
According to the 2010 census, the population of Chappell was 1,717 people. The racial makeup of the city was 97.2% White, 0.2% African American, 0.3% Native American, 0.2% Asian, 0.1% Pacific Islander, 0.7% from other races, and 1.3% from two or more races. Hispanic or Latino of any race were 2.2% of the population.
The median household income in Chappell was $41,250, and the median family income was $48,750. The per capita income for the city was $19,945. About 11.2% of families and 13.2% of the population were below the poverty line, including 17.2% of those under age 18 and 8.3% of those age 65 or over.
Common Questions
What is Per Capita Income in Chappell?
Per Capita income in Chappell is $31,973.
What is the Median Family Income in Chappell?
Median Family Income in Chappell is $56,188.
What is the Median Household income in Chappell?
Median Household Income in Chappell is $53,276.
What is Income or Wage Gap in Chappell?
Income or Wage Gap in Chappell is 32.0%.
Women in Chappell earn 68.0 cents for every dollar earned by a man.
What is Inequality or Gini Index in Chappell?
Inequality or Gini Index in Chappell is 0.43.
What is the Total Population of Chappell?
Total Population of Chappell is 889.
What is the Total Male Population of Chappell?
Total Male Population of Chappell is 432.
What is the Total Female Population of Chappell?
Total Female Population of Chappell is 457.
What is the Ratio of Males per 100 Females in Chappell?
There are 94.53 Males per 100 Females in Chappell.
What is the Ratio of Females per 100 Males in Chappell?
There are 105.79 Females per 100 Males in Chappell.
What is the Median Population Age in Chappell?
Median Population Age in Chappell is 50.8 Years.
What is the Average Family Size in Chappell
Average Family Size in Chappell is 2.7 People.
What is the Average Household Size in Chappell
Average Household Size in Chappell is 2.1 People.
How Large is the Labor Force in Chappell?
There are 392 People in the Labor Forcein in Chappell.
What is the Percentage of People in the Labor Force in Chappell?
52.3% of People are in the Labor Force in Chappell.
What is the Unemployment Rate in Chappell?
Unemployment Rate in Chappell is 3.3%.