Central City, NE Map & Demographics
Central City Map
Central City Overview
$28,180
PER CAPITA INCOME
$74,333
AVG FAMILY INCOME
$54,063
AVG HOUSEHOLD INCOME
39.4%
WAGE / INCOME GAP [ % ]
60.6¢/ $1
WAGE / INCOME GAP [ $ ]
0.41
INEQUALITY / GINI INDEX
3,035
TOTAL POPULATION
1,439
MALE POPULATION
1,596
FEMALE POPULATION
90.16
MALES / 100 FEMALES
110.91
FEMALES / 100 MALES
37.0
MEDIAN AGE
3.1
AVG FAMILY SIZE
2.4
AVG HOUSEHOLD SIZE
1,399
LABOR FORCE [ PEOPLE ]
59.2%
PERCENT IN LABOR FORCE
Central City Zip Codes
Central City Area Codes
Income in Central City
Income Overview in Central City
Per Capita Income in Central City is $28,180, while median incomes of families and households are $74,333 and $54,063 respectively.
| Characteristic | Number | Measure |
| Per Capita Income | 3,035 | $28,180 |
| Median Family Income | 736 | $74,333 |
| Mean Family Income | 736 | $81,869 |
| Median Household Income | 1,200 | $54,063 |
| Mean Household Income | 1,200 | $66,254 |
| Income Deficit | 736 | $0 |
| Wage / Income Gap (%) | 3,035 | 39.35% |
| Wage / Income Gap ($) | 3,035 | 60.65¢ per $1 |
| Gini / Inequality Index | 3,035 | 0.41 |
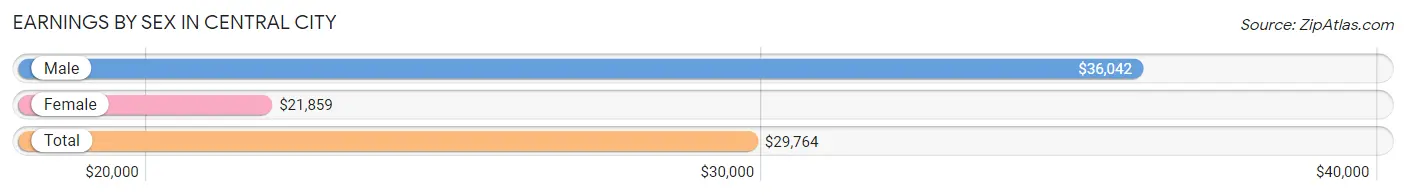
Earnings by Sex in Central City
Average Earnings in Central City are $29,764, $36,042 for men and $21,859 for women, a difference of 39.4%.
| Sex | Number | Average Earnings |
| Male | 759 (49.1%) | $36,042 |
| Female | 788 (50.9%) | $21,859 |
| Total | 1,547 (100.0%) | $29,764 |
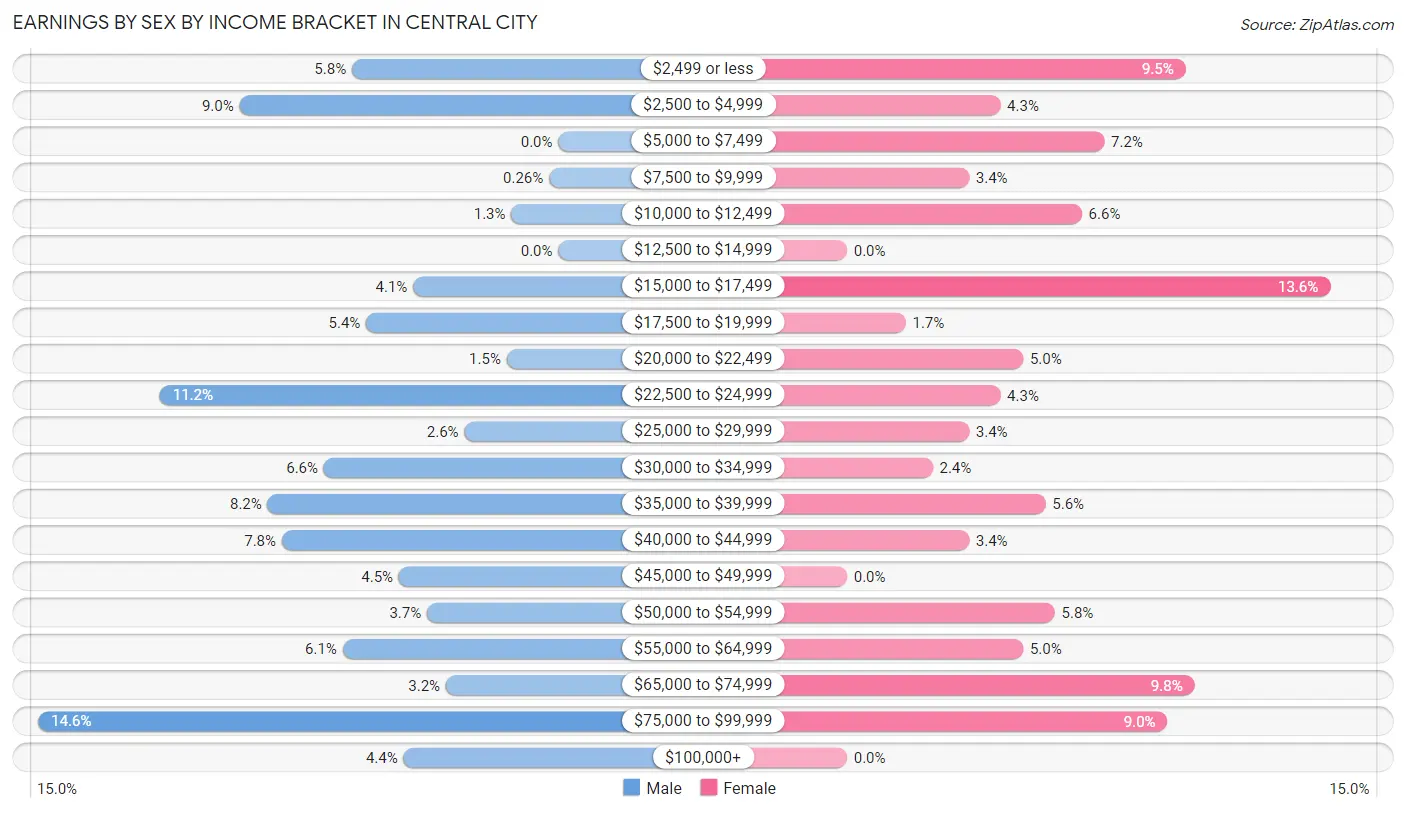
Earnings by Sex by Income Bracket in Central City
The most common earnings brackets in Central City are $75,000 to $99,999 for men (111 | 14.6%) and $15,000 to $17,499 for women (107 | 13.6%).
| Income | Male | Female |
| $2,499 or less | 44 (5.8%) | 75 (9.5%) |
| $2,500 to $4,999 | 68 (9.0%) | 34 (4.3%) |
| $5,000 to $7,499 | 0 (0.0%) | 57 (7.2%) |
| $7,500 to $9,999 | 2 (0.3%) | 27 (3.4%) |
| $10,000 to $12,499 | 10 (1.3%) | 52 (6.6%) |
| $12,500 to $14,999 | 0 (0.0%) | 0 (0.0%) |
| $15,000 to $17,499 | 31 (4.1%) | 107 (13.6%) |
| $17,500 to $19,999 | 41 (5.4%) | 13 (1.7%) |
| $20,000 to $22,499 | 11 (1.5%) | 39 (5.0%) |
| $22,500 to $24,999 | 85 (11.2%) | 34 (4.3%) |
| $25,000 to $29,999 | 20 (2.6%) | 27 (3.4%) |
| $30,000 to $34,999 | 50 (6.6%) | 19 (2.4%) |
| $35,000 to $39,999 | 62 (8.2%) | 44 (5.6%) |
| $40,000 to $44,999 | 59 (7.8%) | 27 (3.4%) |
| $45,000 to $49,999 | 34 (4.5%) | 0 (0.0%) |
| $50,000 to $54,999 | 28 (3.7%) | 46 (5.8%) |
| $55,000 to $64,999 | 46 (6.1%) | 39 (5.0%) |
| $65,000 to $74,999 | 24 (3.2%) | 77 (9.8%) |
| $75,000 to $99,999 | 111 (14.6%) | 71 (9.0%) |
| $100,000+ | 33 (4.3%) | 0 (0.0%) |
| Total | 759 (100.0%) | 788 (100.0%) |
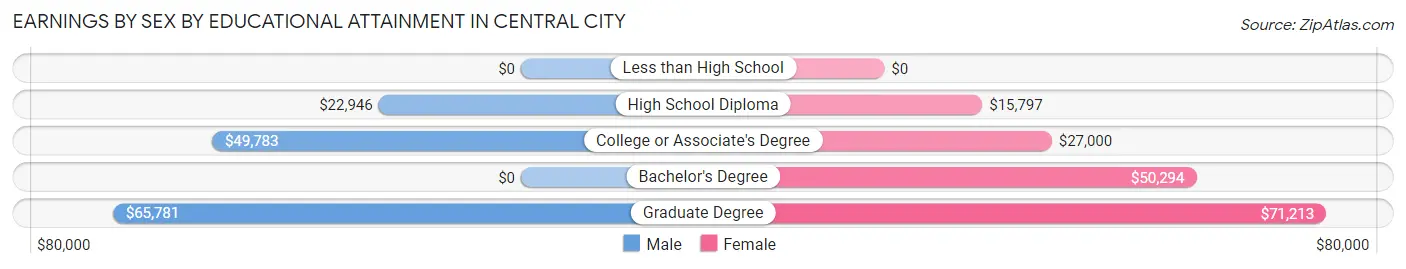
Earnings by Sex by Educational Attainment in Central City
Average earnings in Central City are $36,548 for men and $28,015 for women, a difference of 23.4%. Men with an educational attainment of graduate degree enjoy the highest average annual earnings of $65,781, while those with high school diploma education earn the least with $22,946. Women with an educational attainment of graduate degree earn the most with the average annual earnings of $71,213, while those with high school diploma education have the smallest earnings of $15,797.
| Educational Attainment | Male Income | Female Income |
| Less than High School | - | - |
| High School Diploma | $22,946 | $15,797 |
| College or Associate's Degree | $49,783 | $27,000 |
| Bachelor's Degree | - | - |
| Graduate Degree | $65,781 | $71,213 |
| Total | $36,548 | $28,015 |
Family Income in Central City
Family Income Brackets in Central City
According to the Central City family income data, there are 134 families falling into the $75,000 to $99,999 income range, which is the most common income bracket and makes up 18.2% of all families. Conversely, the $200,000+ income bracket is the least frequent group with only 6 families (0.8%) belonging to this category.
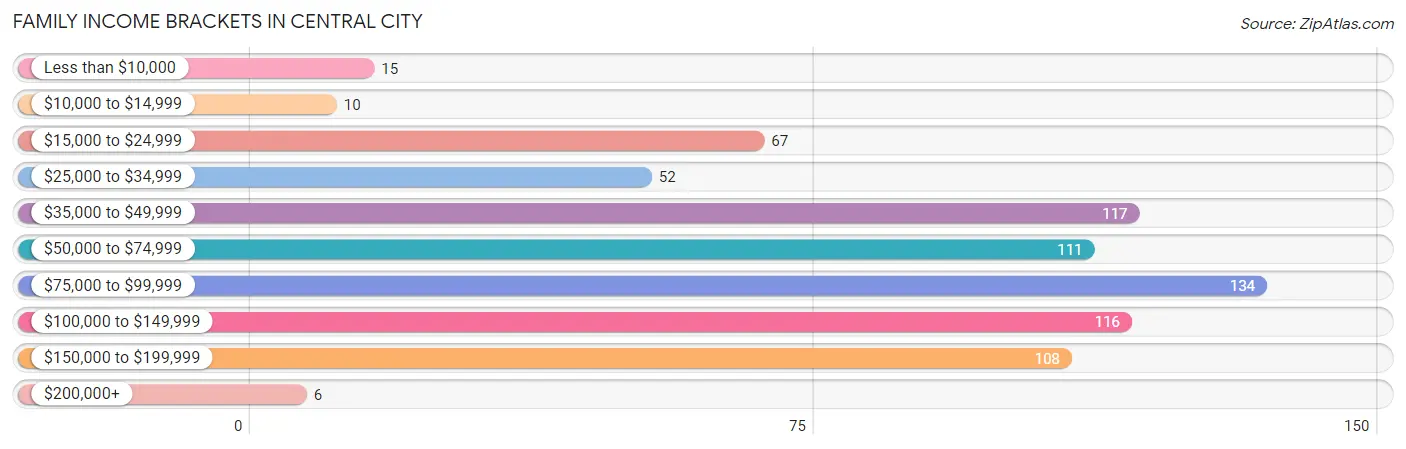
| Income Bracket | # Families | % Families |
| Less than $10,000 | 15 | 2.0% |
| $10,000 to $14,999 | 10 | 1.4% |
| $15,000 to $24,999 | 67 | 9.1% |
| $25,000 to $34,999 | 52 | 7.1% |
| $35,000 to $49,999 | 117 | 15.9% |
| $50,000 to $74,999 | 111 | 15.1% |
| $75,000 to $99,999 | 134 | 18.2% |
| $100,000 to $149,999 | 116 | 15.8% |
| $150,000 to $199,999 | 108 | 14.7% |
| $200,000+ | 6 | 0.8% |
Family Income by Famaliy Size in Central City
4-person families (97 | 13.2%) account for the highest median family income in Central City with $120,341 per family, while 3-person families (133 | 18.1%) have the highest median income of $32,770 per family member.
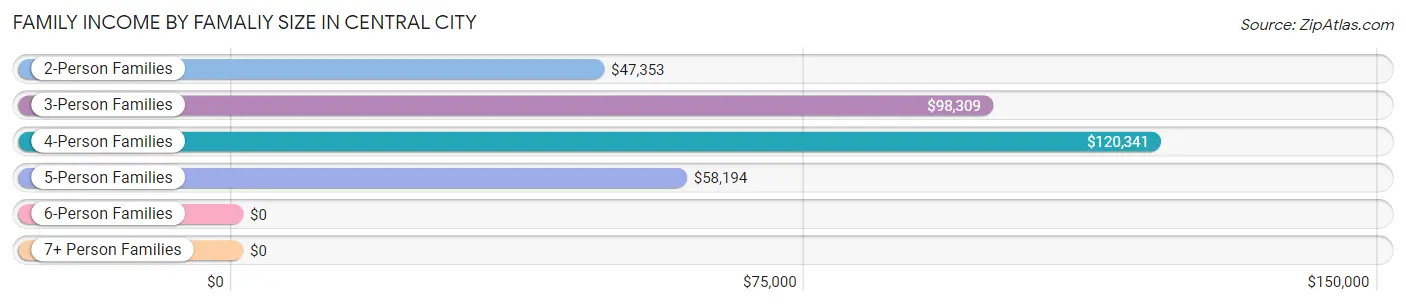
| Income Bracket | # Families | Median Income |
| 2-Person Families | 412 (56.0%) | $47,353 |
| 3-Person Families | 133 (18.1%) | $98,309 |
| 4-Person Families | 97 (13.2%) | $120,341 |
| 5-Person Families | 56 (7.6%) | $58,194 |
| 6-Person Families | 29 (3.9%) | $0 |
| 7+ Person Families | 9 (1.2%) | $0 |
| Total | 736 (100.0%) | $74,333 |
Family Income by Number of Earners in Central City
The median family income in Central City is $74,333, with families comprising 3+ earners (46) having the highest median family income of $165,370, while families with 1 earner (208) have the lowest median family income of $36,724, accounting for 6.2% and 28.3% of families, respectively.
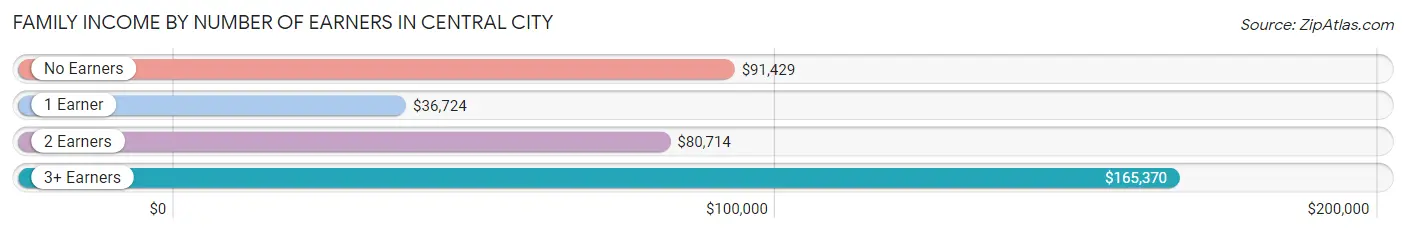
| Number of Earners | # Families | Median Income |
| No Earners | 108 (14.7%) | $91,429 |
| 1 Earner | 208 (28.3%) | $36,724 |
| 2 Earners | 374 (50.8%) | $80,714 |
| 3+ Earners | 46 (6.2%) | $165,370 |
| Total | 736 (100.0%) | $74,333 |
Household Income in Central City
Household Income Brackets in Central City
With 214 households falling in the category, the $35,000 to $49,999 income range is the most frequent in Central City, accounting for 17.8% of all households. In contrast, only 6 households (0.5%) fall into the $200,000+ income bracket, making it the least populous group.
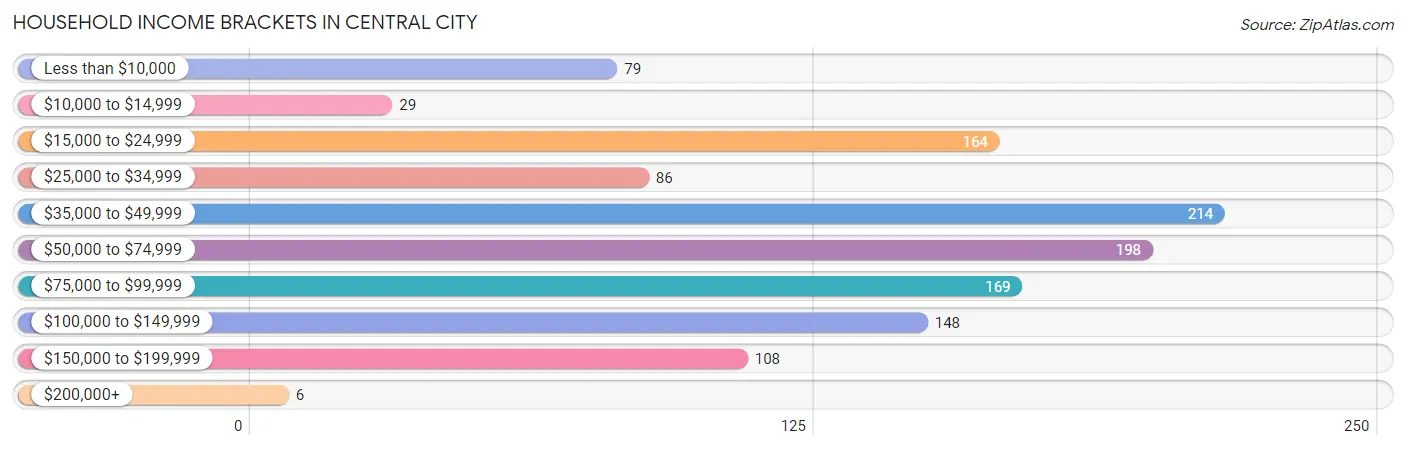
| Income Bracket | # Households | % Households |
| Less than $10,000 | 79 | 6.6% |
| $10,000 to $14,999 | 29 | 2.4% |
| $15,000 to $24,999 | 164 | 13.7% |
| $25,000 to $34,999 | 86 | 7.2% |
| $35,000 to $49,999 | 214 | 17.8% |
| $50,000 to $74,999 | 198 | 16.5% |
| $75,000 to $99,999 | 169 | 14.1% |
| $100,000 to $149,999 | 148 | 12.3% |
| $150,000 to $199,999 | 108 | 9.0% |
| $200,000+ | 6 | 0.5% |
Household Income by Householder Age in Central City
The median household income in Central City is $54,063, with the highest median household income of $60,250 found in the 25 to 44 years age bracket for the primary householder. A total of 462 households (38.5%) fall into this category. Meanwhile, the 15 to 24 years age bracket for the primary householder has the lowest median household income of $36,940, with 65 households (5.4%) in this group.
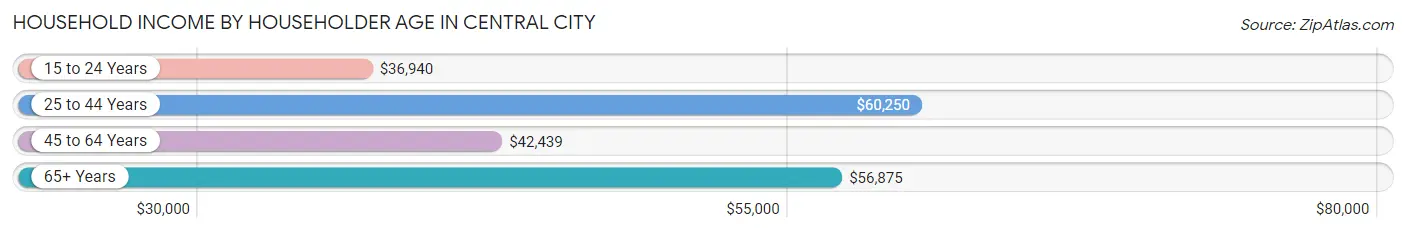
| Income Bracket | # Households | Median Income |
| 15 to 24 Years | 65 (5.4%) | $36,940 |
| 25 to 44 Years | 462 (38.5%) | $60,250 |
| 45 to 64 Years | 276 (23.0%) | $42,439 |
| 65+ Years | 397 (33.1%) | $56,875 |
| Total | 1,200 (100.0%) | $54,063 |
Poverty in Central City
Income Below Poverty by Sex and Age in Central City
With 13.4% poverty level for males and 12.3% for females among the residents of Central City, 18 to 24 year old males and 5 year old females are the most vulnerable to poverty, with 54 males (56.8%) and 13 females (46.4%) in their respective age groups living below the poverty level.
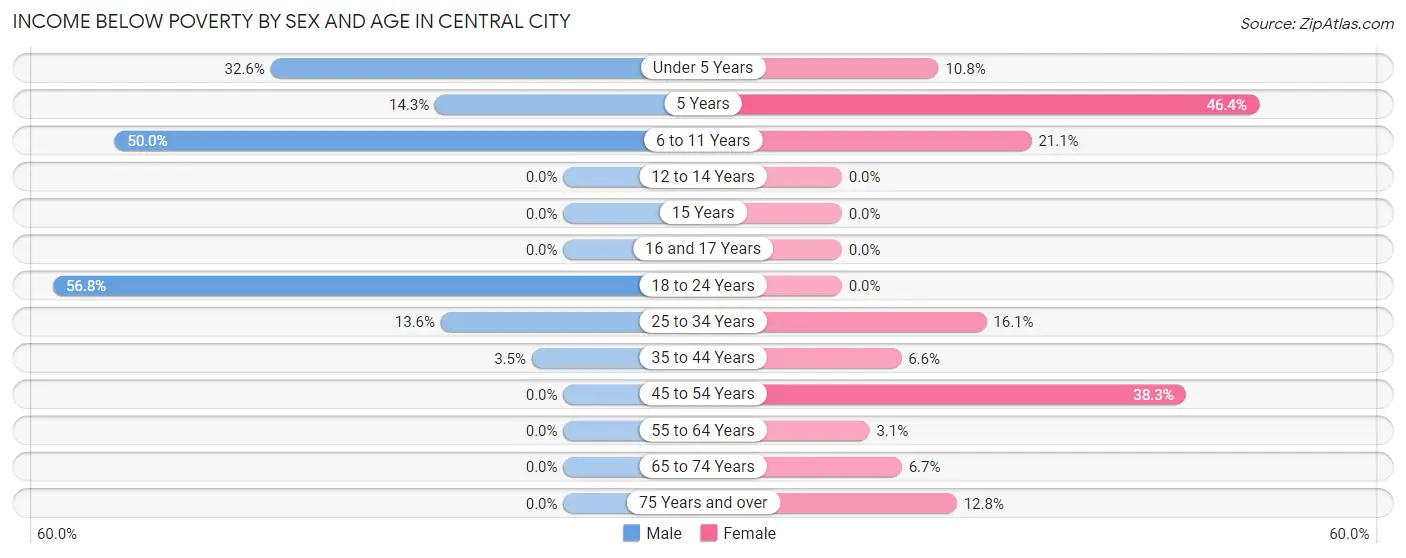
| Age Bracket | Male | Female |
| Under 5 Years | 45 (32.6%) | 7 (10.8%) |
| 5 Years | 6 (14.3%) | 13 (46.4%) |
| 6 to 11 Years | 44 (50.0%) | 34 (21.1%) |
| 12 to 14 Years | 0 (0.0%) | 0 (0.0%) |
| 15 Years | 0 (0.0%) | 0 (0.0%) |
| 16 and 17 Years | 0 (0.0%) | 0 (0.0%) |
| 18 to 24 Years | 54 (56.8%) | 0 (0.0%) |
| 25 to 34 Years | 33 (13.6%) | 38 (16.1%) |
| 35 to 44 Years | 6 (3.5%) | 10 (6.6%) |
| 45 to 54 Years | 0 (0.0%) | 49 (38.3%) |
| 55 to 64 Years | 0 (0.0%) | 7 (3.1%) |
| 65 to 74 Years | 0 (0.0%) | 10 (6.7%) |
| 75 Years and over | 0 (0.0%) | 21 (12.8%) |
| Total | 188 (13.4%) | 189 (12.3%) |
Income Above Poverty by Sex and Age in Central City
According to the poverty statistics in Central City, males aged 12 to 14 years and females aged 12 to 14 years are the age groups that are most secure financially, with 100.0% of males and 100.0% of females in these age groups living above the poverty line.
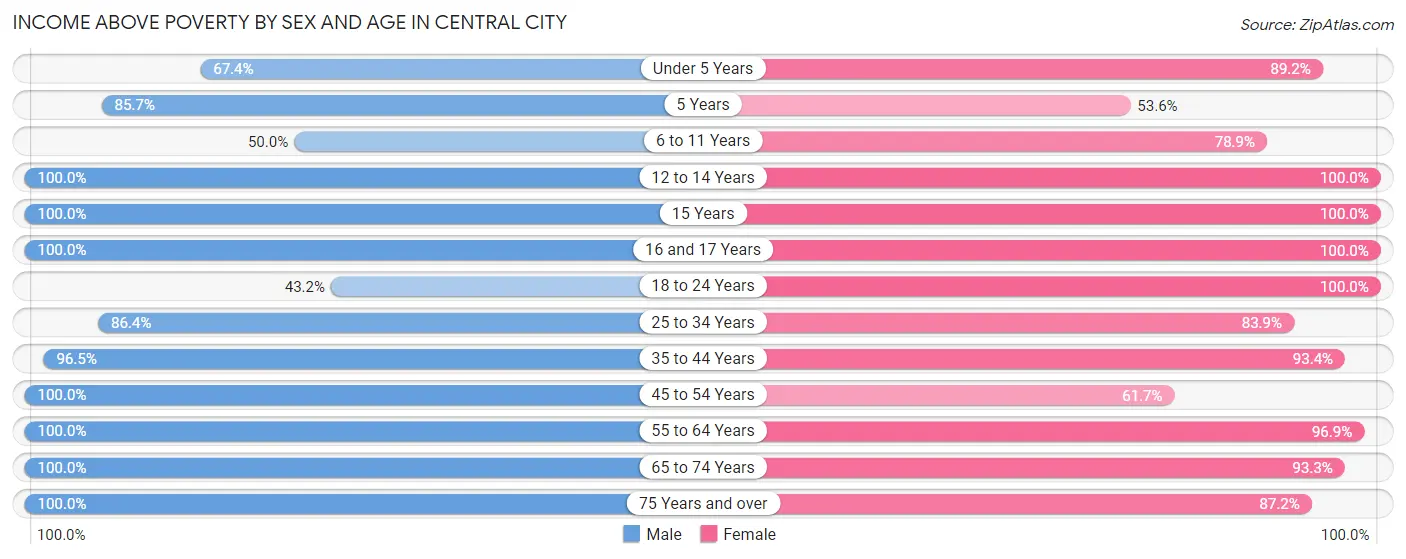
| Age Bracket | Male | Female |
| Under 5 Years | 93 (67.4%) | 58 (89.2%) |
| 5 Years | 36 (85.7%) | 15 (53.6%) |
| 6 to 11 Years | 44 (50.0%) | 127 (78.9%) |
| 12 to 14 Years | 88 (100.0%) | 28 (100.0%) |
| 15 Years | 18 (100.0%) | 16 (100.0%) |
| 16 and 17 Years | 26 (100.0%) | 48 (100.0%) |
| 18 to 24 Years | 41 (43.2%) | 128 (100.0%) |
| 25 to 34 Years | 209 (86.4%) | 198 (83.9%) |
| 35 to 44 Years | 165 (96.5%) | 141 (93.4%) |
| 45 to 54 Years | 112 (100.0%) | 79 (61.7%) |
| 55 to 64 Years | 152 (100.0%) | 220 (96.9%) |
| 65 to 74 Years | 172 (100.0%) | 140 (93.3%) |
| 75 Years and over | 57 (100.0%) | 143 (87.2%) |
| Total | 1,213 (86.6%) | 1,341 (87.6%) |
Income Below Poverty Among Married-Couple Families in Central City
The poverty statistics for married-couple families in Central City show that 2.3% or 13 of the total 556 families live below the poverty line. Families with 3 or 4 children have the highest poverty rate of 19.7%, comprising of 13 families. On the other hand, families with no children have the lowest poverty rate of 0.0%, which includes 0 families.
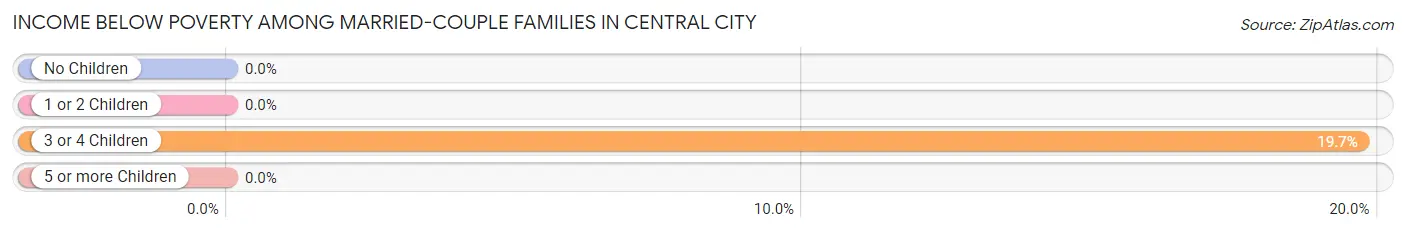
| Children | Above Poverty | Below Poverty |
| No Children | 363 (100.0%) | 0 (0.0%) |
| 1 or 2 Children | 127 (100.0%) | 0 (0.0%) |
| 3 or 4 Children | 53 (80.3%) | 13 (19.7%) |
| 5 or more Children | 0 (0.0%) | 0 (0.0%) |
| Total | 543 (97.7%) | 13 (2.3%) |
Income Below Poverty Among Single-Parent Households in Central City
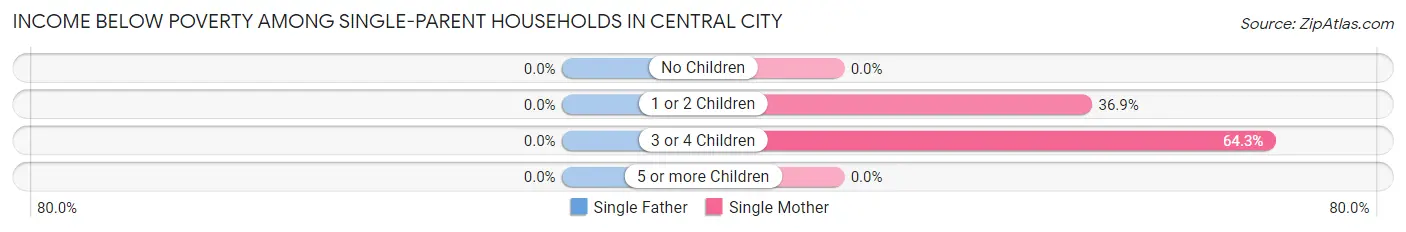
| Children | Single Father | Single Mother |
| No Children | 0 (0.0%) | 0 (0.0%) |
| 1 or 2 Children | 0 (0.0%) | 41 (36.9%) |
| 3 or 4 Children | 0 (0.0%) | 18 (64.3%) |
| 5 or more Children | 0 (0.0%) | 0 (0.0%) |
| Total | 0 (0.0%) | 59 (37.8%) |
Income Below Poverty Among Married-Couple vs Single-Parent Households in Central City
The poverty data for Central City shows that 13 of the married-couple family households (2.3%) and 59 of the single-parent households (32.8%) are living below the poverty level. Within the married-couple family households, those with 3 or 4 children have the highest poverty rate, with 13 households (19.7%) falling below the poverty line. Among the single-parent households, those with 3 or 4 children have the highest poverty rate, with 18 household (39.1%) living below poverty.
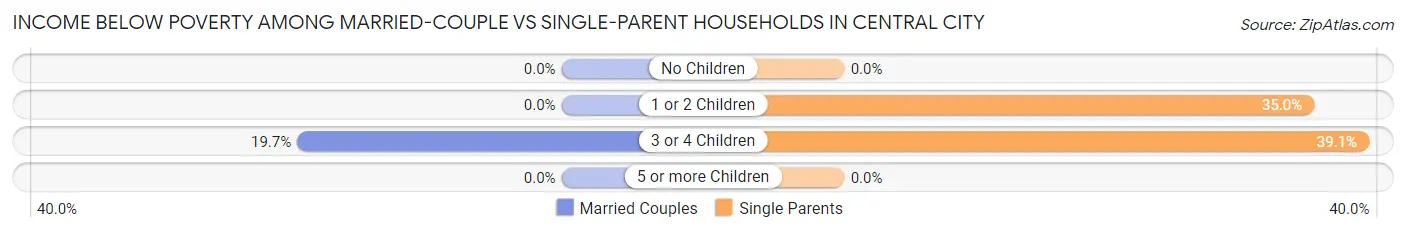
| Children | Married-Couple Families | Single-Parent Households |
| No Children | 0 (0.0%) | 0 (0.0%) |
| 1 or 2 Children | 0 (0.0%) | 41 (35.0%) |
| 3 or 4 Children | 13 (19.7%) | 18 (39.1%) |
| 5 or more Children | 0 (0.0%) | 0 (0.0%) |
| Total | 13 (2.3%) | 59 (32.8%) |
Race in Central City
The most populous races in Central City are White / Caucasian (2,715 | 89.5%), Hispanic or Latino (227 | 7.5%), and Two or more Races (128 | 4.2%).
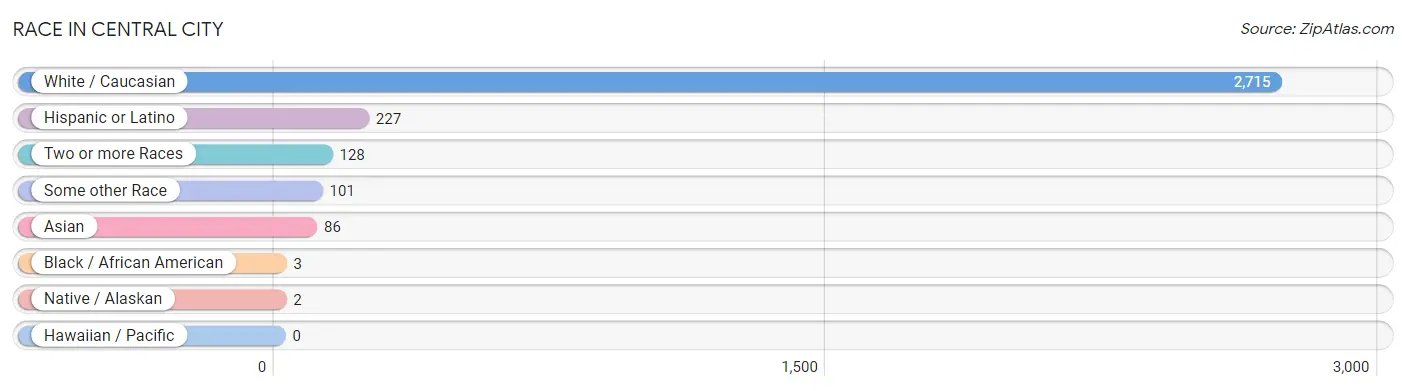
| Race | # Population | % Population |
| Asian | 86 | 2.8% |
| Black / African American | 3 | 0.1% |
| Hawaiian / Pacific | 0 | 0.0% |
| Hispanic or Latino | 227 | 7.5% |
| Native / Alaskan | 2 | 0.1% |
| White / Caucasian | 2,715 | 89.5% |
| Two or more Races | 128 | 4.2% |
| Some other Race | 101 | 3.3% |
| Total | 3,035 | 100.0% |
Ancestry in Central City
The most populous ancestries reported in Central City are German (1,130 | 37.2%), Irish (392 | 12.9%), American (270 | 8.9%), English (161 | 5.3%), and Swedish (142 | 4.7%), together accounting for 69.0% of all Central City residents.
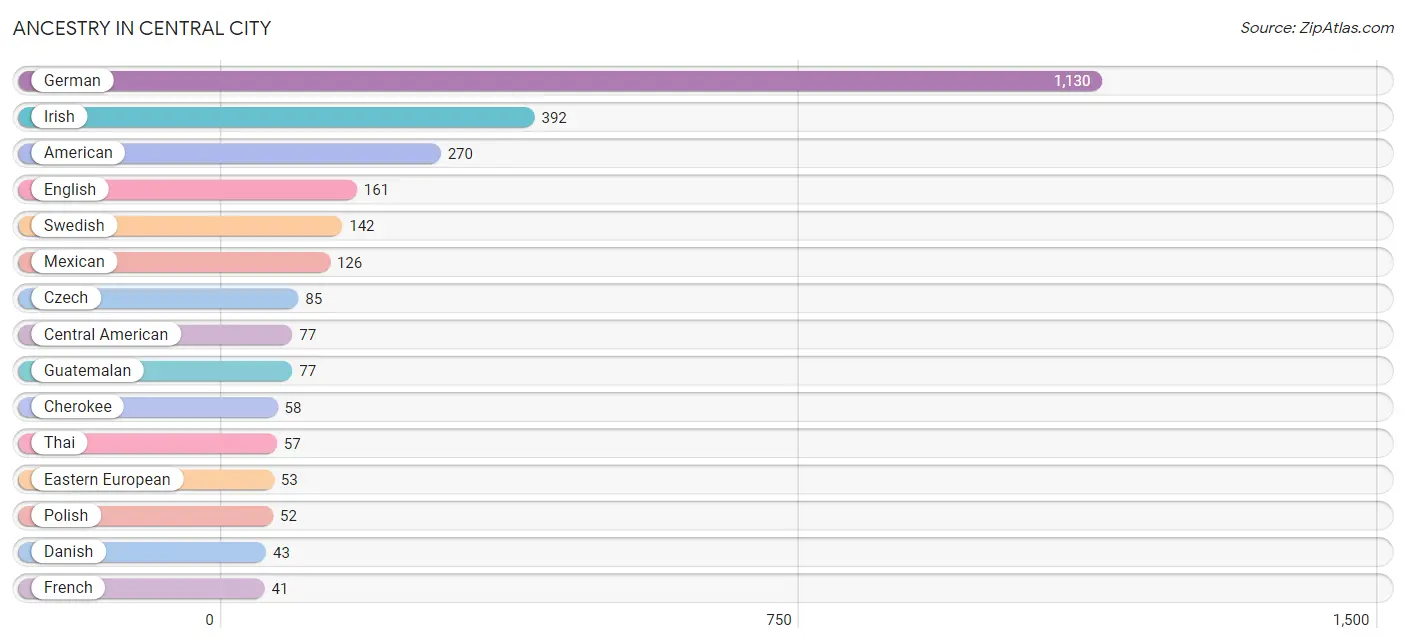
| Ancestry | # Population | % Population |
| American | 270 | 8.9% |
| Apache | 5 | 0.2% |
| Austrian | 1 | 0.0% |
| British | 30 | 1.0% |
| Central American | 77 | 2.5% |
| Cherokee | 58 | 1.9% |
| Czech | 85 | 2.8% |
| Danish | 43 | 1.4% |
| Dutch | 39 | 1.3% |
| Eastern European | 53 | 1.8% |
| English | 161 | 5.3% |
| European | 38 | 1.3% |
| Filipino | 29 | 1.0% |
| French | 41 | 1.3% |
| German | 1,130 | 37.2% |
| Guatemalan | 77 | 2.5% |
| Irish | 392 | 12.9% |
| Iroquois | 1 | 0.0% |
| Italian | 41 | 1.3% |
| Mexican | 126 | 4.2% |
| Mexican American Indian | 5 | 0.2% |
| Norwegian | 10 | 0.3% |
| Pennsylvania German | 11 | 0.4% |
| Polish | 52 | 1.7% |
| Puerto Rican | 24 | 0.8% |
| Scotch-Irish | 11 | 0.4% |
| Scottish | 11 | 0.4% |
| Sioux | 2 | 0.1% |
| Swedish | 142 | 4.7% |
| Thai | 57 | 1.9% |
| Welsh | 37 | 1.2% | View All 31 Rows |
Immigrants in Central City
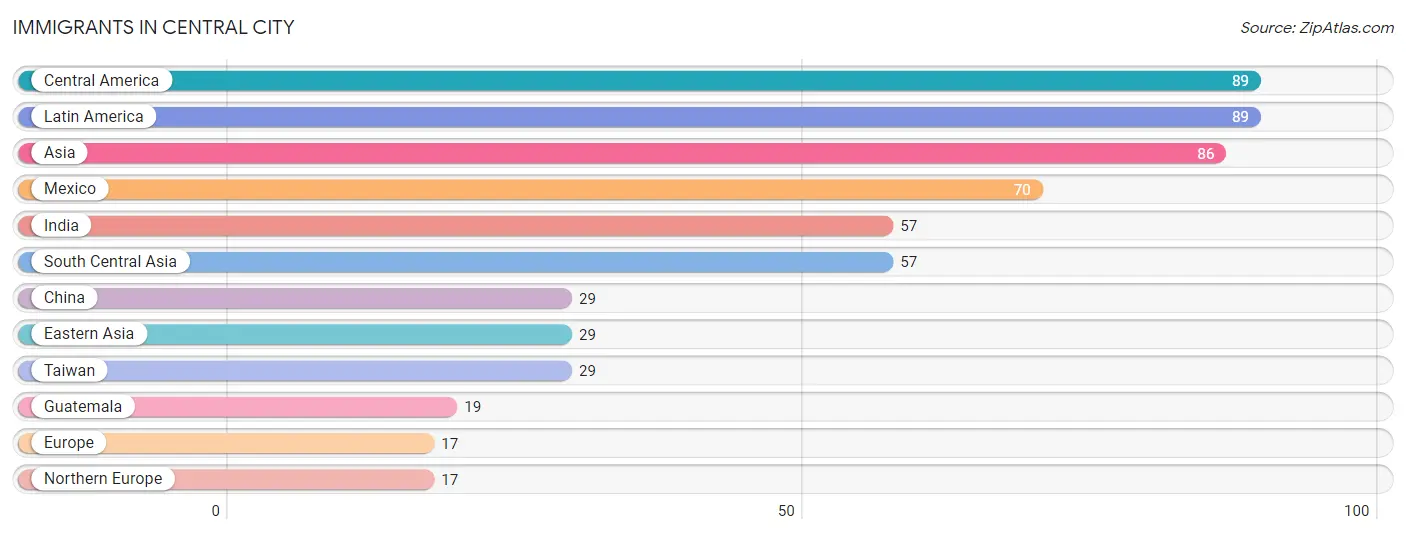
The most numerous immigrant groups reported in Central City came from Central America (89 | 2.9%), Latin America (89 | 2.9%), Asia (86 | 2.8%), Mexico (70 | 2.3%), and India (57 | 1.9%), together accounting for 12.9% of all Central City residents.
| Immigration Origin | # Population | % Population |
| Asia | 86 | 2.8% |
| Central America | 89 | 2.9% |
| China | 29 | 1.0% |
| Eastern Asia | 29 | 1.0% |
| Europe | 17 | 0.6% |
| Guatemala | 19 | 0.6% |
| India | 57 | 1.9% |
| Latin America | 89 | 2.9% |
| Mexico | 70 | 2.3% |
| Northern Europe | 17 | 0.6% |
| South Central Asia | 57 | 1.9% |
| Taiwan | 29 | 1.0% | View All 12 Rows |
Sex and Age in Central City
Sex and Age in Central City
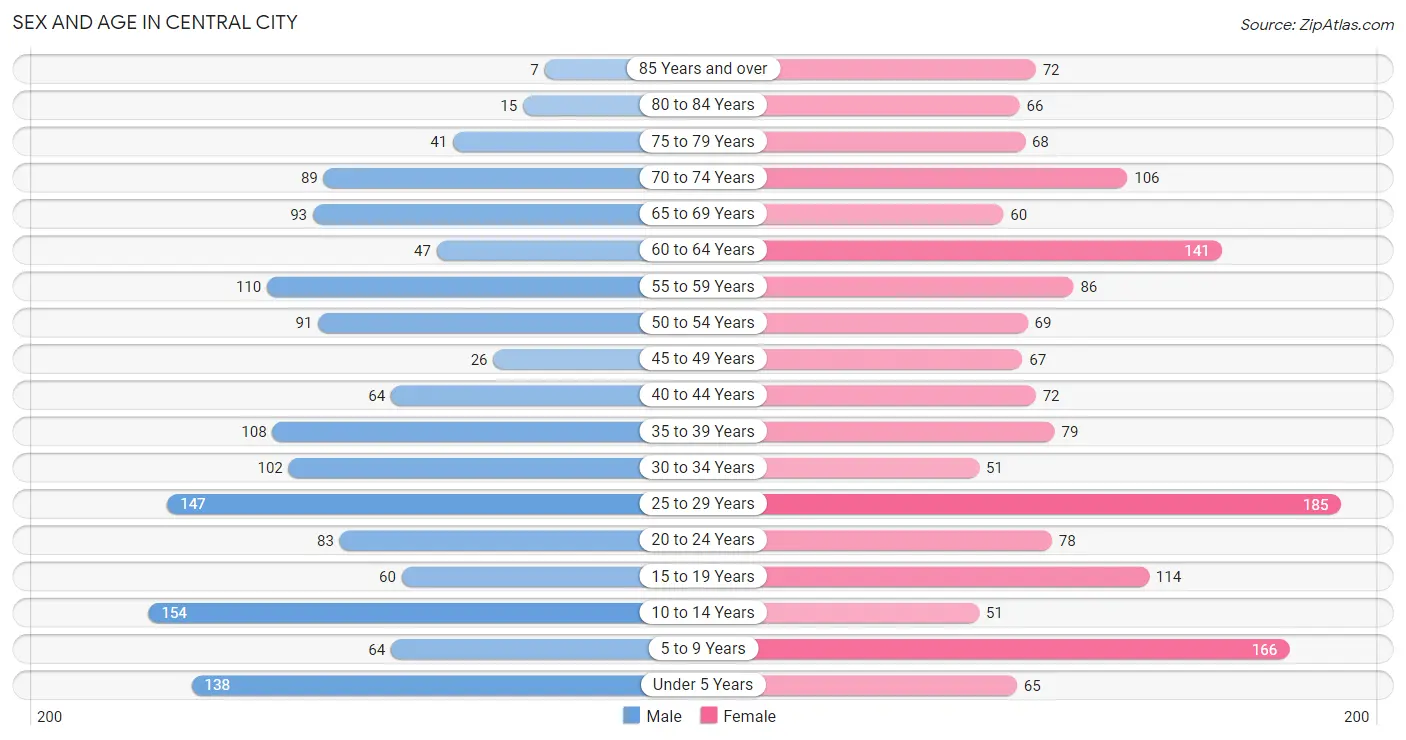
The most populous age groups in Central City are 10 to 14 Years (154 | 10.7%) for men and 25 to 29 Years (185 | 11.6%) for women.
| Age Bracket | Male | Female |
| Under 5 Years | 138 (9.6%) | 65 (4.1%) |
| 5 to 9 Years | 64 (4.4%) | 166 (10.4%) |
| 10 to 14 Years | 154 (10.7%) | 51 (3.2%) |
| 15 to 19 Years | 60 (4.2%) | 114 (7.1%) |
| 20 to 24 Years | 83 (5.8%) | 78 (4.9%) |
| 25 to 29 Years | 147 (10.2%) | 185 (11.6%) |
| 30 to 34 Years | 102 (7.1%) | 51 (3.2%) |
| 35 to 39 Years | 108 (7.5%) | 79 (5.0%) |
| 40 to 44 Years | 64 (4.4%) | 72 (4.5%) |
| 45 to 49 Years | 26 (1.8%) | 67 (4.2%) |
| 50 to 54 Years | 91 (6.3%) | 69 (4.3%) |
| 55 to 59 Years | 110 (7.6%) | 86 (5.4%) |
| 60 to 64 Years | 47 (3.3%) | 141 (8.8%) |
| 65 to 69 Years | 93 (6.5%) | 60 (3.8%) |
| 70 to 74 Years | 89 (6.2%) | 106 (6.6%) |
| 75 to 79 Years | 41 (2.9%) | 68 (4.3%) |
| 80 to 84 Years | 15 (1.0%) | 66 (4.1%) |
| 85 Years and over | 7 (0.5%) | 72 (4.5%) |
| Total | 1,439 (100.0%) | 1,596 (100.0%) |
Families and Households in Central City
Median Family Size in Central City
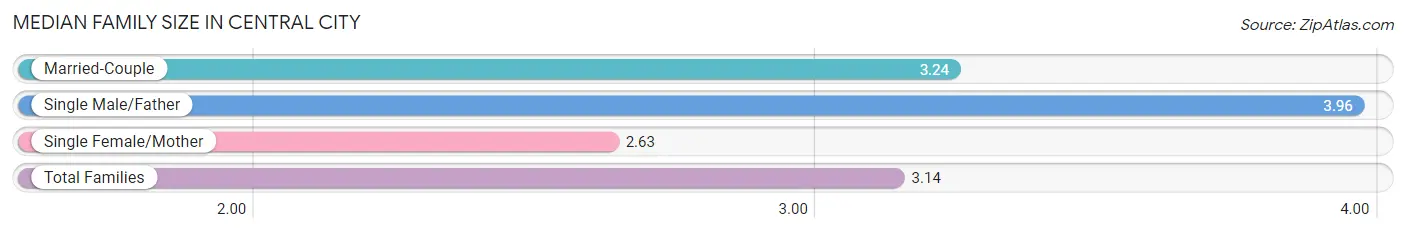
The median family size in Central City is 3.14 persons per family, with single male/father families (24 | 3.3%) accounting for the largest median family size of 3.96 persons per family. On the other hand, single female/mother families (156 | 21.2%) represent the smallest median family size with 2.63 persons per family.
| Family Type | # Families | Family Size |
| Married-Couple | 556 (75.5%) | 3.24 |
| Single Male/Father | 24 (3.3%) | 3.96 |
| Single Female/Mother | 156 (21.2%) | 2.63 |
| Total Families | 736 (100.0%) | 3.14 |
Median Household Size in Central City
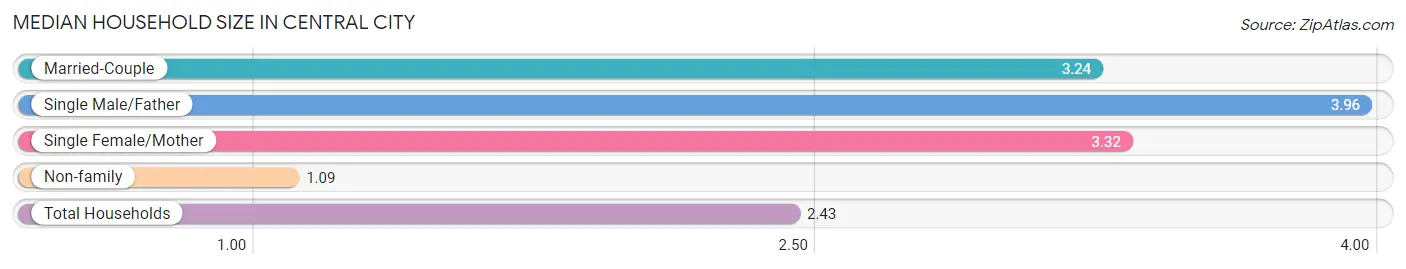
The median household size in Central City is 2.43 persons per household, with single male/father households (24 | 2.0%) accounting for the largest median household size of 3.96 persons per household. non-family households (464 | 38.7%) represent the smallest median household size with 1.09 persons per household.
| Household Type | # Households | Household Size |
| Married-Couple | 556 (46.3%) | 3.24 |
| Single Male/Father | 24 (2.0%) | 3.96 |
| Single Female/Mother | 156 (13.0%) | 3.32 |
| Non-family | 464 (38.7%) | 1.09 |
| Total Households | 1,200 (100.0%) | 2.43 |
Household Size by Marriage Status in Central City
Out of a total of 1,200 households in Central City, 736 (61.3%) are family households, while 464 (38.7%) are nonfamily households. The most numerous type of family households are 2-person households, comprising 345, and the most common type of nonfamily households are 1-person households, comprising 423.
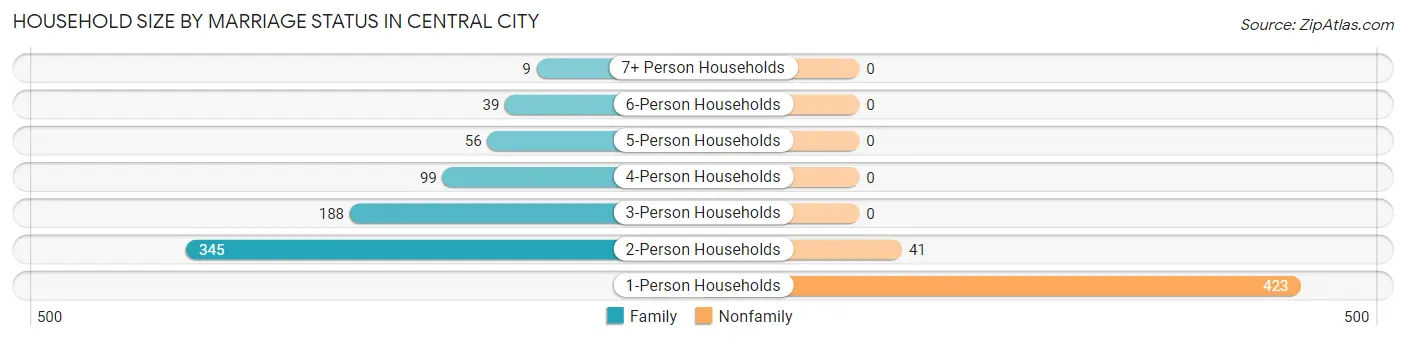
| Household Size | Family Households | Nonfamily Households |
| 1-Person Households | - | 423 (35.2%) |
| 2-Person Households | 345 (28.7%) | 41 (3.4%) |
| 3-Person Households | 188 (15.7%) | 0 (0.0%) |
| 4-Person Households | 99 (8.3%) | 0 (0.0%) |
| 5-Person Households | 56 (4.7%) | 0 (0.0%) |
| 6-Person Households | 39 (3.3%) | 0 (0.0%) |
| 7+ Person Households | 9 (0.7%) | 0 (0.0%) |
| Total | 736 (61.3%) | 464 (38.7%) |
Female Fertility in Central City
Fertility by Age in Central City
Average fertility rate in Central City is 52.0 births per 1,000 women. Women in the age bracket of 20 to 34 years have the highest fertility rate with 108.0 births per 1,000 women. Women in the age bracket of 20 to 34 years acount for 100.0% of all women with births.
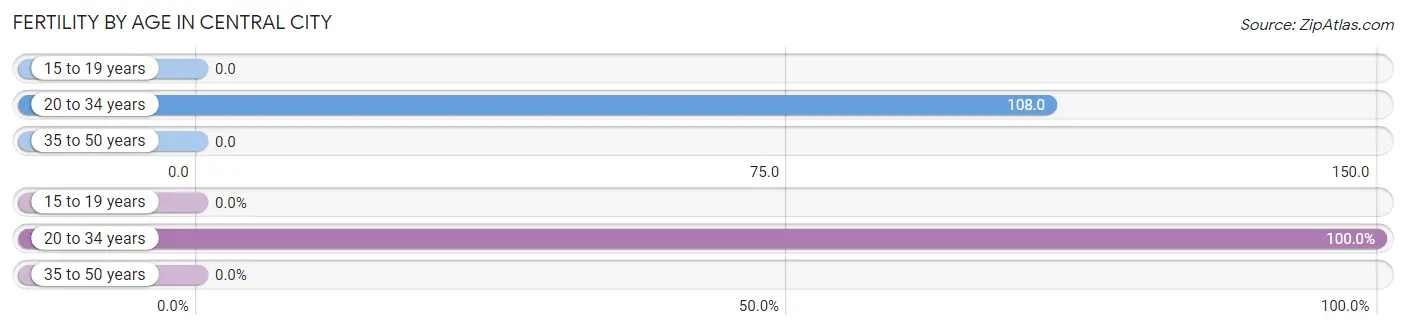
| Age Bracket | Women with Births | Births / 1,000 Women |
| 15 to 19 years | 0 (0.0%) | 0.0 |
| 20 to 34 years | 34 (100.0%) | 108.0 |
| 35 to 50 years | 0 (0.0%) | 0.0 |
| Total | 34 (100.0%) | 52.0 |
Fertility by Age by Marriage Status in Central City
35.3% of women with births (34) in Central City are married. The highest percentage of unmarried women with births falls into 20 to 34 years age bracket with 64.7% of them unmarried at the time of birth, while the lowest percentage of unmarried women with births belong to 20 to 34 years age bracket with 64.7% of them unmarried.
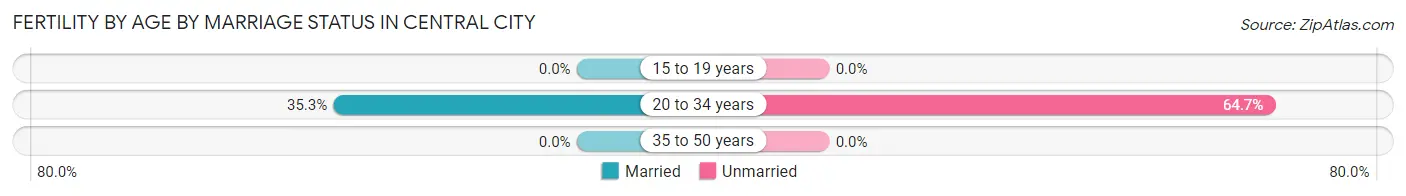
| Age Bracket | Married | Unmarried |
| 15 to 19 years | 0 (0.0%) | 0 (0.0%) |
| 20 to 34 years | 12 (35.3%) | 22 (64.7%) |
| 35 to 50 years | 0 (0.0%) | 0 (0.0%) |
| Total | 12 (35.3%) | 22 (64.7%) |
Fertility by Education in Central City
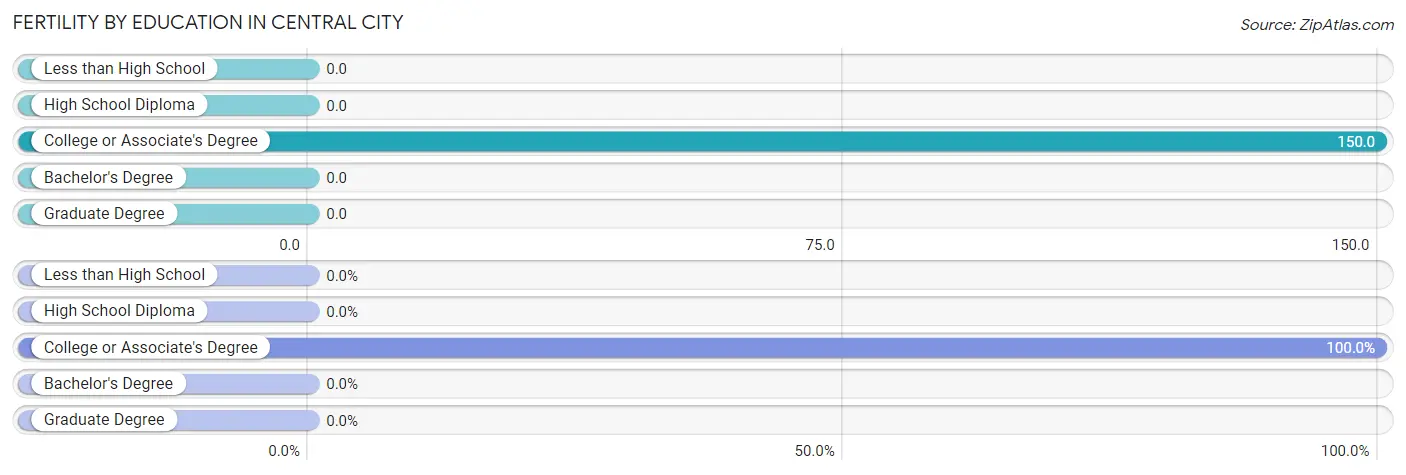
| Educational Attainment | Women with Births | Births / 1,000 Women |
| Less than High School | 0 (0.0%) | 0.0 |
| High School Diploma | 0 (0.0%) | 0.0 |
| College or Associate's Degree | 34 (100.0%) | 150.0 |
| Bachelor's Degree | 0 (0.0%) | 0.0 |
| Graduate Degree | 0 (0.0%) | 0.0 |
| Total | 34 (100.0%) | 52.0 |
Fertility by Education by Marriage Status in Central City
64.7% of women with births in Central City are unmarried. Women with the educational attainment of college or associate's degree are most likely to be married with 35.3% of them married at childbirth, while women with the educational attainment of college or associate's degree are least likely to be married with 64.7% of them unmarried at childbirth.
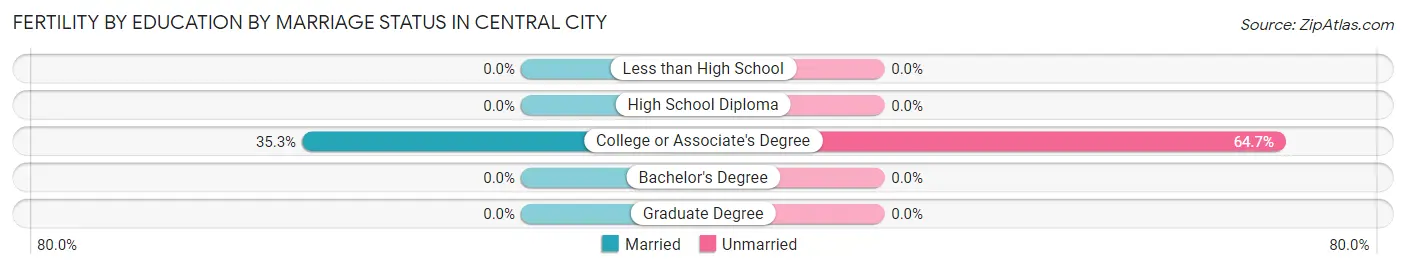
| Educational Attainment | Married | Unmarried |
| Less than High School | 0 (0.0%) | 0 (0.0%) |
| High School Diploma | 0 (0.0%) | 0 (0.0%) |
| College or Associate's Degree | 12 (35.3%) | 22 (64.7%) |
| Bachelor's Degree | 0 (0.0%) | 0 (0.0%) |
| Graduate Degree | 0 (0.0%) | 0 (0.0%) |
| Total | 12 (35.3%) | 22 (64.7%) |
Employment Characteristics in Central City
Employment by Class of Employer in Central City
Among the 1,244 employed individuals in Central City, private company employees (819 | 65.8%), local government employees (173 | 13.9%), and self-employed (not incorporated) (107 | 8.6%) make up the most common classes of employment.
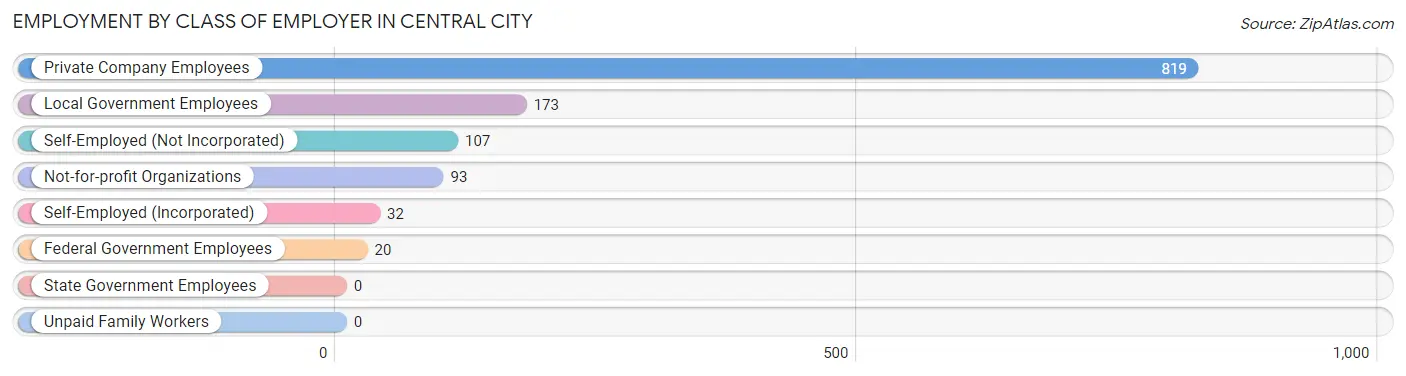
| Employer Class | # Employees | % Employees |
| Private Company Employees | 819 | 65.8% |
| Self-Employed (Incorporated) | 32 | 2.6% |
| Self-Employed (Not Incorporated) | 107 | 8.6% |
| Not-for-profit Organizations | 93 | 7.5% |
| Local Government Employees | 173 | 13.9% |
| State Government Employees | 0 | 0.0% |
| Federal Government Employees | 20 | 1.6% |
| Unpaid Family Workers | 0 | 0.0% |
| Total | 1,244 | 100.0% |
Employment Status by Age in Central City
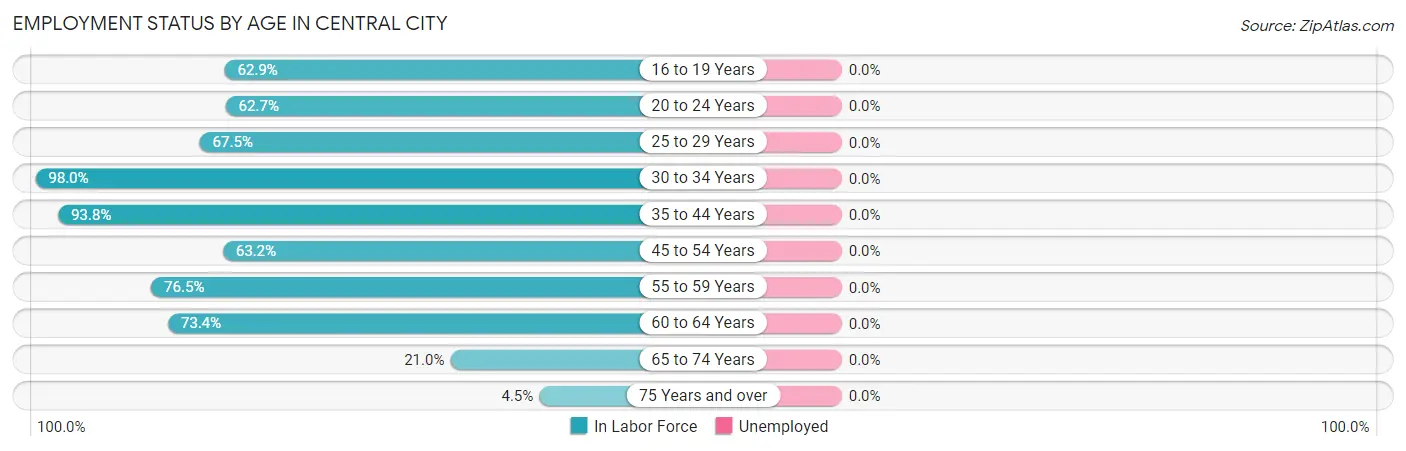
| Age Bracket | In Labor Force | Unemployed |
| 16 to 19 Years | 88 (62.9%) | 0 (0.0%) |
| 20 to 24 Years | 101 (62.7%) | 0 (0.0%) |
| 25 to 29 Years | 224 (67.5%) | 0 (0.0%) |
| 30 to 34 Years | 150 (98.0%) | 0 (0.0%) |
| 35 to 44 Years | 303 (93.8%) | 0 (0.0%) |
| 45 to 54 Years | 160 (63.2%) | 0 (0.0%) |
| 55 to 59 Years | 150 (76.5%) | 0 (0.0%) |
| 60 to 64 Years | 138 (73.4%) | 0 (0.0%) |
| 65 to 74 Years | 73 (21.0%) | 0 (0.0%) |
| 75 Years and over | 12 (4.5%) | 0 (0.0%) |
| Total | 1,399 (59.2%) | 0 (0.0%) |
Employment Status by Educational Attainment in Central City
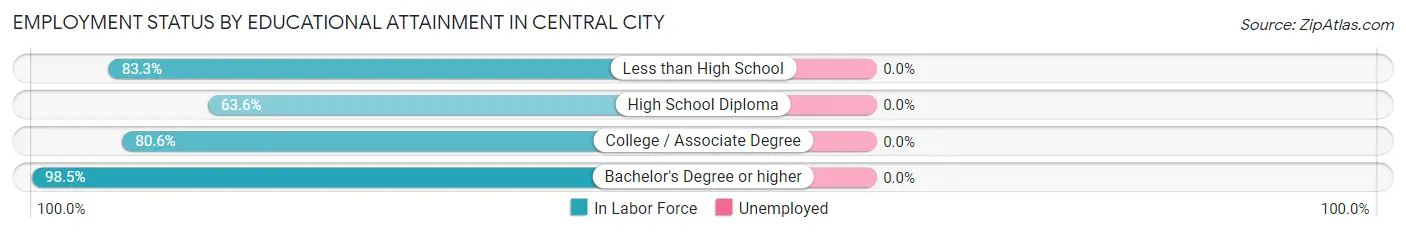
| Educational Attainment | In Labor Force | Unemployed |
| Less than High School | 55 (83.3%) | 0 (0.0%) |
| High School Diploma | 341 (63.6%) | 0 (0.0%) |
| College / Associate Degree | 458 (80.6%) | 0 (0.0%) |
| Bachelor's Degree or higher | 271 (98.5%) | 0 (0.0%) |
| Total | 1,126 (77.9%) | 0 (0.0%) |
Employment Occupations by Sex in Central City
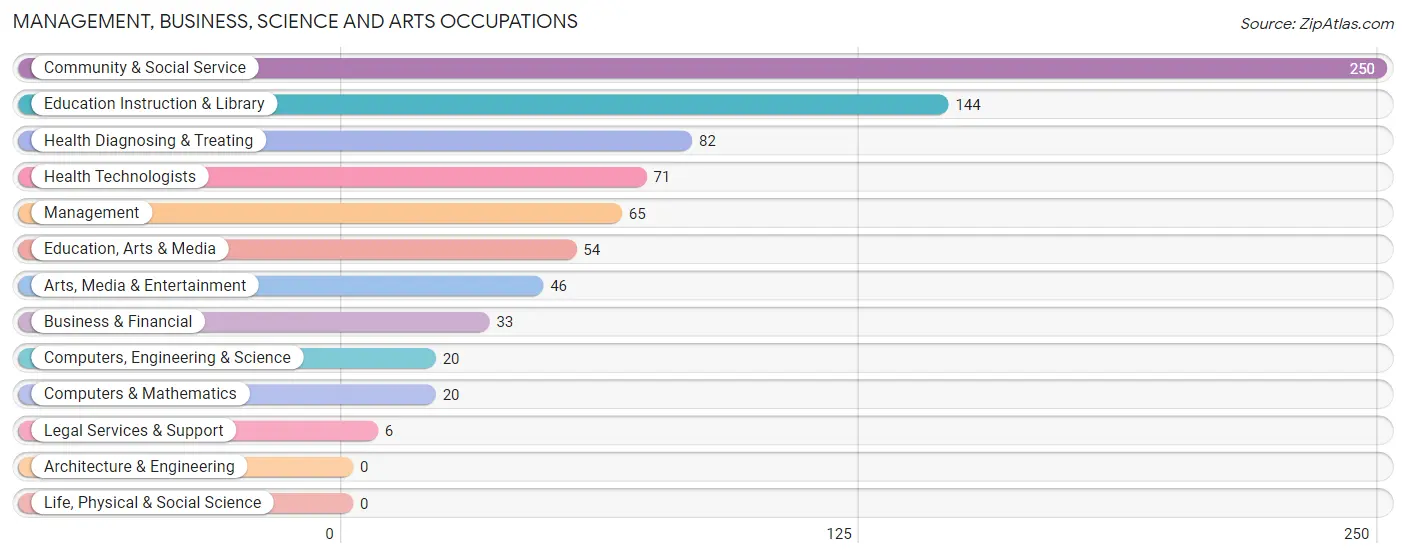
Management, Business, Science and Arts Occupations
The most common Management, Business, Science and Arts occupations in Central City are Community & Social Service (250 | 17.9%), Education Instruction & Library (144 | 10.3%), Health Diagnosing & Treating (82 | 5.9%), Health Technologists (71 | 5.1%), and Management (65 | 4.6%).
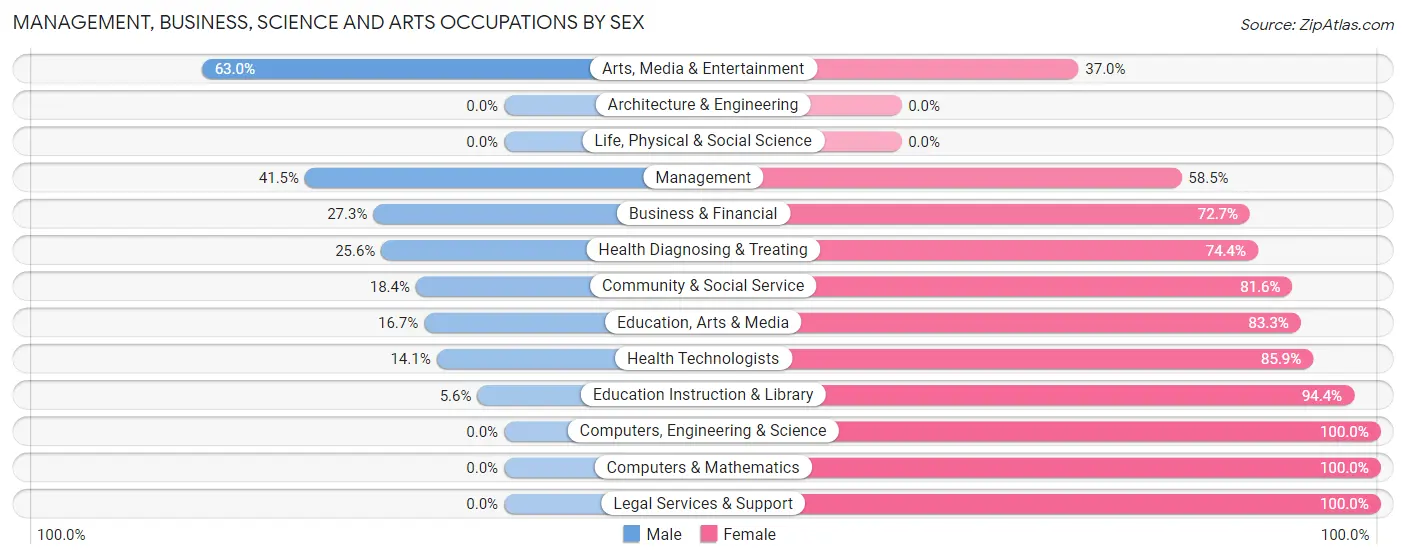
Management, Business, Science and Arts Occupations by Sex
Within the Management, Business, Science and Arts occupations in Central City, the most male-oriented occupations are Arts, Media & Entertainment (63.0%), Management (41.5%), and Business & Financial (27.3%), while the most female-oriented occupations are Computers, Engineering & Science (100.0%), Computers & Mathematics (100.0%), and Legal Services & Support (100.0%).
| Occupation | Male | Female |
| Management | 27 (41.5%) | 38 (58.5%) |
| Business & Financial | 9 (27.3%) | 24 (72.7%) |
| Computers, Engineering & Science | 0 (0.0%) | 20 (100.0%) |
| Computers & Mathematics | 0 (0.0%) | 20 (100.0%) |
| Architecture & Engineering | 0 (0.0%) | 0 (0.0%) |
| Life, Physical & Social Science | 0 (0.0%) | 0 (0.0%) |
| Community & Social Service | 46 (18.4%) | 204 (81.6%) |
| Education, Arts & Media | 9 (16.7%) | 45 (83.3%) |
| Legal Services & Support | 0 (0.0%) | 6 (100.0%) |
| Education Instruction & Library | 8 (5.6%) | 136 (94.4%) |
| Arts, Media & Entertainment | 29 (63.0%) | 17 (37.0%) |
| Health Diagnosing & Treating | 21 (25.6%) | 61 (74.4%) |
| Health Technologists | 10 (14.1%) | 61 (85.9%) |
| Total (Category) | 103 (22.9%) | 347 (77.1%) |
| Total (Overall) | 653 (46.7%) | 746 (53.3%) |
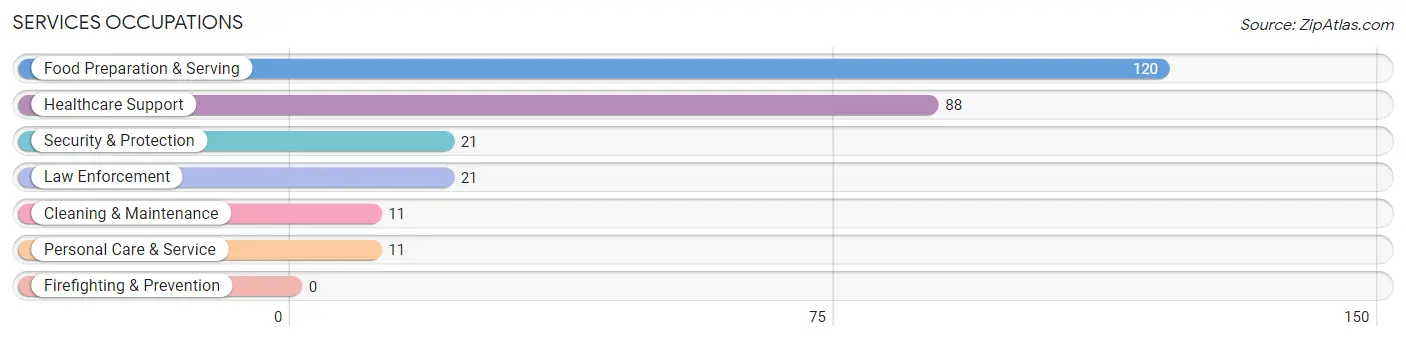
Services Occupations
The most common Services occupations in Central City are Food Preparation & Serving (120 | 8.6%), Healthcare Support (88 | 6.3%), Security & Protection (21 | 1.5%), Law Enforcement (21 | 1.5%), and Cleaning & Maintenance (11 | 0.8%).
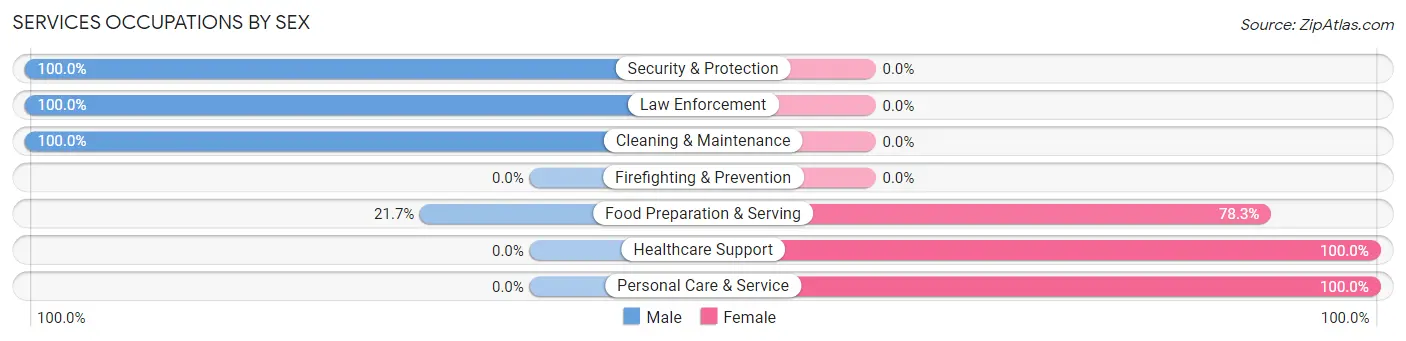
Services Occupations by Sex
Within the Services occupations in Central City, the most male-oriented occupations are Security & Protection (100.0%), Law Enforcement (100.0%), and Cleaning & Maintenance (100.0%), while the most female-oriented occupations are Healthcare Support (100.0%), Personal Care & Service (100.0%), and Food Preparation & Serving (78.3%).
| Occupation | Male | Female |
| Healthcare Support | 0 (0.0%) | 88 (100.0%) |
| Security & Protection | 21 (100.0%) | 0 (0.0%) |
| Firefighting & Prevention | 0 (0.0%) | 0 (0.0%) |
| Law Enforcement | 21 (100.0%) | 0 (0.0%) |
| Food Preparation & Serving | 26 (21.7%) | 94 (78.3%) |
| Cleaning & Maintenance | 11 (100.0%) | 0 (0.0%) |
| Personal Care & Service | 0 (0.0%) | 11 (100.0%) |
| Total (Category) | 58 (23.1%) | 193 (76.9%) |
| Total (Overall) | 653 (46.7%) | 746 (53.3%) |
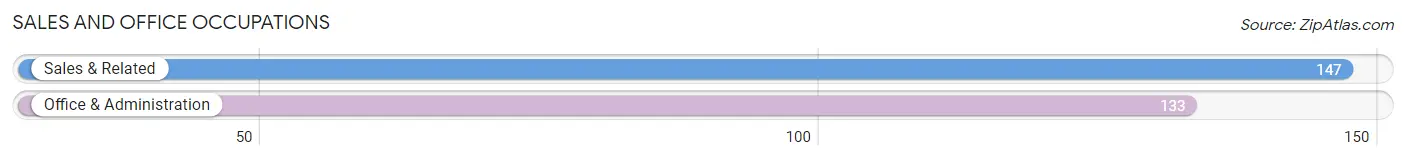
Sales and Office Occupations
The most common Sales and Office occupations in Central City are Sales & Related (147 | 10.5%), and Office & Administration (133 | 9.5%).
Sales and Office Occupations by Sex
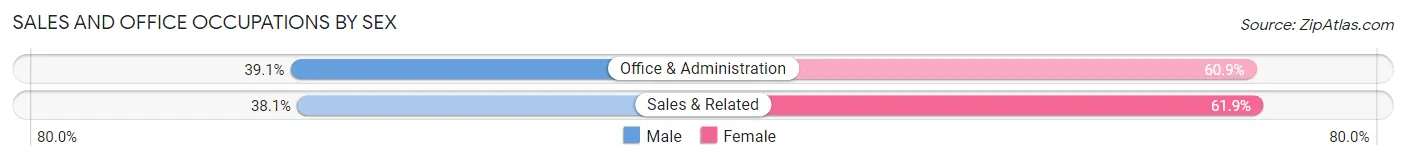
| Occupation | Male | Female |
| Sales & Related | 56 (38.1%) | 91 (61.9%) |
| Office & Administration | 52 (39.1%) | 81 (60.9%) |
| Total (Category) | 108 (38.6%) | 172 (61.4%) |
| Total (Overall) | 653 (46.7%) | 746 (53.3%) |
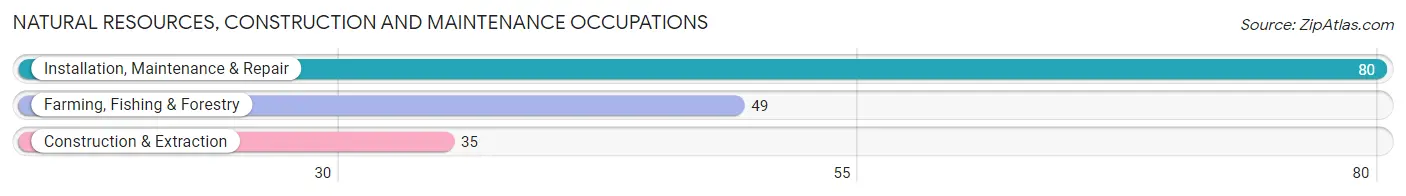
Natural Resources, Construction and Maintenance Occupations
The most common Natural Resources, Construction and Maintenance occupations in Central City are Installation, Maintenance & Repair (80 | 5.7%), Farming, Fishing & Forestry (49 | 3.5%), and Construction & Extraction (35 | 2.5%).
Natural Resources, Construction and Maintenance Occupations by Sex

| Occupation | Male | Female |
| Farming, Fishing & Forestry | 43 (87.8%) | 6 (12.2%) |
| Construction & Extraction | 35 (100.0%) | 0 (0.0%) |
| Installation, Maintenance & Repair | 80 (100.0%) | 0 (0.0%) |
| Total (Category) | 158 (96.3%) | 6 (3.7%) |
| Total (Overall) | 653 (46.7%) | 746 (53.3%) |
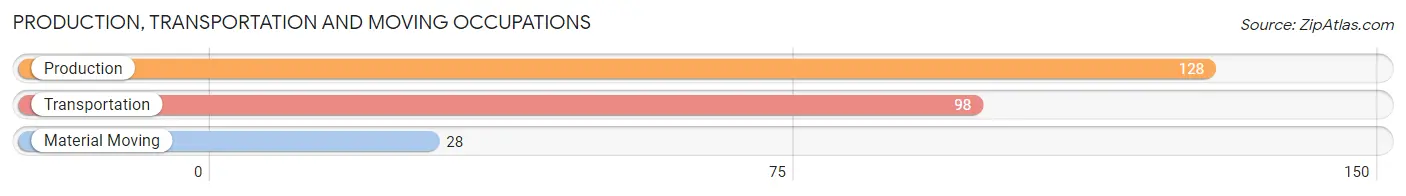
Production, Transportation and Moving Occupations
The most common Production, Transportation and Moving occupations in Central City are Production (128 | 9.1%), Transportation (98 | 7.0%), and Material Moving (28 | 2.0%).
Production, Transportation and Moving Occupations by Sex
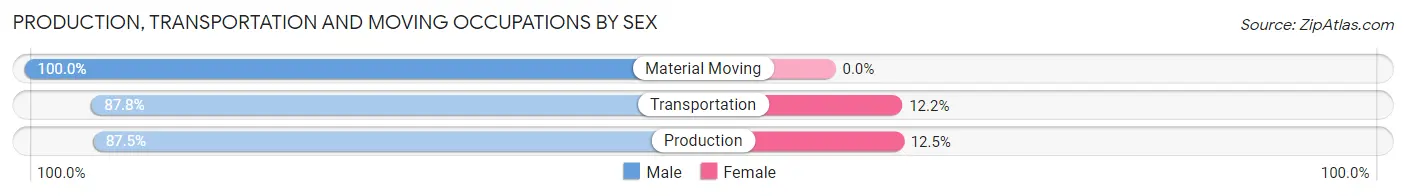
| Occupation | Male | Female |
| Production | 112 (87.5%) | 16 (12.5%) |
| Transportation | 86 (87.8%) | 12 (12.2%) |
| Material Moving | 28 (100.0%) | 0 (0.0%) |
| Total (Category) | 226 (89.0%) | 28 (11.0%) |
| Total (Overall) | 653 (46.7%) | 746 (53.3%) |
Employment Industries by Sex in Central City
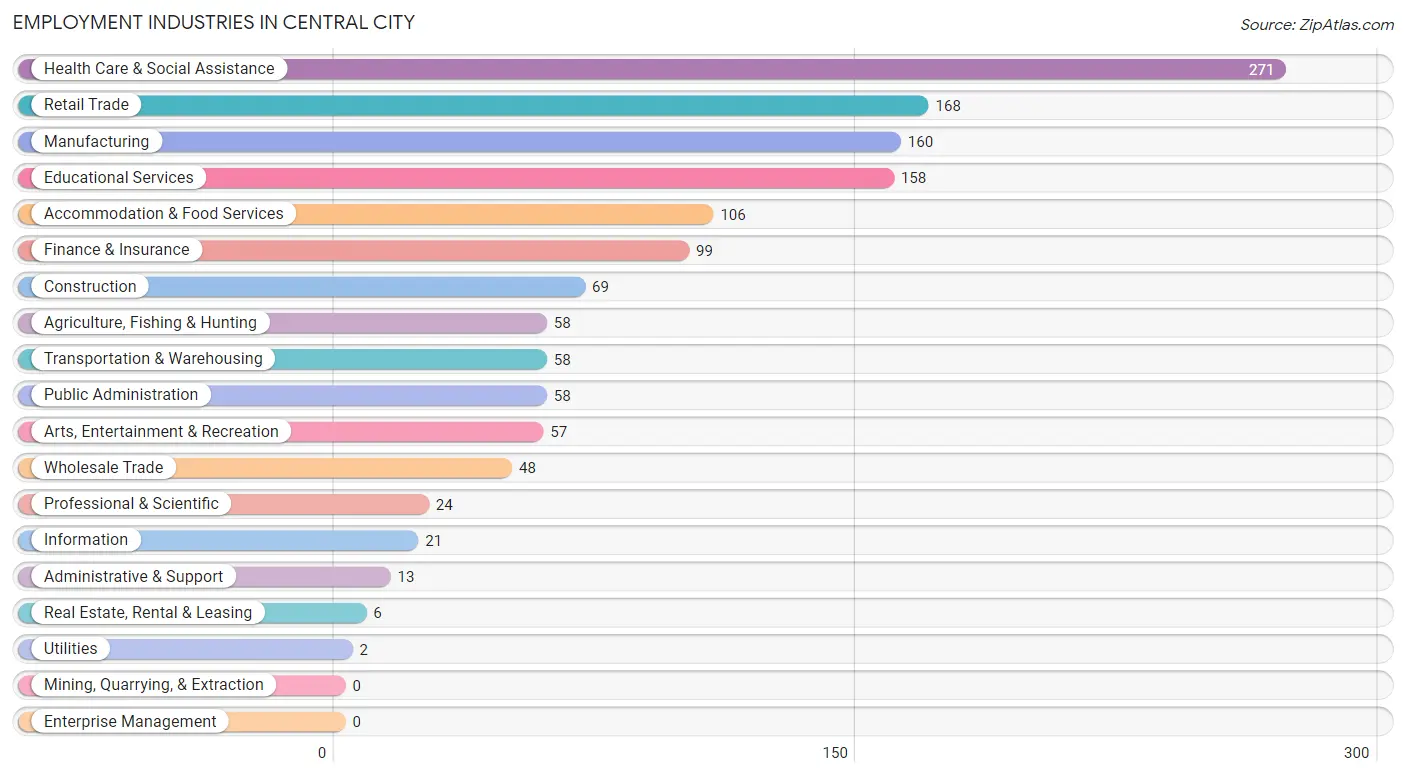
Employment Industries in Central City
The major employment industries in Central City include Health Care & Social Assistance (271 | 19.4%), Retail Trade (168 | 12.0%), Manufacturing (160 | 11.4%), Educational Services (158 | 11.3%), and Accommodation & Food Services (106 | 7.6%).
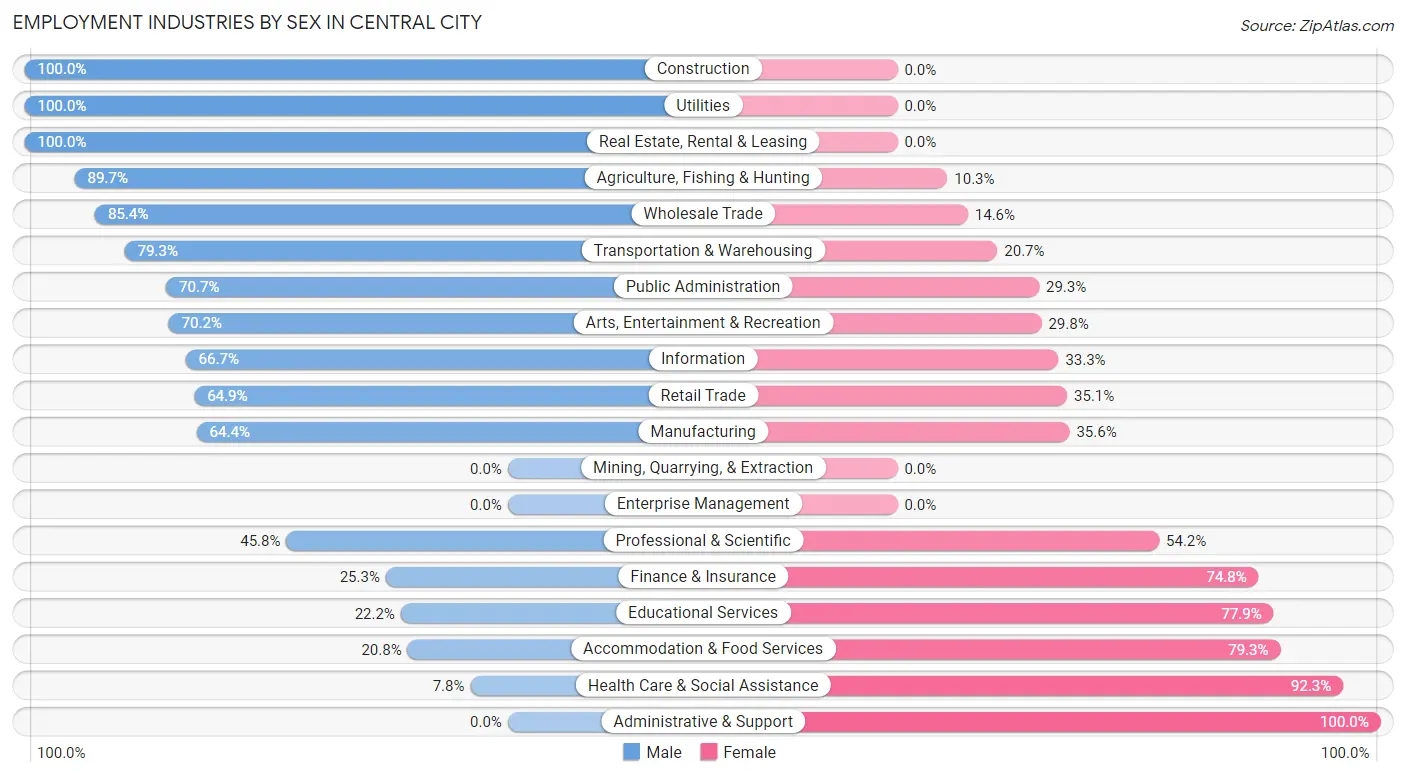
Employment Industries by Sex in Central City
The Central City industries that see more men than women are Construction (100.0%), Utilities (100.0%), and Real Estate, Rental & Leasing (100.0%), whereas the industries that tend to have a higher number of women are Administrative & Support (100.0%), Health Care & Social Assistance (92.2%), and Accommodation & Food Services (79.2%).
| Industry | Male | Female |
| Agriculture, Fishing & Hunting | 52 (89.7%) | 6 (10.3%) |
| Mining, Quarrying, & Extraction | 0 (0.0%) | 0 (0.0%) |
| Construction | 69 (100.0%) | 0 (0.0%) |
| Manufacturing | 103 (64.4%) | 57 (35.6%) |
| Wholesale Trade | 41 (85.4%) | 7 (14.6%) |
| Retail Trade | 109 (64.9%) | 59 (35.1%) |
| Transportation & Warehousing | 46 (79.3%) | 12 (20.7%) |
| Utilities | 2 (100.0%) | 0 (0.0%) |
| Information | 14 (66.7%) | 7 (33.3%) |
| Finance & Insurance | 25 (25.3%) | 74 (74.8%) |
| Real Estate, Rental & Leasing | 6 (100.0%) | 0 (0.0%) |
| Professional & Scientific | 11 (45.8%) | 13 (54.2%) |
| Enterprise Management | 0 (0.0%) | 0 (0.0%) |
| Administrative & Support | 0 (0.0%) | 13 (100.0%) |
| Educational Services | 35 (22.2%) | 123 (77.8%) |
| Health Care & Social Assistance | 21 (7.7%) | 250 (92.2%) |
| Arts, Entertainment & Recreation | 40 (70.2%) | 17 (29.8%) |
| Accommodation & Food Services | 22 (20.7%) | 84 (79.2%) |
| Public Administration | 41 (70.7%) | 17 (29.3%) |
| Total | 653 (46.7%) | 746 (53.3%) |
Education in Central City
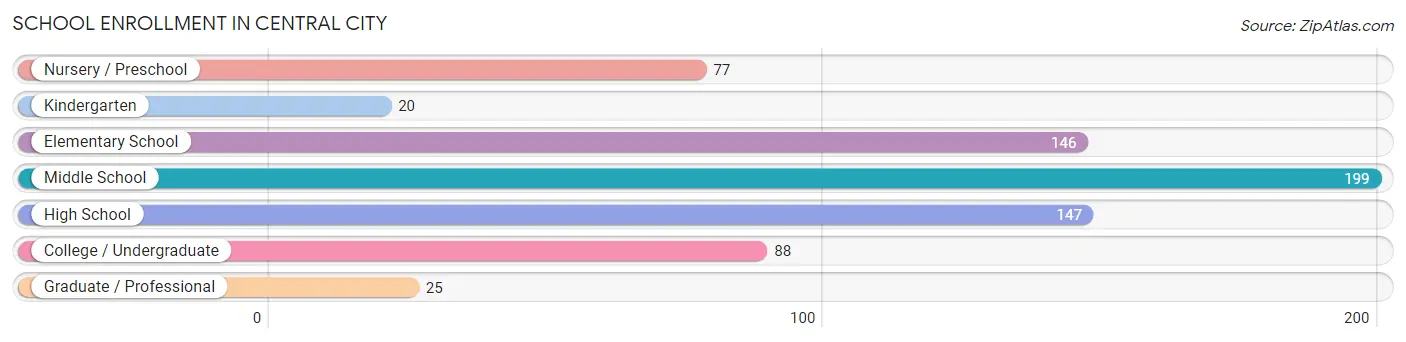
School Enrollment in Central City
The most common levels of schooling among the 702 students in Central City are middle school (199 | 28.3%), high school (147 | 20.9%), and elementary school (146 | 20.8%).
| School Level | # Students | % Students |
| Nursery / Preschool | 77 | 11.0% |
| Kindergarten | 20 | 2.9% |
| Elementary School | 146 | 20.8% |
| Middle School | 199 | 28.3% |
| High School | 147 | 20.9% |
| College / Undergraduate | 88 | 12.5% |
| Graduate / Professional | 25 | 3.6% |
| Total | 702 | 100.0% |
School Enrollment by Age by Funding Source in Central City
Out of a total of 702 students who are enrolled in schools in Central City, 129 (18.4%) attend a private institution, while the remaining 573 (81.6%) are enrolled in public schools. The age group of 25 to 34 year olds has the highest likelihood of being enrolled in private schools, with 40 (61.5% in the age bracket) enrolled. Conversely, the age group of 3 to 4 year olds has the lowest likelihood of being enrolled in a private school, with 7 (100.0% in the age bracket) attending a public institution.
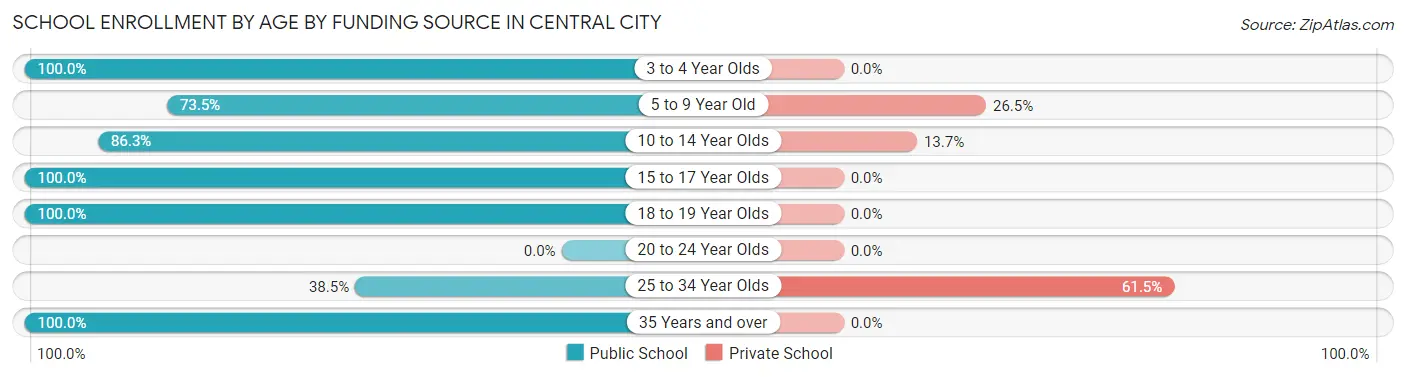
| Age Bracket | Public School | Private School |
| 3 to 4 Year Olds | 7 (100.0%) | 0 (0.0%) |
| 5 to 9 Year Old | 169 (73.5%) | 61 (26.5%) |
| 10 to 14 Year Olds | 177 (86.3%) | 28 (13.7%) |
| 15 to 17 Year Olds | 97 (100.0%) | 0 (0.0%) |
| 18 to 19 Year Olds | 66 (100.0%) | 0 (0.0%) |
| 20 to 24 Year Olds | 0 (0.0%) | 0 (0.0%) |
| 25 to 34 Year Olds | 25 (38.5%) | 40 (61.5%) |
| 35 Years and over | 32 (100.0%) | 0 (0.0%) |
| Total | 573 (81.6%) | 129 (18.4%) |
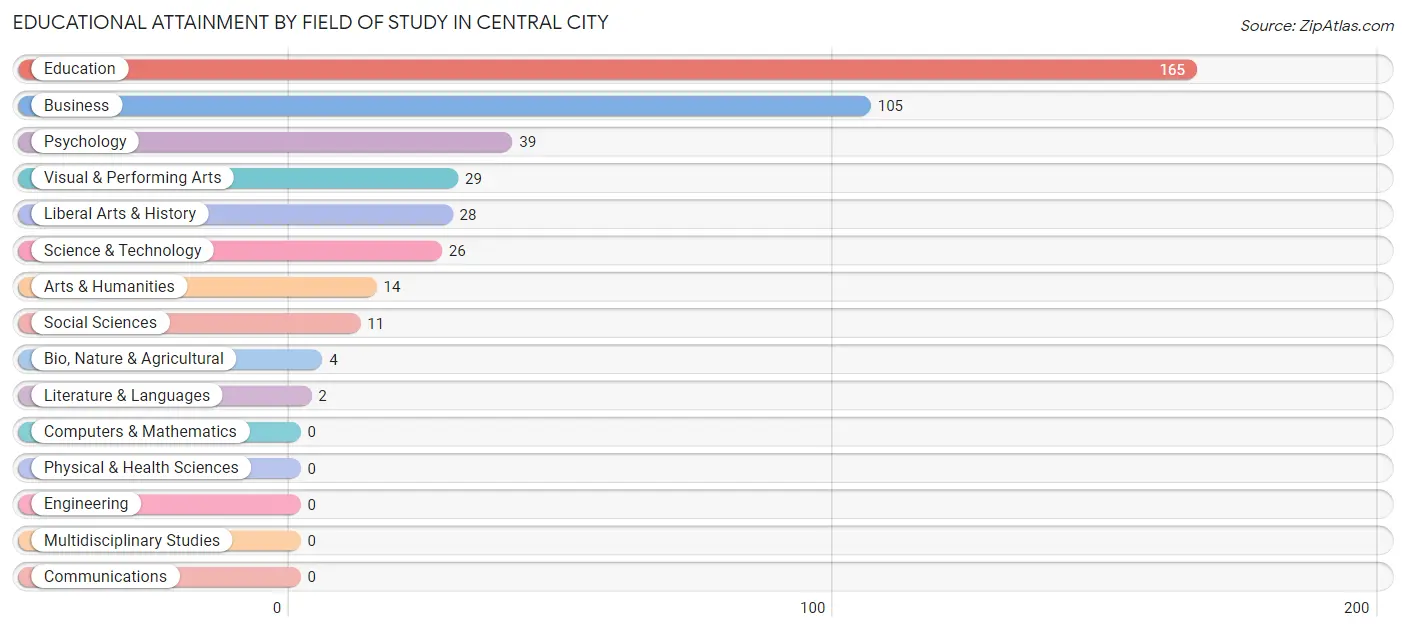
Educational Attainment by Field of Study in Central City
Education (165 | 39.0%), business (105 | 24.8%), psychology (39 | 9.2%), visual & performing arts (29 | 6.9%), and liberal arts & history (28 | 6.6%) are the most common fields of study among 423 individuals in Central City who have obtained a bachelor's degree or higher.
| Field of Study | # Graduates | % Graduates |
| Computers & Mathematics | 0 | 0.0% |
| Bio, Nature & Agricultural | 4 | 0.9% |
| Physical & Health Sciences | 0 | 0.0% |
| Psychology | 39 | 9.2% |
| Social Sciences | 11 | 2.6% |
| Engineering | 0 | 0.0% |
| Multidisciplinary Studies | 0 | 0.0% |
| Science & Technology | 26 | 6.1% |
| Business | 105 | 24.8% |
| Education | 165 | 39.0% |
| Literature & Languages | 2 | 0.5% |
| Liberal Arts & History | 28 | 6.6% |
| Visual & Performing Arts | 29 | 6.9% |
| Communications | 0 | 0.0% |
| Arts & Humanities | 14 | 3.3% |
| Total | 423 | 100.0% |
Transportation & Commute in Central City
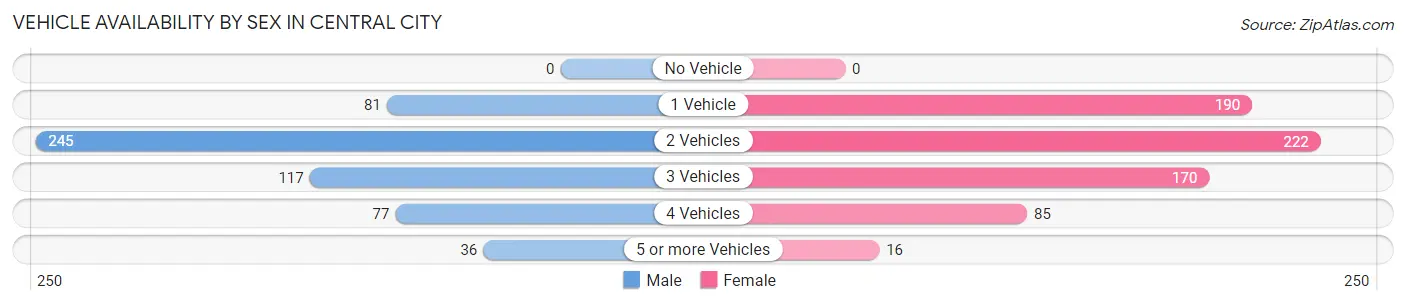
Vehicle Availability by Sex in Central City
The most prevalent vehicle ownership categories in Central City are males with 2 vehicles (245, accounting for 44.1%) and females with 2 vehicles (222, making up 35.9%).
| Vehicles Available | Male | Female |
| No Vehicle | 0 (0.0%) | 0 (0.0%) |
| 1 Vehicle | 81 (14.6%) | 190 (27.8%) |
| 2 Vehicles | 245 (44.1%) | 222 (32.5%) |
| 3 Vehicles | 117 (21.0%) | 170 (24.9%) |
| 4 Vehicles | 77 (13.9%) | 85 (12.4%) |
| 5 or more Vehicles | 36 (6.5%) | 16 (2.3%) |
| Total | 556 (100.0%) | 683 (100.0%) |
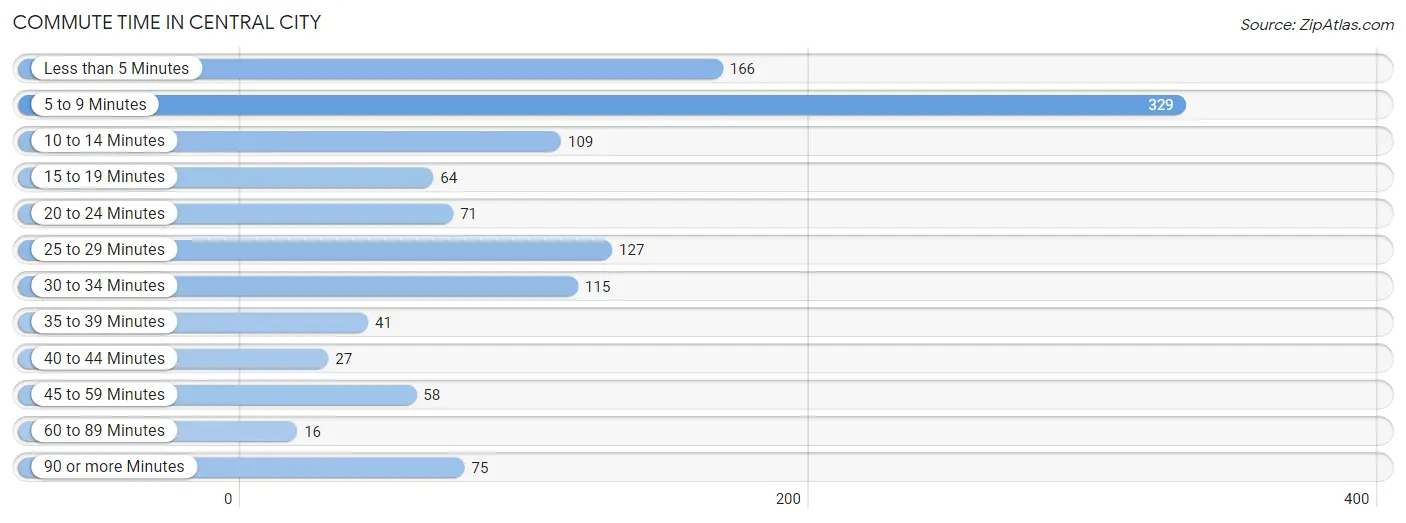
Commute Time in Central City
The most frequently occuring commute durations in Central City are 5 to 9 minutes (329 commuters, 27.5%), less than 5 minutes (166 commuters, 13.9%), and 25 to 29 minutes (127 commuters, 10.6%).
| Commute Time | # Commuters | % Commuters |
| Less than 5 Minutes | 166 | 13.9% |
| 5 to 9 Minutes | 329 | 27.5% |
| 10 to 14 Minutes | 109 | 9.1% |
| 15 to 19 Minutes | 64 | 5.3% |
| 20 to 24 Minutes | 71 | 5.9% |
| 25 to 29 Minutes | 127 | 10.6% |
| 30 to 34 Minutes | 115 | 9.6% |
| 35 to 39 Minutes | 41 | 3.4% |
| 40 to 44 Minutes | 27 | 2.2% |
| 45 to 59 Minutes | 58 | 4.8% |
| 60 to 89 Minutes | 16 | 1.3% |
| 90 or more Minutes | 75 | 6.3% |
Commute Time by Sex in Central City
The most common commute times in Central City are 5 to 9 minutes (124 commuters, 22.5%) for males and 5 to 9 minutes (205 commuters, 31.7%) for females.
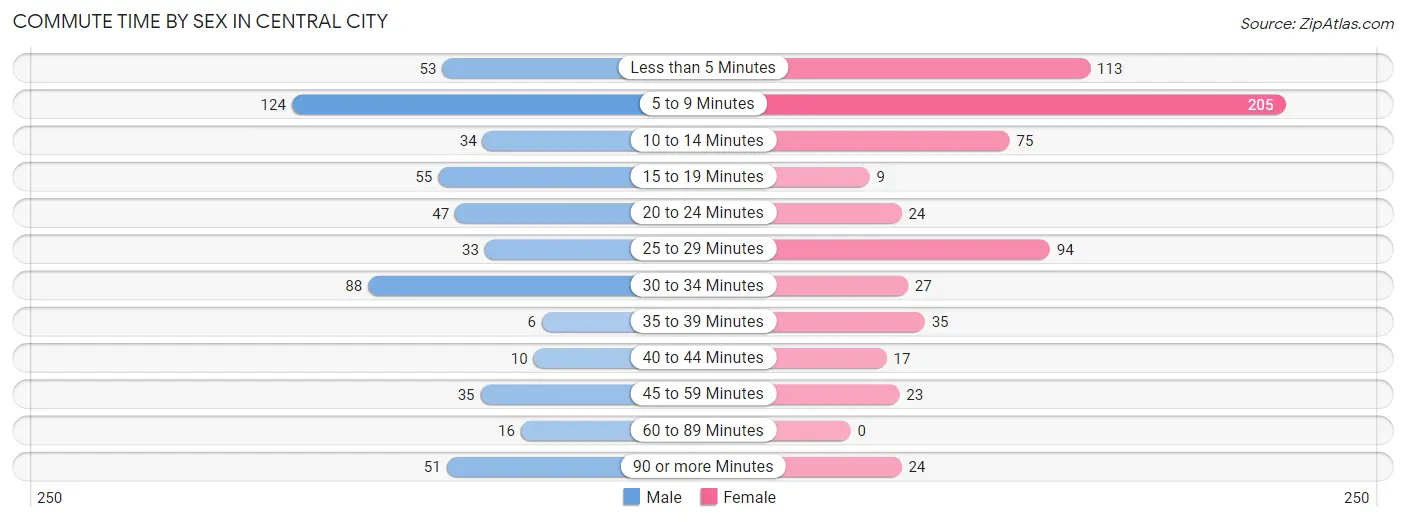
| Commute Time | Male | Female |
| Less than 5 Minutes | 53 (9.6%) | 113 (17.5%) |
| 5 to 9 Minutes | 124 (22.5%) | 205 (31.7%) |
| 10 to 14 Minutes | 34 (6.2%) | 75 (11.6%) |
| 15 to 19 Minutes | 55 (10.0%) | 9 (1.4%) |
| 20 to 24 Minutes | 47 (8.5%) | 24 (3.7%) |
| 25 to 29 Minutes | 33 (6.0%) | 94 (14.5%) |
| 30 to 34 Minutes | 88 (15.9%) | 27 (4.2%) |
| 35 to 39 Minutes | 6 (1.1%) | 35 (5.4%) |
| 40 to 44 Minutes | 10 (1.8%) | 17 (2.6%) |
| 45 to 59 Minutes | 35 (6.3%) | 23 (3.6%) |
| 60 to 89 Minutes | 16 (2.9%) | 0 (0.0%) |
| 90 or more Minutes | 51 (9.2%) | 24 (3.7%) |
Time of Departure to Work by Sex in Central City
The most frequent times of departure to work in Central City are 7:30 AM to 7:59 AM (127, 23.0%) for males and 7:30 AM to 7:59 AM (146, 22.6%) for females.
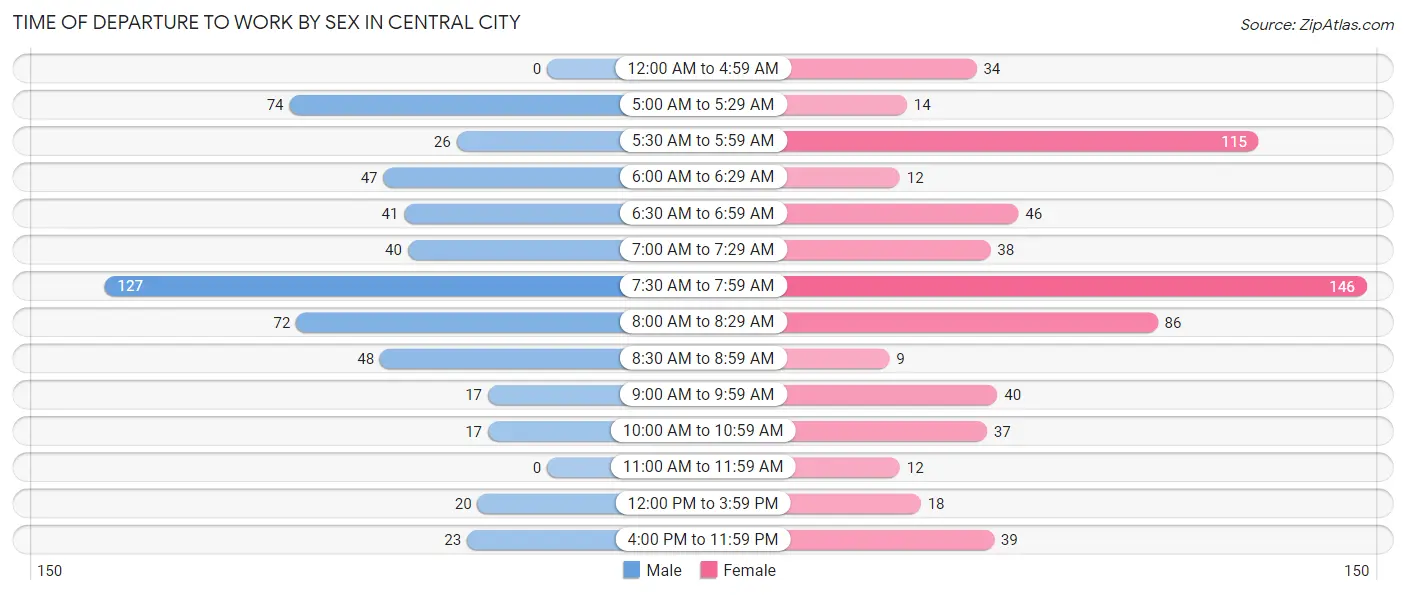
| Time of Departure | Male | Female |
| 12:00 AM to 4:59 AM | 0 (0.0%) | 34 (5.3%) |
| 5:00 AM to 5:29 AM | 74 (13.4%) | 14 (2.2%) |
| 5:30 AM to 5:59 AM | 26 (4.7%) | 115 (17.8%) |
| 6:00 AM to 6:29 AM | 47 (8.5%) | 12 (1.9%) |
| 6:30 AM to 6:59 AM | 41 (7.4%) | 46 (7.1%) |
| 7:00 AM to 7:29 AM | 40 (7.2%) | 38 (5.9%) |
| 7:30 AM to 7:59 AM | 127 (23.0%) | 146 (22.6%) |
| 8:00 AM to 8:29 AM | 72 (13.0%) | 86 (13.3%) |
| 8:30 AM to 8:59 AM | 48 (8.7%) | 9 (1.4%) |
| 9:00 AM to 9:59 AM | 17 (3.1%) | 40 (6.2%) |
| 10:00 AM to 10:59 AM | 17 (3.1%) | 37 (5.7%) |
| 11:00 AM to 11:59 AM | 0 (0.0%) | 12 (1.9%) |
| 12:00 PM to 3:59 PM | 20 (3.6%) | 18 (2.8%) |
| 4:00 PM to 11:59 PM | 23 (4.2%) | 39 (6.0%) |
| Total | 552 (100.0%) | 646 (100.0%) |
Housing Occupancy in Central City
Occupancy by Ownership in Central City
Of the total 1,200 dwellings in Central City, owner-occupied units account for 779 (64.9%), while renter-occupied units make up 421 (35.1%).
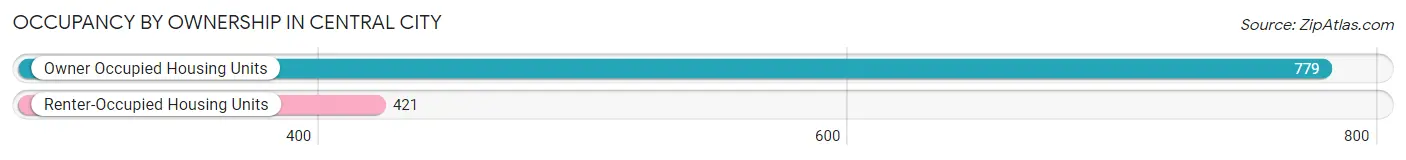
| Occupancy | # Housing Units | % Housing Units |
| Owner Occupied Housing Units | 779 | 64.9% |
| Renter-Occupied Housing Units | 421 | 35.1% |
| Total Occupied Housing Units | 1,200 | 100.0% |
Occupancy by Household Size in Central City
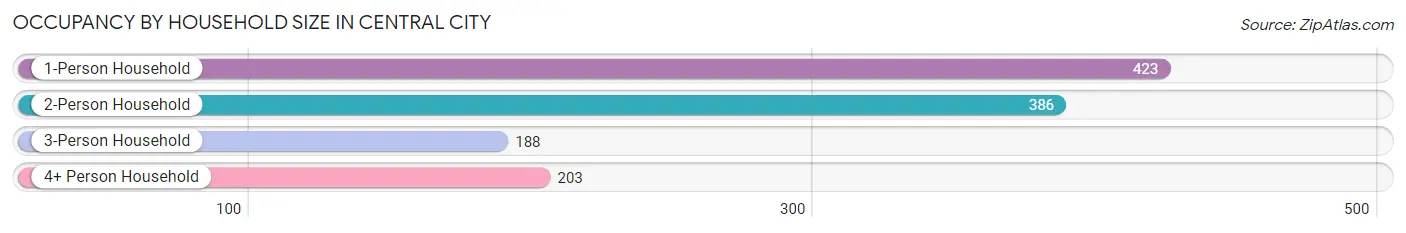
| Household Size | # Housing Units | % Housing Units |
| 1-Person Household | 423 | 35.2% |
| 2-Person Household | 386 | 32.2% |
| 3-Person Household | 188 | 15.7% |
| 4+ Person Household | 203 | 16.9% |
| Total Housing Units | 1,200 | 100.0% |
Occupancy by Ownership by Household Size in Central City
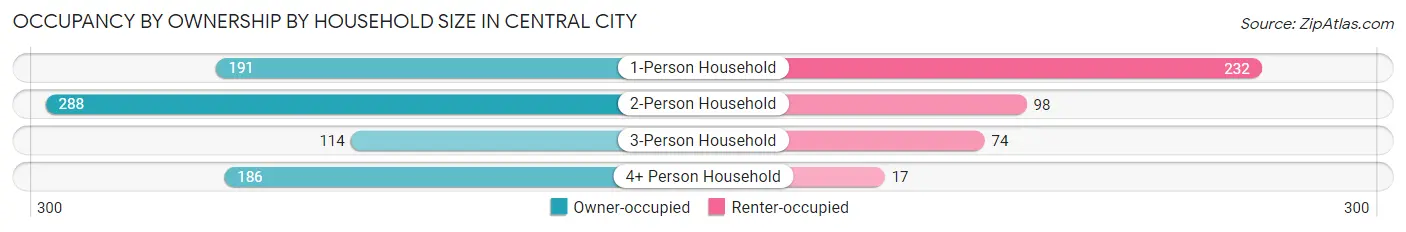
| Household Size | Owner-occupied | Renter-occupied |
| 1-Person Household | 191 (45.2%) | 232 (54.8%) |
| 2-Person Household | 288 (74.6%) | 98 (25.4%) |
| 3-Person Household | 114 (60.6%) | 74 (39.4%) |
| 4+ Person Household | 186 (91.6%) | 17 (8.4%) |
| Total Housing Units | 779 (64.9%) | 421 (35.1%) |
Occupancy by Educational Attainment in Central City
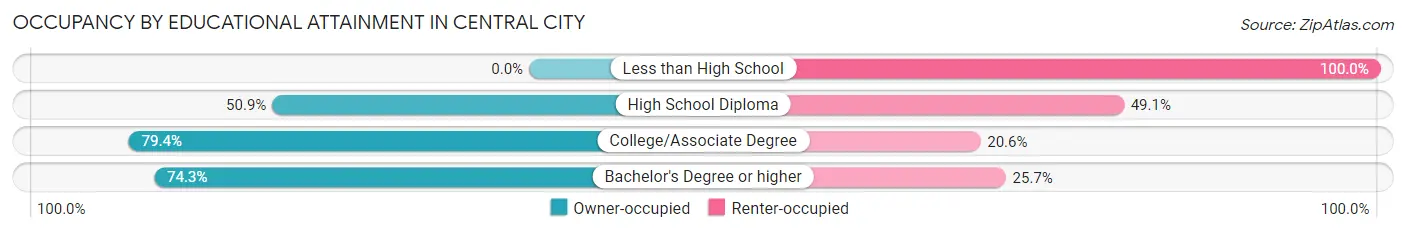
| Household Size | Owner-occupied | Renter-occupied |
| Less than High School | 0 (0.0%) | 51 (100.0%) |
| High School Diploma | 221 (50.9%) | 213 (49.1%) |
| College/Associate Degree | 419 (79.4%) | 109 (20.6%) |
| Bachelor's Degree or higher | 139 (74.3%) | 48 (25.7%) |
Occupancy by Age of Householder in Central City
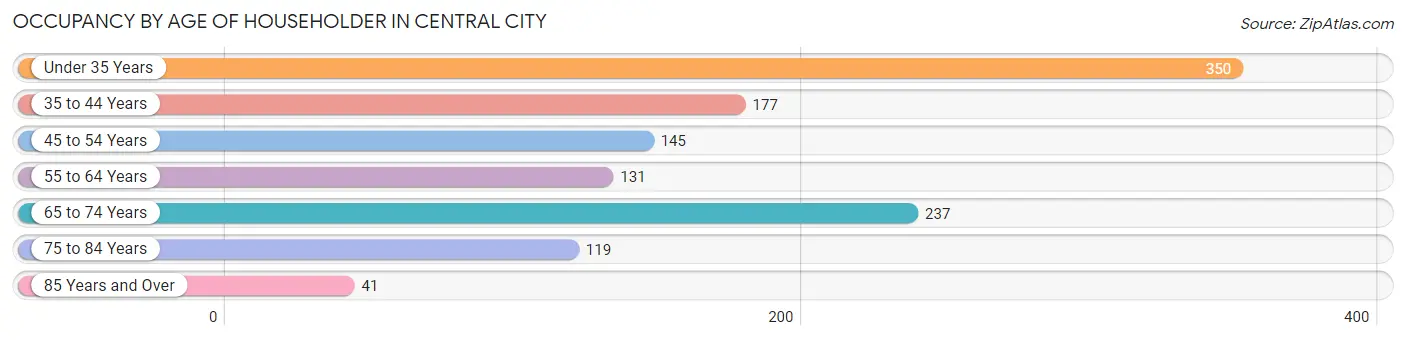
| Age Bracket | # Households | % Households |
| Under 35 Years | 350 | 29.2% |
| 35 to 44 Years | 177 | 14.7% |
| 45 to 54 Years | 145 | 12.1% |
| 55 to 64 Years | 131 | 10.9% |
| 65 to 74 Years | 237 | 19.8% |
| 75 to 84 Years | 119 | 9.9% |
| 85 Years and Over | 41 | 3.4% |
| Total | 1,200 | 100.0% |
Housing Finances in Central City
Median Income by Occupancy in Central City
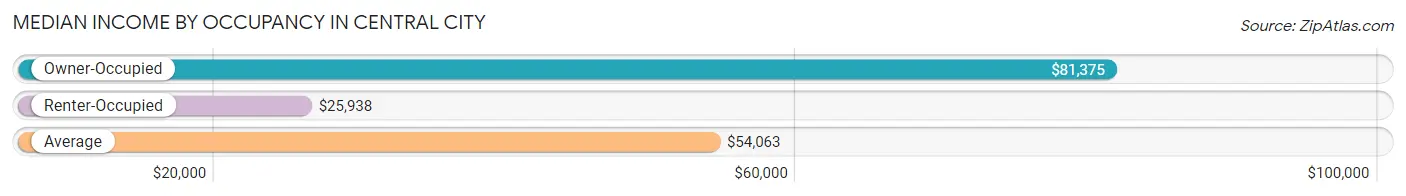
| Occupancy Type | # Households | Median Income |
| Owner-Occupied | 779 (64.9%) | $81,375 |
| Renter-Occupied | 421 (35.1%) | $25,938 |
| Average | 1,200 (100.0%) | $54,063 |
Occupancy by Householder Income Bracket in Central City
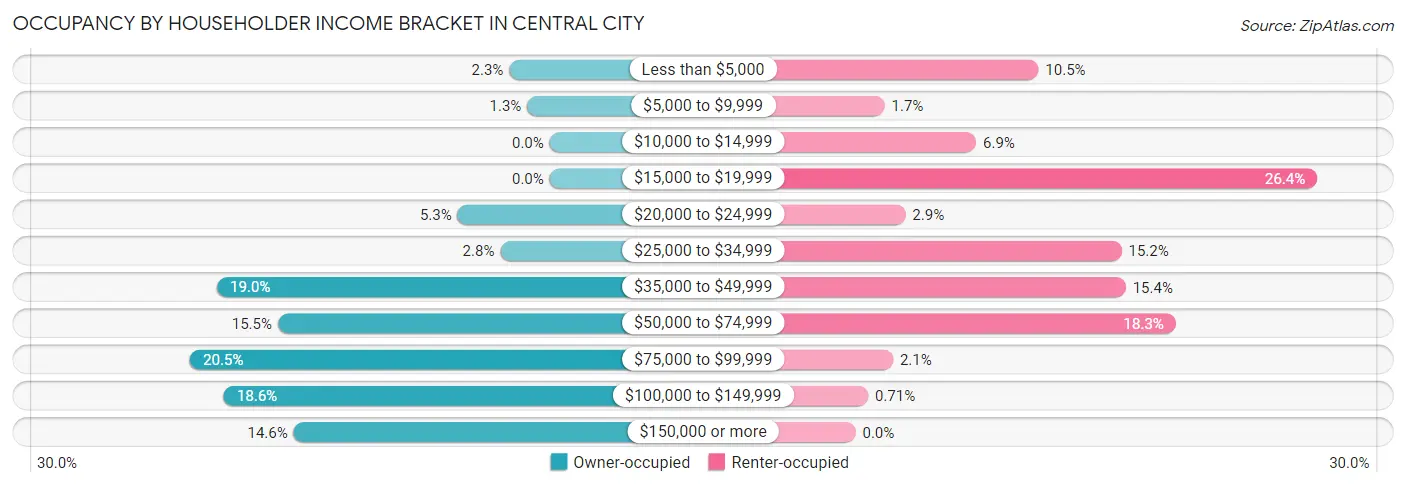
| Income Bracket | Owner-occupied | Renter-occupied |
| Less than $5,000 | 18 (2.3%) | 44 (10.4%) |
| $5,000 to $9,999 | 10 (1.3%) | 7 (1.7%) |
| $10,000 to $14,999 | 0 (0.0%) | 29 (6.9%) |
| $15,000 to $19,999 | 0 (0.0%) | 111 (26.4%) |
| $20,000 to $24,999 | 41 (5.3%) | 12 (2.9%) |
| $25,000 to $34,999 | 22 (2.8%) | 64 (15.2%) |
| $35,000 to $49,999 | 148 (19.0%) | 65 (15.4%) |
| $50,000 to $74,999 | 121 (15.5%) | 77 (18.3%) |
| $75,000 to $99,999 | 160 (20.5%) | 9 (2.1%) |
| $100,000 to $149,999 | 145 (18.6%) | 3 (0.7%) |
| $150,000 or more | 114 (14.6%) | 0 (0.0%) |
| Total | 779 (100.0%) | 421 (100.0%) |
Monthly Housing Cost Tiers in Central City
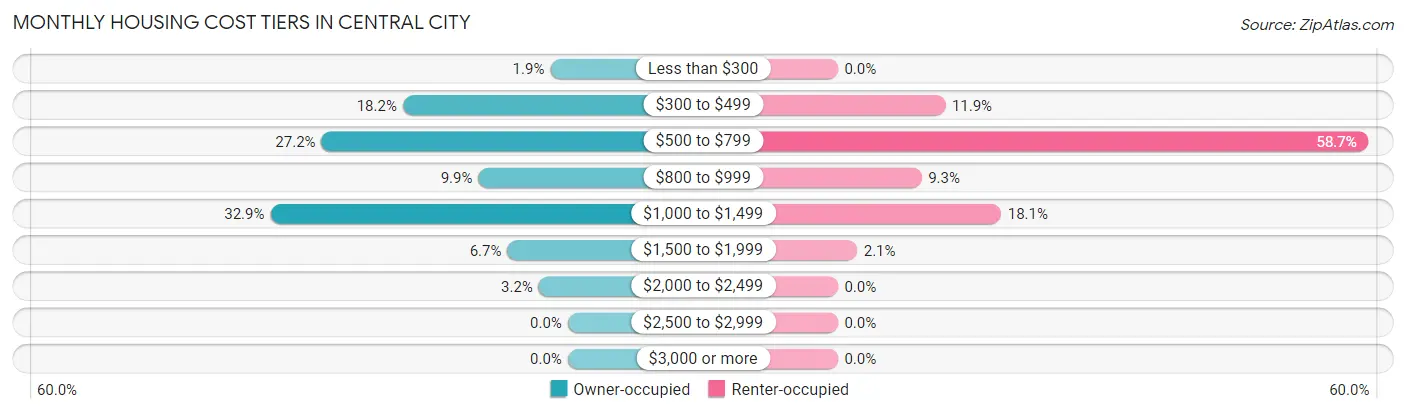
| Monthly Cost | Owner-occupied | Renter-occupied |
| Less than $300 | 15 (1.9%) | 0 (0.0%) |
| $300 to $499 | 142 (18.2%) | 50 (11.9%) |
| $500 to $799 | 212 (27.2%) | 247 (58.7%) |
| $800 to $999 | 77 (9.9%) | 39 (9.3%) |
| $1,000 to $1,499 | 256 (32.9%) | 76 (18.0%) |
| $1,500 to $1,999 | 52 (6.7%) | 9 (2.1%) |
| $2,000 to $2,499 | 25 (3.2%) | 0 (0.0%) |
| $2,500 to $2,999 | 0 (0.0%) | 0 (0.0%) |
| $3,000 or more | 0 (0.0%) | 0 (0.0%) |
| Total | 779 (100.0%) | 421 (100.0%) |
Physical Housing Characteristics in Central City
Housing Structures in Central City
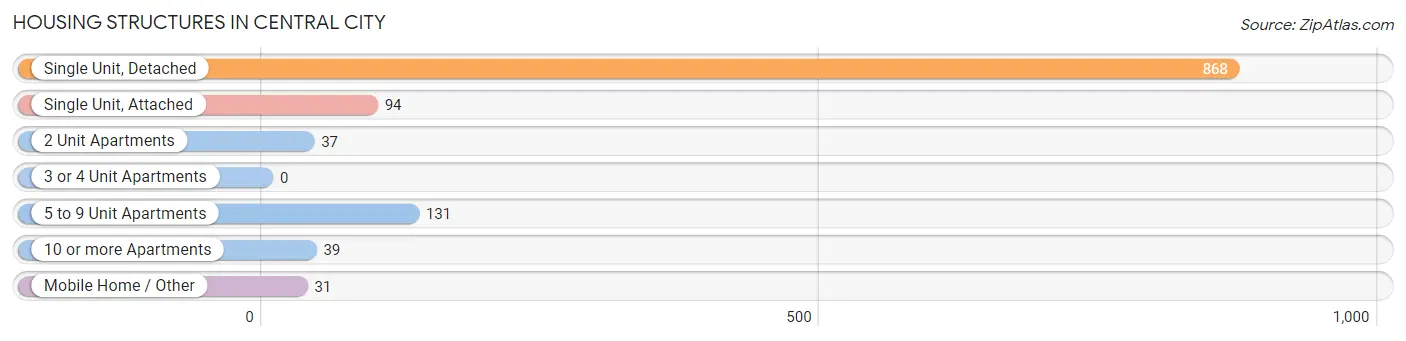
| Structure Type | # Housing Units | % Housing Units |
| Single Unit, Detached | 868 | 72.3% |
| Single Unit, Attached | 94 | 7.8% |
| 2 Unit Apartments | 37 | 3.1% |
| 3 or 4 Unit Apartments | 0 | 0.0% |
| 5 to 9 Unit Apartments | 131 | 10.9% |
| 10 or more Apartments | 39 | 3.3% |
| Mobile Home / Other | 31 | 2.6% |
| Total | 1,200 | 100.0% |
Housing Structures by Occupancy in Central City
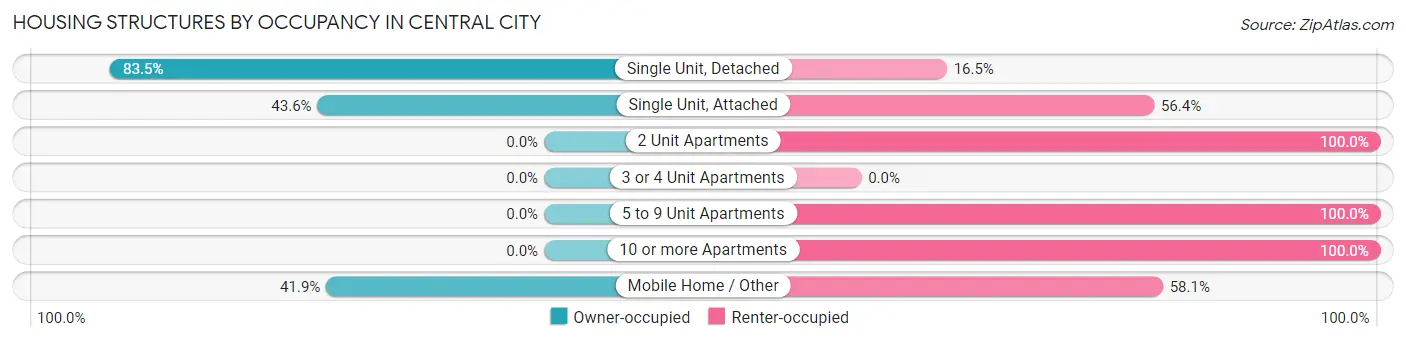
| Structure Type | Owner-occupied | Renter-occupied |
| Single Unit, Detached | 725 (83.5%) | 143 (16.5%) |
| Single Unit, Attached | 41 (43.6%) | 53 (56.4%) |
| 2 Unit Apartments | 0 (0.0%) | 37 (100.0%) |
| 3 or 4 Unit Apartments | 0 (0.0%) | 0 (0.0%) |
| 5 to 9 Unit Apartments | 0 (0.0%) | 131 (100.0%) |
| 10 or more Apartments | 0 (0.0%) | 39 (100.0%) |
| Mobile Home / Other | 13 (41.9%) | 18 (58.1%) |
| Total | 779 (64.9%) | 421 (35.1%) |
Housing Structures by Number of Rooms in Central City
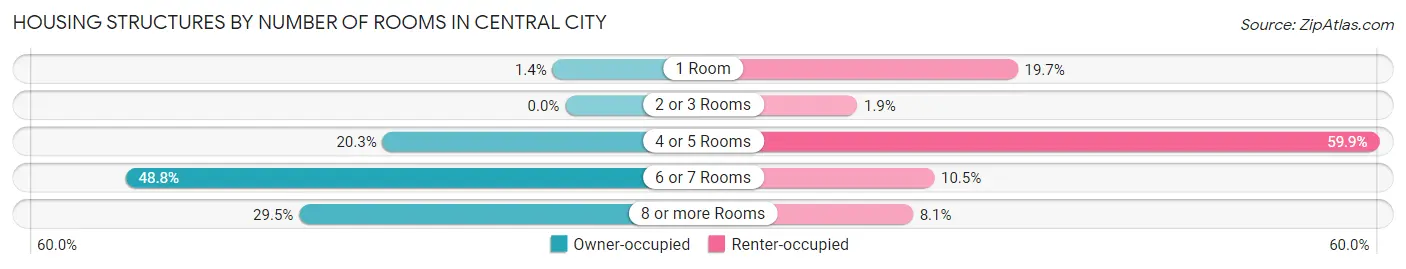
| Number of Rooms | Owner-occupied | Renter-occupied |
| 1 Room | 11 (1.4%) | 83 (19.7%) |
| 2 or 3 Rooms | 0 (0.0%) | 8 (1.9%) |
| 4 or 5 Rooms | 158 (20.3%) | 252 (59.9%) |
| 6 or 7 Rooms | 380 (48.8%) | 44 (10.4%) |
| 8 or more Rooms | 230 (29.5%) | 34 (8.1%) |
| Total | 779 (100.0%) | 421 (100.0%) |
Housing Structure by Heating Type in Central City
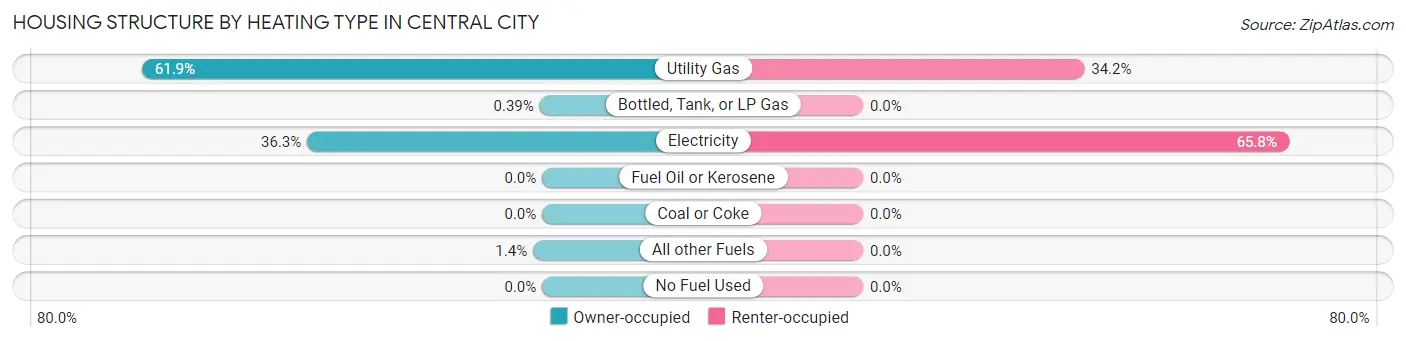
| Heating Type | Owner-occupied | Renter-occupied |
| Utility Gas | 482 (61.9%) | 144 (34.2%) |
| Bottled, Tank, or LP Gas | 3 (0.4%) | 0 (0.0%) |
| Electricity | 283 (36.3%) | 277 (65.8%) |
| Fuel Oil or Kerosene | 0 (0.0%) | 0 (0.0%) |
| Coal or Coke | 0 (0.0%) | 0 (0.0%) |
| All other Fuels | 11 (1.4%) | 0 (0.0%) |
| No Fuel Used | 0 (0.0%) | 0 (0.0%) |
| Total | 779 (100.0%) | 421 (100.0%) |
Household Vehicle Usage in Central City
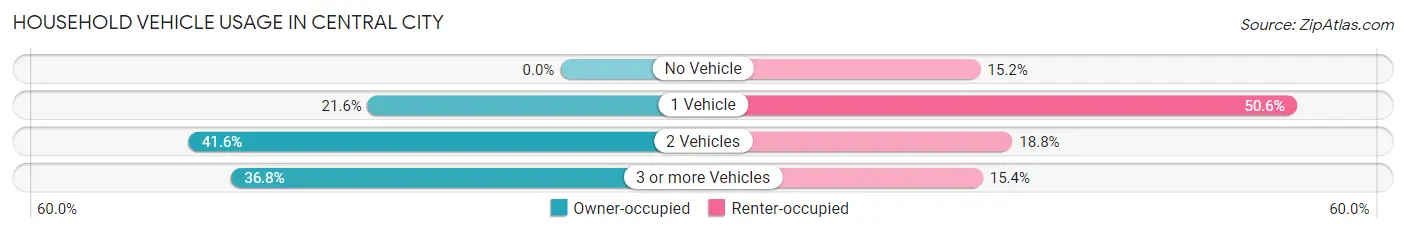
| Vehicles per Household | Owner-occupied | Renter-occupied |
| No Vehicle | 0 (0.0%) | 64 (15.2%) |
| 1 Vehicle | 168 (21.6%) | 213 (50.6%) |
| 2 Vehicles | 324 (41.6%) | 79 (18.8%) |
| 3 or more Vehicles | 287 (36.8%) | 65 (15.4%) |
| Total | 779 (100.0%) | 421 (100.0%) |
Real Estate & Mortgages in Central City
Real Estate and Mortgage Overview in Central City
| Characteristic | Without Mortgage | With Mortgage |
| Housing Units | 359 | 420 |
| Median Property Value | $173,100 | $149,300 |
| Median Household Income | $80,417 | $39 |
| Monthly Housing Costs | $524 | $0 |
| Real Estate Taxes | $2,390 | $0 |
Property Value by Mortgage Status in Central City
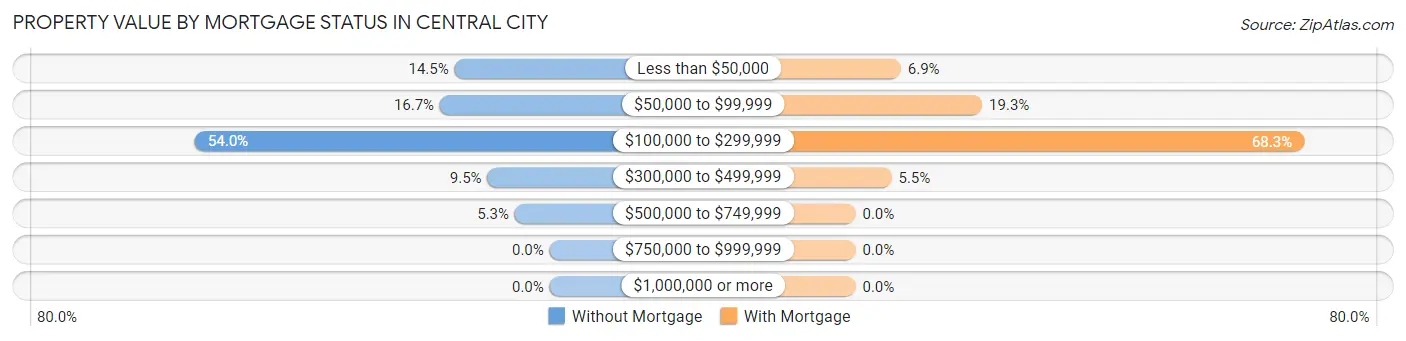
| Property Value | Without Mortgage | With Mortgage |
| Less than $50,000 | 52 (14.5%) | 29 (6.9%) |
| $50,000 to $99,999 | 60 (16.7%) | 81 (19.3%) |
| $100,000 to $299,999 | 194 (54.0%) | 287 (68.3%) |
| $300,000 to $499,999 | 34 (9.5%) | 23 (5.5%) |
| $500,000 to $749,999 | 19 (5.3%) | 0 (0.0%) |
| $750,000 to $999,999 | 0 (0.0%) | 0 (0.0%) |
| $1,000,000 or more | 0 (0.0%) | 0 (0.0%) |
| Total | 359 (100.0%) | 420 (100.0%) |
Household Income by Mortgage Status in Central City
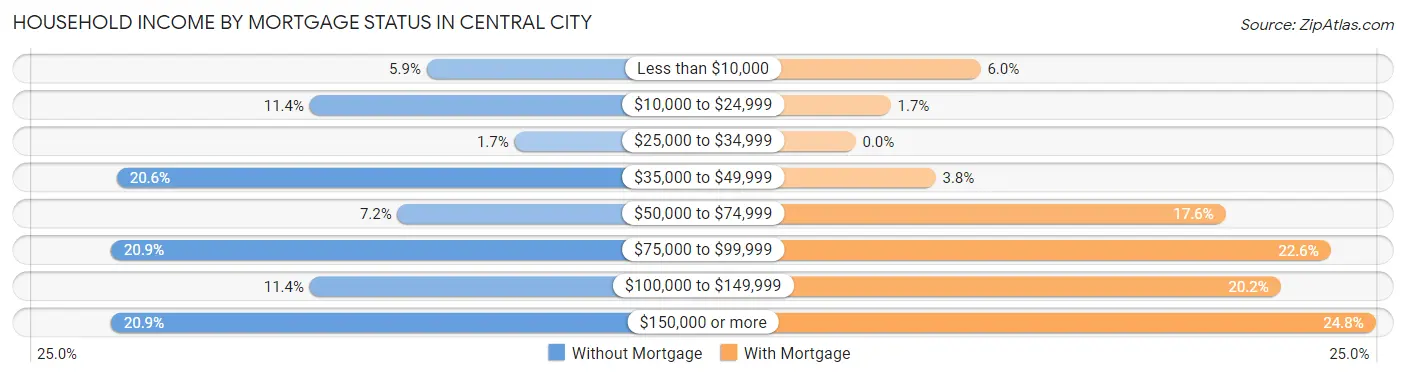
| Household Income | Without Mortgage | With Mortgage |
| Less than $10,000 | 21 (5.9%) | 25 (5.9%) |
| $10,000 to $24,999 | 41 (11.4%) | 7 (1.7%) |
| $25,000 to $34,999 | 6 (1.7%) | 0 (0.0%) |
| $35,000 to $49,999 | 74 (20.6%) | 16 (3.8%) |
| $50,000 to $74,999 | 26 (7.2%) | 74 (17.6%) |
| $75,000 to $99,999 | 75 (20.9%) | 95 (22.6%) |
| $100,000 to $149,999 | 41 (11.4%) | 85 (20.2%) |
| $150,000 or more | 75 (20.9%) | 104 (24.8%) |
| Total | 359 (100.0%) | 420 (100.0%) |
Property Value to Household Income Ratio in Central City
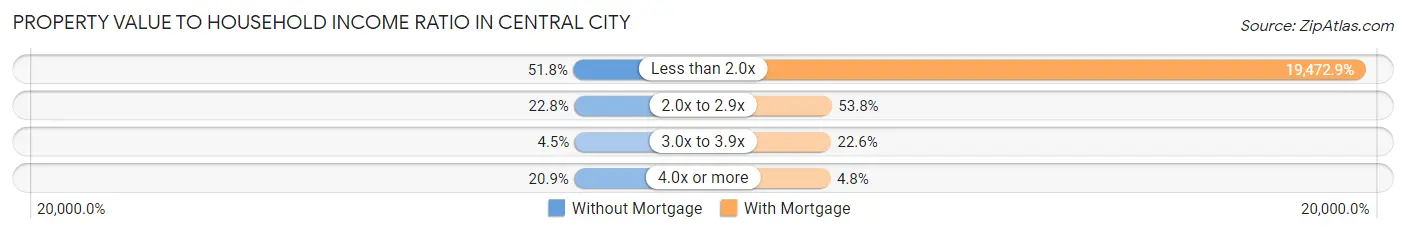
| Value-to-Income Ratio | Without Mortgage | With Mortgage |
| Less than 2.0x | 186 (51.8%) | 81,786 (19,472.9%) |
| 2.0x to 2.9x | 82 (22.8%) | 226 (53.8%) |
| 3.0x to 3.9x | 16 (4.5%) | 95 (22.6%) |
| 4.0x or more | 75 (20.9%) | 20 (4.8%) |
| Total | 359 (100.0%) | 420 (100.0%) |
Real Estate Taxes by Mortgage Status in Central City
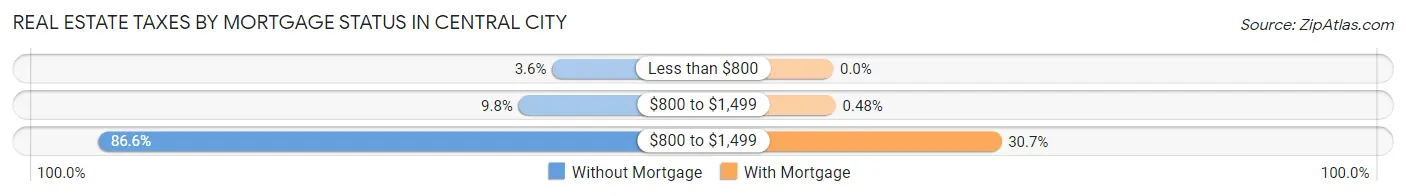
| Property Taxes | Without Mortgage | With Mortgage |
| Less than $800 | 13 (3.6%) | 0 (0.0%) |
| $800 to $1,499 | 35 (9.8%) | 2 (0.5%) |
| $800 to $1,499 | 311 (86.6%) | 129 (30.7%) |
| Total | 359 (100.0%) | 420 (100.0%) |
Health & Disability in Central City
Health Insurance Coverage by Age in Central City
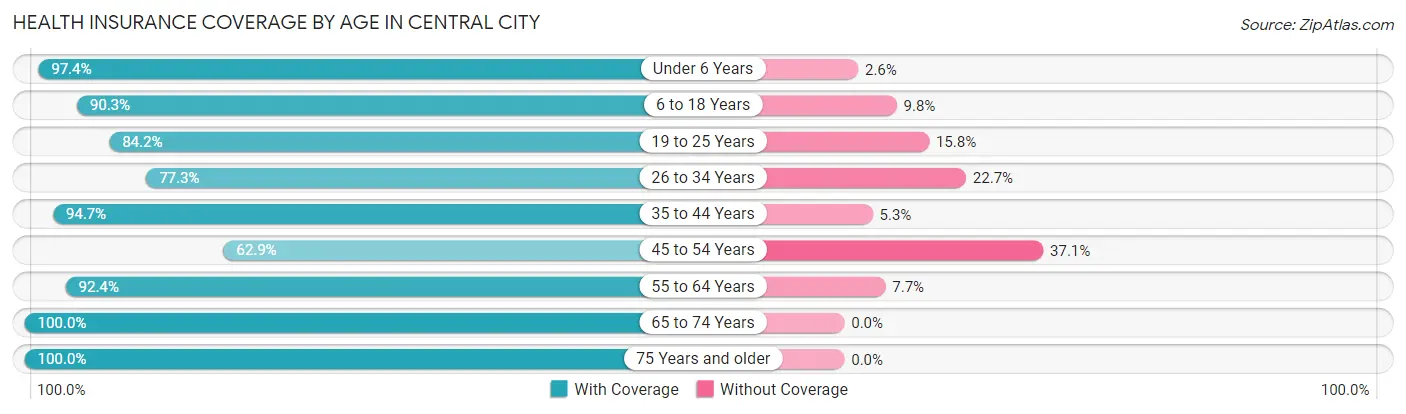
| Age Bracket | With Coverage | Without Coverage |
| Under 6 Years | 266 (97.4%) | 7 (2.6%) |
| 6 to 18 Years | 472 (90.2%) | 51 (9.8%) |
| 19 to 25 Years | 240 (84.2%) | 45 (15.8%) |
| 26 to 34 Years | 283 (77.3%) | 83 (22.7%) |
| 35 to 44 Years | 305 (94.7%) | 17 (5.3%) |
| 45 to 54 Years | 151 (62.9%) | 89 (37.1%) |
| 55 to 64 Years | 350 (92.3%) | 29 (7.6%) |
| 65 to 74 Years | 322 (100.0%) | 0 (0.0%) |
| 75 Years and older | 221 (100.0%) | 0 (0.0%) |
| Total | 2,610 (89.0%) | 321 (11.0%) |
Health Insurance Coverage by Citizenship Status in Central City
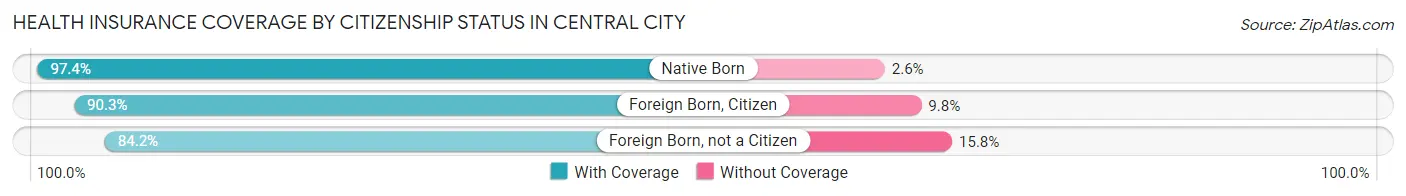
| Citizenship Status | With Coverage | Without Coverage |
| Native Born | 266 (97.4%) | 7 (2.6%) |
| Foreign Born, Citizen | 472 (90.2%) | 51 (9.8%) |
| Foreign Born, not a Citizen | 240 (84.2%) | 45 (15.8%) |
Health Insurance Coverage by Household Income in Central City
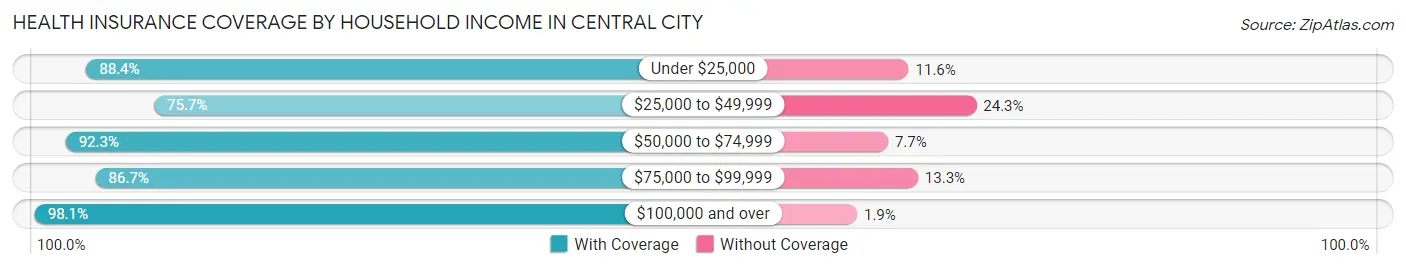
| Household Income | With Coverage | Without Coverage |
| Under $25,000 | 336 (88.4%) | 44 (11.6%) |
| $25,000 to $49,999 | 465 (75.7%) | 149 (24.3%) |
| $50,000 to $74,999 | 455 (92.3%) | 38 (7.7%) |
| $75,000 to $99,999 | 475 (86.7%) | 73 (13.3%) |
| $100,000 and over | 869 (98.1%) | 17 (1.9%) |
Public vs Private Health Insurance Coverage by Age in Central City
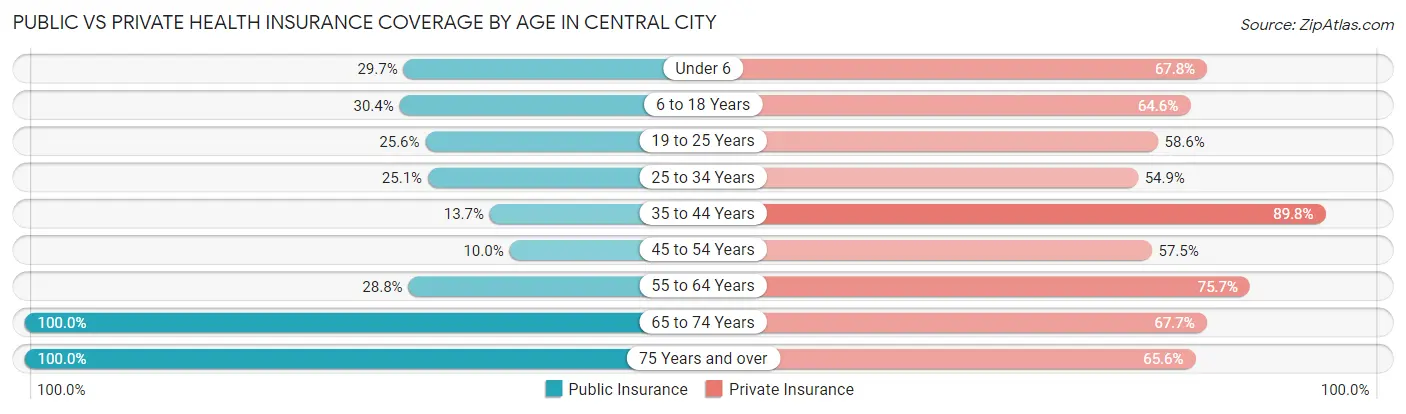
| Age Bracket | Public Insurance | Private Insurance |
| Under 6 | 81 (29.7%) | 185 (67.8%) |
| 6 to 18 Years | 159 (30.4%) | 338 (64.6%) |
| 19 to 25 Years | 73 (25.6%) | 167 (58.6%) |
| 25 to 34 Years | 92 (25.1%) | 201 (54.9%) |
| 35 to 44 Years | 44 (13.7%) | 289 (89.7%) |
| 45 to 54 Years | 24 (10.0%) | 138 (57.5%) |
| 55 to 64 Years | 109 (28.8%) | 287 (75.7%) |
| 65 to 74 Years | 322 (100.0%) | 218 (67.7%) |
| 75 Years and over | 221 (100.0%) | 145 (65.6%) |
| Total | 1,125 (38.4%) | 1,968 (67.1%) |
Disability Status by Sex by Age in Central City
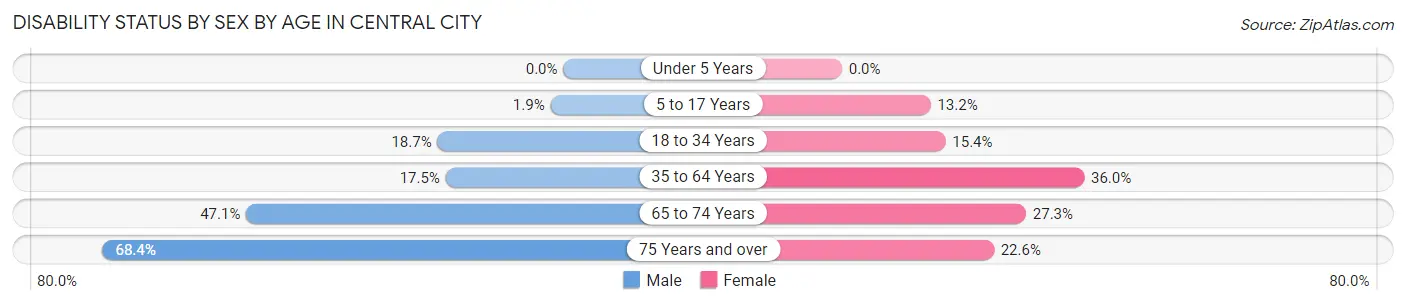
| Age Bracket | Male | Female |
| Under 5 Years | 0 (0.0%) | 0 (0.0%) |
| 5 to 17 Years | 5 (1.9%) | 37 (13.2%) |
| 18 to 34 Years | 63 (18.7%) | 56 (15.4%) |
| 35 to 64 Years | 76 (17.5%) | 182 (36.0%) |
| 65 to 74 Years | 81 (47.1%) | 41 (27.3%) |
| 75 Years and over | 39 (68.4%) | 37 (22.6%) |
Disability Class by Sex by Age in Central City
Disability Class: Hearing Difficulty
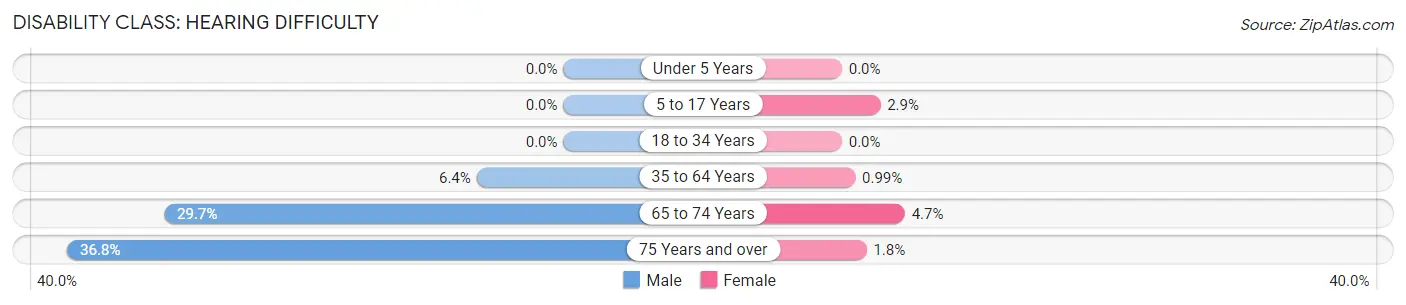
| Age Bracket | Male | Female |
| Under 5 Years | 0 (0.0%) | 0 (0.0%) |
| 5 to 17 Years | 0 (0.0%) | 8 (2.9%) |
| 18 to 34 Years | 0 (0.0%) | 0 (0.0%) |
| 35 to 64 Years | 28 (6.4%) | 5 (1.0%) |
| 65 to 74 Years | 51 (29.6%) | 7 (4.7%) |
| 75 Years and over | 21 (36.8%) | 3 (1.8%) |
Disability Class: Vision Difficulty
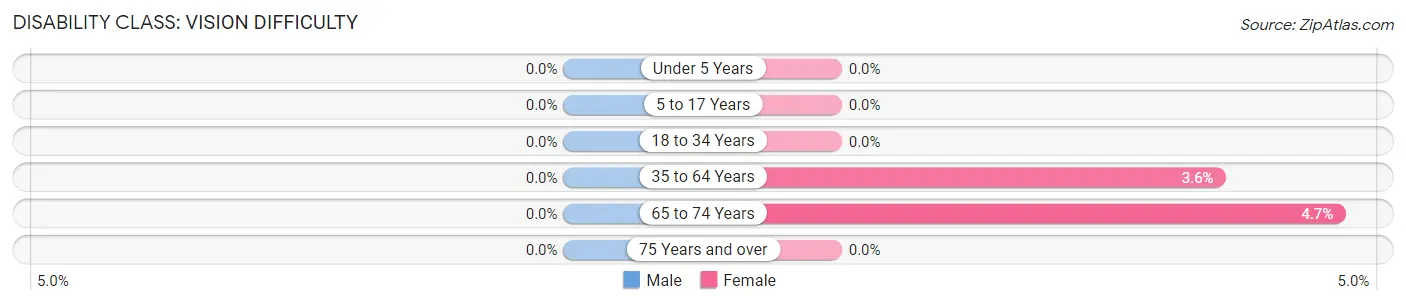
| Age Bracket | Male | Female |
| Under 5 Years | 0 (0.0%) | 0 (0.0%) |
| 5 to 17 Years | 0 (0.0%) | 0 (0.0%) |
| 18 to 34 Years | 0 (0.0%) | 0 (0.0%) |
| 35 to 64 Years | 0 (0.0%) | 18 (3.6%) |
| 65 to 74 Years | 0 (0.0%) | 7 (4.7%) |
| 75 Years and over | 0 (0.0%) | 0 (0.0%) |
Disability Class: Cognitive Difficulty
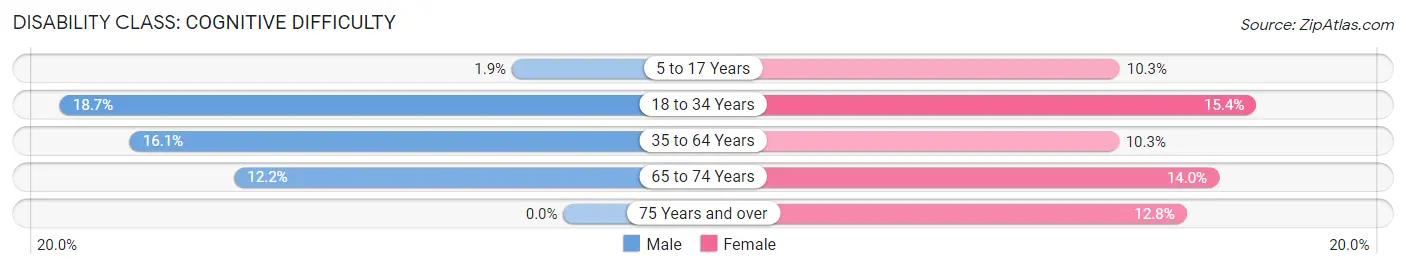
| Age Bracket | Male | Female |
| 5 to 17 Years | 5 (1.9%) | 29 (10.3%) |
| 18 to 34 Years | 63 (18.7%) | 56 (15.4%) |
| 35 to 64 Years | 70 (16.1%) | 52 (10.3%) |
| 65 to 74 Years | 21 (12.2%) | 21 (14.0%) |
| 75 Years and over | 0 (0.0%) | 21 (12.8%) |
Disability Class: Ambulatory Difficulty
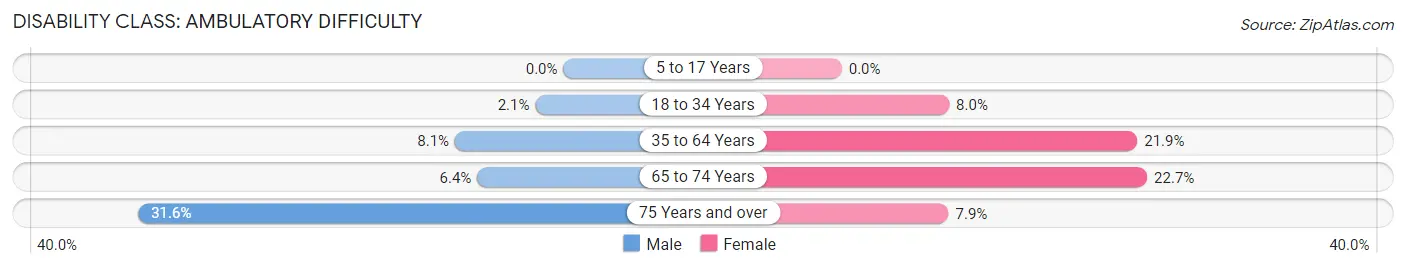
| Age Bracket | Male | Female |
| 5 to 17 Years | 0 (0.0%) | 0 (0.0%) |
| 18 to 34 Years | 7 (2.1%) | 29 (8.0%) |
| 35 to 64 Years | 35 (8.1%) | 111 (21.9%) |
| 65 to 74 Years | 11 (6.4%) | 34 (22.7%) |
| 75 Years and over | 18 (31.6%) | 13 (7.9%) |
Disability Class: Self-Care Difficulty
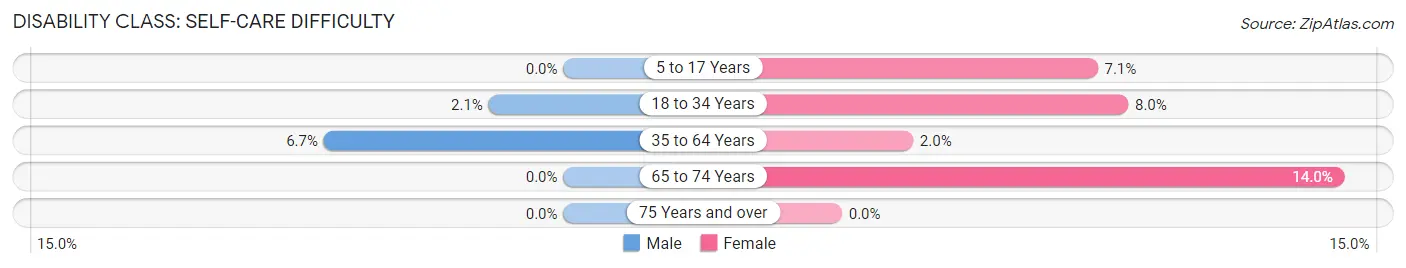
| Age Bracket | Male | Female |
| 5 to 17 Years | 0 (0.0%) | 20 (7.1%) |
| 18 to 34 Years | 7 (2.1%) | 29 (8.0%) |
| 35 to 64 Years | 29 (6.7%) | 10 (2.0%) |
| 65 to 74 Years | 0 (0.0%) | 21 (14.0%) |
| 75 Years and over | 0 (0.0%) | 0 (0.0%) |
Technology Access in Central City
Computing Device Access in Central City
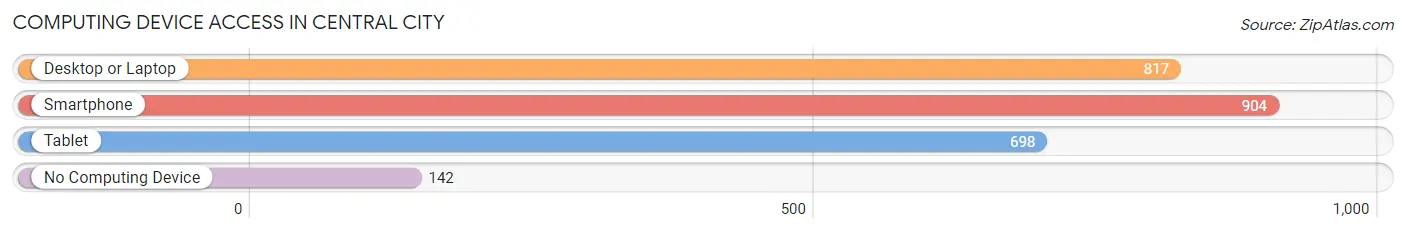
| Device Type | # Households | % Households |
| Desktop or Laptop | 817 | 68.1% |
| Smartphone | 904 | 75.3% |
| Tablet | 698 | 58.2% |
| No Computing Device | 142 | 11.8% |
| Total | 1,200 | 100.0% |
Internet Access in Central City
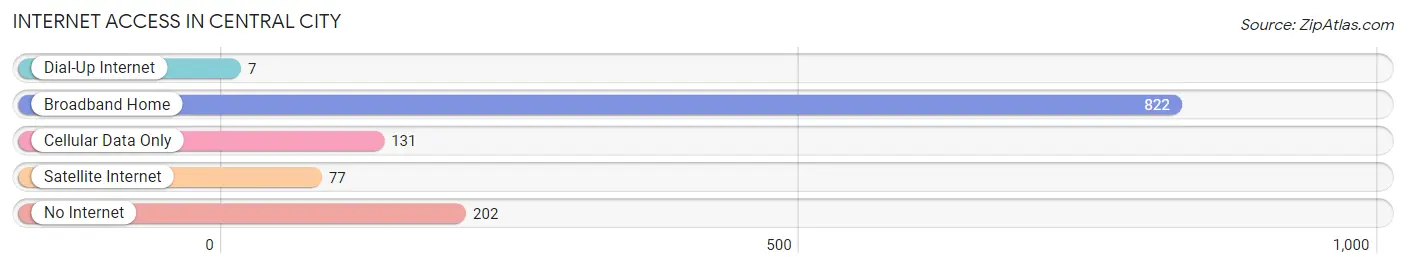
| Internet Type | # Households | % Households |
| Dial-Up Internet | 7 | 0.6% |
| Broadband Home | 822 | 68.5% |
| Cellular Data Only | 131 | 10.9% |
| Satellite Internet | 77 | 6.4% |
| No Internet | 202 | 16.8% |
| Total | 1,200 | 100.0% |
Central City Summary
Central City, Nebraska is a small city located in Merrick County, Nebraska. It is situated in the Platte River Valley, approximately 40 miles northwest of Omaha. The city has a population of approximately 2,500 people and is the county seat of Merrick County.
History
Central City was founded in 1856 by a group of settlers from the nearby town of Grand Island. The settlers were looking for a place to settle and build a new town. The town was originally named “Centreville”, but the name was changed to Central City in 1858.
The city was incorporated in 1872 and was the first city in Merrick County. The city was a major stop on the Union Pacific Railroad and was a major hub for the cattle industry. The city was also home to a number of businesses, including a flour mill, a brickyard, a brewery, and a number of other businesses.
Geography
Central City is located in the Platte River Valley, approximately 40 miles northwest of Omaha. The city is situated on the banks of the Platte River and is surrounded by rolling hills and farmland. The city has a total area of 1.3 square miles, all of which is land.
Economy
Central City’s economy is largely based on agriculture and manufacturing. The city is home to a number of agricultural businesses, including a feed mill, a grain elevator, and a number of other agricultural businesses. The city is also home to a number of manufacturing businesses, including a furniture factory, a plastics factory, and a number of other manufacturing businesses.
Demographics
As of the 2010 census, Central City had a population of 2,500 people. The racial makeup of the city was 97.2% White, 0.4% African American, 0.2% Native American, 0.4% Asian, 0.2% from other races, and 1.6% from two or more races. Hispanic or Latino of any race were 1.2% of the population.
The median income for a household in Central City was $41,250, and the median income for a family was $50,000. The per capita income for the city was $20,845. About 8.2% of families and 10.2% of the population were below the poverty line, including 14.2% of those under age 18 and 8.2% of those age 65 or over.
Conclusion
Central City, Nebraska is a small city located in Merrick County, Nebraska. It is situated in the Platte River Valley, approximately 40 miles northwest of Omaha. The city has a population of approximately 2,500 people and is the county seat of Merrick County. The city’s economy is largely based on agriculture and manufacturing, and the city is home to a number of businesses, including a feed mill, a grain elevator, a furniture factory, and a plastics factory. The racial makeup of the city is 97.2% White, 0.4% African American, 0.2% Native American, 0.4% Asian, 0.2% from other races, and 1.6% from two or more races. The median income for a household in Central City was $41,250, and the median income for a family was $50,000.
Common Questions
What is Per Capita Income in Central City?
Per Capita income in Central City is $28,180.
What is the Median Family Income in Central City?
Median Family Income in Central City is $74,333.
What is the Median Household income in Central City?
Median Household Income in Central City is $54,063.
What is Income or Wage Gap in Central City?
Income or Wage Gap in Central City is 39.4%.
Women in Central City earn 60.6 cents for every dollar earned by a man.
What is Inequality or Gini Index in Central City?
Inequality or Gini Index in Central City is 0.41.
What is the Total Population of Central City?
Total Population of Central City is 3,035.
What is the Total Male Population of Central City?
Total Male Population of Central City is 1,439.
What is the Total Female Population of Central City?
Total Female Population of Central City is 1,596.
What is the Ratio of Males per 100 Females in Central City?
There are 90.16 Males per 100 Females in Central City.
What is the Ratio of Females per 100 Males in Central City?
There are 110.91 Females per 100 Males in Central City.
What is the Median Population Age in Central City?
Median Population Age in Central City is 37.0 Years.
What is the Average Family Size in Central City
Average Family Size in Central City is 3.1 People.
What is the Average Household Size in Central City
Average Household Size in Central City is 2.4 People.
How Large is the Labor Force in Central City?
There are 1,399 People in the Labor Forcein in Central City.
What is the Percentage of People in the Labor Force in Central City?
59.2% of People are in the Labor Force in Central City.