Webster County, NE Map & Demographics
Webster County Map
Webster County Overview
$34,652
PER CAPITA INCOME
$74,028
AVG FAMILY INCOME
$62,571
AVG HOUSEHOLD INCOME
34.1%
WAGE / INCOME GAP [ % ]
65.9¢/ $1
WAGE / INCOME GAP [ $ ]
$10,313
FAMILY INCOME DEFICIT
0.44
INEQUALITY / GINI INDEX
3,410
TOTAL POPULATION
1,749
MALE POPULATION
1,661
FEMALE POPULATION
105.30
MALES / 100 FEMALES
94.97
FEMALES / 100 MALES
44.6
MEDIAN AGE
2.7
AVG FAMILY SIZE
2.2
AVG HOUSEHOLD SIZE
1,800
LABOR FORCE [ PEOPLE ]
65.9%
PERCENT IN LABOR FORCE
1.8%
UNEMPLOYMENT RATE
Webster County Area Codes
Income in Webster County
Income Overview in Webster County
Per Capita Income in Webster County is $34,652, while median incomes of families and households are $74,028 and $62,571 respectively.
| Characteristic | Number | Measure |
| Per Capita Income | 3,410 | $34,652 |
| Median Family Income | 977 | $74,028 |
| Mean Family Income | 977 | $97,427 |
| Median Household Income | 1,480 | $62,571 |
| Mean Household Income | 1,480 | $81,902 |
| Income Deficit | 977 | $10,313 |
| Wage / Income Gap (%) | 3,410 | 34.11% |
| Wage / Income Gap ($) | 3,410 | 65.89¢ per $1 |
| Gini / Inequality Index | 3,410 | 0.44 |
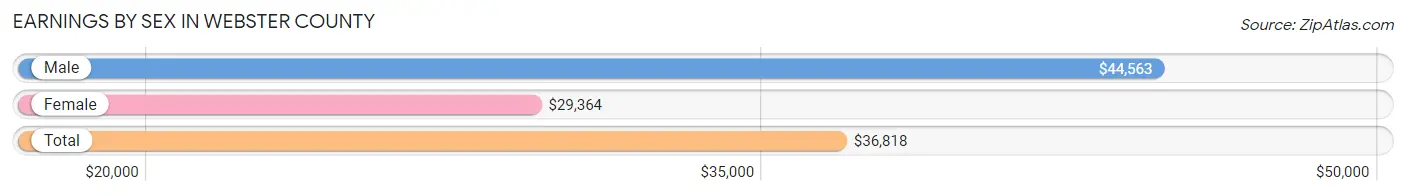
Earnings by Sex in Webster County
Average Earnings in Webster County are $36,818, $44,563 for men and $29,364 for women, a difference of 34.1%.
| Sex | Number | Average Earnings |
| Male | 1,097 (57.0%) | $44,563 |
| Female | 829 (43.0%) | $29,364 |
| Total | 1,926 (100.0%) | $36,818 |
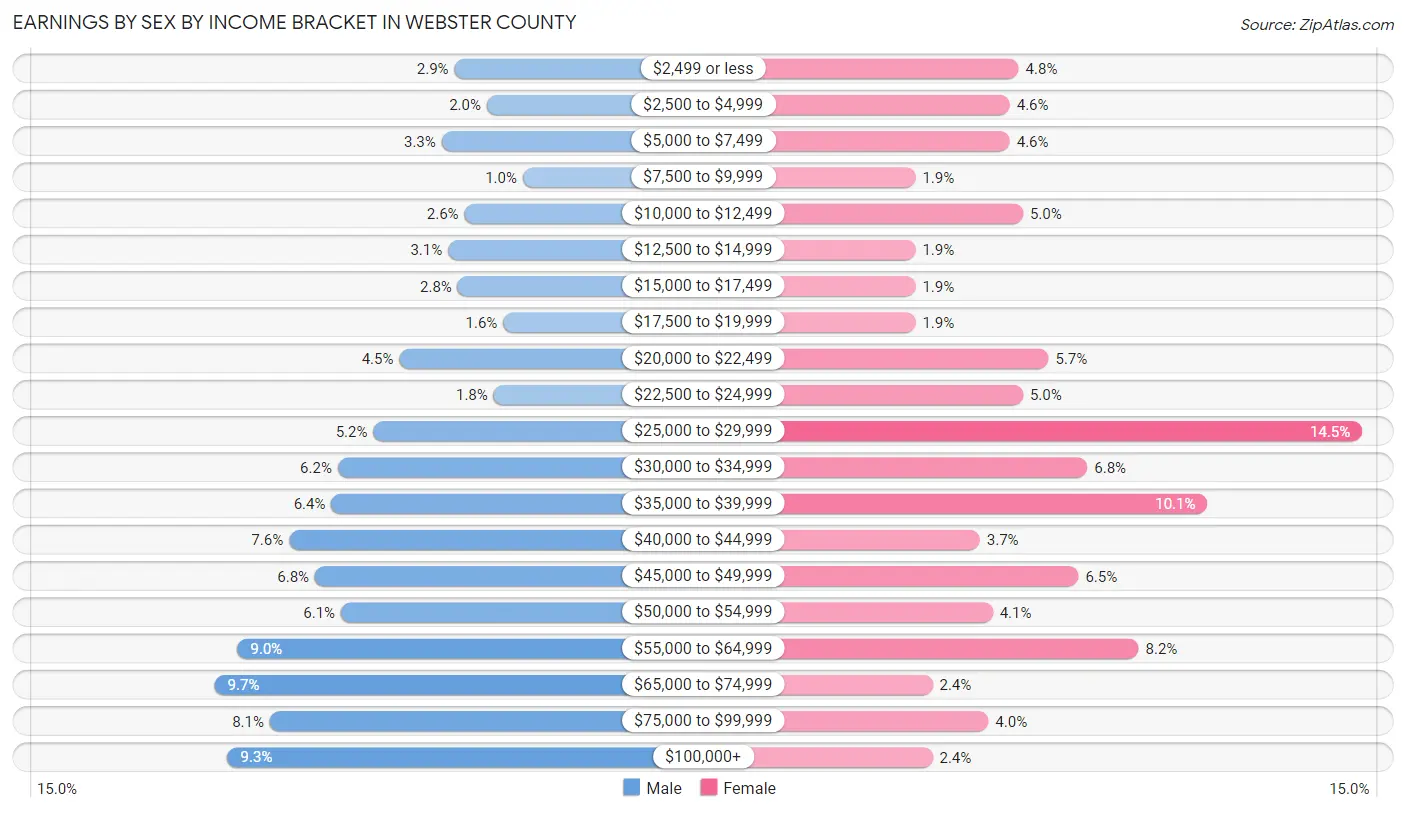
Earnings by Sex by Income Bracket in Webster County
The most common earnings brackets in Webster County are $65,000 to $74,999 for men (106 | 9.7%) and $25,000 to $29,999 for women (120 | 14.5%).
| Income | Male | Female |
| $2,499 or less | 32 (2.9%) | 40 (4.8%) |
| $2,500 to $4,999 | 22 (2.0%) | 38 (4.6%) |
| $5,000 to $7,499 | 36 (3.3%) | 38 (4.6%) |
| $7,500 to $9,999 | 11 (1.0%) | 16 (1.9%) |
| $10,000 to $12,499 | 29 (2.6%) | 41 (5.0%) |
| $12,500 to $14,999 | 34 (3.1%) | 16 (1.9%) |
| $15,000 to $17,499 | 31 (2.8%) | 16 (1.9%) |
| $17,500 to $19,999 | 17 (1.5%) | 16 (1.9%) |
| $20,000 to $22,499 | 49 (4.5%) | 47 (5.7%) |
| $22,500 to $24,999 | 20 (1.8%) | 41 (5.0%) |
| $25,000 to $29,999 | 57 (5.2%) | 120 (14.5%) |
| $30,000 to $34,999 | 68 (6.2%) | 56 (6.8%) |
| $35,000 to $39,999 | 70 (6.4%) | 84 (10.1%) |
| $40,000 to $44,999 | 83 (7.6%) | 31 (3.7%) |
| $45,000 to $49,999 | 75 (6.8%) | 54 (6.5%) |
| $50,000 to $54,999 | 67 (6.1%) | 34 (4.1%) |
| $55,000 to $64,999 | 99 (9.0%) | 68 (8.2%) |
| $65,000 to $74,999 | 106 (9.7%) | 20 (2.4%) |
| $75,000 to $99,999 | 89 (8.1%) | 33 (4.0%) |
| $100,000+ | 102 (9.3%) | 20 (2.4%) |
| Total | 1,097 (100.0%) | 829 (100.0%) |
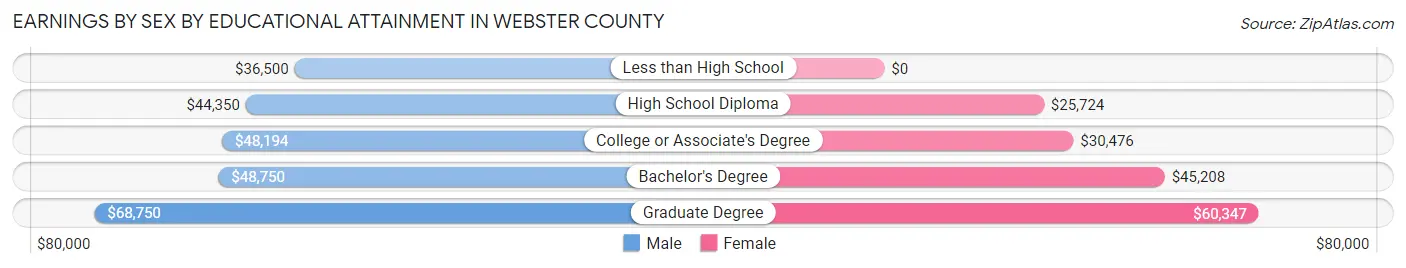
Earnings by Sex by Educational Attainment in Webster County
Average earnings in Webster County are $46,754 for men and $31,500 for women, a difference of 32.6%. Men with an educational attainment of graduate degree enjoy the highest average annual earnings of $68,750, while those with less than high school education earn the least with $36,500. Women with an educational attainment of graduate degree earn the most with the average annual earnings of $60,347, while those with high school diploma education have the smallest earnings of $25,724.
| Educational Attainment | Male Income | Female Income |
| Less than High School | $36,500 | $0 |
| High School Diploma | $44,350 | $25,724 |
| College or Associate's Degree | $48,194 | $30,476 |
| Bachelor's Degree | $48,750 | $45,208 |
| Graduate Degree | $68,750 | $60,347 |
| Total | $46,754 | $31,500 |
Family Income in Webster County
Family Income Brackets in Webster County
According to the Webster County family income data, there are 220 families falling into the $50,000 to $74,999 income range, which is the most common income bracket and makes up 22.5% of all families. Conversely, the $10,000 to $14,999 income bracket is the least frequent group with only 4 families (0.4%) belonging to this category.
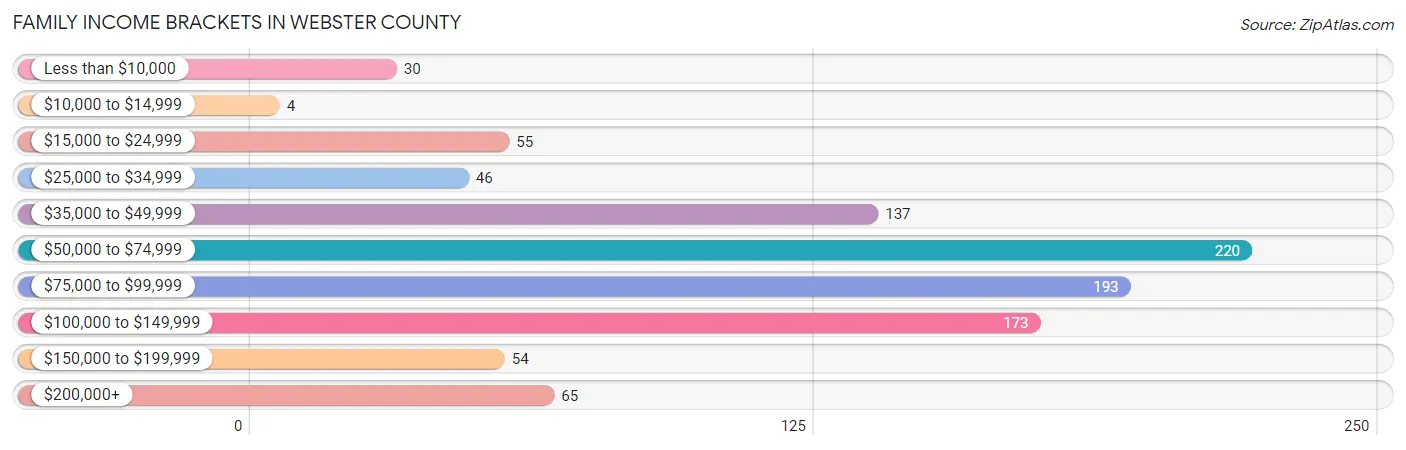
| Income Bracket | # Families | % Families |
| Less than $10,000 | 30 | 3.1% |
| $10,000 to $14,999 | 4 | 0.4% |
| $15,000 to $24,999 | 55 | 5.6% |
| $25,000 to $34,999 | 46 | 4.7% |
| $35,000 to $49,999 | 137 | 14.0% |
| $50,000 to $74,999 | 220 | 22.5% |
| $75,000 to $99,999 | 193 | 19.8% |
| $100,000 to $149,999 | 173 | 17.7% |
| $150,000 to $199,999 | 54 | 5.5% |
| $200,000+ | 65 | 6.7% |
Family Income by Famaliy Size in Webster County
5-person families (50 | 5.1%) account for the highest median family income in Webster County with $120,833 per family, while 2-person families (551 | 56.4%) have the highest median income of $32,552 per family member.
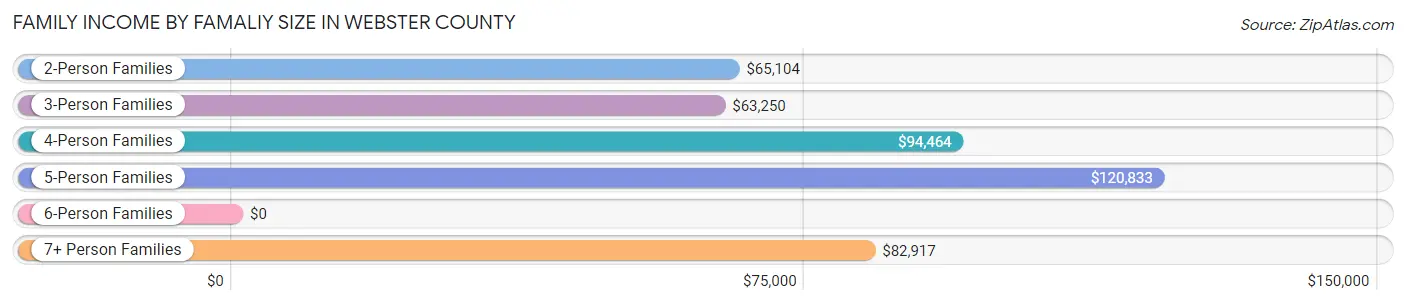
| Income Bracket | # Families | Median Income |
| 2-Person Families | 551 (56.4%) | $65,104 |
| 3-Person Families | 162 (16.6%) | $63,250 |
| 4-Person Families | 179 (18.3%) | $94,464 |
| 5-Person Families | 50 (5.1%) | $120,833 |
| 6-Person Families | 23 (2.4%) | $0 |
| 7+ Person Families | 12 (1.2%) | $82,917 |
| Total | 977 (100.0%) | $74,028 |
Family Income by Number of Earners in Webster County
The median family income in Webster County is $74,028, with families comprising 3+ earners (73) having the highest median family income of $131,458, while families with no earners (133) have the lowest median family income of $45,417, accounting for 7.5% and 13.6% of families, respectively.
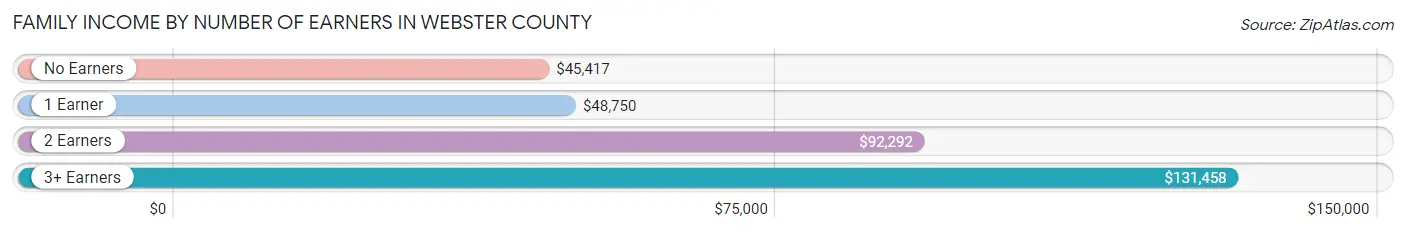
| Number of Earners | # Families | Median Income |
| No Earners | 133 (13.6%) | $45,417 |
| 1 Earner | 280 (28.7%) | $48,750 |
| 2 Earners | 491 (50.3%) | $92,292 |
| 3+ Earners | 73 (7.5%) | $131,458 |
| Total | 977 (100.0%) | $74,028 |
Household Income in Webster County
Household Income Brackets in Webster County
With 297 households falling in the category, the $50,000 to $74,999 income range is the most frequent in Webster County, accounting for 20.1% of all households. In contrast, only 43 households (2.9%) fall into the less than $10,000 income bracket, making it the least populous group.
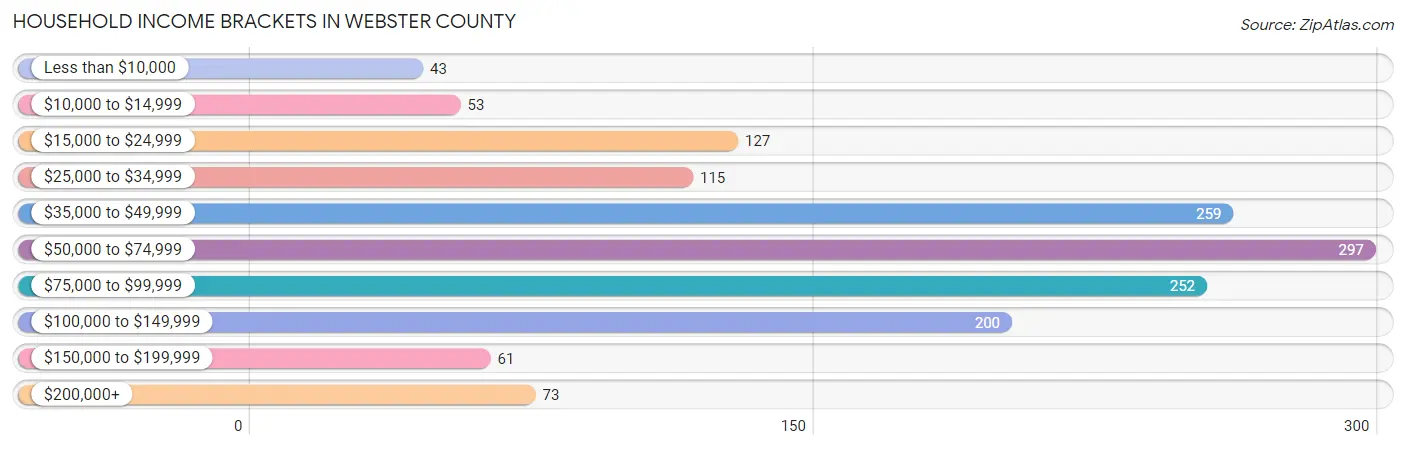
| Income Bracket | # Households | % Households |
| Less than $10,000 | 43 | 2.9% |
| $10,000 to $14,999 | 53 | 3.6% |
| $15,000 to $24,999 | 127 | 8.6% |
| $25,000 to $34,999 | 115 | 7.8% |
| $35,000 to $49,999 | 259 | 17.5% |
| $50,000 to $74,999 | 297 | 20.1% |
| $75,000 to $99,999 | 252 | 17.0% |
| $100,000 to $149,999 | 200 | 13.5% |
| $150,000 to $199,999 | 61 | 4.1% |
| $200,000+ | 73 | 4.9% |
Household Income by Householder Age in Webster County
The median household income in Webster County is $62,571, with the highest median household income of $73,500 found in the 25 to 44 years age bracket for the primary householder. A total of 410 households (27.7%) fall into this category. Meanwhile, the 15 to 24 years age bracket for the primary householder has the lowest median household income of $22,500, with 88 households (5.9%) in this group.
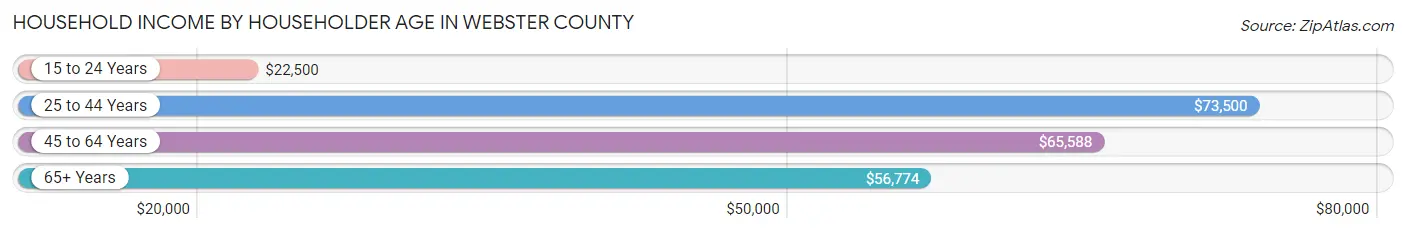
| Income Bracket | # Households | Median Income |
| 15 to 24 Years | 88 (5.9%) | $22,500 |
| 25 to 44 Years | 410 (27.7%) | $73,500 |
| 45 to 64 Years | 500 (33.8%) | $65,588 |
| 65+ Years | 482 (32.6%) | $56,774 |
| Total | 1,480 (100.0%) | $62,571 |
Poverty in Webster County
Income Below Poverty by Sex and Age in Webster County
With 7.0% poverty level for males and 8.9% for females among the residents of Webster County, 18 to 24 year old males and 16 and 17 year old females are the most vulnerable to poverty, with 28 males (23.7%) and 11 females (18.3%) in their respective age groups living below the poverty level.
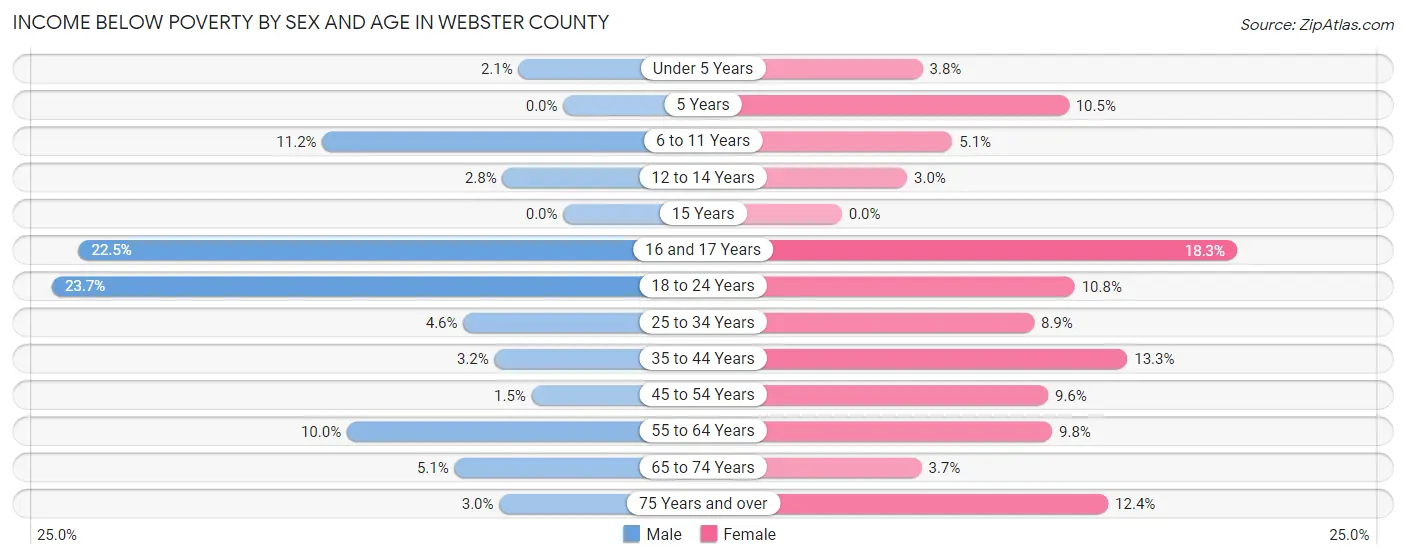
| Age Bracket | Male | Female |
| Under 5 Years | 2 (2.1%) | 3 (3.7%) |
| 5 Years | 0 (0.0%) | 2 (10.5%) |
| 6 to 11 Years | 18 (11.2%) | 6 (5.1%) |
| 12 to 14 Years | 2 (2.8%) | 2 (3.0%) |
| 15 Years | 0 (0.0%) | 0 (0.0%) |
| 16 and 17 Years | 9 (22.5%) | 11 (18.3%) |
| 18 to 24 Years | 28 (23.7%) | 12 (10.8%) |
| 25 to 34 Years | 9 (4.6%) | 14 (8.9%) |
| 35 to 44 Years | 6 (3.2%) | 22 (13.3%) |
| 45 to 54 Years | 3 (1.5%) | 18 (9.6%) |
| 55 to 64 Years | 27 (10.0%) | 24 (9.8%) |
| 65 to 74 Years | 11 (5.1%) | 8 (3.7%) |
| 75 Years and over | 3 (3.0%) | 22 (12.4%) |
| Total | 118 (7.0%) | 144 (8.9%) |
Income Above Poverty by Sex and Age in Webster County
According to the poverty statistics in Webster County, males aged 5 years and females aged 15 years are the age groups that are most secure financially, with 100.0% of males and 100.0% of females in these age groups living above the poverty line.
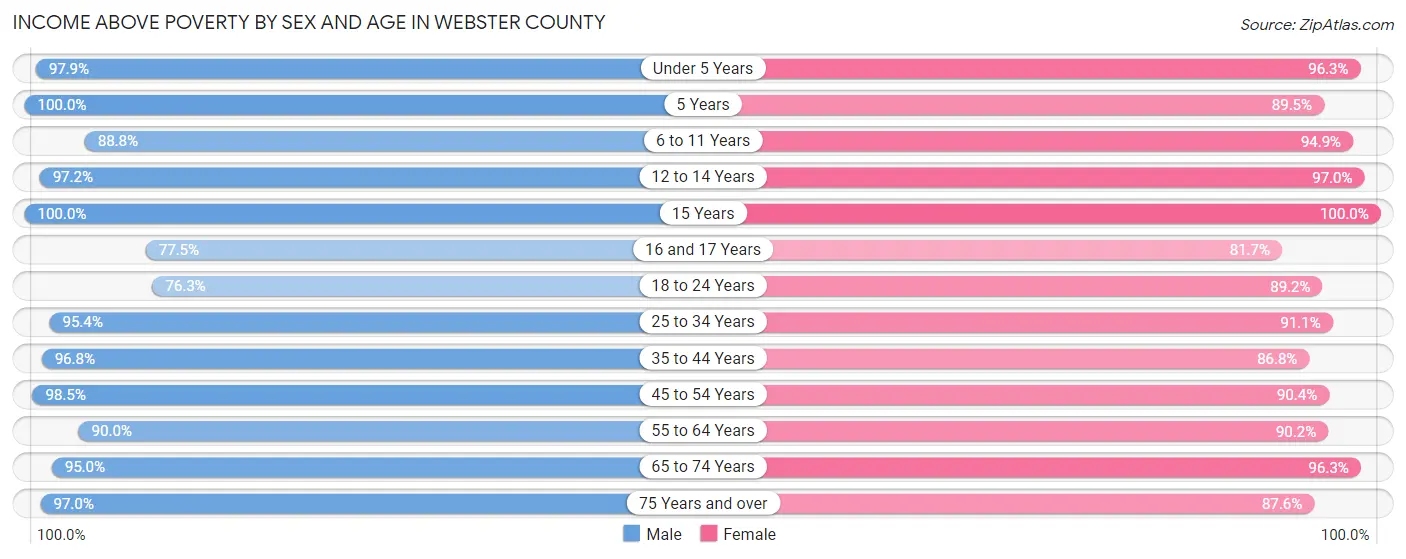
| Age Bracket | Male | Female |
| Under 5 Years | 94 (97.9%) | 77 (96.3%) |
| 5 Years | 4 (100.0%) | 17 (89.5%) |
| 6 to 11 Years | 143 (88.8%) | 111 (94.9%) |
| 12 to 14 Years | 69 (97.2%) | 64 (97.0%) |
| 15 Years | 26 (100.0%) | 17 (100.0%) |
| 16 and 17 Years | 31 (77.5%) | 49 (81.7%) |
| 18 to 24 Years | 90 (76.3%) | 99 (89.2%) |
| 25 to 34 Years | 185 (95.4%) | 143 (91.1%) |
| 35 to 44 Years | 182 (96.8%) | 144 (86.8%) |
| 45 to 54 Years | 201 (98.5%) | 170 (90.4%) |
| 55 to 64 Years | 242 (90.0%) | 222 (90.2%) |
| 65 to 74 Years | 207 (95.0%) | 208 (96.3%) |
| 75 Years and over | 98 (97.0%) | 156 (87.6%) |
| Total | 1,572 (93.0%) | 1,477 (91.1%) |
Income Below Poverty Among Married-Couple Families in Webster County
The poverty statistics for married-couple families in Webster County show that 2.7% or 21 of the total 780 families live below the poverty line. Families with no children have the highest poverty rate of 3.9%, comprising of 19 families. On the other hand, families with 3 or 4 children have the lowest poverty rate of 0.0%, which includes 0 families.
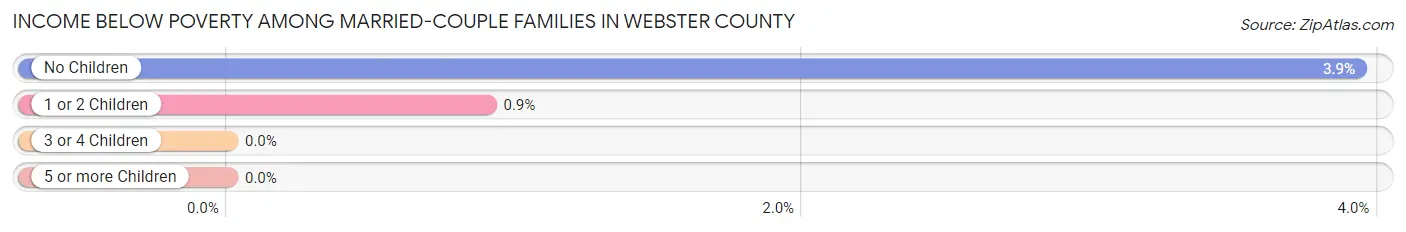
| Children | Above Poverty | Below Poverty |
| No Children | 465 (96.1%) | 19 (3.9%) |
| 1 or 2 Children | 220 (99.1%) | 2 (0.9%) |
| 3 or 4 Children | 68 (100.0%) | 0 (0.0%) |
| 5 or more Children | 6 (100.0%) | 0 (0.0%) |
| Total | 759 (97.3%) | 21 (2.7%) |
Income Below Poverty Among Single-Parent Households in Webster County
According to the poverty data in Webster County, 12.4% or 12 single-father households and 29.0% or 29 single-mother households are living below the poverty line. Among single-father households, those with 3 or 4 children have the highest poverty rate, with 2 households (66.7%) experiencing poverty. Likewise, among single-mother households, those with 3 or 4 children have the highest poverty rate, with 20 households (83.3%) falling below the poverty line.
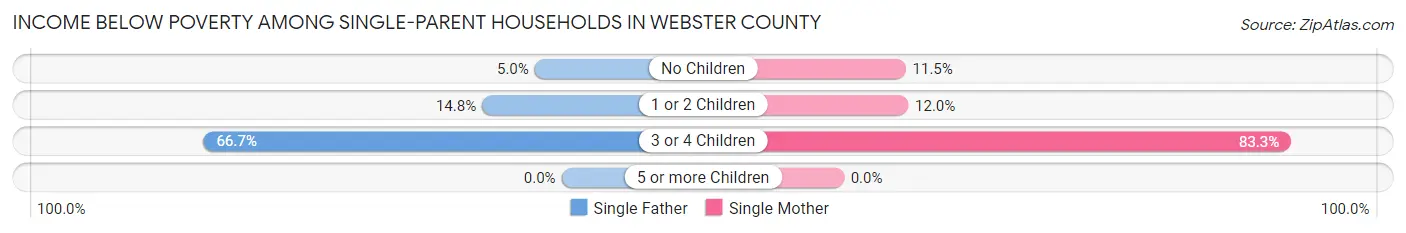
| Children | Single Father | Single Mother |
| No Children | 2 (5.0%) | 3 (11.5%) |
| 1 or 2 Children | 8 (14.8%) | 6 (12.0%) |
| 3 or 4 Children | 2 (66.7%) | 20 (83.3%) |
| 5 or more Children | 0 (0.0%) | 0 (0.0%) |
| Total | 12 (12.4%) | 29 (29.0%) |
Income Below Poverty Among Married-Couple vs Single-Parent Households in Webster County
The poverty data for Webster County shows that 21 of the married-couple family households (2.7%) and 41 of the single-parent households (20.8%) are living below the poverty level. Within the married-couple family households, those with no children have the highest poverty rate, with 19 households (3.9%) falling below the poverty line. Among the single-parent households, those with 3 or 4 children have the highest poverty rate, with 22 household (81.5%) living below poverty.
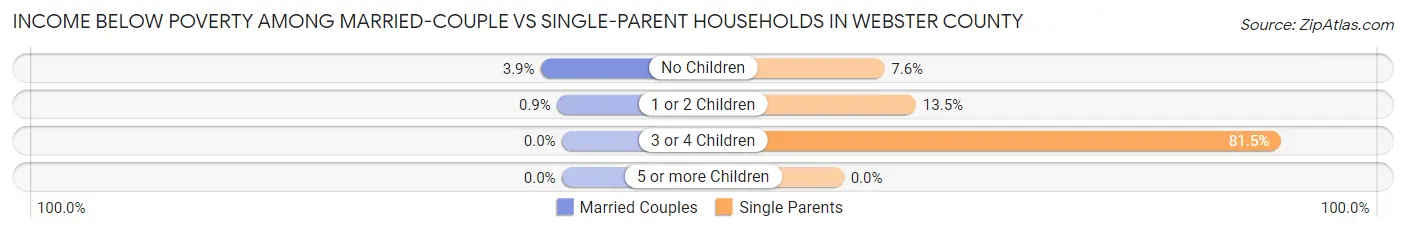
| Children | Married-Couple Families | Single-Parent Households |
| No Children | 19 (3.9%) | 5 (7.6%) |
| 1 or 2 Children | 2 (0.9%) | 14 (13.5%) |
| 3 or 4 Children | 0 (0.0%) | 22 (81.5%) |
| 5 or more Children | 0 (0.0%) | 0 (0.0%) |
| Total | 21 (2.7%) | 41 (20.8%) |
Race in Webster County
The most populous races in Webster County are White / Caucasian (3,207 | 94.1%), Hispanic or Latino (182 | 5.3%), and Two or more Races (148 | 4.3%).
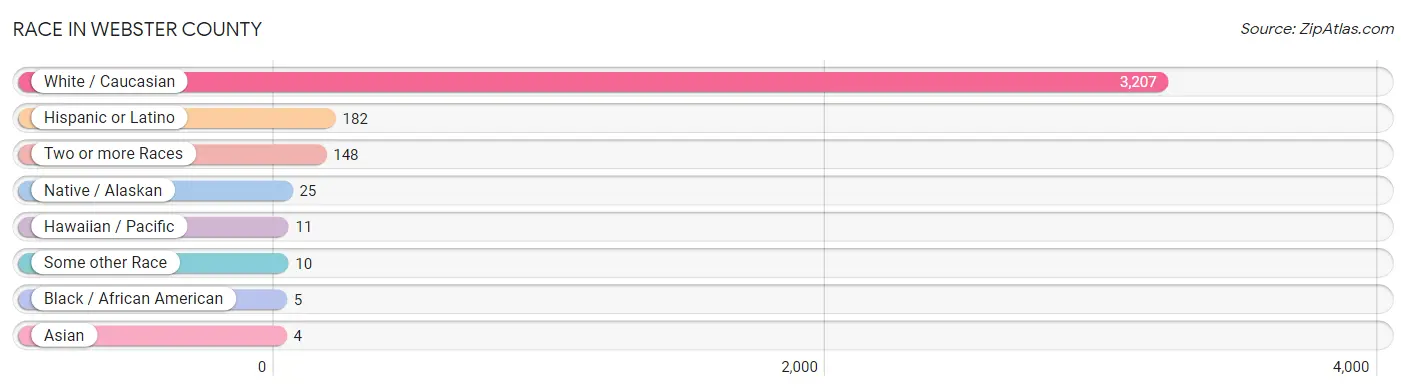
| Race | # Population | % Population |
| Asian | 4 | 0.1% |
| Black / African American | 5 | 0.2% |
| Hawaiian / Pacific | 11 | 0.3% |
| Hispanic or Latino | 182 | 5.3% |
| Native / Alaskan | 25 | 0.7% |
| White / Caucasian | 3,207 | 94.1% |
| Two or more Races | 148 | 4.3% |
| Some other Race | 10 | 0.3% |
| Total | 3,410 | 100.0% |
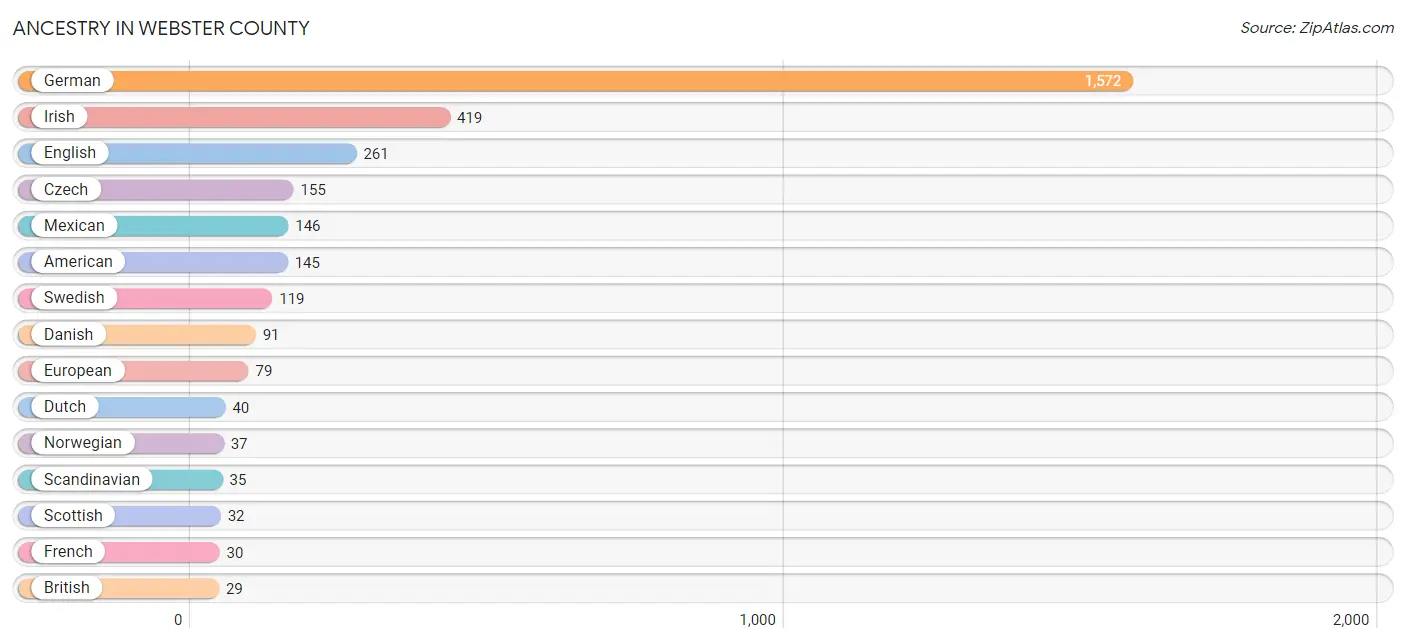
Ancestry in Webster County
The most populous ancestries reported in Webster County are German (1,572 | 46.1%), Irish (419 | 12.3%), English (261 | 7.6%), Czech (155 | 4.5%), and Mexican (146 | 4.3%), together accounting for 74.9% of all Webster County residents.
| Ancestry | # Population | % Population |
| American | 145 | 4.3% |
| Apache | 10 | 0.3% |
| Bhutanese | 6 | 0.2% |
| British | 29 | 0.9% |
| Central American | 4 | 0.1% |
| Chickasaw | 8 | 0.2% |
| Chippewa | 4 | 0.1% |
| Colombian | 8 | 0.2% |
| Cuban | 9 | 0.3% |
| Czech | 155 | 4.5% |
| Czechoslovakian | 12 | 0.4% |
| Danish | 91 | 2.7% |
| Dutch | 40 | 1.2% |
| English | 261 | 7.6% |
| European | 79 | 2.3% |
| Finnish | 4 | 0.1% |
| French | 30 | 0.9% |
| French American Indian | 17 | 0.5% |
| French Canadian | 9 | 0.3% |
| German | 1,572 | 46.1% |
| Greek | 1 | 0.0% |
| Honduran | 4 | 0.1% |
| Hungarian | 1 | 0.0% |
| Irish | 419 | 12.3% |
| Italian | 20 | 0.6% |
| Korean | 9 | 0.3% |
| Mexican | 146 | 4.3% |
| Native Hawaiian | 13 | 0.4% |
| Navajo | 9 | 0.3% |
| Northern European | 3 | 0.1% |
| Norwegian | 37 | 1.1% |
| Pennsylvania German | 4 | 0.1% |
| Polish | 3 | 0.1% |
| Portuguese | 3 | 0.1% |
| Puerto Rican | 15 | 0.4% |
| Russian | 11 | 0.3% |
| Scandinavian | 35 | 1.0% |
| Scotch-Irish | 23 | 0.7% |
| Scottish | 32 | 0.9% |
| Sioux | 21 | 0.6% |
| Slovak | 1 | 0.0% |
| South African | 7 | 0.2% |
| South American | 8 | 0.2% |
| Subsaharan African | 7 | 0.2% |
| Swedish | 119 | 3.5% |
| Swiss | 6 | 0.2% |
| Welsh | 9 | 0.3% | View All 47 Rows |
Immigrants in Webster County
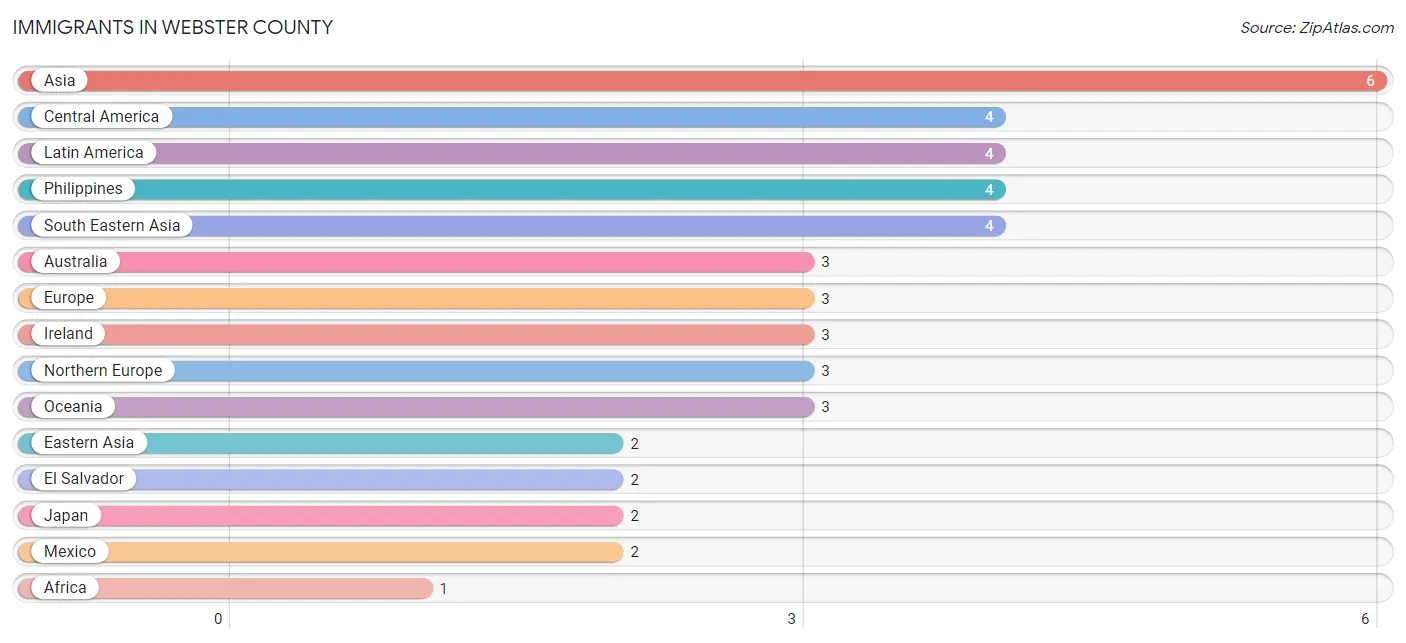
The most numerous immigrant groups reported in Webster County came from Asia (6 | 0.2%), Central America (4 | 0.1%), Latin America (4 | 0.1%), Philippines (4 | 0.1%), and South Eastern Asia (4 | 0.1%), together accounting for 0.7% of all Webster County residents.
| Immigration Origin | # Population | % Population |
| Africa | 1 | 0.0% |
| Asia | 6 | 0.2% |
| Australia | 3 | 0.1% |
| Central America | 4 | 0.1% |
| Eastern Asia | 2 | 0.1% |
| El Salvador | 2 | 0.1% |
| Europe | 3 | 0.1% |
| Ireland | 3 | 0.1% |
| Japan | 2 | 0.1% |
| Latin America | 4 | 0.1% |
| Mexico | 2 | 0.1% |
| Northern Europe | 3 | 0.1% |
| Oceania | 3 | 0.1% |
| Philippines | 4 | 0.1% |
| South Eastern Asia | 4 | 0.1% |
| Western Africa | 1 | 0.0% | View All 16 Rows |
Sex and Age in Webster County
Sex and Age in Webster County
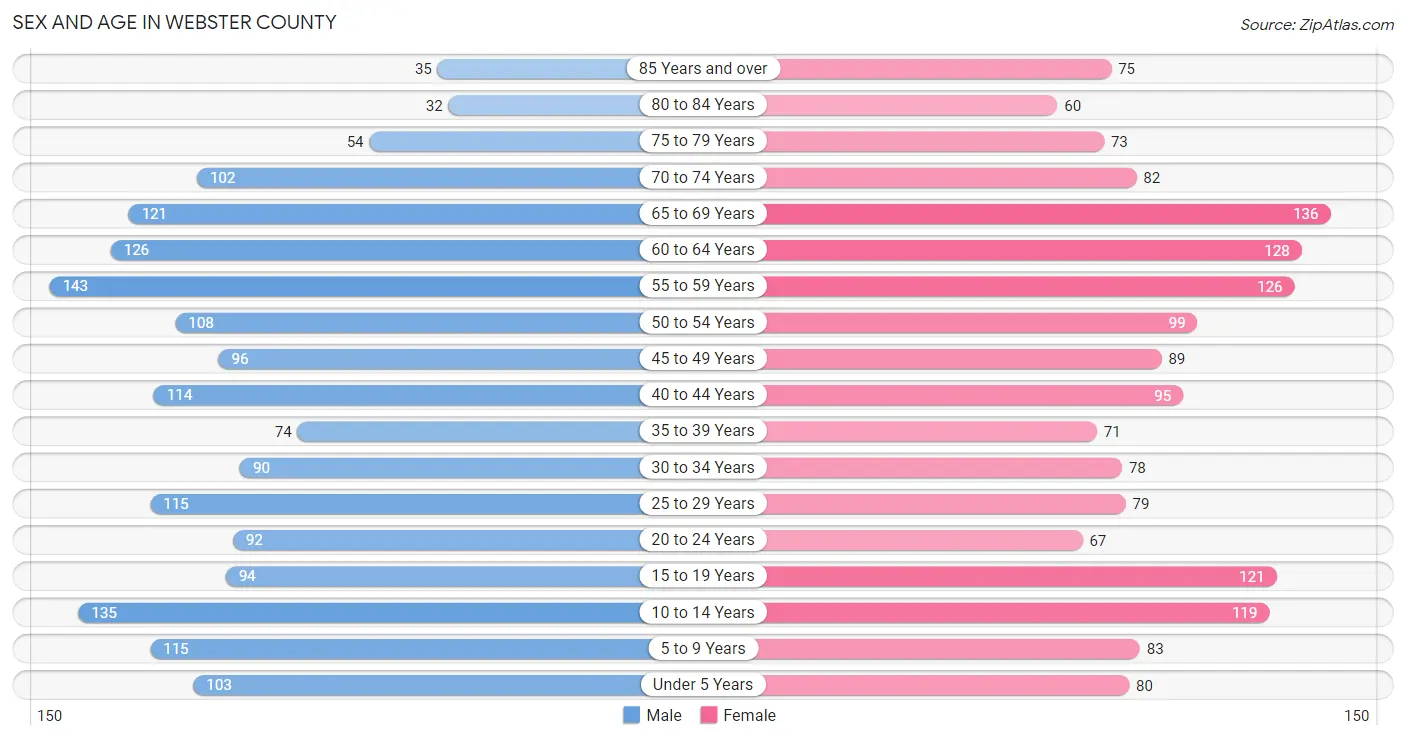
The most populous age groups in Webster County are 55 to 59 Years (143 | 8.2%) for men and 65 to 69 Years (136 | 8.2%) for women.
| Age Bracket | Male | Female |
| Under 5 Years | 103 (5.9%) | 80 (4.8%) |
| 5 to 9 Years | 115 (6.6%) | 83 (5.0%) |
| 10 to 14 Years | 135 (7.7%) | 119 (7.2%) |
| 15 to 19 Years | 94 (5.4%) | 121 (7.3%) |
| 20 to 24 Years | 92 (5.3%) | 67 (4.0%) |
| 25 to 29 Years | 115 (6.6%) | 79 (4.8%) |
| 30 to 34 Years | 90 (5.1%) | 78 (4.7%) |
| 35 to 39 Years | 74 (4.2%) | 71 (4.3%) |
| 40 to 44 Years | 114 (6.5%) | 95 (5.7%) |
| 45 to 49 Years | 96 (5.5%) | 89 (5.4%) |
| 50 to 54 Years | 108 (6.2%) | 99 (6.0%) |
| 55 to 59 Years | 143 (8.2%) | 126 (7.6%) |
| 60 to 64 Years | 126 (7.2%) | 128 (7.7%) |
| 65 to 69 Years | 121 (6.9%) | 136 (8.2%) |
| 70 to 74 Years | 102 (5.8%) | 82 (4.9%) |
| 75 to 79 Years | 54 (3.1%) | 73 (4.4%) |
| 80 to 84 Years | 32 (1.8%) | 60 (3.6%) |
| 85 Years and over | 35 (2.0%) | 75 (4.5%) |
| Total | 1,749 (100.0%) | 1,661 (100.0%) |
Families and Households in Webster County
Median Family Size in Webster County
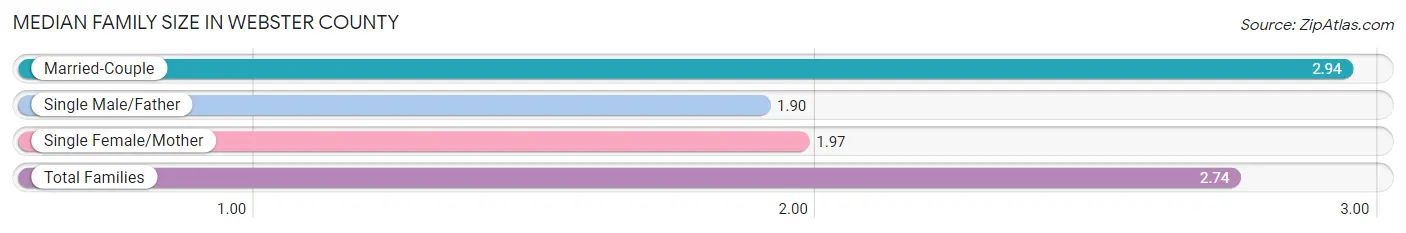
The median family size in Webster County is 2.74 persons per family, with married-couple families (780 | 79.8%) accounting for the largest median family size of 2.94 persons per family. On the other hand, single male/father families (97 | 9.9%) represent the smallest median family size with 1.90 persons per family.
| Family Type | # Families | Family Size |
| Married-Couple | 780 (79.8%) | 2.94 |
| Single Male/Father | 97 (9.9%) | 1.90 |
| Single Female/Mother | 100 (10.2%) | 1.97 |
| Total Families | 977 (100.0%) | 2.74 |
Median Household Size in Webster County
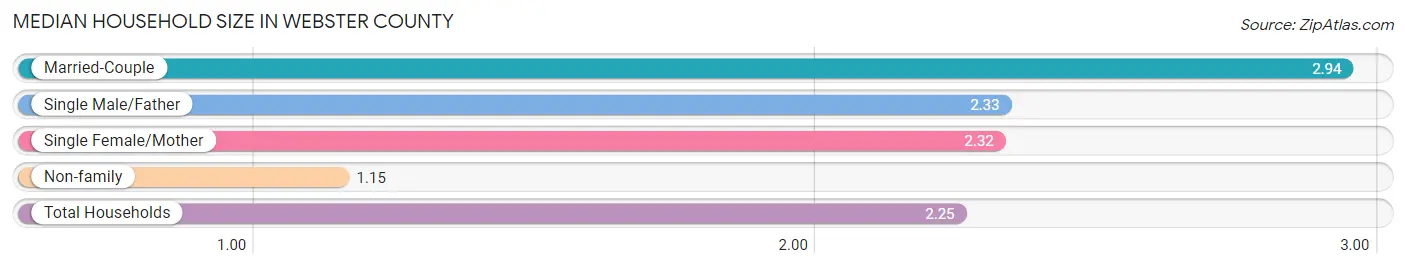
The median household size in Webster County is 2.25 persons per household, with married-couple households (780 | 52.7%) accounting for the largest median household size of 2.94 persons per household. non-family households (503 | 34.0%) represent the smallest median household size with 1.15 persons per household.
| Household Type | # Households | Household Size |
| Married-Couple | 780 (52.7%) | 2.94 |
| Single Male/Father | 97 (6.6%) | 2.33 |
| Single Female/Mother | 100 (6.8%) | 2.32 |
| Non-family | 503 (34.0%) | 1.15 |
| Total Households | 1,480 (100.0%) | 2.25 |
Household Size by Marriage Status in Webster County
Out of a total of 1,480 households in Webster County, 977 (66.0%) are family households, while 503 (34.0%) are nonfamily households. The most numerous type of family households are 2-person households, comprising 522, and the most common type of nonfamily households are 1-person households, comprising 437.
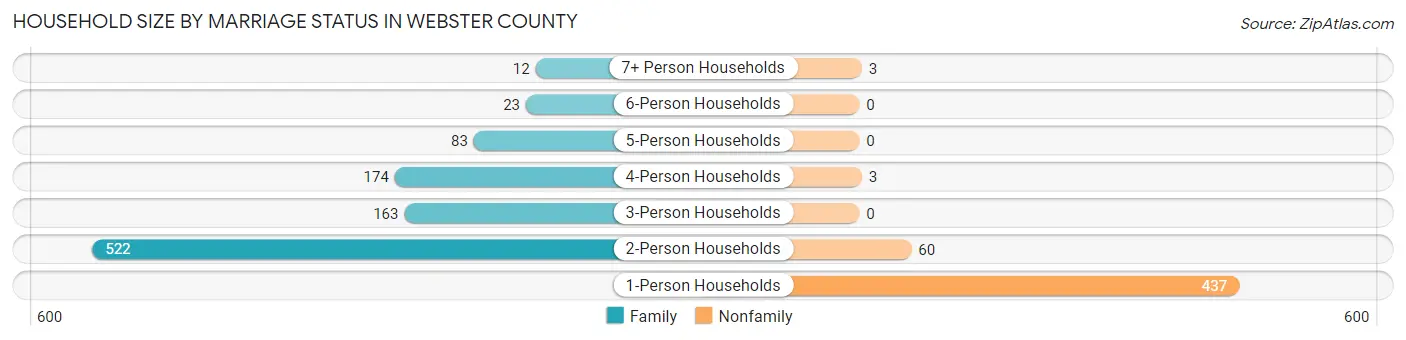
| Household Size | Family Households | Nonfamily Households |
| 1-Person Households | - | 437 (29.5%) |
| 2-Person Households | 522 (35.3%) | 60 (4.1%) |
| 3-Person Households | 163 (11.0%) | 0 (0.0%) |
| 4-Person Households | 174 (11.8%) | 3 (0.2%) |
| 5-Person Households | 83 (5.6%) | 0 (0.0%) |
| 6-Person Households | 23 (1.5%) | 0 (0.0%) |
| 7+ Person Households | 12 (0.8%) | 3 (0.2%) |
| Total | 977 (66.0%) | 503 (34.0%) |
Female Fertility in Webster County
Fertility by Age in Webster County
Average fertility rate in Webster County is 88.0 births per 1,000 women. Women in the age bracket of 20 to 34 years have the highest fertility rate with 170.0 births per 1,000 women. Women in the age bracket of 20 to 34 years acount for 70.4% of all women with births.
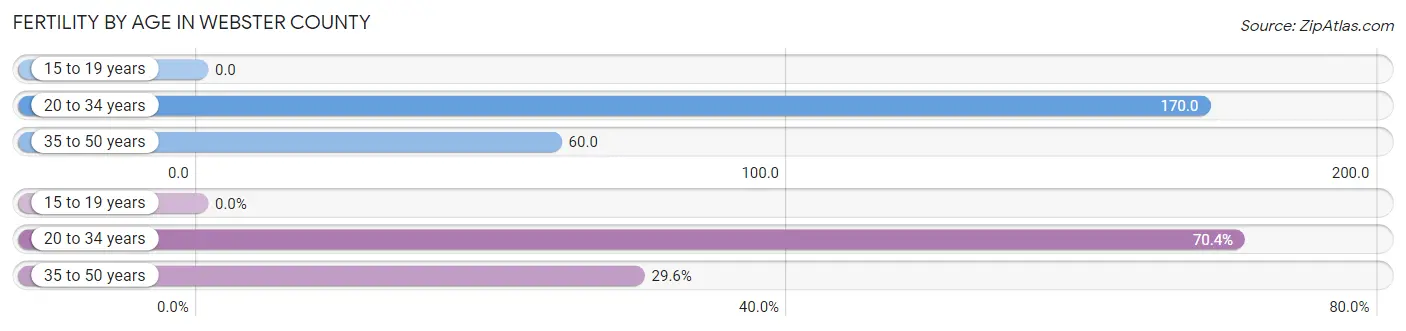
| Age Bracket | Women with Births | Births / 1,000 Women |
| 15 to 19 years | 0 (0.0%) | 0.0 |
| 20 to 34 years | 38 (70.4%) | 170.0 |
| 35 to 50 years | 16 (29.6%) | 60.0 |
| Total | 54 (100.0%) | 88.0 |
Fertility by Age by Marriage Status in Webster County
70.4% of women with births (54) in Webster County are married. The highest percentage of unmarried women with births falls into 35 to 50 years age bracket with 100.0% of them unmarried at the time of birth, while the lowest percentage of unmarried women with births belong to 20 to 34 years age bracket with 0.0% of them unmarried.
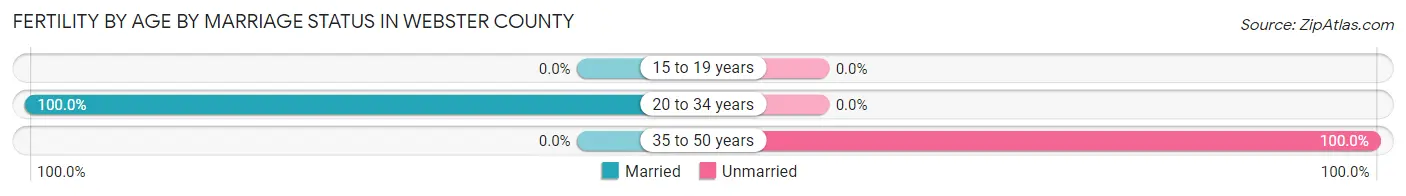
| Age Bracket | Married | Unmarried |
| 15 to 19 years | 0 (0.0%) | 0 (0.0%) |
| 20 to 34 years | 38 (100.0%) | 0 (0.0%) |
| 35 to 50 years | 0 (0.0%) | 16 (100.0%) |
| Total | 38 (70.4%) | 16 (29.6%) |
Fertility by Education in Webster County
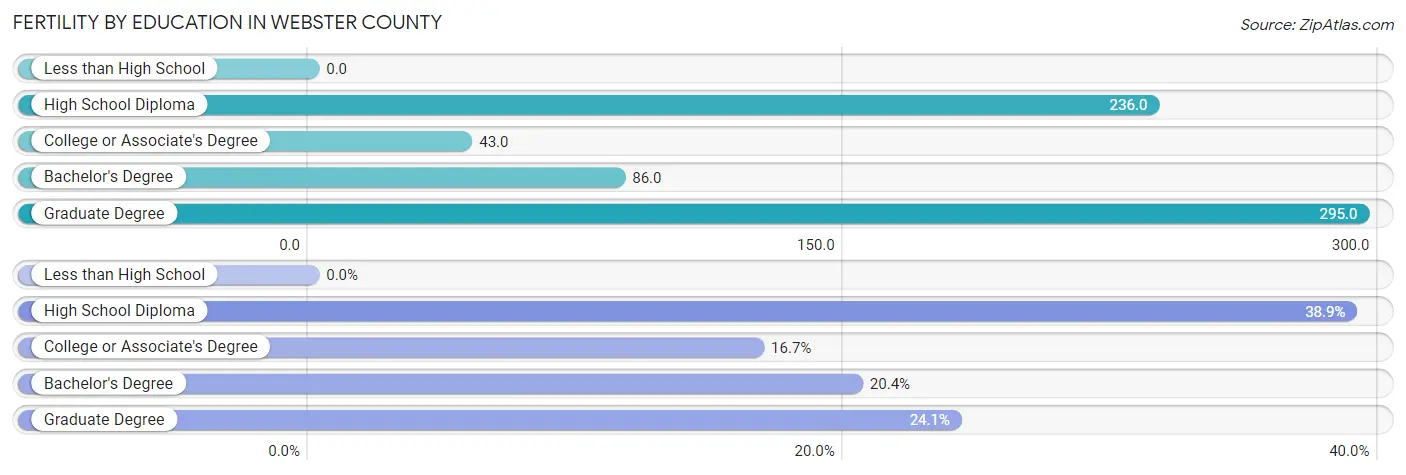
| Educational Attainment | Women with Births | Births / 1,000 Women |
| Less than High School | 0 (0.0%) | 0.0 |
| High School Diploma | 21 (38.9%) | 236.0 |
| College or Associate's Degree | 9 (16.7%) | 43.0 |
| Bachelor's Degree | 11 (20.4%) | 86.0 |
| Graduate Degree | 13 (24.1%) | 295.0 |
| Total | 54 (100.0%) | 88.0 |
Fertility by Education by Marriage Status in Webster County
29.6% of women with births in Webster County are unmarried. Women with the educational attainment of college or associate's degree are most likely to be married with 100.0% of them married at childbirth, while women with the educational attainment of high school diploma are least likely to be married with 76.2% of them unmarried at childbirth.
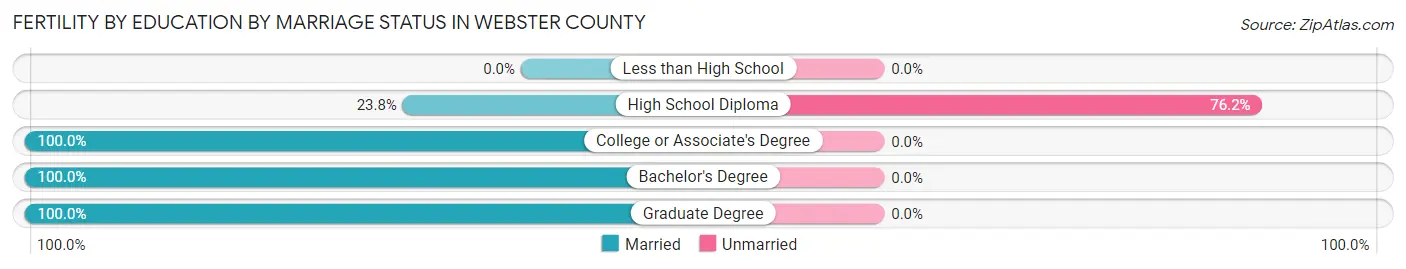
| Educational Attainment | Married | Unmarried |
| Less than High School | 0 (0.0%) | 0 (0.0%) |
| High School Diploma | 5 (23.8%) | 16 (76.2%) |
| College or Associate's Degree | 9 (100.0%) | 0 (0.0%) |
| Bachelor's Degree | 11 (100.0%) | 0 (0.0%) |
| Graduate Degree | 13 (100.0%) | 0 (0.0%) |
| Total | 38 (70.4%) | 16 (29.6%) |
Employment Characteristics in Webster County
Employment by Class of Employer in Webster County
Among the 1,745 employed individuals in Webster County, private company employees (991 | 56.8%), self-employed (not incorporated) (250 | 14.3%), and local government employees (177 | 10.1%) make up the most common classes of employment.
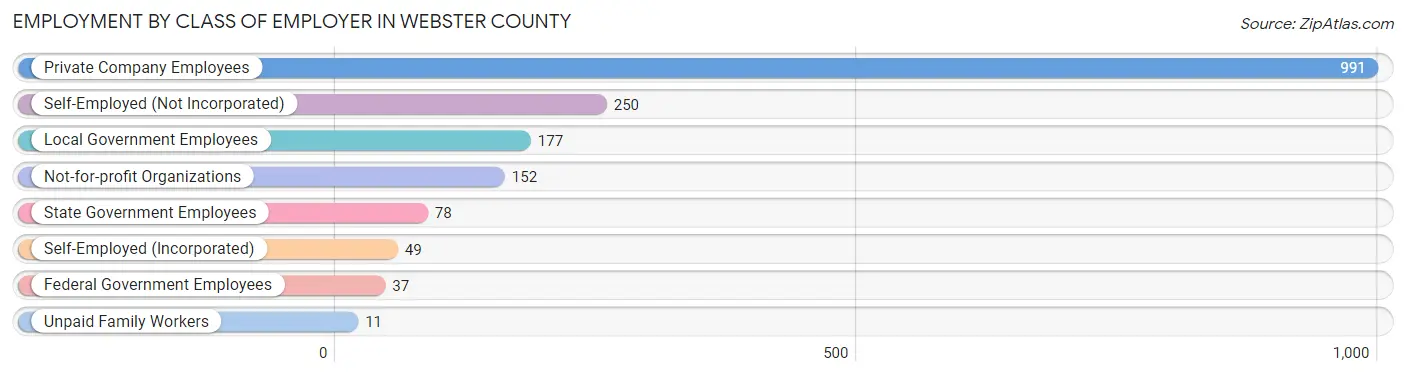
| Employer Class | # Employees | % Employees |
| Private Company Employees | 991 | 56.8% |
| Self-Employed (Incorporated) | 49 | 2.8% |
| Self-Employed (Not Incorporated) | 250 | 14.3% |
| Not-for-profit Organizations | 152 | 8.7% |
| Local Government Employees | 177 | 10.1% |
| State Government Employees | 78 | 4.5% |
| Federal Government Employees | 37 | 2.1% |
| Unpaid Family Workers | 11 | 0.6% |
| Total | 1,745 | 100.0% |
Employment Status by Age in Webster County
According to the labor force statistics for Webster County, out of the total population over 16 years of age (2,732), 65.9% or 1,800 individuals are in the labor force, with 1.8% or 32 of them unemployed. The age group with the highest labor force participation rate is 25 to 29 years, with 93.8% or 182 individuals in the labor force. Within the labor force, the 16 to 19 years age range has the highest percentage of unemployed individuals, with 11.7% or 9 of them being unemployed.
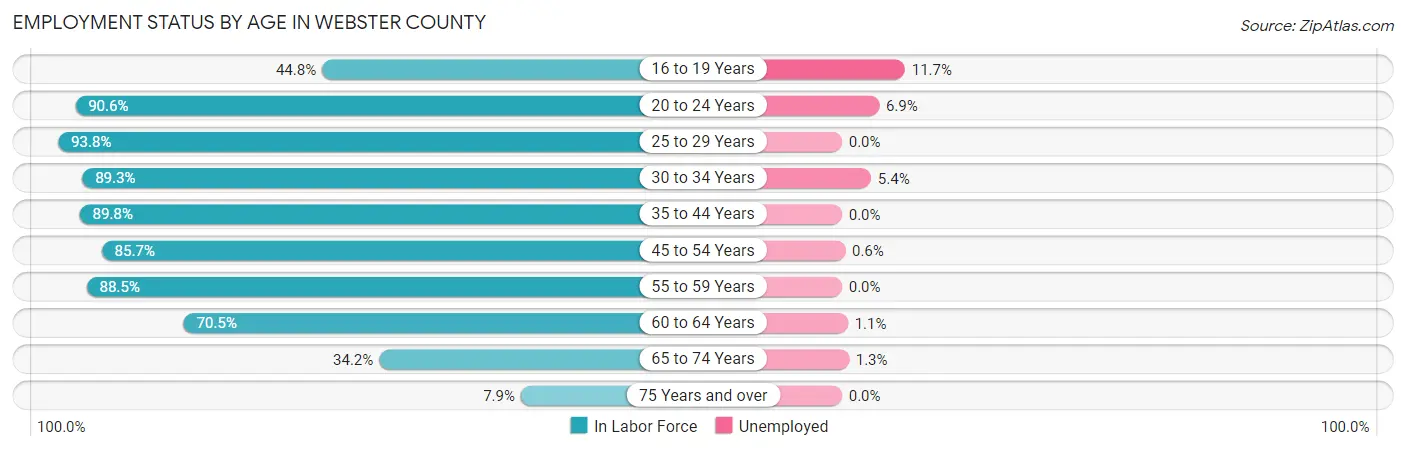
| Age Bracket | In Labor Force | Unemployed |
| 16 to 19 Years | 77 (44.8%) | 9 (11.7%) |
| 20 to 24 Years | 144 (90.6%) | 10 (6.9%) |
| 25 to 29 Years | 182 (93.8%) | 0 (0.0%) |
| 30 to 34 Years | 150 (89.3%) | 8 (5.4%) |
| 35 to 44 Years | 318 (89.8%) | 0 (0.0%) |
| 45 to 54 Years | 336 (85.7%) | 2 (0.6%) |
| 55 to 59 Years | 238 (88.5%) | 0 (0.0%) |
| 60 to 64 Years | 179 (70.5%) | 2 (1.1%) |
| 65 to 74 Years | 151 (34.2%) | 2 (1.3%) |
| 75 Years and over | 26 (7.9%) | 0 (0.0%) |
| Total | 1,800 (65.9%) | 32 (1.8%) |
Employment Status by Educational Attainment in Webster County
According to labor force statistics for Webster County, 86.0% of individuals (1,403) out of the total population between 25 and 64 years of age (1,631) are in the labor force, with 0.9% or 13 of them being unemployed. The group with the highest labor force participation rate are those with the educational attainment of bachelor's degree or higher, with 90.3% or 318 individuals in the labor force. Within the labor force, individuals with high school diploma education have the highest percentage of unemployment, with 1.1% or 5 of them being unemployed.
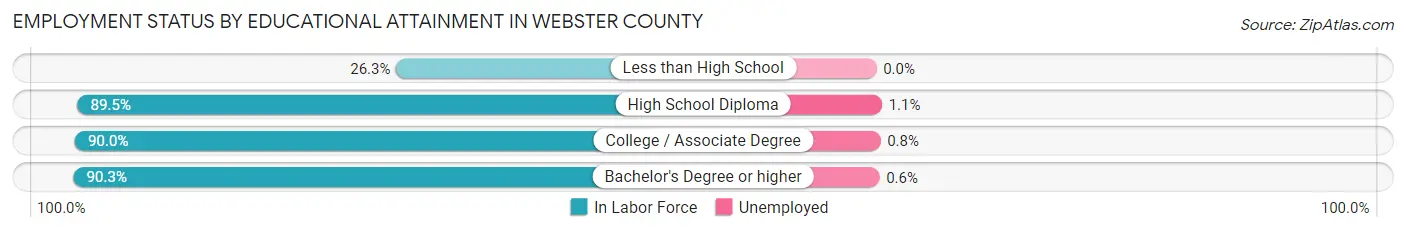
| Educational Attainment | In Labor Force | Unemployed |
| Less than High School | 26 (26.3%) | 0 (0.0%) |
| High School Diploma | 441 (89.5%) | 5 (1.1%) |
| College / Associate Degree | 618 (90.0%) | 5 (0.8%) |
| Bachelor's Degree or higher | 318 (90.3%) | 2 (0.6%) |
| Total | 1,403 (86.0%) | 15 (0.9%) |
Employment Occupations by Sex in Webster County
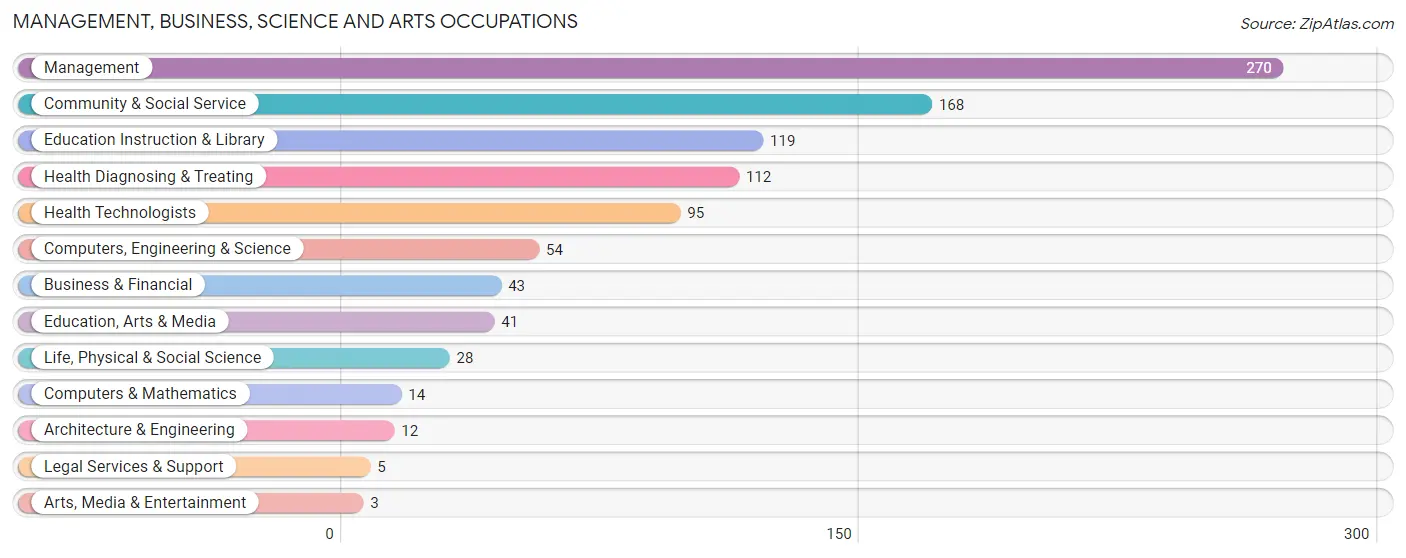
Management, Business, Science and Arts Occupations
The most common Management, Business, Science and Arts occupations in Webster County are Management (270 | 15.3%), Community & Social Service (168 | 9.5%), Education Instruction & Library (119 | 6.7%), Health Diagnosing & Treating (112 | 6.3%), and Health Technologists (95 | 5.4%).
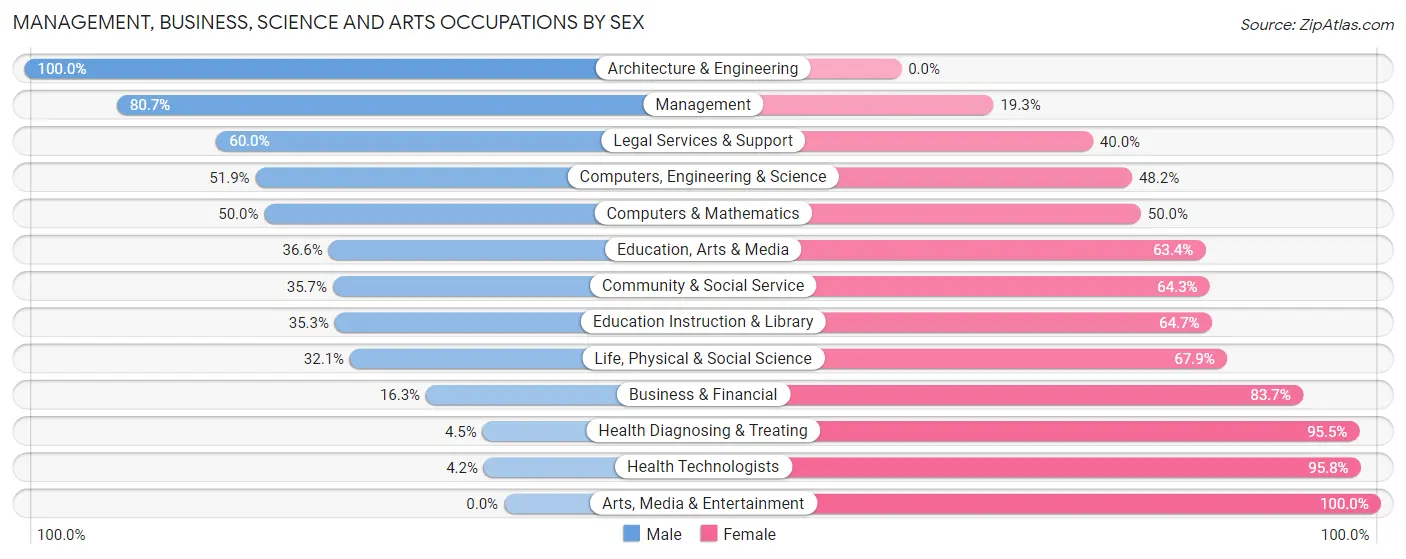
Management, Business, Science and Arts Occupations by Sex
Within the Management, Business, Science and Arts occupations in Webster County, the most male-oriented occupations are Architecture & Engineering (100.0%), Management (80.7%), and Legal Services & Support (60.0%), while the most female-oriented occupations are Arts, Media & Entertainment (100.0%), Health Technologists (95.8%), and Health Diagnosing & Treating (95.5%).
| Occupation | Male | Female |
| Management | 218 (80.7%) | 52 (19.3%) |
| Business & Financial | 7 (16.3%) | 36 (83.7%) |
| Computers, Engineering & Science | 28 (51.8%) | 26 (48.1%) |
| Computers & Mathematics | 7 (50.0%) | 7 (50.0%) |
| Architecture & Engineering | 12 (100.0%) | 0 (0.0%) |
| Life, Physical & Social Science | 9 (32.1%) | 19 (67.9%) |
| Community & Social Service | 60 (35.7%) | 108 (64.3%) |
| Education, Arts & Media | 15 (36.6%) | 26 (63.4%) |
| Legal Services & Support | 3 (60.0%) | 2 (40.0%) |
| Education Instruction & Library | 42 (35.3%) | 77 (64.7%) |
| Arts, Media & Entertainment | 0 (0.0%) | 3 (100.0%) |
| Health Diagnosing & Treating | 5 (4.5%) | 107 (95.5%) |
| Health Technologists | 4 (4.2%) | 91 (95.8%) |
| Total (Category) | 318 (49.1%) | 329 (50.8%) |
| Total (Overall) | 992 (56.1%) | 775 (43.9%) |
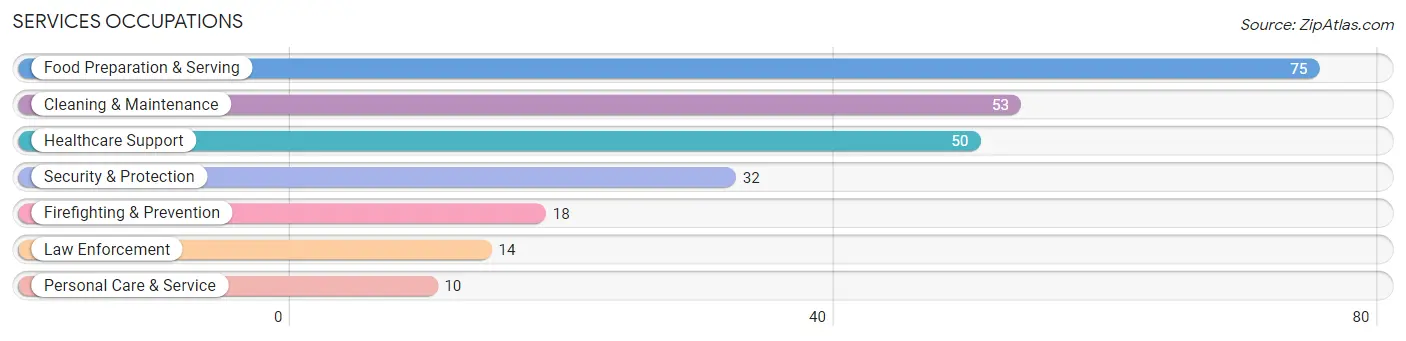
Services Occupations
The most common Services occupations in Webster County are Food Preparation & Serving (75 | 4.2%), Cleaning & Maintenance (53 | 3.0%), Healthcare Support (50 | 2.8%), Security & Protection (32 | 1.8%), and Firefighting & Prevention (18 | 1.0%).
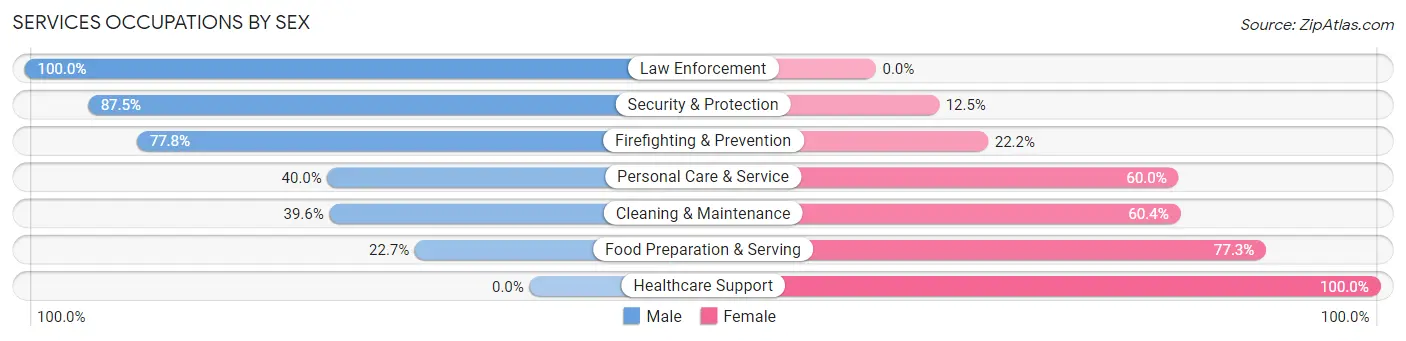
Services Occupations by Sex
Within the Services occupations in Webster County, the most male-oriented occupations are Law Enforcement (100.0%), Security & Protection (87.5%), and Firefighting & Prevention (77.8%), while the most female-oriented occupations are Healthcare Support (100.0%), Food Preparation & Serving (77.3%), and Cleaning & Maintenance (60.4%).
| Occupation | Male | Female |
| Healthcare Support | 0 (0.0%) | 50 (100.0%) |
| Security & Protection | 28 (87.5%) | 4 (12.5%) |
| Firefighting & Prevention | 14 (77.8%) | 4 (22.2%) |
| Law Enforcement | 14 (100.0%) | 0 (0.0%) |
| Food Preparation & Serving | 17 (22.7%) | 58 (77.3%) |
| Cleaning & Maintenance | 21 (39.6%) | 32 (60.4%) |
| Personal Care & Service | 4 (40.0%) | 6 (60.0%) |
| Total (Category) | 70 (31.8%) | 150 (68.2%) |
| Total (Overall) | 992 (56.1%) | 775 (43.9%) |
Sales and Office Occupations
The most common Sales and Office occupations in Webster County are Office & Administration (204 | 11.5%), and Sales & Related (98 | 5.6%).
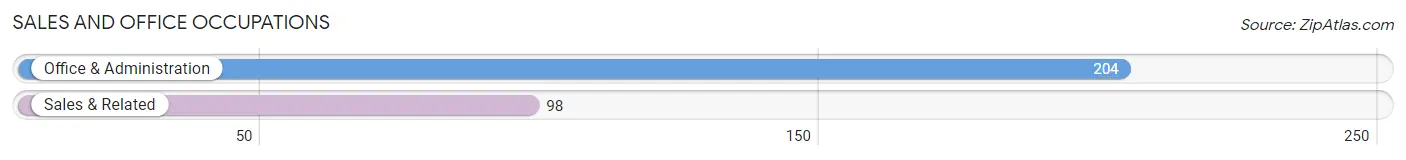
Sales and Office Occupations by Sex

| Occupation | Male | Female |
| Sales & Related | 58 (59.2%) | 40 (40.8%) |
| Office & Administration | 34 (16.7%) | 170 (83.3%) |
| Total (Category) | 92 (30.5%) | 210 (69.5%) |
| Total (Overall) | 992 (56.1%) | 775 (43.9%) |
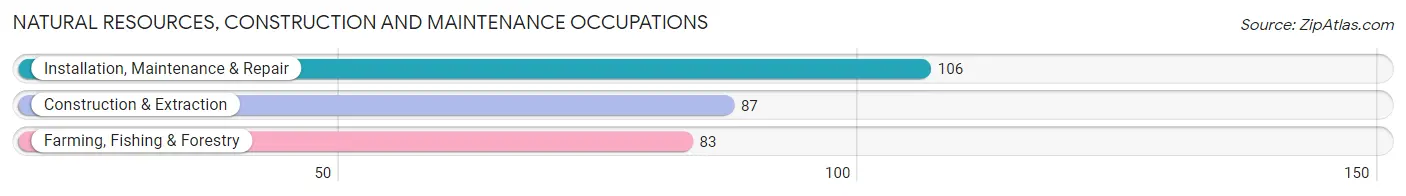
Natural Resources, Construction and Maintenance Occupations
The most common Natural Resources, Construction and Maintenance occupations in Webster County are Installation, Maintenance & Repair (106 | 6.0%), Construction & Extraction (87 | 4.9%), and Farming, Fishing & Forestry (83 | 4.7%).
Natural Resources, Construction and Maintenance Occupations by Sex
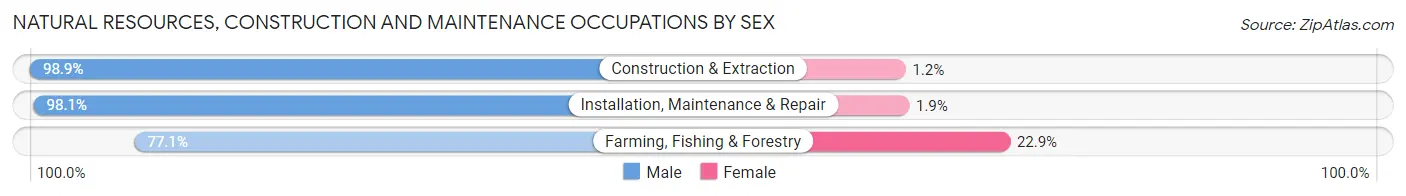
| Occupation | Male | Female |
| Farming, Fishing & Forestry | 64 (77.1%) | 19 (22.9%) |
| Construction & Extraction | 86 (98.9%) | 1 (1.1%) |
| Installation, Maintenance & Repair | 104 (98.1%) | 2 (1.9%) |
| Total (Category) | 254 (92.0%) | 22 (8.0%) |
| Total (Overall) | 992 (56.1%) | 775 (43.9%) |
Production, Transportation and Moving Occupations
The most common Production, Transportation and Moving occupations in Webster County are Transportation (126 | 7.1%), Production (112 | 6.3%), and Material Moving (84 | 4.8%).
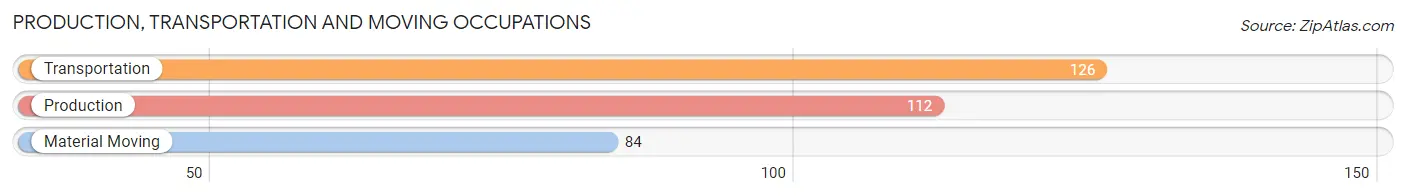
Production, Transportation and Moving Occupations by Sex
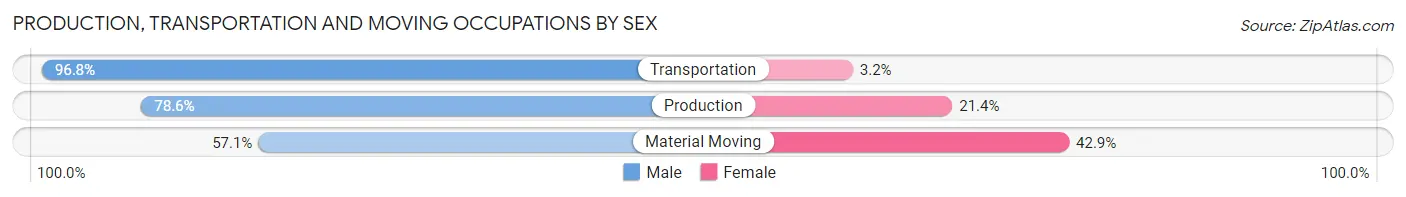
| Occupation | Male | Female |
| Production | 88 (78.6%) | 24 (21.4%) |
| Transportation | 122 (96.8%) | 4 (3.2%) |
| Material Moving | 48 (57.1%) | 36 (42.9%) |
| Total (Category) | 258 (80.1%) | 64 (19.9%) |
| Total (Overall) | 992 (56.1%) | 775 (43.9%) |
Employment Industries by Sex in Webster County
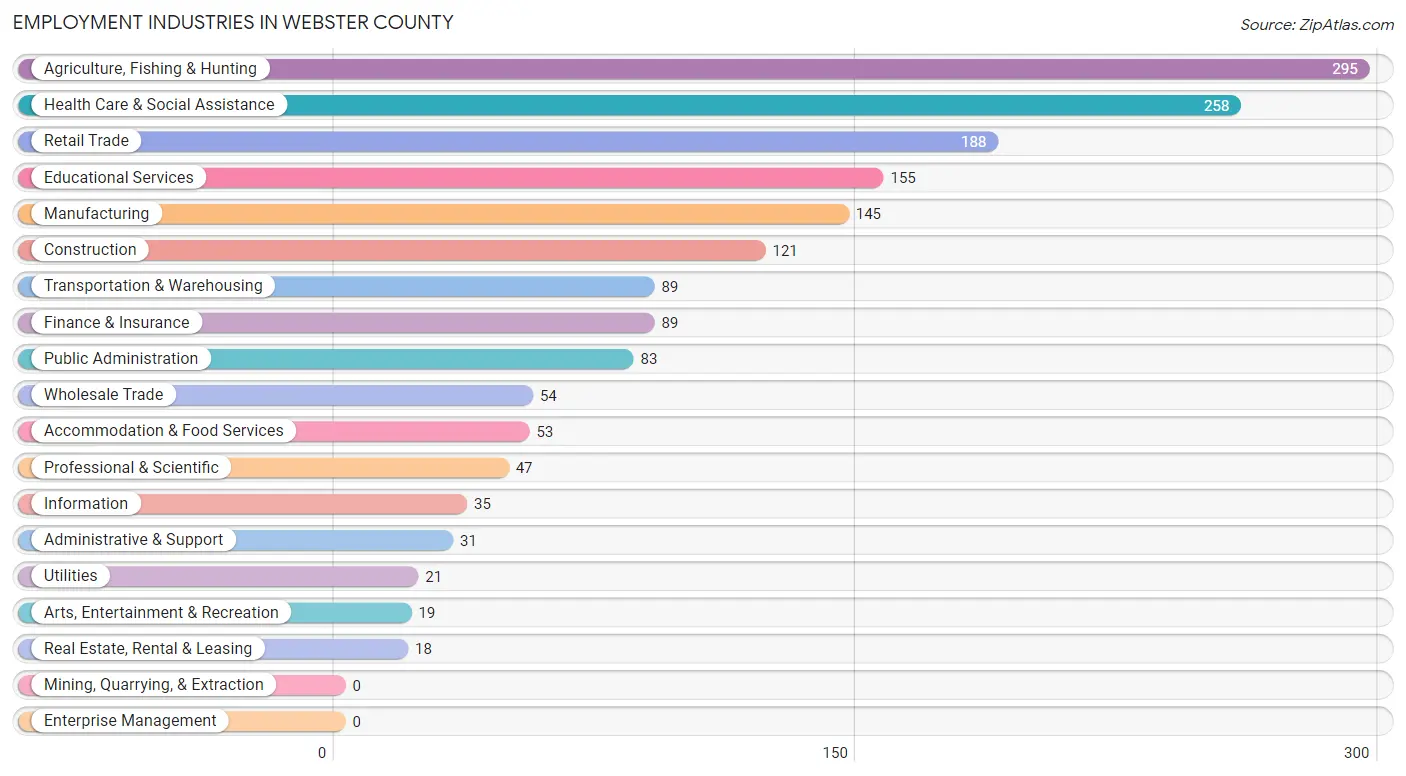
Employment Industries in Webster County
The major employment industries in Webster County include Agriculture, Fishing & Hunting (295 | 16.7%), Health Care & Social Assistance (258 | 14.6%), Retail Trade (188 | 10.6%), Educational Services (155 | 8.8%), and Manufacturing (145 | 8.2%).
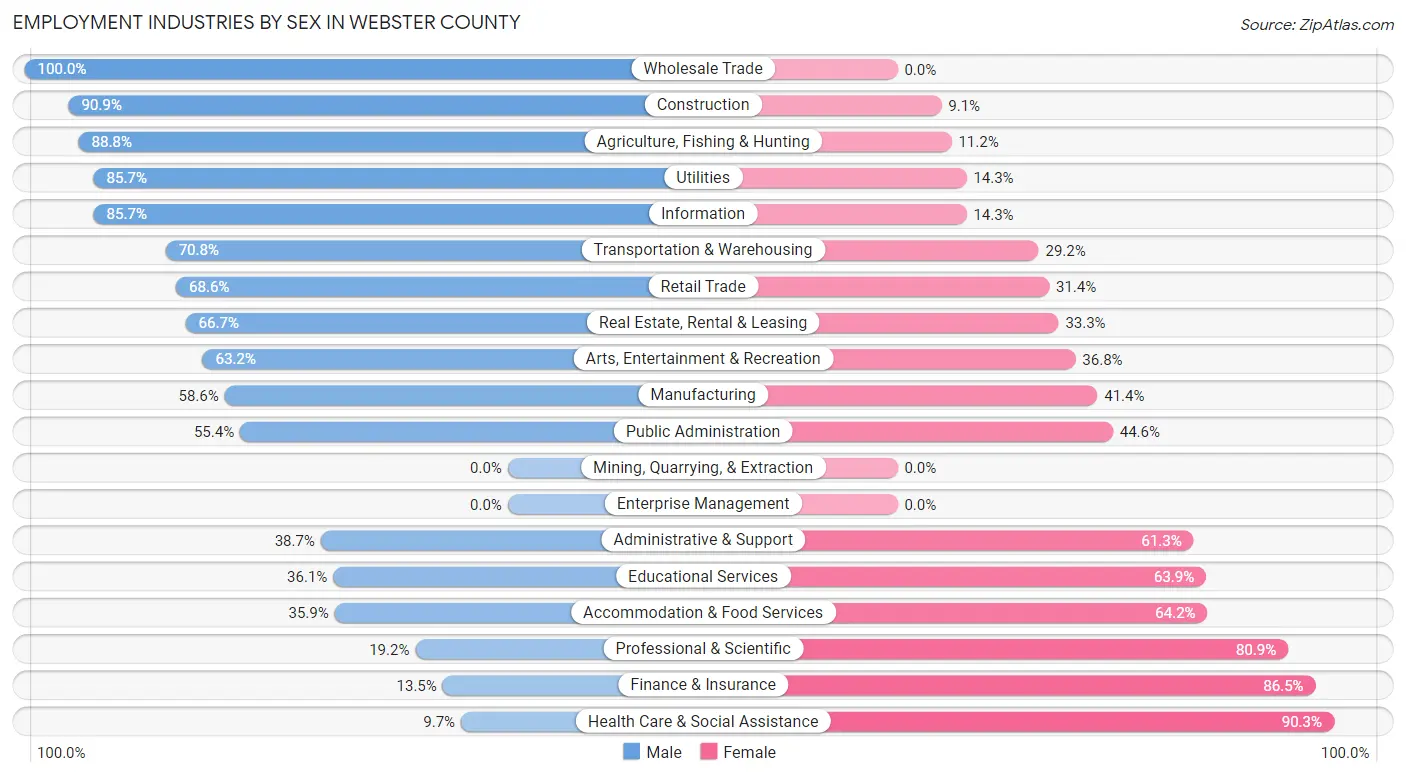
Employment Industries by Sex in Webster County
The Webster County industries that see more men than women are Wholesale Trade (100.0%), Construction (90.9%), and Agriculture, Fishing & Hunting (88.8%), whereas the industries that tend to have a higher number of women are Health Care & Social Assistance (90.3%), Finance & Insurance (86.5%), and Professional & Scientific (80.8%).
| Industry | Male | Female |
| Agriculture, Fishing & Hunting | 262 (88.8%) | 33 (11.2%) |
| Mining, Quarrying, & Extraction | 0 (0.0%) | 0 (0.0%) |
| Construction | 110 (90.9%) | 11 (9.1%) |
| Manufacturing | 85 (58.6%) | 60 (41.4%) |
| Wholesale Trade | 54 (100.0%) | 0 (0.0%) |
| Retail Trade | 129 (68.6%) | 59 (31.4%) |
| Transportation & Warehousing | 63 (70.8%) | 26 (29.2%) |
| Utilities | 18 (85.7%) | 3 (14.3%) |
| Information | 30 (85.7%) | 5 (14.3%) |
| Finance & Insurance | 12 (13.5%) | 77 (86.5%) |
| Real Estate, Rental & Leasing | 12 (66.7%) | 6 (33.3%) |
| Professional & Scientific | 9 (19.2%) | 38 (80.8%) |
| Enterprise Management | 0 (0.0%) | 0 (0.0%) |
| Administrative & Support | 12 (38.7%) | 19 (61.3%) |
| Educational Services | 56 (36.1%) | 99 (63.9%) |
| Health Care & Social Assistance | 25 (9.7%) | 233 (90.3%) |
| Arts, Entertainment & Recreation | 12 (63.2%) | 7 (36.8%) |
| Accommodation & Food Services | 19 (35.8%) | 34 (64.1%) |
| Public Administration | 46 (55.4%) | 37 (44.6%) |
| Total | 992 (56.1%) | 775 (43.9%) |
Education in Webster County
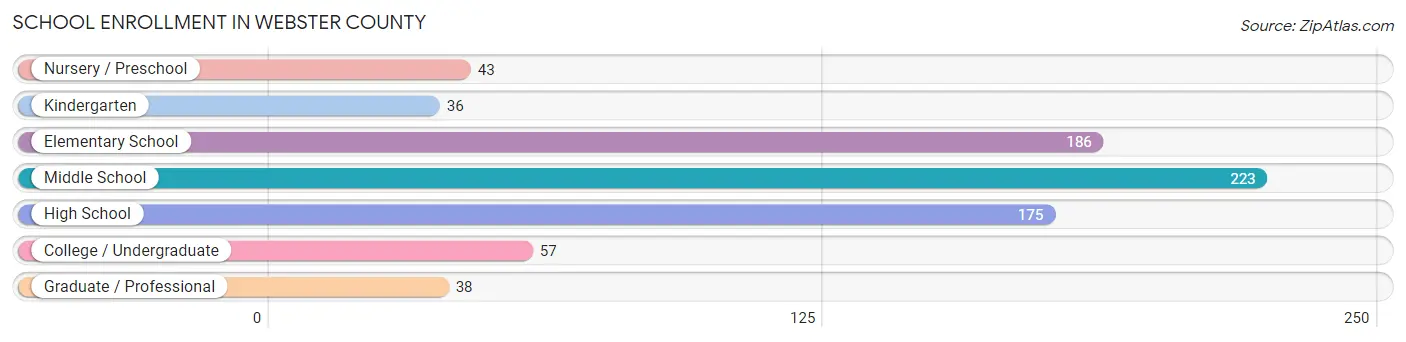
School Enrollment in Webster County
The most common levels of schooling among the 758 students in Webster County are middle school (223 | 29.4%), elementary school (186 | 24.5%), and high school (175 | 23.1%).
| School Level | # Students | % Students |
| Nursery / Preschool | 43 | 5.7% |
| Kindergarten | 36 | 4.8% |
| Elementary School | 186 | 24.5% |
| Middle School | 223 | 29.4% |
| High School | 175 | 23.1% |
| College / Undergraduate | 57 | 7.5% |
| Graduate / Professional | 38 | 5.0% |
| Total | 758 | 100.0% |
School Enrollment by Age by Funding Source in Webster County
Out of a total of 758 students who are enrolled in schools in Webster County, 120 (15.8%) attend a private institution, while the remaining 638 (84.2%) are enrolled in public schools. The age group of 18 to 19 year olds has the highest likelihood of being enrolled in private schools, with 15 (30.6% in the age bracket) enrolled. Conversely, the age group of 25 to 34 year olds has the lowest likelihood of being enrolled in a private school, with 7 (100.0% in the age bracket) attending a public institution.
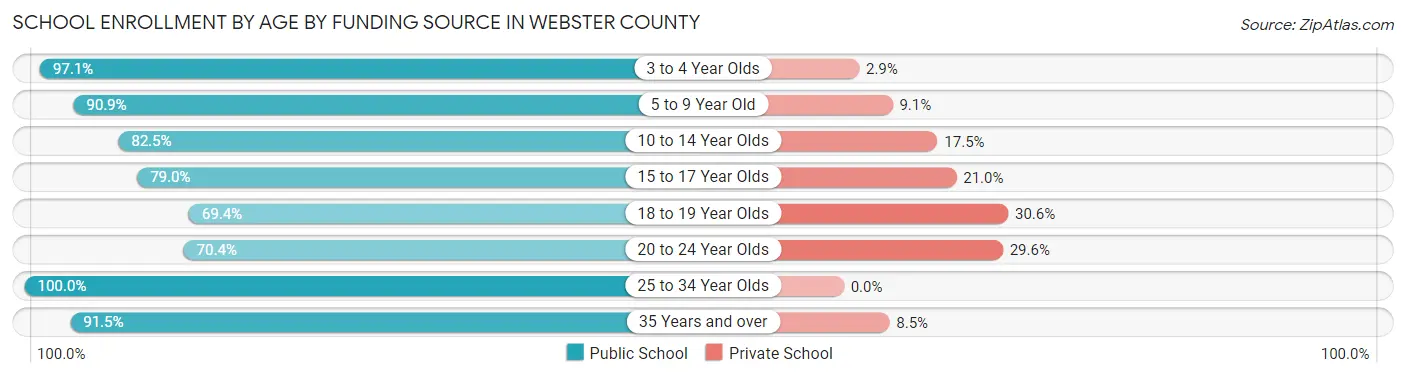
| Age Bracket | Public School | Private School |
| 3 to 4 Year Olds | 34 (97.1%) | 1 (2.9%) |
| 5 to 9 Year Old | 180 (90.9%) | 18 (9.1%) |
| 10 to 14 Year Olds | 208 (82.5%) | 44 (17.5%) |
| 15 to 17 Year Olds | 113 (79.0%) | 30 (21.0%) |
| 18 to 19 Year Olds | 34 (69.4%) | 15 (30.6%) |
| 20 to 24 Year Olds | 19 (70.4%) | 8 (29.6%) |
| 25 to 34 Year Olds | 7 (100.0%) | 0 (0.0%) |
| 35 Years and over | 43 (91.5%) | 4 (8.5%) |
| Total | 638 (84.2%) | 120 (15.8%) |
Educational Attainment by Field of Study in Webster County
Education (169 | 30.8%), business (124 | 22.6%), bio, nature & agricultural (81 | 14.8%), science & technology (55 | 10.0%), and psychology (27 | 4.9%) are the most common fields of study among 548 individuals in Webster County who have obtained a bachelor's degree or higher.
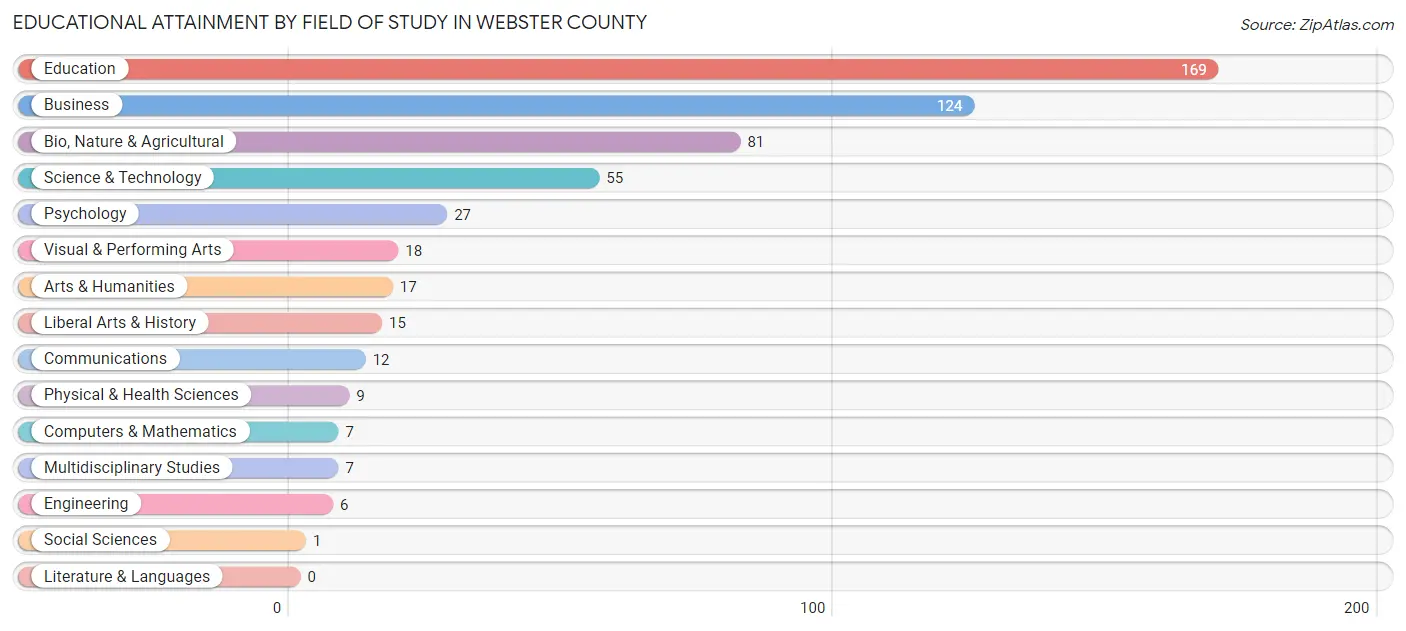
| Field of Study | # Graduates | % Graduates |
| Computers & Mathematics | 7 | 1.3% |
| Bio, Nature & Agricultural | 81 | 14.8% |
| Physical & Health Sciences | 9 | 1.6% |
| Psychology | 27 | 4.9% |
| Social Sciences | 1 | 0.2% |
| Engineering | 6 | 1.1% |
| Multidisciplinary Studies | 7 | 1.3% |
| Science & Technology | 55 | 10.0% |
| Business | 124 | 22.6% |
| Education | 169 | 30.8% |
| Literature & Languages | 0 | 0.0% |
| Liberal Arts & History | 15 | 2.7% |
| Visual & Performing Arts | 18 | 3.3% |
| Communications | 12 | 2.2% |
| Arts & Humanities | 17 | 3.1% |
| Total | 548 | 100.0% |
Transportation & Commute in Webster County
Vehicle Availability by Sex in Webster County
The most prevalent vehicle ownership categories in Webster County are males with 3 vehicles (301, accounting for 30.9%) and females with 3 vehicles (221, making up 39.0%).
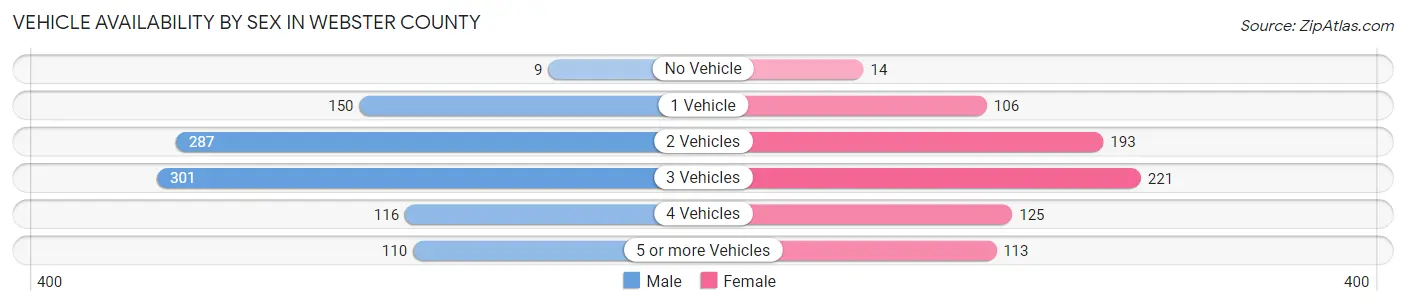
| Vehicles Available | Male | Female |
| No Vehicle | 9 (0.9%) | 14 (1.8%) |
| 1 Vehicle | 150 (15.4%) | 106 (13.7%) |
| 2 Vehicles | 287 (29.5%) | 193 (25.0%) |
| 3 Vehicles | 301 (30.9%) | 221 (28.6%) |
| 4 Vehicles | 116 (11.9%) | 125 (16.2%) |
| 5 or more Vehicles | 110 (11.3%) | 113 (14.6%) |
| Total | 973 (100.0%) | 772 (100.0%) |
Commute Time in Webster County
The most frequently occuring commute durations in Webster County are 5 to 9 minutes (315 commuters, 19.2%), less than 5 minutes (272 commuters, 16.6%), and 30 to 34 minutes (225 commuters, 13.7%).
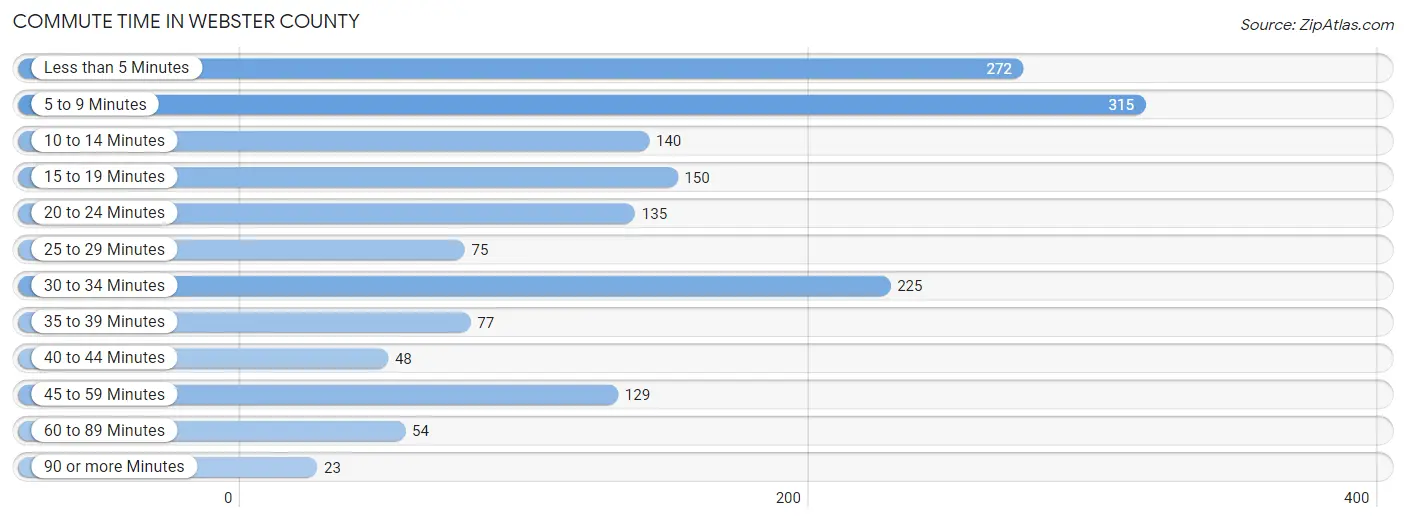
| Commute Time | # Commuters | % Commuters |
| Less than 5 Minutes | 272 | 16.6% |
| 5 to 9 Minutes | 315 | 19.2% |
| 10 to 14 Minutes | 140 | 8.5% |
| 15 to 19 Minutes | 150 | 9.1% |
| 20 to 24 Minutes | 135 | 8.2% |
| 25 to 29 Minutes | 75 | 4.6% |
| 30 to 34 Minutes | 225 | 13.7% |
| 35 to 39 Minutes | 77 | 4.7% |
| 40 to 44 Minutes | 48 | 2.9% |
| 45 to 59 Minutes | 129 | 7.9% |
| 60 to 89 Minutes | 54 | 3.3% |
| 90 or more Minutes | 23 | 1.4% |
Commute Time by Sex in Webster County
The most common commute times in Webster County are less than 5 minutes (161 commuters, 17.8%) for males and 5 to 9 minutes (162 commuters, 22.0%) for females.
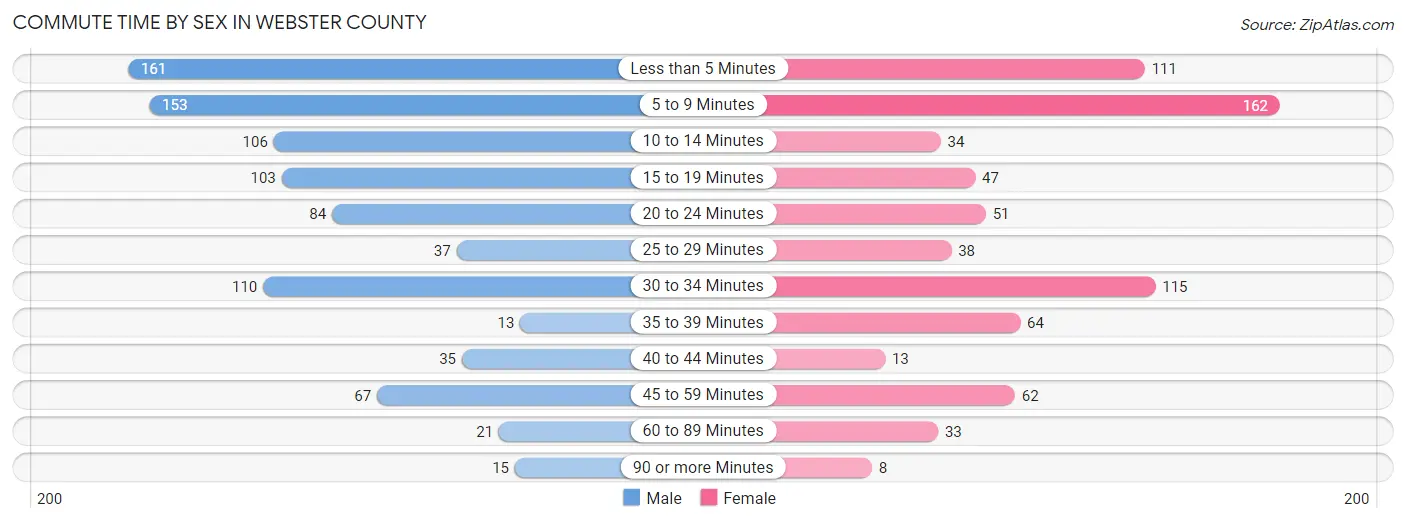
| Commute Time | Male | Female |
| Less than 5 Minutes | 161 (17.8%) | 111 (15.0%) |
| 5 to 9 Minutes | 153 (16.9%) | 162 (22.0%) |
| 10 to 14 Minutes | 106 (11.7%) | 34 (4.6%) |
| 15 to 19 Minutes | 103 (11.4%) | 47 (6.4%) |
| 20 to 24 Minutes | 84 (9.3%) | 51 (6.9%) |
| 25 to 29 Minutes | 37 (4.1%) | 38 (5.1%) |
| 30 to 34 Minutes | 110 (12.1%) | 115 (15.6%) |
| 35 to 39 Minutes | 13 (1.4%) | 64 (8.7%) |
| 40 to 44 Minutes | 35 (3.9%) | 13 (1.8%) |
| 45 to 59 Minutes | 67 (7.4%) | 62 (8.4%) |
| 60 to 89 Minutes | 21 (2.3%) | 33 (4.5%) |
| 90 or more Minutes | 15 (1.7%) | 8 (1.1%) |
Time of Departure to Work by Sex in Webster County
The most frequent times of departure to work in Webster County are 7:30 AM to 7:59 AM (183, 20.2%) for males and 7:30 AM to 7:59 AM (169, 22.9%) for females.
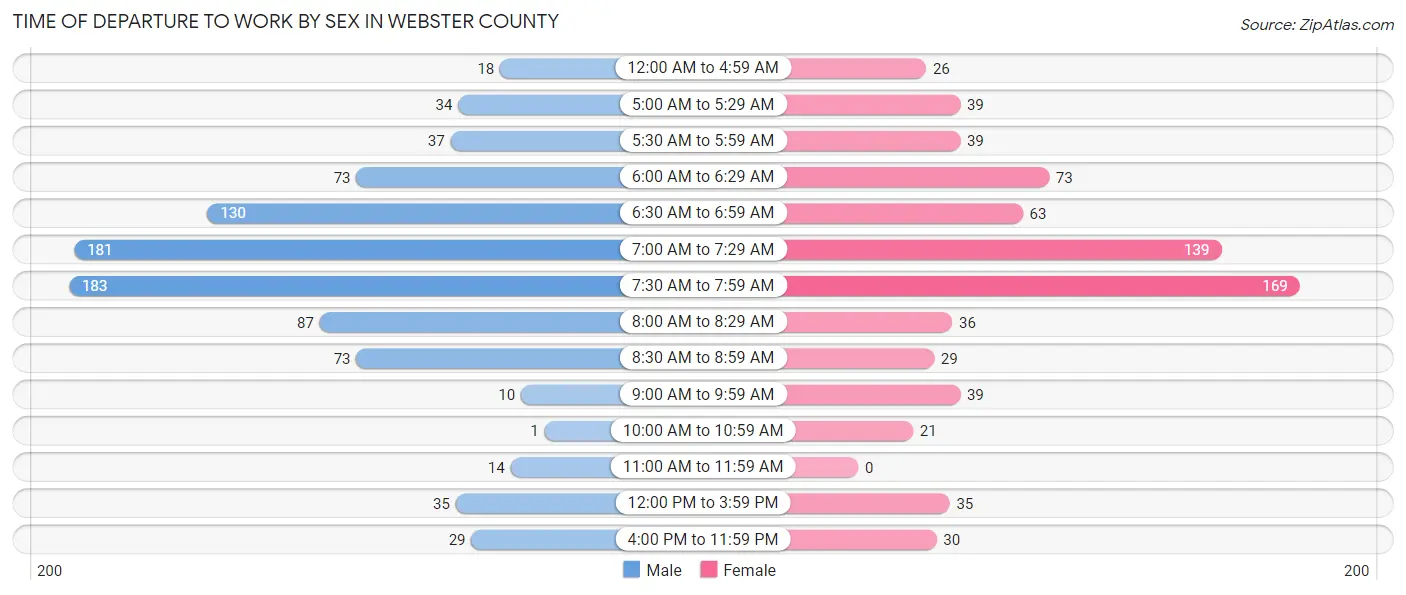
| Time of Departure | Male | Female |
| 12:00 AM to 4:59 AM | 18 (2.0%) | 26 (3.5%) |
| 5:00 AM to 5:29 AM | 34 (3.8%) | 39 (5.3%) |
| 5:30 AM to 5:59 AM | 37 (4.1%) | 39 (5.3%) |
| 6:00 AM to 6:29 AM | 73 (8.1%) | 73 (9.9%) |
| 6:30 AM to 6:59 AM | 130 (14.4%) | 63 (8.5%) |
| 7:00 AM to 7:29 AM | 181 (20.0%) | 139 (18.8%) |
| 7:30 AM to 7:59 AM | 183 (20.2%) | 169 (22.9%) |
| 8:00 AM to 8:29 AM | 87 (9.6%) | 36 (4.9%) |
| 8:30 AM to 8:59 AM | 73 (8.1%) | 29 (3.9%) |
| 9:00 AM to 9:59 AM | 10 (1.1%) | 39 (5.3%) |
| 10:00 AM to 10:59 AM | 1 (0.1%) | 21 (2.9%) |
| 11:00 AM to 11:59 AM | 14 (1.5%) | 0 (0.0%) |
| 12:00 PM to 3:59 PM | 35 (3.9%) | 35 (4.7%) |
| 4:00 PM to 11:59 PM | 29 (3.2%) | 30 (4.1%) |
| Total | 905 (100.0%) | 738 (100.0%) |
Housing Occupancy in Webster County
Occupancy by Ownership in Webster County
Of the total 1,480 dwellings in Webster County, owner-occupied units account for 1,210 (81.8%), while renter-occupied units make up 270 (18.2%).
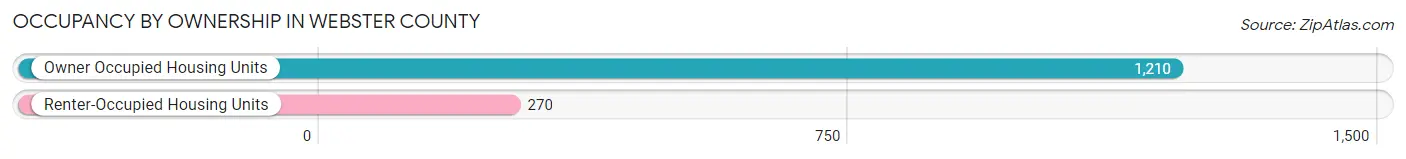
| Occupancy | # Housing Units | % Housing Units |
| Owner Occupied Housing Units | 1,210 | 81.8% |
| Renter-Occupied Housing Units | 270 | 18.2% |
| Total Occupied Housing Units | 1,480 | 100.0% |
Occupancy by Household Size in Webster County
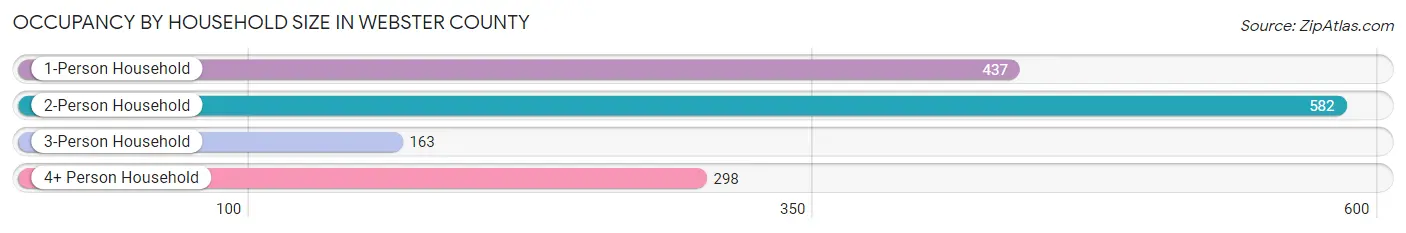
| Household Size | # Housing Units | % Housing Units |
| 1-Person Household | 437 | 29.5% |
| 2-Person Household | 582 | 39.3% |
| 3-Person Household | 163 | 11.0% |
| 4+ Person Household | 298 | 20.1% |
| Total Housing Units | 1,480 | 100.0% |
Occupancy by Ownership by Household Size in Webster County
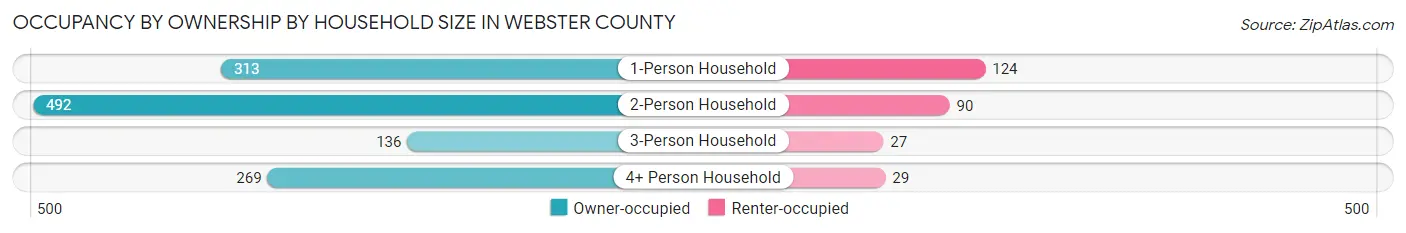
| Household Size | Owner-occupied | Renter-occupied |
| 1-Person Household | 313 (71.6%) | 124 (28.4%) |
| 2-Person Household | 492 (84.5%) | 90 (15.5%) |
| 3-Person Household | 136 (83.4%) | 27 (16.6%) |
| 4+ Person Household | 269 (90.3%) | 29 (9.7%) |
| Total Housing Units | 1,210 (81.8%) | 270 (18.2%) |
Occupancy by Educational Attainment in Webster County
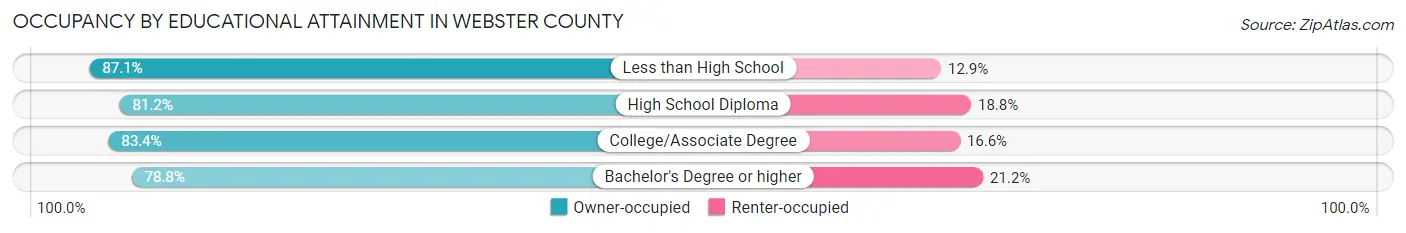
| Household Size | Owner-occupied | Renter-occupied |
| Less than High School | 61 (87.1%) | 9 (12.9%) |
| High School Diploma | 371 (81.2%) | 86 (18.8%) |
| College/Associate Degree | 492 (83.4%) | 98 (16.6%) |
| Bachelor's Degree or higher | 286 (78.8%) | 77 (21.2%) |
Occupancy by Age of Householder in Webster County
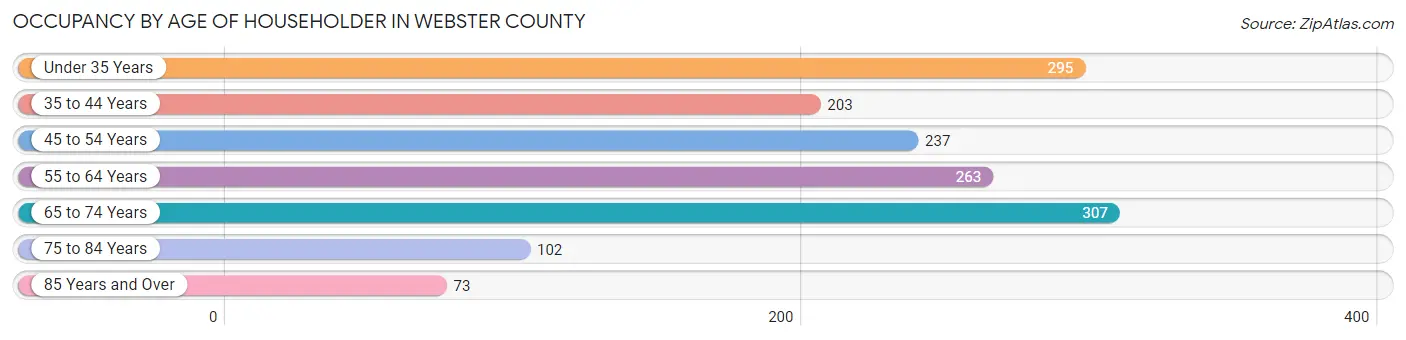
| Age Bracket | # Households | % Households |
| Under 35 Years | 295 | 19.9% |
| 35 to 44 Years | 203 | 13.7% |
| 45 to 54 Years | 237 | 16.0% |
| 55 to 64 Years | 263 | 17.8% |
| 65 to 74 Years | 307 | 20.7% |
| 75 to 84 Years | 102 | 6.9% |
| 85 Years and Over | 73 | 4.9% |
| Total | 1,480 | 100.0% |
Housing Finances in Webster County
Median Income by Occupancy in Webster County
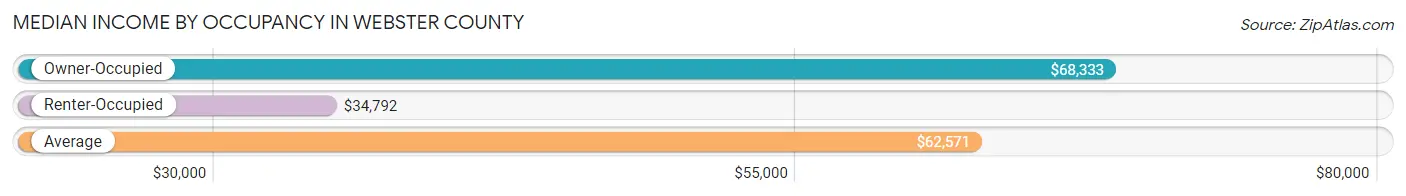
| Occupancy Type | # Households | Median Income |
| Owner-Occupied | 1,210 (81.8%) | $68,333 |
| Renter-Occupied | 270 (18.2%) | $34,792 |
| Average | 1,480 (100.0%) | $62,571 |
Occupancy by Householder Income Bracket in Webster County
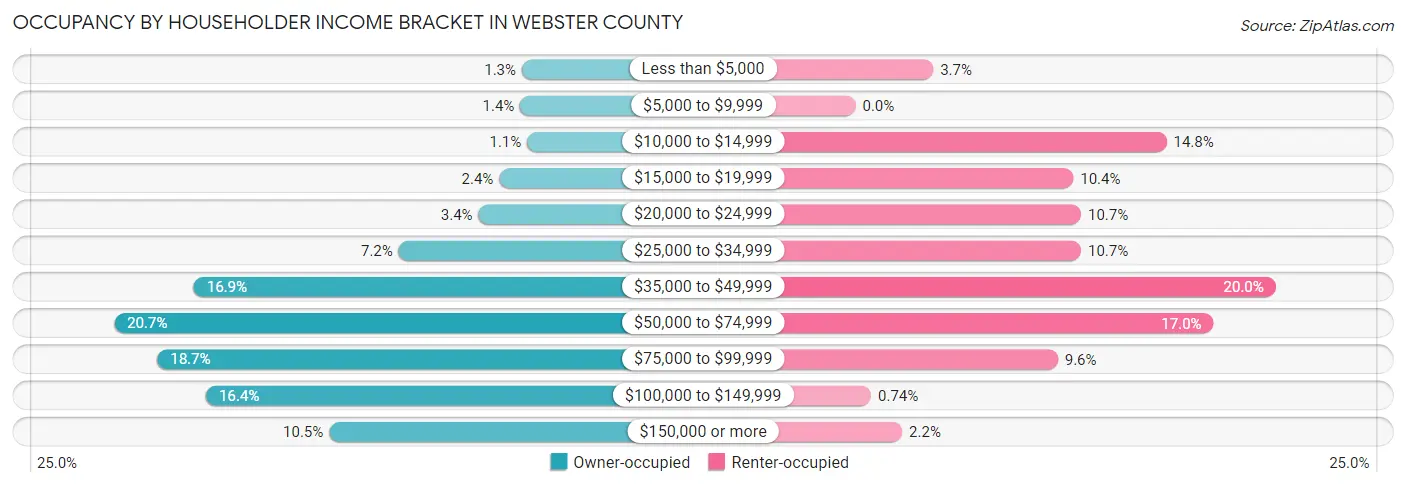
| Income Bracket | Owner-occupied | Renter-occupied |
| Less than $5,000 | 16 (1.3%) | 10 (3.7%) |
| $5,000 to $9,999 | 17 (1.4%) | 0 (0.0%) |
| $10,000 to $14,999 | 13 (1.1%) | 40 (14.8%) |
| $15,000 to $19,999 | 29 (2.4%) | 28 (10.4%) |
| $20,000 to $24,999 | 41 (3.4%) | 29 (10.7%) |
| $25,000 to $34,999 | 87 (7.2%) | 29 (10.7%) |
| $35,000 to $49,999 | 205 (16.9%) | 54 (20.0%) |
| $50,000 to $74,999 | 251 (20.7%) | 46 (17.0%) |
| $75,000 to $99,999 | 226 (18.7%) | 26 (9.6%) |
| $100,000 to $149,999 | 198 (16.4%) | 2 (0.7%) |
| $150,000 or more | 127 (10.5%) | 6 (2.2%) |
| Total | 1,210 (100.0%) | 270 (100.0%) |
Monthly Housing Cost Tiers in Webster County
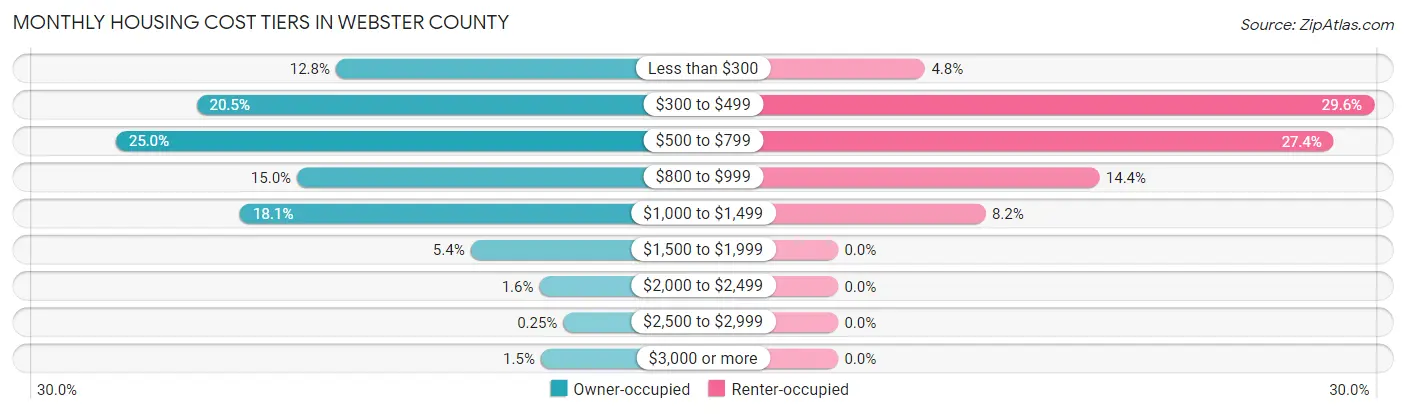
| Monthly Cost | Owner-occupied | Renter-occupied |
| Less than $300 | 155 (12.8%) | 13 (4.8%) |
| $300 to $499 | 248 (20.5%) | 80 (29.6%) |
| $500 to $799 | 302 (25.0%) | 74 (27.4%) |
| $800 to $999 | 181 (15.0%) | 39 (14.4%) |
| $1,000 to $1,499 | 219 (18.1%) | 22 (8.2%) |
| $1,500 to $1,999 | 65 (5.4%) | 0 (0.0%) |
| $2,000 to $2,499 | 19 (1.6%) | 0 (0.0%) |
| $2,500 to $2,999 | 3 (0.3%) | 0 (0.0%) |
| $3,000 or more | 18 (1.5%) | 0 (0.0%) |
| Total | 1,210 (100.0%) | 270 (100.0%) |
Physical Housing Characteristics in Webster County
Housing Structures in Webster County
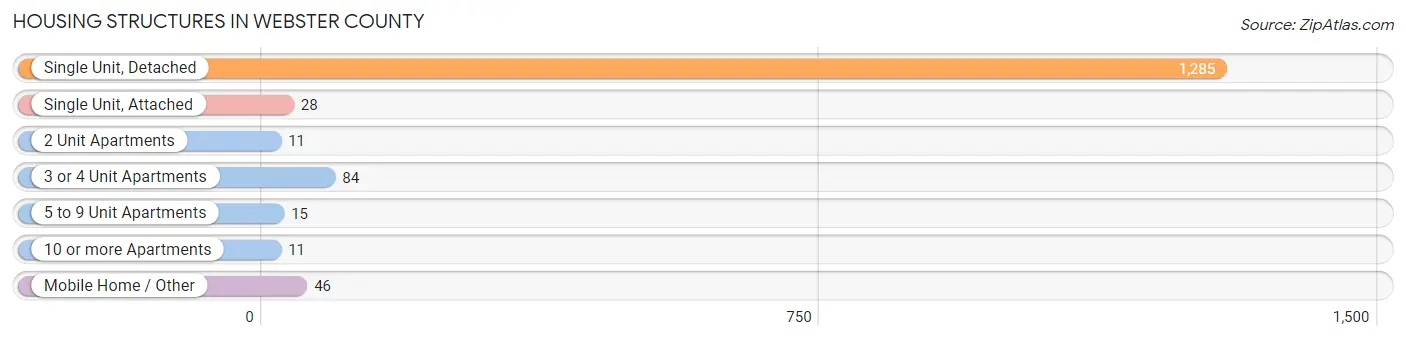
| Structure Type | # Housing Units | % Housing Units |
| Single Unit, Detached | 1,285 | 86.8% |
| Single Unit, Attached | 28 | 1.9% |
| 2 Unit Apartments | 11 | 0.7% |
| 3 or 4 Unit Apartments | 84 | 5.7% |
| 5 to 9 Unit Apartments | 15 | 1.0% |
| 10 or more Apartments | 11 | 0.7% |
| Mobile Home / Other | 46 | 3.1% |
| Total | 1,480 | 100.0% |
Housing Structures by Occupancy in Webster County
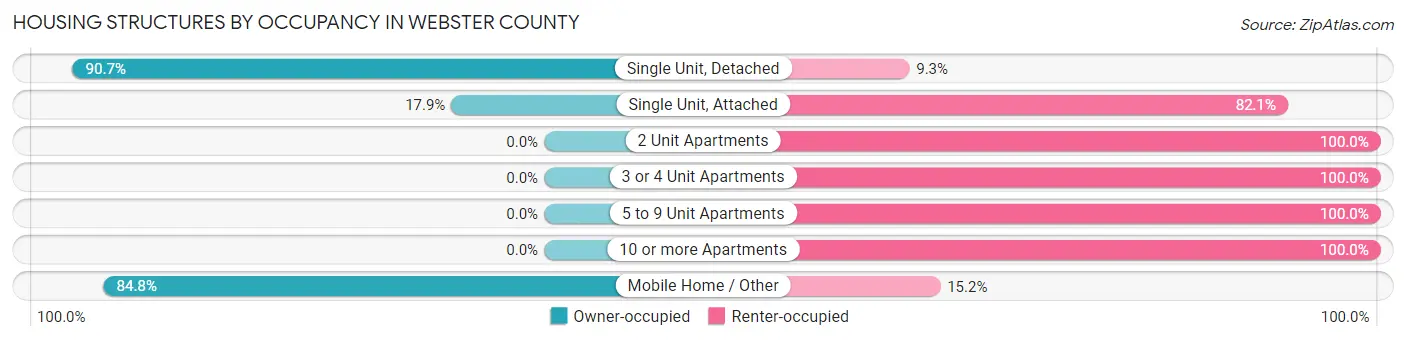
| Structure Type | Owner-occupied | Renter-occupied |
| Single Unit, Detached | 1,166 (90.7%) | 119 (9.3%) |
| Single Unit, Attached | 5 (17.9%) | 23 (82.1%) |
| 2 Unit Apartments | 0 (0.0%) | 11 (100.0%) |
| 3 or 4 Unit Apartments | 0 (0.0%) | 84 (100.0%) |
| 5 to 9 Unit Apartments | 0 (0.0%) | 15 (100.0%) |
| 10 or more Apartments | 0 (0.0%) | 11 (100.0%) |
| Mobile Home / Other | 39 (84.8%) | 7 (15.2%) |
| Total | 1,210 (81.8%) | 270 (18.2%) |
Housing Structures by Number of Rooms in Webster County
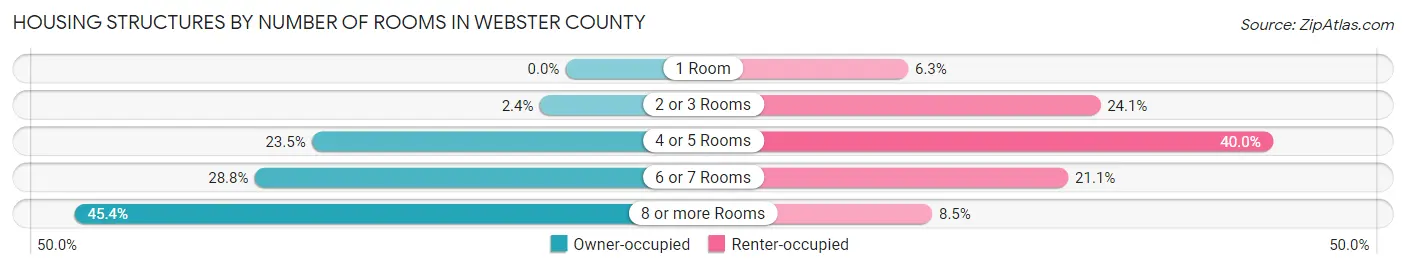
| Number of Rooms | Owner-occupied | Renter-occupied |
| 1 Room | 0 (0.0%) | 17 (6.3%) |
| 2 or 3 Rooms | 29 (2.4%) | 65 (24.1%) |
| 4 or 5 Rooms | 284 (23.5%) | 108 (40.0%) |
| 6 or 7 Rooms | 348 (28.8%) | 57 (21.1%) |
| 8 or more Rooms | 549 (45.4%) | 23 (8.5%) |
| Total | 1,210 (100.0%) | 270 (100.0%) |
Housing Structure by Heating Type in Webster County
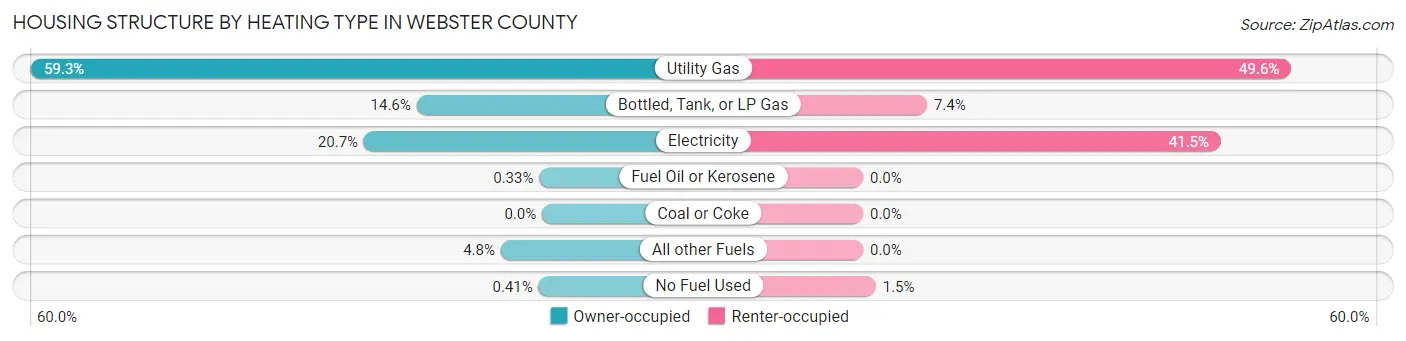
| Heating Type | Owner-occupied | Renter-occupied |
| Utility Gas | 717 (59.3%) | 134 (49.6%) |
| Bottled, Tank, or LP Gas | 176 (14.5%) | 20 (7.4%) |
| Electricity | 250 (20.7%) | 112 (41.5%) |
| Fuel Oil or Kerosene | 4 (0.3%) | 0 (0.0%) |
| Coal or Coke | 0 (0.0%) | 0 (0.0%) |
| All other Fuels | 58 (4.8%) | 0 (0.0%) |
| No Fuel Used | 5 (0.4%) | 4 (1.5%) |
| Total | 1,210 (100.0%) | 270 (100.0%) |
Household Vehicle Usage in Webster County
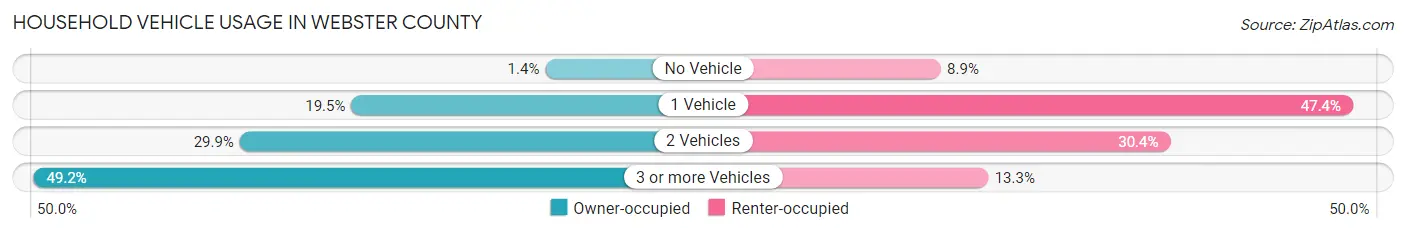
| Vehicles per Household | Owner-occupied | Renter-occupied |
| No Vehicle | 17 (1.4%) | 24 (8.9%) |
| 1 Vehicle | 236 (19.5%) | 128 (47.4%) |
| 2 Vehicles | 362 (29.9%) | 82 (30.4%) |
| 3 or more Vehicles | 595 (49.2%) | 36 (13.3%) |
| Total | 1,210 (100.0%) | 270 (100.0%) |
Real Estate & Mortgages in Webster County
Real Estate and Mortgage Overview in Webster County
| Characteristic | Without Mortgage | With Mortgage |
| Housing Units | 726 | 484 |
| Median Property Value | $74,700 | $121,400 |
| Median Household Income | $58,333 | $80 |
| Monthly Housing Costs | $476 | $18 |
| Real Estate Taxes | $977 | $8 |
Property Value by Mortgage Status in Webster County
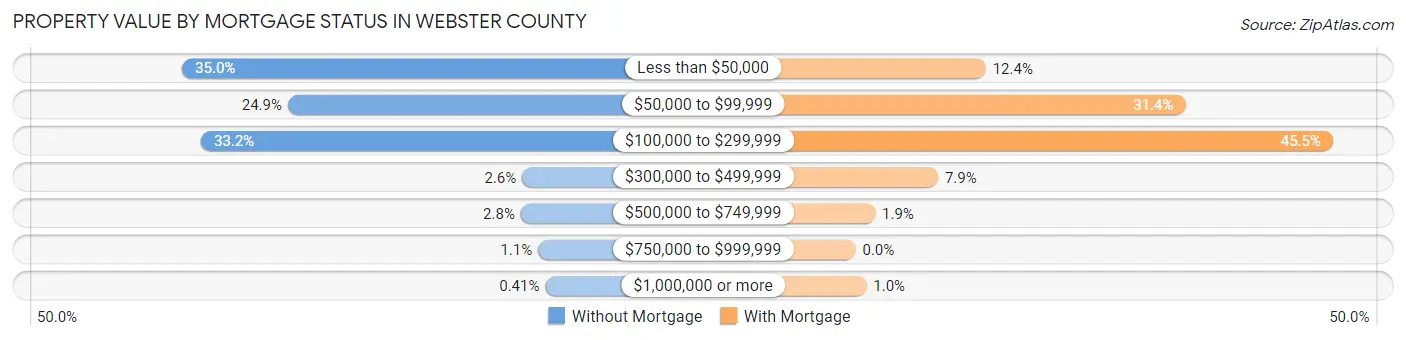
| Property Value | Without Mortgage | With Mortgage |
| Less than $50,000 | 254 (35.0%) | 60 (12.4%) |
| $50,000 to $99,999 | 181 (24.9%) | 152 (31.4%) |
| $100,000 to $299,999 | 241 (33.2%) | 220 (45.5%) |
| $300,000 to $499,999 | 19 (2.6%) | 38 (7.9%) |
| $500,000 to $749,999 | 20 (2.8%) | 9 (1.9%) |
| $750,000 to $999,999 | 8 (1.1%) | 0 (0.0%) |
| $1,000,000 or more | 3 (0.4%) | 5 (1.0%) |
| Total | 726 (100.0%) | 484 (100.0%) |
Household Income by Mortgage Status in Webster County
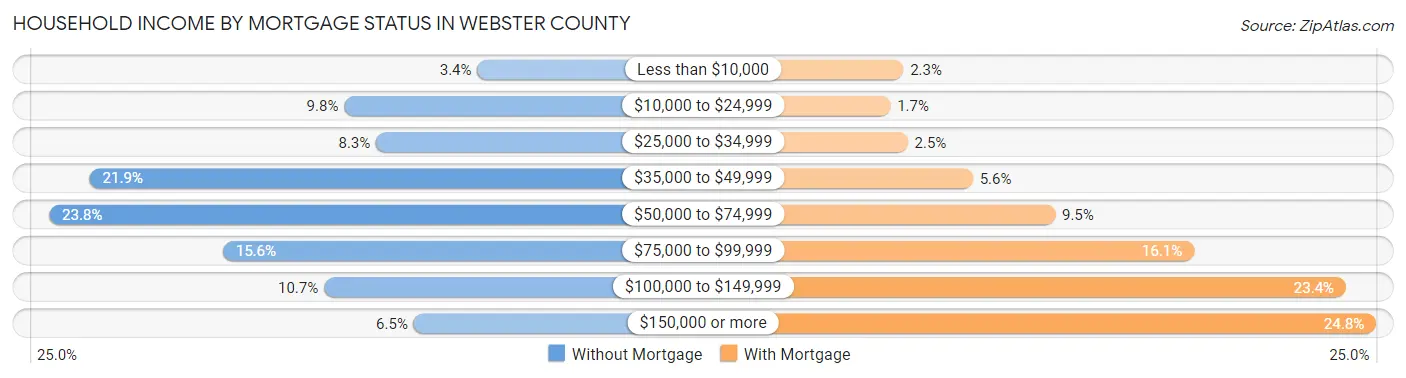
| Household Income | Without Mortgage | With Mortgage |
| Less than $10,000 | 25 (3.4%) | 11 (2.3%) |
| $10,000 to $24,999 | 71 (9.8%) | 8 (1.7%) |
| $25,000 to $34,999 | 60 (8.3%) | 12 (2.5%) |
| $35,000 to $49,999 | 159 (21.9%) | 27 (5.6%) |
| $50,000 to $74,999 | 173 (23.8%) | 46 (9.5%) |
| $75,000 to $99,999 | 113 (15.6%) | 78 (16.1%) |
| $100,000 to $149,999 | 78 (10.7%) | 113 (23.4%) |
| $150,000 or more | 47 (6.5%) | 120 (24.8%) |
| Total | 726 (100.0%) | 484 (100.0%) |
Property Value to Household Income Ratio in Webster County
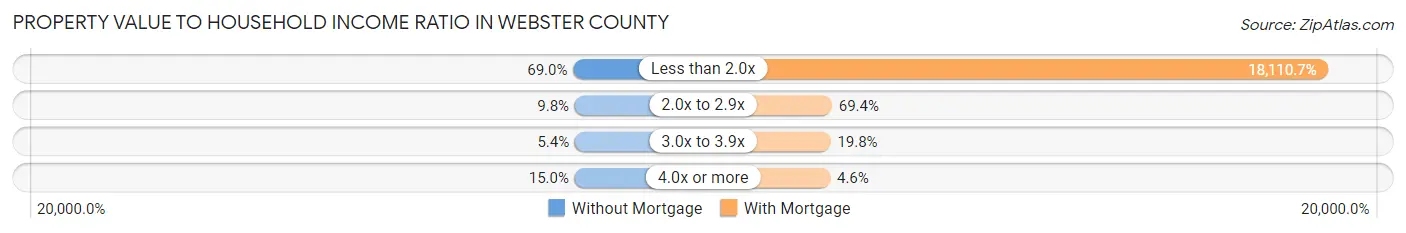
| Value-to-Income Ratio | Without Mortgage | With Mortgage |
| Less than 2.0x | 501 (69.0%) | 87,656 (18,110.7%) |
| 2.0x to 2.9x | 71 (9.8%) | 336 (69.4%) |
| 3.0x to 3.9x | 39 (5.4%) | 96 (19.8%) |
| 4.0x or more | 109 (15.0%) | 22 (4.5%) |
| Total | 726 (100.0%) | 484 (100.0%) |
Real Estate Taxes by Mortgage Status in Webster County
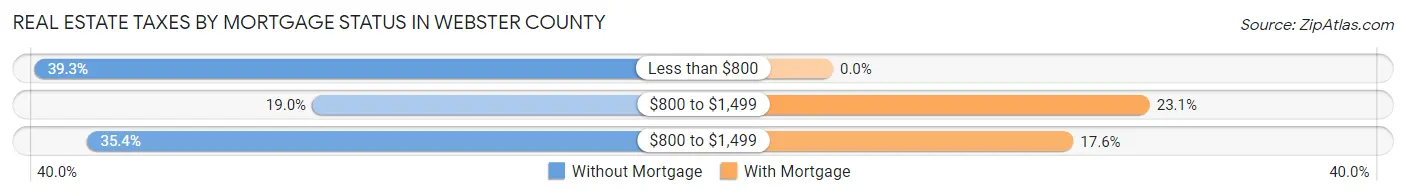
| Property Taxes | Without Mortgage | With Mortgage |
| Less than $800 | 285 (39.3%) | 0 (0.0%) |
| $800 to $1,499 | 138 (19.0%) | 112 (23.1%) |
| $800 to $1,499 | 257 (35.4%) | 85 (17.6%) |
| Total | 726 (100.0%) | 484 (100.0%) |
Health & Disability in Webster County
Health Insurance Coverage by Age in Webster County
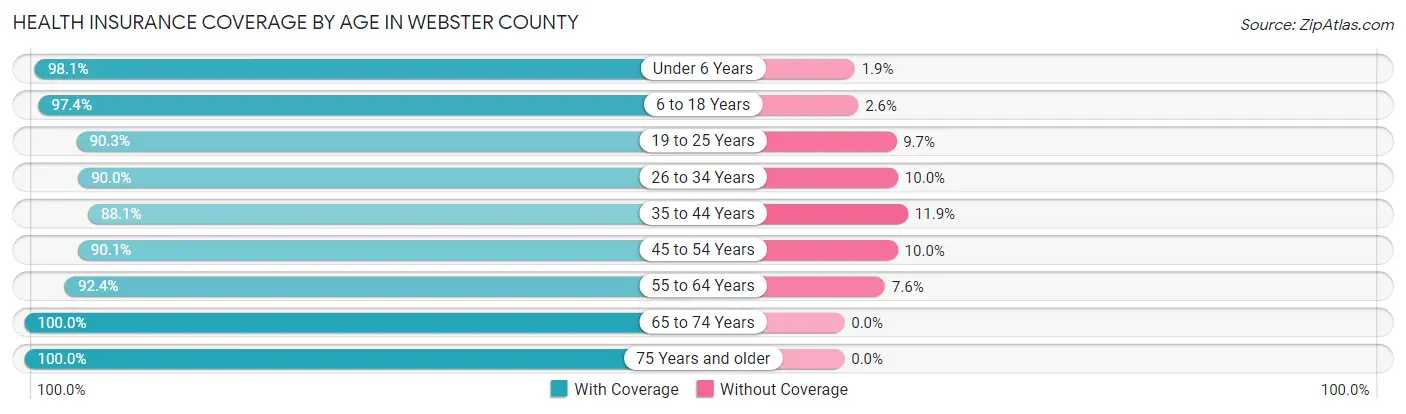
| Age Bracket | With Coverage | Without Coverage |
| Under 6 Years | 202 (98.1%) | 4 (1.9%) |
| 6 to 18 Years | 598 (97.4%) | 16 (2.6%) |
| 19 to 25 Years | 196 (90.3%) | 21 (9.7%) |
| 26 to 34 Years | 288 (90.0%) | 32 (10.0%) |
| 35 to 44 Years | 312 (88.1%) | 42 (11.9%) |
| 45 to 54 Years | 353 (90.0%) | 39 (10.0%) |
| 55 to 64 Years | 476 (92.4%) | 39 (7.6%) |
| 65 to 74 Years | 434 (100.0%) | 0 (0.0%) |
| 75 Years and older | 279 (100.0%) | 0 (0.0%) |
| Total | 3,138 (94.2%) | 193 (5.8%) |
Health Insurance Coverage by Citizenship Status in Webster County
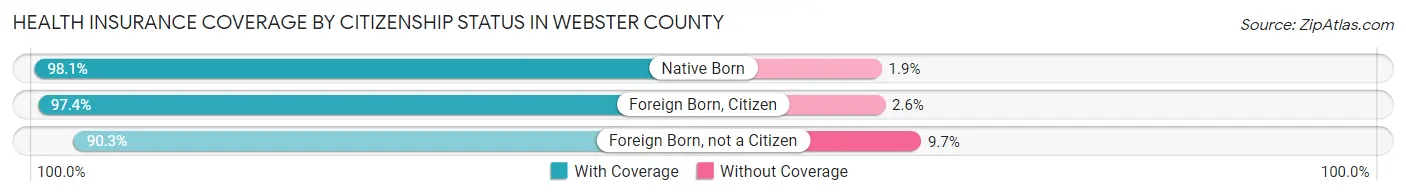
| Citizenship Status | With Coverage | Without Coverage |
| Native Born | 202 (98.1%) | 4 (1.9%) |
| Foreign Born, Citizen | 598 (97.4%) | 16 (2.6%) |
| Foreign Born, not a Citizen | 196 (90.3%) | 21 (9.7%) |
Health Insurance Coverage by Household Income in Webster County
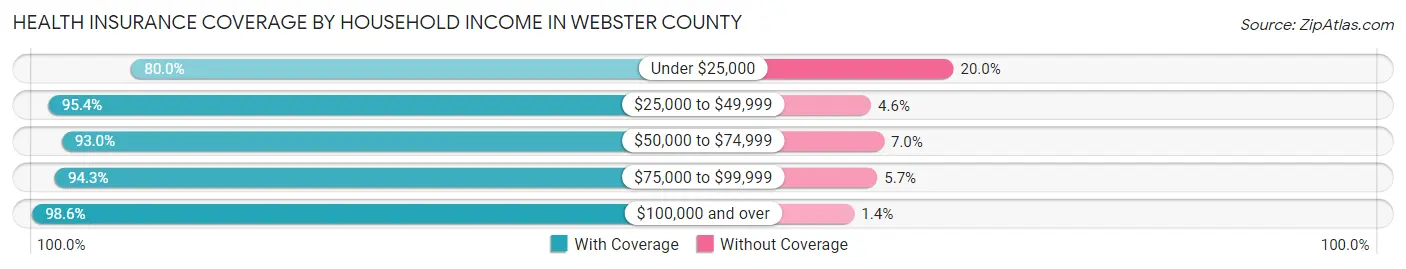
| Household Income | With Coverage | Without Coverage |
| Under $25,000 | 240 (80.0%) | 60 (20.0%) |
| $25,000 to $49,999 | 607 (95.4%) | 29 (4.6%) |
| $50,000 to $74,999 | 666 (93.0%) | 50 (7.0%) |
| $75,000 to $99,999 | 659 (94.3%) | 40 (5.7%) |
| $100,000 and over | 966 (98.6%) | 14 (1.4%) |
Public vs Private Health Insurance Coverage by Age in Webster County
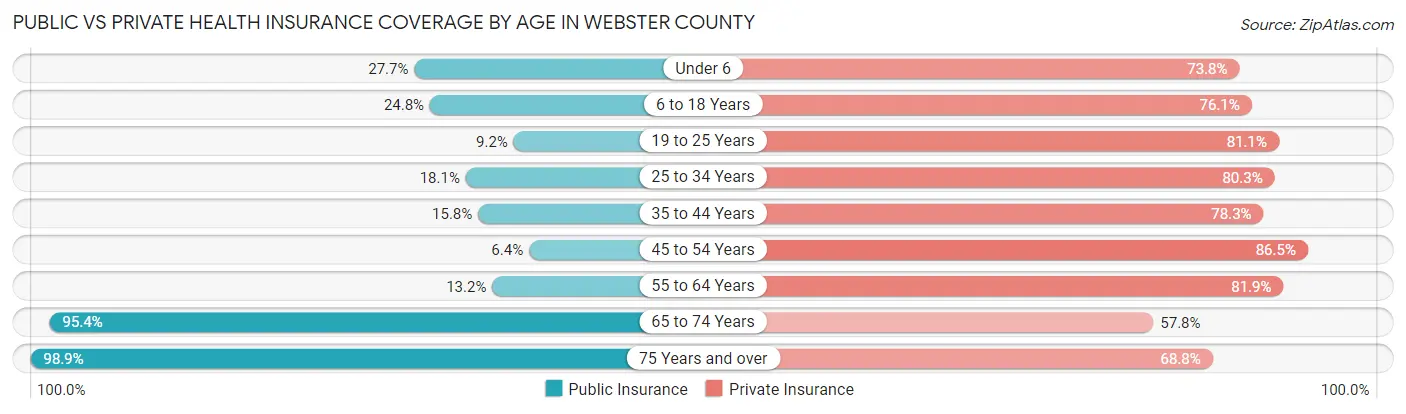
| Age Bracket | Public Insurance | Private Insurance |
| Under 6 | 57 (27.7%) | 152 (73.8%) |
| 6 to 18 Years | 152 (24.8%) | 467 (76.1%) |
| 19 to 25 Years | 20 (9.2%) | 176 (81.1%) |
| 25 to 34 Years | 58 (18.1%) | 257 (80.3%) |
| 35 to 44 Years | 56 (15.8%) | 277 (78.2%) |
| 45 to 54 Years | 25 (6.4%) | 339 (86.5%) |
| 55 to 64 Years | 68 (13.2%) | 422 (81.9%) |
| 65 to 74 Years | 414 (95.4%) | 251 (57.8%) |
| 75 Years and over | 276 (98.9%) | 192 (68.8%) |
| Total | 1,126 (33.8%) | 2,533 (76.0%) |
Disability Status by Sex by Age in Webster County
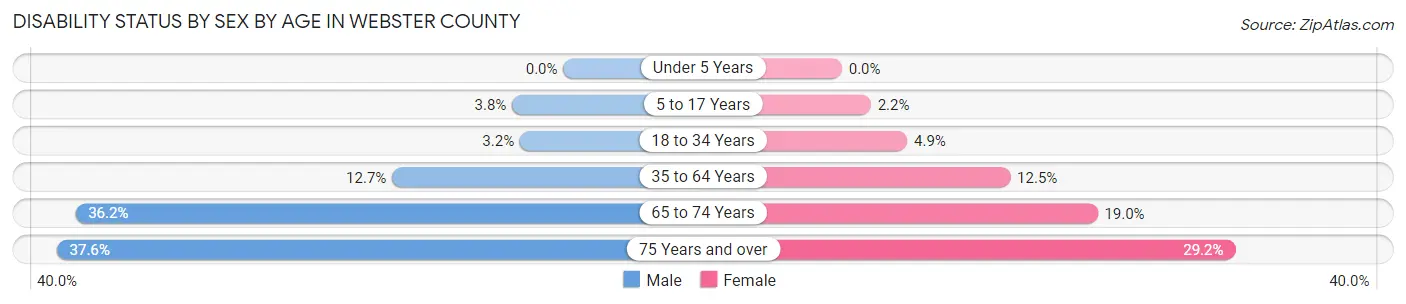
| Age Bracket | Male | Female |
| Under 5 Years | 0 (0.0%) | 0 (0.0%) |
| 5 to 17 Years | 12 (3.8%) | 6 (2.1%) |
| 18 to 34 Years | 10 (3.2%) | 13 (4.9%) |
| 35 to 64 Years | 84 (12.7%) | 75 (12.5%) |
| 65 to 74 Years | 79 (36.2%) | 41 (19.0%) |
| 75 Years and over | 38 (37.6%) | 52 (29.2%) |
Disability Class by Sex by Age in Webster County
Disability Class: Hearing Difficulty
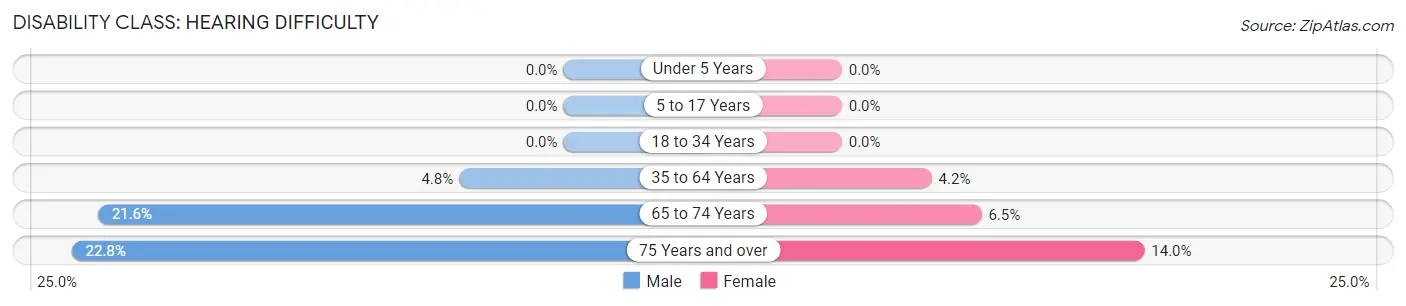
| Age Bracket | Male | Female |
| Under 5 Years | 0 (0.0%) | 0 (0.0%) |
| 5 to 17 Years | 0 (0.0%) | 0 (0.0%) |
| 18 to 34 Years | 0 (0.0%) | 0 (0.0%) |
| 35 to 64 Years | 32 (4.8%) | 25 (4.2%) |
| 65 to 74 Years | 47 (21.6%) | 14 (6.5%) |
| 75 Years and over | 23 (22.8%) | 25 (14.0%) |
Disability Class: Vision Difficulty
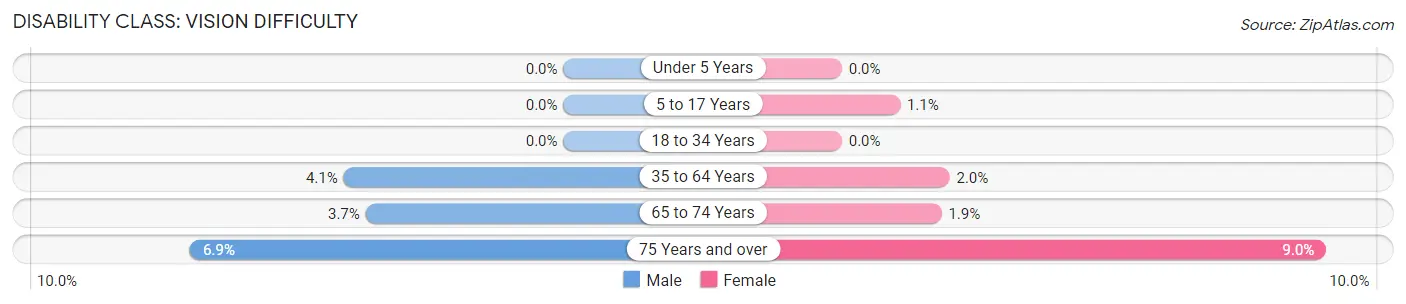
| Age Bracket | Male | Female |
| Under 5 Years | 0 (0.0%) | 0 (0.0%) |
| 5 to 17 Years | 0 (0.0%) | 3 (1.1%) |
| 18 to 34 Years | 0 (0.0%) | 0 (0.0%) |
| 35 to 64 Years | 27 (4.1%) | 12 (2.0%) |
| 65 to 74 Years | 8 (3.7%) | 4 (1.8%) |
| 75 Years and over | 7 (6.9%) | 16 (9.0%) |
Disability Class: Cognitive Difficulty
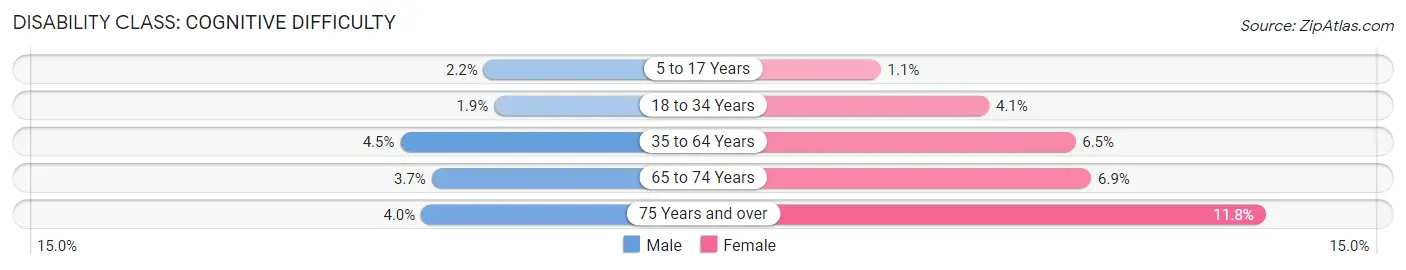
| Age Bracket | Male | Female |
| 5 to 17 Years | 7 (2.2%) | 3 (1.1%) |
| 18 to 34 Years | 6 (1.9%) | 11 (4.1%) |
| 35 to 64 Years | 30 (4.5%) | 39 (6.5%) |
| 65 to 74 Years | 8 (3.7%) | 15 (6.9%) |
| 75 Years and over | 4 (4.0%) | 21 (11.8%) |
Disability Class: Ambulatory Difficulty
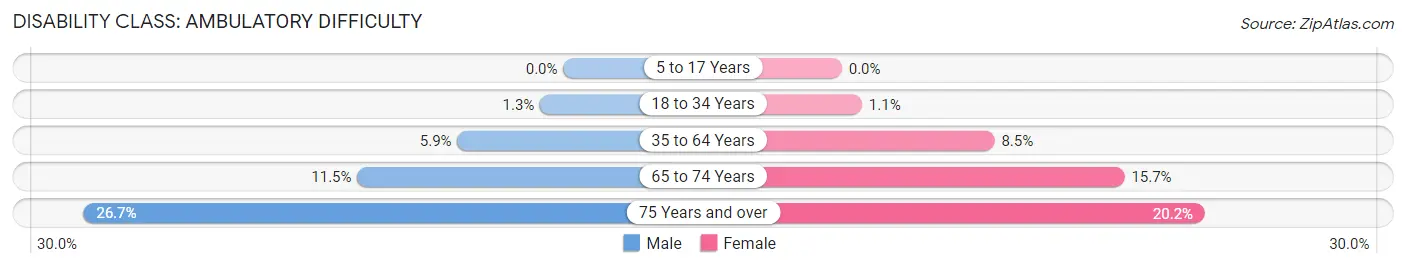
| Age Bracket | Male | Female |
| 5 to 17 Years | 0 (0.0%) | 0 (0.0%) |
| 18 to 34 Years | 4 (1.3%) | 3 (1.1%) |
| 35 to 64 Years | 39 (5.9%) | 51 (8.5%) |
| 65 to 74 Years | 25 (11.5%) | 34 (15.7%) |
| 75 Years and over | 27 (26.7%) | 36 (20.2%) |
Disability Class: Self-Care Difficulty
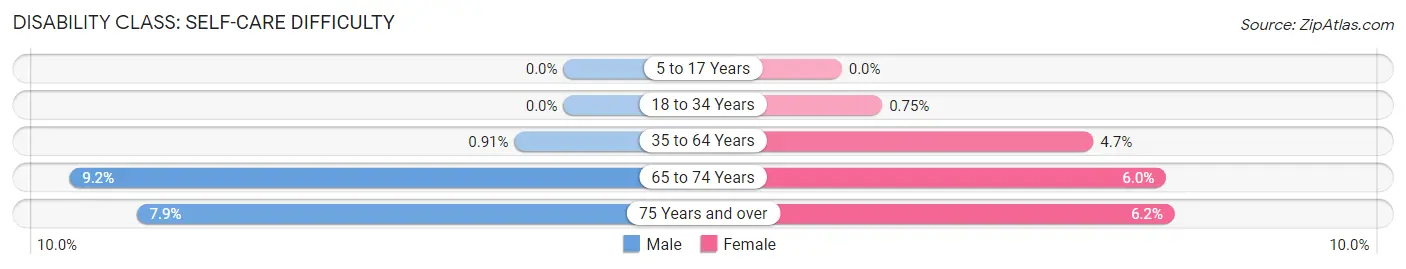
| Age Bracket | Male | Female |
| 5 to 17 Years | 0 (0.0%) | 0 (0.0%) |
| 18 to 34 Years | 0 (0.0%) | 2 (0.7%) |
| 35 to 64 Years | 6 (0.9%) | 28 (4.7%) |
| 65 to 74 Years | 20 (9.2%) | 13 (6.0%) |
| 75 Years and over | 8 (7.9%) | 11 (6.2%) |
Technology Access in Webster County
Computing Device Access in Webster County
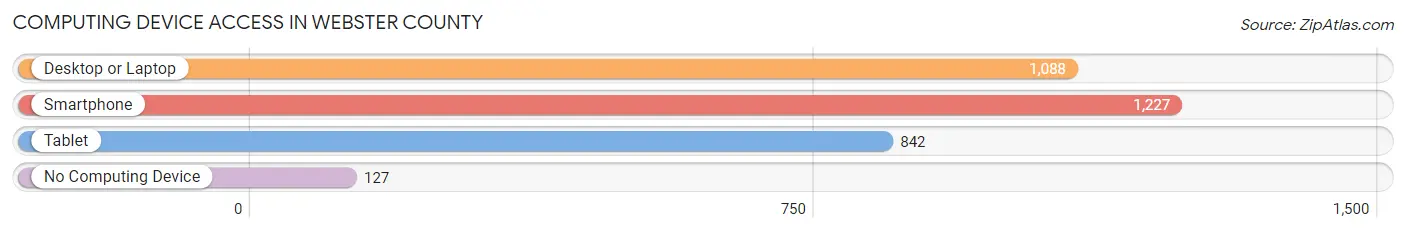
| Device Type | # Households | % Households |
| Desktop or Laptop | 1,088 | 73.5% |
| Smartphone | 1,227 | 82.9% |
| Tablet | 842 | 56.9% |
| No Computing Device | 127 | 8.6% |
| Total | 1,480 | 100.0% |
Internet Access in Webster County
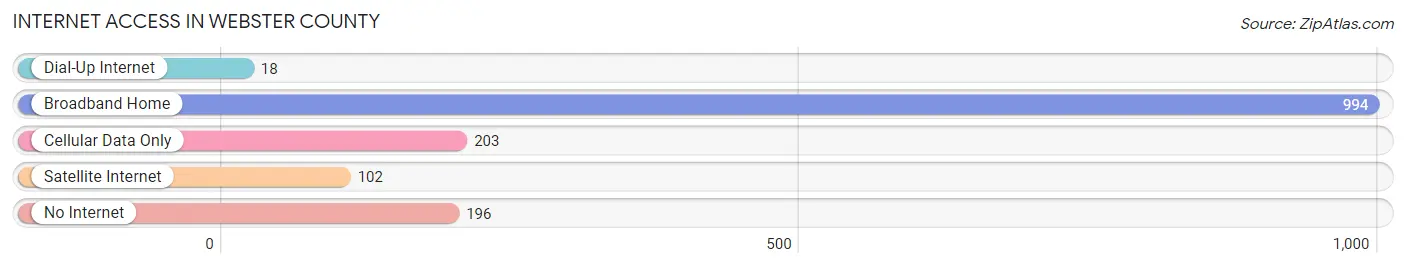
| Internet Type | # Households | % Households |
| Dial-Up Internet | 18 | 1.2% |
| Broadband Home | 994 | 67.2% |
| Cellular Data Only | 203 | 13.7% |
| Satellite Internet | 102 | 6.9% |
| No Internet | 196 | 13.2% |
| Total | 1,480 | 100.0% |
Webster County Summary
Webster County, Nebraska is located in the central part of the state and is bordered by Custer, Franklin, Nuckolls, and Thayer counties. The county seat is Red Cloud, and the county was named after Daniel Webster, a prominent American statesman. The county has a total area of 576 square miles, of which 575 square miles is land and 1 square mile is water.
As of the 2010 census, the population of Webster County was 3,769, with a population density of 6.5 people per square mile. The median age was 43.2 years, and the median household income was $45,945. The racial makeup of the county was 97.3% White, 0.3% African American, 0.3% Native American, 0.2% Asian, 0.1% Pacific Islander, 0.7% from other races, and 1.1% from two or more races. Hispanic or Latino of any race were 2.2% of the population.
The economy of Webster County is largely agricultural, with corn, soybeans, and wheat being the primary crops. Livestock production is also important, with cattle, hogs, and sheep being the main animals raised. The county also has a number of small businesses, including retail stores, restaurants, and service providers.
The county is served by two school districts, Red Cloud Community Schools and Blue Hill Community Schools. The county also has a number of private schools, including St. Mary's Catholic School and Red Cloud Christian Academy.
Webster County is home to a number of historical sites, including the Red Cloud Opera House, the Red Cloud Museum, and the Webster County Historical Society. The county is also home to a number of parks and recreational areas, including the Webster County Fairgrounds, the Webster County Wildlife Management Area, and the Webster County State Recreation Area.
Webster County is a rural county with a rich history and a strong agricultural economy. The county is home to a number of historical sites, parks, and recreational areas, and is served by two school districts. The county has a diverse population and a median household income that is slightly higher than the state average.
Common Questions
What is Per Capita Income in Webster County?
Per Capita income in Webster County is $34,652.
What is the Median Family Income in Webster County?
Median Family Income in Webster County is $74,028.
What is the Median Household income in Webster County?
Median Household Income in Webster County is $62,571.
What is Income or Wage Gap in Webster County?
Income or Wage Gap in Webster County is 34.1%.
Women in Webster County earn 65.9 cents for every dollar earned by a man.
What is Family Income Deficit in Webster County?
Family Income Deficit in Webster County is $10,313.
Families that are below poverty line in Webster County earn $10,313 less on average than the poverty threshold level.
What is Inequality or Gini Index in Webster County?
Inequality or Gini Index in Webster County is 0.44.
What is the Total Population of Webster County?
Total Population of Webster County is 3,410.
What is the Total Male Population of Webster County?
Total Male Population of Webster County is 1,749.
What is the Total Female Population of Webster County?
Total Female Population of Webster County is 1,661.
What is the Ratio of Males per 100 Females in Webster County?
There are 105.30 Males per 100 Females in Webster County.
What is the Ratio of Females per 100 Males in Webster County?
There are 94.97 Females per 100 Males in Webster County.
What is the Median Population Age in Webster County?
Median Population Age in Webster County is 44.6 Years.
What is the Average Family Size in Webster County
Average Family Size in Webster County is 2.7 People.
What is the Average Household Size in Webster County
Average Household Size in Webster County is 2.2 People.
How Large is the Labor Force in Webster County?
There are 1,800 People in the Labor Forcein in Webster County.
What is the Percentage of People in the Labor Force in Webster County?
65.9% of People are in the Labor Force in Webster County.
What is the Unemployment Rate in Webster County?
Unemployment Rate in Webster County is 1.8%.