Thayer County, NE Map & Demographics
Thayer County Map
Thayer County Overview
$32,028
PER CAPITA INCOME
$74,583
AVG FAMILY INCOME
$60,305
AVG HOUSEHOLD INCOME
45.0%
WAGE / INCOME GAP [ % ]
55.0¢/ $1
WAGE / INCOME GAP [ $ ]
$10,090
FAMILY INCOME DEFICIT
0.43
INEQUALITY / GINI INDEX
5,006
TOTAL POPULATION
2,474
MALE POPULATION
2,532
FEMALE POPULATION
97.71
MALES / 100 FEMALES
102.34
FEMALES / 100 MALES
45.9
MEDIAN AGE
3.0
AVG FAMILY SIZE
2.4
AVG HOUSEHOLD SIZE
2,520
LABOR FORCE [ PEOPLE ]
62.9%
PERCENT IN LABOR FORCE
3.2%
UNEMPLOYMENT RATE
Thayer County Area Codes
Income in Thayer County
Income Overview in Thayer County
Per Capita Income in Thayer County is $32,028, while median incomes of families and households are $74,583 and $60,305 respectively.
| Characteristic | Number | Measure |
| Per Capita Income | 5,006 | $32,028 |
| Median Family Income | 1,325 | $74,583 |
| Mean Family Income | 1,325 | $85,825 |
| Median Household Income | 2,056 | $60,305 |
| Mean Household Income | 2,056 | $76,798 |
| Income Deficit | 1,325 | $10,090 |
| Wage / Income Gap (%) | 5,006 | 45.00% |
| Wage / Income Gap ($) | 5,006 | 55.00¢ per $1 |
| Gini / Inequality Index | 5,006 | 0.43 |
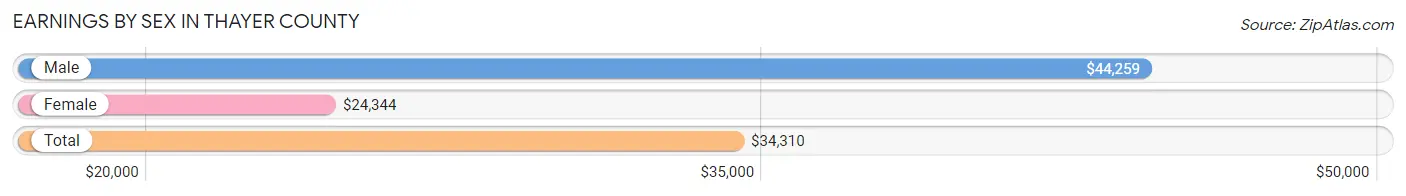
Earnings by Sex in Thayer County
Average Earnings in Thayer County are $34,310, $44,259 for men and $24,344 for women, a difference of 45.0%.
| Sex | Number | Average Earnings |
| Male | 1,436 (52.2%) | $44,259 |
| Female | 1,314 (47.8%) | $24,344 |
| Total | 2,750 (100.0%) | $34,310 |
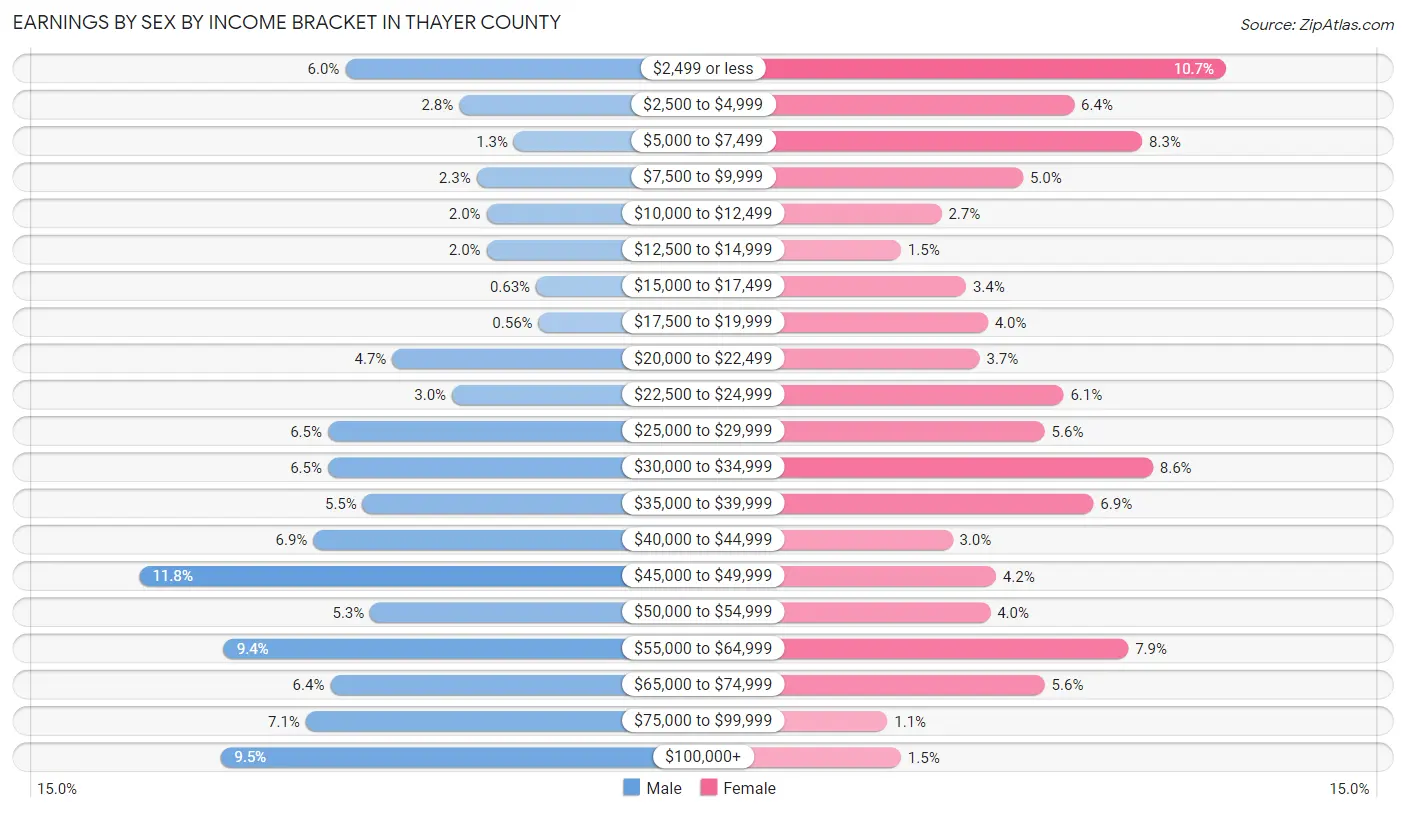
Earnings by Sex by Income Bracket in Thayer County
The most common earnings brackets in Thayer County are $45,000 to $49,999 for men (169 | 11.8%) and $2,499 or less for women (140 | 10.6%).
| Income | Male | Female |
| $2,499 or less | 86 (6.0%) | 140 (10.6%) |
| $2,500 to $4,999 | 40 (2.8%) | 84 (6.4%) |
| $5,000 to $7,499 | 18 (1.3%) | 109 (8.3%) |
| $7,500 to $9,999 | 33 (2.3%) | 65 (5.0%) |
| $10,000 to $12,499 | 29 (2.0%) | 35 (2.7%) |
| $12,500 to $14,999 | 29 (2.0%) | 20 (1.5%) |
| $15,000 to $17,499 | 9 (0.6%) | 44 (3.4%) |
| $17,500 to $19,999 | 8 (0.6%) | 52 (4.0%) |
| $20,000 to $22,499 | 67 (4.7%) | 49 (3.7%) |
| $22,500 to $24,999 | 43 (3.0%) | 80 (6.1%) |
| $25,000 to $29,999 | 93 (6.5%) | 73 (5.6%) |
| $30,000 to $34,999 | 93 (6.5%) | 113 (8.6%) |
| $35,000 to $39,999 | 79 (5.5%) | 91 (6.9%) |
| $40,000 to $44,999 | 99 (6.9%) | 39 (3.0%) |
| $45,000 to $49,999 | 169 (11.8%) | 55 (4.2%) |
| $50,000 to $54,999 | 76 (5.3%) | 53 (4.0%) |
| $55,000 to $64,999 | 135 (9.4%) | 104 (7.9%) |
| $65,000 to $74,999 | 92 (6.4%) | 73 (5.6%) |
| $75,000 to $99,999 | 102 (7.1%) | 15 (1.1%) |
| $100,000+ | 136 (9.5%) | 20 (1.5%) |
| Total | 1,436 (100.0%) | 1,314 (100.0%) |
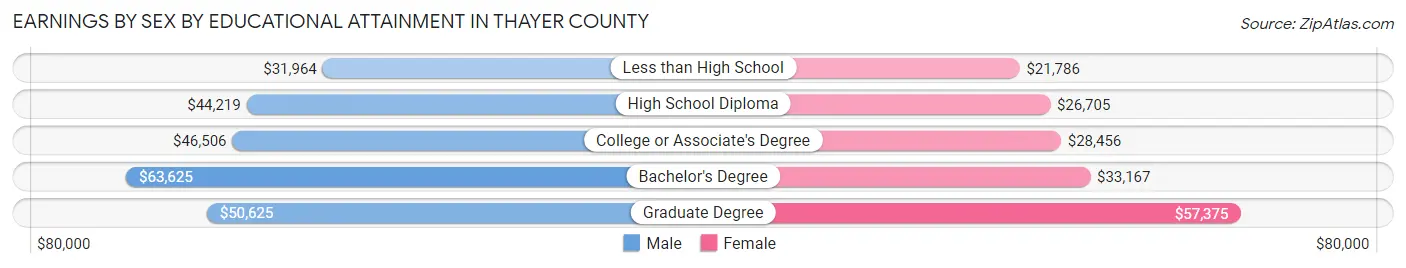
Earnings by Sex by Educational Attainment in Thayer County
Average earnings in Thayer County are $46,002 for men and $29,609 for women, a difference of 35.6%. Men with an educational attainment of bachelor's degree enjoy the highest average annual earnings of $63,625, while those with less than high school education earn the least with $31,964. Women with an educational attainment of graduate degree earn the most with the average annual earnings of $57,375, while those with less than high school education have the smallest earnings of $21,786.
| Educational Attainment | Male Income | Female Income |
| Less than High School | $31,964 | $21,786 |
| High School Diploma | $44,219 | $26,705 |
| College or Associate's Degree | $46,506 | $28,456 |
| Bachelor's Degree | $63,625 | $33,167 |
| Graduate Degree | $50,625 | $57,375 |
| Total | $46,002 | $29,609 |
Family Income in Thayer County
Family Income Brackets in Thayer County
According to the Thayer County family income data, there are 297 families falling into the $50,000 to $74,999 income range, which is the most common income bracket and makes up 22.4% of all families. Conversely, the $10,000 to $14,999 income bracket is the least frequent group with only 23 families (1.7%) belonging to this category.
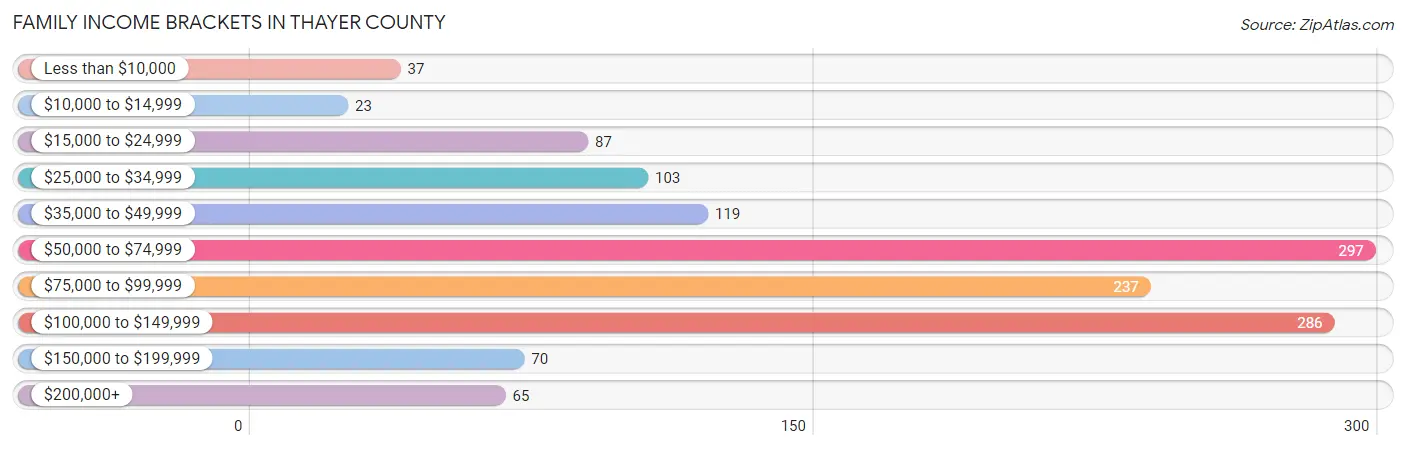
| Income Bracket | # Families | % Families |
| Less than $10,000 | 37 | 2.8% |
| $10,000 to $14,999 | 23 | 1.7% |
| $15,000 to $24,999 | 87 | 6.6% |
| $25,000 to $34,999 | 103 | 7.8% |
| $35,000 to $49,999 | 119 | 9.0% |
| $50,000 to $74,999 | 297 | 22.4% |
| $75,000 to $99,999 | 237 | 17.9% |
| $100,000 to $149,999 | 286 | 21.6% |
| $150,000 to $199,999 | 70 | 5.3% |
| $200,000+ | 65 | 4.9% |
Family Income by Famaliy Size in Thayer County
6-person families (35 | 2.6%) account for the highest median family income in Thayer County with $133,229 per family, while 2-person families (788 | 59.5%) have the highest median income of $33,044 per family member.
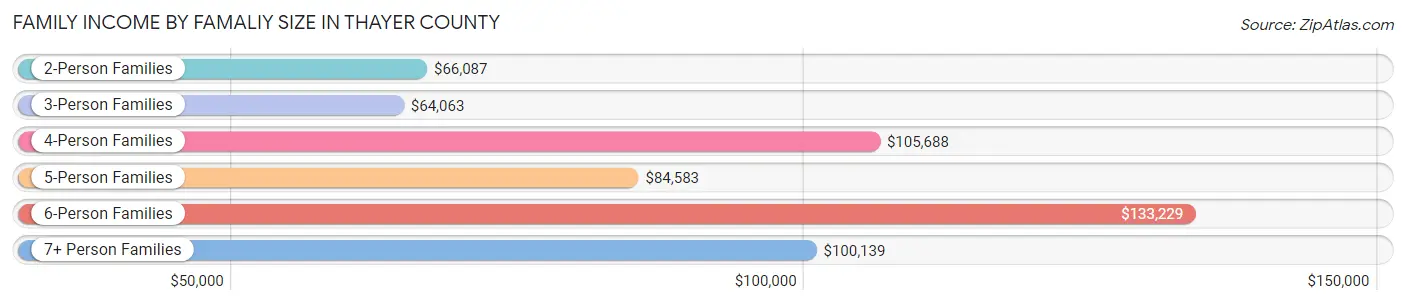
| Income Bracket | # Families | Median Income |
| 2-Person Families | 788 (59.5%) | $66,087 |
| 3-Person Families | 206 (15.5%) | $64,063 |
| 4-Person Families | 191 (14.4%) | $105,688 |
| 5-Person Families | 88 (6.6%) | $84,583 |
| 6-Person Families | 35 (2.6%) | $133,229 |
| 7+ Person Families | 17 (1.3%) | $100,139 |
| Total | 1,325 (100.0%) | $74,583 |
Family Income by Number of Earners in Thayer County
The median family income in Thayer County is $74,583, with families comprising 3+ earners (128) having the highest median family income of $103,077, while families with no earners (180) have the lowest median family income of $41,250, accounting for 9.7% and 13.6% of families, respectively.
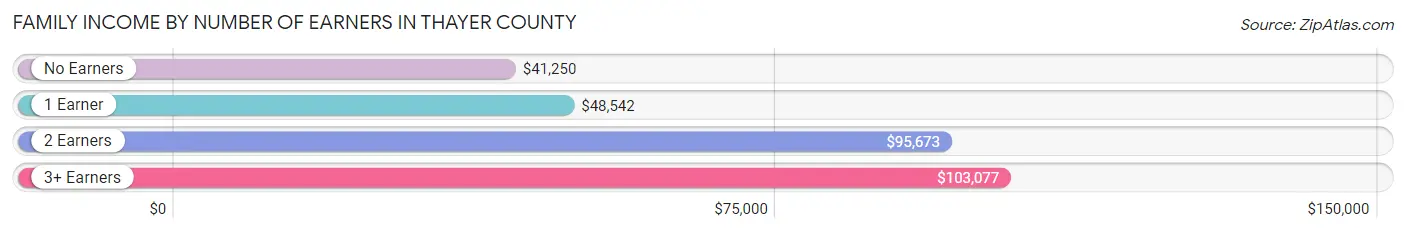
| Number of Earners | # Families | Median Income |
| No Earners | 180 (13.6%) | $41,250 |
| 1 Earner | 387 (29.2%) | $48,542 |
| 2 Earners | 630 (47.5%) | $95,673 |
| 3+ Earners | 128 (9.7%) | $103,077 |
| Total | 1,325 (100.0%) | $74,583 |
Household Income in Thayer County
Household Income Brackets in Thayer County
With 440 households falling in the category, the $50,000 to $74,999 income range is the most frequent in Thayer County, accounting for 21.4% of all households. In contrast, only 56 households (2.7%) fall into the $10,000 to $14,999 income bracket, making it the least populous group.
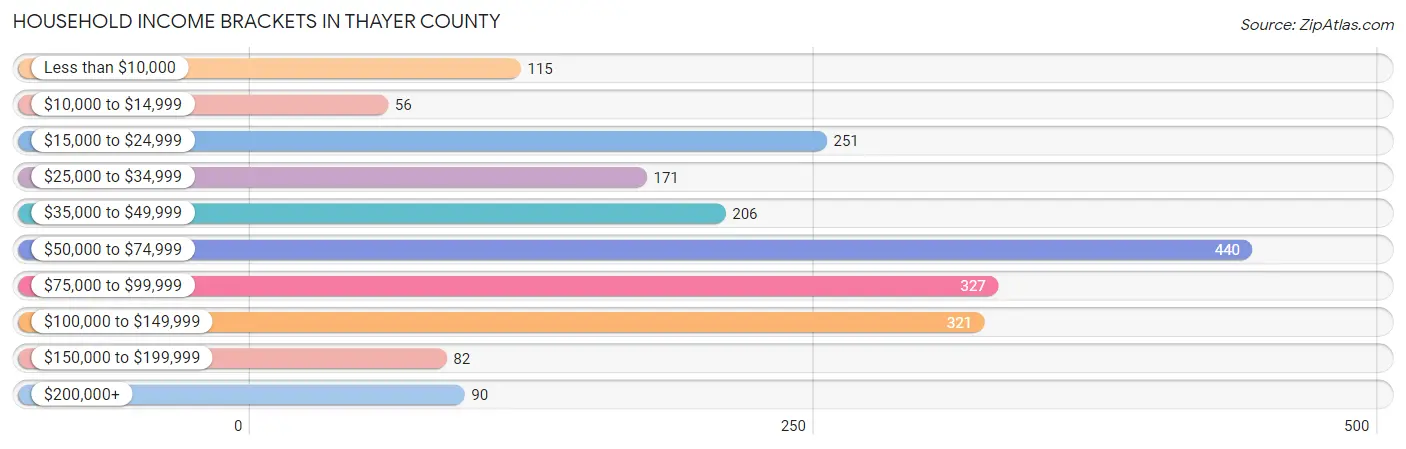
| Income Bracket | # Households | % Households |
| Less than $10,000 | 115 | 5.6% |
| $10,000 to $14,999 | 56 | 2.7% |
| $15,000 to $24,999 | 251 | 12.2% |
| $25,000 to $34,999 | 171 | 8.3% |
| $35,000 to $49,999 | 206 | 10.0% |
| $50,000 to $74,999 | 440 | 21.4% |
| $75,000 to $99,999 | 327 | 15.9% |
| $100,000 to $149,999 | 321 | 15.6% |
| $150,000 to $199,999 | 82 | 4.0% |
| $200,000+ | 90 | 4.4% |
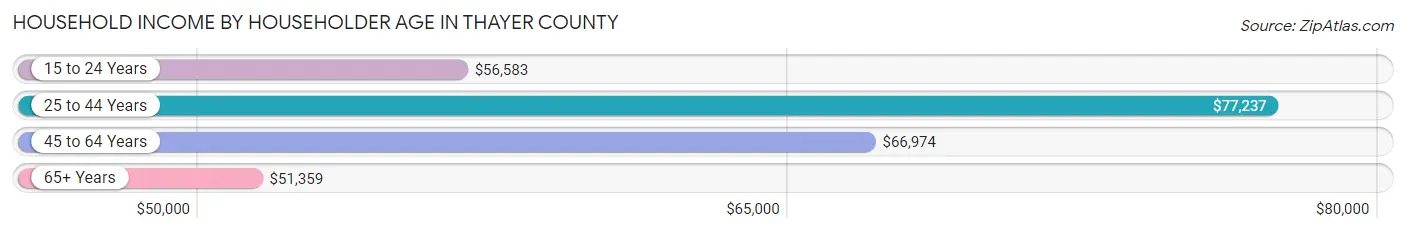
Household Income by Householder Age in Thayer County
The median household income in Thayer County is $60,305, with the highest median household income of $77,237 found in the 25 to 44 years age bracket for the primary householder. A total of 482 households (23.4%) fall into this category. Meanwhile, the 65+ years age bracket for the primary householder has the lowest median household income of $51,359, with 759 households (36.9%) in this group.
| Income Bracket | # Households | Median Income |
| 15 to 24 Years | 93 (4.5%) | $56,583 |
| 25 to 44 Years | 482 (23.4%) | $77,237 |
| 45 to 64 Years | 722 (35.1%) | $66,974 |
| 65+ Years | 759 (36.9%) | $51,359 |
| Total | 2,056 (100.0%) | $60,305 |
Poverty in Thayer County
Income Below Poverty by Sex and Age in Thayer County
With 7.6% poverty level for males and 11.8% for females among the residents of Thayer County, 12 to 14 year old males and 18 to 24 year old females are the most vulnerable to poverty, with 27 males (27.0%) and 51 females (32.3%) in their respective age groups living below the poverty level.
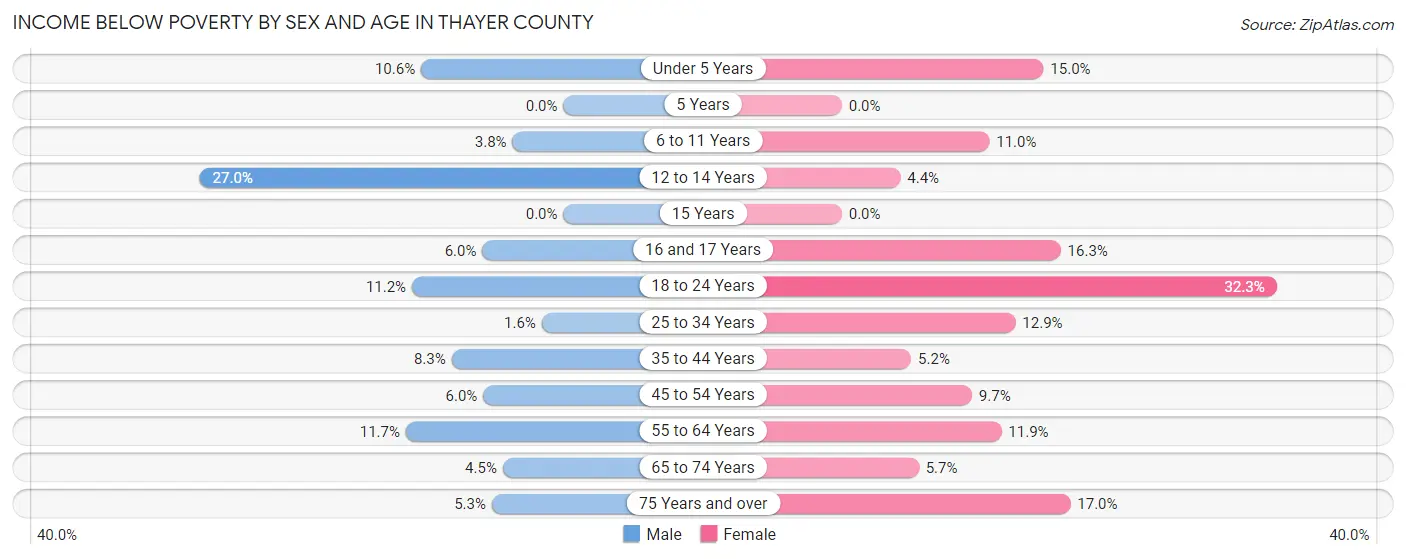
| Age Bracket | Male | Female |
| Under 5 Years | 13 (10.6%) | 22 (15.0%) |
| 5 Years | 0 (0.0%) | 0 (0.0%) |
| 6 to 11 Years | 7 (3.8%) | 22 (11.0%) |
| 12 to 14 Years | 27 (27.0%) | 3 (4.3%) |
| 15 Years | 0 (0.0%) | 0 (0.0%) |
| 16 and 17 Years | 5 (6.0%) | 13 (16.3%) |
| 18 to 24 Years | 19 (11.2%) | 51 (32.3%) |
| 25 to 34 Years | 4 (1.6%) | 29 (12.9%) |
| 35 to 44 Years | 21 (8.3%) | 12 (5.1%) |
| 45 to 54 Years | 16 (5.9%) | 28 (9.7%) |
| 55 to 64 Years | 44 (11.7%) | 39 (11.8%) |
| 65 to 74 Years | 15 (4.5%) | 19 (5.7%) |
| 75 Years and over | 12 (5.3%) | 47 (17.0%) |
| Total | 183 (7.6%) | 285 (11.8%) |
Income Above Poverty by Sex and Age in Thayer County
According to the poverty statistics in Thayer County, males aged 5 years and females aged 5 years are the age groups that are most secure financially, with 100.0% of males and 100.0% of females in these age groups living above the poverty line.
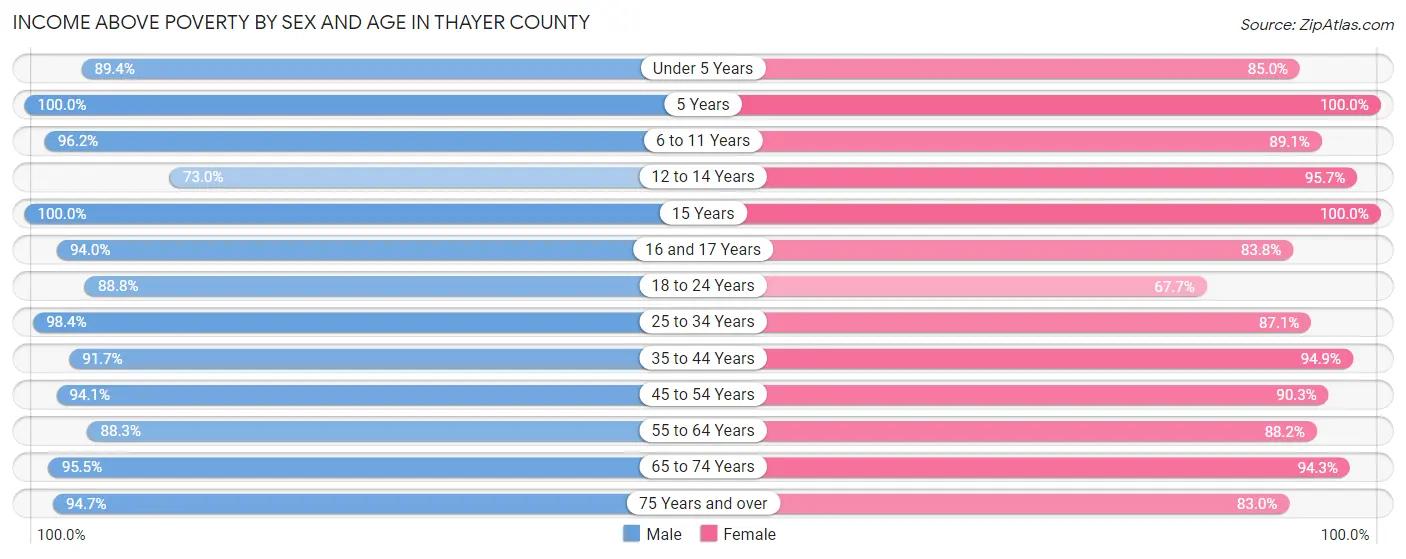
| Age Bracket | Male | Female |
| Under 5 Years | 110 (89.4%) | 125 (85.0%) |
| 5 Years | 46 (100.0%) | 48 (100.0%) |
| 6 to 11 Years | 178 (96.2%) | 179 (89.0%) |
| 12 to 14 Years | 73 (73.0%) | 66 (95.7%) |
| 15 Years | 9 (100.0%) | 28 (100.0%) |
| 16 and 17 Years | 78 (94.0%) | 67 (83.8%) |
| 18 to 24 Years | 150 (88.8%) | 107 (67.7%) |
| 25 to 34 Years | 245 (98.4%) | 196 (87.1%) |
| 35 to 44 Years | 232 (91.7%) | 221 (94.9%) |
| 45 to 54 Years | 253 (94.1%) | 262 (90.3%) |
| 55 to 64 Years | 332 (88.3%) | 290 (88.1%) |
| 65 to 74 Years | 318 (95.5%) | 314 (94.3%) |
| 75 Years and over | 214 (94.7%) | 230 (83.0%) |
| Total | 2,238 (92.4%) | 2,133 (88.2%) |
Income Below Poverty Among Married-Couple Families in Thayer County
The poverty statistics for married-couple families in Thayer County show that 5.5% or 59 of the total 1,072 families live below the poverty line. Families with 5 or more children have the highest poverty rate of 9.1%, comprising of 1 families. On the other hand, families with 3 or 4 children have the lowest poverty rate of 2.1%, which includes 2 families.
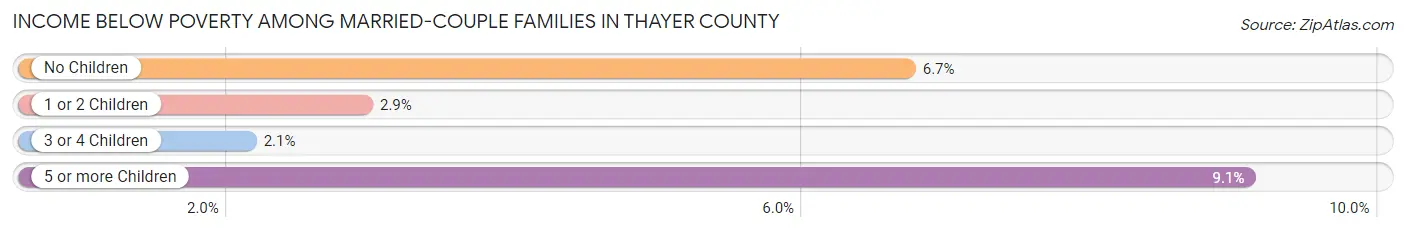
| Children | Above Poverty | Below Poverty |
| No Children | 680 (93.3%) | 49 (6.7%) |
| 1 or 2 Children | 231 (97.1%) | 7 (2.9%) |
| 3 or 4 Children | 92 (97.9%) | 2 (2.1%) |
| 5 or more Children | 10 (90.9%) | 1 (9.1%) |
| Total | 1,013 (94.5%) | 59 (5.5%) |
Income Below Poverty Among Single-Parent Households in Thayer County
According to the poverty data in Thayer County, 6.4% or 7 single-father households and 22.2% or 32 single-mother households are living below the poverty line. Among single-father households, those with 1 or 2 children have the highest poverty rate, with 7 households (18.4%) experiencing poverty. Likewise, among single-mother households, those with 1 or 2 children have the highest poverty rate, with 32 households (36.0%) falling below the poverty line.
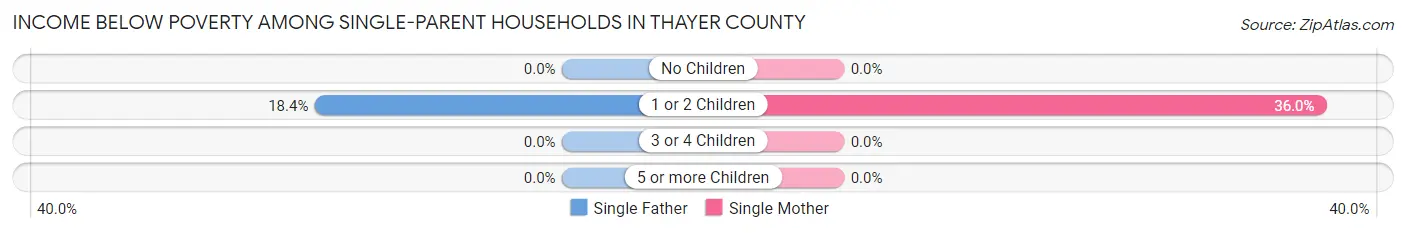
| Children | Single Father | Single Mother |
| No Children | 0 (0.0%) | 0 (0.0%) |
| 1 or 2 Children | 7 (18.4%) | 32 (36.0%) |
| 3 or 4 Children | 0 (0.0%) | 0 (0.0%) |
| 5 or more Children | 0 (0.0%) | 0 (0.0%) |
| Total | 7 (6.4%) | 32 (22.2%) |
Income Below Poverty Among Married-Couple vs Single-Parent Households in Thayer County
The poverty data for Thayer County shows that 59 of the married-couple family households (5.5%) and 39 of the single-parent households (15.4%) are living below the poverty level. Within the married-couple family households, those with 5 or more children have the highest poverty rate, with 1 households (9.1%) falling below the poverty line. Among the single-parent households, those with 1 or 2 children have the highest poverty rate, with 39 household (30.7%) living below poverty.
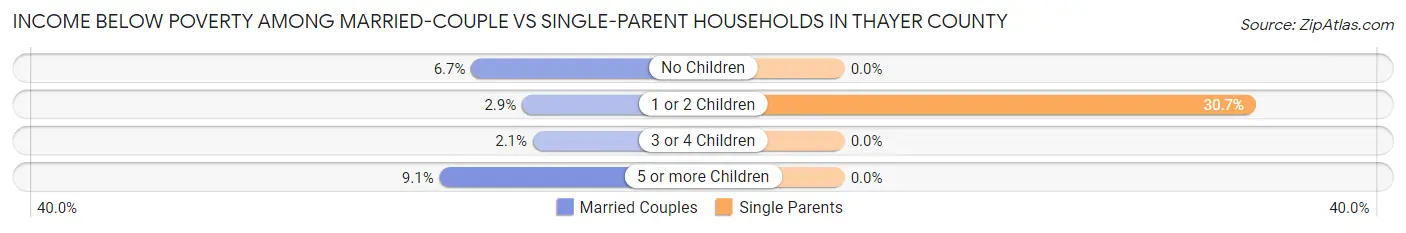
| Children | Married-Couple Families | Single-Parent Households |
| No Children | 49 (6.7%) | 0 (0.0%) |
| 1 or 2 Children | 7 (2.9%) | 39 (30.7%) |
| 3 or 4 Children | 2 (2.1%) | 0 (0.0%) |
| 5 or more Children | 1 (9.1%) | 0 (0.0%) |
| Total | 59 (5.5%) | 39 (15.4%) |
Race in Thayer County
The most populous races in Thayer County are White / Caucasian (4,744 | 94.8%), Two or more Races (221 | 4.4%), and Hispanic or Latino (148 | 3.0%).
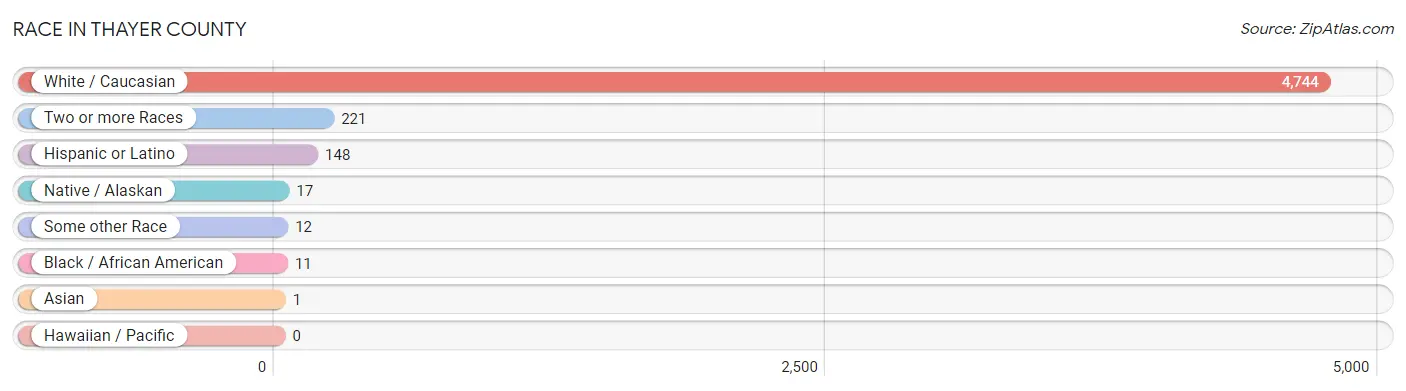
| Race | # Population | % Population |
| Asian | 1 | 0.0% |
| Black / African American | 11 | 0.2% |
| Hawaiian / Pacific | 0 | 0.0% |
| Hispanic or Latino | 148 | 3.0% |
| Native / Alaskan | 17 | 0.3% |
| White / Caucasian | 4,744 | 94.8% |
| Two or more Races | 221 | 4.4% |
| Some other Race | 12 | 0.2% |
| Total | 5,006 | 100.0% |
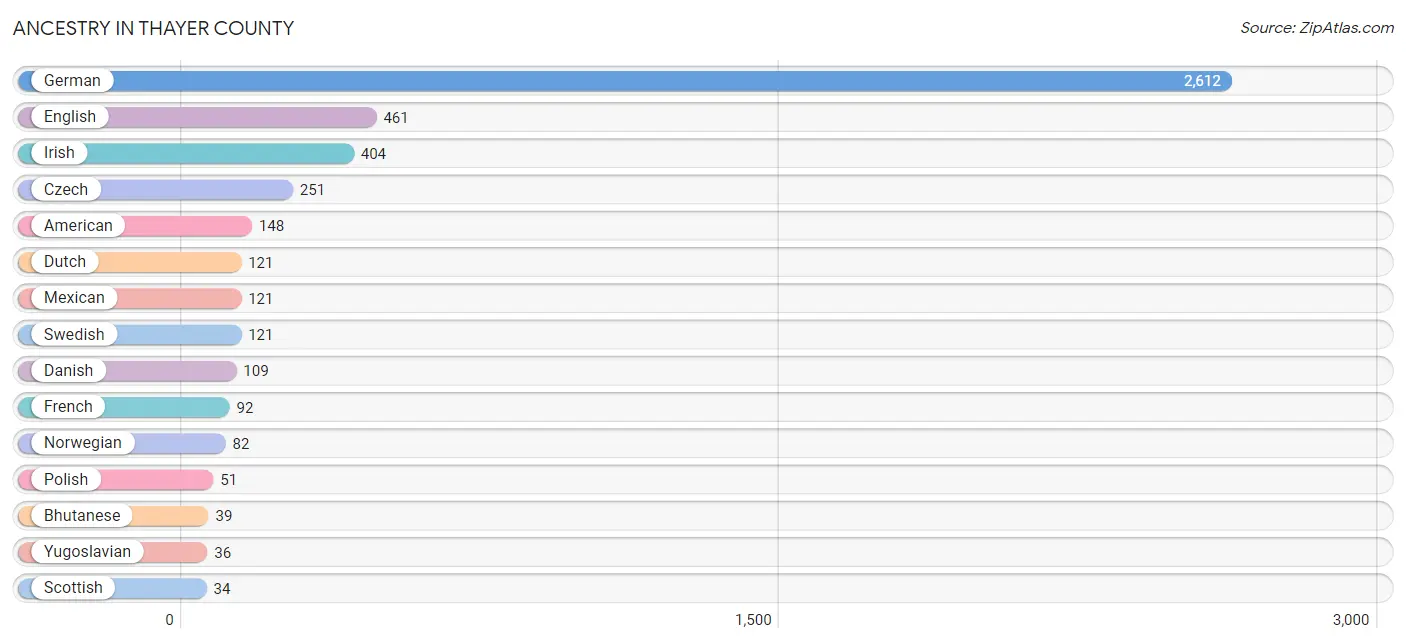
Ancestry in Thayer County
The most populous ancestries reported in Thayer County are German (2,612 | 52.2%), English (461 | 9.2%), Irish (404 | 8.1%), Czech (251 | 5.0%), and American (148 | 3.0%), together accounting for 77.4% of all Thayer County residents.
| Ancestry | # Population | % Population |
| American | 148 | 3.0% |
| Australian | 3 | 0.1% |
| Belgian | 10 | 0.2% |
| Bhutanese | 39 | 0.8% |
| Blackfeet | 2 | 0.0% |
| British | 19 | 0.4% |
| Canadian | 2 | 0.0% |
| Cherokee | 7 | 0.1% |
| Choctaw | 5 | 0.1% |
| Czech | 251 | 5.0% |
| Czechoslovakian | 17 | 0.3% |
| Danish | 109 | 2.2% |
| Dutch | 121 | 2.4% |
| Eastern European | 16 | 0.3% |
| English | 461 | 9.2% |
| European | 17 | 0.3% |
| French | 92 | 1.8% |
| French Canadian | 10 | 0.2% |
| German | 2,612 | 52.2% |
| Hungarian | 13 | 0.3% |
| Indonesian | 1 | 0.0% |
| Irish | 404 | 8.1% |
| Italian | 27 | 0.5% |
| Mexican | 121 | 2.4% |
| Mexican American Indian | 4 | 0.1% |
| Norwegian | 82 | 1.6% |
| Polish | 51 | 1.0% |
| Russian | 5 | 0.1% |
| Scandinavian | 5 | 0.1% |
| Scotch-Irish | 30 | 0.6% |
| Scottish | 34 | 0.7% |
| Sioux | 11 | 0.2% |
| Spanish | 7 | 0.1% |
| Swedish | 121 | 2.4% |
| Swiss | 8 | 0.2% |
| Welsh | 22 | 0.4% |
| Yugoslavian | 36 | 0.7% | View All 37 Rows |
Immigrants in Thayer County
The most numerous immigrant groups reported in Thayer County came from Central America (10 | 0.2%), Latin America (10 | 0.2%), Mexico (10 | 0.2%), Europe (5 | 0.1%), and Australia (3 | 0.1%), together accounting for 0.8% of all Thayer County residents.
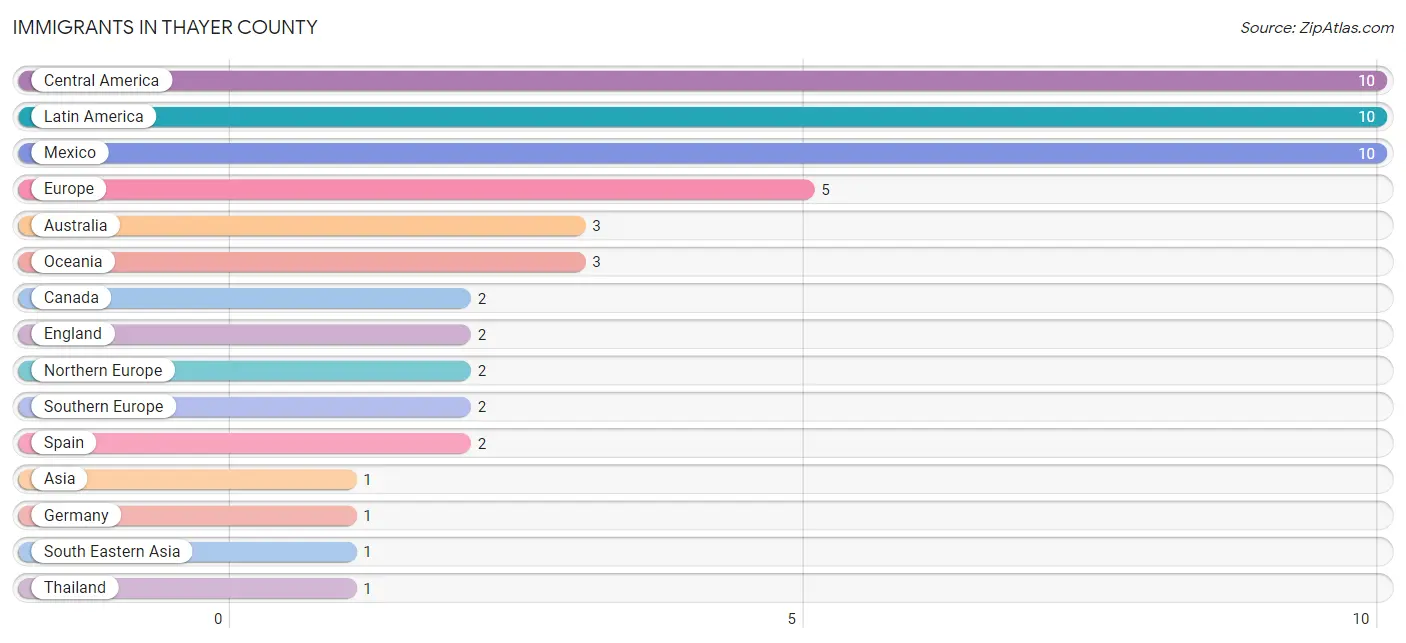
| Immigration Origin | # Population | % Population |
| Asia | 1 | 0.0% |
| Australia | 3 | 0.1% |
| Canada | 2 | 0.0% |
| Central America | 10 | 0.2% |
| England | 2 | 0.0% |
| Europe | 5 | 0.1% |
| Germany | 1 | 0.0% |
| Latin America | 10 | 0.2% |
| Mexico | 10 | 0.2% |
| Northern Europe | 2 | 0.0% |
| Oceania | 3 | 0.1% |
| South Eastern Asia | 1 | 0.0% |
| Southern Europe | 2 | 0.0% |
| Spain | 2 | 0.0% |
| Thailand | 1 | 0.0% |
| Western Europe | 1 | 0.0% | View All 16 Rows |
Sex and Age in Thayer County
Sex and Age in Thayer County
The most populous age groups in Thayer County are 60 to 64 Years (228 | 9.2%) for men and 5 to 9 Years (218 | 8.6%) for women.
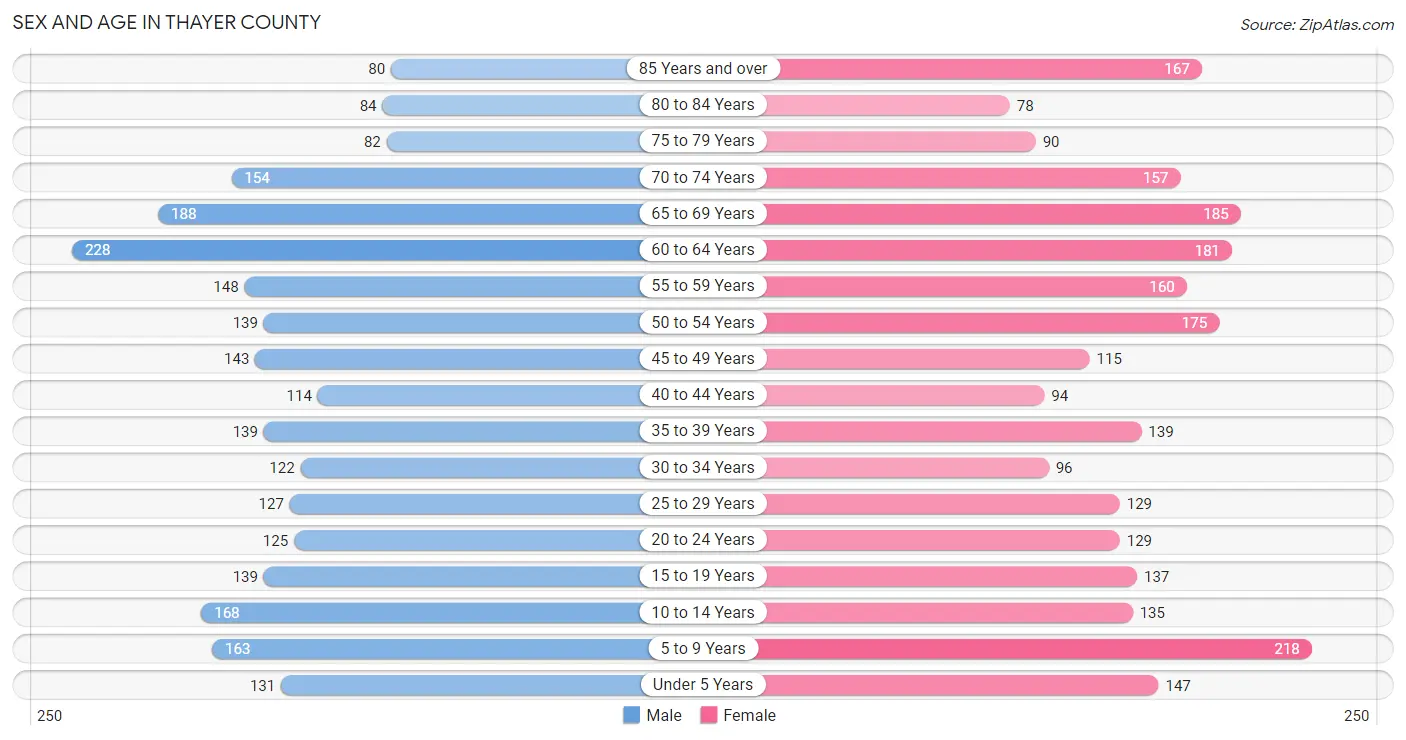
| Age Bracket | Male | Female |
| Under 5 Years | 131 (5.3%) | 147 (5.8%) |
| 5 to 9 Years | 163 (6.6%) | 218 (8.6%) |
| 10 to 14 Years | 168 (6.8%) | 135 (5.3%) |
| 15 to 19 Years | 139 (5.6%) | 137 (5.4%) |
| 20 to 24 Years | 125 (5.1%) | 129 (5.1%) |
| 25 to 29 Years | 127 (5.1%) | 129 (5.1%) |
| 30 to 34 Years | 122 (4.9%) | 96 (3.8%) |
| 35 to 39 Years | 139 (5.6%) | 139 (5.5%) |
| 40 to 44 Years | 114 (4.6%) | 94 (3.7%) |
| 45 to 49 Years | 143 (5.8%) | 115 (4.5%) |
| 50 to 54 Years | 139 (5.6%) | 175 (6.9%) |
| 55 to 59 Years | 148 (6.0%) | 160 (6.3%) |
| 60 to 64 Years | 228 (9.2%) | 181 (7.1%) |
| 65 to 69 Years | 188 (7.6%) | 185 (7.3%) |
| 70 to 74 Years | 154 (6.2%) | 157 (6.2%) |
| 75 to 79 Years | 82 (3.3%) | 90 (3.5%) |
| 80 to 84 Years | 84 (3.4%) | 78 (3.1%) |
| 85 Years and over | 80 (3.2%) | 167 (6.6%) |
| Total | 2,474 (100.0%) | 2,532 (100.0%) |
Families and Households in Thayer County
Median Family Size in Thayer County
The median family size in Thayer County is 2.95 persons per family, with single female/mother families (144 | 10.9%) accounting for the largest median family size of 3.04 persons per family. On the other hand, single male/father families (109 | 8.2%) represent the smallest median family size with 2.84 persons per family.
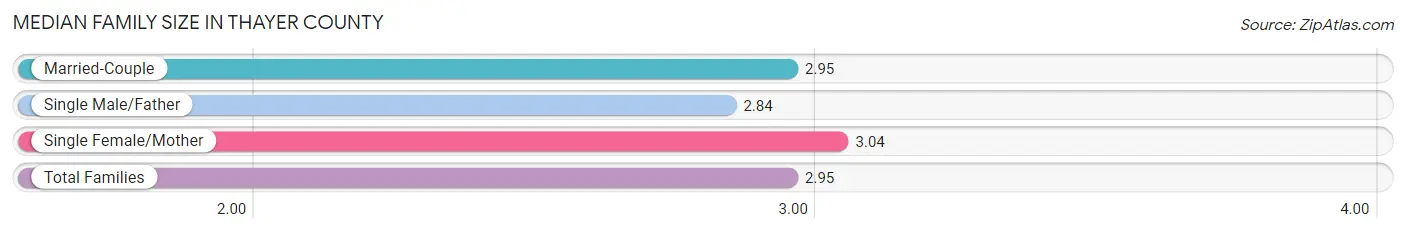
| Family Type | # Families | Family Size |
| Married-Couple | 1,072 (80.9%) | 2.95 |
| Single Male/Father | 109 (8.2%) | 2.84 |
| Single Female/Mother | 144 (10.9%) | 3.04 |
| Total Families | 1,325 (100.0%) | 2.95 |
Median Household Size in Thayer County
The median household size in Thayer County is 2.37 persons per household, with single male/father households (109 | 5.3%) accounting for the largest median household size of 3.29 persons per household. non-family households (731 | 35.5%) represent the smallest median household size with 1.21 persons per household.
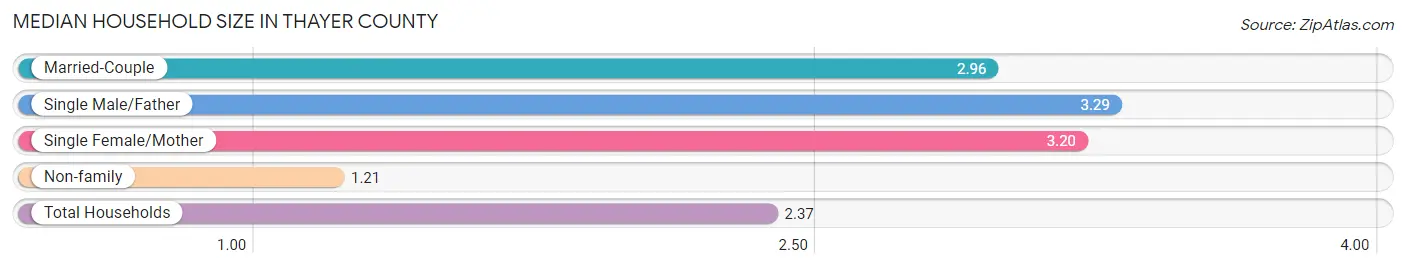
| Household Type | # Households | Household Size |
| Married-Couple | 1,072 (52.1%) | 2.96 |
| Single Male/Father | 109 (5.3%) | 3.29 |
| Single Female/Mother | 144 (7.0%) | 3.20 |
| Non-family | 731 (35.5%) | 1.21 |
| Total Households | 2,056 (100.0%) | 2.37 |
Household Size by Marriage Status in Thayer County
Out of a total of 2,056 households in Thayer County, 1,325 (64.4%) are family households, while 731 (35.5%) are nonfamily households. The most numerous type of family households are 2-person households, comprising 759, and the most common type of nonfamily households are 1-person households, comprising 625.
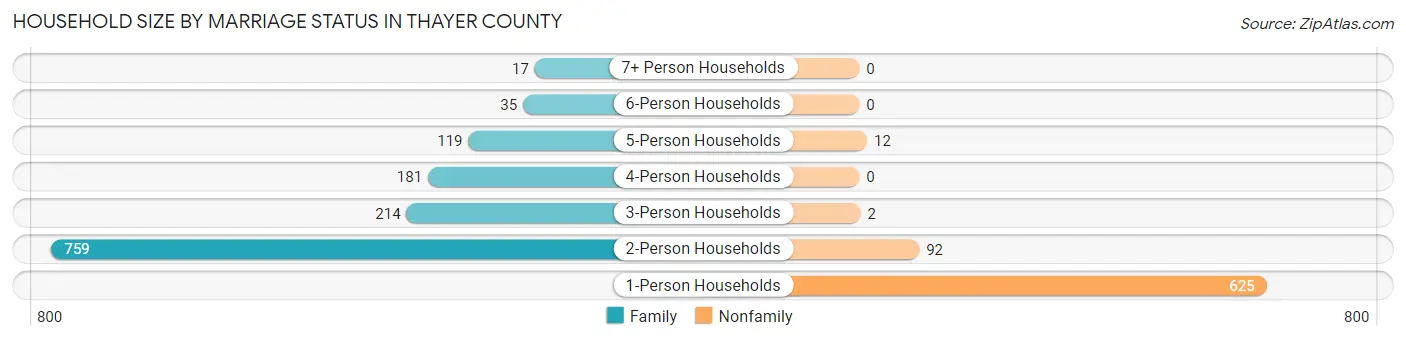
| Household Size | Family Households | Nonfamily Households |
| 1-Person Households | - | 625 (30.4%) |
| 2-Person Households | 759 (36.9%) | 92 (4.5%) |
| 3-Person Households | 214 (10.4%) | 2 (0.1%) |
| 4-Person Households | 181 (8.8%) | 0 (0.0%) |
| 5-Person Households | 119 (5.8%) | 12 (0.6%) |
| 6-Person Households | 35 (1.7%) | 0 (0.0%) |
| 7+ Person Households | 17 (0.8%) | 0 (0.0%) |
| Total | 1,325 (64.4%) | 731 (35.5%) |
Female Fertility in Thayer County
Fertility by Age in Thayer County
Average fertility rate in Thayer County is 31.0 births per 1,000 women. Women in the age bracket of 20 to 34 years have the highest fertility rate with 65.0 births per 1,000 women. Women in the age bracket of 20 to 34 years acount for 82.1% of all women with births.
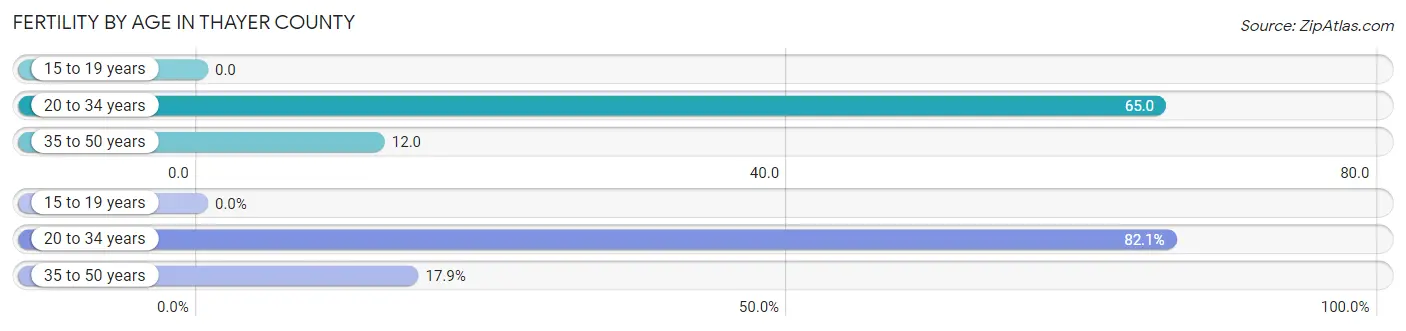
| Age Bracket | Women with Births | Births / 1,000 Women |
| 15 to 19 years | 0 (0.0%) | 0.0 |
| 20 to 34 years | 23 (82.1%) | 65.0 |
| 35 to 50 years | 5 (17.9%) | 12.0 |
| Total | 28 (100.0%) | 31.0 |
Fertility by Age by Marriage Status in Thayer County
85.7% of women with births (28) in Thayer County are married. The highest percentage of unmarried women with births falls into 35 to 50 years age bracket with 20.0% of them unmarried at the time of birth, while the lowest percentage of unmarried women with births belong to 20 to 34 years age bracket with 13.0% of them unmarried.
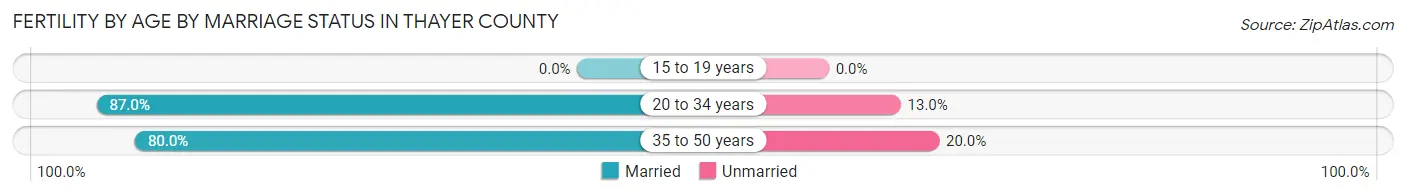
| Age Bracket | Married | Unmarried |
| 15 to 19 years | 0 (0.0%) | 0 (0.0%) |
| 20 to 34 years | 20 (87.0%) | 3 (13.0%) |
| 35 to 50 years | 4 (80.0%) | 1 (20.0%) |
| Total | 24 (85.7%) | 4 (14.3%) |
Fertility by Education in Thayer County
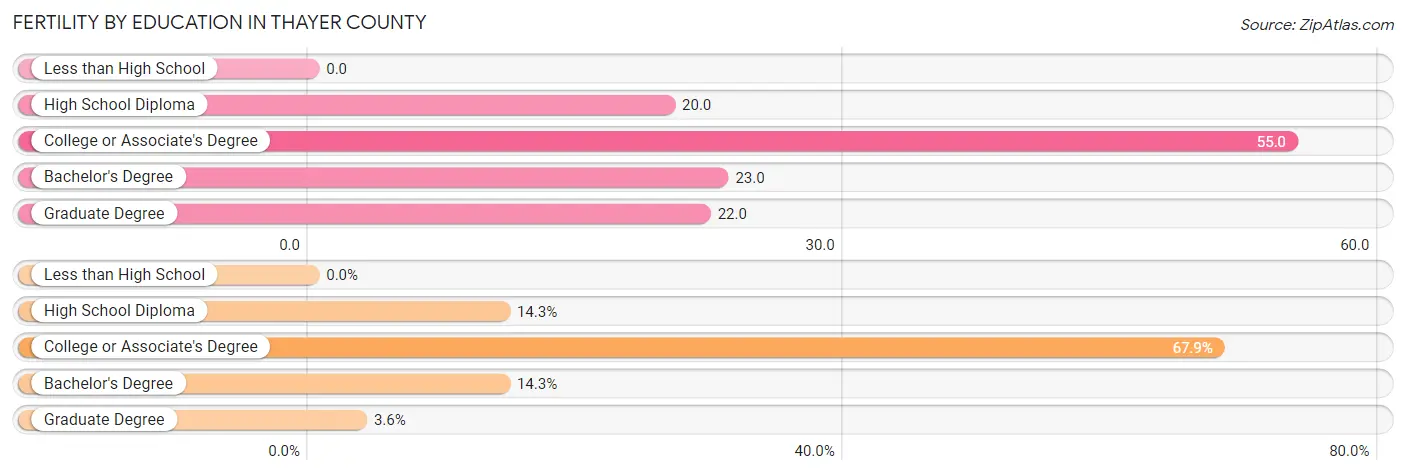
| Educational Attainment | Women with Births | Births / 1,000 Women |
| Less than High School | 0 (0.0%) | 0.0 |
| High School Diploma | 4 (14.3%) | 20.0 |
| College or Associate's Degree | 19 (67.9%) | 55.0 |
| Bachelor's Degree | 4 (14.3%) | 23.0 |
| Graduate Degree | 1 (3.6%) | 22.0 |
| Total | 28 (100.0%) | 31.0 |
Fertility by Education by Marriage Status in Thayer County
14.3% of women with births in Thayer County are unmarried. Women with the educational attainment of college or associate's degree are most likely to be married with 100.0% of them married at childbirth, while women with the educational attainment of high school diploma are least likely to be married with 100.0% of them unmarried at childbirth.
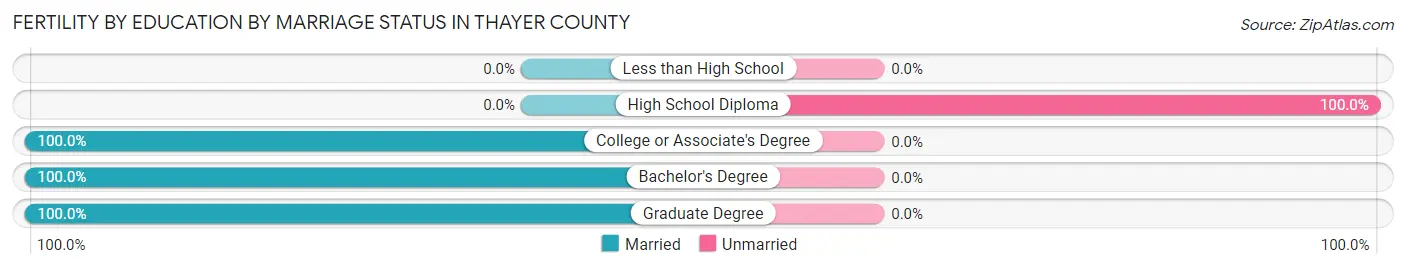
| Educational Attainment | Married | Unmarried |
| Less than High School | 0 (0.0%) | 0 (0.0%) |
| High School Diploma | 0 (0.0%) | 4 (100.0%) |
| College or Associate's Degree | 19 (100.0%) | 0 (0.0%) |
| Bachelor's Degree | 4 (100.0%) | 0 (0.0%) |
| Graduate Degree | 1 (100.0%) | 0 (0.0%) |
| Total | 24 (85.7%) | 4 (14.3%) |
Employment Characteristics in Thayer County
Employment by Class of Employer in Thayer County
Among the 2,405 employed individuals in Thayer County, private company employees (1,444 | 60.0%), self-employed (not incorporated) (345 | 14.3%), and local government employees (228 | 9.5%) make up the most common classes of employment.
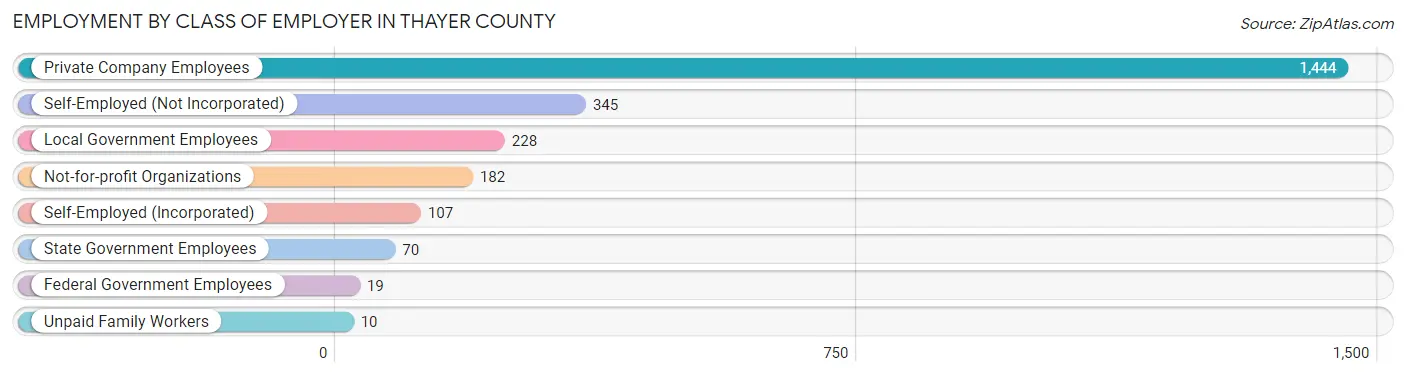
| Employer Class | # Employees | % Employees |
| Private Company Employees | 1,444 | 60.0% |
| Self-Employed (Incorporated) | 107 | 4.4% |
| Self-Employed (Not Incorporated) | 345 | 14.3% |
| Not-for-profit Organizations | 182 | 7.6% |
| Local Government Employees | 228 | 9.5% |
| State Government Employees | 70 | 2.9% |
| Federal Government Employees | 19 | 0.8% |
| Unpaid Family Workers | 10 | 0.4% |
| Total | 2,405 | 100.0% |
Employment Status by Age in Thayer County
According to the labor force statistics for Thayer County, out of the total population over 16 years of age (4,007), 62.9% or 2,520 individuals are in the labor force, with 3.2% or 81 of them unemployed. The age group with the highest labor force participation rate is 20 to 24 years, with 93.7% or 238 individuals in the labor force. Within the labor force, the 16 to 19 years age range has the highest percentage of unemployed individuals, with 5.9% or 5 of them being unemployed.
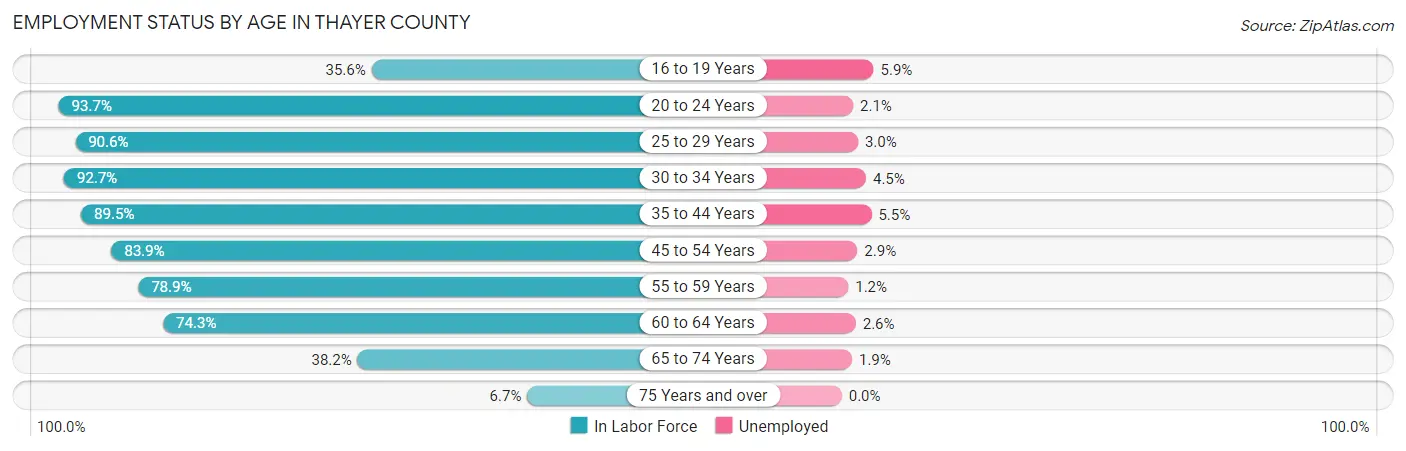
| Age Bracket | In Labor Force | Unemployed |
| 16 to 19 Years | 85 (35.6%) | 5 (5.9%) |
| 20 to 24 Years | 238 (93.7%) | 5 (2.1%) |
| 25 to 29 Years | 232 (90.6%) | 7 (3.0%) |
| 30 to 34 Years | 202 (92.7%) | 9 (4.5%) |
| 35 to 44 Years | 435 (89.5%) | 24 (5.5%) |
| 45 to 54 Years | 480 (83.9%) | 14 (2.9%) |
| 55 to 59 Years | 243 (78.9%) | 3 (1.2%) |
| 60 to 64 Years | 304 (74.3%) | 8 (2.6%) |
| 65 to 74 Years | 261 (38.2%) | 5 (1.9%) |
| 75 Years and over | 39 (6.7%) | 0 (0.0%) |
| Total | 2,520 (62.9%) | 81 (3.2%) |
Employment Status by Educational Attainment in Thayer County
According to labor force statistics for Thayer County, 84.3% of individuals (1,896) out of the total population between 25 and 64 years of age (2,249) are in the labor force, with 3.4% or 64 of them being unemployed. The group with the highest labor force participation rate are those with the educational attainment of bachelor's degree or higher, with 90.0% or 493 individuals in the labor force. Within the labor force, individuals with bachelor's degree or higher education have the highest percentage of unemployment, with 5.7% or 28 of them being unemployed.
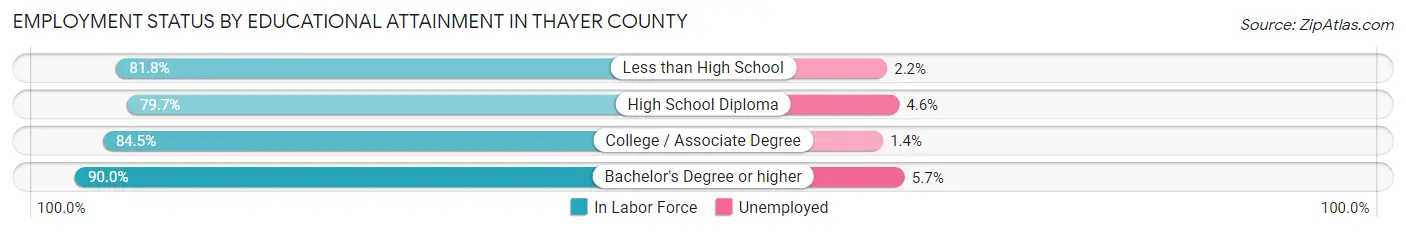
| Educational Attainment | In Labor Force | Unemployed |
| Less than High School | 90 (81.8%) | 2 (2.2%) |
| High School Diploma | 517 (79.7%) | 30 (4.6%) |
| College / Associate Degree | 796 (84.5%) | 13 (1.4%) |
| Bachelor's Degree or higher | 493 (90.0%) | 31 (5.7%) |
| Total | 1,896 (84.3%) | 76 (3.4%) |
Employment Occupations by Sex in Thayer County
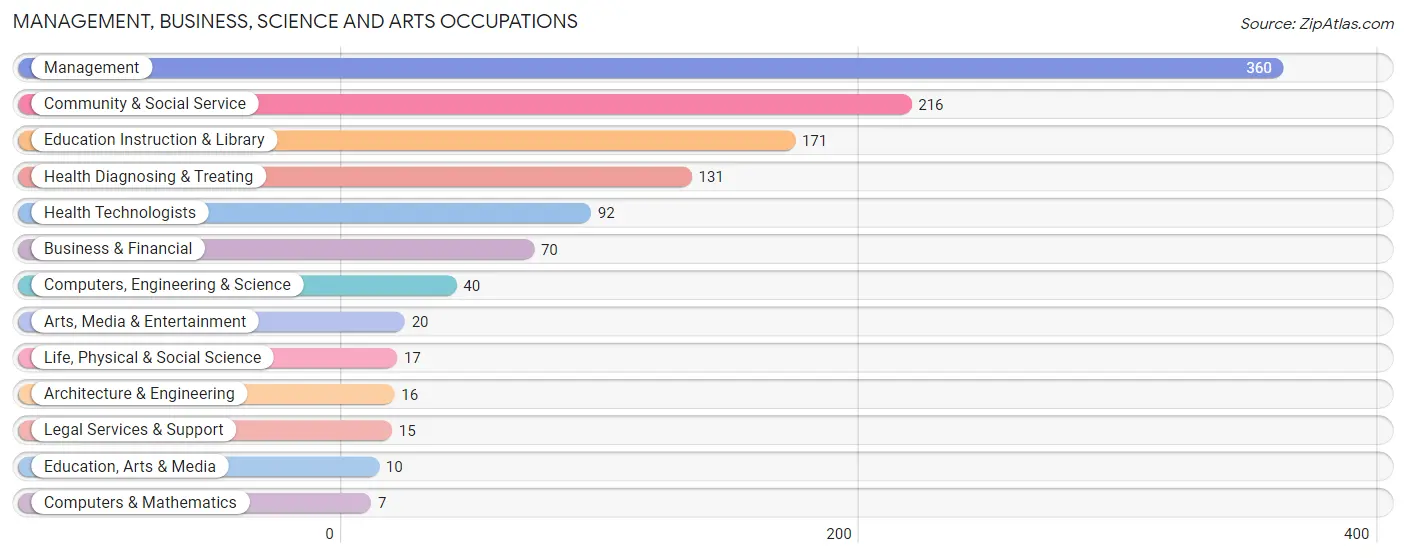
Management, Business, Science and Arts Occupations
The most common Management, Business, Science and Arts occupations in Thayer County are Management (360 | 14.8%), Community & Social Service (216 | 8.9%), Education Instruction & Library (171 | 7.0%), Health Diagnosing & Treating (131 | 5.4%), and Health Technologists (92 | 3.8%).
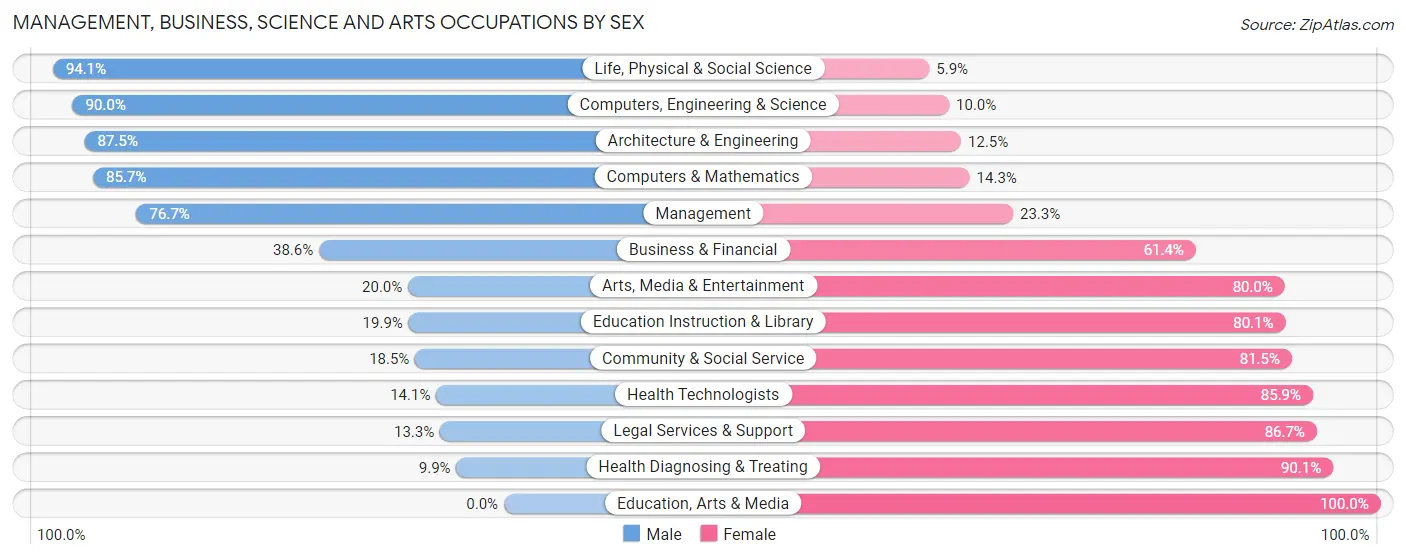
Management, Business, Science and Arts Occupations by Sex
Within the Management, Business, Science and Arts occupations in Thayer County, the most male-oriented occupations are Life, Physical & Social Science (94.1%), Computers, Engineering & Science (90.0%), and Architecture & Engineering (87.5%), while the most female-oriented occupations are Education, Arts & Media (100.0%), Health Diagnosing & Treating (90.1%), and Legal Services & Support (86.7%).
| Occupation | Male | Female |
| Management | 276 (76.7%) | 84 (23.3%) |
| Business & Financial | 27 (38.6%) | 43 (61.4%) |
| Computers, Engineering & Science | 36 (90.0%) | 4 (10.0%) |
| Computers & Mathematics | 6 (85.7%) | 1 (14.3%) |
| Architecture & Engineering | 14 (87.5%) | 2 (12.5%) |
| Life, Physical & Social Science | 16 (94.1%) | 1 (5.9%) |
| Community & Social Service | 40 (18.5%) | 176 (81.5%) |
| Education, Arts & Media | 0 (0.0%) | 10 (100.0%) |
| Legal Services & Support | 2 (13.3%) | 13 (86.7%) |
| Education Instruction & Library | 34 (19.9%) | 137 (80.1%) |
| Arts, Media & Entertainment | 4 (20.0%) | 16 (80.0%) |
| Health Diagnosing & Treating | 13 (9.9%) | 118 (90.1%) |
| Health Technologists | 13 (14.1%) | 79 (85.9%) |
| Total (Category) | 392 (48.0%) | 425 (52.0%) |
| Total (Overall) | 1,287 (52.8%) | 1,152 (47.2%) |
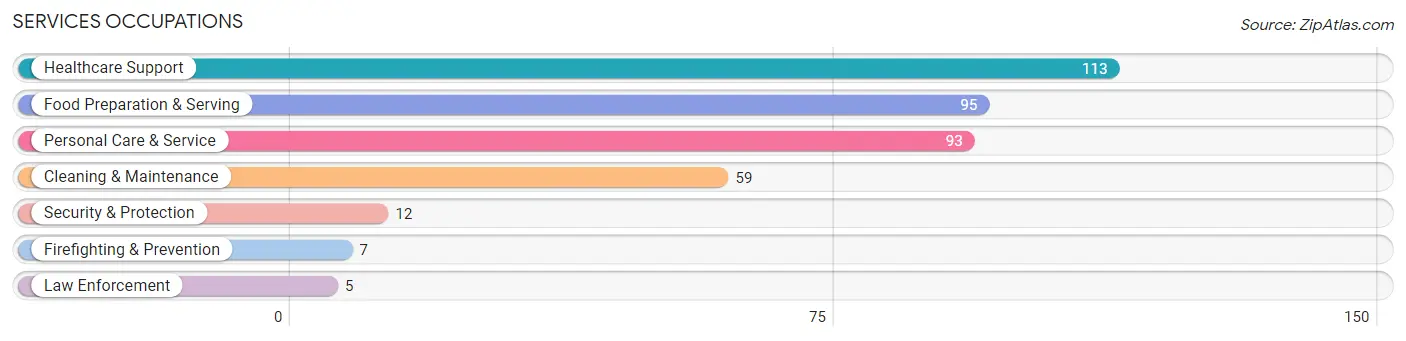
Services Occupations
The most common Services occupations in Thayer County are Healthcare Support (113 | 4.6%), Food Preparation & Serving (95 | 3.9%), Personal Care & Service (93 | 3.8%), Cleaning & Maintenance (59 | 2.4%), and Security & Protection (12 | 0.5%).
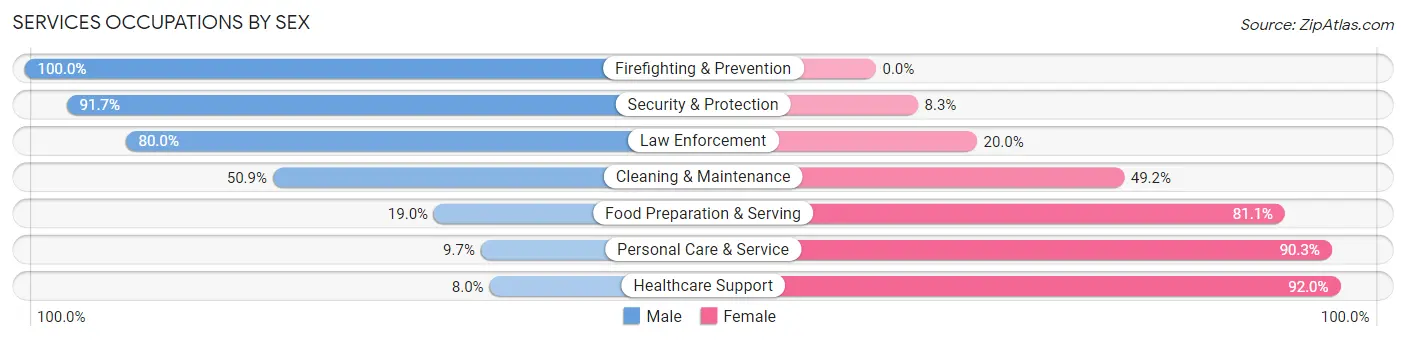
Services Occupations by Sex
Within the Services occupations in Thayer County, the most male-oriented occupations are Firefighting & Prevention (100.0%), Security & Protection (91.7%), and Law Enforcement (80.0%), while the most female-oriented occupations are Healthcare Support (92.0%), Personal Care & Service (90.3%), and Food Preparation & Serving (81.0%).
| Occupation | Male | Female |
| Healthcare Support | 9 (8.0%) | 104 (92.0%) |
| Security & Protection | 11 (91.7%) | 1 (8.3%) |
| Firefighting & Prevention | 7 (100.0%) | 0 (0.0%) |
| Law Enforcement | 4 (80.0%) | 1 (20.0%) |
| Food Preparation & Serving | 18 (19.0%) | 77 (81.0%) |
| Cleaning & Maintenance | 30 (50.8%) | 29 (49.1%) |
| Personal Care & Service | 9 (9.7%) | 84 (90.3%) |
| Total (Category) | 77 (20.7%) | 295 (79.3%) |
| Total (Overall) | 1,287 (52.8%) | 1,152 (47.2%) |
Sales and Office Occupations
The most common Sales and Office occupations in Thayer County are Office & Administration (212 | 8.7%), and Sales & Related (168 | 6.9%).
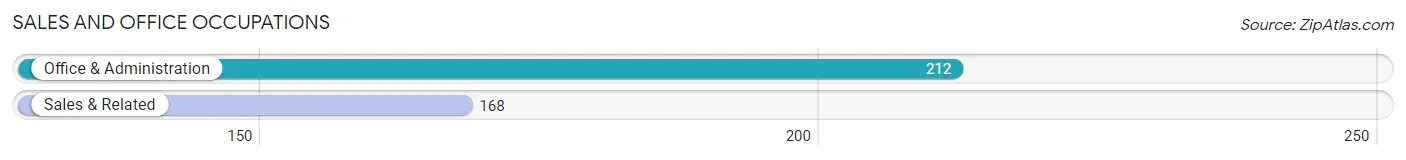
Sales and Office Occupations by Sex
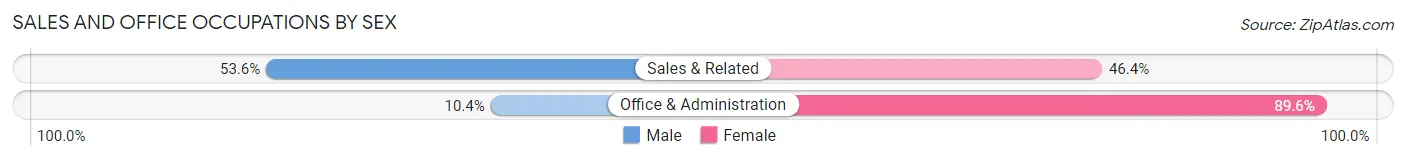
| Occupation | Male | Female |
| Sales & Related | 90 (53.6%) | 78 (46.4%) |
| Office & Administration | 22 (10.4%) | 190 (89.6%) |
| Total (Category) | 112 (29.5%) | 268 (70.5%) |
| Total (Overall) | 1,287 (52.8%) | 1,152 (47.2%) |
Natural Resources, Construction and Maintenance Occupations
The most common Natural Resources, Construction and Maintenance occupations in Thayer County are Farming, Fishing & Forestry (237 | 9.7%), Construction & Extraction (161 | 6.6%), and Installation, Maintenance & Repair (86 | 3.5%).
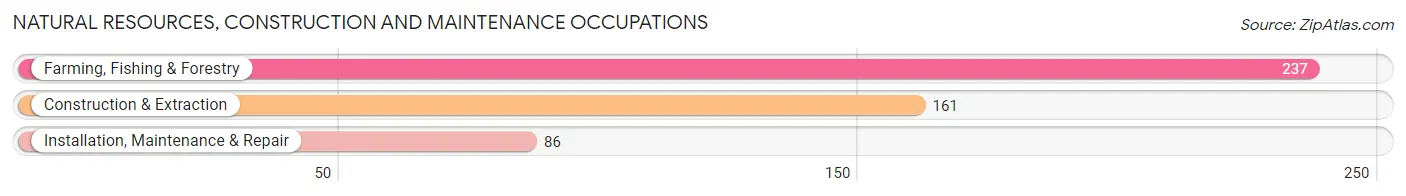
Natural Resources, Construction and Maintenance Occupations by Sex
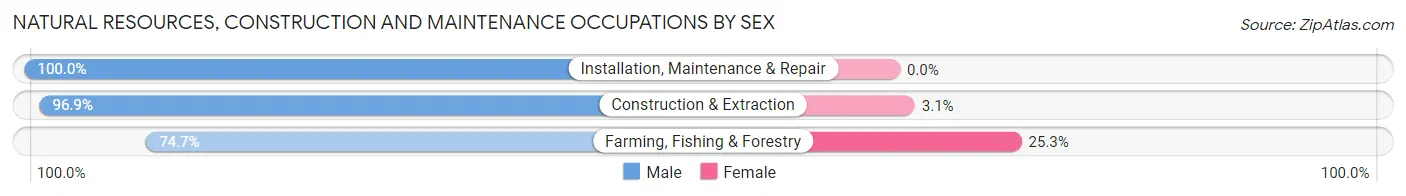
| Occupation | Male | Female |
| Farming, Fishing & Forestry | 177 (74.7%) | 60 (25.3%) |
| Construction & Extraction | 156 (96.9%) | 5 (3.1%) |
| Installation, Maintenance & Repair | 86 (100.0%) | 0 (0.0%) |
| Total (Category) | 419 (86.6%) | 65 (13.4%) |
| Total (Overall) | 1,287 (52.8%) | 1,152 (47.2%) |
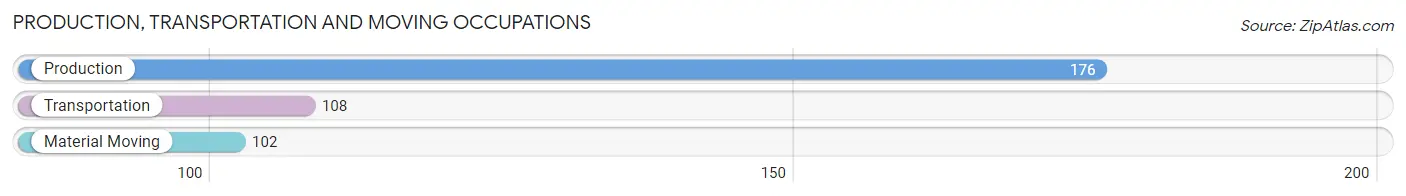
Production, Transportation and Moving Occupations
The most common Production, Transportation and Moving occupations in Thayer County are Production (176 | 7.2%), Transportation (108 | 4.4%), and Material Moving (102 | 4.2%).
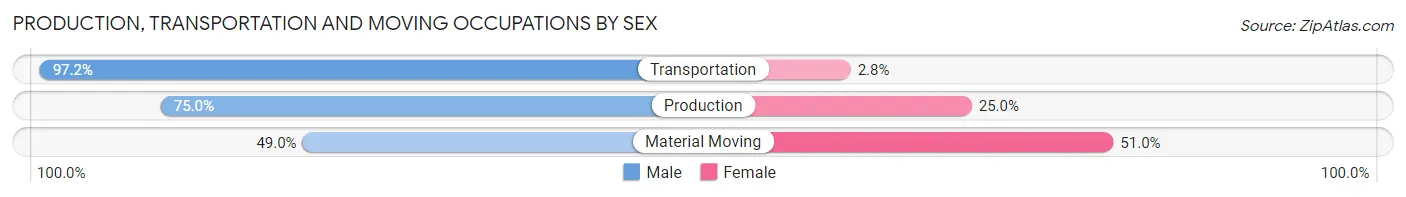
Production, Transportation and Moving Occupations by Sex
| Occupation | Male | Female |
| Production | 132 (75.0%) | 44 (25.0%) |
| Transportation | 105 (97.2%) | 3 (2.8%) |
| Material Moving | 50 (49.0%) | 52 (51.0%) |
| Total (Category) | 287 (74.4%) | 99 (25.7%) |
| Total (Overall) | 1,287 (52.8%) | 1,152 (47.2%) |
Employment Industries by Sex in Thayer County
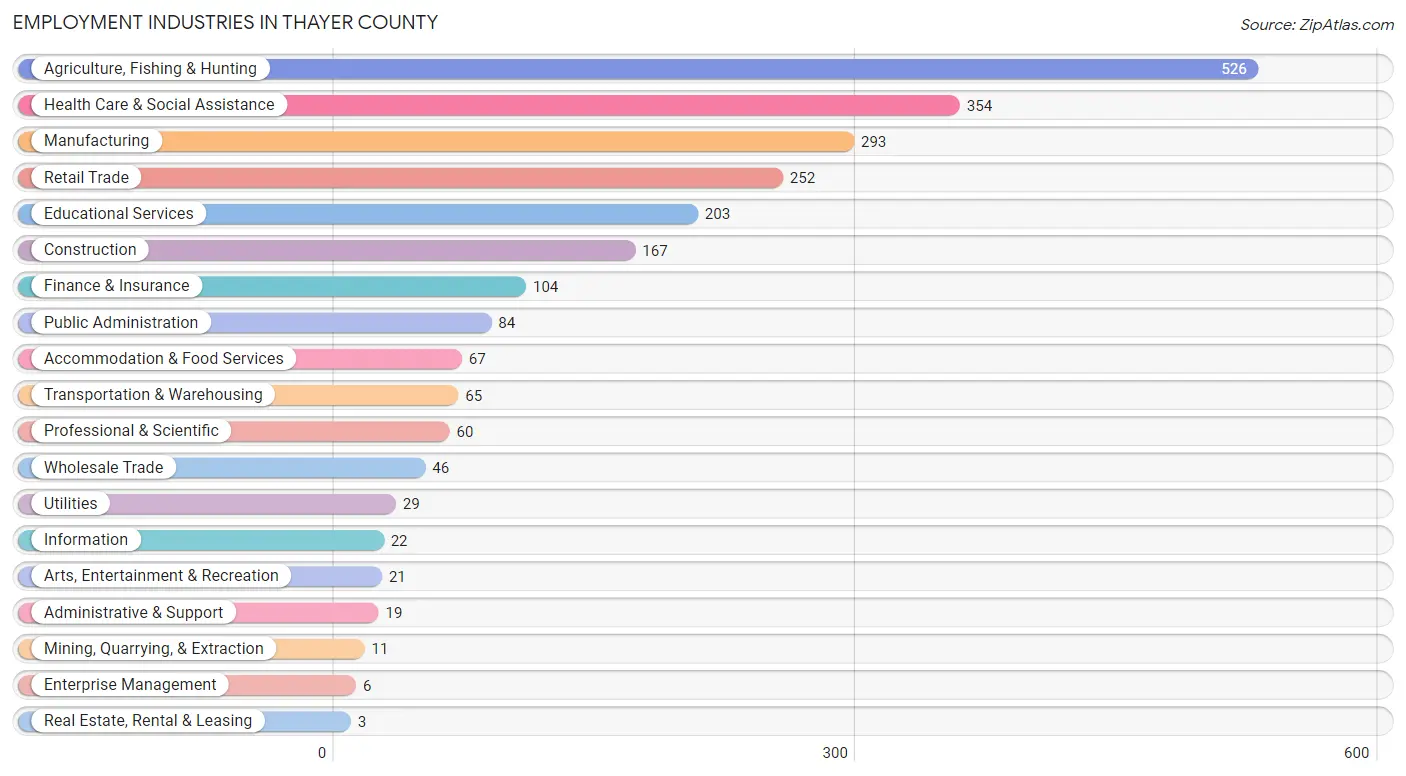
Employment Industries in Thayer County
The major employment industries in Thayer County include Agriculture, Fishing & Hunting (526 | 21.6%), Health Care & Social Assistance (354 | 14.5%), Manufacturing (293 | 12.0%), Retail Trade (252 | 10.3%), and Educational Services (203 | 8.3%).
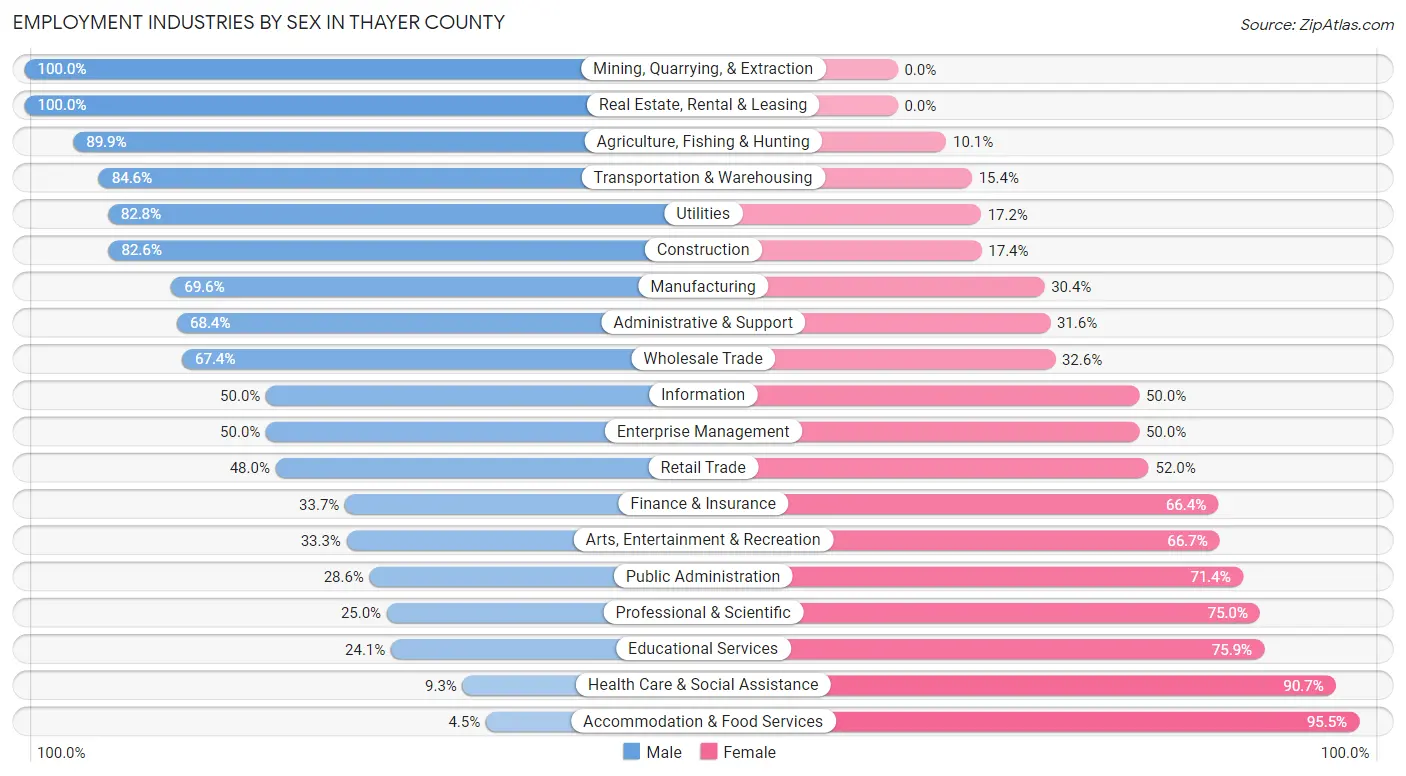
Employment Industries by Sex in Thayer County
The Thayer County industries that see more men than women are Mining, Quarrying, & Extraction (100.0%), Real Estate, Rental & Leasing (100.0%), and Agriculture, Fishing & Hunting (89.9%), whereas the industries that tend to have a higher number of women are Accommodation & Food Services (95.5%), Health Care & Social Assistance (90.7%), and Educational Services (75.9%).
| Industry | Male | Female |
| Agriculture, Fishing & Hunting | 473 (89.9%) | 53 (10.1%) |
| Mining, Quarrying, & Extraction | 11 (100.0%) | 0 (0.0%) |
| Construction | 138 (82.6%) | 29 (17.4%) |
| Manufacturing | 204 (69.6%) | 89 (30.4%) |
| Wholesale Trade | 31 (67.4%) | 15 (32.6%) |
| Retail Trade | 121 (48.0%) | 131 (52.0%) |
| Transportation & Warehousing | 55 (84.6%) | 10 (15.4%) |
| Utilities | 24 (82.8%) | 5 (17.2%) |
| Information | 11 (50.0%) | 11 (50.0%) |
| Finance & Insurance | 35 (33.7%) | 69 (66.3%) |
| Real Estate, Rental & Leasing | 3 (100.0%) | 0 (0.0%) |
| Professional & Scientific | 15 (25.0%) | 45 (75.0%) |
| Enterprise Management | 3 (50.0%) | 3 (50.0%) |
| Administrative & Support | 13 (68.4%) | 6 (31.6%) |
| Educational Services | 49 (24.1%) | 154 (75.9%) |
| Health Care & Social Assistance | 33 (9.3%) | 321 (90.7%) |
| Arts, Entertainment & Recreation | 7 (33.3%) | 14 (66.7%) |
| Accommodation & Food Services | 3 (4.5%) | 64 (95.5%) |
| Public Administration | 24 (28.6%) | 60 (71.4%) |
| Total | 1,287 (52.8%) | 1,152 (47.2%) |
Education in Thayer County
School Enrollment in Thayer County
The most common levels of schooling among the 1,168 students in Thayer County are middle school (283 | 24.2%), elementary school (263 | 22.5%), and high school (221 | 18.9%).
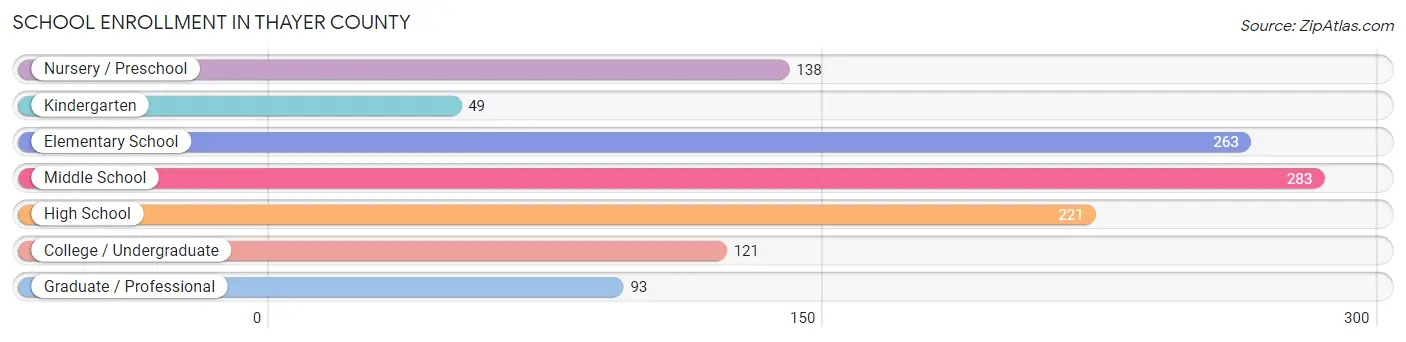
| School Level | # Students | % Students |
| Nursery / Preschool | 138 | 11.8% |
| Kindergarten | 49 | 4.2% |
| Elementary School | 263 | 22.5% |
| Middle School | 283 | 24.2% |
| High School | 221 | 18.9% |
| College / Undergraduate | 121 | 10.4% |
| Graduate / Professional | 93 | 8.0% |
| Total | 1,168 | 100.0% |
School Enrollment by Age by Funding Source in Thayer County
Out of a total of 1,168 students who are enrolled in schools in Thayer County, 93 (8.0%) attend a private institution, while the remaining 1,075 (92.0%) are enrolled in public schools. The age group of 25 to 34 year olds has the highest likelihood of being enrolled in private schools, with 5 (14.7% in the age bracket) enrolled. Conversely, the age group of 18 to 19 year olds has the lowest likelihood of being enrolled in a private school, with 32 (97.0% in the age bracket) attending a public institution.
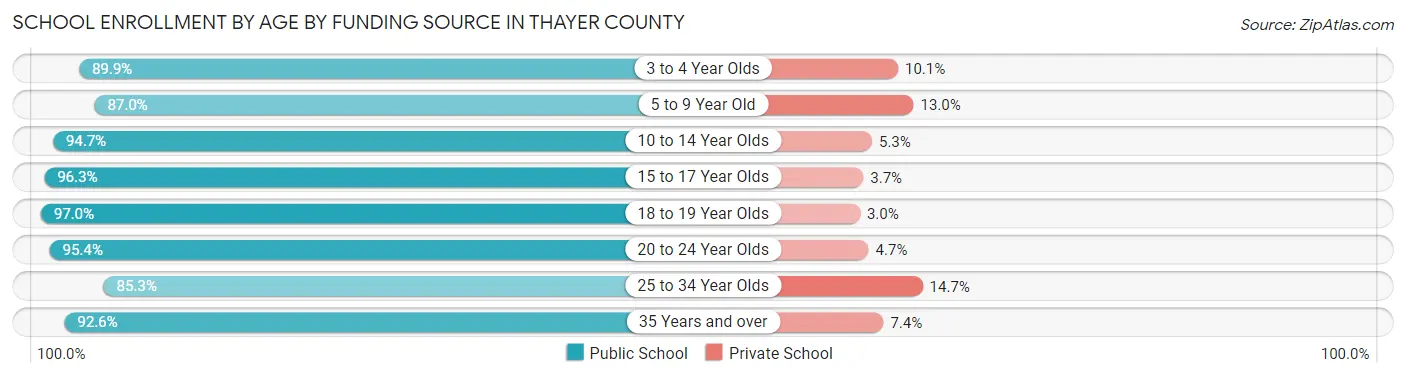
| Age Bracket | Public School | Private School |
| 3 to 4 Year Olds | 71 (89.9%) | 8 (10.1%) |
| 5 to 9 Year Old | 314 (87.0%) | 47 (13.0%) |
| 10 to 14 Year Olds | 287 (94.7%) | 16 (5.3%) |
| 15 to 17 Year Olds | 184 (96.3%) | 7 (3.7%) |
| 18 to 19 Year Olds | 32 (97.0%) | 1 (3.0%) |
| 20 to 24 Year Olds | 82 (95.4%) | 4 (4.6%) |
| 25 to 34 Year Olds | 29 (85.3%) | 5 (14.7%) |
| 35 Years and over | 75 (92.6%) | 6 (7.4%) |
| Total | 1,075 (92.0%) | 93 (8.0%) |
Educational Attainment by Field of Study in Thayer County
Education (266 | 31.0%), bio, nature & agricultural (170 | 19.8%), business (88 | 10.2%), arts & humanities (82 | 9.6%), and science & technology (66 | 7.7%) are the most common fields of study among 859 individuals in Thayer County who have obtained a bachelor's degree or higher.
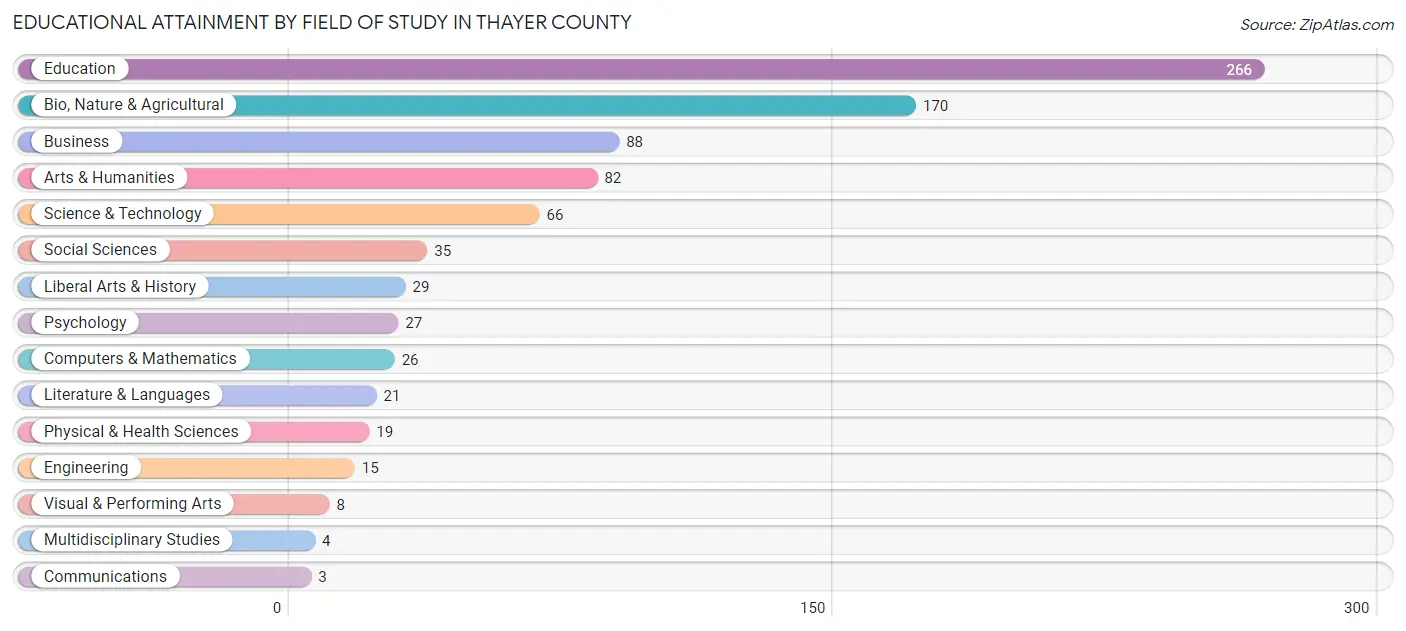
| Field of Study | # Graduates | % Graduates |
| Computers & Mathematics | 26 | 3.0% |
| Bio, Nature & Agricultural | 170 | 19.8% |
| Physical & Health Sciences | 19 | 2.2% |
| Psychology | 27 | 3.1% |
| Social Sciences | 35 | 4.1% |
| Engineering | 15 | 1.8% |
| Multidisciplinary Studies | 4 | 0.5% |
| Science & Technology | 66 | 7.7% |
| Business | 88 | 10.2% |
| Education | 266 | 31.0% |
| Literature & Languages | 21 | 2.4% |
| Liberal Arts & History | 29 | 3.4% |
| Visual & Performing Arts | 8 | 0.9% |
| Communications | 3 | 0.4% |
| Arts & Humanities | 82 | 9.6% |
| Total | 859 | 100.0% |
Transportation & Commute in Thayer County
Vehicle Availability by Sex in Thayer County
The most prevalent vehicle ownership categories in Thayer County are males with 2 vehicles (437, accounting for 34.4%) and females with 2 vehicles (443, making up 38.7%).
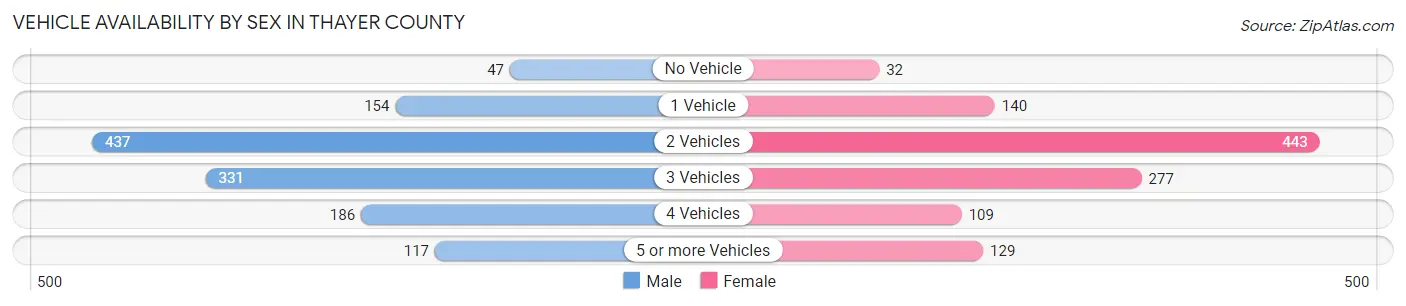
| Vehicles Available | Male | Female |
| No Vehicle | 47 (3.7%) | 32 (2.8%) |
| 1 Vehicle | 154 (12.1%) | 140 (12.4%) |
| 2 Vehicles | 437 (34.4%) | 443 (39.2%) |
| 3 Vehicles | 331 (26.0%) | 277 (24.5%) |
| 4 Vehicles | 186 (14.6%) | 109 (9.7%) |
| 5 or more Vehicles | 117 (9.2%) | 129 (11.4%) |
| Total | 1,272 (100.0%) | 1,130 (100.0%) |
Commute Time in Thayer County
The most frequently occuring commute durations in Thayer County are 5 to 9 minutes (567 commuters, 24.8%), less than 5 minutes (522 commuters, 22.8%), and 15 to 19 minutes (365 commuters, 16.0%).
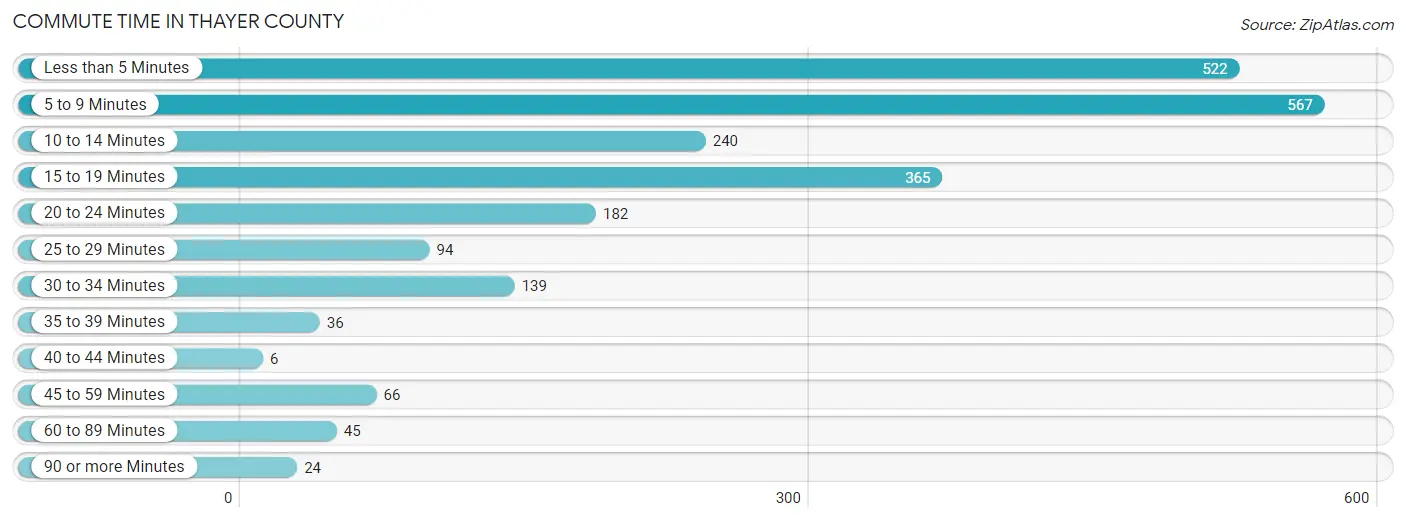
| Commute Time | # Commuters | % Commuters |
| Less than 5 Minutes | 522 | 22.8% |
| 5 to 9 Minutes | 567 | 24.8% |
| 10 to 14 Minutes | 240 | 10.5% |
| 15 to 19 Minutes | 365 | 16.0% |
| 20 to 24 Minutes | 182 | 8.0% |
| 25 to 29 Minutes | 94 | 4.1% |
| 30 to 34 Minutes | 139 | 6.1% |
| 35 to 39 Minutes | 36 | 1.6% |
| 40 to 44 Minutes | 6 | 0.3% |
| 45 to 59 Minutes | 66 | 2.9% |
| 60 to 89 Minutes | 45 | 2.0% |
| 90 or more Minutes | 24 | 1.1% |
Commute Time by Sex in Thayer County
The most common commute times in Thayer County are 5 to 9 minutes (327 commuters, 26.7%) for males and less than 5 minutes (266 commuters, 25.1%) for females.
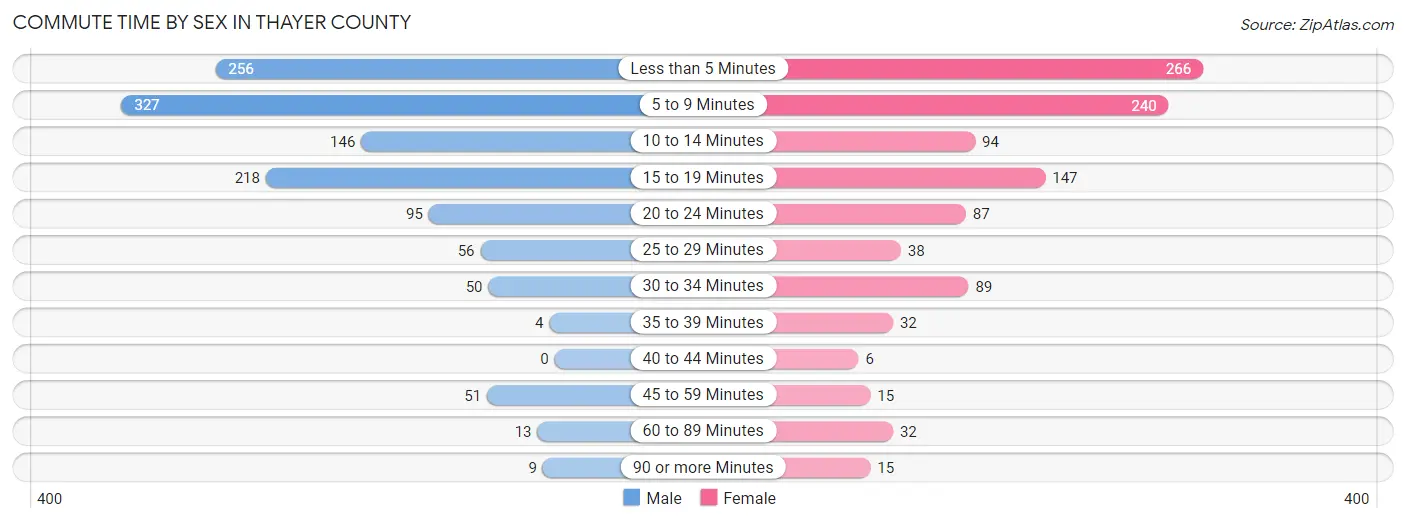
| Commute Time | Male | Female |
| Less than 5 Minutes | 256 (20.9%) | 266 (25.1%) |
| 5 to 9 Minutes | 327 (26.7%) | 240 (22.6%) |
| 10 to 14 Minutes | 146 (11.9%) | 94 (8.9%) |
| 15 to 19 Minutes | 218 (17.8%) | 147 (13.9%) |
| 20 to 24 Minutes | 95 (7.8%) | 87 (8.2%) |
| 25 to 29 Minutes | 56 (4.6%) | 38 (3.6%) |
| 30 to 34 Minutes | 50 (4.1%) | 89 (8.4%) |
| 35 to 39 Minutes | 4 (0.3%) | 32 (3.0%) |
| 40 to 44 Minutes | 0 (0.0%) | 6 (0.6%) |
| 45 to 59 Minutes | 51 (4.2%) | 15 (1.4%) |
| 60 to 89 Minutes | 13 (1.1%) | 32 (3.0%) |
| 90 or more Minutes | 9 (0.7%) | 15 (1.4%) |
Time of Departure to Work by Sex in Thayer County
The most frequent times of departure to work in Thayer County are 7:30 AM to 7:59 AM (326, 26.6%) for males and 7:30 AM to 7:59 AM (268, 25.3%) for females.
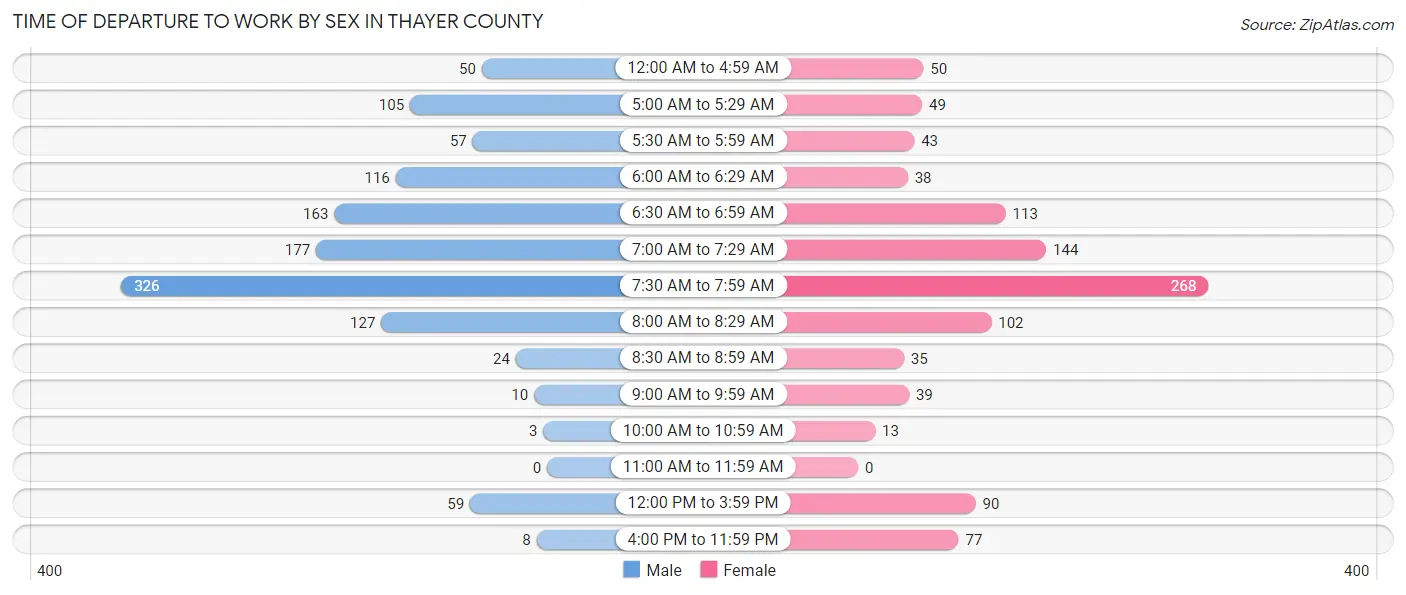
| Time of Departure | Male | Female |
| 12:00 AM to 4:59 AM | 50 (4.1%) | 50 (4.7%) |
| 5:00 AM to 5:29 AM | 105 (8.6%) | 49 (4.6%) |
| 5:30 AM to 5:59 AM | 57 (4.6%) | 43 (4.1%) |
| 6:00 AM to 6:29 AM | 116 (9.5%) | 38 (3.6%) |
| 6:30 AM to 6:59 AM | 163 (13.3%) | 113 (10.6%) |
| 7:00 AM to 7:29 AM | 177 (14.4%) | 144 (13.6%) |
| 7:30 AM to 7:59 AM | 326 (26.6%) | 268 (25.3%) |
| 8:00 AM to 8:29 AM | 127 (10.4%) | 102 (9.6%) |
| 8:30 AM to 8:59 AM | 24 (2.0%) | 35 (3.3%) |
| 9:00 AM to 9:59 AM | 10 (0.8%) | 39 (3.7%) |
| 10:00 AM to 10:59 AM | 3 (0.2%) | 13 (1.2%) |
| 11:00 AM to 11:59 AM | 0 (0.0%) | 0 (0.0%) |
| 12:00 PM to 3:59 PM | 59 (4.8%) | 90 (8.5%) |
| 4:00 PM to 11:59 PM | 8 (0.6%) | 77 (7.3%) |
| Total | 1,225 (100.0%) | 1,061 (100.0%) |
Housing Occupancy in Thayer County
Occupancy by Ownership in Thayer County
Of the total 2,056 dwellings in Thayer County, owner-occupied units account for 1,592 (77.4%), while renter-occupied units make up 464 (22.6%).
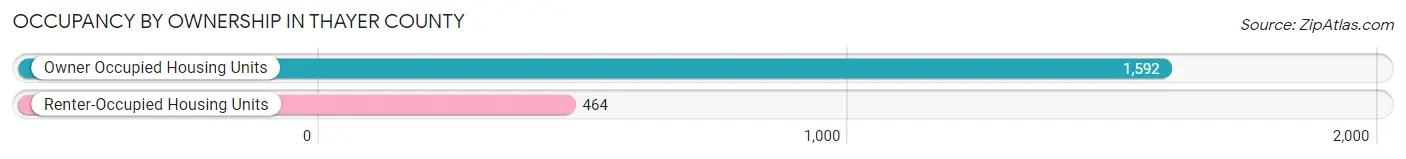
| Occupancy | # Housing Units | % Housing Units |
| Owner Occupied Housing Units | 1,592 | 77.4% |
| Renter-Occupied Housing Units | 464 | 22.6% |
| Total Occupied Housing Units | 2,056 | 100.0% |
Occupancy by Household Size in Thayer County
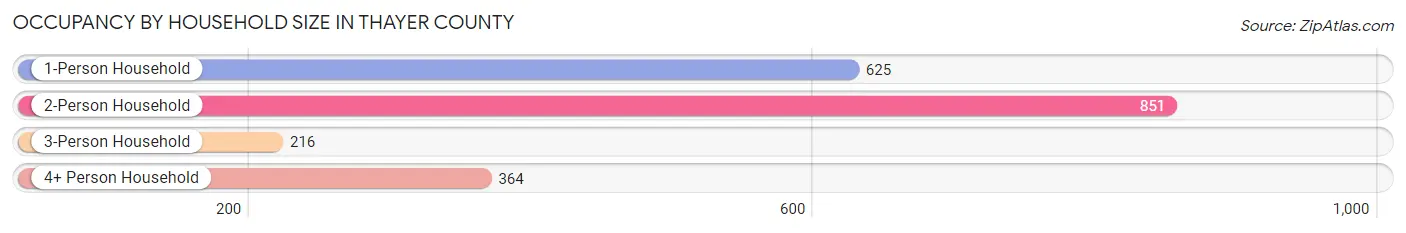
| Household Size | # Housing Units | % Housing Units |
| 1-Person Household | 625 | 30.4% |
| 2-Person Household | 851 | 41.4% |
| 3-Person Household | 216 | 10.5% |
| 4+ Person Household | 364 | 17.7% |
| Total Housing Units | 2,056 | 100.0% |
Occupancy by Ownership by Household Size in Thayer County
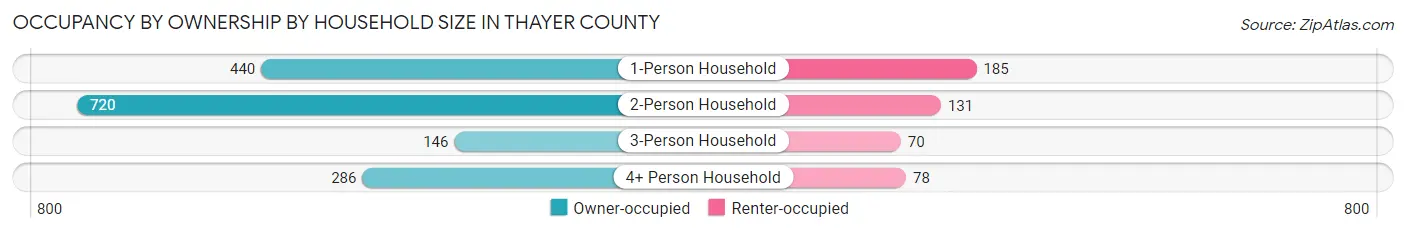
| Household Size | Owner-occupied | Renter-occupied |
| 1-Person Household | 440 (70.4%) | 185 (29.6%) |
| 2-Person Household | 720 (84.6%) | 131 (15.4%) |
| 3-Person Household | 146 (67.6%) | 70 (32.4%) |
| 4+ Person Household | 286 (78.6%) | 78 (21.4%) |
| Total Housing Units | 1,592 (77.4%) | 464 (22.6%) |
Occupancy by Educational Attainment in Thayer County
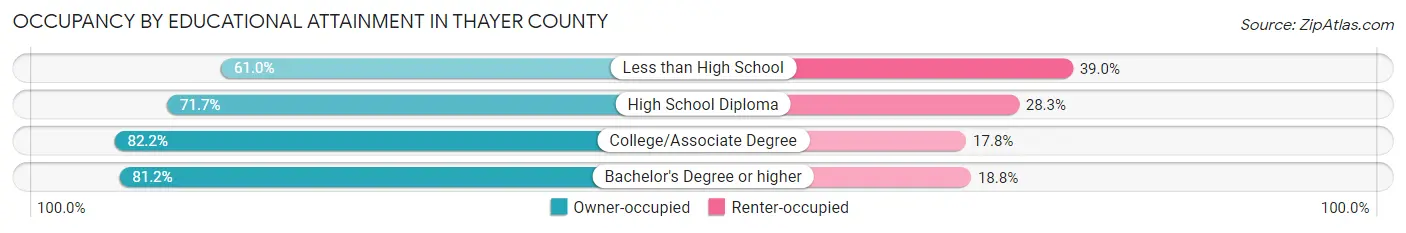
| Household Size | Owner-occupied | Renter-occupied |
| Less than High School | 83 (61.0%) | 53 (39.0%) |
| High School Diploma | 439 (71.7%) | 173 (28.3%) |
| College/Associate Degree | 677 (82.2%) | 147 (17.8%) |
| Bachelor's Degree or higher | 393 (81.2%) | 91 (18.8%) |
Occupancy by Age of Householder in Thayer County
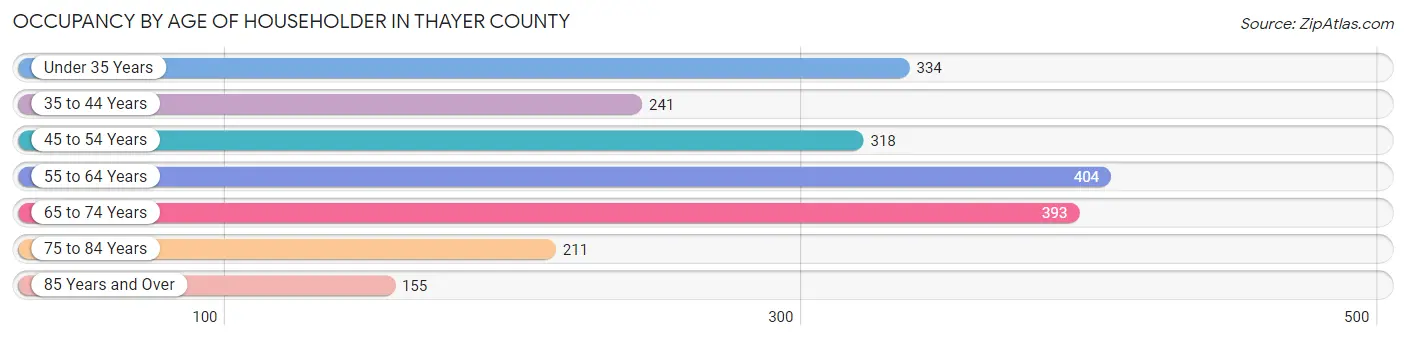
| Age Bracket | # Households | % Households |
| Under 35 Years | 334 | 16.3% |
| 35 to 44 Years | 241 | 11.7% |
| 45 to 54 Years | 318 | 15.5% |
| 55 to 64 Years | 404 | 19.7% |
| 65 to 74 Years | 393 | 19.1% |
| 75 to 84 Years | 211 | 10.3% |
| 85 Years and Over | 155 | 7.5% |
| Total | 2,056 | 100.0% |
Housing Finances in Thayer County
Median Income by Occupancy in Thayer County
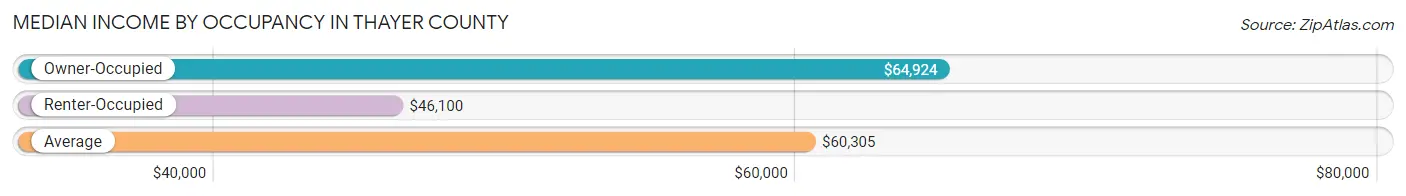
| Occupancy Type | # Households | Median Income |
| Owner-Occupied | 1,592 (77.4%) | $64,924 |
| Renter-Occupied | 464 (22.6%) | $46,100 |
| Average | 2,056 (100.0%) | $60,305 |
Occupancy by Householder Income Bracket in Thayer County
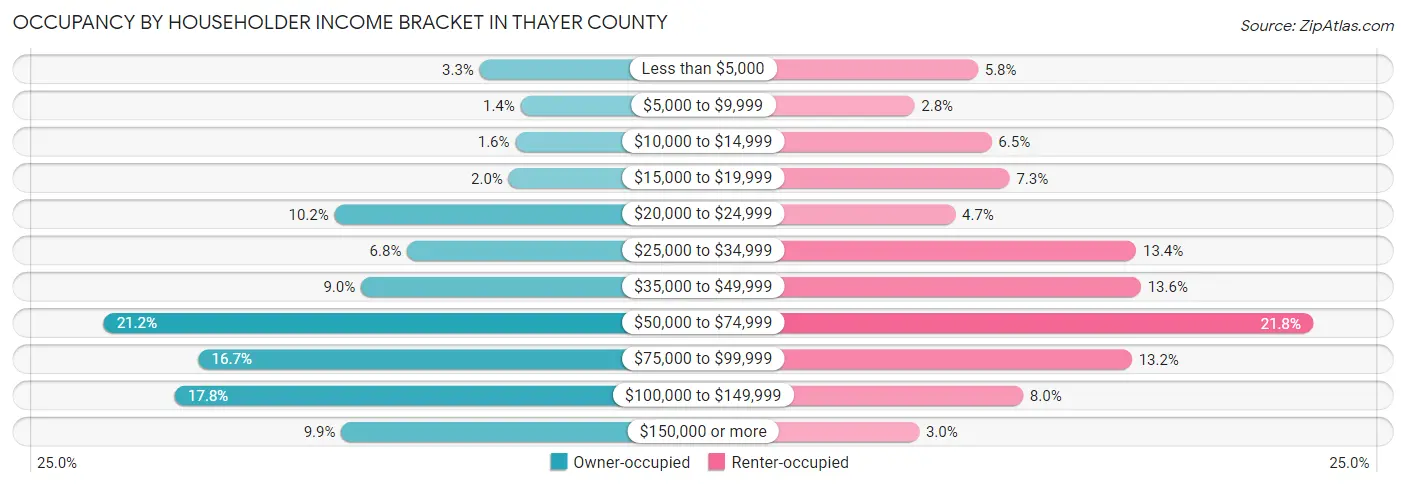
| Income Bracket | Owner-occupied | Renter-occupied |
| Less than $5,000 | 53 (3.3%) | 27 (5.8%) |
| $5,000 to $9,999 | 22 (1.4%) | 13 (2.8%) |
| $10,000 to $14,999 | 26 (1.6%) | 30 (6.5%) |
| $15,000 to $19,999 | 31 (1.9%) | 34 (7.3%) |
| $20,000 to $24,999 | 163 (10.2%) | 22 (4.7%) |
| $25,000 to $34,999 | 108 (6.8%) | 62 (13.4%) |
| $35,000 to $49,999 | 143 (9.0%) | 63 (13.6%) |
| $50,000 to $74,999 | 338 (21.2%) | 101 (21.8%) |
| $75,000 to $99,999 | 266 (16.7%) | 61 (13.2%) |
| $100,000 to $149,999 | 284 (17.8%) | 37 (8.0%) |
| $150,000 or more | 158 (9.9%) | 14 (3.0%) |
| Total | 1,592 (100.0%) | 464 (100.0%) |
Monthly Housing Cost Tiers in Thayer County
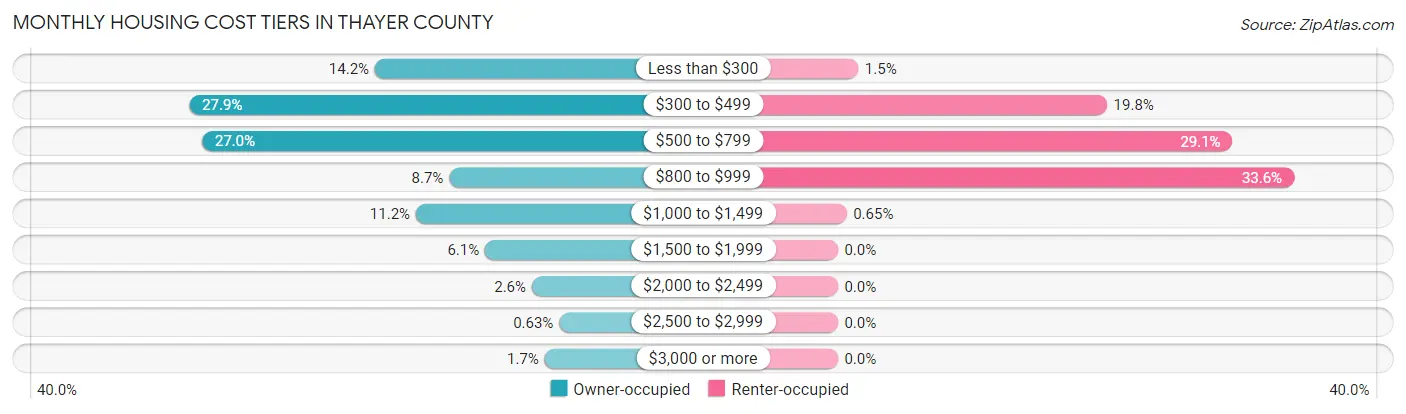
| Monthly Cost | Owner-occupied | Renter-occupied |
| Less than $300 | 226 (14.2%) | 7 (1.5%) |
| $300 to $499 | 444 (27.9%) | 92 (19.8%) |
| $500 to $799 | 429 (27.0%) | 135 (29.1%) |
| $800 to $999 | 139 (8.7%) | 156 (33.6%) |
| $1,000 to $1,499 | 178 (11.2%) | 3 (0.6%) |
| $1,500 to $1,999 | 97 (6.1%) | 0 (0.0%) |
| $2,000 to $2,499 | 42 (2.6%) | 0 (0.0%) |
| $2,500 to $2,999 | 10 (0.6%) | 0 (0.0%) |
| $3,000 or more | 27 (1.7%) | 0 (0.0%) |
| Total | 1,592 (100.0%) | 464 (100.0%) |
Physical Housing Characteristics in Thayer County
Housing Structures in Thayer County
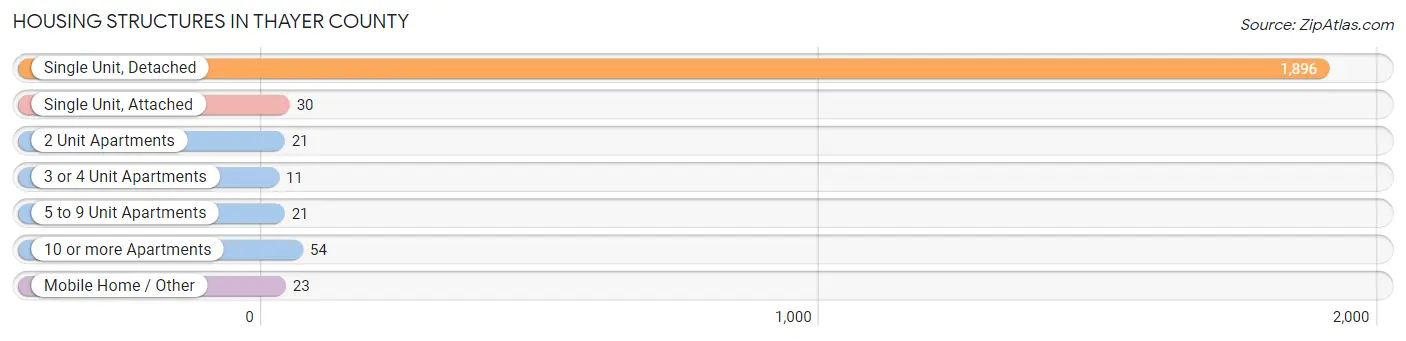
| Structure Type | # Housing Units | % Housing Units |
| Single Unit, Detached | 1,896 | 92.2% |
| Single Unit, Attached | 30 | 1.5% |
| 2 Unit Apartments | 21 | 1.0% |
| 3 or 4 Unit Apartments | 11 | 0.5% |
| 5 to 9 Unit Apartments | 21 | 1.0% |
| 10 or more Apartments | 54 | 2.6% |
| Mobile Home / Other | 23 | 1.1% |
| Total | 2,056 | 100.0% |
Housing Structures by Occupancy in Thayer County
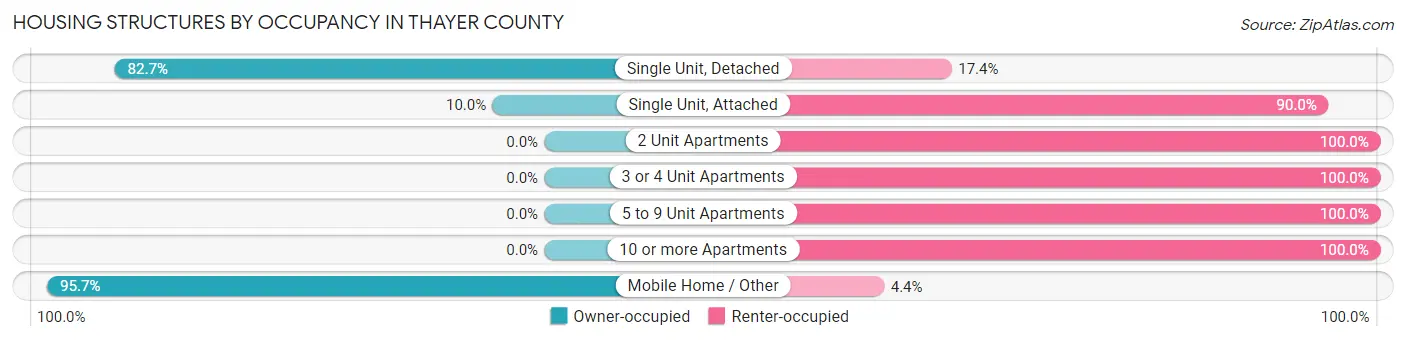
| Structure Type | Owner-occupied | Renter-occupied |
| Single Unit, Detached | 1,567 (82.7%) | 329 (17.3%) |
| Single Unit, Attached | 3 (10.0%) | 27 (90.0%) |
| 2 Unit Apartments | 0 (0.0%) | 21 (100.0%) |
| 3 or 4 Unit Apartments | 0 (0.0%) | 11 (100.0%) |
| 5 to 9 Unit Apartments | 0 (0.0%) | 21 (100.0%) |
| 10 or more Apartments | 0 (0.0%) | 54 (100.0%) |
| Mobile Home / Other | 22 (95.7%) | 1 (4.3%) |
| Total | 1,592 (77.4%) | 464 (22.6%) |
Housing Structures by Number of Rooms in Thayer County
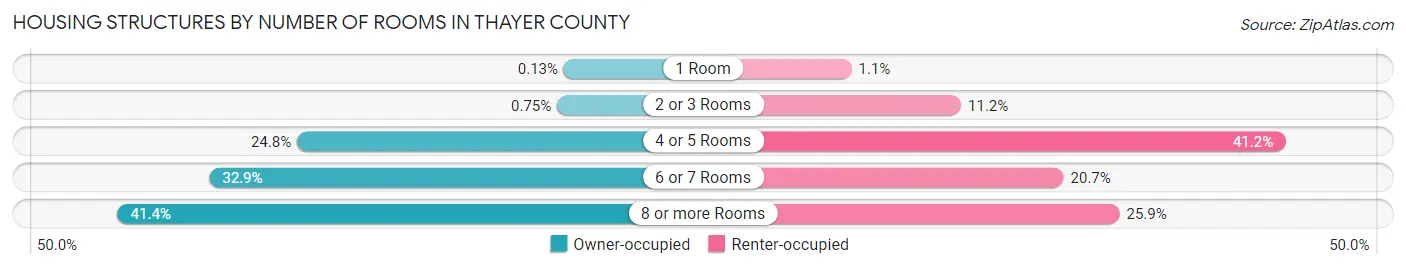
| Number of Rooms | Owner-occupied | Renter-occupied |
| 1 Room | 2 (0.1%) | 5 (1.1%) |
| 2 or 3 Rooms | 12 (0.7%) | 52 (11.2%) |
| 4 or 5 Rooms | 395 (24.8%) | 191 (41.2%) |
| 6 or 7 Rooms | 524 (32.9%) | 96 (20.7%) |
| 8 or more Rooms | 659 (41.4%) | 120 (25.9%) |
| Total | 1,592 (100.0%) | 464 (100.0%) |
Housing Structure by Heating Type in Thayer County
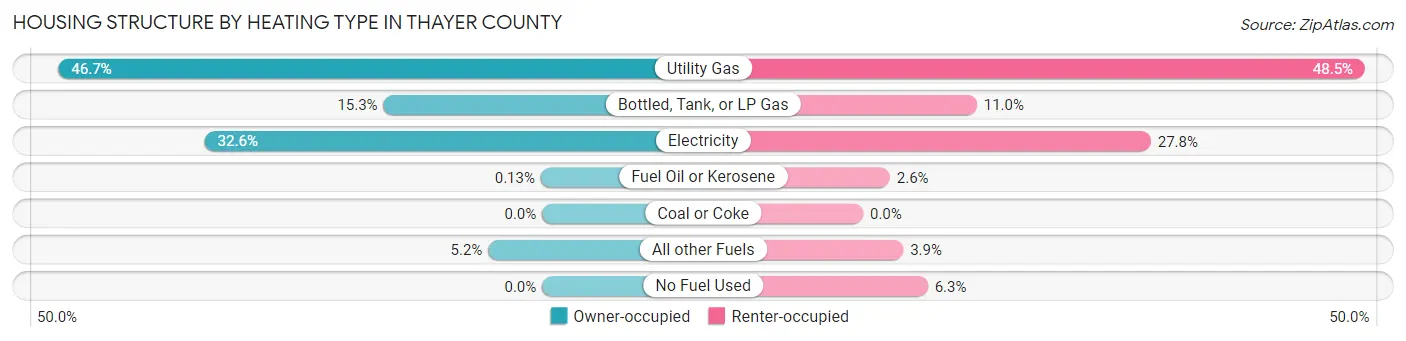
| Heating Type | Owner-occupied | Renter-occupied |
| Utility Gas | 744 (46.7%) | 225 (48.5%) |
| Bottled, Tank, or LP Gas | 244 (15.3%) | 51 (11.0%) |
| Electricity | 519 (32.6%) | 129 (27.8%) |
| Fuel Oil or Kerosene | 2 (0.1%) | 12 (2.6%) |
| Coal or Coke | 0 (0.0%) | 0 (0.0%) |
| All other Fuels | 83 (5.2%) | 18 (3.9%) |
| No Fuel Used | 0 (0.0%) | 29 (6.2%) |
| Total | 1,592 (100.0%) | 464 (100.0%) |
Household Vehicle Usage in Thayer County
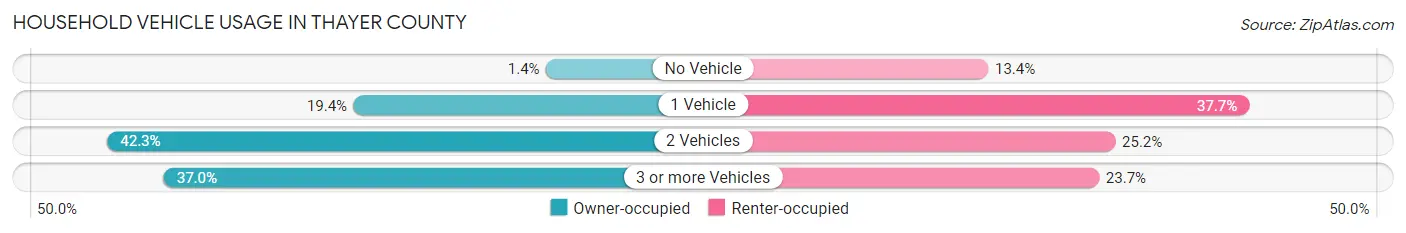
| Vehicles per Household | Owner-occupied | Renter-occupied |
| No Vehicle | 22 (1.4%) | 62 (13.4%) |
| 1 Vehicle | 308 (19.4%) | 175 (37.7%) |
| 2 Vehicles | 673 (42.3%) | 117 (25.2%) |
| 3 or more Vehicles | 589 (37.0%) | 110 (23.7%) |
| Total | 1,592 (100.0%) | 464 (100.0%) |
Real Estate & Mortgages in Thayer County
Real Estate and Mortgage Overview in Thayer County
| Characteristic | Without Mortgage | With Mortgage |
| Housing Units | 1,032 | 560 |
| Median Property Value | $83,300 | $108,700 |
| Median Household Income | $57,197 | $68 |
| Monthly Housing Costs | $447 | $27 |
| Real Estate Taxes | $983 | $13 |
Property Value by Mortgage Status in Thayer County
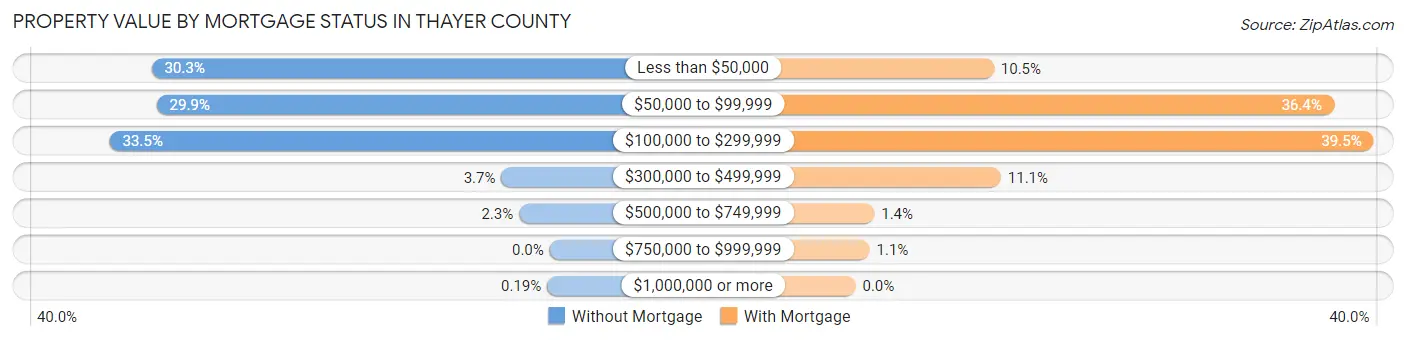
| Property Value | Without Mortgage | With Mortgage |
| Less than $50,000 | 313 (30.3%) | 59 (10.5%) |
| $50,000 to $99,999 | 309 (29.9%) | 204 (36.4%) |
| $100,000 to $299,999 | 346 (33.5%) | 221 (39.5%) |
| $300,000 to $499,999 | 38 (3.7%) | 62 (11.1%) |
| $500,000 to $749,999 | 24 (2.3%) | 8 (1.4%) |
| $750,000 to $999,999 | 0 (0.0%) | 6 (1.1%) |
| $1,000,000 or more | 2 (0.2%) | 0 (0.0%) |
| Total | 1,032 (100.0%) | 560 (100.0%) |
Household Income by Mortgage Status in Thayer County
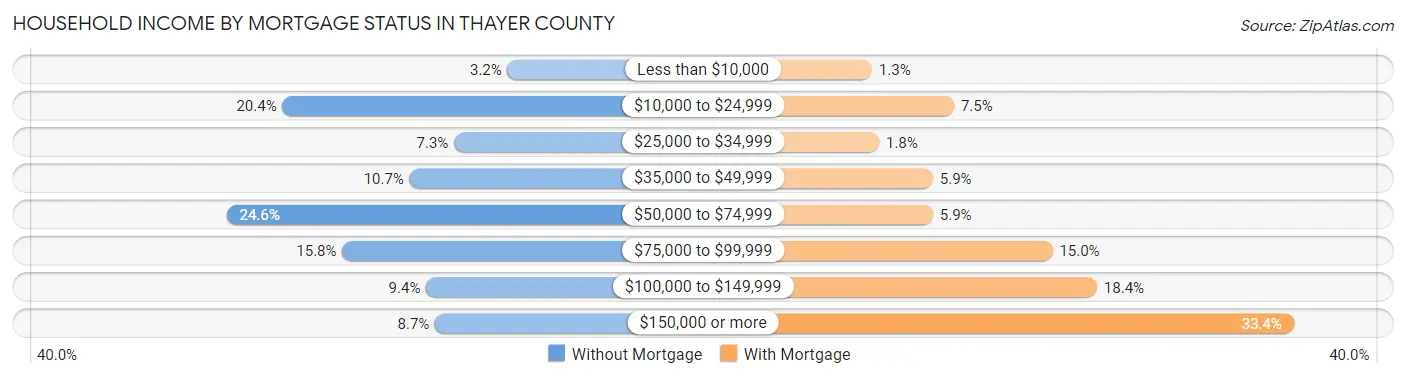
| Household Income | Without Mortgage | With Mortgage |
| Less than $10,000 | 33 (3.2%) | 7 (1.3%) |
| $10,000 to $24,999 | 210 (20.3%) | 42 (7.5%) |
| $25,000 to $34,999 | 75 (7.3%) | 10 (1.8%) |
| $35,000 to $49,999 | 110 (10.7%) | 33 (5.9%) |
| $50,000 to $74,999 | 254 (24.6%) | 33 (5.9%) |
| $75,000 to $99,999 | 163 (15.8%) | 84 (15.0%) |
| $100,000 to $149,999 | 97 (9.4%) | 103 (18.4%) |
| $150,000 or more | 90 (8.7%) | 187 (33.4%) |
| Total | 1,032 (100.0%) | 560 (100.0%) |
Property Value to Household Income Ratio in Thayer County
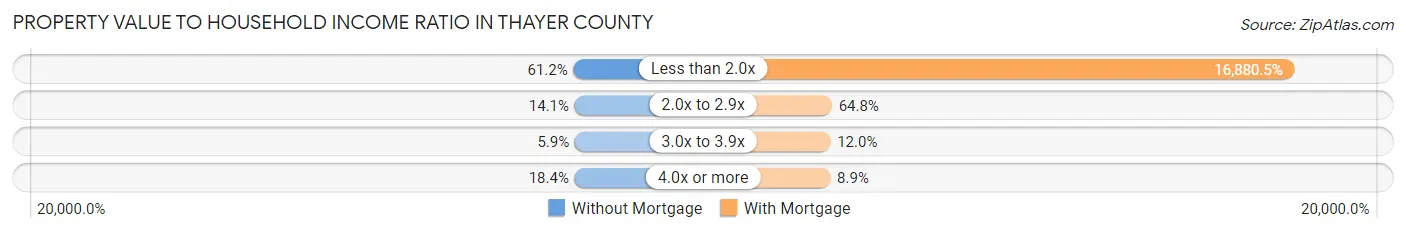
| Value-to-Income Ratio | Without Mortgage | With Mortgage |
| Less than 2.0x | 632 (61.2%) | 94,531 (16,880.5%) |
| 2.0x to 2.9x | 145 (14.1%) | 363 (64.8%) |
| 3.0x to 3.9x | 61 (5.9%) | 67 (12.0%) |
| 4.0x or more | 190 (18.4%) | 50 (8.9%) |
| Total | 1,032 (100.0%) | 560 (100.0%) |
Real Estate Taxes by Mortgage Status in Thayer County
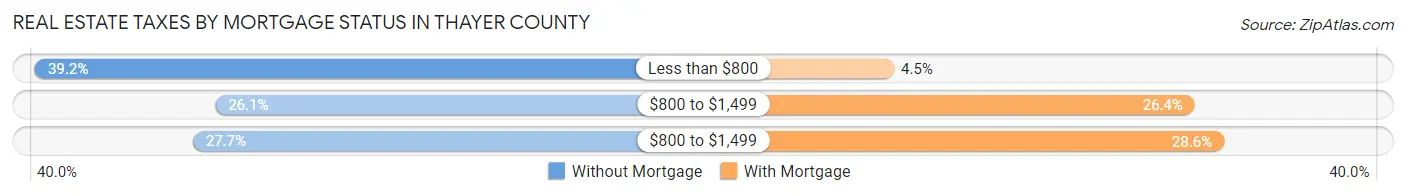
| Property Taxes | Without Mortgage | With Mortgage |
| Less than $800 | 405 (39.2%) | 25 (4.5%) |
| $800 to $1,499 | 269 (26.1%) | 148 (26.4%) |
| $800 to $1,499 | 286 (27.7%) | 160 (28.6%) |
| Total | 1,032 (100.0%) | 560 (100.0%) |
Health & Disability in Thayer County
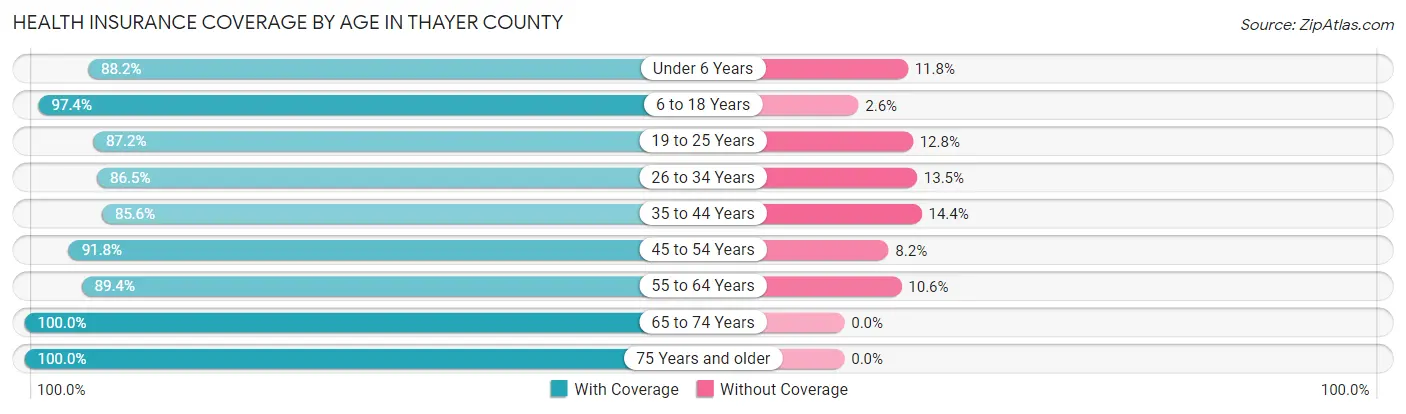
Health Insurance Coverage by Age in Thayer County
| Age Bracket | With Coverage | Without Coverage |
| Under 6 Years | 328 (88.2%) | 44 (11.8%) |
| 6 to 18 Years | 818 (97.4%) | 22 (2.6%) |
| 19 to 25 Years | 294 (87.2%) | 43 (12.8%) |
| 26 to 34 Years | 358 (86.5%) | 56 (13.5%) |
| 35 to 44 Years | 416 (85.6%) | 70 (14.4%) |
| 45 to 54 Years | 513 (91.8%) | 46 (8.2%) |
| 55 to 64 Years | 630 (89.4%) | 75 (10.6%) |
| 65 to 74 Years | 666 (100.0%) | 0 (0.0%) |
| 75 Years and older | 503 (100.0%) | 0 (0.0%) |
| Total | 4,526 (92.7%) | 356 (7.3%) |
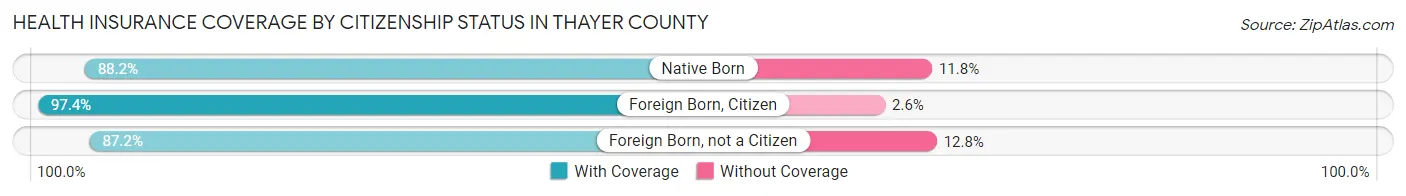
Health Insurance Coverage by Citizenship Status in Thayer County
| Citizenship Status | With Coverage | Without Coverage |
| Native Born | 328 (88.2%) | 44 (11.8%) |
| Foreign Born, Citizen | 818 (97.4%) | 22 (2.6%) |
| Foreign Born, not a Citizen | 294 (87.2%) | 43 (12.8%) |
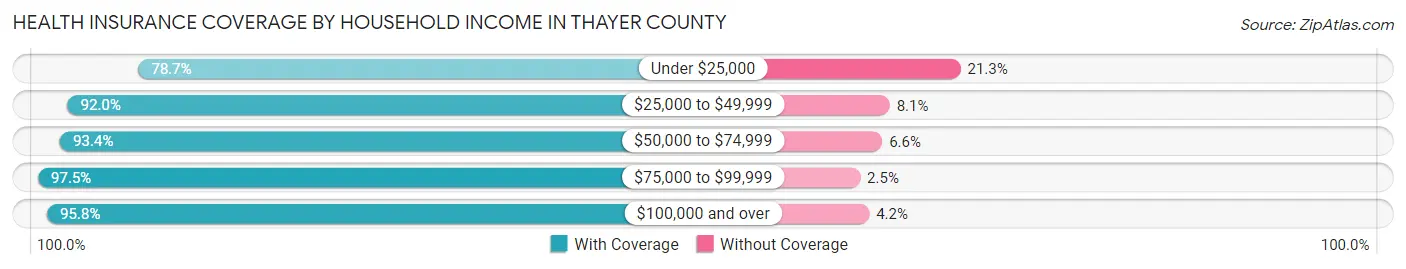
Health Insurance Coverage by Household Income in Thayer County
| Household Income | With Coverage | Without Coverage |
| Under $25,000 | 517 (78.7%) | 140 (21.3%) |
| $25,000 to $49,999 | 708 (91.9%) | 62 (8.1%) |
| $50,000 to $74,999 | 914 (93.4%) | 65 (6.6%) |
| $75,000 to $99,999 | 897 (97.5%) | 23 (2.5%) |
| $100,000 and over | 1,482 (95.8%) | 65 (4.2%) |
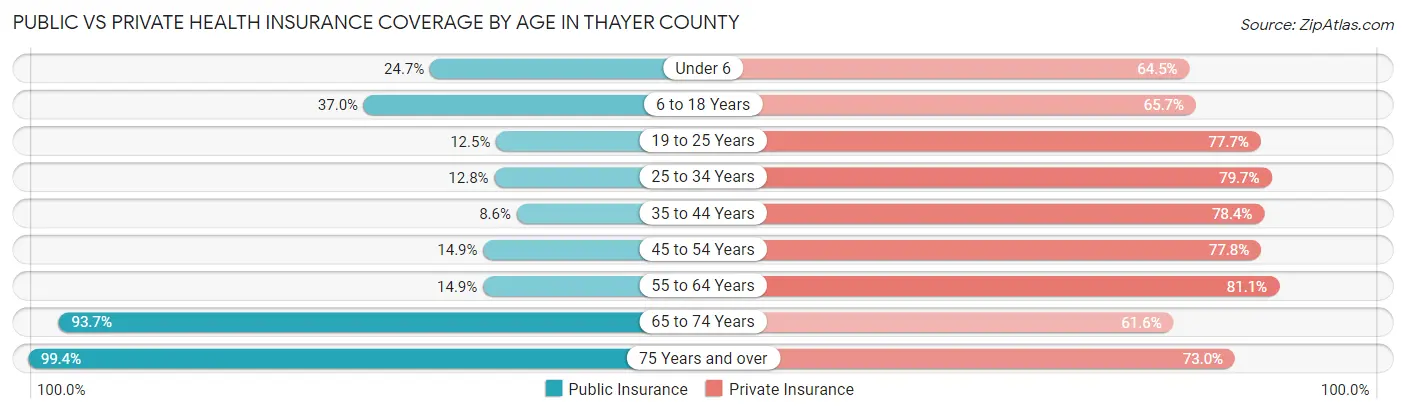
Public vs Private Health Insurance Coverage by Age in Thayer County
| Age Bracket | Public Insurance | Private Insurance |
| Under 6 | 92 (24.7%) | 240 (64.5%) |
| 6 to 18 Years | 311 (37.0%) | 552 (65.7%) |
| 19 to 25 Years | 42 (12.5%) | 262 (77.7%) |
| 25 to 34 Years | 53 (12.8%) | 330 (79.7%) |
| 35 to 44 Years | 42 (8.6%) | 381 (78.4%) |
| 45 to 54 Years | 83 (14.8%) | 435 (77.8%) |
| 55 to 64 Years | 105 (14.9%) | 572 (81.1%) |
| 65 to 74 Years | 624 (93.7%) | 410 (61.6%) |
| 75 Years and over | 500 (99.4%) | 367 (73.0%) |
| Total | 1,852 (37.9%) | 3,549 (72.7%) |
Disability Status by Sex by Age in Thayer County
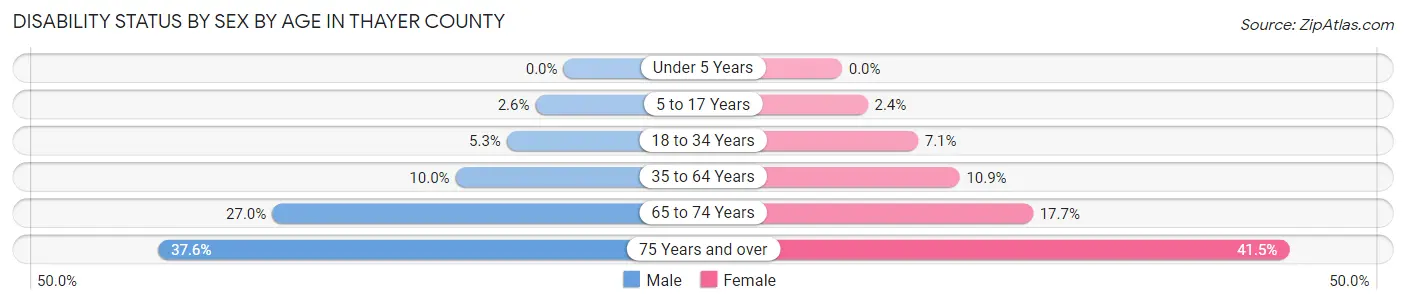
| Age Bracket | Male | Female |
| Under 5 Years | 0 (0.0%) | 0 (0.0%) |
| 5 to 17 Years | 11 (2.6%) | 11 (2.4%) |
| 18 to 34 Years | 22 (5.3%) | 27 (7.0%) |
| 35 to 64 Years | 90 (10.0%) | 93 (10.9%) |
| 65 to 74 Years | 90 (27.0%) | 59 (17.7%) |
| 75 Years and over | 85 (37.6%) | 115 (41.5%) |
Disability Class by Sex by Age in Thayer County
Disability Class: Hearing Difficulty
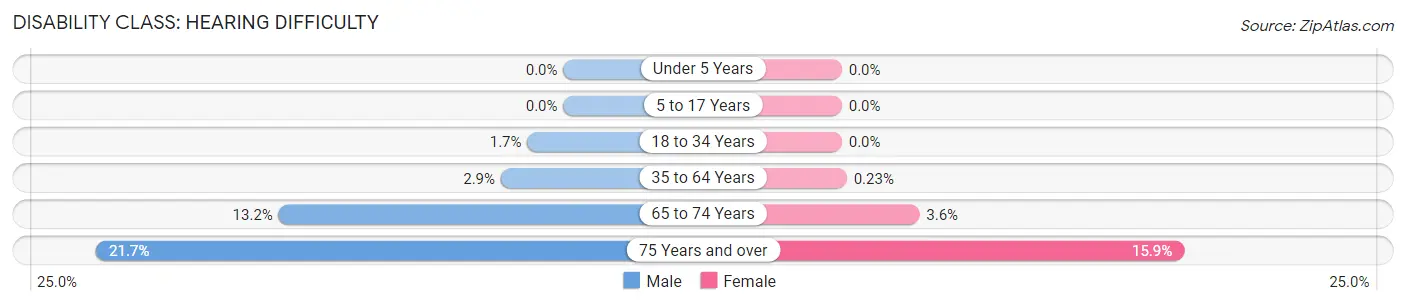
| Age Bracket | Male | Female |
| Under 5 Years | 0 (0.0%) | 0 (0.0%) |
| 5 to 17 Years | 0 (0.0%) | 0 (0.0%) |
| 18 to 34 Years | 7 (1.7%) | 0 (0.0%) |
| 35 to 64 Years | 26 (2.9%) | 2 (0.2%) |
| 65 to 74 Years | 44 (13.2%) | 12 (3.6%) |
| 75 Years and over | 49 (21.7%) | 44 (15.9%) |
Disability Class: Vision Difficulty
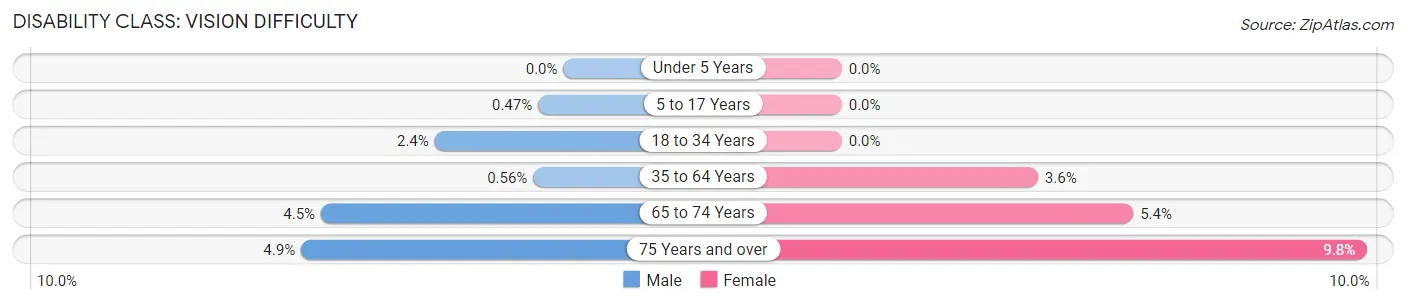
| Age Bracket | Male | Female |
| Under 5 Years | 0 (0.0%) | 0 (0.0%) |
| 5 to 17 Years | 2 (0.5%) | 0 (0.0%) |
| 18 to 34 Years | 10 (2.4%) | 0 (0.0%) |
| 35 to 64 Years | 5 (0.6%) | 31 (3.6%) |
| 65 to 74 Years | 15 (4.5%) | 18 (5.4%) |
| 75 Years and over | 11 (4.9%) | 27 (9.8%) |
Disability Class: Cognitive Difficulty
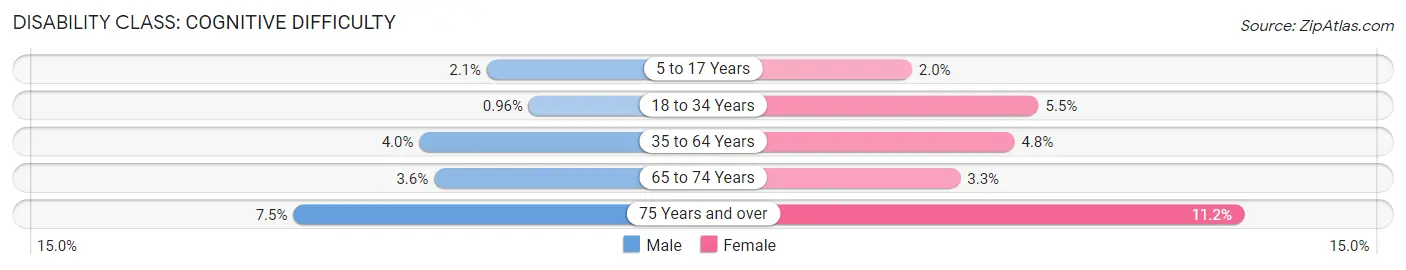
| Age Bracket | Male | Female |
| 5 to 17 Years | 9 (2.1%) | 9 (1.9%) |
| 18 to 34 Years | 4 (1.0%) | 21 (5.5%) |
| 35 to 64 Years | 36 (4.0%) | 41 (4.8%) |
| 65 to 74 Years | 12 (3.6%) | 11 (3.3%) |
| 75 Years and over | 17 (7.5%) | 31 (11.2%) |
Disability Class: Ambulatory Difficulty
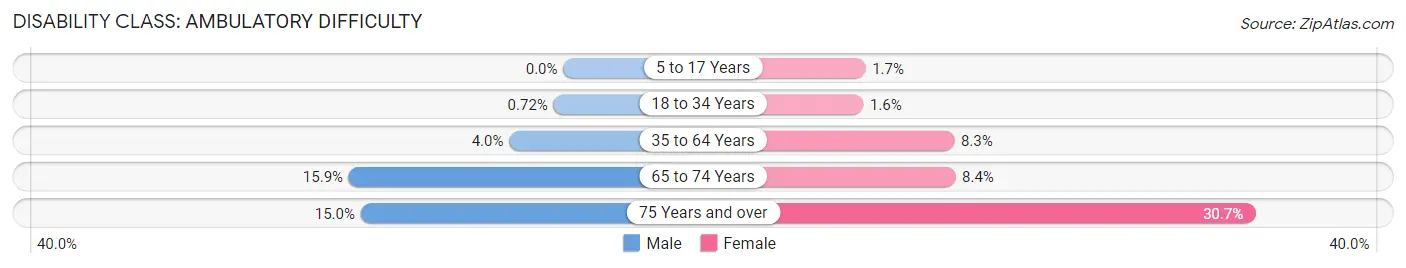
| Age Bracket | Male | Female |
| 5 to 17 Years | 0 (0.0%) | 8 (1.7%) |
| 18 to 34 Years | 3 (0.7%) | 6 (1.6%) |
| 35 to 64 Years | 36 (4.0%) | 71 (8.3%) |
| 65 to 74 Years | 53 (15.9%) | 28 (8.4%) |
| 75 Years and over | 34 (15.0%) | 85 (30.7%) |
Disability Class: Self-Care Difficulty
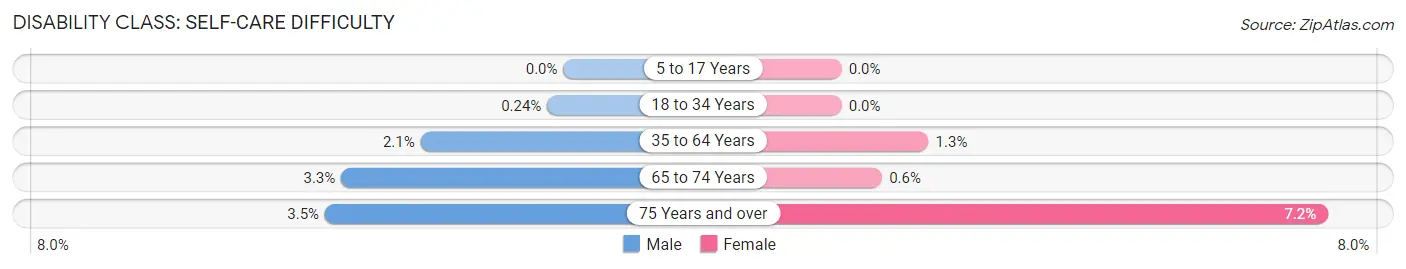
| Age Bracket | Male | Female |
| 5 to 17 Years | 0 (0.0%) | 0 (0.0%) |
| 18 to 34 Years | 1 (0.2%) | 0 (0.0%) |
| 35 to 64 Years | 19 (2.1%) | 11 (1.3%) |
| 65 to 74 Years | 11 (3.3%) | 2 (0.6%) |
| 75 Years and over | 8 (3.5%) | 20 (7.2%) |
Technology Access in Thayer County
Computing Device Access in Thayer County
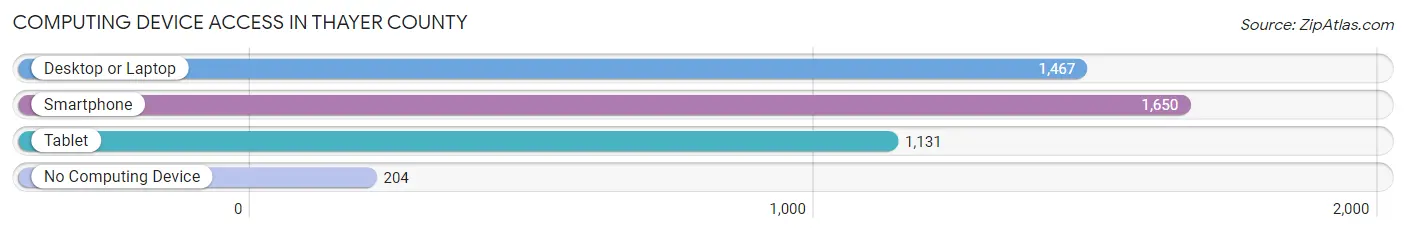
| Device Type | # Households | % Households |
| Desktop or Laptop | 1,467 | 71.4% |
| Smartphone | 1,650 | 80.2% |
| Tablet | 1,131 | 55.0% |
| No Computing Device | 204 | 9.9% |
| Total | 2,056 | 100.0% |
Internet Access in Thayer County
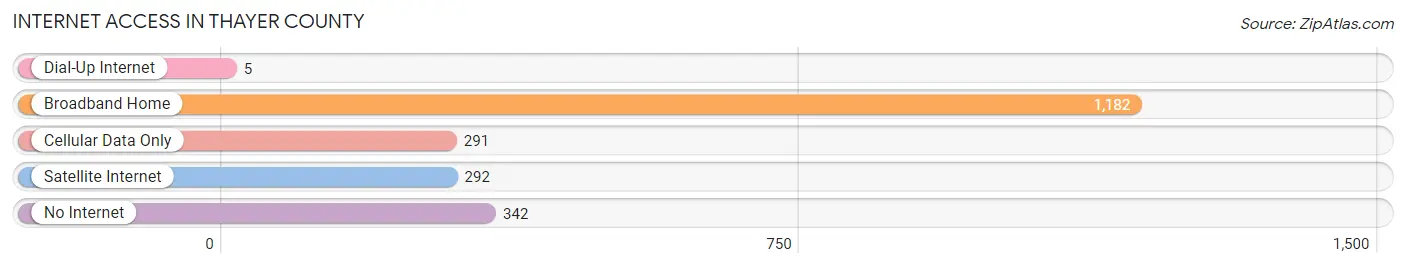
| Internet Type | # Households | % Households |
| Dial-Up Internet | 5 | 0.2% |
| Broadband Home | 1,182 | 57.5% |
| Cellular Data Only | 291 | 14.1% |
| Satellite Internet | 292 | 14.2% |
| No Internet | 342 | 16.6% |
| Total | 2,056 | 100.0% |
Thayer County Summary
Thayer County is located in the southeastern corner of Nebraska, and is bordered by the states of Kansas and Missouri. It is part of the Nebraska Panhandle, and is the only county in the state that is completely surrounded by other states. The county seat is Hebron, and the largest city is Deshler. The county was named after General John Milton Thayer, a Union Army officer during the Civil War.
Geography
Thayer County covers an area of 576 square miles, and is mostly rural. The terrain is mostly flat, with some rolling hills in the northern part of the county. The county is drained by the Little Blue River, which flows through the county from north to south. The county is also home to several small lakes, including Lake McConaughy, which is the largest lake in Nebraska.
The climate of Thayer County is generally temperate, with hot summers and cold winters. The average annual temperature is around 50 degrees Fahrenheit, and the average annual precipitation is around 25 inches.
Demographics
As of the 2010 census, there were 5,228 people, 2,068 households, and 1,427 families living in Thayer County. The population density was 9 people per square mile. The racial makeup of the county was 97.3% White, 0.3% African American, 0.3% Native American, 0.2% Asian, 0.1% Pacific Islander, 0.7% from other races, and 0.9% from two or more races. Hispanic or Latino of any race were 1.7% of the population.
The median income for a household in Thayer County was $41,944, and the median income for a family was $50,938. The per capita income for the county was $20,845. About 8.2% of families and 11.2% of the population were below the poverty line, including 14.2% of those under age 18 and 8.2% of those age 65 or over.
Economy
The economy of Thayer County is largely based on agriculture. The county is home to several large farms, and the main crops grown in the area are corn, soybeans, and wheat. The county is also home to several small businesses, including a few restaurants, a few retail stores, and a few manufacturing companies.
The county is also home to several tourist attractions, including the Thayer County Museum, the Thayer County Historical Society, and the Thayer County Fairgrounds. The county is also home to several parks, including the Thayer County State Recreation Area, which offers camping, fishing, and hiking opportunities.
Conclusion
Thayer County is a rural county located in the southeastern corner of Nebraska. It is bordered by the states of Kansas and Missouri, and is the only county in the state that is completely surrounded by other states. The county is home to several large farms, and the main crops grown in the area are corn, soybeans, and wheat. The county is also home to several small businesses, tourist attractions, and parks. The population of the county is largely white, and the median income for a household is around $41,944.
Common Questions
What is Per Capita Income in Thayer County?
Per Capita income in Thayer County is $32,028.
What is the Median Family Income in Thayer County?
Median Family Income in Thayer County is $74,583.
What is the Median Household income in Thayer County?
Median Household Income in Thayer County is $60,305.
What is Income or Wage Gap in Thayer County?
Income or Wage Gap in Thayer County is 45.0%.
Women in Thayer County earn 55.0 cents for every dollar earned by a man.
What is Family Income Deficit in Thayer County?
Family Income Deficit in Thayer County is $10,090.
Families that are below poverty line in Thayer County earn $10,090 less on average than the poverty threshold level.
What is Inequality or Gini Index in Thayer County?
Inequality or Gini Index in Thayer County is 0.43.
What is the Total Population of Thayer County?
Total Population of Thayer County is 5,006.
What is the Total Male Population of Thayer County?
Total Male Population of Thayer County is 2,474.
What is the Total Female Population of Thayer County?
Total Female Population of Thayer County is 2,532.
What is the Ratio of Males per 100 Females in Thayer County?
There are 97.71 Males per 100 Females in Thayer County.
What is the Ratio of Females per 100 Males in Thayer County?
There are 102.34 Females per 100 Males in Thayer County.
What is the Median Population Age in Thayer County?
Median Population Age in Thayer County is 45.9 Years.
What is the Average Family Size in Thayer County
Average Family Size in Thayer County is 3.0 People.
What is the Average Household Size in Thayer County
Average Household Size in Thayer County is 2.4 People.
How Large is the Labor Force in Thayer County?
There are 2,520 People in the Labor Forcein in Thayer County.
What is the Percentage of People in the Labor Force in Thayer County?
62.9% of People are in the Labor Force in Thayer County.
What is the Unemployment Rate in Thayer County?
Unemployment Rate in Thayer County is 3.2%.