Sheridan County, NE Map & Demographics
Sheridan County Map
Sheridan County Overview
$31,699
PER CAPITA INCOME
$67,454
AVG FAMILY INCOME
$53,609
AVG HOUSEHOLD INCOME
43.1%
WAGE / INCOME GAP [ % ]
56.9¢/ $1
WAGE / INCOME GAP [ $ ]
0.44
INEQUALITY / GINI INDEX
5,102
TOTAL POPULATION
2,558
MALE POPULATION
2,544
FEMALE POPULATION
100.55
MALES / 100 FEMALES
99.45
FEMALES / 100 MALES
45.8
MEDIAN AGE
2.8
AVG FAMILY SIZE
2.4
AVG HOUSEHOLD SIZE
2,454
LABOR FORCE [ PEOPLE ]
59.4%
PERCENT IN LABOR FORCE
2.2%
UNEMPLOYMENT RATE
Sheridan County Area Codes
Income in Sheridan County
Income Overview in Sheridan County
Per Capita Income in Sheridan County is $31,699, while median incomes of families and households are $67,454 and $53,609 respectively.
| Characteristic | Number | Measure |
| Per Capita Income | 5,102 | $31,699 |
| Median Family Income | 1,414 | $67,454 |
| Mean Family Income | 1,414 | $88,816 |
| Median Household Income | 2,101 | $53,609 |
| Mean Household Income | 2,101 | $73,631 |
| Income Deficit | 1,414 | $0 |
| Wage / Income Gap (%) | 5,102 | 43.12% |
| Wage / Income Gap ($) | 5,102 | 56.88¢ per $1 |
| Gini / Inequality Index | 5,102 | 0.44 |
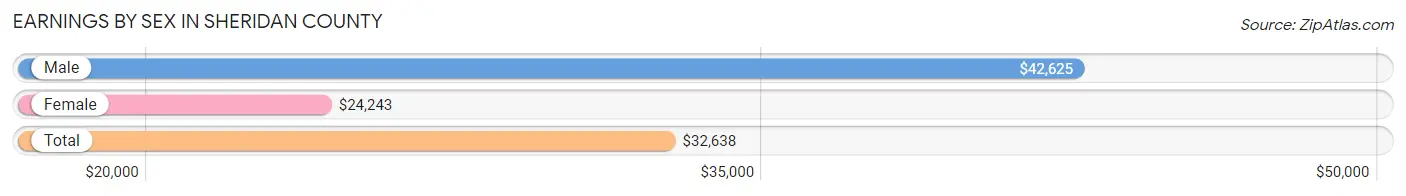
Earnings by Sex in Sheridan County
Average Earnings in Sheridan County are $32,638, $42,625 for men and $24,243 for women, a difference of 43.1%.
| Sex | Number | Average Earnings |
| Male | 1,465 (54.7%) | $42,625 |
| Female | 1,211 (45.3%) | $24,243 |
| Total | 2,676 (100.0%) | $32,638 |
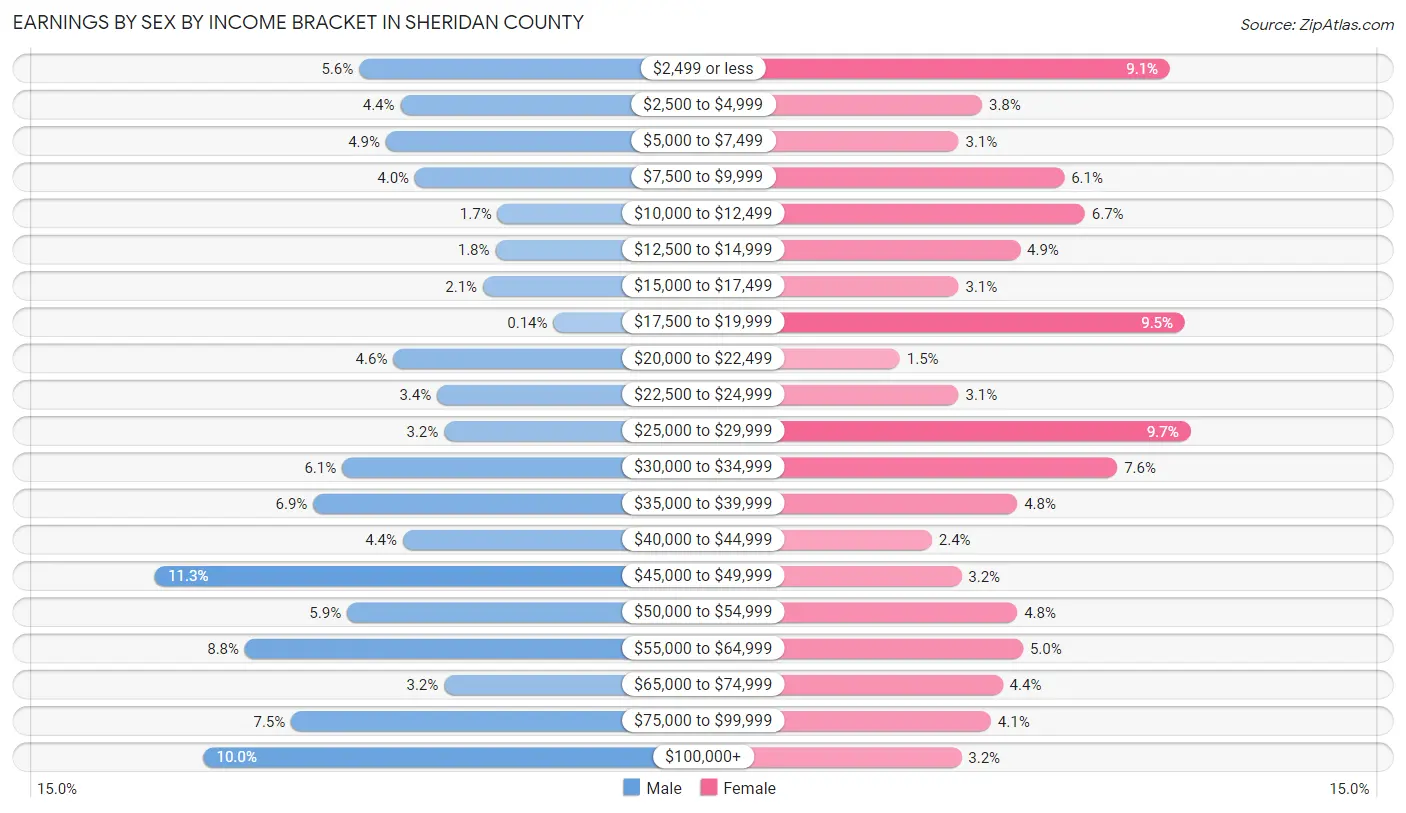
Earnings by Sex by Income Bracket in Sheridan County
The most common earnings brackets in Sheridan County are $45,000 to $49,999 for men (166 | 11.3%) and $25,000 to $29,999 for women (117 | 9.7%).
| Income | Male | Female |
| $2,499 or less | 82 (5.6%) | 110 (9.1%) |
| $2,500 to $4,999 | 65 (4.4%) | 46 (3.8%) |
| $5,000 to $7,499 | 71 (4.9%) | 38 (3.1%) |
| $7,500 to $9,999 | 59 (4.0%) | 74 (6.1%) |
| $10,000 to $12,499 | 25 (1.7%) | 81 (6.7%) |
| $12,500 to $14,999 | 26 (1.8%) | 59 (4.9%) |
| $15,000 to $17,499 | 31 (2.1%) | 38 (3.1%) |
| $17,500 to $19,999 | 2 (0.1%) | 115 (9.5%) |
| $20,000 to $22,499 | 68 (4.6%) | 18 (1.5%) |
| $22,500 to $24,999 | 50 (3.4%) | 38 (3.1%) |
| $25,000 to $29,999 | 47 (3.2%) | 117 (9.7%) |
| $30,000 to $34,999 | 89 (6.1%) | 92 (7.6%) |
| $35,000 to $39,999 | 101 (6.9%) | 58 (4.8%) |
| $40,000 to $44,999 | 64 (4.4%) | 29 (2.4%) |
| $45,000 to $49,999 | 166 (11.3%) | 39 (3.2%) |
| $50,000 to $54,999 | 87 (5.9%) | 58 (4.8%) |
| $55,000 to $64,999 | 129 (8.8%) | 60 (5.0%) |
| $65,000 to $74,999 | 47 (3.2%) | 53 (4.4%) |
| $75,000 to $99,999 | 110 (7.5%) | 49 (4.1%) |
| $100,000+ | 146 (10.0%) | 39 (3.2%) |
| Total | 1,465 (100.0%) | 1,211 (100.0%) |
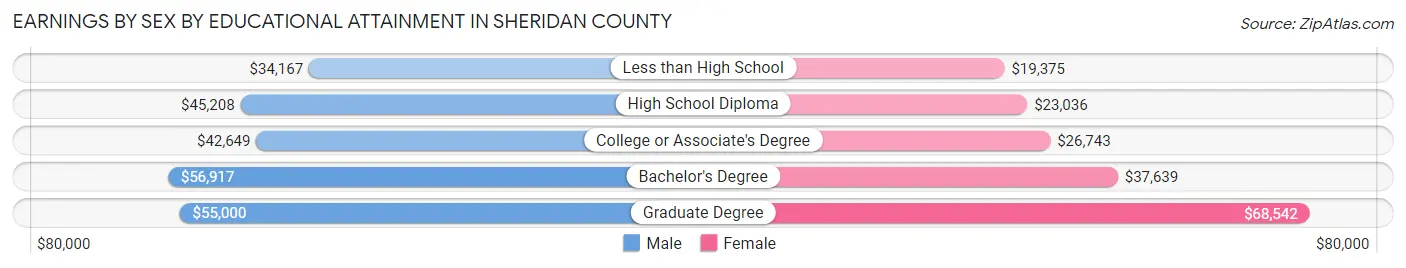
Earnings by Sex by Educational Attainment in Sheridan County
Average earnings in Sheridan County are $45,640 for men and $28,039 for women, a difference of 38.6%. Men with an educational attainment of bachelor's degree enjoy the highest average annual earnings of $56,917, while those with less than high school education earn the least with $34,167. Women with an educational attainment of graduate degree earn the most with the average annual earnings of $68,542, while those with less than high school education have the smallest earnings of $19,375.
| Educational Attainment | Male Income | Female Income |
| Less than High School | $34,167 | $19,375 |
| High School Diploma | $45,208 | $23,036 |
| College or Associate's Degree | $42,649 | $26,743 |
| Bachelor's Degree | $56,917 | $37,639 |
| Graduate Degree | $55,000 | $68,542 |
| Total | $45,640 | $28,039 |
Family Income in Sheridan County
Family Income Brackets in Sheridan County
According to the Sheridan County family income data, there are 311 families falling into the $50,000 to $74,999 income range, which is the most common income bracket and makes up 22.0% of all families. Conversely, the less than $10,000 income bracket is the least frequent group with only 24 families (1.7%) belonging to this category.
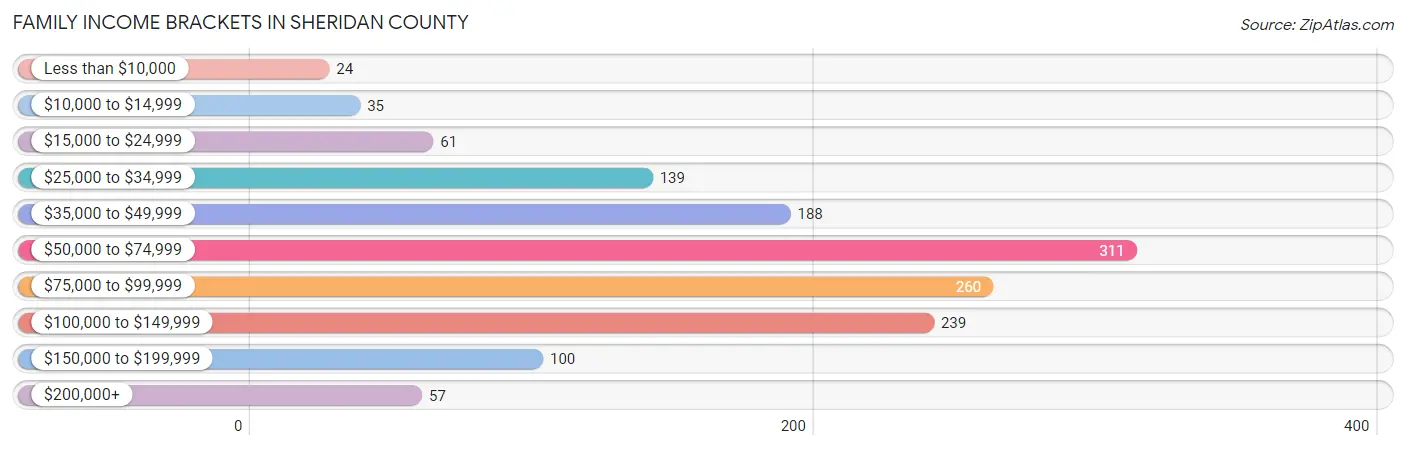
| Income Bracket | # Families | % Families |
| Less than $10,000 | 24 | 1.7% |
| $10,000 to $14,999 | 35 | 2.5% |
| $15,000 to $24,999 | 61 | 4.3% |
| $25,000 to $34,999 | 139 | 9.8% |
| $35,000 to $49,999 | 188 | 13.3% |
| $50,000 to $74,999 | 311 | 22.0% |
| $75,000 to $99,999 | 260 | 18.4% |
| $100,000 to $149,999 | 239 | 16.9% |
| $150,000 to $199,999 | 100 | 7.1% |
| $200,000+ | 57 | 4.0% |
Family Income by Famaliy Size in Sheridan County
4-person families (184 | 13.0%) account for the highest median family income in Sheridan County with $91,250 per family, while 2-person families (847 | 59.9%) have the highest median income of $32,662 per family member.
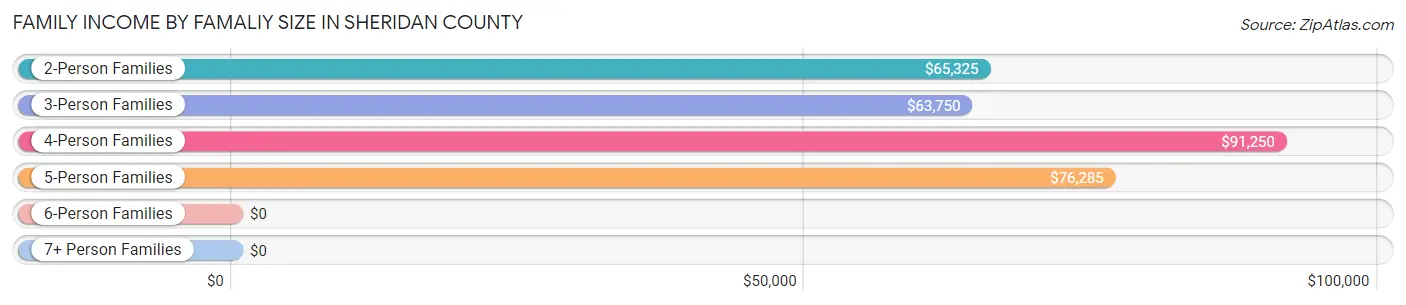
| Income Bracket | # Families | Median Income |
| 2-Person Families | 847 (59.9%) | $65,325 |
| 3-Person Families | 234 (16.6%) | $63,750 |
| 4-Person Families | 184 (13.0%) | $91,250 |
| 5-Person Families | 121 (8.6%) | $76,285 |
| 6-Person Families | 14 (1.0%) | $0 |
| 7+ Person Families | 14 (1.0%) | $0 |
| Total | 1,414 (100.0%) | $67,454 |
Family Income by Number of Earners in Sheridan County
The median family income in Sheridan County is $67,454, with families comprising 2 earners (632) having the highest median family income of $93,125, while families with no earners (205) have the lowest median family income of $45,986, accounting for 44.7% and 14.5% of families, respectively.
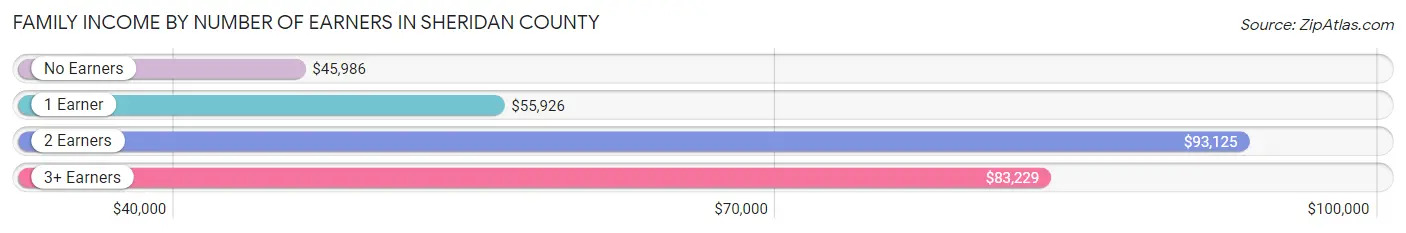
| Number of Earners | # Families | Median Income |
| No Earners | 205 (14.5%) | $45,986 |
| 1 Earner | 478 (33.8%) | $55,926 |
| 2 Earners | 632 (44.7%) | $93,125 |
| 3+ Earners | 99 (7.0%) | $83,229 |
| Total | 1,414 (100.0%) | $67,454 |
Household Income in Sheridan County
Household Income Brackets in Sheridan County
With 391 households falling in the category, the $50,000 to $74,999 income range is the most frequent in Sheridan County, accounting for 18.6% of all households. In contrast, only 61 households (2.9%) fall into the $200,000+ income bracket, making it the least populous group.
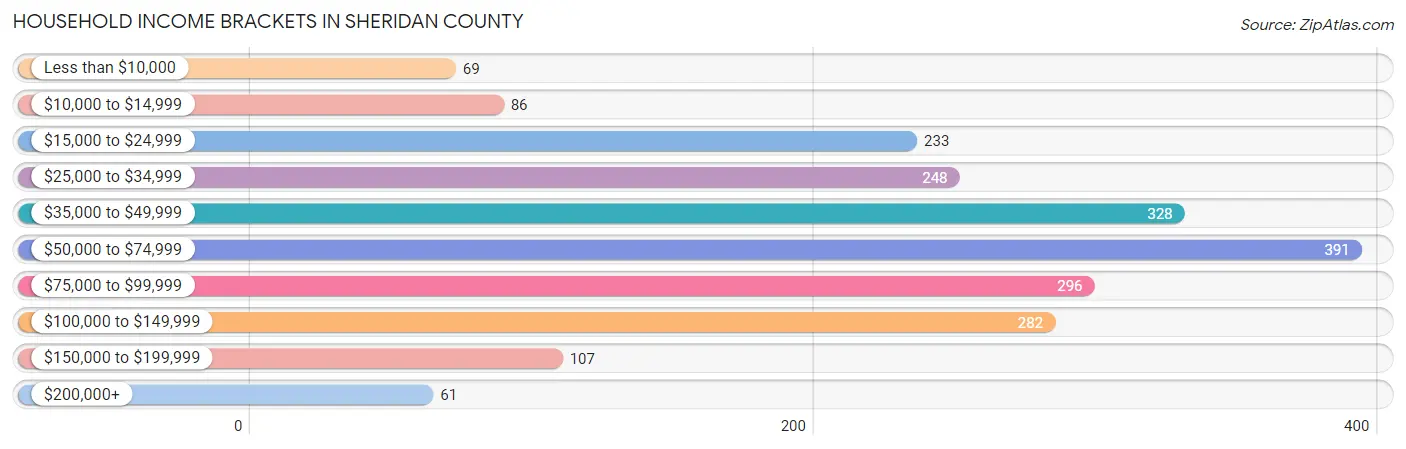
| Income Bracket | # Households | % Households |
| Less than $10,000 | 69 | 3.3% |
| $10,000 to $14,999 | 86 | 4.1% |
| $15,000 to $24,999 | 233 | 11.1% |
| $25,000 to $34,999 | 248 | 11.8% |
| $35,000 to $49,999 | 328 | 15.6% |
| $50,000 to $74,999 | 391 | 18.6% |
| $75,000 to $99,999 | 296 | 14.1% |
| $100,000 to $149,999 | 282 | 13.4% |
| $150,000 to $199,999 | 107 | 5.1% |
| $200,000+ | 61 | 2.9% |
Household Income by Householder Age in Sheridan County
The median household income in Sheridan County is $53,609, with the highest median household income of $67,434 found in the 45 to 64 years age bracket for the primary householder. A total of 655 households (31.2%) fall into this category. Meanwhile, the 65+ years age bracket for the primary householder has the lowest median household income of $46,140, with 848 households (40.4%) in this group.
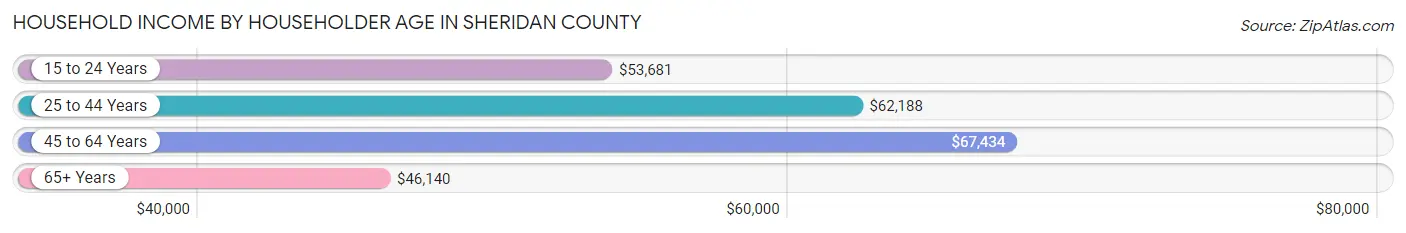
| Income Bracket | # Households | Median Income |
| 15 to 24 Years | 111 (5.3%) | $53,681 |
| 25 to 44 Years | 487 (23.2%) | $62,188 |
| 45 to 64 Years | 655 (31.2%) | $67,434 |
| 65+ Years | 848 (40.4%) | $46,140 |
| Total | 2,101 (100.0%) | $53,609 |
Poverty in Sheridan County
Income Below Poverty by Sex and Age in Sheridan County
With 11.6% poverty level for males and 10.0% for females among the residents of Sheridan County, 16 and 17 year old males and 5 year old females are the most vulnerable to poverty, with 10 males (24.4%) and 5 females (50.0%) in their respective age groups living below the poverty level.
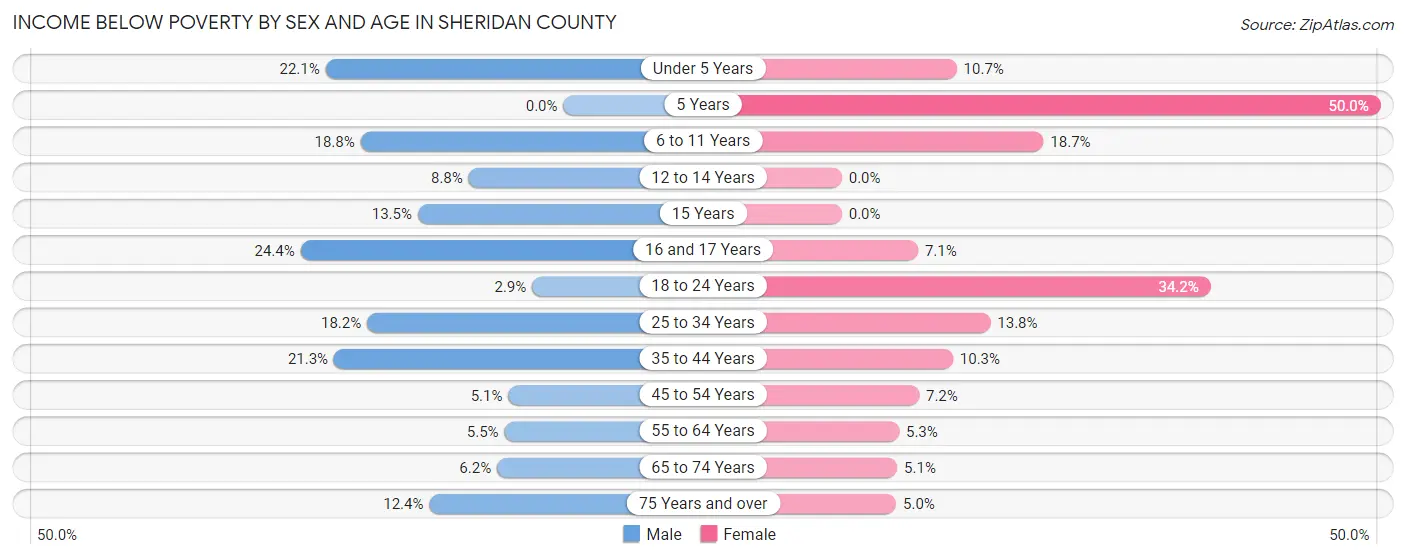
| Age Bracket | Male | Female |
| Under 5 Years | 49 (22.1%) | 13 (10.7%) |
| 5 Years | 0 (0.0%) | 5 (50.0%) |
| 6 to 11 Years | 35 (18.8%) | 29 (18.7%) |
| 12 to 14 Years | 8 (8.8%) | 0 (0.0%) |
| 15 Years | 5 (13.5%) | 0 (0.0%) |
| 16 and 17 Years | 10 (24.4%) | 7 (7.1%) |
| 18 to 24 Years | 6 (2.9%) | 64 (34.2%) |
| 25 to 34 Years | 43 (18.2%) | 32 (13.8%) |
| 35 to 44 Years | 53 (21.3%) | 27 (10.3%) |
| 45 to 54 Years | 16 (5.1%) | 18 (7.2%) |
| 55 to 64 Years | 18 (5.5%) | 19 (5.3%) |
| 65 to 74 Years | 22 (6.2%) | 19 (5.1%) |
| 75 Years and over | 24 (12.4%) | 17 (5.0%) |
| Total | 289 (11.6%) | 250 (10.0%) |
Income Above Poverty by Sex and Age in Sheridan County
According to the poverty statistics in Sheridan County, males aged 5 years and females aged 12 to 14 years are the age groups that are most secure financially, with 100.0% of males and 100.0% of females in these age groups living above the poverty line.
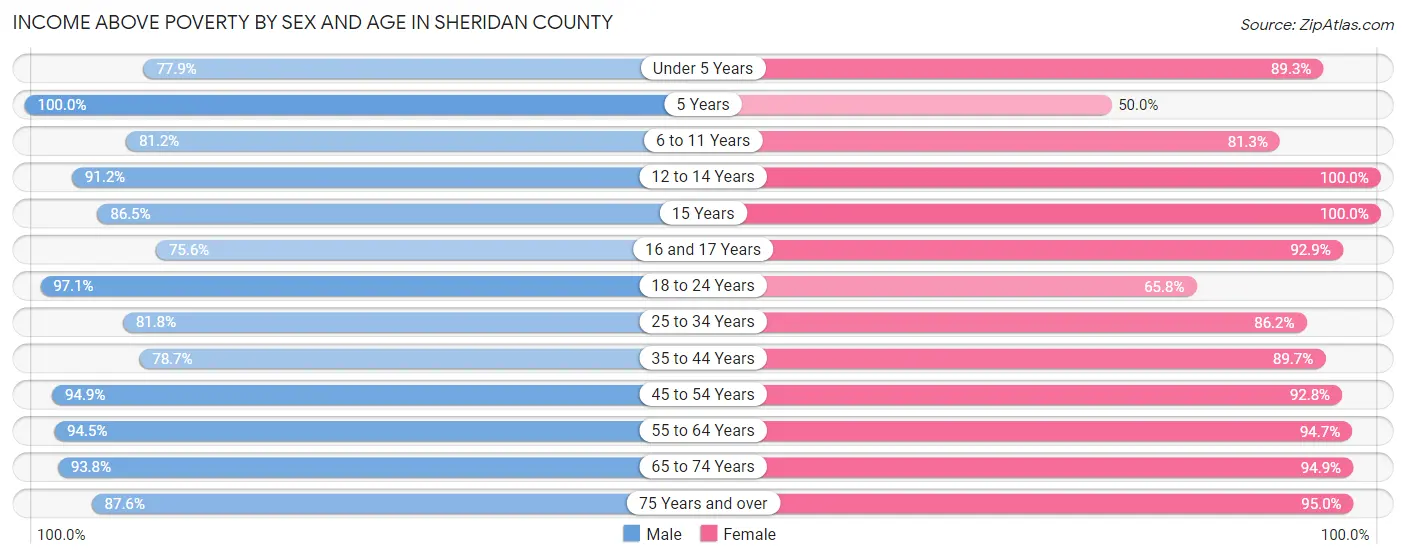
| Age Bracket | Male | Female |
| Under 5 Years | 173 (77.9%) | 109 (89.3%) |
| 5 Years | 23 (100.0%) | 5 (50.0%) |
| 6 to 11 Years | 151 (81.2%) | 126 (81.3%) |
| 12 to 14 Years | 83 (91.2%) | 71 (100.0%) |
| 15 Years | 32 (86.5%) | 41 (100.0%) |
| 16 and 17 Years | 31 (75.6%) | 92 (92.9%) |
| 18 to 24 Years | 201 (97.1%) | 123 (65.8%) |
| 25 to 34 Years | 193 (81.8%) | 200 (86.2%) |
| 35 to 44 Years | 196 (78.7%) | 235 (89.7%) |
| 45 to 54 Years | 297 (94.9%) | 233 (92.8%) |
| 55 to 64 Years | 311 (94.5%) | 339 (94.7%) |
| 65 to 74 Years | 335 (93.8%) | 351 (94.9%) |
| 75 Years and over | 169 (87.6%) | 320 (95.0%) |
| Total | 2,195 (88.4%) | 2,245 (90.0%) |
Income Below Poverty Among Married-Couple Families in Sheridan County
The poverty statistics for married-couple families in Sheridan County show that 4.0% or 47 of the total 1,181 families live below the poverty line. Families with 3 or 4 children have the highest poverty rate of 11.7%, comprising of 12 families. On the other hand, families with 5 or more children have the lowest poverty rate of 0.0%, which includes 0 families.
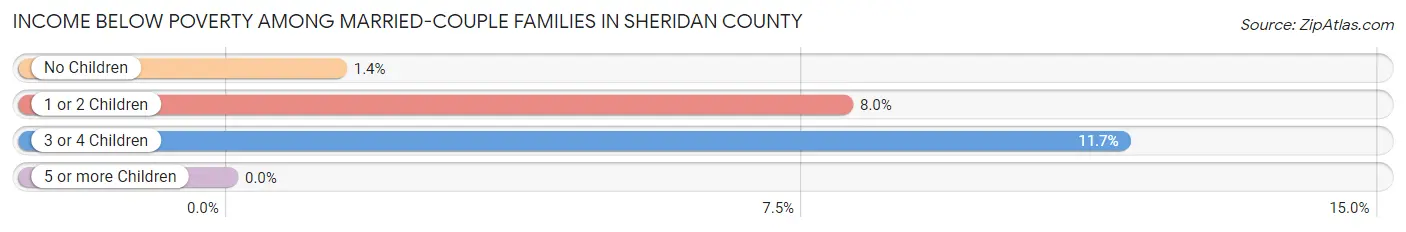
| Children | Above Poverty | Below Poverty |
| No Children | 765 (98.6%) | 11 (1.4%) |
| 1 or 2 Children | 275 (92.0%) | 24 (8.0%) |
| 3 or 4 Children | 91 (88.3%) | 12 (11.7%) |
| 5 or more Children | 3 (100.0%) | 0 (0.0%) |
| Total | 1,134 (96.0%) | 47 (4.0%) |
Income Below Poverty Among Single-Parent Households in Sheridan County
According to the poverty data in Sheridan County, 20.2% or 20 single-father households and 23.1% or 31 single-mother households are living below the poverty line. Among single-father households, those with 1 or 2 children have the highest poverty rate, with 20 households (40.0%) experiencing poverty. Likewise, among single-mother households, those with 3 or 4 children have the highest poverty rate, with 6 households (33.3%) falling below the poverty line.
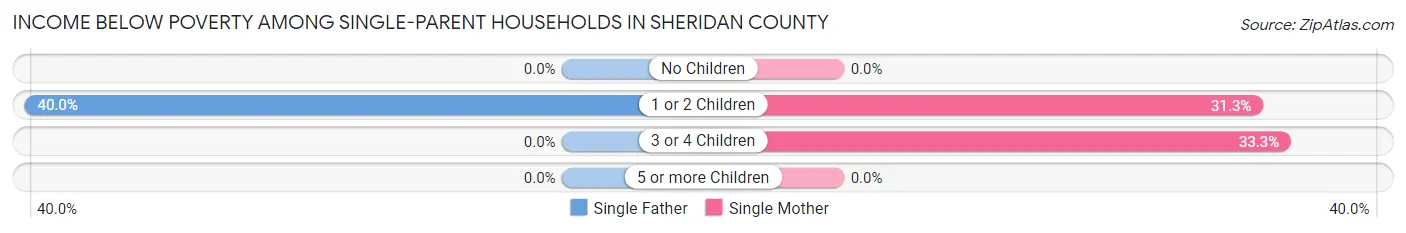
| Children | Single Father | Single Mother |
| No Children | 0 (0.0%) | 0 (0.0%) |
| 1 or 2 Children | 20 (40.0%) | 25 (31.2%) |
| 3 or 4 Children | 0 (0.0%) | 6 (33.3%) |
| 5 or more Children | 0 (0.0%) | 0 (0.0%) |
| Total | 20 (20.2%) | 31 (23.1%) |
Income Below Poverty Among Married-Couple vs Single-Parent Households in Sheridan County
The poverty data for Sheridan County shows that 47 of the married-couple family households (4.0%) and 51 of the single-parent households (21.9%) are living below the poverty level. Within the married-couple family households, those with 3 or 4 children have the highest poverty rate, with 12 households (11.7%) falling below the poverty line. Among the single-parent households, those with 1 or 2 children have the highest poverty rate, with 45 household (34.6%) living below poverty.
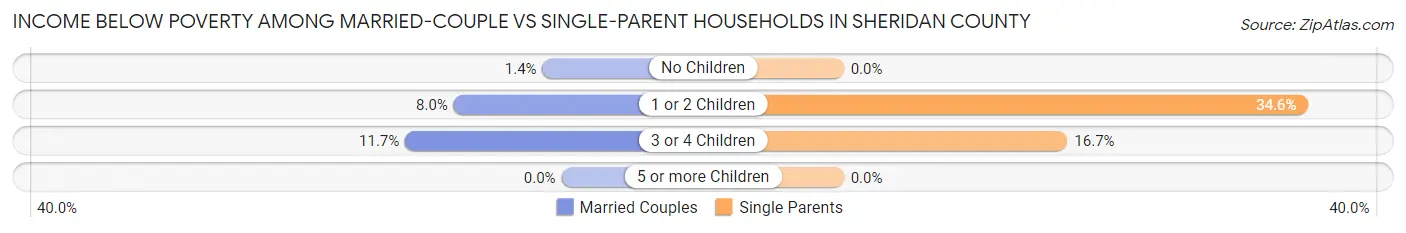
| Children | Married-Couple Families | Single-Parent Households |
| No Children | 11 (1.4%) | 0 (0.0%) |
| 1 or 2 Children | 24 (8.0%) | 45 (34.6%) |
| 3 or 4 Children | 12 (11.7%) | 6 (16.7%) |
| 5 or more Children | 0 (0.0%) | 0 (0.0%) |
| Total | 47 (4.0%) | 51 (21.9%) |
Race in Sheridan County
The most populous races in Sheridan County are White / Caucasian (4,101 | 80.4%), Native / Alaskan (466 | 9.1%), and Two or more Races (321 | 6.3%).
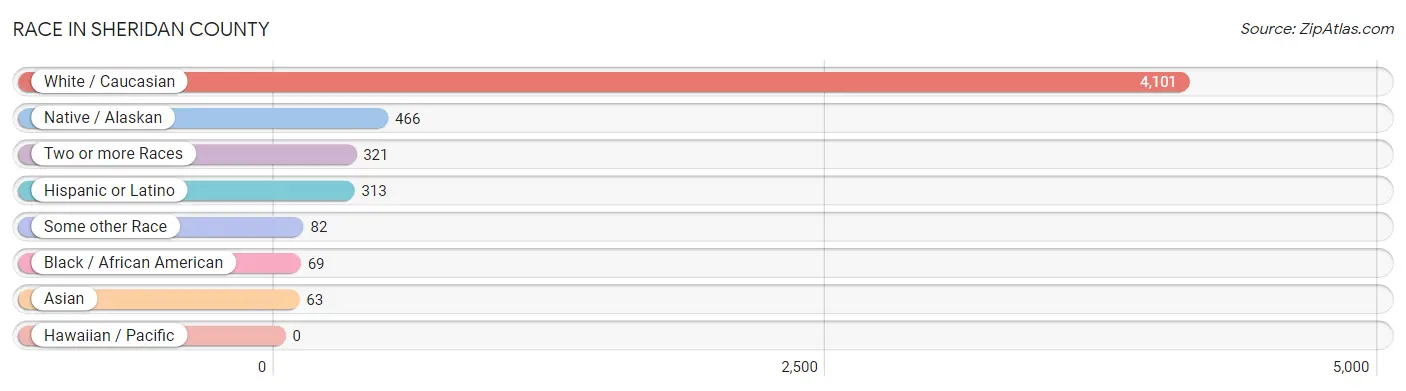
| Race | # Population | % Population |
| Asian | 63 | 1.2% |
| Black / African American | 69 | 1.3% |
| Hawaiian / Pacific | 0 | 0.0% |
| Hispanic or Latino | 313 | 6.1% |
| Native / Alaskan | 466 | 9.1% |
| White / Caucasian | 4,101 | 80.4% |
| Two or more Races | 321 | 6.3% |
| Some other Race | 82 | 1.6% |
| Total | 5,102 | 100.0% |
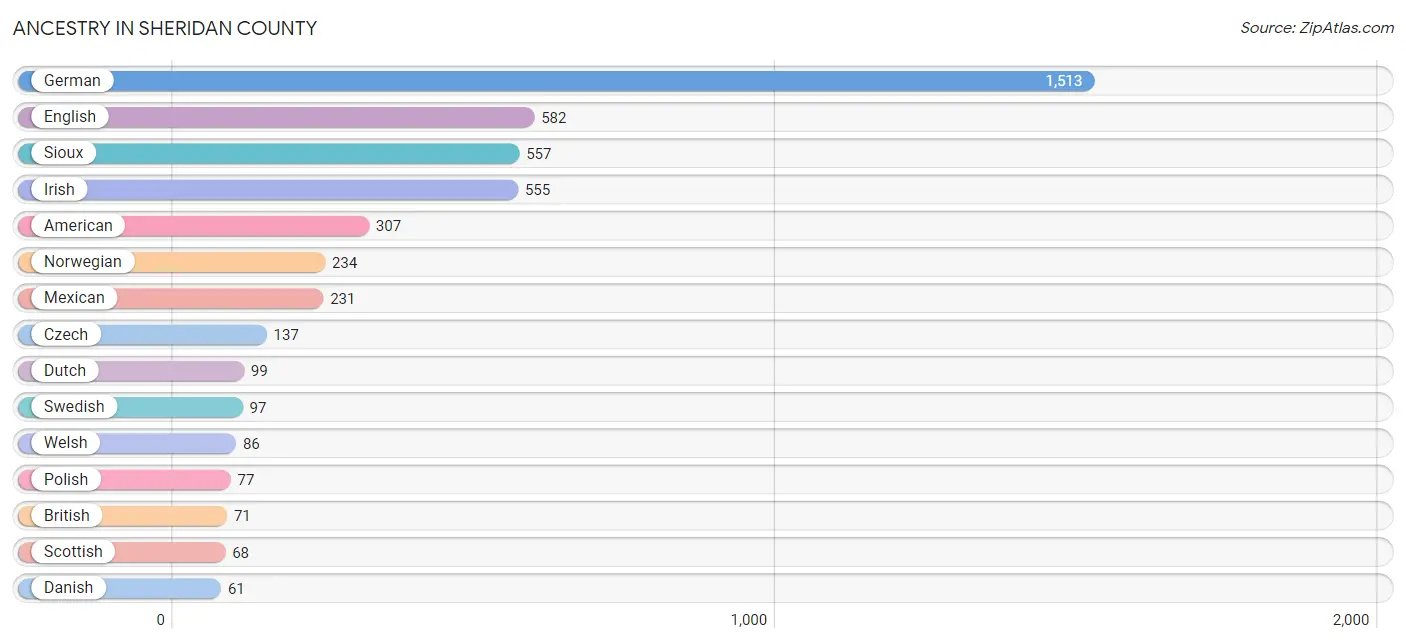
Ancestry in Sheridan County
The most populous ancestries reported in Sheridan County are German (1,513 | 29.7%), English (582 | 11.4%), Sioux (557 | 10.9%), Irish (555 | 10.9%), and American (307 | 6.0%), together accounting for 68.9% of all Sheridan County residents.
| Ancestry | # Population | % Population |
| American | 307 | 6.0% |
| Apache | 13 | 0.3% |
| Arab | 37 | 0.7% |
| Belgian | 7 | 0.1% |
| Bhutanese | 1 | 0.0% |
| Blackfeet | 23 | 0.4% |
| British | 71 | 1.4% |
| Burmese | 1 | 0.0% |
| Central American | 7 | 0.1% |
| Cherokee | 5 | 0.1% |
| Colombian | 6 | 0.1% |
| Cuban | 39 | 0.8% |
| Czech | 137 | 2.7% |
| Czechoslovakian | 9 | 0.2% |
| Danish | 61 | 1.2% |
| Dutch | 99 | 1.9% |
| Eastern European | 14 | 0.3% |
| English | 582 | 11.4% |
| European | 48 | 0.9% |
| French | 58 | 1.1% |
| French American Indian | 1 | 0.0% |
| French Canadian | 34 | 0.7% |
| German | 1,513 | 29.7% |
| Guatemalan | 1 | 0.0% |
| Hungarian | 4 | 0.1% |
| Irish | 555 | 10.9% |
| Iroquois | 9 | 0.2% |
| Italian | 39 | 0.8% |
| Korean | 2 | 0.0% |
| Lebanese | 31 | 0.6% |
| Malaysian | 7 | 0.1% |
| Mexican | 231 | 4.5% |
| Navajo | 11 | 0.2% |
| Norwegian | 234 | 4.6% |
| Panamanian | 6 | 0.1% |
| Polish | 77 | 1.5% |
| Puerto Rican | 30 | 0.6% |
| Romanian | 2 | 0.0% |
| Russian | 2 | 0.0% |
| Scandinavian | 4 | 0.1% |
| Scotch-Irish | 54 | 1.1% |
| Scottish | 68 | 1.3% |
| Sioux | 557 | 10.9% |
| South American | 6 | 0.1% |
| Sri Lankan | 24 | 0.5% |
| Swedish | 97 | 1.9% |
| Swiss | 39 | 0.8% |
| Syrian | 6 | 0.1% |
| Thai | 51 | 1.0% |
| Welsh | 86 | 1.7% |
| Yugoslavian | 4 | 0.1% | View All 51 Rows |
Immigrants in Sheridan County
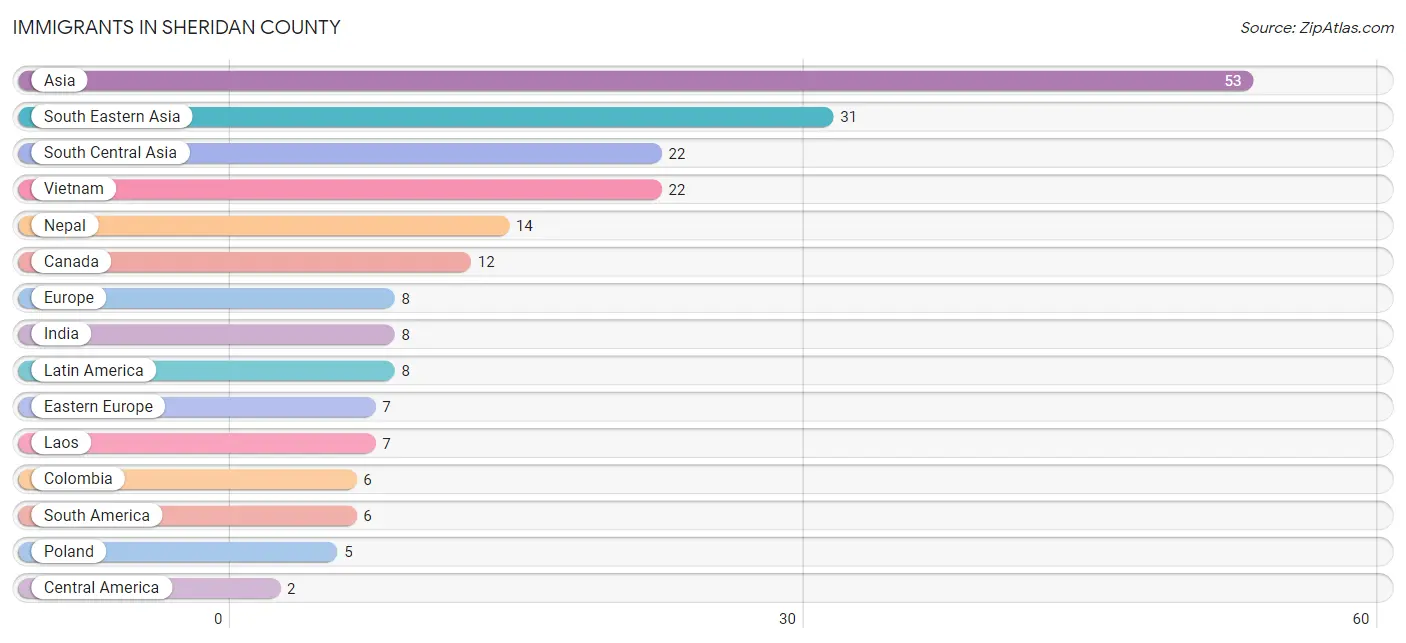
The most numerous immigrant groups reported in Sheridan County came from Asia (53 | 1.0%), South Eastern Asia (31 | 0.6%), South Central Asia (22 | 0.4%), Vietnam (22 | 0.4%), and Nepal (14 | 0.3%), together accounting for 2.8% of all Sheridan County residents.
| Immigration Origin | # Population | % Population |
| Asia | 53 | 1.0% |
| Canada | 12 | 0.2% |
| Central America | 2 | 0.0% |
| Colombia | 6 | 0.1% |
| Eastern Europe | 7 | 0.1% |
| England | 1 | 0.0% |
| Europe | 8 | 0.2% |
| India | 8 | 0.2% |
| Laos | 7 | 0.1% |
| Latin America | 8 | 0.2% |
| Nepal | 14 | 0.3% |
| Northern Europe | 1 | 0.0% |
| Panama | 2 | 0.0% |
| Philippines | 2 | 0.0% |
| Poland | 5 | 0.1% |
| Romania | 2 | 0.0% |
| South America | 6 | 0.1% |
| South Central Asia | 22 | 0.4% |
| South Eastern Asia | 31 | 0.6% |
| Vietnam | 22 | 0.4% | View All 20 Rows |
Sex and Age in Sheridan County
Sex and Age in Sheridan County
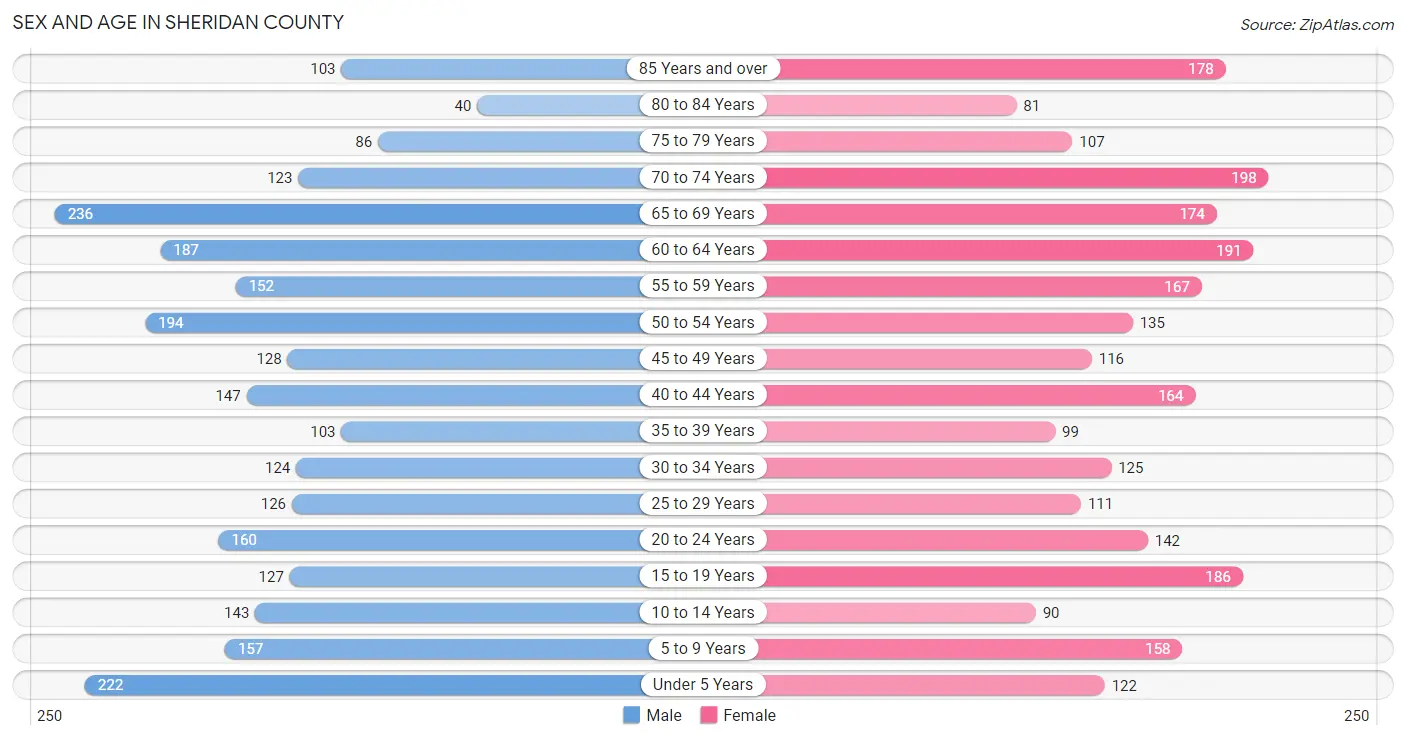
The most populous age groups in Sheridan County are 65 to 69 Years (236 | 9.2%) for men and 70 to 74 Years (198 | 7.8%) for women.
| Age Bracket | Male | Female |
| Under 5 Years | 222 (8.7%) | 122 (4.8%) |
| 5 to 9 Years | 157 (6.1%) | 158 (6.2%) |
| 10 to 14 Years | 143 (5.6%) | 90 (3.5%) |
| 15 to 19 Years | 127 (5.0%) | 186 (7.3%) |
| 20 to 24 Years | 160 (6.2%) | 142 (5.6%) |
| 25 to 29 Years | 126 (4.9%) | 111 (4.4%) |
| 30 to 34 Years | 124 (4.9%) | 125 (4.9%) |
| 35 to 39 Years | 103 (4.0%) | 99 (3.9%) |
| 40 to 44 Years | 147 (5.8%) | 164 (6.5%) |
| 45 to 49 Years | 128 (5.0%) | 116 (4.6%) |
| 50 to 54 Years | 194 (7.6%) | 135 (5.3%) |
| 55 to 59 Years | 152 (5.9%) | 167 (6.6%) |
| 60 to 64 Years | 187 (7.3%) | 191 (7.5%) |
| 65 to 69 Years | 236 (9.2%) | 174 (6.8%) |
| 70 to 74 Years | 123 (4.8%) | 198 (7.8%) |
| 75 to 79 Years | 86 (3.4%) | 107 (4.2%) |
| 80 to 84 Years | 40 (1.6%) | 81 (3.2%) |
| 85 Years and over | 103 (4.0%) | 178 (7.0%) |
| Total | 2,558 (100.0%) | 2,544 (100.0%) |
Families and Households in Sheridan County
Median Family Size in Sheridan County
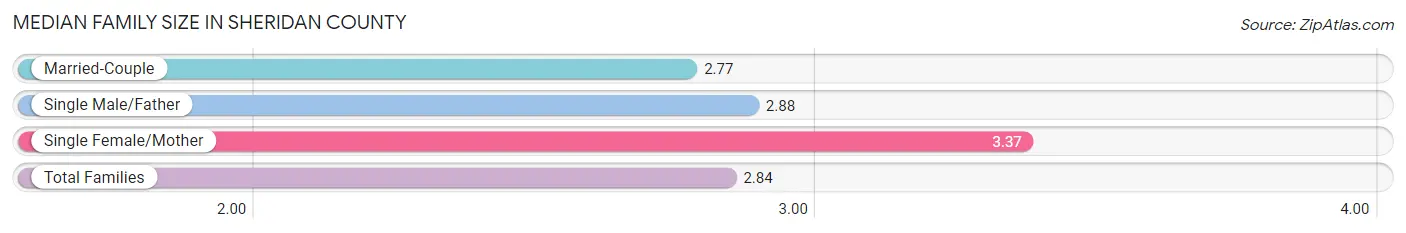
The median family size in Sheridan County is 2.84 persons per family, with single female/mother families (134 | 9.5%) accounting for the largest median family size of 3.37 persons per family. On the other hand, married-couple families (1,181 | 83.5%) represent the smallest median family size with 2.77 persons per family.
| Family Type | # Families | Family Size |
| Married-Couple | 1,181 (83.5%) | 2.77 |
| Single Male/Father | 99 (7.0%) | 2.88 |
| Single Female/Mother | 134 (9.5%) | 3.37 |
| Total Families | 1,414 (100.0%) | 2.84 |
Median Household Size in Sheridan County
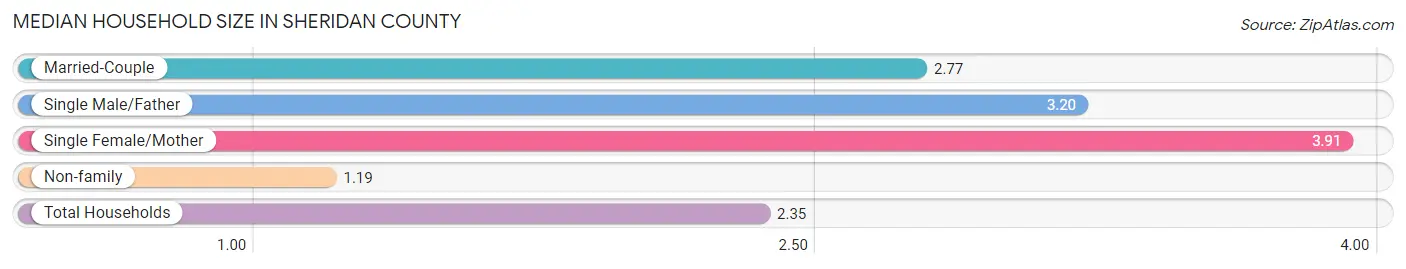
The median household size in Sheridan County is 2.35 persons per household, with single female/mother households (134 | 6.4%) accounting for the largest median household size of 3.91 persons per household. non-family households (687 | 32.7%) represent the smallest median household size with 1.19 persons per household.
| Household Type | # Households | Household Size |
| Married-Couple | 1,181 (56.2%) | 2.77 |
| Single Male/Father | 99 (4.7%) | 3.20 |
| Single Female/Mother | 134 (6.4%) | 3.91 |
| Non-family | 687 (32.7%) | 1.19 |
| Total Households | 2,101 (100.0%) | 2.35 |
Household Size by Marriage Status in Sheridan County
Out of a total of 2,101 households in Sheridan County, 1,414 (67.3%) are family households, while 687 (32.7%) are nonfamily households. The most numerous type of family households are 2-person households, comprising 815, and the most common type of nonfamily households are 1-person households, comprising 597.
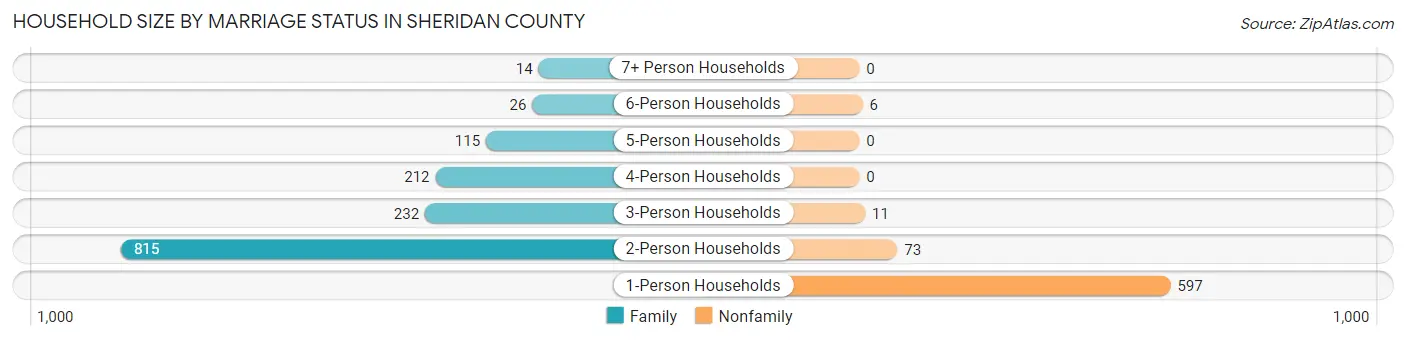
| Household Size | Family Households | Nonfamily Households |
| 1-Person Households | - | 597 (28.4%) |
| 2-Person Households | 815 (38.8%) | 73 (3.5%) |
| 3-Person Households | 232 (11.0%) | 11 (0.5%) |
| 4-Person Households | 212 (10.1%) | 0 (0.0%) |
| 5-Person Households | 115 (5.5%) | 0 (0.0%) |
| 6-Person Households | 26 (1.2%) | 6 (0.3%) |
| 7+ Person Households | 14 (0.7%) | 0 (0.0%) |
| Total | 1,414 (67.3%) | 687 (32.7%) |
Female Fertility in Sheridan County
Fertility by Age in Sheridan County
Average fertility rate in Sheridan County is 49.0 births per 1,000 women. Women in the age bracket of 20 to 34 years have the highest fertility rate with 111.0 births per 1,000 women. Women in the age bracket of 20 to 34 years acount for 85.7% of all women with births.
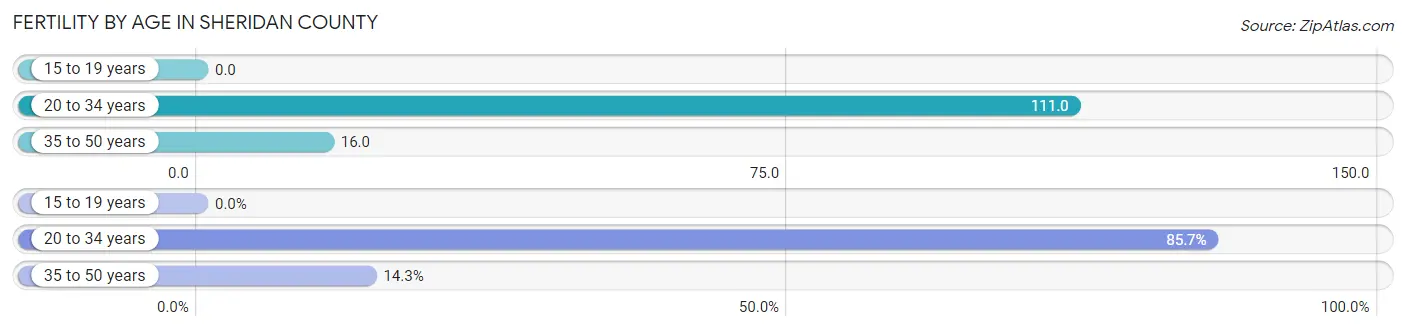
| Age Bracket | Women with Births | Births / 1,000 Women |
| 15 to 19 years | 0 (0.0%) | 0.0 |
| 20 to 34 years | 42 (85.7%) | 111.0 |
| 35 to 50 years | 7 (14.3%) | 16.0 |
| Total | 49 (100.0%) | 49.0 |
Fertility by Age by Marriage Status in Sheridan County
65.3% of women with births (49) in Sheridan County are married. The highest percentage of unmarried women with births falls into 20 to 34 years age bracket with 40.5% of them unmarried at the time of birth, while the lowest percentage of unmarried women with births belong to 35 to 50 years age bracket with 0.0% of them unmarried.
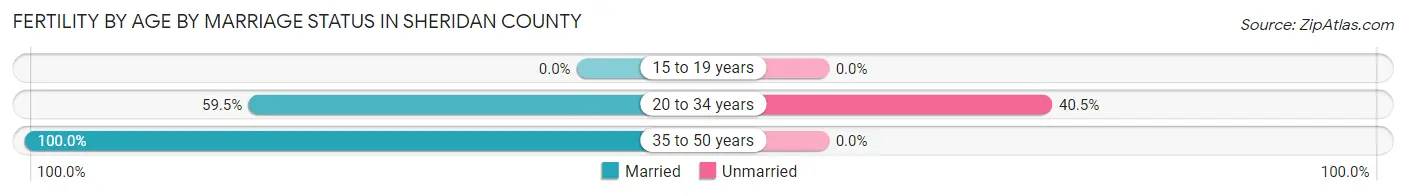
| Age Bracket | Married | Unmarried |
| 15 to 19 years | 0 (0.0%) | 0 (0.0%) |
| 20 to 34 years | 25 (59.5%) | 17 (40.5%) |
| 35 to 50 years | 7 (100.0%) | 0 (0.0%) |
| Total | 32 (65.3%) | 17 (34.7%) |
Fertility by Education in Sheridan County
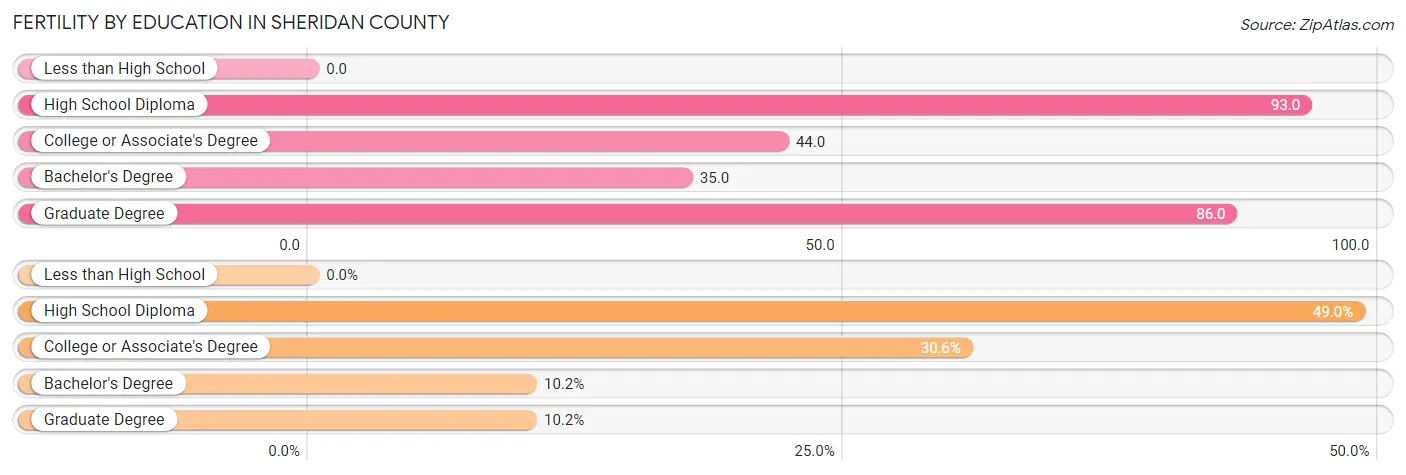
| Educational Attainment | Women with Births | Births / 1,000 Women |
| Less than High School | 0 (0.0%) | 0.0 |
| High School Diploma | 24 (49.0%) | 93.0 |
| College or Associate's Degree | 15 (30.6%) | 44.0 |
| Bachelor's Degree | 5 (10.2%) | 35.0 |
| Graduate Degree | 5 (10.2%) | 86.0 |
| Total | 49 (100.0%) | 49.0 |
Fertility by Education by Marriage Status in Sheridan County
34.7% of women with births in Sheridan County are unmarried. Women with the educational attainment of bachelor's degree are most likely to be married with 100.0% of them married at childbirth, while women with the educational attainment of college or associate's degree are least likely to be married with 86.7% of them unmarried at childbirth.
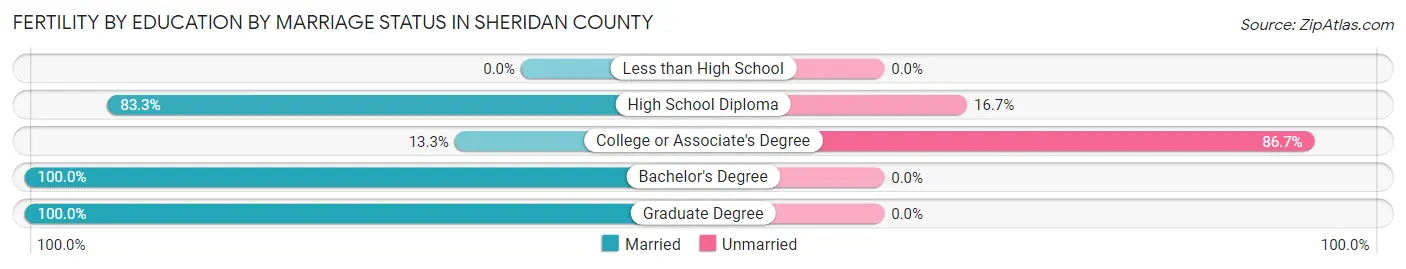
| Educational Attainment | Married | Unmarried |
| Less than High School | 0 (0.0%) | 0 (0.0%) |
| High School Diploma | 20 (83.3%) | 4 (16.7%) |
| College or Associate's Degree | 2 (13.3%) | 13 (86.7%) |
| Bachelor's Degree | 5 (100.0%) | 0 (0.0%) |
| Graduate Degree | 5 (100.0%) | 0 (0.0%) |
| Total | 32 (65.3%) | 17 (34.7%) |
Employment Characteristics in Sheridan County
Employment by Class of Employer in Sheridan County
Among the 2,375 employed individuals in Sheridan County, private company employees (1,192 | 50.2%), self-employed (not incorporated) (383 | 16.1%), and local government employees (338 | 14.2%) make up the most common classes of employment.
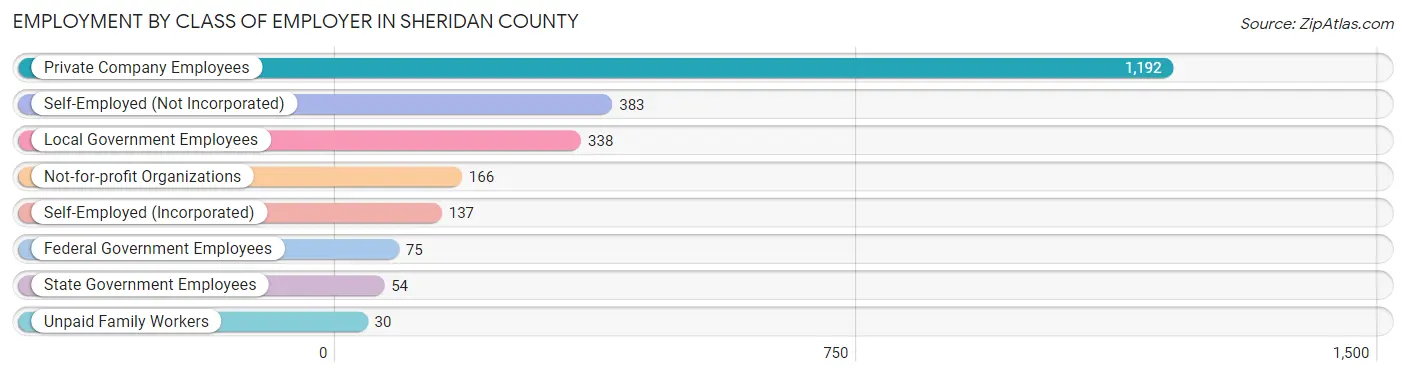
| Employer Class | # Employees | % Employees |
| Private Company Employees | 1,192 | 50.2% |
| Self-Employed (Incorporated) | 137 | 5.8% |
| Self-Employed (Not Incorporated) | 383 | 16.1% |
| Not-for-profit Organizations | 166 | 7.0% |
| Local Government Employees | 338 | 14.2% |
| State Government Employees | 54 | 2.3% |
| Federal Government Employees | 75 | 3.2% |
| Unpaid Family Workers | 30 | 1.3% |
| Total | 2,375 | 100.0% |
Employment Status by Age in Sheridan County
According to the labor force statistics for Sheridan County, out of the total population over 16 years of age (4,132), 59.4% or 2,454 individuals are in the labor force, with 2.2% or 54 of them unemployed. The age group with the highest labor force participation rate is 25 to 29 years, with 85.2% or 202 individuals in the labor force. Within the labor force, the 20 to 24 years age range has the highest percentage of unemployed individuals, with 8.7% or 22 of them being unemployed.
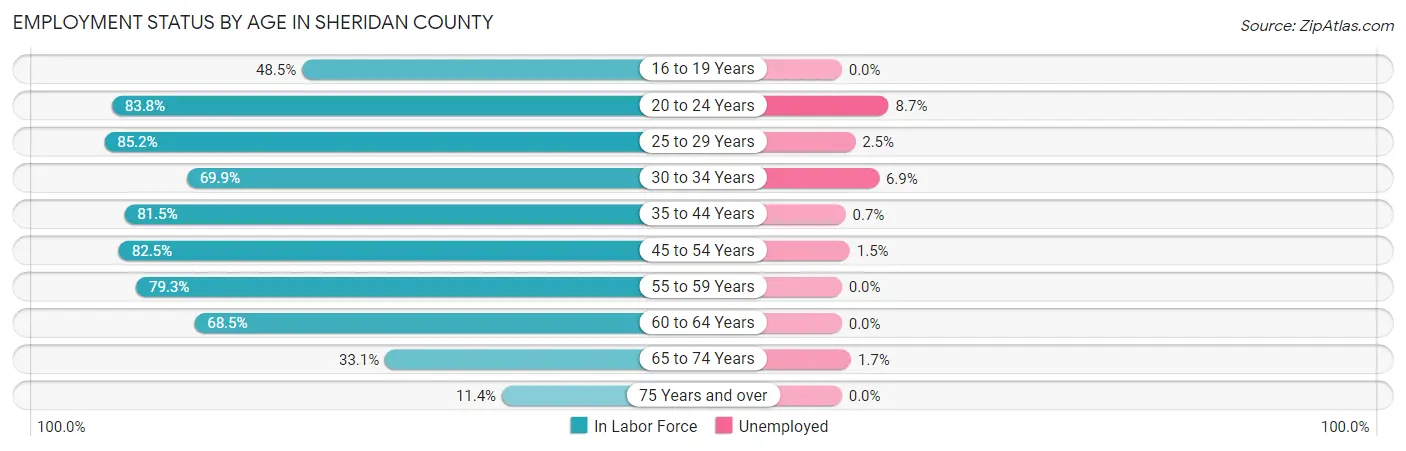
| Age Bracket | In Labor Force | Unemployed |
| 16 to 19 Years | 114 (48.5%) | 0 (0.0%) |
| 20 to 24 Years | 253 (83.8%) | 22 (8.7%) |
| 25 to 29 Years | 202 (85.2%) | 5 (2.5%) |
| 30 to 34 Years | 174 (69.9%) | 12 (6.9%) |
| 35 to 44 Years | 418 (81.5%) | 3 (0.7%) |
| 45 to 54 Years | 473 (82.5%) | 7 (1.5%) |
| 55 to 59 Years | 253 (79.3%) | 0 (0.0%) |
| 60 to 64 Years | 259 (68.5%) | 0 (0.0%) |
| 65 to 74 Years | 242 (33.1%) | 4 (1.7%) |
| 75 Years and over | 68 (11.4%) | 0 (0.0%) |
| Total | 2,454 (59.4%) | 54 (2.2%) |
Employment Status by Educational Attainment in Sheridan County
According to labor force statistics for Sheridan County, 78.4% of individuals (1,779) out of the total population between 25 and 64 years of age (2,269) are in the labor force, with 1.5% or 27 of them being unemployed. The group with the highest labor force participation rate are those with the educational attainment of bachelor's degree or higher, with 95.0% or 438 individuals in the labor force. Within the labor force, individuals with high school diploma education have the highest percentage of unemployment, with 3.6% or 19 of them being unemployed.
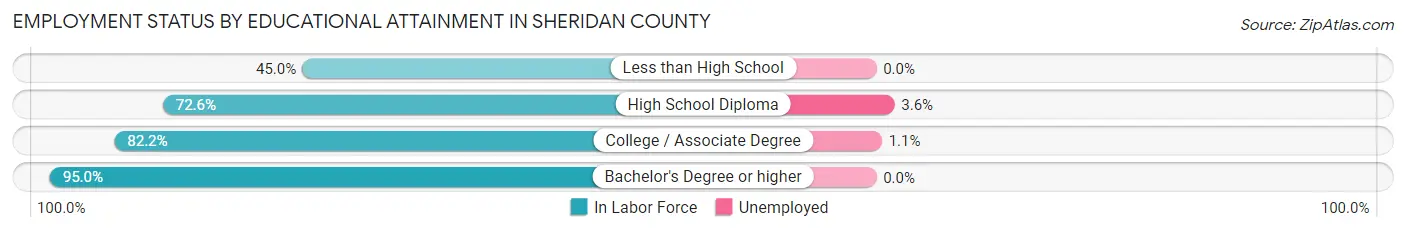
| Educational Attainment | In Labor Force | Unemployed |
| Less than High School | 91 (45.0%) | 0 (0.0%) |
| High School Diploma | 526 (72.6%) | 26 (3.6%) |
| College / Associate Degree | 724 (82.2%) | 10 (1.1%) |
| Bachelor's Degree or higher | 438 (95.0%) | 0 (0.0%) |
| Total | 1,779 (78.4%) | 34 (1.5%) |
Employment Occupations by Sex in Sheridan County
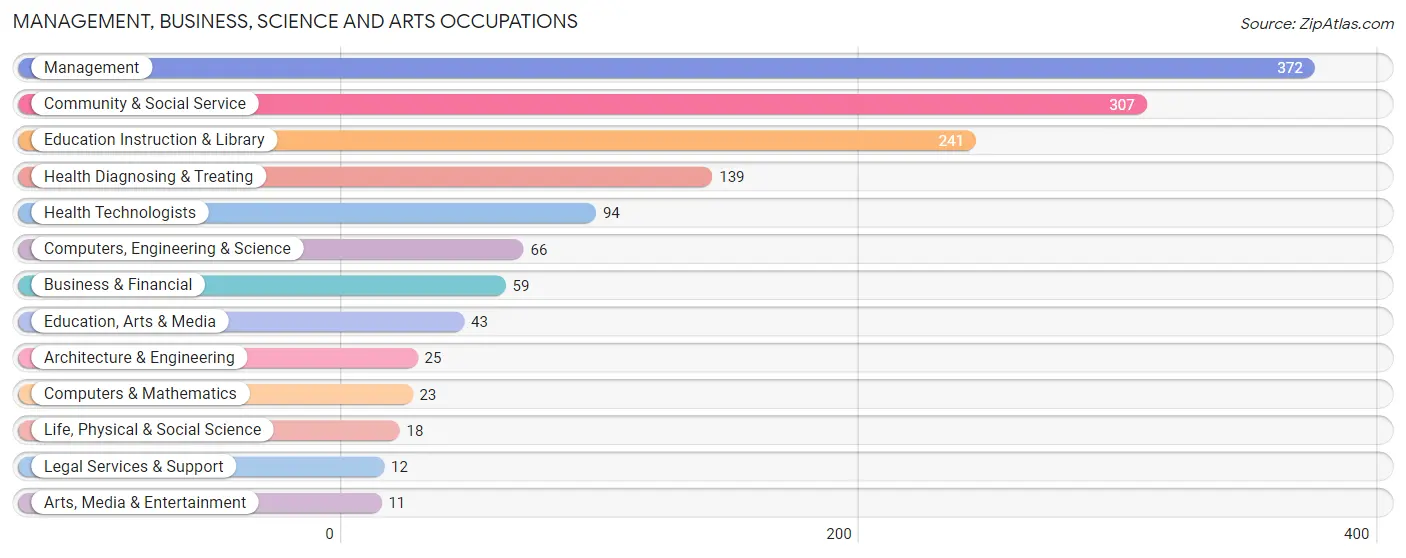
Management, Business, Science and Arts Occupations
The most common Management, Business, Science and Arts occupations in Sheridan County are Management (372 | 15.5%), Community & Social Service (307 | 12.8%), Education Instruction & Library (241 | 10.0%), Health Diagnosing & Treating (139 | 5.8%), and Health Technologists (94 | 3.9%).
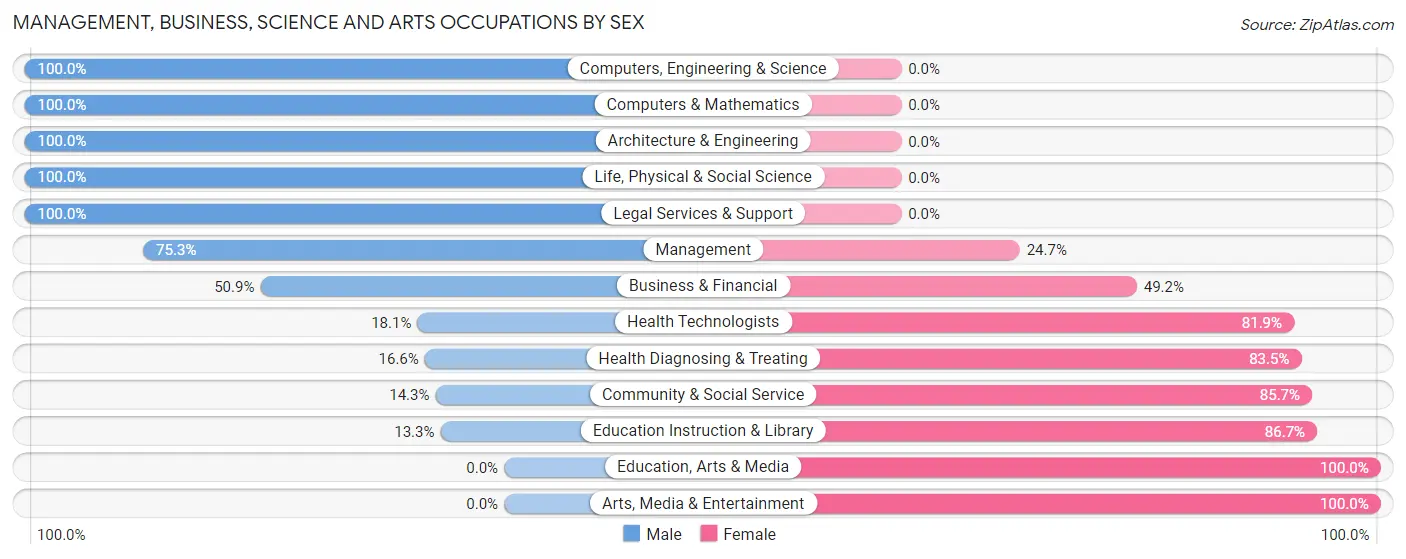
Management, Business, Science and Arts Occupations by Sex
Within the Management, Business, Science and Arts occupations in Sheridan County, the most male-oriented occupations are Computers, Engineering & Science (100.0%), Computers & Mathematics (100.0%), and Architecture & Engineering (100.0%), while the most female-oriented occupations are Education, Arts & Media (100.0%), Arts, Media & Entertainment (100.0%), and Education Instruction & Library (86.7%).
| Occupation | Male | Female |
| Management | 280 (75.3%) | 92 (24.7%) |
| Business & Financial | 30 (50.8%) | 29 (49.1%) |
| Computers, Engineering & Science | 66 (100.0%) | 0 (0.0%) |
| Computers & Mathematics | 23 (100.0%) | 0 (0.0%) |
| Architecture & Engineering | 25 (100.0%) | 0 (0.0%) |
| Life, Physical & Social Science | 18 (100.0%) | 0 (0.0%) |
| Community & Social Service | 44 (14.3%) | 263 (85.7%) |
| Education, Arts & Media | 0 (0.0%) | 43 (100.0%) |
| Legal Services & Support | 12 (100.0%) | 0 (0.0%) |
| Education Instruction & Library | 32 (13.3%) | 209 (86.7%) |
| Arts, Media & Entertainment | 0 (0.0%) | 11 (100.0%) |
| Health Diagnosing & Treating | 23 (16.6%) | 116 (83.5%) |
| Health Technologists | 17 (18.1%) | 77 (81.9%) |
| Total (Category) | 443 (47.0%) | 500 (53.0%) |
| Total (Overall) | 1,293 (53.8%) | 1,110 (46.2%) |
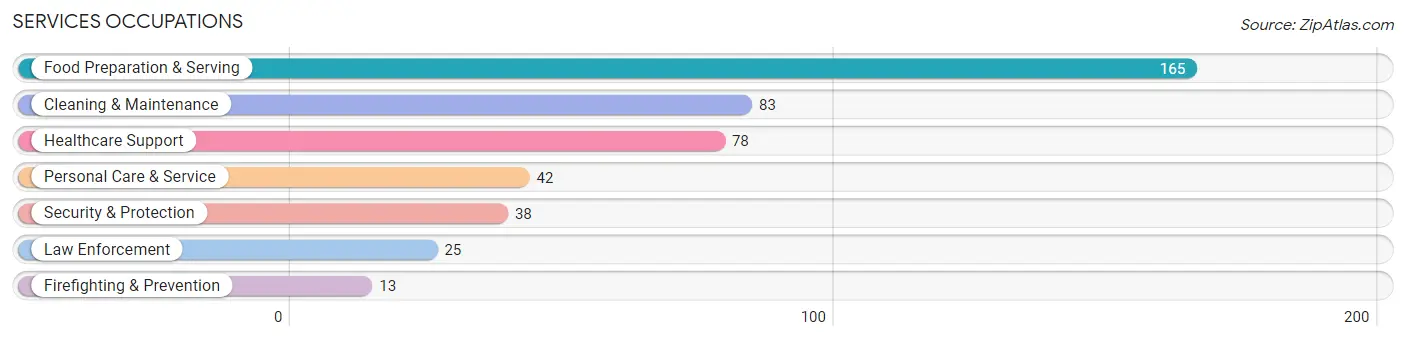
Services Occupations
The most common Services occupations in Sheridan County are Food Preparation & Serving (165 | 6.9%), Cleaning & Maintenance (83 | 3.5%), Healthcare Support (78 | 3.3%), Personal Care & Service (42 | 1.8%), and Security & Protection (38 | 1.6%).
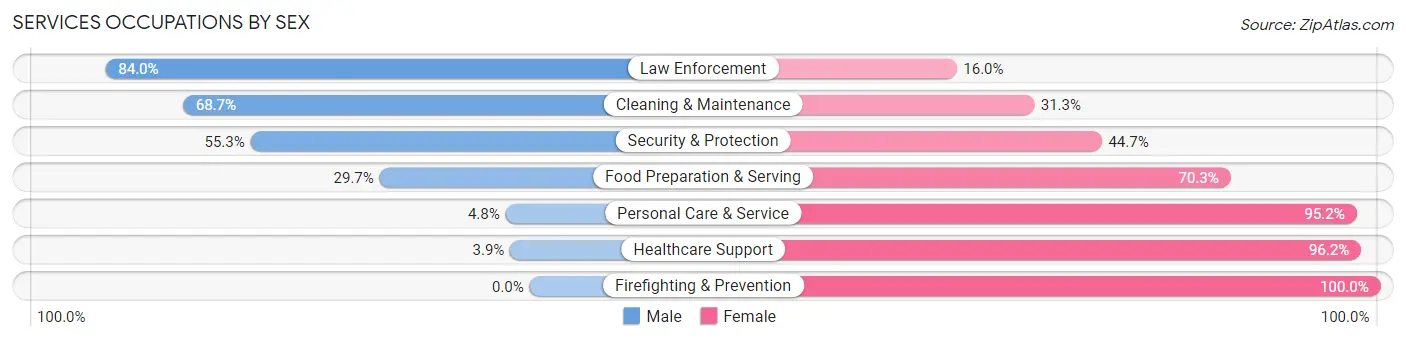
Services Occupations by Sex
Within the Services occupations in Sheridan County, the most male-oriented occupations are Law Enforcement (84.0%), Cleaning & Maintenance (68.7%), and Security & Protection (55.3%), while the most female-oriented occupations are Firefighting & Prevention (100.0%), Healthcare Support (96.2%), and Personal Care & Service (95.2%).
| Occupation | Male | Female |
| Healthcare Support | 3 (3.8%) | 75 (96.2%) |
| Security & Protection | 21 (55.3%) | 17 (44.7%) |
| Firefighting & Prevention | 0 (0.0%) | 13 (100.0%) |
| Law Enforcement | 21 (84.0%) | 4 (16.0%) |
| Food Preparation & Serving | 49 (29.7%) | 116 (70.3%) |
| Cleaning & Maintenance | 57 (68.7%) | 26 (31.3%) |
| Personal Care & Service | 2 (4.8%) | 40 (95.2%) |
| Total (Category) | 132 (32.5%) | 274 (67.5%) |
| Total (Overall) | 1,293 (53.8%) | 1,110 (46.2%) |
Sales and Office Occupations
The most common Sales and Office occupations in Sheridan County are Sales & Related (269 | 11.2%), and Office & Administration (144 | 6.0%).

Sales and Office Occupations by Sex

| Occupation | Male | Female |
| Sales & Related | 122 (45.4%) | 147 (54.6%) |
| Office & Administration | 21 (14.6%) | 123 (85.4%) |
| Total (Category) | 143 (34.6%) | 270 (65.4%) |
| Total (Overall) | 1,293 (53.8%) | 1,110 (46.2%) |
Natural Resources, Construction and Maintenance Occupations
The most common Natural Resources, Construction and Maintenance occupations in Sheridan County are Farming, Fishing & Forestry (126 | 5.2%), Construction & Extraction (126 | 5.2%), and Installation, Maintenance & Repair (108 | 4.5%).
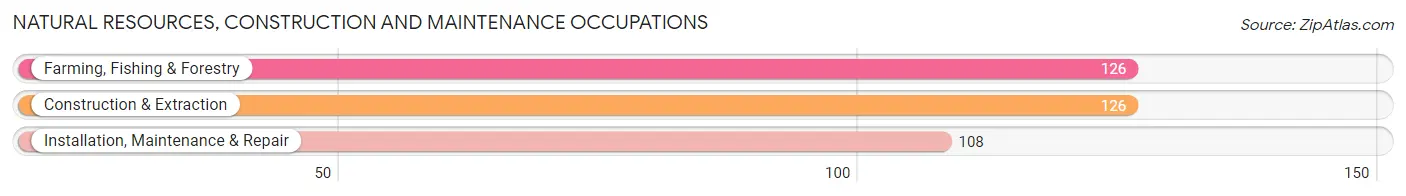
Natural Resources, Construction and Maintenance Occupations by Sex
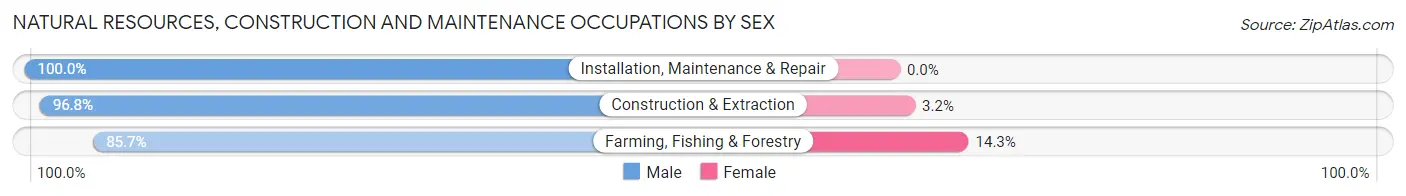
| Occupation | Male | Female |
| Farming, Fishing & Forestry | 108 (85.7%) | 18 (14.3%) |
| Construction & Extraction | 122 (96.8%) | 4 (3.2%) |
| Installation, Maintenance & Repair | 108 (100.0%) | 0 (0.0%) |
| Total (Category) | 338 (93.9%) | 22 (6.1%) |
| Total (Overall) | 1,293 (53.8%) | 1,110 (46.2%) |
Production, Transportation and Moving Occupations
The most common Production, Transportation and Moving occupations in Sheridan County are Transportation (146 | 6.1%), Production (97 | 4.0%), and Material Moving (38 | 1.6%).
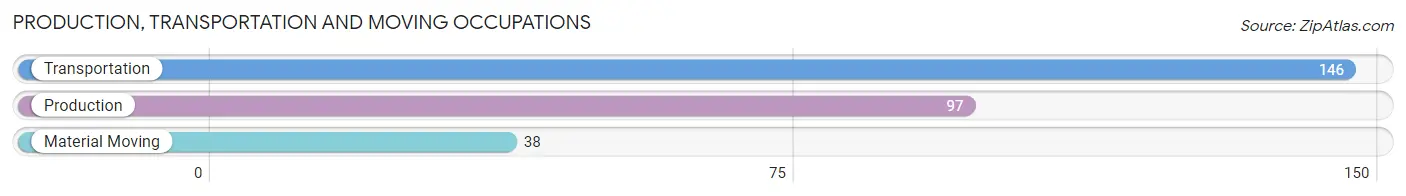
Production, Transportation and Moving Occupations by Sex
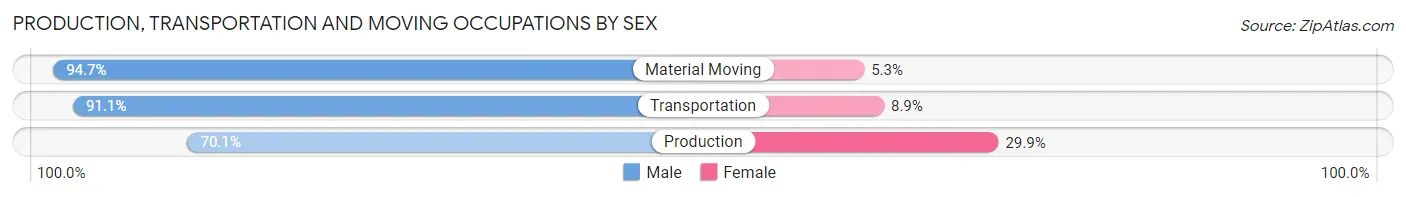
| Occupation | Male | Female |
| Production | 68 (70.1%) | 29 (29.9%) |
| Transportation | 133 (91.1%) | 13 (8.9%) |
| Material Moving | 36 (94.7%) | 2 (5.3%) |
| Total (Category) | 237 (84.3%) | 44 (15.7%) |
| Total (Overall) | 1,293 (53.8%) | 1,110 (46.2%) |
Employment Industries by Sex in Sheridan County
Employment Industries in Sheridan County
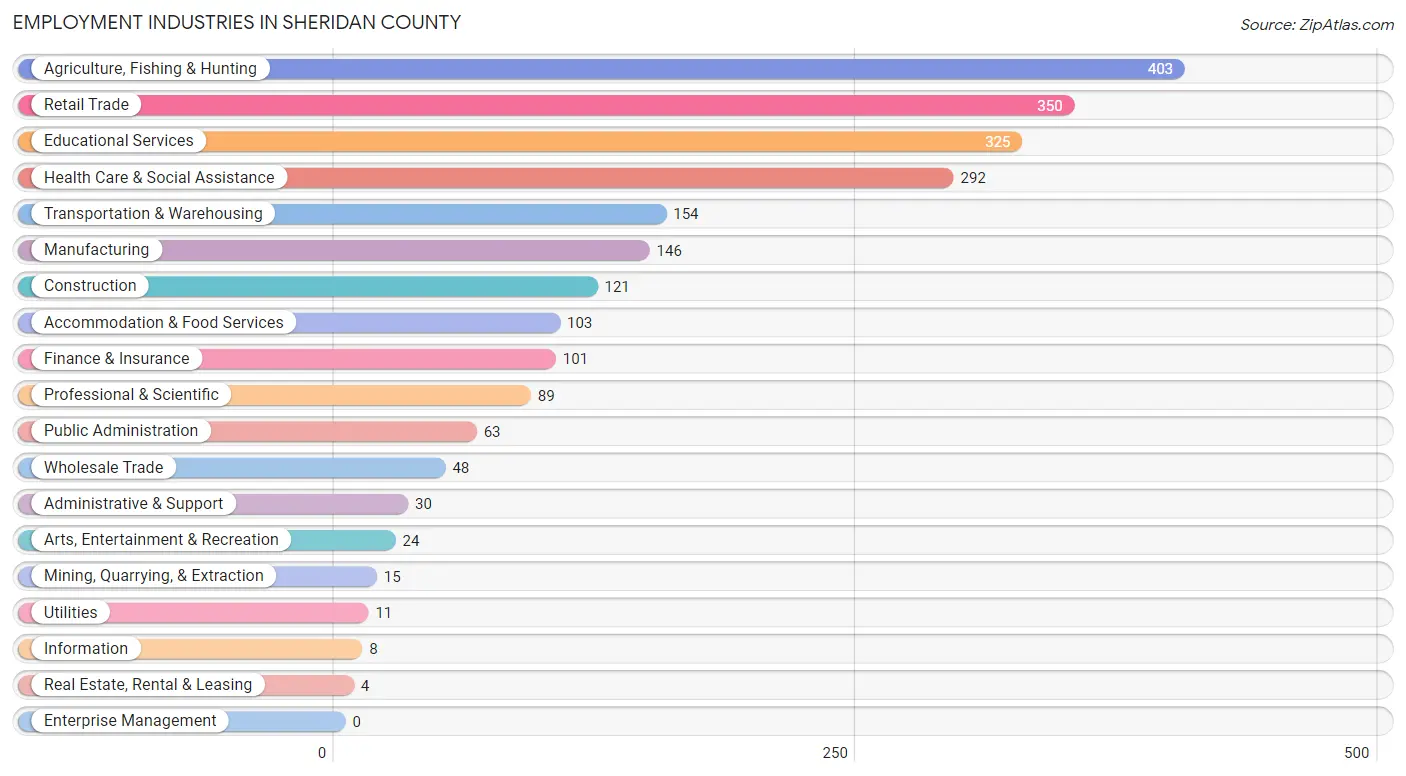
The major employment industries in Sheridan County include Agriculture, Fishing & Hunting (403 | 16.8%), Retail Trade (350 | 14.6%), Educational Services (325 | 13.5%), Health Care & Social Assistance (292 | 12.1%), and Transportation & Warehousing (154 | 6.4%).
Employment Industries by Sex in Sheridan County
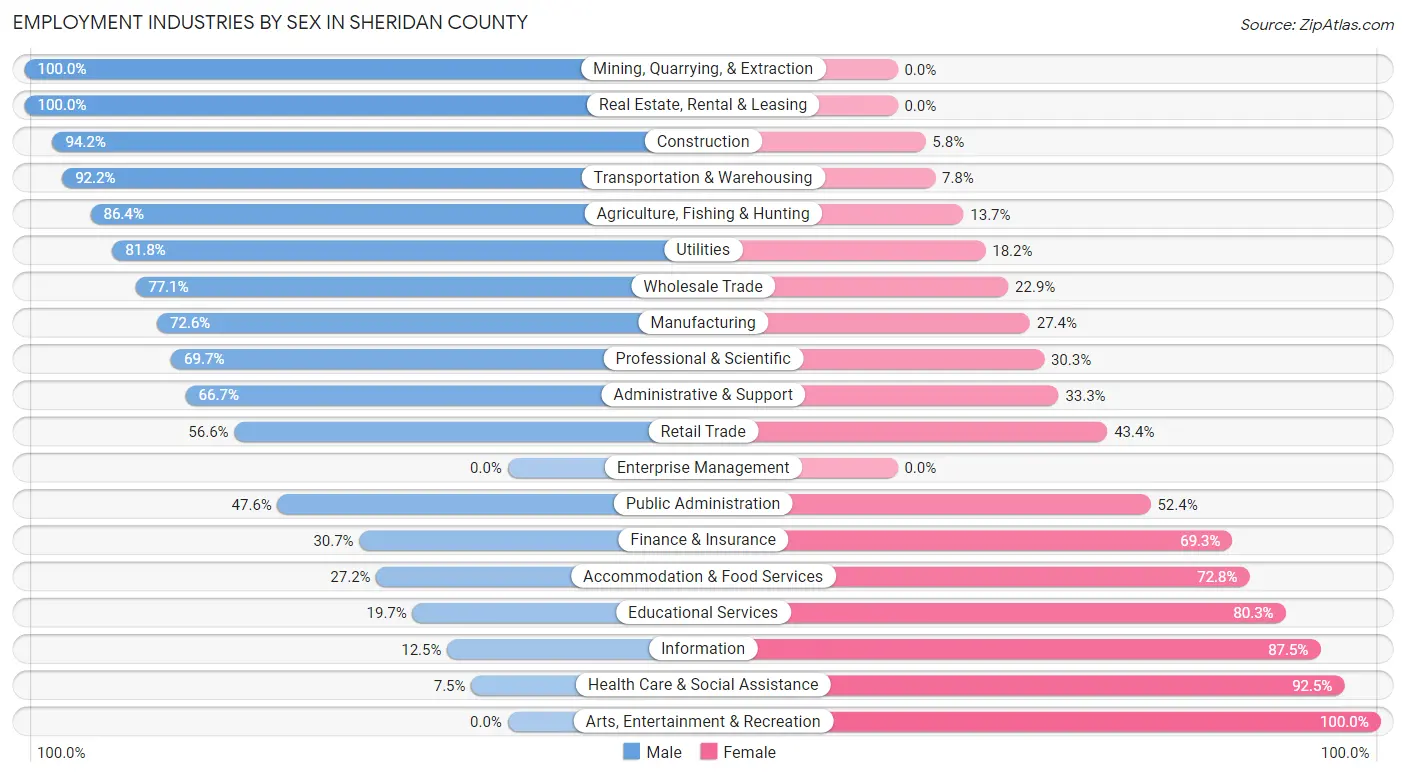
The Sheridan County industries that see more men than women are Mining, Quarrying, & Extraction (100.0%), Real Estate, Rental & Leasing (100.0%), and Construction (94.2%), whereas the industries that tend to have a higher number of women are Arts, Entertainment & Recreation (100.0%), Health Care & Social Assistance (92.5%), and Information (87.5%).
| Industry | Male | Female |
| Agriculture, Fishing & Hunting | 348 (86.4%) | 55 (13.7%) |
| Mining, Quarrying, & Extraction | 15 (100.0%) | 0 (0.0%) |
| Construction | 114 (94.2%) | 7 (5.8%) |
| Manufacturing | 106 (72.6%) | 40 (27.4%) |
| Wholesale Trade | 37 (77.1%) | 11 (22.9%) |
| Retail Trade | 198 (56.6%) | 152 (43.4%) |
| Transportation & Warehousing | 142 (92.2%) | 12 (7.8%) |
| Utilities | 9 (81.8%) | 2 (18.2%) |
| Information | 1 (12.5%) | 7 (87.5%) |
| Finance & Insurance | 31 (30.7%) | 70 (69.3%) |
| Real Estate, Rental & Leasing | 4 (100.0%) | 0 (0.0%) |
| Professional & Scientific | 62 (69.7%) | 27 (30.3%) |
| Enterprise Management | 0 (0.0%) | 0 (0.0%) |
| Administrative & Support | 20 (66.7%) | 10 (33.3%) |
| Educational Services | 64 (19.7%) | 261 (80.3%) |
| Health Care & Social Assistance | 22 (7.5%) | 270 (92.5%) |
| Arts, Entertainment & Recreation | 0 (0.0%) | 24 (100.0%) |
| Accommodation & Food Services | 28 (27.2%) | 75 (72.8%) |
| Public Administration | 30 (47.6%) | 33 (52.4%) |
| Total | 1,293 (53.8%) | 1,110 (46.2%) |
Education in Sheridan County
School Enrollment in Sheridan County
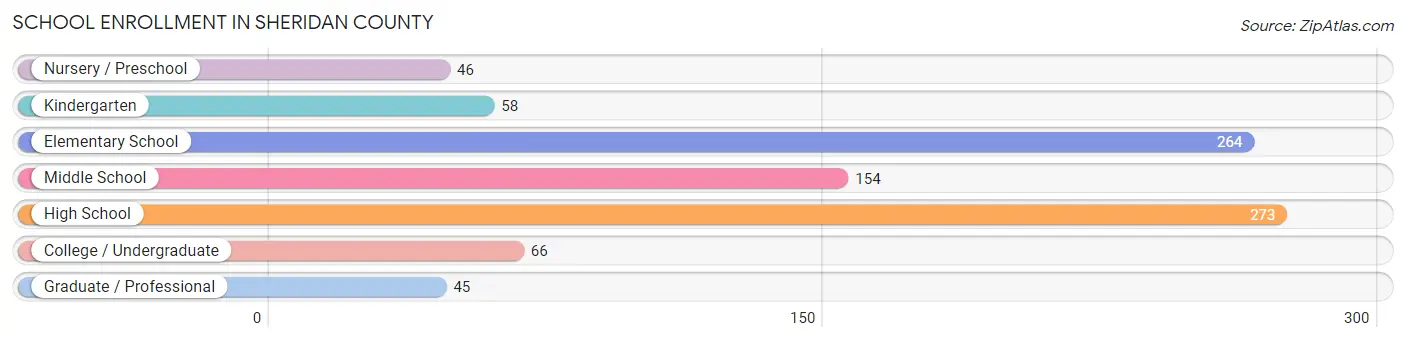
The most common levels of schooling among the 906 students in Sheridan County are high school (273 | 30.1%), elementary school (264 | 29.1%), and middle school (154 | 17.0%).
| School Level | # Students | % Students |
| Nursery / Preschool | 46 | 5.1% |
| Kindergarten | 58 | 6.4% |
| Elementary School | 264 | 29.1% |
| Middle School | 154 | 17.0% |
| High School | 273 | 30.1% |
| College / Undergraduate | 66 | 7.3% |
| Graduate / Professional | 45 | 5.0% |
| Total | 906 | 100.0% |
School Enrollment by Age by Funding Source in Sheridan County
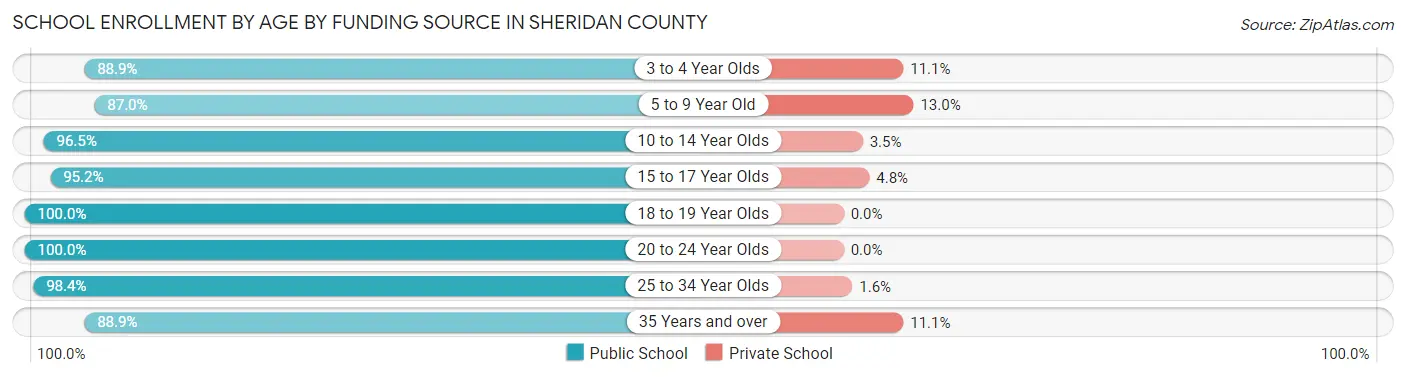
Out of a total of 906 students who are enrolled in schools in Sheridan County, 66 (7.3%) attend a private institution, while the remaining 840 (92.7%) are enrolled in public schools. The age group of 5 to 9 year old has the highest likelihood of being enrolled in private schools, with 39 (13.0% in the age bracket) enrolled. Conversely, the age group of 18 to 19 year olds has the lowest likelihood of being enrolled in a private school, with 37 (100.0% in the age bracket) attending a public institution.
| Age Bracket | Public School | Private School |
| 3 to 4 Year Olds | 40 (88.9%) | 5 (11.1%) |
| 5 to 9 Year Old | 261 (87.0%) | 39 (13.0%) |
| 10 to 14 Year Olds | 191 (96.5%) | 7 (3.5%) |
| 15 to 17 Year Olds | 199 (95.2%) | 10 (4.8%) |
| 18 to 19 Year Olds | 37 (100.0%) | 0 (0.0%) |
| 20 to 24 Year Olds | 19 (100.0%) | 0 (0.0%) |
| 25 to 34 Year Olds | 61 (98.4%) | 1 (1.6%) |
| 35 Years and over | 32 (88.9%) | 4 (11.1%) |
| Total | 840 (92.7%) | 66 (7.3%) |
Educational Attainment by Field of Study in Sheridan County
Education (204 | 24.7%), bio, nature & agricultural (153 | 18.5%), science & technology (129 | 15.6%), business (124 | 15.0%), and arts & humanities (89 | 10.8%) are the most common fields of study among 827 individuals in Sheridan County who have obtained a bachelor's degree or higher.
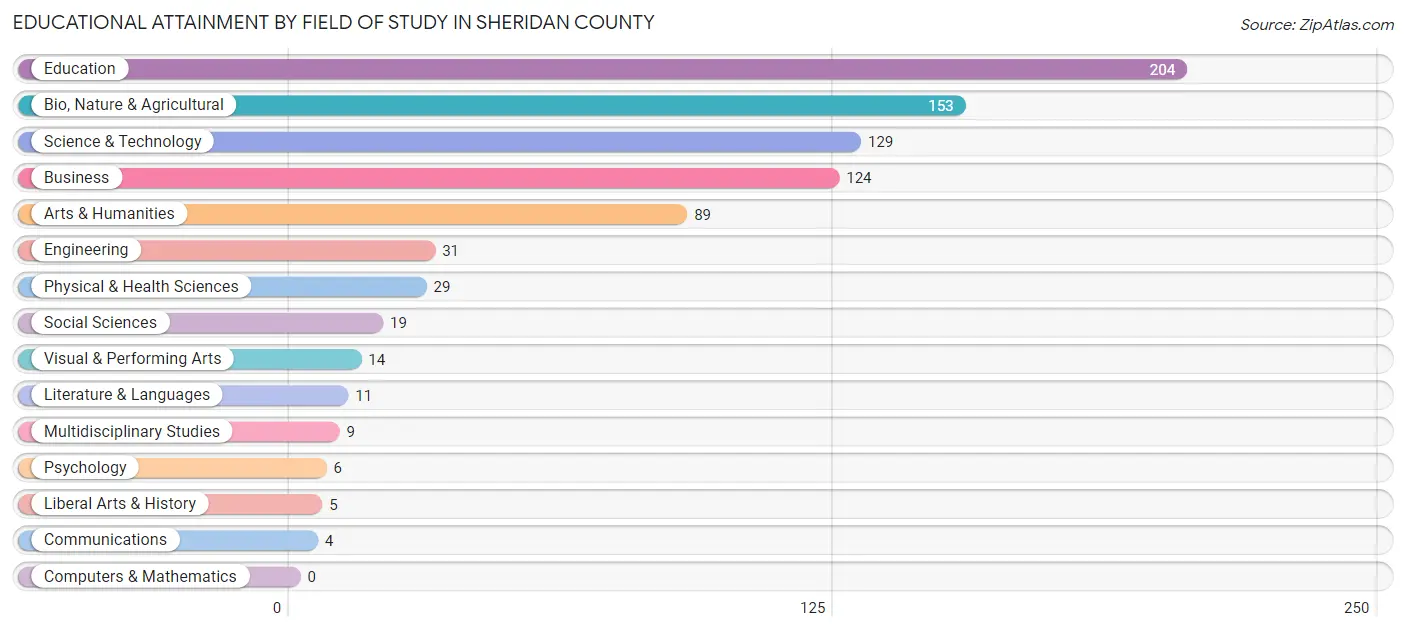
| Field of Study | # Graduates | % Graduates |
| Computers & Mathematics | 0 | 0.0% |
| Bio, Nature & Agricultural | 153 | 18.5% |
| Physical & Health Sciences | 29 | 3.5% |
| Psychology | 6 | 0.7% |
| Social Sciences | 19 | 2.3% |
| Engineering | 31 | 3.7% |
| Multidisciplinary Studies | 9 | 1.1% |
| Science & Technology | 129 | 15.6% |
| Business | 124 | 15.0% |
| Education | 204 | 24.7% |
| Literature & Languages | 11 | 1.3% |
| Liberal Arts & History | 5 | 0.6% |
| Visual & Performing Arts | 14 | 1.7% |
| Communications | 4 | 0.5% |
| Arts & Humanities | 89 | 10.8% |
| Total | 827 | 100.0% |
Transportation & Commute in Sheridan County
Vehicle Availability by Sex in Sheridan County
The most prevalent vehicle ownership categories in Sheridan County are males with 2 vehicles (455, accounting for 36.0%) and females with 2 vehicles (429, making up 41.2%).
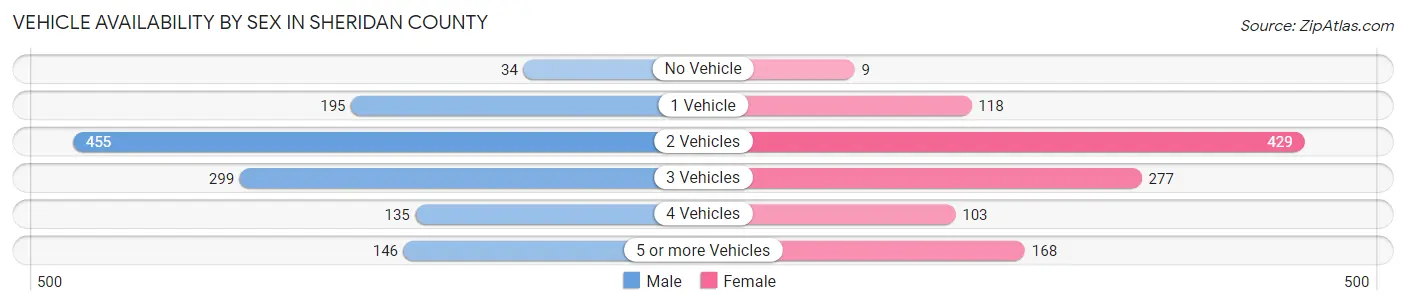
| Vehicles Available | Male | Female |
| No Vehicle | 34 (2.7%) | 9 (0.8%) |
| 1 Vehicle | 195 (15.4%) | 118 (10.7%) |
| 2 Vehicles | 455 (36.0%) | 429 (38.9%) |
| 3 Vehicles | 299 (23.7%) | 277 (25.1%) |
| 4 Vehicles | 135 (10.7%) | 103 (9.3%) |
| 5 or more Vehicles | 146 (11.6%) | 168 (15.2%) |
| Total | 1,264 (100.0%) | 1,104 (100.0%) |
Commute Time in Sheridan County
The most frequently occuring commute durations in Sheridan County are less than 5 minutes (534 commuters, 24.8%), 5 to 9 minutes (472 commuters, 21.9%), and 10 to 14 minutes (257 commuters, 11.9%).
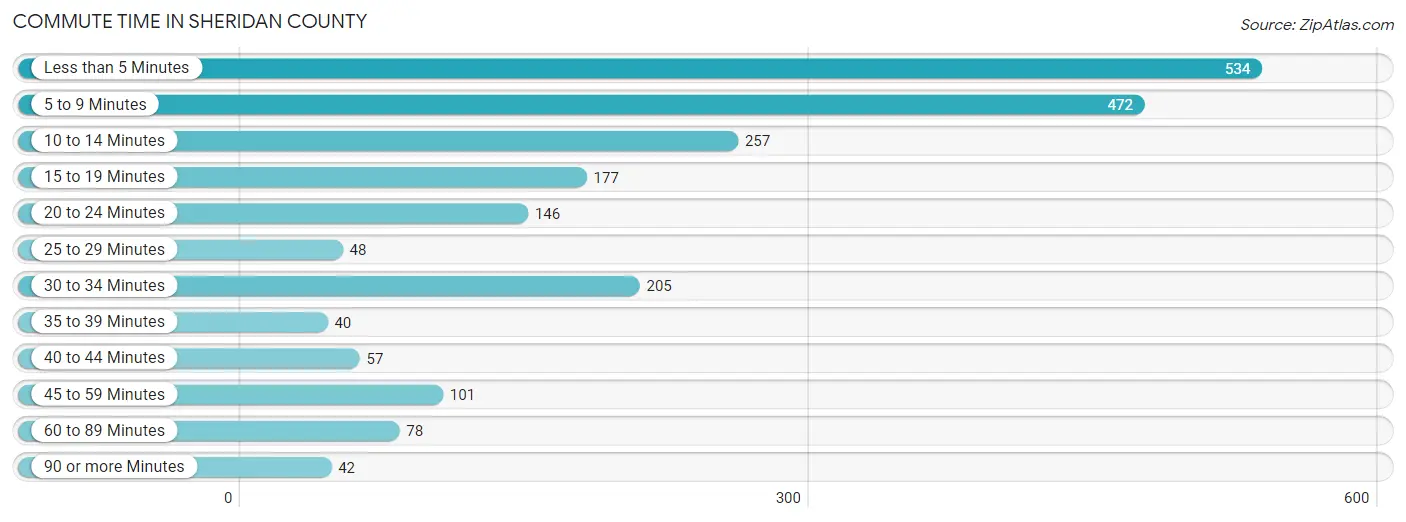
| Commute Time | # Commuters | % Commuters |
| Less than 5 Minutes | 534 | 24.8% |
| 5 to 9 Minutes | 472 | 21.9% |
| 10 to 14 Minutes | 257 | 11.9% |
| 15 to 19 Minutes | 177 | 8.2% |
| 20 to 24 Minutes | 146 | 6.8% |
| 25 to 29 Minutes | 48 | 2.2% |
| 30 to 34 Minutes | 205 | 9.5% |
| 35 to 39 Minutes | 40 | 1.8% |
| 40 to 44 Minutes | 57 | 2.6% |
| 45 to 59 Minutes | 101 | 4.7% |
| 60 to 89 Minutes | 78 | 3.6% |
| 90 or more Minutes | 42 | 1.9% |
Commute Time by Sex in Sheridan County
The most common commute times in Sheridan County are less than 5 minutes (277 commuters, 24.5%) for males and less than 5 minutes (257 commuters, 25.0%) for females.
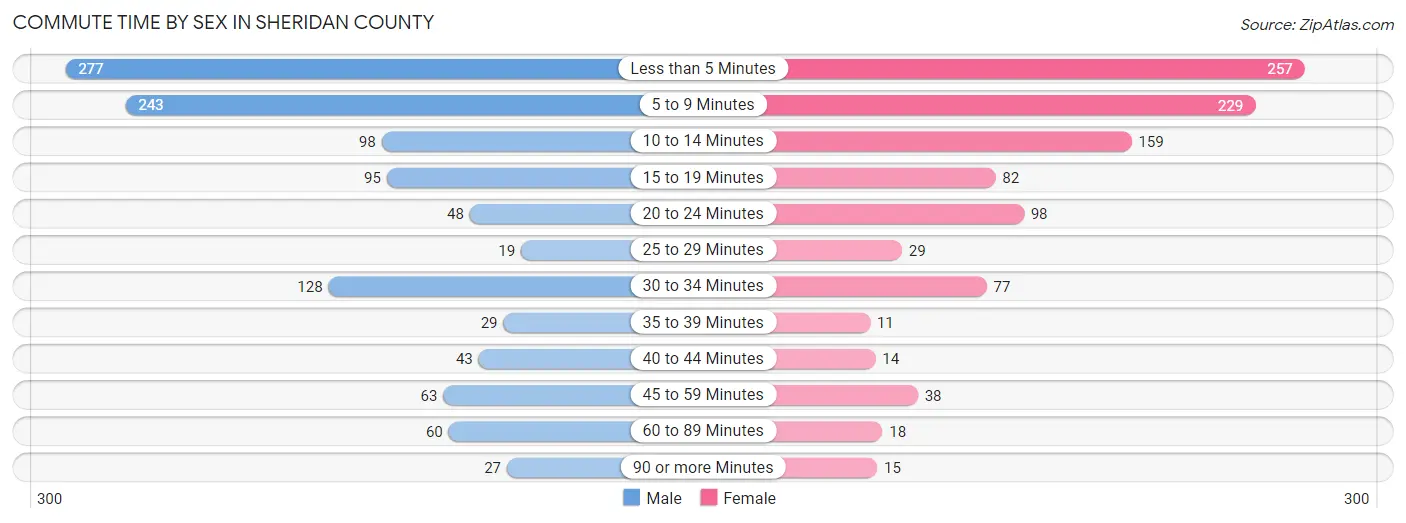
| Commute Time | Male | Female |
| Less than 5 Minutes | 277 (24.5%) | 257 (25.0%) |
| 5 to 9 Minutes | 243 (21.5%) | 229 (22.3%) |
| 10 to 14 Minutes | 98 (8.7%) | 159 (15.5%) |
| 15 to 19 Minutes | 95 (8.4%) | 82 (8.0%) |
| 20 to 24 Minutes | 48 (4.3%) | 98 (9.5%) |
| 25 to 29 Minutes | 19 (1.7%) | 29 (2.8%) |
| 30 to 34 Minutes | 128 (11.3%) | 77 (7.5%) |
| 35 to 39 Minutes | 29 (2.6%) | 11 (1.1%) |
| 40 to 44 Minutes | 43 (3.8%) | 14 (1.4%) |
| 45 to 59 Minutes | 63 (5.6%) | 38 (3.7%) |
| 60 to 89 Minutes | 60 (5.3%) | 18 (1.8%) |
| 90 or more Minutes | 27 (2.4%) | 15 (1.5%) |
Time of Departure to Work by Sex in Sheridan County
The most frequent times of departure to work in Sheridan County are 7:30 AM to 7:59 AM (212, 18.8%) for males and 7:00 AM to 7:29 AM (280, 27.3%) for females.
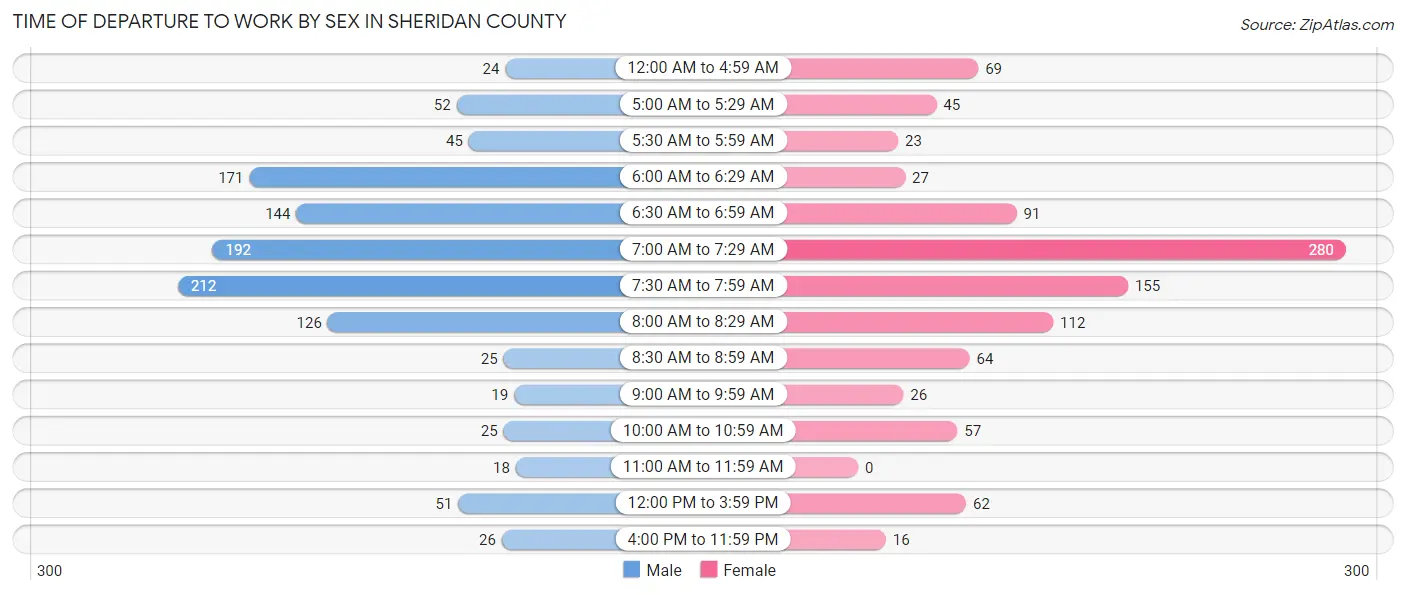
| Time of Departure | Male | Female |
| 12:00 AM to 4:59 AM | 24 (2.1%) | 69 (6.7%) |
| 5:00 AM to 5:29 AM | 52 (4.6%) | 45 (4.4%) |
| 5:30 AM to 5:59 AM | 45 (4.0%) | 23 (2.2%) |
| 6:00 AM to 6:29 AM | 171 (15.1%) | 27 (2.6%) |
| 6:30 AM to 6:59 AM | 144 (12.7%) | 91 (8.9%) |
| 7:00 AM to 7:29 AM | 192 (17.0%) | 280 (27.3%) |
| 7:30 AM to 7:59 AM | 212 (18.8%) | 155 (15.1%) |
| 8:00 AM to 8:29 AM | 126 (11.2%) | 112 (10.9%) |
| 8:30 AM to 8:59 AM | 25 (2.2%) | 64 (6.2%) |
| 9:00 AM to 9:59 AM | 19 (1.7%) | 26 (2.5%) |
| 10:00 AM to 10:59 AM | 25 (2.2%) | 57 (5.6%) |
| 11:00 AM to 11:59 AM | 18 (1.6%) | 0 (0.0%) |
| 12:00 PM to 3:59 PM | 51 (4.5%) | 62 (6.0%) |
| 4:00 PM to 11:59 PM | 26 (2.3%) | 16 (1.6%) |
| Total | 1,130 (100.0%) | 1,027 (100.0%) |
Housing Occupancy in Sheridan County
Occupancy by Ownership in Sheridan County
Of the total 2,101 dwellings in Sheridan County, owner-occupied units account for 1,462 (69.6%), while renter-occupied units make up 639 (30.4%).
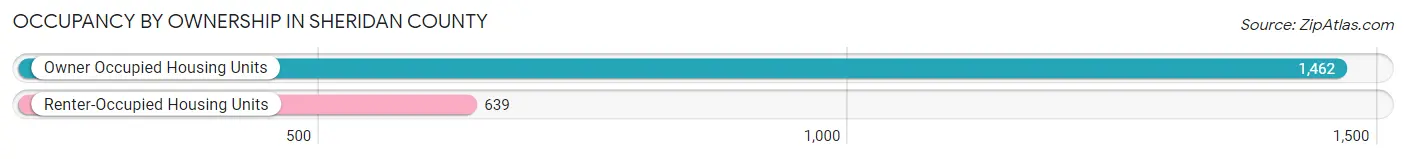
| Occupancy | # Housing Units | % Housing Units |
| Owner Occupied Housing Units | 1,462 | 69.6% |
| Renter-Occupied Housing Units | 639 | 30.4% |
| Total Occupied Housing Units | 2,101 | 100.0% |
Occupancy by Household Size in Sheridan County
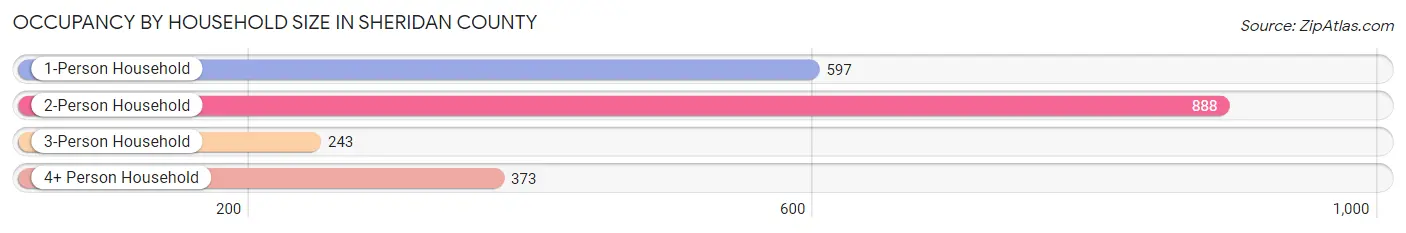
| Household Size | # Housing Units | % Housing Units |
| 1-Person Household | 597 | 28.4% |
| 2-Person Household | 888 | 42.3% |
| 3-Person Household | 243 | 11.6% |
| 4+ Person Household | 373 | 17.7% |
| Total Housing Units | 2,101 | 100.0% |
Occupancy by Ownership by Household Size in Sheridan County
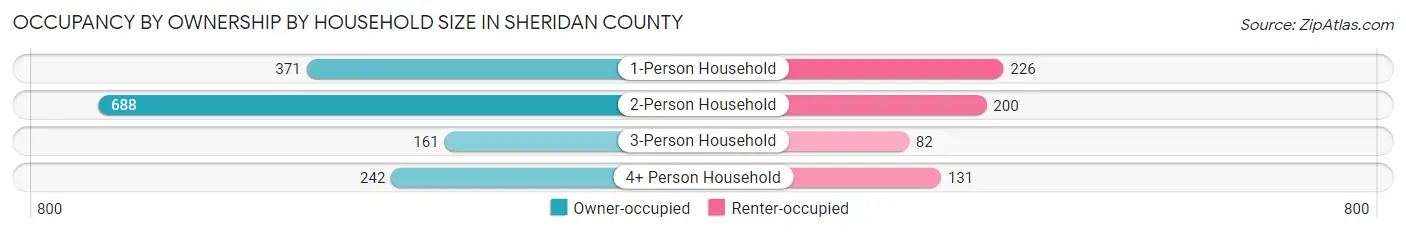
| Household Size | Owner-occupied | Renter-occupied |
| 1-Person Household | 371 (62.1%) | 226 (37.9%) |
| 2-Person Household | 688 (77.5%) | 200 (22.5%) |
| 3-Person Household | 161 (66.3%) | 82 (33.7%) |
| 4+ Person Household | 242 (64.9%) | 131 (35.1%) |
| Total Housing Units | 1,462 (69.6%) | 639 (30.4%) |
Occupancy by Educational Attainment in Sheridan County
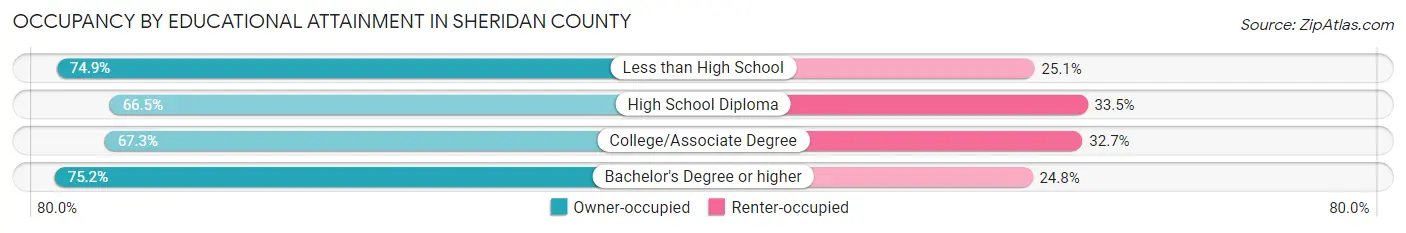
| Household Size | Owner-occupied | Renter-occupied |
| Less than High School | 146 (74.9%) | 49 (25.1%) |
| High School Diploma | 383 (66.5%) | 193 (33.5%) |
| College/Associate Degree | 572 (67.3%) | 278 (32.7%) |
| Bachelor's Degree or higher | 361 (75.2%) | 119 (24.8%) |
Occupancy by Age of Householder in Sheridan County
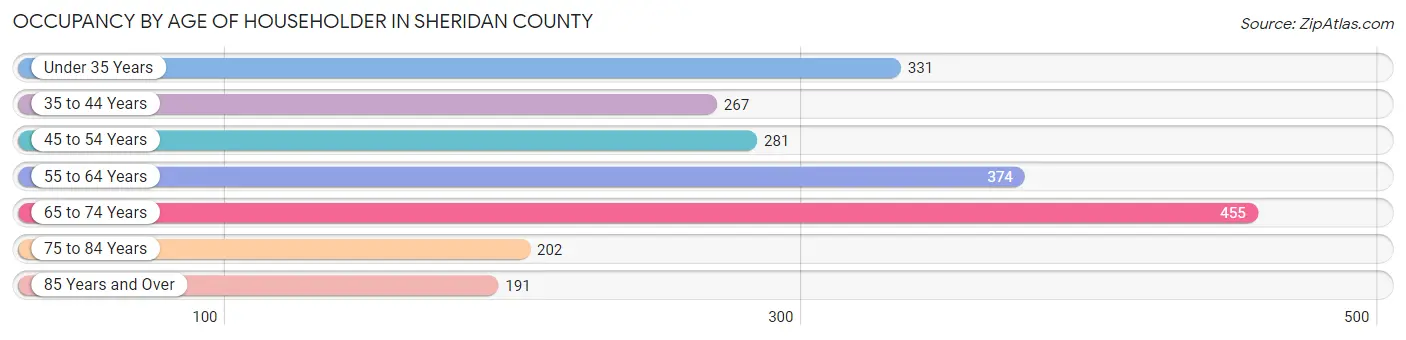
| Age Bracket | # Households | % Households |
| Under 35 Years | 331 | 15.8% |
| 35 to 44 Years | 267 | 12.7% |
| 45 to 54 Years | 281 | 13.4% |
| 55 to 64 Years | 374 | 17.8% |
| 65 to 74 Years | 455 | 21.7% |
| 75 to 84 Years | 202 | 9.6% |
| 85 Years and Over | 191 | 9.1% |
| Total | 2,101 | 100.0% |
Housing Finances in Sheridan County
Median Income by Occupancy in Sheridan County
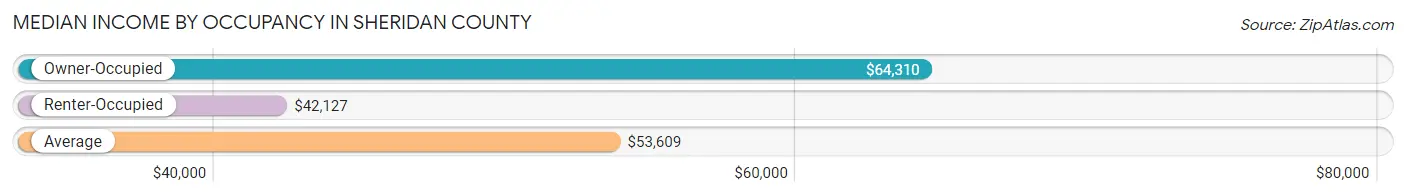
| Occupancy Type | # Households | Median Income |
| Owner-Occupied | 1,462 (69.6%) | $64,310 |
| Renter-Occupied | 639 (30.4%) | $42,127 |
| Average | 2,101 (100.0%) | $53,609 |
Occupancy by Householder Income Bracket in Sheridan County
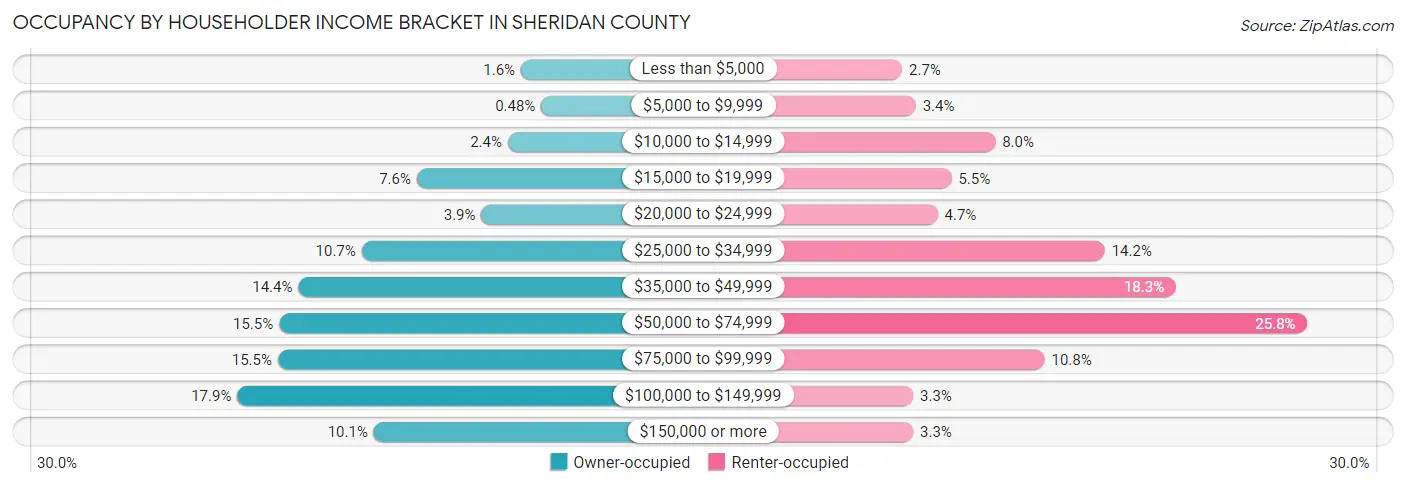
| Income Bracket | Owner-occupied | Renter-occupied |
| Less than $5,000 | 24 (1.6%) | 17 (2.7%) |
| $5,000 to $9,999 | 7 (0.5%) | 22 (3.4%) |
| $10,000 to $14,999 | 35 (2.4%) | 51 (8.0%) |
| $15,000 to $19,999 | 111 (7.6%) | 35 (5.5%) |
| $20,000 to $24,999 | 57 (3.9%) | 30 (4.7%) |
| $25,000 to $34,999 | 157 (10.7%) | 91 (14.2%) |
| $35,000 to $49,999 | 210 (14.4%) | 117 (18.3%) |
| $50,000 to $74,999 | 226 (15.5%) | 165 (25.8%) |
| $75,000 to $99,999 | 227 (15.5%) | 69 (10.8%) |
| $100,000 to $149,999 | 261 (17.8%) | 21 (3.3%) |
| $150,000 or more | 147 (10.1%) | 21 (3.3%) |
| Total | 1,462 (100.0%) | 639 (100.0%) |
Monthly Housing Cost Tiers in Sheridan County
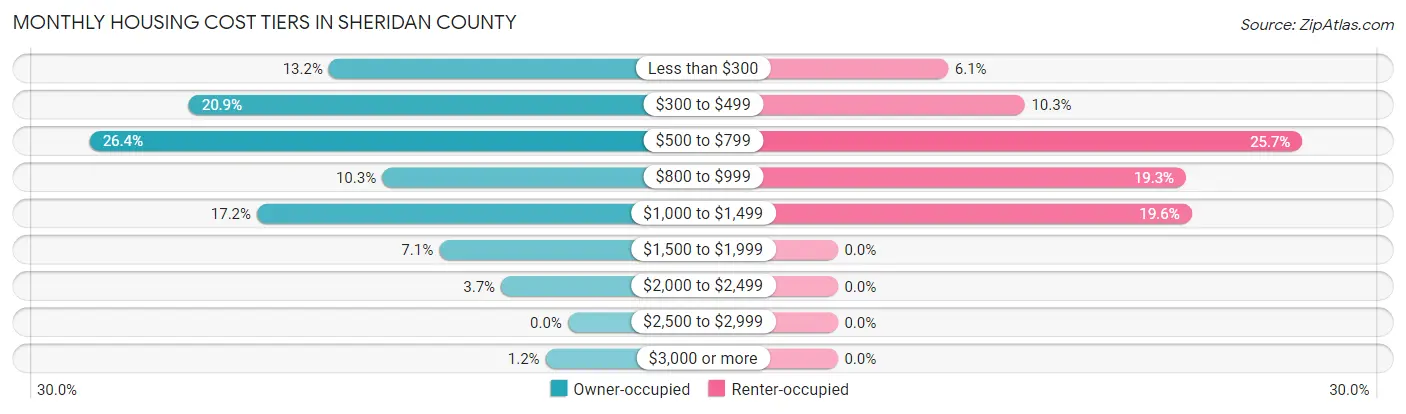
| Monthly Cost | Owner-occupied | Renter-occupied |
| Less than $300 | 193 (13.2%) | 39 (6.1%) |
| $300 to $499 | 306 (20.9%) | 66 (10.3%) |
| $500 to $799 | 386 (26.4%) | 164 (25.7%) |
| $800 to $999 | 150 (10.3%) | 123 (19.3%) |
| $1,000 to $1,499 | 251 (17.2%) | 125 (19.6%) |
| $1,500 to $1,999 | 104 (7.1%) | 0 (0.0%) |
| $2,000 to $2,499 | 54 (3.7%) | 0 (0.0%) |
| $2,500 to $2,999 | 0 (0.0%) | 0 (0.0%) |
| $3,000 or more | 18 (1.2%) | 0 (0.0%) |
| Total | 1,462 (100.0%) | 639 (100.0%) |
Physical Housing Characteristics in Sheridan County
Housing Structures in Sheridan County
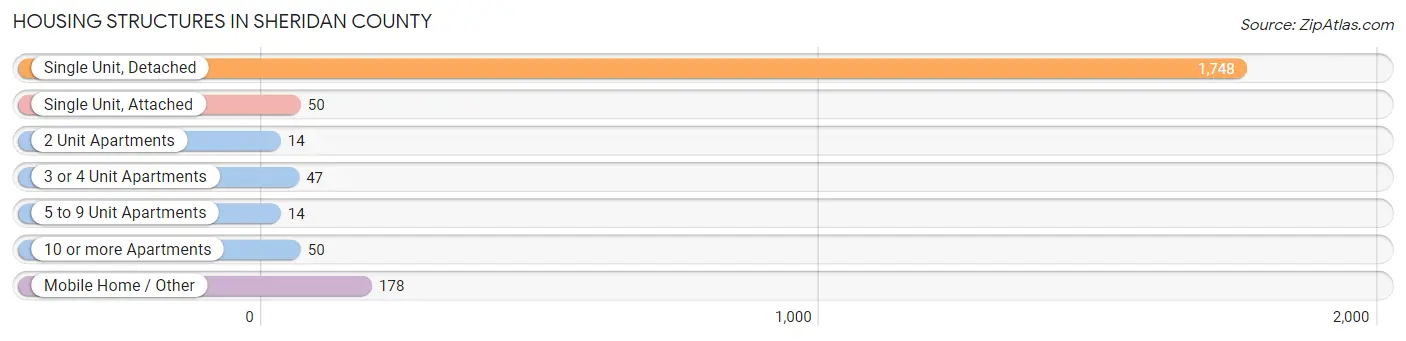
| Structure Type | # Housing Units | % Housing Units |
| Single Unit, Detached | 1,748 | 83.2% |
| Single Unit, Attached | 50 | 2.4% |
| 2 Unit Apartments | 14 | 0.7% |
| 3 or 4 Unit Apartments | 47 | 2.2% |
| 5 to 9 Unit Apartments | 14 | 0.7% |
| 10 or more Apartments | 50 | 2.4% |
| Mobile Home / Other | 178 | 8.5% |
| Total | 2,101 | 100.0% |
Housing Structures by Occupancy in Sheridan County
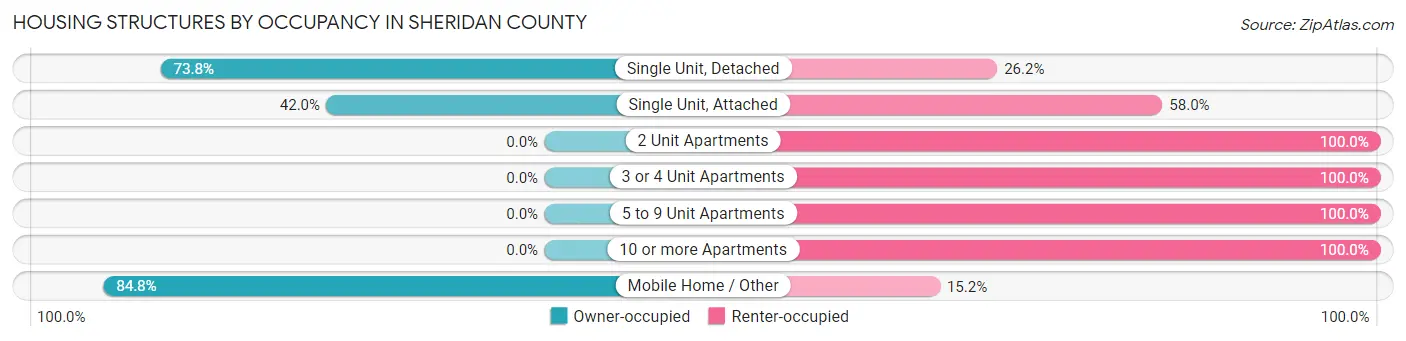
| Structure Type | Owner-occupied | Renter-occupied |
| Single Unit, Detached | 1,290 (73.8%) | 458 (26.2%) |
| Single Unit, Attached | 21 (42.0%) | 29 (58.0%) |
| 2 Unit Apartments | 0 (0.0%) | 14 (100.0%) |
| 3 or 4 Unit Apartments | 0 (0.0%) | 47 (100.0%) |
| 5 to 9 Unit Apartments | 0 (0.0%) | 14 (100.0%) |
| 10 or more Apartments | 0 (0.0%) | 50 (100.0%) |
| Mobile Home / Other | 151 (84.8%) | 27 (15.2%) |
| Total | 1,462 (69.6%) | 639 (30.4%) |
Housing Structures by Number of Rooms in Sheridan County
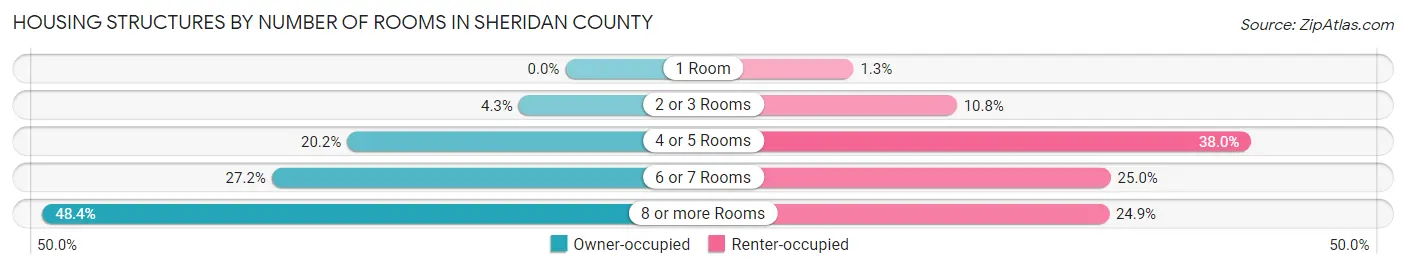
| Number of Rooms | Owner-occupied | Renter-occupied |
| 1 Room | 0 (0.0%) | 8 (1.3%) |
| 2 or 3 Rooms | 63 (4.3%) | 69 (10.8%) |
| 4 or 5 Rooms | 295 (20.2%) | 243 (38.0%) |
| 6 or 7 Rooms | 397 (27.2%) | 160 (25.0%) |
| 8 or more Rooms | 707 (48.4%) | 159 (24.9%) |
| Total | 1,462 (100.0%) | 639 (100.0%) |
Housing Structure by Heating Type in Sheridan County
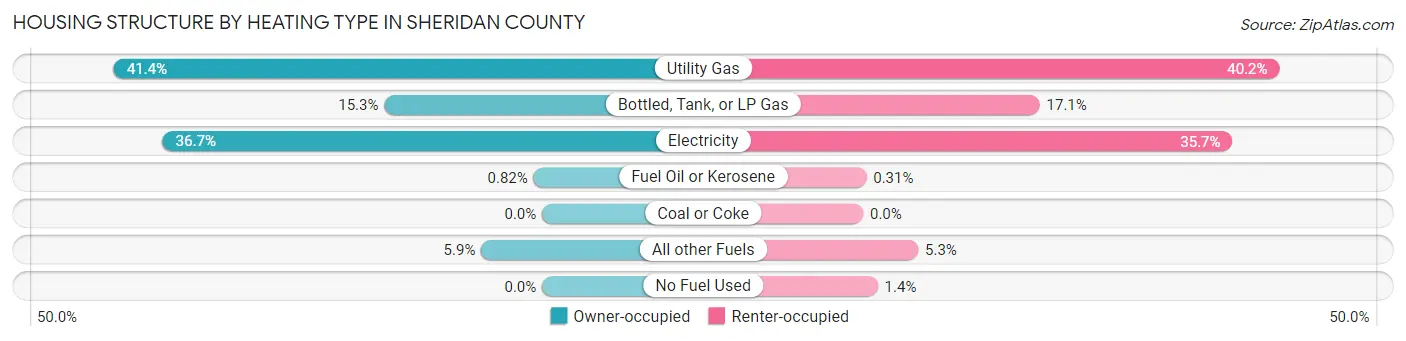
| Heating Type | Owner-occupied | Renter-occupied |
| Utility Gas | 605 (41.4%) | 257 (40.2%) |
| Bottled, Tank, or LP Gas | 223 (15.2%) | 109 (17.1%) |
| Electricity | 536 (36.7%) | 228 (35.7%) |
| Fuel Oil or Kerosene | 12 (0.8%) | 2 (0.3%) |
| Coal or Coke | 0 (0.0%) | 0 (0.0%) |
| All other Fuels | 86 (5.9%) | 34 (5.3%) |
| No Fuel Used | 0 (0.0%) | 9 (1.4%) |
| Total | 1,462 (100.0%) | 639 (100.0%) |
Household Vehicle Usage in Sheridan County
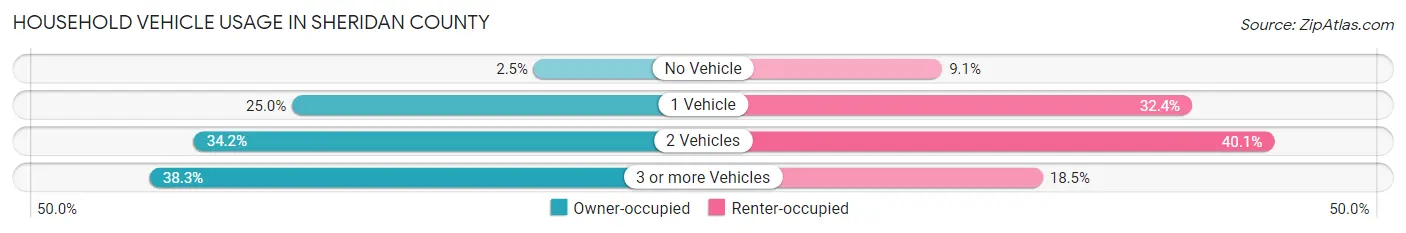
| Vehicles per Household | Owner-occupied | Renter-occupied |
| No Vehicle | 36 (2.5%) | 58 (9.1%) |
| 1 Vehicle | 366 (25.0%) | 207 (32.4%) |
| 2 Vehicles | 500 (34.2%) | 256 (40.1%) |
| 3 or more Vehicles | 560 (38.3%) | 118 (18.5%) |
| Total | 1,462 (100.0%) | 639 (100.0%) |
Real Estate & Mortgages in Sheridan County
Real Estate and Mortgage Overview in Sheridan County
| Characteristic | Without Mortgage | With Mortgage |
| Housing Units | 904 | 558 |
| Median Property Value | $84,800 | $117,000 |
| Median Household Income | $48,289 | $49 |
| Monthly Housing Costs | $479 | $1 |
| Real Estate Taxes | $1,211 | $3 |
Property Value by Mortgage Status in Sheridan County
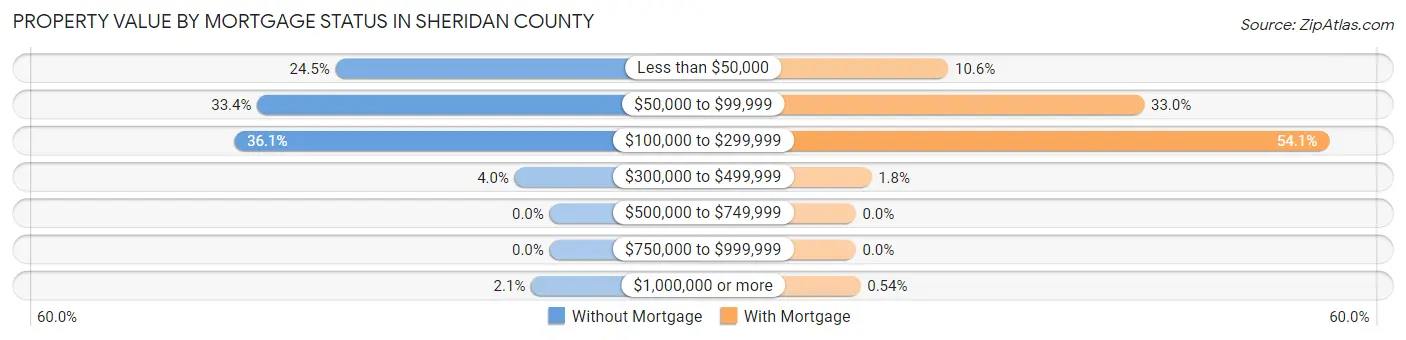
| Property Value | Without Mortgage | With Mortgage |
| Less than $50,000 | 221 (24.4%) | 59 (10.6%) |
| $50,000 to $99,999 | 302 (33.4%) | 184 (33.0%) |
| $100,000 to $299,999 | 326 (36.1%) | 302 (54.1%) |
| $300,000 to $499,999 | 36 (4.0%) | 10 (1.8%) |
| $500,000 to $749,999 | 0 (0.0%) | 0 (0.0%) |
| $750,000 to $999,999 | 0 (0.0%) | 0 (0.0%) |
| $1,000,000 or more | 19 (2.1%) | 3 (0.5%) |
| Total | 904 (100.0%) | 558 (100.0%) |
Household Income by Mortgage Status in Sheridan County
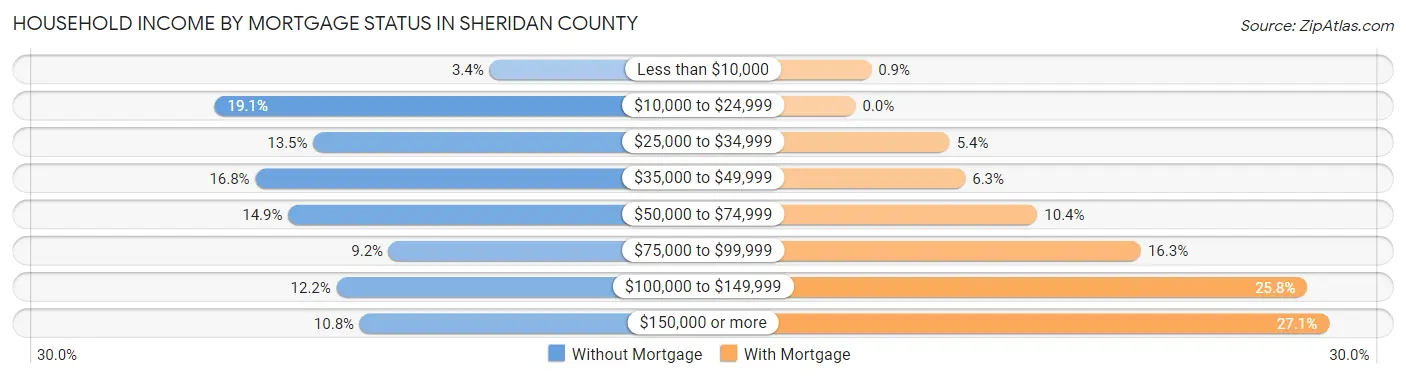
| Household Income | Without Mortgage | With Mortgage |
| Less than $10,000 | 31 (3.4%) | 5 (0.9%) |
| $10,000 to $24,999 | 173 (19.1%) | 0 (0.0%) |
| $25,000 to $34,999 | 122 (13.5%) | 30 (5.4%) |
| $35,000 to $49,999 | 152 (16.8%) | 35 (6.3%) |
| $50,000 to $74,999 | 135 (14.9%) | 58 (10.4%) |
| $75,000 to $99,999 | 83 (9.2%) | 91 (16.3%) |
| $100,000 to $149,999 | 110 (12.2%) | 144 (25.8%) |
| $150,000 or more | 98 (10.8%) | 151 (27.1%) |
| Total | 904 (100.0%) | 558 (100.0%) |
Property Value to Household Income Ratio in Sheridan County
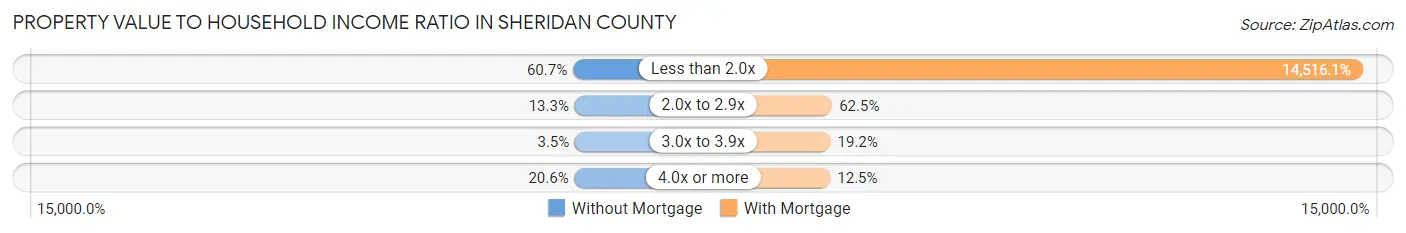
| Value-to-Income Ratio | Without Mortgage | With Mortgage |
| Less than 2.0x | 549 (60.7%) | 81,000 (14,516.1%) |
| 2.0x to 2.9x | 120 (13.3%) | 349 (62.5%) |
| 3.0x to 3.9x | 32 (3.5%) | 107 (19.2%) |
| 4.0x or more | 186 (20.6%) | 70 (12.5%) |
| Total | 904 (100.0%) | 558 (100.0%) |
Real Estate Taxes by Mortgage Status in Sheridan County
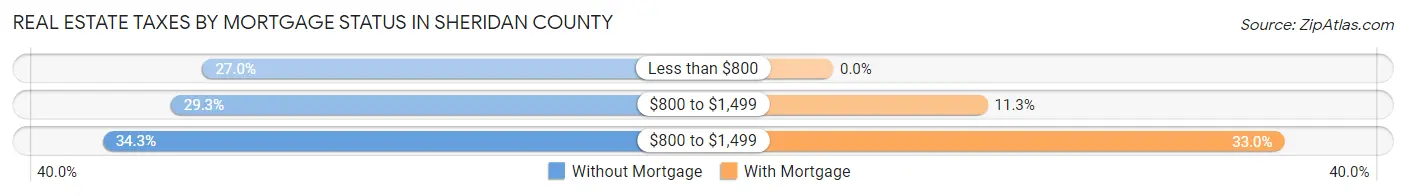
| Property Taxes | Without Mortgage | With Mortgage |
| Less than $800 | 244 (27.0%) | 0 (0.0%) |
| $800 to $1,499 | 265 (29.3%) | 63 (11.3%) |
| $800 to $1,499 | 310 (34.3%) | 184 (33.0%) |
| Total | 904 (100.0%) | 558 (100.0%) |
Health & Disability in Sheridan County
Health Insurance Coverage by Age in Sheridan County
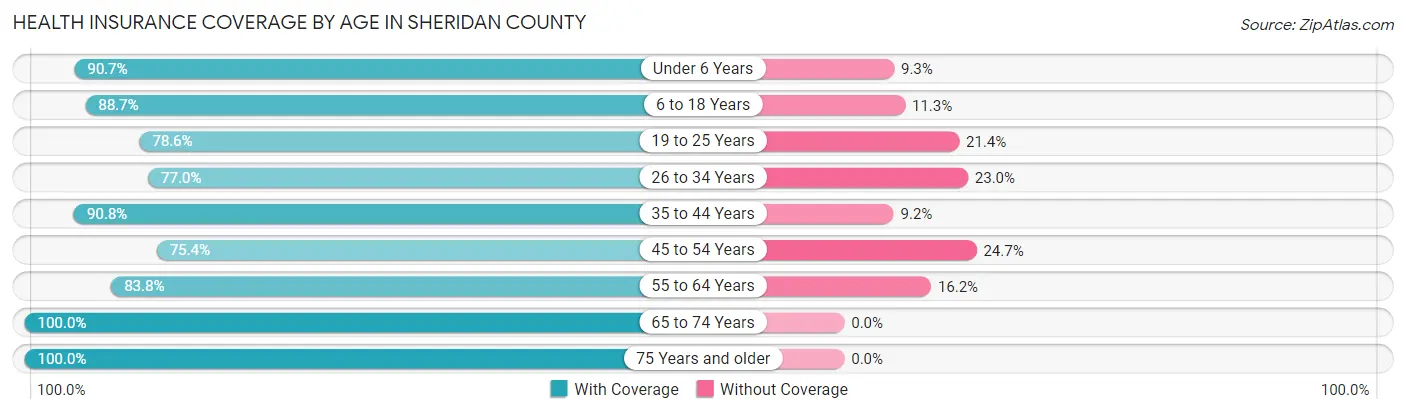
| Age Bracket | With Coverage | Without Coverage |
| Under 6 Years | 342 (90.7%) | 35 (9.3%) |
| 6 to 18 Years | 689 (88.7%) | 88 (11.3%) |
| 19 to 25 Years | 312 (78.6%) | 85 (21.4%) |
| 26 to 34 Years | 324 (77.0%) | 97 (23.0%) |
| 35 to 44 Years | 464 (90.8%) | 47 (9.2%) |
| 45 to 54 Years | 425 (75.3%) | 139 (24.6%) |
| 55 to 64 Years | 576 (83.8%) | 111 (16.2%) |
| 65 to 74 Years | 727 (100.0%) | 0 (0.0%) |
| 75 Years and older | 530 (100.0%) | 0 (0.0%) |
| Total | 4,389 (87.9%) | 602 (12.1%) |
Health Insurance Coverage by Citizenship Status in Sheridan County
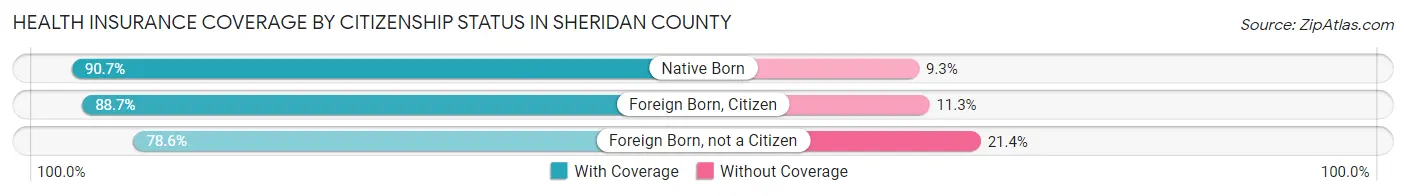
| Citizenship Status | With Coverage | Without Coverage |
| Native Born | 342 (90.7%) | 35 (9.3%) |
| Foreign Born, Citizen | 689 (88.7%) | 88 (11.3%) |
| Foreign Born, not a Citizen | 312 (78.6%) | 85 (21.4%) |
Health Insurance Coverage by Household Income in Sheridan County
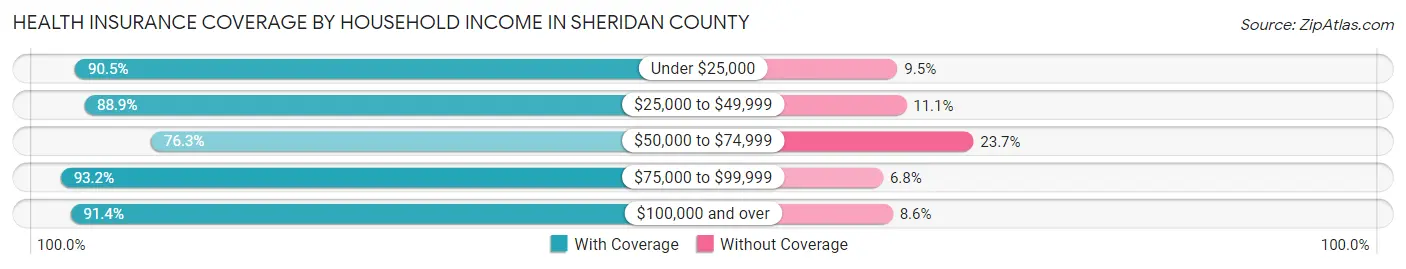
| Household Income | With Coverage | Without Coverage |
| Under $25,000 | 535 (90.5%) | 56 (9.5%) |
| $25,000 to $49,999 | 909 (88.9%) | 114 (11.1%) |
| $50,000 to $74,999 | 798 (76.3%) | 248 (23.7%) |
| $75,000 to $99,999 | 811 (93.2%) | 59 (6.8%) |
| $100,000 and over | 1,284 (91.4%) | 121 (8.6%) |
Public vs Private Health Insurance Coverage by Age in Sheridan County
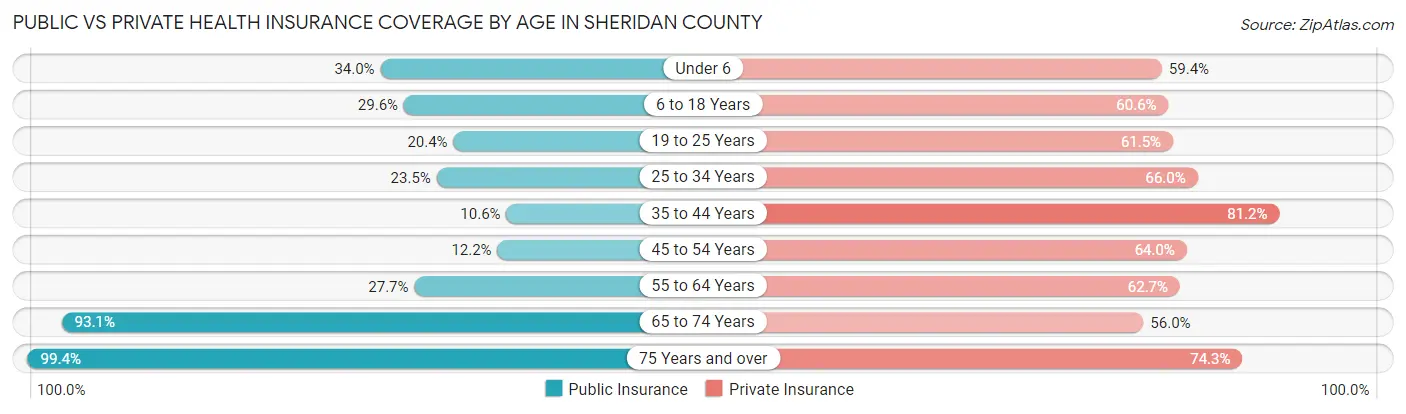
| Age Bracket | Public Insurance | Private Insurance |
| Under 6 | 128 (34.0%) | 224 (59.4%) |
| 6 to 18 Years | 230 (29.6%) | 471 (60.6%) |
| 19 to 25 Years | 81 (20.4%) | 244 (61.5%) |
| 25 to 34 Years | 99 (23.5%) | 278 (66.0%) |
| 35 to 44 Years | 54 (10.6%) | 415 (81.2%) |
| 45 to 54 Years | 69 (12.2%) | 361 (64.0%) |
| 55 to 64 Years | 190 (27.7%) | 431 (62.7%) |
| 65 to 74 Years | 677 (93.1%) | 407 (56.0%) |
| 75 Years and over | 527 (99.4%) | 394 (74.3%) |
| Total | 2,055 (41.2%) | 3,225 (64.6%) |
Disability Status by Sex by Age in Sheridan County
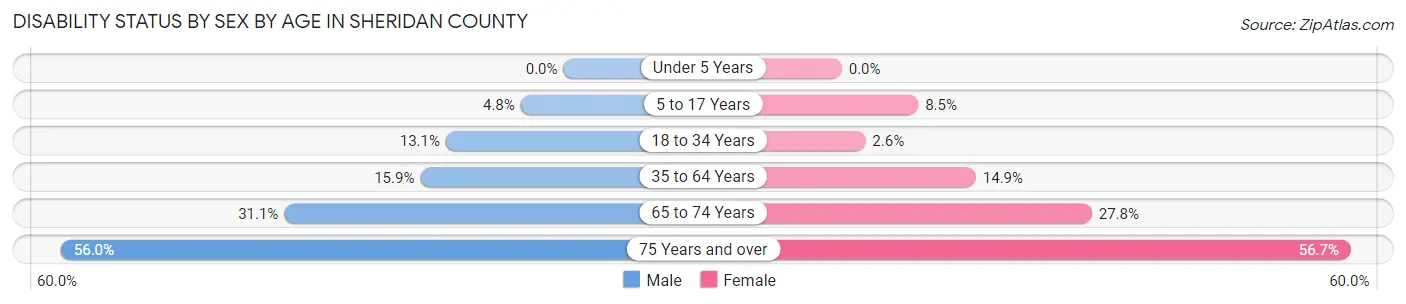
| Age Bracket | Male | Female |
| Under 5 Years | 0 (0.0%) | 0 (0.0%) |
| 5 to 17 Years | 18 (4.8%) | 33 (8.5%) |
| 18 to 34 Years | 58 (13.1%) | 11 (2.6%) |
| 35 to 64 Years | 142 (15.9%) | 130 (14.9%) |
| 65 to 74 Years | 111 (31.1%) | 103 (27.8%) |
| 75 Years and over | 108 (56.0%) | 191 (56.7%) |
Disability Class by Sex by Age in Sheridan County
Disability Class: Hearing Difficulty
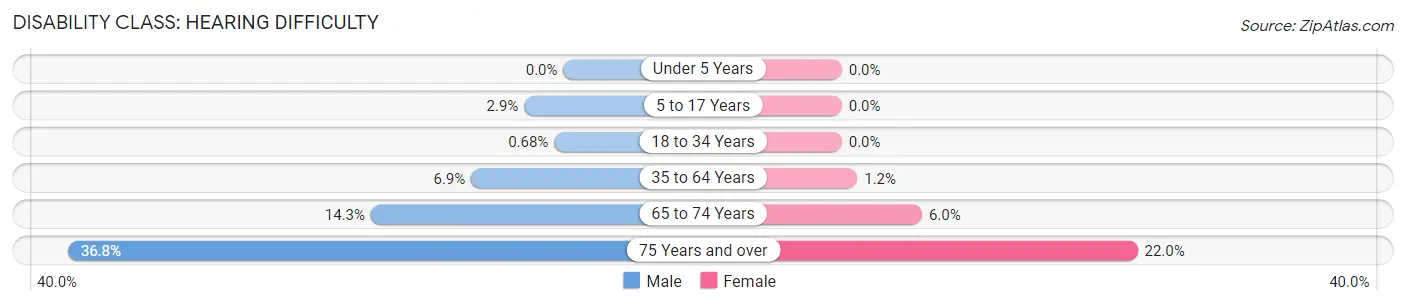
| Age Bracket | Male | Female |
| Under 5 Years | 0 (0.0%) | 0 (0.0%) |
| 5 to 17 Years | 11 (2.9%) | 0 (0.0%) |
| 18 to 34 Years | 3 (0.7%) | 0 (0.0%) |
| 35 to 64 Years | 61 (6.9%) | 10 (1.1%) |
| 65 to 74 Years | 51 (14.3%) | 22 (5.9%) |
| 75 Years and over | 71 (36.8%) | 74 (22.0%) |
Disability Class: Vision Difficulty
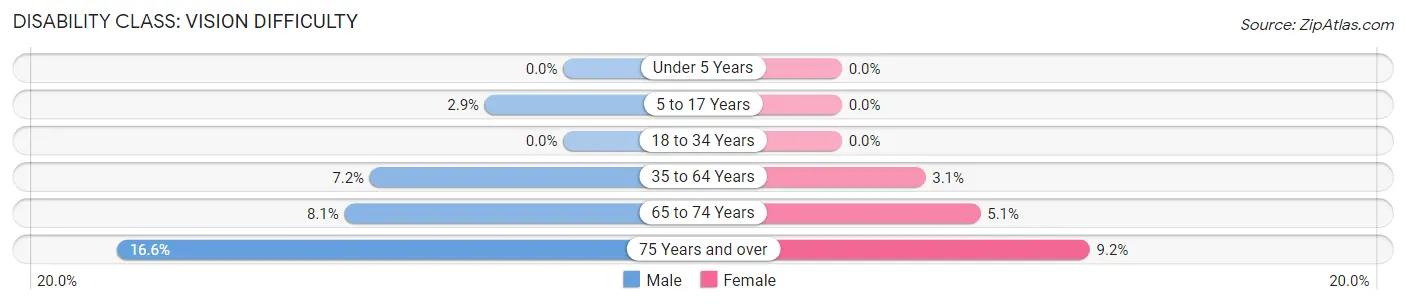
| Age Bracket | Male | Female |
| Under 5 Years | 0 (0.0%) | 0 (0.0%) |
| 5 to 17 Years | 11 (2.9%) | 0 (0.0%) |
| 18 to 34 Years | 0 (0.0%) | 0 (0.0%) |
| 35 to 64 Years | 64 (7.2%) | 27 (3.1%) |
| 65 to 74 Years | 29 (8.1%) | 19 (5.1%) |
| 75 Years and over | 32 (16.6%) | 31 (9.2%) |
Disability Class: Cognitive Difficulty
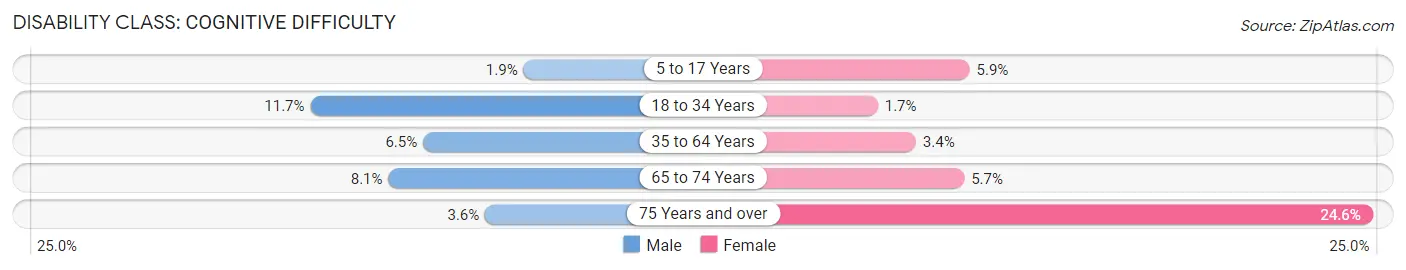
| Age Bracket | Male | Female |
| 5 to 17 Years | 7 (1.8%) | 23 (5.9%) |
| 18 to 34 Years | 52 (11.7%) | 7 (1.7%) |
| 35 to 64 Years | 58 (6.5%) | 30 (3.4%) |
| 65 to 74 Years | 29 (8.1%) | 21 (5.7%) |
| 75 Years and over | 7 (3.6%) | 83 (24.6%) |
Disability Class: Ambulatory Difficulty
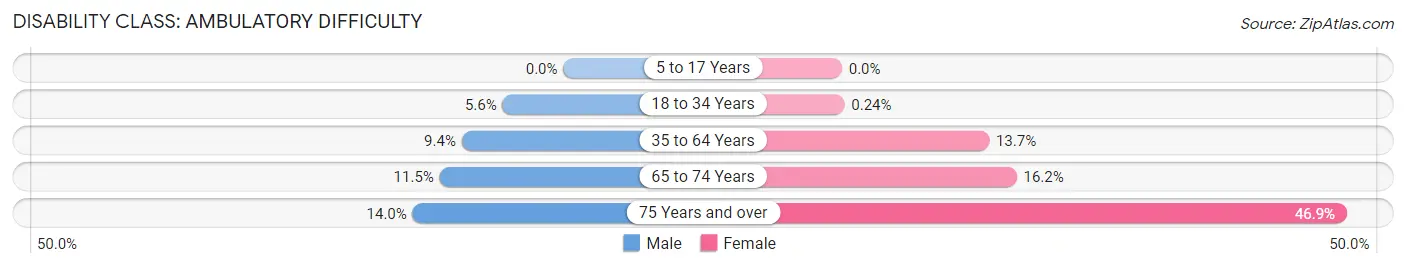
| Age Bracket | Male | Female |
| 5 to 17 Years | 0 (0.0%) | 0 (0.0%) |
| 18 to 34 Years | 25 (5.6%) | 1 (0.2%) |
| 35 to 64 Years | 84 (9.4%) | 119 (13.7%) |
| 65 to 74 Years | 41 (11.5%) | 60 (16.2%) |
| 75 Years and over | 27 (14.0%) | 158 (46.9%) |
Disability Class: Self-Care Difficulty
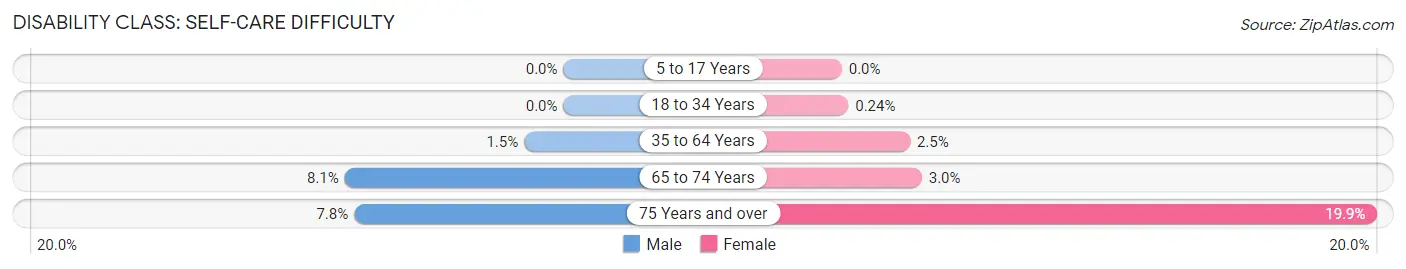
| Age Bracket | Male | Female |
| 5 to 17 Years | 0 (0.0%) | 0 (0.0%) |
| 18 to 34 Years | 0 (0.0%) | 1 (0.2%) |
| 35 to 64 Years | 13 (1.5%) | 22 (2.5%) |
| 65 to 74 Years | 29 (8.1%) | 11 (3.0%) |
| 75 Years and over | 15 (7.8%) | 67 (19.9%) |
Technology Access in Sheridan County
Computing Device Access in Sheridan County
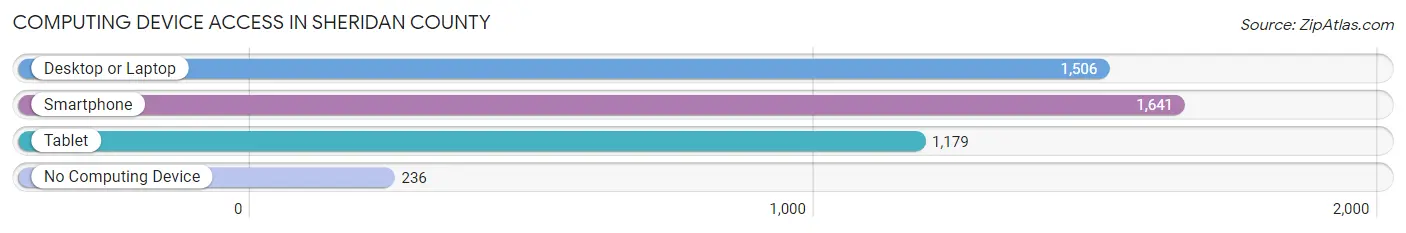
| Device Type | # Households | % Households |
| Desktop or Laptop | 1,506 | 71.7% |
| Smartphone | 1,641 | 78.1% |
| Tablet | 1,179 | 56.1% |
| No Computing Device | 236 | 11.2% |
| Total | 2,101 | 100.0% |
Internet Access in Sheridan County
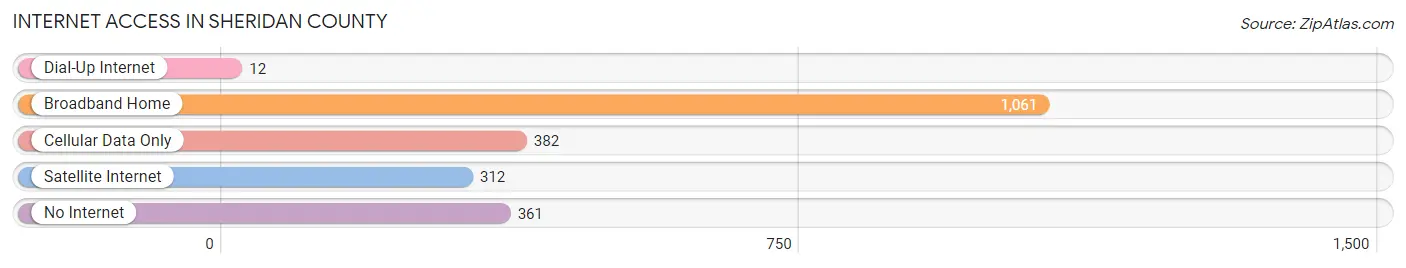
| Internet Type | # Households | % Households |
| Dial-Up Internet | 12 | 0.6% |
| Broadband Home | 1,061 | 50.5% |
| Cellular Data Only | 382 | 18.2% |
| Satellite Internet | 312 | 14.8% |
| No Internet | 361 | 17.2% |
| Total | 2,101 | 100.0% |
Sheridan County Summary
Sheridan County is located in the north-central part of Nebraska, in the Great Plains region of the United States. It is bordered by Dawes County to the north, Sioux County to the east, Box Butte County to the south, and Scotts Bluff County to the west. The county seat is Rushville, and the largest city is Gordon.
History
Sheridan County was established in 1885 and named after General Philip Sheridan, a Civil War hero. The county was originally part of Sioux County, which was created in 1871. The first settlers in the area were ranchers and farmers, who arrived in the late 1870s. The first post office was established in 1883.
The county was largely rural until the early 20th century, when the railroad arrived. This brought an influx of new settlers and businesses, and the county began to develop. The county seat was moved from Rushville to Gordon in 1910.
Geography
Sheridan County covers an area of 1,717 square miles, making it the fifth-largest county in Nebraska. The county is mostly flat, with some rolling hills in the east. The terrain is mostly grassland, with some areas of sandhills and wooded areas. The county is drained by the North Platte River and its tributaries.
The county has a semi-arid climate, with hot summers and cold winters. The average annual precipitation is about 17 inches.
Economy
The economy of Sheridan County is largely based on agriculture. The main crops are corn, wheat, and hay. Cattle and sheep are also raised in the county.
The county also has some manufacturing and service industries. The largest employers in the county are the Gordon-Rushville Public Schools, the Gordon Memorial Hospital, and the Gordon-Rushville Community College.
Demographics
As of the 2010 census, the population of Sheridan County was 5,469. The population is mostly white (96.2%), with small percentages of Native American (1.2%), African American (0.5%), and Asian (0.3%) residents. The median household income is $45,813, and the median age is 43.
The county is served by two school districts, Gordon-Rushville Public Schools and Sioux County Public Schools. The county also has two public libraries, the Gordon Public Library and the Rushville Public Library.
Common Questions
What is Per Capita Income in Sheridan County?
Per Capita income in Sheridan County is $31,699.
What is the Median Family Income in Sheridan County?
Median Family Income in Sheridan County is $67,454.
What is the Median Household income in Sheridan County?
Median Household Income in Sheridan County is $53,609.
What is Income or Wage Gap in Sheridan County?
Income or Wage Gap in Sheridan County is 43.1%.
Women in Sheridan County earn 56.9 cents for every dollar earned by a man.
What is Inequality or Gini Index in Sheridan County?
Inequality or Gini Index in Sheridan County is 0.44.
What is the Total Population of Sheridan County?
Total Population of Sheridan County is 5,102.
What is the Total Male Population of Sheridan County?
Total Male Population of Sheridan County is 2,558.
What is the Total Female Population of Sheridan County?
Total Female Population of Sheridan County is 2,544.
What is the Ratio of Males per 100 Females in Sheridan County?
There are 100.55 Males per 100 Females in Sheridan County.
What is the Ratio of Females per 100 Males in Sheridan County?
There are 99.45 Females per 100 Males in Sheridan County.
What is the Median Population Age in Sheridan County?
Median Population Age in Sheridan County is 45.8 Years.
What is the Average Family Size in Sheridan County
Average Family Size in Sheridan County is 2.8 People.
What is the Average Household Size in Sheridan County
Average Household Size in Sheridan County is 2.4 People.
How Large is the Labor Force in Sheridan County?
There are 2,454 People in the Labor Forcein in Sheridan County.
What is the Percentage of People in the Labor Force in Sheridan County?
59.4% of People are in the Labor Force in Sheridan County.
What is the Unemployment Rate in Sheridan County?
Unemployment Rate in Sheridan County is 2.2%.