Richardson County, NE Map & Demographics
Richardson County Map
Richardson County Overview
$32,336
PER CAPITA INCOME
$69,819
AVG FAMILY INCOME
$50,321
AVG HOUSEHOLD INCOME
43.4%
WAGE / INCOME GAP [ % ]
56.6¢/ $1
WAGE / INCOME GAP [ $ ]
$9,057
FAMILY INCOME DEFICIT
0.44
INEQUALITY / GINI INDEX
7,850
TOTAL POPULATION
3,981
MALE POPULATION
3,869
FEMALE POPULATION
102.89
MALES / 100 FEMALES
97.19
FEMALES / 100 MALES
47.1
MEDIAN AGE
2.8
AVG FAMILY SIZE
2.1
AVG HOUSEHOLD SIZE
3,958
LABOR FORCE [ PEOPLE ]
61.8%
PERCENT IN LABOR FORCE
4.7%
UNEMPLOYMENT RATE
Richardson County Area Codes
Income in Richardson County
Income Overview in Richardson County
Per Capita Income in Richardson County is $32,336, while median incomes of families and households are $69,819 and $50,321 respectively.
| Characteristic | Number | Measure |
| Per Capita Income | 7,850 | $32,336 |
| Median Family Income | 2,141 | $69,819 |
| Mean Family Income | 2,141 | $84,220 |
| Median Household Income | 3,587 | $50,321 |
| Mean Household Income | 3,587 | $69,224 |
| Income Deficit | 2,141 | $9,057 |
| Wage / Income Gap (%) | 7,850 | 43.43% |
| Wage / Income Gap ($) | 7,850 | 56.57¢ per $1 |
| Gini / Inequality Index | 7,850 | 0.44 |
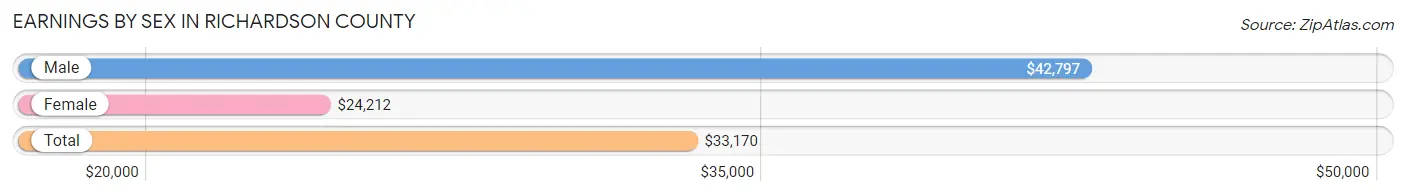
Earnings by Sex in Richardson County
Average Earnings in Richardson County are $33,170, $42,797 for men and $24,212 for women, a difference of 43.4%.
| Sex | Number | Average Earnings |
| Male | 2,327 (53.4%) | $42,797 |
| Female | 2,027 (46.6%) | $24,212 |
| Total | 4,354 (100.0%) | $33,170 |
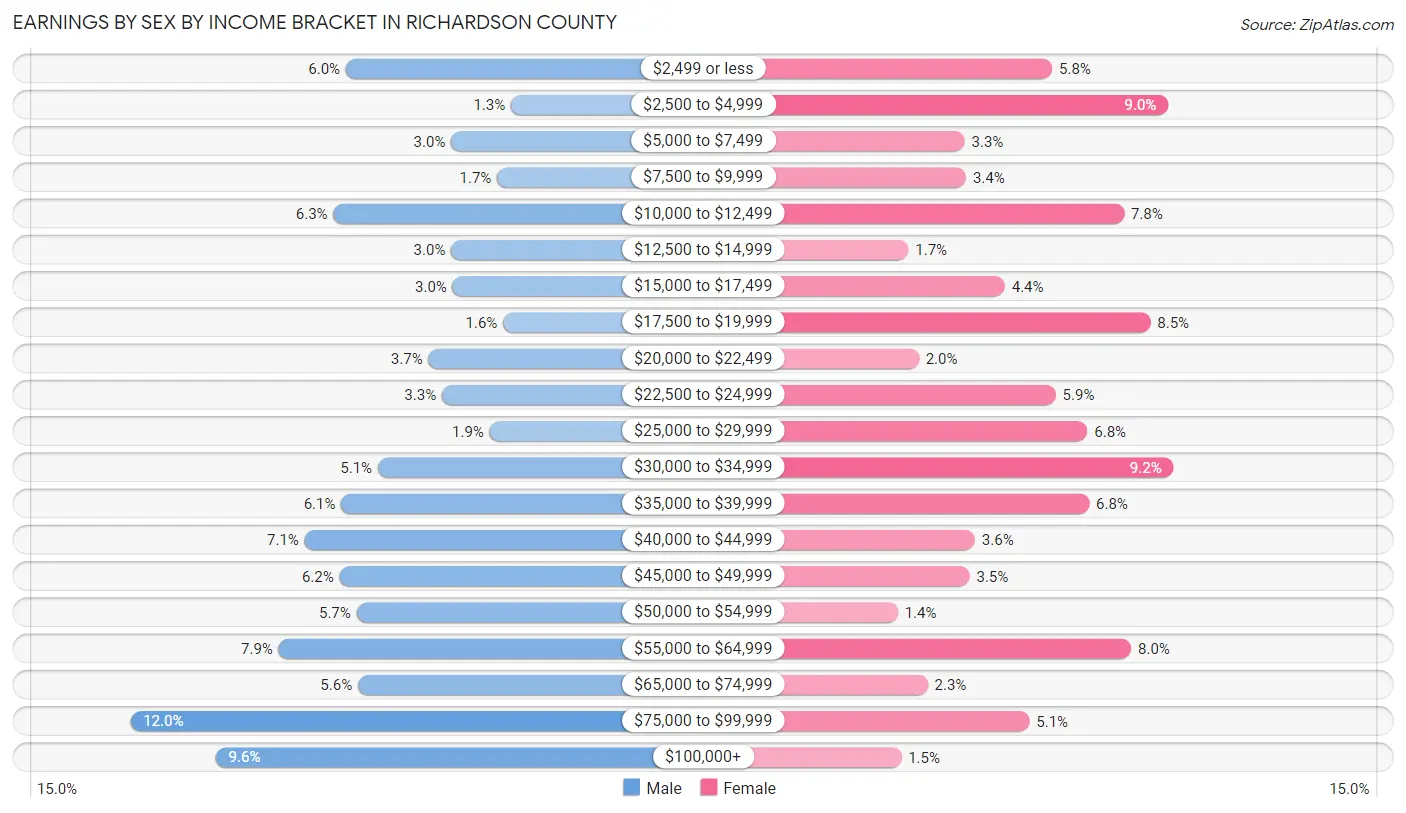
Earnings by Sex by Income Bracket in Richardson County
The most common earnings brackets in Richardson County are $75,000 to $99,999 for men (280 | 12.0%) and $30,000 to $34,999 for women (186 | 9.2%).
| Income | Male | Female |
| $2,499 or less | 139 (6.0%) | 117 (5.8%) |
| $2,500 to $4,999 | 31 (1.3%) | 183 (9.0%) |
| $5,000 to $7,499 | 70 (3.0%) | 67 (3.3%) |
| $7,500 to $9,999 | 40 (1.7%) | 68 (3.4%) |
| $10,000 to $12,499 | 147 (6.3%) | 158 (7.8%) |
| $12,500 to $14,999 | 70 (3.0%) | 35 (1.7%) |
| $15,000 to $17,499 | 69 (3.0%) | 90 (4.4%) |
| $17,500 to $19,999 | 36 (1.5%) | 173 (8.5%) |
| $20,000 to $22,499 | 85 (3.6%) | 41 (2.0%) |
| $22,500 to $24,999 | 76 (3.3%) | 119 (5.9%) |
| $25,000 to $29,999 | 45 (1.9%) | 137 (6.8%) |
| $30,000 to $34,999 | 118 (5.1%) | 186 (9.2%) |
| $35,000 to $39,999 | 142 (6.1%) | 138 (6.8%) |
| $40,000 to $44,999 | 166 (7.1%) | 73 (3.6%) |
| $45,000 to $49,999 | 143 (6.1%) | 70 (3.5%) |
| $50,000 to $54,999 | 132 (5.7%) | 29 (1.4%) |
| $55,000 to $64,999 | 183 (7.9%) | 162 (8.0%) |
| $65,000 to $74,999 | 131 (5.6%) | 46 (2.3%) |
| $75,000 to $99,999 | 280 (12.0%) | 104 (5.1%) |
| $100,000+ | 224 (9.6%) | 31 (1.5%) |
| Total | 2,327 (100.0%) | 2,027 (100.0%) |
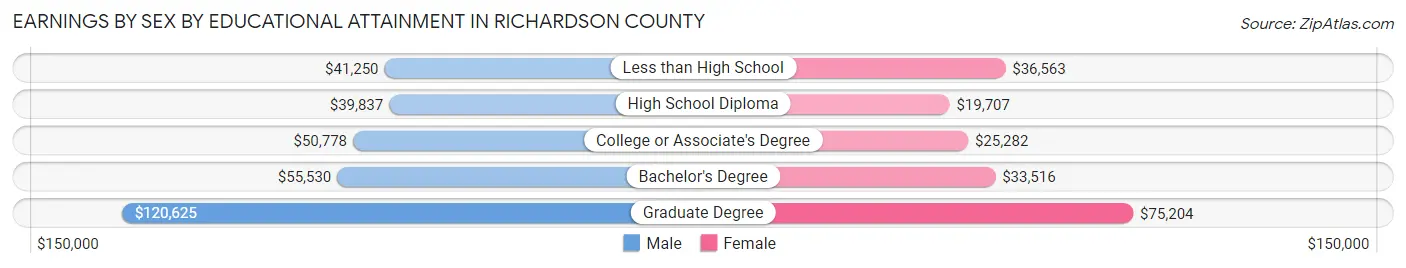
Earnings by Sex by Educational Attainment in Richardson County
Average earnings in Richardson County are $46,292 for men and $27,447 for women, a difference of 40.7%. Men with an educational attainment of graduate degree enjoy the highest average annual earnings of $120,625, while those with high school diploma education earn the least with $39,837. Women with an educational attainment of graduate degree earn the most with the average annual earnings of $75,204, while those with high school diploma education have the smallest earnings of $19,707.
| Educational Attainment | Male Income | Female Income |
| Less than High School | $41,250 | $36,563 |
| High School Diploma | $39,837 | $19,707 |
| College or Associate's Degree | $50,778 | $25,282 |
| Bachelor's Degree | $55,530 | $33,516 |
| Graduate Degree | $120,625 | $75,204 |
| Total | $46,292 | $27,447 |
Family Income in Richardson County
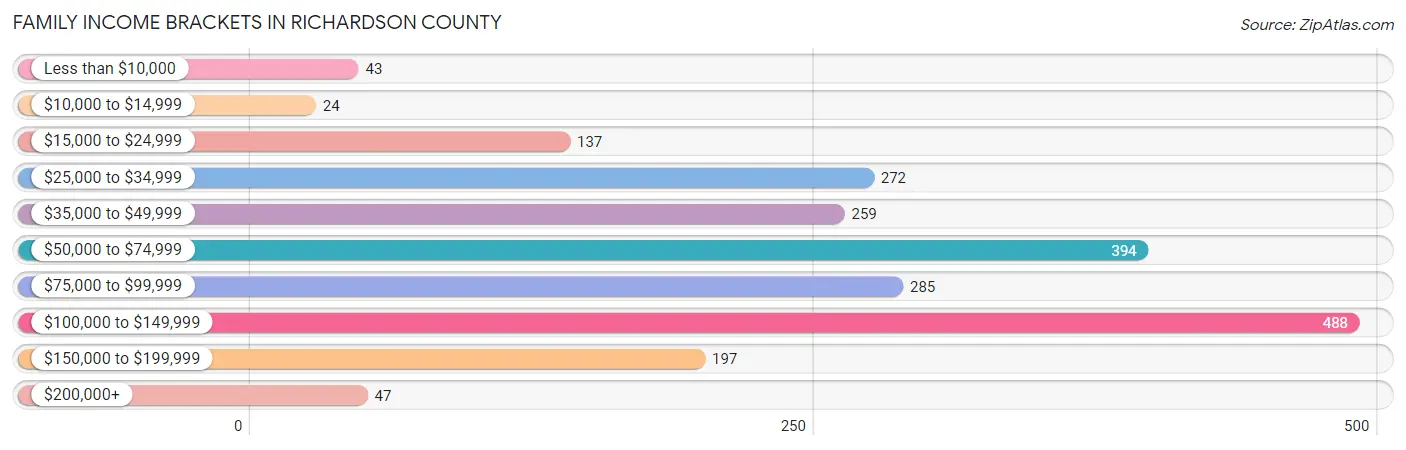
Family Income Brackets in Richardson County
According to the Richardson County family income data, there are 488 families falling into the $100,000 to $149,999 income range, which is the most common income bracket and makes up 22.8% of all families. Conversely, the $10,000 to $14,999 income bracket is the least frequent group with only 24 families (1.1%) belonging to this category.
| Income Bracket | # Families | % Families |
| Less than $10,000 | 43 | 2.0% |
| $10,000 to $14,999 | 24 | 1.1% |
| $15,000 to $24,999 | 137 | 6.4% |
| $25,000 to $34,999 | 272 | 12.7% |
| $35,000 to $49,999 | 259 | 12.1% |
| $50,000 to $74,999 | 394 | 18.4% |
| $75,000 to $99,999 | 285 | 13.3% |
| $100,000 to $149,999 | 488 | 22.8% |
| $150,000 to $199,999 | 197 | 9.2% |
| $200,000+ | 47 | 2.2% |
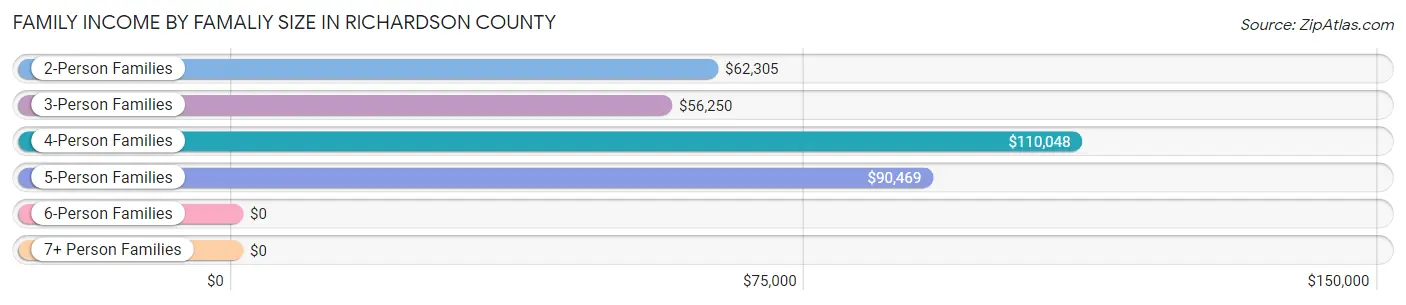
Family Income by Famaliy Size in Richardson County
4-person families (315 | 14.7%) account for the highest median family income in Richardson County with $110,048 per family, while 2-person families (1,303 | 60.9%) have the highest median income of $31,152 per family member.
| Income Bracket | # Families | Median Income |
| 2-Person Families | 1,303 (60.9%) | $62,305 |
| 3-Person Families | 346 (16.2%) | $56,250 |
| 4-Person Families | 315 (14.7%) | $110,048 |
| 5-Person Families | 117 (5.5%) | $90,469 |
| 6-Person Families | 60 (2.8%) | $0 |
| 7+ Person Families | 0 (0.0%) | $0 |
| Total | 2,141 (100.0%) | $69,819 |
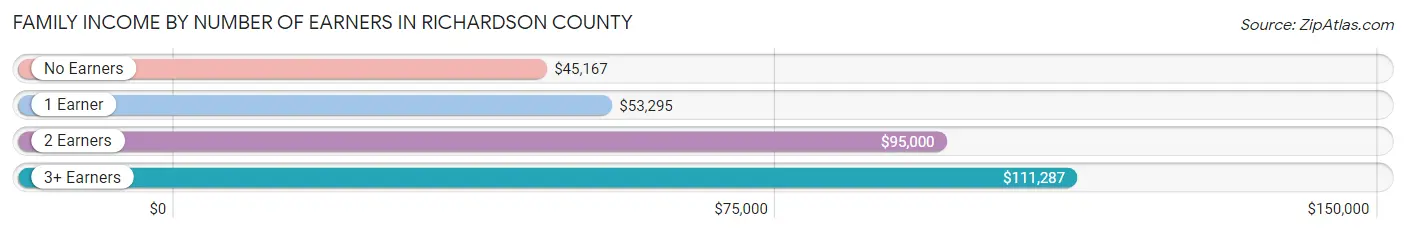
Family Income by Number of Earners in Richardson County
The median family income in Richardson County is $69,819, with families comprising 3+ earners (168) having the highest median family income of $111,287, while families with no earners (290) have the lowest median family income of $45,167, accounting for 7.9% and 13.6% of families, respectively.
| Number of Earners | # Families | Median Income |
| No Earners | 290 (13.6%) | $45,167 |
| 1 Earner | 685 (32.0%) | $53,295 |
| 2 Earners | 998 (46.6%) | $95,000 |
| 3+ Earners | 168 (7.9%) | $111,287 |
| Total | 2,141 (100.0%) | $69,819 |
Household Income in Richardson County
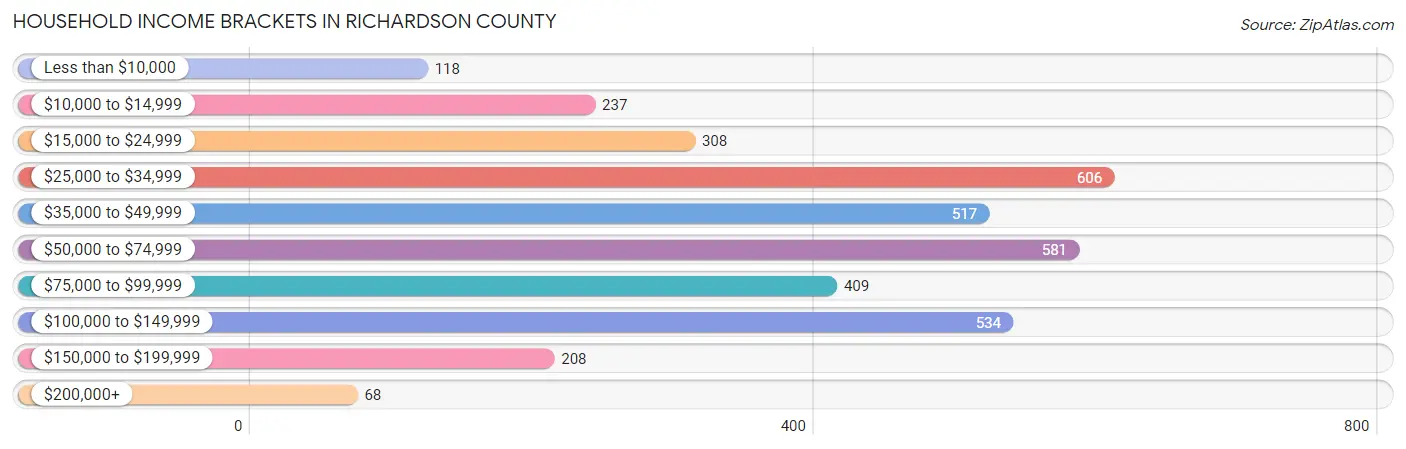
Household Income Brackets in Richardson County
With 606 households falling in the category, the $25,000 to $34,999 income range is the most frequent in Richardson County, accounting for 16.9% of all households. In contrast, only 68 households (1.9%) fall into the $200,000+ income bracket, making it the least populous group.
| Income Bracket | # Households | % Households |
| Less than $10,000 | 118 | 3.3% |
| $10,000 to $14,999 | 237 | 6.6% |
| $15,000 to $24,999 | 308 | 8.6% |
| $25,000 to $34,999 | 606 | 16.9% |
| $35,000 to $49,999 | 517 | 14.4% |
| $50,000 to $74,999 | 581 | 16.2% |
| $75,000 to $99,999 | 409 | 11.4% |
| $100,000 to $149,999 | 534 | 14.9% |
| $150,000 to $199,999 | 208 | 5.8% |
| $200,000+ | 68 | 1.9% |
Household Income by Householder Age in Richardson County
The median household income in Richardson County is $50,321, with the highest median household income of $75,071 found in the 25 to 44 years age bracket for the primary householder. A total of 841 households (23.4%) fall into this category. Meanwhile, the 65+ years age bracket for the primary householder has the lowest median household income of $35,458, with 1,249 households (34.8%) in this group.
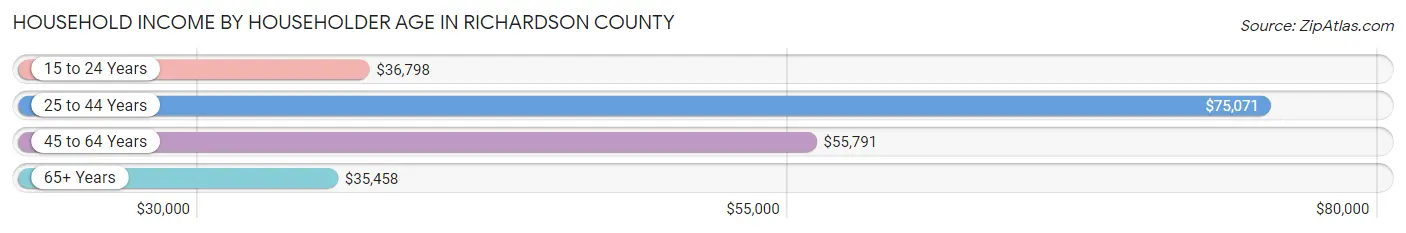
| Income Bracket | # Households | Median Income |
| 15 to 24 Years | 164 (4.6%) | $36,798 |
| 25 to 44 Years | 841 (23.4%) | $75,071 |
| 45 to 64 Years | 1,333 (37.2%) | $55,791 |
| 65+ Years | 1,249 (34.8%) | $35,458 |
| Total | 3,587 (100.0%) | $50,321 |
Poverty in Richardson County
Income Below Poverty by Sex and Age in Richardson County
With 8.4% poverty level for males and 13.4% for females among the residents of Richardson County, 15 year old males and 75 year old and over females are the most vulnerable to poverty, with 16 males (33.3%) and 127 females (26.9%) in their respective age groups living below the poverty level.
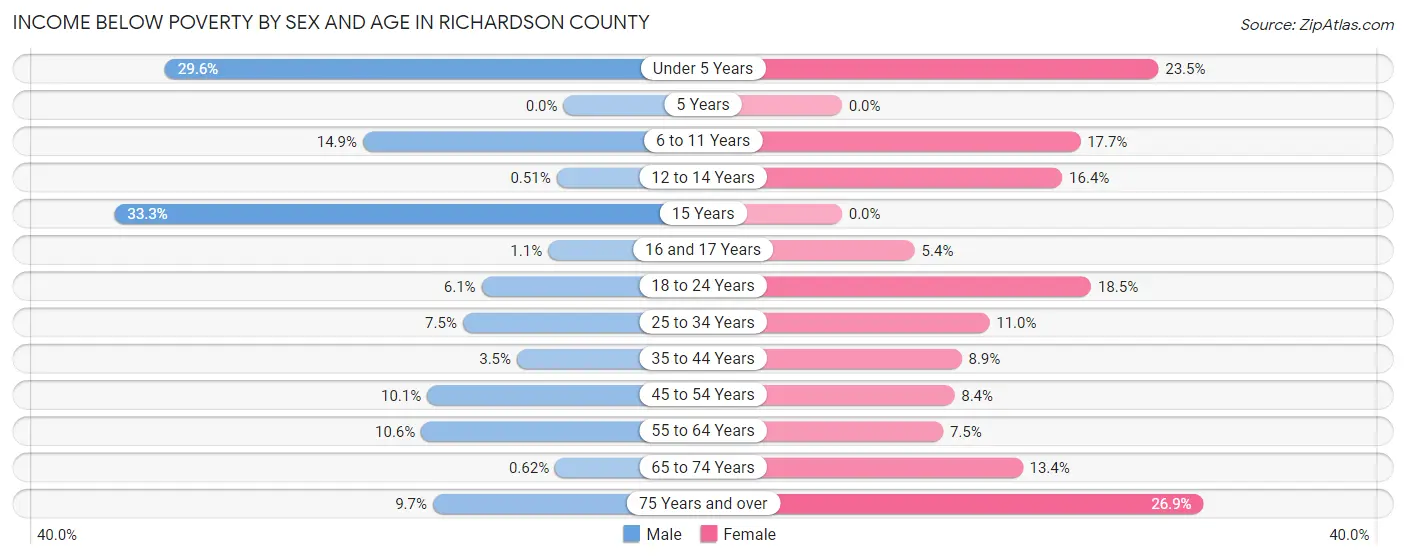
| Age Bracket | Male | Female |
| Under 5 Years | 63 (29.6%) | 47 (23.5%) |
| 5 Years | 0 (0.0%) | 0 (0.0%) |
| 6 to 11 Years | 35 (14.9%) | 43 (17.7%) |
| 12 to 14 Years | 1 (0.5%) | 18 (16.4%) |
| 15 Years | 16 (33.3%) | 0 (0.0%) |
| 16 and 17 Years | 2 (1.1%) | 2 (5.4%) |
| 18 to 24 Years | 16 (6.1%) | 47 (18.5%) |
| 25 to 34 Years | 33 (7.5%) | 37 (11.0%) |
| 35 to 44 Years | 14 (3.5%) | 37 (8.9%) |
| 45 to 54 Years | 43 (10.1%) | 35 (8.4%) |
| 55 to 64 Years | 70 (10.6%) | 48 (7.5%) |
| 65 to 74 Years | 3 (0.6%) | 69 (13.4%) |
| 75 Years and over | 31 (9.7%) | 127 (26.9%) |
| Total | 327 (8.4%) | 510 (13.4%) |
Income Above Poverty by Sex and Age in Richardson County
According to the poverty statistics in Richardson County, males aged 5 years and females aged 5 years are the age groups that are most secure financially, with 100.0% of males and 100.0% of females in these age groups living above the poverty line.
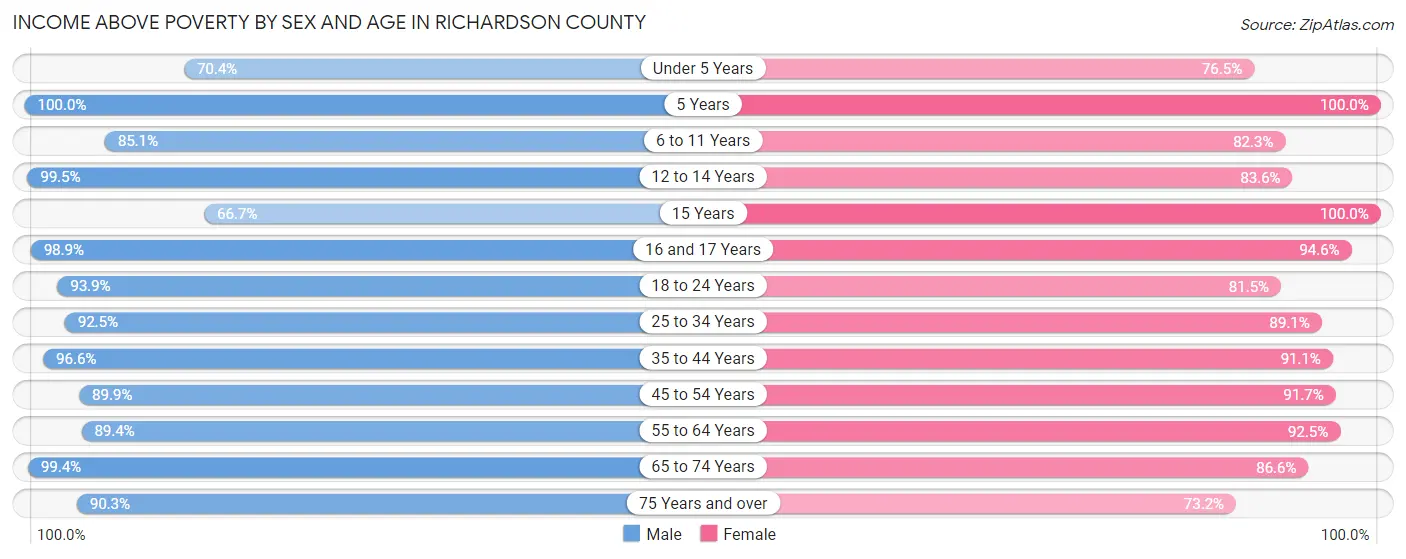
| Age Bracket | Male | Female |
| Under 5 Years | 150 (70.4%) | 153 (76.5%) |
| 5 Years | 40 (100.0%) | 66 (100.0%) |
| 6 to 11 Years | 200 (85.1%) | 200 (82.3%) |
| 12 to 14 Years | 194 (99.5%) | 92 (83.6%) |
| 15 Years | 32 (66.7%) | 93 (100.0%) |
| 16 and 17 Years | 173 (98.9%) | 35 (94.6%) |
| 18 to 24 Years | 247 (93.9%) | 207 (81.5%) |
| 25 to 34 Years | 409 (92.5%) | 301 (89.0%) |
| 35 to 44 Years | 392 (96.6%) | 379 (91.1%) |
| 45 to 54 Years | 382 (89.9%) | 384 (91.6%) |
| 55 to 64 Years | 593 (89.4%) | 591 (92.5%) |
| 65 to 74 Years | 477 (99.4%) | 445 (86.6%) |
| 75 Years and over | 289 (90.3%) | 346 (73.2%) |
| Total | 3,578 (91.6%) | 3,292 (86.6%) |
Income Below Poverty Among Married-Couple Families in Richardson County
The poverty statistics for married-couple families in Richardson County show that 2.5% or 43 of the total 1,692 families live below the poverty line. Families with 3 or 4 children have the highest poverty rate of 9.1%, comprising of 15 families. On the other hand, families with no children have the lowest poverty rate of 1.8%, which includes 19 families.
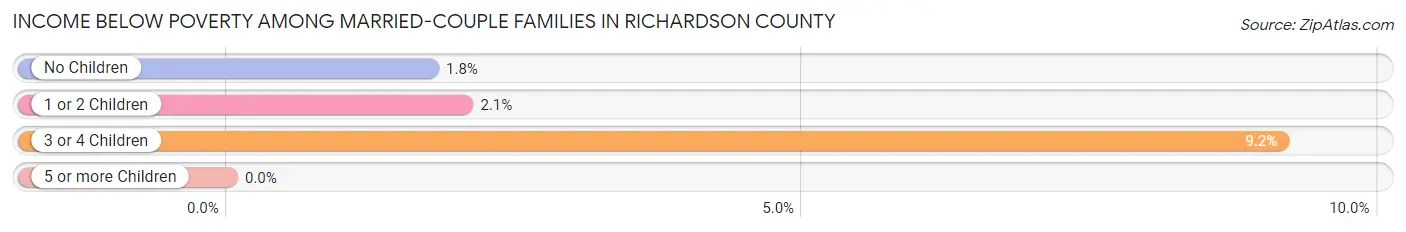
| Children | Above Poverty | Below Poverty |
| No Children | 1,069 (98.3%) | 19 (1.8%) |
| 1 or 2 Children | 431 (98.0%) | 9 (2.1%) |
| 3 or 4 Children | 149 (90.8%) | 15 (9.1%) |
| 5 or more Children | 0 (0.0%) | 0 (0.0%) |
| Total | 1,649 (97.5%) | 43 (2.5%) |
Income Below Poverty Among Single-Parent Households in Richardson County
According to the poverty data in Richardson County, 7.8% or 16 single-father households and 31.1% or 76 single-mother households are living below the poverty line. Among single-father households, those with 1 or 2 children have the highest poverty rate, with 16 households (12.3%) experiencing poverty. Likewise, among single-mother households, those with 3 or 4 children have the highest poverty rate, with 17 households (100.0%) falling below the poverty line.
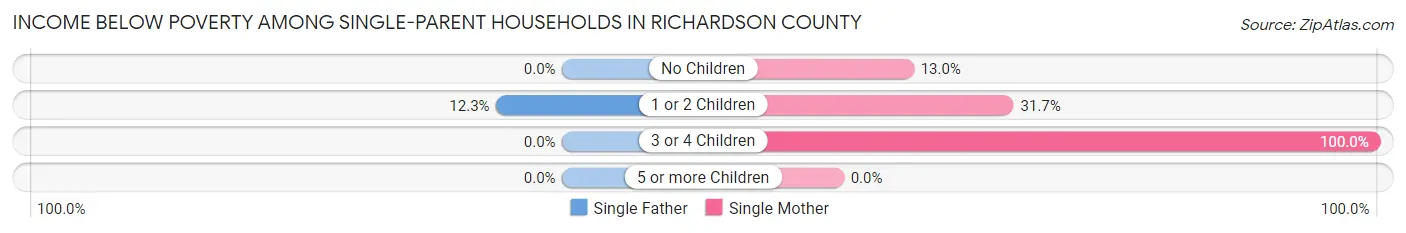
| Children | Single Father | Single Mother |
| No Children | 0 (0.0%) | 9 (13.0%) |
| 1 or 2 Children | 16 (12.3%) | 50 (31.7%) |
| 3 or 4 Children | 0 (0.0%) | 17 (100.0%) |
| 5 or more Children | 0 (0.0%) | 0 (0.0%) |
| Total | 16 (7.8%) | 76 (31.1%) |
Income Below Poverty Among Married-Couple vs Single-Parent Households in Richardson County
The poverty data for Richardson County shows that 43 of the married-couple family households (2.5%) and 92 of the single-parent households (20.5%) are living below the poverty level. Within the married-couple family households, those with 3 or 4 children have the highest poverty rate, with 15 households (9.1%) falling below the poverty line. Among the single-parent households, those with 3 or 4 children have the highest poverty rate, with 17 household (73.9%) living below poverty.
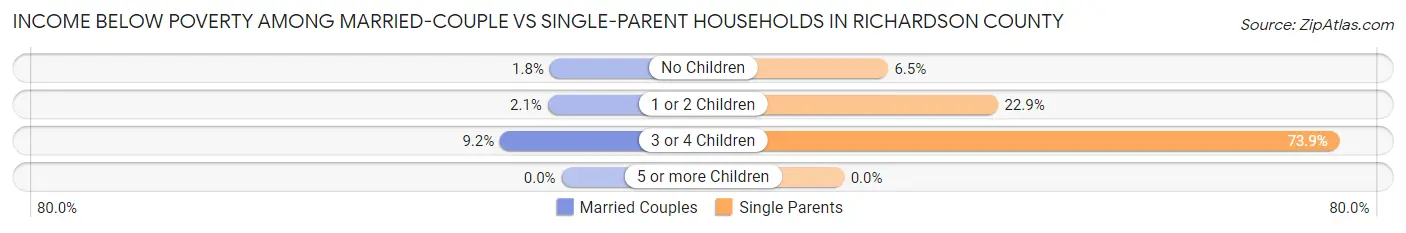
| Children | Married-Couple Families | Single-Parent Households |
| No Children | 19 (1.8%) | 9 (6.5%) |
| 1 or 2 Children | 9 (2.1%) | 66 (22.9%) |
| 3 or 4 Children | 15 (9.1%) | 17 (73.9%) |
| 5 or more Children | 0 (0.0%) | 0 (0.0%) |
| Total | 43 (2.5%) | 92 (20.5%) |
Race in Richardson County
The most populous races in Richardson County are White / Caucasian (7,226 | 92.0%), Two or more Races (342 | 4.4%), and Native / Alaskan (184 | 2.3%).
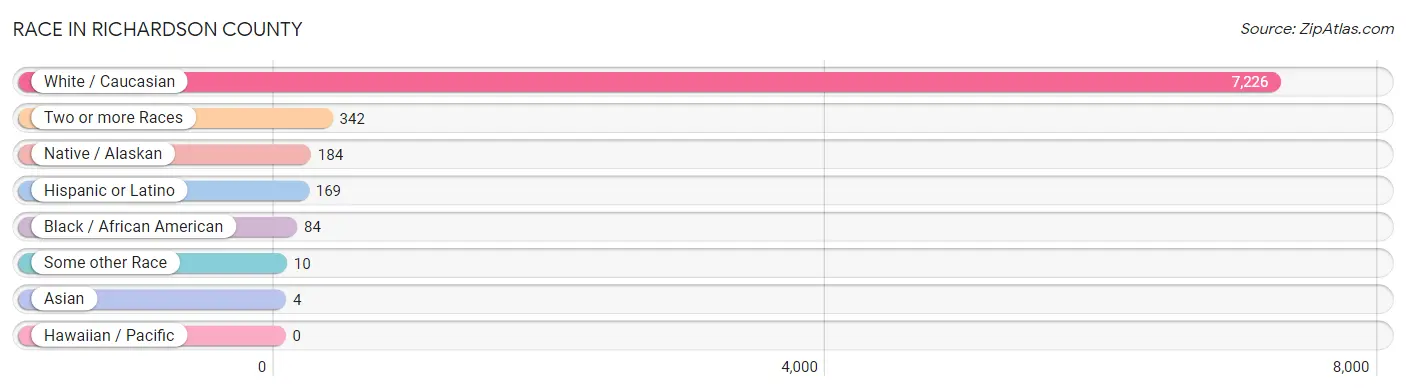
| Race | # Population | % Population |
| Asian | 4 | 0.1% |
| Black / African American | 84 | 1.1% |
| Hawaiian / Pacific | 0 | 0.0% |
| Hispanic or Latino | 169 | 2.1% |
| Native / Alaskan | 184 | 2.3% |
| White / Caucasian | 7,226 | 92.0% |
| Two or more Races | 342 | 4.4% |
| Some other Race | 10 | 0.1% |
| Total | 7,850 | 100.0% |
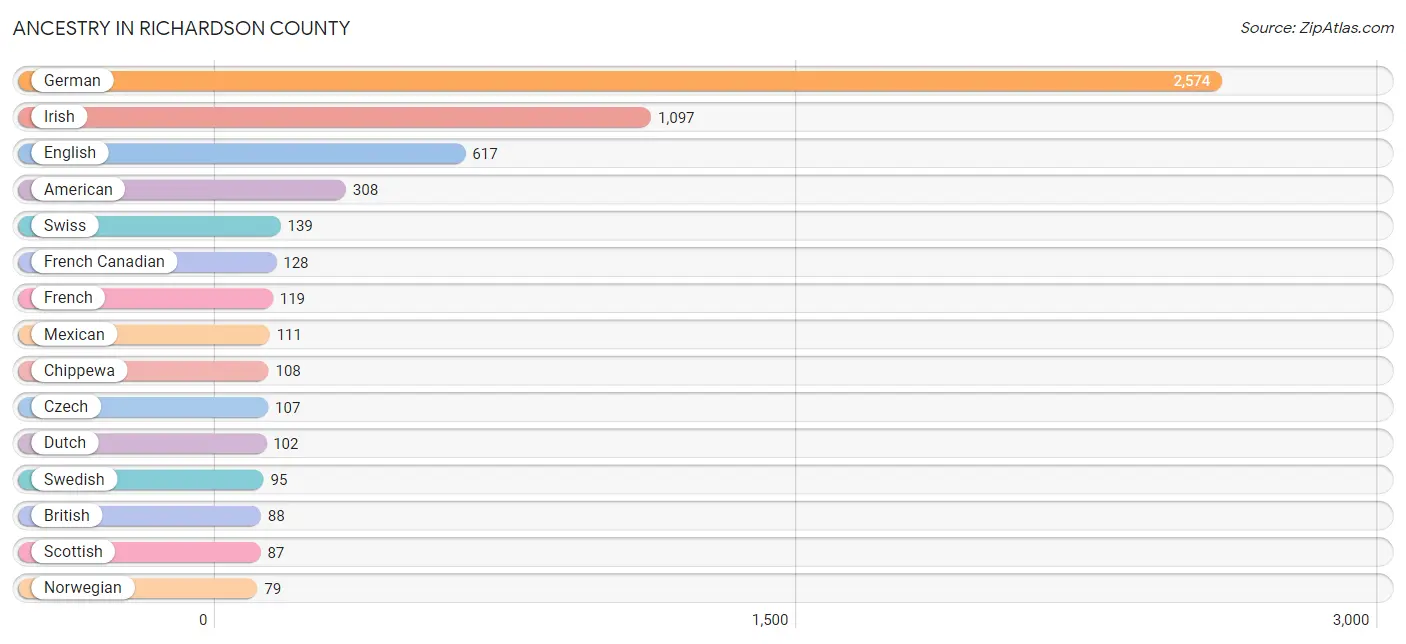
Ancestry in Richardson County
The most populous ancestries reported in Richardson County are German (2,574 | 32.8%), Irish (1,097 | 14.0%), English (617 | 7.9%), American (308 | 3.9%), and Swiss (139 | 1.8%), together accounting for 60.3% of all Richardson County residents.
| Ancestry | # Population | % Population |
| Alsatian | 4 | 0.1% |
| American | 308 | 3.9% |
| Blackfeet | 19 | 0.2% |
| British | 88 | 1.1% |
| Central American | 1 | 0.0% |
| Cherokee | 36 | 0.5% |
| Chippewa | 108 | 1.4% |
| Choctaw | 14 | 0.2% |
| Crow | 11 | 0.1% |
| Czech | 107 | 1.4% |
| Czechoslovakian | 2 | 0.0% |
| Danish | 29 | 0.4% |
| Dutch | 102 | 1.3% |
| Eastern European | 12 | 0.2% |
| English | 617 | 7.9% |
| European | 63 | 0.8% |
| Finnish | 6 | 0.1% |
| French | 119 | 1.5% |
| French American Indian | 1 | 0.0% |
| French Canadian | 128 | 1.6% |
| German | 2,574 | 32.8% |
| Greek | 15 | 0.2% |
| Honduran | 1 | 0.0% |
| Irish | 1,097 | 14.0% |
| Italian | 47 | 0.6% |
| Korean | 4 | 0.1% |
| Lithuanian | 7 | 0.1% |
| Mexican | 111 | 1.4% |
| Northern European | 5 | 0.1% |
| Norwegian | 79 | 1.0% |
| Pakistani | 2 | 0.0% |
| Pennsylvania German | 4 | 0.1% |
| Polish | 45 | 0.6% |
| Potawatomi | 28 | 0.4% |
| Russian | 7 | 0.1% |
| Scotch-Irish | 38 | 0.5% |
| Scottish | 87 | 1.1% |
| Sioux | 70 | 0.9% |
| Spaniard | 57 | 0.7% |
| Swedish | 95 | 1.2% |
| Swiss | 139 | 1.8% |
| Welsh | 59 | 0.7% |
| Yaqui | 17 | 0.2% | View All 43 Rows |
Immigrants in Richardson County
The most numerous immigrant groups reported in Richardson County came from Europe (68 | 0.9%), Northern Europe (45 | 0.6%), Central America (25 | 0.3%), Latin America (25 | 0.3%), and Mexico (24 | 0.3%), together accounting for 2.4% of all Richardson County residents.
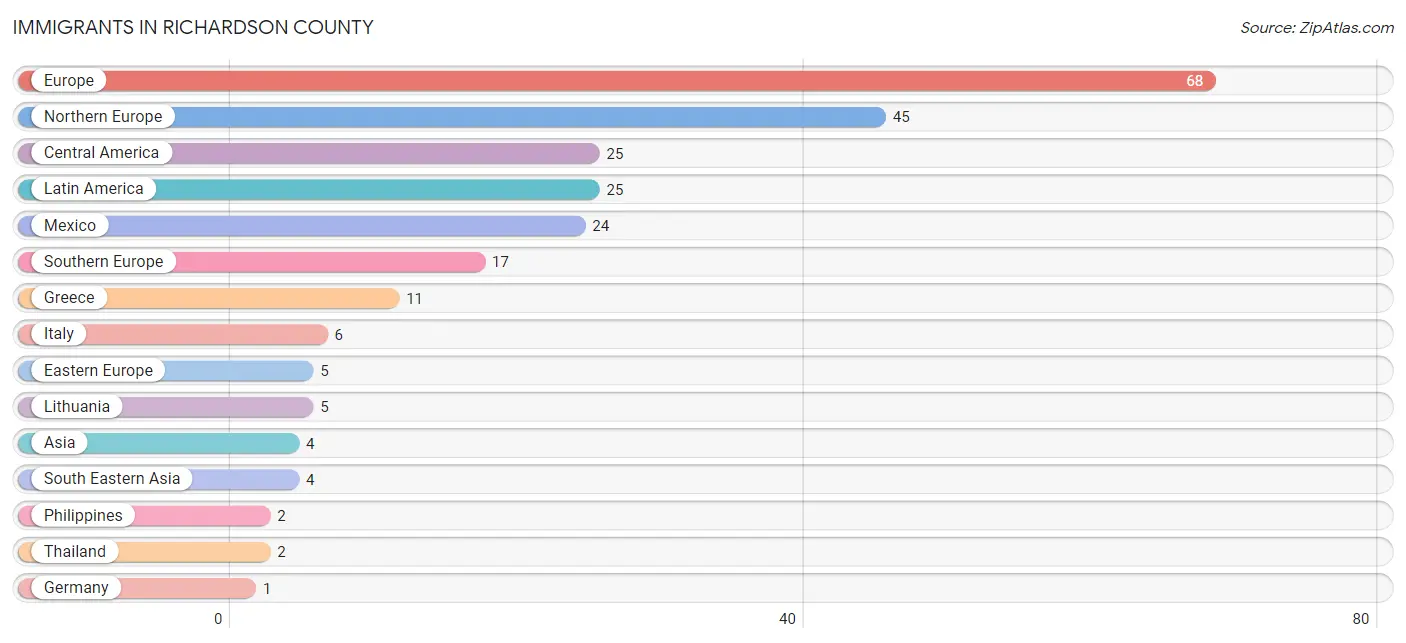
| Immigration Origin | # Population | % Population |
| Asia | 4 | 0.1% |
| Central America | 25 | 0.3% |
| Eastern Europe | 5 | 0.1% |
| Europe | 68 | 0.9% |
| Germany | 1 | 0.0% |
| Greece | 11 | 0.1% |
| Honduras | 1 | 0.0% |
| Italy | 6 | 0.1% |
| Latin America | 25 | 0.3% |
| Lithuania | 5 | 0.1% |
| Mexico | 24 | 0.3% |
| Northern Europe | 45 | 0.6% |
| Philippines | 2 | 0.0% |
| South Eastern Asia | 4 | 0.1% |
| Southern Europe | 17 | 0.2% |
| Thailand | 2 | 0.0% |
| Western Europe | 1 | 0.0% | View All 17 Rows |
Sex and Age in Richardson County
Sex and Age in Richardson County
The most populous age groups in Richardson County are 60 to 64 Years (387 | 9.7%) for men and 60 to 64 Years (355 | 9.2%) for women.
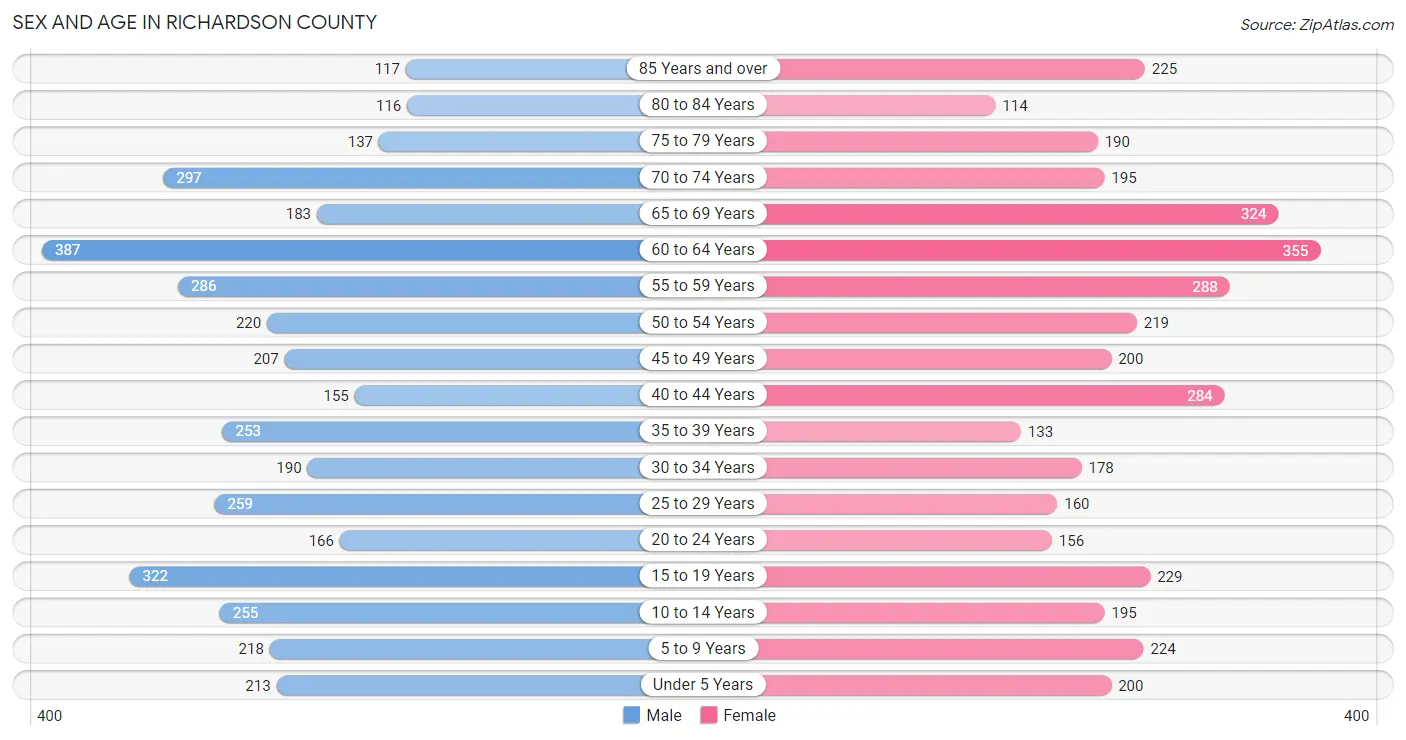
| Age Bracket | Male | Female |
| Under 5 Years | 213 (5.3%) | 200 (5.2%) |
| 5 to 9 Years | 218 (5.5%) | 224 (5.8%) |
| 10 to 14 Years | 255 (6.4%) | 195 (5.0%) |
| 15 to 19 Years | 322 (8.1%) | 229 (5.9%) |
| 20 to 24 Years | 166 (4.2%) | 156 (4.0%) |
| 25 to 29 Years | 259 (6.5%) | 160 (4.1%) |
| 30 to 34 Years | 190 (4.8%) | 178 (4.6%) |
| 35 to 39 Years | 253 (6.4%) | 133 (3.4%) |
| 40 to 44 Years | 155 (3.9%) | 284 (7.3%) |
| 45 to 49 Years | 207 (5.2%) | 200 (5.2%) |
| 50 to 54 Years | 220 (5.5%) | 219 (5.7%) |
| 55 to 59 Years | 286 (7.2%) | 288 (7.4%) |
| 60 to 64 Years | 387 (9.7%) | 355 (9.2%) |
| 65 to 69 Years | 183 (4.6%) | 324 (8.4%) |
| 70 to 74 Years | 297 (7.5%) | 195 (5.0%) |
| 75 to 79 Years | 137 (3.4%) | 190 (4.9%) |
| 80 to 84 Years | 116 (2.9%) | 114 (2.9%) |
| 85 Years and over | 117 (2.9%) | 225 (5.8%) |
| Total | 3,981 (100.0%) | 3,869 (100.0%) |
Families and Households in Richardson County
Median Family Size in Richardson County
The median family size in Richardson County is 2.81 persons per family, with single female/mother families (244 | 11.4%) accounting for the largest median family size of 3.05 persons per family. On the other hand, single male/father families (205 | 9.6%) represent the smallest median family size with 2.29 persons per family.
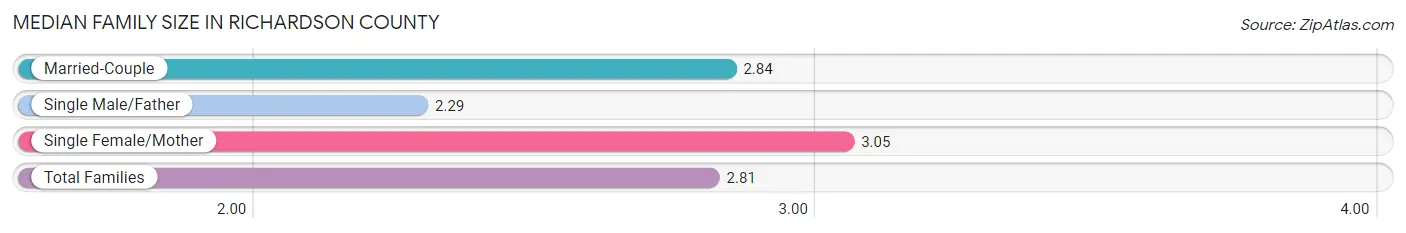
| Family Type | # Families | Family Size |
| Married-Couple | 1,692 (79.0%) | 2.84 |
| Single Male/Father | 205 (9.6%) | 2.29 |
| Single Female/Mother | 244 (11.4%) | 3.05 |
| Total Families | 2,141 (100.0%) | 2.81 |
Median Household Size in Richardson County
The median household size in Richardson County is 2.15 persons per household, with single female/mother households (244 | 6.8%) accounting for the largest median household size of 3.34 persons per household. non-family households (1,446 | 40.3%) represent the smallest median household size with 1.08 persons per household.
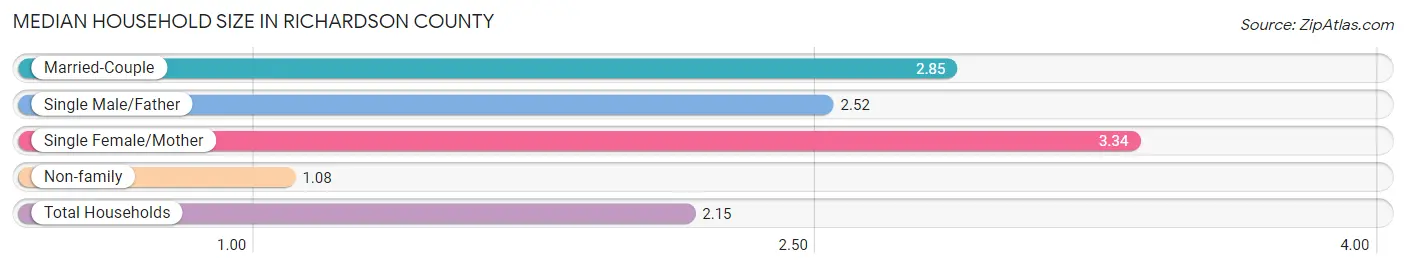
| Household Type | # Households | Household Size |
| Married-Couple | 1,692 (47.2%) | 2.85 |
| Single Male/Father | 205 (5.7%) | 2.52 |
| Single Female/Mother | 244 (6.8%) | 3.34 |
| Non-family | 1,446 (40.3%) | 1.08 |
| Total Households | 3,587 (100.0%) | 2.15 |
Household Size by Marriage Status in Richardson County
Out of a total of 3,587 households in Richardson County, 2,141 (59.7%) are family households, while 1,446 (40.3%) are nonfamily households. The most numerous type of family households are 2-person households, comprising 1,231, and the most common type of nonfamily households are 1-person households, comprising 1,347.
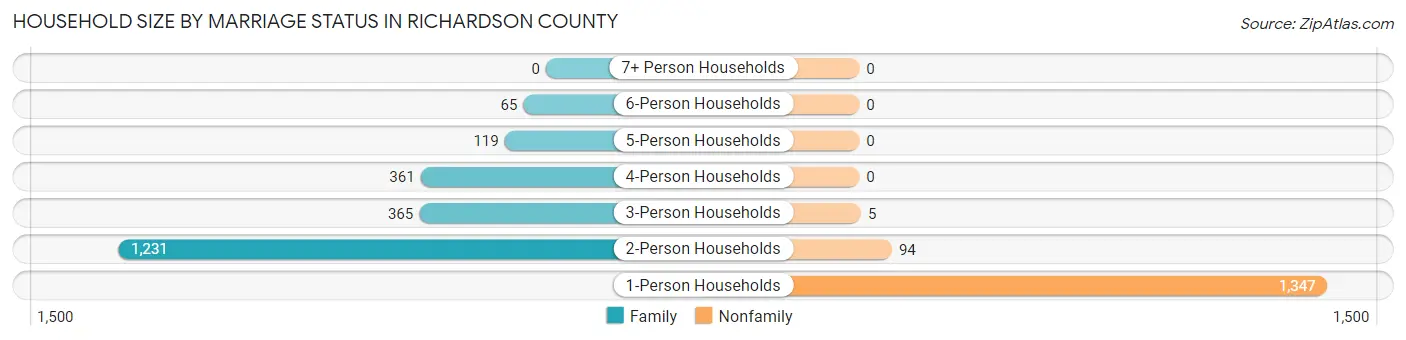
| Household Size | Family Households | Nonfamily Households |
| 1-Person Households | - | 1,347 (37.6%) |
| 2-Person Households | 1,231 (34.3%) | 94 (2.6%) |
| 3-Person Households | 365 (10.2%) | 5 (0.1%) |
| 4-Person Households | 361 (10.1%) | 0 (0.0%) |
| 5-Person Households | 119 (3.3%) | 0 (0.0%) |
| 6-Person Households | 65 (1.8%) | 0 (0.0%) |
| 7+ Person Households | 0 (0.0%) | 0 (0.0%) |
| Total | 2,141 (59.7%) | 1,446 (40.3%) |
Female Fertility in Richardson County
Fertility by Age in Richardson County
Average fertility rate in Richardson County is 75.0 births per 1,000 women. Women in the age bracket of 20 to 34 years have the highest fertility rate with 180.0 births per 1,000 women. Women in the age bracket of 20 to 34 years acount for 86.4% of all women with births.
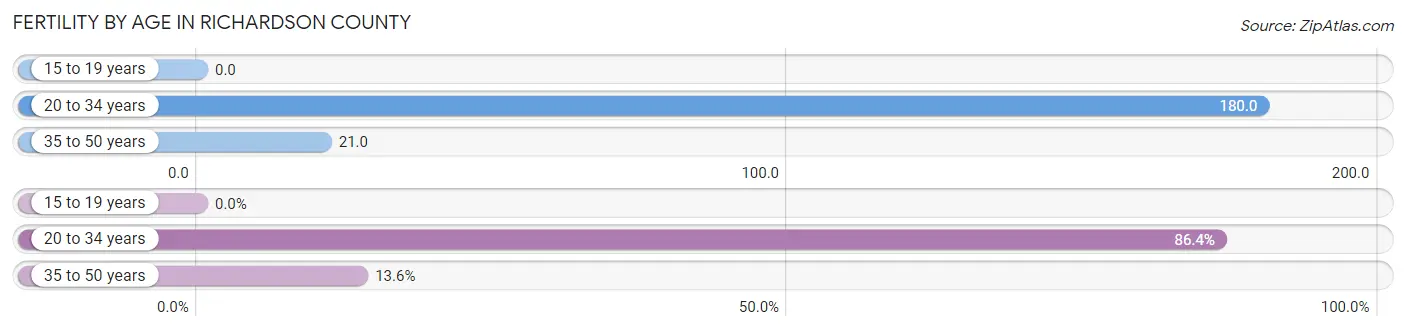
| Age Bracket | Women with Births | Births / 1,000 Women |
| 15 to 19 years | 0 (0.0%) | 0.0 |
| 20 to 34 years | 89 (86.4%) | 180.0 |
| 35 to 50 years | 14 (13.6%) | 21.0 |
| Total | 103 (100.0%) | 75.0 |
Fertility by Age by Marriage Status in Richardson County
66.0% of women with births (103) in Richardson County are married. The highest percentage of unmarried women with births falls into 20 to 34 years age bracket with 38.2% of them unmarried at the time of birth, while the lowest percentage of unmarried women with births belong to 35 to 50 years age bracket with 7.1% of them unmarried.
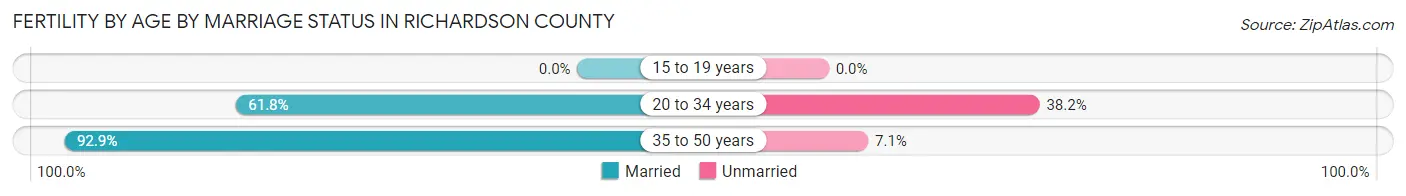
| Age Bracket | Married | Unmarried |
| 15 to 19 years | 0 (0.0%) | 0 (0.0%) |
| 20 to 34 years | 55 (61.8%) | 34 (38.2%) |
| 35 to 50 years | 13 (92.9%) | 1 (7.1%) |
| Total | 68 (66.0%) | 35 (34.0%) |
Fertility by Education in Richardson County
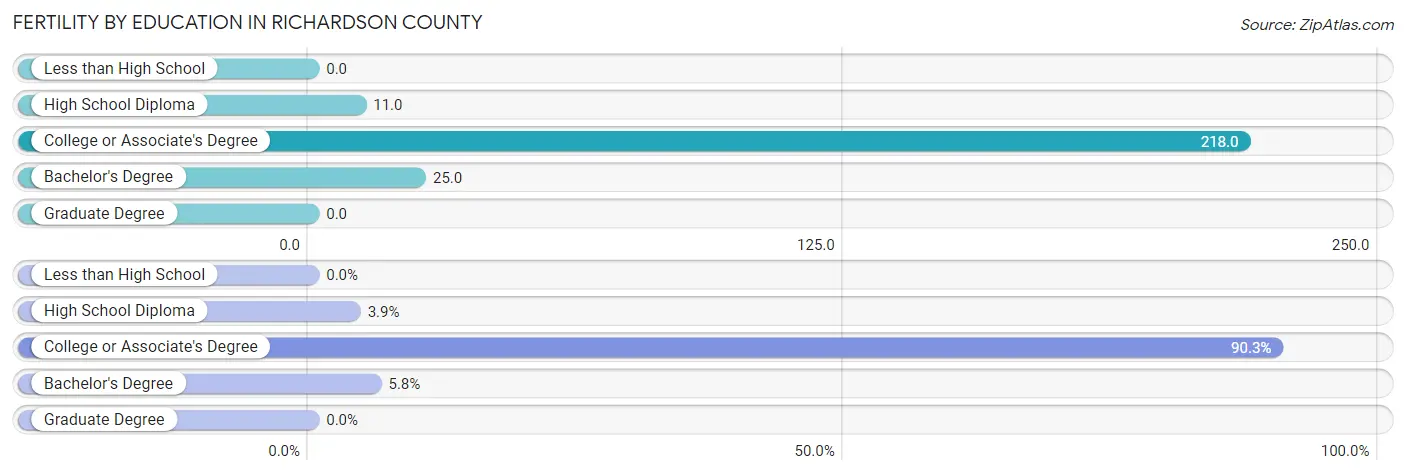
| Educational Attainment | Women with Births | Births / 1,000 Women |
| Less than High School | 0 (0.0%) | 0.0 |
| High School Diploma | 4 (3.9%) | 11.0 |
| College or Associate's Degree | 93 (90.3%) | 218.0 |
| Bachelor's Degree | 6 (5.8%) | 25.0 |
| Graduate Degree | 0 (0.0%) | 0.0 |
| Total | 103 (100.0%) | 75.0 |
Fertility by Education by Marriage Status in Richardson County
34.0% of women with births in Richardson County are unmarried. Women with the educational attainment of bachelor's degree are most likely to be married with 100.0% of them married at childbirth, while women with the educational attainment of high school diploma are least likely to be married with 75.0% of them unmarried at childbirth.
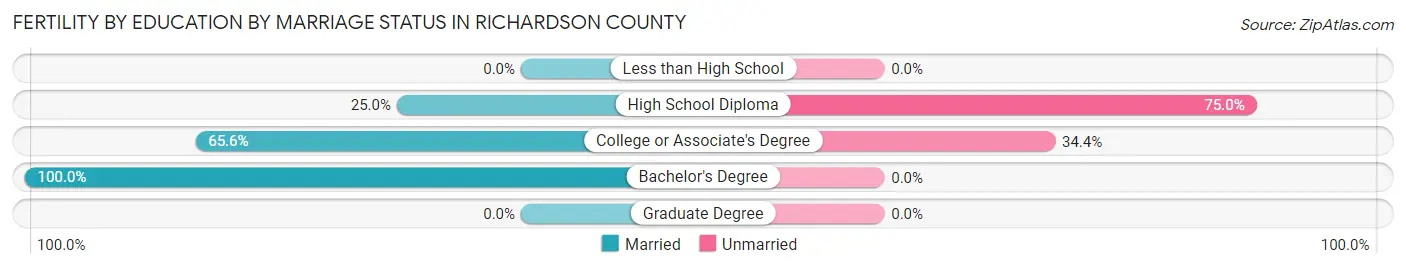
| Educational Attainment | Married | Unmarried |
| Less than High School | 0 (0.0%) | 0 (0.0%) |
| High School Diploma | 1 (25.0%) | 3 (75.0%) |
| College or Associate's Degree | 61 (65.6%) | 32 (34.4%) |
| Bachelor's Degree | 6 (100.0%) | 0 (0.0%) |
| Graduate Degree | 0 (0.0%) | 0 (0.0%) |
| Total | 68 (66.0%) | 35 (34.0%) |
Employment Characteristics in Richardson County
Employment by Class of Employer in Richardson County
Among the 3,650 employed individuals in Richardson County, private company employees (2,088 | 57.2%), self-employed (not incorporated) (514 | 14.1%), and not-for-profit organizations (317 | 8.7%) make up the most common classes of employment.
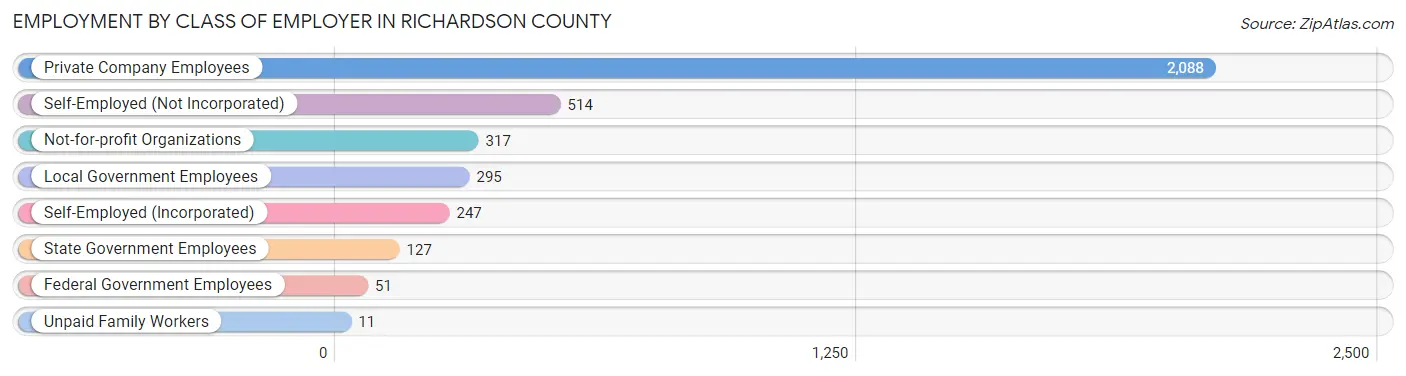
| Employer Class | # Employees | % Employees |
| Private Company Employees | 2,088 | 57.2% |
| Self-Employed (Incorporated) | 247 | 6.8% |
| Self-Employed (Not Incorporated) | 514 | 14.1% |
| Not-for-profit Organizations | 317 | 8.7% |
| Local Government Employees | 295 | 8.1% |
| State Government Employees | 127 | 3.5% |
| Federal Government Employees | 51 | 1.4% |
| Unpaid Family Workers | 11 | 0.3% |
| Total | 3,650 | 100.0% |
Employment Status by Age in Richardson County
According to the labor force statistics for Richardson County, out of the total population over 16 years of age (6,404), 61.8% or 3,958 individuals are in the labor force, with 4.7% or 186 of them unemployed. The age group with the highest labor force participation rate is 35 to 44 years, with 94.8% or 782 individuals in the labor force. Within the labor force, the 16 to 19 years age range has the highest percentage of unemployed individuals, with 35.1% or 78 of them being unemployed.
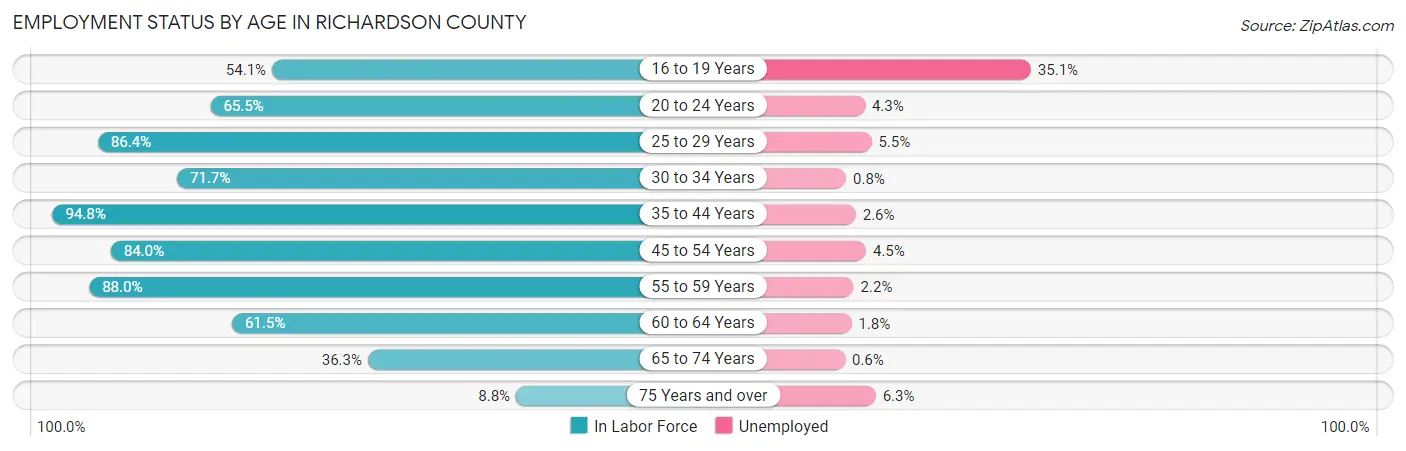
| Age Bracket | In Labor Force | Unemployed |
| 16 to 19 Years | 222 (54.1%) | 78 (35.1%) |
| 20 to 24 Years | 211 (65.5%) | 9 (4.3%) |
| 25 to 29 Years | 362 (86.4%) | 20 (5.5%) |
| 30 to 34 Years | 264 (71.7%) | 2 (0.8%) |
| 35 to 44 Years | 782 (94.8%) | 20 (2.6%) |
| 45 to 54 Years | 711 (84.0%) | 32 (4.5%) |
| 55 to 59 Years | 505 (88.0%) | 11 (2.2%) |
| 60 to 64 Years | 456 (61.5%) | 8 (1.8%) |
| 65 to 74 Years | 363 (36.3%) | 2 (0.6%) |
| 75 Years and over | 79 (8.8%) | 5 (6.3%) |
| Total | 3,958 (61.8%) | 186 (4.7%) |
Employment Status by Educational Attainment in Richardson County
According to labor force statistics for Richardson County, 81.6% of individuals (3,080) out of the total population between 25 and 64 years of age (3,774) are in the labor force, with 3.0% or 92 of them being unemployed. The group with the highest labor force participation rate are those with the educational attainment of bachelor's degree or higher, with 88.8% or 659 individuals in the labor force. Within the labor force, individuals with high school diploma education have the highest percentage of unemployment, with 4.5% or 51 of them being unemployed.
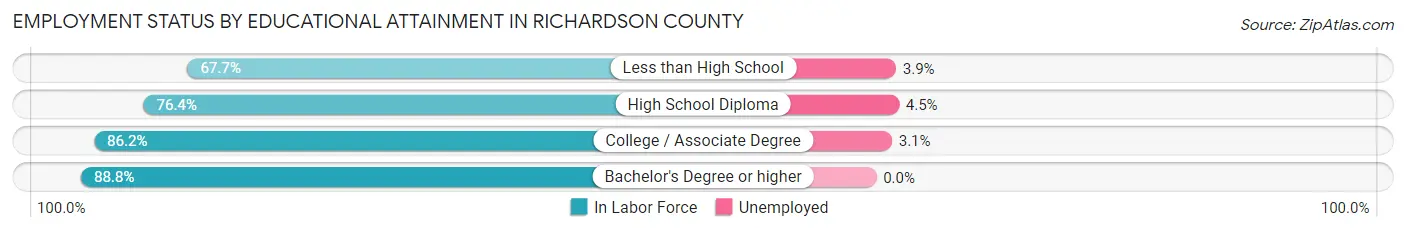
| Educational Attainment | In Labor Force | Unemployed |
| Less than High School | 180 (67.7%) | 10 (3.9%) |
| High School Diploma | 1,125 (76.4%) | 66 (4.5%) |
| College / Associate Degree | 1,115 (86.2%) | 40 (3.1%) |
| Bachelor's Degree or higher | 659 (88.8%) | 0 (0.0%) |
| Total | 3,080 (81.6%) | 113 (3.0%) |
Employment Occupations by Sex in Richardson County
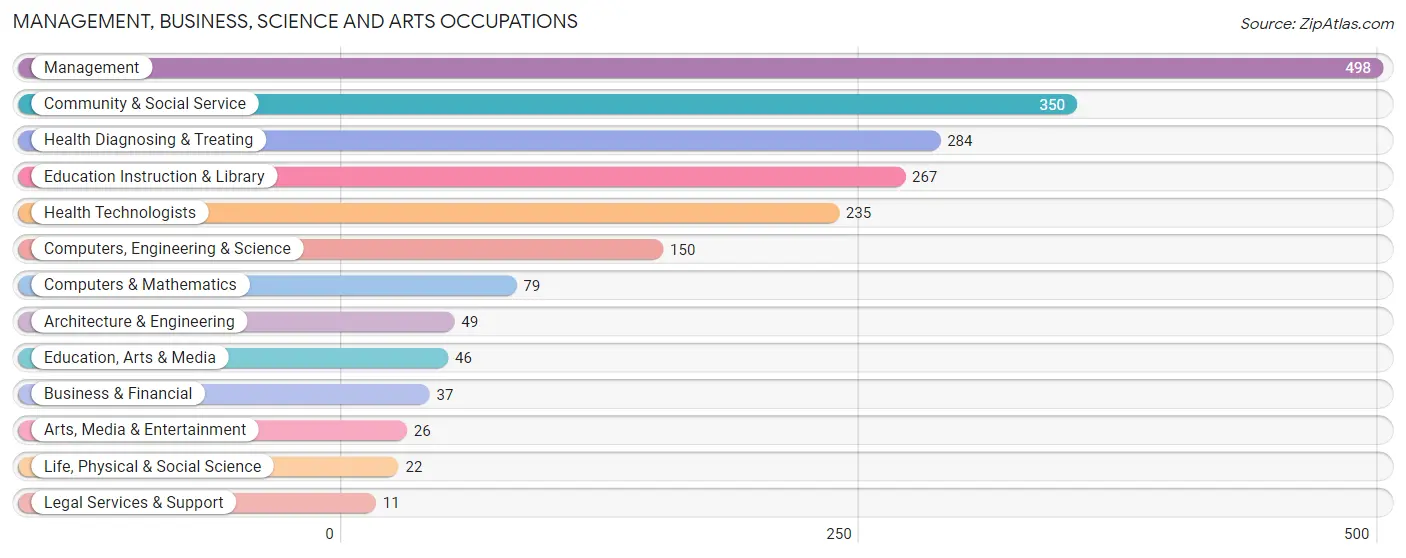
Management, Business, Science and Arts Occupations
The most common Management, Business, Science and Arts occupations in Richardson County are Management (498 | 13.2%), Community & Social Service (350 | 9.3%), Health Diagnosing & Treating (284 | 7.5%), Education Instruction & Library (267 | 7.1%), and Health Technologists (235 | 6.2%).
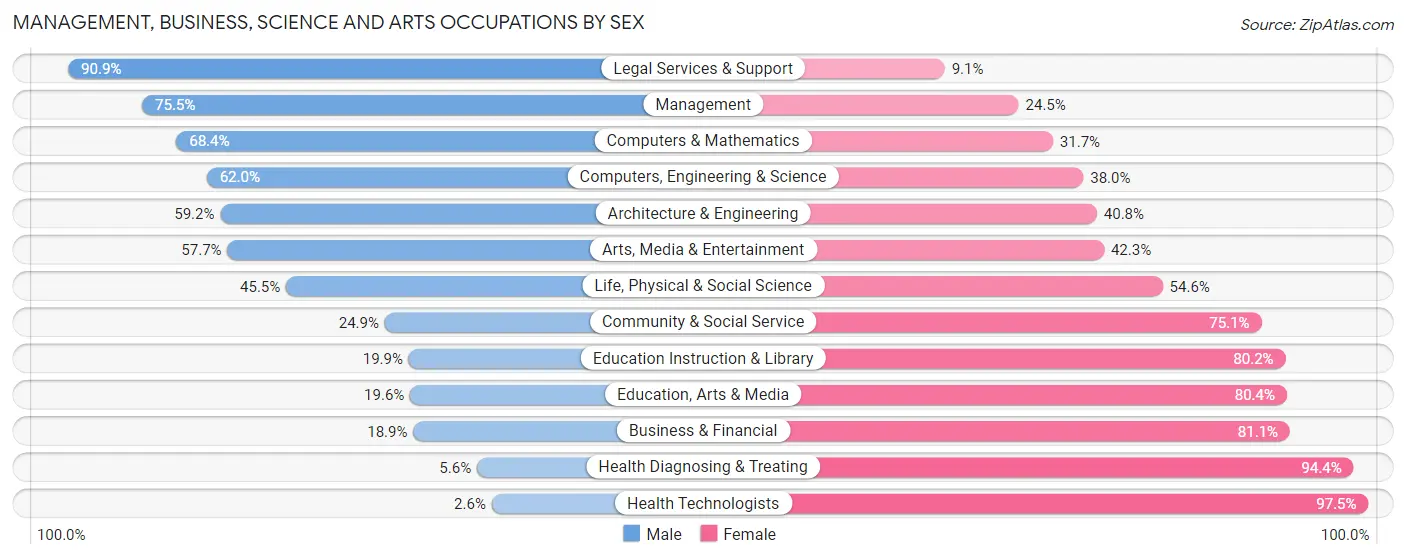
Management, Business, Science and Arts Occupations by Sex
Within the Management, Business, Science and Arts occupations in Richardson County, the most male-oriented occupations are Legal Services & Support (90.9%), Management (75.5%), and Computers & Mathematics (68.3%), while the most female-oriented occupations are Health Technologists (97.5%), Health Diagnosing & Treating (94.4%), and Business & Financial (81.1%).
| Occupation | Male | Female |
| Management | 376 (75.5%) | 122 (24.5%) |
| Business & Financial | 7 (18.9%) | 30 (81.1%) |
| Computers, Engineering & Science | 93 (62.0%) | 57 (38.0%) |
| Computers & Mathematics | 54 (68.3%) | 25 (31.7%) |
| Architecture & Engineering | 29 (59.2%) | 20 (40.8%) |
| Life, Physical & Social Science | 10 (45.5%) | 12 (54.5%) |
| Community & Social Service | 87 (24.9%) | 263 (75.1%) |
| Education, Arts & Media | 9 (19.6%) | 37 (80.4%) |
| Legal Services & Support | 10 (90.9%) | 1 (9.1%) |
| Education Instruction & Library | 53 (19.9%) | 214 (80.1%) |
| Arts, Media & Entertainment | 15 (57.7%) | 11 (42.3%) |
| Health Diagnosing & Treating | 16 (5.6%) | 268 (94.4%) |
| Health Technologists | 6 (2.5%) | 229 (97.5%) |
| Total (Category) | 579 (43.9%) | 740 (56.1%) |
| Total (Overall) | 2,105 (55.9%) | 1,663 (44.1%) |
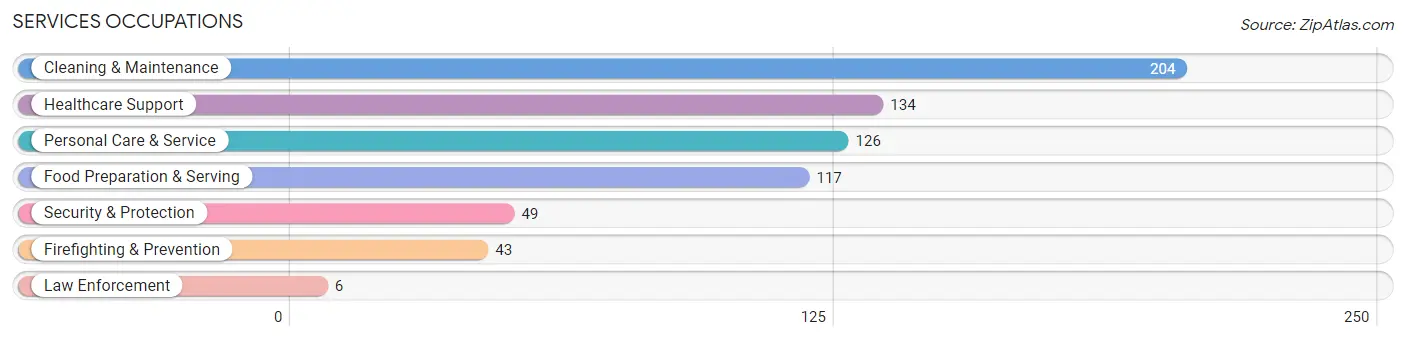
Services Occupations
The most common Services occupations in Richardson County are Cleaning & Maintenance (204 | 5.4%), Healthcare Support (134 | 3.6%), Personal Care & Service (126 | 3.3%), Food Preparation & Serving (117 | 3.1%), and Security & Protection (49 | 1.3%).
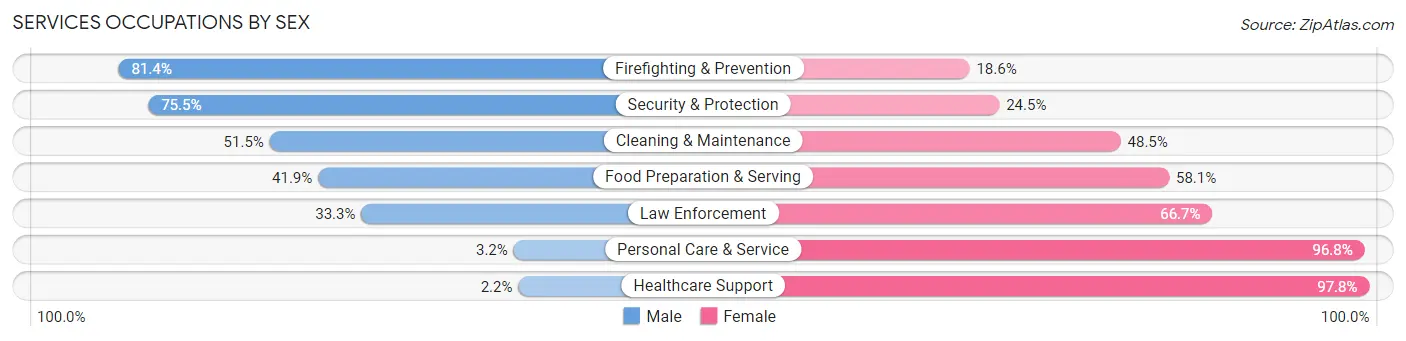
Services Occupations by Sex
Within the Services occupations in Richardson County, the most male-oriented occupations are Firefighting & Prevention (81.4%), Security & Protection (75.5%), and Cleaning & Maintenance (51.5%), while the most female-oriented occupations are Healthcare Support (97.8%), Personal Care & Service (96.8%), and Law Enforcement (66.7%).
| Occupation | Male | Female |
| Healthcare Support | 3 (2.2%) | 131 (97.8%) |
| Security & Protection | 37 (75.5%) | 12 (24.5%) |
| Firefighting & Prevention | 35 (81.4%) | 8 (18.6%) |
| Law Enforcement | 2 (33.3%) | 4 (66.7%) |
| Food Preparation & Serving | 49 (41.9%) | 68 (58.1%) |
| Cleaning & Maintenance | 105 (51.5%) | 99 (48.5%) |
| Personal Care & Service | 4 (3.2%) | 122 (96.8%) |
| Total (Category) | 198 (31.4%) | 432 (68.6%) |
| Total (Overall) | 2,105 (55.9%) | 1,663 (44.1%) |
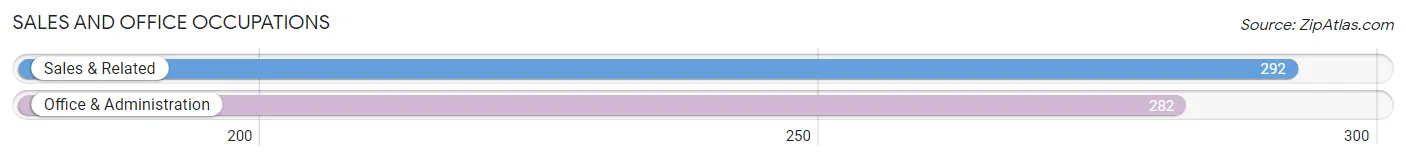
Sales and Office Occupations
The most common Sales and Office occupations in Richardson County are Sales & Related (292 | 7.7%), and Office & Administration (282 | 7.5%).
Sales and Office Occupations by Sex
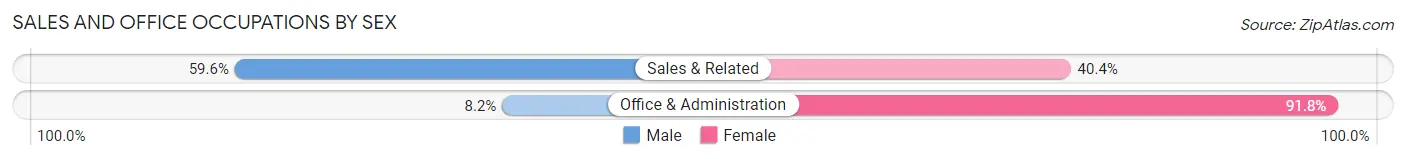
| Occupation | Male | Female |
| Sales & Related | 174 (59.6%) | 118 (40.4%) |
| Office & Administration | 23 (8.2%) | 259 (91.8%) |
| Total (Category) | 197 (34.3%) | 377 (65.7%) |
| Total (Overall) | 2,105 (55.9%) | 1,663 (44.1%) |
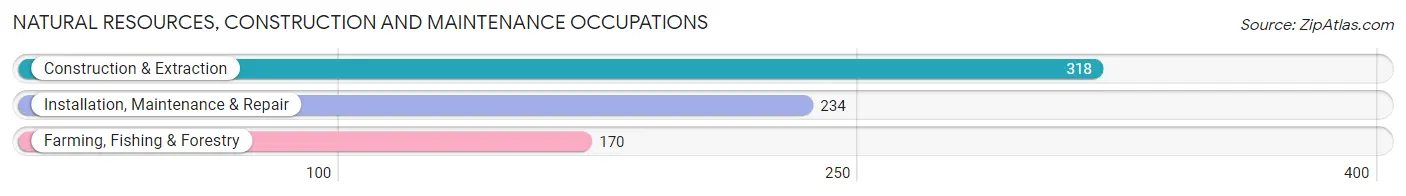
Natural Resources, Construction and Maintenance Occupations
The most common Natural Resources, Construction and Maintenance occupations in Richardson County are Construction & Extraction (318 | 8.4%), Installation, Maintenance & Repair (234 | 6.2%), and Farming, Fishing & Forestry (170 | 4.5%).
Natural Resources, Construction and Maintenance Occupations by Sex
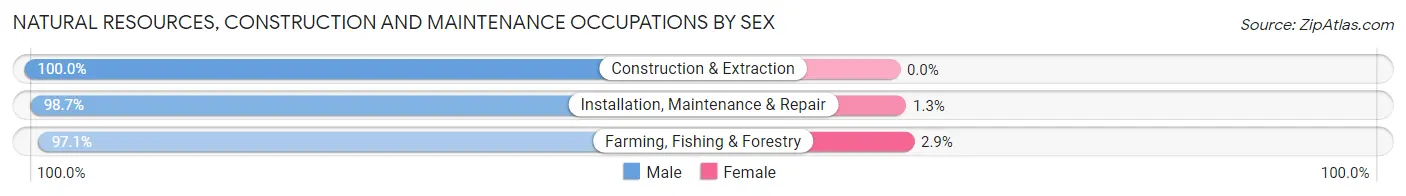
| Occupation | Male | Female |
| Farming, Fishing & Forestry | 165 (97.1%) | 5 (2.9%) |
| Construction & Extraction | 318 (100.0%) | 0 (0.0%) |
| Installation, Maintenance & Repair | 231 (98.7%) | 3 (1.3%) |
| Total (Category) | 714 (98.9%) | 8 (1.1%) |
| Total (Overall) | 2,105 (55.9%) | 1,663 (44.1%) |
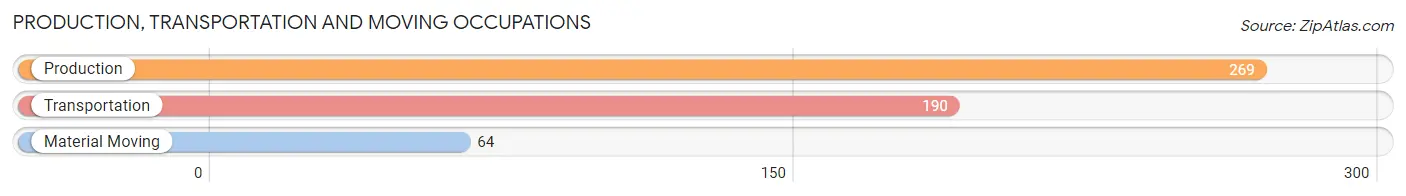
Production, Transportation and Moving Occupations
The most common Production, Transportation and Moving occupations in Richardson County are Production (269 | 7.1%), Transportation (190 | 5.0%), and Material Moving (64 | 1.7%).
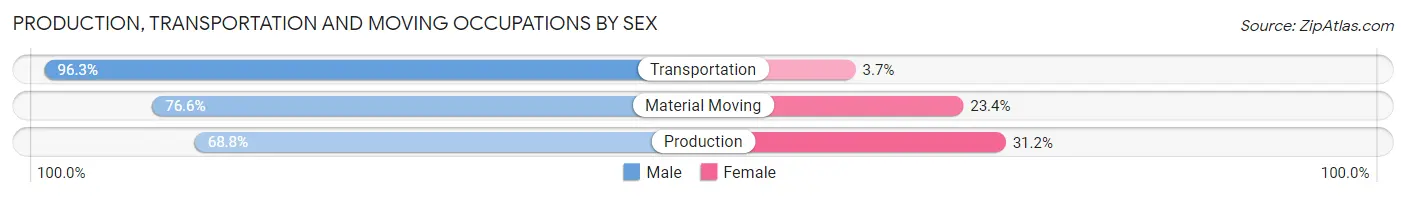
Production, Transportation and Moving Occupations by Sex
| Occupation | Male | Female |
| Production | 185 (68.8%) | 84 (31.2%) |
| Transportation | 183 (96.3%) | 7 (3.7%) |
| Material Moving | 49 (76.6%) | 15 (23.4%) |
| Total (Category) | 417 (79.7%) | 106 (20.3%) |
| Total (Overall) | 2,105 (55.9%) | 1,663 (44.1%) |
Employment Industries by Sex in Richardson County
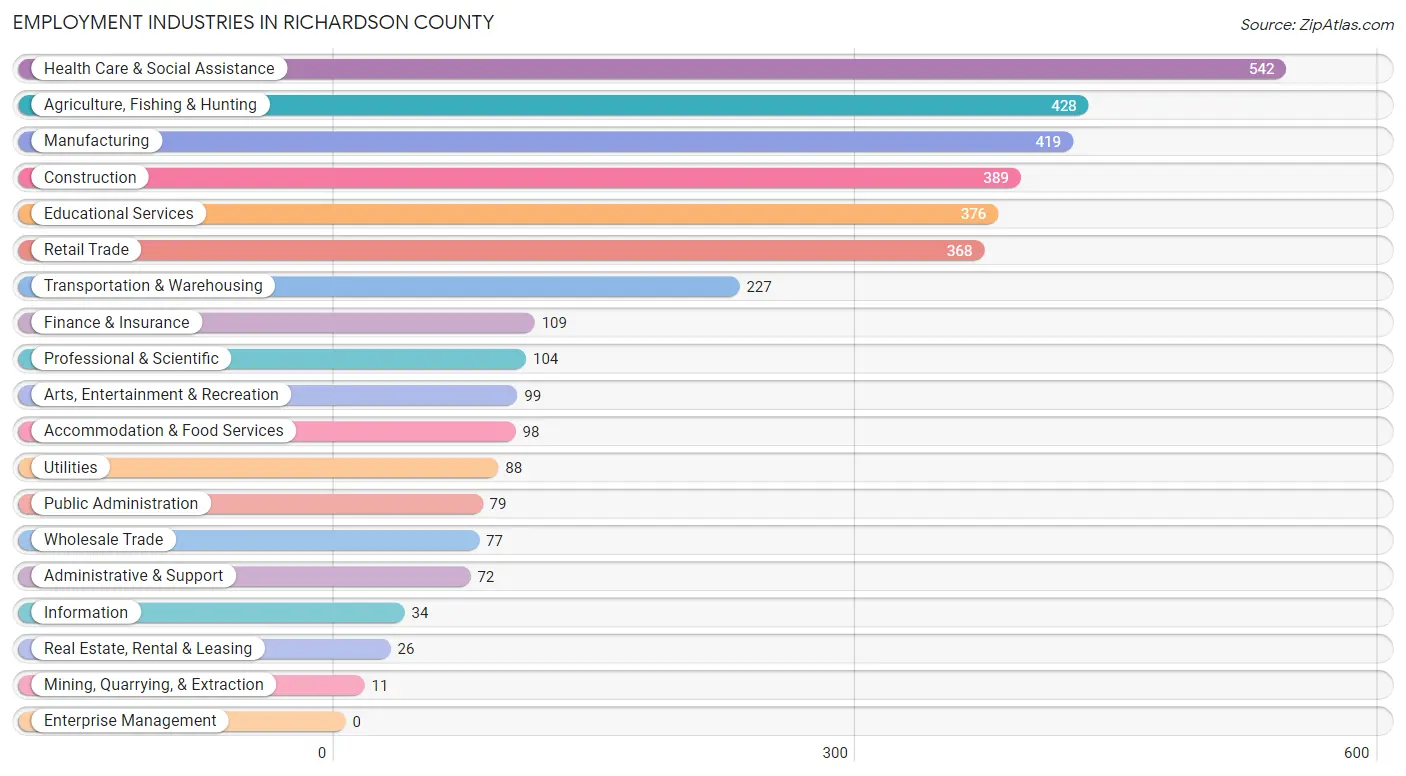
Employment Industries in Richardson County
The major employment industries in Richardson County include Health Care & Social Assistance (542 | 14.4%), Agriculture, Fishing & Hunting (428 | 11.4%), Manufacturing (419 | 11.1%), Construction (389 | 10.3%), and Educational Services (376 | 10.0%).
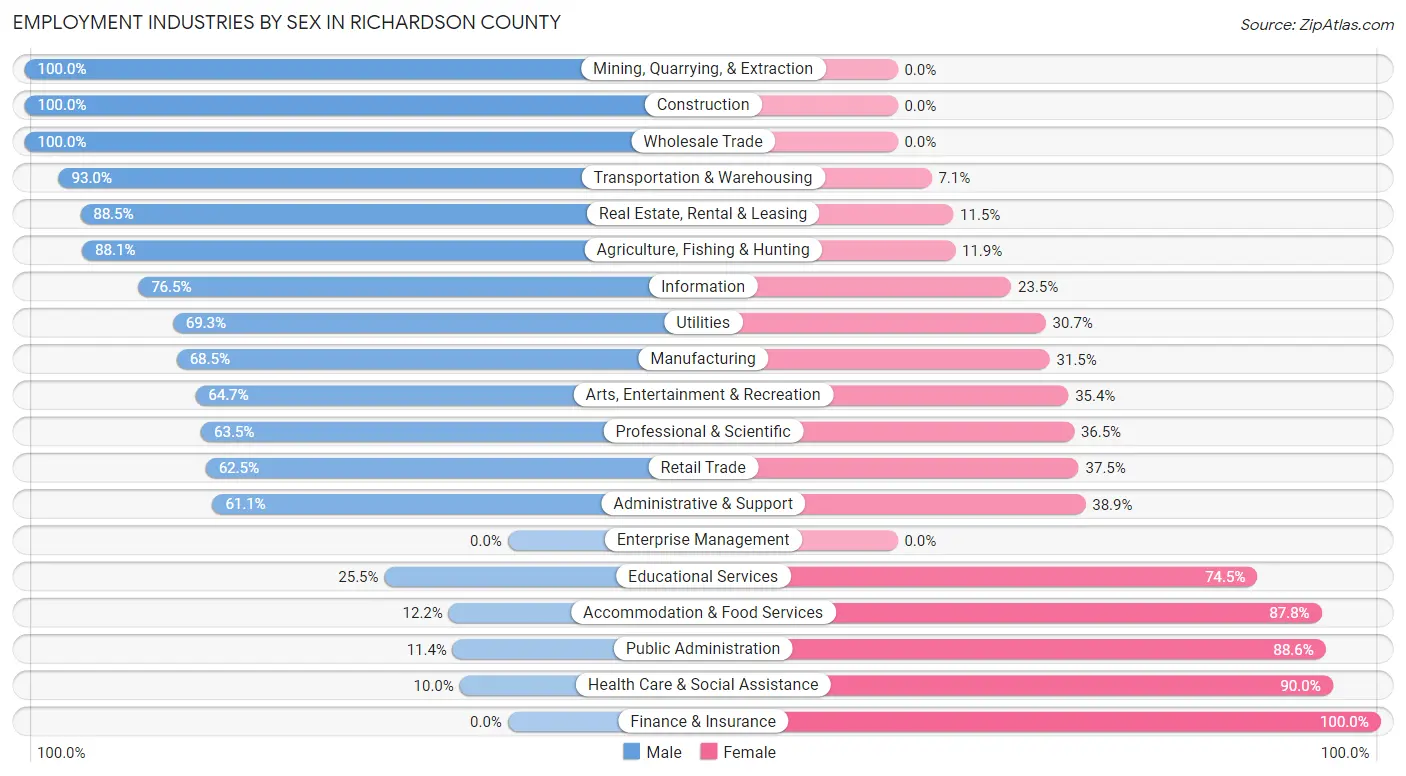
Employment Industries by Sex in Richardson County
The Richardson County industries that see more men than women are Mining, Quarrying, & Extraction (100.0%), Construction (100.0%), and Wholesale Trade (100.0%), whereas the industries that tend to have a higher number of women are Finance & Insurance (100.0%), Health Care & Social Assistance (90.0%), and Public Administration (88.6%).
| Industry | Male | Female |
| Agriculture, Fishing & Hunting | 377 (88.1%) | 51 (11.9%) |
| Mining, Quarrying, & Extraction | 11 (100.0%) | 0 (0.0%) |
| Construction | 389 (100.0%) | 0 (0.0%) |
| Manufacturing | 287 (68.5%) | 132 (31.5%) |
| Wholesale Trade | 77 (100.0%) | 0 (0.0%) |
| Retail Trade | 230 (62.5%) | 138 (37.5%) |
| Transportation & Warehousing | 211 (92.9%) | 16 (7.0%) |
| Utilities | 61 (69.3%) | 27 (30.7%) |
| Information | 26 (76.5%) | 8 (23.5%) |
| Finance & Insurance | 0 (0.0%) | 109 (100.0%) |
| Real Estate, Rental & Leasing | 23 (88.5%) | 3 (11.5%) |
| Professional & Scientific | 66 (63.5%) | 38 (36.5%) |
| Enterprise Management | 0 (0.0%) | 0 (0.0%) |
| Administrative & Support | 44 (61.1%) | 28 (38.9%) |
| Educational Services | 96 (25.5%) | 280 (74.5%) |
| Health Care & Social Assistance | 54 (10.0%) | 488 (90.0%) |
| Arts, Entertainment & Recreation | 64 (64.6%) | 35 (35.3%) |
| Accommodation & Food Services | 12 (12.2%) | 86 (87.8%) |
| Public Administration | 9 (11.4%) | 70 (88.6%) |
| Total | 2,105 (55.9%) | 1,663 (44.1%) |
Education in Richardson County
School Enrollment in Richardson County
The most common levels of schooling among the 1,547 students in Richardson County are high school (480 | 31.0%), middle school (417 | 27.0%), and elementary school (331 | 21.4%).
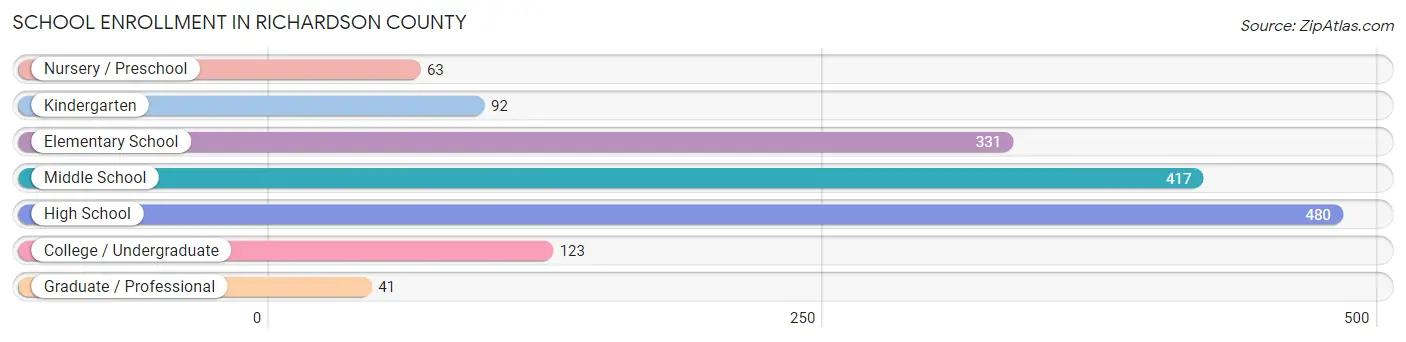
| School Level | # Students | % Students |
| Nursery / Preschool | 63 | 4.1% |
| Kindergarten | 92 | 5.9% |
| Elementary School | 331 | 21.4% |
| Middle School | 417 | 27.0% |
| High School | 480 | 31.0% |
| College / Undergraduate | 123 | 8.0% |
| Graduate / Professional | 41 | 2.6% |
| Total | 1,547 | 100.0% |
School Enrollment by Age by Funding Source in Richardson County
Out of a total of 1,547 students who are enrolled in schools in Richardson County, 240 (15.5%) attend a private institution, while the remaining 1,307 (84.5%) are enrolled in public schools. The age group of 3 to 4 year olds has the highest likelihood of being enrolled in private schools, with 10 (27.8% in the age bracket) enrolled. Conversely, the age group of 20 to 24 year olds has the lowest likelihood of being enrolled in a private school, with 46 (100.0% in the age bracket) attending a public institution.
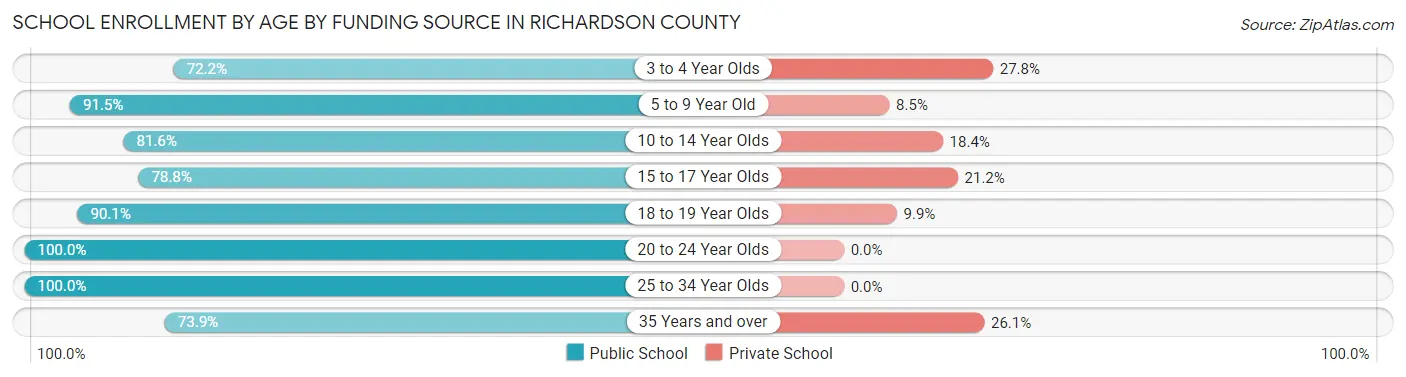
| Age Bracket | Public School | Private School |
| 3 to 4 Year Olds | 26 (72.2%) | 10 (27.8%) |
| 5 to 9 Year Old | 400 (91.5%) | 37 (8.5%) |
| 10 to 14 Year Olds | 367 (81.6%) | 83 (18.4%) |
| 15 to 17 Year Olds | 271 (78.8%) | 73 (21.2%) |
| 18 to 19 Year Olds | 128 (90.1%) | 14 (9.9%) |
| 20 to 24 Year Olds | 46 (100.0%) | 0 (0.0%) |
| 25 to 34 Year Olds | 4 (100.0%) | 0 (0.0%) |
| 35 Years and over | 65 (73.9%) | 23 (26.1%) |
| Total | 1,307 (84.5%) | 240 (15.5%) |
Educational Attainment by Field of Study in Richardson County
Education (327 | 24.7%), business (206 | 15.5%), science & technology (180 | 13.6%), bio, nature & agricultural (131 | 9.9%), and social sciences (104 | 7.9%) are the most common fields of study among 1,325 individuals in Richardson County who have obtained a bachelor's degree or higher.
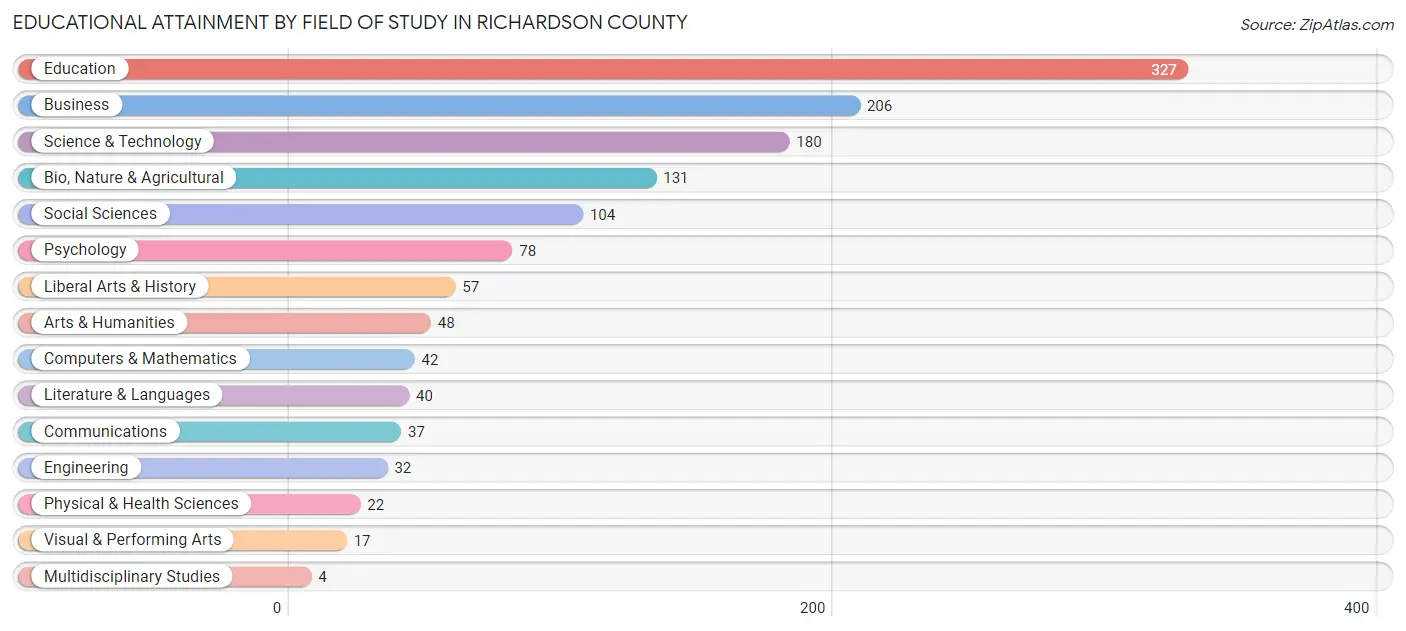
| Field of Study | # Graduates | % Graduates |
| Computers & Mathematics | 42 | 3.2% |
| Bio, Nature & Agricultural | 131 | 9.9% |
| Physical & Health Sciences | 22 | 1.7% |
| Psychology | 78 | 5.9% |
| Social Sciences | 104 | 7.9% |
| Engineering | 32 | 2.4% |
| Multidisciplinary Studies | 4 | 0.3% |
| Science & Technology | 180 | 13.6% |
| Business | 206 | 15.5% |
| Education | 327 | 24.7% |
| Literature & Languages | 40 | 3.0% |
| Liberal Arts & History | 57 | 4.3% |
| Visual & Performing Arts | 17 | 1.3% |
| Communications | 37 | 2.8% |
| Arts & Humanities | 48 | 3.6% |
| Total | 1,325 | 100.0% |
Transportation & Commute in Richardson County
Vehicle Availability by Sex in Richardson County
The most prevalent vehicle ownership categories in Richardson County are males with 2 vehicles (733, accounting for 36.0%) and females with 2 vehicles (429, making up 45.4%).
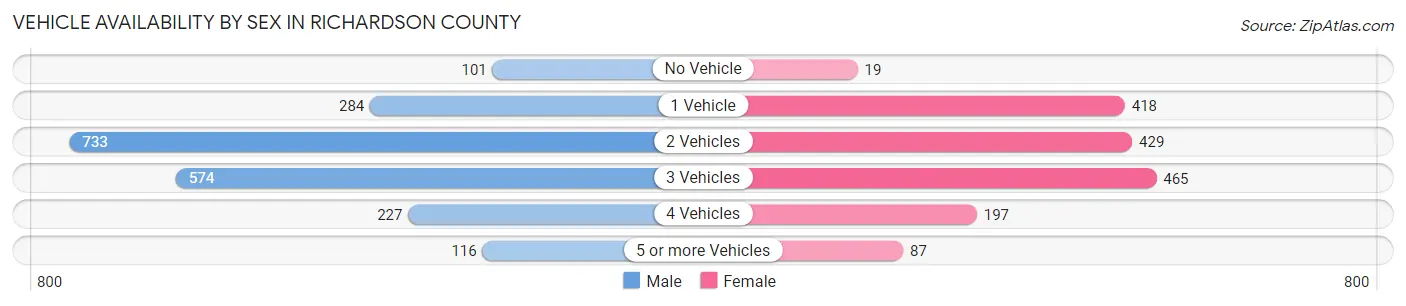
| Vehicles Available | Male | Female |
| No Vehicle | 101 (5.0%) | 19 (1.2%) |
| 1 Vehicle | 284 (14.0%) | 418 (25.9%) |
| 2 Vehicles | 733 (36.0%) | 429 (26.6%) |
| 3 Vehicles | 574 (28.2%) | 465 (28.8%) |
| 4 Vehicles | 227 (11.2%) | 197 (12.2%) |
| 5 or more Vehicles | 116 (5.7%) | 87 (5.4%) |
| Total | 2,035 (100.0%) | 1,615 (100.0%) |
Commute Time in Richardson County
The most frequently occuring commute durations in Richardson County are 5 to 9 minutes (823 commuters, 23.9%), less than 5 minutes (624 commuters, 18.1%), and 10 to 14 minutes (452 commuters, 13.1%).
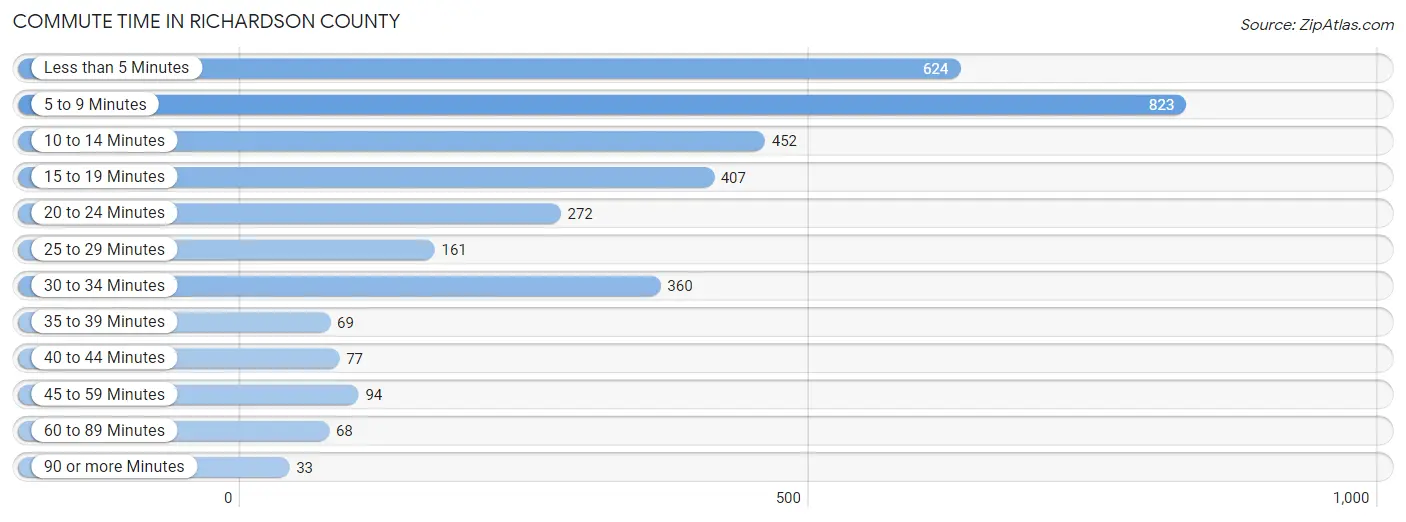
| Commute Time | # Commuters | % Commuters |
| Less than 5 Minutes | 624 | 18.1% |
| 5 to 9 Minutes | 823 | 23.9% |
| 10 to 14 Minutes | 452 | 13.1% |
| 15 to 19 Minutes | 407 | 11.8% |
| 20 to 24 Minutes | 272 | 7.9% |
| 25 to 29 Minutes | 161 | 4.7% |
| 30 to 34 Minutes | 360 | 10.5% |
| 35 to 39 Minutes | 69 | 2.0% |
| 40 to 44 Minutes | 77 | 2.2% |
| 45 to 59 Minutes | 94 | 2.7% |
| 60 to 89 Minutes | 68 | 2.0% |
| 90 or more Minutes | 33 | 1.0% |
Commute Time by Sex in Richardson County
The most common commute times in Richardson County are 5 to 9 minutes (438 commuters, 23.0%) for males and 5 to 9 minutes (385 commuters, 25.1%) for females.
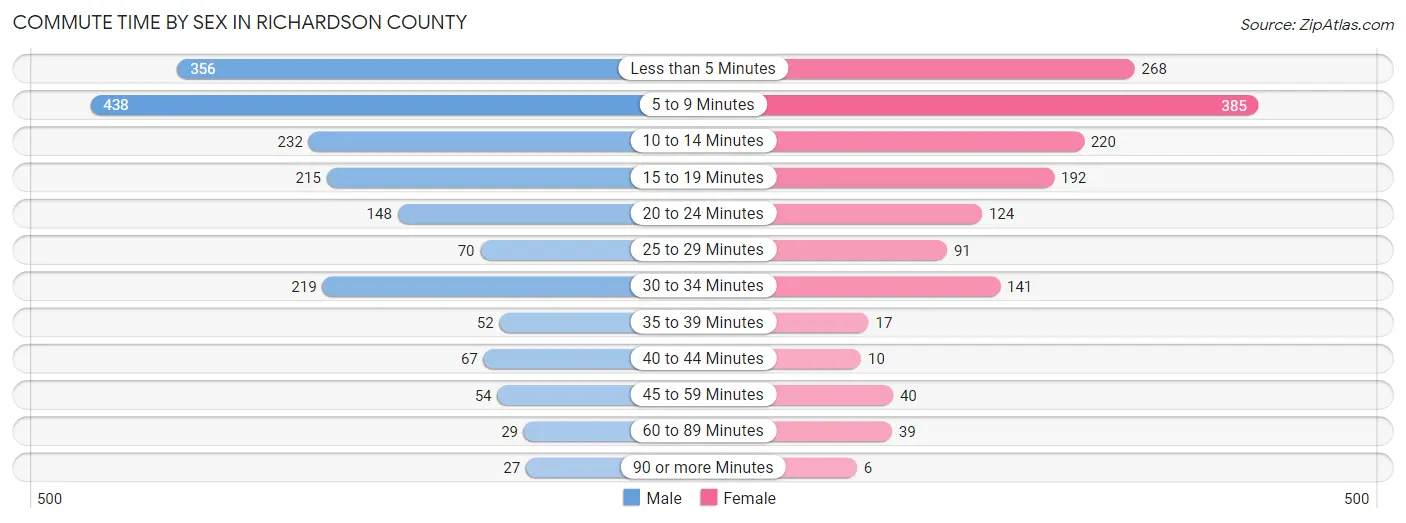
| Commute Time | Male | Female |
| Less than 5 Minutes | 356 (18.7%) | 268 (17.5%) |
| 5 to 9 Minutes | 438 (23.0%) | 385 (25.1%) |
| 10 to 14 Minutes | 232 (12.2%) | 220 (14.3%) |
| 15 to 19 Minutes | 215 (11.3%) | 192 (12.5%) |
| 20 to 24 Minutes | 148 (7.8%) | 124 (8.1%) |
| 25 to 29 Minutes | 70 (3.7%) | 91 (5.9%) |
| 30 to 34 Minutes | 219 (11.5%) | 141 (9.2%) |
| 35 to 39 Minutes | 52 (2.7%) | 17 (1.1%) |
| 40 to 44 Minutes | 67 (3.5%) | 10 (0.6%) |
| 45 to 59 Minutes | 54 (2.8%) | 40 (2.6%) |
| 60 to 89 Minutes | 29 (1.5%) | 39 (2.5%) |
| 90 or more Minutes | 27 (1.4%) | 6 (0.4%) |
Time of Departure to Work by Sex in Richardson County
The most frequent times of departure to work in Richardson County are 7:30 AM to 7:59 AM (292, 15.3%) for males and 7:00 AM to 7:29 AM (287, 18.7%) for females.
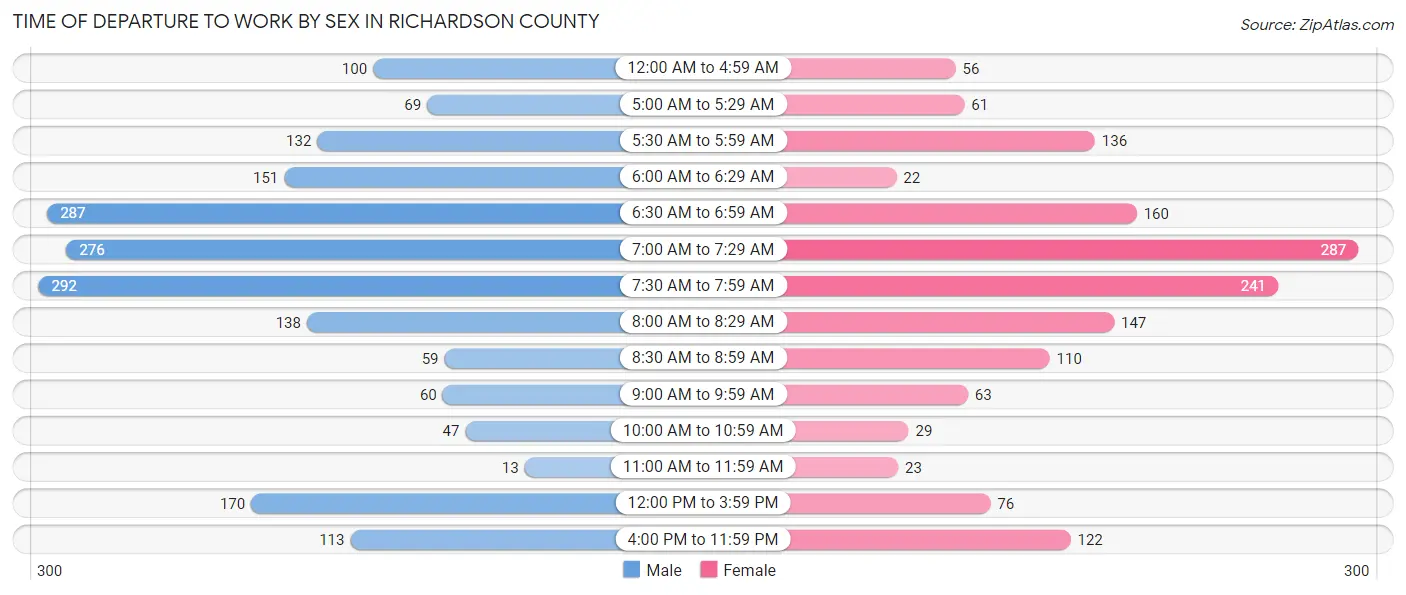
| Time of Departure | Male | Female |
| 12:00 AM to 4:59 AM | 100 (5.2%) | 56 (3.6%) |
| 5:00 AM to 5:29 AM | 69 (3.6%) | 61 (4.0%) |
| 5:30 AM to 5:59 AM | 132 (6.9%) | 136 (8.9%) |
| 6:00 AM to 6:29 AM | 151 (7.9%) | 22 (1.4%) |
| 6:30 AM to 6:59 AM | 287 (15.0%) | 160 (10.4%) |
| 7:00 AM to 7:29 AM | 276 (14.5%) | 287 (18.7%) |
| 7:30 AM to 7:59 AM | 292 (15.3%) | 241 (15.7%) |
| 8:00 AM to 8:29 AM | 138 (7.2%) | 147 (9.6%) |
| 8:30 AM to 8:59 AM | 59 (3.1%) | 110 (7.2%) |
| 9:00 AM to 9:59 AM | 60 (3.2%) | 63 (4.1%) |
| 10:00 AM to 10:59 AM | 47 (2.5%) | 29 (1.9%) |
| 11:00 AM to 11:59 AM | 13 (0.7%) | 23 (1.5%) |
| 12:00 PM to 3:59 PM | 170 (8.9%) | 76 (5.0%) |
| 4:00 PM to 11:59 PM | 113 (5.9%) | 122 (8.0%) |
| Total | 1,907 (100.0%) | 1,533 (100.0%) |
Housing Occupancy in Richardson County
Occupancy by Ownership in Richardson County
Of the total 3,587 dwellings in Richardson County, owner-occupied units account for 2,640 (73.6%), while renter-occupied units make up 947 (26.4%).
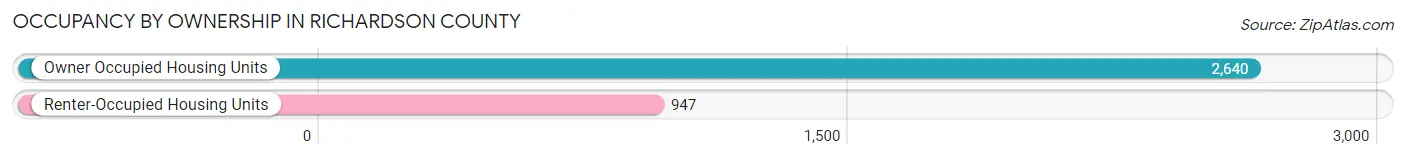
| Occupancy | # Housing Units | % Housing Units |
| Owner Occupied Housing Units | 2,640 | 73.6% |
| Renter-Occupied Housing Units | 947 | 26.4% |
| Total Occupied Housing Units | 3,587 | 100.0% |
Occupancy by Household Size in Richardson County
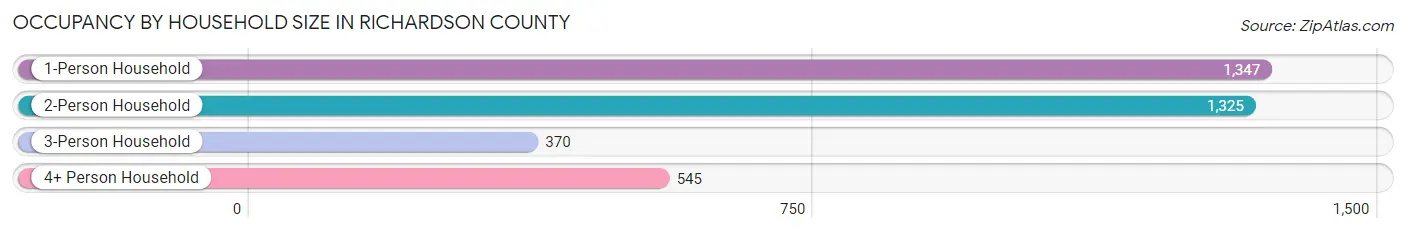
| Household Size | # Housing Units | % Housing Units |
| 1-Person Household | 1,347 | 37.6% |
| 2-Person Household | 1,325 | 36.9% |
| 3-Person Household | 370 | 10.3% |
| 4+ Person Household | 545 | 15.2% |
| Total Housing Units | 3,587 | 100.0% |
Occupancy by Ownership by Household Size in Richardson County
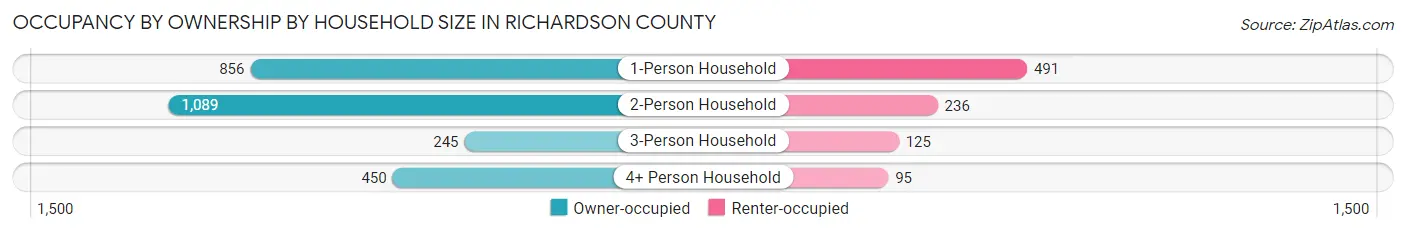
| Household Size | Owner-occupied | Renter-occupied |
| 1-Person Household | 856 (63.5%) | 491 (36.4%) |
| 2-Person Household | 1,089 (82.2%) | 236 (17.8%) |
| 3-Person Household | 245 (66.2%) | 125 (33.8%) |
| 4+ Person Household | 450 (82.6%) | 95 (17.4%) |
| Total Housing Units | 2,640 (73.6%) | 947 (26.4%) |
Occupancy by Educational Attainment in Richardson County
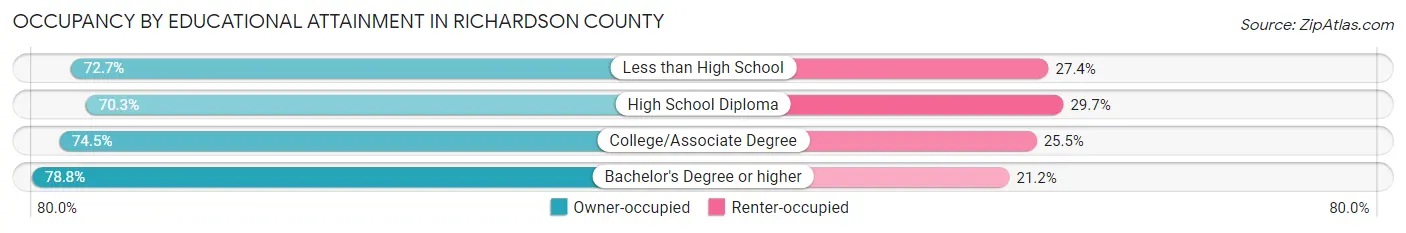
| Household Size | Owner-occupied | Renter-occupied |
| Less than High School | 178 (72.7%) | 67 (27.4%) |
| High School Diploma | 1,034 (70.3%) | 437 (29.7%) |
| College/Associate Degree | 817 (74.5%) | 279 (25.5%) |
| Bachelor's Degree or higher | 611 (78.8%) | 164 (21.2%) |
Occupancy by Age of Householder in Richardson County
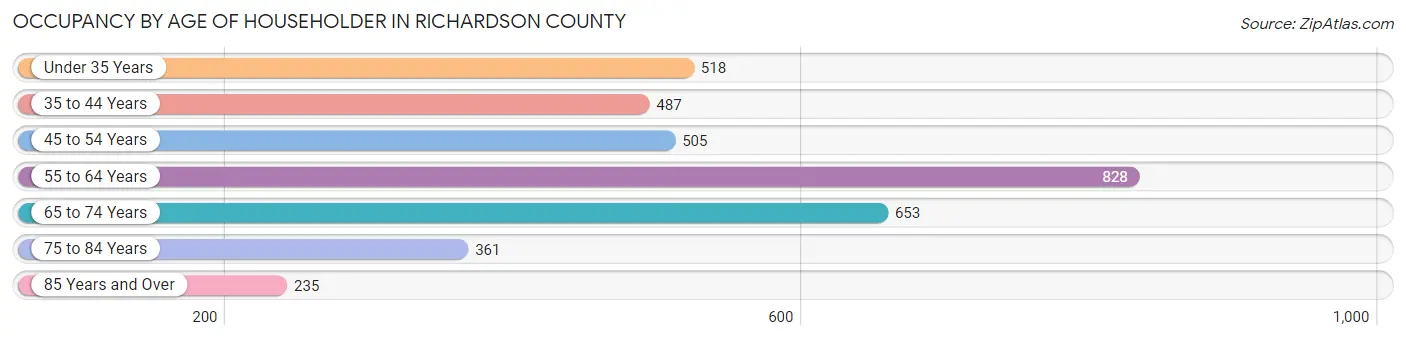
| Age Bracket | # Households | % Households |
| Under 35 Years | 518 | 14.4% |
| 35 to 44 Years | 487 | 13.6% |
| 45 to 54 Years | 505 | 14.1% |
| 55 to 64 Years | 828 | 23.1% |
| 65 to 74 Years | 653 | 18.2% |
| 75 to 84 Years | 361 | 10.1% |
| 85 Years and Over | 235 | 6.6% |
| Total | 3,587 | 100.0% |
Housing Finances in Richardson County
Median Income by Occupancy in Richardson County
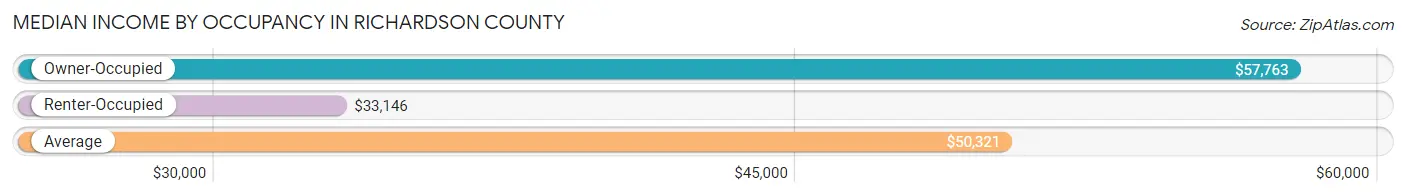
| Occupancy Type | # Households | Median Income |
| Owner-Occupied | 2,640 (73.6%) | $57,763 |
| Renter-Occupied | 947 (26.4%) | $33,146 |
| Average | 3,587 (100.0%) | $50,321 |
Occupancy by Householder Income Bracket in Richardson County
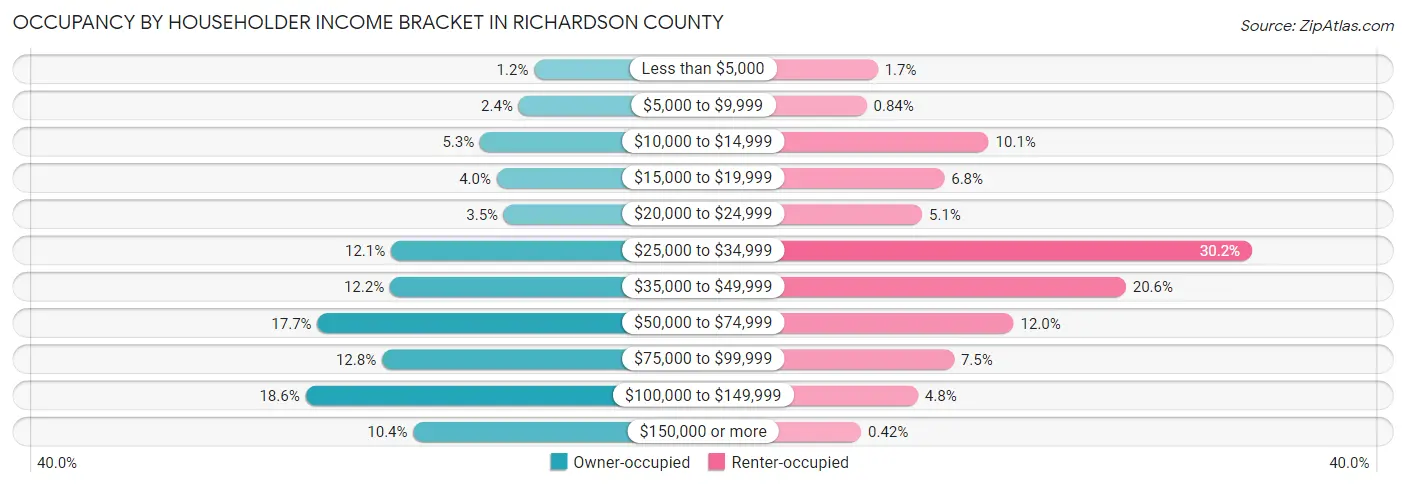
| Income Bracket | Owner-occupied | Renter-occupied |
| Less than $5,000 | 31 (1.2%) | 16 (1.7%) |
| $5,000 to $9,999 | 62 (2.4%) | 8 (0.8%) |
| $10,000 to $14,999 | 140 (5.3%) | 96 (10.1%) |
| $15,000 to $19,999 | 106 (4.0%) | 64 (6.8%) |
| $20,000 to $24,999 | 92 (3.5%) | 48 (5.1%) |
| $25,000 to $34,999 | 319 (12.1%) | 286 (30.2%) |
| $35,000 to $49,999 | 321 (12.2%) | 195 (20.6%) |
| $50,000 to $74,999 | 467 (17.7%) | 114 (12.0%) |
| $75,000 to $99,999 | 337 (12.8%) | 71 (7.5%) |
| $100,000 to $149,999 | 491 (18.6%) | 45 (4.8%) |
| $150,000 or more | 274 (10.4%) | 4 (0.4%) |
| Total | 2,640 (100.0%) | 947 (100.0%) |
Monthly Housing Cost Tiers in Richardson County
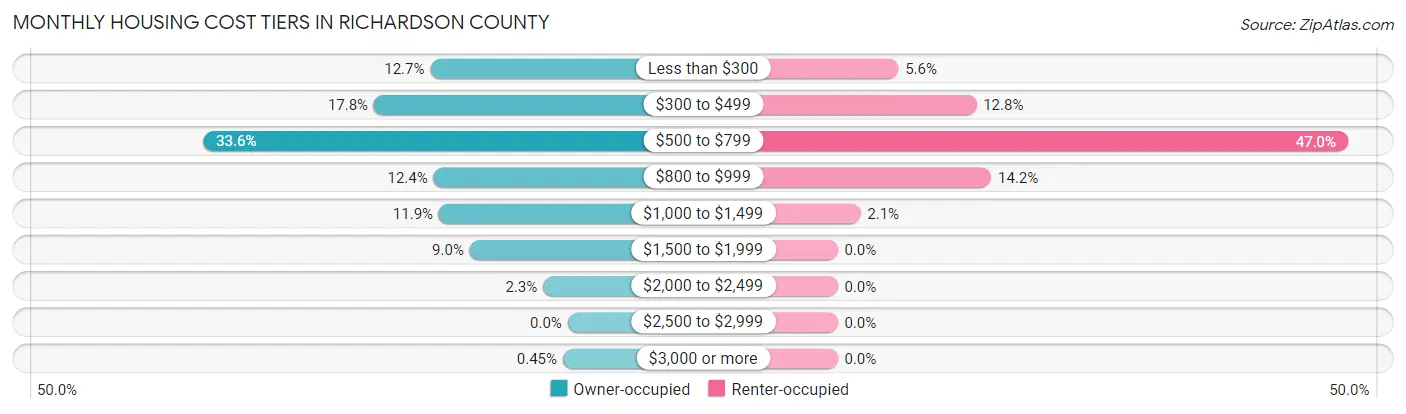
| Monthly Cost | Owner-occupied | Renter-occupied |
| Less than $300 | 334 (12.7%) | 53 (5.6%) |
| $300 to $499 | 471 (17.8%) | 121 (12.8%) |
| $500 to $799 | 886 (33.6%) | 445 (47.0%) |
| $800 to $999 | 326 (12.3%) | 134 (14.1%) |
| $1,000 to $1,499 | 313 (11.9%) | 20 (2.1%) |
| $1,500 to $1,999 | 238 (9.0%) | 0 (0.0%) |
| $2,000 to $2,499 | 60 (2.3%) | 0 (0.0%) |
| $2,500 to $2,999 | 0 (0.0%) | 0 (0.0%) |
| $3,000 or more | 12 (0.4%) | 0 (0.0%) |
| Total | 2,640 (100.0%) | 947 (100.0%) |
Physical Housing Characteristics in Richardson County
Housing Structures in Richardson County
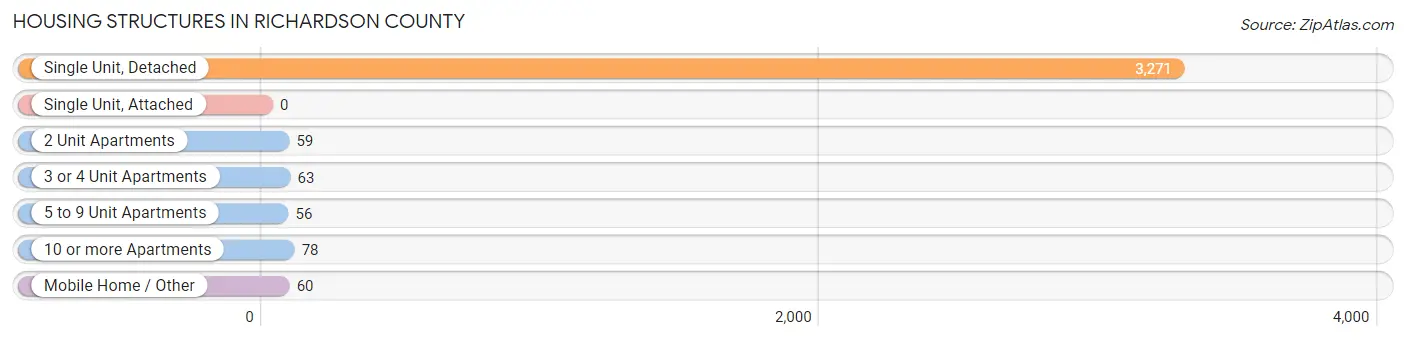
| Structure Type | # Housing Units | % Housing Units |
| Single Unit, Detached | 3,271 | 91.2% |
| Single Unit, Attached | 0 | 0.0% |
| 2 Unit Apartments | 59 | 1.6% |
| 3 or 4 Unit Apartments | 63 | 1.8% |
| 5 to 9 Unit Apartments | 56 | 1.6% |
| 10 or more Apartments | 78 | 2.2% |
| Mobile Home / Other | 60 | 1.7% |
| Total | 3,587 | 100.0% |
Housing Structures by Occupancy in Richardson County
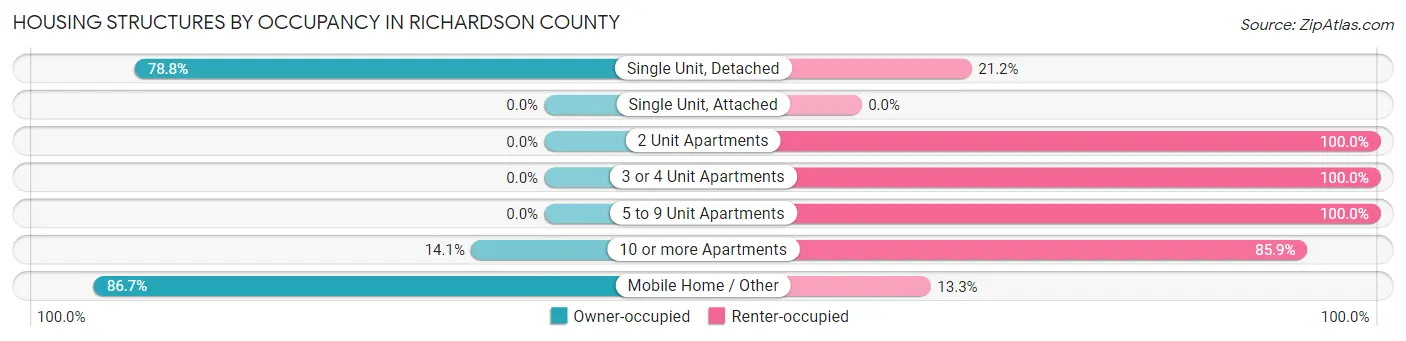
| Structure Type | Owner-occupied | Renter-occupied |
| Single Unit, Detached | 2,577 (78.8%) | 694 (21.2%) |
| Single Unit, Attached | 0 (0.0%) | 0 (0.0%) |
| 2 Unit Apartments | 0 (0.0%) | 59 (100.0%) |
| 3 or 4 Unit Apartments | 0 (0.0%) | 63 (100.0%) |
| 5 to 9 Unit Apartments | 0 (0.0%) | 56 (100.0%) |
| 10 or more Apartments | 11 (14.1%) | 67 (85.9%) |
| Mobile Home / Other | 52 (86.7%) | 8 (13.3%) |
| Total | 2,640 (73.6%) | 947 (26.4%) |
Housing Structures by Number of Rooms in Richardson County
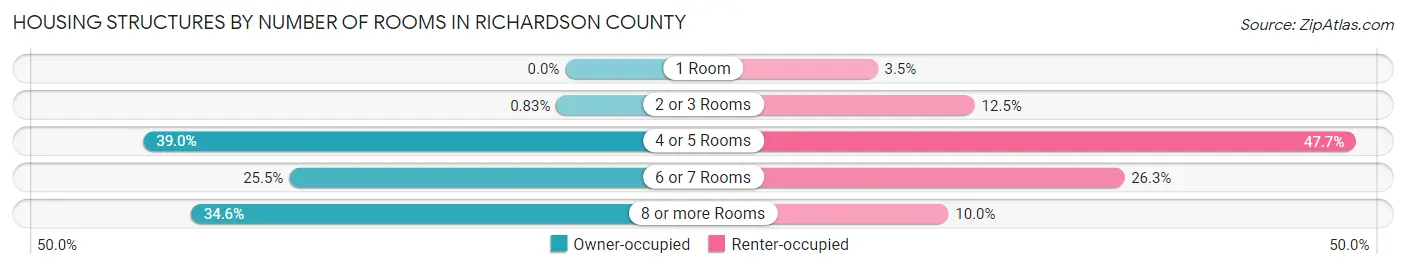
| Number of Rooms | Owner-occupied | Renter-occupied |
| 1 Room | 0 (0.0%) | 33 (3.5%) |
| 2 or 3 Rooms | 22 (0.8%) | 118 (12.5%) |
| 4 or 5 Rooms | 1,030 (39.0%) | 452 (47.7%) |
| 6 or 7 Rooms | 674 (25.5%) | 249 (26.3%) |
| 8 or more Rooms | 914 (34.6%) | 95 (10.0%) |
| Total | 2,640 (100.0%) | 947 (100.0%) |
Housing Structure by Heating Type in Richardson County
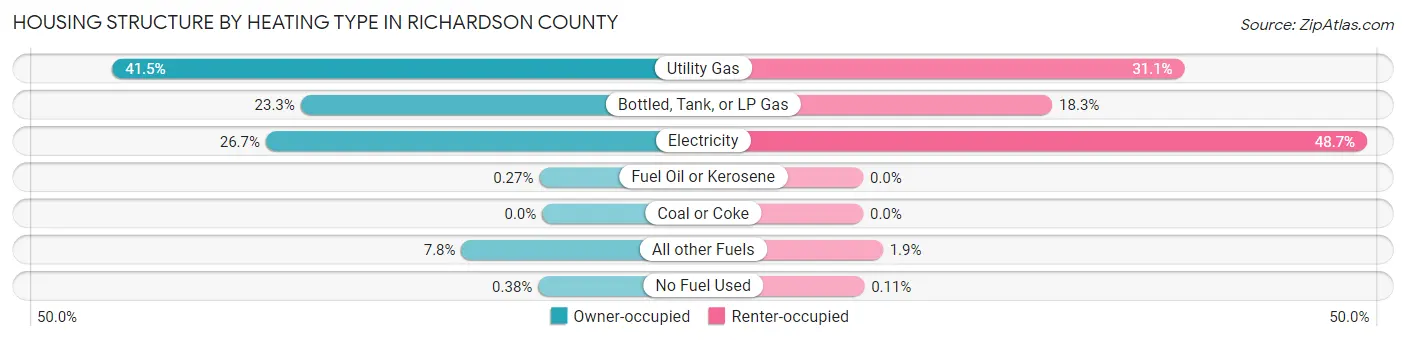
| Heating Type | Owner-occupied | Renter-occupied |
| Utility Gas | 1,096 (41.5%) | 294 (31.0%) |
| Bottled, Tank, or LP Gas | 616 (23.3%) | 173 (18.3%) |
| Electricity | 705 (26.7%) | 461 (48.7%) |
| Fuel Oil or Kerosene | 7 (0.3%) | 0 (0.0%) |
| Coal or Coke | 0 (0.0%) | 0 (0.0%) |
| All other Fuels | 206 (7.8%) | 18 (1.9%) |
| No Fuel Used | 10 (0.4%) | 1 (0.1%) |
| Total | 2,640 (100.0%) | 947 (100.0%) |
Household Vehicle Usage in Richardson County
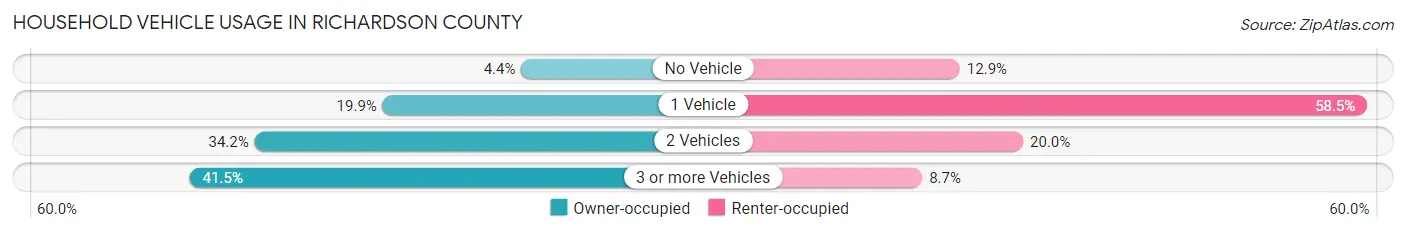
| Vehicles per Household | Owner-occupied | Renter-occupied |
| No Vehicle | 115 (4.4%) | 122 (12.9%) |
| 1 Vehicle | 525 (19.9%) | 554 (58.5%) |
| 2 Vehicles | 904 (34.2%) | 189 (20.0%) |
| 3 or more Vehicles | 1,096 (41.5%) | 82 (8.7%) |
| Total | 2,640 (100.0%) | 947 (100.0%) |
Real Estate & Mortgages in Richardson County
Real Estate and Mortgage Overview in Richardson County
| Characteristic | Without Mortgage | With Mortgage |
| Housing Units | 1,642 | 998 |
| Median Property Value | $78,100 | $94,700 |
| Median Household Income | $48,000 | $156 |
| Monthly Housing Costs | $506 | $12 |
| Real Estate Taxes | $1,034 | $27 |
Property Value by Mortgage Status in Richardson County
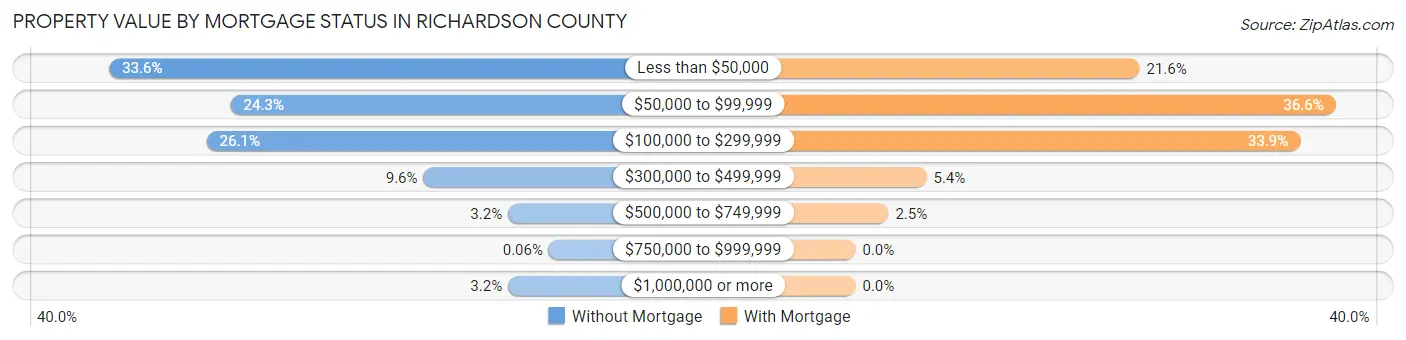
| Property Value | Without Mortgage | With Mortgage |
| Less than $50,000 | 551 (33.6%) | 216 (21.6%) |
| $50,000 to $99,999 | 399 (24.3%) | 365 (36.6%) |
| $100,000 to $299,999 | 429 (26.1%) | 338 (33.9%) |
| $300,000 to $499,999 | 158 (9.6%) | 54 (5.4%) |
| $500,000 to $749,999 | 52 (3.2%) | 25 (2.5%) |
| $750,000 to $999,999 | 1 (0.1%) | 0 (0.0%) |
| $1,000,000 or more | 52 (3.2%) | 0 (0.0%) |
| Total | 1,642 (100.0%) | 998 (100.0%) |
Household Income by Mortgage Status in Richardson County
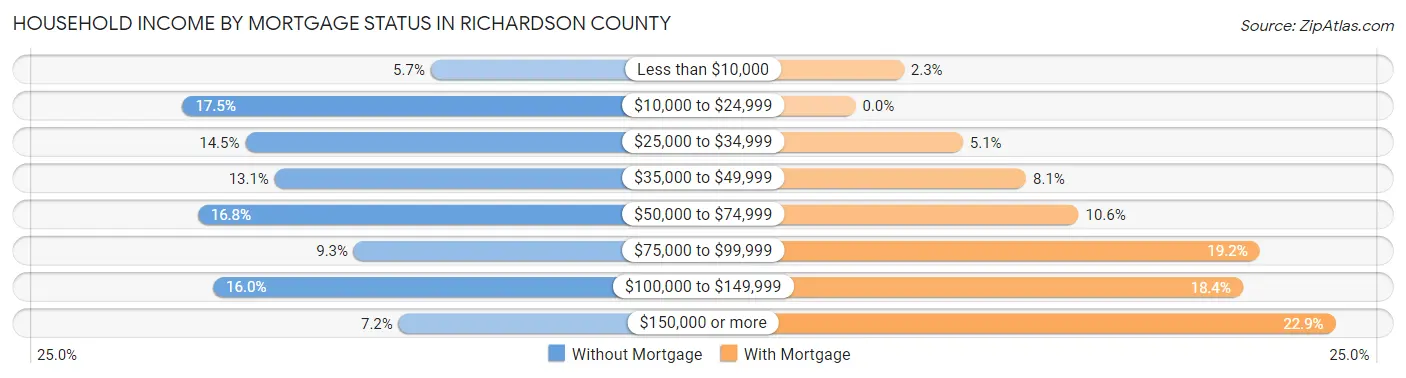
| Household Income | Without Mortgage | With Mortgage |
| Less than $10,000 | 93 (5.7%) | 23 (2.3%) |
| $10,000 to $24,999 | 287 (17.5%) | 0 (0.0%) |
| $25,000 to $34,999 | 238 (14.5%) | 51 (5.1%) |
| $35,000 to $49,999 | 215 (13.1%) | 81 (8.1%) |
| $50,000 to $74,999 | 275 (16.8%) | 106 (10.6%) |
| $75,000 to $99,999 | 153 (9.3%) | 192 (19.2%) |
| $100,000 to $149,999 | 263 (16.0%) | 184 (18.4%) |
| $150,000 or more | 118 (7.2%) | 228 (22.9%) |
| Total | 1,642 (100.0%) | 998 (100.0%) |
Property Value to Household Income Ratio in Richardson County
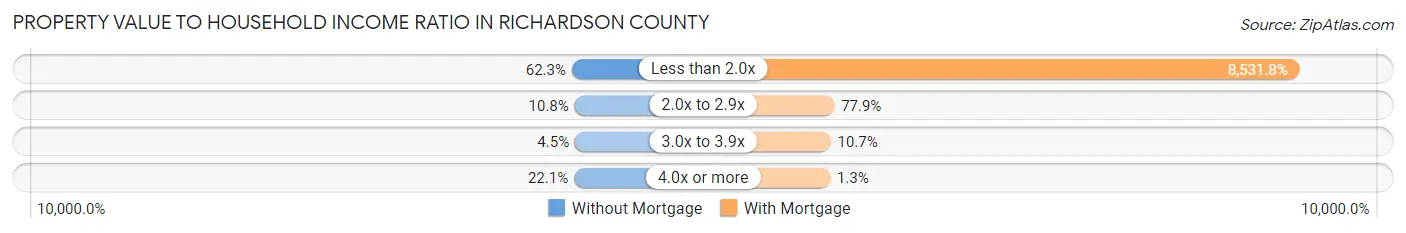
| Value-to-Income Ratio | Without Mortgage | With Mortgage |
| Less than 2.0x | 1,023 (62.3%) | 85,147 (8,531.8%) |
| 2.0x to 2.9x | 177 (10.8%) | 777 (77.9%) |
| 3.0x to 3.9x | 73 (4.4%) | 107 (10.7%) |
| 4.0x or more | 362 (22.1%) | 13 (1.3%) |
| Total | 1,642 (100.0%) | 998 (100.0%) |
Real Estate Taxes by Mortgage Status in Richardson County
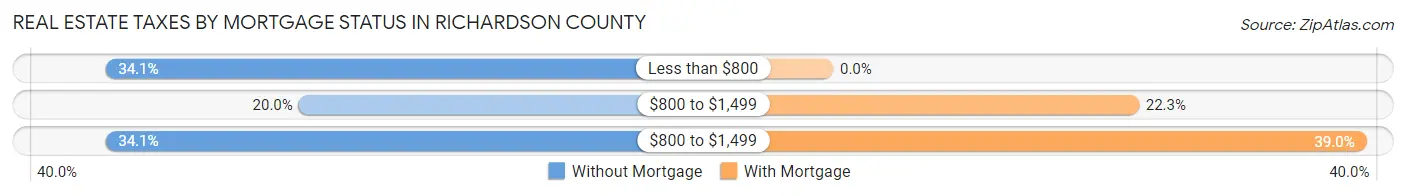
| Property Taxes | Without Mortgage | With Mortgage |
| Less than $800 | 560 (34.1%) | 0 (0.0%) |
| $800 to $1,499 | 328 (20.0%) | 223 (22.3%) |
| $800 to $1,499 | 560 (34.1%) | 389 (39.0%) |
| Total | 1,642 (100.0%) | 998 (100.0%) |
Health & Disability in Richardson County
Health Insurance Coverage by Age in Richardson County
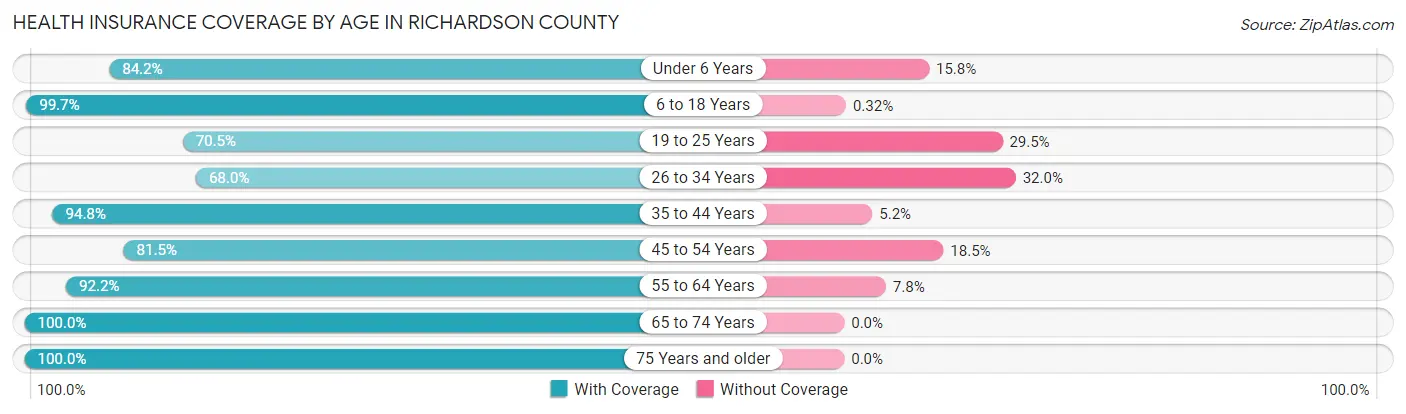
| Age Bracket | With Coverage | Without Coverage |
| Under 6 Years | 437 (84.2%) | 82 (15.8%) |
| 6 to 18 Years | 1,246 (99.7%) | 4 (0.3%) |
| 19 to 25 Years | 404 (70.5%) | 169 (29.5%) |
| 26 to 34 Years | 417 (68.0%) | 196 (32.0%) |
| 35 to 44 Years | 779 (94.8%) | 43 (5.2%) |
| 45 to 54 Years | 688 (81.5%) | 156 (18.5%) |
| 55 to 64 Years | 1,201 (92.2%) | 101 (7.8%) |
| 65 to 74 Years | 994 (100.0%) | 0 (0.0%) |
| 75 Years and older | 793 (100.0%) | 0 (0.0%) |
| Total | 6,959 (90.3%) | 751 (9.7%) |
Health Insurance Coverage by Citizenship Status in Richardson County
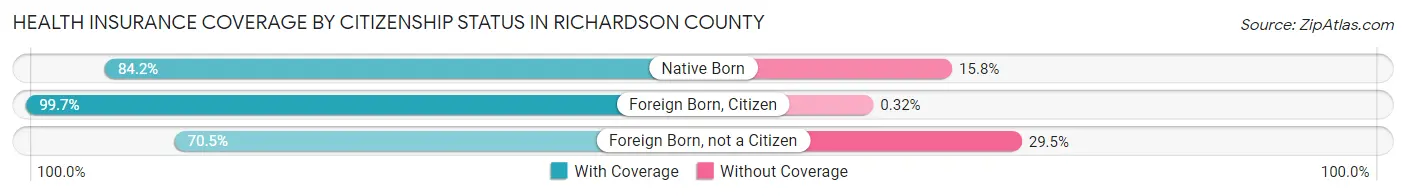
| Citizenship Status | With Coverage | Without Coverage |
| Native Born | 437 (84.2%) | 82 (15.8%) |
| Foreign Born, Citizen | 1,246 (99.7%) | 4 (0.3%) |
| Foreign Born, not a Citizen | 404 (70.5%) | 169 (29.5%) |
Health Insurance Coverage by Household Income in Richardson County
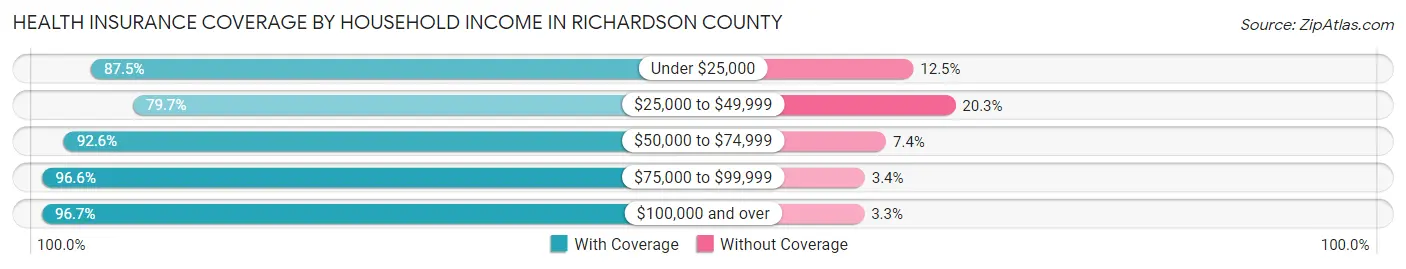
| Household Income | With Coverage | Without Coverage |
| Under $25,000 | 779 (87.5%) | 111 (12.5%) |
| $25,000 to $49,999 | 1,680 (79.7%) | 429 (20.3%) |
| $50,000 to $74,999 | 1,247 (92.6%) | 99 (7.4%) |
| $75,000 to $99,999 | 918 (96.6%) | 32 (3.4%) |
| $100,000 and over | 2,335 (96.7%) | 79 (3.3%) |
Public vs Private Health Insurance Coverage by Age in Richardson County
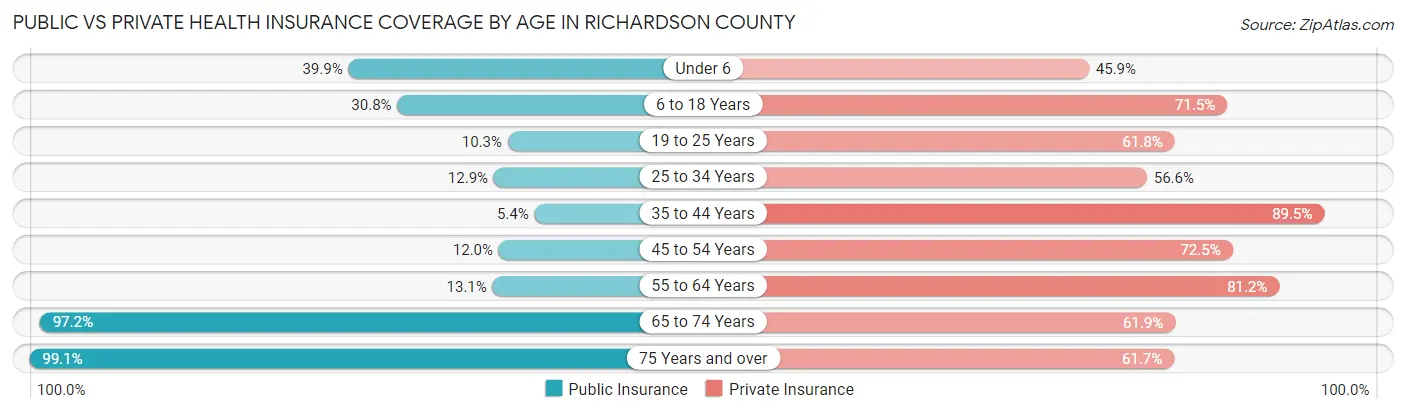
| Age Bracket | Public Insurance | Private Insurance |
| Under 6 | 207 (39.9%) | 238 (45.9%) |
| 6 to 18 Years | 385 (30.8%) | 894 (71.5%) |
| 19 to 25 Years | 59 (10.3%) | 354 (61.8%) |
| 25 to 34 Years | 79 (12.9%) | 347 (56.6%) |
| 35 to 44 Years | 44 (5.3%) | 736 (89.5%) |
| 45 to 54 Years | 101 (12.0%) | 612 (72.5%) |
| 55 to 64 Years | 171 (13.1%) | 1,057 (81.2%) |
| 65 to 74 Years | 966 (97.2%) | 615 (61.9%) |
| 75 Years and over | 786 (99.1%) | 489 (61.7%) |
| Total | 2,798 (36.3%) | 5,342 (69.3%) |
Disability Status by Sex by Age in Richardson County
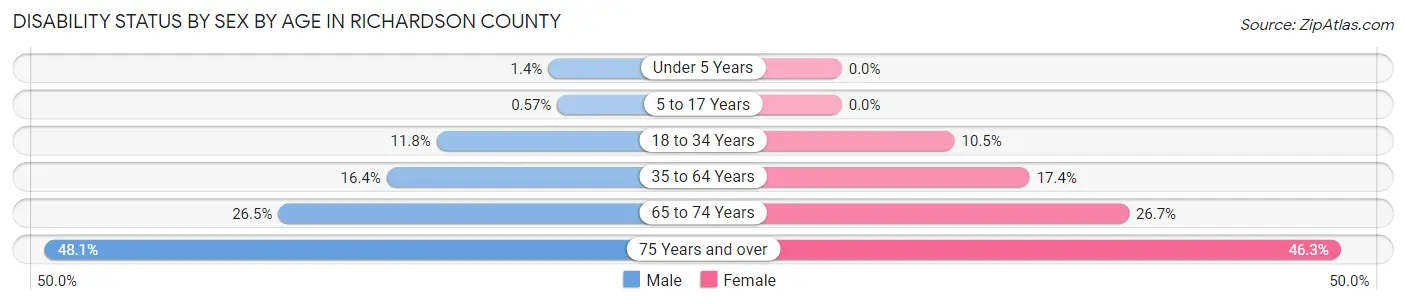
| Age Bracket | Male | Female |
| Under 5 Years | 3 (1.4%) | 0 (0.0%) |
| 5 to 17 Years | 4 (0.6%) | 0 (0.0%) |
| 18 to 34 Years | 83 (11.8%) | 62 (10.5%) |
| 35 to 64 Years | 245 (16.4%) | 257 (17.4%) |
| 65 to 74 Years | 127 (26.5%) | 137 (26.7%) |
| 75 Years and over | 154 (48.1%) | 219 (46.3%) |
Disability Class by Sex by Age in Richardson County
Disability Class: Hearing Difficulty
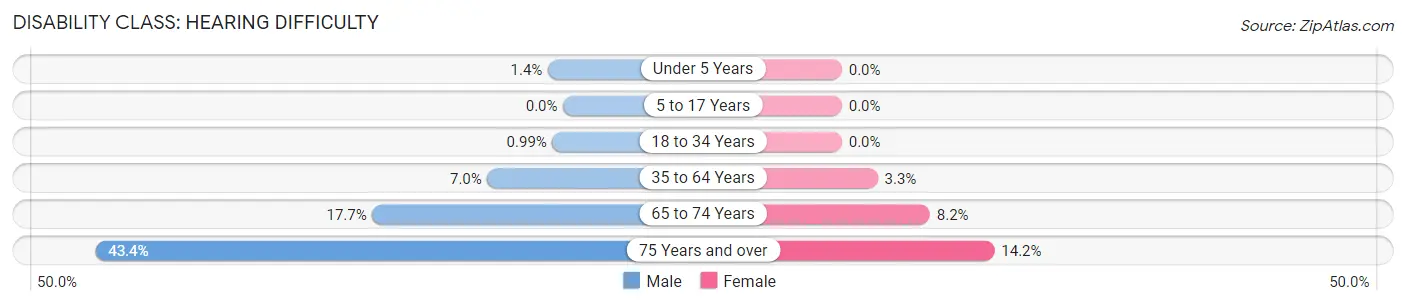
| Age Bracket | Male | Female |
| Under 5 Years | 3 (1.4%) | 0 (0.0%) |
| 5 to 17 Years | 0 (0.0%) | 0 (0.0%) |
| 18 to 34 Years | 7 (1.0%) | 0 (0.0%) |
| 35 to 64 Years | 105 (7.0%) | 49 (3.3%) |
| 65 to 74 Years | 85 (17.7%) | 42 (8.2%) |
| 75 Years and over | 139 (43.4%) | 67 (14.2%) |
Disability Class: Vision Difficulty
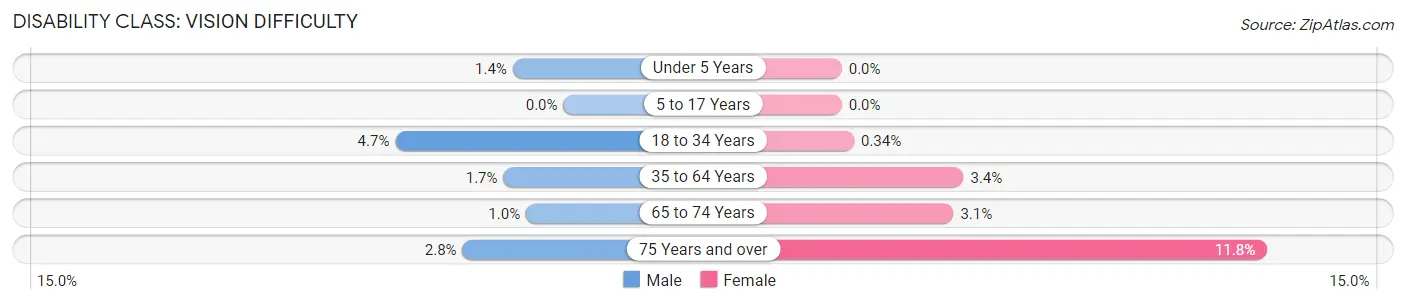
| Age Bracket | Male | Female |
| Under 5 Years | 3 (1.4%) | 0 (0.0%) |
| 5 to 17 Years | 0 (0.0%) | 0 (0.0%) |
| 18 to 34 Years | 33 (4.7%) | 2 (0.3%) |
| 35 to 64 Years | 25 (1.7%) | 50 (3.4%) |
| 65 to 74 Years | 5 (1.0%) | 16 (3.1%) |
| 75 Years and over | 9 (2.8%) | 56 (11.8%) |
Disability Class: Cognitive Difficulty
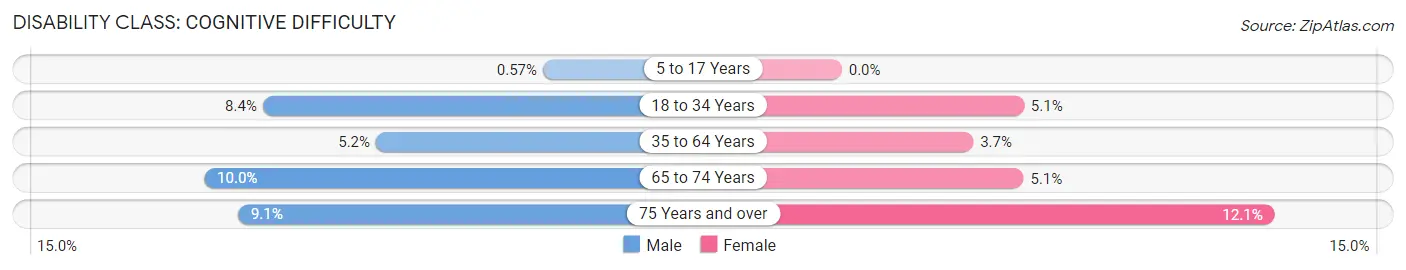
| Age Bracket | Male | Female |
| 5 to 17 Years | 4 (0.6%) | 0 (0.0%) |
| 18 to 34 Years | 59 (8.4%) | 30 (5.1%) |
| 35 to 64 Years | 78 (5.2%) | 54 (3.7%) |
| 65 to 74 Years | 48 (10.0%) | 26 (5.1%) |
| 75 Years and over | 29 (9.1%) | 57 (12.0%) |
Disability Class: Ambulatory Difficulty
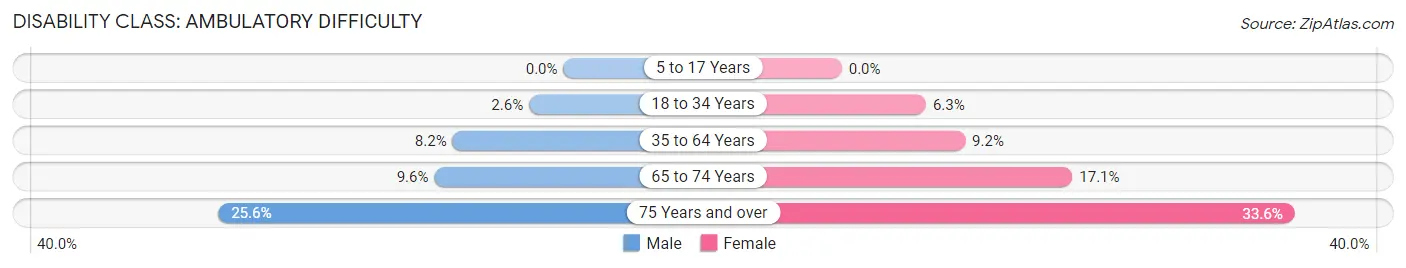
| Age Bracket | Male | Female |
| 5 to 17 Years | 0 (0.0%) | 0 (0.0%) |
| 18 to 34 Years | 18 (2.5%) | 37 (6.2%) |
| 35 to 64 Years | 123 (8.2%) | 135 (9.2%) |
| 65 to 74 Years | 46 (9.6%) | 88 (17.1%) |
| 75 Years and over | 82 (25.6%) | 159 (33.6%) |
Disability Class: Self-Care Difficulty
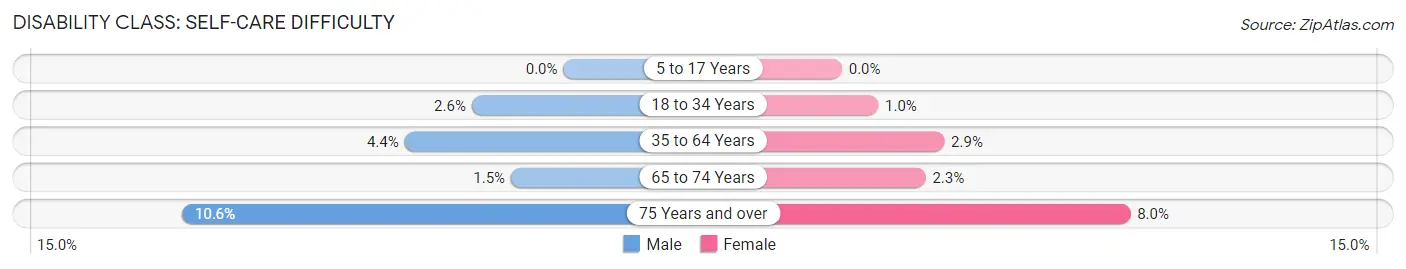
| Age Bracket | Male | Female |
| 5 to 17 Years | 0 (0.0%) | 0 (0.0%) |
| 18 to 34 Years | 18 (2.5%) | 6 (1.0%) |
| 35 to 64 Years | 66 (4.4%) | 42 (2.9%) |
| 65 to 74 Years | 7 (1.5%) | 12 (2.3%) |
| 75 Years and over | 34 (10.6%) | 38 (8.0%) |
Technology Access in Richardson County
Computing Device Access in Richardson County
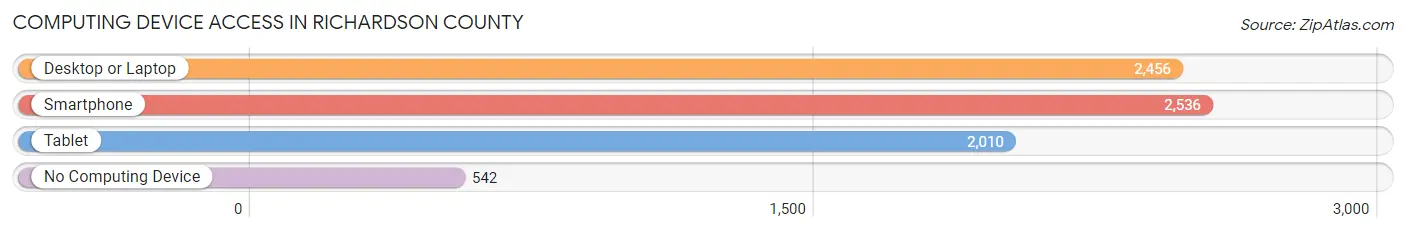
| Device Type | # Households | % Households |
| Desktop or Laptop | 2,456 | 68.5% |
| Smartphone | 2,536 | 70.7% |
| Tablet | 2,010 | 56.0% |
| No Computing Device | 542 | 15.1% |
| Total | 3,587 | 100.0% |
Internet Access in Richardson County
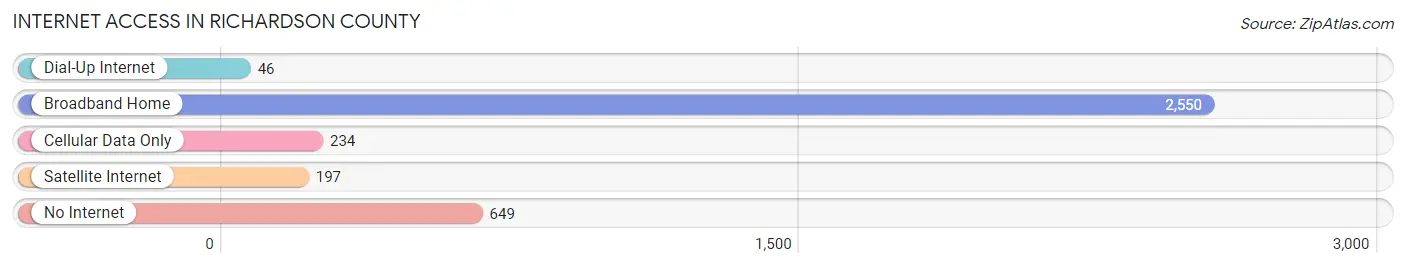
| Internet Type | # Households | % Households |
| Dial-Up Internet | 46 | 1.3% |
| Broadband Home | 2,550 | 71.1% |
| Cellular Data Only | 234 | 6.5% |
| Satellite Internet | 197 | 5.5% |
| No Internet | 649 | 18.1% |
| Total | 3,587 | 100.0% |
Richardson County Summary
Richardson County is located in the southeastern corner of Nebraska, and is bordered by the states of Iowa and Missouri. It is part of the Omaha-Council Bluffs Metropolitan Statistical Area. The county was established in 1854 and named after William A. Richardson, the first territorial governor of Nebraska. As of the 2010 census, the population was 8,363.
History
The area that is now Richardson County was originally inhabited by the Omaha and Pawnee tribes. The first white settlers arrived in the area in the 1840s, and the county was officially established in 1854. The county seat is located in Falls City, which was founded in 1857.
The county was an important stop on the Underground Railroad, with many of the county's residents helping to provide shelter and assistance to escaped slaves. During the Civil War, Richardson County was home to several Union Army regiments, and many of the county's residents served in the war.
In the late 19th century, the county experienced a period of rapid growth and development. The railroad arrived in the county in 1871, and the first telephone line was installed in 1883. The county also saw the establishment of several businesses, including a flour mill, a brickyard, and a furniture factory.
Geography
Richardson County is located in the southeastern corner of Nebraska, and is bordered by the states of Iowa and Missouri. It is part of the Omaha-Council Bluffs Metropolitan Statistical Area. The county covers an area of 576 square miles, and is home to several rivers and streams, including the Big Nemaha River, the Little Nemaha River, and the Verdigris River.
The county is mostly flat, with some rolling hills in the northern and western parts of the county. The highest point in the county is located in the northwest corner, at an elevation of 1,068 feet. The county is home to several state parks, including the Big Nemaha State Wildlife Management Area, the Little Nemaha State Wildlife Management Area, and the Verdigris State Wildlife Management Area.
Economy
The economy of Richardson County is largely based on agriculture. The county is home to several large farms, and the main crops grown in the area include corn, soybeans, wheat, and hay. The county is also home to several manufacturing companies, including a furniture factory, a brickyard, and a flour mill.
The county is also home to several tourist attractions, including the Richardson County Historical Museum, the Richardson County Courthouse, and the Richardson County Fairgrounds. The county is also home to several wineries, and is a popular destination for wine tasting.
Demographics
As of the 2010 census, the population of Richardson County was 8,363. The population is spread out across the county, with the largest population centers being Falls City, Humboldt, and Rulo. The racial makeup of the county is 95.3% White, 0.7% African American, 0.4% Native American, 0.3% Asian, 0.1% Pacific Islander, and 2.2% from other races.
The median household income in the county is $41,945, and the median family income is $50,945. The per capita income in the county is $20,845. The unemployment rate in the county is 4.2%. The poverty rate in the county is 11.3%.
Common Questions
What is Per Capita Income in Richardson County?
Per Capita income in Richardson County is $32,336.
What is the Median Family Income in Richardson County?
Median Family Income in Richardson County is $69,819.
What is the Median Household income in Richardson County?
Median Household Income in Richardson County is $50,321.
What is Income or Wage Gap in Richardson County?
Income or Wage Gap in Richardson County is 43.4%.
Women in Richardson County earn 56.6 cents for every dollar earned by a man.
What is Family Income Deficit in Richardson County?
Family Income Deficit in Richardson County is $9,057.
Families that are below poverty line in Richardson County earn $9,057 less on average than the poverty threshold level.
What is Inequality or Gini Index in Richardson County?
Inequality or Gini Index in Richardson County is 0.44.
What is the Total Population of Richardson County?
Total Population of Richardson County is 7,850.
What is the Total Male Population of Richardson County?
Total Male Population of Richardson County is 3,981.
What is the Total Female Population of Richardson County?
Total Female Population of Richardson County is 3,869.
What is the Ratio of Males per 100 Females in Richardson County?
There are 102.89 Males per 100 Females in Richardson County.
What is the Ratio of Females per 100 Males in Richardson County?
There are 97.19 Females per 100 Males in Richardson County.
What is the Median Population Age in Richardson County?
Median Population Age in Richardson County is 47.1 Years.
What is the Average Family Size in Richardson County
Average Family Size in Richardson County is 2.8 People.
What is the Average Household Size in Richardson County
Average Household Size in Richardson County is 2.1 People.
How Large is the Labor Force in Richardson County?
There are 3,958 People in the Labor Forcein in Richardson County.
What is the Percentage of People in the Labor Force in Richardson County?
61.8% of People are in the Labor Force in Richardson County.
What is the Unemployment Rate in Richardson County?
Unemployment Rate in Richardson County is 4.7%.