Red Willow County, NE Map & Demographics
Red Willow County Map
Red Willow County Overview
$34,401
PER CAPITA INCOME
$82,741
AVG FAMILY INCOME
$58,344
AVG HOUSEHOLD INCOME
35.9%
WAGE / INCOME GAP [ % ]
64.1¢/ $1
WAGE / INCOME GAP [ $ ]
0.47
INEQUALITY / GINI INDEX
10,690
TOTAL POPULATION
5,224
MALE POPULATION
5,466
FEMALE POPULATION
95.57
MALES / 100 FEMALES
104.63
FEMALES / 100 MALES
41.5
MEDIAN AGE
3.3
AVG FAMILY SIZE
2.4
AVG HOUSEHOLD SIZE
5,501
LABOR FORCE [ PEOPLE ]
62.8%
PERCENT IN LABOR FORCE
2.3%
UNEMPLOYMENT RATE
Red Willow County Area Codes
Income in Red Willow County
Income Overview in Red Willow County
Per Capita Income in Red Willow County is $34,401, while median incomes of families and households are $82,741 and $58,344 respectively.
| Characteristic | Number | Measure |
| Per Capita Income | 10,690 | $34,401 |
| Median Family Income | 2,495 | $82,741 |
| Mean Family Income | 2,495 | $93,932 |
| Median Household Income | 4,315 | $58,344 |
| Mean Household Income | 4,315 | $79,828 |
| Income Deficit | 2,495 | $0 |
| Wage / Income Gap (%) | 10,690 | 35.90% |
| Wage / Income Gap ($) | 10,690 | 64.10¢ per $1 |
| Gini / Inequality Index | 10,690 | 0.47 |
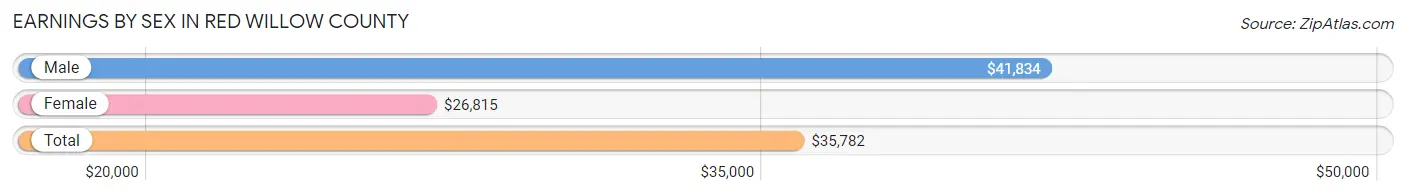
Earnings by Sex in Red Willow County
Average Earnings in Red Willow County are $35,782, $41,834 for men and $26,815 for women, a difference of 35.9%.
| Sex | Number | Average Earnings |
| Male | 3,201 (52.5%) | $41,834 |
| Female | 2,893 (47.5%) | $26,815 |
| Total | 6,094 (100.0%) | $35,782 |
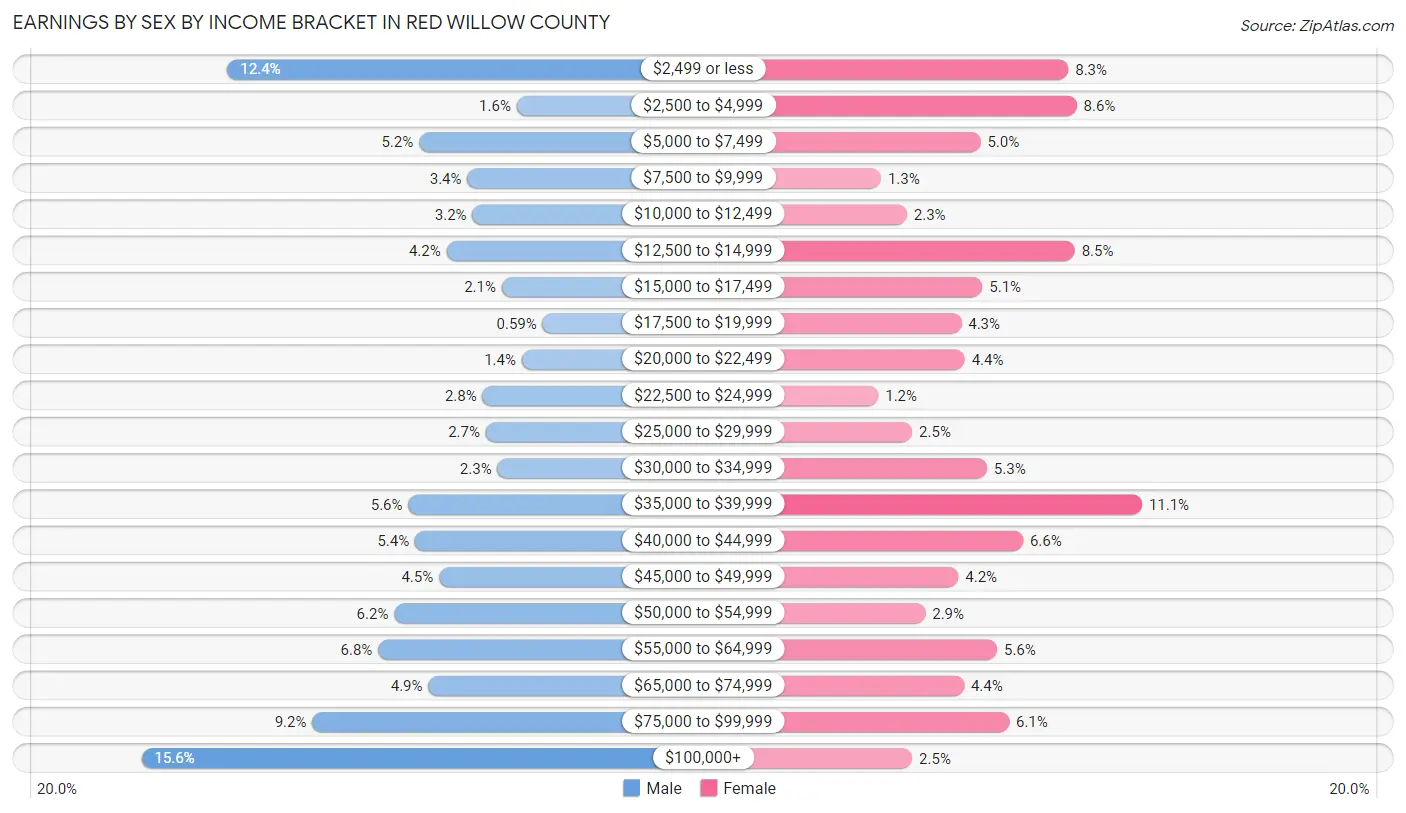
Earnings by Sex by Income Bracket in Red Willow County
The most common earnings brackets in Red Willow County are $100,000+ for men (500 | 15.6%) and $35,000 to $39,999 for women (320 | 11.1%).
| Income | Male | Female |
| $2,499 or less | 397 (12.4%) | 240 (8.3%) |
| $2,500 to $4,999 | 50 (1.6%) | 249 (8.6%) |
| $5,000 to $7,499 | 167 (5.2%) | 145 (5.0%) |
| $7,500 to $9,999 | 109 (3.4%) | 37 (1.3%) |
| $10,000 to $12,499 | 103 (3.2%) | 65 (2.2%) |
| $12,500 to $14,999 | 134 (4.2%) | 247 (8.5%) |
| $15,000 to $17,499 | 68 (2.1%) | 147 (5.1%) |
| $17,500 to $19,999 | 19 (0.6%) | 124 (4.3%) |
| $20,000 to $22,499 | 44 (1.4%) | 128 (4.4%) |
| $22,500 to $24,999 | 91 (2.8%) | 34 (1.2%) |
| $25,000 to $29,999 | 87 (2.7%) | 71 (2.5%) |
| $30,000 to $34,999 | 73 (2.3%) | 152 (5.2%) |
| $35,000 to $39,999 | 180 (5.6%) | 320 (11.1%) |
| $40,000 to $44,999 | 172 (5.4%) | 191 (6.6%) |
| $45,000 to $49,999 | 143 (4.5%) | 121 (4.2%) |
| $50,000 to $54,999 | 197 (6.1%) | 85 (2.9%) |
| $55,000 to $64,999 | 216 (6.8%) | 163 (5.6%) |
| $65,000 to $74,999 | 156 (4.9%) | 127 (4.4%) |
| $75,000 to $99,999 | 295 (9.2%) | 176 (6.1%) |
| $100,000+ | 500 (15.6%) | 71 (2.5%) |
| Total | 3,201 (100.0%) | 2,893 (100.0%) |
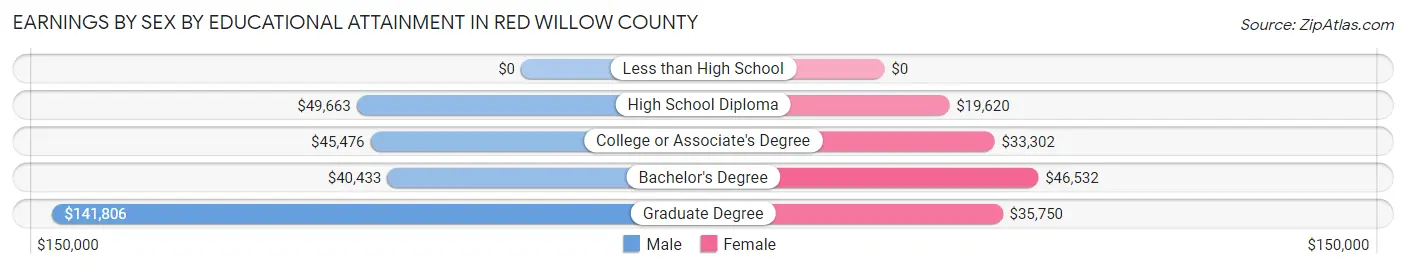
Earnings by Sex by Educational Attainment in Red Willow County
Average earnings in Red Willow County are $49,839 for men and $34,146 for women, a difference of 31.5%. Men with an educational attainment of graduate degree enjoy the highest average annual earnings of $141,806, while those with bachelor's degree education earn the least with $40,433. Women with an educational attainment of bachelor's degree earn the most with the average annual earnings of $46,532, while those with high school diploma education have the smallest earnings of $19,620.
| Educational Attainment | Male Income | Female Income |
| Less than High School | - | - |
| High School Diploma | $49,663 | $19,620 |
| College or Associate's Degree | $45,476 | $33,302 |
| Bachelor's Degree | $40,433 | $46,532 |
| Graduate Degree | $141,806 | $35,750 |
| Total | $49,839 | $34,146 |
Family Income in Red Willow County
Family Income Brackets in Red Willow County
According to the Red Willow County family income data, there are 477 families falling into the $100,000 to $149,999 income range, which is the most common income bracket and makes up 19.1% of all families. Conversely, the $15,000 to $24,999 income bracket is the least frequent group with only 15 families (0.6%) belonging to this category.
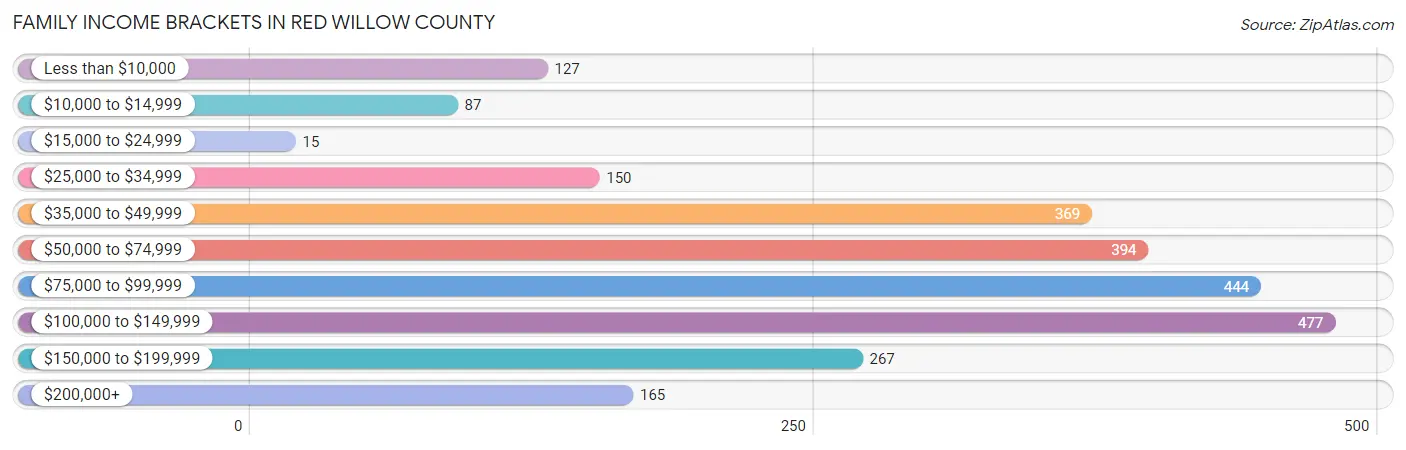
| Income Bracket | # Families | % Families |
| Less than $10,000 | 127 | 5.1% |
| $10,000 to $14,999 | 87 | 3.5% |
| $15,000 to $24,999 | 15 | 0.6% |
| $25,000 to $34,999 | 150 | 6.0% |
| $35,000 to $49,999 | 369 | 14.8% |
| $50,000 to $74,999 | 394 | 15.8% |
| $75,000 to $99,999 | 444 | 17.8% |
| $100,000 to $149,999 | 477 | 19.1% |
| $150,000 to $199,999 | 267 | 10.7% |
| $200,000+ | 165 | 6.6% |
Family Income by Famaliy Size in Red Willow County
6-person families (10 | 0.4%) account for the highest median family income in Red Willow County with $175,000 per family, while 2-person families (1,539 | 61.7%) have the highest median income of $36,016 per family member.
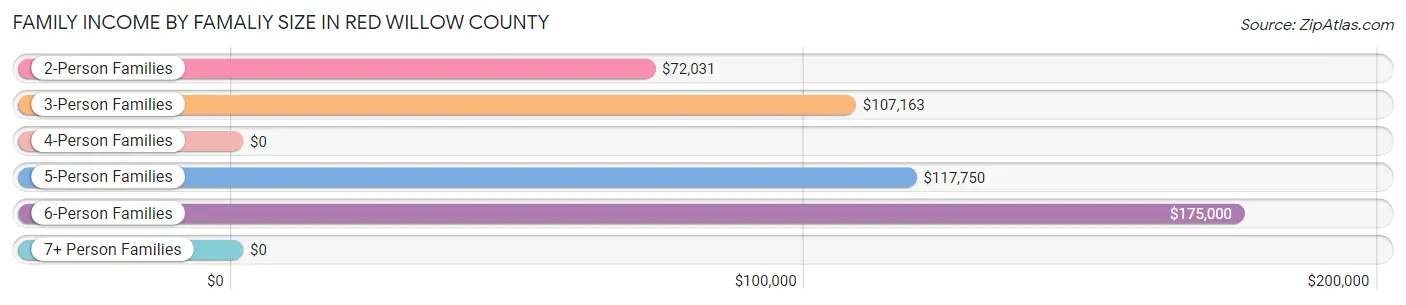
| Income Bracket | # Families | Median Income |
| 2-Person Families | 1,539 (61.7%) | $72,031 |
| 3-Person Families | 499 (20.0%) | $107,163 |
| 4-Person Families | 299 (12.0%) | $0 |
| 5-Person Families | 129 (5.2%) | $117,750 |
| 6-Person Families | 10 (0.4%) | $175,000 |
| 7+ Person Families | 19 (0.8%) | $0 |
| Total | 2,495 (100.0%) | $82,741 |
Family Income by Number of Earners in Red Willow County
The median family income in Red Willow County is $82,741, with families comprising 3+ earners (193) having the highest median family income of $119,583, while families with 1 earner (772) have the lowest median family income of $48,750, accounting for 7.7% and 30.9% of families, respectively.
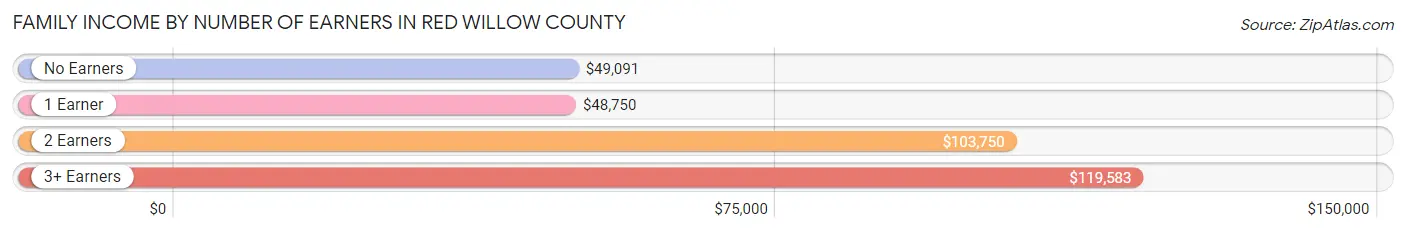
| Number of Earners | # Families | Median Income |
| No Earners | 366 (14.7%) | $49,091 |
| 1 Earner | 772 (30.9%) | $48,750 |
| 2 Earners | 1,164 (46.7%) | $103,750 |
| 3+ Earners | 193 (7.7%) | $119,583 |
| Total | 2,495 (100.0%) | $82,741 |
Household Income in Red Willow County
Household Income Brackets in Red Willow County
With 781 households falling in the category, the $50,000 to $74,999 income range is the most frequent in Red Willow County, accounting for 18.1% of all households. In contrast, only 203 households (4.7%) fall into the less than $10,000 income bracket, making it the least populous group.
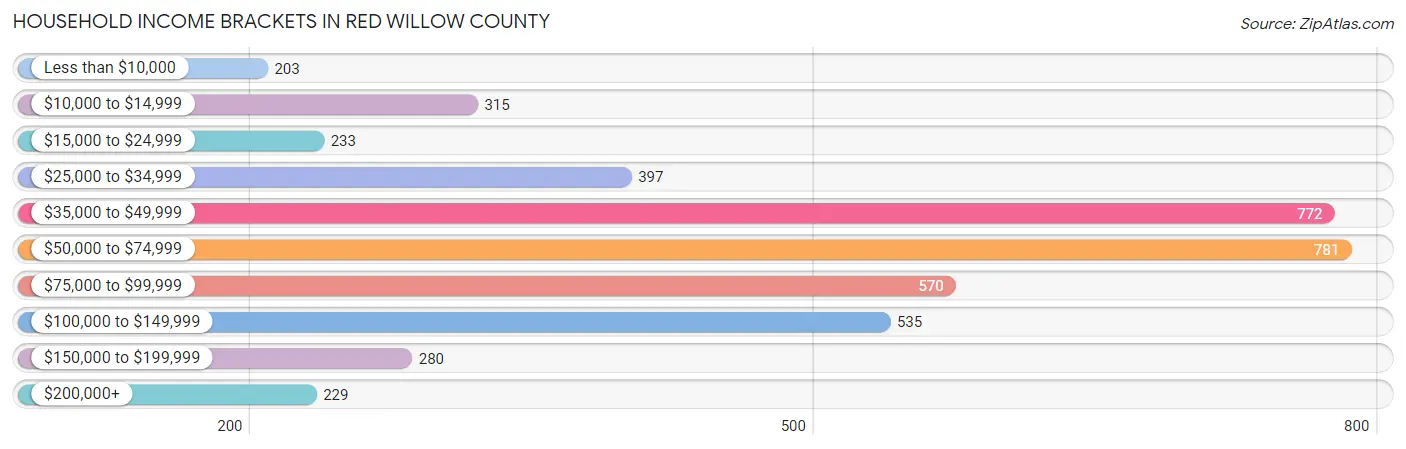
| Income Bracket | # Households | % Households |
| Less than $10,000 | 203 | 4.7% |
| $10,000 to $14,999 | 315 | 7.3% |
| $15,000 to $24,999 | 233 | 5.4% |
| $25,000 to $34,999 | 397 | 9.2% |
| $35,000 to $49,999 | 772 | 17.9% |
| $50,000 to $74,999 | 781 | 18.1% |
| $75,000 to $99,999 | 570 | 13.2% |
| $100,000 to $149,999 | 535 | 12.4% |
| $150,000 to $199,999 | 280 | 6.5% |
| $200,000+ | 229 | 5.3% |
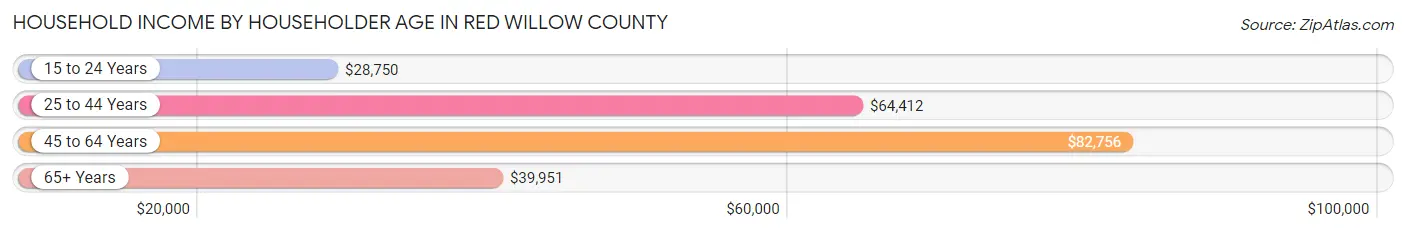
Household Income by Householder Age in Red Willow County
The median household income in Red Willow County is $58,344, with the highest median household income of $82,756 found in the 45 to 64 years age bracket for the primary householder. A total of 1,555 households (36.0%) fall into this category. Meanwhile, the 15 to 24 years age bracket for the primary householder has the lowest median household income of $28,750, with 193 households (4.5%) in this group.
| Income Bracket | # Households | Median Income |
| 15 to 24 Years | 193 (4.5%) | $28,750 |
| 25 to 44 Years | 1,064 (24.7%) | $64,412 |
| 45 to 64 Years | 1,555 (36.0%) | $82,756 |
| 65+ Years | 1,503 (34.8%) | $39,951 |
| Total | 4,315 (100.0%) | $58,344 |
Poverty in Red Willow County
Income Below Poverty by Sex and Age in Red Willow County
With 10.9% poverty level for males and 13.4% for females among the residents of Red Willow County, under 5 year old males and 18 to 24 year old females are the most vulnerable to poverty, with 97 males (31.9%) and 135 females (38.2%) in their respective age groups living below the poverty level.
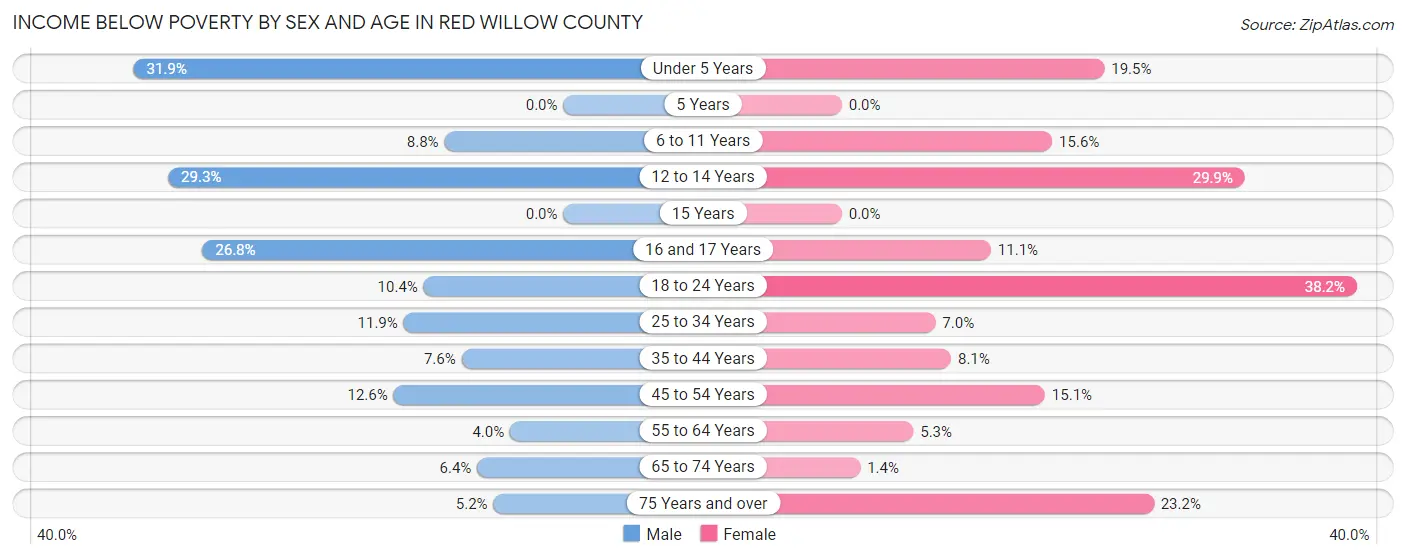
| Age Bracket | Male | Female |
| Under 5 Years | 97 (31.9%) | 61 (19.5%) |
| 5 Years | 0 (0.0%) | 0 (0.0%) |
| 6 to 11 Years | 31 (8.8%) | 57 (15.6%) |
| 12 to 14 Years | 49 (29.3%) | 76 (29.9%) |
| 15 Years | 0 (0.0%) | 0 (0.0%) |
| 16 and 17 Years | 52 (26.8%) | 27 (11.1%) |
| 18 to 24 Years | 50 (10.4%) | 135 (38.2%) |
| 25 to 34 Years | 60 (11.9%) | 37 (7.0%) |
| 35 to 44 Years | 45 (7.6%) | 49 (8.1%) |
| 45 to 54 Years | 72 (12.6%) | 89 (15.1%) |
| 55 to 64 Years | 30 (4.0%) | 45 (5.3%) |
| 65 to 74 Years | 39 (6.4%) | 8 (1.4%) |
| 75 Years and over | 21 (5.2%) | 132 (23.2%) |
| Total | 546 (10.9%) | 716 (13.4%) |
Income Above Poverty by Sex and Age in Red Willow County
According to the poverty statistics in Red Willow County, males aged 5 years and females aged 5 years are the age groups that are most secure financially, with 100.0% of males and 100.0% of females in these age groups living above the poverty line.
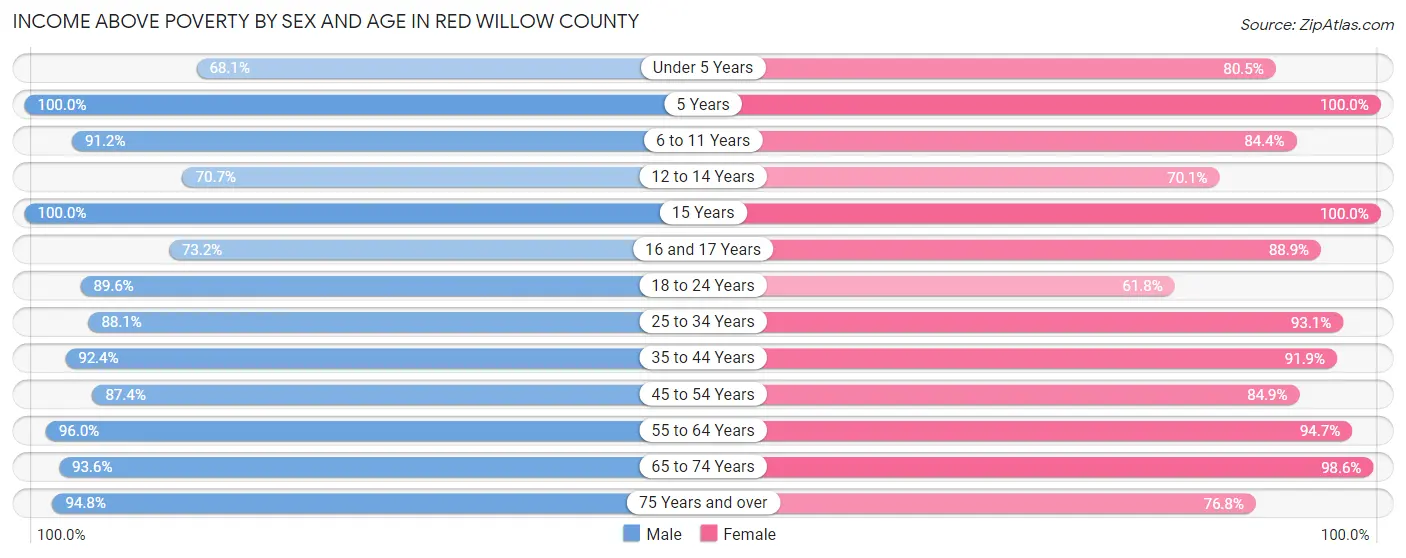
| Age Bracket | Male | Female |
| Under 5 Years | 207 (68.1%) | 252 (80.5%) |
| 5 Years | 76 (100.0%) | 56 (100.0%) |
| 6 to 11 Years | 320 (91.2%) | 308 (84.4%) |
| 12 to 14 Years | 118 (70.7%) | 178 (70.1%) |
| 15 Years | 10 (100.0%) | 34 (100.0%) |
| 16 and 17 Years | 142 (73.2%) | 217 (88.9%) |
| 18 to 24 Years | 432 (89.6%) | 218 (61.8%) |
| 25 to 34 Years | 446 (88.1%) | 495 (93.0%) |
| 35 to 44 Years | 550 (92.4%) | 555 (91.9%) |
| 45 to 54 Years | 499 (87.4%) | 501 (84.9%) |
| 55 to 64 Years | 728 (96.0%) | 803 (94.7%) |
| 65 to 74 Years | 570 (93.6%) | 576 (98.6%) |
| 75 Years and over | 384 (94.8%) | 438 (76.8%) |
| Total | 4,482 (89.1%) | 4,631 (86.6%) |
Income Below Poverty Among Married-Couple Families in Red Willow County
The poverty statistics for married-couple families in Red Willow County show that 5.7% or 122 of the total 2,130 families live below the poverty line. Families with 1 or 2 children have the highest poverty rate of 9.6%, comprising of 57 families. On the other hand, families with 5 or more children have the lowest poverty rate of 0.0%, which includes 0 families.
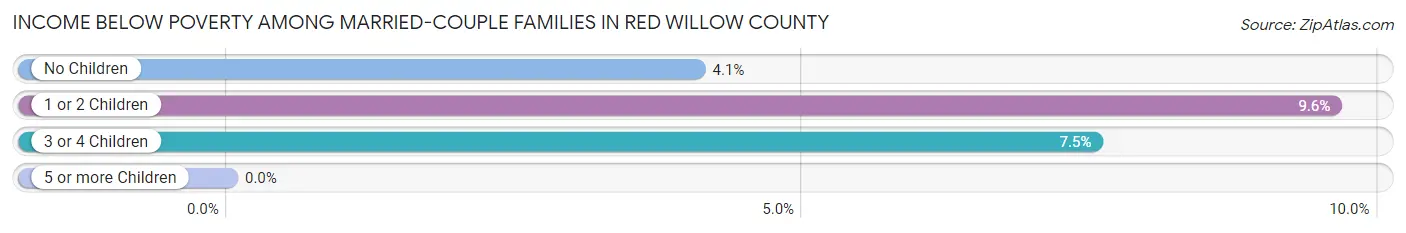
| Children | Above Poverty | Below Poverty |
| No Children | 1,367 (95.9%) | 58 (4.1%) |
| 1 or 2 Children | 536 (90.4%) | 57 (9.6%) |
| 3 or 4 Children | 86 (92.5%) | 7 (7.5%) |
| 5 or more Children | 19 (100.0%) | 0 (0.0%) |
| Total | 2,008 (94.3%) | 122 (5.7%) |
Income Below Poverty Among Single-Parent Households in Red Willow County
According to the poverty data in Red Willow County, 23.5% or 27 single-father households and 27.6% or 69 single-mother households are living below the poverty line. Among single-father households, those with 1 or 2 children have the highest poverty rate, with 27 households (36.5%) experiencing poverty. Likewise, among single-mother households, those with 3 or 4 children have the highest poverty rate, with 6 households (50.0%) falling below the poverty line.
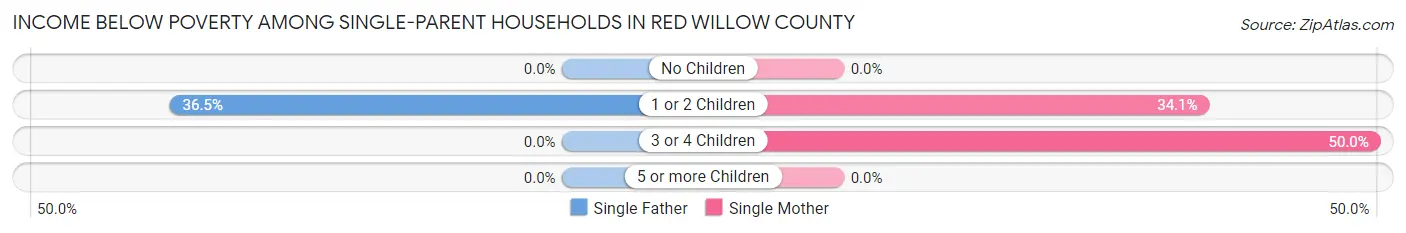
| Children | Single Father | Single Mother |
| No Children | 0 (0.0%) | 0 (0.0%) |
| 1 or 2 Children | 27 (36.5%) | 63 (34.1%) |
| 3 or 4 Children | 0 (0.0%) | 6 (50.0%) |
| 5 or more Children | 0 (0.0%) | 0 (0.0%) |
| Total | 27 (23.5%) | 69 (27.6%) |
Income Below Poverty Among Married-Couple vs Single-Parent Households in Red Willow County
The poverty data for Red Willow County shows that 122 of the married-couple family households (5.7%) and 96 of the single-parent households (26.3%) are living below the poverty level. Within the married-couple family households, those with 1 or 2 children have the highest poverty rate, with 57 households (9.6%) falling below the poverty line. Among the single-parent households, those with 3 or 4 children have the highest poverty rate, with 6 household (50.0%) living below poverty.
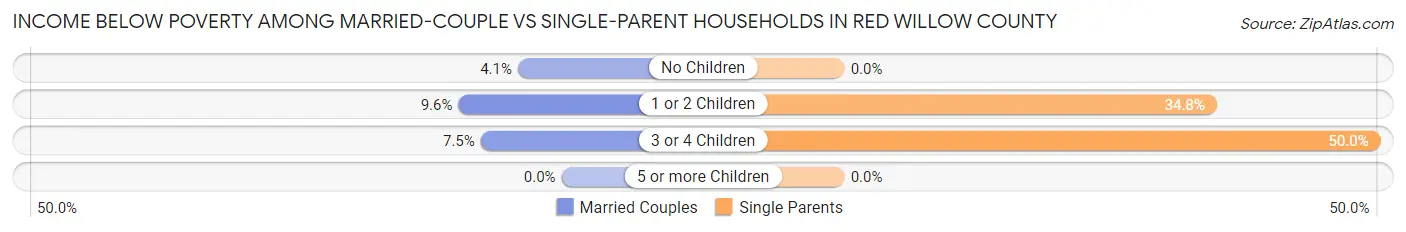
| Children | Married-Couple Families | Single-Parent Households |
| No Children | 58 (4.1%) | 0 (0.0%) |
| 1 or 2 Children | 57 (9.6%) | 90 (34.7%) |
| 3 or 4 Children | 7 (7.5%) | 6 (50.0%) |
| 5 or more Children | 0 (0.0%) | 0 (0.0%) |
| Total | 122 (5.7%) | 96 (26.3%) |
Race in Red Willow County
The most populous races in Red Willow County are White / Caucasian (9,717 | 90.9%), Hispanic or Latino (628 | 5.9%), and Two or more Races (395 | 3.7%).
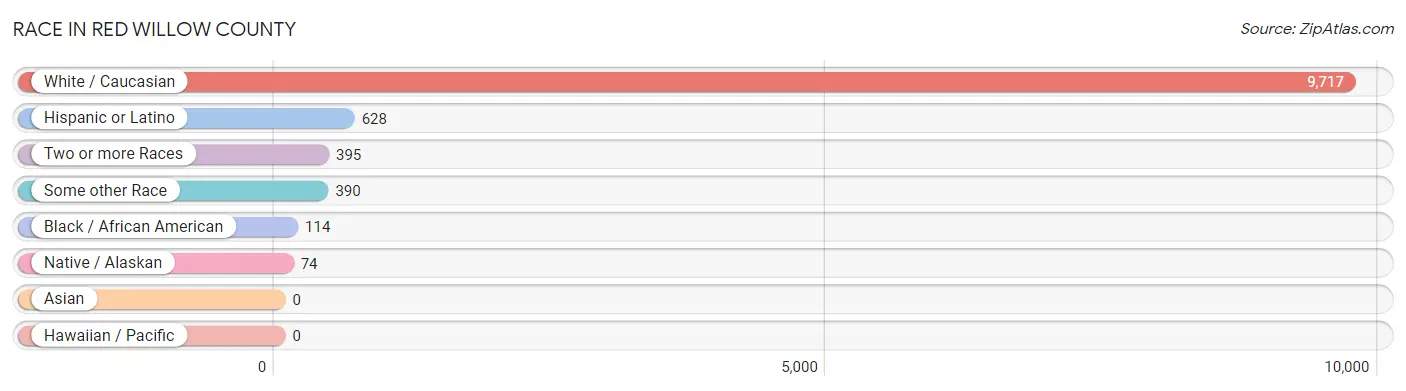
| Race | # Population | % Population |
| Asian | 0 | 0.0% |
| Black / African American | 114 | 1.1% |
| Hawaiian / Pacific | 0 | 0.0% |
| Hispanic or Latino | 628 | 5.9% |
| Native / Alaskan | 74 | 0.7% |
| White / Caucasian | 9,717 | 90.9% |
| Two or more Races | 395 | 3.7% |
| Some other Race | 390 | 3.6% |
| Total | 10,690 | 100.0% |
Ancestry in Red Willow County
The most populous ancestries reported in Red Willow County are German (4,312 | 40.3%), Irish (1,225 | 11.5%), English (1,161 | 10.9%), European (551 | 5.1%), and American (522 | 4.9%), together accounting for 72.7% of all Red Willow County residents.
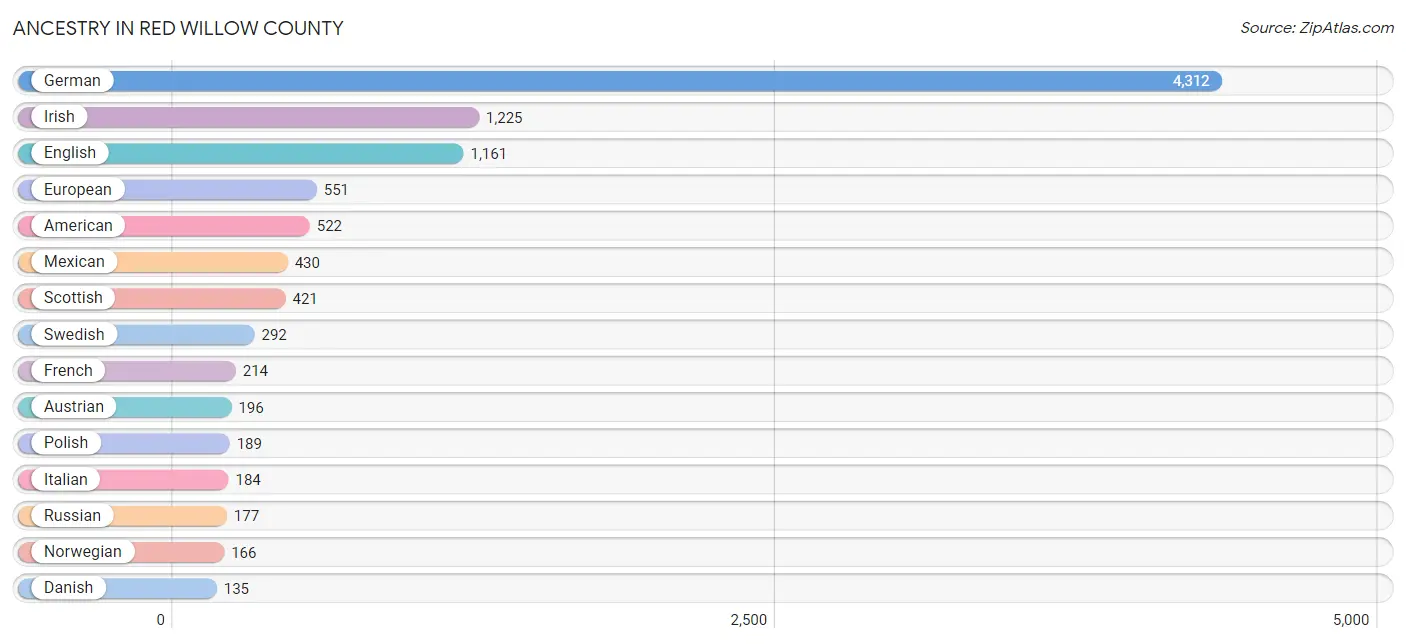
| Ancestry | # Population | % Population |
| African | 3 | 0.0% |
| Alaska Native | 5 | 0.1% |
| American | 522 | 4.9% |
| Apache | 80 | 0.7% |
| Austrian | 196 | 1.8% |
| British | 6 | 0.1% |
| Canadian | 7 | 0.1% |
| Celtic | 10 | 0.1% |
| Central American | 55 | 0.5% |
| Cherokee | 89 | 0.8% |
| Chippewa | 24 | 0.2% |
| Czech | 134 | 1.3% |
| Czechoslovakian | 20 | 0.2% |
| Danish | 135 | 1.3% |
| Dutch | 95 | 0.9% |
| Eastern European | 1 | 0.0% |
| English | 1,161 | 10.9% |
| European | 551 | 5.1% |
| French | 214 | 2.0% |
| French Canadian | 60 | 0.6% |
| German | 4,312 | 40.3% |
| German Russian | 9 | 0.1% |
| Greek | 4 | 0.0% |
| Guatemalan | 55 | 0.5% |
| Indian (Asian) | 40 | 0.4% |
| Irish | 1,225 | 11.5% |
| Italian | 184 | 1.7% |
| Jamaican | 44 | 0.4% |
| Lithuanian | 17 | 0.2% |
| Mexican | 430 | 4.0% |
| Navajo | 81 | 0.8% |
| Northern European | 2 | 0.0% |
| Norwegian | 166 | 1.5% |
| Pennsylvania German | 2 | 0.0% |
| Polish | 189 | 1.8% |
| Puerto Rican | 7 | 0.1% |
| Russian | 177 | 1.7% |
| Scandinavian | 15 | 0.1% |
| Scotch-Irish | 62 | 0.6% |
| Scottish | 421 | 3.9% |
| Sioux | 13 | 0.1% |
| Slavic | 12 | 0.1% |
| Spaniard | 107 | 1.0% |
| Subsaharan African | 3 | 0.0% |
| Swedish | 292 | 2.7% |
| Swiss | 85 | 0.8% |
| Welsh | 17 | 0.2% | View All 47 Rows |
Immigrants in Red Willow County
The most numerous immigrant groups reported in Red Willow County came from Latin America (72 | 0.7%), Caribbean (36 | 0.3%), Central America (36 | 0.3%), Mexico (36 | 0.3%), and Jamaica (27 | 0.3%), together accounting for 1.9% of all Red Willow County residents.
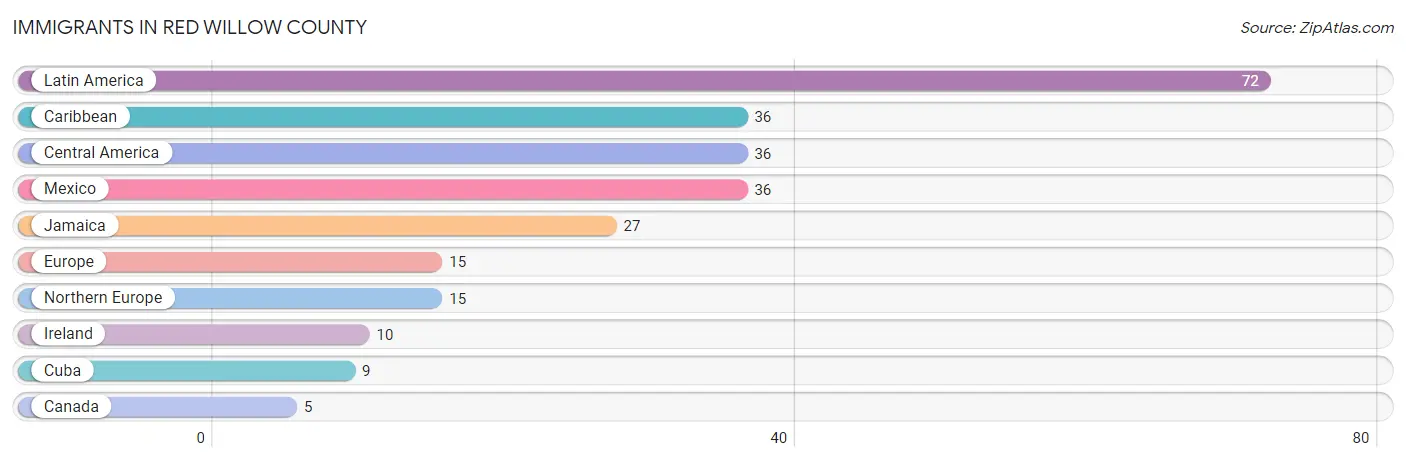
| Immigration Origin | # Population | % Population |
| Canada | 5 | 0.1% |
| Caribbean | 36 | 0.3% |
| Central America | 36 | 0.3% |
| Cuba | 9 | 0.1% |
| Europe | 15 | 0.1% |
| Ireland | 10 | 0.1% |
| Jamaica | 27 | 0.3% |
| Latin America | 72 | 0.7% |
| Mexico | 36 | 0.3% |
| Northern Europe | 15 | 0.1% | View All 10 Rows |
Sex and Age in Red Willow County
Sex and Age in Red Willow County
The most populous age groups in Red Willow County are 60 to 64 Years (481 | 9.2%) for men and 60 to 64 Years (458 | 8.4%) for women.
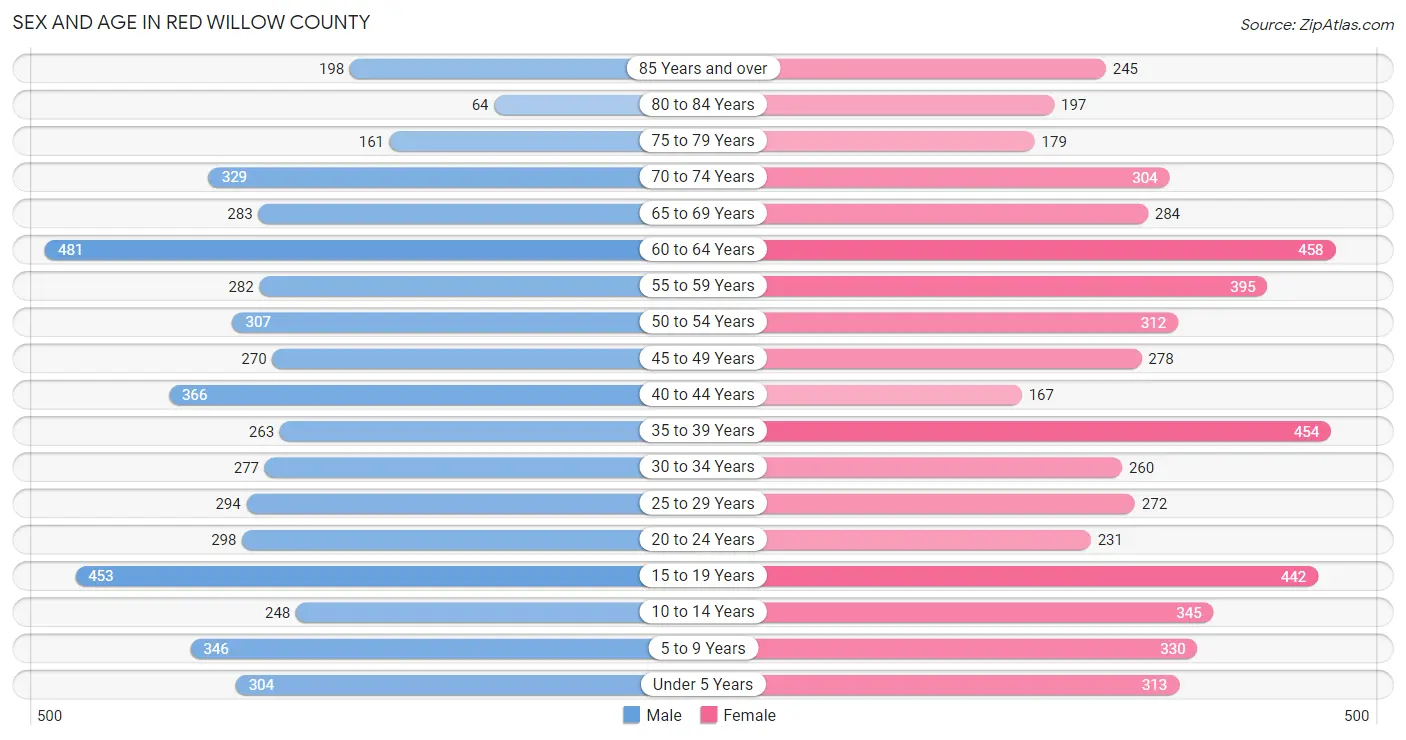
| Age Bracket | Male | Female |
| Under 5 Years | 304 (5.8%) | 313 (5.7%) |
| 5 to 9 Years | 346 (6.6%) | 330 (6.0%) |
| 10 to 14 Years | 248 (4.8%) | 345 (6.3%) |
| 15 to 19 Years | 453 (8.7%) | 442 (8.1%) |
| 20 to 24 Years | 298 (5.7%) | 231 (4.2%) |
| 25 to 29 Years | 294 (5.6%) | 272 (5.0%) |
| 30 to 34 Years | 277 (5.3%) | 260 (4.8%) |
| 35 to 39 Years | 263 (5.0%) | 454 (8.3%) |
| 40 to 44 Years | 366 (7.0%) | 167 (3.1%) |
| 45 to 49 Years | 270 (5.2%) | 278 (5.1%) |
| 50 to 54 Years | 307 (5.9%) | 312 (5.7%) |
| 55 to 59 Years | 282 (5.4%) | 395 (7.2%) |
| 60 to 64 Years | 481 (9.2%) | 458 (8.4%) |
| 65 to 69 Years | 283 (5.4%) | 284 (5.2%) |
| 70 to 74 Years | 329 (6.3%) | 304 (5.6%) |
| 75 to 79 Years | 161 (3.1%) | 179 (3.3%) |
| 80 to 84 Years | 64 (1.2%) | 197 (3.6%) |
| 85 Years and over | 198 (3.8%) | 245 (4.5%) |
| Total | 5,224 (100.0%) | 5,466 (100.0%) |
Families and Households in Red Willow County
Median Family Size in Red Willow County
The median family size in Red Willow County is 3.28 persons per family, with single male/father families (115 | 4.6%) accounting for the largest median family size of 4.12 persons per family. On the other hand, married-couple families (2,130 | 85.4%) represent the smallest median family size with 3.19 persons per family.
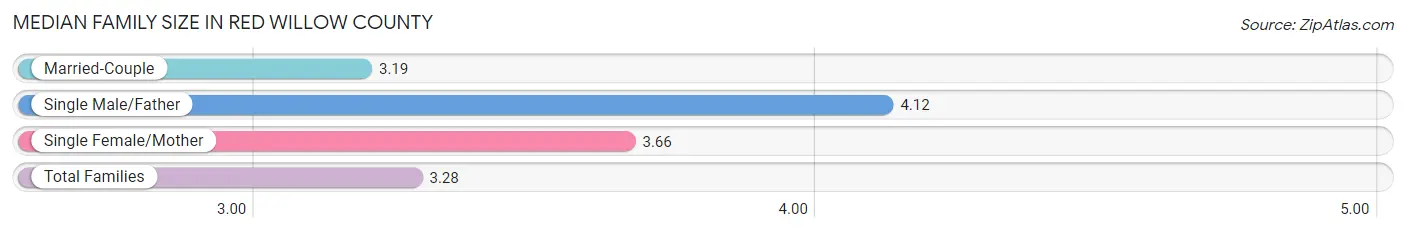
| Family Type | # Families | Family Size |
| Married-Couple | 2,130 (85.4%) | 3.19 |
| Single Male/Father | 115 (4.6%) | 4.12 |
| Single Female/Mother | 250 (10.0%) | 3.66 |
| Total Families | 2,495 (100.0%) | 3.28 |
Median Household Size in Red Willow County
The median household size in Red Willow County is 2.40 persons per household, with single male/father households (115 | 2.7%) accounting for the largest median household size of 4.12 persons per household. non-family households (1,820 | 42.2%) represent the smallest median household size with 1.15 persons per household.
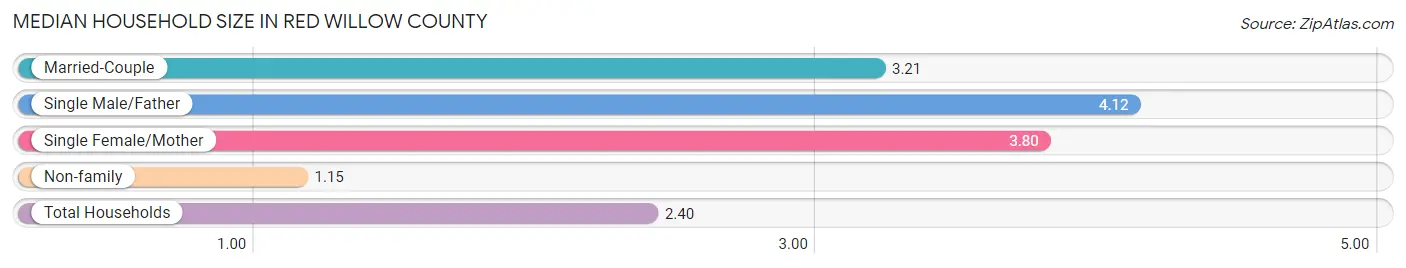
| Household Type | # Households | Household Size |
| Married-Couple | 2,130 (49.4%) | 3.21 |
| Single Male/Father | 115 (2.7%) | 4.12 |
| Single Female/Mother | 250 (5.8%) | 3.80 |
| Non-family | 1,820 (42.2%) | 1.15 |
| Total Households | 4,315 (100.0%) | 2.40 |
Household Size by Marriage Status in Red Willow County
Out of a total of 4,315 households in Red Willow County, 2,495 (57.8%) are family households, while 1,820 (42.2%) are nonfamily households. The most numerous type of family households are 2-person households, comprising 1,526, and the most common type of nonfamily households are 1-person households, comprising 1,619.
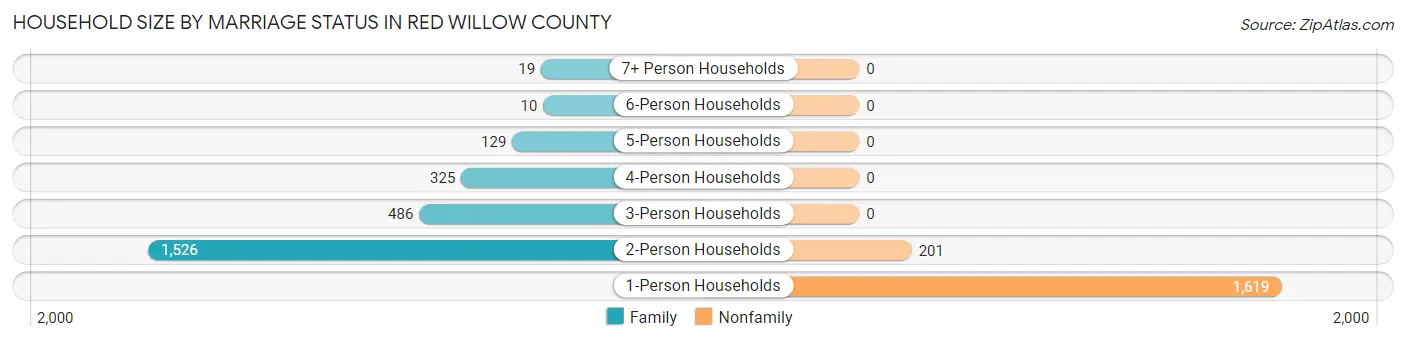
| Household Size | Family Households | Nonfamily Households |
| 1-Person Households | - | 1,619 (37.5%) |
| 2-Person Households | 1,526 (35.4%) | 201 (4.7%) |
| 3-Person Households | 486 (11.3%) | 0 (0.0%) |
| 4-Person Households | 325 (7.5%) | 0 (0.0%) |
| 5-Person Households | 129 (3.0%) | 0 (0.0%) |
| 6-Person Households | 10 (0.2%) | 0 (0.0%) |
| 7+ Person Households | 19 (0.4%) | 0 (0.0%) |
| Total | 2,495 (57.8%) | 1,820 (42.2%) |
Female Fertility in Red Willow County
Fertility by Age in Red Willow County
Average fertility rate in Red Willow County is 87.0 births per 1,000 women. Women in the age bracket of 20 to 34 years have the highest fertility rate with 153.0 births per 1,000 women. Women in the age bracket of 20 to 34 years acount for 61.9% of all women with births.
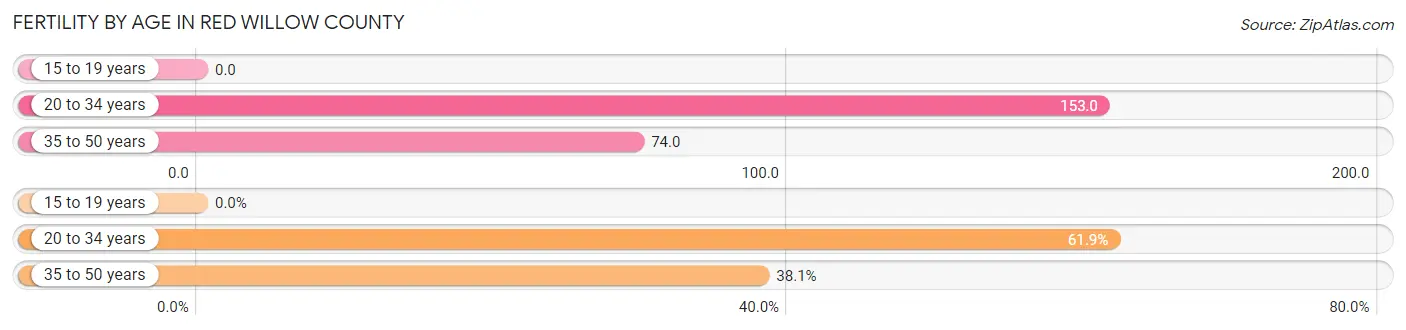
| Age Bracket | Women with Births | Births / 1,000 Women |
| 15 to 19 years | 0 (0.0%) | 0.0 |
| 20 to 34 years | 117 (61.9%) | 153.0 |
| 35 to 50 years | 72 (38.1%) | 74.0 |
| Total | 189 (100.0%) | 87.0 |
Fertility by Age by Marriage Status in Red Willow County
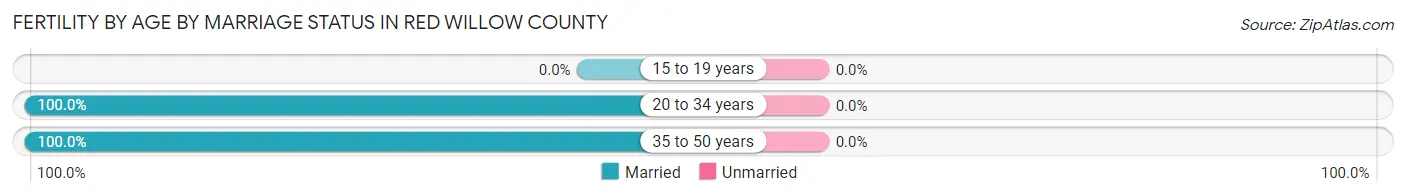
| Age Bracket | Married | Unmarried |
| 15 to 19 years | 0 (0.0%) | 0 (0.0%) |
| 20 to 34 years | 117 (100.0%) | 0 (0.0%) |
| 35 to 50 years | 72 (100.0%) | 0 (0.0%) |
| Total | 189 (100.0%) | 0 (0.0%) |
Fertility by Education in Red Willow County
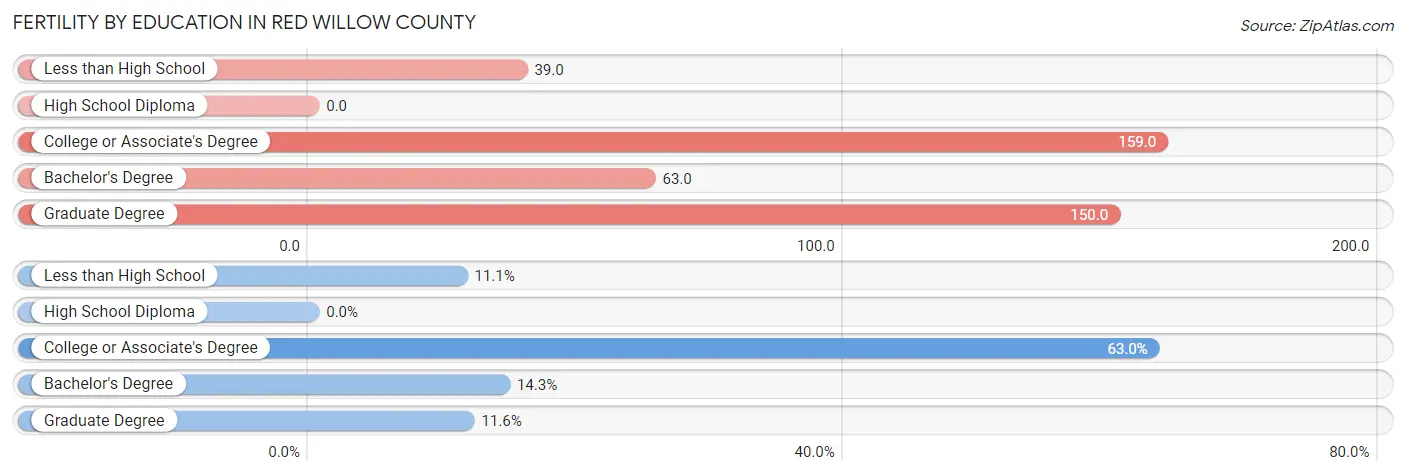
| Educational Attainment | Women with Births | Births / 1,000 Women |
| Less than High School | 21 (11.1%) | 39.0 |
| High School Diploma | 0 (0.0%) | 0.0 |
| College or Associate's Degree | 119 (63.0%) | 159.0 |
| Bachelor's Degree | 27 (14.3%) | 63.0 |
| Graduate Degree | 22 (11.6%) | 150.0 |
| Total | 189 (100.0%) | 87.0 |
Fertility by Education by Marriage Status in Red Willow County
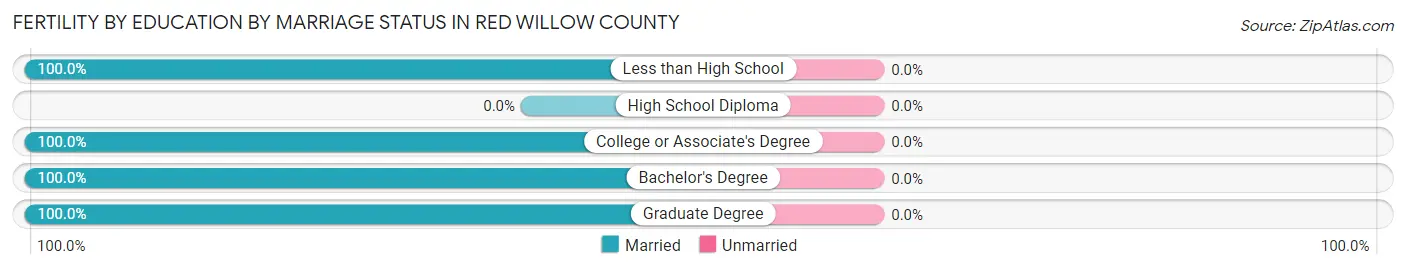
| Educational Attainment | Married | Unmarried |
| Less than High School | 21 (100.0%) | 0 (0.0%) |
| High School Diploma | 0 (0.0%) | 0 (0.0%) |
| College or Associate's Degree | 119 (100.0%) | 0 (0.0%) |
| Bachelor's Degree | 27 (100.0%) | 0 (0.0%) |
| Graduate Degree | 22 (100.0%) | 0 (0.0%) |
| Total | 189 (100.0%) | 0 (0.0%) |
Employment Characteristics in Red Willow County
Employment by Class of Employer in Red Willow County
Among the 5,284 employed individuals in Red Willow County, private company employees (3,359 | 63.6%), self-employed (not incorporated) (498 | 9.4%), and self-employed (incorporated) (372 | 7.0%) make up the most common classes of employment.
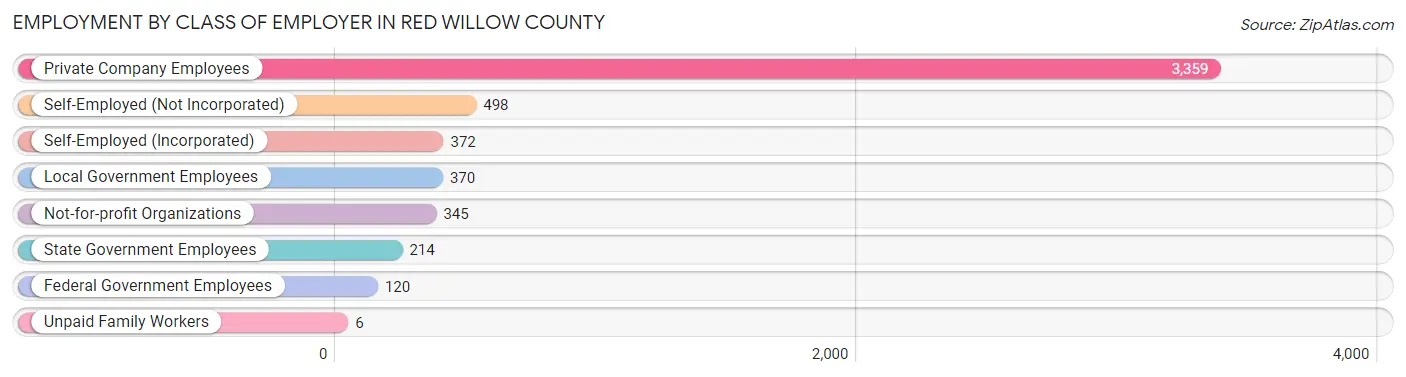
| Employer Class | # Employees | % Employees |
| Private Company Employees | 3,359 | 63.6% |
| Self-Employed (Incorporated) | 372 | 7.0% |
| Self-Employed (Not Incorporated) | 498 | 9.4% |
| Not-for-profit Organizations | 345 | 6.5% |
| Local Government Employees | 370 | 7.0% |
| State Government Employees | 214 | 4.1% |
| Federal Government Employees | 120 | 2.3% |
| Unpaid Family Workers | 6 | 0.1% |
| Total | 5,284 | 100.0% |
Employment Status by Age in Red Willow County
According to the labor force statistics for Red Willow County, out of the total population over 16 years of age (8,760), 62.8% or 5,501 individuals are in the labor force, with 2.3% or 127 of them unemployed. The age group with the highest labor force participation rate is 55 to 59 years, with 92.3% or 625 individuals in the labor force. Within the labor force, the 20 to 24 years age range has the highest percentage of unemployed individuals, with 19.7% or 63 of them being unemployed.
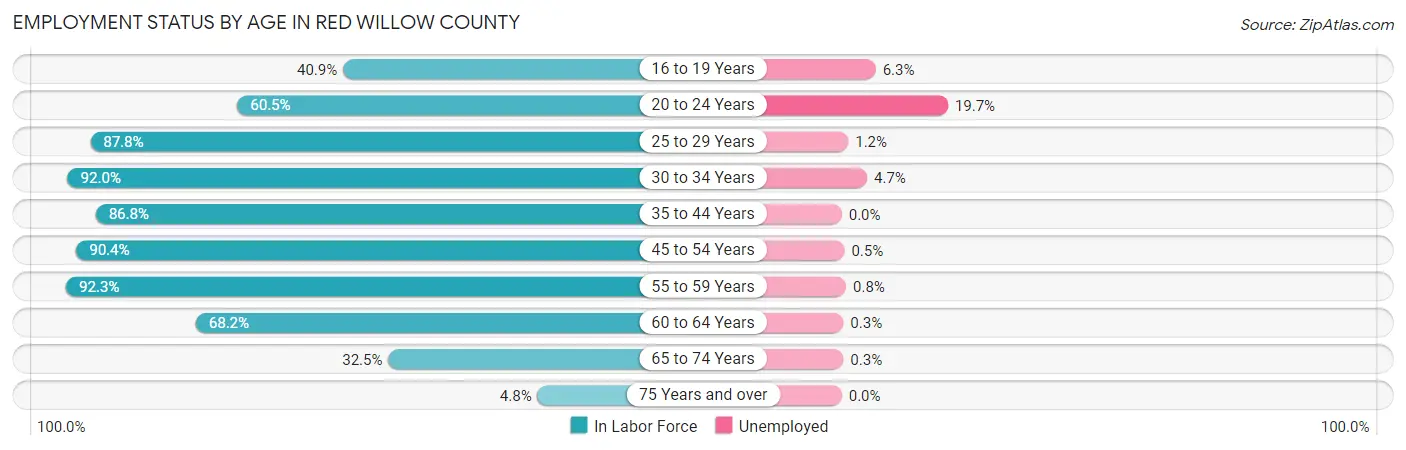
| Age Bracket | In Labor Force | Unemployed |
| 16 to 19 Years | 348 (40.9%) | 22 (6.3%) |
| 20 to 24 Years | 320 (60.5%) | 63 (19.7%) |
| 25 to 29 Years | 497 (87.8%) | 6 (1.2%) |
| 30 to 34 Years | 494 (92.0%) | 23 (4.7%) |
| 35 to 44 Years | 1,085 (86.8%) | 0 (0.0%) |
| 45 to 54 Years | 1,055 (90.4%) | 5 (0.5%) |
| 55 to 59 Years | 625 (92.3%) | 5 (0.8%) |
| 60 to 64 Years | 640 (68.2%) | 2 (0.3%) |
| 65 to 74 Years | 390 (32.5%) | 1 (0.3%) |
| 75 Years and over | 50 (4.8%) | 0 (0.0%) |
| Total | 5,501 (62.8%) | 127 (2.3%) |
Employment Status by Educational Attainment in Red Willow County
According to labor force statistics for Red Willow County, 85.6% of individuals (4,396) out of the total population between 25 and 64 years of age (5,136) are in the labor force, with 0.9% or 40 of them being unemployed. The group with the highest labor force participation rate are those with the educational attainment of bachelor's degree or higher, with 92.7% or 1,188 individuals in the labor force. Within the labor force, individuals with bachelor's degree or higher education have the highest percentage of unemployment, with 2.2% or 26 of them being unemployed.
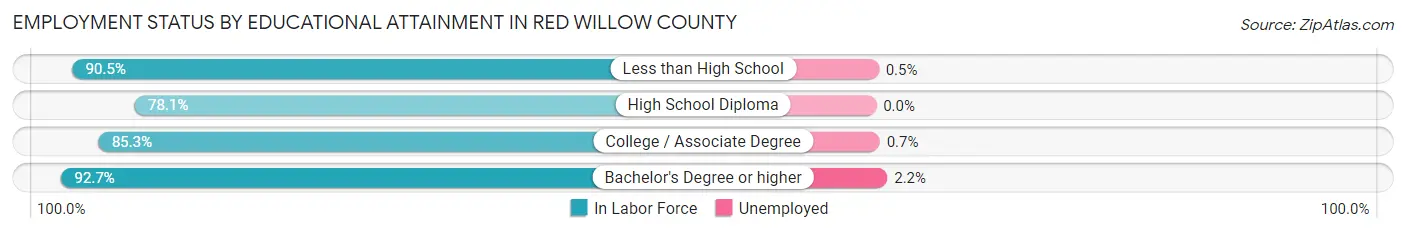
| Educational Attainment | In Labor Force | Unemployed |
| Less than High School | 364 (90.5%) | 2 (0.5%) |
| High School Diploma | 1,093 (78.1%) | 0 (0.0%) |
| College / Associate Degree | 1,751 (85.3%) | 14 (0.7%) |
| Bachelor's Degree or higher | 1,188 (92.7%) | 28 (2.2%) |
| Total | 4,396 (85.6%) | 46 (0.9%) |
Employment Occupations by Sex in Red Willow County
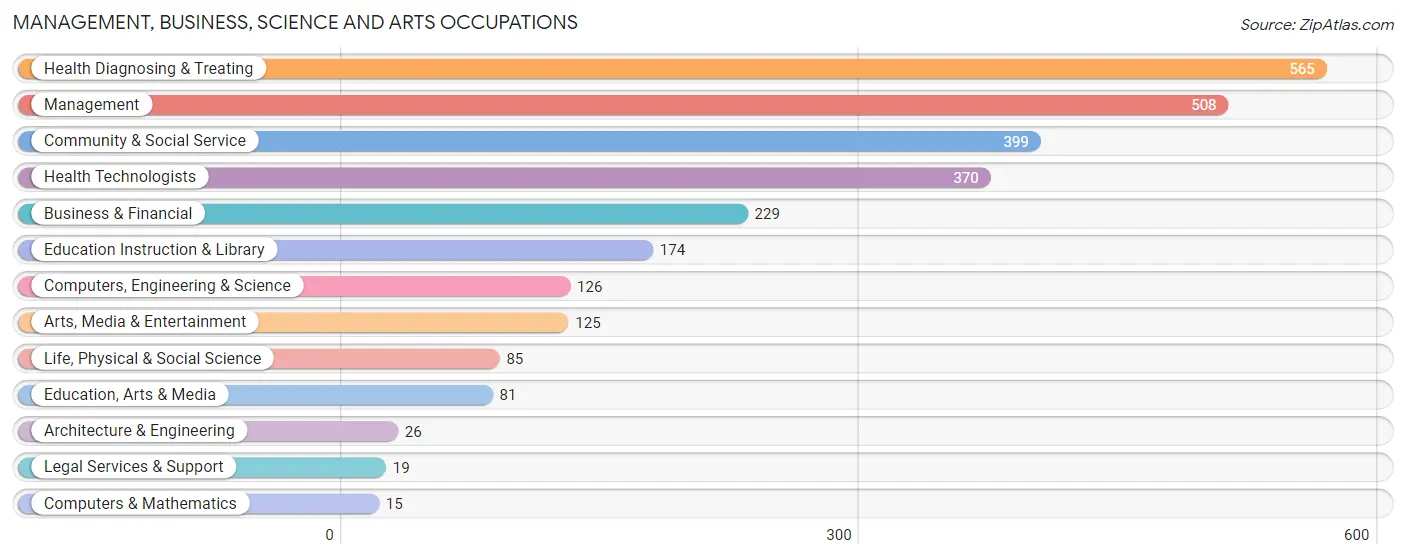
Management, Business, Science and Arts Occupations
The most common Management, Business, Science and Arts occupations in Red Willow County are Health Diagnosing & Treating (565 | 10.5%), Management (508 | 9.5%), Community & Social Service (399 | 7.4%), Health Technologists (370 | 6.9%), and Business & Financial (229 | 4.3%).
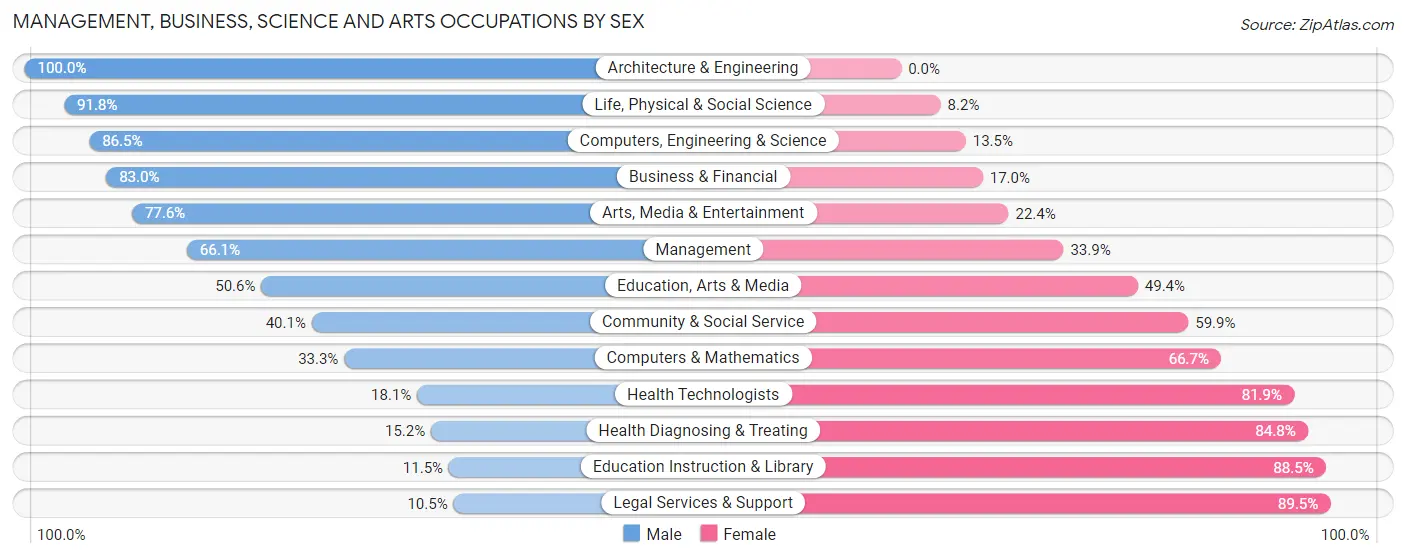
Management, Business, Science and Arts Occupations by Sex
Within the Management, Business, Science and Arts occupations in Red Willow County, the most male-oriented occupations are Architecture & Engineering (100.0%), Life, Physical & Social Science (91.8%), and Computers, Engineering & Science (86.5%), while the most female-oriented occupations are Legal Services & Support (89.5%), Education Instruction & Library (88.5%), and Health Diagnosing & Treating (84.8%).
| Occupation | Male | Female |
| Management | 336 (66.1%) | 172 (33.9%) |
| Business & Financial | 190 (83.0%) | 39 (17.0%) |
| Computers, Engineering & Science | 109 (86.5%) | 17 (13.5%) |
| Computers & Mathematics | 5 (33.3%) | 10 (66.7%) |
| Architecture & Engineering | 26 (100.0%) | 0 (0.0%) |
| Life, Physical & Social Science | 78 (91.8%) | 7 (8.2%) |
| Community & Social Service | 160 (40.1%) | 239 (59.9%) |
| Education, Arts & Media | 41 (50.6%) | 40 (49.4%) |
| Legal Services & Support | 2 (10.5%) | 17 (89.5%) |
| Education Instruction & Library | 20 (11.5%) | 154 (88.5%) |
| Arts, Media & Entertainment | 97 (77.6%) | 28 (22.4%) |
| Health Diagnosing & Treating | 86 (15.2%) | 479 (84.8%) |
| Health Technologists | 67 (18.1%) | 303 (81.9%) |
| Total (Category) | 881 (48.2%) | 946 (51.8%) |
| Total (Overall) | 2,828 (52.6%) | 2,549 (47.4%) |
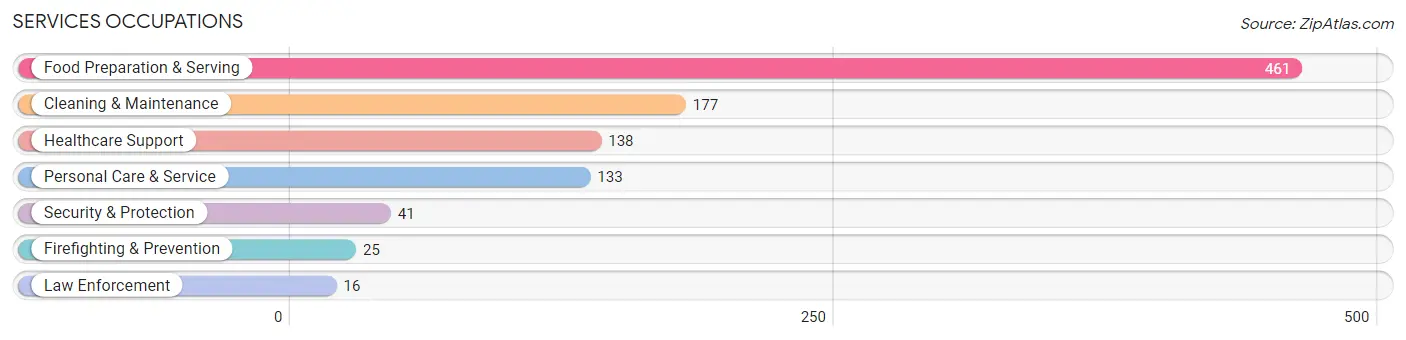
Services Occupations
The most common Services occupations in Red Willow County are Food Preparation & Serving (461 | 8.6%), Cleaning & Maintenance (177 | 3.3%), Healthcare Support (138 | 2.6%), Personal Care & Service (133 | 2.5%), and Security & Protection (41 | 0.8%).
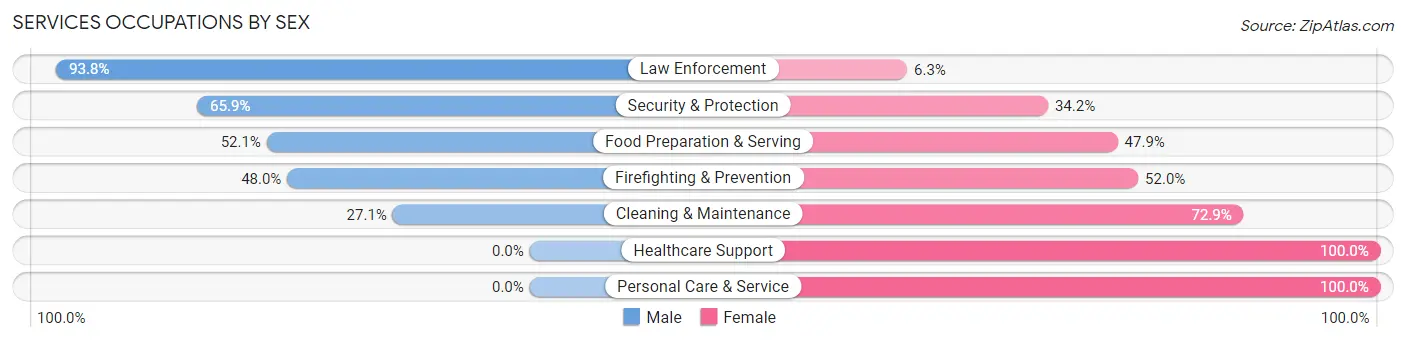
Services Occupations by Sex
Within the Services occupations in Red Willow County, the most male-oriented occupations are Law Enforcement (93.8%), Security & Protection (65.8%), and Food Preparation & Serving (52.1%), while the most female-oriented occupations are Healthcare Support (100.0%), Personal Care & Service (100.0%), and Cleaning & Maintenance (72.9%).
| Occupation | Male | Female |
| Healthcare Support | 0 (0.0%) | 138 (100.0%) |
| Security & Protection | 27 (65.8%) | 14 (34.2%) |
| Firefighting & Prevention | 12 (48.0%) | 13 (52.0%) |
| Law Enforcement | 15 (93.8%) | 1 (6.2%) |
| Food Preparation & Serving | 240 (52.1%) | 221 (47.9%) |
| Cleaning & Maintenance | 48 (27.1%) | 129 (72.9%) |
| Personal Care & Service | 0 (0.0%) | 133 (100.0%) |
| Total (Category) | 315 (33.2%) | 635 (66.8%) |
| Total (Overall) | 2,828 (52.6%) | 2,549 (47.4%) |
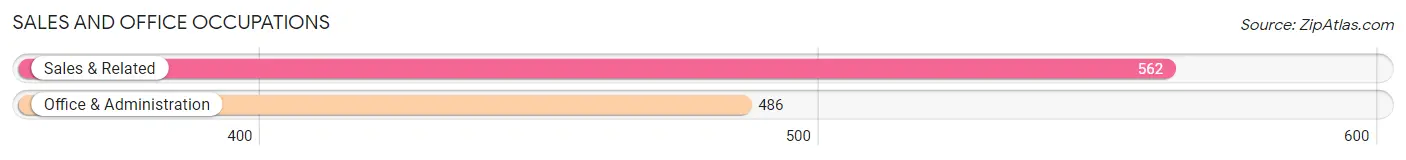
Sales and Office Occupations
The most common Sales and Office occupations in Red Willow County are Sales & Related (562 | 10.4%), and Office & Administration (486 | 9.0%).
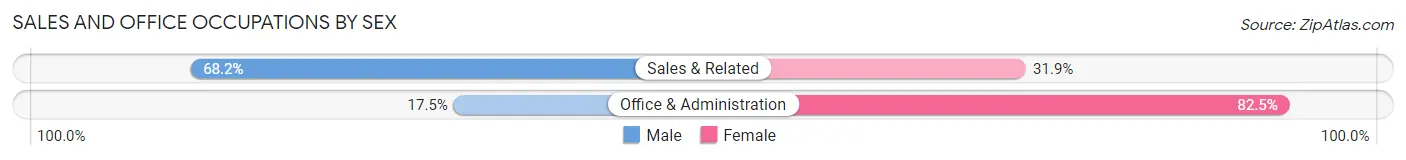
Sales and Office Occupations by Sex
| Occupation | Male | Female |
| Sales & Related | 383 (68.1%) | 179 (31.9%) |
| Office & Administration | 85 (17.5%) | 401 (82.5%) |
| Total (Category) | 468 (44.7%) | 580 (55.3%) |
| Total (Overall) | 2,828 (52.6%) | 2,549 (47.4%) |
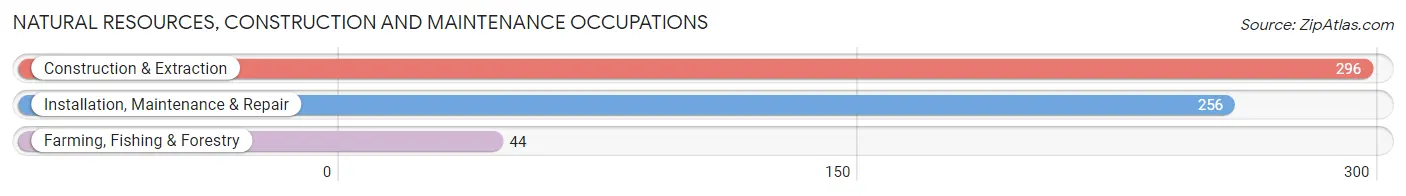
Natural Resources, Construction and Maintenance Occupations
The most common Natural Resources, Construction and Maintenance occupations in Red Willow County are Construction & Extraction (296 | 5.5%), Installation, Maintenance & Repair (256 | 4.8%), and Farming, Fishing & Forestry (44 | 0.8%).
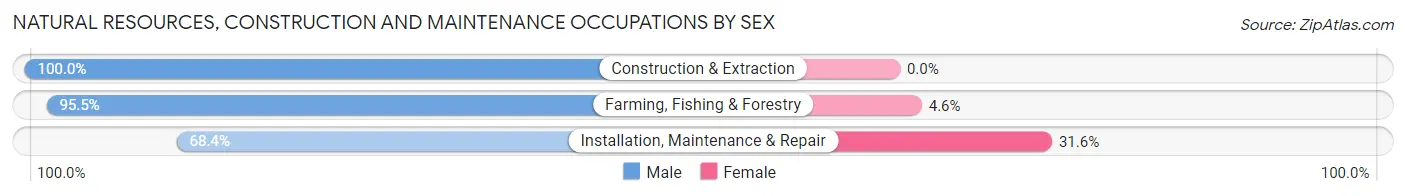
Natural Resources, Construction and Maintenance Occupations by Sex
| Occupation | Male | Female |
| Farming, Fishing & Forestry | 42 (95.5%) | 2 (4.5%) |
| Construction & Extraction | 296 (100.0%) | 0 (0.0%) |
| Installation, Maintenance & Repair | 175 (68.4%) | 81 (31.6%) |
| Total (Category) | 513 (86.1%) | 83 (13.9%) |
| Total (Overall) | 2,828 (52.6%) | 2,549 (47.4%) |
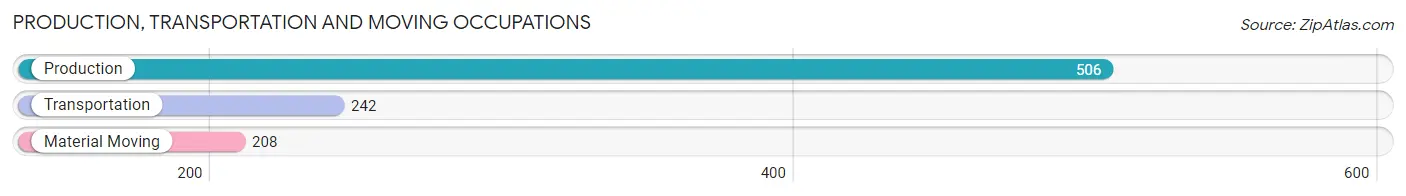
Production, Transportation and Moving Occupations
The most common Production, Transportation and Moving occupations in Red Willow County are Production (506 | 9.4%), Transportation (242 | 4.5%), and Material Moving (208 | 3.9%).
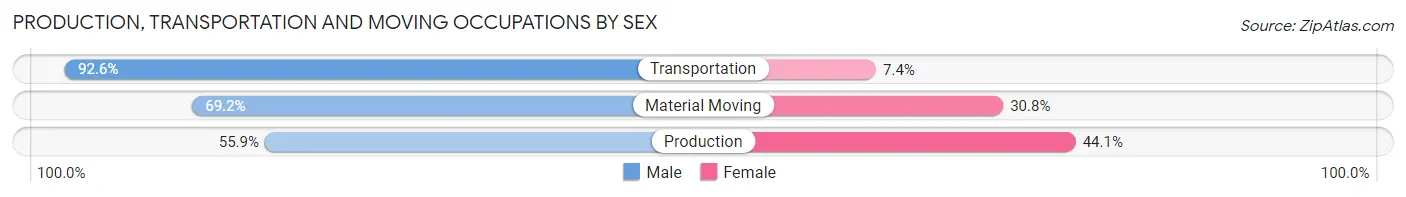
Production, Transportation and Moving Occupations by Sex
| Occupation | Male | Female |
| Production | 283 (55.9%) | 223 (44.1%) |
| Transportation | 224 (92.6%) | 18 (7.4%) |
| Material Moving | 144 (69.2%) | 64 (30.8%) |
| Total (Category) | 651 (68.1%) | 305 (31.9%) |
| Total (Overall) | 2,828 (52.6%) | 2,549 (47.4%) |
Employment Industries by Sex in Red Willow County
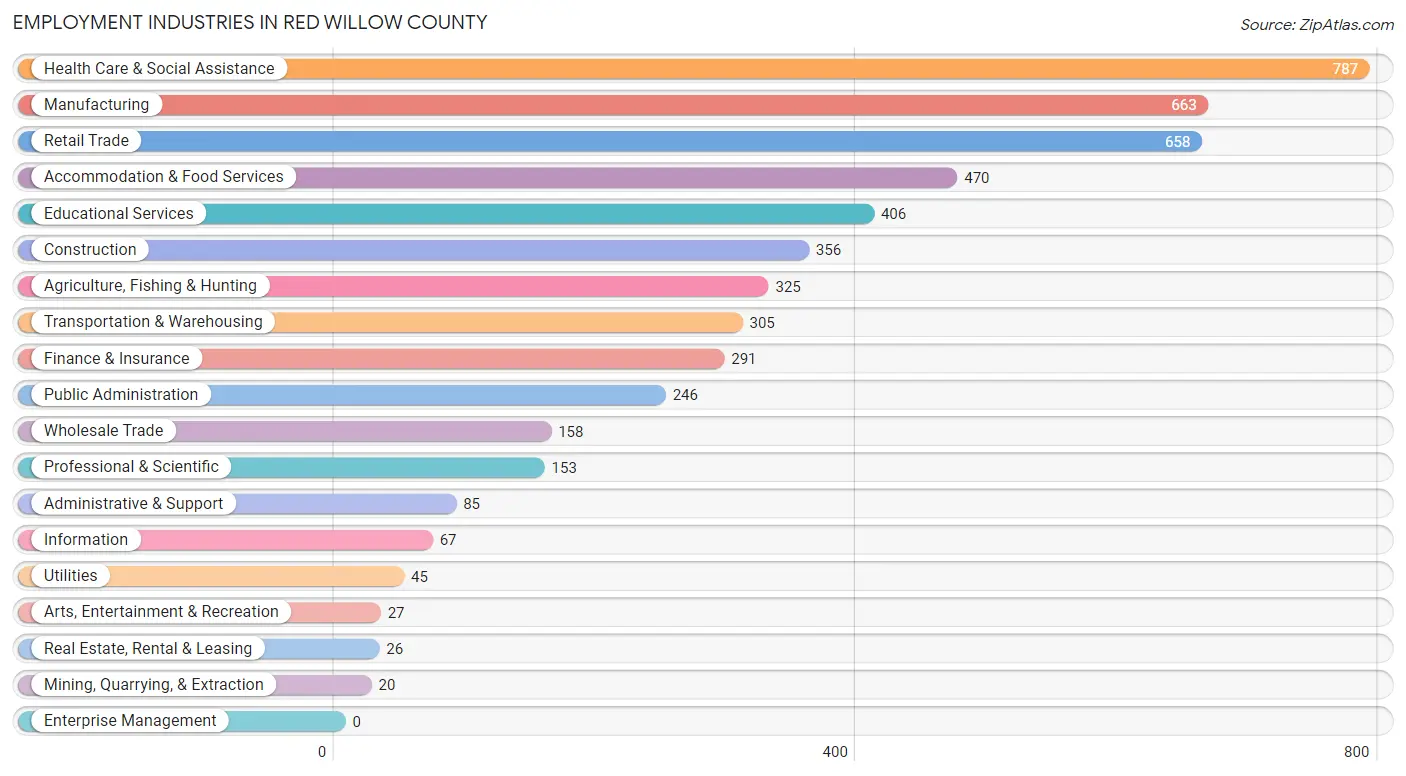
Employment Industries in Red Willow County
The major employment industries in Red Willow County include Health Care & Social Assistance (787 | 14.6%), Manufacturing (663 | 12.3%), Retail Trade (658 | 12.2%), Accommodation & Food Services (470 | 8.7%), and Educational Services (406 | 7.5%).
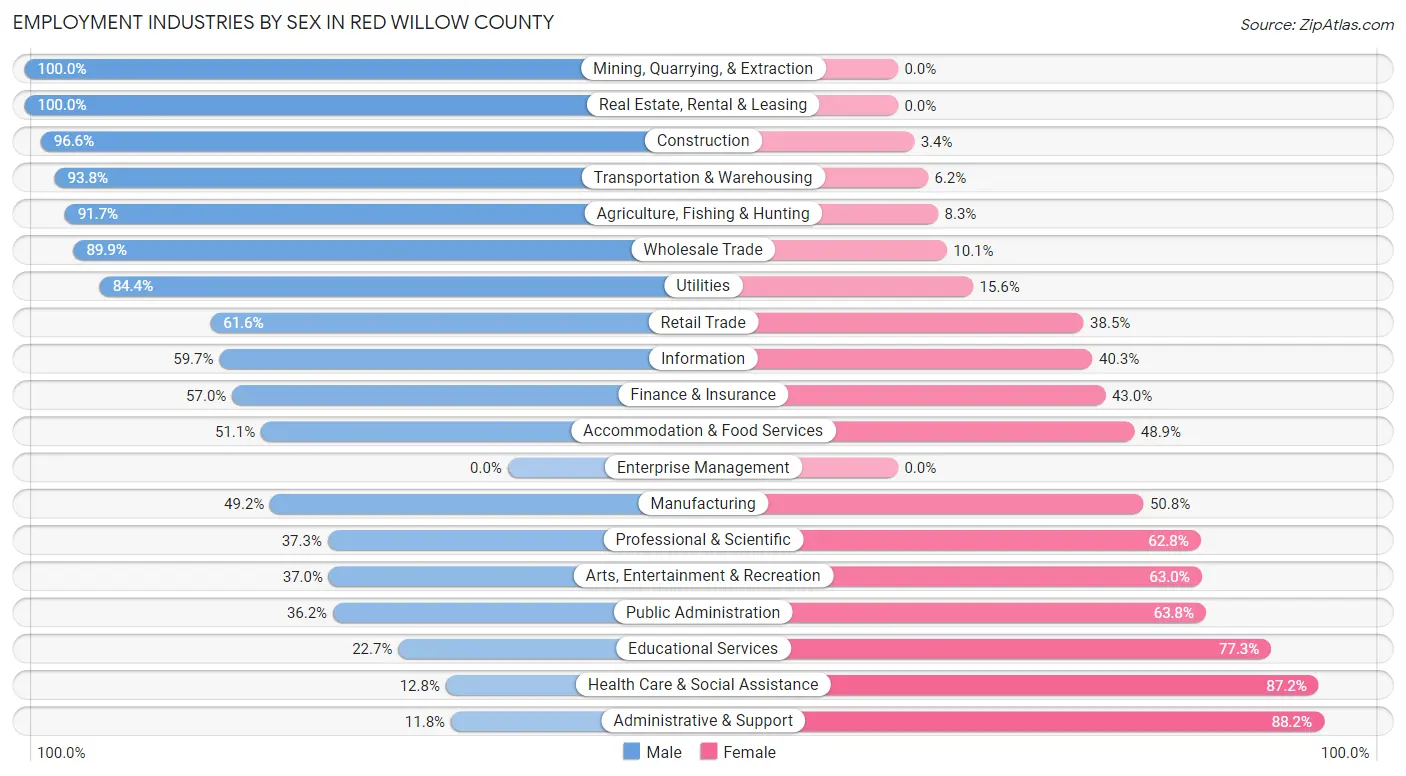
Employment Industries by Sex in Red Willow County
The Red Willow County industries that see more men than women are Mining, Quarrying, & Extraction (100.0%), Real Estate, Rental & Leasing (100.0%), and Construction (96.6%), whereas the industries that tend to have a higher number of women are Administrative & Support (88.2%), Health Care & Social Assistance (87.2%), and Educational Services (77.3%).
| Industry | Male | Female |
| Agriculture, Fishing & Hunting | 298 (91.7%) | 27 (8.3%) |
| Mining, Quarrying, & Extraction | 20 (100.0%) | 0 (0.0%) |
| Construction | 344 (96.6%) | 12 (3.4%) |
| Manufacturing | 326 (49.2%) | 337 (50.8%) |
| Wholesale Trade | 142 (89.9%) | 16 (10.1%) |
| Retail Trade | 405 (61.6%) | 253 (38.5%) |
| Transportation & Warehousing | 286 (93.8%) | 19 (6.2%) |
| Utilities | 38 (84.4%) | 7 (15.6%) |
| Information | 40 (59.7%) | 27 (40.3%) |
| Finance & Insurance | 166 (57.0%) | 125 (43.0%) |
| Real Estate, Rental & Leasing | 26 (100.0%) | 0 (0.0%) |
| Professional & Scientific | 57 (37.2%) | 96 (62.7%) |
| Enterprise Management | 0 (0.0%) | 0 (0.0%) |
| Administrative & Support | 10 (11.8%) | 75 (88.2%) |
| Educational Services | 92 (22.7%) | 314 (77.3%) |
| Health Care & Social Assistance | 101 (12.8%) | 686 (87.2%) |
| Arts, Entertainment & Recreation | 10 (37.0%) | 17 (63.0%) |
| Accommodation & Food Services | 240 (51.1%) | 230 (48.9%) |
| Public Administration | 89 (36.2%) | 157 (63.8%) |
| Total | 2,828 (52.6%) | 2,549 (47.4%) |
Education in Red Willow County
School Enrollment in Red Willow County
The most common levels of schooling among the 2,462 students in Red Willow County are high school (738 | 30.0%), middle school (527 | 21.4%), and elementary school (447 | 18.2%).
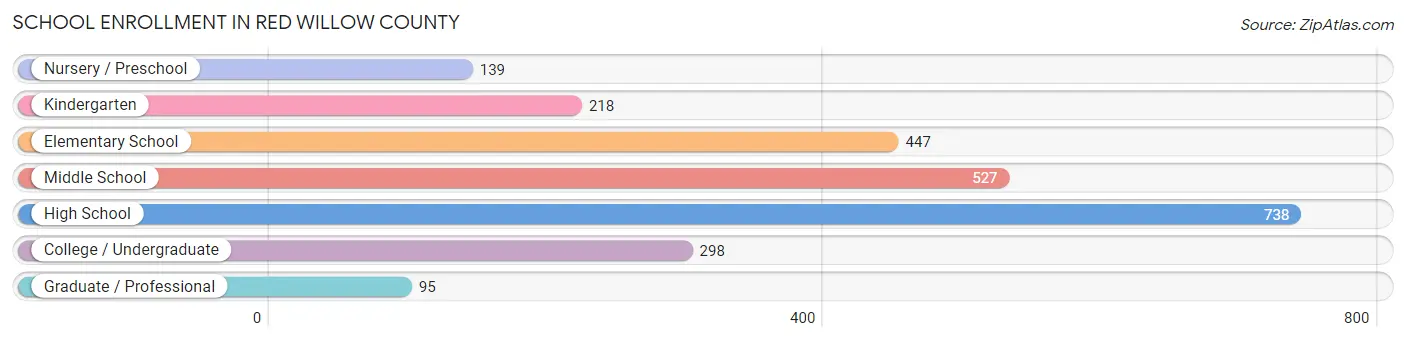
| School Level | # Students | % Students |
| Nursery / Preschool | 139 | 5.7% |
| Kindergarten | 218 | 8.8% |
| Elementary School | 447 | 18.2% |
| Middle School | 527 | 21.4% |
| High School | 738 | 30.0% |
| College / Undergraduate | 298 | 12.1% |
| Graduate / Professional | 95 | 3.9% |
| Total | 2,462 | 100.0% |
School Enrollment by Age by Funding Source in Red Willow County
Out of a total of 2,462 students who are enrolled in schools in Red Willow County, 133 (5.4%) attend a private institution, while the remaining 2,329 (94.6%) are enrolled in public schools. The age group of 3 to 4 year olds has the highest likelihood of being enrolled in private schools, with 43 (31.6% in the age bracket) enrolled. Conversely, the age group of 20 to 24 year olds has the lowest likelihood of being enrolled in a private school, with 66 (100.0% in the age bracket) attending a public institution.
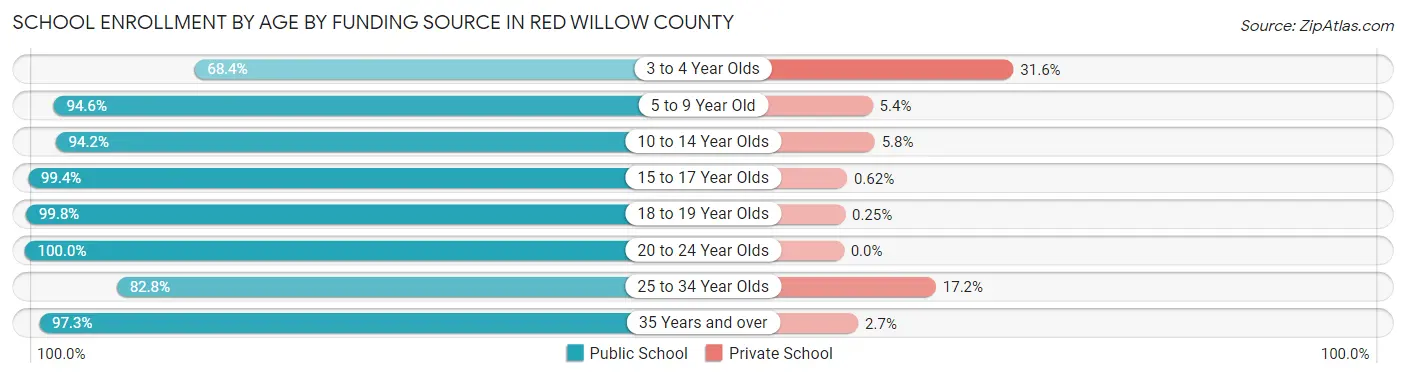
| Age Bracket | Public School | Private School |
| 3 to 4 Year Olds | 93 (68.4%) | 43 (31.6%) |
| 5 to 9 Year Old | 578 (94.6%) | 33 (5.4%) |
| 10 to 14 Year Olds | 554 (94.2%) | 34 (5.8%) |
| 15 to 17 Year Olds | 479 (99.4%) | 3 (0.6%) |
| 18 to 19 Year Olds | 405 (99.8%) | 1 (0.3%) |
| 20 to 24 Year Olds | 66 (100.0%) | 0 (0.0%) |
| 25 to 34 Year Olds | 82 (82.8%) | 17 (17.2%) |
| 35 Years and over | 72 (97.3%) | 2 (2.7%) |
| Total | 2,329 (94.6%) | 133 (5.4%) |
Educational Attainment by Field of Study in Red Willow County
Science & technology (371 | 19.7%), education (341 | 18.1%), business (296 | 15.8%), bio, nature & agricultural (267 | 14.2%), and arts & humanities (154 | 8.2%) are the most common fields of study among 1,879 individuals in Red Willow County who have obtained a bachelor's degree or higher.
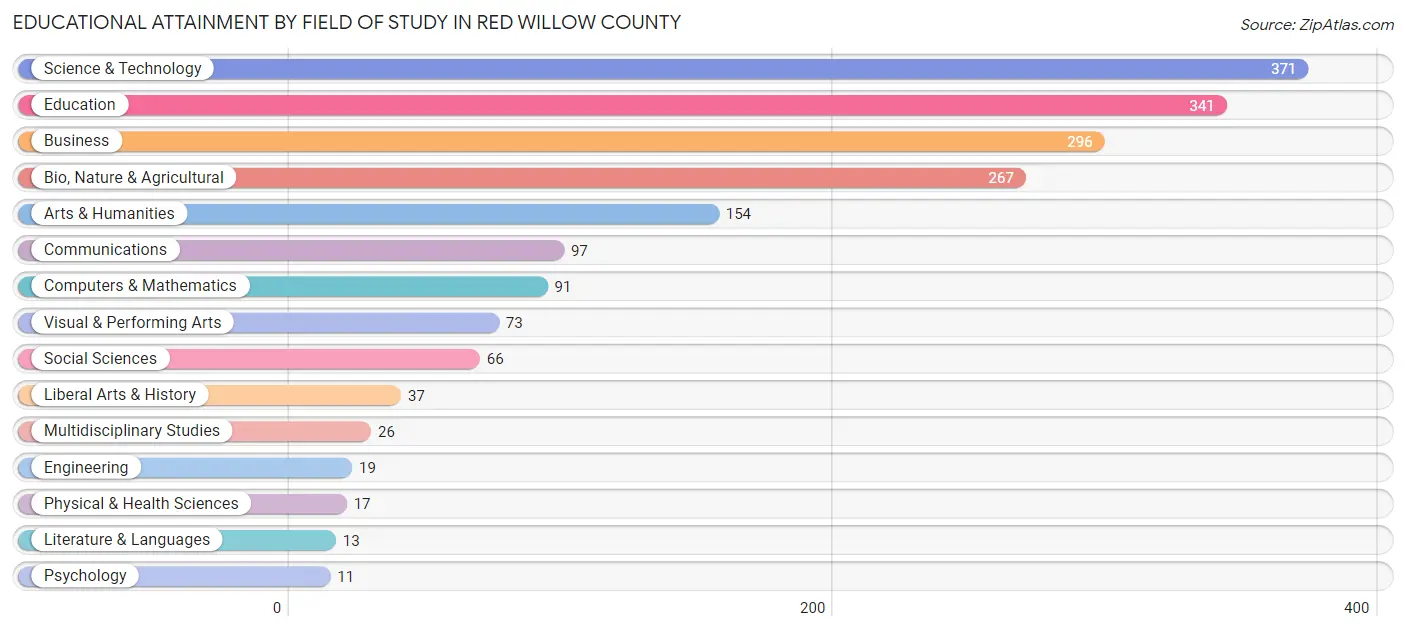
| Field of Study | # Graduates | % Graduates |
| Computers & Mathematics | 91 | 4.8% |
| Bio, Nature & Agricultural | 267 | 14.2% |
| Physical & Health Sciences | 17 | 0.9% |
| Psychology | 11 | 0.6% |
| Social Sciences | 66 | 3.5% |
| Engineering | 19 | 1.0% |
| Multidisciplinary Studies | 26 | 1.4% |
| Science & Technology | 371 | 19.7% |
| Business | 296 | 15.8% |
| Education | 341 | 18.1% |
| Literature & Languages | 13 | 0.7% |
| Liberal Arts & History | 37 | 2.0% |
| Visual & Performing Arts | 73 | 3.9% |
| Communications | 97 | 5.2% |
| Arts & Humanities | 154 | 8.2% |
| Total | 1,879 | 100.0% |
Transportation & Commute in Red Willow County
Vehicle Availability by Sex in Red Willow County
The most prevalent vehicle ownership categories in Red Willow County are males with 2 vehicles (1,003, accounting for 36.2%) and females with 2 vehicles (1,058, making up 40.3%).
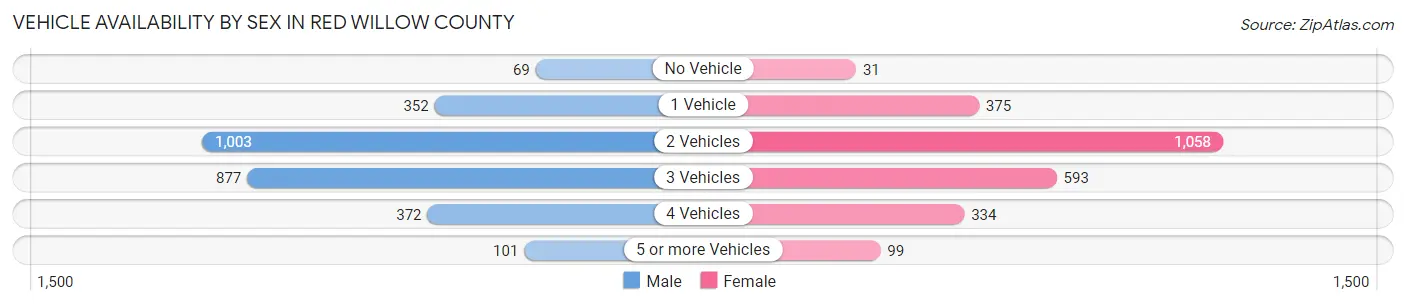
| Vehicles Available | Male | Female |
| No Vehicle | 69 (2.5%) | 31 (1.2%) |
| 1 Vehicle | 352 (12.7%) | 375 (15.1%) |
| 2 Vehicles | 1,003 (36.2%) | 1,058 (42.5%) |
| 3 Vehicles | 877 (31.6%) | 593 (23.8%) |
| 4 Vehicles | 372 (13.4%) | 334 (13.4%) |
| 5 or more Vehicles | 101 (3.6%) | 99 (4.0%) |
| Total | 2,774 (100.0%) | 2,490 (100.0%) |
Commute Time in Red Willow County
The most frequently occuring commute durations in Red Willow County are 5 to 9 minutes (1,810 commuters, 35.6%), 10 to 14 minutes (1,112 commuters, 21.9%), and less than 5 minutes (764 commuters, 15.0%).
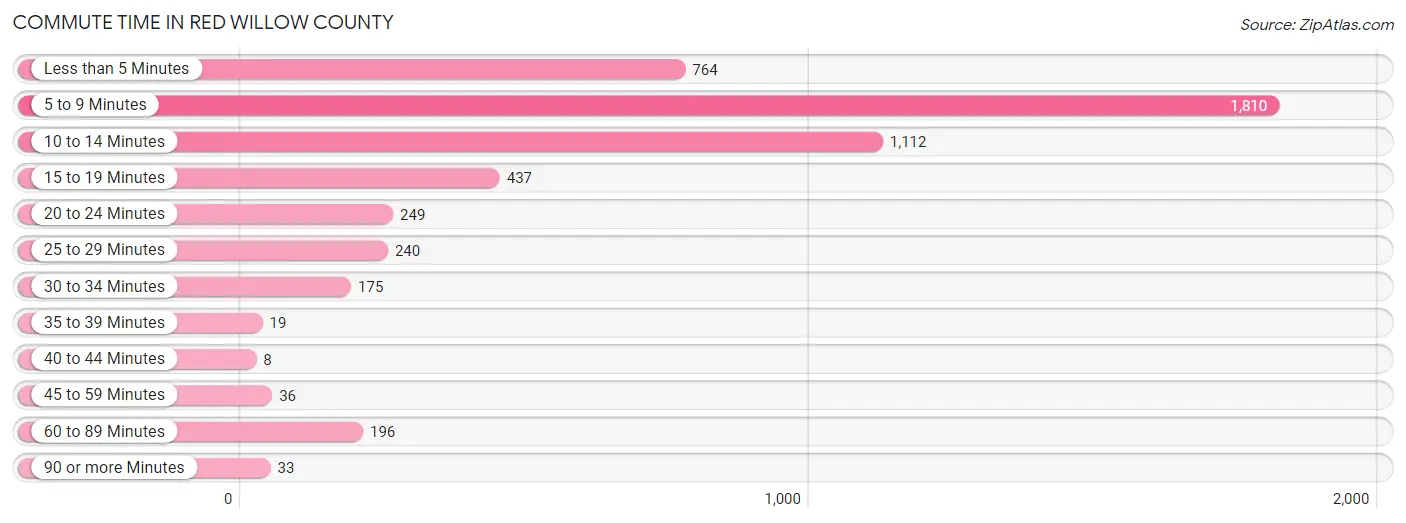
| Commute Time | # Commuters | % Commuters |
| Less than 5 Minutes | 764 | 15.0% |
| 5 to 9 Minutes | 1,810 | 35.6% |
| 10 to 14 Minutes | 1,112 | 21.9% |
| 15 to 19 Minutes | 437 | 8.6% |
| 20 to 24 Minutes | 249 | 4.9% |
| 25 to 29 Minutes | 240 | 4.7% |
| 30 to 34 Minutes | 175 | 3.5% |
| 35 to 39 Minutes | 19 | 0.4% |
| 40 to 44 Minutes | 8 | 0.2% |
| 45 to 59 Minutes | 36 | 0.7% |
| 60 to 89 Minutes | 196 | 3.9% |
| 90 or more Minutes | 33 | 0.6% |
Commute Time by Sex in Red Willow County
The most common commute times in Red Willow County are 5 to 9 minutes (897 commuters, 33.2%) for males and 5 to 9 minutes (913 commuters, 38.4%) for females.
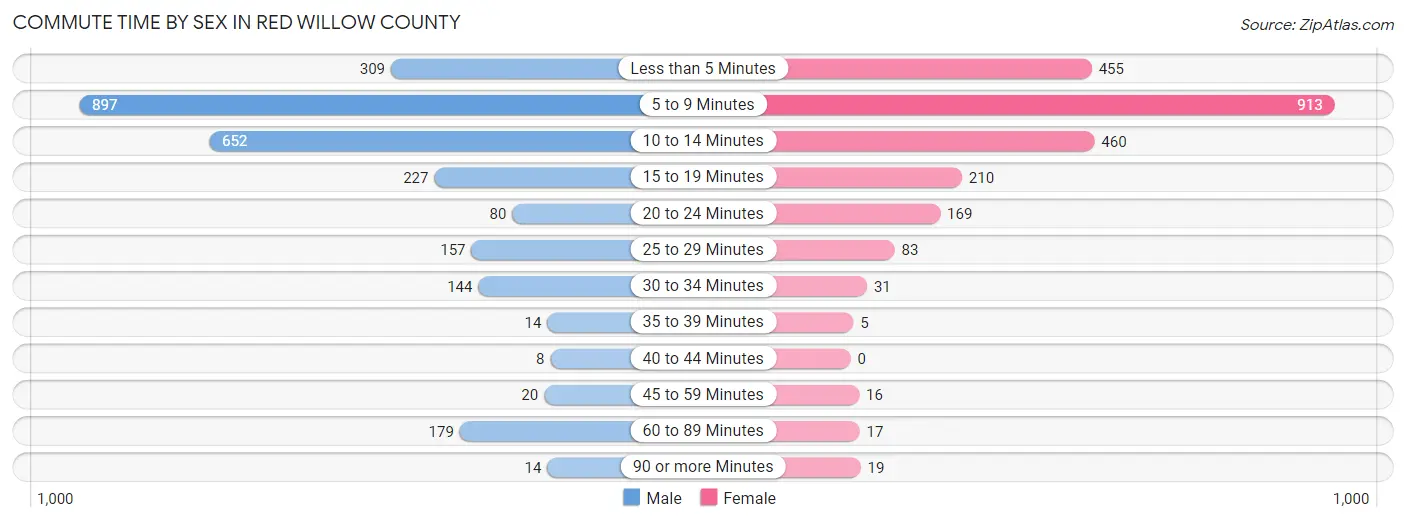
| Commute Time | Male | Female |
| Less than 5 Minutes | 309 (11.4%) | 455 (19.1%) |
| 5 to 9 Minutes | 897 (33.2%) | 913 (38.4%) |
| 10 to 14 Minutes | 652 (24.1%) | 460 (19.3%) |
| 15 to 19 Minutes | 227 (8.4%) | 210 (8.8%) |
| 20 to 24 Minutes | 80 (3.0%) | 169 (7.1%) |
| 25 to 29 Minutes | 157 (5.8%) | 83 (3.5%) |
| 30 to 34 Minutes | 144 (5.3%) | 31 (1.3%) |
| 35 to 39 Minutes | 14 (0.5%) | 5 (0.2%) |
| 40 to 44 Minutes | 8 (0.3%) | 0 (0.0%) |
| 45 to 59 Minutes | 20 (0.7%) | 16 (0.7%) |
| 60 to 89 Minutes | 179 (6.6%) | 17 (0.7%) |
| 90 or more Minutes | 14 (0.5%) | 19 (0.8%) |
Time of Departure to Work by Sex in Red Willow County
The most frequent times of departure to work in Red Willow County are 7:00 AM to 7:29 AM (564, 20.9%) for males and 7:30 AM to 7:59 AM (429, 18.0%) for females.
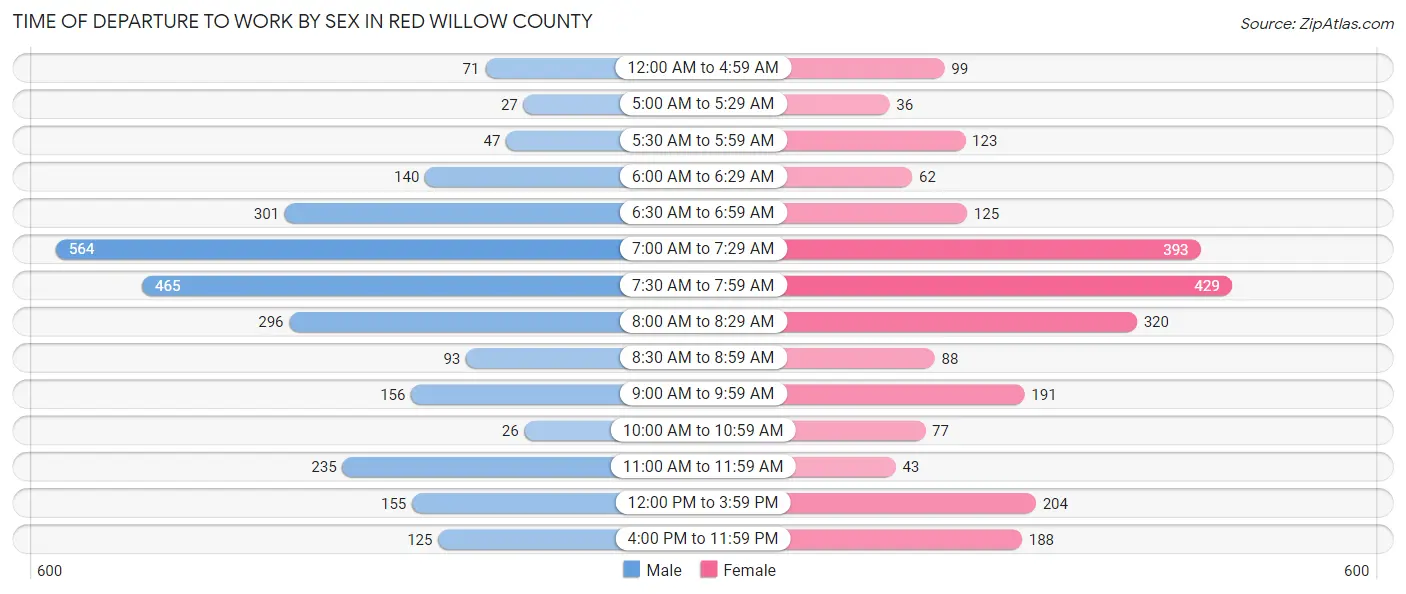
| Time of Departure | Male | Female |
| 12:00 AM to 4:59 AM | 71 (2.6%) | 99 (4.2%) |
| 5:00 AM to 5:29 AM | 27 (1.0%) | 36 (1.5%) |
| 5:30 AM to 5:59 AM | 47 (1.7%) | 123 (5.2%) |
| 6:00 AM to 6:29 AM | 140 (5.2%) | 62 (2.6%) |
| 6:30 AM to 6:59 AM | 301 (11.1%) | 125 (5.3%) |
| 7:00 AM to 7:29 AM | 564 (20.9%) | 393 (16.5%) |
| 7:30 AM to 7:59 AM | 465 (17.2%) | 429 (18.0%) |
| 8:00 AM to 8:29 AM | 296 (11.0%) | 320 (13.5%) |
| 8:30 AM to 8:59 AM | 93 (3.4%) | 88 (3.7%) |
| 9:00 AM to 9:59 AM | 156 (5.8%) | 191 (8.0%) |
| 10:00 AM to 10:59 AM | 26 (1.0%) | 77 (3.2%) |
| 11:00 AM to 11:59 AM | 235 (8.7%) | 43 (1.8%) |
| 12:00 PM to 3:59 PM | 155 (5.7%) | 204 (8.6%) |
| 4:00 PM to 11:59 PM | 125 (4.6%) | 188 (7.9%) |
| Total | 2,701 (100.0%) | 2,378 (100.0%) |
Housing Occupancy in Red Willow County
Occupancy by Ownership in Red Willow County
Of the total 4,315 dwellings in Red Willow County, owner-occupied units account for 3,075 (71.3%), while renter-occupied units make up 1,240 (28.7%).
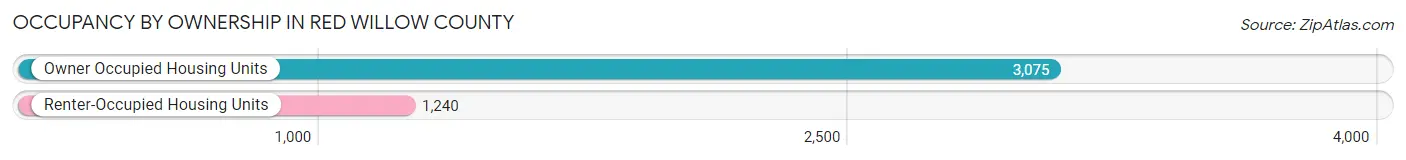
| Occupancy | # Housing Units | % Housing Units |
| Owner Occupied Housing Units | 3,075 | 71.3% |
| Renter-Occupied Housing Units | 1,240 | 28.7% |
| Total Occupied Housing Units | 4,315 | 100.0% |
Occupancy by Household Size in Red Willow County
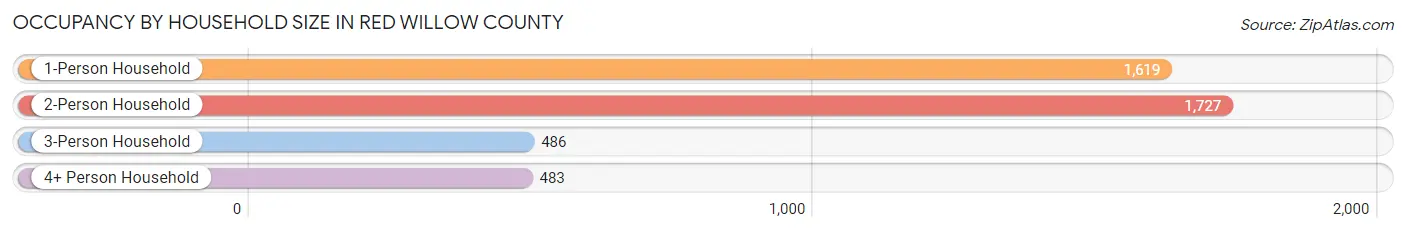
| Household Size | # Housing Units | % Housing Units |
| 1-Person Household | 1,619 | 37.5% |
| 2-Person Household | 1,727 | 40.0% |
| 3-Person Household | 486 | 11.3% |
| 4+ Person Household | 483 | 11.2% |
| Total Housing Units | 4,315 | 100.0% |
Occupancy by Ownership by Household Size in Red Willow County
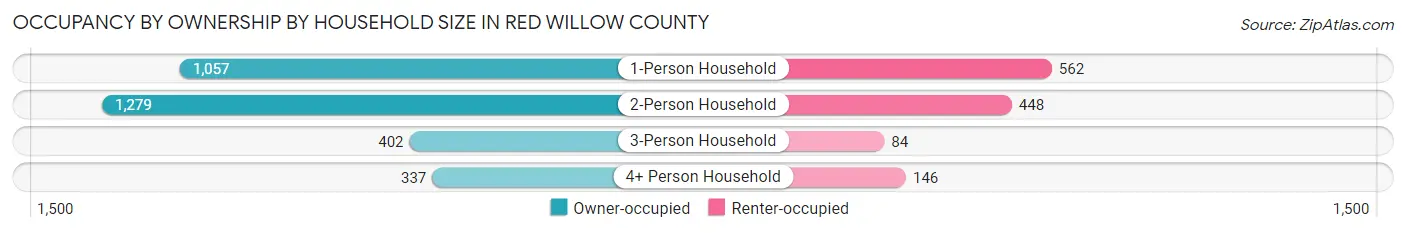
| Household Size | Owner-occupied | Renter-occupied |
| 1-Person Household | 1,057 (65.3%) | 562 (34.7%) |
| 2-Person Household | 1,279 (74.1%) | 448 (25.9%) |
| 3-Person Household | 402 (82.7%) | 84 (17.3%) |
| 4+ Person Household | 337 (69.8%) | 146 (30.2%) |
| Total Housing Units | 3,075 (71.3%) | 1,240 (28.7%) |
Occupancy by Educational Attainment in Red Willow County
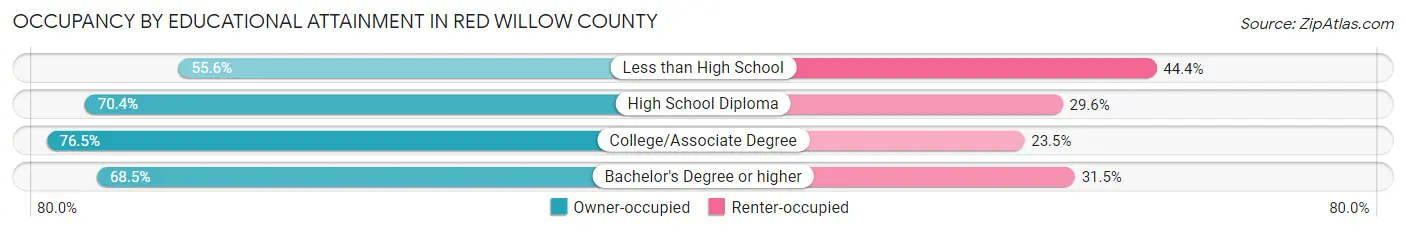
| Household Size | Owner-occupied | Renter-occupied |
| Less than High School | 115 (55.6%) | 92 (44.4%) |
| High School Diploma | 951 (70.4%) | 399 (29.6%) |
| College/Associate Degree | 1,143 (76.5%) | 351 (23.5%) |
| Bachelor's Degree or higher | 866 (68.5%) | 398 (31.5%) |
Occupancy by Age of Householder in Red Willow County
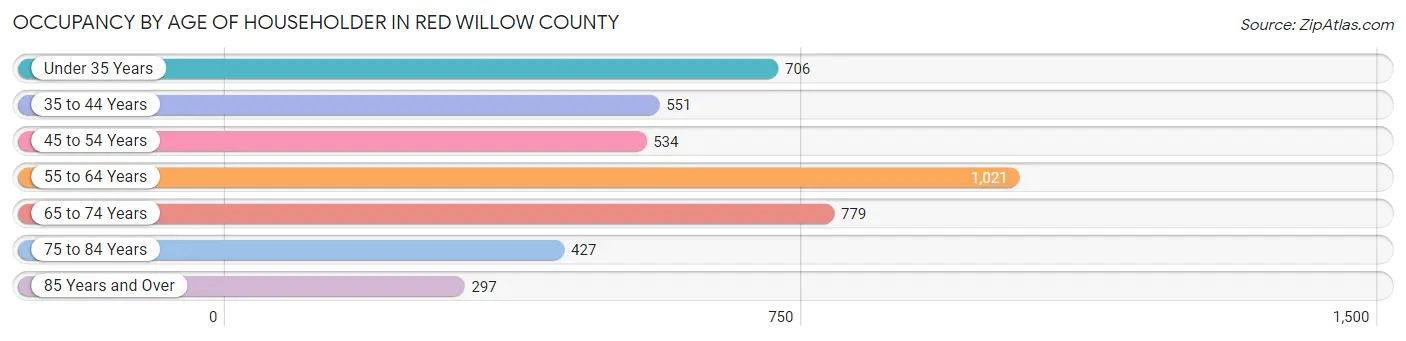
| Age Bracket | # Households | % Households |
| Under 35 Years | 706 | 16.4% |
| 35 to 44 Years | 551 | 12.8% |
| 45 to 54 Years | 534 | 12.4% |
| 55 to 64 Years | 1,021 | 23.7% |
| 65 to 74 Years | 779 | 18.0% |
| 75 to 84 Years | 427 | 9.9% |
| 85 Years and Over | 297 | 6.9% |
| Total | 4,315 | 100.0% |
Housing Finances in Red Willow County
Median Income by Occupancy in Red Willow County
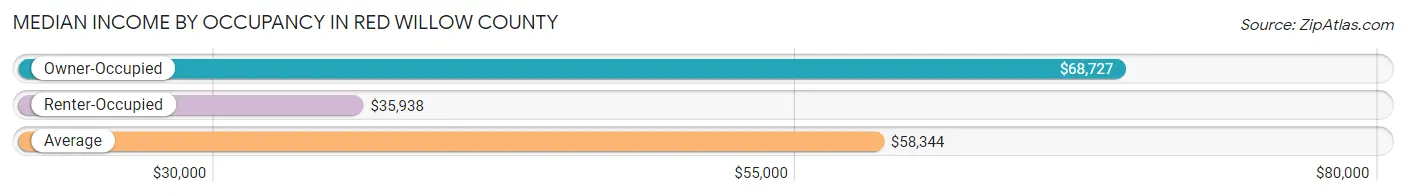
| Occupancy Type | # Households | Median Income |
| Owner-Occupied | 3,075 (71.3%) | $68,727 |
| Renter-Occupied | 1,240 (28.7%) | $35,938 |
| Average | 4,315 (100.0%) | $58,344 |
Occupancy by Householder Income Bracket in Red Willow County
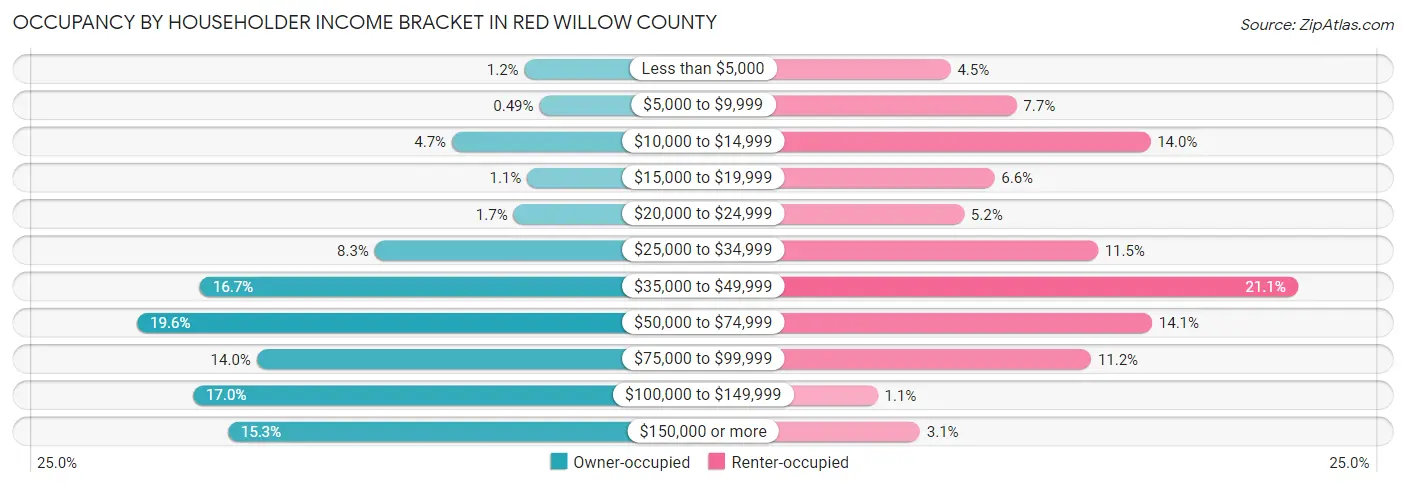
| Income Bracket | Owner-occupied | Renter-occupied |
| Less than $5,000 | 37 (1.2%) | 56 (4.5%) |
| $5,000 to $9,999 | 15 (0.5%) | 95 (7.7%) |
| $10,000 to $14,999 | 143 (4.6%) | 174 (14.0%) |
| $15,000 to $19,999 | 33 (1.1%) | 82 (6.6%) |
| $20,000 to $24,999 | 53 (1.7%) | 64 (5.2%) |
| $25,000 to $34,999 | 256 (8.3%) | 143 (11.5%) |
| $35,000 to $49,999 | 512 (16.7%) | 261 (21.0%) |
| $50,000 to $74,999 | 604 (19.6%) | 175 (14.1%) |
| $75,000 to $99,999 | 429 (14.0%) | 139 (11.2%) |
| $100,000 to $149,999 | 522 (17.0%) | 13 (1.1%) |
| $150,000 or more | 471 (15.3%) | 38 (3.1%) |
| Total | 3,075 (100.0%) | 1,240 (100.0%) |
Monthly Housing Cost Tiers in Red Willow County
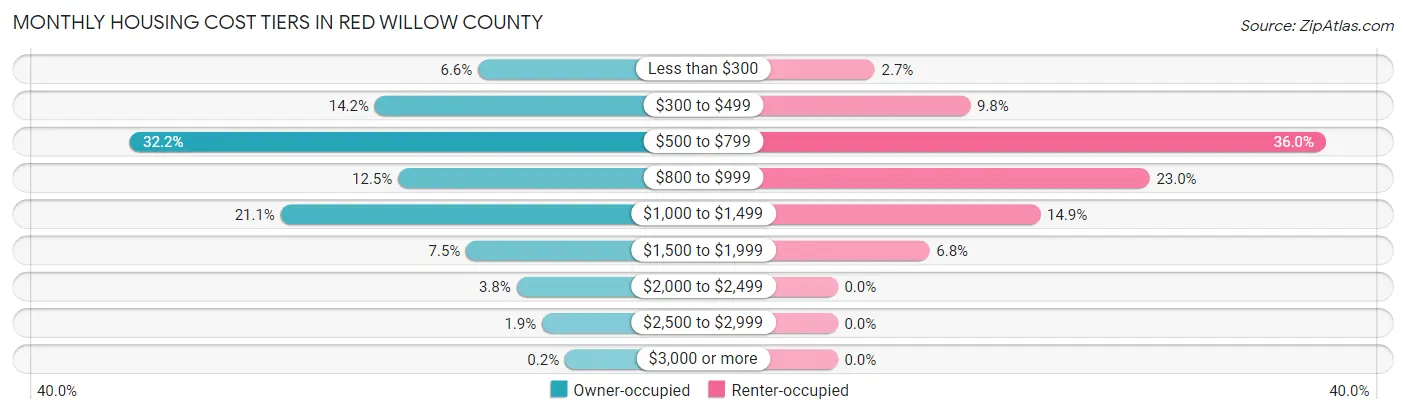
| Monthly Cost | Owner-occupied | Renter-occupied |
| Less than $300 | 203 (6.6%) | 34 (2.7%) |
| $300 to $499 | 437 (14.2%) | 121 (9.8%) |
| $500 to $799 | 991 (32.2%) | 446 (36.0%) |
| $800 to $999 | 384 (12.5%) | 285 (23.0%) |
| $1,000 to $1,499 | 650 (21.1%) | 185 (14.9%) |
| $1,500 to $1,999 | 230 (7.5%) | 84 (6.8%) |
| $2,000 to $2,499 | 116 (3.8%) | 0 (0.0%) |
| $2,500 to $2,999 | 58 (1.9%) | 0 (0.0%) |
| $3,000 or more | 6 (0.2%) | 0 (0.0%) |
| Total | 3,075 (100.0%) | 1,240 (100.0%) |
Physical Housing Characteristics in Red Willow County
Housing Structures in Red Willow County
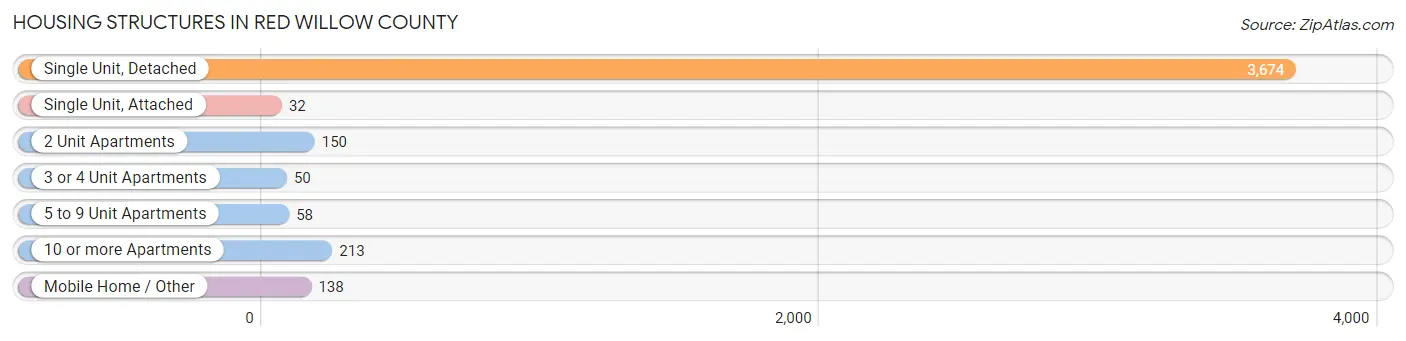
| Structure Type | # Housing Units | % Housing Units |
| Single Unit, Detached | 3,674 | 85.1% |
| Single Unit, Attached | 32 | 0.7% |
| 2 Unit Apartments | 150 | 3.5% |
| 3 or 4 Unit Apartments | 50 | 1.2% |
| 5 to 9 Unit Apartments | 58 | 1.3% |
| 10 or more Apartments | 213 | 4.9% |
| Mobile Home / Other | 138 | 3.2% |
| Total | 4,315 | 100.0% |
Housing Structures by Occupancy in Red Willow County
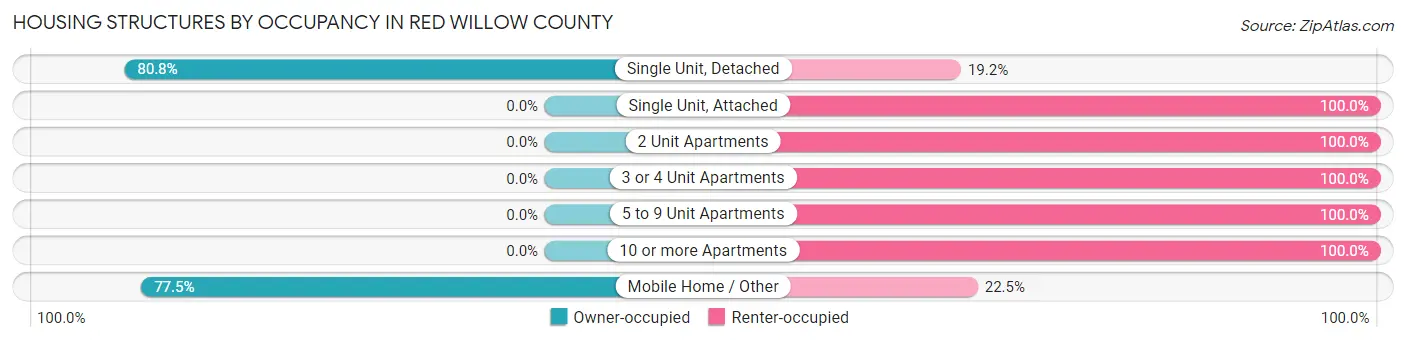
| Structure Type | Owner-occupied | Renter-occupied |
| Single Unit, Detached | 2,968 (80.8%) | 706 (19.2%) |
| Single Unit, Attached | 0 (0.0%) | 32 (100.0%) |
| 2 Unit Apartments | 0 (0.0%) | 150 (100.0%) |
| 3 or 4 Unit Apartments | 0 (0.0%) | 50 (100.0%) |
| 5 to 9 Unit Apartments | 0 (0.0%) | 58 (100.0%) |
| 10 or more Apartments | 0 (0.0%) | 213 (100.0%) |
| Mobile Home / Other | 107 (77.5%) | 31 (22.5%) |
| Total | 3,075 (71.3%) | 1,240 (28.7%) |
Housing Structures by Number of Rooms in Red Willow County
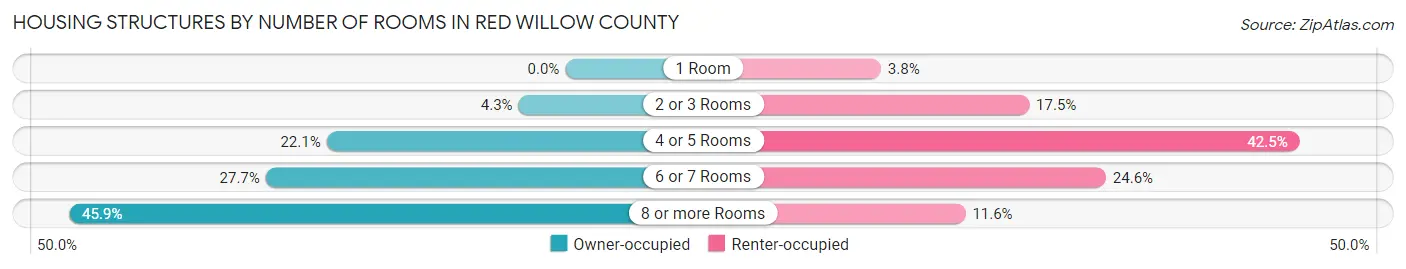
| Number of Rooms | Owner-occupied | Renter-occupied |
| 1 Room | 0 (0.0%) | 47 (3.8%) |
| 2 or 3 Rooms | 133 (4.3%) | 217 (17.5%) |
| 4 or 5 Rooms | 679 (22.1%) | 527 (42.5%) |
| 6 or 7 Rooms | 852 (27.7%) | 305 (24.6%) |
| 8 or more Rooms | 1,411 (45.9%) | 144 (11.6%) |
| Total | 3,075 (100.0%) | 1,240 (100.0%) |
Housing Structure by Heating Type in Red Willow County
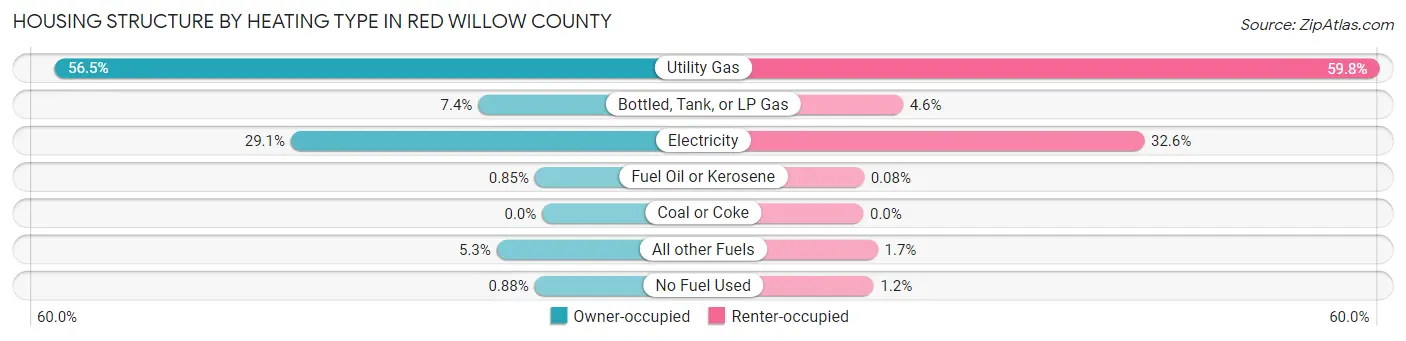
| Heating Type | Owner-occupied | Renter-occupied |
| Utility Gas | 1,736 (56.5%) | 742 (59.8%) |
| Bottled, Tank, or LP Gas | 228 (7.4%) | 57 (4.6%) |
| Electricity | 896 (29.1%) | 404 (32.6%) |
| Fuel Oil or Kerosene | 26 (0.9%) | 1 (0.1%) |
| Coal or Coke | 0 (0.0%) | 0 (0.0%) |
| All other Fuels | 162 (5.3%) | 21 (1.7%) |
| No Fuel Used | 27 (0.9%) | 15 (1.2%) |
| Total | 3,075 (100.0%) | 1,240 (100.0%) |
Household Vehicle Usage in Red Willow County
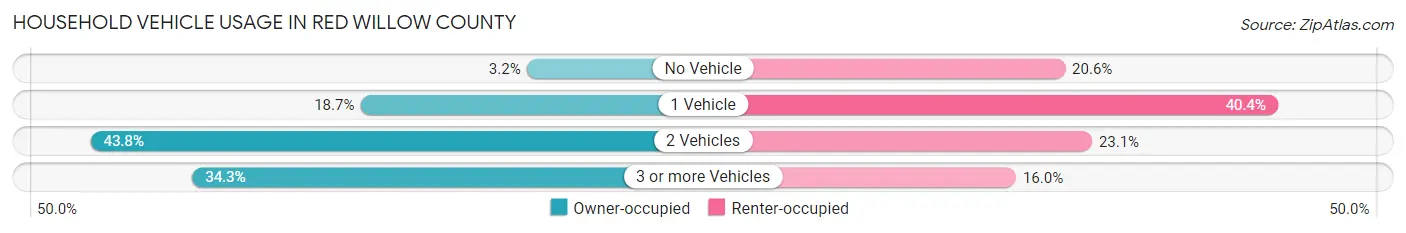
| Vehicles per Household | Owner-occupied | Renter-occupied |
| No Vehicle | 97 (3.2%) | 255 (20.6%) |
| 1 Vehicle | 574 (18.7%) | 501 (40.4%) |
| 2 Vehicles | 1,348 (43.8%) | 286 (23.1%) |
| 3 or more Vehicles | 1,056 (34.3%) | 198 (16.0%) |
| Total | 3,075 (100.0%) | 1,240 (100.0%) |
Real Estate & Mortgages in Red Willow County
Real Estate and Mortgage Overview in Red Willow County
| Characteristic | Without Mortgage | With Mortgage |
| Housing Units | 1,635 | 1,440 |
| Median Property Value | $132,400 | $159,800 |
| Median Household Income | $58,170 | $315 |
| Monthly Housing Costs | $554 | $5 |
| Real Estate Taxes | $1,782 | $51 |
Property Value by Mortgage Status in Red Willow County
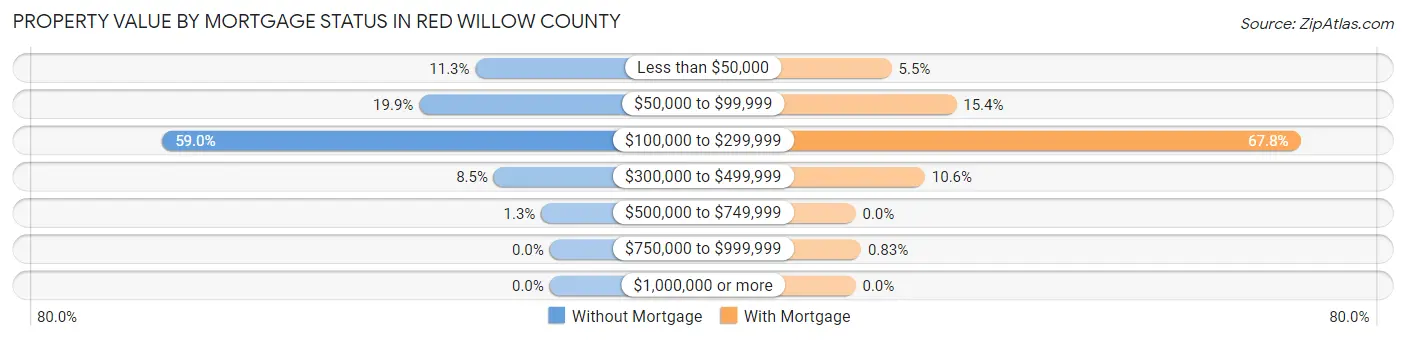
| Property Value | Without Mortgage | With Mortgage |
| Less than $50,000 | 185 (11.3%) | 79 (5.5%) |
| $50,000 to $99,999 | 325 (19.9%) | 221 (15.3%) |
| $100,000 to $299,999 | 965 (59.0%) | 976 (67.8%) |
| $300,000 to $499,999 | 139 (8.5%) | 152 (10.6%) |
| $500,000 to $749,999 | 21 (1.3%) | 0 (0.0%) |
| $750,000 to $999,999 | 0 (0.0%) | 12 (0.8%) |
| $1,000,000 or more | 0 (0.0%) | 0 (0.0%) |
| Total | 1,635 (100.0%) | 1,440 (100.0%) |
Household Income by Mortgage Status in Red Willow County
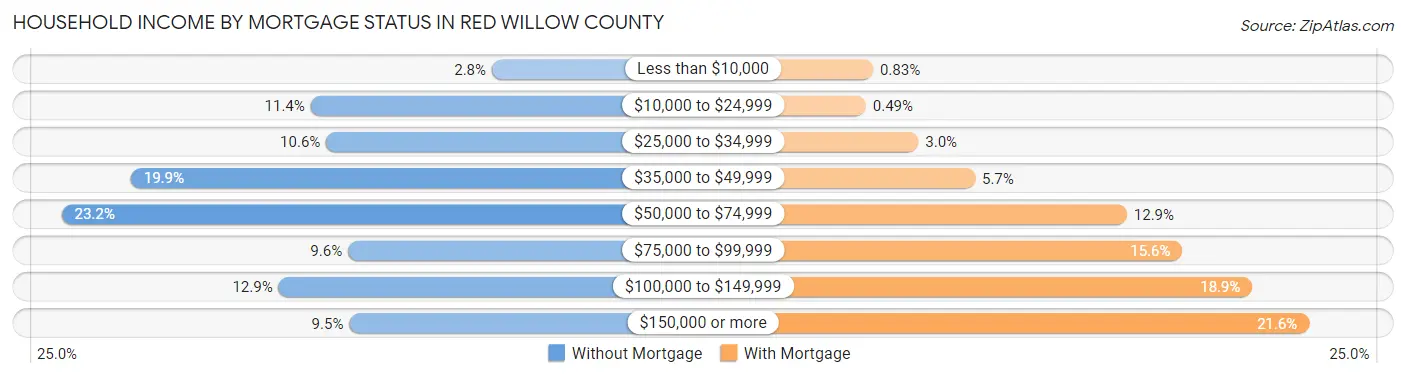
| Household Income | Without Mortgage | With Mortgage |
| Less than $10,000 | 45 (2.8%) | 12 (0.8%) |
| $10,000 to $24,999 | 186 (11.4%) | 7 (0.5%) |
| $25,000 to $34,999 | 174 (10.6%) | 43 (3.0%) |
| $35,000 to $49,999 | 326 (19.9%) | 82 (5.7%) |
| $50,000 to $74,999 | 380 (23.2%) | 186 (12.9%) |
| $75,000 to $99,999 | 157 (9.6%) | 224 (15.6%) |
| $100,000 to $149,999 | 211 (12.9%) | 272 (18.9%) |
| $150,000 or more | 156 (9.5%) | 311 (21.6%) |
| Total | 1,635 (100.0%) | 1,440 (100.0%) |
Property Value to Household Income Ratio in Red Willow County
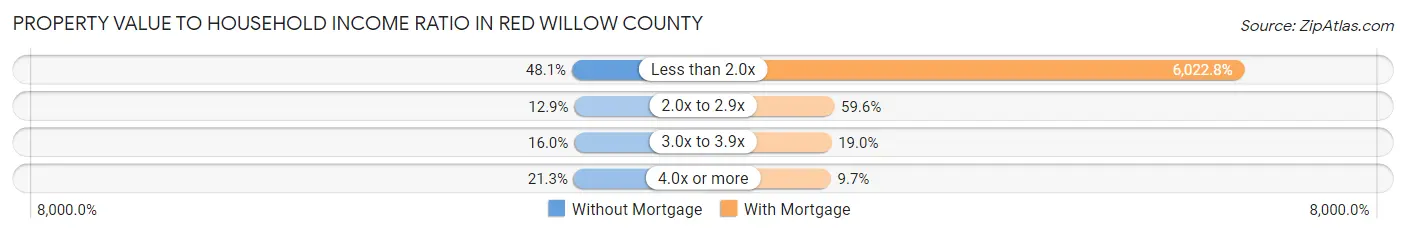
| Value-to-Income Ratio | Without Mortgage | With Mortgage |
| Less than 2.0x | 787 (48.1%) | 86,728 (6,022.8%) |
| 2.0x to 2.9x | 211 (12.9%) | 858 (59.6%) |
| 3.0x to 3.9x | 261 (16.0%) | 274 (19.0%) |
| 4.0x or more | 348 (21.3%) | 140 (9.7%) |
| Total | 1,635 (100.0%) | 1,440 (100.0%) |
Real Estate Taxes by Mortgage Status in Red Willow County
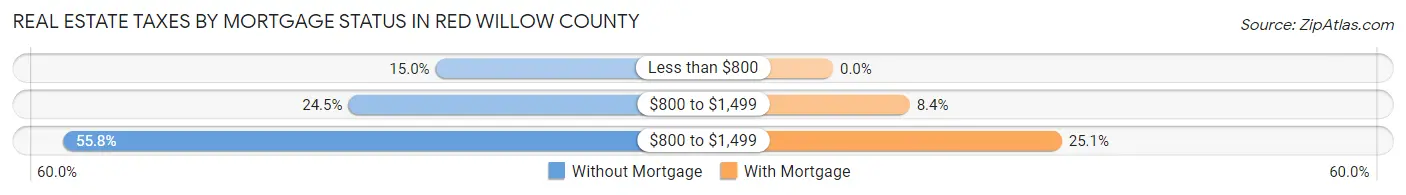
| Property Taxes | Without Mortgage | With Mortgage |
| Less than $800 | 245 (15.0%) | 0 (0.0%) |
| $800 to $1,499 | 401 (24.5%) | 121 (8.4%) |
| $800 to $1,499 | 912 (55.8%) | 361 (25.1%) |
| Total | 1,635 (100.0%) | 1,440 (100.0%) |
Health & Disability in Red Willow County
Health Insurance Coverage by Age in Red Willow County
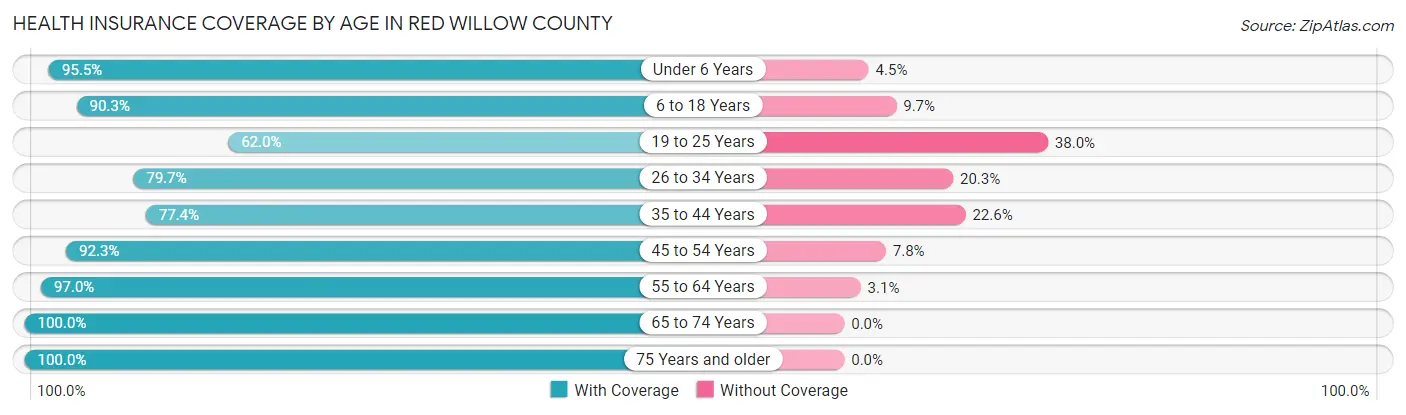
| Age Bracket | With Coverage | Without Coverage |
| Under 6 Years | 715 (95.5%) | 34 (4.5%) |
| 6 to 18 Years | 1,770 (90.3%) | 190 (9.7%) |
| 19 to 25 Years | 428 (62.0%) | 262 (38.0%) |
| 26 to 34 Years | 747 (79.7%) | 190 (20.3%) |
| 35 to 44 Years | 928 (77.4%) | 271 (22.6%) |
| 45 to 54 Years | 1,071 (92.2%) | 90 (7.7%) |
| 55 to 64 Years | 1,557 (97.0%) | 49 (3.0%) |
| 65 to 74 Years | 1,193 (100.0%) | 0 (0.0%) |
| 75 Years and older | 975 (100.0%) | 0 (0.0%) |
| Total | 9,384 (89.6%) | 1,086 (10.4%) |
Health Insurance Coverage by Citizenship Status in Red Willow County
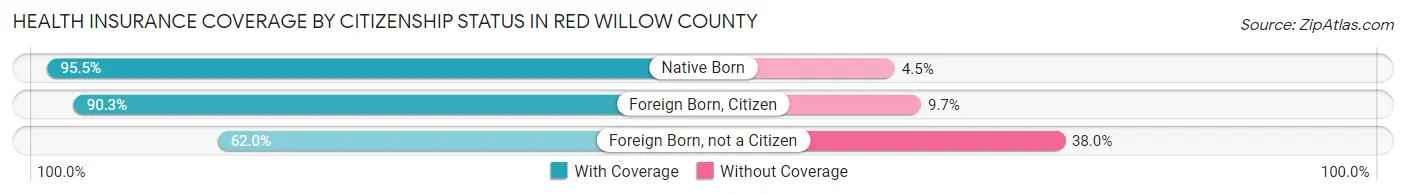
| Citizenship Status | With Coverage | Without Coverage |
| Native Born | 715 (95.5%) | 34 (4.5%) |
| Foreign Born, Citizen | 1,770 (90.3%) | 190 (9.7%) |
| Foreign Born, not a Citizen | 428 (62.0%) | 262 (38.0%) |
Health Insurance Coverage by Household Income in Red Willow County
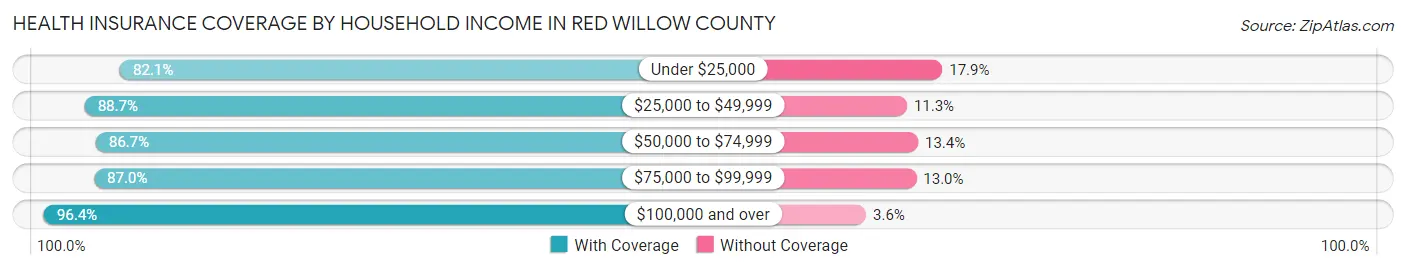
| Household Income | With Coverage | Without Coverage |
| Under $25,000 | 1,119 (82.1%) | 244 (17.9%) |
| $25,000 to $49,999 | 2,086 (88.7%) | 265 (11.3%) |
| $50,000 to $74,999 | 1,512 (86.7%) | 233 (13.4%) |
| $75,000 to $99,999 | 1,428 (87.0%) | 214 (13.0%) |
| $100,000 and over | 3,138 (96.4%) | 118 (3.6%) |
Public vs Private Health Insurance Coverage by Age in Red Willow County
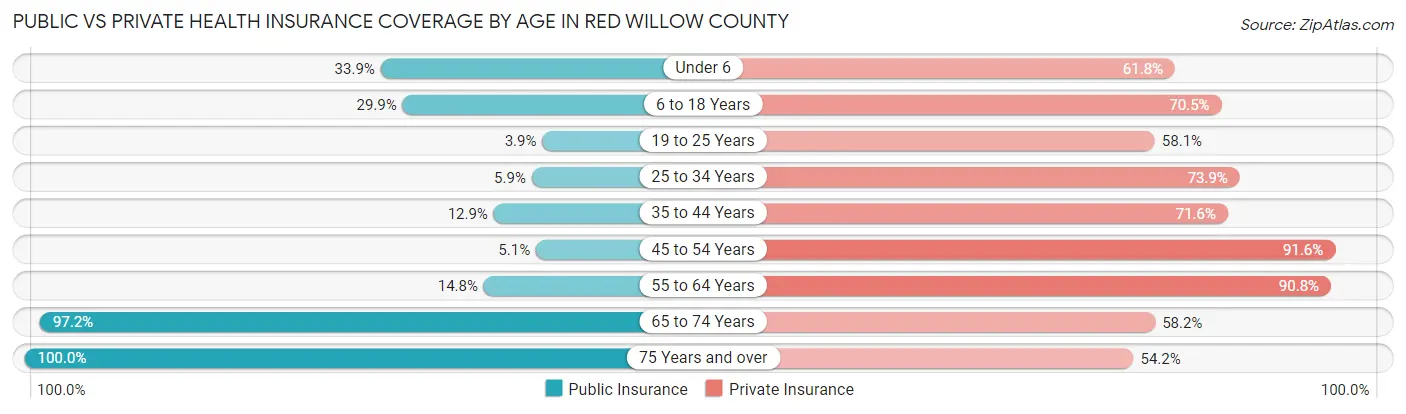
| Age Bracket | Public Insurance | Private Insurance |
| Under 6 | 254 (33.9%) | 463 (61.8%) |
| 6 to 18 Years | 585 (29.8%) | 1,381 (70.5%) |
| 19 to 25 Years | 27 (3.9%) | 401 (58.1%) |
| 25 to 34 Years | 55 (5.9%) | 692 (73.9%) |
| 35 to 44 Years | 155 (12.9%) | 859 (71.6%) |
| 45 to 54 Years | 59 (5.1%) | 1,063 (91.6%) |
| 55 to 64 Years | 237 (14.8%) | 1,458 (90.8%) |
| 65 to 74 Years | 1,159 (97.2%) | 694 (58.2%) |
| 75 Years and over | 975 (100.0%) | 528 (54.1%) |
| Total | 3,506 (33.5%) | 7,539 (72.0%) |
Disability Status by Sex by Age in Red Willow County
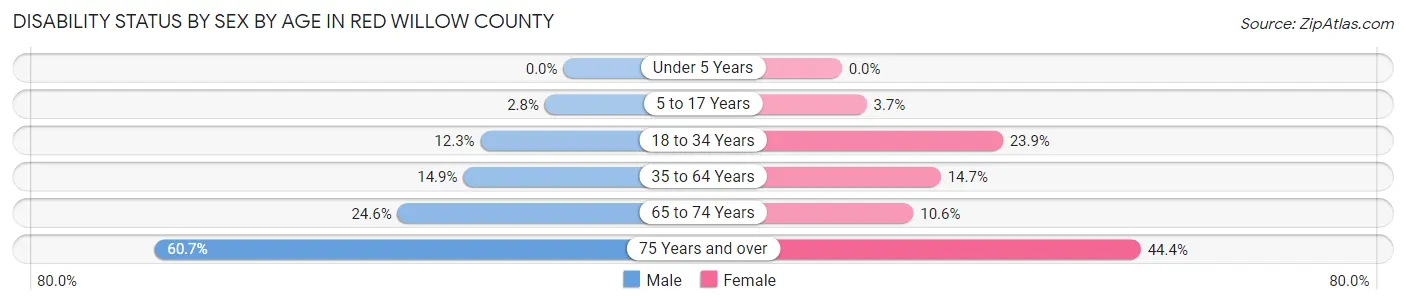
| Age Bracket | Male | Female |
| Under 5 Years | 0 (0.0%) | 0 (0.0%) |
| 5 to 17 Years | 22 (2.8%) | 35 (3.7%) |
| 18 to 34 Years | 129 (12.3%) | 220 (23.9%) |
| 35 to 64 Years | 286 (14.9%) | 300 (14.7%) |
| 65 to 74 Years | 150 (24.6%) | 62 (10.6%) |
| 75 Years and over | 246 (60.7%) | 253 (44.4%) |
Disability Class by Sex by Age in Red Willow County
Disability Class: Hearing Difficulty
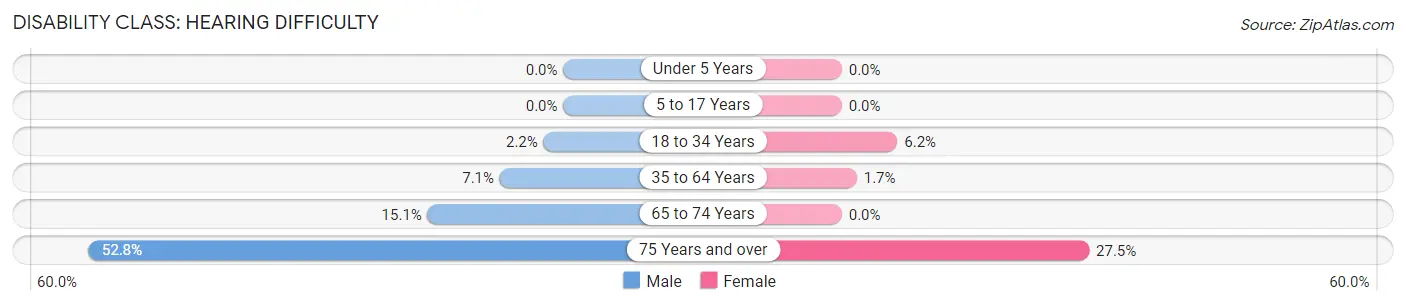
| Age Bracket | Male | Female |
| Under 5 Years | 0 (0.0%) | 0 (0.0%) |
| 5 to 17 Years | 0 (0.0%) | 0 (0.0%) |
| 18 to 34 Years | 23 (2.2%) | 57 (6.2%) |
| 35 to 64 Years | 136 (7.1%) | 34 (1.7%) |
| 65 to 74 Years | 92 (15.1%) | 0 (0.0%) |
| 75 Years and over | 214 (52.8%) | 157 (27.5%) |
Disability Class: Vision Difficulty
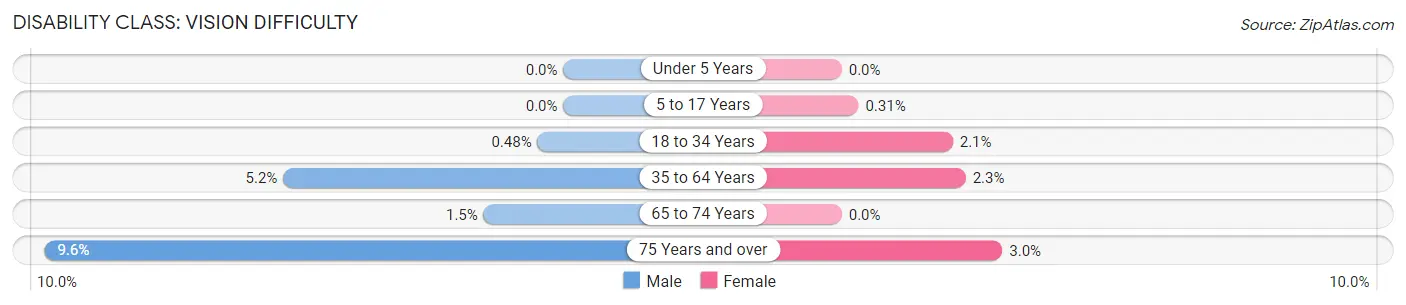
| Age Bracket | Male | Female |
| Under 5 Years | 0 (0.0%) | 0 (0.0%) |
| 5 to 17 Years | 0 (0.0%) | 3 (0.3%) |
| 18 to 34 Years | 5 (0.5%) | 19 (2.1%) |
| 35 to 64 Years | 100 (5.2%) | 47 (2.3%) |
| 65 to 74 Years | 9 (1.5%) | 0 (0.0%) |
| 75 Years and over | 39 (9.6%) | 17 (3.0%) |
Disability Class: Cognitive Difficulty
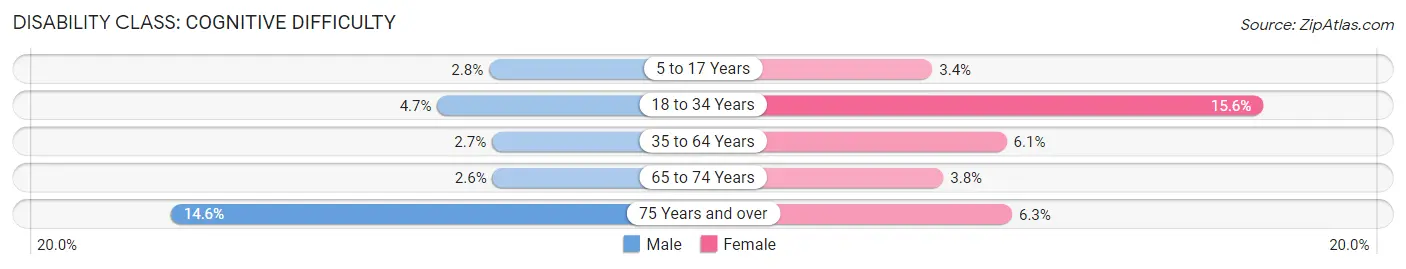
| Age Bracket | Male | Female |
| 5 to 17 Years | 22 (2.8%) | 32 (3.4%) |
| 18 to 34 Years | 49 (4.7%) | 144 (15.6%) |
| 35 to 64 Years | 51 (2.6%) | 125 (6.1%) |
| 65 to 74 Years | 16 (2.6%) | 22 (3.8%) |
| 75 Years and over | 59 (14.6%) | 36 (6.3%) |
Disability Class: Ambulatory Difficulty
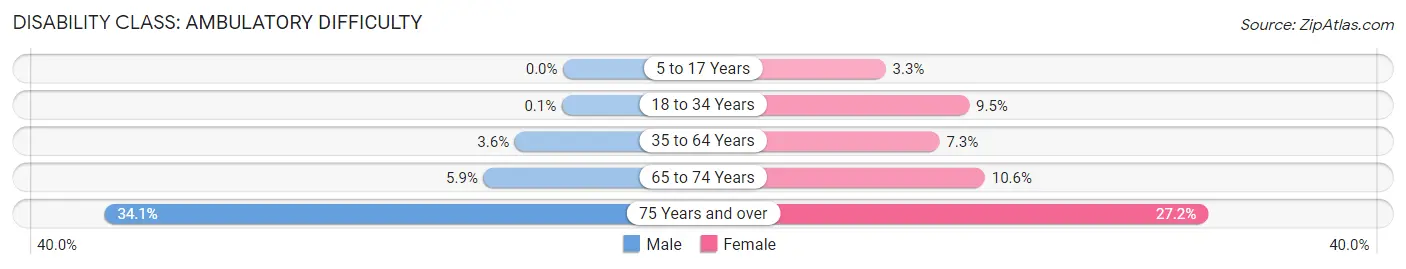
| Age Bracket | Male | Female |
| 5 to 17 Years | 0 (0.0%) | 31 (3.3%) |
| 18 to 34 Years | 1 (0.1%) | 87 (9.5%) |
| 35 to 64 Years | 69 (3.6%) | 148 (7.2%) |
| 65 to 74 Years | 36 (5.9%) | 62 (10.6%) |
| 75 Years and over | 138 (34.1%) | 155 (27.2%) |
Disability Class: Self-Care Difficulty
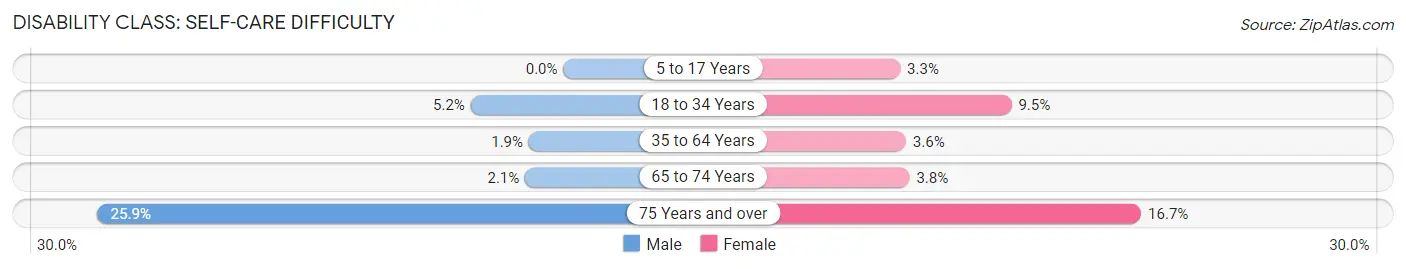
| Age Bracket | Male | Female |
| 5 to 17 Years | 0 (0.0%) | 31 (3.3%) |
| 18 to 34 Years | 54 (5.2%) | 87 (9.5%) |
| 35 to 64 Years | 37 (1.9%) | 73 (3.6%) |
| 65 to 74 Years | 13 (2.1%) | 22 (3.8%) |
| 75 Years and over | 105 (25.9%) | 95 (16.7%) |
Technology Access in Red Willow County
Computing Device Access in Red Willow County
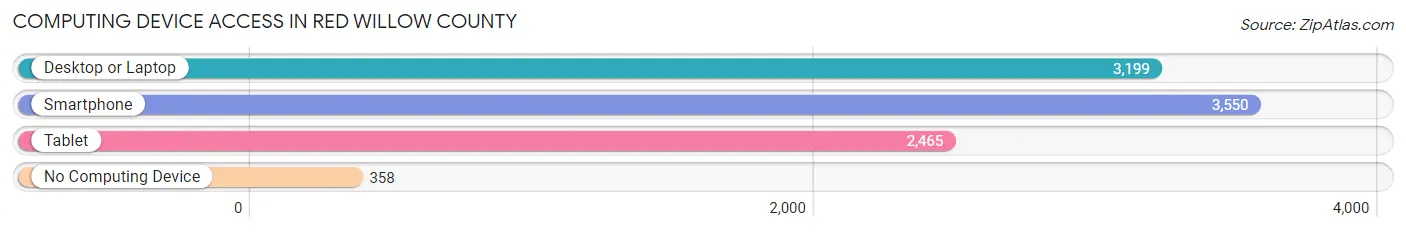
| Device Type | # Households | % Households |
| Desktop or Laptop | 3,199 | 74.1% |
| Smartphone | 3,550 | 82.3% |
| Tablet | 2,465 | 57.1% |
| No Computing Device | 358 | 8.3% |
| Total | 4,315 | 100.0% |
Internet Access in Red Willow County
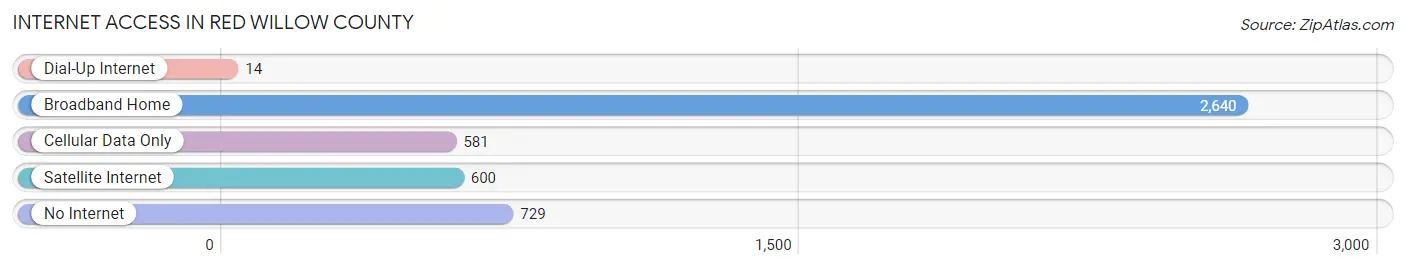
| Internet Type | # Households | % Households |
| Dial-Up Internet | 14 | 0.3% |
| Broadband Home | 2,640 | 61.2% |
| Cellular Data Only | 581 | 13.5% |
| Satellite Internet | 600 | 13.9% |
| No Internet | 729 | 16.9% |
| Total | 4,315 | 100.0% |
Red Willow County Summary
Willow County is located in the south-central part of Nebraska, and is bordered by Frontier, Hayes, Hitchcock, and Furnas counties. The county seat is McCook, and the county was named after the red willow trees that grow along the Republican River. The county has a total area of 845 square miles, and a population of 6,814 as of the 2010 census.
History
Willow County was established in 1873, and was named after the red willow trees that grew along the Republican River. The county was originally part of the Nebraska Territory, and was part of the original land grant given to the Union Pacific Railroad in 1867. The county was organized in 1873, and the first county seat was located in the town of Red Willow. In 1876, the county seat was moved to the town of McCook, which is still the county seat today.
The county was largely agricultural in its early years, and the main crops grown were wheat, corn, and hay. The county also had a thriving livestock industry, with cattle, sheep, and hogs being the main animals raised. The county also had a number of small businesses, including a flour mill, a creamery, and a brickyard.
Geography
Willow County is located in the south-central part of Nebraska, and is bordered by Frontier, Hayes, Hitchcock, and Furnas counties. The county has a total area of 845 square miles, and is mostly flat, with some rolling hills in the western part of the county. The Republican River runs through the county, and there are several small lakes and ponds scattered throughout the county. The county is mostly rural, with the majority of the population living in small towns and villages.
Economy
Willow County is largely agricultural, with the main crops being corn, wheat, and hay. The county also has a thriving livestock industry, with cattle, sheep, and hogs being the main animals raised. The county also has a number of small businesses, including a flour mill, a creamery, and a brickyard.
Demographics
As of the 2010 census, Willow County had a population of 6,814. The racial makeup of the county was 95.3% White, 0.7% African American, 0.4% Native American, 0.3% Asian, 0.1% Pacific Islander, 1.7% from other races, and 1.4% from two or more races. Hispanic or Latino of any race were 4.2% of the population.
The median income for a household in the county was $41,945, and the median income for a family was $50,938. The per capita income for the county was $20,845. About 8.7% of families and 11.3% of the population were below the poverty line, including 14.2% of those under age 18 and 8.2% of those age 65 or over.
Common Questions
What is Per Capita Income in Red Willow County?
Per Capita income in Red Willow County is $34,401.
What is the Median Family Income in Red Willow County?
Median Family Income in Red Willow County is $82,741.
What is the Median Household income in Red Willow County?
Median Household Income in Red Willow County is $58,344.
What is Income or Wage Gap in Red Willow County?
Income or Wage Gap in Red Willow County is 35.9%.
Women in Red Willow County earn 64.1 cents for every dollar earned by a man.
What is Inequality or Gini Index in Red Willow County?
Inequality or Gini Index in Red Willow County is 0.47.
What is the Total Population of Red Willow County?
Total Population of Red Willow County is 10,690.
What is the Total Male Population of Red Willow County?
Total Male Population of Red Willow County is 5,224.
What is the Total Female Population of Red Willow County?
Total Female Population of Red Willow County is 5,466.
What is the Ratio of Males per 100 Females in Red Willow County?
There are 95.57 Males per 100 Females in Red Willow County.
What is the Ratio of Females per 100 Males in Red Willow County?
There are 104.63 Females per 100 Males in Red Willow County.
What is the Median Population Age in Red Willow County?
Median Population Age in Red Willow County is 41.5 Years.
What is the Average Family Size in Red Willow County
Average Family Size in Red Willow County is 3.3 People.
What is the Average Household Size in Red Willow County
Average Household Size in Red Willow County is 2.4 People.
How Large is the Labor Force in Red Willow County?
There are 5,501 People in the Labor Forcein in Red Willow County.
What is the Percentage of People in the Labor Force in Red Willow County?
62.8% of People are in the Labor Force in Red Willow County.
What is the Unemployment Rate in Red Willow County?
Unemployment Rate in Red Willow County is 2.3%.