Phelps County, NE Map & Demographics
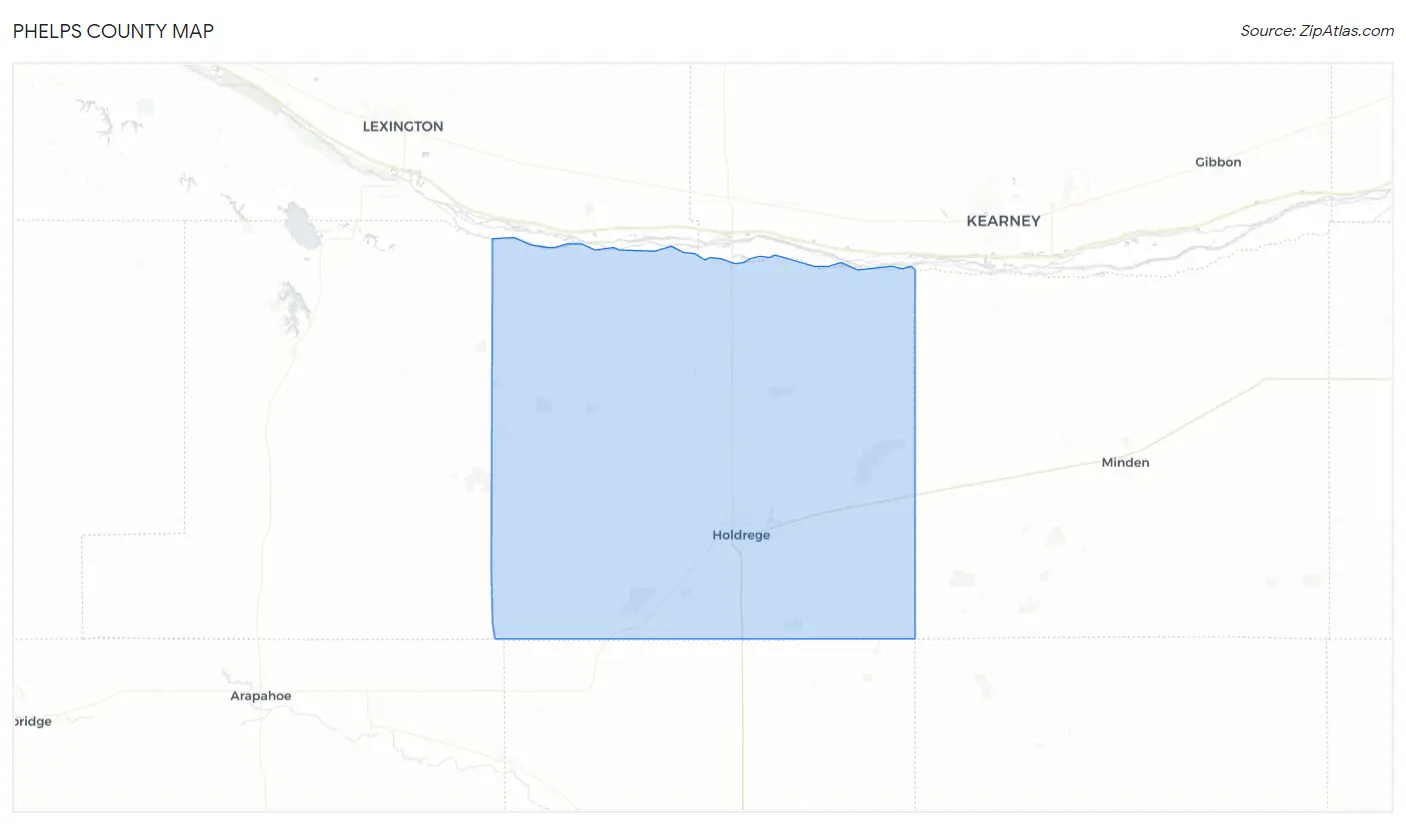
Phelps County Map
Phelps County Overview
$38,930
PER CAPITA INCOME
$91,111
AVG FAMILY INCOME
$65,114
AVG HOUSEHOLD INCOME
28.1%
WAGE / INCOME GAP [ % ]
71.9¢/ $1
WAGE / INCOME GAP [ $ ]
$9,894
FAMILY INCOME DEFICIT
0.50
INEQUALITY / GINI INDEX
8,966
TOTAL POPULATION
4,574
MALE POPULATION
4,392
FEMALE POPULATION
104.14
MALES / 100 FEMALES
96.02
FEMALES / 100 MALES
40.4
MEDIAN AGE
2.9
AVG FAMILY SIZE
2.3
AVG HOUSEHOLD SIZE
4,557
LABOR FORCE [ PEOPLE ]
64.9%
PERCENT IN LABOR FORCE
0.8%
UNEMPLOYMENT RATE
Phelps County Area Codes
Income in Phelps County
Income Overview in Phelps County
Per Capita Income in Phelps County is $38,930, while median incomes of families and households are $91,111 and $65,114 respectively.
| Characteristic | Number | Measure |
| Per Capita Income | 8,966 | $38,930 |
| Median Family Income | 2,320 | $91,111 |
| Mean Family Income | 2,320 | $108,952 |
| Median Household Income | 3,805 | $65,114 |
| Mean Household Income | 3,805 | $89,530 |
| Income Deficit | 2,320 | $9,894 |
| Wage / Income Gap (%) | 8,966 | 28.07% |
| Wage / Income Gap ($) | 8,966 | 71.93¢ per $1 |
| Gini / Inequality Index | 8,966 | 0.50 |
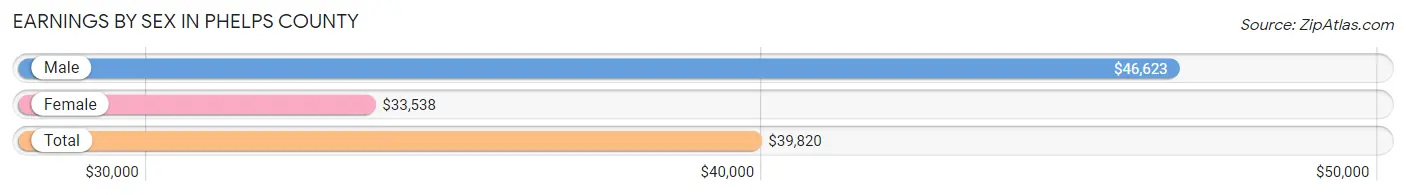
Earnings by Sex in Phelps County
Average Earnings in Phelps County are $39,820, $46,623 for men and $33,538 for women, a difference of 28.1%.
| Sex | Number | Average Earnings |
| Male | 2,655 (53.3%) | $46,623 |
| Female | 2,324 (46.7%) | $33,538 |
| Total | 4,979 (100.0%) | $39,820 |
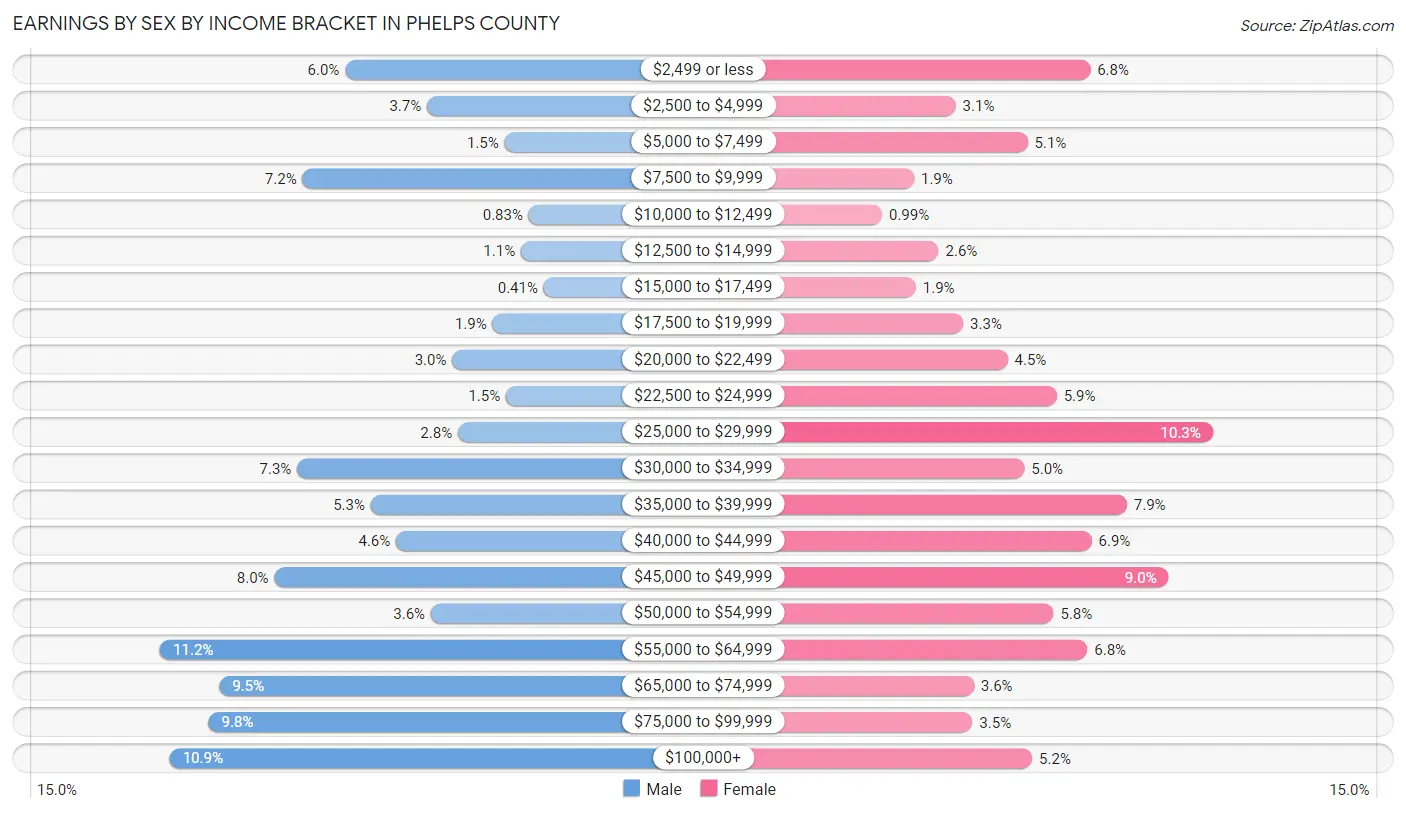
Earnings by Sex by Income Bracket in Phelps County
The most common earnings brackets in Phelps County are $55,000 to $64,999 for men (297 | 11.2%) and $25,000 to $29,999 for women (239 | 10.3%).
| Income | Male | Female |
| $2,499 or less | 159 (6.0%) | 159 (6.8%) |
| $2,500 to $4,999 | 98 (3.7%) | 71 (3.1%) |
| $5,000 to $7,499 | 40 (1.5%) | 118 (5.1%) |
| $7,500 to $9,999 | 191 (7.2%) | 44 (1.9%) |
| $10,000 to $12,499 | 22 (0.8%) | 23 (1.0%) |
| $12,500 to $14,999 | 28 (1.1%) | 60 (2.6%) |
| $15,000 to $17,499 | 11 (0.4%) | 45 (1.9%) |
| $17,500 to $19,999 | 49 (1.8%) | 76 (3.3%) |
| $20,000 to $22,499 | 79 (3.0%) | 105 (4.5%) |
| $22,500 to $24,999 | 39 (1.5%) | 137 (5.9%) |
| $25,000 to $29,999 | 75 (2.8%) | 239 (10.3%) |
| $30,000 to $34,999 | 195 (7.3%) | 116 (5.0%) |
| $35,000 to $39,999 | 140 (5.3%) | 183 (7.9%) |
| $40,000 to $44,999 | 121 (4.6%) | 160 (6.9%) |
| $45,000 to $49,999 | 212 (8.0%) | 210 (9.0%) |
| $50,000 to $54,999 | 95 (3.6%) | 135 (5.8%) |
| $55,000 to $64,999 | 297 (11.2%) | 157 (6.8%) |
| $65,000 to $74,999 | 253 (9.5%) | 83 (3.6%) |
| $75,000 to $99,999 | 261 (9.8%) | 82 (3.5%) |
| $100,000+ | 290 (10.9%) | 121 (5.2%) |
| Total | 2,655 (100.0%) | 2,324 (100.0%) |
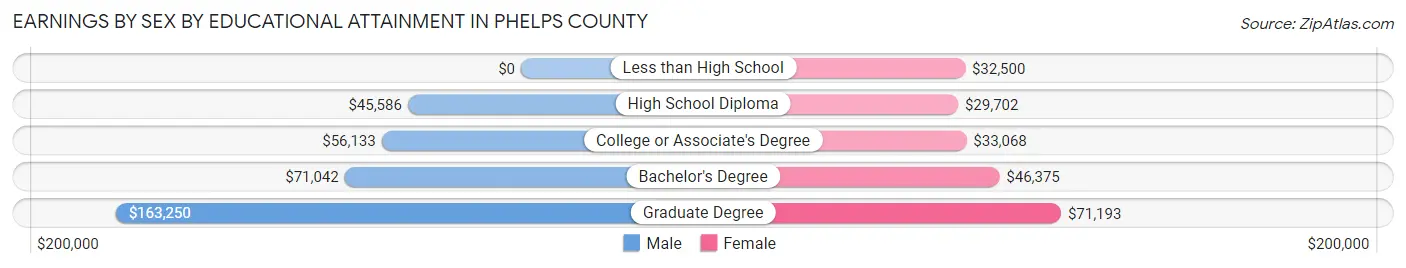
Earnings by Sex by Educational Attainment in Phelps County
Average earnings in Phelps County are $53,211 for men and $38,364 for women, a difference of 27.9%. Men with an educational attainment of graduate degree enjoy the highest average annual earnings of $163,250, while those with high school diploma education earn the least with $45,586. Women with an educational attainment of graduate degree earn the most with the average annual earnings of $71,193, while those with high school diploma education have the smallest earnings of $29,702.
| Educational Attainment | Male Income | Female Income |
| Less than High School | - | - |
| High School Diploma | $45,586 | $29,702 |
| College or Associate's Degree | $56,133 | $33,068 |
| Bachelor's Degree | $71,042 | $46,375 |
| Graduate Degree | $163,250 | $71,193 |
| Total | $53,211 | $38,364 |
Family Income in Phelps County
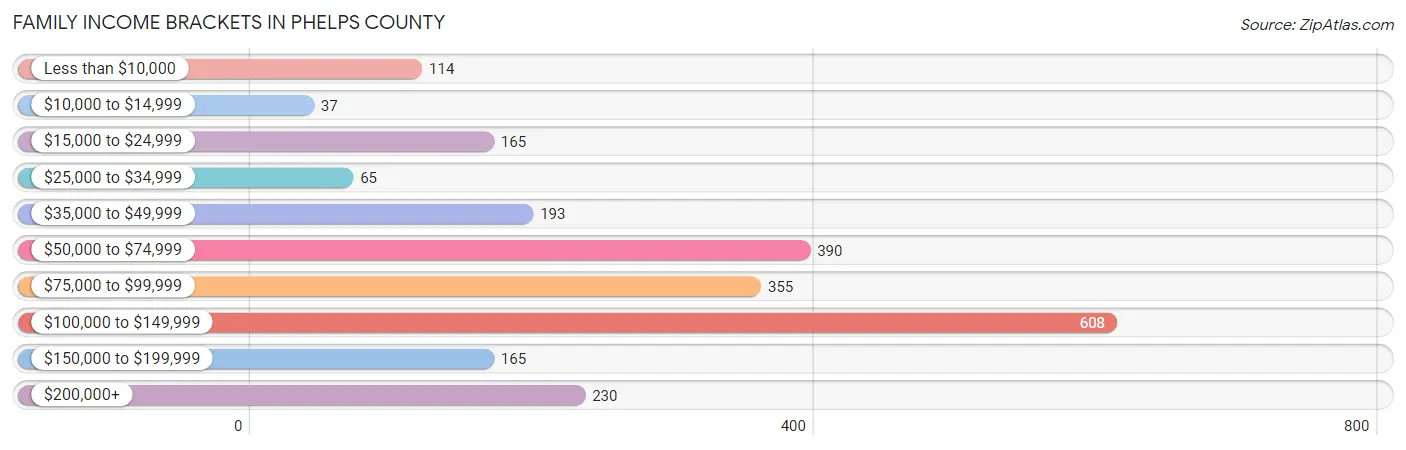
Family Income Brackets in Phelps County
According to the Phelps County family income data, there are 608 families falling into the $100,000 to $149,999 income range, which is the most common income bracket and makes up 26.2% of all families. Conversely, the $10,000 to $14,999 income bracket is the least frequent group with only 37 families (1.6%) belonging to this category.
| Income Bracket | # Families | % Families |
| Less than $10,000 | 114 | 4.9% |
| $10,000 to $14,999 | 37 | 1.6% |
| $15,000 to $24,999 | 165 | 7.1% |
| $25,000 to $34,999 | 65 | 2.8% |
| $35,000 to $49,999 | 193 | 8.3% |
| $50,000 to $74,999 | 390 | 16.8% |
| $75,000 to $99,999 | 355 | 15.3% |
| $100,000 to $149,999 | 608 | 26.2% |
| $150,000 to $199,999 | 165 | 7.1% |
| $200,000+ | 230 | 9.9% |
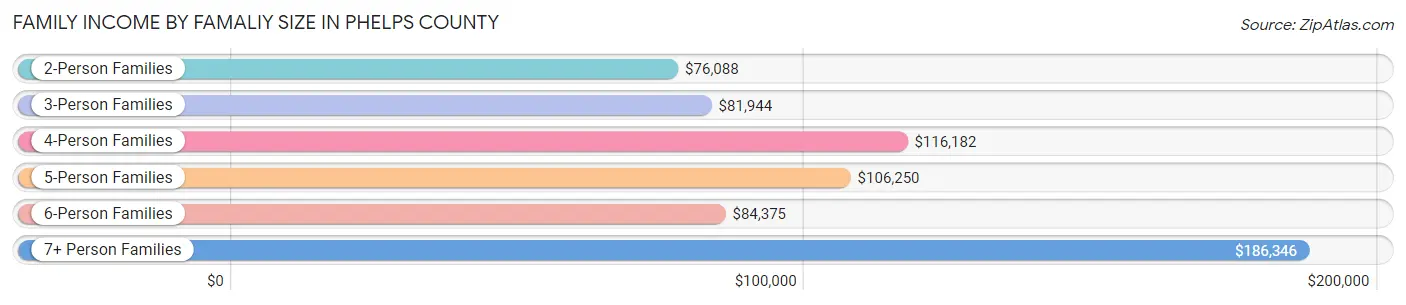
Family Income by Famaliy Size in Phelps County
7+ person families (20 | 0.9%) account for the highest median family income in Phelps County with $186,346 per family, while 2-person families (1,193 | 51.4%) have the highest median income of $38,044 per family member.
| Income Bracket | # Families | Median Income |
| 2-Person Families | 1,193 (51.4%) | $76,088 |
| 3-Person Families | 402 (17.3%) | $81,944 |
| 4-Person Families | 348 (15.0%) | $116,182 |
| 5-Person Families | 310 (13.4%) | $106,250 |
| 6-Person Families | 47 (2.0%) | $84,375 |
| 7+ Person Families | 20 (0.9%) | $186,346 |
| Total | 2,320 (100.0%) | $91,111 |
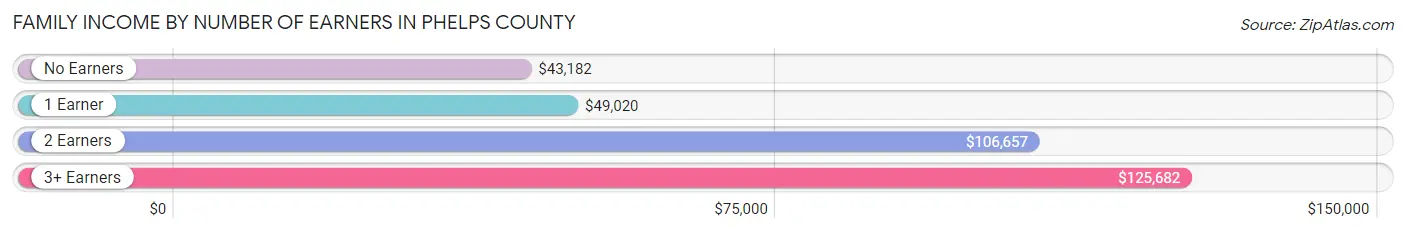
Family Income by Number of Earners in Phelps County
The median family income in Phelps County is $91,111, with families comprising 3+ earners (228) having the highest median family income of $125,682, while families with no earners (340) have the lowest median family income of $43,182, accounting for 9.8% and 14.7% of families, respectively.
| Number of Earners | # Families | Median Income |
| No Earners | 340 (14.7%) | $43,182 |
| 1 Earner | 549 (23.7%) | $49,020 |
| 2 Earners | 1,203 (51.8%) | $106,657 |
| 3+ Earners | 228 (9.8%) | $125,682 |
| Total | 2,320 (100.0%) | $91,111 |
Household Income in Phelps County
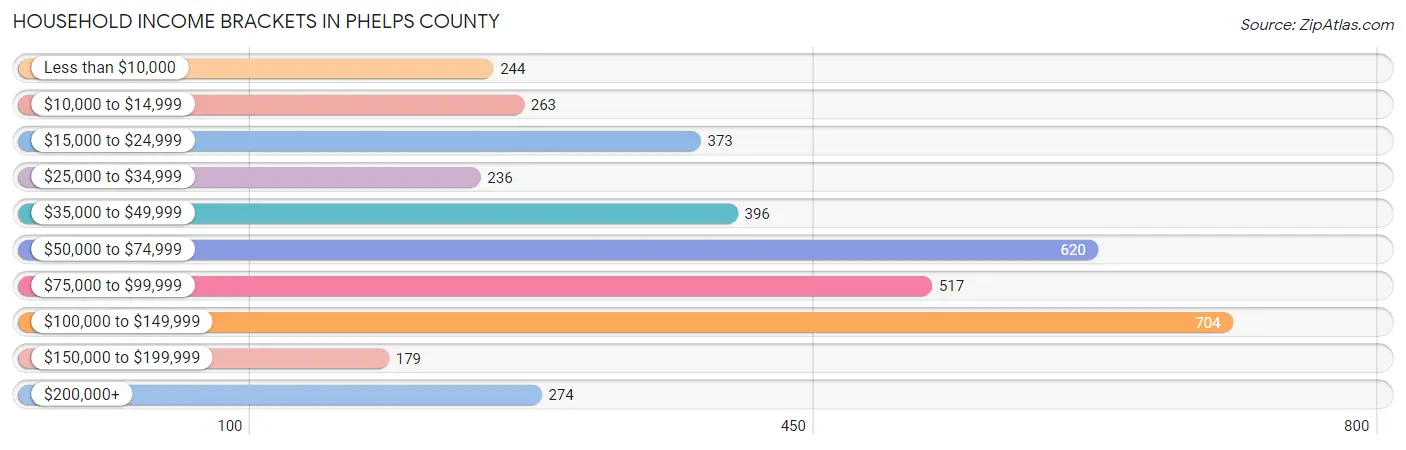
Household Income Brackets in Phelps County
With 704 households falling in the category, the $100,000 to $149,999 income range is the most frequent in Phelps County, accounting for 18.5% of all households. In contrast, only 179 households (4.7%) fall into the $150,000 to $199,999 income bracket, making it the least populous group.
| Income Bracket | # Households | % Households |
| Less than $10,000 | 244 | 6.4% |
| $10,000 to $14,999 | 263 | 6.9% |
| $15,000 to $24,999 | 373 | 9.8% |
| $25,000 to $34,999 | 236 | 6.2% |
| $35,000 to $49,999 | 396 | 10.4% |
| $50,000 to $74,999 | 620 | 16.3% |
| $75,000 to $99,999 | 517 | 13.6% |
| $100,000 to $149,999 | 704 | 18.5% |
| $150,000 to $199,999 | 179 | 4.7% |
| $200,000+ | 274 | 7.2% |
Household Income by Householder Age in Phelps County
The median household income in Phelps County is $65,114, with the highest median household income of $90,469 found in the 25 to 44 years age bracket for the primary householder. A total of 1,064 households (28.0%) fall into this category. Meanwhile, the 15 to 24 years age bracket for the primary householder has the lowest median household income of $37,944, with 277 households (7.3%) in this group.
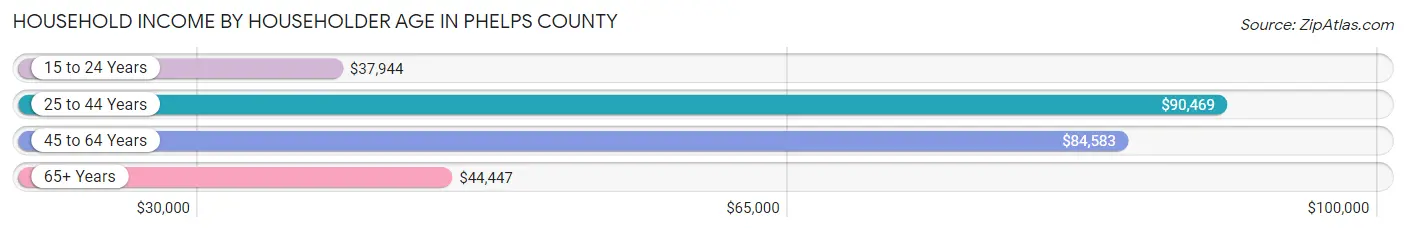
| Income Bracket | # Households | Median Income |
| 15 to 24 Years | 277 (7.3%) | $37,944 |
| 25 to 44 Years | 1,064 (28.0%) | $90,469 |
| 45 to 64 Years | 1,325 (34.8%) | $84,583 |
| 65+ Years | 1,139 (29.9%) | $44,447 |
| Total | 3,805 (100.0%) | $65,114 |
Poverty in Phelps County
Income Below Poverty by Sex and Age in Phelps County
With 15.3% poverty level for males and 13.7% for females among the residents of Phelps County, 6 to 11 year old males and 18 to 24 year old females are the most vulnerable to poverty, with 142 males (31.6%) and 76 females (25.5%) in their respective age groups living below the poverty level.
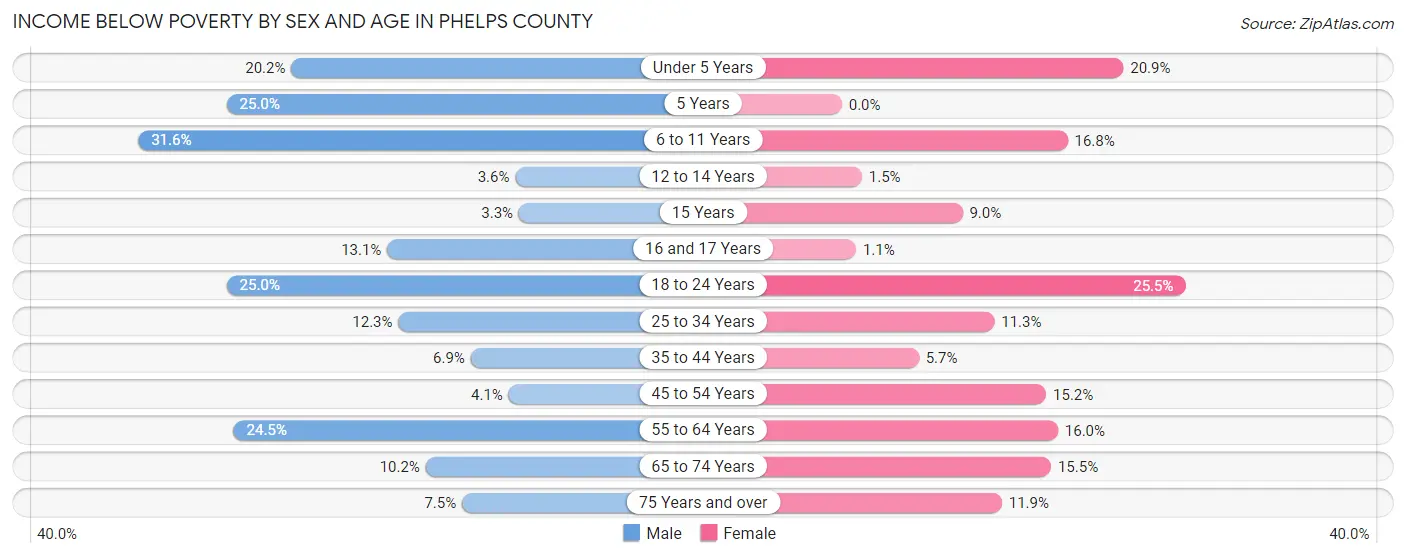
| Age Bracket | Male | Female |
| Under 5 Years | 60 (20.2%) | 51 (20.9%) |
| 5 Years | 13 (25.0%) | 0 (0.0%) |
| 6 to 11 Years | 142 (31.6%) | 63 (16.8%) |
| 12 to 14 Years | 5 (3.6%) | 2 (1.5%) |
| 15 Years | 3 (3.3%) | 6 (9.0%) |
| 16 and 17 Years | 14 (13.1%) | 1 (1.1%) |
| 18 to 24 Years | 105 (25.0%) | 76 (25.5%) |
| 25 to 34 Years | 61 (12.2%) | 55 (11.3%) |
| 35 to 44 Years | 36 (6.9%) | 28 (5.7%) |
| 45 to 54 Years | 20 (4.1%) | 76 (15.2%) |
| 55 to 64 Years | 152 (24.5%) | 94 (16.0%) |
| 65 to 74 Years | 46 (10.2%) | 68 (15.5%) |
| 75 Years and over | 23 (7.5%) | 57 (11.9%) |
| Total | 680 (15.3%) | 577 (13.7%) |
Income Above Poverty by Sex and Age in Phelps County
According to the poverty statistics in Phelps County, males aged 15 years and females aged 5 years are the age groups that are most secure financially, with 96.7% of males and 100.0% of females in these age groups living above the poverty line.
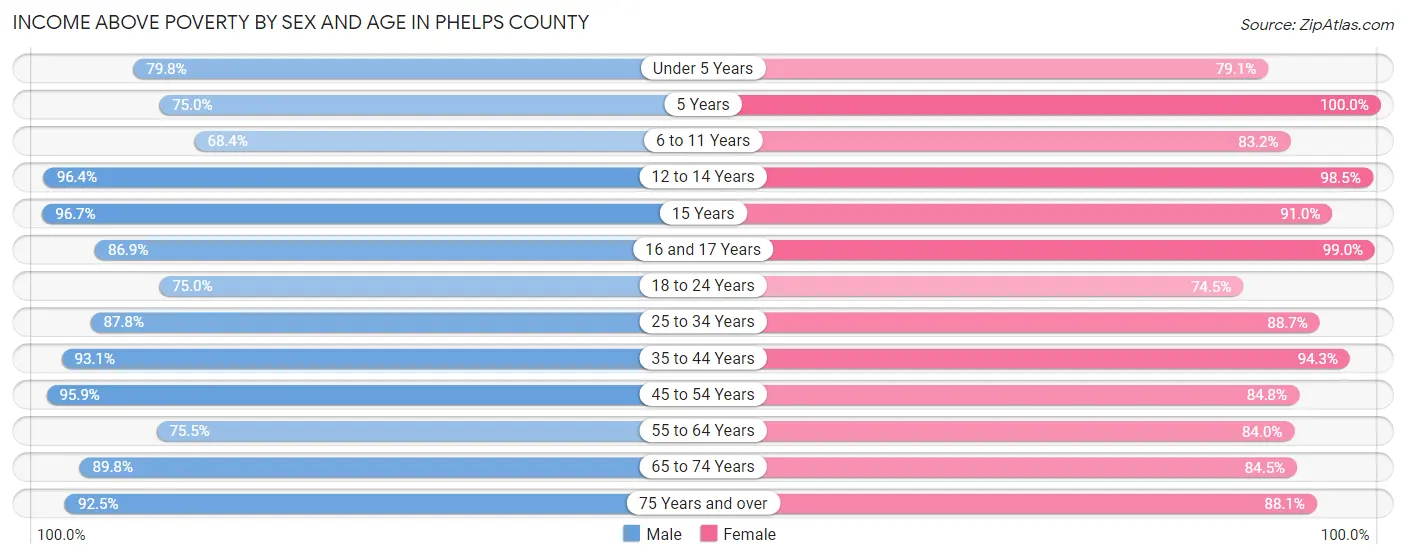
| Age Bracket | Male | Female |
| Under 5 Years | 237 (79.8%) | 193 (79.1%) |
| 5 Years | 39 (75.0%) | 30 (100.0%) |
| 6 to 11 Years | 308 (68.4%) | 313 (83.2%) |
| 12 to 14 Years | 135 (96.4%) | 132 (98.5%) |
| 15 Years | 88 (96.7%) | 61 (91.0%) |
| 16 and 17 Years | 93 (86.9%) | 94 (99.0%) |
| 18 to 24 Years | 315 (75.0%) | 222 (74.5%) |
| 25 to 34 Years | 437 (87.7%) | 431 (88.7%) |
| 35 to 44 Years | 487 (93.1%) | 462 (94.3%) |
| 45 to 54 Years | 473 (95.9%) | 425 (84.8%) |
| 55 to 64 Years | 469 (75.5%) | 492 (84.0%) |
| 65 to 74 Years | 404 (89.8%) | 370 (84.5%) |
| 75 Years and over | 283 (92.5%) | 423 (88.1%) |
| Total | 3,768 (84.7%) | 3,648 (86.3%) |
Income Below Poverty Among Married-Couple Families in Phelps County
The poverty statistics for married-couple families in Phelps County show that 6.2% or 119 of the total 1,916 families live below the poverty line. Families with no children have the highest poverty rate of 6.9%, comprising of 78 families. On the other hand, families with 5 or more children have the lowest poverty rate of 0.0%, which includes 0 families.
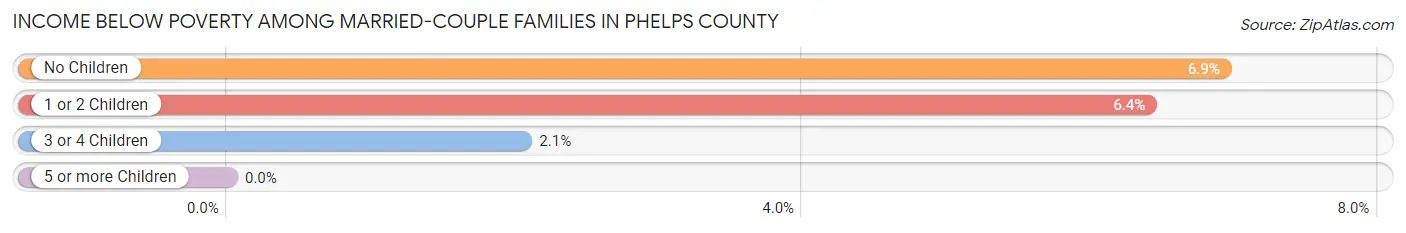
| Children | Above Poverty | Below Poverty |
| No Children | 1,049 (93.1%) | 78 (6.9%) |
| 1 or 2 Children | 541 (93.6%) | 37 (6.4%) |
| 3 or 4 Children | 191 (98.0%) | 4 (2.1%) |
| 5 or more Children | 16 (100.0%) | 0 (0.0%) |
| Total | 1,797 (93.8%) | 119 (6.2%) |
Income Below Poverty Among Single-Parent Households in Phelps County
According to the poverty data in Phelps County, 45.1% or 124 single-father households and 44.2% or 57 single-mother households are living below the poverty line. Among single-father households, those with 3 or 4 children have the highest poverty rate, with 58 households (100.0%) experiencing poverty. Likewise, among single-mother households, those with 3 or 4 children have the highest poverty rate, with 28 households (87.5%) falling below the poverty line.
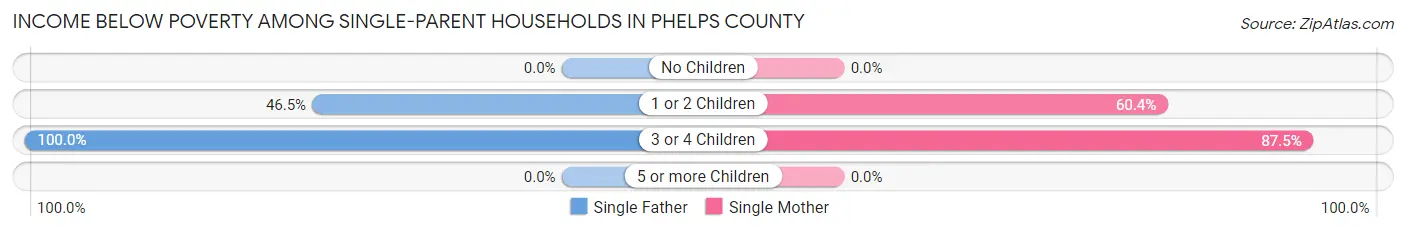
| Children | Single Father | Single Mother |
| No Children | 0 (0.0%) | 0 (0.0%) |
| 1 or 2 Children | 66 (46.5%) | 29 (60.4%) |
| 3 or 4 Children | 58 (100.0%) | 28 (87.5%) |
| 5 or more Children | 0 (0.0%) | 0 (0.0%) |
| Total | 124 (45.1%) | 57 (44.2%) |
Income Below Poverty Among Married-Couple vs Single-Parent Households in Phelps County
The poverty data for Phelps County shows that 119 of the married-couple family households (6.2%) and 181 of the single-parent households (44.8%) are living below the poverty level. Within the married-couple family households, those with no children have the highest poverty rate, with 78 households (6.9%) falling below the poverty line. Among the single-parent households, those with 3 or 4 children have the highest poverty rate, with 86 household (95.6%) living below poverty.
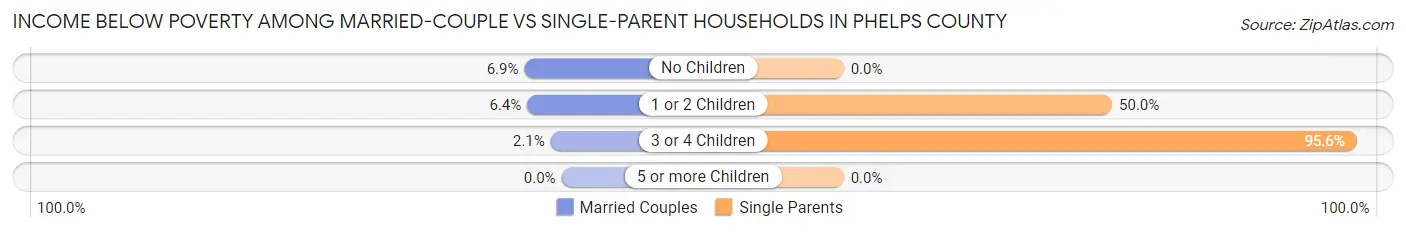
| Children | Married-Couple Families | Single-Parent Households |
| No Children | 78 (6.9%) | 0 (0.0%) |
| 1 or 2 Children | 37 (6.4%) | 95 (50.0%) |
| 3 or 4 Children | 4 (2.1%) | 86 (95.6%) |
| 5 or more Children | 0 (0.0%) | 0 (0.0%) |
| Total | 119 (6.2%) | 181 (44.8%) |
Race in Phelps County
The most populous races in Phelps County are White / Caucasian (8,351 | 93.1%), Hispanic or Latino (555 | 6.2%), and Two or more Races (437 | 4.9%).
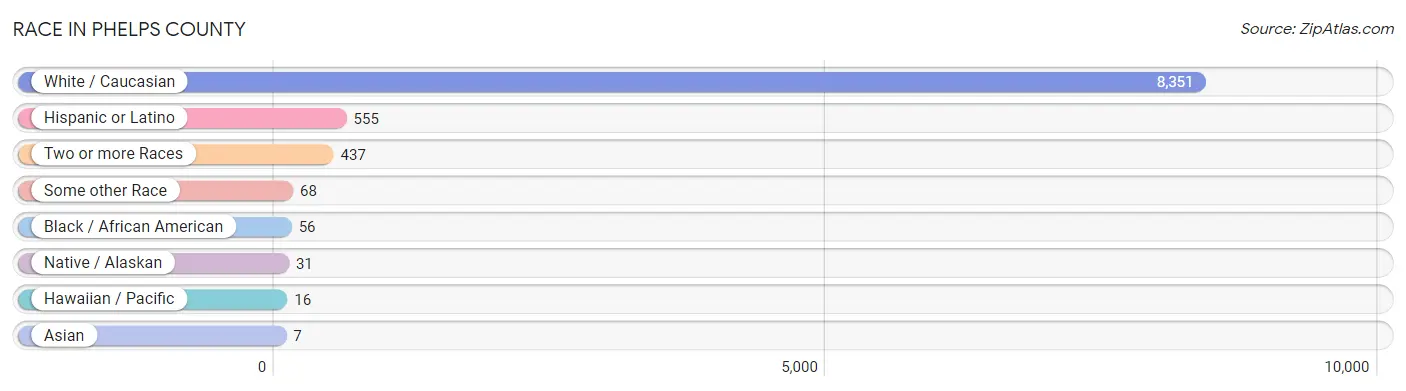
| Race | # Population | % Population |
| Asian | 7 | 0.1% |
| Black / African American | 56 | 0.6% |
| Hawaiian / Pacific | 16 | 0.2% |
| Hispanic or Latino | 555 | 6.2% |
| Native / Alaskan | 31 | 0.4% |
| White / Caucasian | 8,351 | 93.1% |
| Two or more Races | 437 | 4.9% |
| Some other Race | 68 | 0.8% |
| Total | 8,966 | 100.0% |
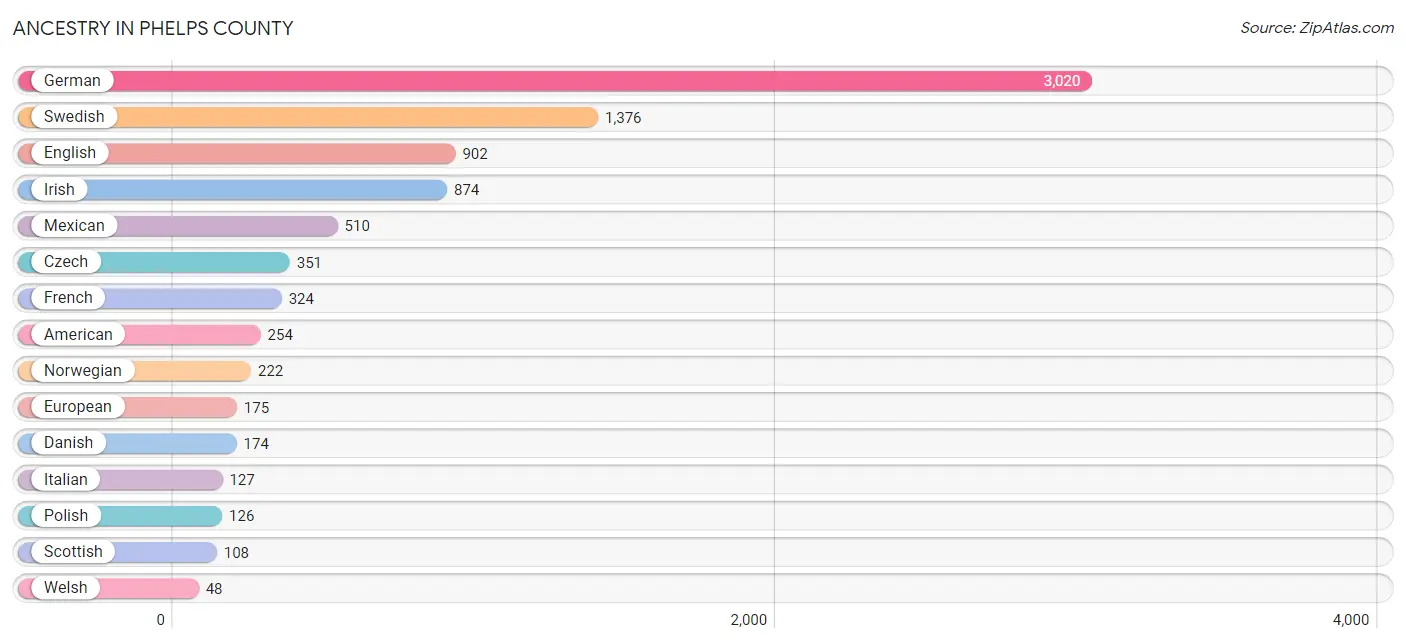
Ancestry in Phelps County
The most populous ancestries reported in Phelps County are German (3,020 | 33.7%), Swedish (1,376 | 15.3%), English (902 | 10.1%), Irish (874 | 9.8%), and Mexican (510 | 5.7%), together accounting for 74.5% of all Phelps County residents.
| Ancestry | # Population | % Population |
| American | 254 | 2.8% |
| Apache | 4 | 0.0% |
| Arab | 9 | 0.1% |
| Austrian | 1 | 0.0% |
| Belgian | 10 | 0.1% |
| Burmese | 10 | 0.1% |
| Central American | 2 | 0.0% |
| Cherokee | 7 | 0.1% |
| Creek | 16 | 0.2% |
| Czech | 351 | 3.9% |
| Danish | 174 | 1.9% |
| Dutch | 45 | 0.5% |
| Eastern European | 9 | 0.1% |
| English | 902 | 10.1% |
| European | 175 | 1.9% |
| French | 324 | 3.6% |
| French Canadian | 5 | 0.1% |
| German | 3,020 | 33.7% |
| Guamanian / Chamorro | 16 | 0.2% |
| Irish | 874 | 9.8% |
| Italian | 127 | 1.4% |
| Korean | 33 | 0.4% |
| Latvian | 14 | 0.2% |
| Lebanese | 9 | 0.1% |
| Mexican | 510 | 5.7% |
| Norwegian | 222 | 2.5% |
| Pennsylvania German | 5 | 0.1% |
| Polish | 126 | 1.4% |
| Portuguese | 11 | 0.1% |
| Potawatomi | 1 | 0.0% |
| Puerto Rican | 4 | 0.0% |
| Russian | 3 | 0.0% |
| Salvadoran | 2 | 0.0% |
| Samoan | 13 | 0.1% |
| Scandinavian | 13 | 0.1% |
| Scotch-Irish | 35 | 0.4% |
| Scottish | 108 | 1.2% |
| Sioux | 37 | 0.4% |
| South African | 21 | 0.2% |
| Spaniard | 7 | 0.1% |
| Spanish American Indian | 1 | 0.0% |
| Subsaharan African | 21 | 0.2% |
| Swedish | 1,376 | 15.3% |
| Swiss | 13 | 0.1% |
| Ukrainian | 3 | 0.0% |
| Welsh | 48 | 0.5% | View All 46 Rows |
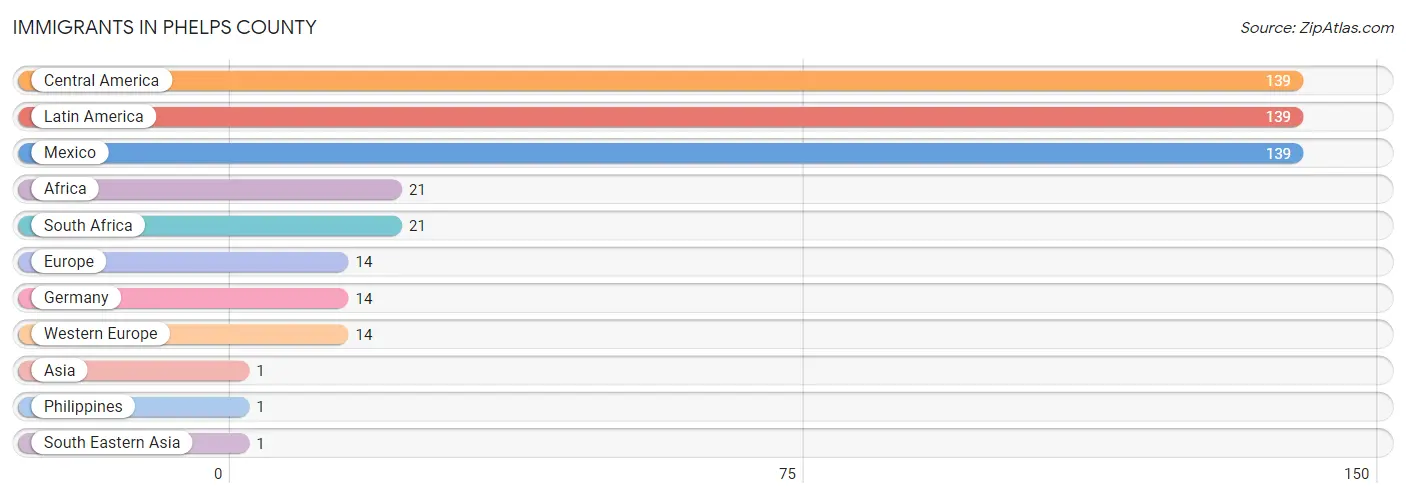
Immigrants in Phelps County
The most numerous immigrant groups reported in Phelps County came from Central America (139 | 1.5%), Latin America (139 | 1.5%), Mexico (139 | 1.5%), Africa (21 | 0.2%), and South Africa (21 | 0.2%), together accounting for 5.1% of all Phelps County residents.
| Immigration Origin | # Population | % Population |
| Africa | 21 | 0.2% |
| Asia | 1 | 0.0% |
| Central America | 139 | 1.5% |
| Europe | 14 | 0.2% |
| Germany | 14 | 0.2% |
| Latin America | 139 | 1.5% |
| Mexico | 139 | 1.5% |
| Philippines | 1 | 0.0% |
| South Africa | 21 | 0.2% |
| South Eastern Asia | 1 | 0.0% |
| Western Europe | 14 | 0.2% | View All 11 Rows |
Sex and Age in Phelps County
Sex and Age in Phelps County
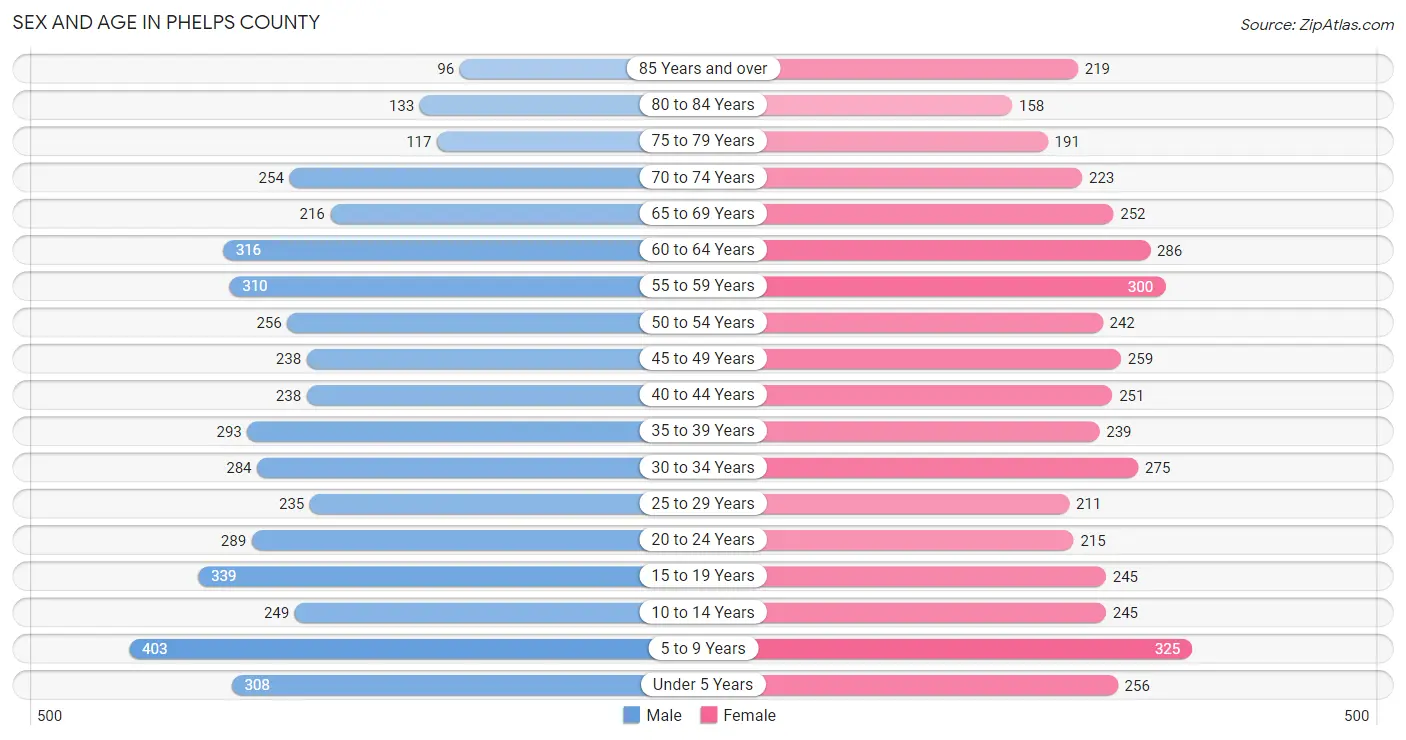
The most populous age groups in Phelps County are 5 to 9 Years (403 | 8.8%) for men and 5 to 9 Years (325 | 7.4%) for women.
| Age Bracket | Male | Female |
| Under 5 Years | 308 (6.7%) | 256 (5.8%) |
| 5 to 9 Years | 403 (8.8%) | 325 (7.4%) |
| 10 to 14 Years | 249 (5.4%) | 245 (5.6%) |
| 15 to 19 Years | 339 (7.4%) | 245 (5.6%) |
| 20 to 24 Years | 289 (6.3%) | 215 (4.9%) |
| 25 to 29 Years | 235 (5.1%) | 211 (4.8%) |
| 30 to 34 Years | 284 (6.2%) | 275 (6.3%) |
| 35 to 39 Years | 293 (6.4%) | 239 (5.4%) |
| 40 to 44 Years | 238 (5.2%) | 251 (5.7%) |
| 45 to 49 Years | 238 (5.2%) | 259 (5.9%) |
| 50 to 54 Years | 256 (5.6%) | 242 (5.5%) |
| 55 to 59 Years | 310 (6.8%) | 300 (6.8%) |
| 60 to 64 Years | 316 (6.9%) | 286 (6.5%) |
| 65 to 69 Years | 216 (4.7%) | 252 (5.7%) |
| 70 to 74 Years | 254 (5.6%) | 223 (5.1%) |
| 75 to 79 Years | 117 (2.6%) | 191 (4.3%) |
| 80 to 84 Years | 133 (2.9%) | 158 (3.6%) |
| 85 Years and over | 96 (2.1%) | 219 (5.0%) |
| Total | 4,574 (100.0%) | 4,392 (100.0%) |
Families and Households in Phelps County
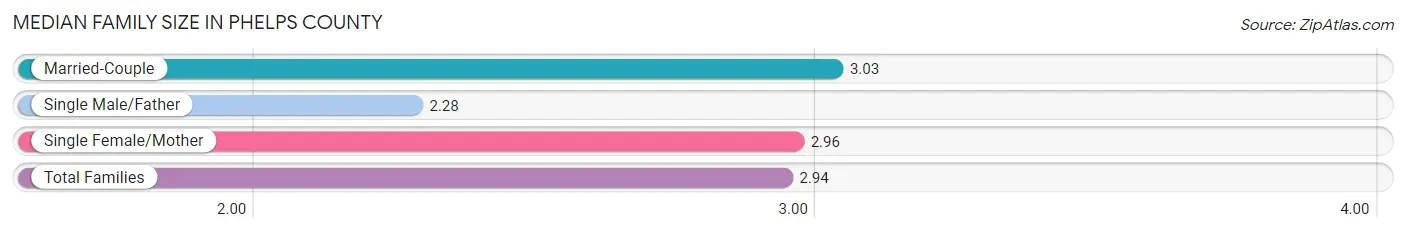
Median Family Size in Phelps County
The median family size in Phelps County is 2.94 persons per family, with married-couple families (1,916 | 82.6%) accounting for the largest median family size of 3.03 persons per family. On the other hand, single male/father families (275 | 11.8%) represent the smallest median family size with 2.28 persons per family.
| Family Type | # Families | Family Size |
| Married-Couple | 1,916 (82.6%) | 3.03 |
| Single Male/Father | 275 (11.8%) | 2.28 |
| Single Female/Mother | 129 (5.6%) | 2.96 |
| Total Families | 2,320 (100.0%) | 2.94 |
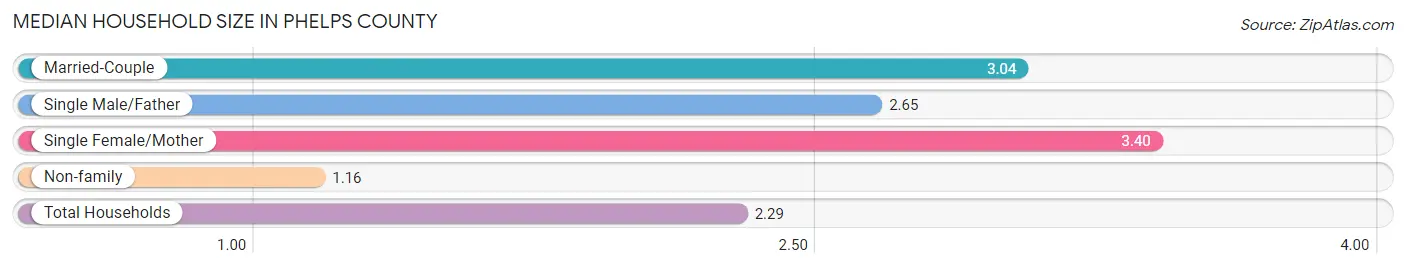
Median Household Size in Phelps County
The median household size in Phelps County is 2.29 persons per household, with single female/mother households (129 | 3.4%) accounting for the largest median household size of 3.4 persons per household. non-family households (1,485 | 39.0%) represent the smallest median household size with 1.16 persons per household.
| Household Type | # Households | Household Size |
| Married-Couple | 1,916 (50.3%) | 3.04 |
| Single Male/Father | 275 (7.2%) | 2.65 |
| Single Female/Mother | 129 (3.4%) | 3.40 |
| Non-family | 1,485 (39.0%) | 1.16 |
| Total Households | 3,805 (100.0%) | 2.29 |
Household Size by Marriage Status in Phelps County
Out of a total of 3,805 households in Phelps County, 2,320 (61.0%) are family households, while 1,485 (39.0%) are nonfamily households. The most numerous type of family households are 2-person households, comprising 1,108, and the most common type of nonfamily households are 1-person households, comprising 1,283.
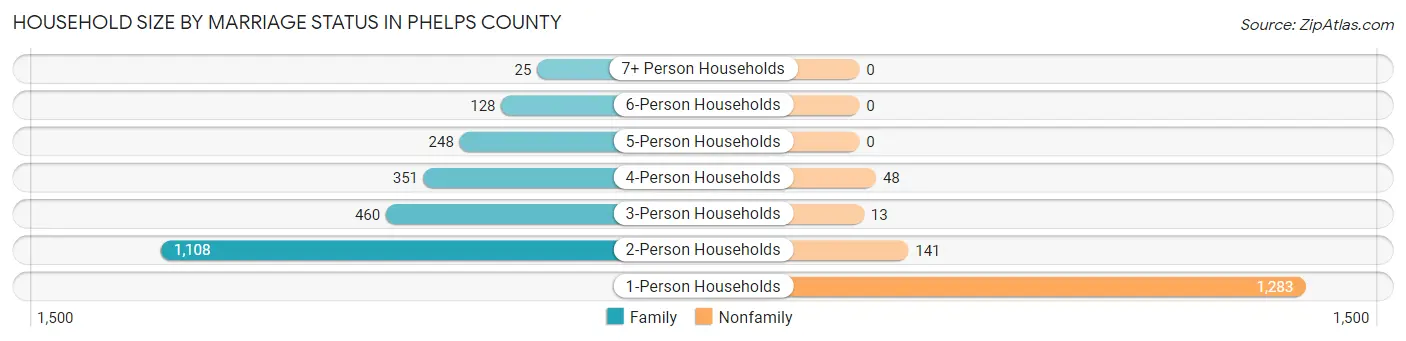
| Household Size | Family Households | Nonfamily Households |
| 1-Person Households | - | 1,283 (33.7%) |
| 2-Person Households | 1,108 (29.1%) | 141 (3.7%) |
| 3-Person Households | 460 (12.1%) | 13 (0.3%) |
| 4-Person Households | 351 (9.2%) | 48 (1.3%) |
| 5-Person Households | 248 (6.5%) | 0 (0.0%) |
| 6-Person Households | 128 (3.4%) | 0 (0.0%) |
| 7+ Person Households | 25 (0.7%) | 0 (0.0%) |
| Total | 2,320 (61.0%) | 1,485 (39.0%) |
Female Fertility in Phelps County
Fertility by Age in Phelps County
Average fertility rate in Phelps County is 130.0 births per 1,000 women. Women in the age bracket of 20 to 34 years have the highest fertility rate with 195.0 births per 1,000 women. Women in the age bracket of 20 to 34 years acount for 61.2% of all women with births.
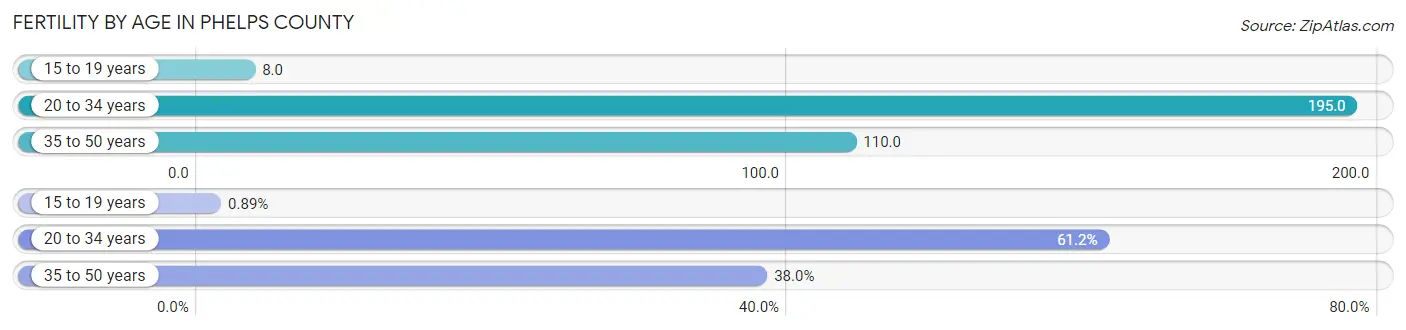
| Age Bracket | Women with Births | Births / 1,000 Women |
| 15 to 19 years | 2 (0.9%) | 8.0 |
| 20 to 34 years | 137 (61.2%) | 195.0 |
| 35 to 50 years | 85 (38.0%) | 110.0 |
| Total | 224 (100.0%) | 130.0 |
Fertility by Age by Marriage Status in Phelps County
74.6% of women with births (224) in Phelps County are married. The highest percentage of unmarried women with births falls into 15 to 19 years age bracket with 100.0% of them unmarried at the time of birth, while the lowest percentage of unmarried women with births belong to 35 to 50 years age bracket with 0.0% of them unmarried.
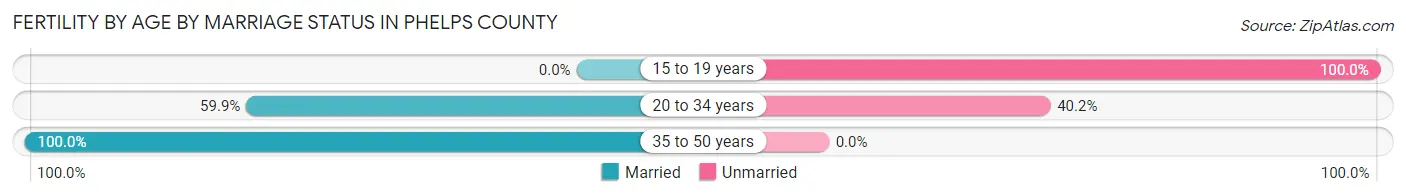
| Age Bracket | Married | Unmarried |
| 15 to 19 years | 0 (0.0%) | 2 (100.0%) |
| 20 to 34 years | 82 (59.9%) | 55 (40.2%) |
| 35 to 50 years | 85 (100.0%) | 0 (0.0%) |
| Total | 167 (74.6%) | 57 (25.5%) |
Fertility by Education in Phelps County
Average fertility rate in Phelps County is 130.0 births per 1,000 women. Women with the education attainment of college or associate's degree have the highest fertility rate of 169.0 births per 1,000 women, while women with the education attainment of graduate degree have the lowest fertility at 63.0 births per 1,000 women. Women with the education attainment of college or associate's degree represent 55.4% of all women with births.
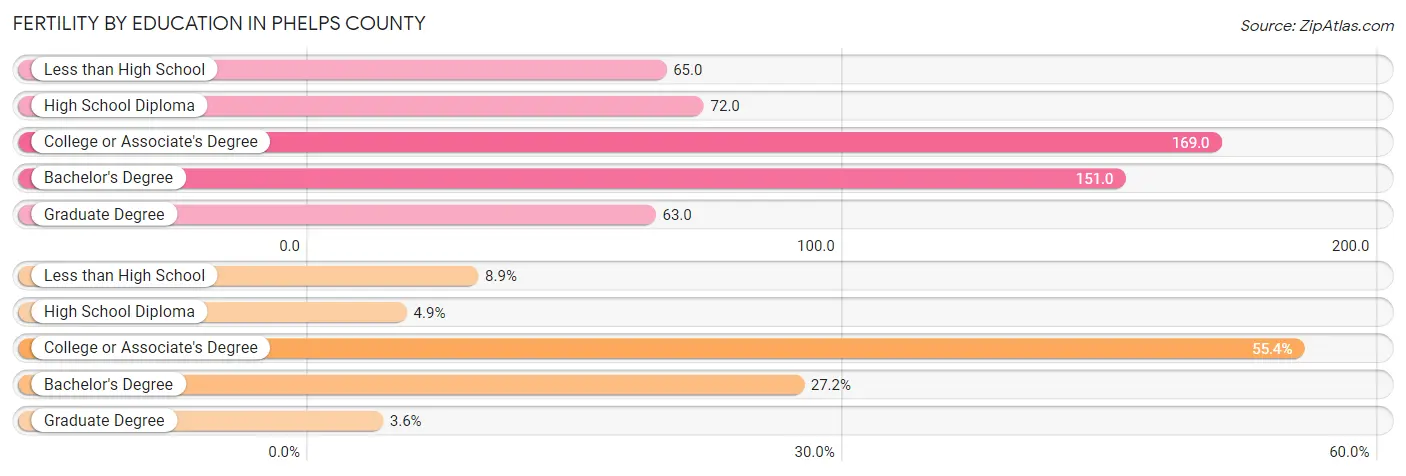
| Educational Attainment | Women with Births | Births / 1,000 Women |
| Less than High School | 20 (8.9%) | 65.0 |
| High School Diploma | 11 (4.9%) | 72.0 |
| College or Associate's Degree | 124 (55.4%) | 169.0 |
| Bachelor's Degree | 61 (27.2%) | 151.0 |
| Graduate Degree | 8 (3.6%) | 63.0 |
| Total | 224 (100.0%) | 130.0 |
Fertility by Education by Marriage Status in Phelps County
25.5% of women with births in Phelps County are unmarried. Women with the educational attainment of less than high school are most likely to be married with 100.0% of them married at childbirth, while women with the educational attainment of high school diploma are least likely to be married with 81.8% of them unmarried at childbirth.
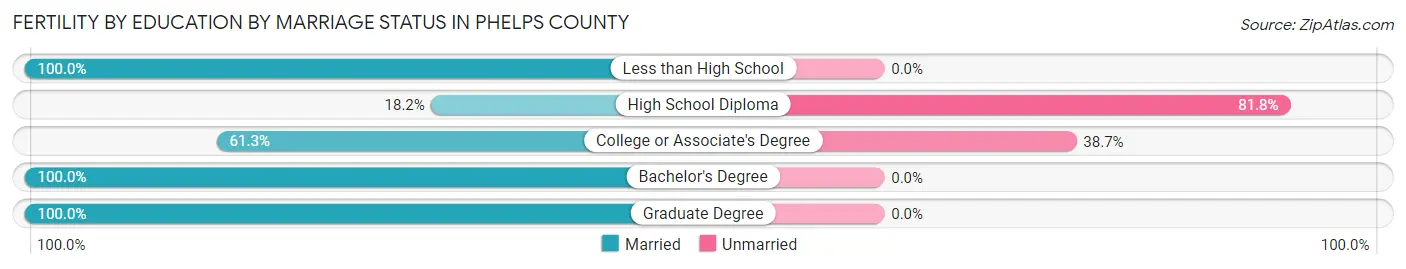
| Educational Attainment | Married | Unmarried |
| Less than High School | 20 (100.0%) | 0 (0.0%) |
| High School Diploma | 2 (18.2%) | 9 (81.8%) |
| College or Associate's Degree | 76 (61.3%) | 48 (38.7%) |
| Bachelor's Degree | 61 (100.0%) | 0 (0.0%) |
| Graduate Degree | 8 (100.0%) | 0 (0.0%) |
| Total | 167 (74.6%) | 57 (25.5%) |
Employment Characteristics in Phelps County
Employment by Class of Employer in Phelps County
Among the 4,446 employed individuals in Phelps County, private company employees (2,612 | 58.8%), local government employees (578 | 13.0%), and self-employed (not incorporated) (498 | 11.2%) make up the most common classes of employment.
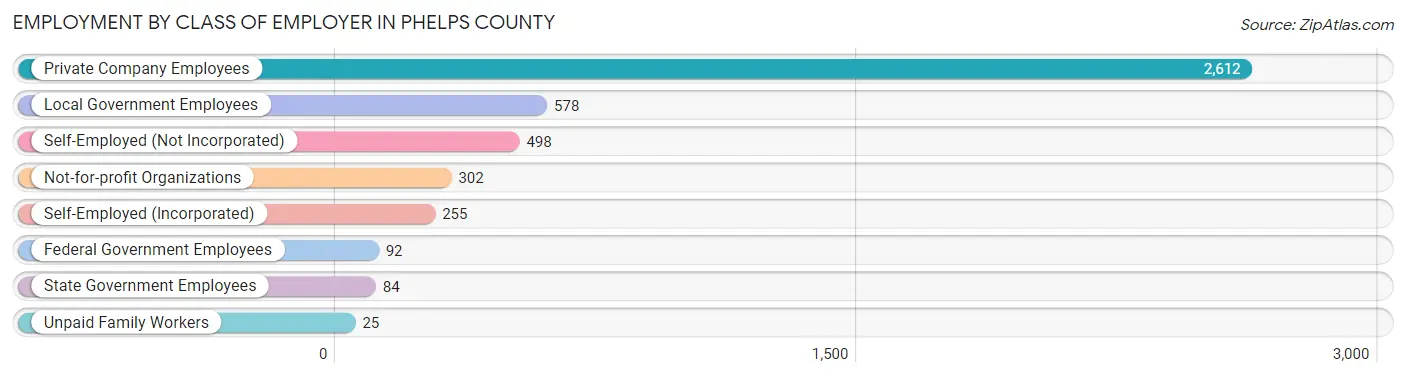
| Employer Class | # Employees | % Employees |
| Private Company Employees | 2,612 | 58.8% |
| Self-Employed (Incorporated) | 255 | 5.7% |
| Self-Employed (Not Incorporated) | 498 | 11.2% |
| Not-for-profit Organizations | 302 | 6.8% |
| Local Government Employees | 578 | 13.0% |
| State Government Employees | 84 | 1.9% |
| Federal Government Employees | 92 | 2.1% |
| Unpaid Family Workers | 25 | 0.6% |
| Total | 4,446 | 100.0% |
Employment Status by Age in Phelps County
According to the labor force statistics for Phelps County, out of the total population over 16 years of age (7,022), 64.9% or 4,557 individuals are in the labor force, with 0.8% or 36 of them unemployed. The age group with the highest labor force participation rate is 20 to 24 years, with 88.9% or 448 individuals in the labor force. Within the labor force, the 20 to 24 years age range has the highest percentage of unemployed individuals, with 4.0% or 18 of them being unemployed.
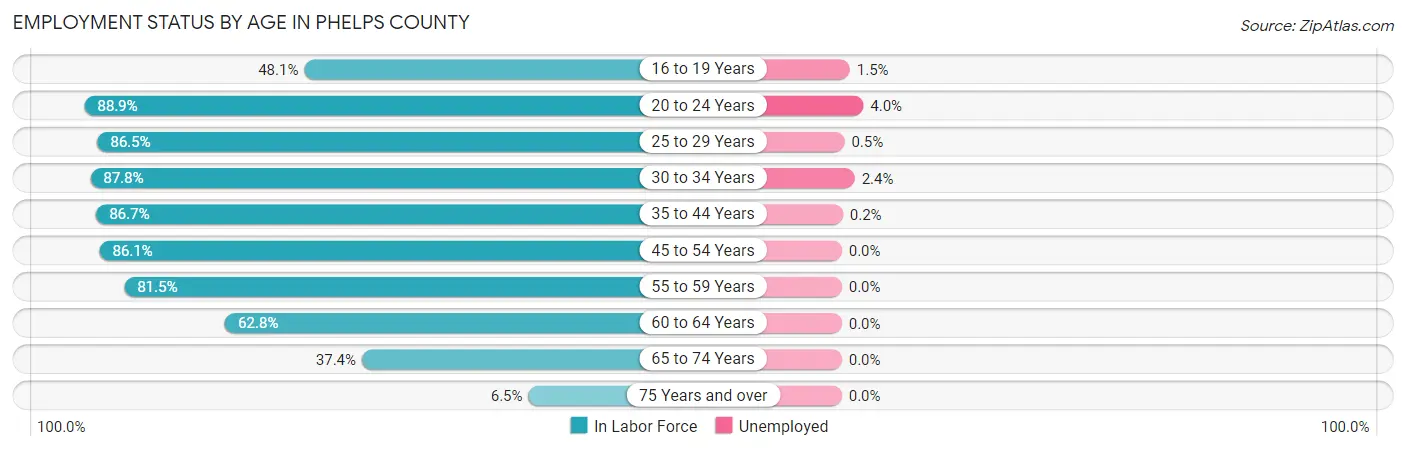
| Age Bracket | In Labor Force | Unemployed |
| 16 to 19 Years | 205 (48.1%) | 3 (1.5%) |
| 20 to 24 Years | 448 (88.9%) | 18 (4.0%) |
| 25 to 29 Years | 386 (86.5%) | 2 (0.5%) |
| 30 to 34 Years | 491 (87.8%) | 12 (2.4%) |
| 35 to 44 Years | 885 (86.7%) | 2 (0.2%) |
| 45 to 54 Years | 857 (86.1%) | 0 (0.0%) |
| 55 to 59 Years | 497 (81.5%) | 0 (0.0%) |
| 60 to 64 Years | 378 (62.8%) | 0 (0.0%) |
| 65 to 74 Years | 353 (37.4%) | 0 (0.0%) |
| 75 Years and over | 59 (6.5%) | 0 (0.0%) |
| Total | 4,557 (64.9%) | 36 (0.8%) |
Employment Status by Educational Attainment in Phelps County
According to labor force statistics for Phelps County, 82.5% of individuals (3,492) out of the total population between 25 and 64 years of age (4,233) are in the labor force, with 0.5% or 17 of them being unemployed. The group with the highest labor force participation rate are those with the educational attainment of college / associate degree, with 89.5% or 1,571 individuals in the labor force. Within the labor force, individuals with less than high school education have the highest percentage of unemployment, with 3.9% or 6 of them being unemployed.
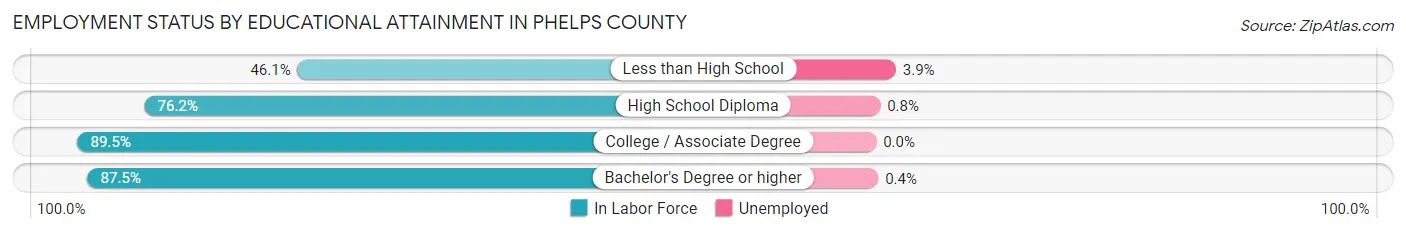
| Educational Attainment | In Labor Force | Unemployed |
| Less than High School | 154 (46.1%) | 13 (3.9%) |
| High School Diploma | 713 (76.2%) | 7 (0.8%) |
| College / Associate Degree | 1,571 (89.5%) | 0 (0.0%) |
| Bachelor's Degree or higher | 1,057 (87.5%) | 5 (0.4%) |
| Total | 3,492 (82.5%) | 21 (0.5%) |
Employment Occupations by Sex in Phelps County
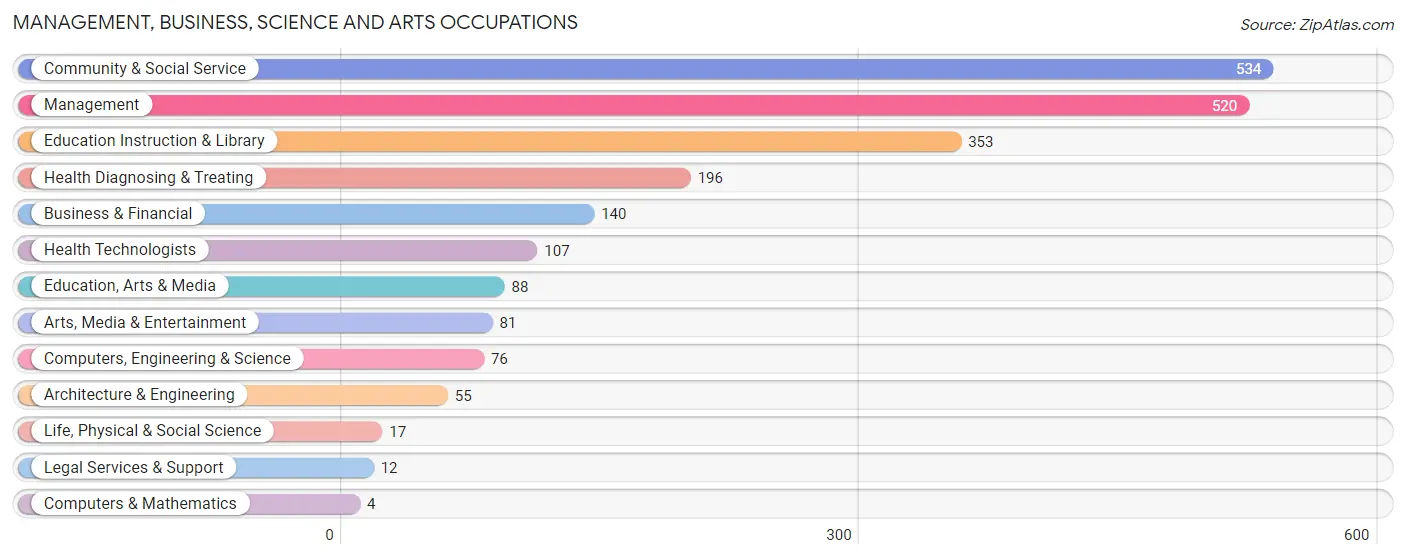
Management, Business, Science and Arts Occupations
The most common Management, Business, Science and Arts occupations in Phelps County are Community & Social Service (534 | 11.8%), Management (520 | 11.5%), Education Instruction & Library (353 | 7.8%), Health Diagnosing & Treating (196 | 4.3%), and Business & Financial (140 | 3.1%).
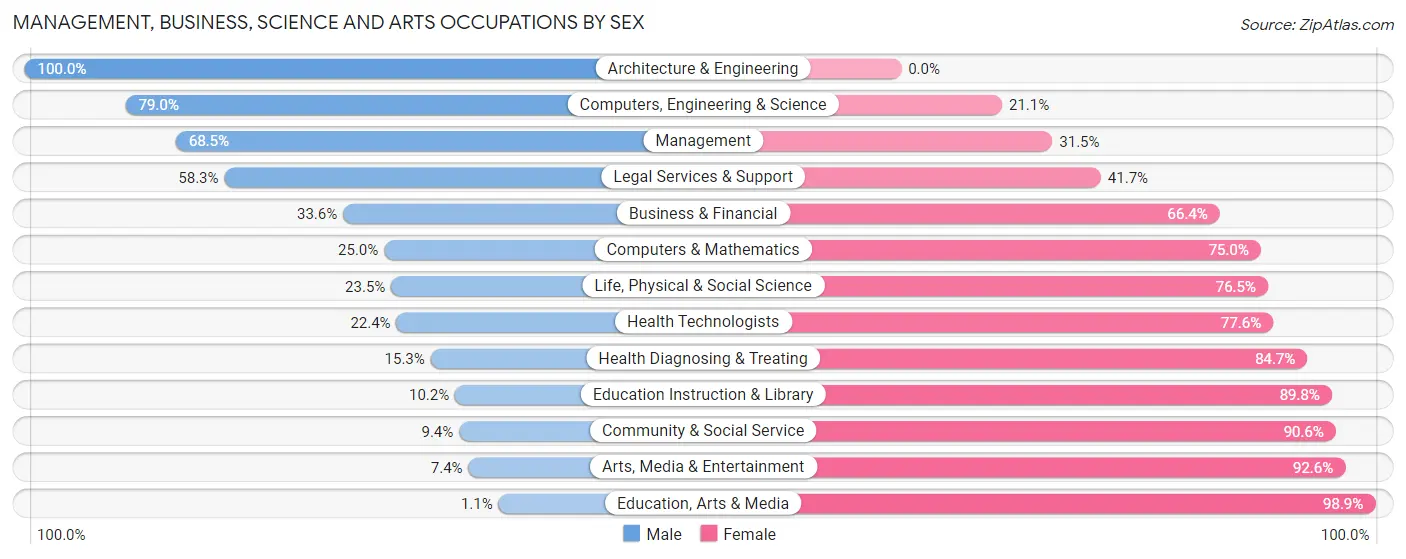
Management, Business, Science and Arts Occupations by Sex
Within the Management, Business, Science and Arts occupations in Phelps County, the most male-oriented occupations are Architecture & Engineering (100.0%), Computers, Engineering & Science (78.9%), and Management (68.5%), while the most female-oriented occupations are Education, Arts & Media (98.9%), Arts, Media & Entertainment (92.6%), and Community & Social Service (90.6%).
| Occupation | Male | Female |
| Management | 356 (68.5%) | 164 (31.5%) |
| Business & Financial | 47 (33.6%) | 93 (66.4%) |
| Computers, Engineering & Science | 60 (78.9%) | 16 (21.0%) |
| Computers & Mathematics | 1 (25.0%) | 3 (75.0%) |
| Architecture & Engineering | 55 (100.0%) | 0 (0.0%) |
| Life, Physical & Social Science | 4 (23.5%) | 13 (76.5%) |
| Community & Social Service | 50 (9.4%) | 484 (90.6%) |
| Education, Arts & Media | 1 (1.1%) | 87 (98.9%) |
| Legal Services & Support | 7 (58.3%) | 5 (41.7%) |
| Education Instruction & Library | 36 (10.2%) | 317 (89.8%) |
| Arts, Media & Entertainment | 6 (7.4%) | 75 (92.6%) |
| Health Diagnosing & Treating | 30 (15.3%) | 166 (84.7%) |
| Health Technologists | 24 (22.4%) | 83 (77.6%) |
| Total (Category) | 543 (37.0%) | 923 (63.0%) |
| Total (Overall) | 2,449 (54.2%) | 2,073 (45.8%) |
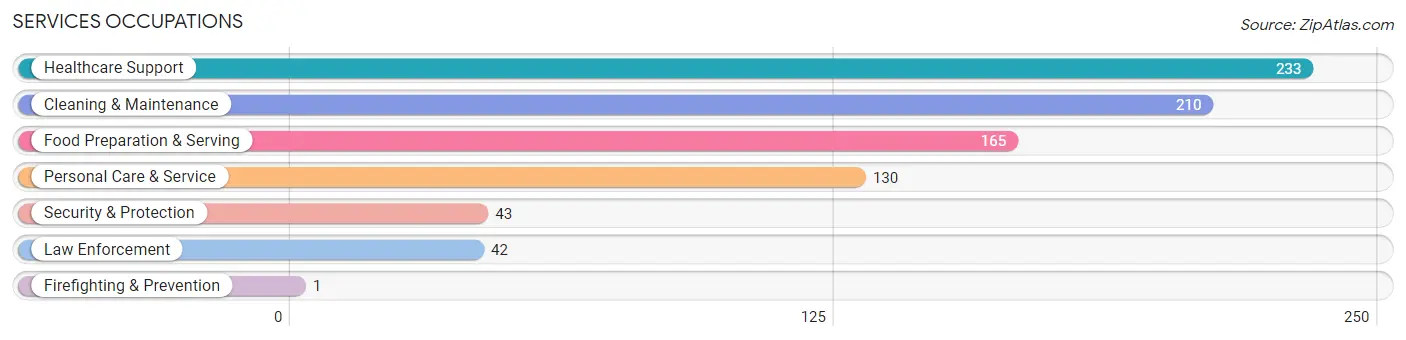
Services Occupations
The most common Services occupations in Phelps County are Healthcare Support (233 | 5.1%), Cleaning & Maintenance (210 | 4.6%), Food Preparation & Serving (165 | 3.6%), Personal Care & Service (130 | 2.9%), and Security & Protection (43 | 0.9%).
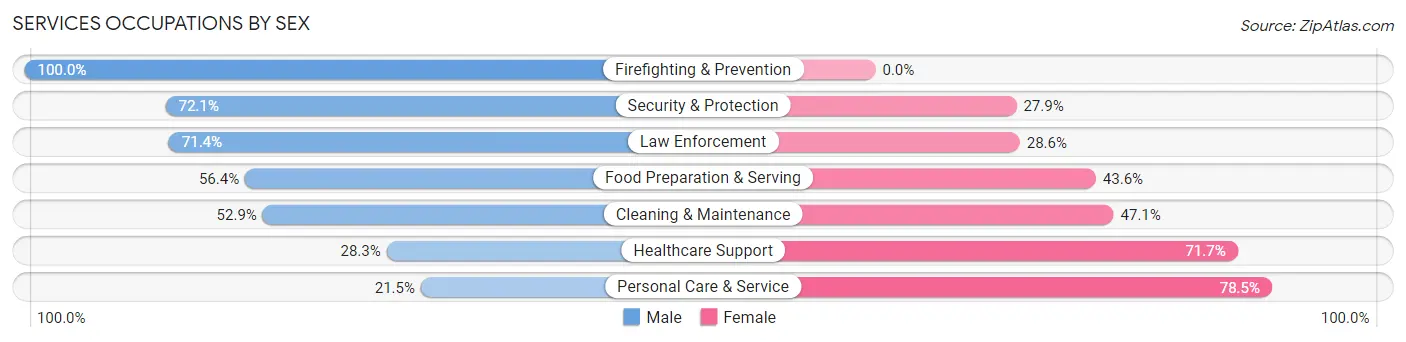
Services Occupations by Sex
Within the Services occupations in Phelps County, the most male-oriented occupations are Firefighting & Prevention (100.0%), Security & Protection (72.1%), and Law Enforcement (71.4%), while the most female-oriented occupations are Personal Care & Service (78.5%), Healthcare Support (71.7%), and Cleaning & Maintenance (47.1%).
| Occupation | Male | Female |
| Healthcare Support | 66 (28.3%) | 167 (71.7%) |
| Security & Protection | 31 (72.1%) | 12 (27.9%) |
| Firefighting & Prevention | 1 (100.0%) | 0 (0.0%) |
| Law Enforcement | 30 (71.4%) | 12 (28.6%) |
| Food Preparation & Serving | 93 (56.4%) | 72 (43.6%) |
| Cleaning & Maintenance | 111 (52.9%) | 99 (47.1%) |
| Personal Care & Service | 28 (21.5%) | 102 (78.5%) |
| Total (Category) | 329 (42.1%) | 452 (57.9%) |
| Total (Overall) | 2,449 (54.2%) | 2,073 (45.8%) |
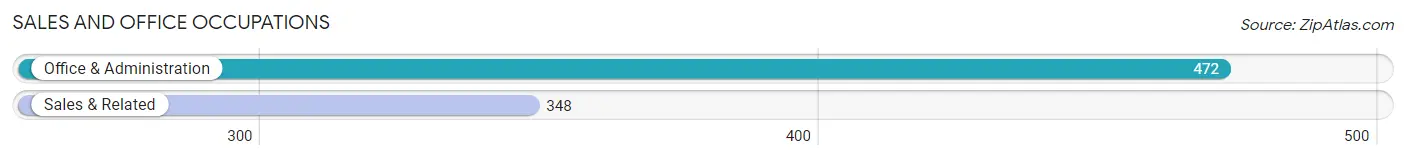
Sales and Office Occupations
The most common Sales and Office occupations in Phelps County are Office & Administration (472 | 10.4%), and Sales & Related (348 | 7.7%).
Sales and Office Occupations by Sex
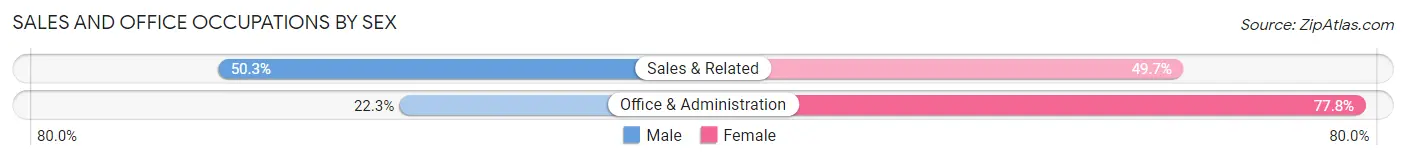
| Occupation | Male | Female |
| Sales & Related | 175 (50.3%) | 173 (49.7%) |
| Office & Administration | 105 (22.3%) | 367 (77.7%) |
| Total (Category) | 280 (34.2%) | 540 (65.8%) |
| Total (Overall) | 2,449 (54.2%) | 2,073 (45.8%) |
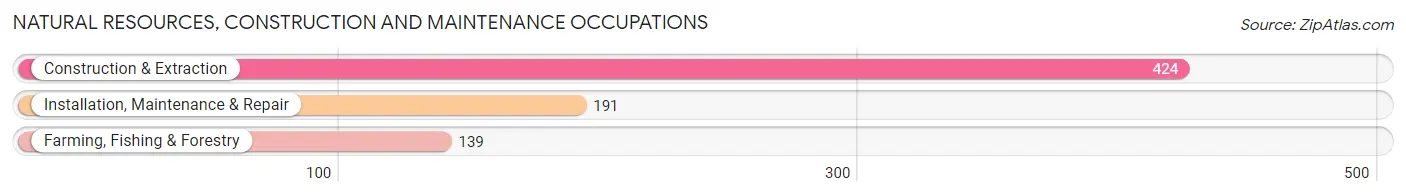
Natural Resources, Construction and Maintenance Occupations
The most common Natural Resources, Construction and Maintenance occupations in Phelps County are Construction & Extraction (424 | 9.4%), Installation, Maintenance & Repair (191 | 4.2%), and Farming, Fishing & Forestry (139 | 3.1%).
Natural Resources, Construction and Maintenance Occupations by Sex
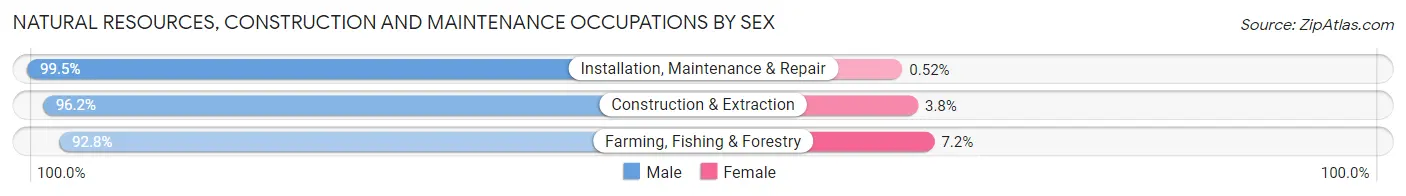
| Occupation | Male | Female |
| Farming, Fishing & Forestry | 129 (92.8%) | 10 (7.2%) |
| Construction & Extraction | 408 (96.2%) | 16 (3.8%) |
| Installation, Maintenance & Repair | 190 (99.5%) | 1 (0.5%) |
| Total (Category) | 727 (96.4%) | 27 (3.6%) |
| Total (Overall) | 2,449 (54.2%) | 2,073 (45.8%) |
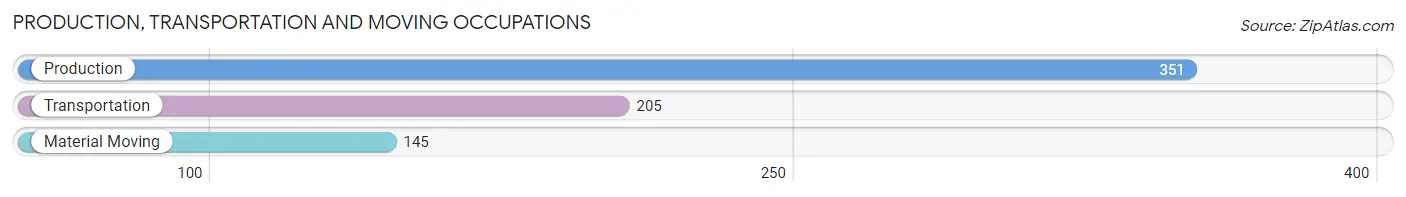
Production, Transportation and Moving Occupations
The most common Production, Transportation and Moving occupations in Phelps County are Production (351 | 7.8%), Transportation (205 | 4.5%), and Material Moving (145 | 3.2%).
Production, Transportation and Moving Occupations by Sex
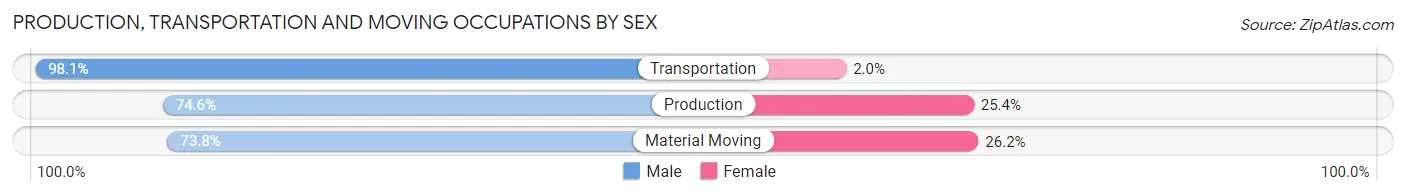
| Occupation | Male | Female |
| Production | 262 (74.6%) | 89 (25.4%) |
| Transportation | 201 (98.1%) | 4 (1.9%) |
| Material Moving | 107 (73.8%) | 38 (26.2%) |
| Total (Category) | 570 (81.3%) | 131 (18.7%) |
| Total (Overall) | 2,449 (54.2%) | 2,073 (45.8%) |
Employment Industries by Sex in Phelps County
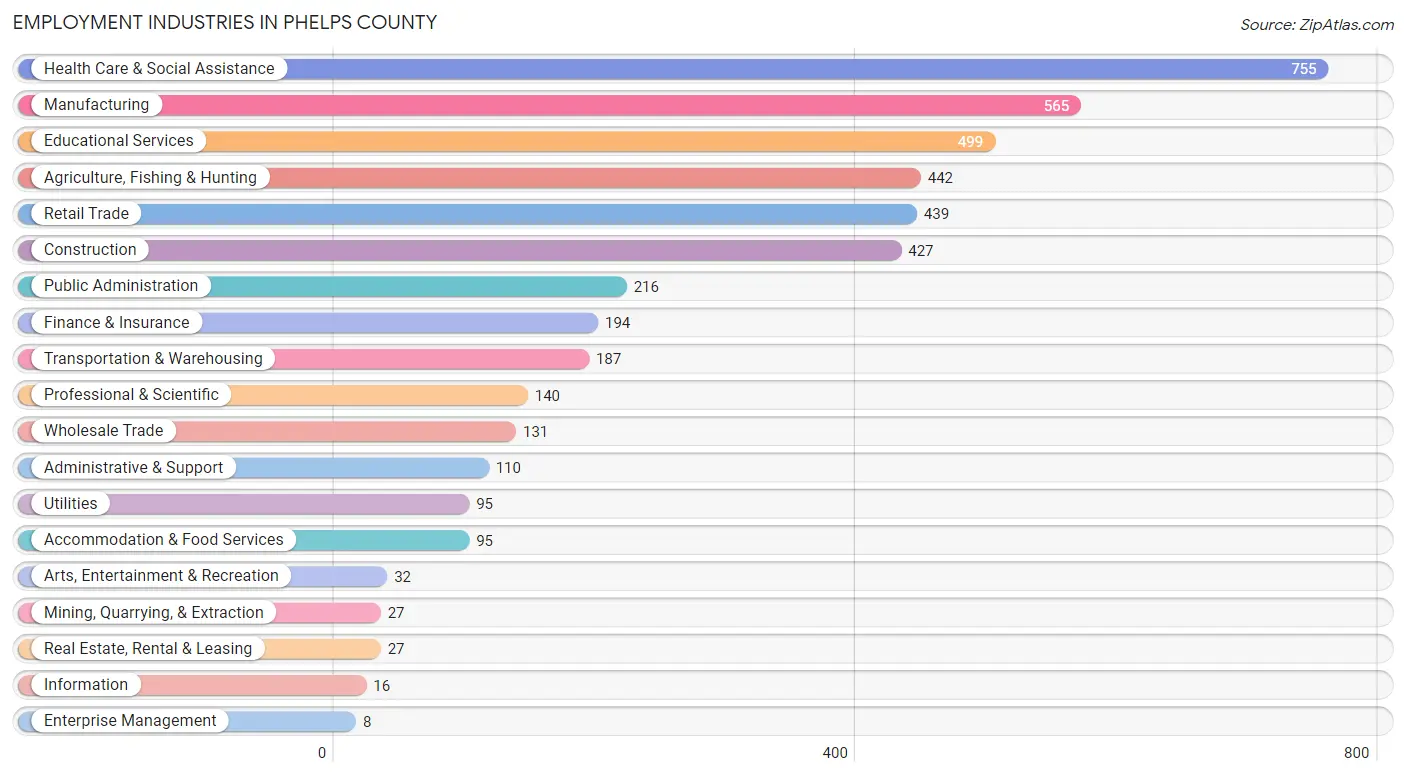
Employment Industries in Phelps County
The major employment industries in Phelps County include Health Care & Social Assistance (755 | 16.7%), Manufacturing (565 | 12.5%), Educational Services (499 | 11.0%), Agriculture, Fishing & Hunting (442 | 9.8%), and Retail Trade (439 | 9.7%).
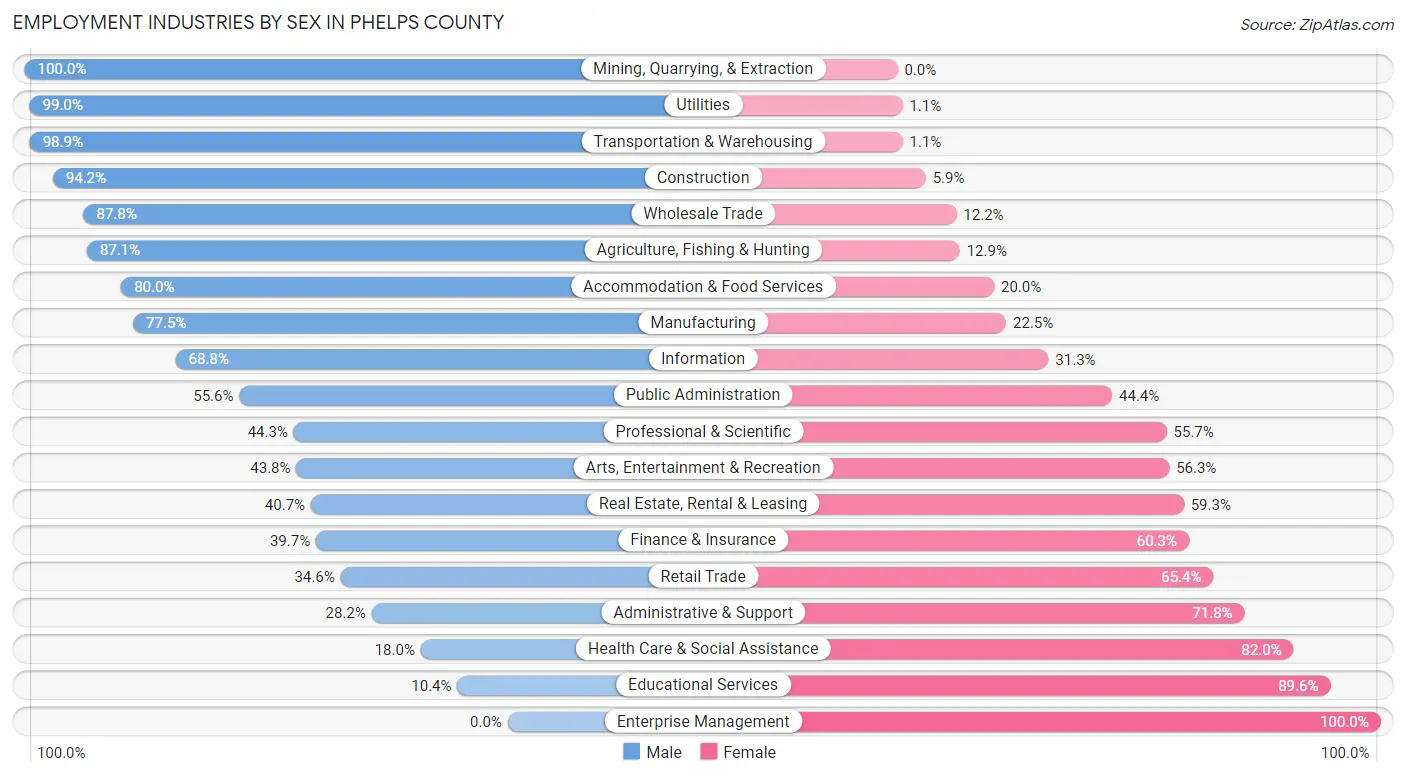
Employment Industries by Sex in Phelps County
The Phelps County industries that see more men than women are Mining, Quarrying, & Extraction (100.0%), Utilities (99.0%), and Transportation & Warehousing (98.9%), whereas the industries that tend to have a higher number of women are Enterprise Management (100.0%), Educational Services (89.6%), and Health Care & Social Assistance (82.0%).
| Industry | Male | Female |
| Agriculture, Fishing & Hunting | 385 (87.1%) | 57 (12.9%) |
| Mining, Quarrying, & Extraction | 27 (100.0%) | 0 (0.0%) |
| Construction | 402 (94.2%) | 25 (5.9%) |
| Manufacturing | 438 (77.5%) | 127 (22.5%) |
| Wholesale Trade | 115 (87.8%) | 16 (12.2%) |
| Retail Trade | 152 (34.6%) | 287 (65.4%) |
| Transportation & Warehousing | 185 (98.9%) | 2 (1.1%) |
| Utilities | 94 (99.0%) | 1 (1.1%) |
| Information | 11 (68.8%) | 5 (31.2%) |
| Finance & Insurance | 77 (39.7%) | 117 (60.3%) |
| Real Estate, Rental & Leasing | 11 (40.7%) | 16 (59.3%) |
| Professional & Scientific | 62 (44.3%) | 78 (55.7%) |
| Enterprise Management | 0 (0.0%) | 8 (100.0%) |
| Administrative & Support | 31 (28.2%) | 79 (71.8%) |
| Educational Services | 52 (10.4%) | 447 (89.6%) |
| Health Care & Social Assistance | 136 (18.0%) | 619 (82.0%) |
| Arts, Entertainment & Recreation | 14 (43.8%) | 18 (56.2%) |
| Accommodation & Food Services | 76 (80.0%) | 19 (20.0%) |
| Public Administration | 120 (55.6%) | 96 (44.4%) |
| Total | 2,449 (54.2%) | 2,073 (45.8%) |
Education in Phelps County
School Enrollment in Phelps County
The most common levels of schooling among the 1,943 students in Phelps County are elementary school (698 | 35.9%), high school (477 | 24.5%), and middle school (374 | 19.3%).
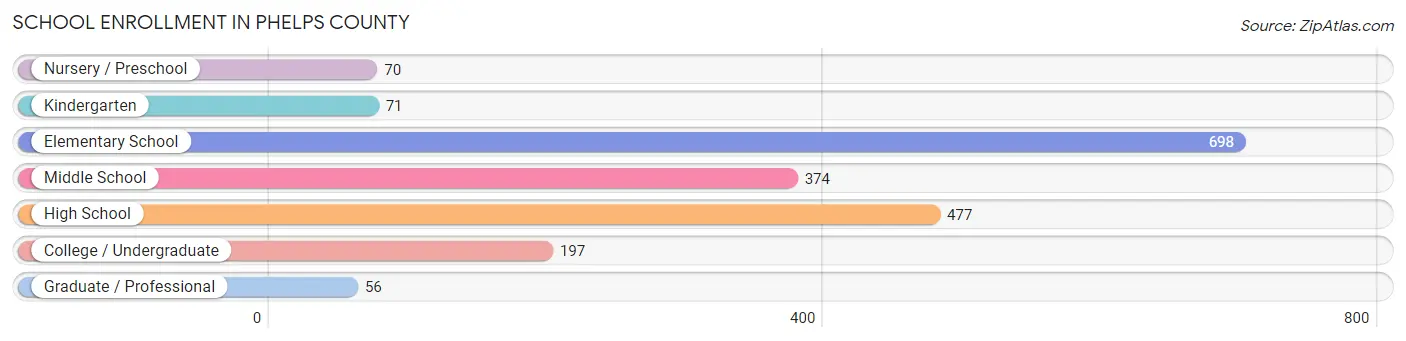
| School Level | # Students | % Students |
| Nursery / Preschool | 70 | 3.6% |
| Kindergarten | 71 | 3.6% |
| Elementary School | 698 | 35.9% |
| Middle School | 374 | 19.3% |
| High School | 477 | 24.5% |
| College / Undergraduate | 197 | 10.1% |
| Graduate / Professional | 56 | 2.9% |
| Total | 1,943 | 100.0% |
School Enrollment by Age by Funding Source in Phelps County
Out of a total of 1,943 students who are enrolled in schools in Phelps County, 113 (5.8%) attend a private institution, while the remaining 1,830 (94.2%) are enrolled in public schools. The age group of 3 to 4 year olds has the highest likelihood of being enrolled in private schools, with 9 (16.1% in the age bracket) enrolled. Conversely, the age group of 15 to 17 year olds has the lowest likelihood of being enrolled in a private school, with 355 (98.6% in the age bracket) attending a public institution.
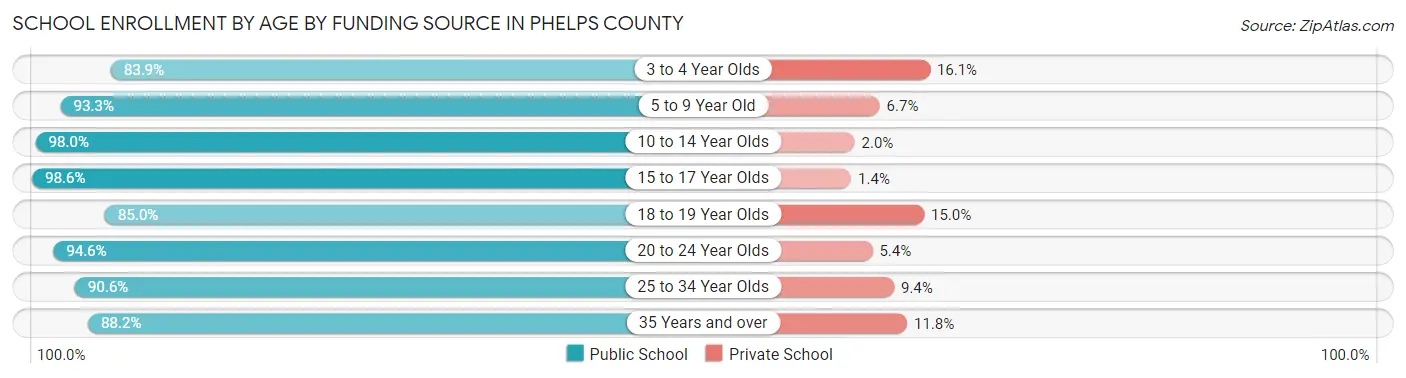
| Age Bracket | Public School | Private School |
| 3 to 4 Year Olds | 47 (83.9%) | 9 (16.1%) |
| 5 to 9 Year Old | 627 (93.3%) | 45 (6.7%) |
| 10 to 14 Year Olds | 483 (98.0%) | 10 (2.0%) |
| 15 to 17 Year Olds | 355 (98.6%) | 5 (1.4%) |
| 18 to 19 Year Olds | 125 (85.0%) | 22 (15.0%) |
| 20 to 24 Year Olds | 53 (94.6%) | 3 (5.4%) |
| 25 to 34 Year Olds | 29 (90.6%) | 3 (9.4%) |
| 35 Years and over | 112 (88.2%) | 15 (11.8%) |
| Total | 1,830 (94.2%) | 113 (5.8%) |
Educational Attainment by Field of Study in Phelps County
Education (624 | 36.8%), business (275 | 16.2%), science & technology (274 | 16.2%), bio, nature & agricultural (166 | 9.8%), and arts & humanities (92 | 5.4%) are the most common fields of study among 1,694 individuals in Phelps County who have obtained a bachelor's degree or higher.
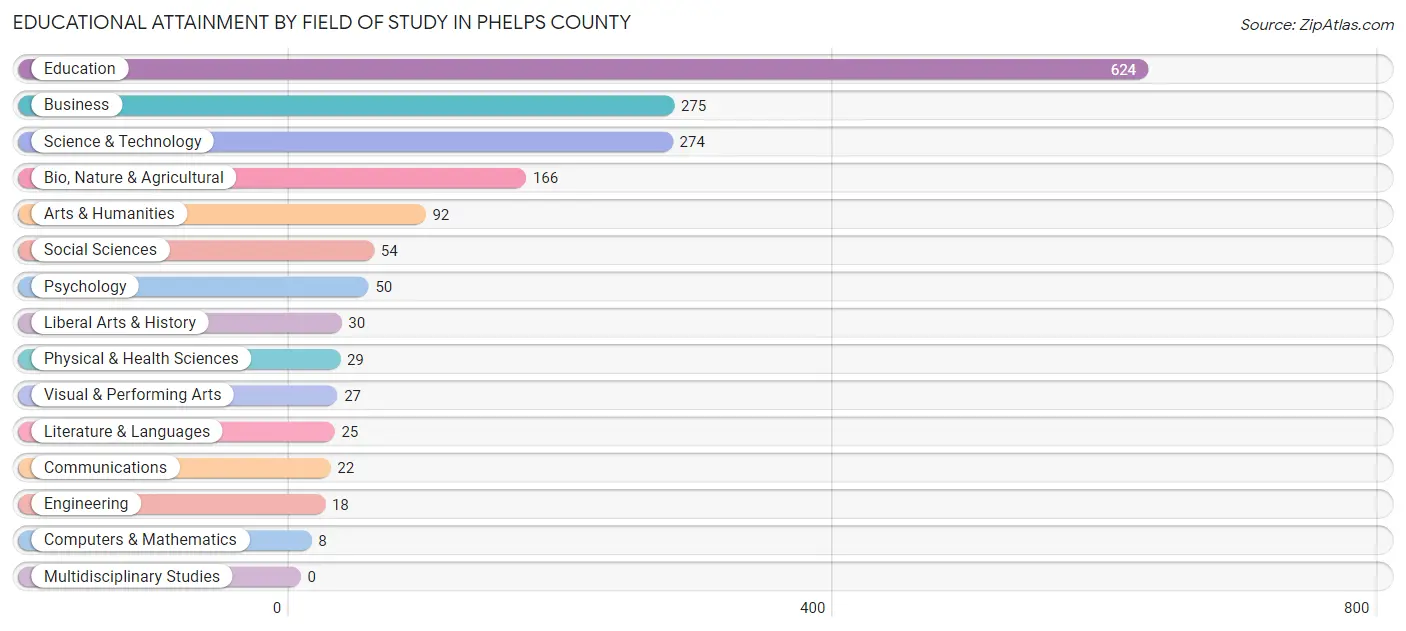
| Field of Study | # Graduates | % Graduates |
| Computers & Mathematics | 8 | 0.5% |
| Bio, Nature & Agricultural | 166 | 9.8% |
| Physical & Health Sciences | 29 | 1.7% |
| Psychology | 50 | 2.9% |
| Social Sciences | 54 | 3.2% |
| Engineering | 18 | 1.1% |
| Multidisciplinary Studies | 0 | 0.0% |
| Science & Technology | 274 | 16.2% |
| Business | 275 | 16.2% |
| Education | 624 | 36.8% |
| Literature & Languages | 25 | 1.5% |
| Liberal Arts & History | 30 | 1.8% |
| Visual & Performing Arts | 27 | 1.6% |
| Communications | 22 | 1.3% |
| Arts & Humanities | 92 | 5.4% |
| Total | 1,694 | 100.0% |
Transportation & Commute in Phelps County
Vehicle Availability by Sex in Phelps County
The most prevalent vehicle ownership categories in Phelps County are males with 2 vehicles (868, accounting for 35.8%) and females with 2 vehicles (644, making up 43.0%).
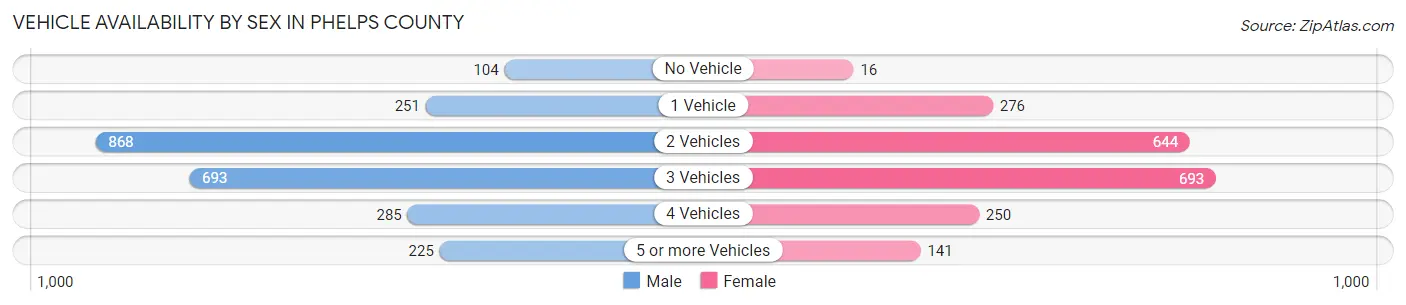
| Vehicles Available | Male | Female |
| No Vehicle | 104 (4.3%) | 16 (0.8%) |
| 1 Vehicle | 251 (10.3%) | 276 (13.7%) |
| 2 Vehicles | 868 (35.8%) | 644 (31.9%) |
| 3 Vehicles | 693 (28.6%) | 693 (34.3%) |
| 4 Vehicles | 285 (11.7%) | 250 (12.4%) |
| 5 or more Vehicles | 225 (9.3%) | 141 (7.0%) |
| Total | 2,426 (100.0%) | 2,020 (100.0%) |
Commute Time in Phelps County
The most frequently occuring commute durations in Phelps County are 5 to 9 minutes (1,057 commuters, 24.7%), less than 5 minutes (866 commuters, 20.2%), and 10 to 14 minutes (789 commuters, 18.4%).
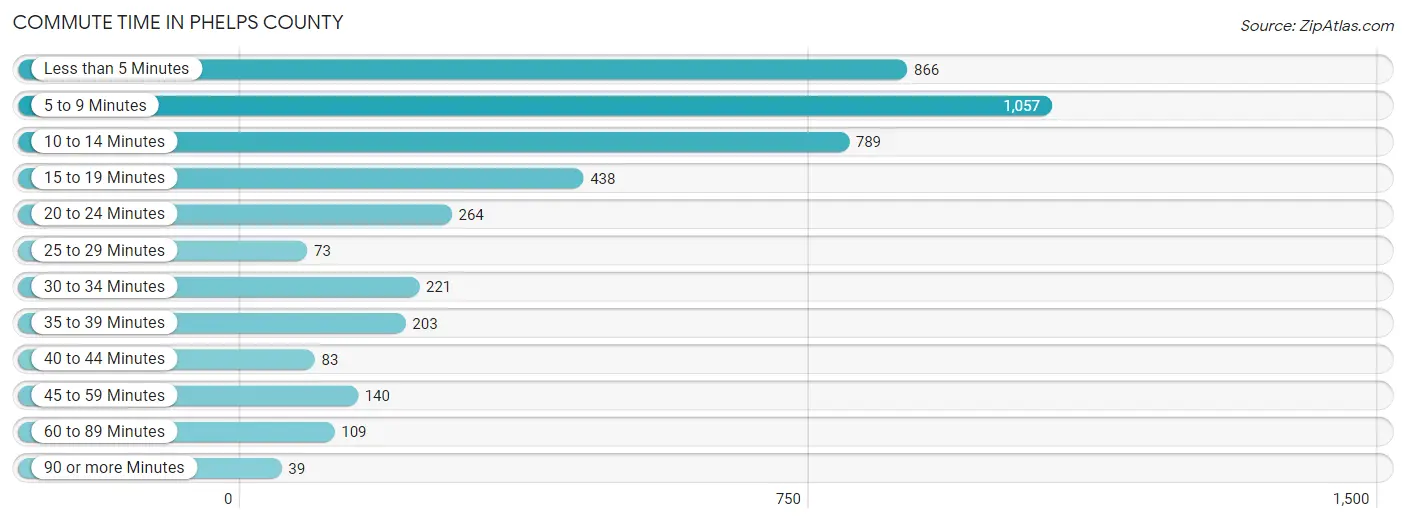
| Commute Time | # Commuters | % Commuters |
| Less than 5 Minutes | 866 | 20.2% |
| 5 to 9 Minutes | 1,057 | 24.7% |
| 10 to 14 Minutes | 789 | 18.4% |
| 15 to 19 Minutes | 438 | 10.2% |
| 20 to 24 Minutes | 264 | 6.2% |
| 25 to 29 Minutes | 73 | 1.7% |
| 30 to 34 Minutes | 221 | 5.2% |
| 35 to 39 Minutes | 203 | 4.7% |
| 40 to 44 Minutes | 83 | 1.9% |
| 45 to 59 Minutes | 140 | 3.3% |
| 60 to 89 Minutes | 109 | 2.5% |
| 90 or more Minutes | 39 | 0.9% |
Commute Time by Sex in Phelps County
The most common commute times in Phelps County are 5 to 9 minutes (566 commuters, 23.9%) for males and 5 to 9 minutes (491 commuters, 25.6%) for females.
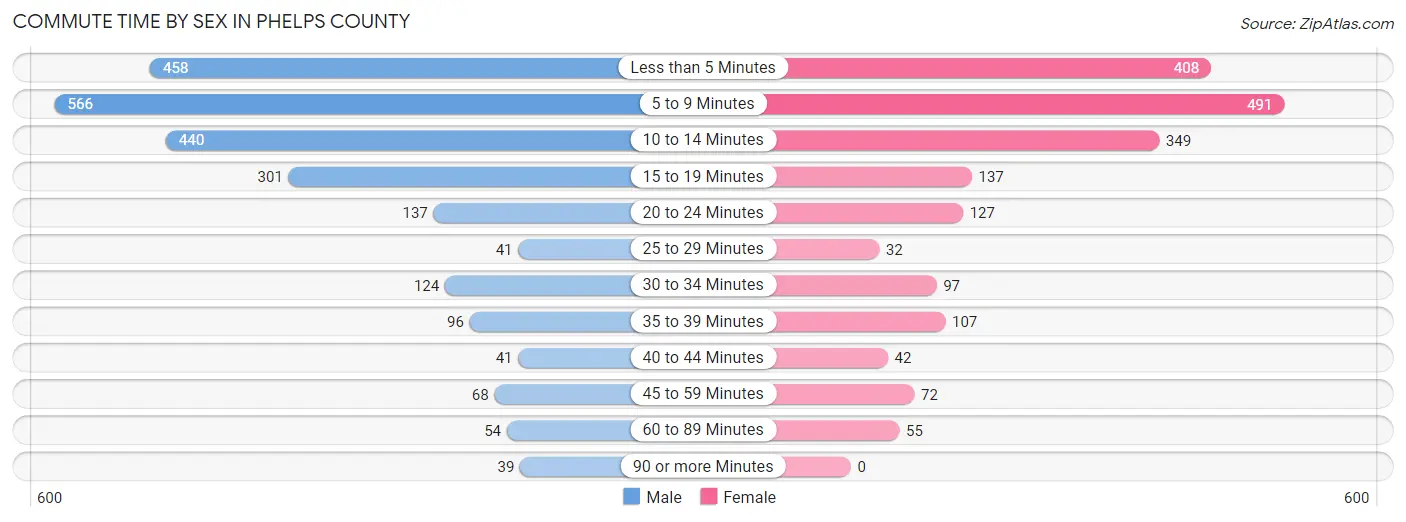
| Commute Time | Male | Female |
| Less than 5 Minutes | 458 (19.4%) | 408 (21.3%) |
| 5 to 9 Minutes | 566 (23.9%) | 491 (25.6%) |
| 10 to 14 Minutes | 440 (18.6%) | 349 (18.2%) |
| 15 to 19 Minutes | 301 (12.7%) | 137 (7.1%) |
| 20 to 24 Minutes | 137 (5.8%) | 127 (6.6%) |
| 25 to 29 Minutes | 41 (1.7%) | 32 (1.7%) |
| 30 to 34 Minutes | 124 (5.2%) | 97 (5.1%) |
| 35 to 39 Minutes | 96 (4.1%) | 107 (5.6%) |
| 40 to 44 Minutes | 41 (1.7%) | 42 (2.2%) |
| 45 to 59 Minutes | 68 (2.9%) | 72 (3.8%) |
| 60 to 89 Minutes | 54 (2.3%) | 55 (2.9%) |
| 90 or more Minutes | 39 (1.7%) | 0 (0.0%) |
Time of Departure to Work by Sex in Phelps County
The most frequent times of departure to work in Phelps County are 7:30 AM to 7:59 AM (436, 18.4%) for males and 7:30 AM to 7:59 AM (473, 24.7%) for females.
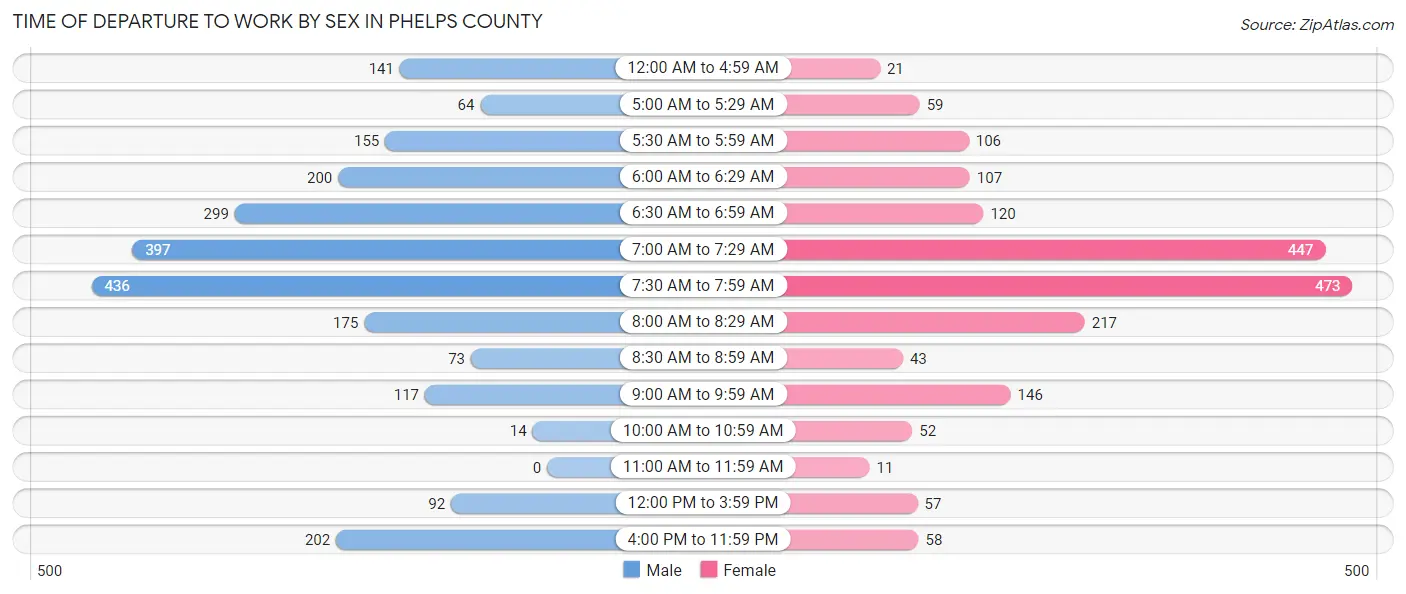
| Time of Departure | Male | Female |
| 12:00 AM to 4:59 AM | 141 (6.0%) | 21 (1.1%) |
| 5:00 AM to 5:29 AM | 64 (2.7%) | 59 (3.1%) |
| 5:30 AM to 5:59 AM | 155 (6.6%) | 106 (5.5%) |
| 6:00 AM to 6:29 AM | 200 (8.5%) | 107 (5.6%) |
| 6:30 AM to 6:59 AM | 299 (12.6%) | 120 (6.3%) |
| 7:00 AM to 7:29 AM | 397 (16.8%) | 447 (23.3%) |
| 7:30 AM to 7:59 AM | 436 (18.4%) | 473 (24.7%) |
| 8:00 AM to 8:29 AM | 175 (7.4%) | 217 (11.3%) |
| 8:30 AM to 8:59 AM | 73 (3.1%) | 43 (2.2%) |
| 9:00 AM to 9:59 AM | 117 (5.0%) | 146 (7.6%) |
| 10:00 AM to 10:59 AM | 14 (0.6%) | 52 (2.7%) |
| 11:00 AM to 11:59 AM | 0 (0.0%) | 11 (0.6%) |
| 12:00 PM to 3:59 PM | 92 (3.9%) | 57 (3.0%) |
| 4:00 PM to 11:59 PM | 202 (8.5%) | 58 (3.0%) |
| Total | 2,365 (100.0%) | 1,917 (100.0%) |
Housing Occupancy in Phelps County
Occupancy by Ownership in Phelps County
Of the total 3,805 dwellings in Phelps County, owner-occupied units account for 2,666 (70.1%), while renter-occupied units make up 1,139 (29.9%).
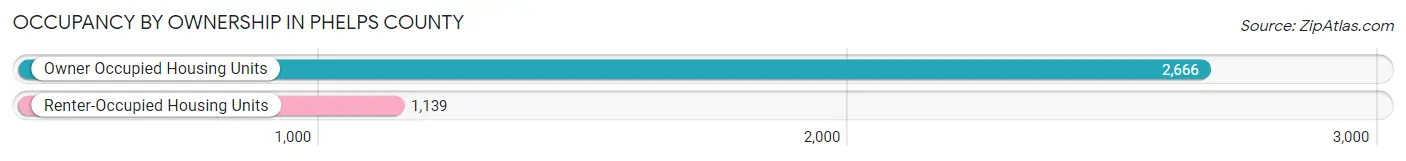
| Occupancy | # Housing Units | % Housing Units |
| Owner Occupied Housing Units | 2,666 | 70.1% |
| Renter-Occupied Housing Units | 1,139 | 29.9% |
| Total Occupied Housing Units | 3,805 | 100.0% |
Occupancy by Household Size in Phelps County
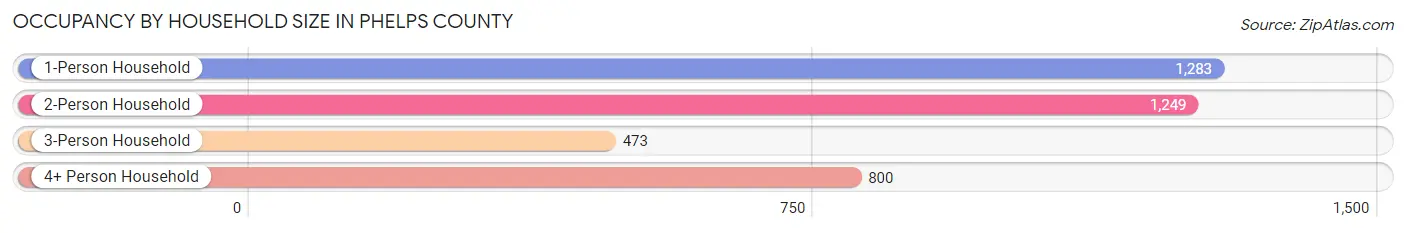
| Household Size | # Housing Units | % Housing Units |
| 1-Person Household | 1,283 | 33.7% |
| 2-Person Household | 1,249 | 32.8% |
| 3-Person Household | 473 | 12.4% |
| 4+ Person Household | 800 | 21.0% |
| Total Housing Units | 3,805 | 100.0% |
Occupancy by Ownership by Household Size in Phelps County
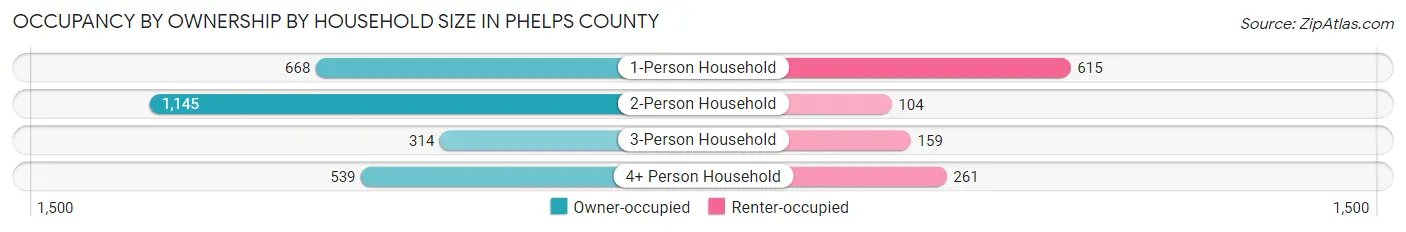
| Household Size | Owner-occupied | Renter-occupied |
| 1-Person Household | 668 (52.1%) | 615 (47.9%) |
| 2-Person Household | 1,145 (91.7%) | 104 (8.3%) |
| 3-Person Household | 314 (66.4%) | 159 (33.6%) |
| 4+ Person Household | 539 (67.4%) | 261 (32.6%) |
| Total Housing Units | 2,666 (70.1%) | 1,139 (29.9%) |
Occupancy by Educational Attainment in Phelps County
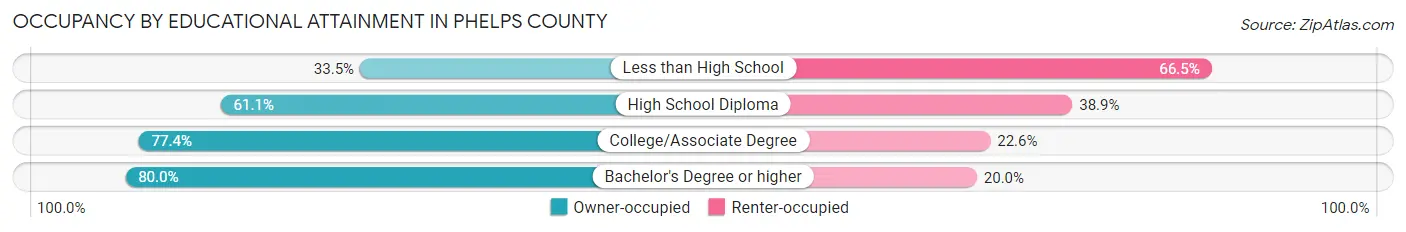
| Household Size | Owner-occupied | Renter-occupied |
| Less than High School | 120 (33.5%) | 238 (66.5%) |
| High School Diploma | 566 (61.1%) | 360 (38.9%) |
| College/Associate Degree | 1,098 (77.4%) | 321 (22.6%) |
| Bachelor's Degree or higher | 882 (80.0%) | 220 (20.0%) |
Occupancy by Age of Householder in Phelps County
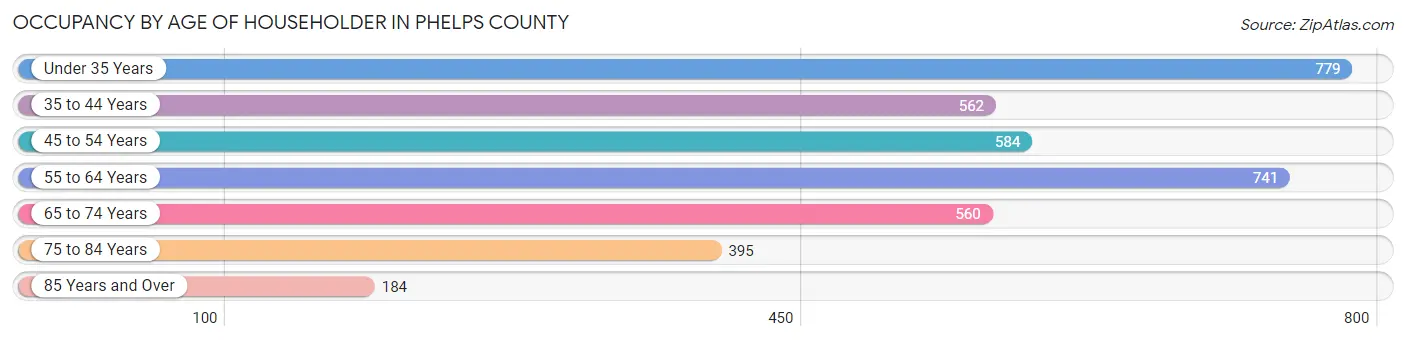
| Age Bracket | # Households | % Households |
| Under 35 Years | 779 | 20.5% |
| 35 to 44 Years | 562 | 14.8% |
| 45 to 54 Years | 584 | 15.3% |
| 55 to 64 Years | 741 | 19.5% |
| 65 to 74 Years | 560 | 14.7% |
| 75 to 84 Years | 395 | 10.4% |
| 85 Years and Over | 184 | 4.8% |
| Total | 3,805 | 100.0% |
Housing Finances in Phelps County
Median Income by Occupancy in Phelps County
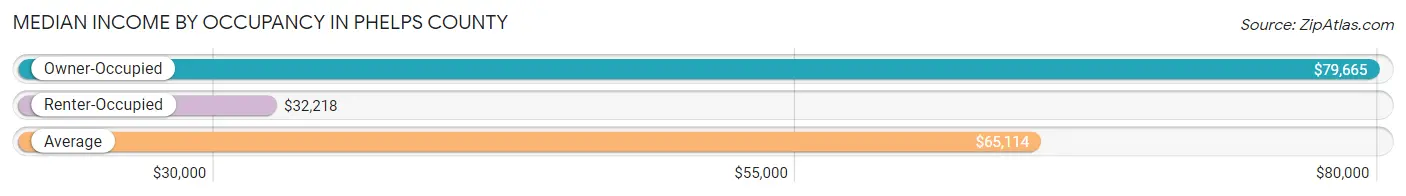
| Occupancy Type | # Households | Median Income |
| Owner-Occupied | 2,666 (70.1%) | $79,665 |
| Renter-Occupied | 1,139 (29.9%) | $32,218 |
| Average | 3,805 (100.0%) | $65,114 |
Occupancy by Householder Income Bracket in Phelps County
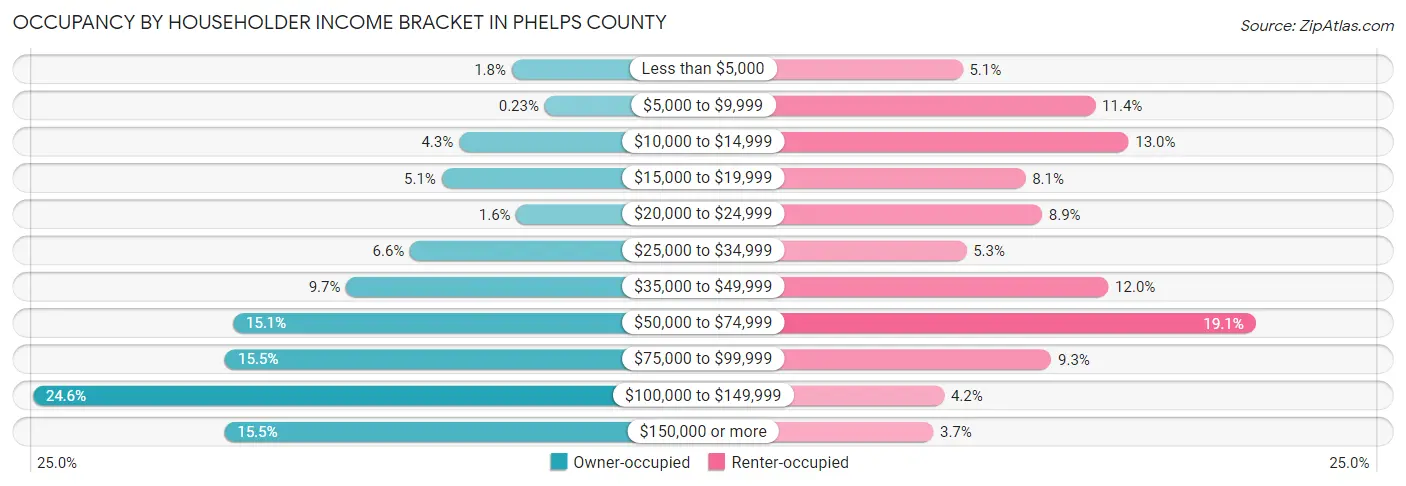
| Income Bracket | Owner-occupied | Renter-occupied |
| Less than $5,000 | 48 (1.8%) | 58 (5.1%) |
| $5,000 to $9,999 | 6 (0.2%) | 130 (11.4%) |
| $10,000 to $14,999 | 115 (4.3%) | 148 (13.0%) |
| $15,000 to $19,999 | 137 (5.1%) | 92 (8.1%) |
| $20,000 to $24,999 | 42 (1.6%) | 101 (8.9%) |
| $25,000 to $34,999 | 177 (6.6%) | 60 (5.3%) |
| $35,000 to $49,999 | 258 (9.7%) | 137 (12.0%) |
| $50,000 to $74,999 | 402 (15.1%) | 217 (19.1%) |
| $75,000 to $99,999 | 412 (15.4%) | 106 (9.3%) |
| $100,000 to $149,999 | 656 (24.6%) | 48 (4.2%) |
| $150,000 or more | 413 (15.5%) | 42 (3.7%) |
| Total | 2,666 (100.0%) | 1,139 (100.0%) |
Monthly Housing Cost Tiers in Phelps County
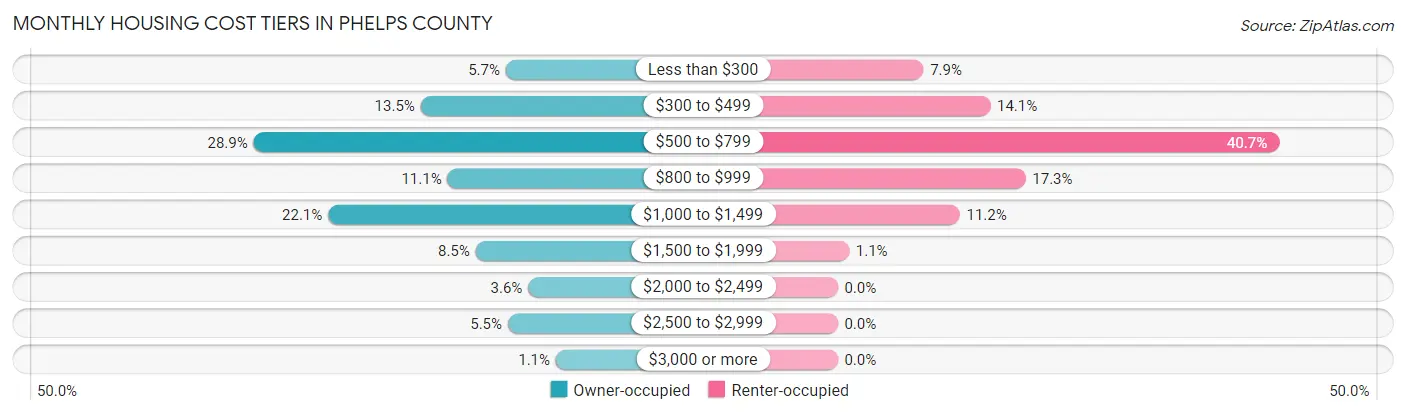
| Monthly Cost | Owner-occupied | Renter-occupied |
| Less than $300 | 152 (5.7%) | 90 (7.9%) |
| $300 to $499 | 361 (13.5%) | 160 (14.1%) |
| $500 to $799 | 771 (28.9%) | 463 (40.6%) |
| $800 to $999 | 295 (11.1%) | 197 (17.3%) |
| $1,000 to $1,499 | 588 (22.1%) | 128 (11.2%) |
| $1,500 to $1,999 | 226 (8.5%) | 12 (1.1%) |
| $2,000 to $2,499 | 97 (3.6%) | 0 (0.0%) |
| $2,500 to $2,999 | 147 (5.5%) | 0 (0.0%) |
| $3,000 or more | 29 (1.1%) | 0 (0.0%) |
| Total | 2,666 (100.0%) | 1,139 (100.0%) |
Physical Housing Characteristics in Phelps County
Housing Structures in Phelps County
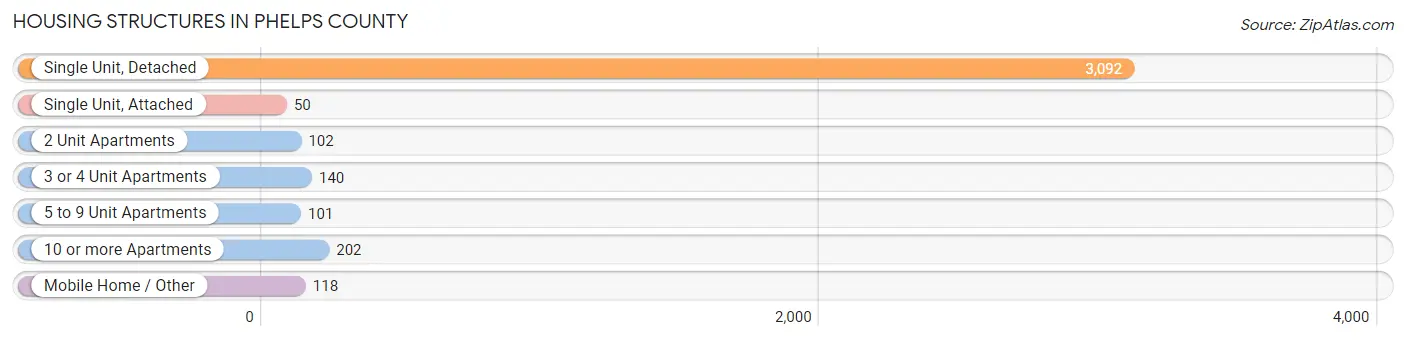
| Structure Type | # Housing Units | % Housing Units |
| Single Unit, Detached | 3,092 | 81.3% |
| Single Unit, Attached | 50 | 1.3% |
| 2 Unit Apartments | 102 | 2.7% |
| 3 or 4 Unit Apartments | 140 | 3.7% |
| 5 to 9 Unit Apartments | 101 | 2.6% |
| 10 or more Apartments | 202 | 5.3% |
| Mobile Home / Other | 118 | 3.1% |
| Total | 3,805 | 100.0% |
Housing Structures by Occupancy in Phelps County
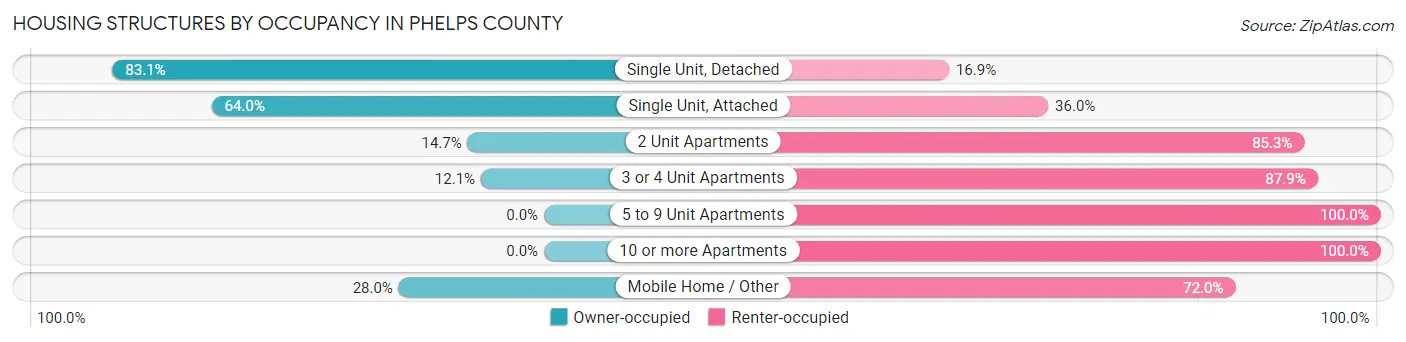
| Structure Type | Owner-occupied | Renter-occupied |
| Single Unit, Detached | 2,569 (83.1%) | 523 (16.9%) |
| Single Unit, Attached | 32 (64.0%) | 18 (36.0%) |
| 2 Unit Apartments | 15 (14.7%) | 87 (85.3%) |
| 3 or 4 Unit Apartments | 17 (12.1%) | 123 (87.9%) |
| 5 to 9 Unit Apartments | 0 (0.0%) | 101 (100.0%) |
| 10 or more Apartments | 0 (0.0%) | 202 (100.0%) |
| Mobile Home / Other | 33 (28.0%) | 85 (72.0%) |
| Total | 2,666 (70.1%) | 1,139 (29.9%) |
Housing Structures by Number of Rooms in Phelps County
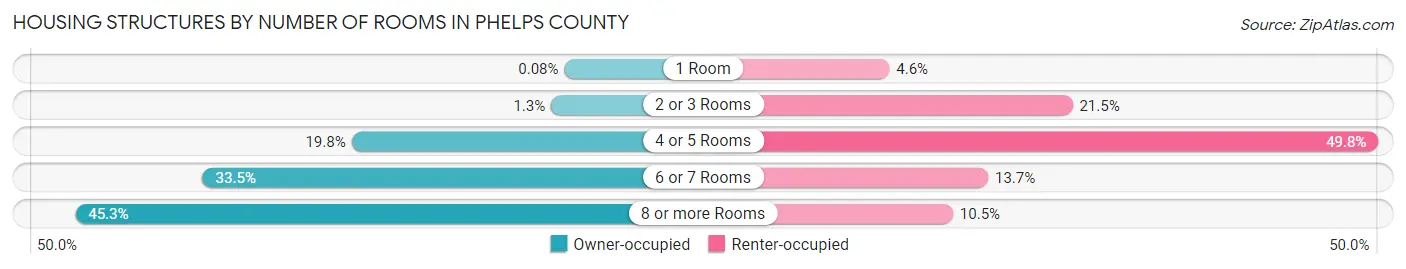
| Number of Rooms | Owner-occupied | Renter-occupied |
| 1 Room | 2 (0.1%) | 52 (4.6%) |
| 2 or 3 Rooms | 35 (1.3%) | 245 (21.5%) |
| 4 or 5 Rooms | 527 (19.8%) | 567 (49.8%) |
| 6 or 7 Rooms | 894 (33.5%) | 156 (13.7%) |
| 8 or more Rooms | 1,208 (45.3%) | 119 (10.4%) |
| Total | 2,666 (100.0%) | 1,139 (100.0%) |
Housing Structure by Heating Type in Phelps County
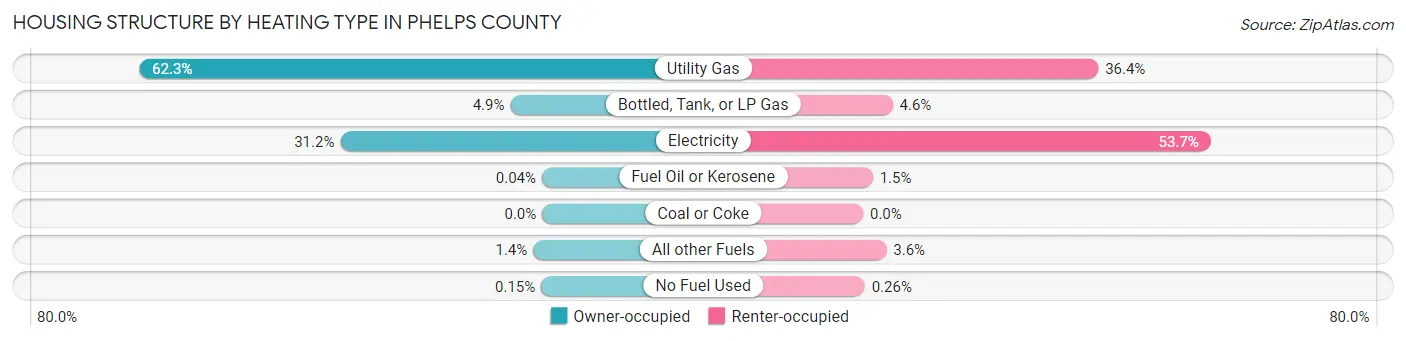
| Heating Type | Owner-occupied | Renter-occupied |
| Utility Gas | 1,661 (62.3%) | 414 (36.3%) |
| Bottled, Tank, or LP Gas | 131 (4.9%) | 52 (4.6%) |
| Electricity | 832 (31.2%) | 612 (53.7%) |
| Fuel Oil or Kerosene | 1 (0.0%) | 17 (1.5%) |
| Coal or Coke | 0 (0.0%) | 0 (0.0%) |
| All other Fuels | 37 (1.4%) | 41 (3.6%) |
| No Fuel Used | 4 (0.2%) | 3 (0.3%) |
| Total | 2,666 (100.0%) | 1,139 (100.0%) |
Household Vehicle Usage in Phelps County
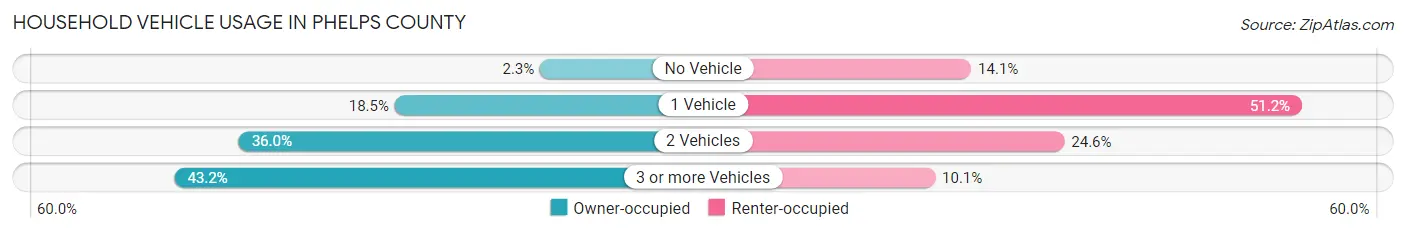
| Vehicles per Household | Owner-occupied | Renter-occupied |
| No Vehicle | 60 (2.2%) | 161 (14.1%) |
| 1 Vehicle | 494 (18.5%) | 583 (51.2%) |
| 2 Vehicles | 960 (36.0%) | 280 (24.6%) |
| 3 or more Vehicles | 1,152 (43.2%) | 115 (10.1%) |
| Total | 2,666 (100.0%) | 1,139 (100.0%) |
Real Estate & Mortgages in Phelps County
Real Estate and Mortgage Overview in Phelps County
| Characteristic | Without Mortgage | With Mortgage |
| Housing Units | 1,340 | 1,326 |
| Median Property Value | $159,800 | $162,700 |
| Median Household Income | $66,221 | $257 |
| Monthly Housing Costs | $573 | $29 |
| Real Estate Taxes | $2,201 | $47 |
Property Value by Mortgage Status in Phelps County
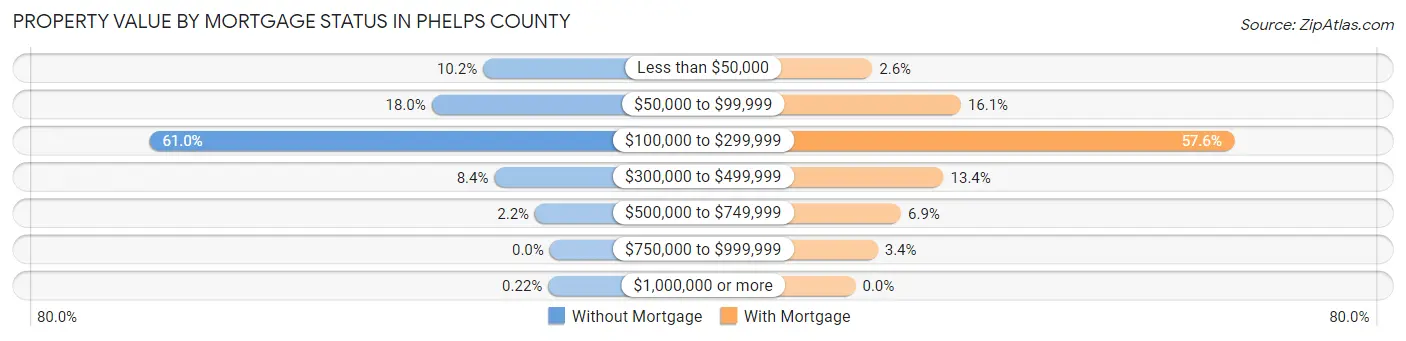
| Property Value | Without Mortgage | With Mortgage |
| Less than $50,000 | 136 (10.2%) | 34 (2.6%) |
| $50,000 to $99,999 | 241 (18.0%) | 213 (16.1%) |
| $100,000 to $299,999 | 817 (61.0%) | 764 (57.6%) |
| $300,000 to $499,999 | 113 (8.4%) | 178 (13.4%) |
| $500,000 to $749,999 | 30 (2.2%) | 92 (6.9%) |
| $750,000 to $999,999 | 0 (0.0%) | 45 (3.4%) |
| $1,000,000 or more | 3 (0.2%) | 0 (0.0%) |
| Total | 1,340 (100.0%) | 1,326 (100.0%) |
Household Income by Mortgage Status in Phelps County
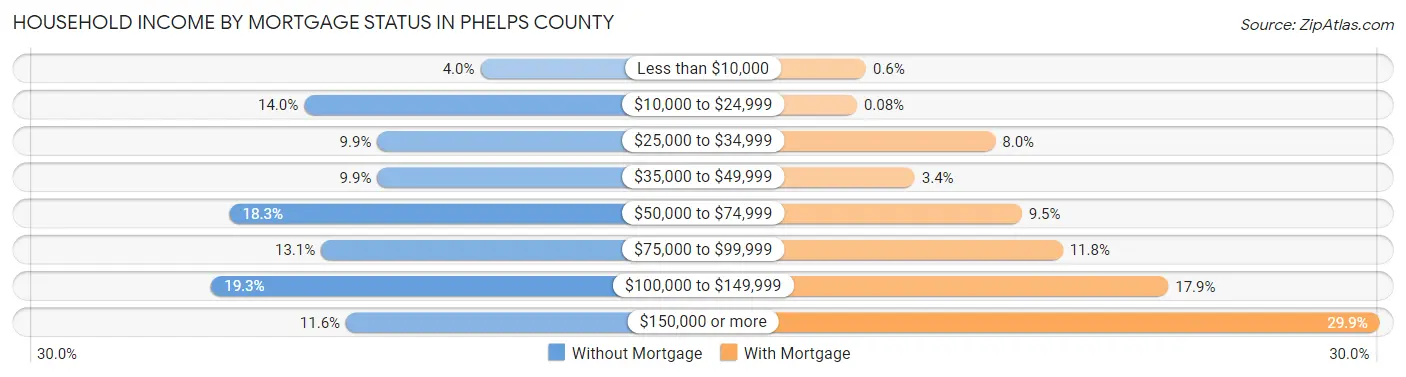
| Household Income | Without Mortgage | With Mortgage |
| Less than $10,000 | 53 (4.0%) | 8 (0.6%) |
| $10,000 to $24,999 | 188 (14.0%) | 1 (0.1%) |
| $25,000 to $34,999 | 132 (9.9%) | 106 (8.0%) |
| $35,000 to $49,999 | 132 (9.9%) | 45 (3.4%) |
| $50,000 to $74,999 | 245 (18.3%) | 126 (9.5%) |
| $75,000 to $99,999 | 175 (13.1%) | 157 (11.8%) |
| $100,000 to $149,999 | 259 (19.3%) | 237 (17.9%) |
| $150,000 or more | 156 (11.6%) | 397 (29.9%) |
| Total | 1,340 (100.0%) | 1,326 (100.0%) |
Property Value to Household Income Ratio in Phelps County
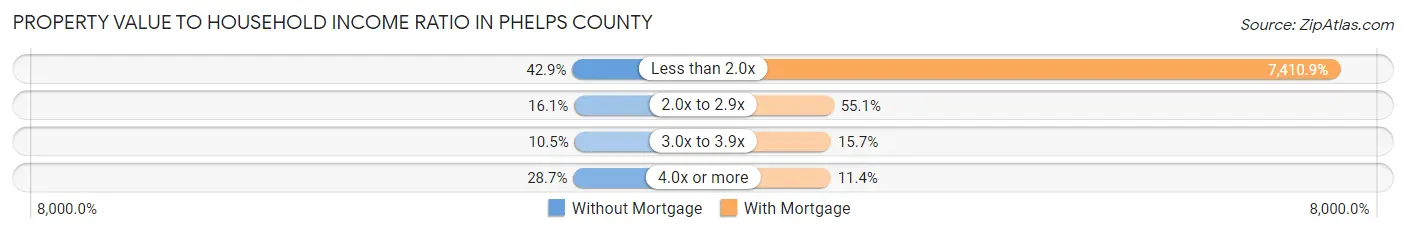
| Value-to-Income Ratio | Without Mortgage | With Mortgage |
| Less than 2.0x | 575 (42.9%) | 98,269 (7,410.9%) |
| 2.0x to 2.9x | 216 (16.1%) | 731 (55.1%) |
| 3.0x to 3.9x | 141 (10.5%) | 208 (15.7%) |
| 4.0x or more | 385 (28.7%) | 151 (11.4%) |
| Total | 1,340 (100.0%) | 1,326 (100.0%) |
Real Estate Taxes by Mortgage Status in Phelps County
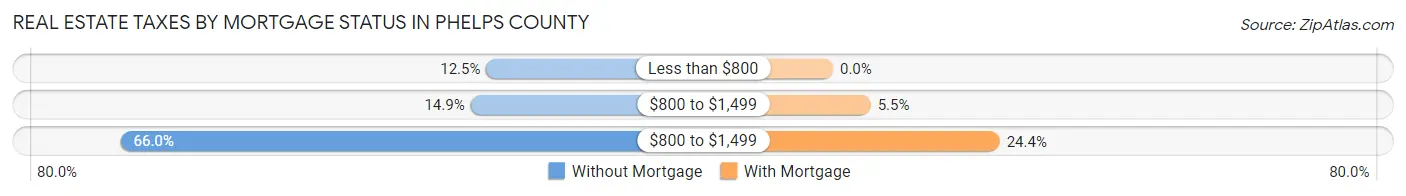
| Property Taxes | Without Mortgage | With Mortgage |
| Less than $800 | 168 (12.5%) | 0 (0.0%) |
| $800 to $1,499 | 199 (14.8%) | 73 (5.5%) |
| $800 to $1,499 | 884 (66.0%) | 323 (24.4%) |
| Total | 1,340 (100.0%) | 1,326 (100.0%) |
Health & Disability in Phelps County
Health Insurance Coverage by Age in Phelps County
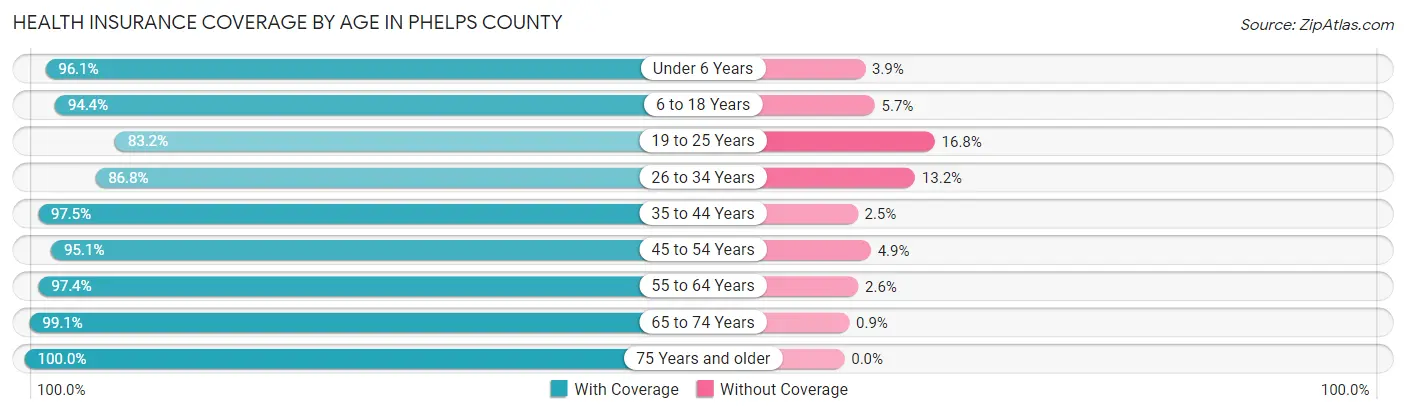
| Age Bracket | With Coverage | Without Coverage |
| Under 6 Years | 622 (96.1%) | 25 (3.9%) |
| 6 to 18 Years | 1,519 (94.4%) | 91 (5.7%) |
| 19 to 25 Years | 553 (83.2%) | 112 (16.8%) |
| 26 to 34 Years | 804 (86.8%) | 122 (13.2%) |
| 35 to 44 Years | 988 (97.5%) | 25 (2.5%) |
| 45 to 54 Years | 945 (95.1%) | 49 (4.9%) |
| 55 to 64 Years | 1,176 (97.4%) | 31 (2.6%) |
| 65 to 74 Years | 880 (99.1%) | 8 (0.9%) |
| 75 Years and older | 786 (100.0%) | 0 (0.0%) |
| Total | 8,273 (94.7%) | 463 (5.3%) |
Health Insurance Coverage by Citizenship Status in Phelps County
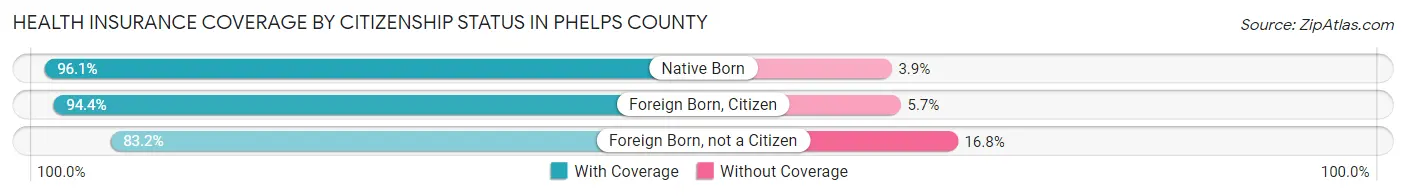
| Citizenship Status | With Coverage | Without Coverage |
| Native Born | 622 (96.1%) | 25 (3.9%) |
| Foreign Born, Citizen | 1,519 (94.4%) | 91 (5.7%) |
| Foreign Born, not a Citizen | 553 (83.2%) | 112 (16.8%) |
Health Insurance Coverage by Household Income in Phelps County
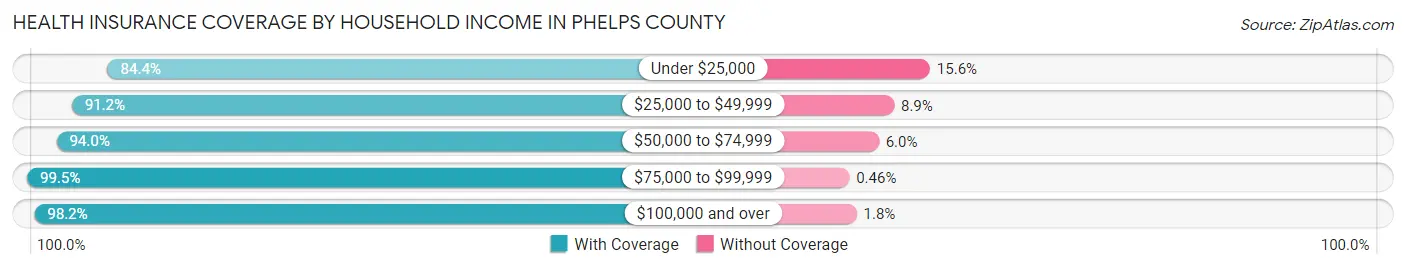
| Household Income | With Coverage | Without Coverage |
| Under $25,000 | 1,182 (84.4%) | 218 (15.6%) |
| $25,000 to $49,999 | 917 (91.1%) | 89 (8.8%) |
| $50,000 to $74,999 | 1,320 (94.0%) | 84 (6.0%) |
| $75,000 to $99,999 | 1,295 (99.5%) | 6 (0.5%) |
| $100,000 and over | 3,545 (98.2%) | 66 (1.8%) |
Public vs Private Health Insurance Coverage by Age in Phelps County
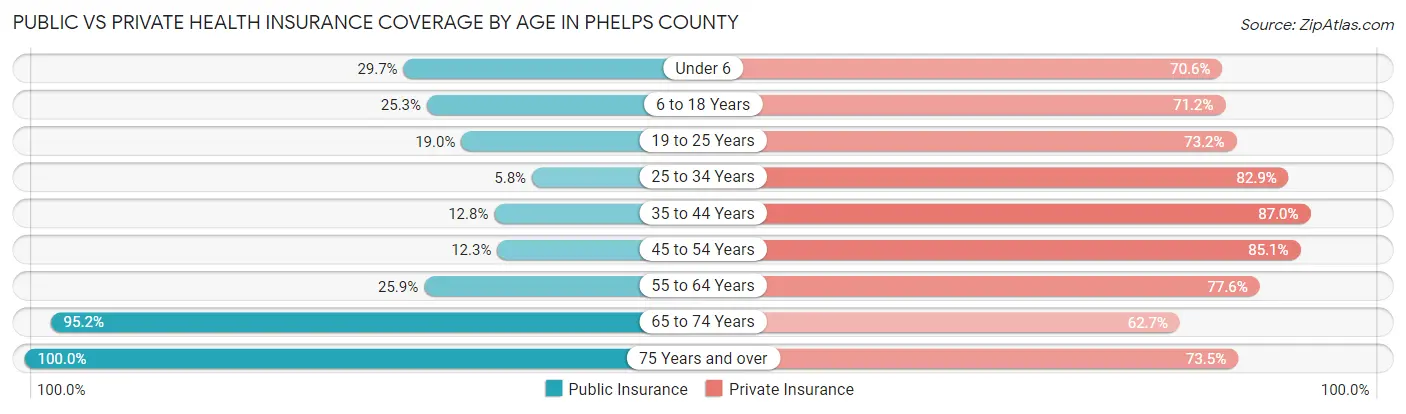
| Age Bracket | Public Insurance | Private Insurance |
| Under 6 | 192 (29.7%) | 457 (70.6%) |
| 6 to 18 Years | 408 (25.3%) | 1,146 (71.2%) |
| 19 to 25 Years | 126 (19.0%) | 487 (73.2%) |
| 25 to 34 Years | 54 (5.8%) | 768 (82.9%) |
| 35 to 44 Years | 130 (12.8%) | 881 (87.0%) |
| 45 to 54 Years | 122 (12.3%) | 846 (85.1%) |
| 55 to 64 Years | 312 (25.9%) | 936 (77.5%) |
| 65 to 74 Years | 845 (95.2%) | 557 (62.7%) |
| 75 Years and over | 786 (100.0%) | 578 (73.5%) |
| Total | 2,975 (34.1%) | 6,656 (76.2%) |
Disability Status by Sex by Age in Phelps County
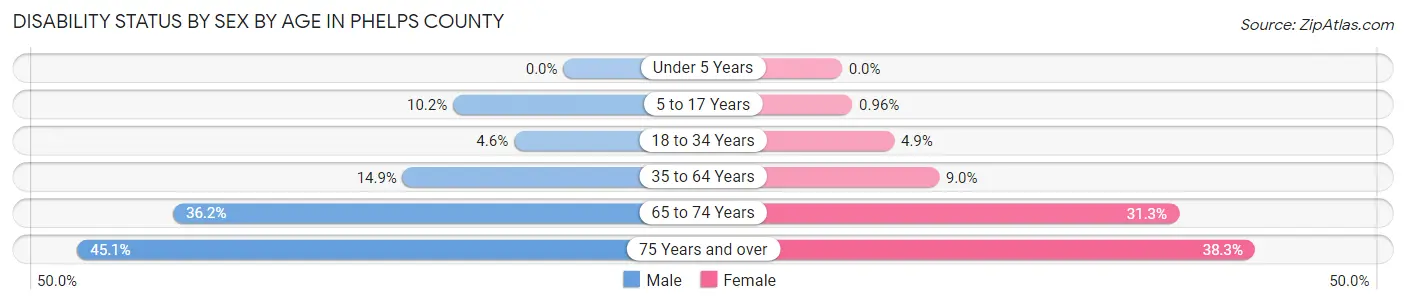
| Age Bracket | Male | Female |
| Under 5 Years | 0 (0.0%) | 0 (0.0%) |
| 5 to 17 Years | 87 (10.2%) | 7 (1.0%) |
| 18 to 34 Years | 42 (4.6%) | 38 (4.9%) |
| 35 to 64 Years | 244 (14.9%) | 142 (9.0%) |
| 65 to 74 Years | 163 (36.2%) | 137 (31.3%) |
| 75 Years and over | 138 (45.1%) | 184 (38.3%) |
Disability Class by Sex by Age in Phelps County
Disability Class: Hearing Difficulty
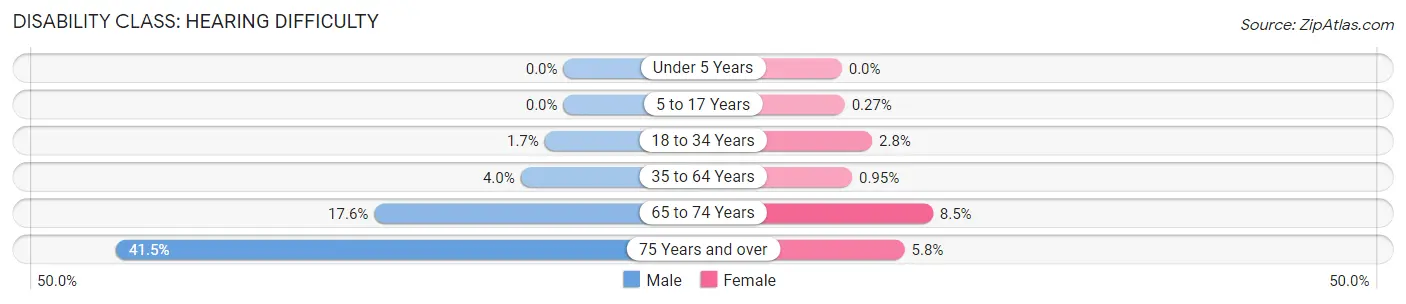
| Age Bracket | Male | Female |
| Under 5 Years | 0 (0.0%) | 0 (0.0%) |
| 5 to 17 Years | 0 (0.0%) | 2 (0.3%) |
| 18 to 34 Years | 16 (1.7%) | 22 (2.8%) |
| 35 to 64 Years | 65 (4.0%) | 15 (0.9%) |
| 65 to 74 Years | 79 (17.6%) | 37 (8.5%) |
| 75 Years and over | 127 (41.5%) | 28 (5.8%) |
Disability Class: Vision Difficulty
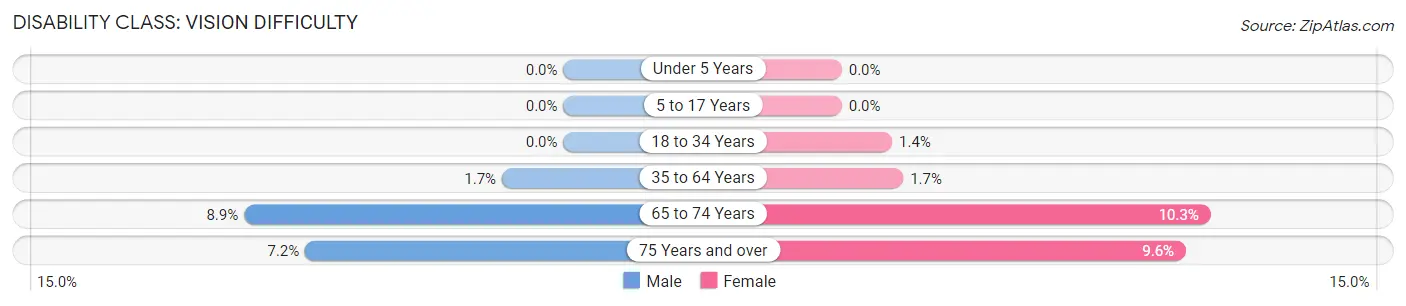
| Age Bracket | Male | Female |
| Under 5 Years | 0 (0.0%) | 0 (0.0%) |
| 5 to 17 Years | 0 (0.0%) | 0 (0.0%) |
| 18 to 34 Years | 0 (0.0%) | 11 (1.4%) |
| 35 to 64 Years | 28 (1.7%) | 27 (1.7%) |
| 65 to 74 Years | 40 (8.9%) | 45 (10.3%) |
| 75 Years and over | 22 (7.2%) | 46 (9.6%) |
Disability Class: Cognitive Difficulty
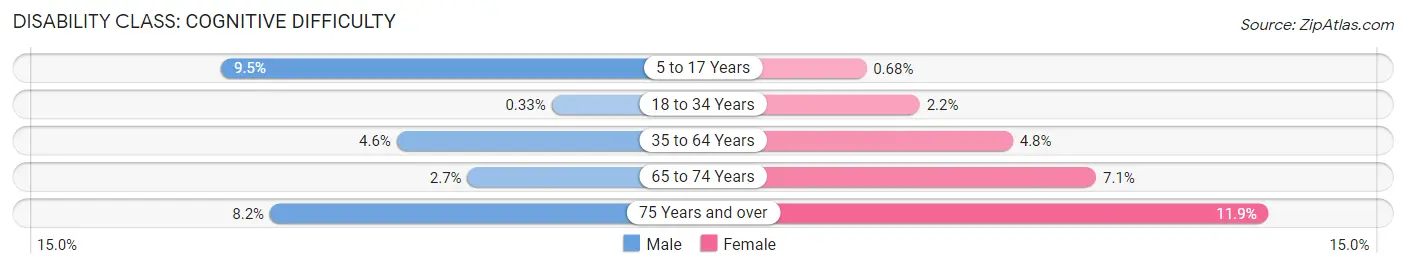
| Age Bracket | Male | Female |
| 5 to 17 Years | 81 (9.5%) | 5 (0.7%) |
| 18 to 34 Years | 3 (0.3%) | 17 (2.2%) |
| 35 to 64 Years | 76 (4.6%) | 75 (4.8%) |
| 65 to 74 Years | 12 (2.7%) | 31 (7.1%) |
| 75 Years and over | 25 (8.2%) | 57 (11.9%) |
Disability Class: Ambulatory Difficulty
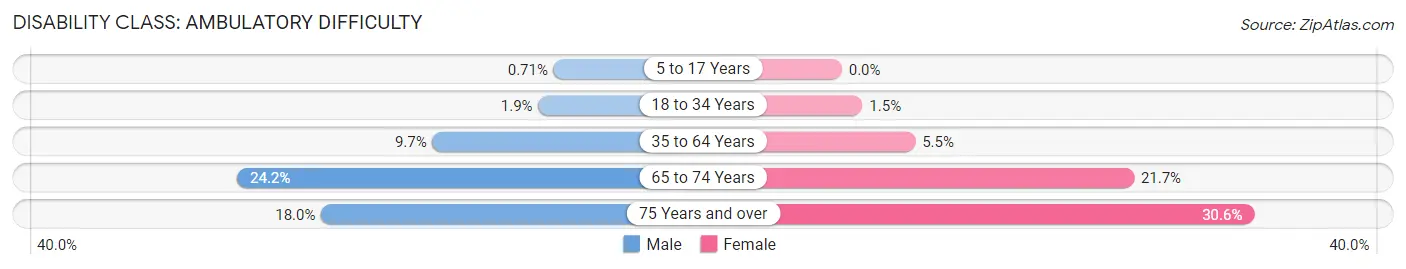
| Age Bracket | Male | Female |
| 5 to 17 Years | 6 (0.7%) | 0 (0.0%) |
| 18 to 34 Years | 17 (1.8%) | 12 (1.5%) |
| 35 to 64 Years | 159 (9.7%) | 86 (5.4%) |
| 65 to 74 Years | 109 (24.2%) | 95 (21.7%) |
| 75 Years and over | 55 (18.0%) | 147 (30.6%) |
Disability Class: Self-Care Difficulty
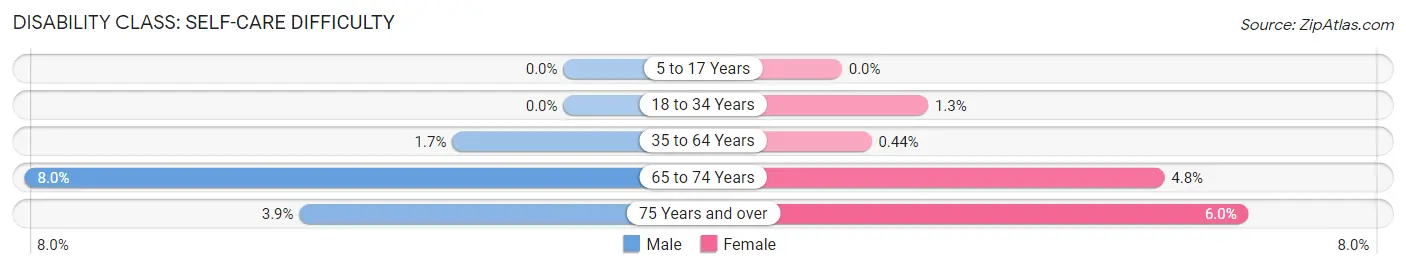
| Age Bracket | Male | Female |
| 5 to 17 Years | 0 (0.0%) | 0 (0.0%) |
| 18 to 34 Years | 0 (0.0%) | 10 (1.3%) |
| 35 to 64 Years | 27 (1.7%) | 7 (0.4%) |
| 65 to 74 Years | 36 (8.0%) | 21 (4.8%) |
| 75 Years and over | 12 (3.9%) | 29 (6.0%) |
Technology Access in Phelps County
Computing Device Access in Phelps County
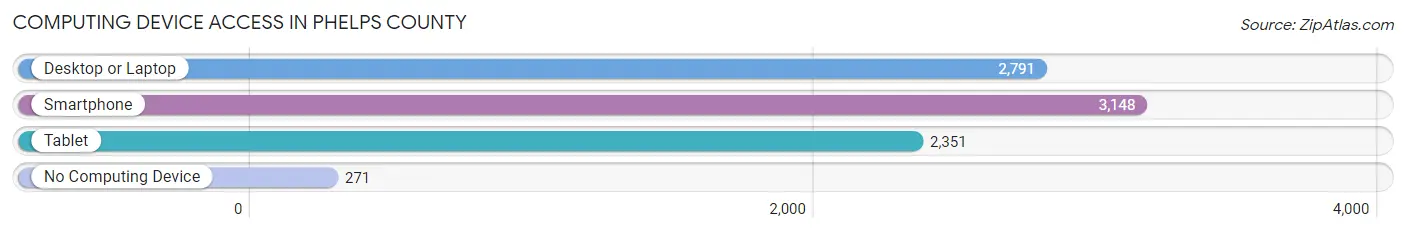
| Device Type | # Households | % Households |
| Desktop or Laptop | 2,791 | 73.4% |
| Smartphone | 3,148 | 82.7% |
| Tablet | 2,351 | 61.8% |
| No Computing Device | 271 | 7.1% |
| Total | 3,805 | 100.0% |
Internet Access in Phelps County
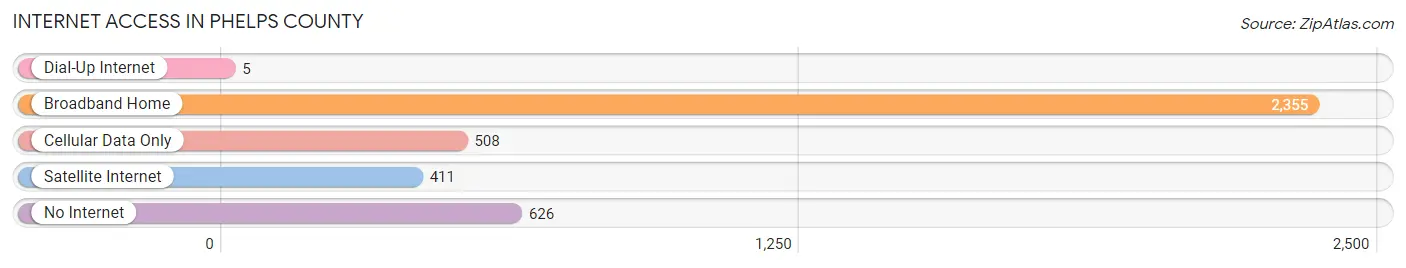
| Internet Type | # Households | % Households |
| Dial-Up Internet | 5 | 0.1% |
| Broadband Home | 2,355 | 61.9% |
| Cellular Data Only | 508 | 13.4% |
| Satellite Internet | 411 | 10.8% |
| No Internet | 626 | 16.5% |
| Total | 3,805 | 100.0% |
Phelps County Summary
Phelps County is located in the south-central region of Nebraska, and is bordered by Kearney, Buffalo, and Gosper counties. The county seat is Holdrege, and the county was named after William Phelps, a Union Army officer who was killed in the Civil War. The county has a total area of 576 square miles, and a population of 8,717 as of the 2010 census.
Geography
Phelps County is located in the south-central region of Nebraska, and is bordered by Kearney, Buffalo, and Gosper counties. The county has a total area of 576 square miles, and is mostly flat, with some rolling hills in the western part of the county. The county is drained by the Platte River, which flows through the county from north to south. The county is also home to several small lakes, including Lake Maloney, Lake McConaughy, and Lake Ogallala.
Climate
Phelps County has a humid continental climate, with hot summers and cold winters. The average annual temperature is around 50°F, and the average annual precipitation is around 22 inches.
Demographics
As of the 2010 census, Phelps County had a population of 8,717. The racial makeup of the county was 95.3% White, 0.7% African American, 0.4% Native American, 0.3% Asian, 0.1% Pacific Islander, 1.7% from other races, and 1.4% from two or more races. Hispanic or Latino of any race were 4.2% of the population.
Economy
Agriculture is the main economic driver in Phelps County, with corn, soybeans, and wheat being the main crops. The county is also home to several large livestock operations, including cattle, hogs, and sheep. The county is also home to several manufacturing companies, including a large food processing plant and a plastics manufacturing plant.
History
Phelps County was established in 1873, and was named after William Phelps, a Union Army officer who was killed in the Civil War. The county was originally home to several Native American tribes, including the Omaha, Pawnee, and Otoe. The first settlers arrived in the county in the late 1860s, and the county was officially organized in 1873.
The county grew rapidly in the late 19th and early 20th centuries, and by the 1920s, the county had a population of over 10,000. The county continued to grow throughout the 20th century, and by the 2010 census, the population had reached 8,717.
Today, Phelps County is a rural county with a strong agricultural base. The county is home to several small towns, including Holdrege, the county seat, and several small unincorporated communities. The county is also home to several large livestock operations, and several manufacturing companies.
Common Questions
What is Per Capita Income in Phelps County?
Per Capita income in Phelps County is $38,930.
What is the Median Family Income in Phelps County?
Median Family Income in Phelps County is $91,111.
What is the Median Household income in Phelps County?
Median Household Income in Phelps County is $65,114.
What is Income or Wage Gap in Phelps County?
Income or Wage Gap in Phelps County is 28.1%.
Women in Phelps County earn 71.9 cents for every dollar earned by a man.
What is Family Income Deficit in Phelps County?
Family Income Deficit in Phelps County is $9,894.
Families that are below poverty line in Phelps County earn $9,894 less on average than the poverty threshold level.
What is Inequality or Gini Index in Phelps County?
Inequality or Gini Index in Phelps County is 0.50.
What is the Total Population of Phelps County?
Total Population of Phelps County is 8,966.
What is the Total Male Population of Phelps County?
Total Male Population of Phelps County is 4,574.
What is the Total Female Population of Phelps County?
Total Female Population of Phelps County is 4,392.
What is the Ratio of Males per 100 Females in Phelps County?
There are 104.14 Males per 100 Females in Phelps County.
What is the Ratio of Females per 100 Males in Phelps County?
There are 96.02 Females per 100 Males in Phelps County.
What is the Median Population Age in Phelps County?
Median Population Age in Phelps County is 40.4 Years.
What is the Average Family Size in Phelps County
Average Family Size in Phelps County is 2.9 People.
What is the Average Household Size in Phelps County
Average Household Size in Phelps County is 2.3 People.
How Large is the Labor Force in Phelps County?
There are 4,557 People in the Labor Forcein in Phelps County.
What is the Percentage of People in the Labor Force in Phelps County?
64.9% of People are in the Labor Force in Phelps County.
What is the Unemployment Rate in Phelps County?
Unemployment Rate in Phelps County is 0.8%.