Perkins County, NE Map & Demographics
Perkins County Overview
$34,696
PER CAPITA INCOME
$80,972
AVG FAMILY INCOME
$61,786
AVG HOUSEHOLD INCOME
39.2%
WAGE / INCOME GAP [ % ]
60.8¢/ $1
WAGE / INCOME GAP [ $ ]
$7,802
FAMILY INCOME DEFICIT
0.43
INEQUALITY / GINI INDEX
2,860
TOTAL POPULATION
1,480
MALE POPULATION
1,380
FEMALE POPULATION
107.25
MALES / 100 FEMALES
93.24
FEMALES / 100 MALES
41.5
MEDIAN AGE
3.0
AVG FAMILY SIZE
2.5
AVG HOUSEHOLD SIZE
1,466
LABOR FORCE [ PEOPLE ]
65.8%
PERCENT IN LABOR FORCE
1.2%
UNEMPLOYMENT RATE
Perkins County Area Codes
Income in Perkins County
Income Overview in Perkins County
Per Capita Income in Perkins County is $34,696, while median incomes of families and households are $80,972 and $61,786 respectively.
| Characteristic | Number | Measure |
| Per Capita Income | 2,860 | $34,696 |
| Median Family Income | 799 | $80,972 |
| Mean Family Income | 799 | $96,303 |
| Median Household Income | 1,154 | $61,786 |
| Mean Household Income | 1,154 | $80,784 |
| Income Deficit | 799 | $7,802 |
| Wage / Income Gap (%) | 2,860 | 39.23% |
| Wage / Income Gap ($) | 2,860 | 60.77¢ per $1 |
| Gini / Inequality Index | 2,860 | 0.43 |
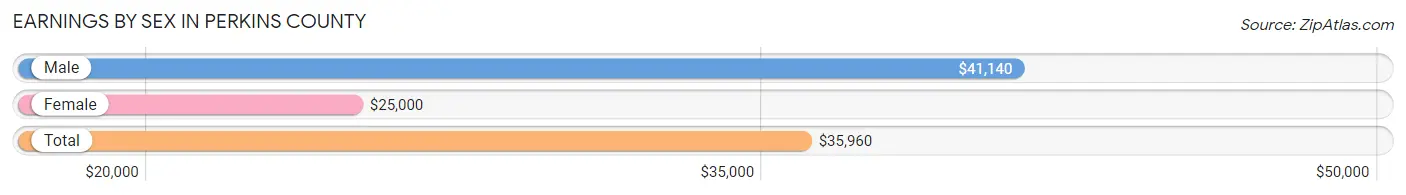
Earnings by Sex in Perkins County
Average Earnings in Perkins County are $35,960, $41,140 for men and $25,000 for women, a difference of 39.2%.
| Sex | Number | Average Earnings |
| Male | 907 (57.3%) | $41,140 |
| Female | 676 (42.7%) | $25,000 |
| Total | 1,583 (100.0%) | $35,960 |
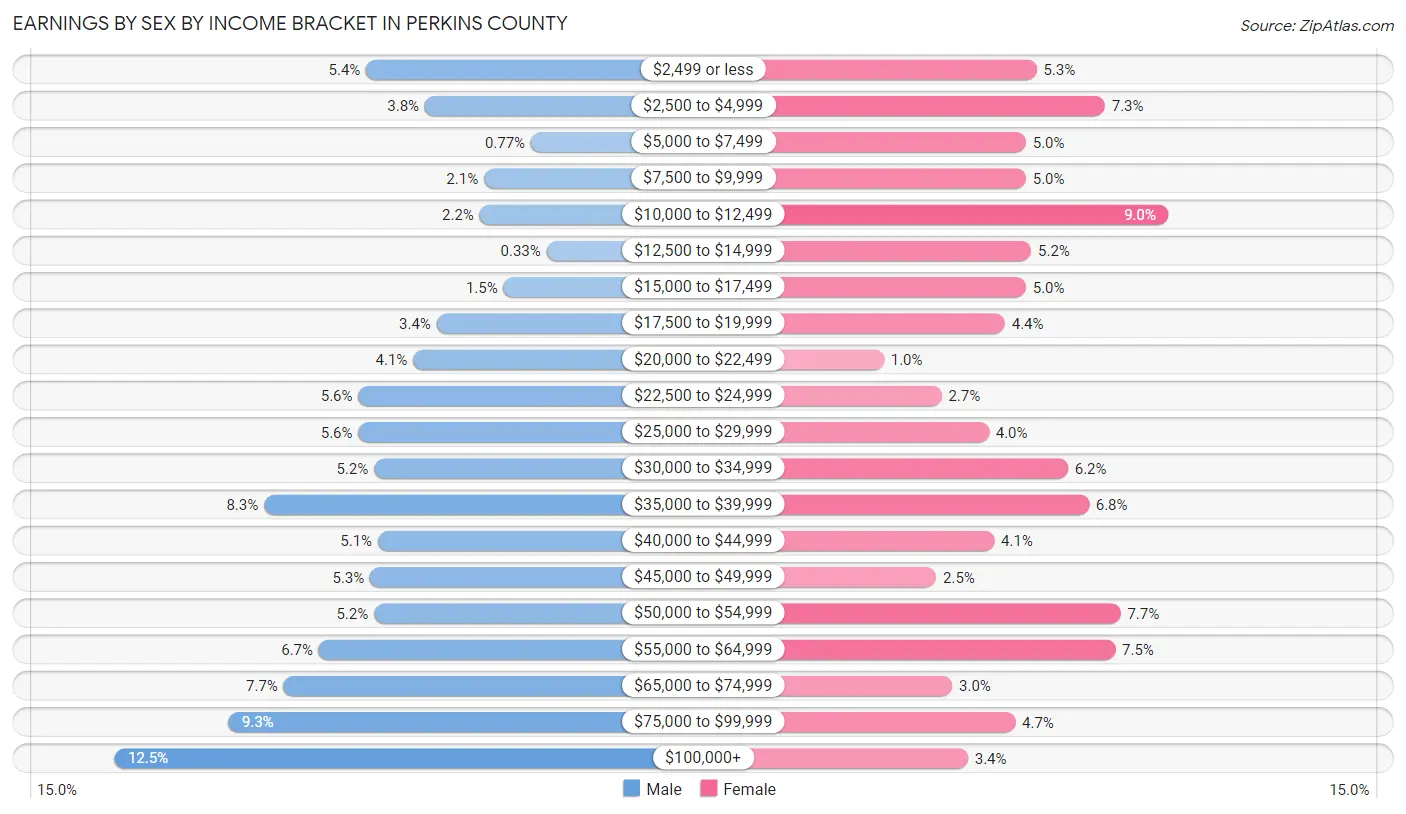
Earnings by Sex by Income Bracket in Perkins County
The most common earnings brackets in Perkins County are $100,000+ for men (113 | 12.5%) and $10,000 to $12,499 for women (61 | 9.0%).
| Income | Male | Female |
| $2,499 or less | 49 (5.4%) | 36 (5.3%) |
| $2,500 to $4,999 | 34 (3.7%) | 49 (7.2%) |
| $5,000 to $7,499 | 7 (0.8%) | 34 (5.0%) |
| $7,500 to $9,999 | 19 (2.1%) | 34 (5.0%) |
| $10,000 to $12,499 | 20 (2.2%) | 61 (9.0%) |
| $12,500 to $14,999 | 3 (0.3%) | 35 (5.2%) |
| $15,000 to $17,499 | 14 (1.5%) | 34 (5.0%) |
| $17,500 to $19,999 | 31 (3.4%) | 30 (4.4%) |
| $20,000 to $22,499 | 37 (4.1%) | 7 (1.0%) |
| $22,500 to $24,999 | 51 (5.6%) | 18 (2.7%) |
| $25,000 to $29,999 | 51 (5.6%) | 27 (4.0%) |
| $30,000 to $34,999 | 47 (5.2%) | 42 (6.2%) |
| $35,000 to $39,999 | 75 (8.3%) | 46 (6.8%) |
| $40,000 to $44,999 | 46 (5.1%) | 28 (4.1%) |
| $45,000 to $49,999 | 48 (5.3%) | 17 (2.5%) |
| $50,000 to $54,999 | 47 (5.2%) | 52 (7.7%) |
| $55,000 to $64,999 | 61 (6.7%) | 51 (7.5%) |
| $65,000 to $74,999 | 70 (7.7%) | 20 (3.0%) |
| $75,000 to $99,999 | 84 (9.3%) | 32 (4.7%) |
| $100,000+ | 113 (12.5%) | 23 (3.4%) |
| Total | 907 (100.0%) | 676 (100.0%) |
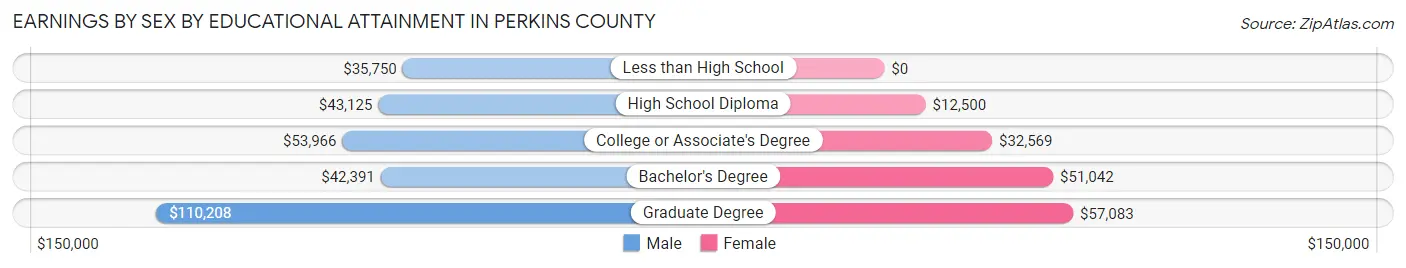
Earnings by Sex by Educational Attainment in Perkins County
Average earnings in Perkins County are $48,348 for men and $31,793 for women, a difference of 34.2%. Men with an educational attainment of graduate degree enjoy the highest average annual earnings of $110,208, while those with less than high school education earn the least with $35,750. Women with an educational attainment of graduate degree earn the most with the average annual earnings of $57,083, while those with high school diploma education have the smallest earnings of $12,500.
| Educational Attainment | Male Income | Female Income |
| Less than High School | $35,750 | $0 |
| High School Diploma | $43,125 | $12,500 |
| College or Associate's Degree | $53,966 | $32,569 |
| Bachelor's Degree | $42,391 | $51,042 |
| Graduate Degree | $110,208 | $57,083 |
| Total | $48,348 | $31,793 |
Family Income in Perkins County
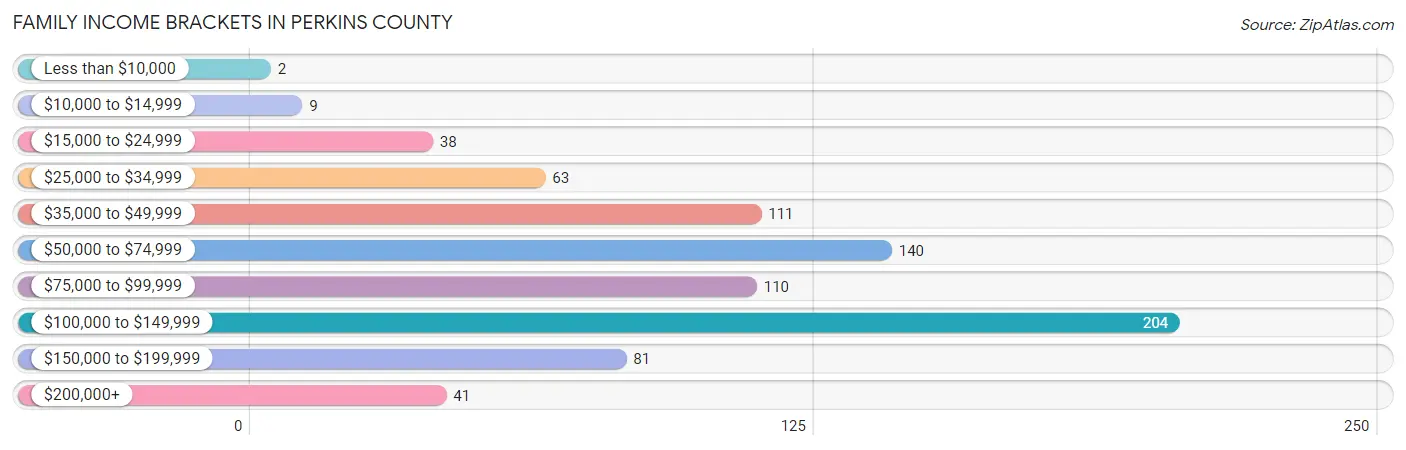
Family Income Brackets in Perkins County
According to the Perkins County family income data, there are 204 families falling into the $100,000 to $149,999 income range, which is the most common income bracket and makes up 25.5% of all families. Conversely, the less than $10,000 income bracket is the least frequent group with only 2 families (0.3%) belonging to this category.
| Income Bracket | # Families | % Families |
| Less than $10,000 | 2 | 0.3% |
| $10,000 to $14,999 | 9 | 1.1% |
| $15,000 to $24,999 | 38 | 4.8% |
| $25,000 to $34,999 | 63 | 7.9% |
| $35,000 to $49,999 | 111 | 13.9% |
| $50,000 to $74,999 | 140 | 17.5% |
| $75,000 to $99,999 | 110 | 13.8% |
| $100,000 to $149,999 | 204 | 25.5% |
| $150,000 to $199,999 | 81 | 10.1% |
| $200,000+ | 41 | 5.1% |
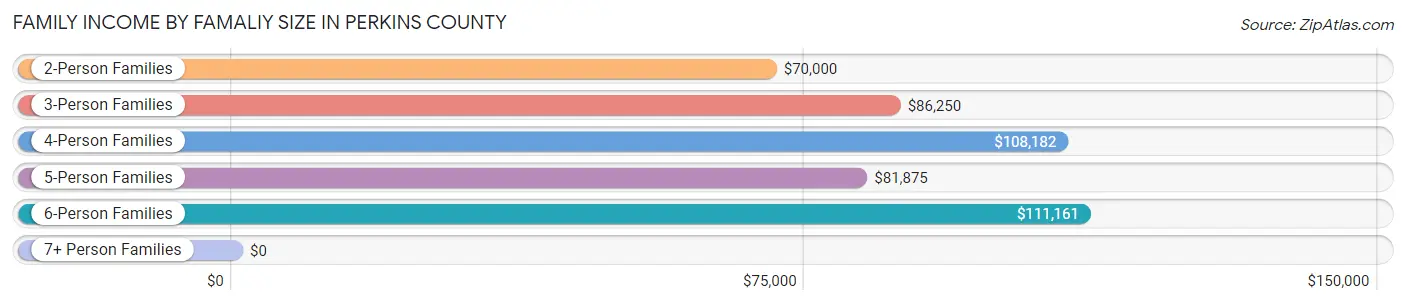
Family Income by Famaliy Size in Perkins County
6-person families (23 | 2.9%) account for the highest median family income in Perkins County with $111,161 per family, while 2-person families (474 | 59.3%) have the highest median income of $35,000 per family member.
| Income Bracket | # Families | Median Income |
| 2-Person Families | 474 (59.3%) | $70,000 |
| 3-Person Families | 108 (13.5%) | $86,250 |
| 4-Person Families | 94 (11.8%) | $108,182 |
| 5-Person Families | 97 (12.1%) | $81,875 |
| 6-Person Families | 23 (2.9%) | $111,161 |
| 7+ Person Families | 3 (0.4%) | $0 |
| Total | 799 (100.0%) | $80,972 |
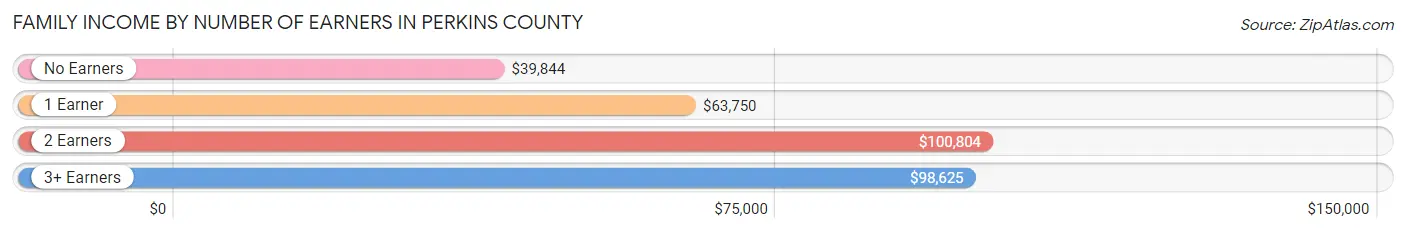
Family Income by Number of Earners in Perkins County
The median family income in Perkins County is $80,972, with families comprising 2 earners (405) having the highest median family income of $100,804, while families with no earners (118) have the lowest median family income of $39,844, accounting for 50.7% and 14.8% of families, respectively.
| Number of Earners | # Families | Median Income |
| No Earners | 118 (14.8%) | $39,844 |
| 1 Earner | 201 (25.2%) | $63,750 |
| 2 Earners | 405 (50.7%) | $100,804 |
| 3+ Earners | 75 (9.4%) | $98,625 |
| Total | 799 (100.0%) | $80,972 |
Household Income in Perkins County
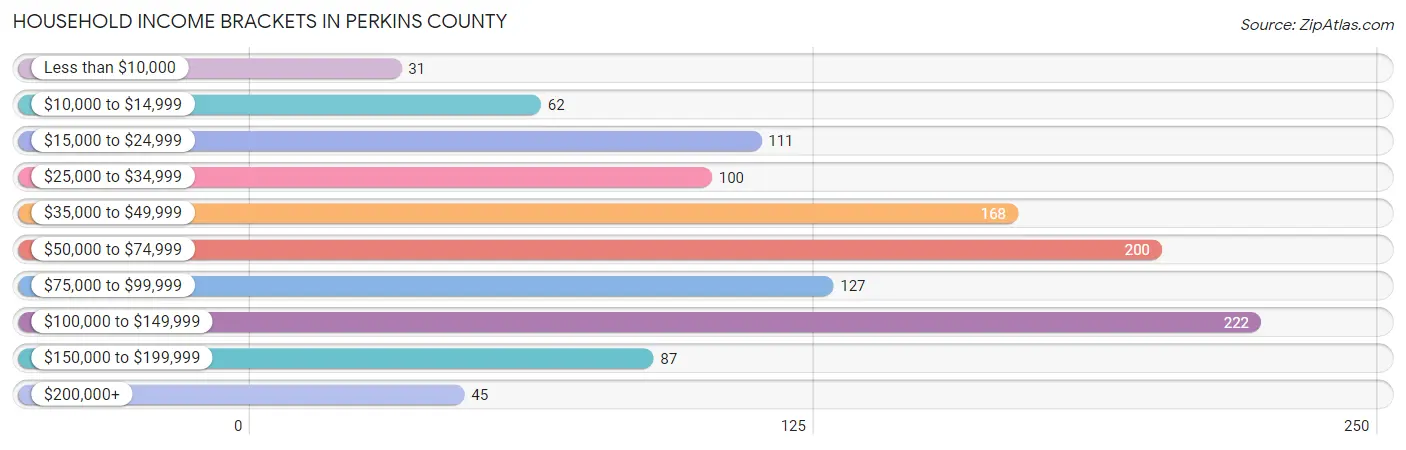
Household Income Brackets in Perkins County
With 222 households falling in the category, the $100,000 to $149,999 income range is the most frequent in Perkins County, accounting for 19.2% of all households. In contrast, only 31 households (2.7%) fall into the less than $10,000 income bracket, making it the least populous group.
| Income Bracket | # Households | % Households |
| Less than $10,000 | 31 | 2.7% |
| $10,000 to $14,999 | 62 | 5.4% |
| $15,000 to $24,999 | 111 | 9.6% |
| $25,000 to $34,999 | 100 | 8.7% |
| $35,000 to $49,999 | 168 | 14.6% |
| $50,000 to $74,999 | 200 | 17.3% |
| $75,000 to $99,999 | 127 | 11.0% |
| $100,000 to $149,999 | 222 | 19.2% |
| $150,000 to $199,999 | 87 | 7.5% |
| $200,000+ | 45 | 3.9% |
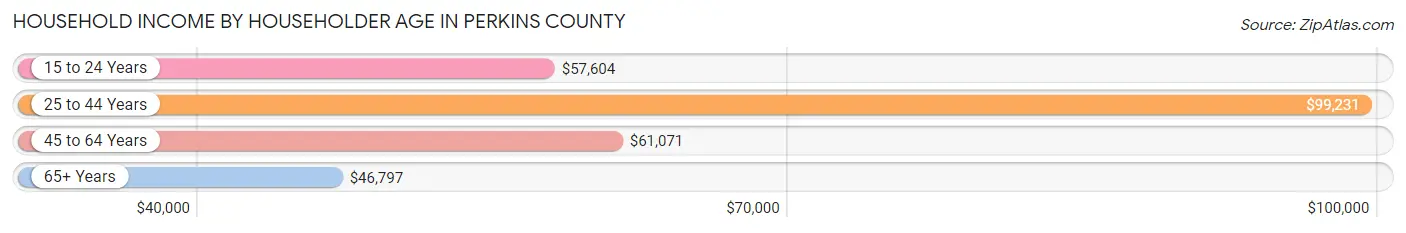
Household Income by Householder Age in Perkins County
The median household income in Perkins County is $61,786, with the highest median household income of $99,231 found in the 25 to 44 years age bracket for the primary householder. A total of 330 households (28.6%) fall into this category. Meanwhile, the 65+ years age bracket for the primary householder has the lowest median household income of $46,797, with 431 households (37.3%) in this group.
| Income Bracket | # Households | Median Income |
| 15 to 24 Years | 33 (2.9%) | $57,604 |
| 25 to 44 Years | 330 (28.6%) | $99,231 |
| 45 to 64 Years | 360 (31.2%) | $61,071 |
| 65+ Years | 431 (37.3%) | $46,797 |
| Total | 1,154 (100.0%) | $61,786 |
Poverty in Perkins County
Income Below Poverty by Sex and Age in Perkins County
With 6.6% poverty level for males and 11.0% for females among the residents of Perkins County, 16 and 17 year old males and 15 year old females are the most vulnerable to poverty, with 15 males (40.5%) and 4 females (25.0%) in their respective age groups living below the poverty level.
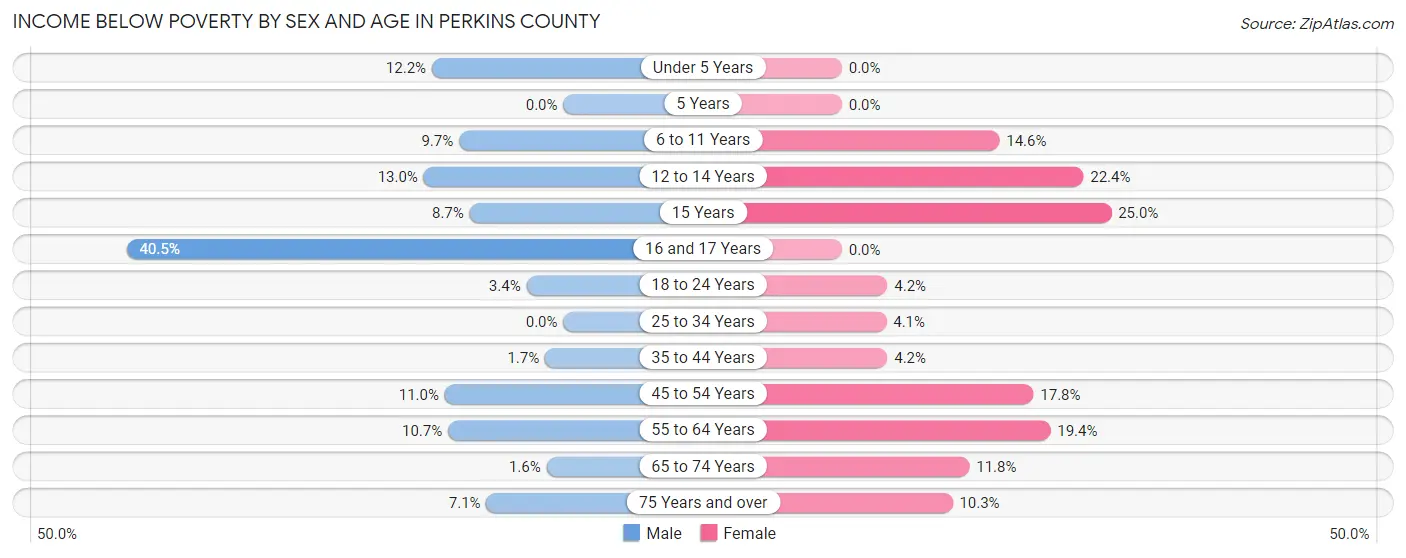
| Age Bracket | Male | Female |
| Under 5 Years | 10 (12.2%) | 0 (0.0%) |
| 5 Years | 0 (0.0%) | 0 (0.0%) |
| 6 to 11 Years | 12 (9.7%) | 19 (14.6%) |
| 12 to 14 Years | 7 (13.0%) | 13 (22.4%) |
| 15 Years | 2 (8.7%) | 4 (25.0%) |
| 16 and 17 Years | 15 (40.5%) | 0 (0.0%) |
| 18 to 24 Years | 4 (3.4%) | 3 (4.2%) |
| 25 to 34 Years | 0 (0.0%) | 5 (4.1%) |
| 35 to 44 Years | 4 (1.7%) | 7 (4.2%) |
| 45 to 54 Years | 11 (11.0%) | 24 (17.8%) |
| 55 to 64 Years | 20 (10.7%) | 36 (19.4%) |
| 65 to 74 Years | 3 (1.6%) | 22 (11.8%) |
| 75 Years and over | 9 (7.1%) | 15 (10.3%) |
| Total | 97 (6.6%) | 148 (11.0%) |
Income Above Poverty by Sex and Age in Perkins County
According to the poverty statistics in Perkins County, males aged 5 years and females aged under 5 years are the age groups that are most secure financially, with 100.0% of males and 100.0% of females in these age groups living above the poverty line.
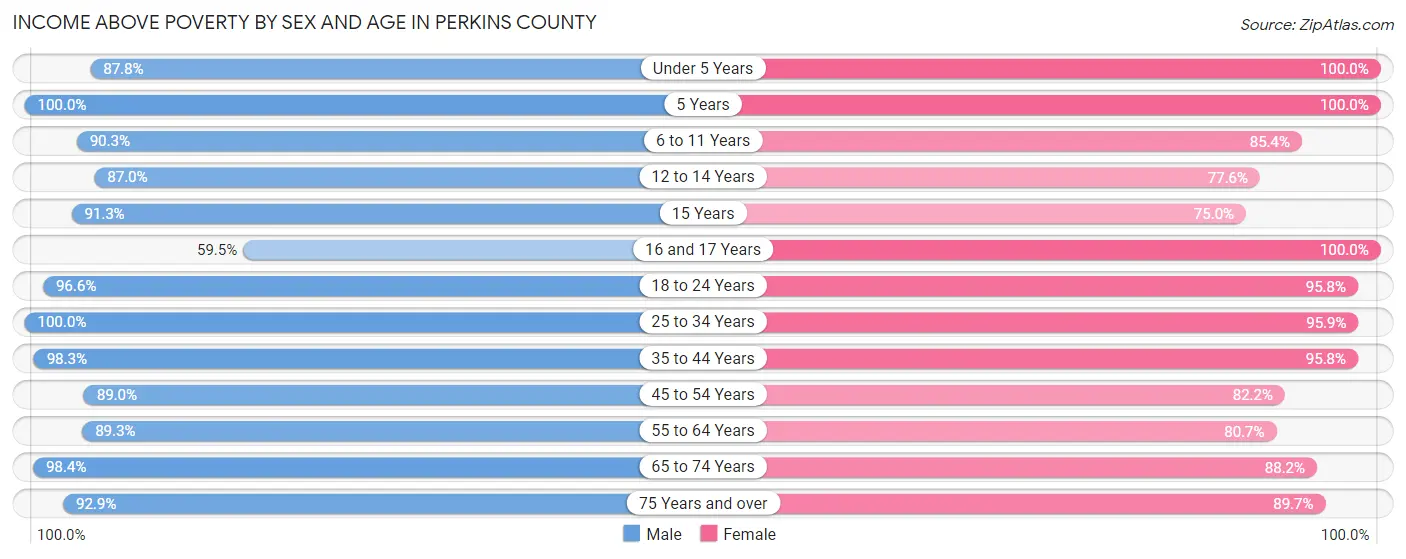
| Age Bracket | Male | Female |
| Under 5 Years | 72 (87.8%) | 75 (100.0%) |
| 5 Years | 47 (100.0%) | 18 (100.0%) |
| 6 to 11 Years | 112 (90.3%) | 111 (85.4%) |
| 12 to 14 Years | 47 (87.0%) | 45 (77.6%) |
| 15 Years | 21 (91.3%) | 12 (75.0%) |
| 16 and 17 Years | 22 (59.5%) | 38 (100.0%) |
| 18 to 24 Years | 113 (96.6%) | 68 (95.8%) |
| 25 to 34 Years | 151 (100.0%) | 116 (95.9%) |
| 35 to 44 Years | 231 (98.3%) | 159 (95.8%) |
| 45 to 54 Years | 89 (89.0%) | 111 (82.2%) |
| 55 to 64 Years | 167 (89.3%) | 150 (80.6%) |
| 65 to 74 Years | 189 (98.4%) | 164 (88.2%) |
| 75 Years and over | 117 (92.9%) | 131 (89.7%) |
| Total | 1,378 (93.4%) | 1,198 (89.0%) |
Income Below Poverty Among Married-Couple Families in Perkins County
The poverty statistics for married-couple families in Perkins County show that 5.3% or 39 of the total 732 families live below the poverty line. Families with 3 or 4 children have the highest poverty rate of 13.5%, comprising of 15 families. On the other hand, families with 1 or 2 children have the lowest poverty rate of 0.0%, which includes 0 families.
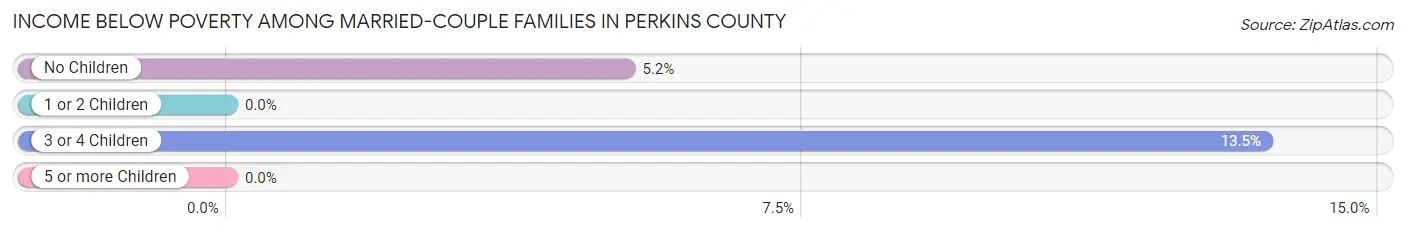
| Children | Above Poverty | Below Poverty |
| No Children | 438 (94.8%) | 24 (5.2%) |
| 1 or 2 Children | 156 (100.0%) | 0 (0.0%) |
| 3 or 4 Children | 96 (86.5%) | 15 (13.5%) |
| 5 or more Children | 3 (100.0%) | 0 (0.0%) |
| Total | 693 (94.7%) | 39 (5.3%) |
Income Below Poverty Among Single-Parent Households in Perkins County
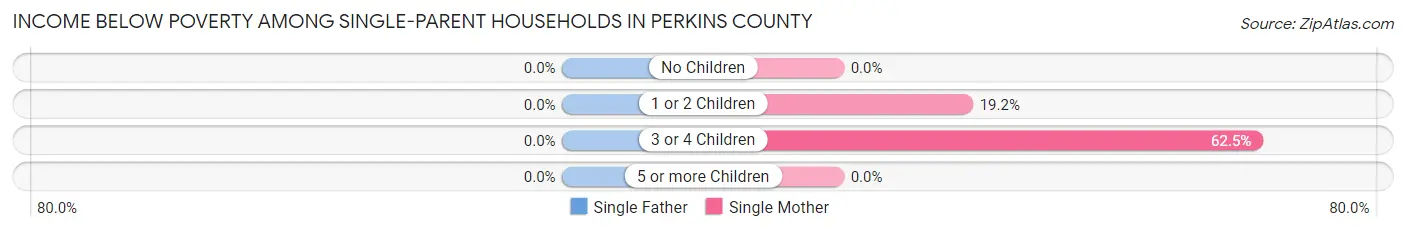
| Children | Single Father | Single Mother |
| No Children | 0 (0.0%) | 0 (0.0%) |
| 1 or 2 Children | 0 (0.0%) | 5 (19.2%) |
| 3 or 4 Children | 0 (0.0%) | 5 (62.5%) |
| 5 or more Children | 0 (0.0%) | 0 (0.0%) |
| Total | 0 (0.0%) | 10 (24.4%) |
Income Below Poverty Among Married-Couple vs Single-Parent Households in Perkins County
The poverty data for Perkins County shows that 39 of the married-couple family households (5.3%) and 10 of the single-parent households (14.9%) are living below the poverty level. Within the married-couple family households, those with 3 or 4 children have the highest poverty rate, with 15 households (13.5%) falling below the poverty line. Among the single-parent households, those with 3 or 4 children have the highest poverty rate, with 5 household (50.0%) living below poverty.
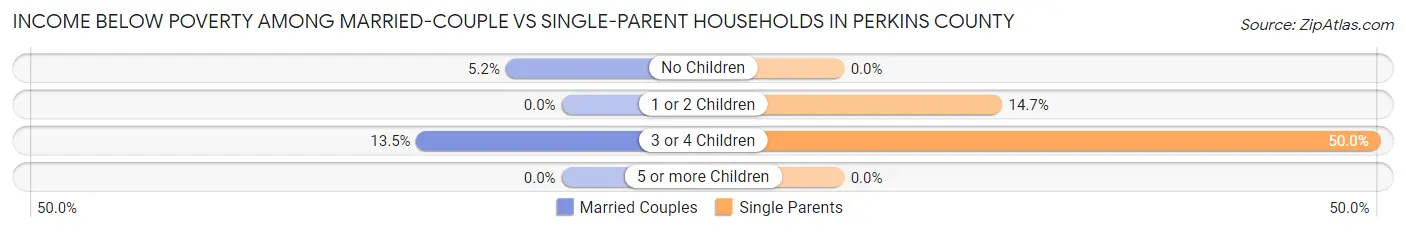
| Children | Married-Couple Families | Single-Parent Households |
| No Children | 24 (5.2%) | 0 (0.0%) |
| 1 or 2 Children | 0 (0.0%) | 5 (14.7%) |
| 3 or 4 Children | 15 (13.5%) | 5 (50.0%) |
| 5 or more Children | 0 (0.0%) | 0 (0.0%) |
| Total | 39 (5.3%) | 10 (14.9%) |
Race in Perkins County
The most populous races in Perkins County are White / Caucasian (2,693 | 94.2%), Hispanic or Latino (137 | 4.8%), and Two or more Races (109 | 3.8%).
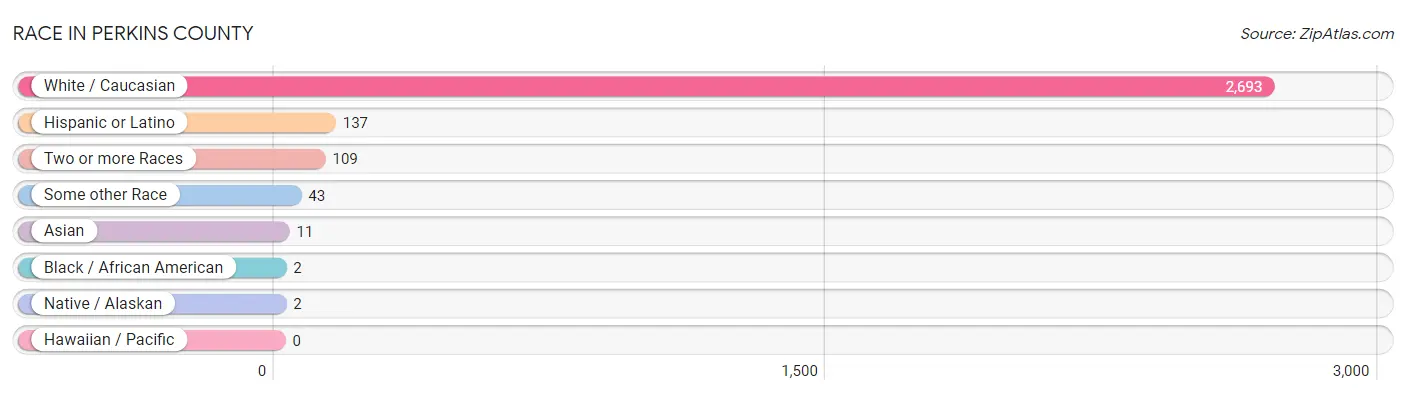
| Race | # Population | % Population |
| Asian | 11 | 0.4% |
| Black / African American | 2 | 0.1% |
| Hawaiian / Pacific | 0 | 0.0% |
| Hispanic or Latino | 137 | 4.8% |
| Native / Alaskan | 2 | 0.1% |
| White / Caucasian | 2,693 | 94.2% |
| Two or more Races | 109 | 3.8% |
| Some other Race | 43 | 1.5% |
| Total | 2,860 | 100.0% |
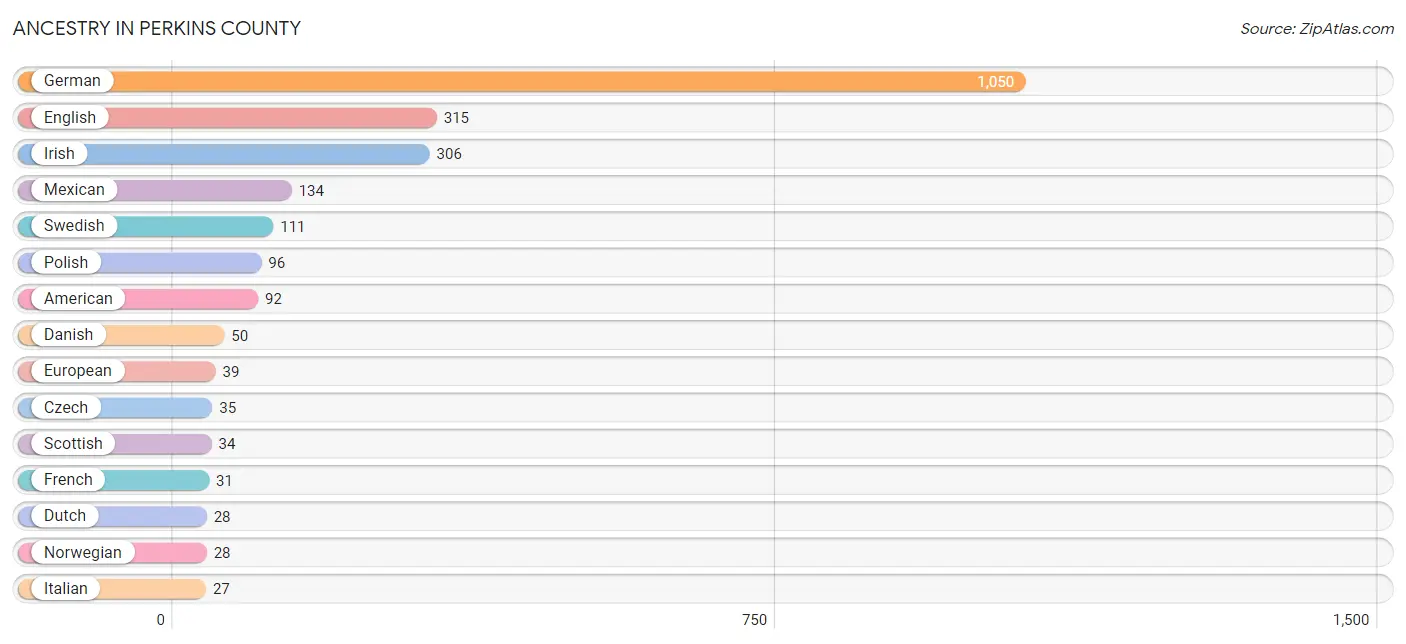
Ancestry in Perkins County
The most populous ancestries reported in Perkins County are German (1,050 | 36.7%), English (315 | 11.0%), Irish (306 | 10.7%), Mexican (134 | 4.7%), and Swedish (111 | 3.9%), together accounting for 67.0% of all Perkins County residents.
| Ancestry | # Population | % Population |
| American | 92 | 3.2% |
| Austrian | 3 | 0.1% |
| Belgian | 3 | 0.1% |
| Bhutanese | 14 | 0.5% |
| Brazilian | 4 | 0.1% |
| British | 11 | 0.4% |
| Burmese | 2 | 0.1% |
| Choctaw | 2 | 0.1% |
| Cuban | 2 | 0.1% |
| Czech | 35 | 1.2% |
| Czechoslovakian | 10 | 0.4% |
| Danish | 50 | 1.8% |
| Dutch | 28 | 1.0% |
| English | 315 | 11.0% |
| European | 39 | 1.4% |
| French | 31 | 1.1% |
| German | 1,050 | 36.7% |
| German Russian | 4 | 0.1% |
| Greek | 4 | 0.1% |
| Hungarian | 2 | 0.1% |
| Indian (Asian) | 2 | 0.1% |
| Irish | 306 | 10.7% |
| Italian | 27 | 0.9% |
| Korean | 2 | 0.1% |
| Mexican | 134 | 4.7% |
| Native Hawaiian | 2 | 0.1% |
| Norwegian | 28 | 1.0% |
| Pennsylvania German | 9 | 0.3% |
| Polish | 96 | 3.4% |
| Russian | 24 | 0.8% |
| Samoan | 2 | 0.1% |
| Scandinavian | 5 | 0.2% |
| Scotch-Irish | 23 | 0.8% |
| Scottish | 34 | 1.2% |
| Spaniard | 1 | 0.0% |
| Sri Lankan | 2 | 0.1% |
| Swedish | 111 | 3.9% |
| Swiss | 17 | 0.6% |
| Thai | 2 | 0.1% |
| Ukrainian | 1 | 0.0% |
| Welsh | 9 | 0.3% | View All 41 Rows |
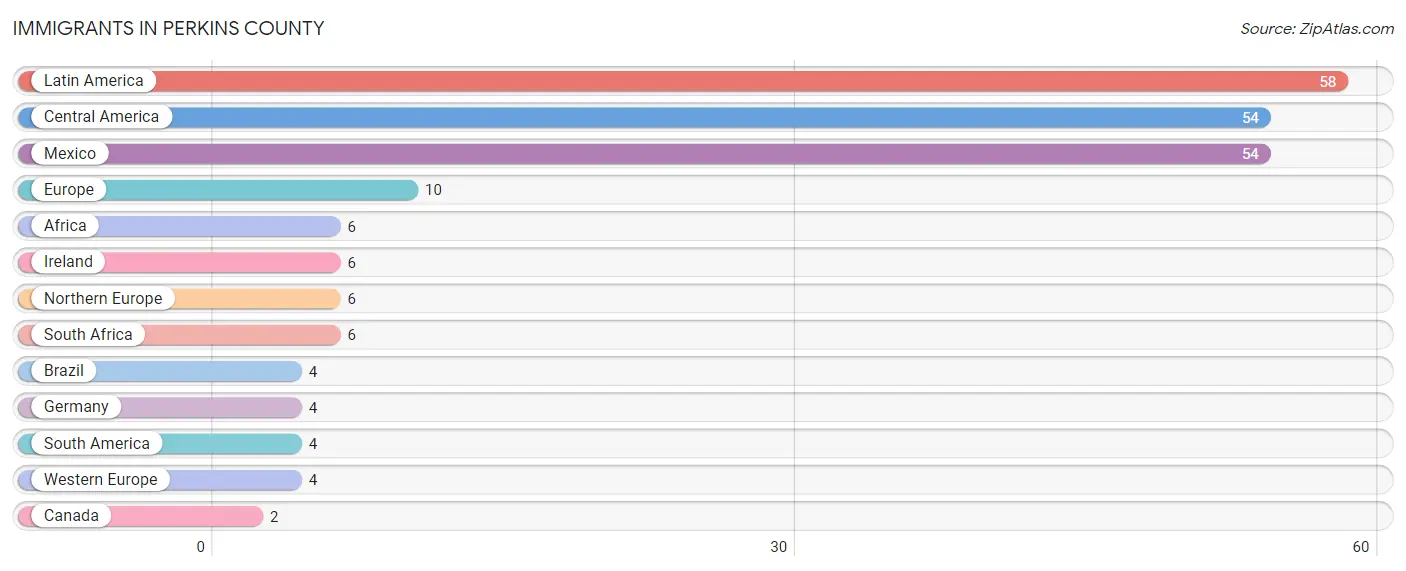
Immigrants in Perkins County
The most numerous immigrant groups reported in Perkins County came from Latin America (58 | 2.0%), Central America (54 | 1.9%), Mexico (54 | 1.9%), Europe (10 | 0.4%), and Africa (6 | 0.2%), together accounting for 6.4% of all Perkins County residents.
| Immigration Origin | # Population | % Population |
| Africa | 6 | 0.2% |
| Brazil | 4 | 0.1% |
| Canada | 2 | 0.1% |
| Central America | 54 | 1.9% |
| Europe | 10 | 0.4% |
| Germany | 4 | 0.1% |
| Ireland | 6 | 0.2% |
| Latin America | 58 | 2.0% |
| Mexico | 54 | 1.9% |
| Northern Europe | 6 | 0.2% |
| South Africa | 6 | 0.2% |
| South America | 4 | 0.1% |
| Western Europe | 4 | 0.1% | View All 13 Rows |
Sex and Age in Perkins County
Sex and Age in Perkins County
The most populous age groups in Perkins County are 5 to 9 Years (148 | 10.0%) for men and 10 to 14 Years (118 | 8.6%) for women.
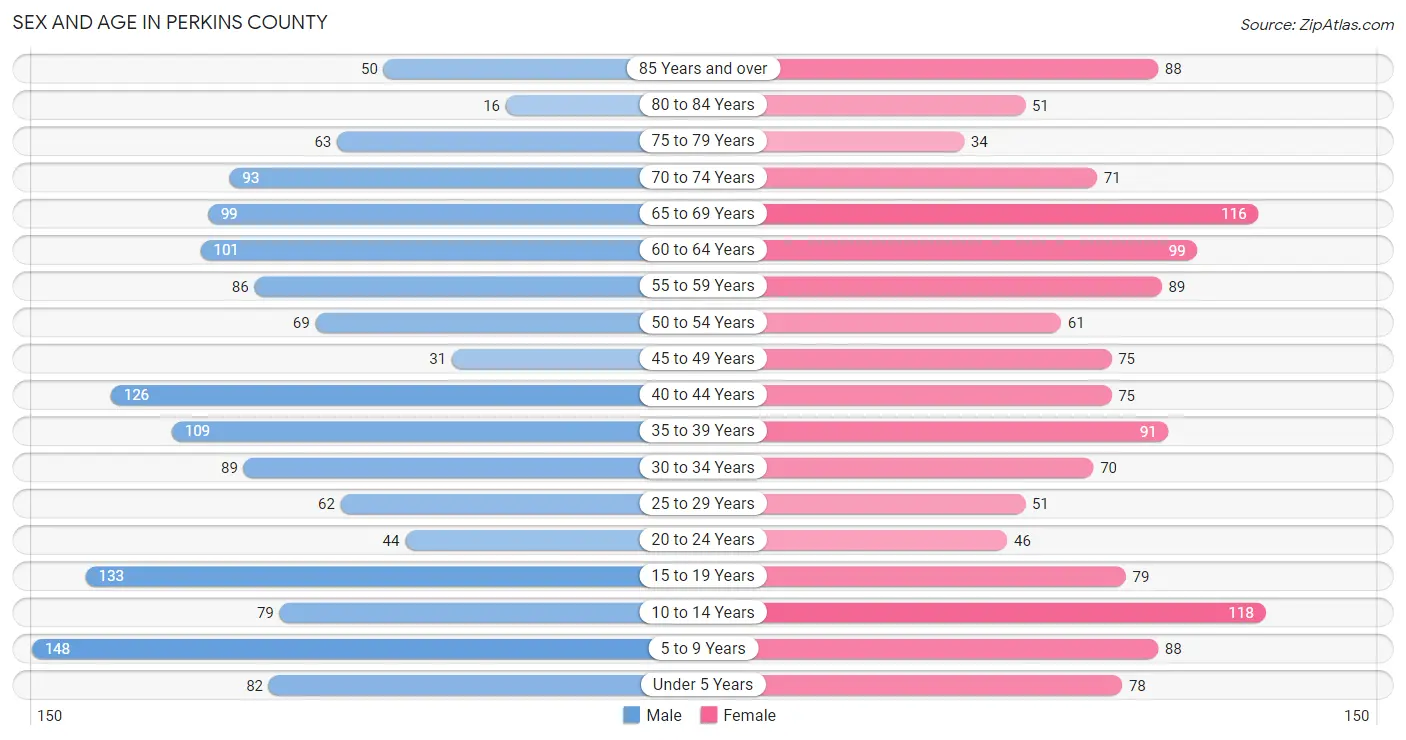
| Age Bracket | Male | Female |
| Under 5 Years | 82 (5.5%) | 78 (5.7%) |
| 5 to 9 Years | 148 (10.0%) | 88 (6.4%) |
| 10 to 14 Years | 79 (5.3%) | 118 (8.6%) |
| 15 to 19 Years | 133 (9.0%) | 79 (5.7%) |
| 20 to 24 Years | 44 (3.0%) | 46 (3.3%) |
| 25 to 29 Years | 62 (4.2%) | 51 (3.7%) |
| 30 to 34 Years | 89 (6.0%) | 70 (5.1%) |
| 35 to 39 Years | 109 (7.4%) | 91 (6.6%) |
| 40 to 44 Years | 126 (8.5%) | 75 (5.4%) |
| 45 to 49 Years | 31 (2.1%) | 75 (5.4%) |
| 50 to 54 Years | 69 (4.7%) | 61 (4.4%) |
| 55 to 59 Years | 86 (5.8%) | 89 (6.5%) |
| 60 to 64 Years | 101 (6.8%) | 99 (7.2%) |
| 65 to 69 Years | 99 (6.7%) | 116 (8.4%) |
| 70 to 74 Years | 93 (6.3%) | 71 (5.1%) |
| 75 to 79 Years | 63 (4.3%) | 34 (2.5%) |
| 80 to 84 Years | 16 (1.1%) | 51 (3.7%) |
| 85 Years and over | 50 (3.4%) | 88 (6.4%) |
| Total | 1,480 (100.0%) | 1,380 (100.0%) |
Families and Households in Perkins County
Median Family Size in Perkins County
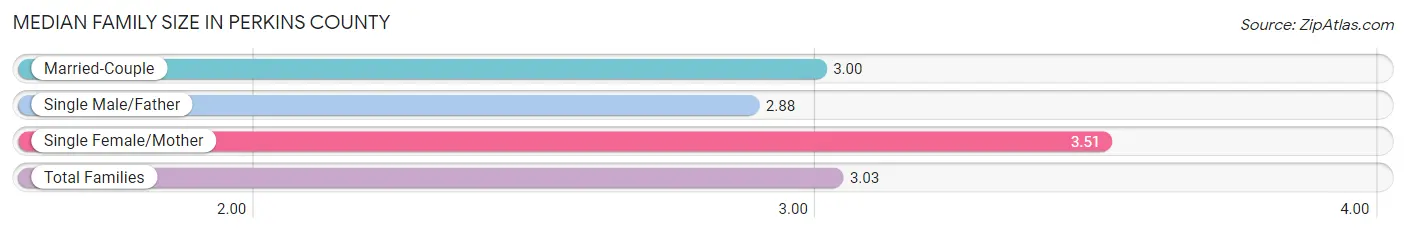
The median family size in Perkins County is 3.03 persons per family, with single female/mother families (41 | 5.1%) accounting for the largest median family size of 3.51 persons per family. On the other hand, single male/father families (26 | 3.3%) represent the smallest median family size with 2.88 persons per family.
| Family Type | # Families | Family Size |
| Married-Couple | 732 (91.6%) | 3.00 |
| Single Male/Father | 26 (3.3%) | 2.88 |
| Single Female/Mother | 41 (5.1%) | 3.51 |
| Total Families | 799 (100.0%) | 3.03 |
Median Household Size in Perkins County
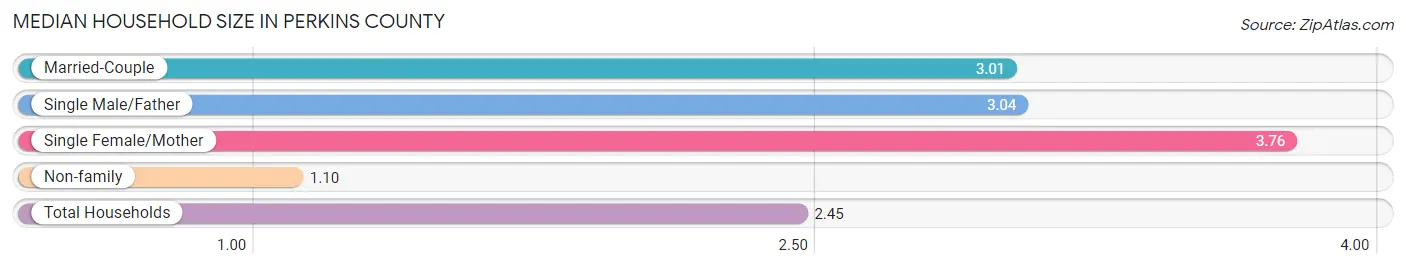
The median household size in Perkins County is 2.45 persons per household, with single female/mother households (41 | 3.5%) accounting for the largest median household size of 3.76 persons per household. non-family households (355 | 30.8%) represent the smallest median household size with 1.10 persons per household.
| Household Type | # Households | Household Size |
| Married-Couple | 732 (63.4%) | 3.01 |
| Single Male/Father | 26 (2.2%) | 3.04 |
| Single Female/Mother | 41 (3.5%) | 3.76 |
| Non-family | 355 (30.8%) | 1.10 |
| Total Households | 1,154 (100.0%) | 2.45 |
Household Size by Marriage Status in Perkins County
Out of a total of 1,154 households in Perkins County, 799 (69.2%) are family households, while 355 (30.8%) are nonfamily households. The most numerous type of family households are 2-person households, comprising 472, and the most common type of nonfamily households are 1-person households, comprising 330.
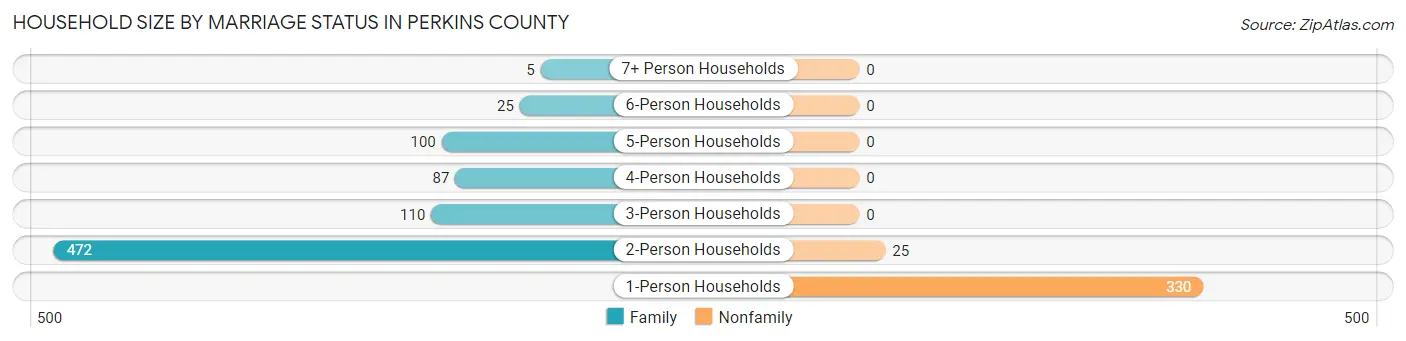
| Household Size | Family Households | Nonfamily Households |
| 1-Person Households | - | 330 (28.6%) |
| 2-Person Households | 472 (40.9%) | 25 (2.2%) |
| 3-Person Households | 110 (9.5%) | 0 (0.0%) |
| 4-Person Households | 87 (7.5%) | 0 (0.0%) |
| 5-Person Households | 100 (8.7%) | 0 (0.0%) |
| 6-Person Households | 25 (2.2%) | 0 (0.0%) |
| 7+ Person Households | 5 (0.4%) | 0 (0.0%) |
| Total | 799 (69.2%) | 355 (30.8%) |
Female Fertility in Perkins County
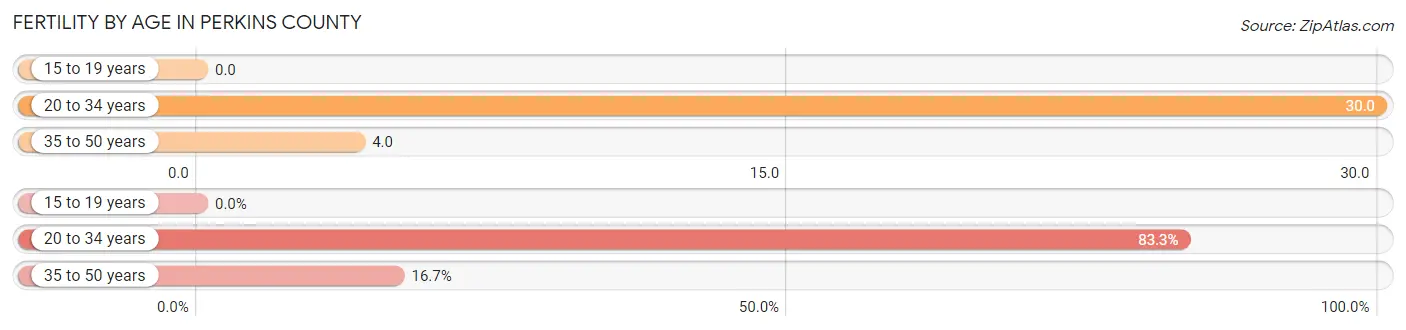
Fertility by Age in Perkins County
Average fertility rate in Perkins County is 12.0 births per 1,000 women. Women in the age bracket of 20 to 34 years have the highest fertility rate with 30.0 births per 1,000 women. Women in the age bracket of 20 to 34 years acount for 83.3% of all women with births.
| Age Bracket | Women with Births | Births / 1,000 Women |
| 15 to 19 years | 0 (0.0%) | 0.0 |
| 20 to 34 years | 5 (83.3%) | 30.0 |
| 35 to 50 years | 1 (16.7%) | 4.0 |
| Total | 6 (100.0%) | 12.0 |
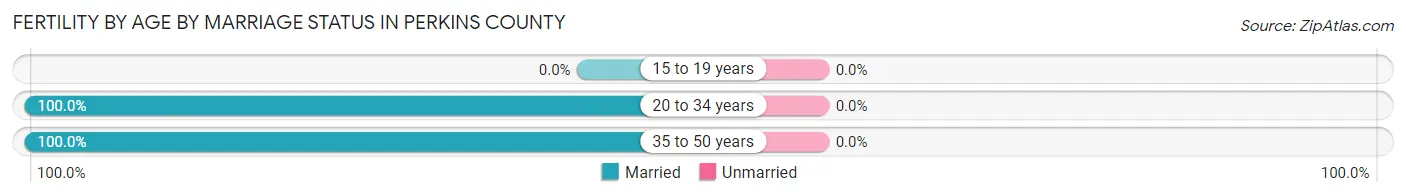
Fertility by Age by Marriage Status in Perkins County
| Age Bracket | Married | Unmarried |
| 15 to 19 years | 0 (0.0%) | 0 (0.0%) |
| 20 to 34 years | 5 (100.0%) | 0 (0.0%) |
| 35 to 50 years | 1 (100.0%) | 0 (0.0%) |
| Total | 6 (100.0%) | 0 (0.0%) |
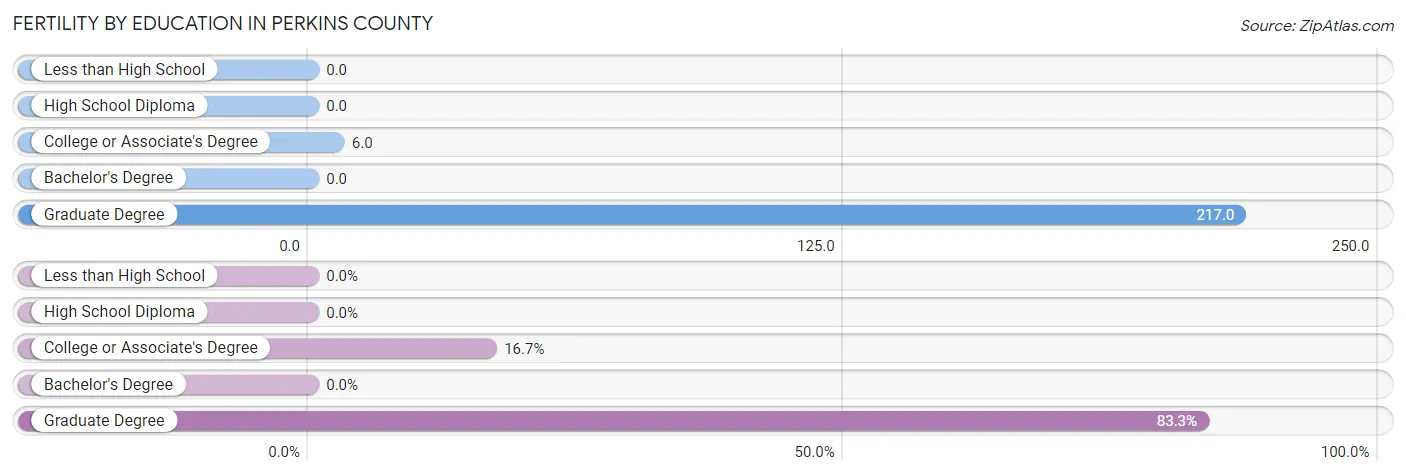
Fertility by Education in Perkins County
| Educational Attainment | Women with Births | Births / 1,000 Women |
| Less than High School | 0 (0.0%) | 0.0 |
| High School Diploma | 0 (0.0%) | 0.0 |
| College or Associate's Degree | 1 (16.7%) | 6.0 |
| Bachelor's Degree | 0 (0.0%) | 0.0 |
| Graduate Degree | 5 (83.3%) | 217.0 |
| Total | 6 (100.0%) | 12.0 |
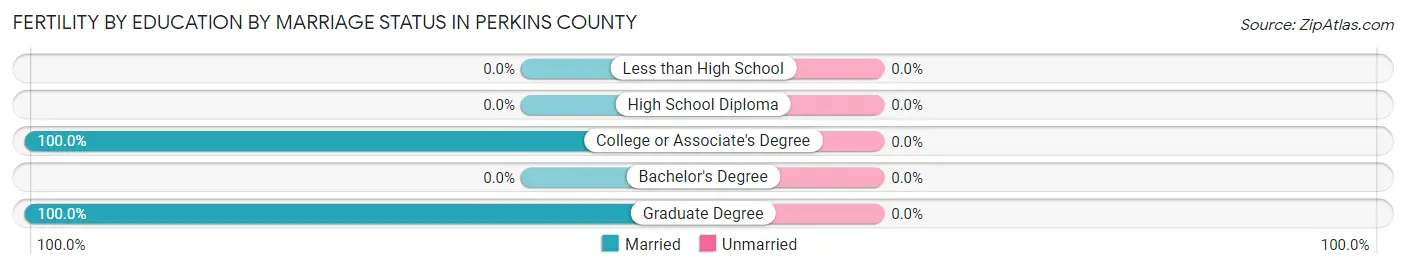
Fertility by Education by Marriage Status in Perkins County
| Educational Attainment | Married | Unmarried |
| Less than High School | 0 (0.0%) | 0 (0.0%) |
| High School Diploma | 0 (0.0%) | 0 (0.0%) |
| College or Associate's Degree | 1 (100.0%) | 0 (0.0%) |
| Bachelor's Degree | 0 (0.0%) | 0 (0.0%) |
| Graduate Degree | 5 (100.0%) | 0 (0.0%) |
| Total | 6 (100.0%) | 0 (0.0%) |
Employment Characteristics in Perkins County
Employment by Class of Employer in Perkins County
Among the 1,414 employed individuals in Perkins County, private company employees (673 | 47.6%), self-employed (not incorporated) (260 | 18.4%), and local government employees (190 | 13.4%) make up the most common classes of employment.
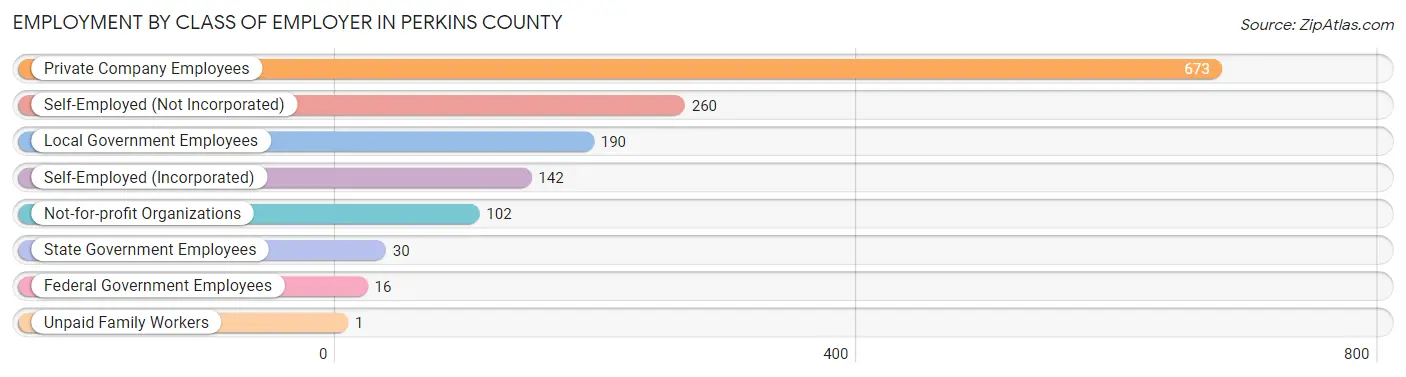
| Employer Class | # Employees | % Employees |
| Private Company Employees | 673 | 47.6% |
| Self-Employed (Incorporated) | 142 | 10.0% |
| Self-Employed (Not Incorporated) | 260 | 18.4% |
| Not-for-profit Organizations | 102 | 7.2% |
| Local Government Employees | 190 | 13.4% |
| State Government Employees | 30 | 2.1% |
| Federal Government Employees | 16 | 1.1% |
| Unpaid Family Workers | 1 | 0.1% |
| Total | 1,414 | 100.0% |
Employment Status by Age in Perkins County
According to the labor force statistics for Perkins County, out of the total population over 16 years of age (2,228), 65.8% or 1,466 individuals are in the labor force, with 1.2% or 18 of them unemployed. The age group with the highest labor force participation rate is 20 to 24 years, with 94.4% or 85 individuals in the labor force. Within the labor force, the 16 to 19 years age range has the highest percentage of unemployed individuals, with 6.3% or 8 of them being unemployed.
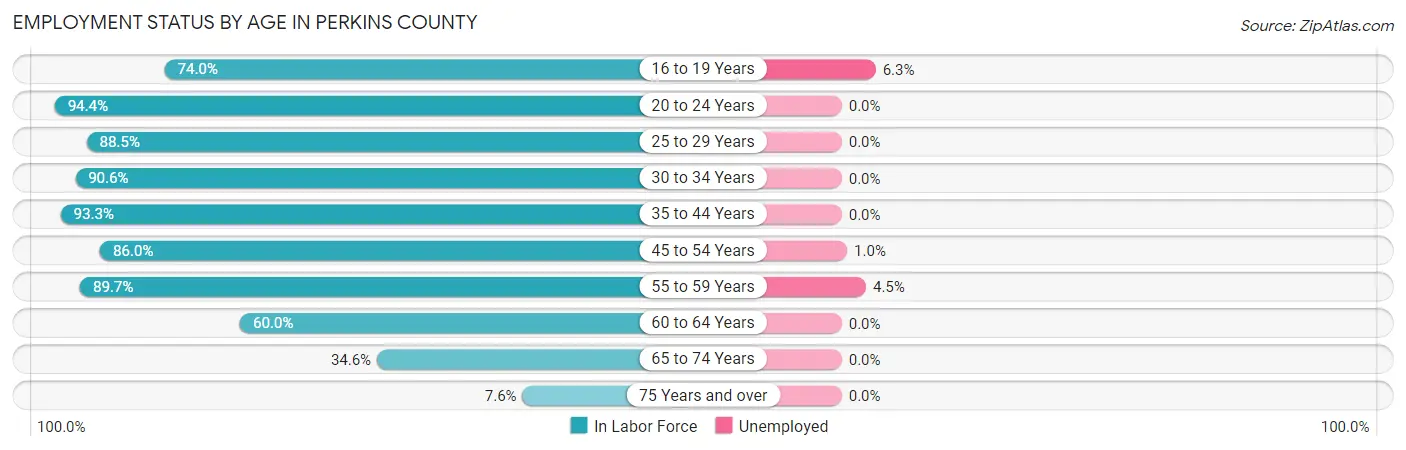
| Age Bracket | In Labor Force | Unemployed |
| 16 to 19 Years | 128 (74.0%) | 8 (6.3%) |
| 20 to 24 Years | 85 (94.4%) | 0 (0.0%) |
| 25 to 29 Years | 100 (88.5%) | 0 (0.0%) |
| 30 to 34 Years | 144 (90.6%) | 0 (0.0%) |
| 35 to 44 Years | 374 (93.3%) | 0 (0.0%) |
| 45 to 54 Years | 203 (86.0%) | 2 (1.0%) |
| 55 to 59 Years | 157 (89.7%) | 7 (4.5%) |
| 60 to 64 Years | 120 (60.0%) | 0 (0.0%) |
| 65 to 74 Years | 131 (34.6%) | 0 (0.0%) |
| 75 Years and over | 23 (7.6%) | 0 (0.0%) |
| Total | 1,466 (65.8%) | 18 (1.2%) |
Employment Status by Educational Attainment in Perkins County
According to labor force statistics for Perkins County, 85.5% of individuals (1,098) out of the total population between 25 and 64 years of age (1,284) are in the labor force, with 0.8% or 9 of them being unemployed. The group with the highest labor force participation rate are those with the educational attainment of college / associate degree, with 91.5% or 495 individuals in the labor force. Within the labor force, individuals with bachelor's degree or higher education have the highest percentage of unemployment, with 2.2% or 6 of them being unemployed.
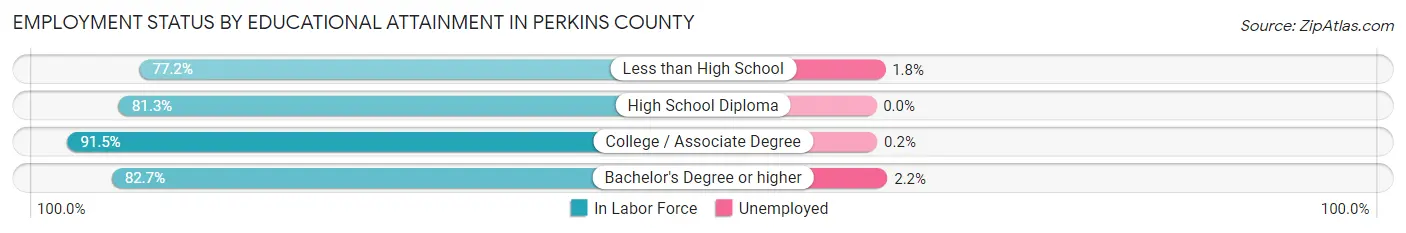
| Educational Attainment | In Labor Force | Unemployed |
| Less than High School | 112 (77.2%) | 3 (1.8%) |
| High School Diploma | 218 (81.3%) | 0 (0.0%) |
| College / Associate Degree | 495 (91.5%) | 1 (0.2%) |
| Bachelor's Degree or higher | 273 (82.7%) | 7 (2.2%) |
| Total | 1,098 (85.5%) | 10 (0.8%) |
Employment Occupations by Sex in Perkins County
Management, Business, Science and Arts Occupations
The most common Management, Business, Science and Arts occupations in Perkins County are Management (263 | 18.2%), Community & Social Service (117 | 8.1%), Education Instruction & Library (98 | 6.8%), Health Diagnosing & Treating (88 | 6.1%), and Health Technologists (61 | 4.2%).
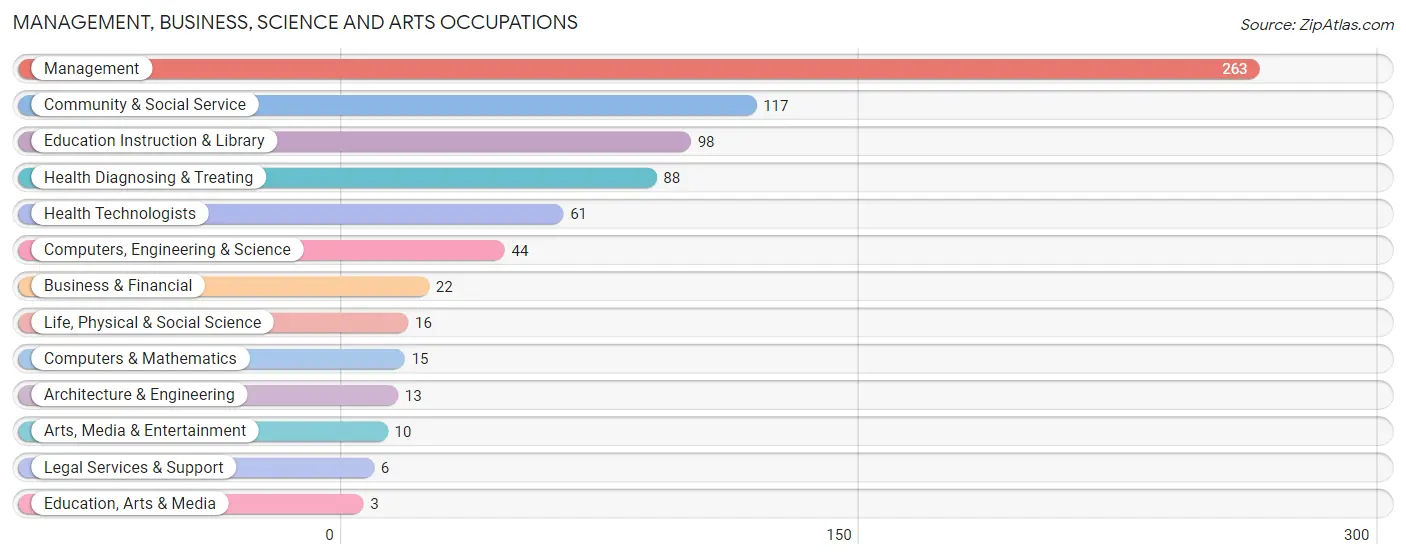
Management, Business, Science and Arts Occupations by Sex
Within the Management, Business, Science and Arts occupations in Perkins County, the most male-oriented occupations are Architecture & Engineering (100.0%), Life, Physical & Social Science (87.5%), and Management (86.7%), while the most female-oriented occupations are Legal Services & Support (100.0%), Arts, Media & Entertainment (100.0%), and Community & Social Service (94.0%).
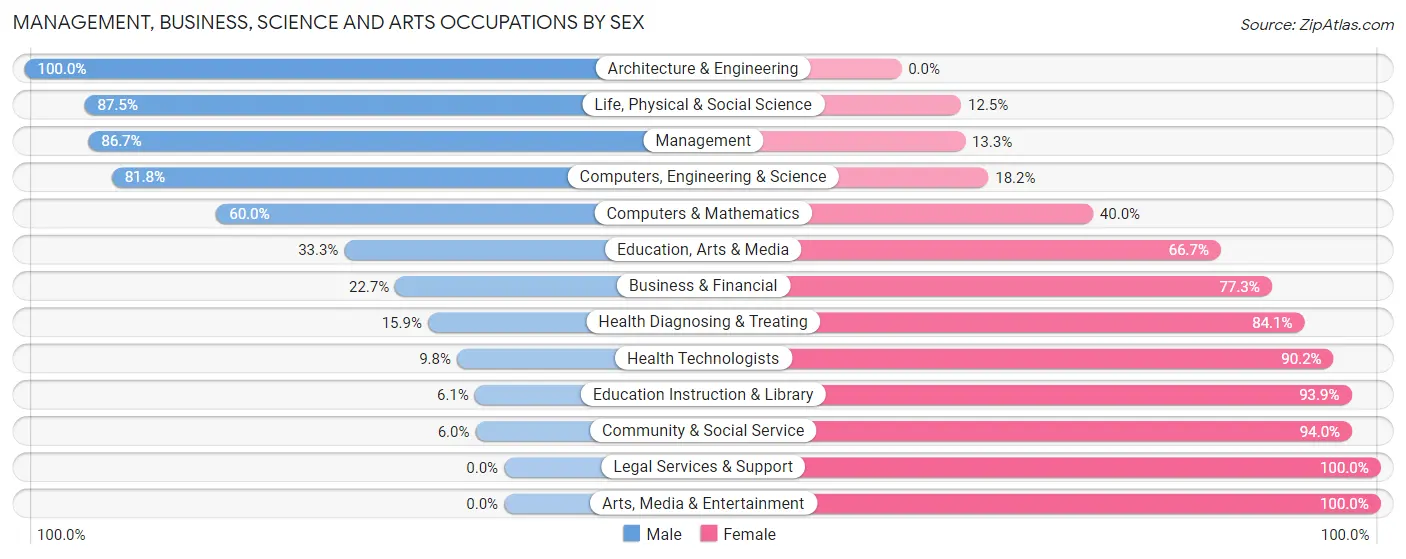
| Occupation | Male | Female |
| Management | 228 (86.7%) | 35 (13.3%) |
| Business & Financial | 5 (22.7%) | 17 (77.3%) |
| Computers, Engineering & Science | 36 (81.8%) | 8 (18.2%) |
| Computers & Mathematics | 9 (60.0%) | 6 (40.0%) |
| Architecture & Engineering | 13 (100.0%) | 0 (0.0%) |
| Life, Physical & Social Science | 14 (87.5%) | 2 (12.5%) |
| Community & Social Service | 7 (6.0%) | 110 (94.0%) |
| Education, Arts & Media | 1 (33.3%) | 2 (66.7%) |
| Legal Services & Support | 0 (0.0%) | 6 (100.0%) |
| Education Instruction & Library | 6 (6.1%) | 92 (93.9%) |
| Arts, Media & Entertainment | 0 (0.0%) | 10 (100.0%) |
| Health Diagnosing & Treating | 14 (15.9%) | 74 (84.1%) |
| Health Technologists | 6 (9.8%) | 55 (90.2%) |
| Total (Category) | 290 (54.3%) | 244 (45.7%) |
| Total (Overall) | 832 (57.5%) | 616 (42.5%) |
Services Occupations
The most common Services occupations in Perkins County are Food Preparation & Serving (122 | 8.4%), Personal Care & Service (65 | 4.5%), Cleaning & Maintenance (32 | 2.2%), Healthcare Support (20 | 1.4%), and Security & Protection (7 | 0.5%).
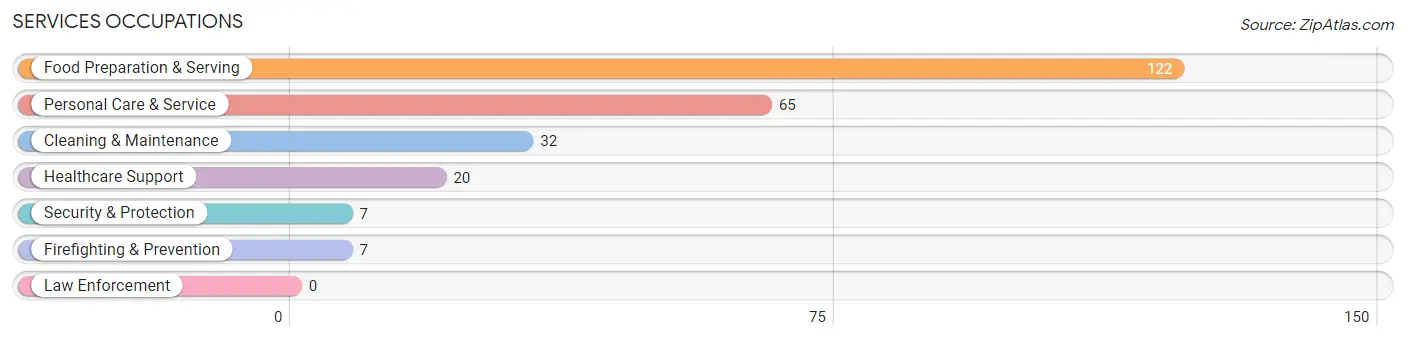
Services Occupations by Sex
Within the Services occupations in Perkins County, the most male-oriented occupations are Security & Protection (100.0%), Firefighting & Prevention (100.0%), and Cleaning & Maintenance (84.4%), while the most female-oriented occupations are Healthcare Support (90.0%), Personal Care & Service (66.1%), and Food Preparation & Serving (53.3%).
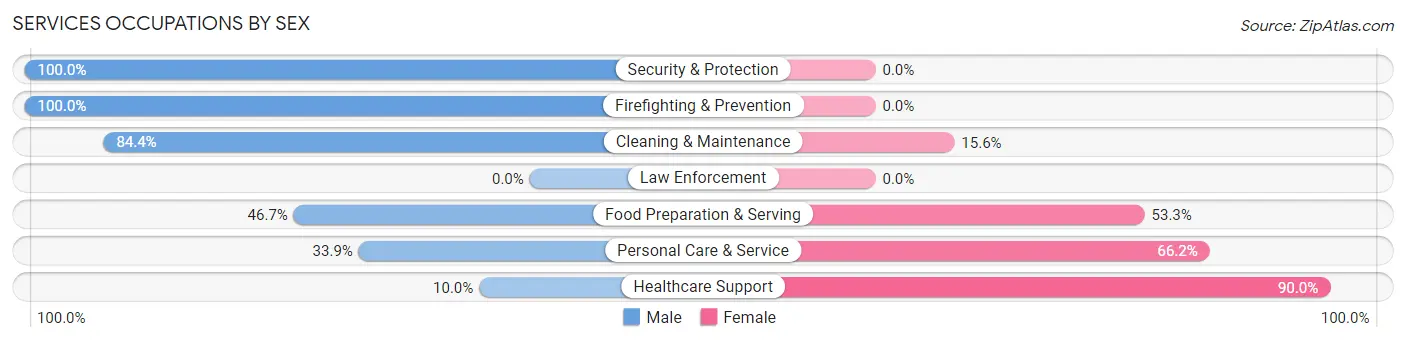
| Occupation | Male | Female |
| Healthcare Support | 2 (10.0%) | 18 (90.0%) |
| Security & Protection | 7 (100.0%) | 0 (0.0%) |
| Firefighting & Prevention | 7 (100.0%) | 0 (0.0%) |
| Law Enforcement | 0 (0.0%) | 0 (0.0%) |
| Food Preparation & Serving | 57 (46.7%) | 65 (53.3%) |
| Cleaning & Maintenance | 27 (84.4%) | 5 (15.6%) |
| Personal Care & Service | 22 (33.9%) | 43 (66.1%) |
| Total (Category) | 115 (46.8%) | 131 (53.2%) |
| Total (Overall) | 832 (57.5%) | 616 (42.5%) |
Sales and Office Occupations
The most common Sales and Office occupations in Perkins County are Office & Administration (161 | 11.1%), and Sales & Related (105 | 7.2%).
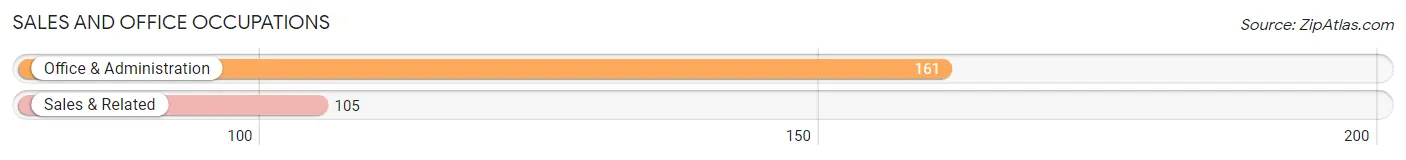
Sales and Office Occupations by Sex
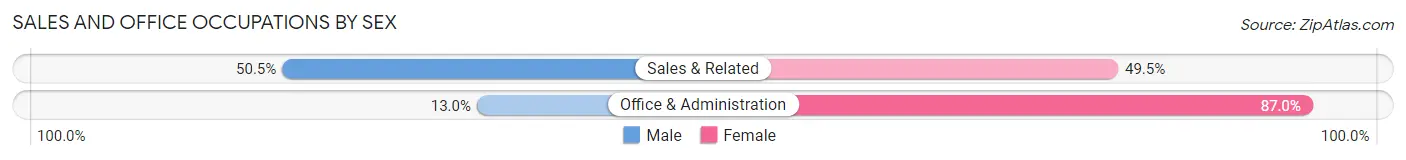
| Occupation | Male | Female |
| Sales & Related | 53 (50.5%) | 52 (49.5%) |
| Office & Administration | 21 (13.0%) | 140 (87.0%) |
| Total (Category) | 74 (27.8%) | 192 (72.2%) |
| Total (Overall) | 832 (57.5%) | 616 (42.5%) |
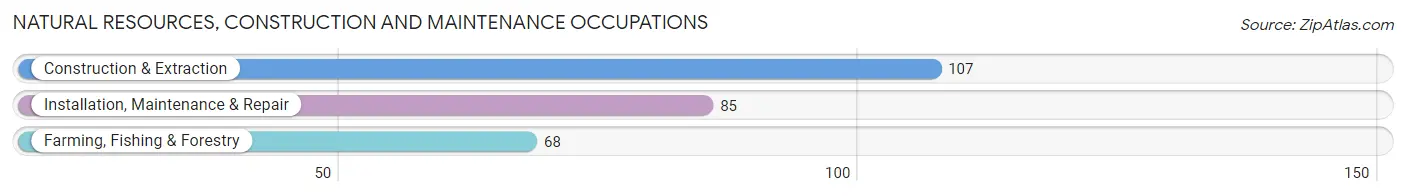
Natural Resources, Construction and Maintenance Occupations
The most common Natural Resources, Construction and Maintenance occupations in Perkins County are Construction & Extraction (107 | 7.4%), Installation, Maintenance & Repair (85 | 5.9%), and Farming, Fishing & Forestry (68 | 4.7%).
Natural Resources, Construction and Maintenance Occupations by Sex
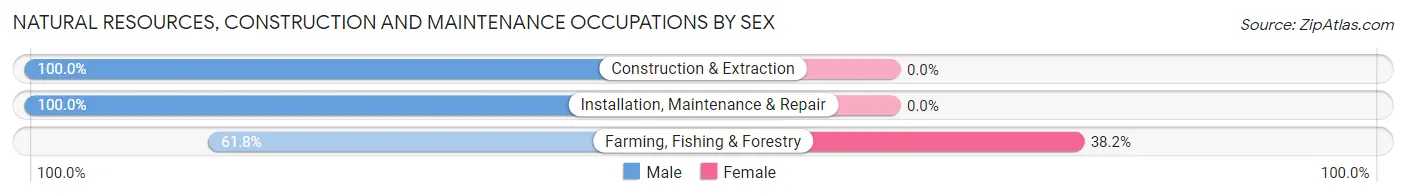
| Occupation | Male | Female |
| Farming, Fishing & Forestry | 42 (61.8%) | 26 (38.2%) |
| Construction & Extraction | 107 (100.0%) | 0 (0.0%) |
| Installation, Maintenance & Repair | 85 (100.0%) | 0 (0.0%) |
| Total (Category) | 234 (90.0%) | 26 (10.0%) |
| Total (Overall) | 832 (57.5%) | 616 (42.5%) |
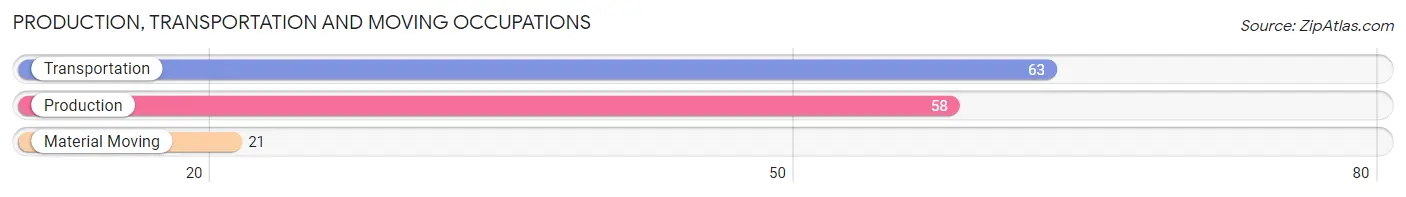
Production, Transportation and Moving Occupations
The most common Production, Transportation and Moving occupations in Perkins County are Transportation (63 | 4.3%), Production (58 | 4.0%), and Material Moving (21 | 1.5%).
Production, Transportation and Moving Occupations by Sex
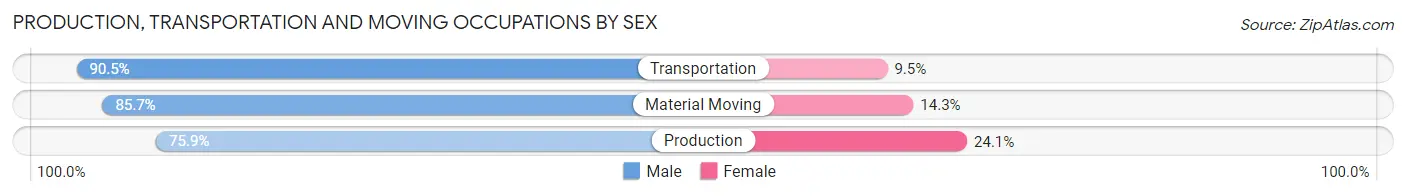
| Occupation | Male | Female |
| Production | 44 (75.9%) | 14 (24.1%) |
| Transportation | 57 (90.5%) | 6 (9.5%) |
| Material Moving | 18 (85.7%) | 3 (14.3%) |
| Total (Category) | 119 (83.8%) | 23 (16.2%) |
| Total (Overall) | 832 (57.5%) | 616 (42.5%) |
Employment Industries by Sex in Perkins County
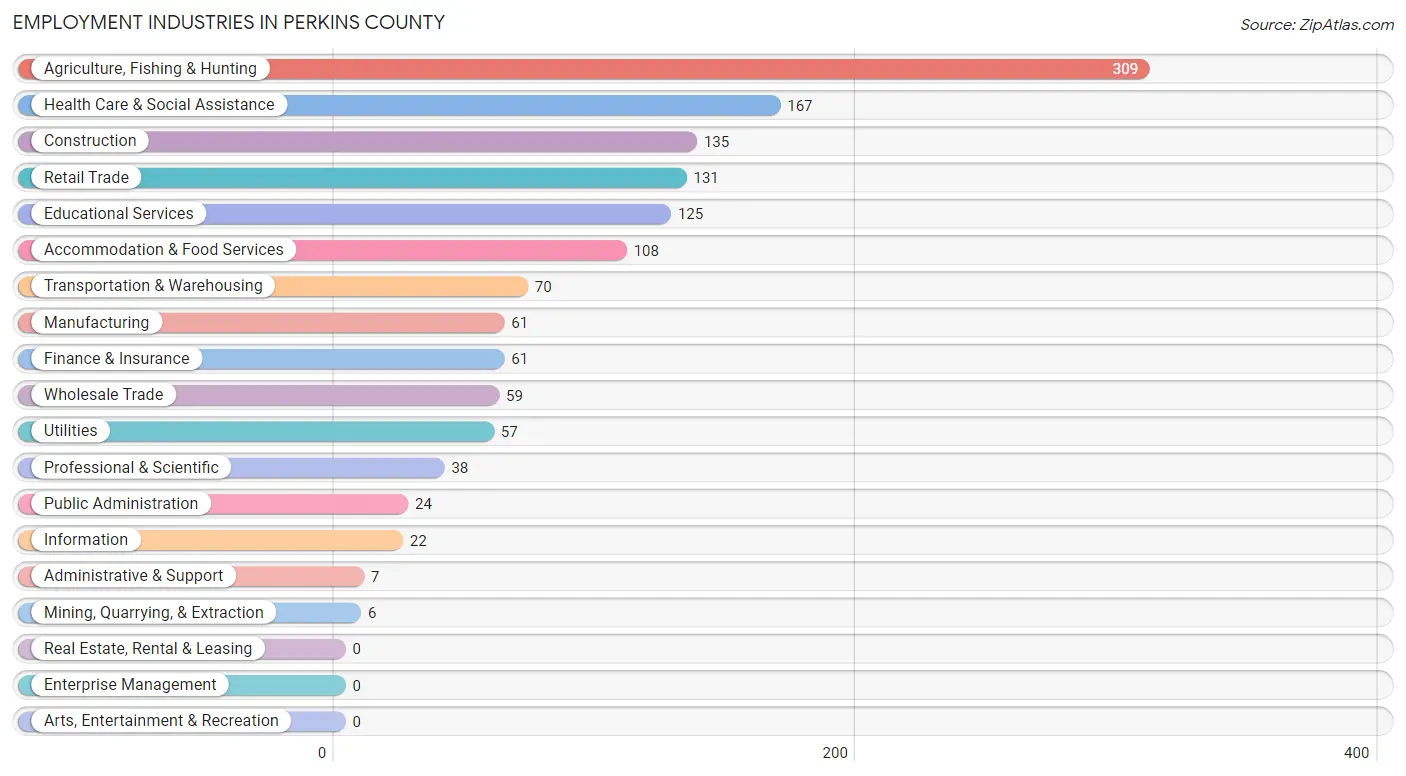
Employment Industries in Perkins County
The major employment industries in Perkins County include Agriculture, Fishing & Hunting (309 | 21.3%), Health Care & Social Assistance (167 | 11.5%), Construction (135 | 9.3%), Retail Trade (131 | 9.0%), and Educational Services (125 | 8.6%).
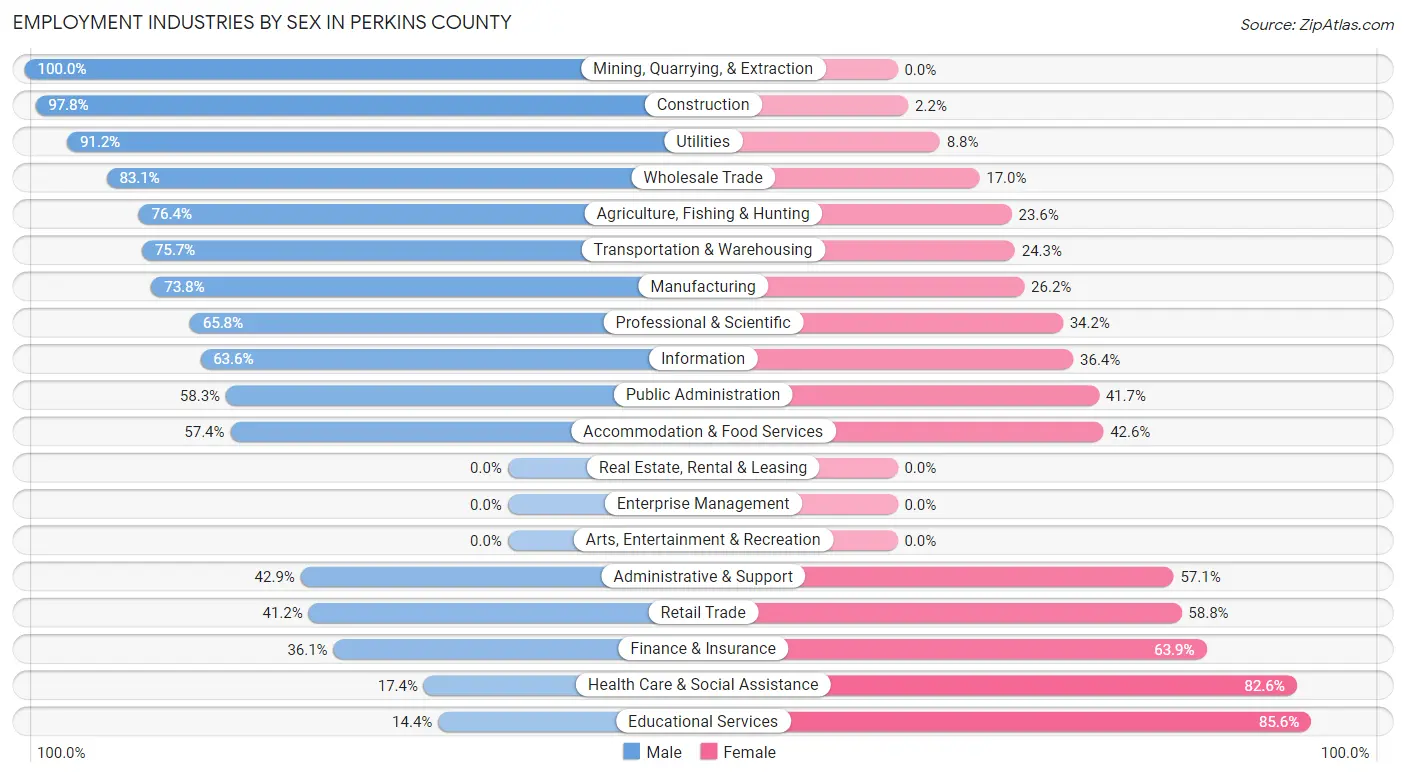
Employment Industries by Sex in Perkins County
The Perkins County industries that see more men than women are Mining, Quarrying, & Extraction (100.0%), Construction (97.8%), and Utilities (91.2%), whereas the industries that tend to have a higher number of women are Educational Services (85.6%), Health Care & Social Assistance (82.6%), and Finance & Insurance (63.9%).
| Industry | Male | Female |
| Agriculture, Fishing & Hunting | 236 (76.4%) | 73 (23.6%) |
| Mining, Quarrying, & Extraction | 6 (100.0%) | 0 (0.0%) |
| Construction | 132 (97.8%) | 3 (2.2%) |
| Manufacturing | 45 (73.8%) | 16 (26.2%) |
| Wholesale Trade | 49 (83.1%) | 10 (17.0%) |
| Retail Trade | 54 (41.2%) | 77 (58.8%) |
| Transportation & Warehousing | 53 (75.7%) | 17 (24.3%) |
| Utilities | 52 (91.2%) | 5 (8.8%) |
| Information | 14 (63.6%) | 8 (36.4%) |
| Finance & Insurance | 22 (36.1%) | 39 (63.9%) |
| Real Estate, Rental & Leasing | 0 (0.0%) | 0 (0.0%) |
| Professional & Scientific | 25 (65.8%) | 13 (34.2%) |
| Enterprise Management | 0 (0.0%) | 0 (0.0%) |
| Administrative & Support | 3 (42.9%) | 4 (57.1%) |
| Educational Services | 18 (14.4%) | 107 (85.6%) |
| Health Care & Social Assistance | 29 (17.4%) | 138 (82.6%) |
| Arts, Entertainment & Recreation | 0 (0.0%) | 0 (0.0%) |
| Accommodation & Food Services | 62 (57.4%) | 46 (42.6%) |
| Public Administration | 14 (58.3%) | 10 (41.7%) |
| Total | 832 (57.5%) | 616 (42.5%) |
Education in Perkins County
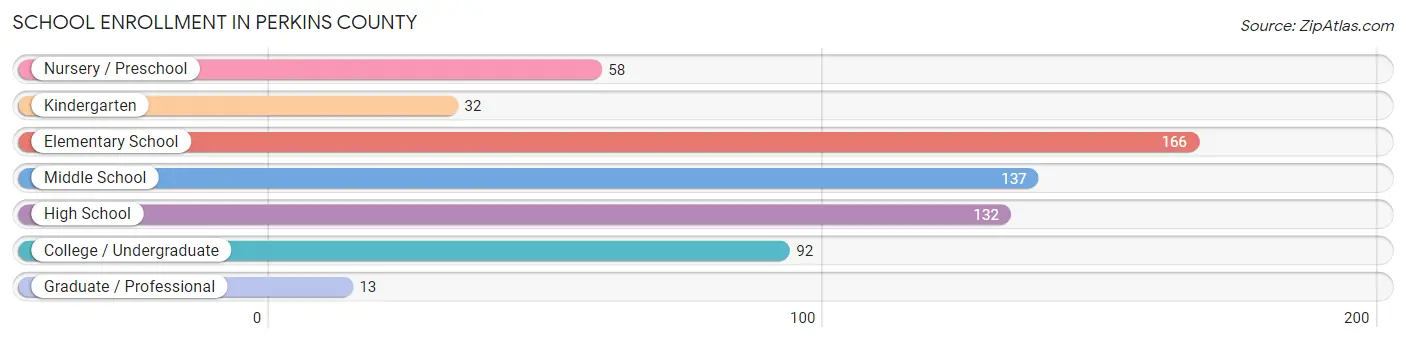
School Enrollment in Perkins County
The most common levels of schooling among the 630 students in Perkins County are elementary school (166 | 26.4%), middle school (137 | 21.7%), and high school (132 | 20.9%).
| School Level | # Students | % Students |
| Nursery / Preschool | 58 | 9.2% |
| Kindergarten | 32 | 5.1% |
| Elementary School | 166 | 26.4% |
| Middle School | 137 | 21.7% |
| High School | 132 | 20.9% |
| College / Undergraduate | 92 | 14.6% |
| Graduate / Professional | 13 | 2.1% |
| Total | 630 | 100.0% |
School Enrollment by Age by Funding Source in Perkins County
Out of a total of 630 students who are enrolled in schools in Perkins County, 103 (16.3%) attend a private institution, while the remaining 527 (83.7%) are enrolled in public schools. The age group of 15 to 17 year olds has the highest likelihood of being enrolled in private schools, with 21 (23.6% in the age bracket) enrolled. Conversely, the age group of 18 to 19 year olds has the lowest likelihood of being enrolled in a private school, with 82 (100.0% in the age bracket) attending a public institution.
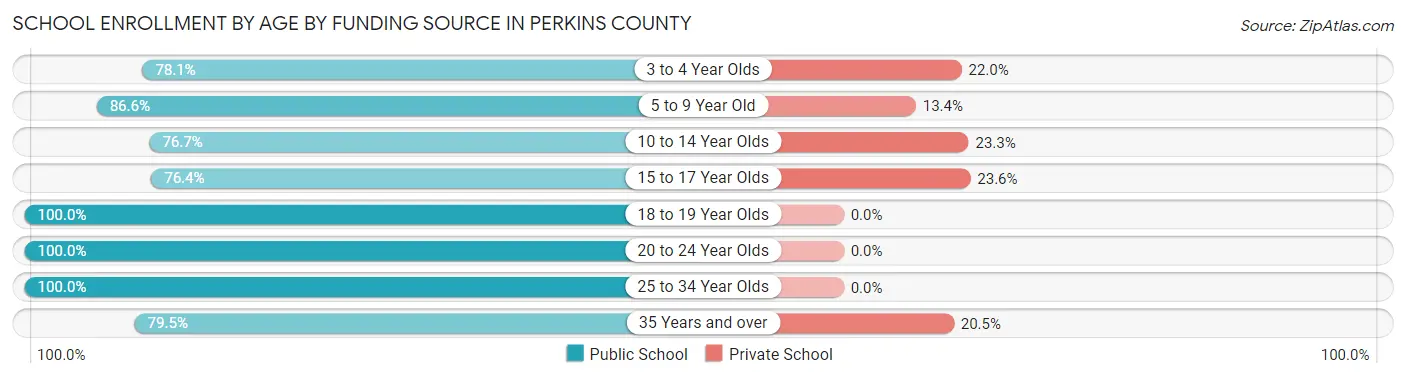
| Age Bracket | Public School | Private School |
| 3 to 4 Year Olds | 32 (78.0%) | 9 (22.0%) |
| 5 to 9 Year Old | 161 (86.6%) | 25 (13.4%) |
| 10 to 14 Year Olds | 132 (76.7%) | 40 (23.3%) |
| 15 to 17 Year Olds | 68 (76.4%) | 21 (23.6%) |
| 18 to 19 Year Olds | 82 (100.0%) | 0 (0.0%) |
| 20 to 24 Year Olds | 7 (100.0%) | 0 (0.0%) |
| 25 to 34 Year Olds | 14 (100.0%) | 0 (0.0%) |
| 35 Years and over | 31 (79.5%) | 8 (20.5%) |
| Total | 527 (83.7%) | 103 (16.3%) |
Educational Attainment by Field of Study in Perkins County
Education (138 | 25.2%), bio, nature & agricultural (131 | 23.9%), business (101 | 18.5%), science & technology (45 | 8.2%), and arts & humanities (39 | 7.1%) are the most common fields of study among 547 individuals in Perkins County who have obtained a bachelor's degree or higher.
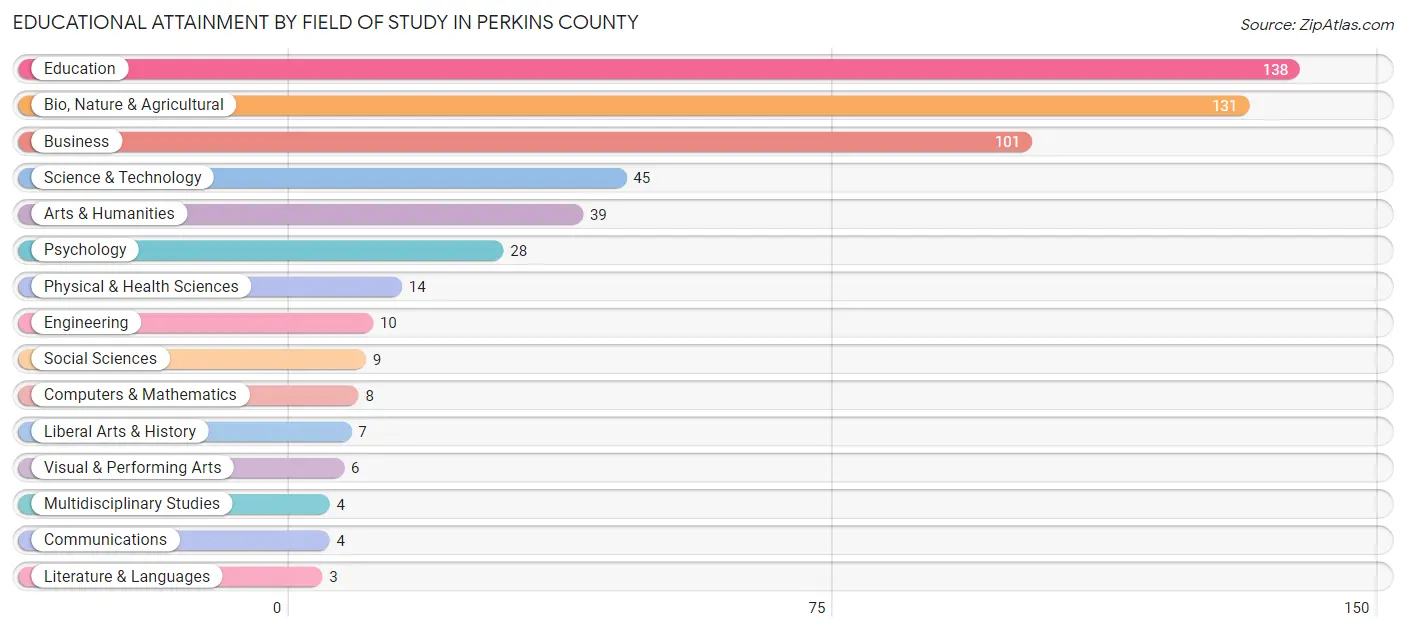
| Field of Study | # Graduates | % Graduates |
| Computers & Mathematics | 8 | 1.5% |
| Bio, Nature & Agricultural | 131 | 23.9% |
| Physical & Health Sciences | 14 | 2.6% |
| Psychology | 28 | 5.1% |
| Social Sciences | 9 | 1.7% |
| Engineering | 10 | 1.8% |
| Multidisciplinary Studies | 4 | 0.7% |
| Science & Technology | 45 | 8.2% |
| Business | 101 | 18.5% |
| Education | 138 | 25.2% |
| Literature & Languages | 3 | 0.5% |
| Liberal Arts & History | 7 | 1.3% |
| Visual & Performing Arts | 6 | 1.1% |
| Communications | 4 | 0.7% |
| Arts & Humanities | 39 | 7.1% |
| Total | 547 | 100.0% |
Transportation & Commute in Perkins County
Vehicle Availability by Sex in Perkins County
The most prevalent vehicle ownership categories in Perkins County are males with 2 vehicles (284, accounting for 34.7%) and females with 2 vehicles (188, making up 47.6%).
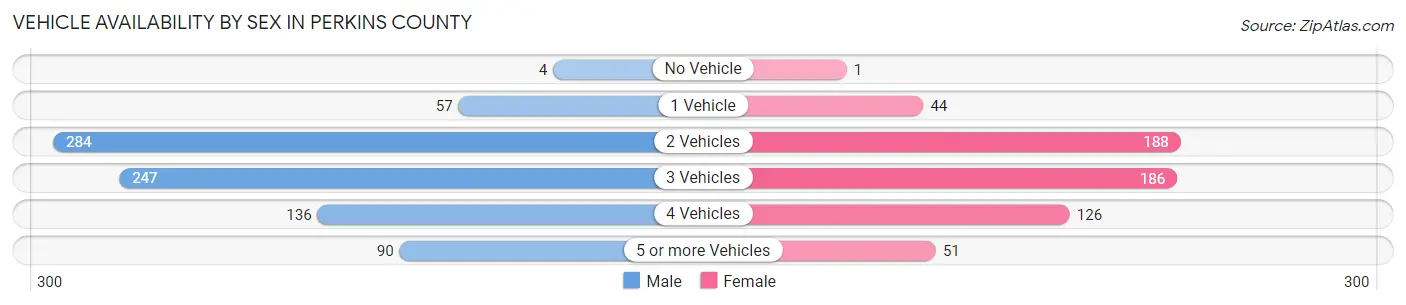
| Vehicles Available | Male | Female |
| No Vehicle | 4 (0.5%) | 1 (0.2%) |
| 1 Vehicle | 57 (7.0%) | 44 (7.4%) |
| 2 Vehicles | 284 (34.7%) | 188 (31.5%) |
| 3 Vehicles | 247 (30.2%) | 186 (31.2%) |
| 4 Vehicles | 136 (16.6%) | 126 (21.1%) |
| 5 or more Vehicles | 90 (11.0%) | 51 (8.6%) |
| Total | 818 (100.0%) | 596 (100.0%) |
Commute Time in Perkins County
The most frequently occuring commute durations in Perkins County are less than 5 minutes (310 commuters, 23.6%), 5 to 9 minutes (306 commuters, 23.3%), and 10 to 14 minutes (172 commuters, 13.1%).
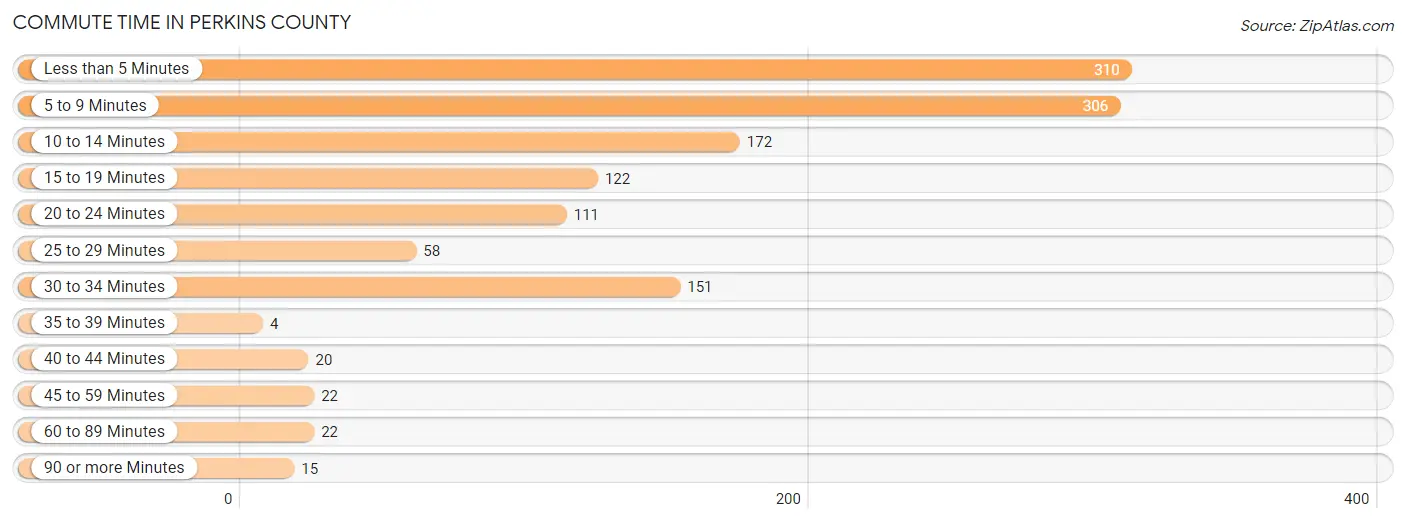
| Commute Time | # Commuters | % Commuters |
| Less than 5 Minutes | 310 | 23.6% |
| 5 to 9 Minutes | 306 | 23.3% |
| 10 to 14 Minutes | 172 | 13.1% |
| 15 to 19 Minutes | 122 | 9.3% |
| 20 to 24 Minutes | 111 | 8.5% |
| 25 to 29 Minutes | 58 | 4.4% |
| 30 to 34 Minutes | 151 | 11.5% |
| 35 to 39 Minutes | 4 | 0.3% |
| 40 to 44 Minutes | 20 | 1.5% |
| 45 to 59 Minutes | 22 | 1.7% |
| 60 to 89 Minutes | 22 | 1.7% |
| 90 or more Minutes | 15 | 1.1% |
Commute Time by Sex in Perkins County
The most common commute times in Perkins County are less than 5 minutes (209 commuters, 27.4%) for males and 5 to 9 minutes (159 commuters, 28.9%) for females.
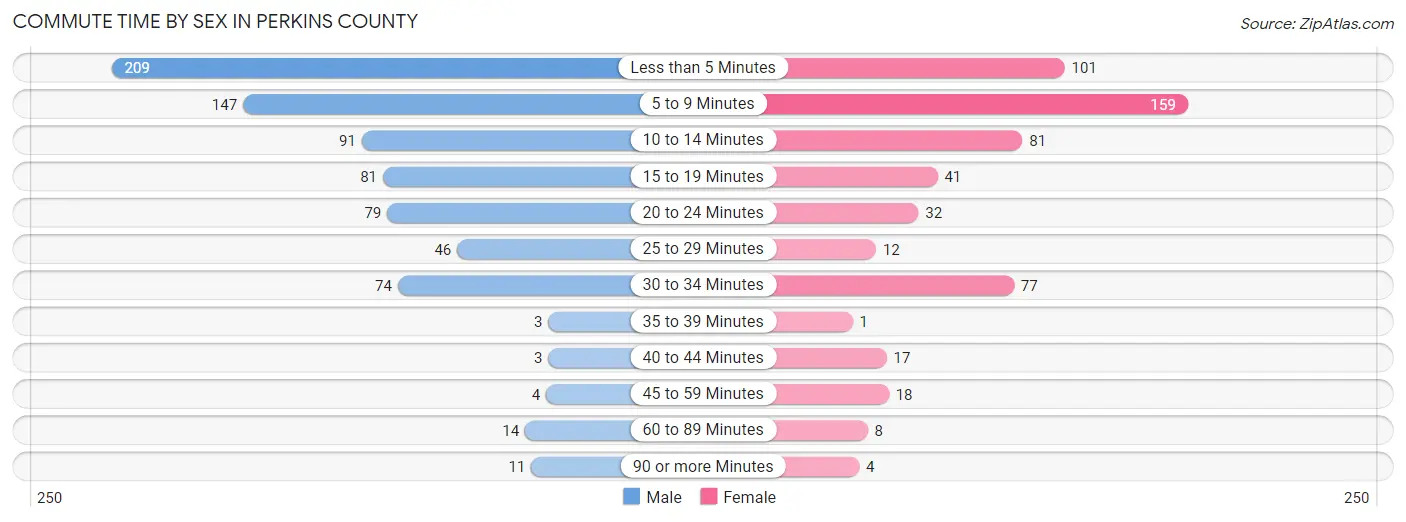
| Commute Time | Male | Female |
| Less than 5 Minutes | 209 (27.4%) | 101 (18.3%) |
| 5 to 9 Minutes | 147 (19.3%) | 159 (28.9%) |
| 10 to 14 Minutes | 91 (11.9%) | 81 (14.7%) |
| 15 to 19 Minutes | 81 (10.6%) | 41 (7.4%) |
| 20 to 24 Minutes | 79 (10.4%) | 32 (5.8%) |
| 25 to 29 Minutes | 46 (6.0%) | 12 (2.2%) |
| 30 to 34 Minutes | 74 (9.7%) | 77 (14.0%) |
| 35 to 39 Minutes | 3 (0.4%) | 1 (0.2%) |
| 40 to 44 Minutes | 3 (0.4%) | 17 (3.1%) |
| 45 to 59 Minutes | 4 (0.5%) | 18 (3.3%) |
| 60 to 89 Minutes | 14 (1.8%) | 8 (1.5%) |
| 90 or more Minutes | 11 (1.4%) | 4 (0.7%) |
Time of Departure to Work by Sex in Perkins County
The most frequent times of departure to work in Perkins County are 7:00 AM to 7:29 AM (208, 27.3%) for males and 7:00 AM to 7:29 AM (176, 31.9%) for females.
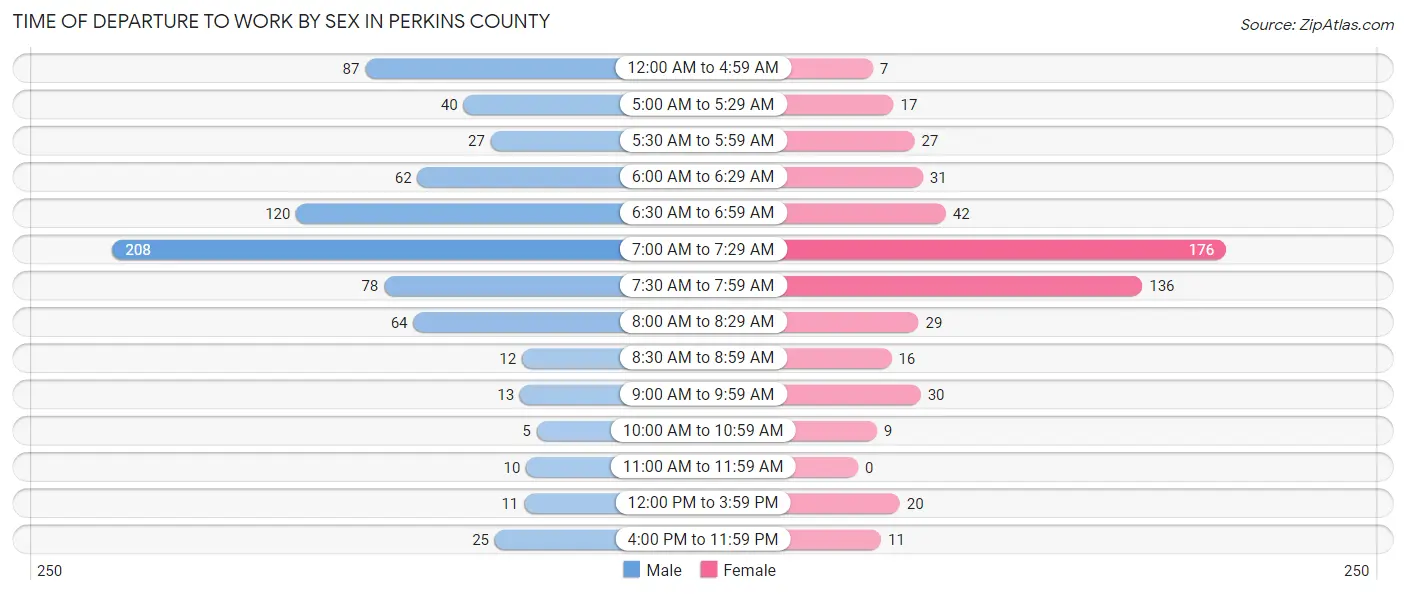
| Time of Departure | Male | Female |
| 12:00 AM to 4:59 AM | 87 (11.4%) | 7 (1.3%) |
| 5:00 AM to 5:29 AM | 40 (5.2%) | 17 (3.1%) |
| 5:30 AM to 5:59 AM | 27 (3.5%) | 27 (4.9%) |
| 6:00 AM to 6:29 AM | 62 (8.1%) | 31 (5.6%) |
| 6:30 AM to 6:59 AM | 120 (15.8%) | 42 (7.6%) |
| 7:00 AM to 7:29 AM | 208 (27.3%) | 176 (31.9%) |
| 7:30 AM to 7:59 AM | 78 (10.2%) | 136 (24.7%) |
| 8:00 AM to 8:29 AM | 64 (8.4%) | 29 (5.3%) |
| 8:30 AM to 8:59 AM | 12 (1.6%) | 16 (2.9%) |
| 9:00 AM to 9:59 AM | 13 (1.7%) | 30 (5.4%) |
| 10:00 AM to 10:59 AM | 5 (0.7%) | 9 (1.6%) |
| 11:00 AM to 11:59 AM | 10 (1.3%) | 0 (0.0%) |
| 12:00 PM to 3:59 PM | 11 (1.4%) | 20 (3.6%) |
| 4:00 PM to 11:59 PM | 25 (3.3%) | 11 (2.0%) |
| Total | 762 (100.0%) | 551 (100.0%) |
Housing Occupancy in Perkins County
Occupancy by Ownership in Perkins County
Of the total 1,154 dwellings in Perkins County, owner-occupied units account for 898 (77.8%), while renter-occupied units make up 256 (22.2%).
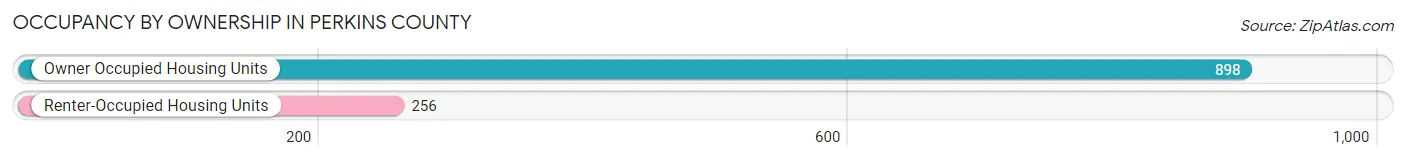
| Occupancy | # Housing Units | % Housing Units |
| Owner Occupied Housing Units | 898 | 77.8% |
| Renter-Occupied Housing Units | 256 | 22.2% |
| Total Occupied Housing Units | 1,154 | 100.0% |
Occupancy by Household Size in Perkins County
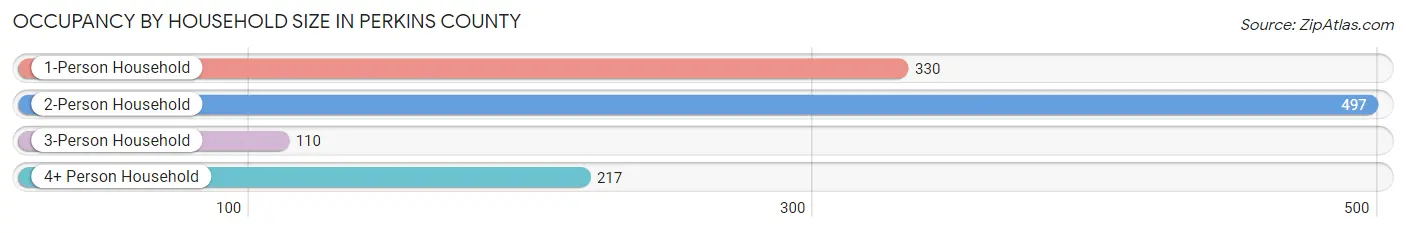
| Household Size | # Housing Units | % Housing Units |
| 1-Person Household | 330 | 28.6% |
| 2-Person Household | 497 | 43.1% |
| 3-Person Household | 110 | 9.5% |
| 4+ Person Household | 217 | 18.8% |
| Total Housing Units | 1,154 | 100.0% |
Occupancy by Ownership by Household Size in Perkins County
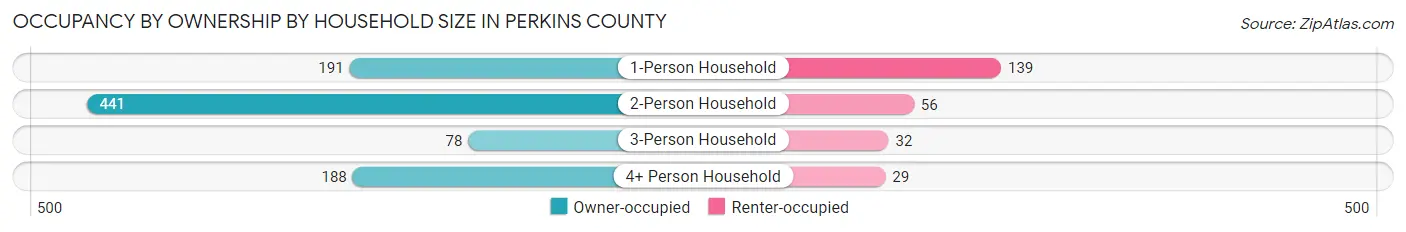
| Household Size | Owner-occupied | Renter-occupied |
| 1-Person Household | 191 (57.9%) | 139 (42.1%) |
| 2-Person Household | 441 (88.7%) | 56 (11.3%) |
| 3-Person Household | 78 (70.9%) | 32 (29.1%) |
| 4+ Person Household | 188 (86.6%) | 29 (13.4%) |
| Total Housing Units | 898 (77.8%) | 256 (22.2%) |
Occupancy by Educational Attainment in Perkins County
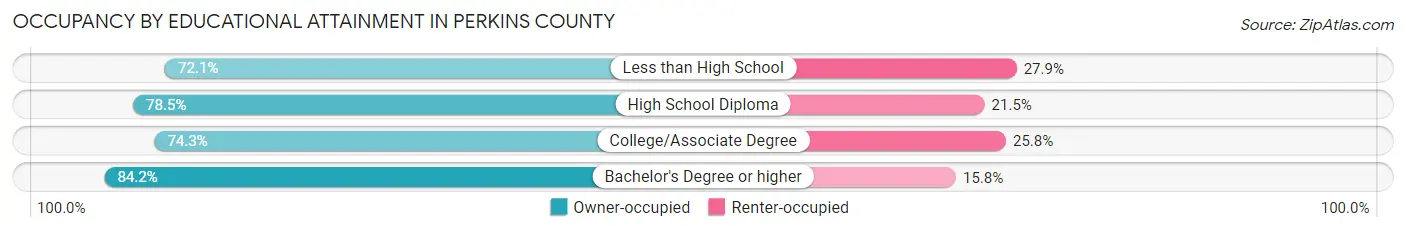
| Household Size | Owner-occupied | Renter-occupied |
| Less than High School | 88 (72.1%) | 34 (27.9%) |
| High School Diploma | 219 (78.5%) | 60 (21.5%) |
| College/Associate Degree | 320 (74.3%) | 111 (25.8%) |
| Bachelor's Degree or higher | 271 (84.2%) | 51 (15.8%) |
Occupancy by Age of Householder in Perkins County
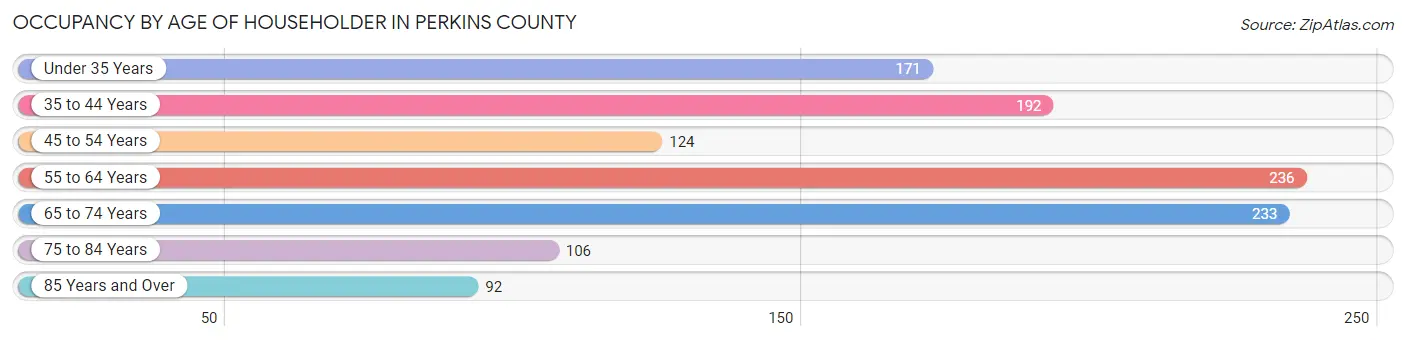
| Age Bracket | # Households | % Households |
| Under 35 Years | 171 | 14.8% |
| 35 to 44 Years | 192 | 16.6% |
| 45 to 54 Years | 124 | 10.7% |
| 55 to 64 Years | 236 | 20.4% |
| 65 to 74 Years | 233 | 20.2% |
| 75 to 84 Years | 106 | 9.2% |
| 85 Years and Over | 92 | 8.0% |
| Total | 1,154 | 100.0% |
Housing Finances in Perkins County
Median Income by Occupancy in Perkins County
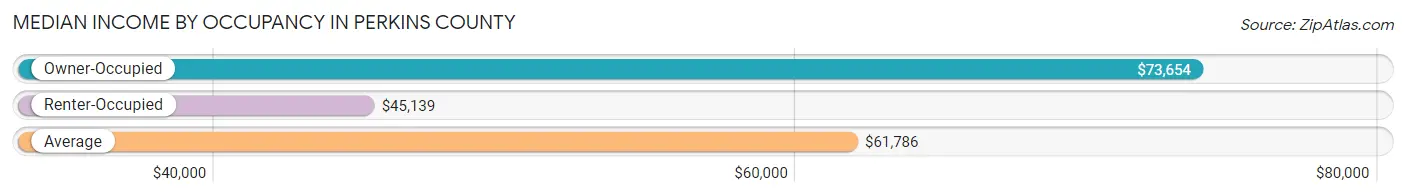
| Occupancy Type | # Households | Median Income |
| Owner-Occupied | 898 (77.8%) | $73,654 |
| Renter-Occupied | 256 (22.2%) | $45,139 |
| Average | 1,154 (100.0%) | $61,786 |
Occupancy by Householder Income Bracket in Perkins County
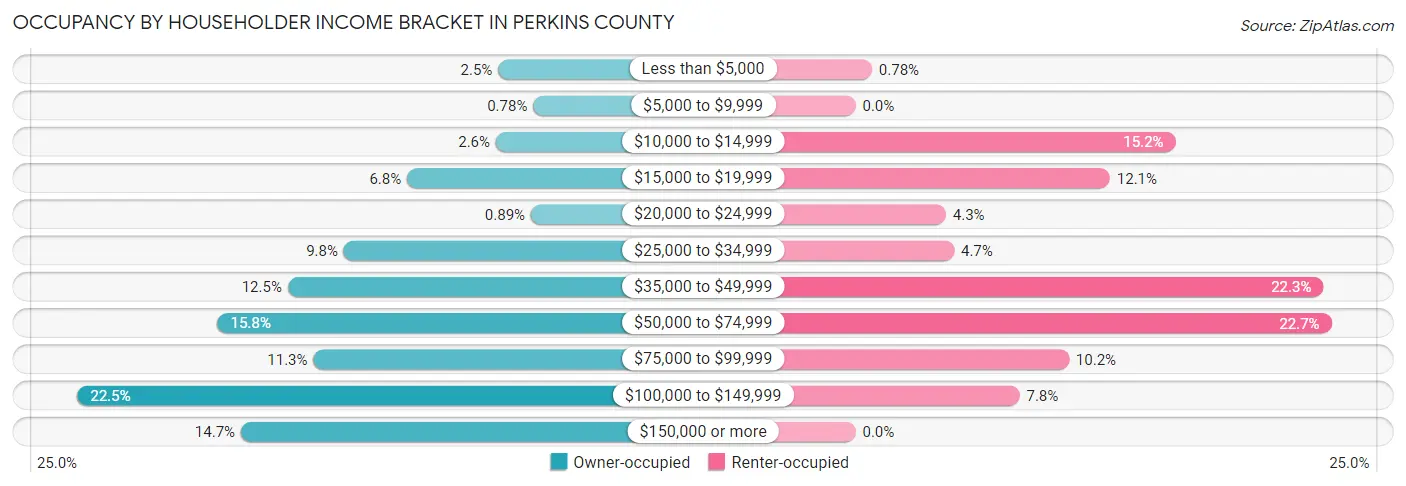
| Income Bracket | Owner-occupied | Renter-occupied |
| Less than $5,000 | 22 (2.5%) | 2 (0.8%) |
| $5,000 to $9,999 | 7 (0.8%) | 0 (0.0%) |
| $10,000 to $14,999 | 23 (2.6%) | 39 (15.2%) |
| $15,000 to $19,999 | 61 (6.8%) | 31 (12.1%) |
| $20,000 to $24,999 | 8 (0.9%) | 11 (4.3%) |
| $25,000 to $34,999 | 88 (9.8%) | 12 (4.7%) |
| $35,000 to $49,999 | 112 (12.5%) | 57 (22.3%) |
| $50,000 to $74,999 | 142 (15.8%) | 58 (22.7%) |
| $75,000 to $99,999 | 101 (11.3%) | 26 (10.2%) |
| $100,000 to $149,999 | 202 (22.5%) | 20 (7.8%) |
| $150,000 or more | 132 (14.7%) | 0 (0.0%) |
| Total | 898 (100.0%) | 256 (100.0%) |
Monthly Housing Cost Tiers in Perkins County
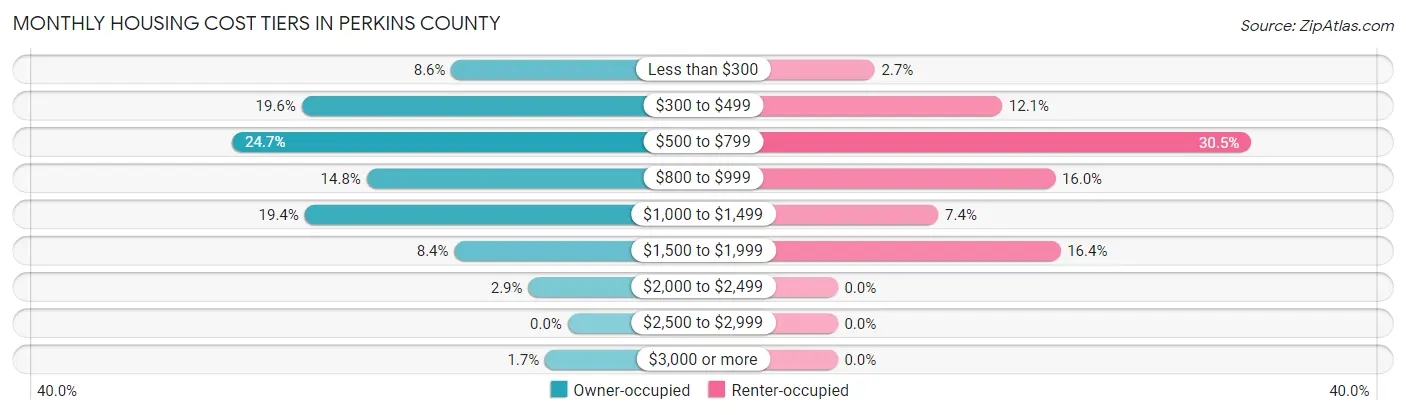
| Monthly Cost | Owner-occupied | Renter-occupied |
| Less than $300 | 77 (8.6%) | 7 (2.7%) |
| $300 to $499 | 176 (19.6%) | 31 (12.1%) |
| $500 to $799 | 222 (24.7%) | 78 (30.5%) |
| $800 to $999 | 133 (14.8%) | 41 (16.0%) |
| $1,000 to $1,499 | 174 (19.4%) | 19 (7.4%) |
| $1,500 to $1,999 | 75 (8.4%) | 42 (16.4%) |
| $2,000 to $2,499 | 26 (2.9%) | 0 (0.0%) |
| $2,500 to $2,999 | 0 (0.0%) | 0 (0.0%) |
| $3,000 or more | 15 (1.7%) | 0 (0.0%) |
| Total | 898 (100.0%) | 256 (100.0%) |
Physical Housing Characteristics in Perkins County
Housing Structures in Perkins County
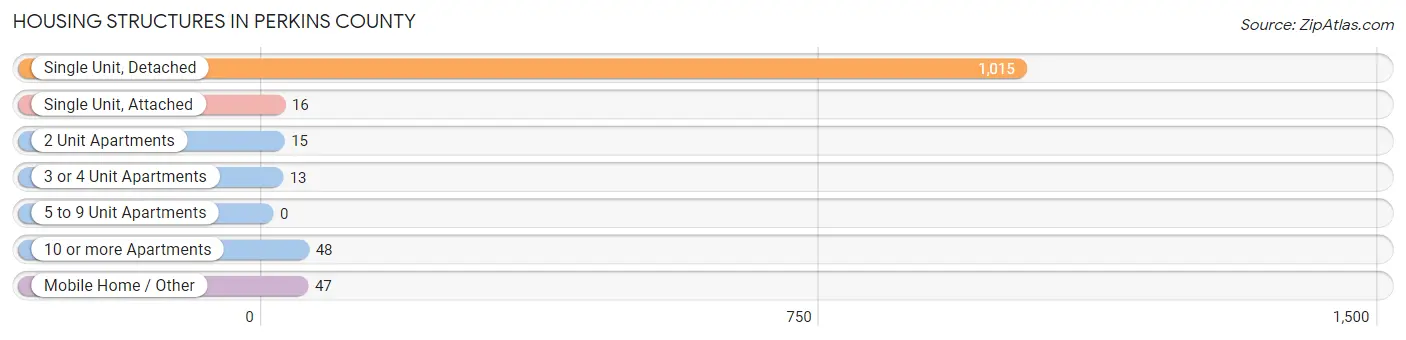
| Structure Type | # Housing Units | % Housing Units |
| Single Unit, Detached | 1,015 | 87.9% |
| Single Unit, Attached | 16 | 1.4% |
| 2 Unit Apartments | 15 | 1.3% |
| 3 or 4 Unit Apartments | 13 | 1.1% |
| 5 to 9 Unit Apartments | 0 | 0.0% |
| 10 or more Apartments | 48 | 4.2% |
| Mobile Home / Other | 47 | 4.1% |
| Total | 1,154 | 100.0% |
Housing Structures by Occupancy in Perkins County
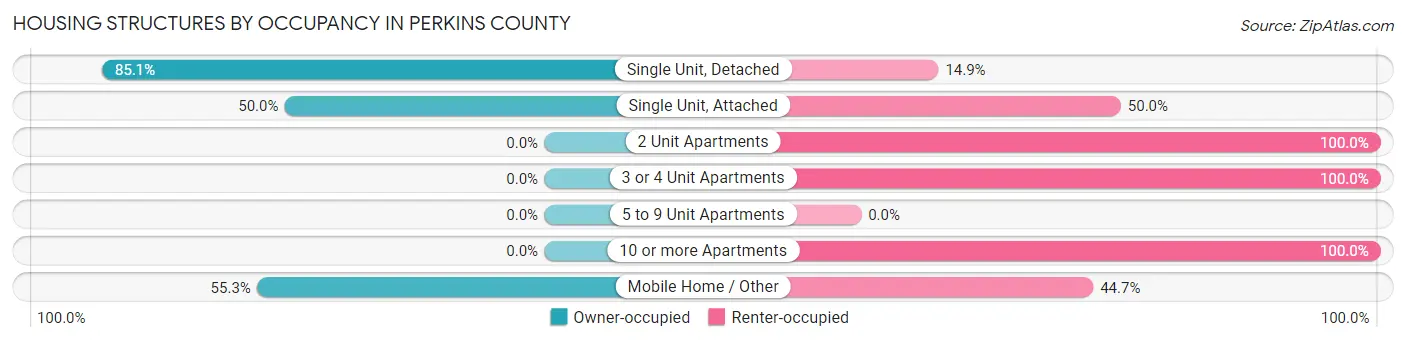
| Structure Type | Owner-occupied | Renter-occupied |
| Single Unit, Detached | 864 (85.1%) | 151 (14.9%) |
| Single Unit, Attached | 8 (50.0%) | 8 (50.0%) |
| 2 Unit Apartments | 0 (0.0%) | 15 (100.0%) |
| 3 or 4 Unit Apartments | 0 (0.0%) | 13 (100.0%) |
| 5 to 9 Unit Apartments | 0 (0.0%) | 0 (0.0%) |
| 10 or more Apartments | 0 (0.0%) | 48 (100.0%) |
| Mobile Home / Other | 26 (55.3%) | 21 (44.7%) |
| Total | 898 (77.8%) | 256 (22.2%) |
Housing Structures by Number of Rooms in Perkins County
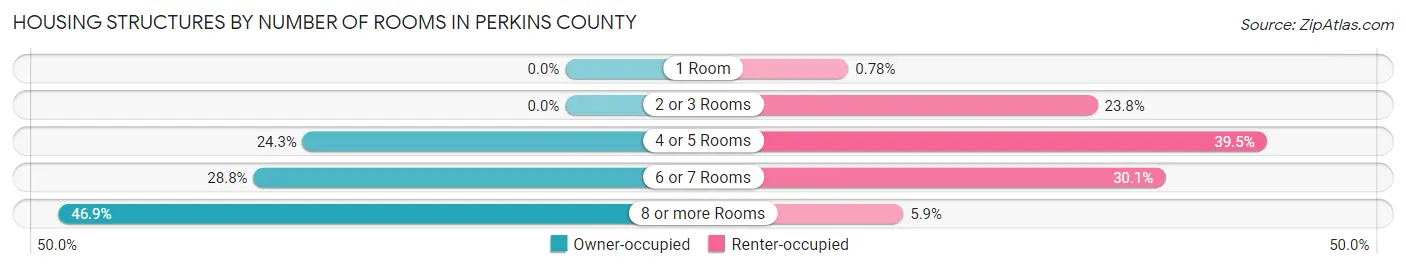
| Number of Rooms | Owner-occupied | Renter-occupied |
| 1 Room | 0 (0.0%) | 2 (0.8%) |
| 2 or 3 Rooms | 0 (0.0%) | 61 (23.8%) |
| 4 or 5 Rooms | 218 (24.3%) | 101 (39.5%) |
| 6 or 7 Rooms | 259 (28.8%) | 77 (30.1%) |
| 8 or more Rooms | 421 (46.9%) | 15 (5.9%) |
| Total | 898 (100.0%) | 256 (100.0%) |
Housing Structure by Heating Type in Perkins County
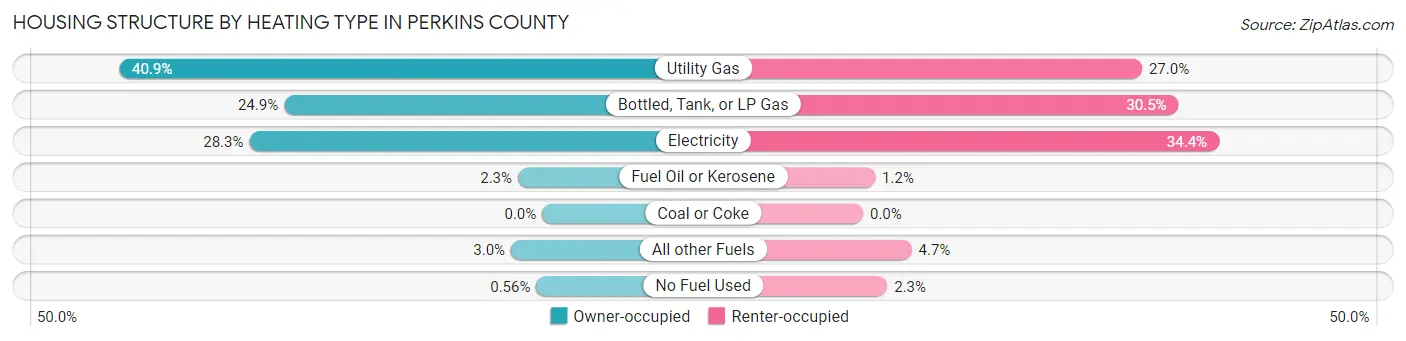
| Heating Type | Owner-occupied | Renter-occupied |
| Utility Gas | 367 (40.9%) | 69 (27.0%) |
| Bottled, Tank, or LP Gas | 224 (24.9%) | 78 (30.5%) |
| Electricity | 254 (28.3%) | 88 (34.4%) |
| Fuel Oil or Kerosene | 21 (2.3%) | 3 (1.2%) |
| Coal or Coke | 0 (0.0%) | 0 (0.0%) |
| All other Fuels | 27 (3.0%) | 12 (4.7%) |
| No Fuel Used | 5 (0.6%) | 6 (2.3%) |
| Total | 898 (100.0%) | 256 (100.0%) |
Household Vehicle Usage in Perkins County
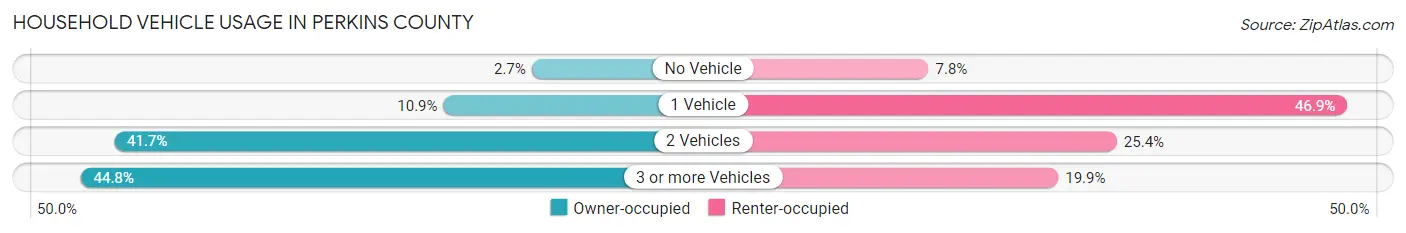
| Vehicles per Household | Owner-occupied | Renter-occupied |
| No Vehicle | 24 (2.7%) | 20 (7.8%) |
| 1 Vehicle | 98 (10.9%) | 120 (46.9%) |
| 2 Vehicles | 374 (41.6%) | 65 (25.4%) |
| 3 or more Vehicles | 402 (44.8%) | 51 (19.9%) |
| Total | 898 (100.0%) | 256 (100.0%) |
Real Estate & Mortgages in Perkins County
Real Estate and Mortgage Overview in Perkins County
| Characteristic | Without Mortgage | With Mortgage |
| Housing Units | 542 | 356 |
| Median Property Value | $141,000 | $144,900 |
| Median Household Income | $64,444 | $47 |
| Monthly Housing Costs | $530 | $15 |
| Real Estate Taxes | $1,361 | $5 |
Property Value by Mortgage Status in Perkins County
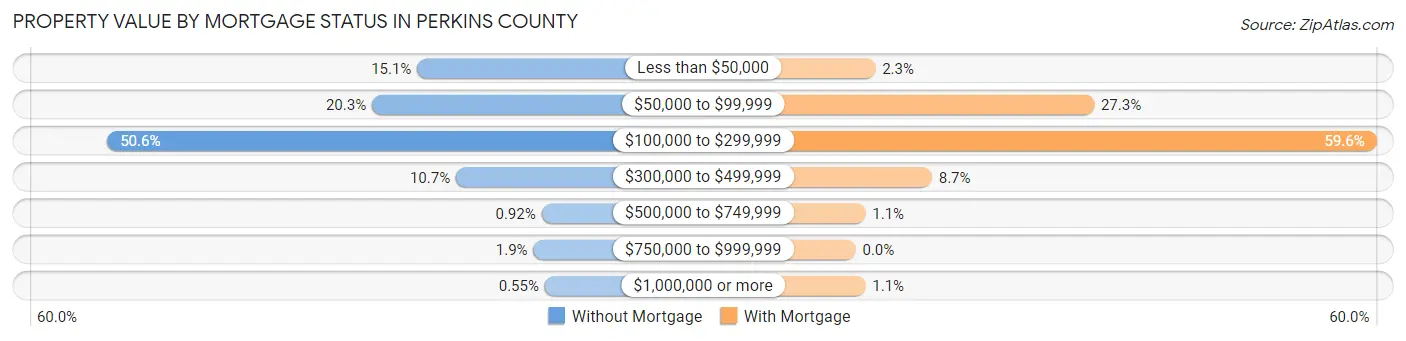
| Property Value | Without Mortgage | With Mortgage |
| Less than $50,000 | 82 (15.1%) | 8 (2.2%) |
| $50,000 to $99,999 | 110 (20.3%) | 97 (27.3%) |
| $100,000 to $299,999 | 274 (50.5%) | 212 (59.6%) |
| $300,000 to $499,999 | 58 (10.7%) | 31 (8.7%) |
| $500,000 to $749,999 | 5 (0.9%) | 4 (1.1%) |
| $750,000 to $999,999 | 10 (1.8%) | 0 (0.0%) |
| $1,000,000 or more | 3 (0.5%) | 4 (1.1%) |
| Total | 542 (100.0%) | 356 (100.0%) |
Household Income by Mortgage Status in Perkins County
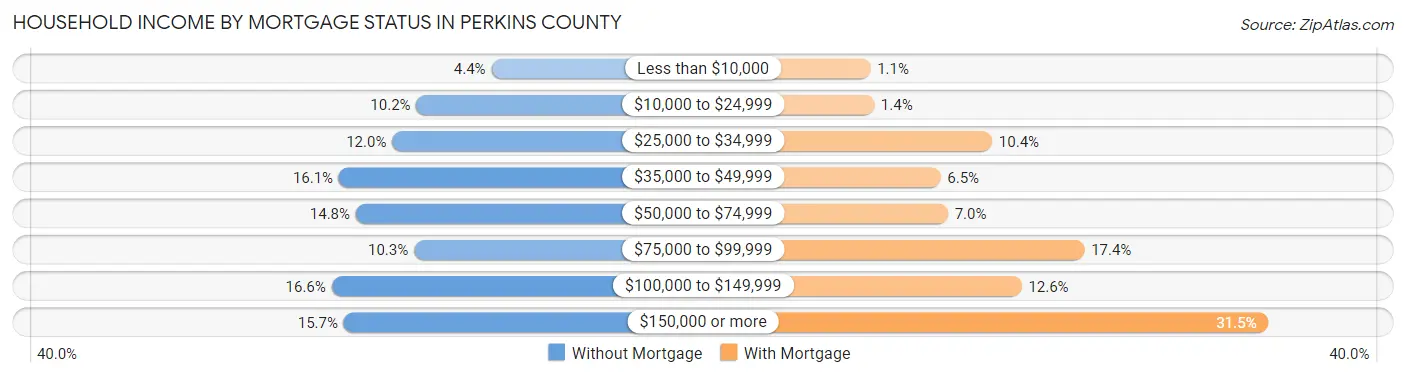
| Household Income | Without Mortgage | With Mortgage |
| Less than $10,000 | 24 (4.4%) | 4 (1.1%) |
| $10,000 to $24,999 | 55 (10.2%) | 5 (1.4%) |
| $25,000 to $34,999 | 65 (12.0%) | 37 (10.4%) |
| $35,000 to $49,999 | 87 (16.1%) | 23 (6.5%) |
| $50,000 to $74,999 | 80 (14.8%) | 25 (7.0%) |
| $75,000 to $99,999 | 56 (10.3%) | 62 (17.4%) |
| $100,000 to $149,999 | 90 (16.6%) | 45 (12.6%) |
| $150,000 or more | 85 (15.7%) | 112 (31.5%) |
| Total | 542 (100.0%) | 356 (100.0%) |
Property Value to Household Income Ratio in Perkins County
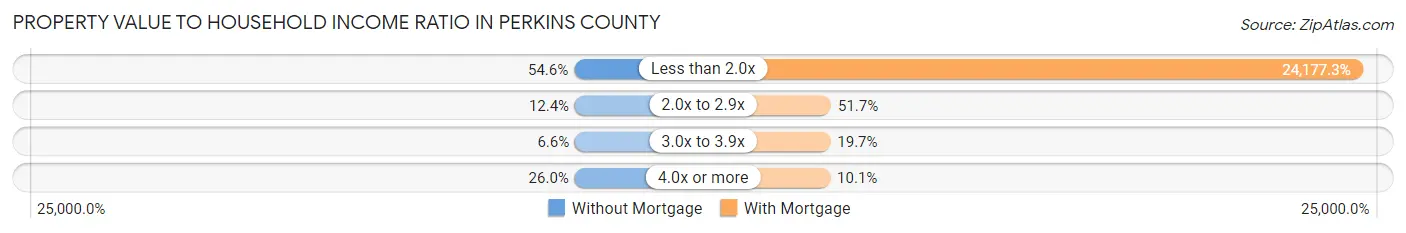
| Value-to-Income Ratio | Without Mortgage | With Mortgage |
| Less than 2.0x | 296 (54.6%) | 86,071 (24,177.3%) |
| 2.0x to 2.9x | 67 (12.4%) | 184 (51.7%) |
| 3.0x to 3.9x | 36 (6.6%) | 70 (19.7%) |
| 4.0x or more | 141 (26.0%) | 36 (10.1%) |
| Total | 542 (100.0%) | 356 (100.0%) |
Real Estate Taxes by Mortgage Status in Perkins County
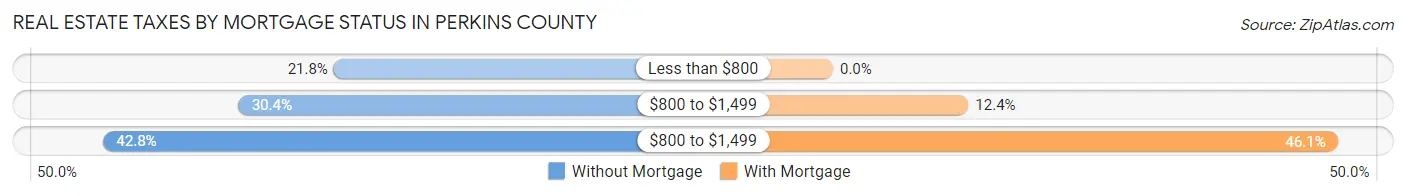
| Property Taxes | Without Mortgage | With Mortgage |
| Less than $800 | 118 (21.8%) | 0 (0.0%) |
| $800 to $1,499 | 165 (30.4%) | 44 (12.4%) |
| $800 to $1,499 | 232 (42.8%) | 164 (46.1%) |
| Total | 542 (100.0%) | 356 (100.0%) |
Health & Disability in Perkins County
Health Insurance Coverage by Age in Perkins County
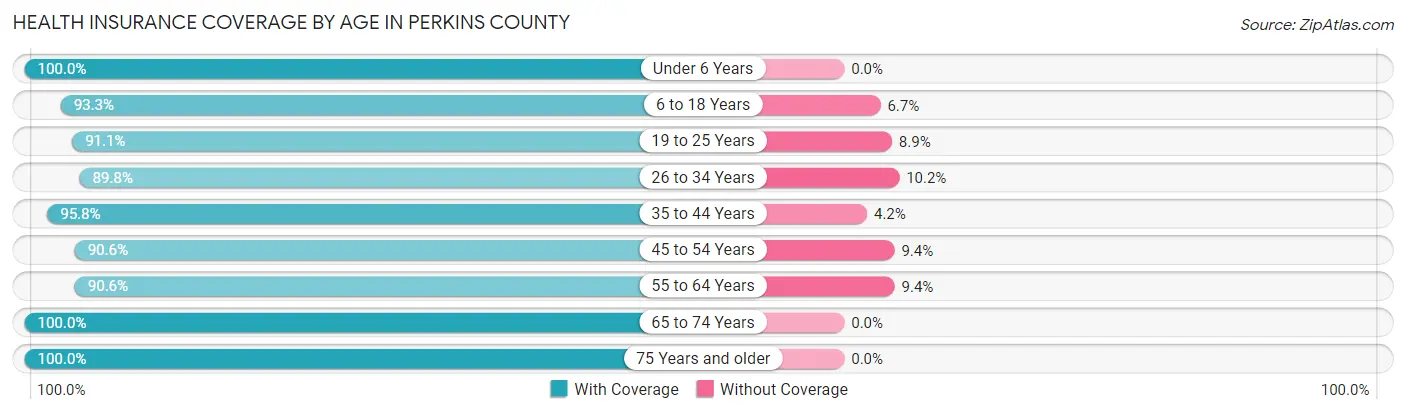
| Age Bracket | With Coverage | Without Coverage |
| Under 6 Years | 225 (100.0%) | 0 (0.0%) |
| 6 to 18 Years | 484 (93.3%) | 35 (6.7%) |
| 19 to 25 Years | 154 (91.1%) | 15 (8.9%) |
| 26 to 34 Years | 228 (89.8%) | 26 (10.2%) |
| 35 to 44 Years | 384 (95.8%) | 17 (4.2%) |
| 45 to 54 Years | 213 (90.6%) | 22 (9.4%) |
| 55 to 64 Years | 338 (90.6%) | 35 (9.4%) |
| 65 to 74 Years | 378 (100.0%) | 0 (0.0%) |
| 75 Years and older | 272 (100.0%) | 0 (0.0%) |
| Total | 2,676 (94.7%) | 150 (5.3%) |
Health Insurance Coverage by Citizenship Status in Perkins County
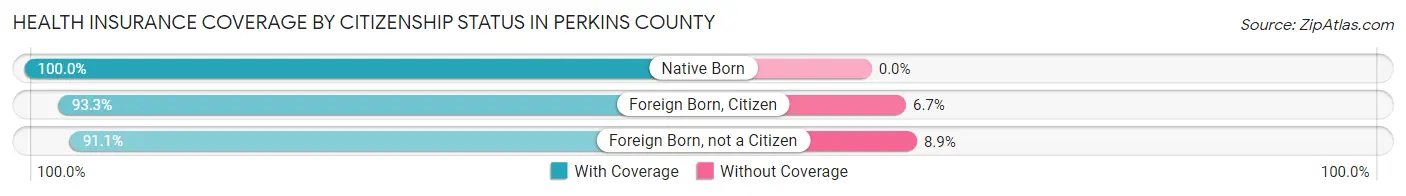
| Citizenship Status | With Coverage | Without Coverage |
| Native Born | 225 (100.0%) | 0 (0.0%) |
| Foreign Born, Citizen | 484 (93.3%) | 35 (6.7%) |
| Foreign Born, not a Citizen | 154 (91.1%) | 15 (8.9%) |
Health Insurance Coverage by Household Income in Perkins County
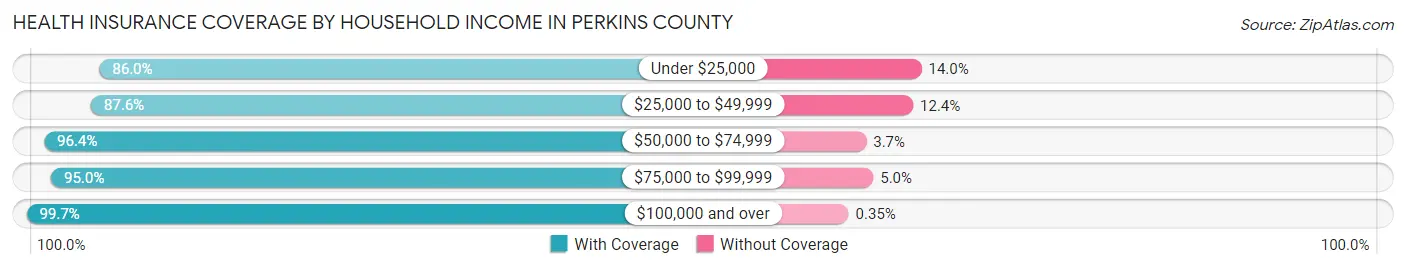
| Household Income | With Coverage | Without Coverage |
| Under $25,000 | 264 (86.0%) | 43 (14.0%) |
| $25,000 to $49,999 | 465 (87.6%) | 66 (12.4%) |
| $50,000 to $74,999 | 422 (96.4%) | 16 (3.6%) |
| $75,000 to $99,999 | 402 (95.0%) | 21 (5.0%) |
| $100,000 and over | 1,123 (99.7%) | 4 (0.4%) |
Public vs Private Health Insurance Coverage by Age in Perkins County
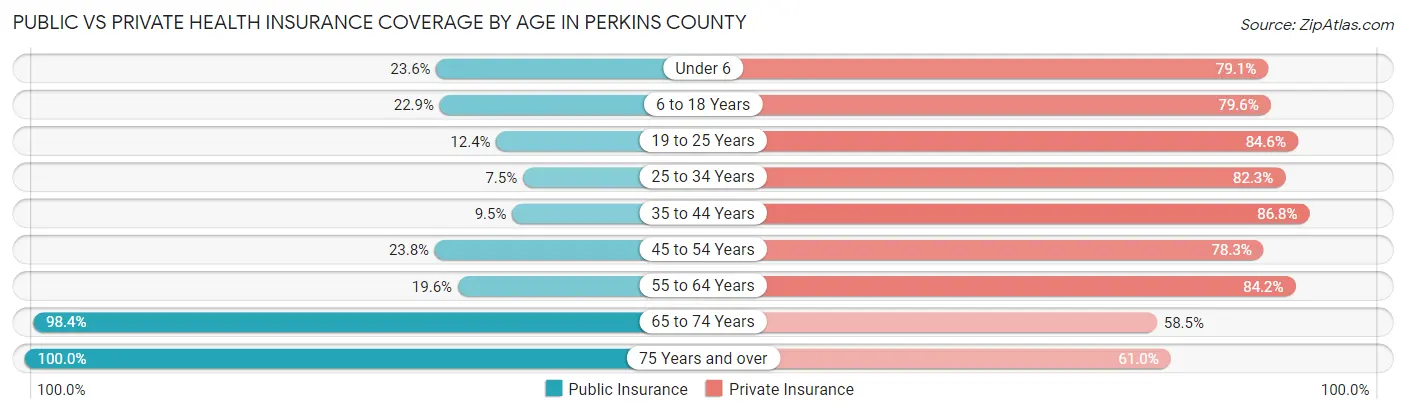
| Age Bracket | Public Insurance | Private Insurance |
| Under 6 | 53 (23.6%) | 178 (79.1%) |
| 6 to 18 Years | 119 (22.9%) | 413 (79.6%) |
| 19 to 25 Years | 21 (12.4%) | 143 (84.6%) |
| 25 to 34 Years | 19 (7.5%) | 209 (82.3%) |
| 35 to 44 Years | 38 (9.5%) | 348 (86.8%) |
| 45 to 54 Years | 56 (23.8%) | 184 (78.3%) |
| 55 to 64 Years | 73 (19.6%) | 314 (84.2%) |
| 65 to 74 Years | 372 (98.4%) | 221 (58.5%) |
| 75 Years and over | 272 (100.0%) | 166 (61.0%) |
| Total | 1,023 (36.2%) | 2,176 (77.0%) |
Disability Status by Sex by Age in Perkins County
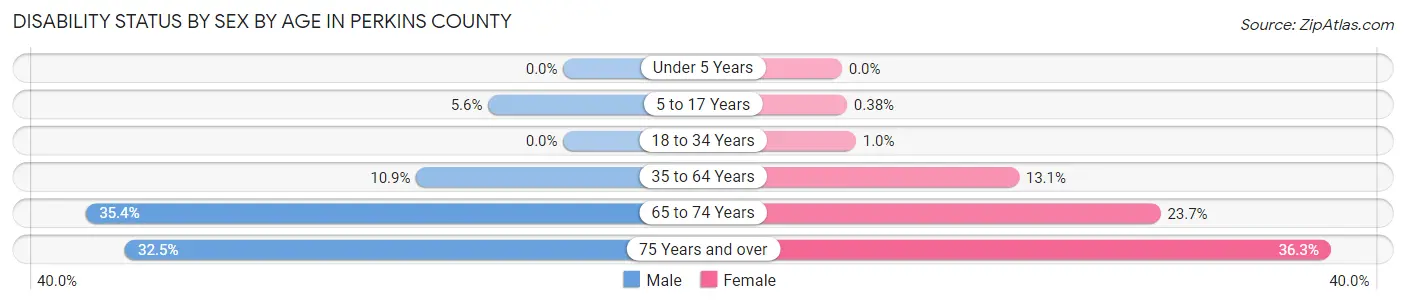
| Age Bracket | Male | Female |
| Under 5 Years | 0 (0.0%) | 0 (0.0%) |
| 5 to 17 Years | 16 (5.6%) | 1 (0.4%) |
| 18 to 34 Years | 0 (0.0%) | 2 (1.0%) |
| 35 to 64 Years | 57 (10.9%) | 64 (13.1%) |
| 65 to 74 Years | 68 (35.4%) | 44 (23.7%) |
| 75 Years and over | 41 (32.5%) | 53 (36.3%) |
Disability Class by Sex by Age in Perkins County
Disability Class: Hearing Difficulty
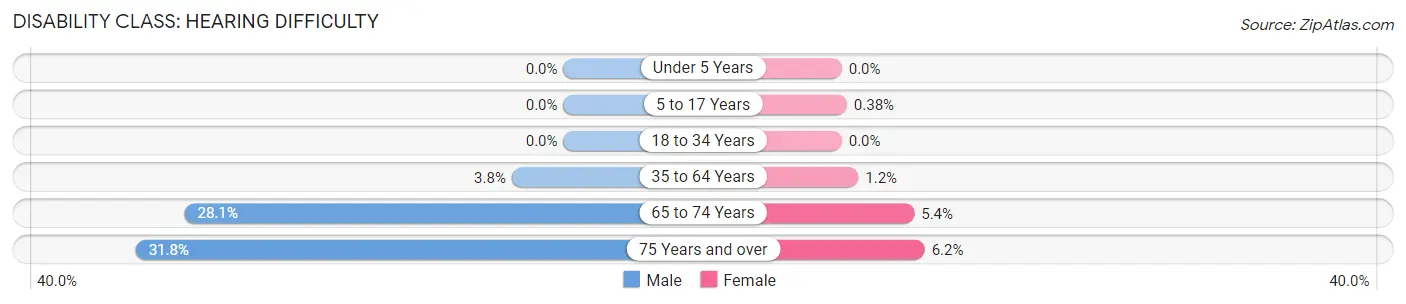
| Age Bracket | Male | Female |
| Under 5 Years | 0 (0.0%) | 0 (0.0%) |
| 5 to 17 Years | 0 (0.0%) | 1 (0.4%) |
| 18 to 34 Years | 0 (0.0%) | 0 (0.0%) |
| 35 to 64 Years | 20 (3.8%) | 6 (1.2%) |
| 65 to 74 Years | 54 (28.1%) | 10 (5.4%) |
| 75 Years and over | 40 (31.8%) | 9 (6.2%) |
Disability Class: Vision Difficulty
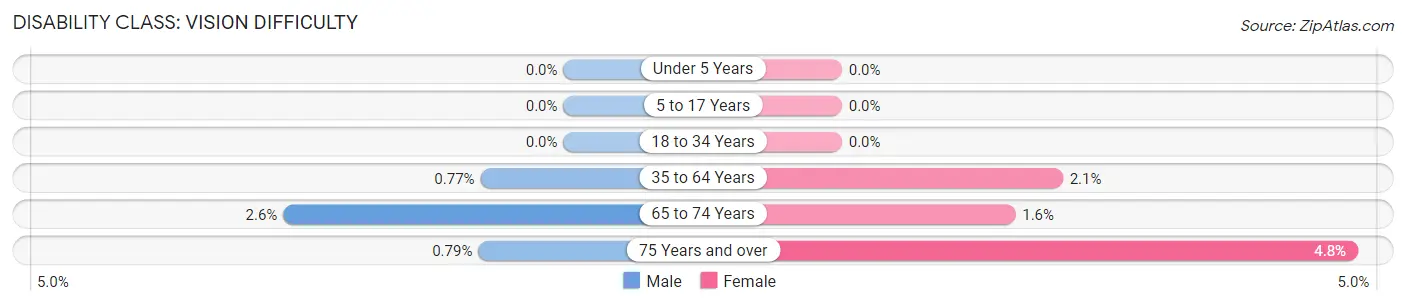
| Age Bracket | Male | Female |
| Under 5 Years | 0 (0.0%) | 0 (0.0%) |
| 5 to 17 Years | 0 (0.0%) | 0 (0.0%) |
| 18 to 34 Years | 0 (0.0%) | 0 (0.0%) |
| 35 to 64 Years | 4 (0.8%) | 10 (2.1%) |
| 65 to 74 Years | 5 (2.6%) | 3 (1.6%) |
| 75 Years and over | 1 (0.8%) | 7 (4.8%) |
Disability Class: Cognitive Difficulty
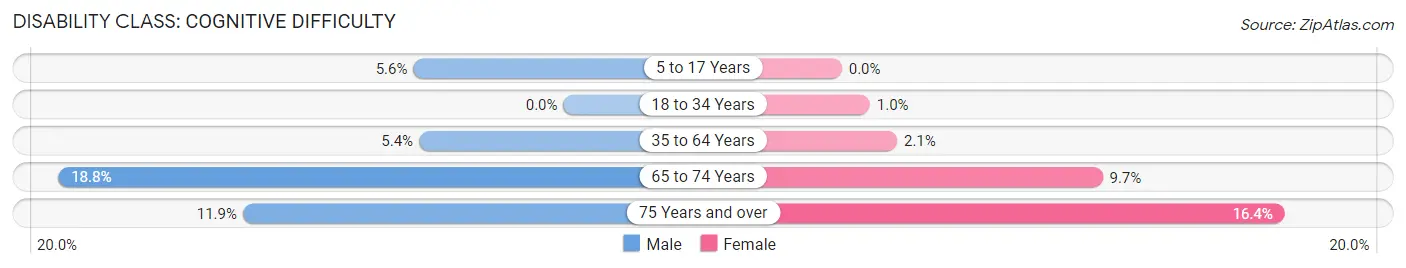
| Age Bracket | Male | Female |
| 5 to 17 Years | 16 (5.6%) | 0 (0.0%) |
| 18 to 34 Years | 0 (0.0%) | 2 (1.0%) |
| 35 to 64 Years | 28 (5.4%) | 10 (2.1%) |
| 65 to 74 Years | 36 (18.8%) | 18 (9.7%) |
| 75 Years and over | 15 (11.9%) | 24 (16.4%) |
Disability Class: Ambulatory Difficulty
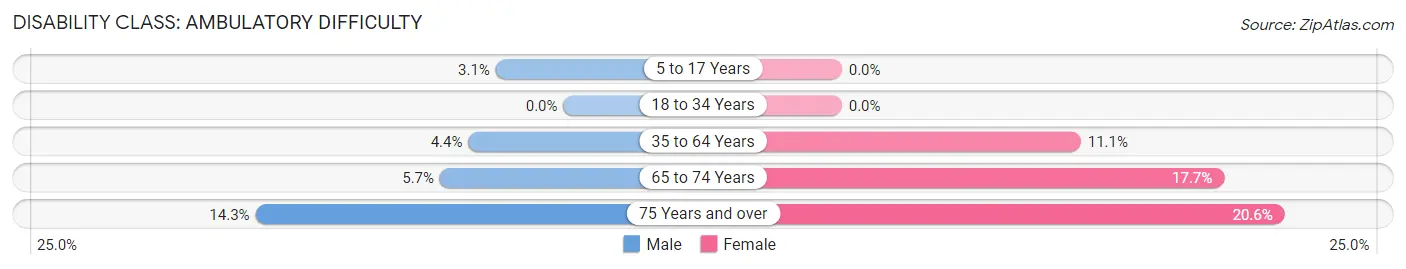
| Age Bracket | Male | Female |
| 5 to 17 Years | 9 (3.1%) | 0 (0.0%) |
| 18 to 34 Years | 0 (0.0%) | 0 (0.0%) |
| 35 to 64 Years | 23 (4.4%) | 54 (11.1%) |
| 65 to 74 Years | 11 (5.7%) | 33 (17.7%) |
| 75 Years and over | 18 (14.3%) | 30 (20.5%) |
Disability Class: Self-Care Difficulty
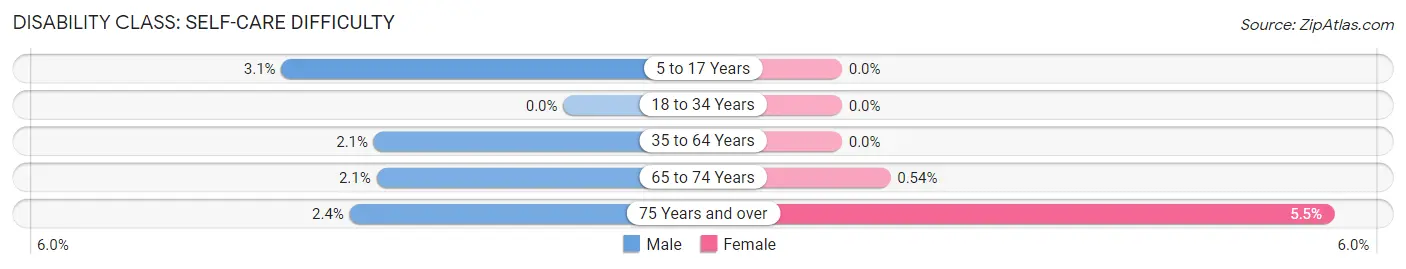
| Age Bracket | Male | Female |
| 5 to 17 Years | 9 (3.1%) | 0 (0.0%) |
| 18 to 34 Years | 0 (0.0%) | 0 (0.0%) |
| 35 to 64 Years | 11 (2.1%) | 0 (0.0%) |
| 65 to 74 Years | 4 (2.1%) | 1 (0.5%) |
| 75 Years and over | 3 (2.4%) | 8 (5.5%) |
Technology Access in Perkins County
Computing Device Access in Perkins County
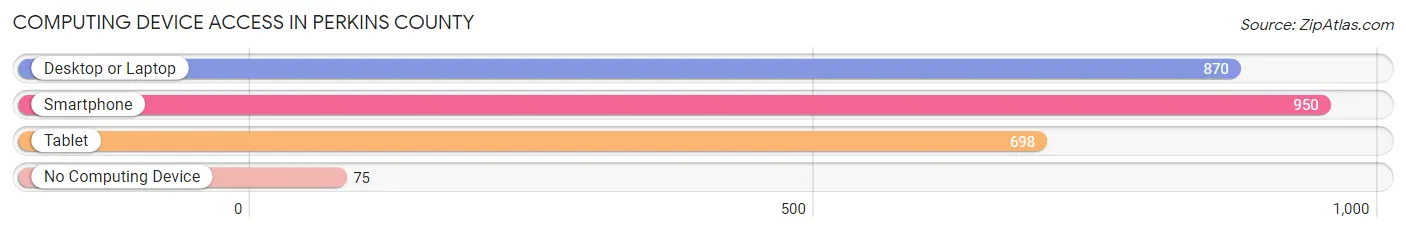
| Device Type | # Households | % Households |
| Desktop or Laptop | 870 | 75.4% |
| Smartphone | 950 | 82.3% |
| Tablet | 698 | 60.5% |
| No Computing Device | 75 | 6.5% |
| Total | 1,154 | 100.0% |
Internet Access in Perkins County
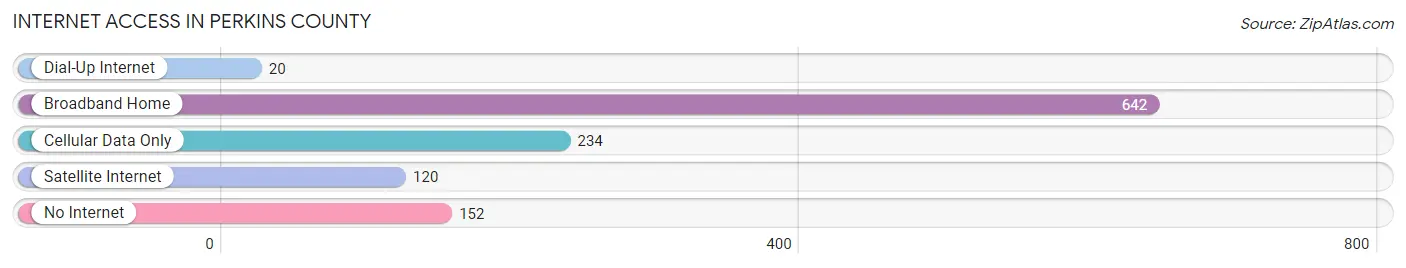
| Internet Type | # Households | % Households |
| Dial-Up Internet | 20 | 1.7% |
| Broadband Home | 642 | 55.6% |
| Cellular Data Only | 234 | 20.3% |
| Satellite Internet | 120 | 10.4% |
| No Internet | 152 | 13.2% |
| Total | 1,154 | 100.0% |
Perkins County Summary
Perkins County is located in the western part of Nebraska, in the Great Plains region of the United States. It is bordered by Keith County to the north, Lincoln County to the east, Chase County to the south, and Cheyenne County to the west. The county seat is Grant, and the largest city is Madrid. The county was named after James Perkins, a pioneer settler.
Geography
Perkins County covers an area of 1,845 square miles, making it the fifth-largest county in Nebraska. The county is mostly flat, with rolling hills in the east and south. The terrain is mostly grassland, with some areas of sandhills and cropland. The county is drained by the North Platte River, which flows through the western part of the county.
The climate of Perkins County is semi-arid, with hot summers and cold winters. The average annual temperature is 52°F, and the average annual precipitation is 17.5 inches.
Demographics
As of the 2010 census, there were 5,945 people, 2,521 households, and 1,637 families living in Perkins County. The population density was 3.2 people per square mile. The racial makeup of the county was 97.2% White, 0.3% African American, 0.3% Native American, 0.2% Asian, 0.1% Pacific Islander, 0.7% from other races, and 1.2% from two or more races. Hispanic or Latino of any race were 2.2% of the population.
The median income for a household in the county was $37,917, and the median income for a family was $45,938. The per capita income for the county was $18,945. About 11.2% of families and 14.2% of the population were below the poverty line, including 17.2% of those under age 18 and 11.2% of those age 65 or over.
Economy
The economy of Perkins County is largely based on agriculture. The county is home to a variety of crops, including corn, wheat, soybeans, and sorghum. Cattle and sheep are also raised in the county.
The county is also home to several oil and gas fields, which provide jobs for many of the county's residents. Other industries in the county include manufacturing, retail, and tourism.
History
Perkins County was established in 1887. The county was named after James Perkins, a pioneer settler who arrived in the area in 1873.
The county was largely settled by homesteaders, who established farms and ranches in the area. The county's economy was largely based on agriculture, and the county was home to several small towns and villages.
In the early 20th century, oil and gas were discovered in the county, and the economy shifted to include oil and gas production. The county also experienced a population boom, as many people moved to the area to take advantage of the new economic opportunities.
Today, Perkins County is a largely rural county, with a population of just over 5,900. The county is still largely agricultural, and oil and gas production is still an important part of the economy.
Common Questions
What is Per Capita Income in Perkins County?
Per Capita income in Perkins County is $34,696.
What is the Median Family Income in Perkins County?
Median Family Income in Perkins County is $80,972.
What is the Median Household income in Perkins County?
Median Household Income in Perkins County is $61,786.
What is Income or Wage Gap in Perkins County?
Income or Wage Gap in Perkins County is 39.2%.
Women in Perkins County earn 60.8 cents for every dollar earned by a man.
What is Family Income Deficit in Perkins County?
Family Income Deficit in Perkins County is $7,802.
Families that are below poverty line in Perkins County earn $7,802 less on average than the poverty threshold level.
What is Inequality or Gini Index in Perkins County?
Inequality or Gini Index in Perkins County is 0.43.
What is the Total Population of Perkins County?
Total Population of Perkins County is 2,860.
What is the Total Male Population of Perkins County?
Total Male Population of Perkins County is 1,480.
What is the Total Female Population of Perkins County?
Total Female Population of Perkins County is 1,380.
What is the Ratio of Males per 100 Females in Perkins County?
There are 107.25 Males per 100 Females in Perkins County.
What is the Ratio of Females per 100 Males in Perkins County?
There are 93.24 Females per 100 Males in Perkins County.
What is the Median Population Age in Perkins County?
Median Population Age in Perkins County is 41.5 Years.
What is the Average Family Size in Perkins County
Average Family Size in Perkins County is 3.0 People.
What is the Average Household Size in Perkins County
Average Household Size in Perkins County is 2.5 People.
How Large is the Labor Force in Perkins County?
There are 1,466 People in the Labor Forcein in Perkins County.
What is the Percentage of People in the Labor Force in Perkins County?
65.8% of People are in the Labor Force in Perkins County.
What is the Unemployment Rate in Perkins County?
Unemployment Rate in Perkins County is 1.2%.