Nemaha County, NE Map & Demographics
Nemaha County Map
Nemaha County Overview
$36,367
PER CAPITA INCOME
$92,644
AVG FAMILY INCOME
$57,196
AVG HOUSEHOLD INCOME
36.4%
WAGE / INCOME GAP [ % ]
63.6¢/ $1
WAGE / INCOME GAP [ $ ]
0.47
INEQUALITY / GINI INDEX
7,019
TOTAL POPULATION
3,595
MALE POPULATION
3,424
FEMALE POPULATION
104.99
MALES / 100 FEMALES
95.24
FEMALES / 100 MALES
38.6
MEDIAN AGE
3.0
AVG FAMILY SIZE
2.3
AVG HOUSEHOLD SIZE
3,487
LABOR FORCE [ PEOPLE ]
60.9%
PERCENT IN LABOR FORCE
6.4%
UNEMPLOYMENT RATE
Nemaha County Area Codes
Income in Nemaha County
Income Overview in Nemaha County
Per Capita Income in Nemaha County is $36,367, while median incomes of families and households are $92,644 and $57,196 respectively.
| Characteristic | Number | Measure |
| Per Capita Income | 7,019 | $36,367 |
| Median Family Income | 1,613 | $92,644 |
| Mean Family Income | 1,613 | $107,904 |
| Median Household Income | 2,851 | $57,196 |
| Mean Household Income | 2,851 | $83,814 |
| Income Deficit | 1,613 | $0 |
| Wage / Income Gap (%) | 7,019 | 36.40% |
| Wage / Income Gap ($) | 7,019 | 63.60¢ per $1 |
| Gini / Inequality Index | 7,019 | 0.47 |
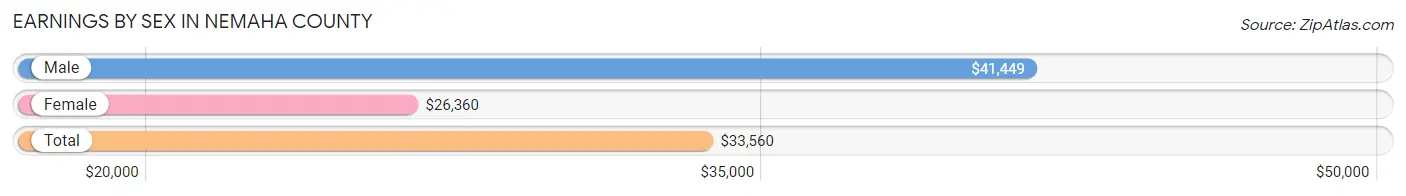
Earnings by Sex in Nemaha County
Average Earnings in Nemaha County are $33,560, $41,449 for men and $26,360 for women, a difference of 36.4%.
| Sex | Number | Average Earnings |
| Male | 2,155 (53.5%) | $41,449 |
| Female | 1,874 (46.5%) | $26,360 |
| Total | 4,029 (100.0%) | $33,560 |
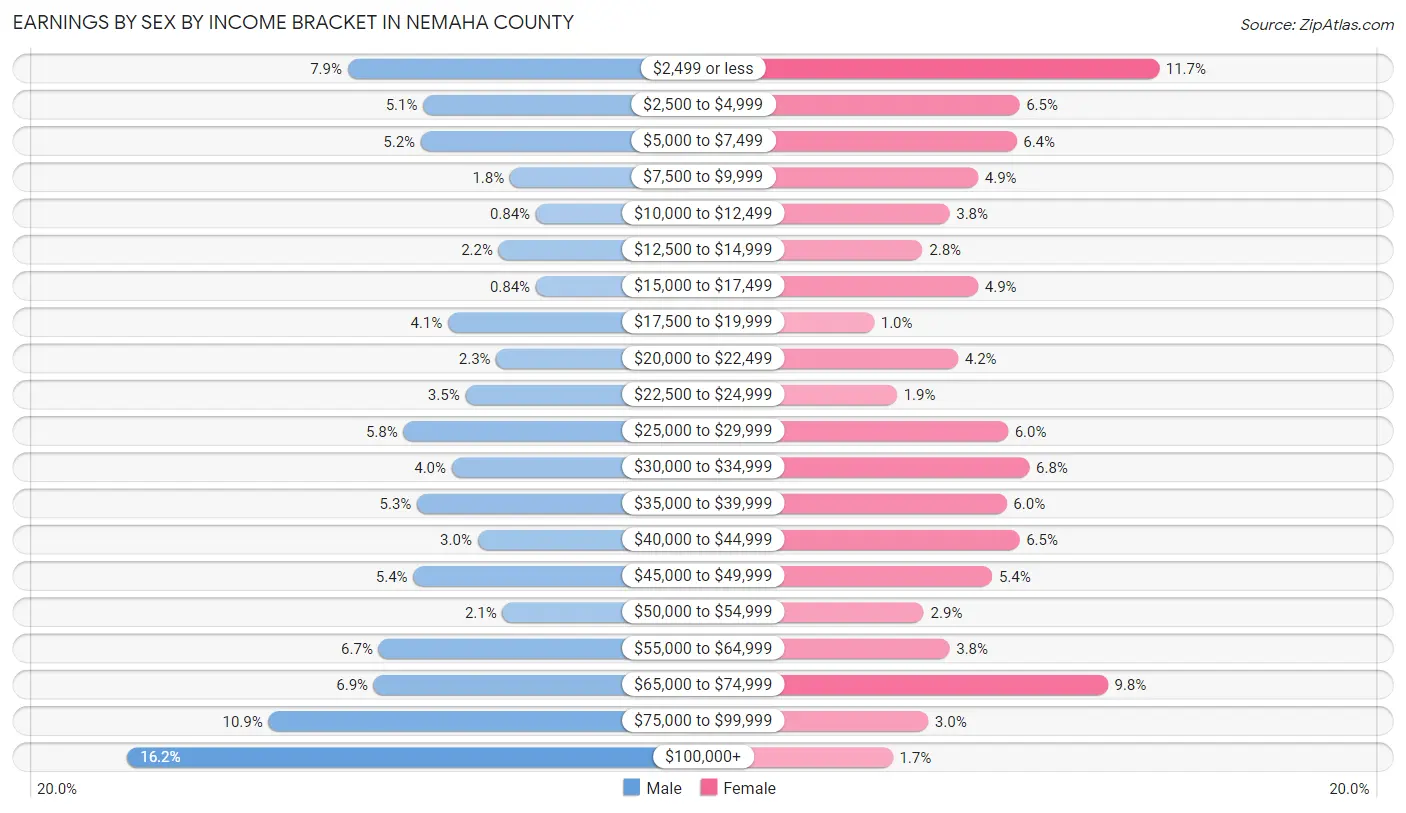
Earnings by Sex by Income Bracket in Nemaha County
The most common earnings brackets in Nemaha County are $100,000+ for men (348 | 16.2%) and $2,499 or less for women (219 | 11.7%).
| Income | Male | Female |
| $2,499 or less | 170 (7.9%) | 219 (11.7%) |
| $2,500 to $4,999 | 109 (5.1%) | 121 (6.5%) |
| $5,000 to $7,499 | 111 (5.1%) | 119 (6.4%) |
| $7,500 to $9,999 | 39 (1.8%) | 92 (4.9%) |
| $10,000 to $12,499 | 18 (0.8%) | 72 (3.8%) |
| $12,500 to $14,999 | 48 (2.2%) | 53 (2.8%) |
| $15,000 to $17,499 | 18 (0.8%) | 92 (4.9%) |
| $17,500 to $19,999 | 89 (4.1%) | 19 (1.0%) |
| $20,000 to $22,499 | 50 (2.3%) | 78 (4.2%) |
| $22,500 to $24,999 | 75 (3.5%) | 35 (1.9%) |
| $25,000 to $29,999 | 125 (5.8%) | 113 (6.0%) |
| $30,000 to $34,999 | 86 (4.0%) | 128 (6.8%) |
| $35,000 to $39,999 | 114 (5.3%) | 112 (6.0%) |
| $40,000 to $44,999 | 65 (3.0%) | 121 (6.5%) |
| $45,000 to $49,999 | 117 (5.4%) | 102 (5.4%) |
| $50,000 to $54,999 | 45 (2.1%) | 54 (2.9%) |
| $55,000 to $64,999 | 145 (6.7%) | 72 (3.8%) |
| $65,000 to $74,999 | 149 (6.9%) | 183 (9.8%) |
| $75,000 to $99,999 | 234 (10.9%) | 57 (3.0%) |
| $100,000+ | 348 (16.2%) | 32 (1.7%) |
| Total | 2,155 (100.0%) | 1,874 (100.0%) |
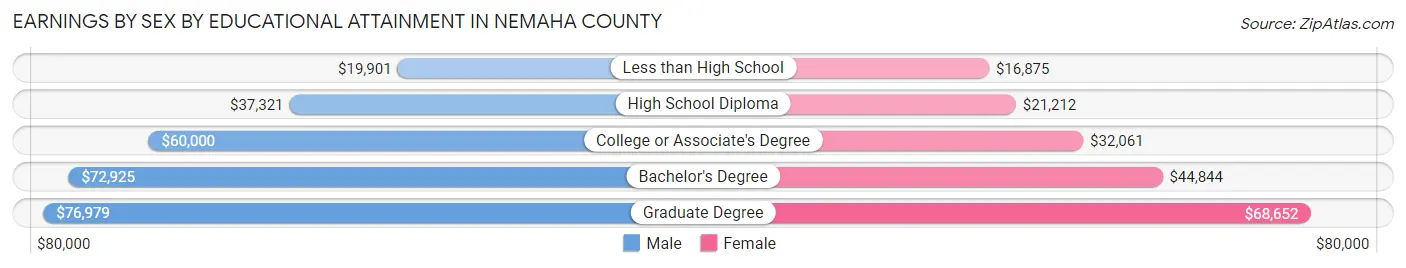
Earnings by Sex by Educational Attainment in Nemaha County
Average earnings in Nemaha County are $55,029 for men and $37,074 for women, a difference of 32.6%. Men with an educational attainment of graduate degree enjoy the highest average annual earnings of $76,979, while those with less than high school education earn the least with $19,901. Women with an educational attainment of graduate degree earn the most with the average annual earnings of $68,652, while those with less than high school education have the smallest earnings of $16,875.
| Educational Attainment | Male Income | Female Income |
| Less than High School | $19,901 | $16,875 |
| High School Diploma | $37,321 | $21,212 |
| College or Associate's Degree | $60,000 | $32,061 |
| Bachelor's Degree | $72,925 | $44,844 |
| Graduate Degree | $76,979 | $68,652 |
| Total | $55,029 | $37,074 |
Family Income in Nemaha County
Family Income Brackets in Nemaha County
According to the Nemaha County family income data, there are 356 families falling into the $100,000 to $149,999 income range, which is the most common income bracket and makes up 22.1% of all families. Conversely, the $10,000 to $14,999 income bracket is the least frequent group with only 19 families (1.2%) belonging to this category.
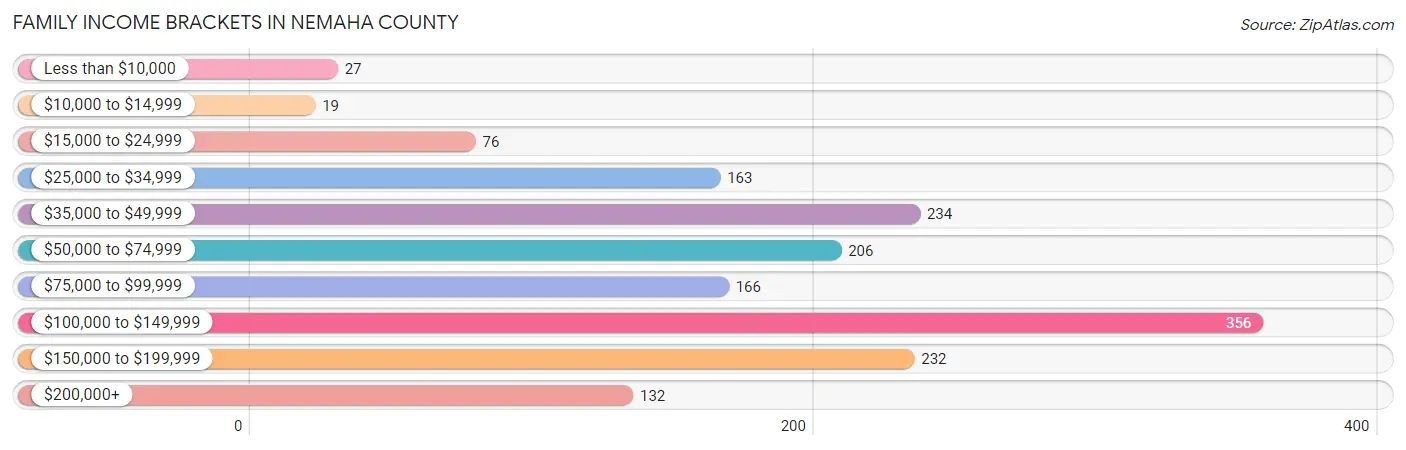
| Income Bracket | # Families | % Families |
| Less than $10,000 | 27 | 1.7% |
| $10,000 to $14,999 | 19 | 1.2% |
| $15,000 to $24,999 | 76 | 4.7% |
| $25,000 to $34,999 | 163 | 10.1% |
| $35,000 to $49,999 | 234 | 14.5% |
| $50,000 to $74,999 | 206 | 12.8% |
| $75,000 to $99,999 | 166 | 10.3% |
| $100,000 to $149,999 | 356 | 22.1% |
| $150,000 to $199,999 | 232 | 14.4% |
| $200,000+ | 132 | 8.2% |
Family Income by Famaliy Size in Nemaha County
7+ person families (24 | 1.5%) account for the highest median family income in Nemaha County with $115,000 per family, while 2-person families (906 | 56.2%) have the highest median income of $34,444 per family member.
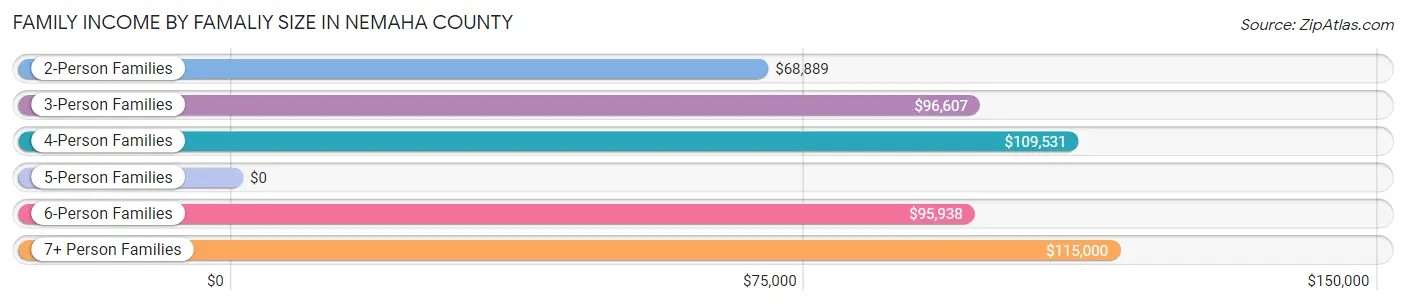
| Income Bracket | # Families | Median Income |
| 2-Person Families | 906 (56.2%) | $68,889 |
| 3-Person Families | 289 (17.9%) | $96,607 |
| 4-Person Families | 269 (16.7%) | $109,531 |
| 5-Person Families | 88 (5.5%) | $0 |
| 6-Person Families | 37 (2.3%) | $95,938 |
| 7+ Person Families | 24 (1.5%) | $115,000 |
| Total | 1,613 (100.0%) | $92,644 |
Family Income by Number of Earners in Nemaha County
The median family income in Nemaha County is $92,644, with families comprising 3+ earners (139) having the highest median family income of $128,750, while families with no earners (155) have the lowest median family income of $50,402, accounting for 8.6% and 9.6% of families, respectively.
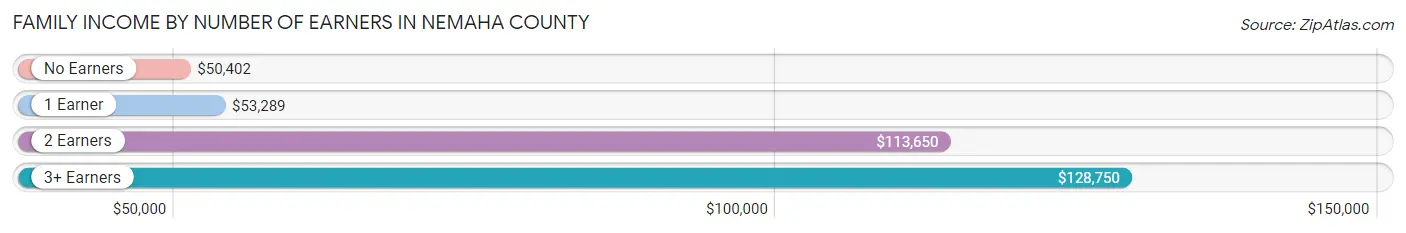
| Number of Earners | # Families | Median Income |
| No Earners | 155 (9.6%) | $50,402 |
| 1 Earner | 528 (32.7%) | $53,289 |
| 2 Earners | 791 (49.0%) | $113,650 |
| 3+ Earners | 139 (8.6%) | $128,750 |
| Total | 1,613 (100.0%) | $92,644 |
Household Income in Nemaha County
Household Income Brackets in Nemaha County
With 473 households falling in the category, the $50,000 to $74,999 income range is the most frequent in Nemaha County, accounting for 16.6% of all households. In contrast, only 100 households (3.5%) fall into the less than $10,000 income bracket, making it the least populous group.
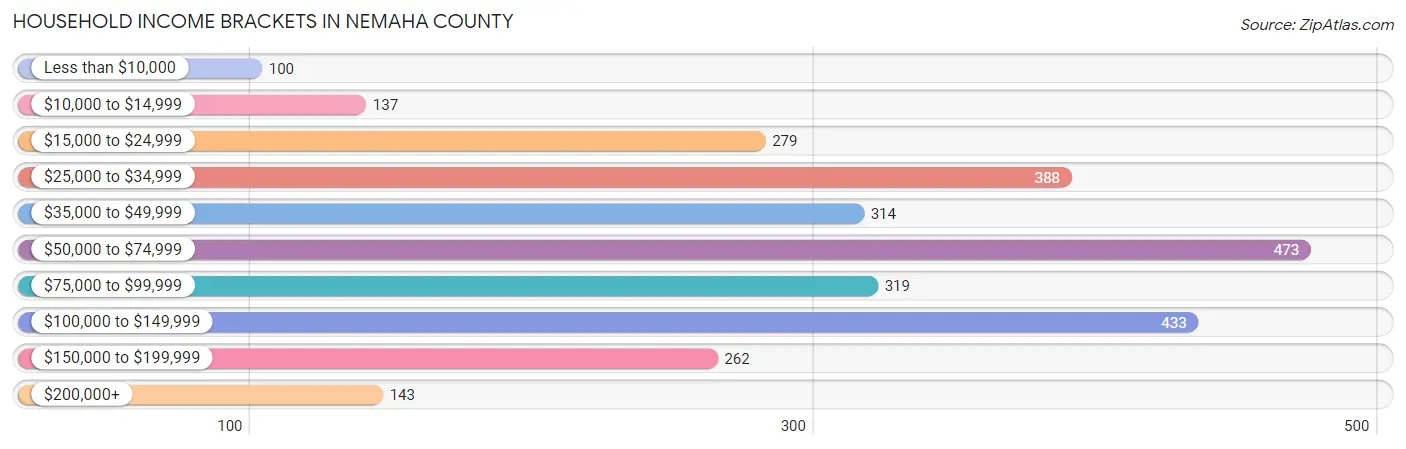
| Income Bracket | # Households | % Households |
| Less than $10,000 | 100 | 3.5% |
| $10,000 to $14,999 | 137 | 4.8% |
| $15,000 to $24,999 | 279 | 9.8% |
| $25,000 to $34,999 | 388 | 13.6% |
| $35,000 to $49,999 | 314 | 11.0% |
| $50,000 to $74,999 | 473 | 16.6% |
| $75,000 to $99,999 | 319 | 11.2% |
| $100,000 to $149,999 | 433 | 15.2% |
| $150,000 to $199,999 | 262 | 9.2% |
| $200,000+ | 143 | 5.0% |
Household Income by Householder Age in Nemaha County
The median household income in Nemaha County is $57,196, with the highest median household income of $79,333 found in the 45 to 64 years age bracket for the primary householder. A total of 986 households (34.6%) fall into this category. Meanwhile, the 15 to 24 years age bracket for the primary householder has the lowest median household income of $33,448, with 126 households (4.4%) in this group.
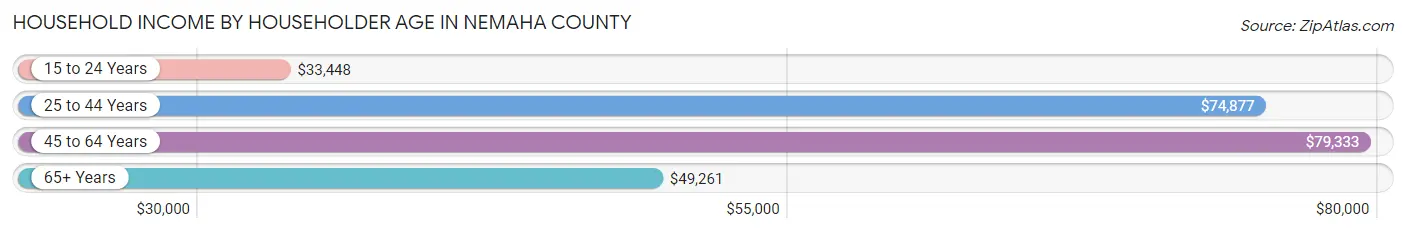
| Income Bracket | # Households | Median Income |
| 15 to 24 Years | 126 (4.4%) | $33,448 |
| 25 to 44 Years | 838 (29.4%) | $74,877 |
| 45 to 64 Years | 986 (34.6%) | $79,333 |
| 65+ Years | 901 (31.6%) | $49,261 |
| Total | 2,851 (100.0%) | $57,196 |
Poverty in Nemaha County
Income Below Poverty by Sex and Age in Nemaha County
With 12.7% poverty level for males and 18.1% for females among the residents of Nemaha County, 18 to 24 year old males and 18 to 24 year old females are the most vulnerable to poverty, with 68 males (28.0%) and 158 females (66.1%) in their respective age groups living below the poverty level.
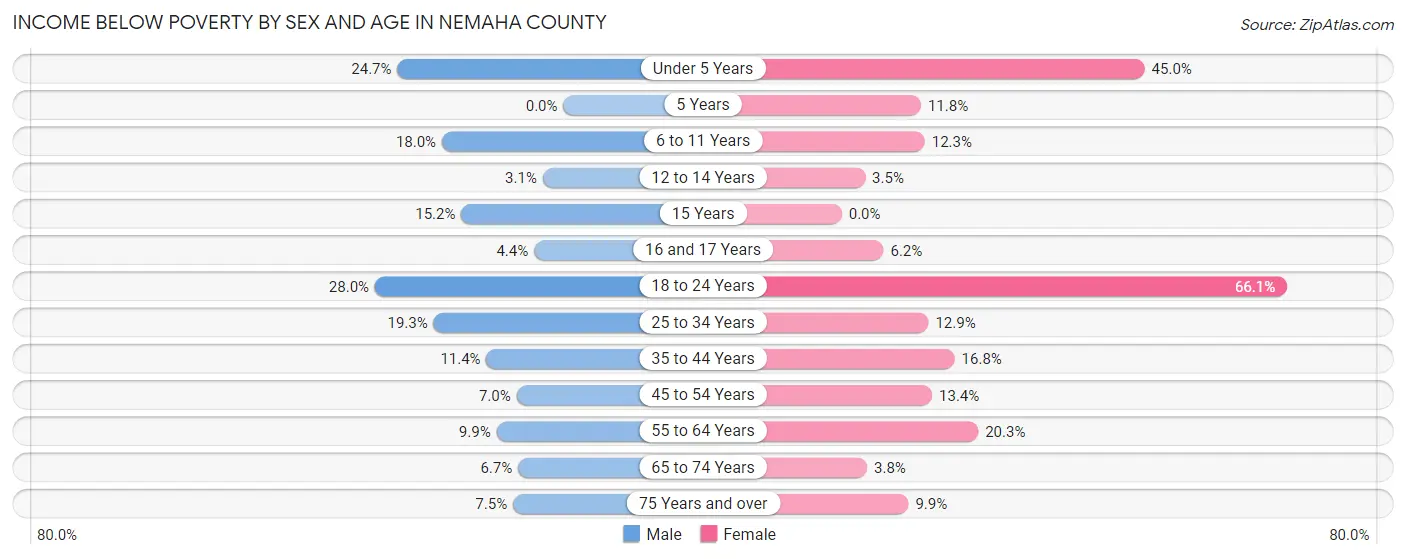
| Age Bracket | Male | Female |
| Under 5 Years | 53 (24.6%) | 85 (45.0%) |
| 5 Years | 0 (0.0%) | 4 (11.8%) |
| 6 to 11 Years | 42 (18.0%) | 28 (12.3%) |
| 12 to 14 Years | 6 (3.1%) | 5 (3.5%) |
| 15 Years | 5 (15.1%) | 0 (0.0%) |
| 16 and 17 Years | 5 (4.3%) | 8 (6.2%) |
| 18 to 24 Years | 68 (28.0%) | 158 (66.1%) |
| 25 to 34 Years | 79 (19.3%) | 44 (12.9%) |
| 35 to 44 Years | 50 (11.4%) | 61 (16.8%) |
| 45 to 54 Years | 23 (7.0%) | 48 (13.4%) |
| 55 to 64 Years | 44 (9.9%) | 93 (20.3%) |
| 65 to 74 Years | 28 (6.7%) | 15 (3.8%) |
| 75 Years and over | 19 (7.5%) | 30 (9.9%) |
| Total | 422 (12.7%) | 579 (18.1%) |
Income Above Poverty by Sex and Age in Nemaha County
According to the poverty statistics in Nemaha County, males aged 5 years and females aged 15 years are the age groups that are most secure financially, with 100.0% of males and 100.0% of females in these age groups living above the poverty line.
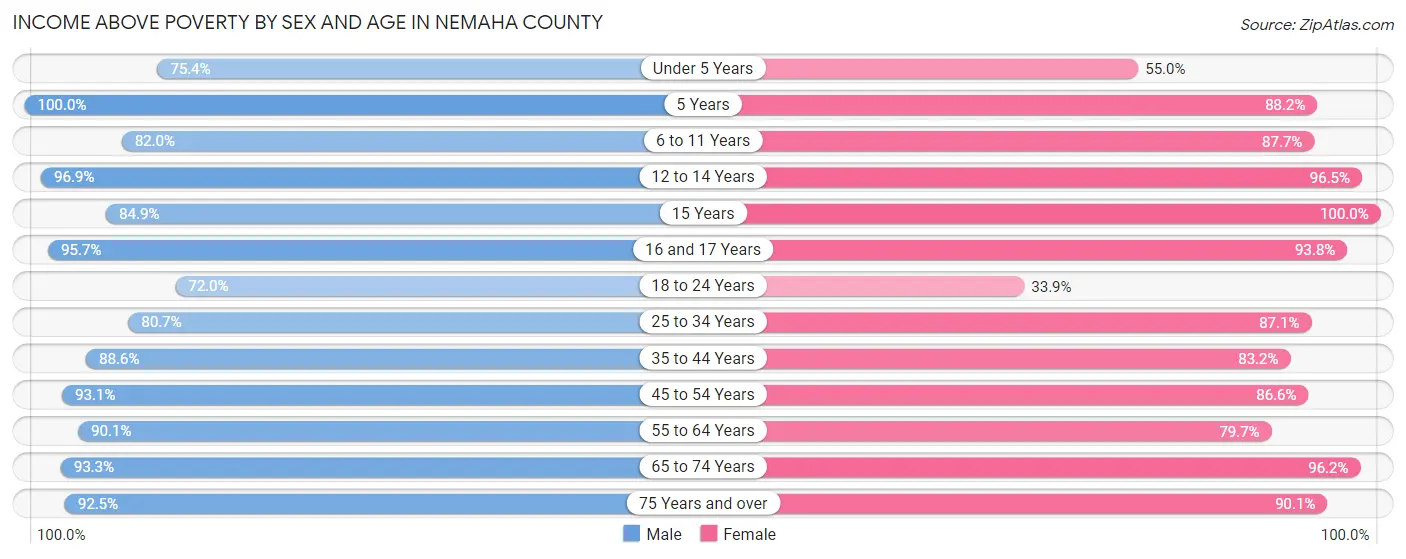
| Age Bracket | Male | Female |
| Under 5 Years | 162 (75.3%) | 104 (55.0%) |
| 5 Years | 8 (100.0%) | 30 (88.2%) |
| 6 to 11 Years | 191 (82.0%) | 199 (87.7%) |
| 12 to 14 Years | 190 (96.9%) | 139 (96.5%) |
| 15 Years | 28 (84.9%) | 9 (100.0%) |
| 16 and 17 Years | 110 (95.7%) | 121 (93.8%) |
| 18 to 24 Years | 175 (72.0%) | 81 (33.9%) |
| 25 to 34 Years | 331 (80.7%) | 298 (87.1%) |
| 35 to 44 Years | 388 (88.6%) | 303 (83.2%) |
| 45 to 54 Years | 308 (93.0%) | 310 (86.6%) |
| 55 to 64 Years | 399 (90.1%) | 366 (79.7%) |
| 65 to 74 Years | 388 (93.3%) | 384 (96.2%) |
| 75 Years and over | 235 (92.5%) | 273 (90.1%) |
| Total | 2,913 (87.4%) | 2,617 (81.9%) |
Income Below Poverty Among Married-Couple Families in Nemaha County
The poverty statistics for married-couple families in Nemaha County show that 4.1% or 53 of the total 1,282 families live below the poverty line. Families with 3 or 4 children have the highest poverty rate of 17.1%, comprising of 14 families. On the other hand, families with 5 or more children have the lowest poverty rate of 0.0%, which includes 0 families.
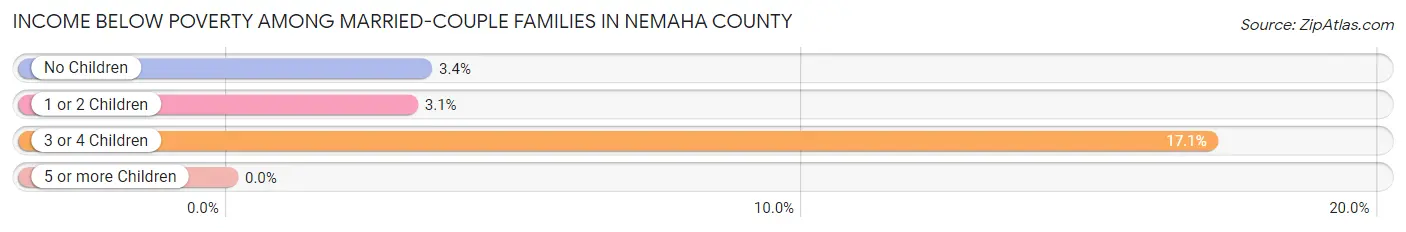
| Children | Above Poverty | Below Poverty |
| No Children | 801 (96.6%) | 28 (3.4%) |
| 1 or 2 Children | 340 (96.9%) | 11 (3.1%) |
| 3 or 4 Children | 68 (82.9%) | 14 (17.1%) |
| 5 or more Children | 20 (100.0%) | 0 (0.0%) |
| Total | 1,229 (95.9%) | 53 (4.1%) |
Income Below Poverty Among Single-Parent Households in Nemaha County
According to the poverty data in Nemaha County, 20.9% or 24 single-father households and 25.9% or 56 single-mother households are living below the poverty line. Among single-father households, those with 3 or 4 children have the highest poverty rate, with 24 households (100.0%) experiencing poverty. Likewise, among single-mother households, those with 1 or 2 children have the highest poverty rate, with 54 households (40.9%) falling below the poverty line.
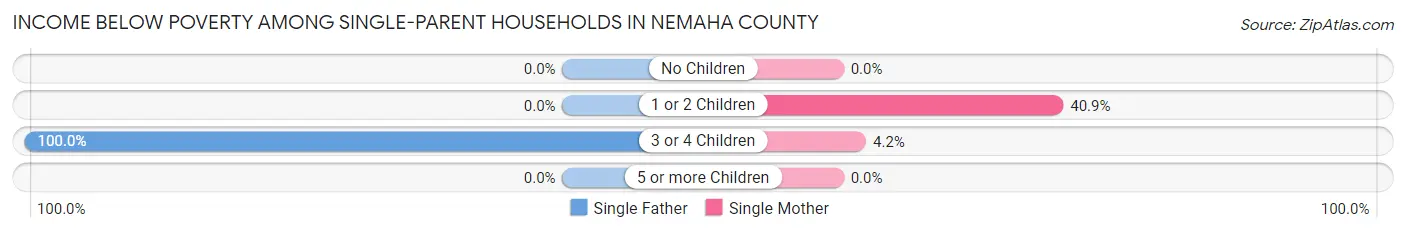
| Children | Single Father | Single Mother |
| No Children | 0 (0.0%) | 0 (0.0%) |
| 1 or 2 Children | 0 (0.0%) | 54 (40.9%) |
| 3 or 4 Children | 24 (100.0%) | 2 (4.2%) |
| 5 or more Children | 0 (0.0%) | 0 (0.0%) |
| Total | 24 (20.9%) | 56 (25.9%) |
Income Below Poverty Among Married-Couple vs Single-Parent Households in Nemaha County
The poverty data for Nemaha County shows that 53 of the married-couple family households (4.1%) and 80 of the single-parent households (24.2%) are living below the poverty level. Within the married-couple family households, those with 3 or 4 children have the highest poverty rate, with 14 households (17.1%) falling below the poverty line. Among the single-parent households, those with 3 or 4 children have the highest poverty rate, with 26 household (36.1%) living below poverty.
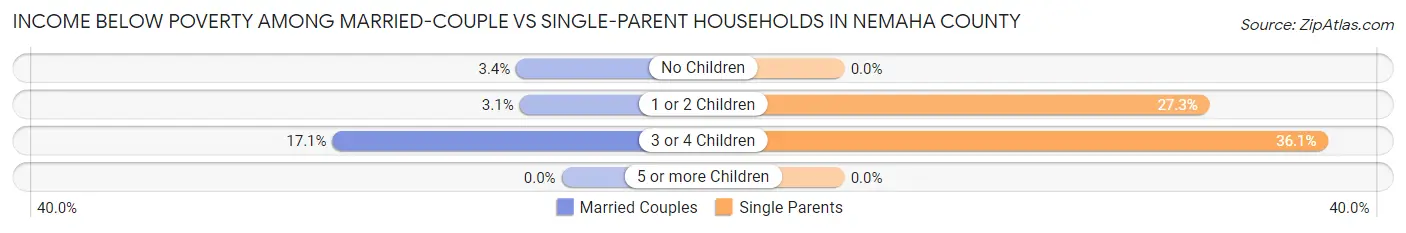
| Children | Married-Couple Families | Single-Parent Households |
| No Children | 28 (3.4%) | 0 (0.0%) |
| 1 or 2 Children | 11 (3.1%) | 54 (27.3%) |
| 3 or 4 Children | 14 (17.1%) | 26 (36.1%) |
| 5 or more Children | 0 (0.0%) | 0 (0.0%) |
| Total | 53 (4.1%) | 80 (24.2%) |
Race in Nemaha County
The most populous races in Nemaha County are White / Caucasian (6,427 | 91.6%), Two or more Races (349 | 5.0%), and Hispanic or Latino (214 | 3.0%).
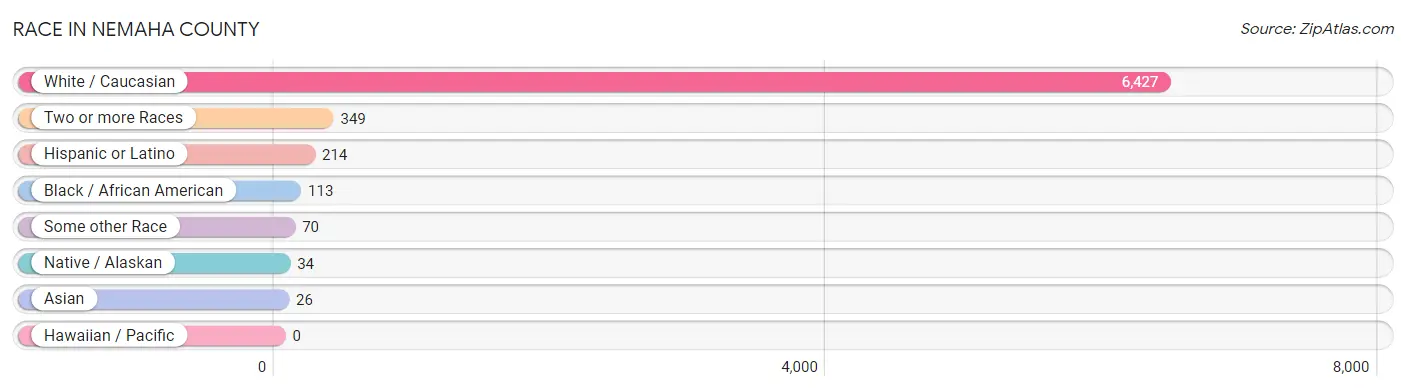
| Race | # Population | % Population |
| Asian | 26 | 0.4% |
| Black / African American | 113 | 1.6% |
| Hawaiian / Pacific | 0 | 0.0% |
| Hispanic or Latino | 214 | 3.0% |
| Native / Alaskan | 34 | 0.5% |
| White / Caucasian | 6,427 | 91.6% |
| Two or more Races | 349 | 5.0% |
| Some other Race | 70 | 1.0% |
| Total | 7,019 | 100.0% |
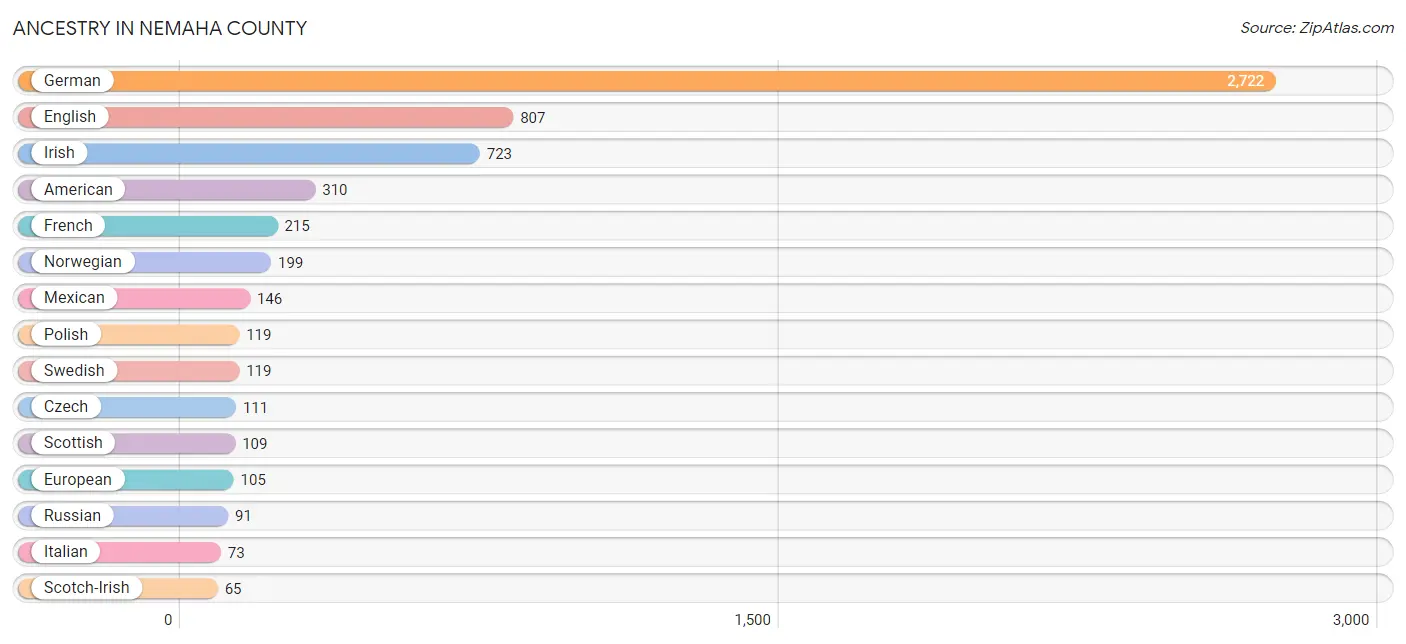
Ancestry in Nemaha County
The most populous ancestries reported in Nemaha County are German (2,722 | 38.8%), English (807 | 11.5%), Irish (723 | 10.3%), American (310 | 4.4%), and French (215 | 3.1%), together accounting for 68.1% of all Nemaha County residents.
| Ancestry | # Population | % Population |
| African | 10 | 0.1% |
| American | 310 | 4.4% |
| Australian | 5 | 0.1% |
| Blackfeet | 1 | 0.0% |
| British | 8 | 0.1% |
| Burmese | 18 | 0.3% |
| Canadian | 2 | 0.0% |
| Central American | 10 | 0.1% |
| Cherokee | 16 | 0.2% |
| Choctaw | 1 | 0.0% |
| Cuban | 38 | 0.5% |
| Czech | 111 | 1.6% |
| Czechoslovakian | 22 | 0.3% |
| Danish | 20 | 0.3% |
| Dutch | 54 | 0.8% |
| Eastern European | 5 | 0.1% |
| English | 807 | 11.5% |
| European | 105 | 1.5% |
| French | 215 | 3.1% |
| French American Indian | 2 | 0.0% |
| French Canadian | 10 | 0.1% |
| German | 2,722 | 38.8% |
| Greek | 1 | 0.0% |
| Inupiat | 1 | 0.0% |
| Irish | 723 | 10.3% |
| Italian | 73 | 1.0% |
| Jamaican | 10 | 0.1% |
| Korean | 8 | 0.1% |
| Lithuanian | 20 | 0.3% |
| Mexican | 146 | 2.1% |
| Nigerian | 6 | 0.1% |
| Norwegian | 199 | 2.8% |
| Paiute | 1 | 0.0% |
| Pakistani | 4 | 0.1% |
| Pennsylvania German | 11 | 0.2% |
| Polish | 119 | 1.7% |
| Potawatomi | 3 | 0.0% |
| Puerto Rican | 10 | 0.1% |
| Russian | 91 | 1.3% |
| Salvadoran | 10 | 0.1% |
| Scandinavian | 44 | 0.6% |
| Scotch-Irish | 65 | 0.9% |
| Scottish | 109 | 1.5% |
| Sioux | 3 | 0.0% |
| Slovak | 6 | 0.1% |
| South African | 3 | 0.0% |
| South American | 5 | 0.1% |
| Spaniard | 2 | 0.0% |
| Spanish | 3 | 0.0% |
| Subsaharan African | 33 | 0.5% |
| Sudanese | 14 | 0.2% |
| Swedish | 119 | 1.7% |
| Swiss | 50 | 0.7% |
| Ukrainian | 14 | 0.2% |
| Ute | 5 | 0.1% |
| Venezuelan | 5 | 0.1% |
| Welsh | 17 | 0.2% | View All 57 Rows |
Immigrants in Nemaha County
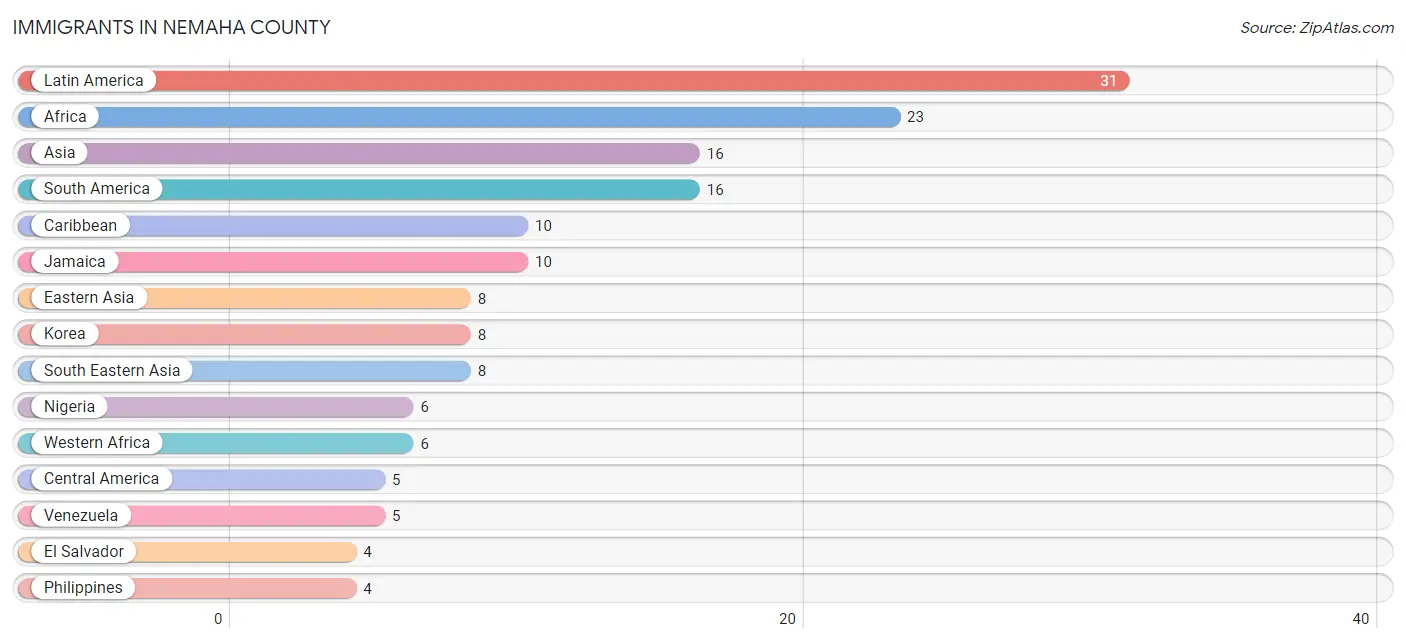
The most numerous immigrant groups reported in Nemaha County came from Latin America (31 | 0.4%), Africa (23 | 0.3%), Asia (16 | 0.2%), South America (16 | 0.2%), and Caribbean (10 | 0.1%), together accounting for 1.4% of all Nemaha County residents.
| Immigration Origin | # Population | % Population |
| Africa | 23 | 0.3% |
| Asia | 16 | 0.2% |
| Caribbean | 10 | 0.1% |
| Central America | 5 | 0.1% |
| Eastern Asia | 8 | 0.1% |
| El Salvador | 4 | 0.1% |
| Europe | 1 | 0.0% |
| Germany | 1 | 0.0% |
| Jamaica | 10 | 0.1% |
| Korea | 8 | 0.1% |
| Latin America | 31 | 0.4% |
| Mexico | 1 | 0.0% |
| Nigeria | 6 | 0.1% |
| Philippines | 4 | 0.1% |
| South Africa | 3 | 0.0% |
| South America | 16 | 0.2% |
| South Eastern Asia | 8 | 0.1% |
| Thailand | 4 | 0.1% |
| Venezuela | 5 | 0.1% |
| Western Africa | 6 | 0.1% |
| Western Europe | 1 | 0.0% | View All 21 Rows |
Sex and Age in Nemaha County
Sex and Age in Nemaha County
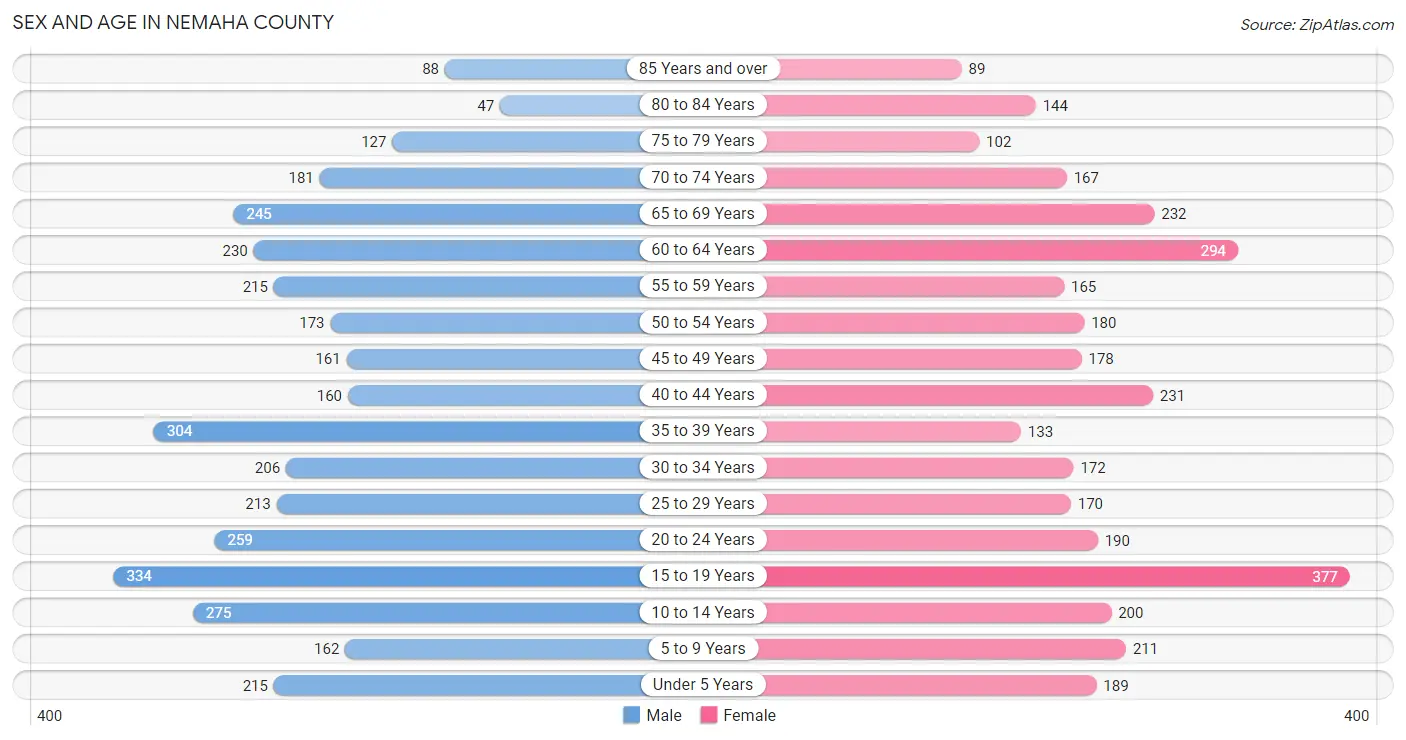
The most populous age groups in Nemaha County are 15 to 19 Years (334 | 9.3%) for men and 15 to 19 Years (377 | 11.0%) for women.
| Age Bracket | Male | Female |
| Under 5 Years | 215 (6.0%) | 189 (5.5%) |
| 5 to 9 Years | 162 (4.5%) | 211 (6.2%) |
| 10 to 14 Years | 275 (7.6%) | 200 (5.8%) |
| 15 to 19 Years | 334 (9.3%) | 377 (11.0%) |
| 20 to 24 Years | 259 (7.2%) | 190 (5.6%) |
| 25 to 29 Years | 213 (5.9%) | 170 (5.0%) |
| 30 to 34 Years | 206 (5.7%) | 172 (5.0%) |
| 35 to 39 Years | 304 (8.5%) | 133 (3.9%) |
| 40 to 44 Years | 160 (4.4%) | 231 (6.8%) |
| 45 to 49 Years | 161 (4.5%) | 178 (5.2%) |
| 50 to 54 Years | 173 (4.8%) | 180 (5.3%) |
| 55 to 59 Years | 215 (6.0%) | 165 (4.8%) |
| 60 to 64 Years | 230 (6.4%) | 294 (8.6%) |
| 65 to 69 Years | 245 (6.8%) | 232 (6.8%) |
| 70 to 74 Years | 181 (5.0%) | 167 (4.9%) |
| 75 to 79 Years | 127 (3.5%) | 102 (3.0%) |
| 80 to 84 Years | 47 (1.3%) | 144 (4.2%) |
| 85 Years and over | 88 (2.5%) | 89 (2.6%) |
| Total | 3,595 (100.0%) | 3,424 (100.0%) |
Families and Households in Nemaha County
Median Family Size in Nemaha County
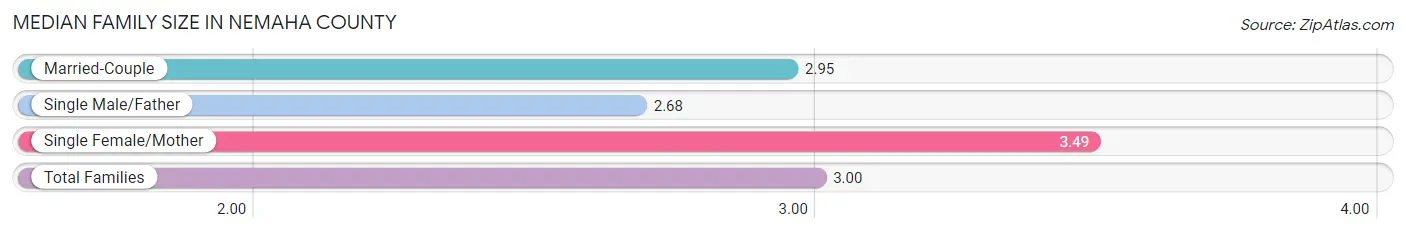
The median family size in Nemaha County is 3.00 persons per family, with single female/mother families (216 | 13.4%) accounting for the largest median family size of 3.49 persons per family. On the other hand, single male/father families (115 | 7.1%) represent the smallest median family size with 2.68 persons per family.
| Family Type | # Families | Family Size |
| Married-Couple | 1,282 (79.5%) | 2.95 |
| Single Male/Father | 115 (7.1%) | 2.68 |
| Single Female/Mother | 216 (13.4%) | 3.49 |
| Total Families | 1,613 (100.0%) | 3.00 |
Median Household Size in Nemaha County
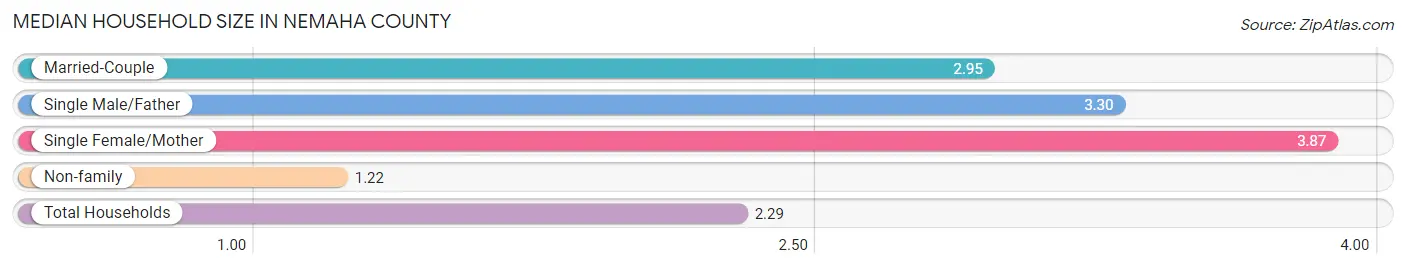
The median household size in Nemaha County is 2.29 persons per household, with single female/mother households (216 | 7.6%) accounting for the largest median household size of 3.87 persons per household. non-family households (1,238 | 43.4%) represent the smallest median household size with 1.22 persons per household.
| Household Type | # Households | Household Size |
| Married-Couple | 1,282 (45.0%) | 2.95 |
| Single Male/Father | 115 (4.0%) | 3.30 |
| Single Female/Mother | 216 (7.6%) | 3.87 |
| Non-family | 1,238 (43.4%) | 1.22 |
| Total Households | 2,851 (100.0%) | 2.29 |
Household Size by Marriage Status in Nemaha County
Out of a total of 2,851 households in Nemaha County, 1,613 (56.6%) are family households, while 1,238 (43.4%) are nonfamily households. The most numerous type of family households are 2-person households, comprising 813, and the most common type of nonfamily households are 1-person households, comprising 1,065.
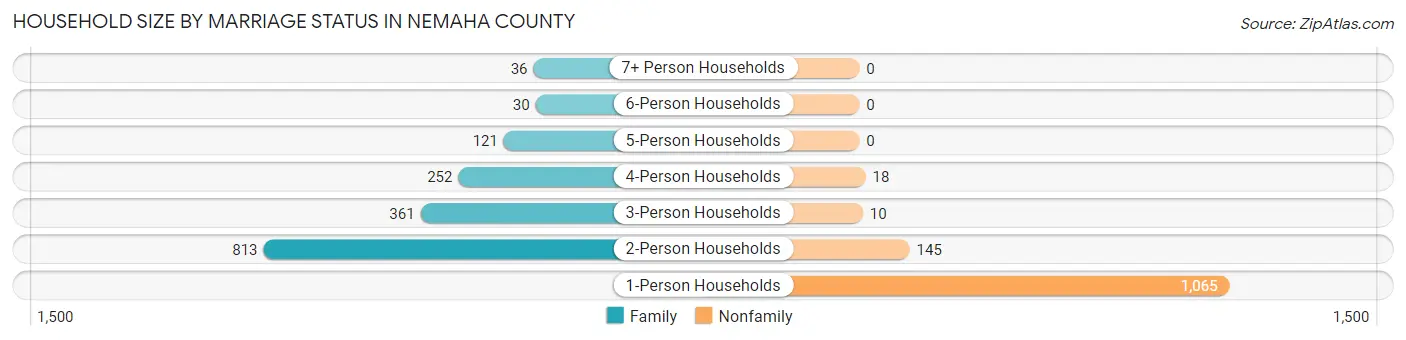
| Household Size | Family Households | Nonfamily Households |
| 1-Person Households | - | 1,065 (37.4%) |
| 2-Person Households | 813 (28.5%) | 145 (5.1%) |
| 3-Person Households | 361 (12.7%) | 10 (0.4%) |
| 4-Person Households | 252 (8.8%) | 18 (0.6%) |
| 5-Person Households | 121 (4.2%) | 0 (0.0%) |
| 6-Person Households | 30 (1.1%) | 0 (0.0%) |
| 7+ Person Households | 36 (1.3%) | 0 (0.0%) |
| Total | 1,613 (56.6%) | 1,238 (43.4%) |
Female Fertility in Nemaha County
Fertility by Age in Nemaha County
Average fertility rate in Nemaha County is 31.0 births per 1,000 women. Women in the age bracket of 20 to 34 years have the highest fertility rate with 77.0 births per 1,000 women. Women in the age bracket of 20 to 34 years acount for 89.1% of all women with births.
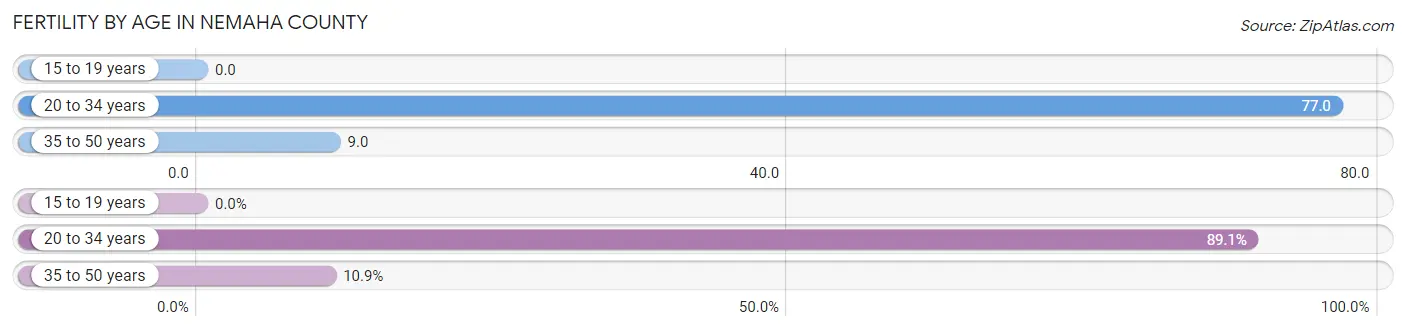
| Age Bracket | Women with Births | Births / 1,000 Women |
| 15 to 19 years | 0 (0.0%) | 0.0 |
| 20 to 34 years | 41 (89.1%) | 77.0 |
| 35 to 50 years | 5 (10.9%) | 9.0 |
| Total | 46 (100.0%) | 31.0 |
Fertility by Age by Marriage Status in Nemaha County
93.5% of women with births (46) in Nemaha County are married. The highest percentage of unmarried women with births falls into 35 to 50 years age bracket with 20.0% of them unmarried at the time of birth, while the lowest percentage of unmarried women with births belong to 20 to 34 years age bracket with 4.9% of them unmarried.
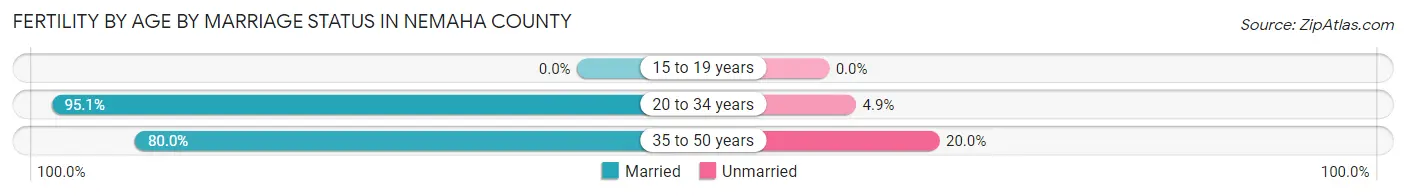
| Age Bracket | Married | Unmarried |
| 15 to 19 years | 0 (0.0%) | 0 (0.0%) |
| 20 to 34 years | 39 (95.1%) | 2 (4.9%) |
| 35 to 50 years | 4 (80.0%) | 1 (20.0%) |
| Total | 43 (93.5%) | 3 (6.5%) |
Fertility by Education in Nemaha County
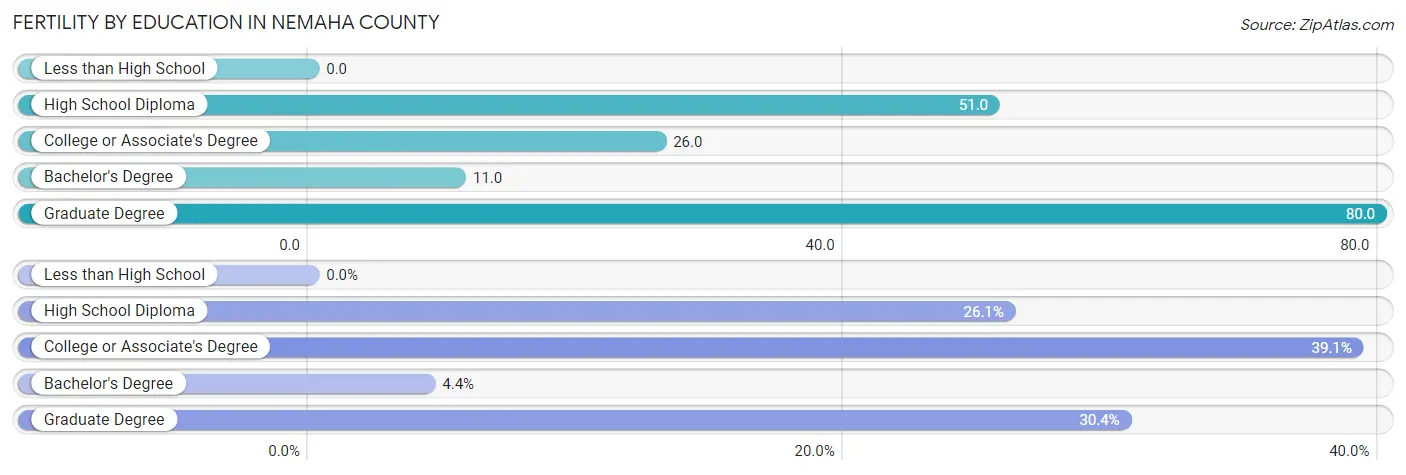
| Educational Attainment | Women with Births | Births / 1,000 Women |
| Less than High School | 0 (0.0%) | 0.0 |
| High School Diploma | 12 (26.1%) | 51.0 |
| College or Associate's Degree | 18 (39.1%) | 26.0 |
| Bachelor's Degree | 2 (4.3%) | 11.0 |
| Graduate Degree | 14 (30.4%) | 80.0 |
| Total | 46 (100.0%) | 31.0 |
Fertility by Education by Marriage Status in Nemaha County
6.5% of women with births in Nemaha County are unmarried. Women with the educational attainment of high school diploma are most likely to be married with 100.0% of them married at childbirth, while women with the educational attainment of college or associate's degree are least likely to be married with 16.7% of them unmarried at childbirth.
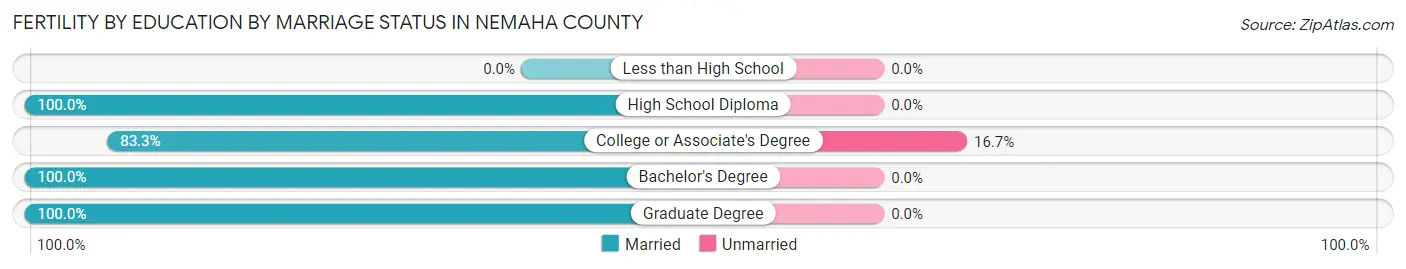
| Educational Attainment | Married | Unmarried |
| Less than High School | 0 (0.0%) | 0 (0.0%) |
| High School Diploma | 12 (100.0%) | 0 (0.0%) |
| College or Associate's Degree | 15 (83.3%) | 3 (16.7%) |
| Bachelor's Degree | 2 (100.0%) | 0 (0.0%) |
| Graduate Degree | 14 (100.0%) | 0 (0.0%) |
| Total | 43 (93.5%) | 3 (6.5%) |
Employment Characteristics in Nemaha County
Employment by Class of Employer in Nemaha County
Among the 3,187 employed individuals in Nemaha County, private company employees (1,537 | 48.2%), not-for-profit organizations (426 | 13.4%), and local government employees (381 | 11.9%) make up the most common classes of employment.
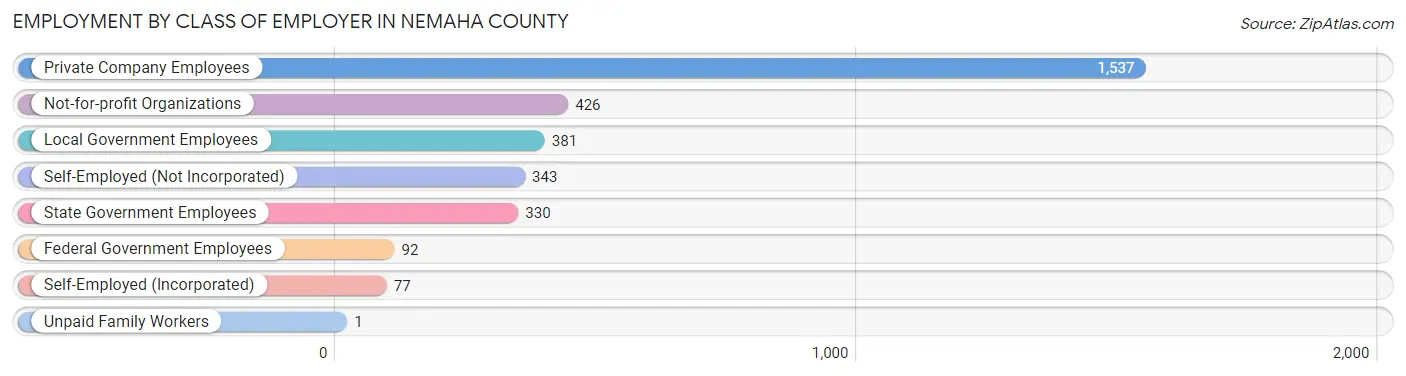
| Employer Class | # Employees | % Employees |
| Private Company Employees | 1,537 | 48.2% |
| Self-Employed (Incorporated) | 77 | 2.4% |
| Self-Employed (Not Incorporated) | 343 | 10.8% |
| Not-for-profit Organizations | 426 | 13.4% |
| Local Government Employees | 381 | 11.9% |
| State Government Employees | 330 | 10.3% |
| Federal Government Employees | 92 | 2.9% |
| Unpaid Family Workers | 1 | 0.0% |
| Total | 3,187 | 100.0% |
Employment Status by Age in Nemaha County
According to the labor force statistics for Nemaha County, out of the total population over 16 years of age (5,725), 60.9% or 3,487 individuals are in the labor force, with 6.4% or 223 of them unemployed. The age group with the highest labor force participation rate is 30 to 34 years, with 91.5% or 346 individuals in the labor force. Within the labor force, the 16 to 19 years age range has the highest percentage of unemployed individuals, with 23.4% or 79 of them being unemployed.
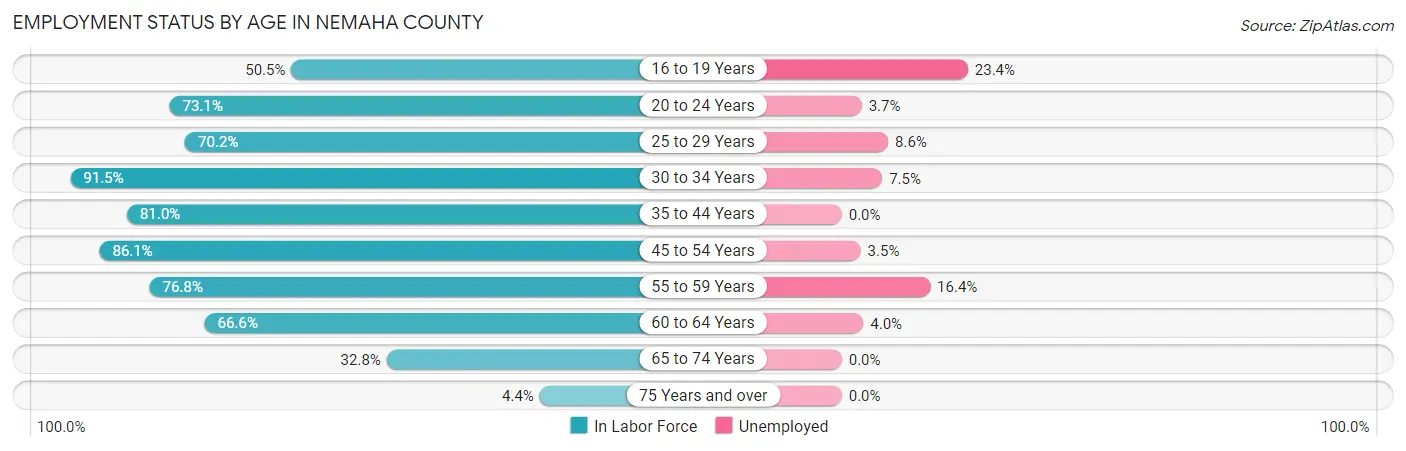
| Age Bracket | In Labor Force | Unemployed |
| 16 to 19 Years | 338 (50.5%) | 79 (23.4%) |
| 20 to 24 Years | 328 (73.1%) | 12 (3.7%) |
| 25 to 29 Years | 269 (70.2%) | 23 (8.6%) |
| 30 to 34 Years | 346 (91.5%) | 26 (7.5%) |
| 35 to 44 Years | 671 (81.0%) | 0 (0.0%) |
| 45 to 54 Years | 596 (86.1%) | 21 (3.5%) |
| 55 to 59 Years | 292 (76.8%) | 48 (16.4%) |
| 60 to 64 Years | 349 (66.6%) | 14 (4.0%) |
| 65 to 74 Years | 271 (32.8%) | 0 (0.0%) |
| 75 Years and over | 26 (4.4%) | 0 (0.0%) |
| Total | 3,487 (60.9%) | 223 (6.4%) |
Employment Status by Educational Attainment in Nemaha County
According to labor force statistics for Nemaha County, 79.2% of individuals (2,523) out of the total population between 25 and 64 years of age (3,185) are in the labor force, with 5.2% or 131 of them being unemployed. The group with the highest labor force participation rate are those with the educational attainment of bachelor's degree or higher, with 89.5% or 931 individuals in the labor force. Within the labor force, individuals with college / associate degree education have the highest percentage of unemployment, with 8.5% or 76 of them being unemployed.
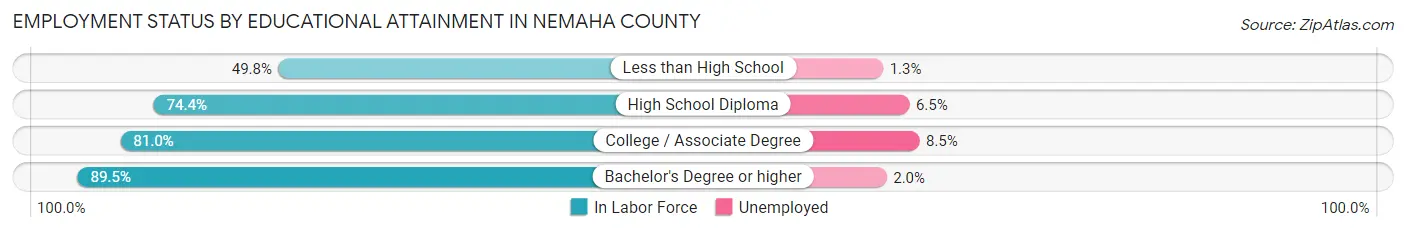
| Educational Attainment | In Labor Force | Unemployed |
| Less than High School | 158 (49.8%) | 4 (1.3%) |
| High School Diploma | 536 (74.4%) | 47 (6.5%) |
| College / Associate Degree | 897 (81.0%) | 94 (8.5%) |
| Bachelor's Degree or higher | 931 (89.5%) | 21 (2.0%) |
| Total | 2,523 (79.2%) | 166 (5.2%) |
Employment Occupations by Sex in Nemaha County
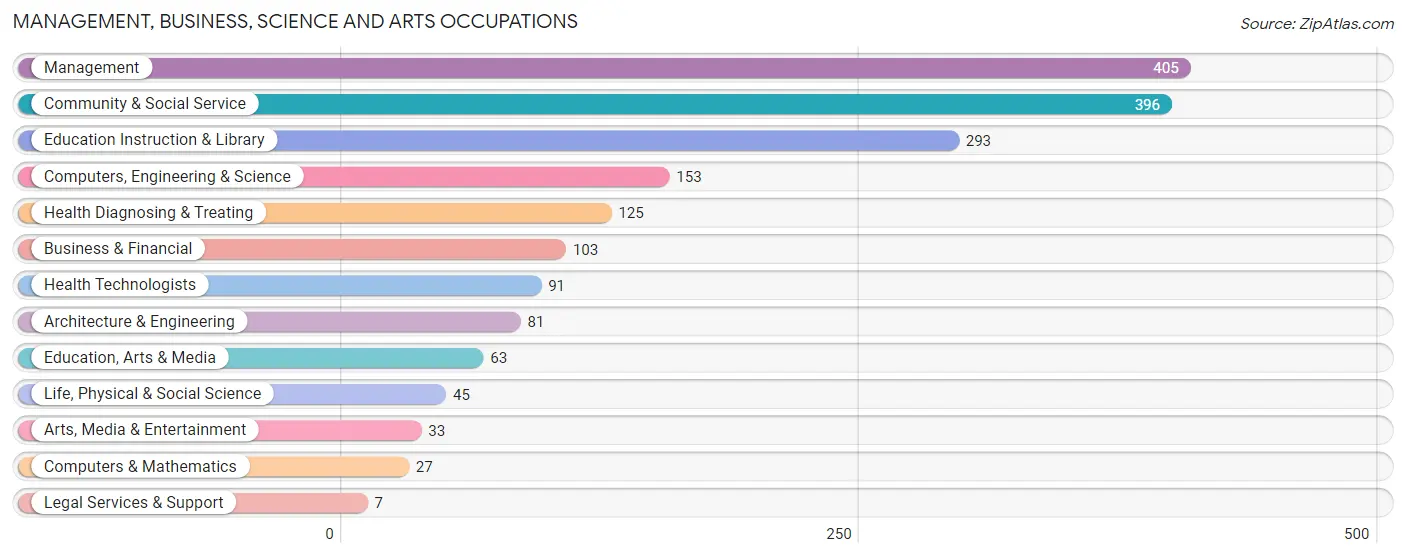
Management, Business, Science and Arts Occupations
The most common Management, Business, Science and Arts occupations in Nemaha County are Management (405 | 12.4%), Community & Social Service (396 | 12.1%), Education Instruction & Library (293 | 9.0%), Computers, Engineering & Science (153 | 4.7%), and Health Diagnosing & Treating (125 | 3.8%).
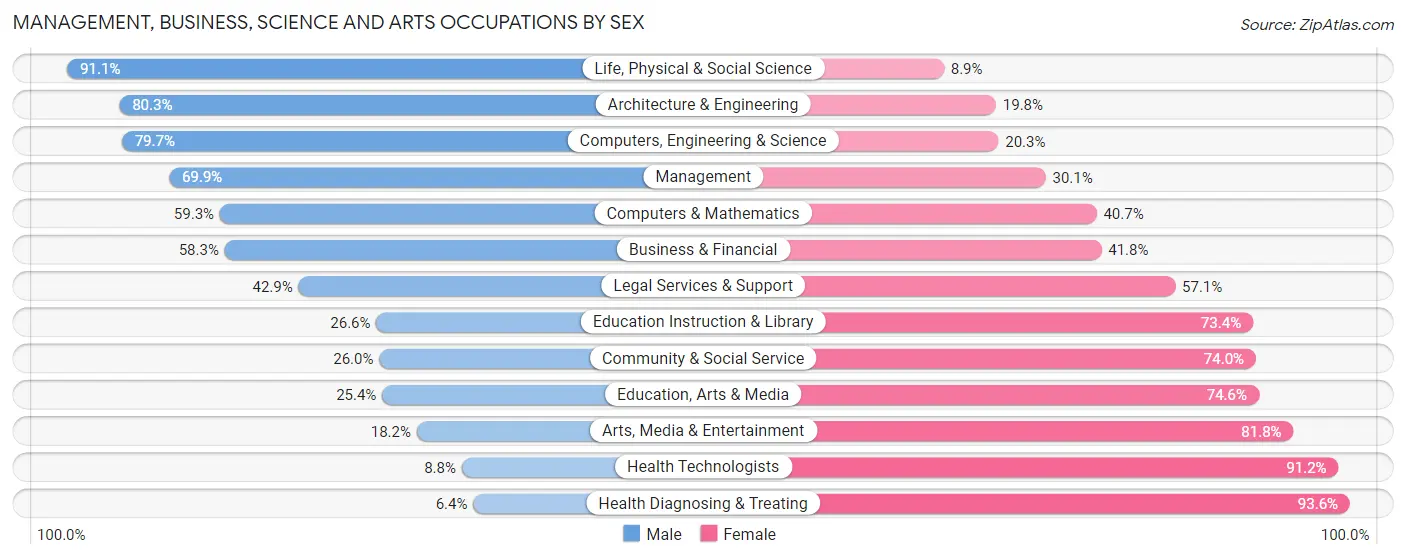
Management, Business, Science and Arts Occupations by Sex
Within the Management, Business, Science and Arts occupations in Nemaha County, the most male-oriented occupations are Life, Physical & Social Science (91.1%), Architecture & Engineering (80.2%), and Computers, Engineering & Science (79.7%), while the most female-oriented occupations are Health Diagnosing & Treating (93.6%), Health Technologists (91.2%), and Arts, Media & Entertainment (81.8%).
| Occupation | Male | Female |
| Management | 283 (69.9%) | 122 (30.1%) |
| Business & Financial | 60 (58.3%) | 43 (41.7%) |
| Computers, Engineering & Science | 122 (79.7%) | 31 (20.3%) |
| Computers & Mathematics | 16 (59.3%) | 11 (40.7%) |
| Architecture & Engineering | 65 (80.2%) | 16 (19.8%) |
| Life, Physical & Social Science | 41 (91.1%) | 4 (8.9%) |
| Community & Social Service | 103 (26.0%) | 293 (74.0%) |
| Education, Arts & Media | 16 (25.4%) | 47 (74.6%) |
| Legal Services & Support | 3 (42.9%) | 4 (57.1%) |
| Education Instruction & Library | 78 (26.6%) | 215 (73.4%) |
| Arts, Media & Entertainment | 6 (18.2%) | 27 (81.8%) |
| Health Diagnosing & Treating | 8 (6.4%) | 117 (93.6%) |
| Health Technologists | 8 (8.8%) | 83 (91.2%) |
| Total (Category) | 576 (48.7%) | 606 (51.3%) |
| Total (Overall) | 1,720 (52.7%) | 1,543 (47.3%) |
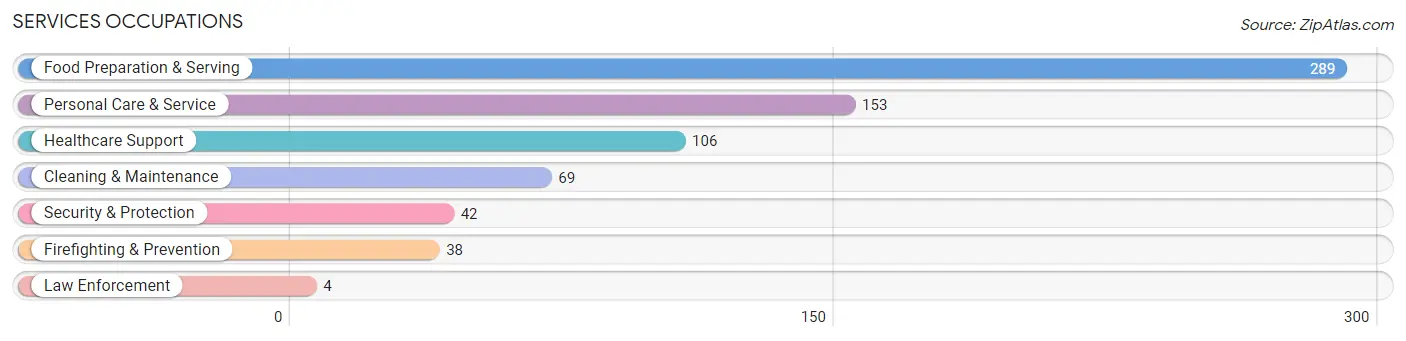
Services Occupations
The most common Services occupations in Nemaha County are Food Preparation & Serving (289 | 8.9%), Personal Care & Service (153 | 4.7%), Healthcare Support (106 | 3.3%), Cleaning & Maintenance (69 | 2.1%), and Security & Protection (42 | 1.3%).
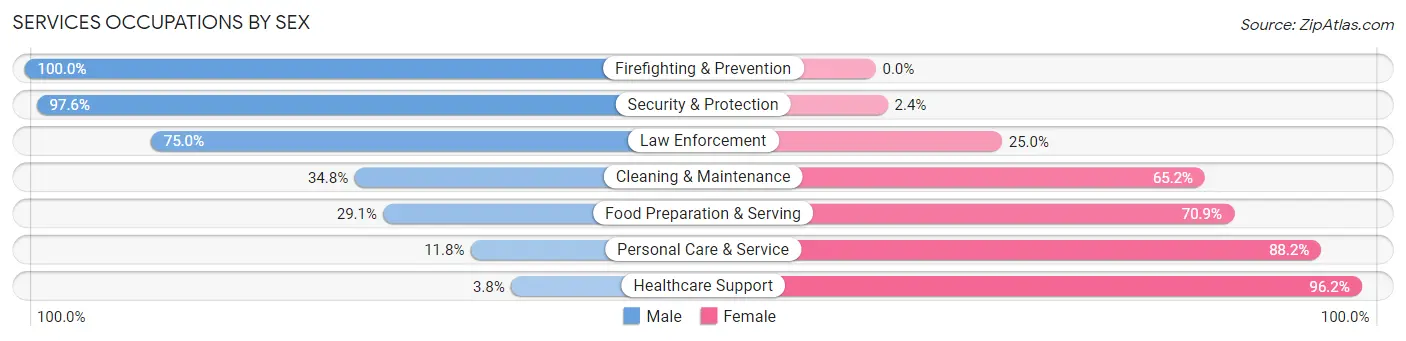
Services Occupations by Sex
Within the Services occupations in Nemaha County, the most male-oriented occupations are Firefighting & Prevention (100.0%), Security & Protection (97.6%), and Law Enforcement (75.0%), while the most female-oriented occupations are Healthcare Support (96.2%), Personal Care & Service (88.2%), and Food Preparation & Serving (70.9%).
| Occupation | Male | Female |
| Healthcare Support | 4 (3.8%) | 102 (96.2%) |
| Security & Protection | 41 (97.6%) | 1 (2.4%) |
| Firefighting & Prevention | 38 (100.0%) | 0 (0.0%) |
| Law Enforcement | 3 (75.0%) | 1 (25.0%) |
| Food Preparation & Serving | 84 (29.1%) | 205 (70.9%) |
| Cleaning & Maintenance | 24 (34.8%) | 45 (65.2%) |
| Personal Care & Service | 18 (11.8%) | 135 (88.2%) |
| Total (Category) | 171 (26.0%) | 488 (74.1%) |
| Total (Overall) | 1,720 (52.7%) | 1,543 (47.3%) |
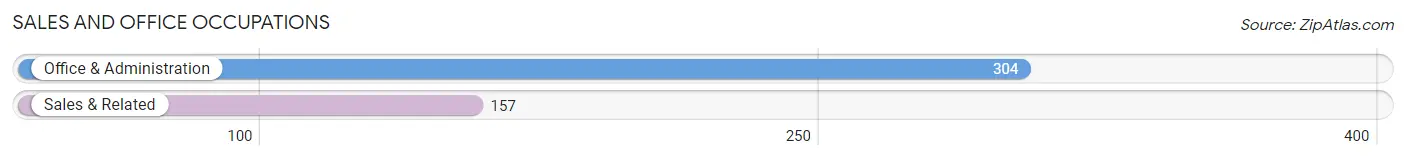
Sales and Office Occupations
The most common Sales and Office occupations in Nemaha County are Office & Administration (304 | 9.3%), and Sales & Related (157 | 4.8%).
Sales and Office Occupations by Sex
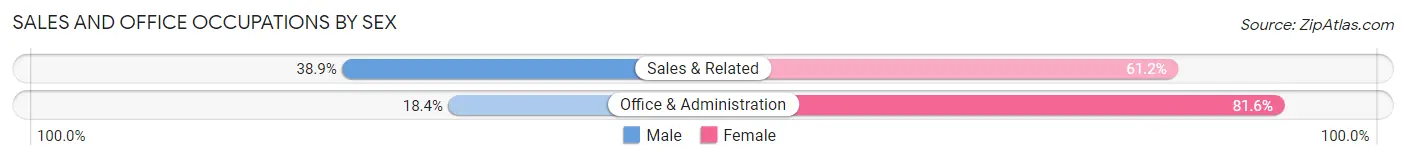
| Occupation | Male | Female |
| Sales & Related | 61 (38.9%) | 96 (61.2%) |
| Office & Administration | 56 (18.4%) | 248 (81.6%) |
| Total (Category) | 117 (25.4%) | 344 (74.6%) |
| Total (Overall) | 1,720 (52.7%) | 1,543 (47.3%) |
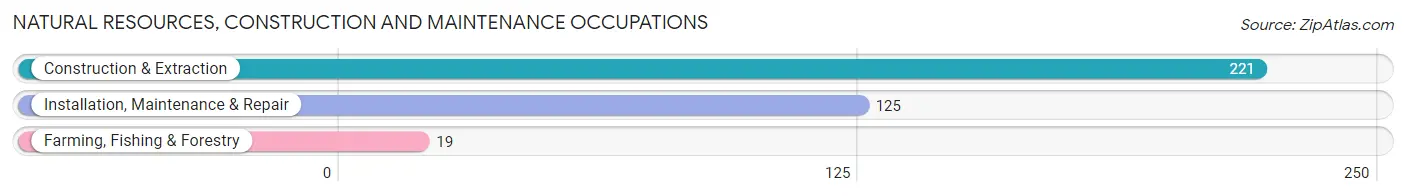
Natural Resources, Construction and Maintenance Occupations
The most common Natural Resources, Construction and Maintenance occupations in Nemaha County are Construction & Extraction (221 | 6.8%), Installation, Maintenance & Repair (125 | 3.8%), and Farming, Fishing & Forestry (19 | 0.6%).
Natural Resources, Construction and Maintenance Occupations by Sex
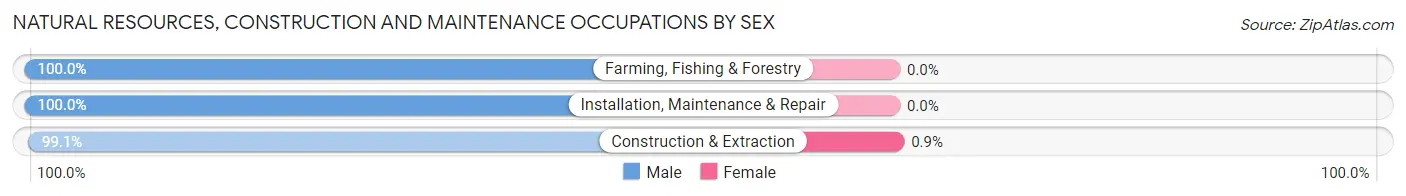
| Occupation | Male | Female |
| Farming, Fishing & Forestry | 19 (100.0%) | 0 (0.0%) |
| Construction & Extraction | 219 (99.1%) | 2 (0.9%) |
| Installation, Maintenance & Repair | 125 (100.0%) | 0 (0.0%) |
| Total (Category) | 363 (99.5%) | 2 (0.5%) |
| Total (Overall) | 1,720 (52.7%) | 1,543 (47.3%) |
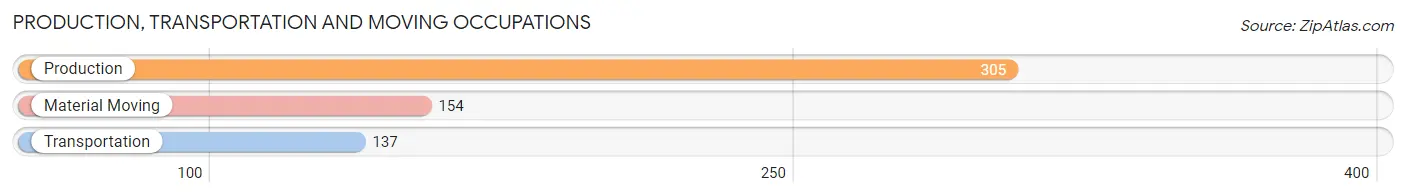
Production, Transportation and Moving Occupations
The most common Production, Transportation and Moving occupations in Nemaha County are Production (305 | 9.3%), Material Moving (154 | 4.7%), and Transportation (137 | 4.2%).
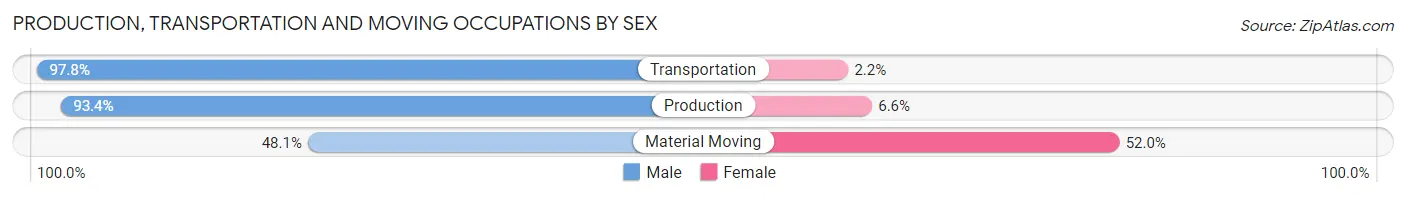
Production, Transportation and Moving Occupations by Sex
| Occupation | Male | Female |
| Production | 285 (93.4%) | 20 (6.6%) |
| Transportation | 134 (97.8%) | 3 (2.2%) |
| Material Moving | 74 (48.0%) | 80 (51.9%) |
| Total (Category) | 493 (82.7%) | 103 (17.3%) |
| Total (Overall) | 1,720 (52.7%) | 1,543 (47.3%) |
Employment Industries by Sex in Nemaha County
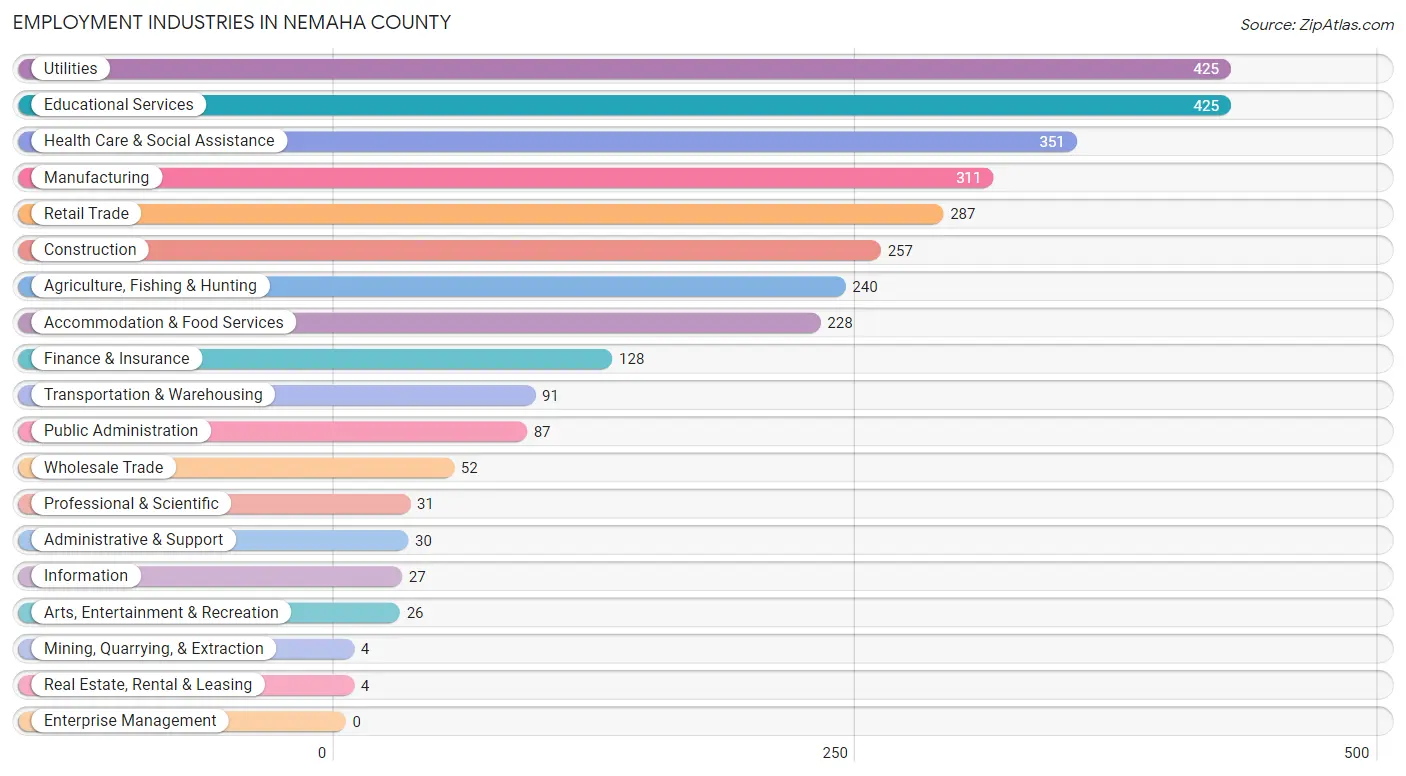
Employment Industries in Nemaha County
The major employment industries in Nemaha County include Utilities (425 | 13.0%), Educational Services (425 | 13.0%), Health Care & Social Assistance (351 | 10.8%), Manufacturing (311 | 9.5%), and Retail Trade (287 | 8.8%).
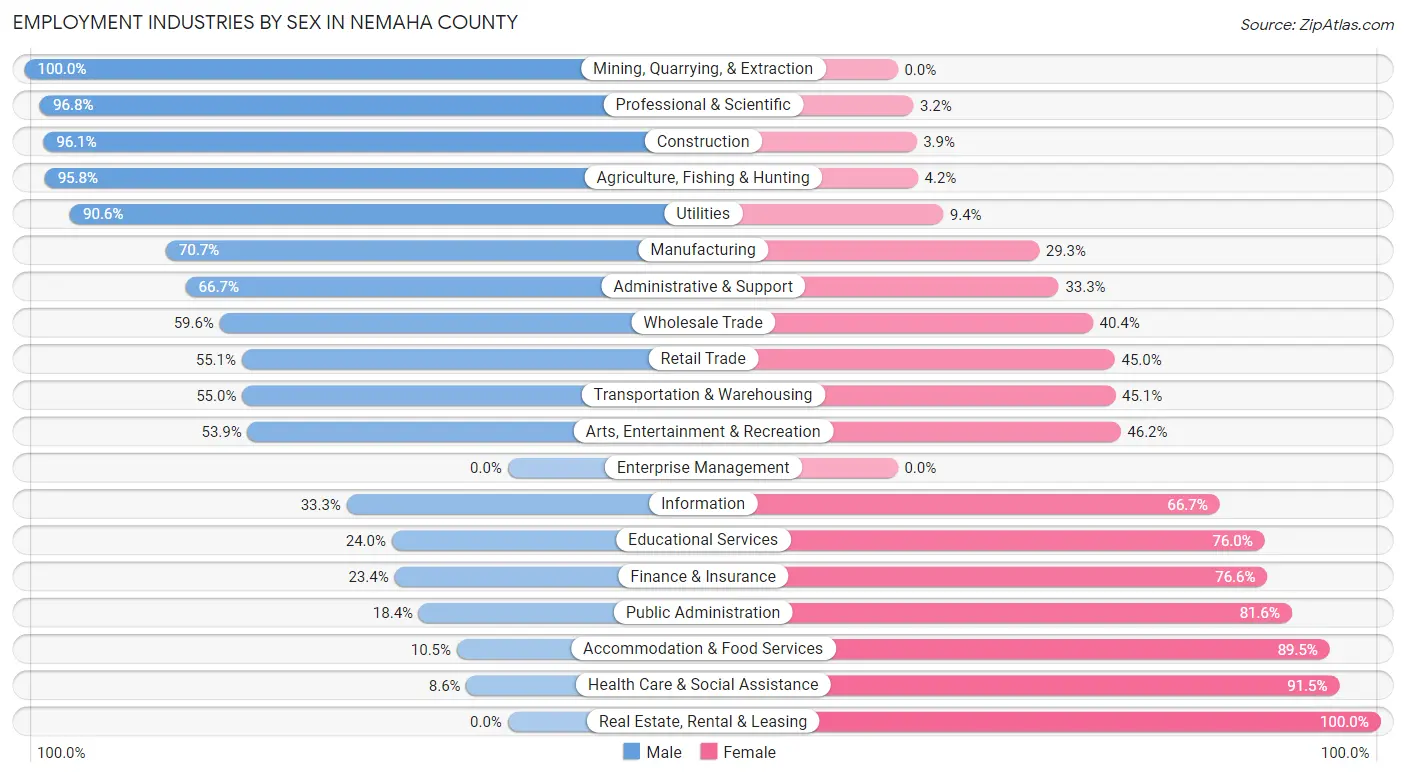
Employment Industries by Sex in Nemaha County
The Nemaha County industries that see more men than women are Mining, Quarrying, & Extraction (100.0%), Professional & Scientific (96.8%), and Construction (96.1%), whereas the industries that tend to have a higher number of women are Real Estate, Rental & Leasing (100.0%), Health Care & Social Assistance (91.4%), and Accommodation & Food Services (89.5%).
| Industry | Male | Female |
| Agriculture, Fishing & Hunting | 230 (95.8%) | 10 (4.2%) |
| Mining, Quarrying, & Extraction | 4 (100.0%) | 0 (0.0%) |
| Construction | 247 (96.1%) | 10 (3.9%) |
| Manufacturing | 220 (70.7%) | 91 (29.3%) |
| Wholesale Trade | 31 (59.6%) | 21 (40.4%) |
| Retail Trade | 158 (55.0%) | 129 (45.0%) |
| Transportation & Warehousing | 50 (54.9%) | 41 (45.1%) |
| Utilities | 385 (90.6%) | 40 (9.4%) |
| Information | 9 (33.3%) | 18 (66.7%) |
| Finance & Insurance | 30 (23.4%) | 98 (76.6%) |
| Real Estate, Rental & Leasing | 0 (0.0%) | 4 (100.0%) |
| Professional & Scientific | 30 (96.8%) | 1 (3.2%) |
| Enterprise Management | 0 (0.0%) | 0 (0.0%) |
| Administrative & Support | 20 (66.7%) | 10 (33.3%) |
| Educational Services | 102 (24.0%) | 323 (76.0%) |
| Health Care & Social Assistance | 30 (8.6%) | 321 (91.4%) |
| Arts, Entertainment & Recreation | 14 (53.8%) | 12 (46.2%) |
| Accommodation & Food Services | 24 (10.5%) | 204 (89.5%) |
| Public Administration | 16 (18.4%) | 71 (81.6%) |
| Total | 1,720 (52.7%) | 1,543 (47.3%) |
Education in Nemaha County
School Enrollment in Nemaha County
The most common levels of schooling among the 1,916 students in Nemaha County are college / undergraduate (724 | 37.8%), middle school (379 | 19.8%), and high school (331 | 17.3%).
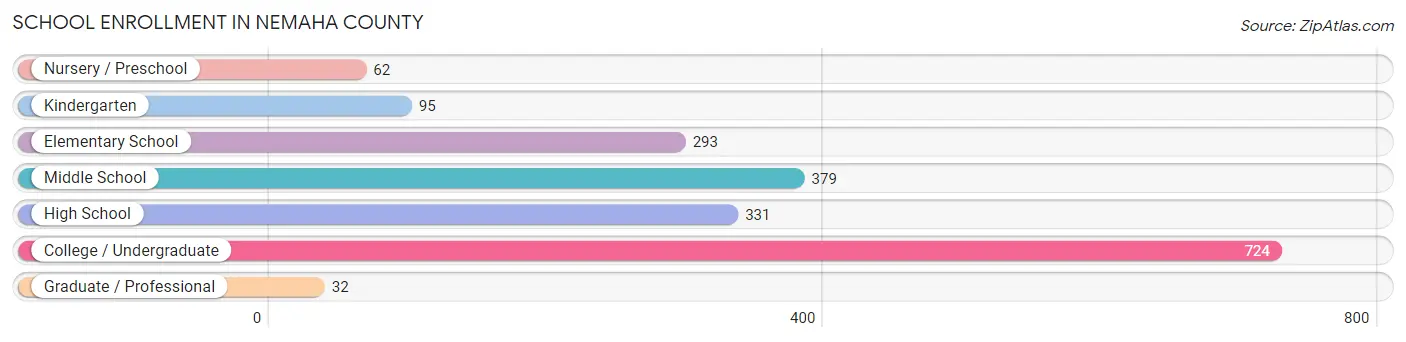
| School Level | # Students | % Students |
| Nursery / Preschool | 62 | 3.2% |
| Kindergarten | 95 | 5.0% |
| Elementary School | 293 | 15.3% |
| Middle School | 379 | 19.8% |
| High School | 331 | 17.3% |
| College / Undergraduate | 724 | 37.8% |
| Graduate / Professional | 32 | 1.7% |
| Total | 1,916 | 100.0% |
School Enrollment by Age by Funding Source in Nemaha County
Out of a total of 1,916 students who are enrolled in schools in Nemaha County, 136 (7.1%) attend a private institution, while the remaining 1,780 (92.9%) are enrolled in public schools. The age group of 3 to 4 year olds has the highest likelihood of being enrolled in private schools, with 33 (47.1% in the age bracket) enrolled. Conversely, the age group of 15 to 17 year olds has the lowest likelihood of being enrolled in a private school, with 264 (100.0% in the age bracket) attending a public institution.
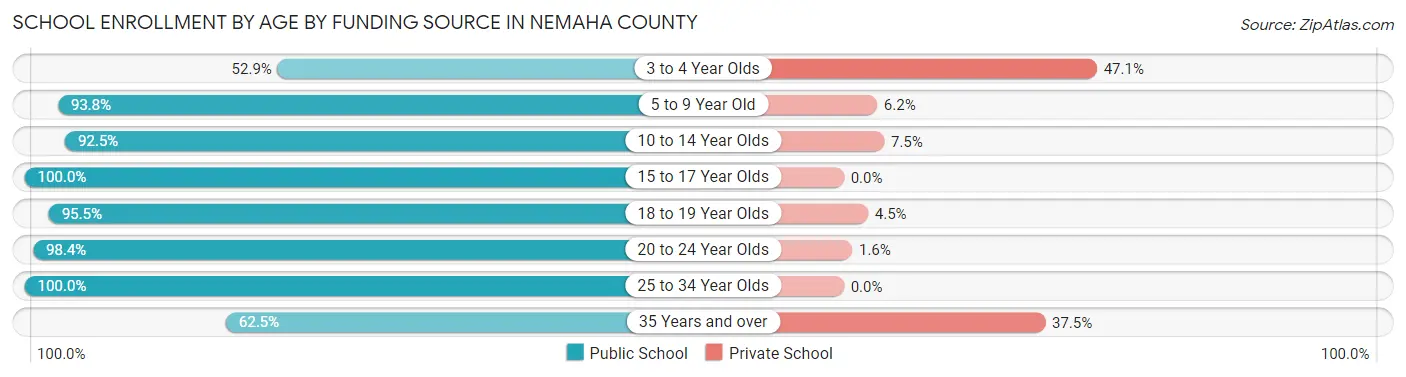
| Age Bracket | Public School | Private School |
| 3 to 4 Year Olds | 37 (52.9%) | 33 (47.1%) |
| 5 to 9 Year Old | 318 (93.8%) | 21 (6.2%) |
| 10 to 14 Year Olds | 406 (92.5%) | 33 (7.5%) |
| 15 to 17 Year Olds | 264 (100.0%) | 0 (0.0%) |
| 18 to 19 Year Olds | 382 (95.5%) | 18 (4.5%) |
| 20 to 24 Year Olds | 252 (98.4%) | 4 (1.6%) |
| 25 to 34 Year Olds | 76 (100.0%) | 0 (0.0%) |
| 35 Years and over | 45 (62.5%) | 27 (37.5%) |
| Total | 1,780 (92.9%) | 136 (7.1%) |
Educational Attainment by Field of Study in Nemaha County
Education (447 | 28.2%), business (292 | 18.4%), science & technology (165 | 10.4%), bio, nature & agricultural (131 | 8.3%), and engineering (115 | 7.3%) are the most common fields of study among 1,585 individuals in Nemaha County who have obtained a bachelor's degree or higher.
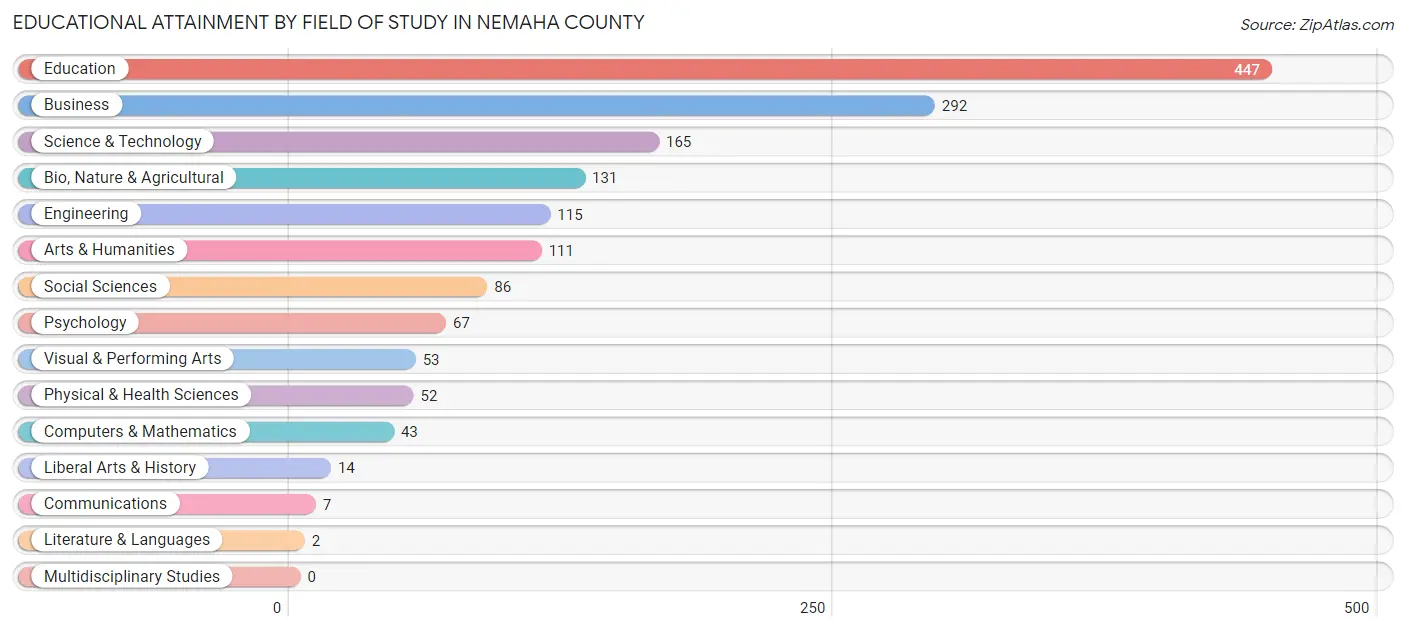
| Field of Study | # Graduates | % Graduates |
| Computers & Mathematics | 43 | 2.7% |
| Bio, Nature & Agricultural | 131 | 8.3% |
| Physical & Health Sciences | 52 | 3.3% |
| Psychology | 67 | 4.2% |
| Social Sciences | 86 | 5.4% |
| Engineering | 115 | 7.3% |
| Multidisciplinary Studies | 0 | 0.0% |
| Science & Technology | 165 | 10.4% |
| Business | 292 | 18.4% |
| Education | 447 | 28.2% |
| Literature & Languages | 2 | 0.1% |
| Liberal Arts & History | 14 | 0.9% |
| Visual & Performing Arts | 53 | 3.3% |
| Communications | 7 | 0.4% |
| Arts & Humanities | 111 | 7.0% |
| Total | 1,585 | 100.0% |
Transportation & Commute in Nemaha County
Vehicle Availability by Sex in Nemaha County
The most prevalent vehicle ownership categories in Nemaha County are males with 2 vehicles (572, accounting for 34.9%) and females with 2 vehicles (378, making up 41.3%).
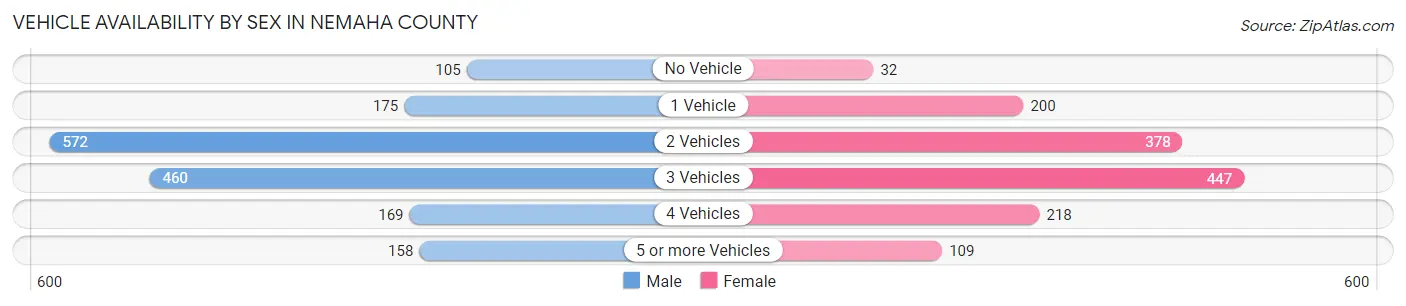
| Vehicles Available | Male | Female |
| No Vehicle | 105 (6.4%) | 32 (2.3%) |
| 1 Vehicle | 175 (10.7%) | 200 (14.4%) |
| 2 Vehicles | 572 (34.9%) | 378 (27.3%) |
| 3 Vehicles | 460 (28.1%) | 447 (32.3%) |
| 4 Vehicles | 169 (10.3%) | 218 (15.8%) |
| 5 or more Vehicles | 158 (9.6%) | 109 (7.9%) |
| Total | 1,639 (100.0%) | 1,384 (100.0%) |
Commute Time in Nemaha County
The most frequently occuring commute durations in Nemaha County are 5 to 9 minutes (749 commuters, 24.5%), less than 5 minutes (472 commuters, 15.4%), and 15 to 19 minutes (389 commuters, 12.7%).
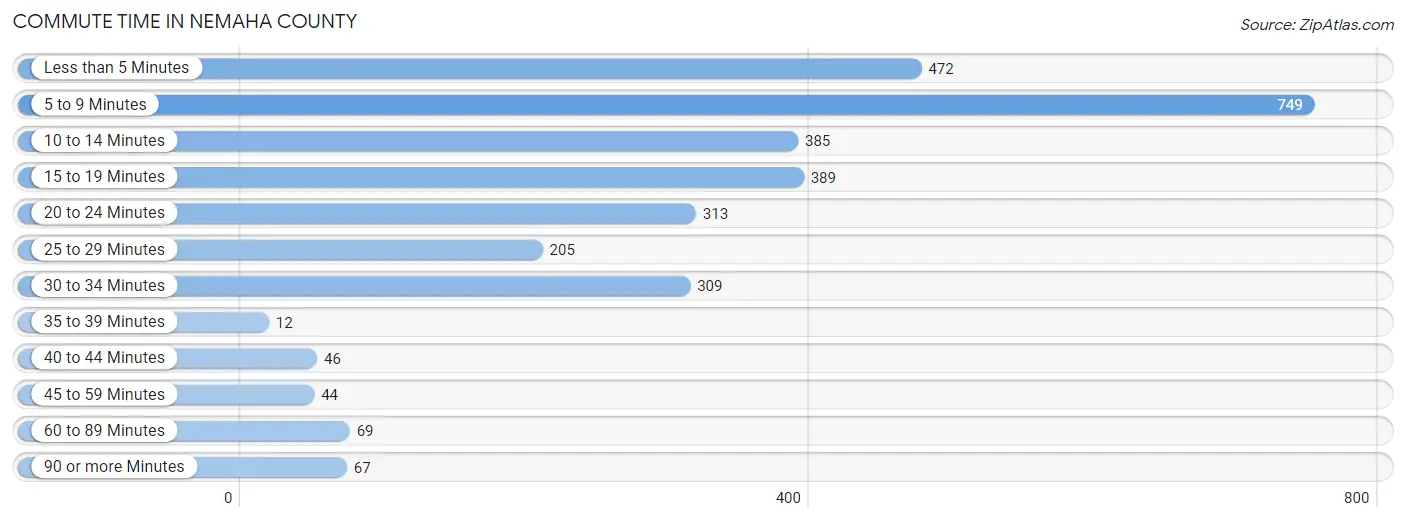
| Commute Time | # Commuters | % Commuters |
| Less than 5 Minutes | 472 | 15.4% |
| 5 to 9 Minutes | 749 | 24.5% |
| 10 to 14 Minutes | 385 | 12.6% |
| 15 to 19 Minutes | 389 | 12.7% |
| 20 to 24 Minutes | 313 | 10.2% |
| 25 to 29 Minutes | 205 | 6.7% |
| 30 to 34 Minutes | 309 | 10.1% |
| 35 to 39 Minutes | 12 | 0.4% |
| 40 to 44 Minutes | 46 | 1.5% |
| 45 to 59 Minutes | 44 | 1.4% |
| 60 to 89 Minutes | 69 | 2.2% |
| 90 or more Minutes | 67 | 2.2% |
Commute Time by Sex in Nemaha County
The most common commute times in Nemaha County are 5 to 9 minutes (314 commuters, 19.7%) for males and 5 to 9 minutes (435 commuters, 29.7%) for females.
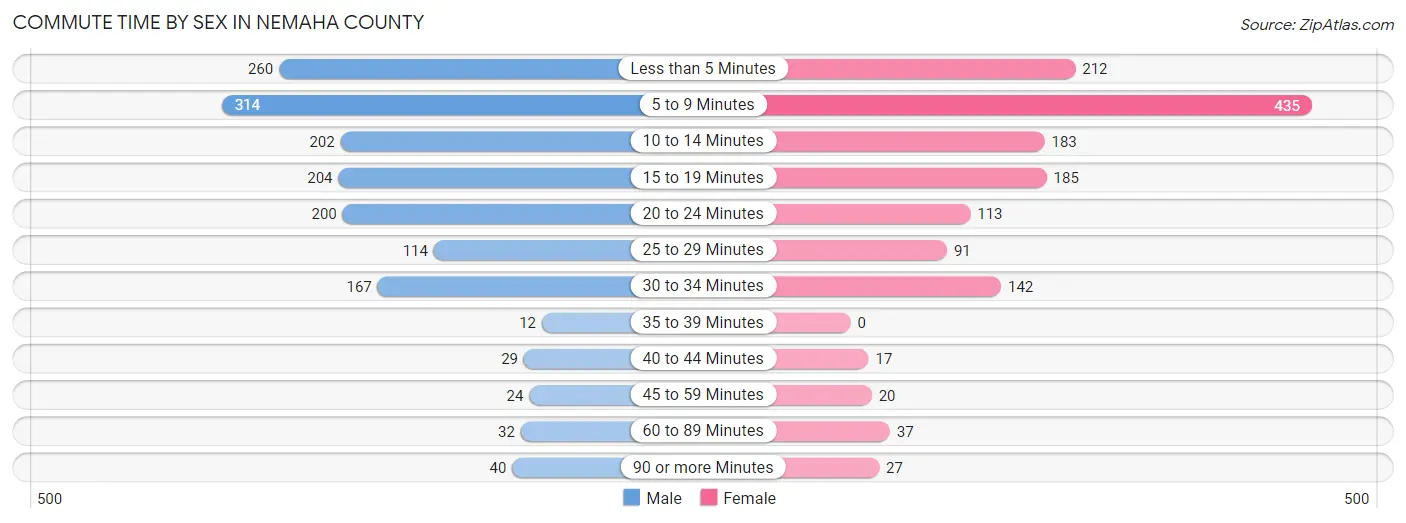
| Commute Time | Male | Female |
| Less than 5 Minutes | 260 (16.3%) | 212 (14.5%) |
| 5 to 9 Minutes | 314 (19.7%) | 435 (29.7%) |
| 10 to 14 Minutes | 202 (12.6%) | 183 (12.5%) |
| 15 to 19 Minutes | 204 (12.8%) | 185 (12.7%) |
| 20 to 24 Minutes | 200 (12.5%) | 113 (7.7%) |
| 25 to 29 Minutes | 114 (7.1%) | 91 (6.2%) |
| 30 to 34 Minutes | 167 (10.4%) | 142 (9.7%) |
| 35 to 39 Minutes | 12 (0.7%) | 0 (0.0%) |
| 40 to 44 Minutes | 29 (1.8%) | 17 (1.2%) |
| 45 to 59 Minutes | 24 (1.5%) | 20 (1.4%) |
| 60 to 89 Minutes | 32 (2.0%) | 37 (2.5%) |
| 90 or more Minutes | 40 (2.5%) | 27 (1.8%) |
Time of Departure to Work by Sex in Nemaha County
The most frequent times of departure to work in Nemaha County are 6:30 AM to 6:59 AM (208, 13.0%) for males and 7:00 AM to 7:29 AM (308, 21.1%) for females.
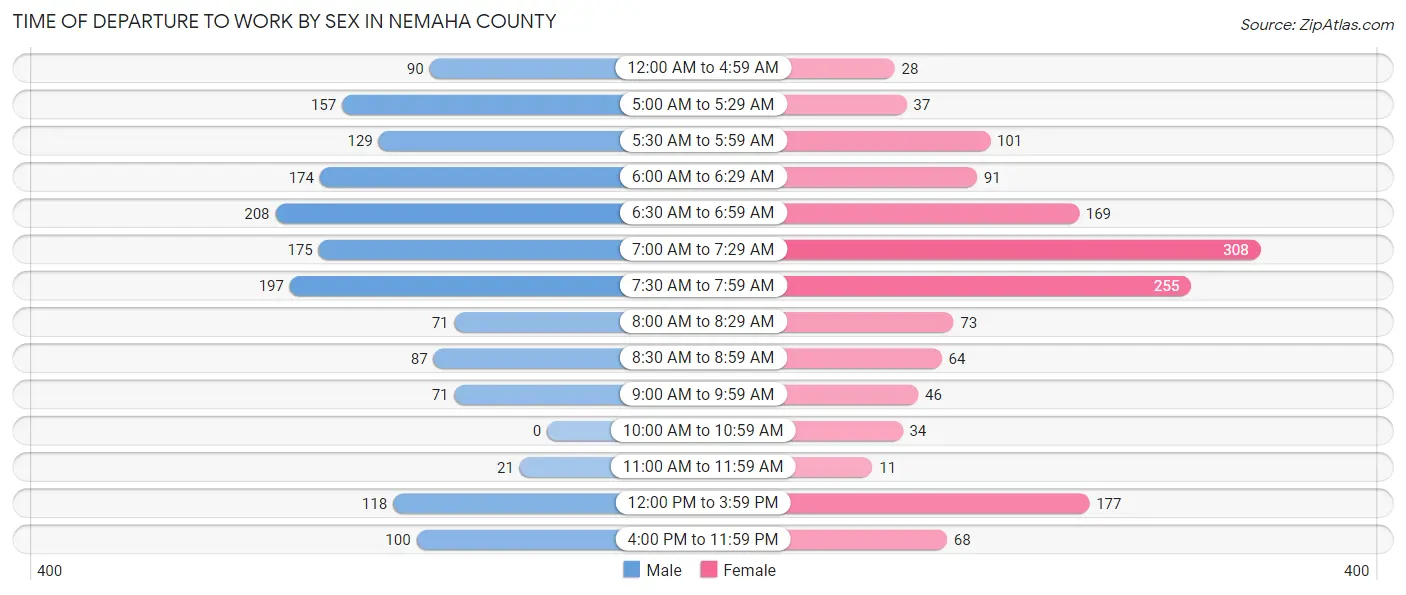
| Time of Departure | Male | Female |
| 12:00 AM to 4:59 AM | 90 (5.6%) | 28 (1.9%) |
| 5:00 AM to 5:29 AM | 157 (9.8%) | 37 (2.5%) |
| 5:30 AM to 5:59 AM | 129 (8.1%) | 101 (6.9%) |
| 6:00 AM to 6:29 AM | 174 (10.9%) | 91 (6.2%) |
| 6:30 AM to 6:59 AM | 208 (13.0%) | 169 (11.6%) |
| 7:00 AM to 7:29 AM | 175 (11.0%) | 308 (21.1%) |
| 7:30 AM to 7:59 AM | 197 (12.3%) | 255 (17.4%) |
| 8:00 AM to 8:29 AM | 71 (4.4%) | 73 (5.0%) |
| 8:30 AM to 8:59 AM | 87 (5.4%) | 64 (4.4%) |
| 9:00 AM to 9:59 AM | 71 (4.4%) | 46 (3.2%) |
| 10:00 AM to 10:59 AM | 0 (0.0%) | 34 (2.3%) |
| 11:00 AM to 11:59 AM | 21 (1.3%) | 11 (0.7%) |
| 12:00 PM to 3:59 PM | 118 (7.4%) | 177 (12.1%) |
| 4:00 PM to 11:59 PM | 100 (6.3%) | 68 (4.6%) |
| Total | 1,598 (100.0%) | 1,462 (100.0%) |
Housing Occupancy in Nemaha County
Occupancy by Ownership in Nemaha County
Of the total 2,851 dwellings in Nemaha County, owner-occupied units account for 1,987 (69.7%), while renter-occupied units make up 864 (30.3%).
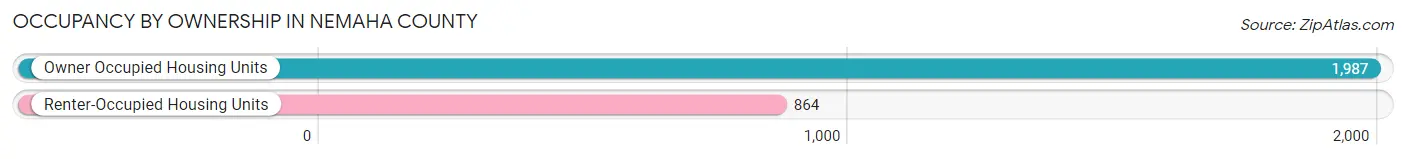
| Occupancy | # Housing Units | % Housing Units |
| Owner Occupied Housing Units | 1,987 | 69.7% |
| Renter-Occupied Housing Units | 864 | 30.3% |
| Total Occupied Housing Units | 2,851 | 100.0% |
Occupancy by Household Size in Nemaha County
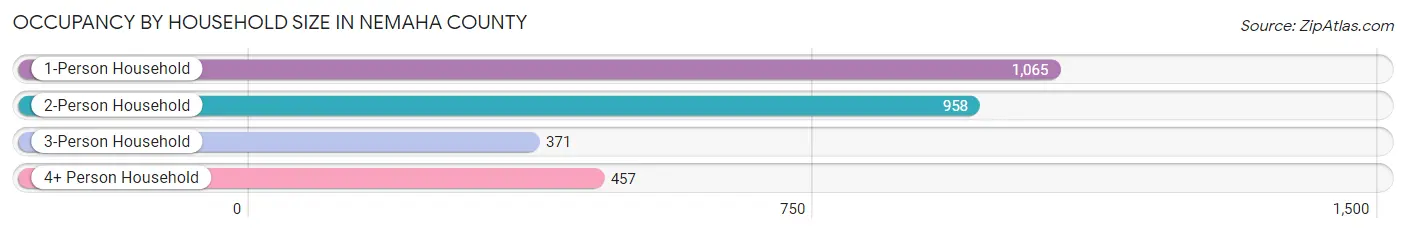
| Household Size | # Housing Units | % Housing Units |
| 1-Person Household | 1,065 | 37.4% |
| 2-Person Household | 958 | 33.6% |
| 3-Person Household | 371 | 13.0% |
| 4+ Person Household | 457 | 16.0% |
| Total Housing Units | 2,851 | 100.0% |
Occupancy by Ownership by Household Size in Nemaha County
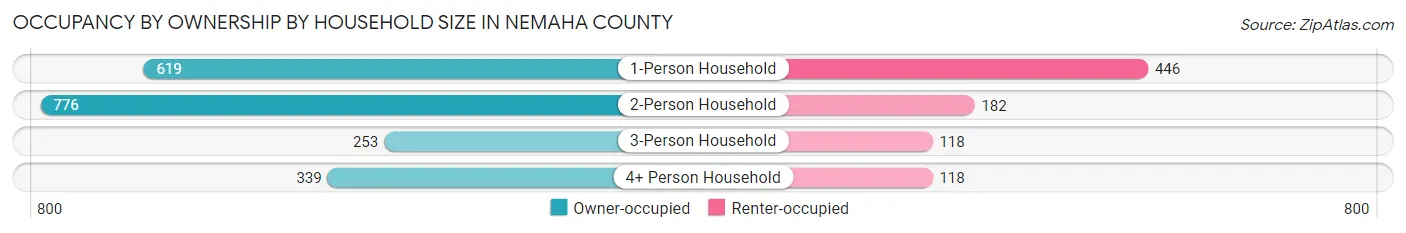
| Household Size | Owner-occupied | Renter-occupied |
| 1-Person Household | 619 (58.1%) | 446 (41.9%) |
| 2-Person Household | 776 (81.0%) | 182 (19.0%) |
| 3-Person Household | 253 (68.2%) | 118 (31.8%) |
| 4+ Person Household | 339 (74.2%) | 118 (25.8%) |
| Total Housing Units | 1,987 (69.7%) | 864 (30.3%) |
Occupancy by Educational Attainment in Nemaha County
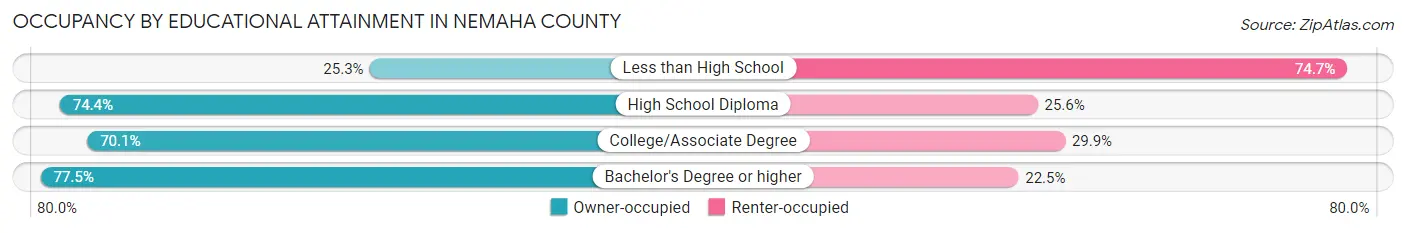
| Household Size | Owner-occupied | Renter-occupied |
| Less than High School | 61 (25.3%) | 180 (74.7%) |
| High School Diploma | 599 (74.4%) | 206 (25.6%) |
| College/Associate Degree | 674 (70.1%) | 288 (29.9%) |
| Bachelor's Degree or higher | 653 (77.5%) | 190 (22.5%) |
Occupancy by Age of Householder in Nemaha County
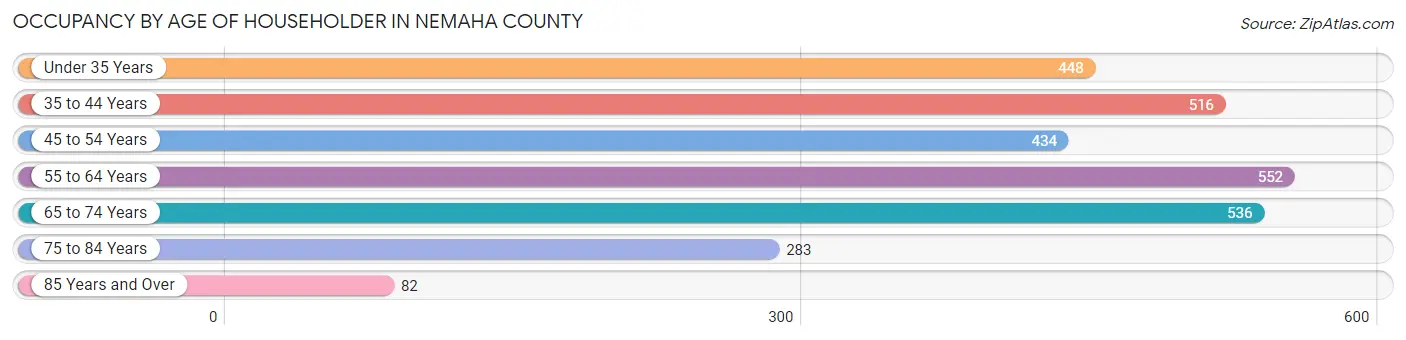
| Age Bracket | # Households | % Households |
| Under 35 Years | 448 | 15.7% |
| 35 to 44 Years | 516 | 18.1% |
| 45 to 54 Years | 434 | 15.2% |
| 55 to 64 Years | 552 | 19.4% |
| 65 to 74 Years | 536 | 18.8% |
| 75 to 84 Years | 283 | 9.9% |
| 85 Years and Over | 82 | 2.9% |
| Total | 2,851 | 100.0% |
Housing Finances in Nemaha County
Median Income by Occupancy in Nemaha County
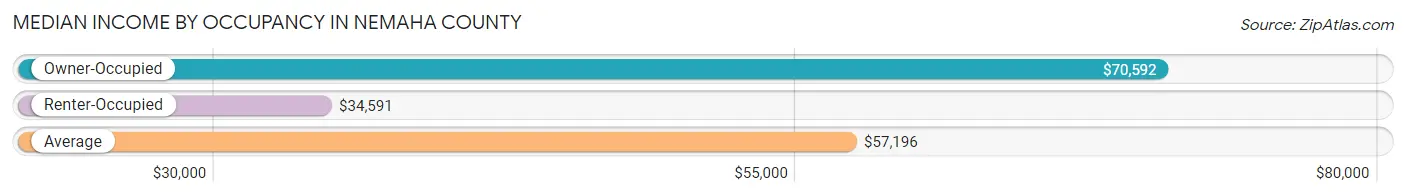
| Occupancy Type | # Households | Median Income |
| Owner-Occupied | 1,987 (69.7%) | $70,592 |
| Renter-Occupied | 864 (30.3%) | $34,591 |
| Average | 2,851 (100.0%) | $57,196 |
Occupancy by Householder Income Bracket in Nemaha County
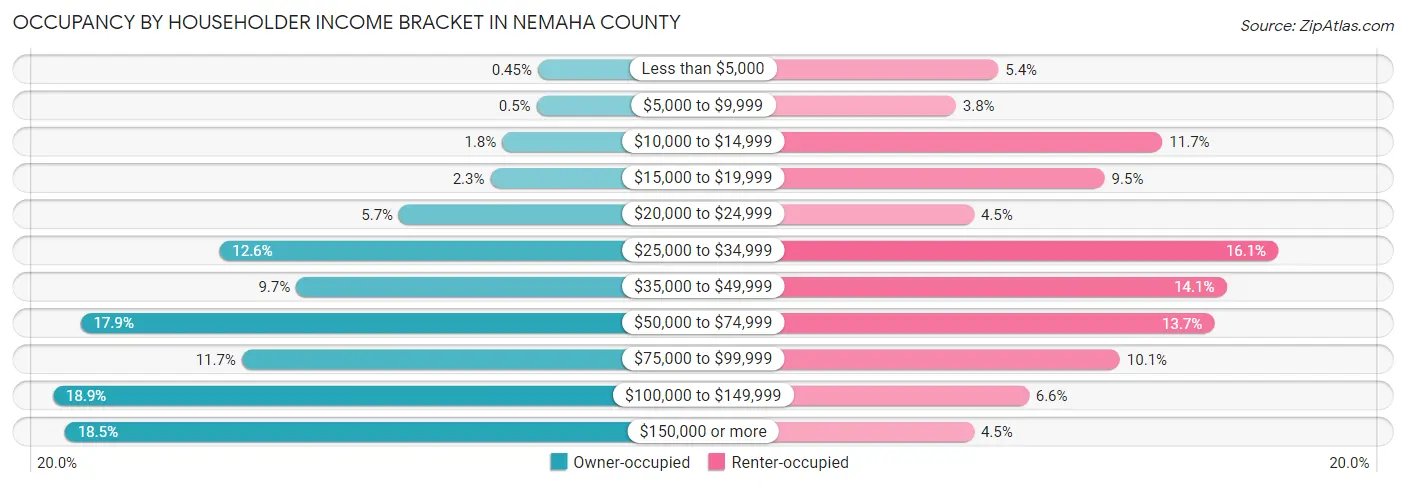
| Income Bracket | Owner-occupied | Renter-occupied |
| Less than $5,000 | 9 (0.4%) | 47 (5.4%) |
| $5,000 to $9,999 | 10 (0.5%) | 33 (3.8%) |
| $10,000 to $14,999 | 36 (1.8%) | 101 (11.7%) |
| $15,000 to $19,999 | 45 (2.3%) | 82 (9.5%) |
| $20,000 to $24,999 | 114 (5.7%) | 39 (4.5%) |
| $25,000 to $34,999 | 250 (12.6%) | 139 (16.1%) |
| $35,000 to $49,999 | 192 (9.7%) | 122 (14.1%) |
| $50,000 to $74,999 | 355 (17.9%) | 118 (13.7%) |
| $75,000 to $99,999 | 233 (11.7%) | 87 (10.1%) |
| $100,000 to $149,999 | 376 (18.9%) | 57 (6.6%) |
| $150,000 or more | 367 (18.5%) | 39 (4.5%) |
| Total | 1,987 (100.0%) | 864 (100.0%) |
Monthly Housing Cost Tiers in Nemaha County
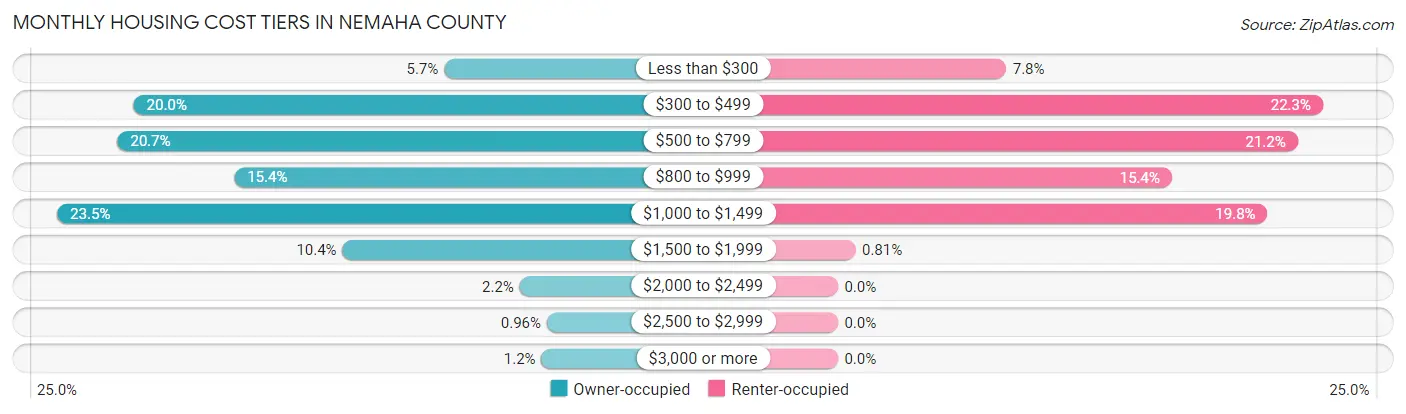
| Monthly Cost | Owner-occupied | Renter-occupied |
| Less than $300 | 113 (5.7%) | 67 (7.7%) |
| $300 to $499 | 397 (20.0%) | 193 (22.3%) |
| $500 to $799 | 412 (20.7%) | 183 (21.2%) |
| $800 to $999 | 305 (15.3%) | 133 (15.4%) |
| $1,000 to $1,499 | 467 (23.5%) | 171 (19.8%) |
| $1,500 to $1,999 | 206 (10.4%) | 7 (0.8%) |
| $2,000 to $2,499 | 44 (2.2%) | 0 (0.0%) |
| $2,500 to $2,999 | 19 (1.0%) | 0 (0.0%) |
| $3,000 or more | 24 (1.2%) | 0 (0.0%) |
| Total | 1,987 (100.0%) | 864 (100.0%) |
Physical Housing Characteristics in Nemaha County
Housing Structures in Nemaha County
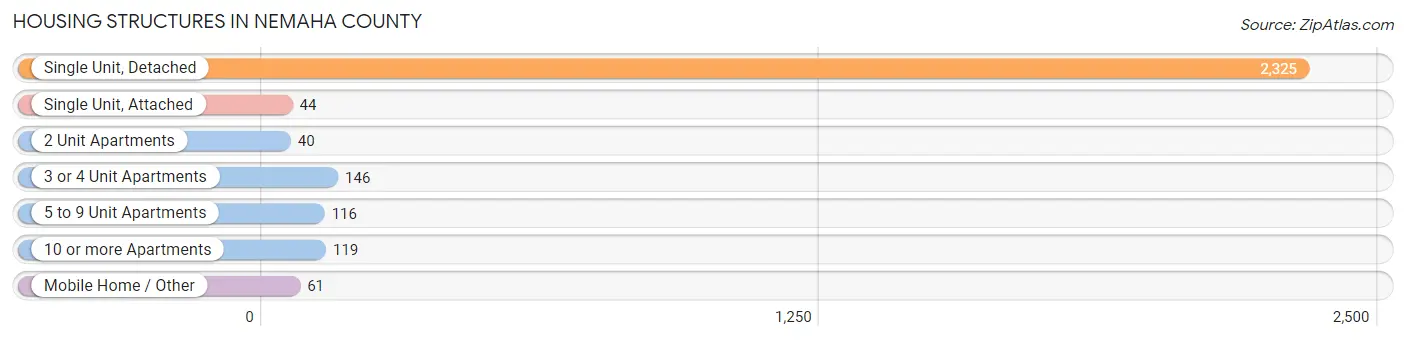
| Structure Type | # Housing Units | % Housing Units |
| Single Unit, Detached | 2,325 | 81.6% |
| Single Unit, Attached | 44 | 1.5% |
| 2 Unit Apartments | 40 | 1.4% |
| 3 or 4 Unit Apartments | 146 | 5.1% |
| 5 to 9 Unit Apartments | 116 | 4.1% |
| 10 or more Apartments | 119 | 4.2% |
| Mobile Home / Other | 61 | 2.1% |
| Total | 2,851 | 100.0% |
Housing Structures by Occupancy in Nemaha County
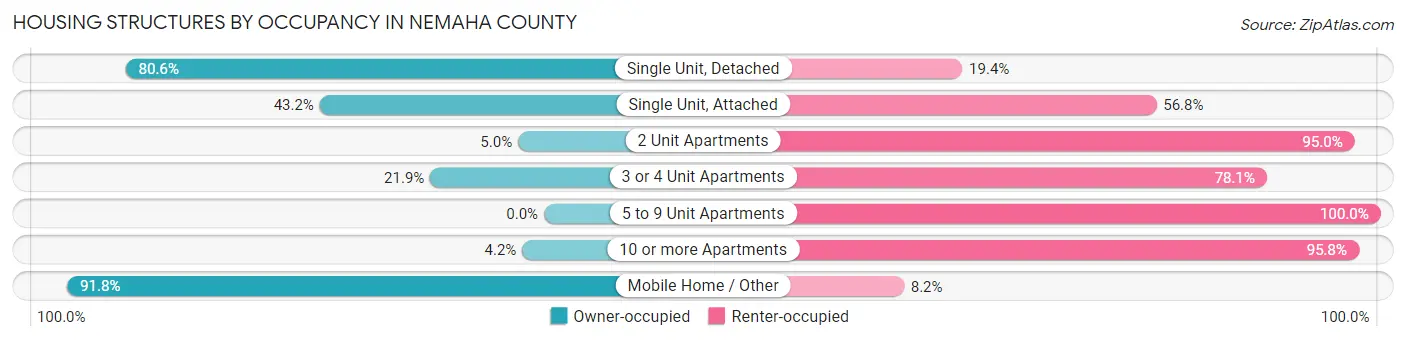
| Structure Type | Owner-occupied | Renter-occupied |
| Single Unit, Detached | 1,873 (80.6%) | 452 (19.4%) |
| Single Unit, Attached | 19 (43.2%) | 25 (56.8%) |
| 2 Unit Apartments | 2 (5.0%) | 38 (95.0%) |
| 3 or 4 Unit Apartments | 32 (21.9%) | 114 (78.1%) |
| 5 to 9 Unit Apartments | 0 (0.0%) | 116 (100.0%) |
| 10 or more Apartments | 5 (4.2%) | 114 (95.8%) |
| Mobile Home / Other | 56 (91.8%) | 5 (8.2%) |
| Total | 1,987 (69.7%) | 864 (30.3%) |
Housing Structures by Number of Rooms in Nemaha County
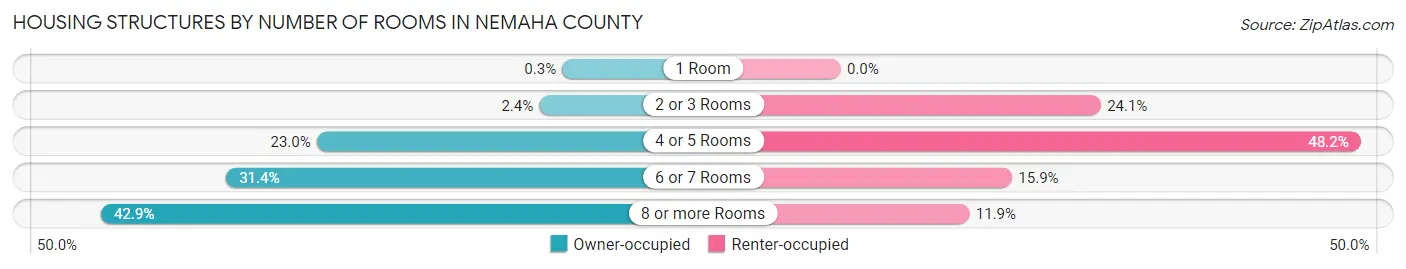
| Number of Rooms | Owner-occupied | Renter-occupied |
| 1 Room | 6 (0.3%) | 0 (0.0%) |
| 2 or 3 Rooms | 48 (2.4%) | 208 (24.1%) |
| 4 or 5 Rooms | 457 (23.0%) | 416 (48.1%) |
| 6 or 7 Rooms | 623 (31.4%) | 137 (15.9%) |
| 8 or more Rooms | 853 (42.9%) | 103 (11.9%) |
| Total | 1,987 (100.0%) | 864 (100.0%) |
Housing Structure by Heating Type in Nemaha County
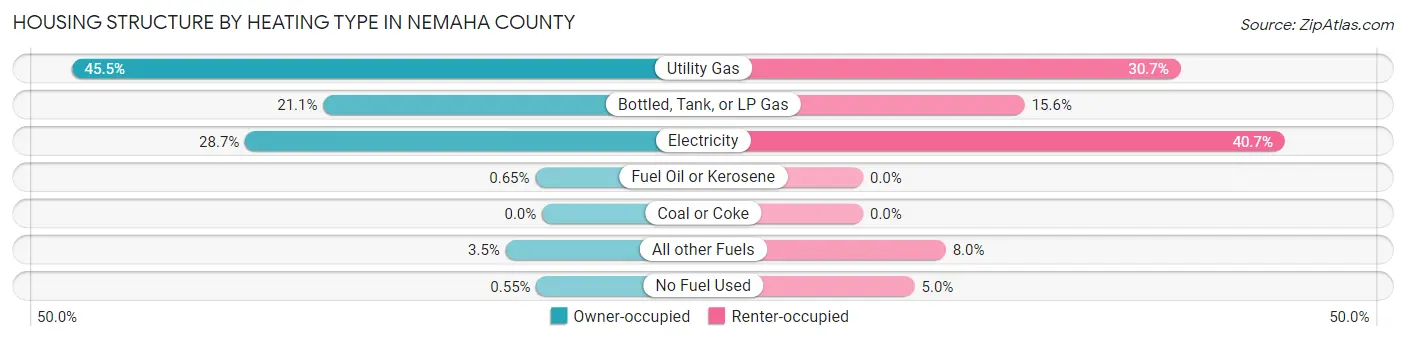
| Heating Type | Owner-occupied | Renter-occupied |
| Utility Gas | 903 (45.5%) | 265 (30.7%) |
| Bottled, Tank, or LP Gas | 420 (21.1%) | 135 (15.6%) |
| Electricity | 570 (28.7%) | 352 (40.7%) |
| Fuel Oil or Kerosene | 13 (0.6%) | 0 (0.0%) |
| Coal or Coke | 0 (0.0%) | 0 (0.0%) |
| All other Fuels | 70 (3.5%) | 69 (8.0%) |
| No Fuel Used | 11 (0.5%) | 43 (5.0%) |
| Total | 1,987 (100.0%) | 864 (100.0%) |
Household Vehicle Usage in Nemaha County
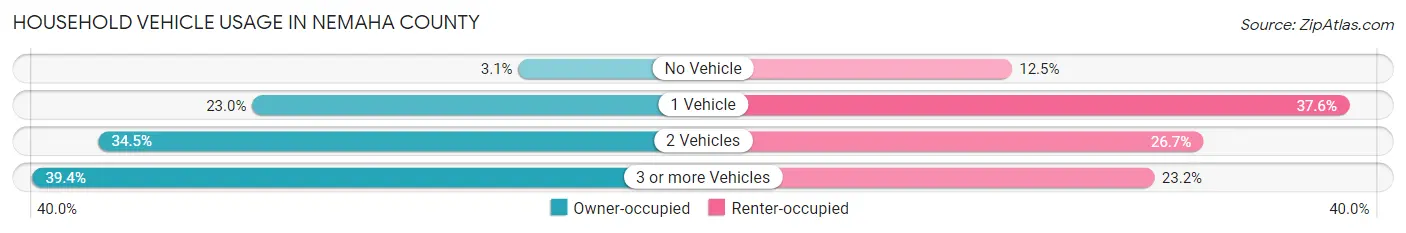
| Vehicles per Household | Owner-occupied | Renter-occupied |
| No Vehicle | 62 (3.1%) | 108 (12.5%) |
| 1 Vehicle | 457 (23.0%) | 325 (37.6%) |
| 2 Vehicles | 685 (34.5%) | 231 (26.7%) |
| 3 or more Vehicles | 783 (39.4%) | 200 (23.2%) |
| Total | 1,987 (100.0%) | 864 (100.0%) |
Real Estate & Mortgages in Nemaha County
Real Estate and Mortgage Overview in Nemaha County
| Characteristic | Without Mortgage | With Mortgage |
| Housing Units | 993 | 994 |
| Median Property Value | $115,900 | $119,200 |
| Median Household Income | $56,348 | $221 |
| Monthly Housing Costs | $507 | $23 |
| Real Estate Taxes | $1,619 | $12 |
Property Value by Mortgage Status in Nemaha County
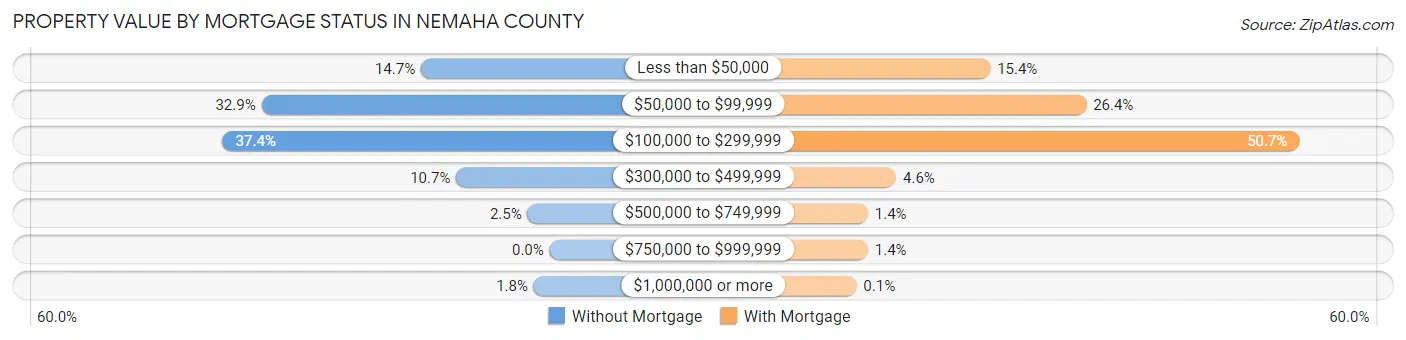
| Property Value | Without Mortgage | With Mortgage |
| Less than $50,000 | 146 (14.7%) | 153 (15.4%) |
| $50,000 to $99,999 | 327 (32.9%) | 262 (26.4%) |
| $100,000 to $299,999 | 371 (37.4%) | 504 (50.7%) |
| $300,000 to $499,999 | 106 (10.7%) | 46 (4.6%) |
| $500,000 to $749,999 | 25 (2.5%) | 14 (1.4%) |
| $750,000 to $999,999 | 0 (0.0%) | 14 (1.4%) |
| $1,000,000 or more | 18 (1.8%) | 1 (0.1%) |
| Total | 993 (100.0%) | 994 (100.0%) |
Household Income by Mortgage Status in Nemaha County
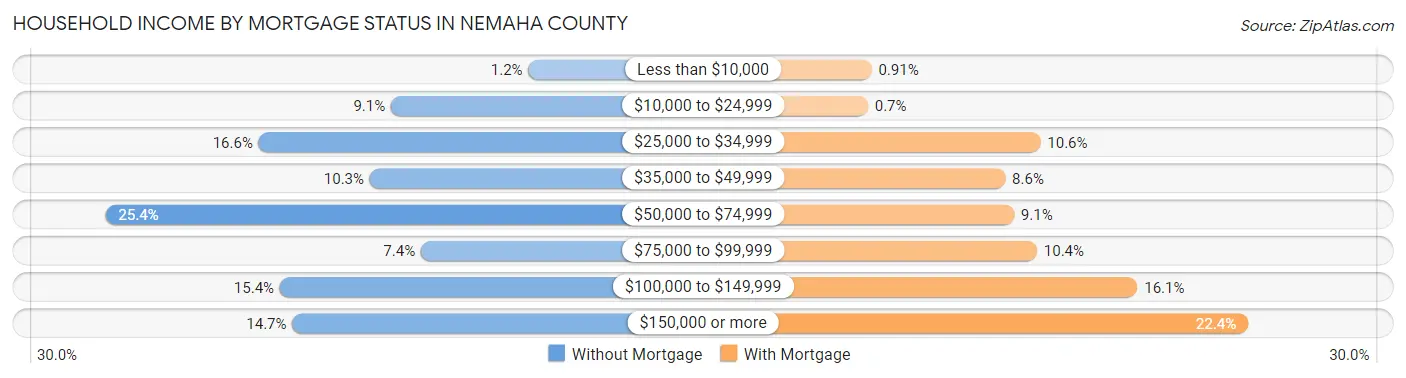
| Household Income | Without Mortgage | With Mortgage |
| Less than $10,000 | 12 (1.2%) | 9 (0.9%) |
| $10,000 to $24,999 | 90 (9.1%) | 7 (0.7%) |
| $25,000 to $34,999 | 165 (16.6%) | 105 (10.6%) |
| $35,000 to $49,999 | 102 (10.3%) | 85 (8.6%) |
| $50,000 to $74,999 | 252 (25.4%) | 90 (9.0%) |
| $75,000 to $99,999 | 73 (7.3%) | 103 (10.4%) |
| $100,000 to $149,999 | 153 (15.4%) | 160 (16.1%) |
| $150,000 or more | 146 (14.7%) | 223 (22.4%) |
| Total | 993 (100.0%) | 994 (100.0%) |
Property Value to Household Income Ratio in Nemaha County
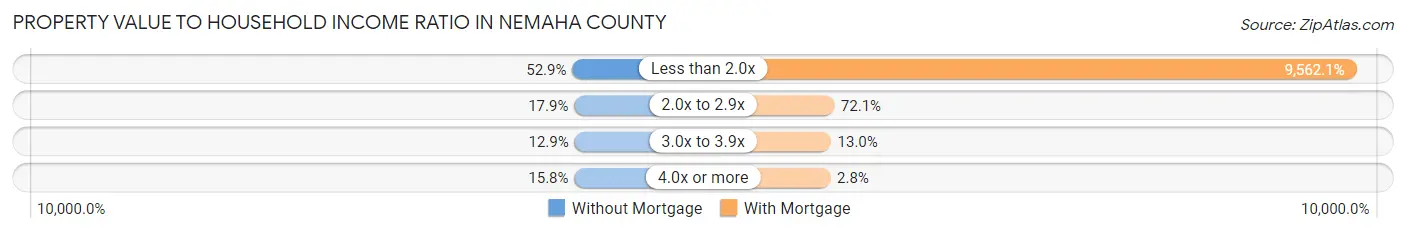
| Value-to-Income Ratio | Without Mortgage | With Mortgage |
| Less than 2.0x | 525 (52.9%) | 95,047 (9,562.1%) |
| 2.0x to 2.9x | 178 (17.9%) | 717 (72.1%) |
| 3.0x to 3.9x | 128 (12.9%) | 129 (13.0%) |
| 4.0x or more | 157 (15.8%) | 28 (2.8%) |
| Total | 993 (100.0%) | 994 (100.0%) |
Real Estate Taxes by Mortgage Status in Nemaha County
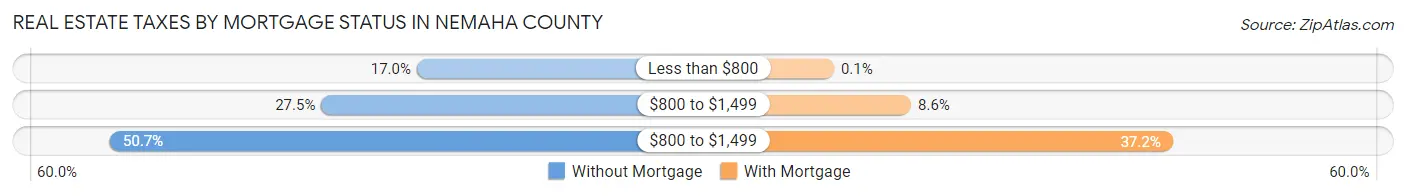
| Property Taxes | Without Mortgage | With Mortgage |
| Less than $800 | 169 (17.0%) | 1 (0.1%) |
| $800 to $1,499 | 273 (27.5%) | 85 (8.6%) |
| $800 to $1,499 | 503 (50.6%) | 370 (37.2%) |
| Total | 993 (100.0%) | 994 (100.0%) |
Health & Disability in Nemaha County
Health Insurance Coverage by Age in Nemaha County
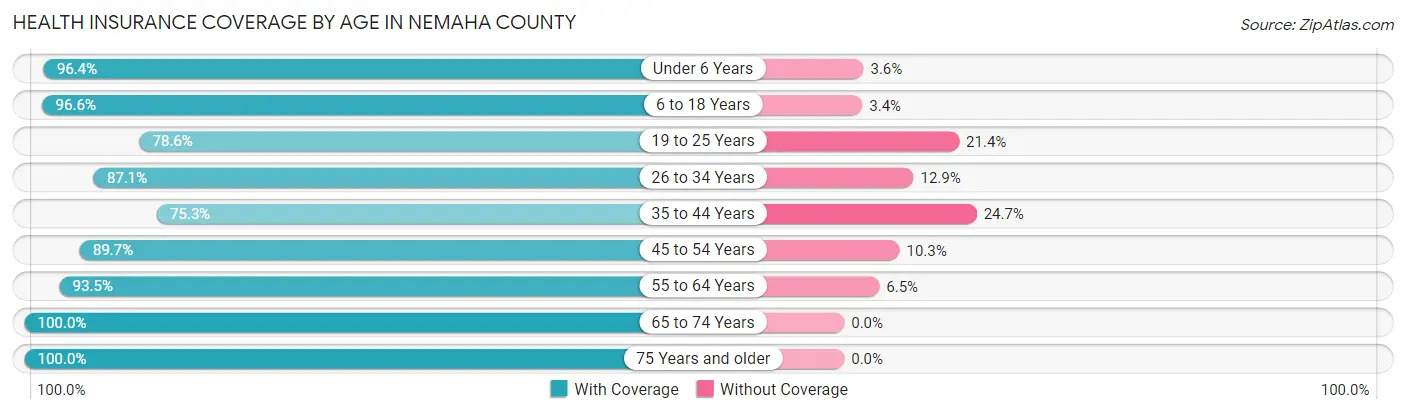
| Age Bracket | With Coverage | Without Coverage |
| Under 6 Years | 430 (96.4%) | 16 (3.6%) |
| 6 to 18 Years | 1,346 (96.6%) | 47 (3.4%) |
| 19 to 25 Years | 499 (78.6%) | 136 (21.4%) |
| 26 to 34 Years | 600 (87.1%) | 89 (12.9%) |
| 35 to 44 Years | 604 (75.3%) | 198 (24.7%) |
| 45 to 54 Years | 618 (89.7%) | 71 (10.3%) |
| 55 to 64 Years | 843 (93.5%) | 59 (6.5%) |
| 65 to 74 Years | 815 (100.0%) | 0 (0.0%) |
| 75 Years and older | 557 (100.0%) | 0 (0.0%) |
| Total | 6,312 (91.1%) | 616 (8.9%) |
Health Insurance Coverage by Citizenship Status in Nemaha County
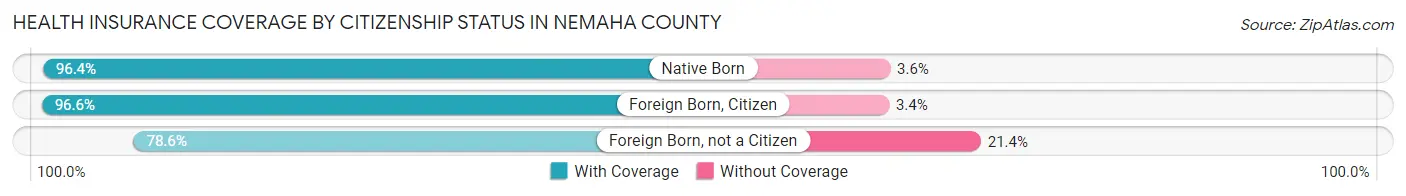
| Citizenship Status | With Coverage | Without Coverage |
| Native Born | 430 (96.4%) | 16 (3.6%) |
| Foreign Born, Citizen | 1,346 (96.6%) | 47 (3.4%) |
| Foreign Born, not a Citizen | 499 (78.6%) | 136 (21.4%) |
Health Insurance Coverage by Household Income in Nemaha County
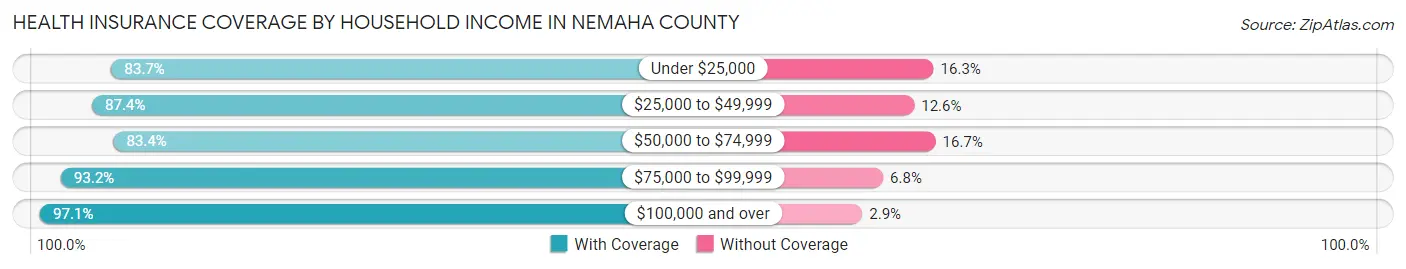
| Household Income | With Coverage | Without Coverage |
| Under $25,000 | 664 (83.7%) | 129 (16.3%) |
| $25,000 to $49,999 | 1,258 (87.4%) | 182 (12.6%) |
| $50,000 to $74,999 | 816 (83.4%) | 163 (16.7%) |
| $75,000 to $99,999 | 807 (93.2%) | 59 (6.8%) |
| $100,000 and over | 2,368 (97.1%) | 71 (2.9%) |
Public vs Private Health Insurance Coverage by Age in Nemaha County
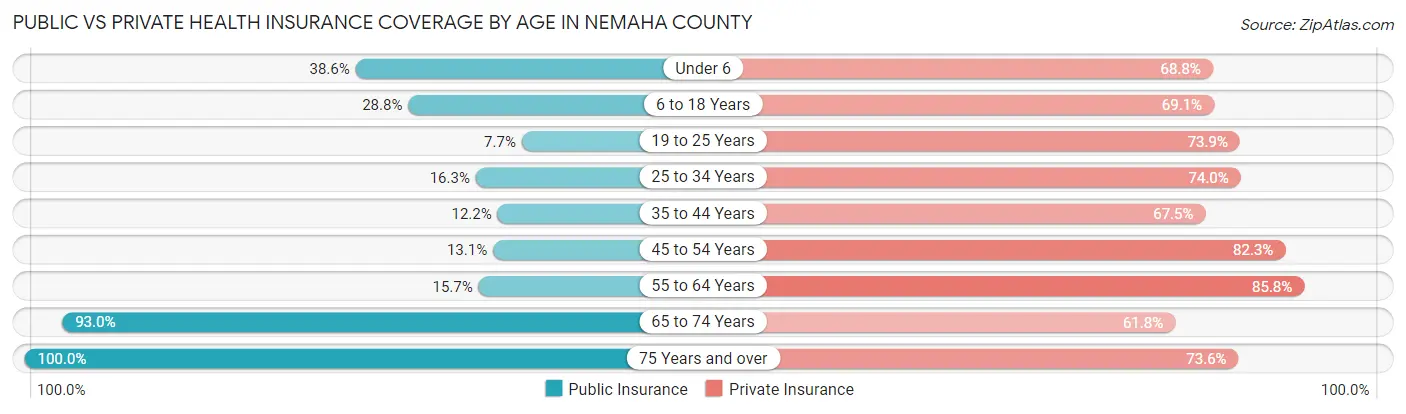
| Age Bracket | Public Insurance | Private Insurance |
| Under 6 | 172 (38.6%) | 307 (68.8%) |
| 6 to 18 Years | 401 (28.8%) | 962 (69.1%) |
| 19 to 25 Years | 49 (7.7%) | 469 (73.9%) |
| 25 to 34 Years | 112 (16.3%) | 510 (74.0%) |
| 35 to 44 Years | 98 (12.2%) | 541 (67.5%) |
| 45 to 54 Years | 90 (13.1%) | 567 (82.3%) |
| 55 to 64 Years | 142 (15.7%) | 774 (85.8%) |
| 65 to 74 Years | 758 (93.0%) | 504 (61.8%) |
| 75 Years and over | 557 (100.0%) | 410 (73.6%) |
| Total | 2,379 (34.3%) | 5,044 (72.8%) |
Disability Status by Sex by Age in Nemaha County
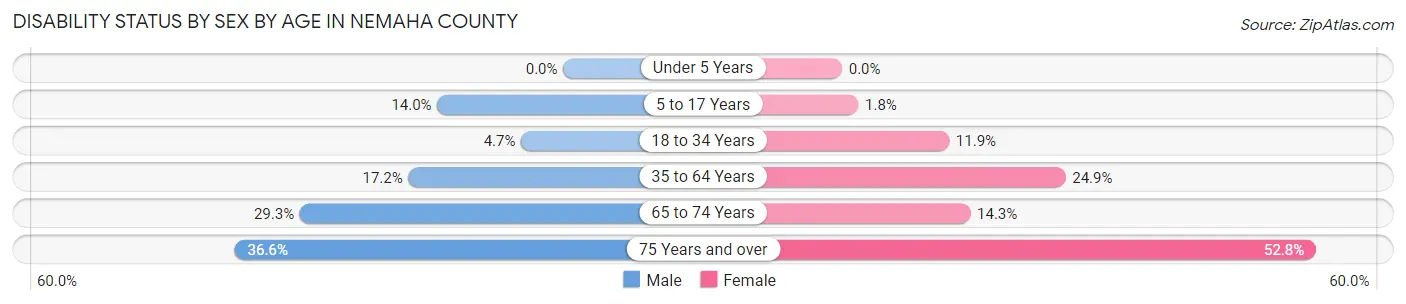
| Age Bracket | Male | Female |
| Under 5 Years | 0 (0.0%) | 0 (0.0%) |
| 5 to 17 Years | 82 (14.0%) | 10 (1.8%) |
| 18 to 34 Years | 40 (4.7%) | 92 (11.9%) |
| 35 to 64 Years | 209 (17.2%) | 294 (24.9%) |
| 65 to 74 Years | 122 (29.3%) | 57 (14.3%) |
| 75 Years and over | 93 (36.6%) | 160 (52.8%) |
Disability Class by Sex by Age in Nemaha County
Disability Class: Hearing Difficulty
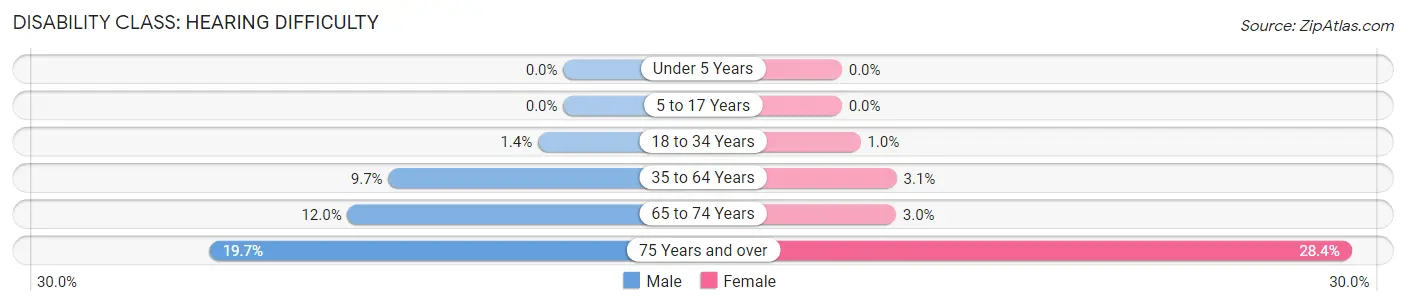
| Age Bracket | Male | Female |
| Under 5 Years | 0 (0.0%) | 0 (0.0%) |
| 5 to 17 Years | 0 (0.0%) | 0 (0.0%) |
| 18 to 34 Years | 12 (1.4%) | 8 (1.0%) |
| 35 to 64 Years | 118 (9.7%) | 36 (3.0%) |
| 65 to 74 Years | 50 (12.0%) | 12 (3.0%) |
| 75 Years and over | 50 (19.7%) | 86 (28.4%) |
Disability Class: Vision Difficulty
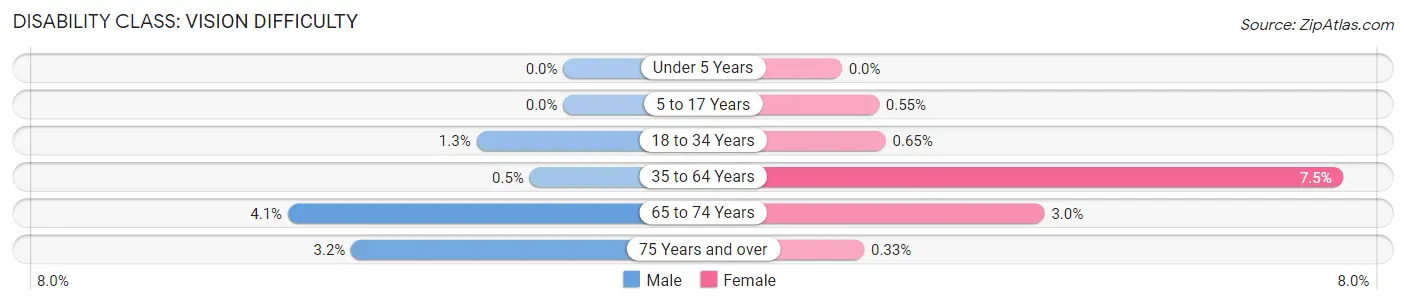
| Age Bracket | Male | Female |
| Under 5 Years | 0 (0.0%) | 0 (0.0%) |
| 5 to 17 Years | 0 (0.0%) | 3 (0.5%) |
| 18 to 34 Years | 11 (1.3%) | 5 (0.6%) |
| 35 to 64 Years | 6 (0.5%) | 88 (7.4%) |
| 65 to 74 Years | 17 (4.1%) | 12 (3.0%) |
| 75 Years and over | 8 (3.2%) | 1 (0.3%) |
Disability Class: Cognitive Difficulty
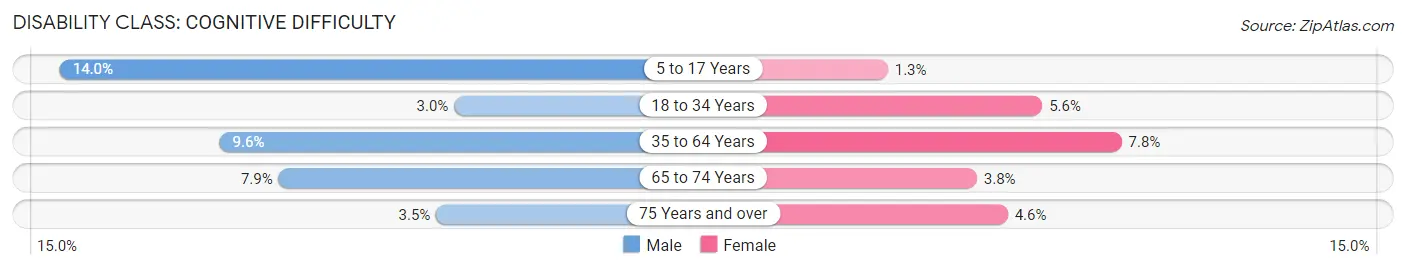
| Age Bracket | Male | Female |
| 5 to 17 Years | 82 (14.0%) | 7 (1.3%) |
| 18 to 34 Years | 26 (3.0%) | 43 (5.6%) |
| 35 to 64 Years | 116 (9.6%) | 92 (7.8%) |
| 65 to 74 Years | 33 (7.9%) | 15 (3.8%) |
| 75 Years and over | 9 (3.5%) | 14 (4.6%) |
Disability Class: Ambulatory Difficulty
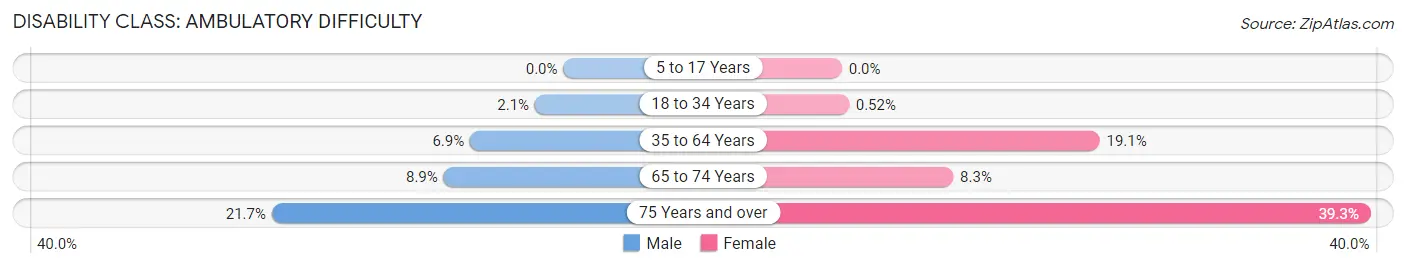
| Age Bracket | Male | Female |
| 5 to 17 Years | 0 (0.0%) | 0 (0.0%) |
| 18 to 34 Years | 18 (2.1%) | 4 (0.5%) |
| 35 to 64 Years | 84 (6.9%) | 226 (19.1%) |
| 65 to 74 Years | 37 (8.9%) | 33 (8.3%) |
| 75 Years and over | 55 (21.6%) | 119 (39.3%) |
Disability Class: Self-Care Difficulty
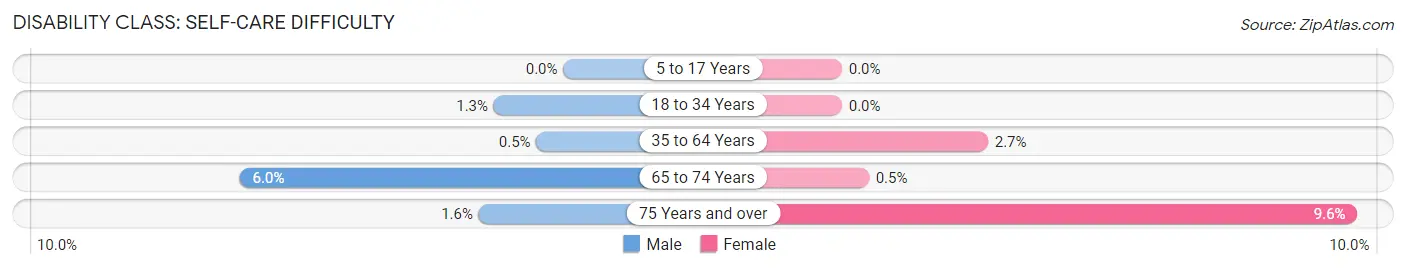
| Age Bracket | Male | Female |
| 5 to 17 Years | 0 (0.0%) | 0 (0.0%) |
| 18 to 34 Years | 11 (1.3%) | 0 (0.0%) |
| 35 to 64 Years | 6 (0.5%) | 32 (2.7%) |
| 65 to 74 Years | 25 (6.0%) | 2 (0.5%) |
| 75 Years and over | 4 (1.6%) | 29 (9.6%) |
Technology Access in Nemaha County
Computing Device Access in Nemaha County
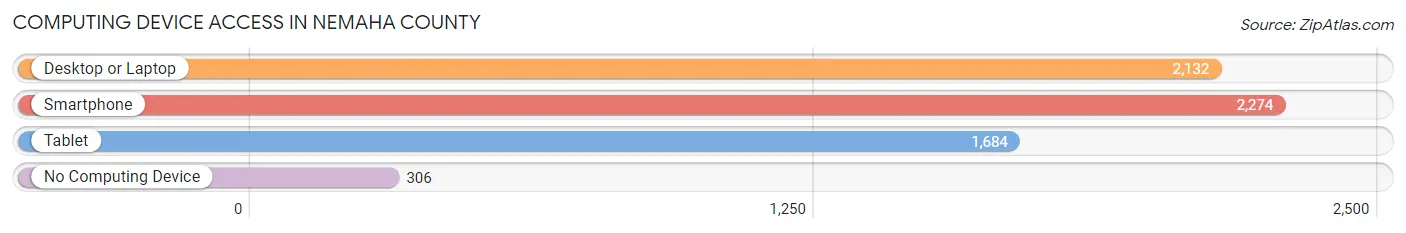
| Device Type | # Households | % Households |
| Desktop or Laptop | 2,132 | 74.8% |
| Smartphone | 2,274 | 79.8% |
| Tablet | 1,684 | 59.1% |
| No Computing Device | 306 | 10.7% |
| Total | 2,851 | 100.0% |
Internet Access in Nemaha County
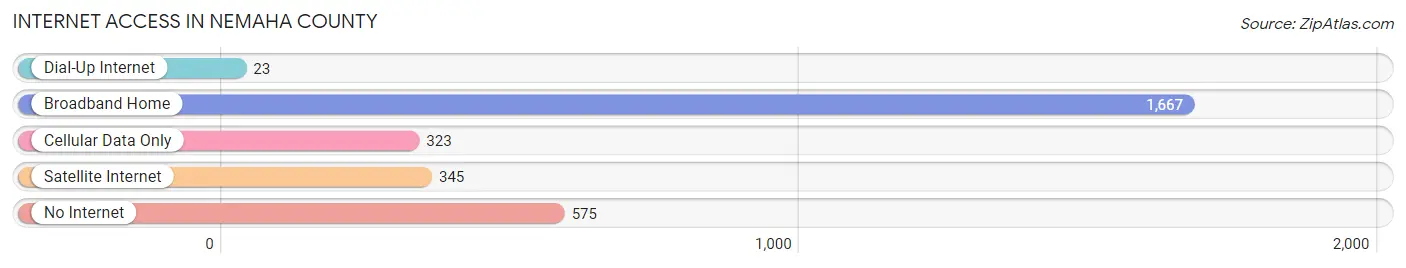
| Internet Type | # Households | % Households |
| Dial-Up Internet | 23 | 0.8% |
| Broadband Home | 1,667 | 58.5% |
| Cellular Data Only | 323 | 11.3% |
| Satellite Internet | 345 | 12.1% |
| No Internet | 575 | 20.2% |
| Total | 2,851 | 100.0% |
Nemaha County Summary
Nemaha County is located in the southeastern corner of Nebraska, and is bordered by Otoe, Johnson, Pawnee, Richardson, and Gage counties. The county seat is Auburn, and the county was named after the Nemaha River, which runs through the county. The county has a total area of 576 square miles, and a population of 7,541 as of the 2010 census.
History
Nemaha County was established in 1855, and was originally part of Richardson County. The county was named after the Nemaha River, which runs through the county. The first settlers in the area were of German and Irish descent, and the first county seat was located in Brownville. In 1856, the county seat was moved to Auburn, and the county has remained there ever since.
The county was home to several Native American tribes, including the Omaha, Pawnee, and Otoe. The first white settlers in the area were fur traders, and the first permanent settlers arrived in the 1840s. The county was largely agricultural, and the main crops were corn, wheat, and oats.
Geography
Nemaha County is located in the southeastern corner of Nebraska, and is bordered by Otoe, Johnson, Pawnee, Richardson, and Gage counties. The county has a total area of 576 square miles, and is mostly flat, with some rolling hills. The county is drained by the Nemaha River, which runs through the county. The county is home to several small lakes, including Lake Ogallala, Lake McConaughy, and Lake McConaughy State Recreation Area.
Economy
Nemaha County has a largely agricultural economy, with the main crops being corn, wheat, and oats. The county is also home to several small businesses, including manufacturing, retail, and service industries. The county is also home to several wind farms, which provide renewable energy to the area.
Demographics
As of the 2010 census, there were 7,541 people, 2,945 households, and 2,072 families living in Nemaha County. The population density was 13 people per square mile. The racial makeup of the county was 97.3% White, 0.3% African American, 0.2% Native American, 0.2% Asian, 0.1% Pacific Islander, 0.7% from other races, and 1.2% from two or more races. Hispanic or Latino of any race were 2.2% of the population.
The median income for a household in the county was $45,945, and the median income for a family was $54,813. The per capita income for the county was $21,945. About 8.2% of families and 10.3% of the population were below the poverty line, including 13.2% of those under age 18 and 8.2% of those age 65 or over.
Common Questions
What is Per Capita Income in Nemaha County?
Per Capita income in Nemaha County is $36,367.
What is the Median Family Income in Nemaha County?
Median Family Income in Nemaha County is $92,644.
What is the Median Household income in Nemaha County?
Median Household Income in Nemaha County is $57,196.
What is Income or Wage Gap in Nemaha County?
Income or Wage Gap in Nemaha County is 36.4%.
Women in Nemaha County earn 63.6 cents for every dollar earned by a man.
What is Inequality or Gini Index in Nemaha County?
Inequality or Gini Index in Nemaha County is 0.47.
What is the Total Population of Nemaha County?
Total Population of Nemaha County is 7,019.
What is the Total Male Population of Nemaha County?
Total Male Population of Nemaha County is 3,595.
What is the Total Female Population of Nemaha County?
Total Female Population of Nemaha County is 3,424.
What is the Ratio of Males per 100 Females in Nemaha County?
There are 104.99 Males per 100 Females in Nemaha County.
What is the Ratio of Females per 100 Males in Nemaha County?
There are 95.24 Females per 100 Males in Nemaha County.
What is the Median Population Age in Nemaha County?
Median Population Age in Nemaha County is 38.6 Years.
What is the Average Family Size in Nemaha County
Average Family Size in Nemaha County is 3.0 People.
What is the Average Household Size in Nemaha County
Average Household Size in Nemaha County is 2.3 People.
How Large is the Labor Force in Nemaha County?
There are 3,487 People in the Labor Forcein in Nemaha County.
What is the Percentage of People in the Labor Force in Nemaha County?
60.9% of People are in the Labor Force in Nemaha County.
What is the Unemployment Rate in Nemaha County?
Unemployment Rate in Nemaha County is 6.4%.