Nance County, NE Map & Demographics
Nance County Overview
$32,568
PER CAPITA INCOME
$80,787
AVG FAMILY INCOME
$60,054
AVG HOUSEHOLD INCOME
24.1%
WAGE / INCOME GAP [ % ]
75.9¢/ $1
WAGE / INCOME GAP [ $ ]
0.45
INEQUALITY / GINI INDEX
3,366
TOTAL POPULATION
1,697
MALE POPULATION
1,669
FEMALE POPULATION
101.68
MALES / 100 FEMALES
98.35
FEMALES / 100 MALES
44.0
MEDIAN AGE
3.1
AVG FAMILY SIZE
2.5
AVG HOUSEHOLD SIZE
1,737
LABOR FORCE [ PEOPLE ]
64.9%
PERCENT IN LABOR FORCE
4.4%
UNEMPLOYMENT RATE
Income in Nance County
Income Overview in Nance County
Per Capita Income in Nance County is $32,568, while median incomes of families and households are $80,787 and $60,054 respectively.
| Characteristic | Number | Measure |
| Per Capita Income | 3,366 | $32,568 |
| Median Family Income | 835 | $80,787 |
| Mean Family Income | 835 | $104,001 |
| Median Household Income | 1,307 | $60,054 |
| Mean Household Income | 1,307 | $82,284 |
| Income Deficit | 835 | $0 |
| Wage / Income Gap (%) | 3,366 | 24.12% |
| Wage / Income Gap ($) | 3,366 | 75.88¢ per $1 |
| Gini / Inequality Index | 3,366 | 0.45 |
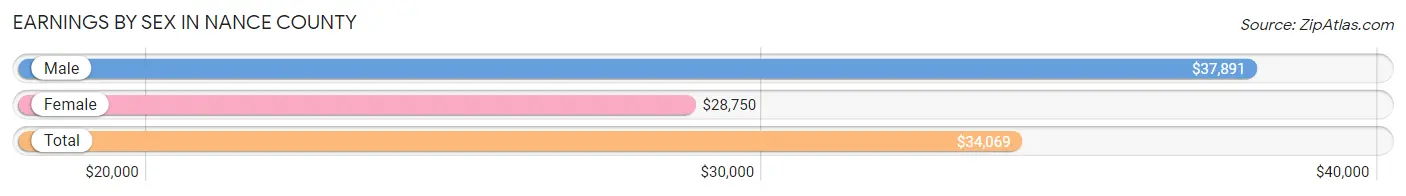
Earnings by Sex in Nance County
Average Earnings in Nance County are $34,069, $37,891 for men and $28,750 for women, a difference of 24.1%.
| Sex | Number | Average Earnings |
| Male | 995 (53.9%) | $37,891 |
| Female | 851 (46.1%) | $28,750 |
| Total | 1,846 (100.0%) | $34,069 |
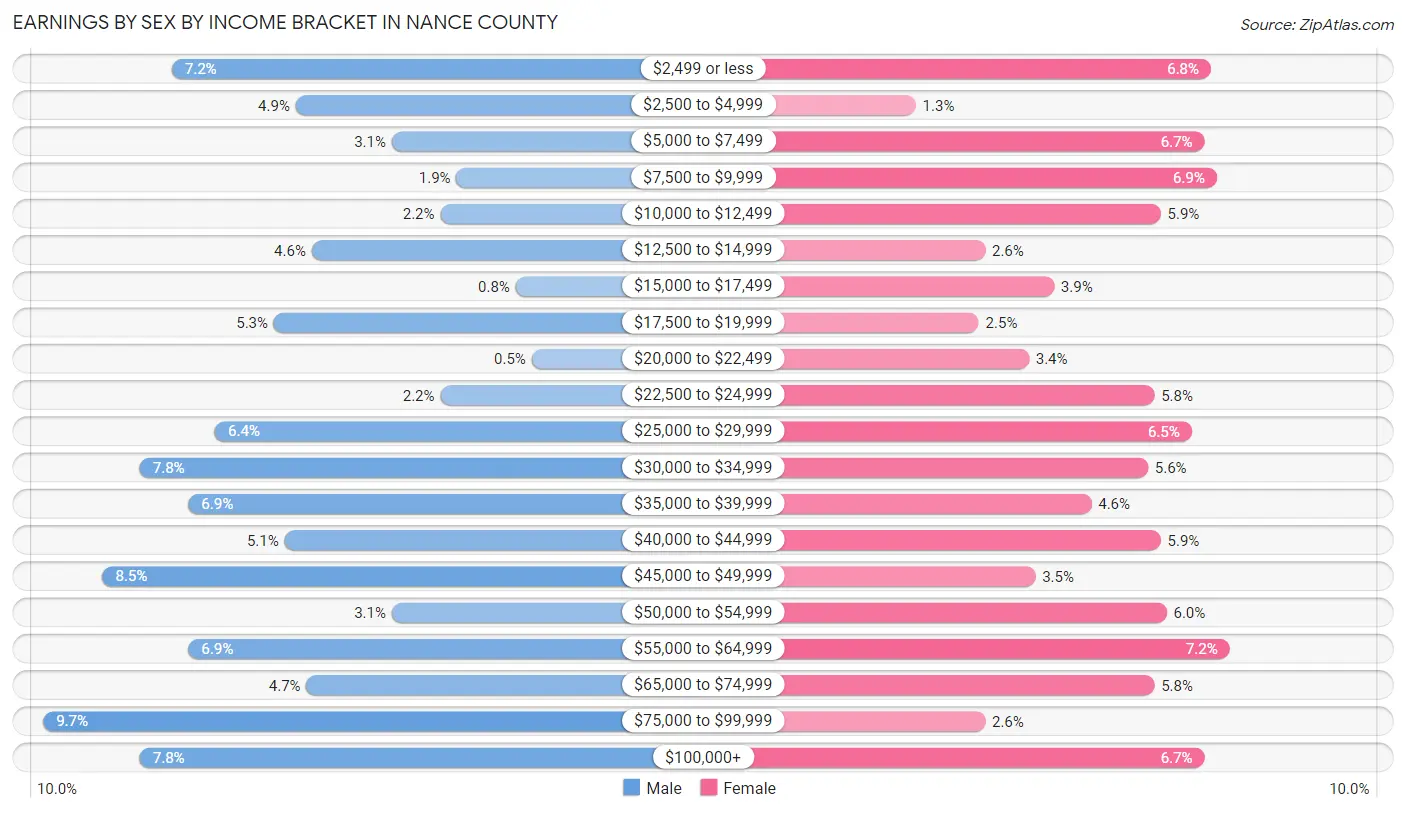
Earnings by Sex by Income Bracket in Nance County
The most common earnings brackets in Nance County are $75,000 to $99,999 for men (96 | 9.7%) and $55,000 to $64,999 for women (61 | 7.2%).
| Income | Male | Female |
| $2,499 or less | 72 (7.2%) | 58 (6.8%) |
| $2,500 to $4,999 | 49 (4.9%) | 11 (1.3%) |
| $5,000 to $7,499 | 31 (3.1%) | 57 (6.7%) |
| $7,500 to $9,999 | 19 (1.9%) | 59 (6.9%) |
| $10,000 to $12,499 | 22 (2.2%) | 50 (5.9%) |
| $12,500 to $14,999 | 46 (4.6%) | 22 (2.6%) |
| $15,000 to $17,499 | 8 (0.8%) | 33 (3.9%) |
| $17,500 to $19,999 | 53 (5.3%) | 21 (2.5%) |
| $20,000 to $22,499 | 5 (0.5%) | 29 (3.4%) |
| $22,500 to $24,999 | 22 (2.2%) | 49 (5.8%) |
| $25,000 to $29,999 | 64 (6.4%) | 55 (6.5%) |
| $30,000 to $34,999 | 78 (7.8%) | 48 (5.6%) |
| $35,000 to $39,999 | 69 (6.9%) | 39 (4.6%) |
| $40,000 to $44,999 | 51 (5.1%) | 50 (5.9%) |
| $45,000 to $49,999 | 85 (8.5%) | 30 (3.5%) |
| $50,000 to $54,999 | 31 (3.1%) | 51 (6.0%) |
| $55,000 to $64,999 | 69 (6.9%) | 61 (7.2%) |
| $65,000 to $74,999 | 47 (4.7%) | 49 (5.8%) |
| $75,000 to $99,999 | 96 (9.7%) | 22 (2.6%) |
| $100,000+ | 78 (7.8%) | 57 (6.7%) |
| Total | 995 (100.0%) | 851 (100.0%) |
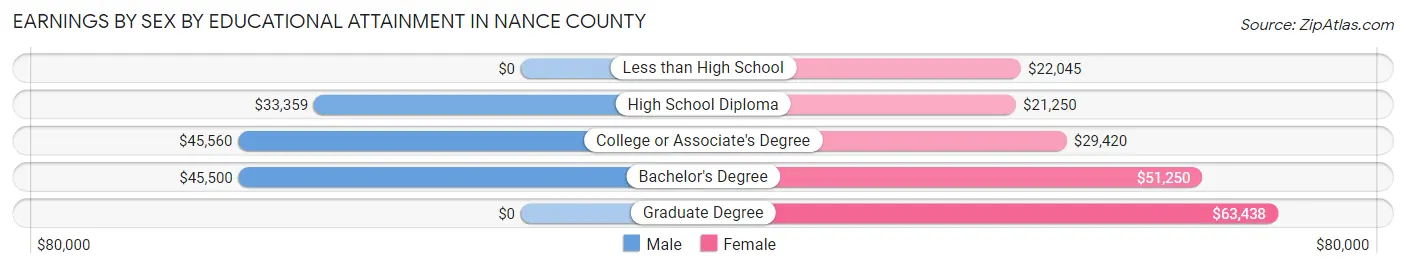
Earnings by Sex by Educational Attainment in Nance County
Average earnings in Nance County are $43,065 for men and $31,750 for women, a difference of 26.3%. Men with an educational attainment of college or associate's degree enjoy the highest average annual earnings of $45,560, while those with high school diploma education earn the least with $33,359. Women with an educational attainment of graduate degree earn the most with the average annual earnings of $63,438, while those with high school diploma education have the smallest earnings of $21,250.
| Educational Attainment | Male Income | Female Income |
| Less than High School | - | - |
| High School Diploma | $33,359 | $21,250 |
| College or Associate's Degree | $45,560 | $29,420 |
| Bachelor's Degree | $45,500 | $51,250 |
| Graduate Degree | - | - |
| Total | $43,065 | $31,750 |
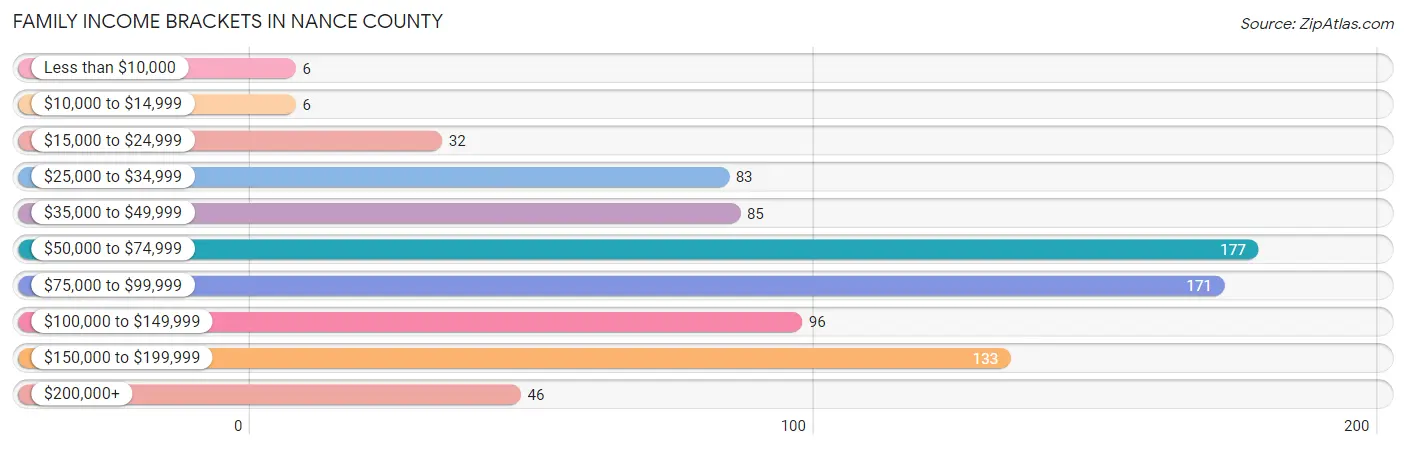
Family Income in Nance County
Family Income Brackets in Nance County
According to the Nance County family income data, there are 177 families falling into the $50,000 to $74,999 income range, which is the most common income bracket and makes up 21.2% of all families. Conversely, the less than $10,000 income bracket is the least frequent group with only 6 families (0.7%) belonging to this category.
| Income Bracket | # Families | % Families |
| Less than $10,000 | 6 | 0.7% |
| $10,000 to $14,999 | 6 | 0.7% |
| $15,000 to $24,999 | 32 | 3.8% |
| $25,000 to $34,999 | 83 | 9.9% |
| $35,000 to $49,999 | 85 | 10.2% |
| $50,000 to $74,999 | 177 | 21.2% |
| $75,000 to $99,999 | 171 | 20.5% |
| $100,000 to $149,999 | 96 | 11.5% |
| $150,000 to $199,999 | 133 | 15.9% |
| $200,000+ | 46 | 5.5% |
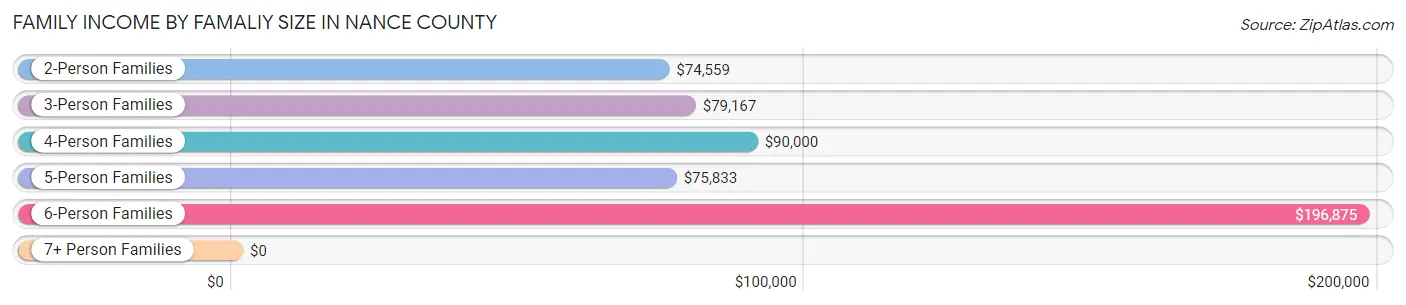
Family Income by Famaliy Size in Nance County
6-person families (33 | 4.0%) account for the highest median family income in Nance County with $196,875 per family, while 2-person families (474 | 56.8%) have the highest median income of $37,280 per family member.
| Income Bracket | # Families | Median Income |
| 2-Person Families | 474 (56.8%) | $74,559 |
| 3-Person Families | 130 (15.6%) | $79,167 |
| 4-Person Families | 140 (16.8%) | $90,000 |
| 5-Person Families | 58 (7.0%) | $75,833 |
| 6-Person Families | 33 (4.0%) | $196,875 |
| 7+ Person Families | 0 (0.0%) | $0 |
| Total | 835 (100.0%) | $80,787 |
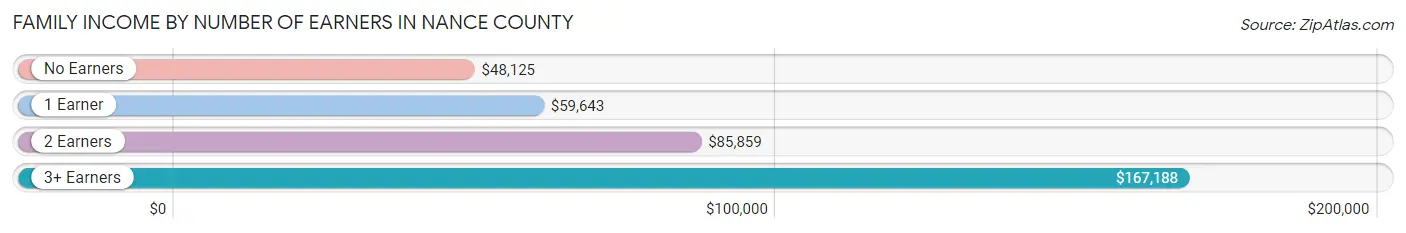
Family Income by Number of Earners in Nance County
The median family income in Nance County is $80,787, with families comprising 3+ earners (75) having the highest median family income of $167,188, while families with no earners (81) have the lowest median family income of $48,125, accounting for 9.0% and 9.7% of families, respectively.
| Number of Earners | # Families | Median Income |
| No Earners | 81 (9.7%) | $48,125 |
| 1 Earner | 218 (26.1%) | $59,643 |
| 2 Earners | 461 (55.2%) | $85,859 |
| 3+ Earners | 75 (9.0%) | $167,188 |
| Total | 835 (100.0%) | $80,787 |
Household Income in Nance County
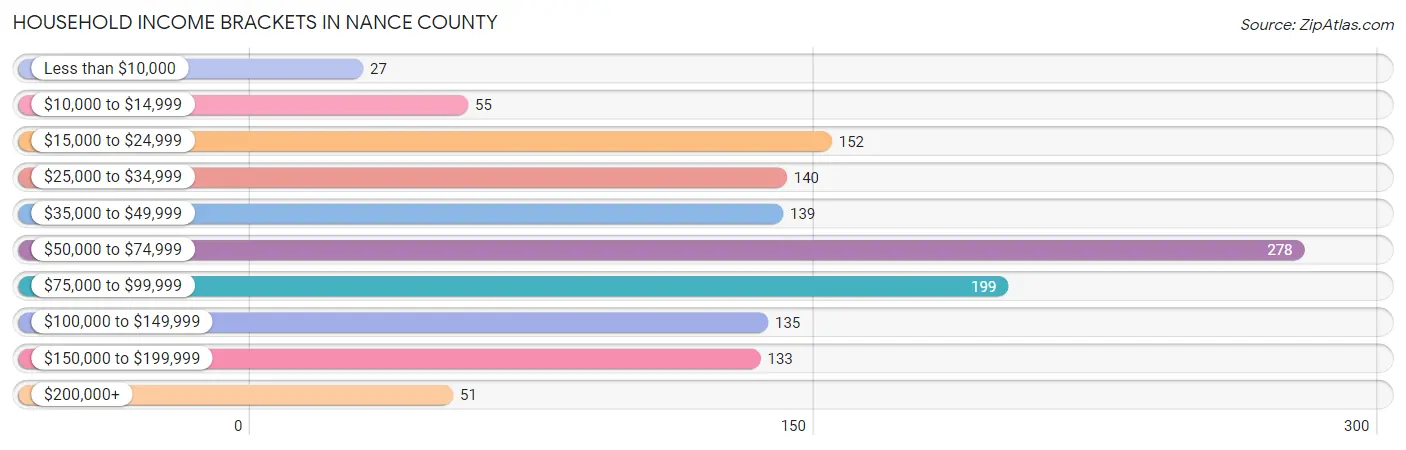
Household Income Brackets in Nance County
With 278 households falling in the category, the $50,000 to $74,999 income range is the most frequent in Nance County, accounting for 21.3% of all households. In contrast, only 27 households (2.1%) fall into the less than $10,000 income bracket, making it the least populous group.
| Income Bracket | # Households | % Households |
| Less than $10,000 | 27 | 2.1% |
| $10,000 to $14,999 | 55 | 4.2% |
| $15,000 to $24,999 | 152 | 11.6% |
| $25,000 to $34,999 | 140 | 10.7% |
| $35,000 to $49,999 | 139 | 10.6% |
| $50,000 to $74,999 | 278 | 21.3% |
| $75,000 to $99,999 | 199 | 15.2% |
| $100,000 to $149,999 | 135 | 10.3% |
| $150,000 to $199,999 | 133 | 10.2% |
| $200,000+ | 51 | 3.9% |
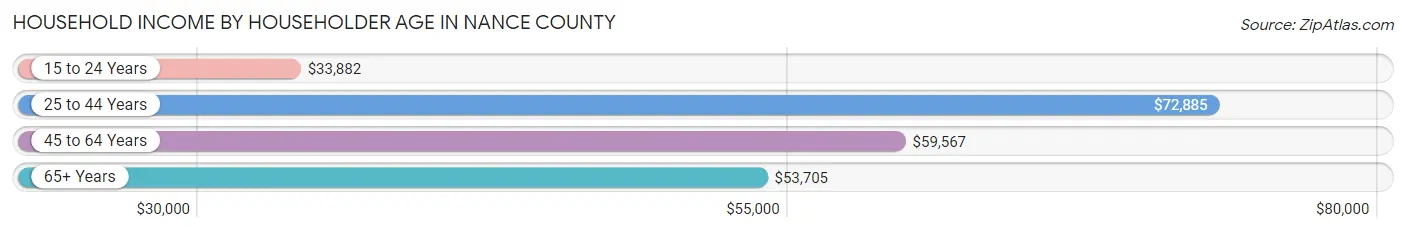
Household Income by Householder Age in Nance County
The median household income in Nance County is $60,054, with the highest median household income of $72,885 found in the 25 to 44 years age bracket for the primary householder. A total of 380 households (29.1%) fall into this category. Meanwhile, the 15 to 24 years age bracket for the primary householder has the lowest median household income of $33,882, with 33 households (2.5%) in this group.
| Income Bracket | # Households | Median Income |
| 15 to 24 Years | 33 (2.5%) | $33,882 |
| 25 to 44 Years | 380 (29.1%) | $72,885 |
| 45 to 64 Years | 491 (37.6%) | $59,567 |
| 65+ Years | 403 (30.8%) | $53,705 |
| Total | 1,307 (100.0%) | $60,054 |
Poverty in Nance County
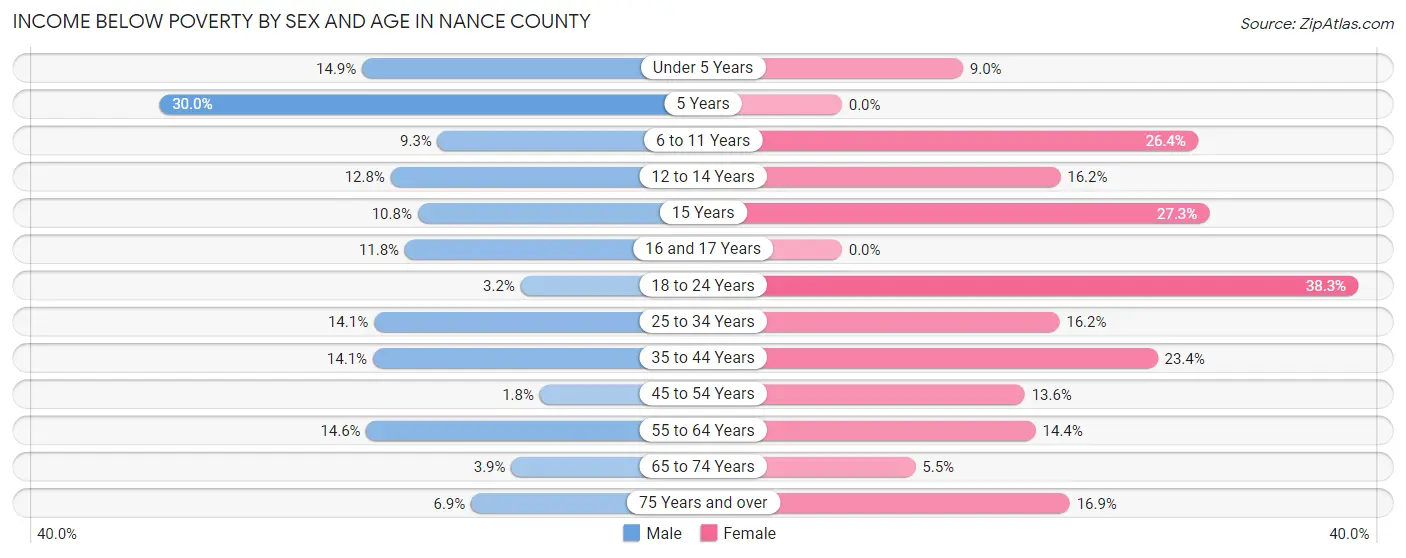
Income Below Poverty by Sex and Age in Nance County
With 10.0% poverty level for males and 17.3% for females among the residents of Nance County, 5 year old males and 18 to 24 year old females are the most vulnerable to poverty, with 3 males (30.0%) and 41 females (38.3%) in their respective age groups living below the poverty level.
| Age Bracket | Male | Female |
| Under 5 Years | 13 (14.9%) | 8 (9.0%) |
| 5 Years | 3 (30.0%) | 0 (0.0%) |
| 6 to 11 Years | 14 (9.3%) | 42 (26.4%) |
| 12 to 14 Years | 10 (12.8%) | 6 (16.2%) |
| 15 Years | 4 (10.8%) | 9 (27.3%) |
| 16 and 17 Years | 4 (11.8%) | 0 (0.0%) |
| 18 to 24 Years | 4 (3.2%) | 41 (38.3%) |
| 25 to 34 Years | 27 (14.1%) | 26 (16.2%) |
| 35 to 44 Years | 27 (14.1%) | 45 (23.4%) |
| 45 to 54 Years | 3 (1.8%) | 22 (13.6%) |
| 55 to 64 Years | 44 (14.6%) | 38 (14.4%) |
| 65 to 74 Years | 8 (3.9%) | 10 (5.5%) |
| 75 Years and over | 5 (6.9%) | 33 (16.9%) |
| Total | 166 (10.0%) | 280 (17.3%) |
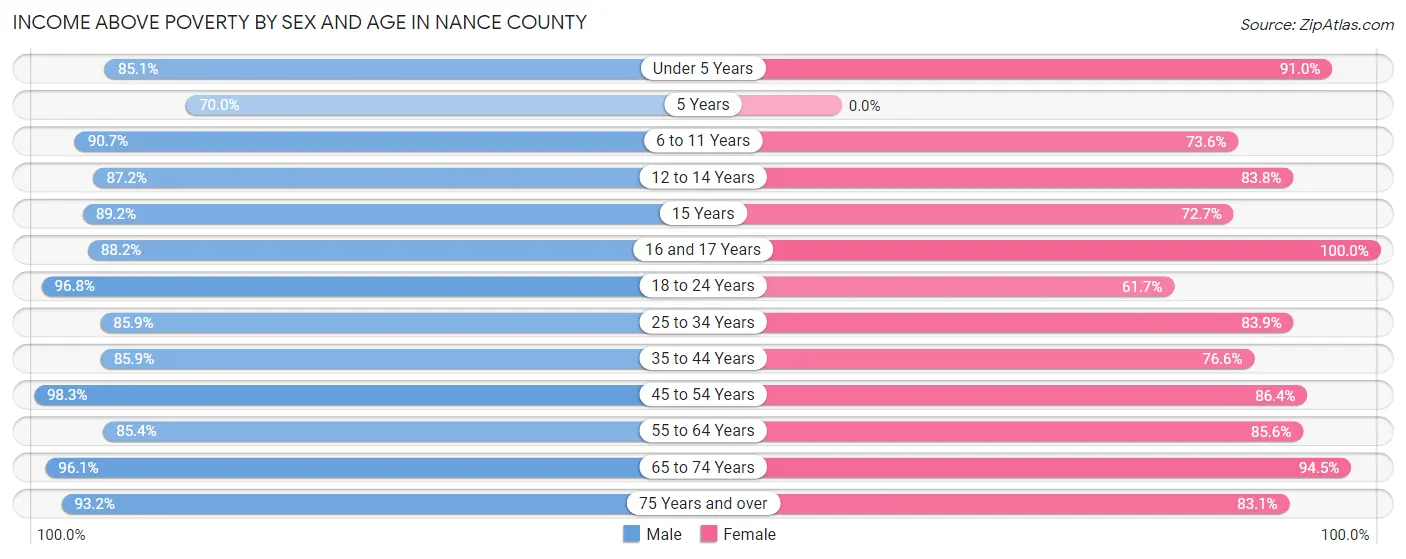
Income Above Poverty by Sex and Age in Nance County
According to the poverty statistics in Nance County, males aged 45 to 54 years and females aged 16 and 17 years are the age groups that are most secure financially, with 98.3% of males and 100.0% of females in these age groups living above the poverty line.
| Age Bracket | Male | Female |
| Under 5 Years | 74 (85.1%) | 81 (91.0%) |
| 5 Years | 7 (70.0%) | 0 (0.0%) |
| 6 to 11 Years | 136 (90.7%) | 117 (73.6%) |
| 12 to 14 Years | 68 (87.2%) | 31 (83.8%) |
| 15 Years | 33 (89.2%) | 24 (72.7%) |
| 16 and 17 Years | 30 (88.2%) | 39 (100.0%) |
| 18 to 24 Years | 122 (96.8%) | 66 (61.7%) |
| 25 to 34 Years | 165 (85.9%) | 135 (83.9%) |
| 35 to 44 Years | 164 (85.9%) | 147 (76.6%) |
| 45 to 54 Years | 168 (98.3%) | 140 (86.4%) |
| 55 to 64 Years | 257 (85.4%) | 226 (85.6%) |
| 65 to 74 Years | 199 (96.1%) | 173 (94.5%) |
| 75 Years and over | 68 (93.1%) | 162 (83.1%) |
| Total | 1,491 (90.0%) | 1,341 (82.7%) |
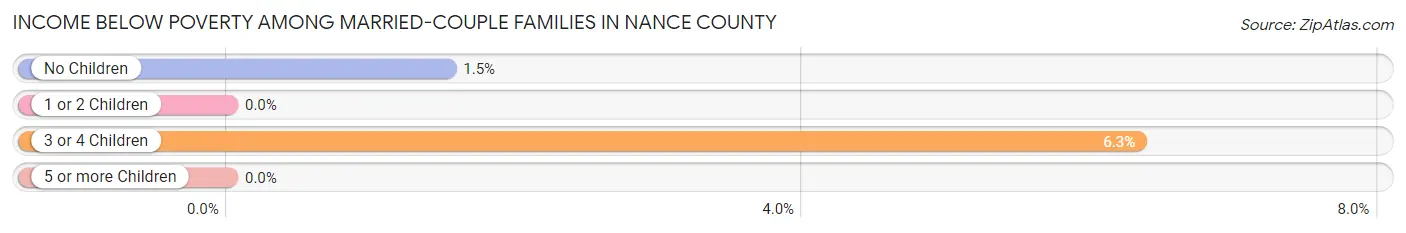
Income Below Poverty Among Married-Couple Families in Nance County
The poverty statistics for married-couple families in Nance County show that 1.7% or 12 of the total 726 families live below the poverty line. Families with 3 or 4 children have the highest poverty rate of 6.3%, comprising of 5 families. On the other hand, families with 1 or 2 children have the lowest poverty rate of 0.0%, which includes 0 families.
| Children | Above Poverty | Below Poverty |
| No Children | 454 (98.5%) | 7 (1.5%) |
| 1 or 2 Children | 186 (100.0%) | 0 (0.0%) |
| 3 or 4 Children | 74 (93.7%) | 5 (6.3%) |
| 5 or more Children | 0 (0.0%) | 0 (0.0%) |
| Total | 714 (98.4%) | 12 (1.7%) |
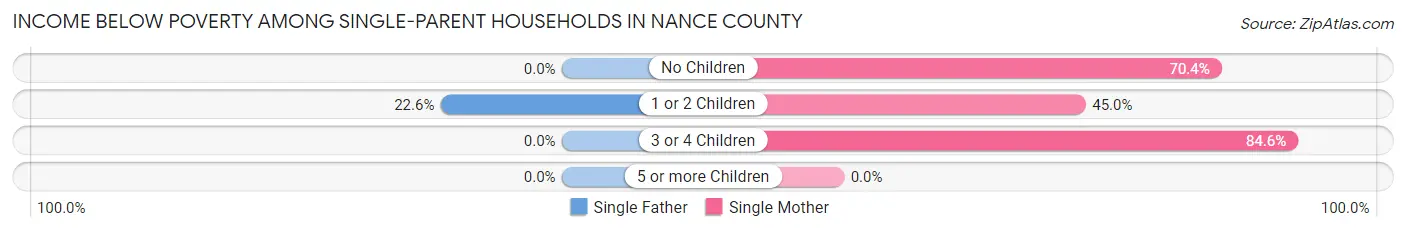
Income Below Poverty Among Single-Parent Households in Nance County
According to the poverty data in Nance County, 14.3% or 7 single-father households and 65.0% or 39 single-mother households are living below the poverty line. Among single-father households, those with 1 or 2 children have the highest poverty rate, with 7 households (22.6%) experiencing poverty. Likewise, among single-mother households, those with 3 or 4 children have the highest poverty rate, with 11 households (84.6%) falling below the poverty line.
| Children | Single Father | Single Mother |
| No Children | 0 (0.0%) | 19 (70.4%) |
| 1 or 2 Children | 7 (22.6%) | 9 (45.0%) |
| 3 or 4 Children | 0 (0.0%) | 11 (84.6%) |
| 5 or more Children | 0 (0.0%) | 0 (0.0%) |
| Total | 7 (14.3%) | 39 (65.0%) |
Income Below Poverty Among Married-Couple vs Single-Parent Households in Nance County
The poverty data for Nance County shows that 12 of the married-couple family households (1.7%) and 46 of the single-parent households (42.2%) are living below the poverty level. Within the married-couple family households, those with 3 or 4 children have the highest poverty rate, with 5 households (6.3%) falling below the poverty line. Among the single-parent households, those with 3 or 4 children have the highest poverty rate, with 11 household (73.3%) living below poverty.
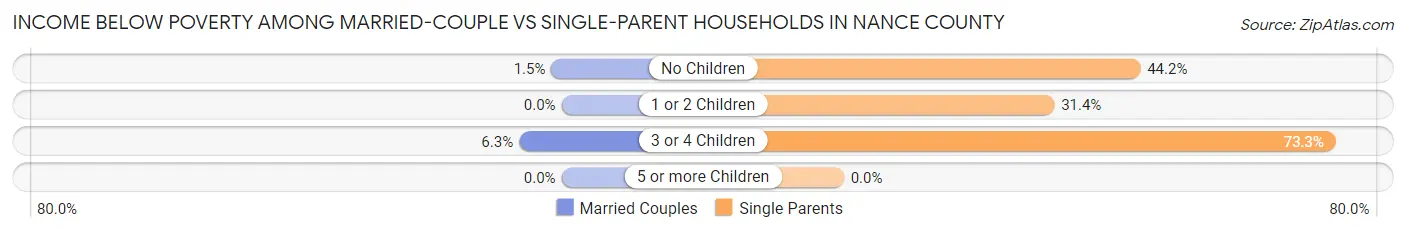
| Children | Married-Couple Families | Single-Parent Households |
| No Children | 7 (1.5%) | 19 (44.2%) |
| 1 or 2 Children | 0 (0.0%) | 16 (31.4%) |
| 3 or 4 Children | 5 (6.3%) | 11 (73.3%) |
| 5 or more Children | 0 (0.0%) | 0 (0.0%) |
| Total | 12 (1.7%) | 46 (42.2%) |
Race in Nance County
The most populous races in Nance County are White / Caucasian (3,203 | 95.2%), Hispanic or Latino (117 | 3.5%), and Two or more Races (116 | 3.5%).
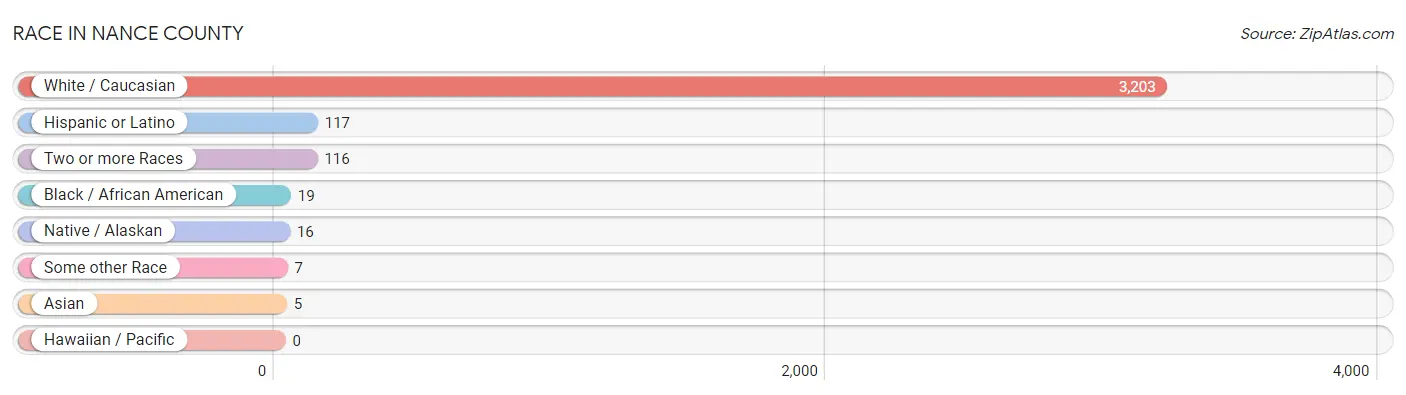
| Race | # Population | % Population |
| Asian | 5 | 0.2% |
| Black / African American | 19 | 0.6% |
| Hawaiian / Pacific | 0 | 0.0% |
| Hispanic or Latino | 117 | 3.5% |
| Native / Alaskan | 16 | 0.5% |
| White / Caucasian | 3,203 | 95.2% |
| Two or more Races | 116 | 3.5% |
| Some other Race | 7 | 0.2% |
| Total | 3,366 | 100.0% |
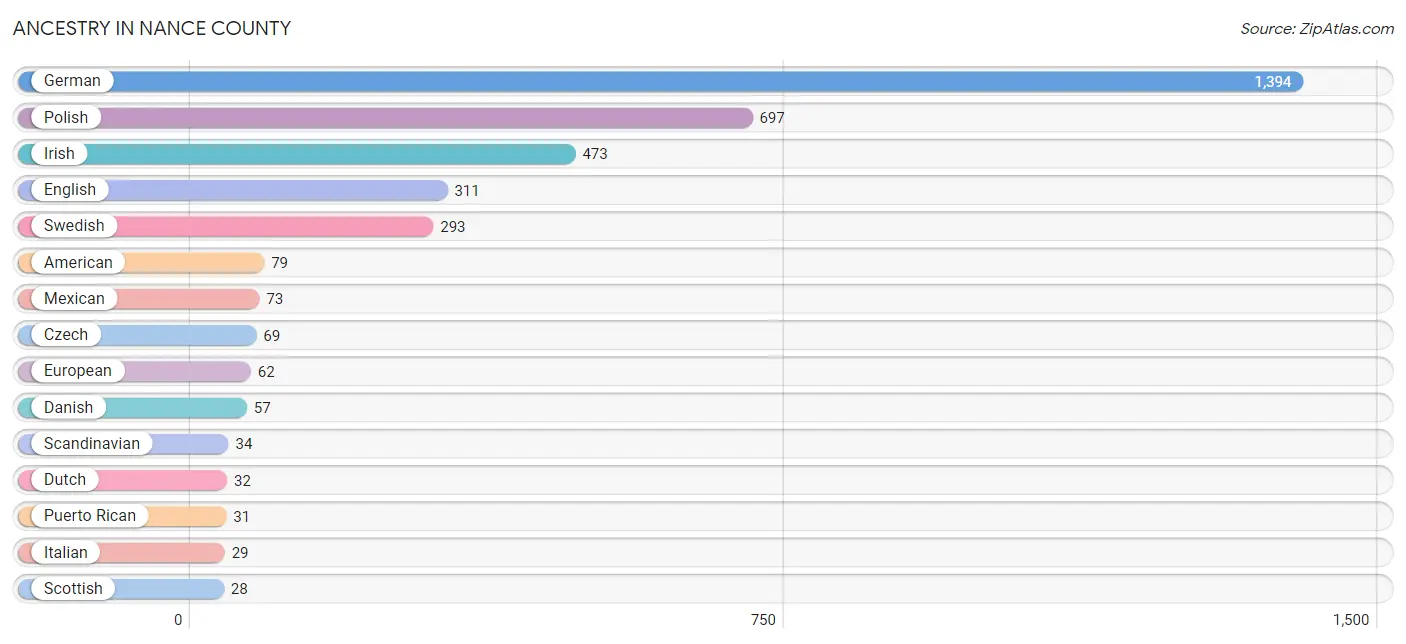
Ancestry in Nance County
The most populous ancestries reported in Nance County are German (1,394 | 41.4%), Polish (697 | 20.7%), Irish (473 | 14.1%), English (311 | 9.2%), and Swedish (293 | 8.7%), together accounting for 94.1% of all Nance County residents.
| Ancestry | # Population | % Population |
| African | 11 | 0.3% |
| American | 79 | 2.4% |
| Blackfeet | 13 | 0.4% |
| British | 2 | 0.1% |
| Central American | 6 | 0.2% |
| Central American Indian | 7 | 0.2% |
| Cherokee | 16 | 0.5% |
| Czech | 69 | 2.1% |
| Czechoslovakian | 4 | 0.1% |
| Danish | 57 | 1.7% |
| Dutch | 32 | 0.9% |
| English | 311 | 9.2% |
| European | 62 | 1.8% |
| French | 27 | 0.8% |
| German | 1,394 | 41.4% |
| Houma | 3 | 0.1% |
| Irish | 473 | 14.1% |
| Italian | 29 | 0.9% |
| Kenyan | 9 | 0.3% |
| Mexican | 73 | 2.2% |
| Mexican American Indian | 13 | 0.4% |
| Northern European | 8 | 0.2% |
| Norwegian | 23 | 0.7% |
| Pennsylvania German | 18 | 0.5% |
| Polish | 697 | 20.7% |
| Portuguese | 5 | 0.2% |
| Puerto Rican | 31 | 0.9% |
| Russian | 2 | 0.1% |
| Salvadoran | 6 | 0.2% |
| Scandinavian | 34 | 1.0% |
| Scotch-Irish | 27 | 0.8% |
| Scottish | 28 | 0.8% |
| Sioux | 5 | 0.2% |
| Spaniard | 7 | 0.2% |
| Subsaharan African | 20 | 0.6% |
| Swedish | 293 | 8.7% |
| Swiss | 11 | 0.3% |
| Thai | 5 | 0.2% |
| Welsh | 14 | 0.4% | View All 39 Rows |
Immigrants in Nance County
The most numerous immigrant groups reported in Nance County came from Africa (8 | 0.2%), Eastern Africa (8 | 0.2%), Kenya (5 | 0.2%), Asia (2 | 0.1%), and India (2 | 0.1%), together accounting for 0.7% of all Nance County residents.
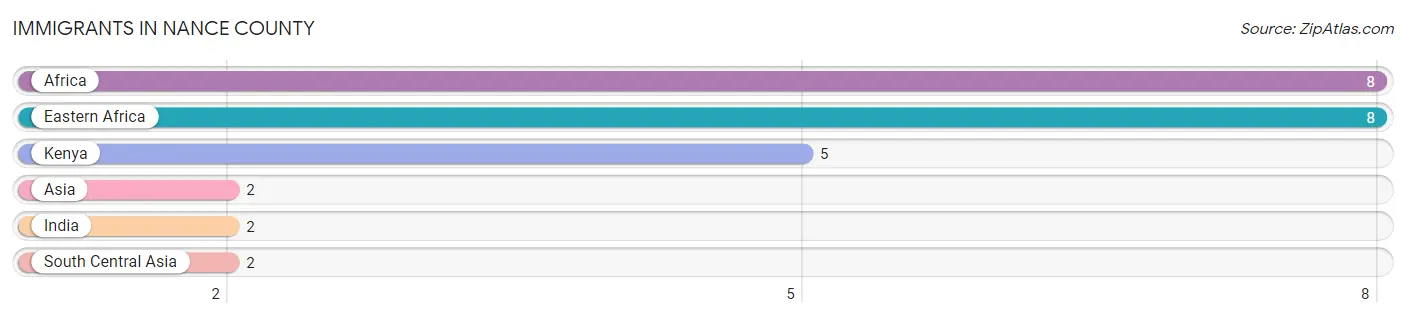
| Immigration Origin | # Population | % Population |
| Africa | 8 | 0.2% |
| Asia | 2 | 0.1% |
| Eastern Africa | 8 | 0.2% |
| India | 2 | 0.1% |
| Kenya | 5 | 0.2% |
| South Central Asia | 2 | 0.1% | View All 6 Rows |
Sex and Age in Nance County
Sex and Age in Nance County
The most populous age groups in Nance County are 55 to 59 Years (176 | 10.4%) for men and 55 to 59 Years (174 | 10.4%) for women.
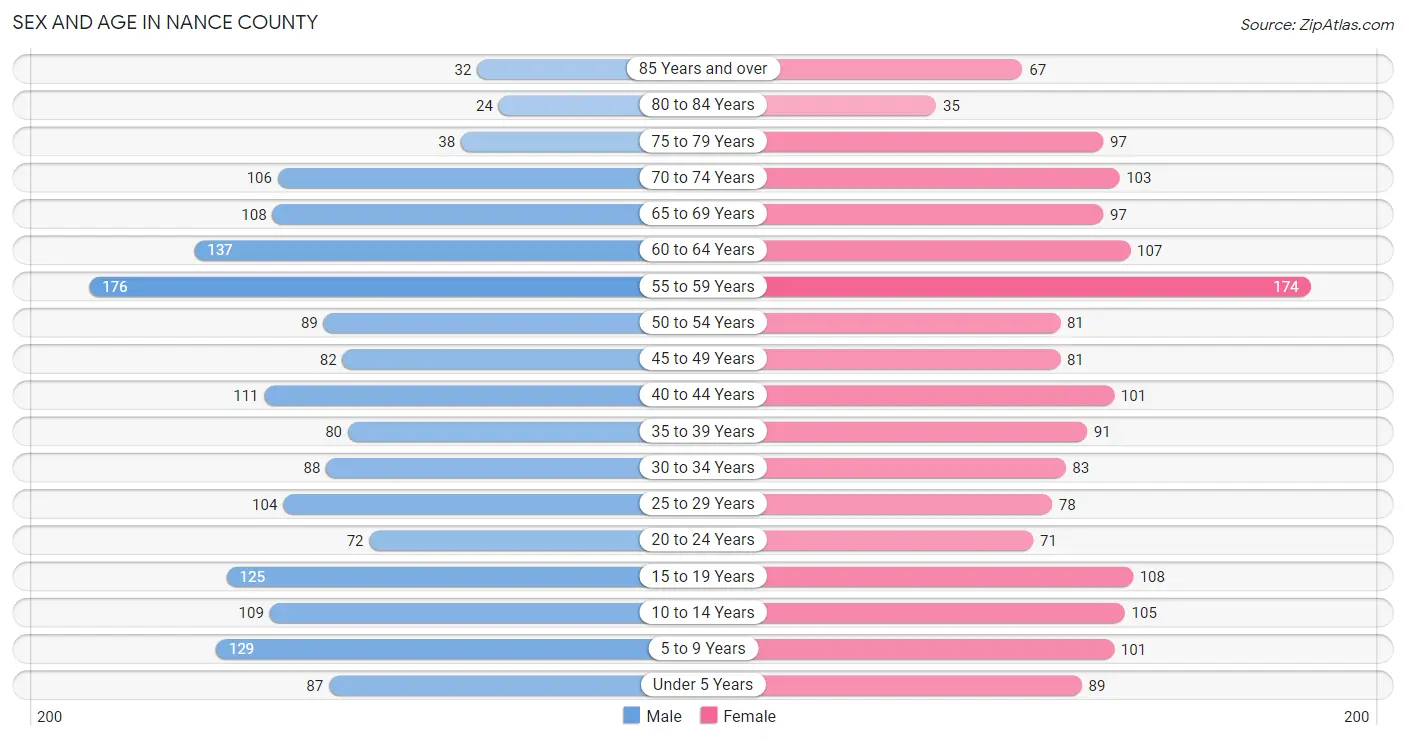
| Age Bracket | Male | Female |
| Under 5 Years | 87 (5.1%) | 89 (5.3%) |
| 5 to 9 Years | 129 (7.6%) | 101 (6.0%) |
| 10 to 14 Years | 109 (6.4%) | 105 (6.3%) |
| 15 to 19 Years | 125 (7.4%) | 108 (6.5%) |
| 20 to 24 Years | 72 (4.2%) | 71 (4.3%) |
| 25 to 29 Years | 104 (6.1%) | 78 (4.7%) |
| 30 to 34 Years | 88 (5.2%) | 83 (5.0%) |
| 35 to 39 Years | 80 (4.7%) | 91 (5.4%) |
| 40 to 44 Years | 111 (6.5%) | 101 (6.0%) |
| 45 to 49 Years | 82 (4.8%) | 81 (4.9%) |
| 50 to 54 Years | 89 (5.2%) | 81 (4.9%) |
| 55 to 59 Years | 176 (10.4%) | 174 (10.4%) |
| 60 to 64 Years | 137 (8.1%) | 107 (6.4%) |
| 65 to 69 Years | 108 (6.4%) | 97 (5.8%) |
| 70 to 74 Years | 106 (6.2%) | 103 (6.2%) |
| 75 to 79 Years | 38 (2.2%) | 97 (5.8%) |
| 80 to 84 Years | 24 (1.4%) | 35 (2.1%) |
| 85 Years and over | 32 (1.9%) | 67 (4.0%) |
| Total | 1,697 (100.0%) | 1,669 (100.0%) |
Families and Households in Nance County
Median Family Size in Nance County
The median family size in Nance County is 3.14 persons per family, with single female/mother families (60 | 7.2%) accounting for the largest median family size of 4.08 persons per family. On the other hand, single male/father families (49 | 5.9%) represent the smallest median family size with 2.76 persons per family.
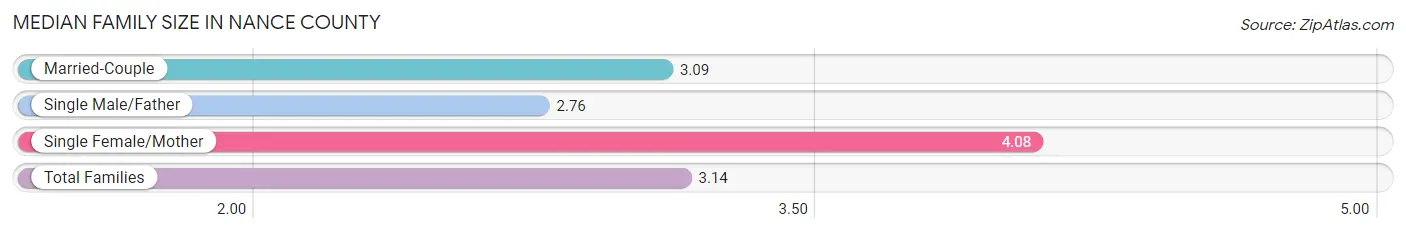
| Family Type | # Families | Family Size |
| Married-Couple | 726 (87.0%) | 3.09 |
| Single Male/Father | 49 (5.9%) | 2.76 |
| Single Female/Mother | 60 (7.2%) | 4.08 |
| Total Families | 835 (100.0%) | 3.14 |
Median Household Size in Nance County
The median household size in Nance County is 2.48 persons per household, with single female/mother households (60 | 4.6%) accounting for the largest median household size of 4.12 persons per household. non-family households (472 | 36.1%) represent the smallest median household size with 1.18 persons per household.
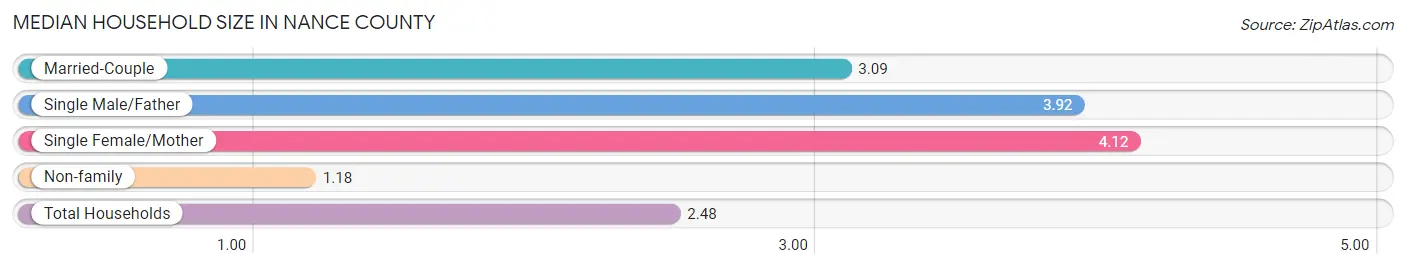
| Household Type | # Households | Household Size |
| Married-Couple | 726 (55.5%) | 3.09 |
| Single Male/Father | 49 (3.7%) | 3.92 |
| Single Female/Mother | 60 (4.6%) | 4.12 |
| Non-family | 472 (36.1%) | 1.18 |
| Total Households | 1,307 (100.0%) | 2.48 |
Household Size by Marriage Status in Nance County
Out of a total of 1,307 households in Nance County, 835 (63.9%) are family households, while 472 (36.1%) are nonfamily households. The most numerous type of family households are 2-person households, comprising 440, and the most common type of nonfamily households are 1-person households, comprising 383.
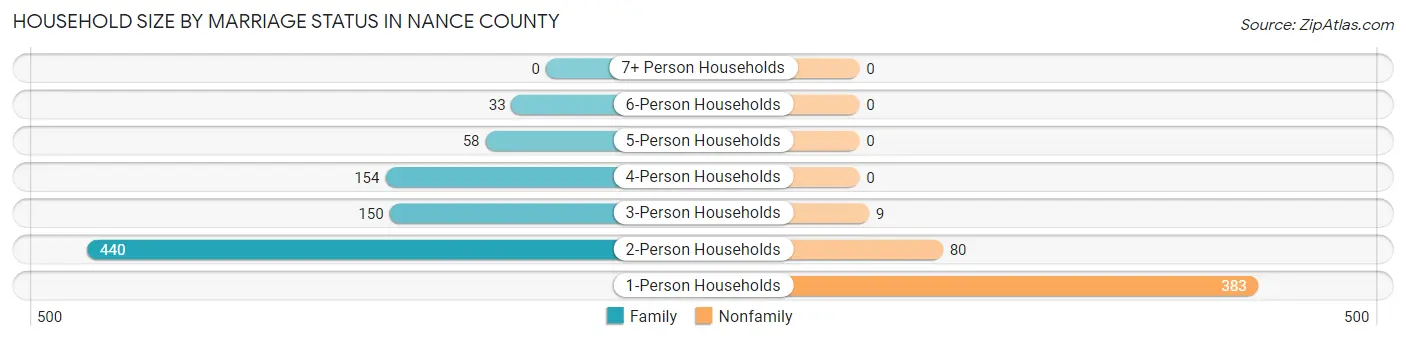
| Household Size | Family Households | Nonfamily Households |
| 1-Person Households | - | 383 (29.3%) |
| 2-Person Households | 440 (33.7%) | 80 (6.1%) |
| 3-Person Households | 150 (11.5%) | 9 (0.7%) |
| 4-Person Households | 154 (11.8%) | 0 (0.0%) |
| 5-Person Households | 58 (4.4%) | 0 (0.0%) |
| 6-Person Households | 33 (2.5%) | 0 (0.0%) |
| 7+ Person Households | 0 (0.0%) | 0 (0.0%) |
| Total | 835 (63.9%) | 472 (36.1%) |
Female Fertility in Nance County
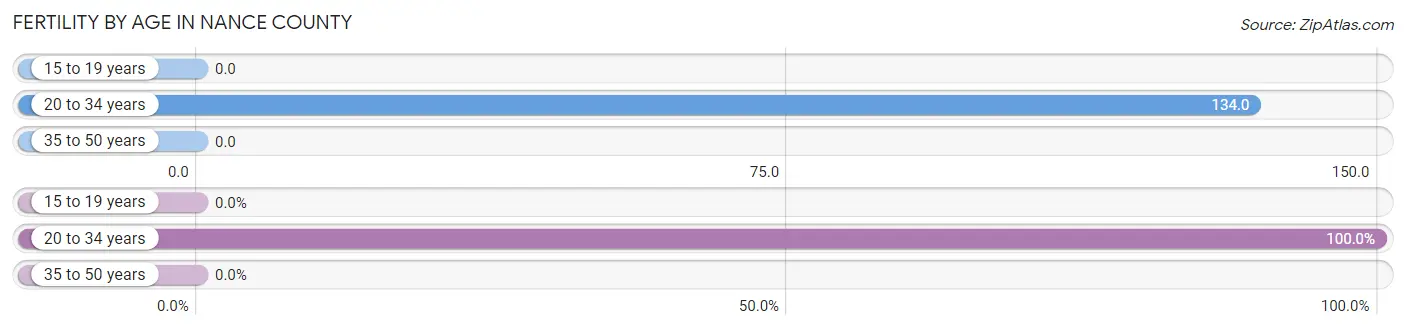
Fertility by Age in Nance County
Average fertility rate in Nance County is 50.0 births per 1,000 women. Women in the age bracket of 20 to 34 years have the highest fertility rate with 134.0 births per 1,000 women. Women in the age bracket of 20 to 34 years acount for 100.0% of all women with births.
| Age Bracket | Women with Births | Births / 1,000 Women |
| 15 to 19 years | 0 (0.0%) | 0.0 |
| 20 to 34 years | 31 (100.0%) | 134.0 |
| 35 to 50 years | 0 (0.0%) | 0.0 |
| Total | 31 (100.0%) | 50.0 |
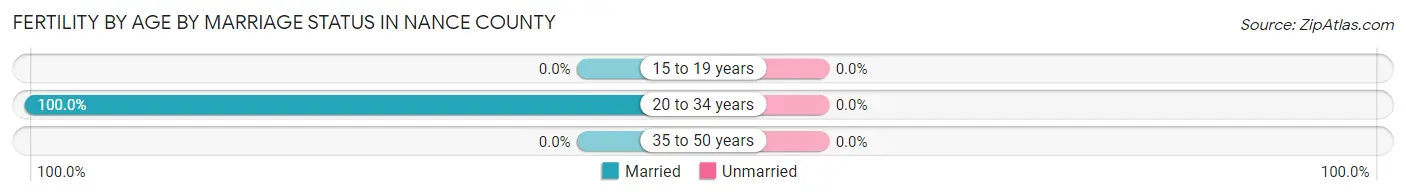
Fertility by Age by Marriage Status in Nance County
| Age Bracket | Married | Unmarried |
| 15 to 19 years | 0 (0.0%) | 0 (0.0%) |
| 20 to 34 years | 31 (100.0%) | 0 (0.0%) |
| 35 to 50 years | 0 (0.0%) | 0 (0.0%) |
| Total | 31 (100.0%) | 0 (0.0%) |
Fertility by Education in Nance County
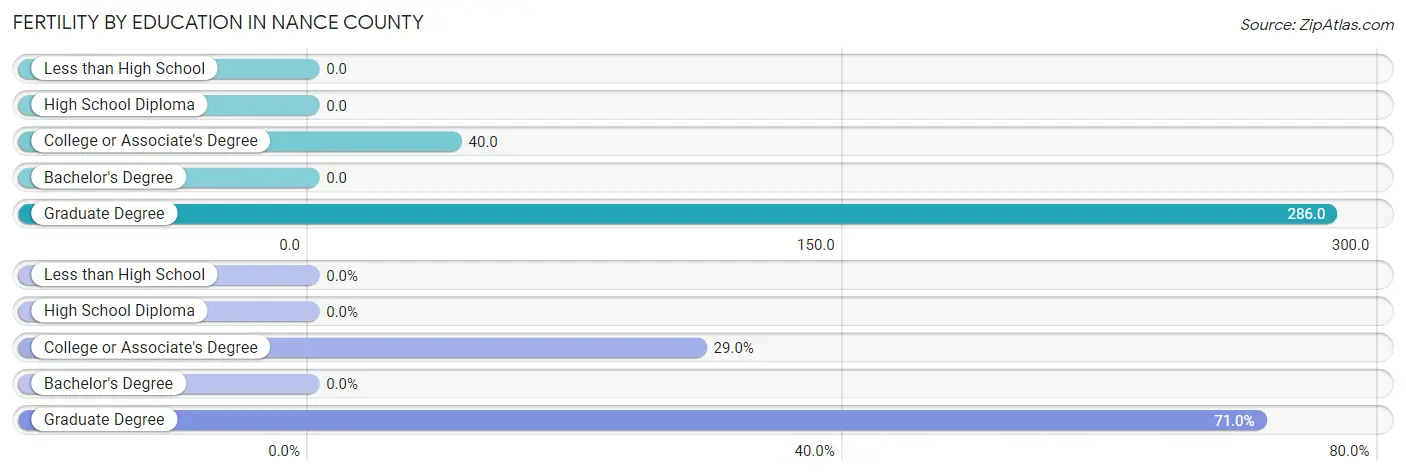
| Educational Attainment | Women with Births | Births / 1,000 Women |
| Less than High School | 0 (0.0%) | 0.0 |
| High School Diploma | 0 (0.0%) | 0.0 |
| College or Associate's Degree | 9 (29.0%) | 40.0 |
| Bachelor's Degree | 0 (0.0%) | 0.0 |
| Graduate Degree | 22 (71.0%) | 286.0 |
| Total | 31 (100.0%) | 50.0 |
Fertility by Education by Marriage Status in Nance County
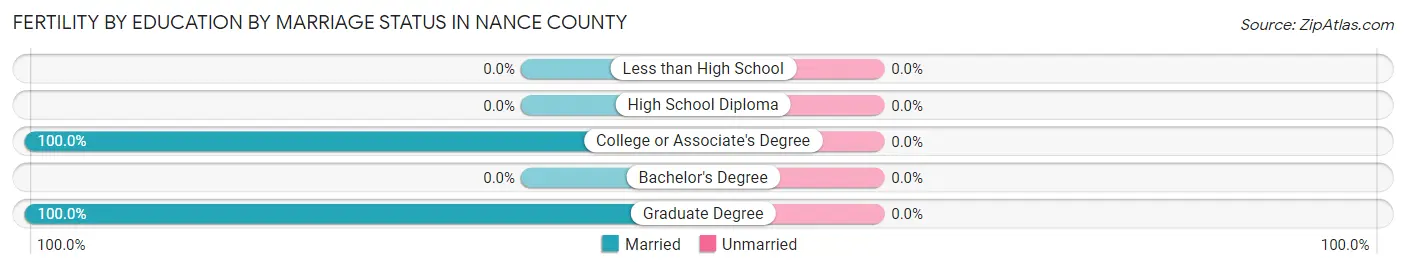
| Educational Attainment | Married | Unmarried |
| Less than High School | 0 (0.0%) | 0 (0.0%) |
| High School Diploma | 0 (0.0%) | 0 (0.0%) |
| College or Associate's Degree | 9 (100.0%) | 0 (0.0%) |
| Bachelor's Degree | 0 (0.0%) | 0 (0.0%) |
| Graduate Degree | 22 (100.0%) | 0 (0.0%) |
| Total | 31 (100.0%) | 0 (0.0%) |
Employment Characteristics in Nance County
Employment by Class of Employer in Nance County
Among the 1,607 employed individuals in Nance County, private company employees (917 | 57.1%), self-employed (not incorporated) (232 | 14.4%), and local government employees (168 | 10.4%) make up the most common classes of employment.
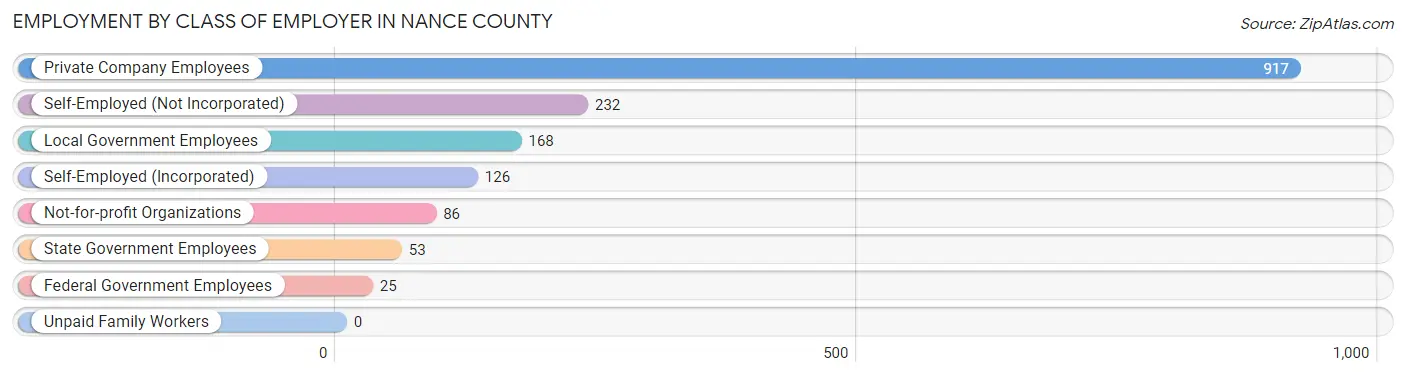
| Employer Class | # Employees | % Employees |
| Private Company Employees | 917 | 57.1% |
| Self-Employed (Incorporated) | 126 | 7.8% |
| Self-Employed (Not Incorporated) | 232 | 14.4% |
| Not-for-profit Organizations | 86 | 5.3% |
| Local Government Employees | 168 | 10.4% |
| State Government Employees | 53 | 3.3% |
| Federal Government Employees | 25 | 1.6% |
| Unpaid Family Workers | 0 | 0.0% |
| Total | 1,607 | 100.0% |
Employment Status by Age in Nance County
According to the labor force statistics for Nance County, out of the total population over 16 years of age (2,676), 64.9% or 1,737 individuals are in the labor force, with 4.4% or 76 of them unemployed. The age group with the highest labor force participation rate is 25 to 29 years, with 100.0% or 182 individuals in the labor force. Within the labor force, the 16 to 19 years age range has the highest percentage of unemployed individuals, with 19.3% or 21 of them being unemployed.
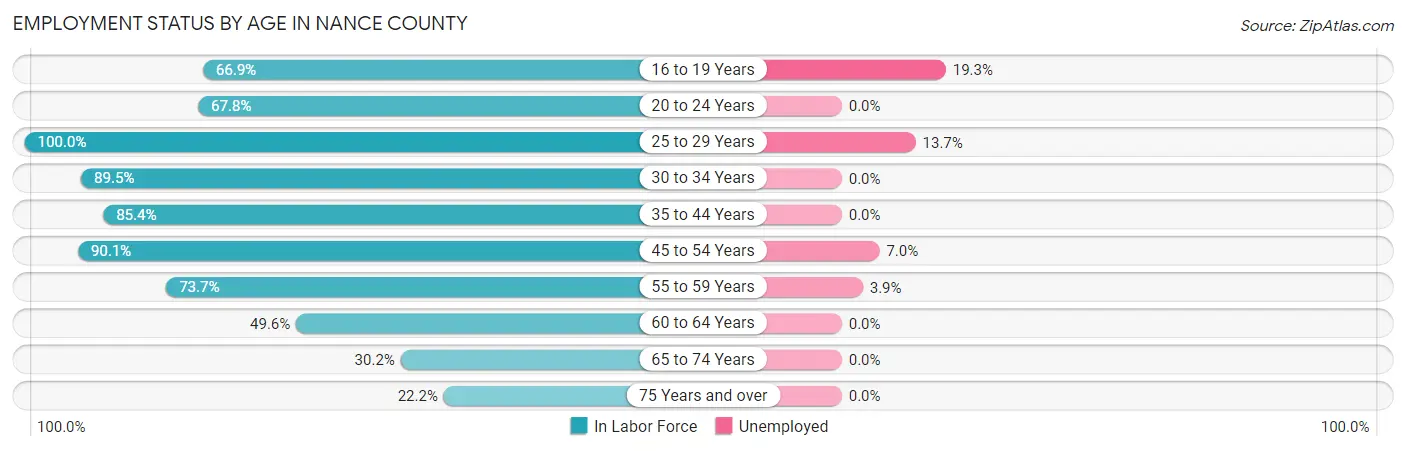
| Age Bracket | In Labor Force | Unemployed |
| 16 to 19 Years | 109 (66.9%) | 21 (19.3%) |
| 20 to 24 Years | 97 (67.8%) | 0 (0.0%) |
| 25 to 29 Years | 182 (100.0%) | 25 (13.7%) |
| 30 to 34 Years | 153 (89.5%) | 0 (0.0%) |
| 35 to 44 Years | 327 (85.4%) | 0 (0.0%) |
| 45 to 54 Years | 300 (90.1%) | 21 (7.0%) |
| 55 to 59 Years | 258 (73.7%) | 10 (3.9%) |
| 60 to 64 Years | 121 (49.6%) | 0 (0.0%) |
| 65 to 74 Years | 125 (30.2%) | 0 (0.0%) |
| 75 Years and over | 65 (22.2%) | 0 (0.0%) |
| Total | 1,737 (64.9%) | 76 (4.4%) |
Employment Status by Educational Attainment in Nance County
According to labor force statistics for Nance County, 80.6% of individuals (1,340) out of the total population between 25 and 64 years of age (1,663) are in the labor force, with 4.2% or 56 of them being unemployed. The group with the highest labor force participation rate are those with the educational attainment of college / associate degree, with 84.2% or 608 individuals in the labor force. Within the labor force, individuals with high school diploma education have the highest percentage of unemployment, with 7.9% or 33 of them being unemployed.
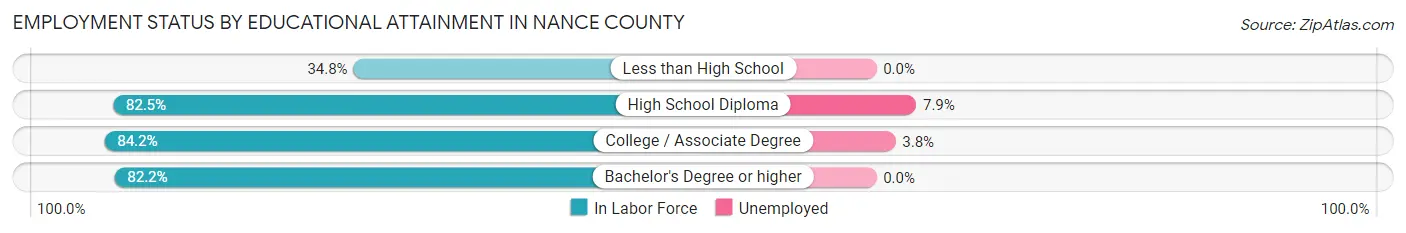
| Educational Attainment | In Labor Force | Unemployed |
| Less than High School | 31 (34.8%) | 0 (0.0%) |
| High School Diploma | 416 (82.5%) | 40 (7.9%) |
| College / Associate Degree | 608 (84.2%) | 27 (3.8%) |
| Bachelor's Degree or higher | 286 (82.2%) | 0 (0.0%) |
| Total | 1,340 (80.6%) | 70 (4.2%) |
Employment Occupations by Sex in Nance County
Management, Business, Science and Arts Occupations
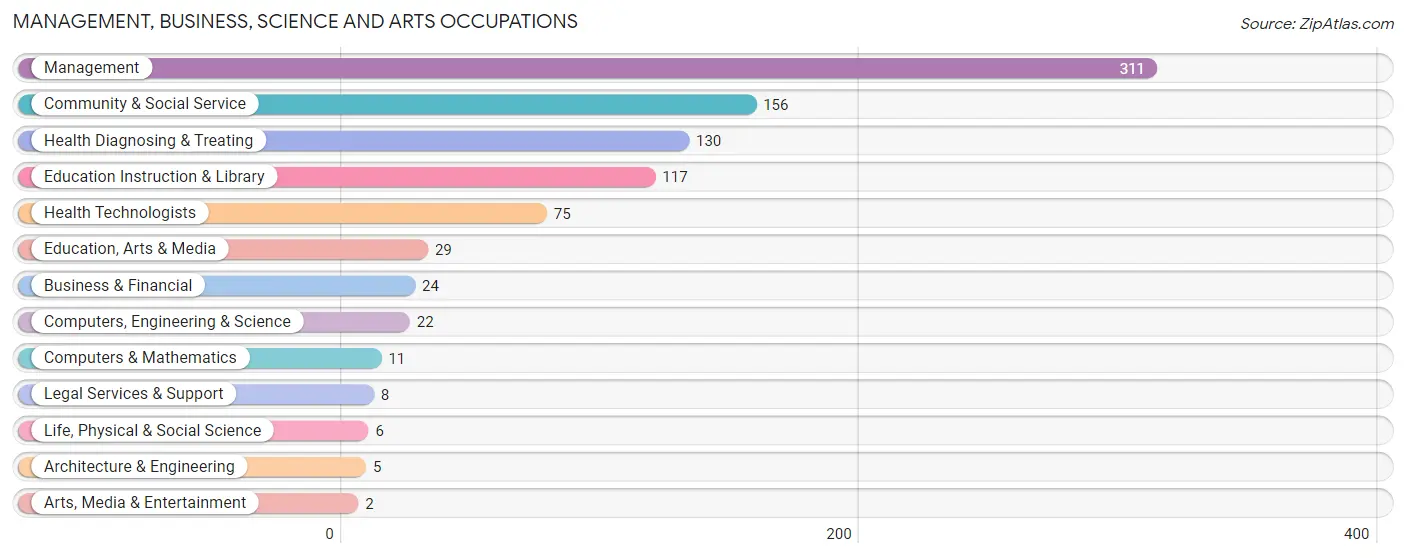
The most common Management, Business, Science and Arts occupations in Nance County are Management (311 | 18.7%), Community & Social Service (156 | 9.4%), Health Diagnosing & Treating (130 | 7.8%), Education Instruction & Library (117 | 7.0%), and Health Technologists (75 | 4.5%).
Management, Business, Science and Arts Occupations by Sex
Within the Management, Business, Science and Arts occupations in Nance County, the most male-oriented occupations are Architecture & Engineering (100.0%), Management (78.5%), and Computers, Engineering & Science (36.4%), while the most female-oriented occupations are Life, Physical & Social Science (100.0%), Legal Services & Support (100.0%), and Arts, Media & Entertainment (100.0%).
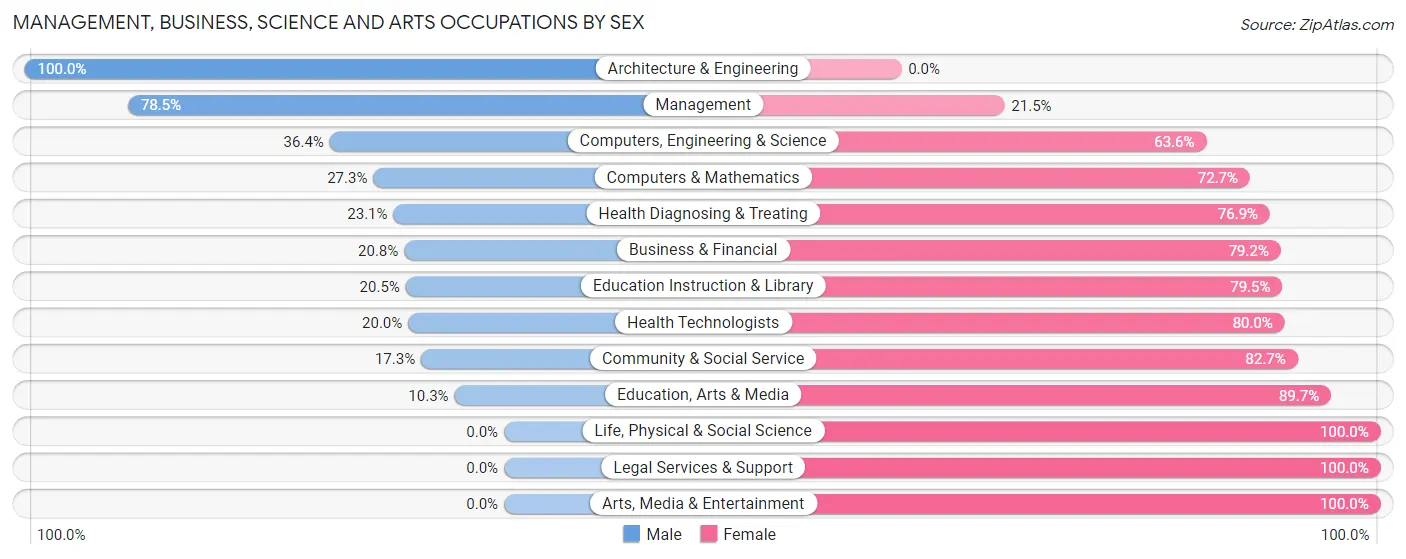
| Occupation | Male | Female |
| Management | 244 (78.5%) | 67 (21.5%) |
| Business & Financial | 5 (20.8%) | 19 (79.2%) |
| Computers, Engineering & Science | 8 (36.4%) | 14 (63.6%) |
| Computers & Mathematics | 3 (27.3%) | 8 (72.7%) |
| Architecture & Engineering | 5 (100.0%) | 0 (0.0%) |
| Life, Physical & Social Science | 0 (0.0%) | 6 (100.0%) |
| Community & Social Service | 27 (17.3%) | 129 (82.7%) |
| Education, Arts & Media | 3 (10.3%) | 26 (89.7%) |
| Legal Services & Support | 0 (0.0%) | 8 (100.0%) |
| Education Instruction & Library | 24 (20.5%) | 93 (79.5%) |
| Arts, Media & Entertainment | 0 (0.0%) | 2 (100.0%) |
| Health Diagnosing & Treating | 30 (23.1%) | 100 (76.9%) |
| Health Technologists | 15 (20.0%) | 60 (80.0%) |
| Total (Category) | 314 (48.8%) | 329 (51.2%) |
| Total (Overall) | 931 (56.1%) | 729 (43.9%) |
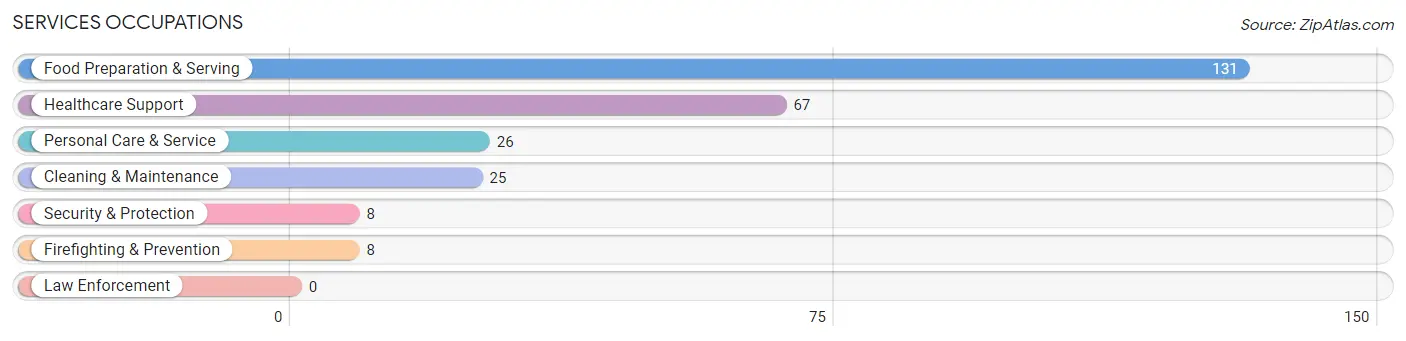
Services Occupations
The most common Services occupations in Nance County are Food Preparation & Serving (131 | 7.9%), Healthcare Support (67 | 4.0%), Personal Care & Service (26 | 1.6%), Cleaning & Maintenance (25 | 1.5%), and Security & Protection (8 | 0.5%).
Services Occupations by Sex
Within the Services occupations in Nance County, the most male-oriented occupations are Food Preparation & Serving (65.6%), Cleaning & Maintenance (60.0%), and Security & Protection (12.5%), while the most female-oriented occupations are Healthcare Support (91.0%), Personal Care & Service (88.5%), and Security & Protection (87.5%).
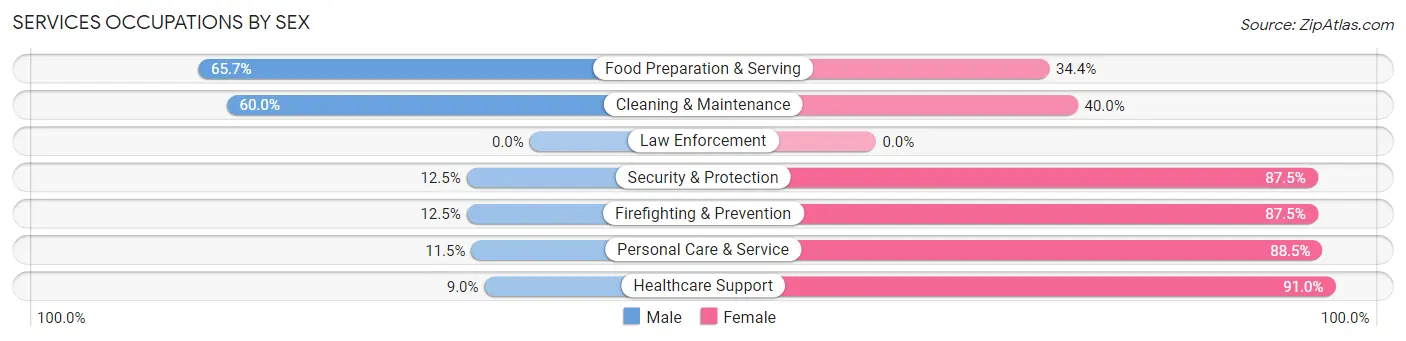
| Occupation | Male | Female |
| Healthcare Support | 6 (9.0%) | 61 (91.0%) |
| Security & Protection | 1 (12.5%) | 7 (87.5%) |
| Firefighting & Prevention | 1 (12.5%) | 7 (87.5%) |
| Law Enforcement | 0 (0.0%) | 0 (0.0%) |
| Food Preparation & Serving | 86 (65.6%) | 45 (34.4%) |
| Cleaning & Maintenance | 15 (60.0%) | 10 (40.0%) |
| Personal Care & Service | 3 (11.5%) | 23 (88.5%) |
| Total (Category) | 111 (43.2%) | 146 (56.8%) |
| Total (Overall) | 931 (56.1%) | 729 (43.9%) |
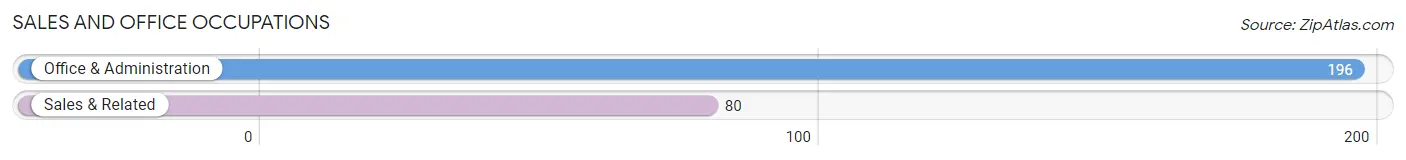
Sales and Office Occupations
The most common Sales and Office occupations in Nance County are Office & Administration (196 | 11.8%), and Sales & Related (80 | 4.8%).
Sales and Office Occupations by Sex

| Occupation | Male | Female |
| Sales & Related | 40 (50.0%) | 40 (50.0%) |
| Office & Administration | 35 (17.9%) | 161 (82.1%) |
| Total (Category) | 75 (27.2%) | 201 (72.8%) |
| Total (Overall) | 931 (56.1%) | 729 (43.9%) |
Natural Resources, Construction and Maintenance Occupations
The most common Natural Resources, Construction and Maintenance occupations in Nance County are Construction & Extraction (155 | 9.3%), Farming, Fishing & Forestry (81 | 4.9%), and Installation, Maintenance & Repair (56 | 3.4%).

Natural Resources, Construction and Maintenance Occupations by Sex

| Occupation | Male | Female |
| Farming, Fishing & Forestry | 70 (86.4%) | 11 (13.6%) |
| Construction & Extraction | 146 (94.2%) | 9 (5.8%) |
| Installation, Maintenance & Repair | 56 (100.0%) | 0 (0.0%) |
| Total (Category) | 272 (93.1%) | 20 (6.9%) |
| Total (Overall) | 931 (56.1%) | 729 (43.9%) |
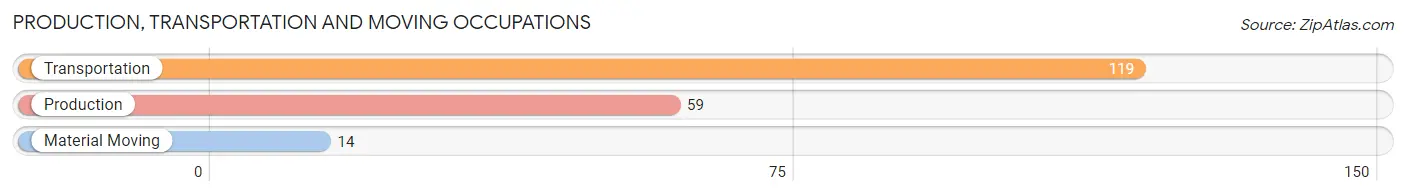
Production, Transportation and Moving Occupations
The most common Production, Transportation and Moving occupations in Nance County are Transportation (119 | 7.2%), Production (59 | 3.5%), and Material Moving (14 | 0.8%).
Production, Transportation and Moving Occupations by Sex
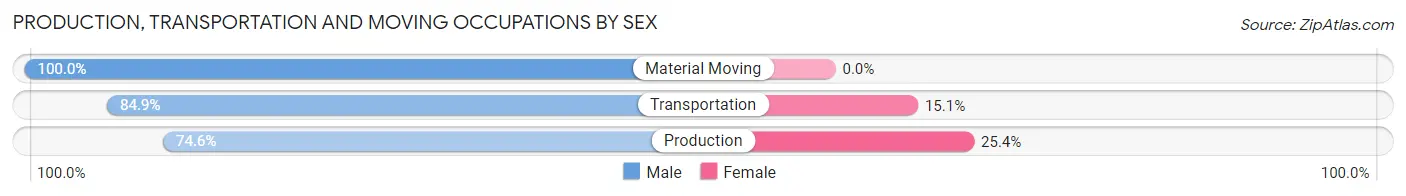
| Occupation | Male | Female |
| Production | 44 (74.6%) | 15 (25.4%) |
| Transportation | 101 (84.9%) | 18 (15.1%) |
| Material Moving | 14 (100.0%) | 0 (0.0%) |
| Total (Category) | 159 (82.8%) | 33 (17.2%) |
| Total (Overall) | 931 (56.1%) | 729 (43.9%) |
Employment Industries by Sex in Nance County
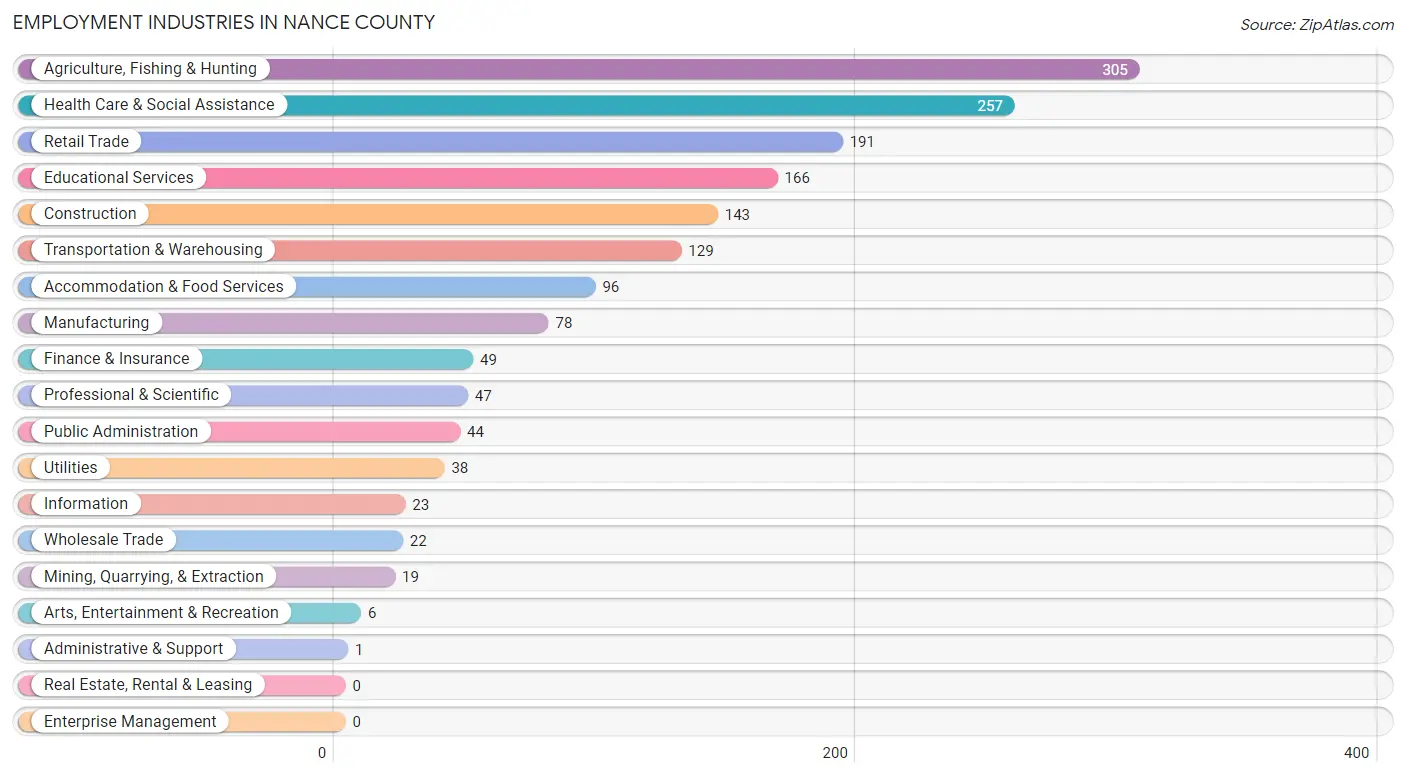
Employment Industries in Nance County
The major employment industries in Nance County include Agriculture, Fishing & Hunting (305 | 18.4%), Health Care & Social Assistance (257 | 15.5%), Retail Trade (191 | 11.5%), Educational Services (166 | 10.0%), and Construction (143 | 8.6%).
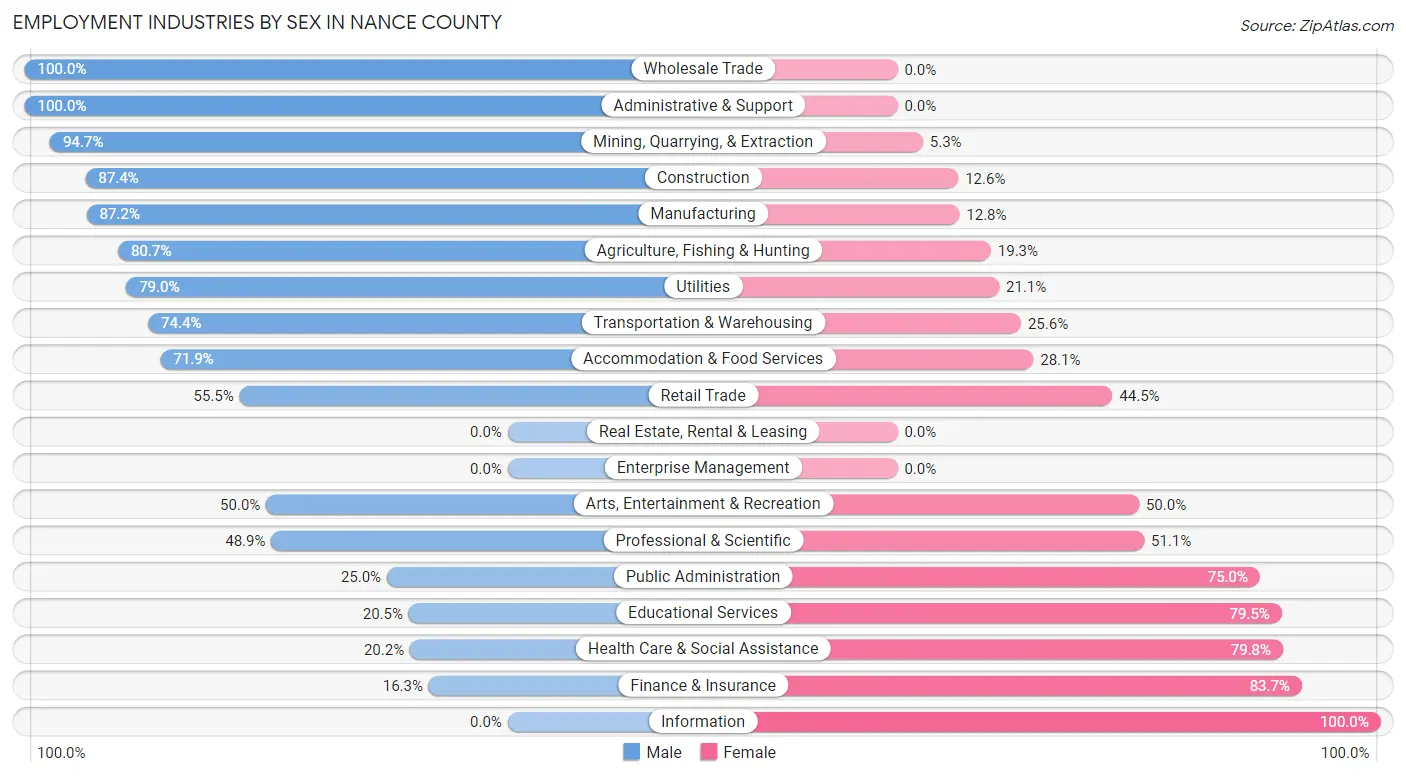
Employment Industries by Sex in Nance County
The Nance County industries that see more men than women are Wholesale Trade (100.0%), Administrative & Support (100.0%), and Mining, Quarrying, & Extraction (94.7%), whereas the industries that tend to have a higher number of women are Information (100.0%), Finance & Insurance (83.7%), and Health Care & Social Assistance (79.8%).
| Industry | Male | Female |
| Agriculture, Fishing & Hunting | 246 (80.7%) | 59 (19.3%) |
| Mining, Quarrying, & Extraction | 18 (94.7%) | 1 (5.3%) |
| Construction | 125 (87.4%) | 18 (12.6%) |
| Manufacturing | 68 (87.2%) | 10 (12.8%) |
| Wholesale Trade | 22 (100.0%) | 0 (0.0%) |
| Retail Trade | 106 (55.5%) | 85 (44.5%) |
| Transportation & Warehousing | 96 (74.4%) | 33 (25.6%) |
| Utilities | 30 (78.9%) | 8 (21.0%) |
| Information | 0 (0.0%) | 23 (100.0%) |
| Finance & Insurance | 8 (16.3%) | 41 (83.7%) |
| Real Estate, Rental & Leasing | 0 (0.0%) | 0 (0.0%) |
| Professional & Scientific | 23 (48.9%) | 24 (51.1%) |
| Enterprise Management | 0 (0.0%) | 0 (0.0%) |
| Administrative & Support | 1 (100.0%) | 0 (0.0%) |
| Educational Services | 34 (20.5%) | 132 (79.5%) |
| Health Care & Social Assistance | 52 (20.2%) | 205 (79.8%) |
| Arts, Entertainment & Recreation | 3 (50.0%) | 3 (50.0%) |
| Accommodation & Food Services | 69 (71.9%) | 27 (28.1%) |
| Public Administration | 11 (25.0%) | 33 (75.0%) |
| Total | 931 (56.1%) | 729 (43.9%) |
Education in Nance County
School Enrollment in Nance County
The most common levels of schooling among the 798 students in Nance County are high school (230 | 28.8%), elementary school (225 | 28.2%), and middle school (169 | 21.2%).
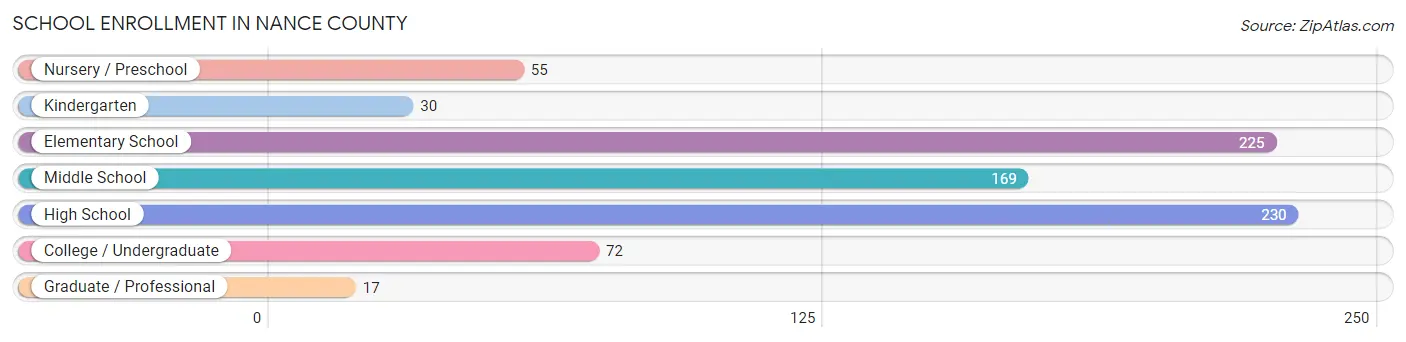
| School Level | # Students | % Students |
| Nursery / Preschool | 55 | 6.9% |
| Kindergarten | 30 | 3.8% |
| Elementary School | 225 | 28.2% |
| Middle School | 169 | 21.2% |
| High School | 230 | 28.8% |
| College / Undergraduate | 72 | 9.0% |
| Graduate / Professional | 17 | 2.1% |
| Total | 798 | 100.0% |
School Enrollment by Age by Funding Source in Nance County
Out of a total of 798 students who are enrolled in schools in Nance County, 66 (8.3%) attend a private institution, while the remaining 732 (91.7%) are enrolled in public schools. The age group of 35 years and over has the highest likelihood of being enrolled in private schools, with 7 (24.1% in the age bracket) enrolled. Conversely, the age group of 18 to 19 year olds has the lowest likelihood of being enrolled in a private school, with 79 (100.0% in the age bracket) attending a public institution.
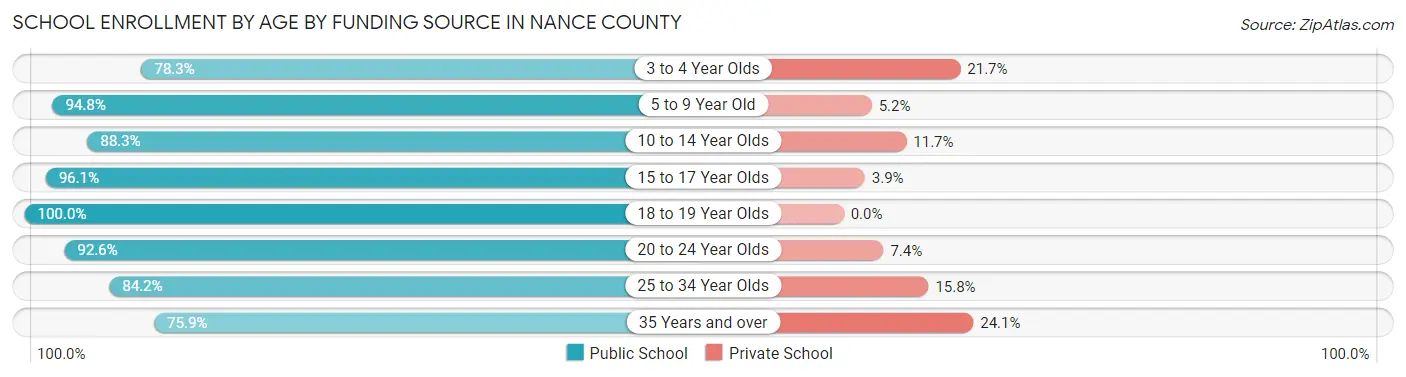
| Age Bracket | Public School | Private School |
| 3 to 4 Year Olds | 36 (78.3%) | 10 (21.7%) |
| 5 to 9 Year Old | 218 (94.8%) | 12 (5.2%) |
| 10 to 14 Year Olds | 189 (88.3%) | 25 (11.7%) |
| 15 to 17 Year Olds | 122 (96.1%) | 5 (3.9%) |
| 18 to 19 Year Olds | 79 (100.0%) | 0 (0.0%) |
| 20 to 24 Year Olds | 50 (92.6%) | 4 (7.4%) |
| 25 to 34 Year Olds | 16 (84.2%) | 3 (15.8%) |
| 35 Years and over | 22 (75.9%) | 7 (24.1%) |
| Total | 732 (91.7%) | 66 (8.3%) |
Educational Attainment by Field of Study in Nance County
Education (115 | 21.9%), bio, nature & agricultural (81 | 15.4%), business (74 | 14.1%), science & technology (66 | 12.6%), and arts & humanities (63 | 12.0%) are the most common fields of study among 526 individuals in Nance County who have obtained a bachelor's degree or higher.
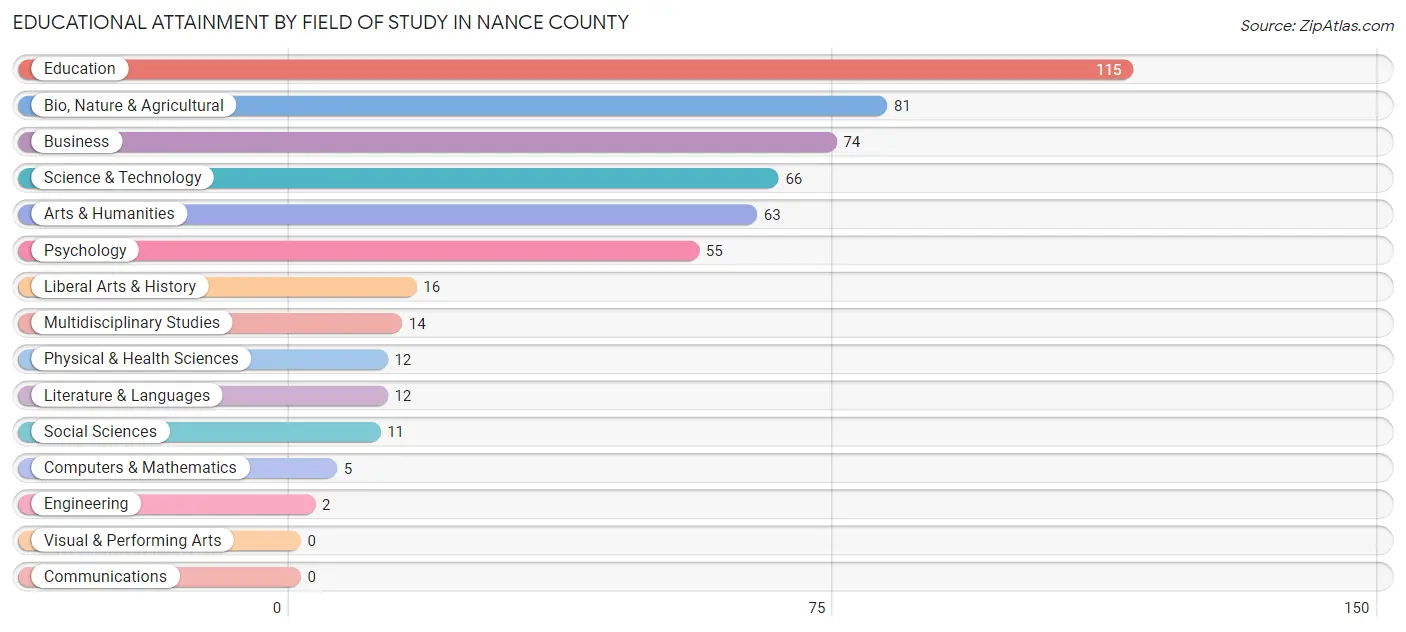
| Field of Study | # Graduates | % Graduates |
| Computers & Mathematics | 5 | 0.9% |
| Bio, Nature & Agricultural | 81 | 15.4% |
| Physical & Health Sciences | 12 | 2.3% |
| Psychology | 55 | 10.5% |
| Social Sciences | 11 | 2.1% |
| Engineering | 2 | 0.4% |
| Multidisciplinary Studies | 14 | 2.7% |
| Science & Technology | 66 | 12.6% |
| Business | 74 | 14.1% |
| Education | 115 | 21.9% |
| Literature & Languages | 12 | 2.3% |
| Liberal Arts & History | 16 | 3.0% |
| Visual & Performing Arts | 0 | 0.0% |
| Communications | 0 | 0.0% |
| Arts & Humanities | 63 | 12.0% |
| Total | 526 | 100.0% |
Transportation & Commute in Nance County
Vehicle Availability by Sex in Nance County
The most prevalent vehicle ownership categories in Nance County are males with 2 vehicles (303, accounting for 33.8%) and females with 2 vehicles (199, making up 43.5%).
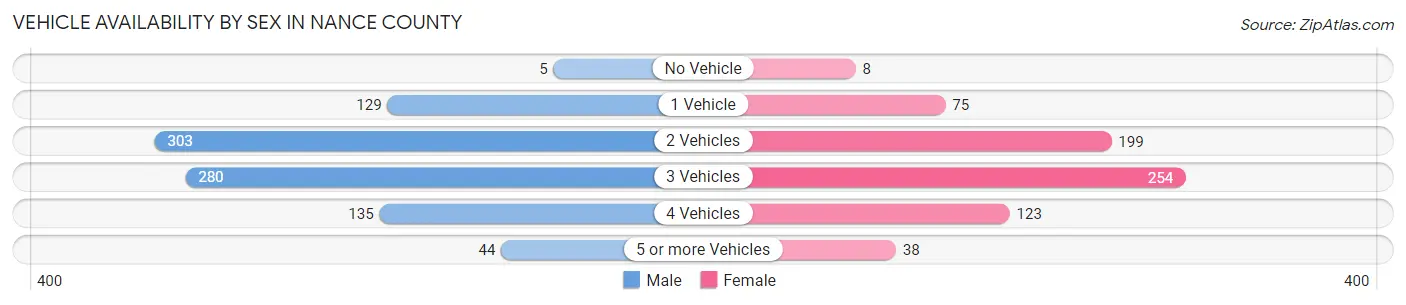
| Vehicles Available | Male | Female |
| No Vehicle | 5 (0.6%) | 8 (1.1%) |
| 1 Vehicle | 129 (14.4%) | 75 (10.8%) |
| 2 Vehicles | 303 (33.8%) | 199 (28.5%) |
| 3 Vehicles | 280 (31.2%) | 254 (36.4%) |
| 4 Vehicles | 135 (15.1%) | 123 (17.6%) |
| 5 or more Vehicles | 44 (4.9%) | 38 (5.4%) |
| Total | 896 (100.0%) | 697 (100.0%) |
Commute Time in Nance County
The most frequently occuring commute durations in Nance County are 5 to 9 minutes (272 commuters, 19.5%), less than 5 minutes (179 commuters, 12.9%), and 30 to 34 minutes (157 commuters, 11.3%).
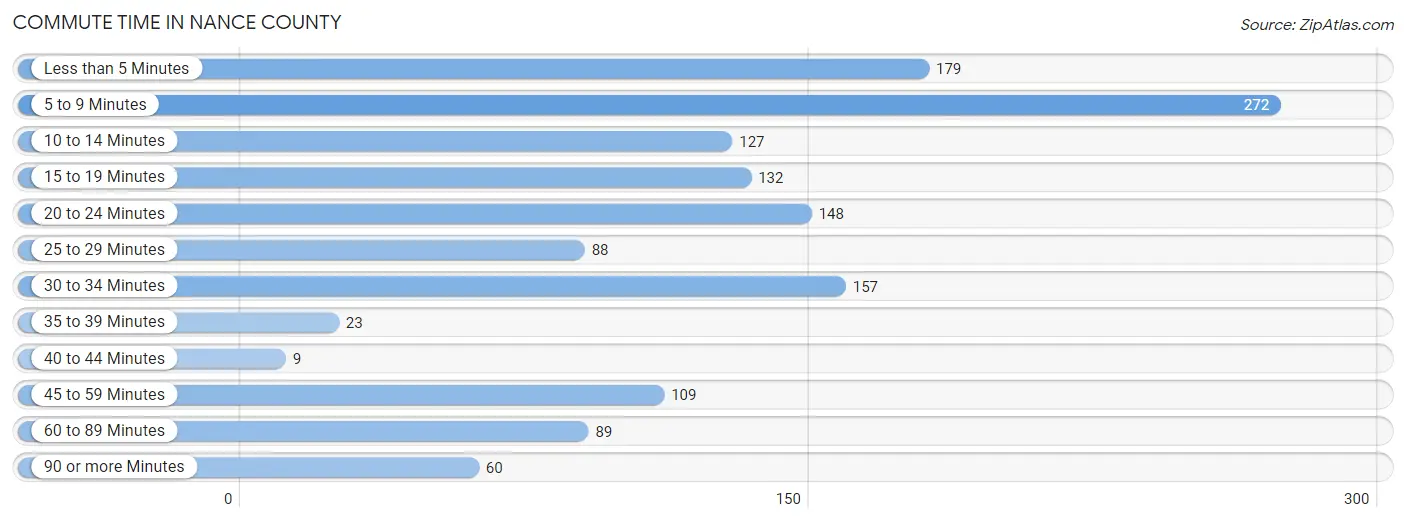
| Commute Time | # Commuters | % Commuters |
| Less than 5 Minutes | 179 | 12.9% |
| 5 to 9 Minutes | 272 | 19.5% |
| 10 to 14 Minutes | 127 | 9.1% |
| 15 to 19 Minutes | 132 | 9.5% |
| 20 to 24 Minutes | 148 | 10.6% |
| 25 to 29 Minutes | 88 | 6.3% |
| 30 to 34 Minutes | 157 | 11.3% |
| 35 to 39 Minutes | 23 | 1.7% |
| 40 to 44 Minutes | 9 | 0.6% |
| 45 to 59 Minutes | 109 | 7.8% |
| 60 to 89 Minutes | 89 | 6.4% |
| 90 or more Minutes | 60 | 4.3% |
Commute Time by Sex in Nance County
The most common commute times in Nance County are 5 to 9 minutes (117 commuters, 15.2%) for males and 5 to 9 minutes (155 commuters, 24.9%) for females.
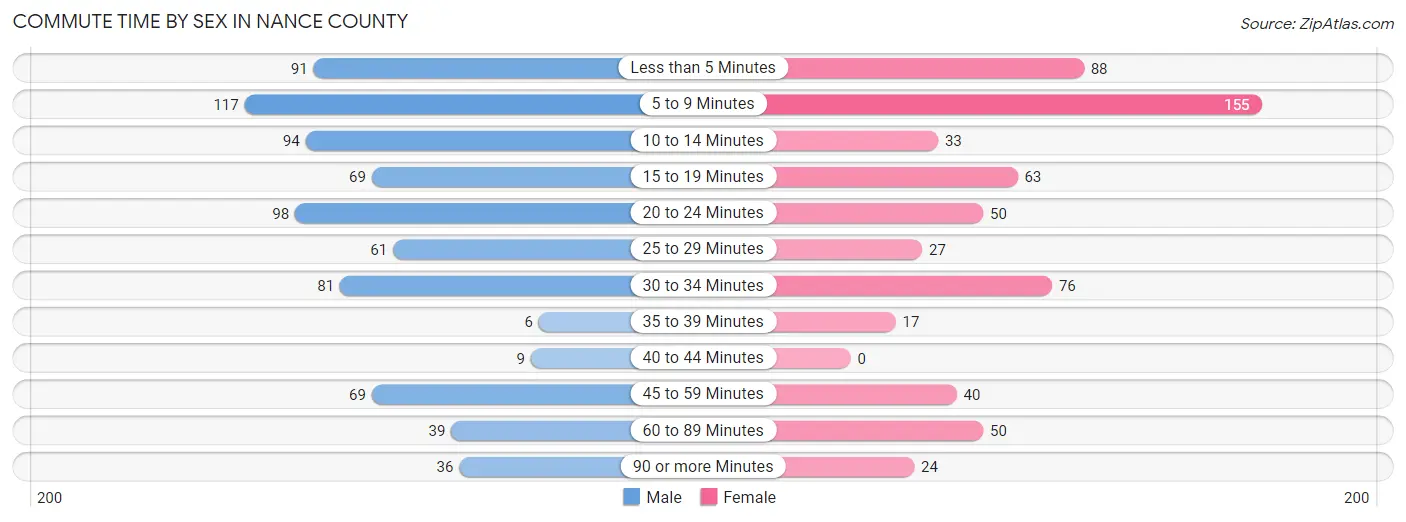
| Commute Time | Male | Female |
| Less than 5 Minutes | 91 (11.8%) | 88 (14.1%) |
| 5 to 9 Minutes | 117 (15.2%) | 155 (24.9%) |
| 10 to 14 Minutes | 94 (12.2%) | 33 (5.3%) |
| 15 to 19 Minutes | 69 (9.0%) | 63 (10.1%) |
| 20 to 24 Minutes | 98 (12.7%) | 50 (8.0%) |
| 25 to 29 Minutes | 61 (7.9%) | 27 (4.3%) |
| 30 to 34 Minutes | 81 (10.5%) | 76 (12.2%) |
| 35 to 39 Minutes | 6 (0.8%) | 17 (2.7%) |
| 40 to 44 Minutes | 9 (1.2%) | 0 (0.0%) |
| 45 to 59 Minutes | 69 (9.0%) | 40 (6.4%) |
| 60 to 89 Minutes | 39 (5.1%) | 50 (8.0%) |
| 90 or more Minutes | 36 (4.7%) | 24 (3.8%) |
Time of Departure to Work by Sex in Nance County
The most frequent times of departure to work in Nance County are 7:00 AM to 7:29 AM (125, 16.2%) for males and 7:00 AM to 7:29 AM (114, 18.3%) for females.
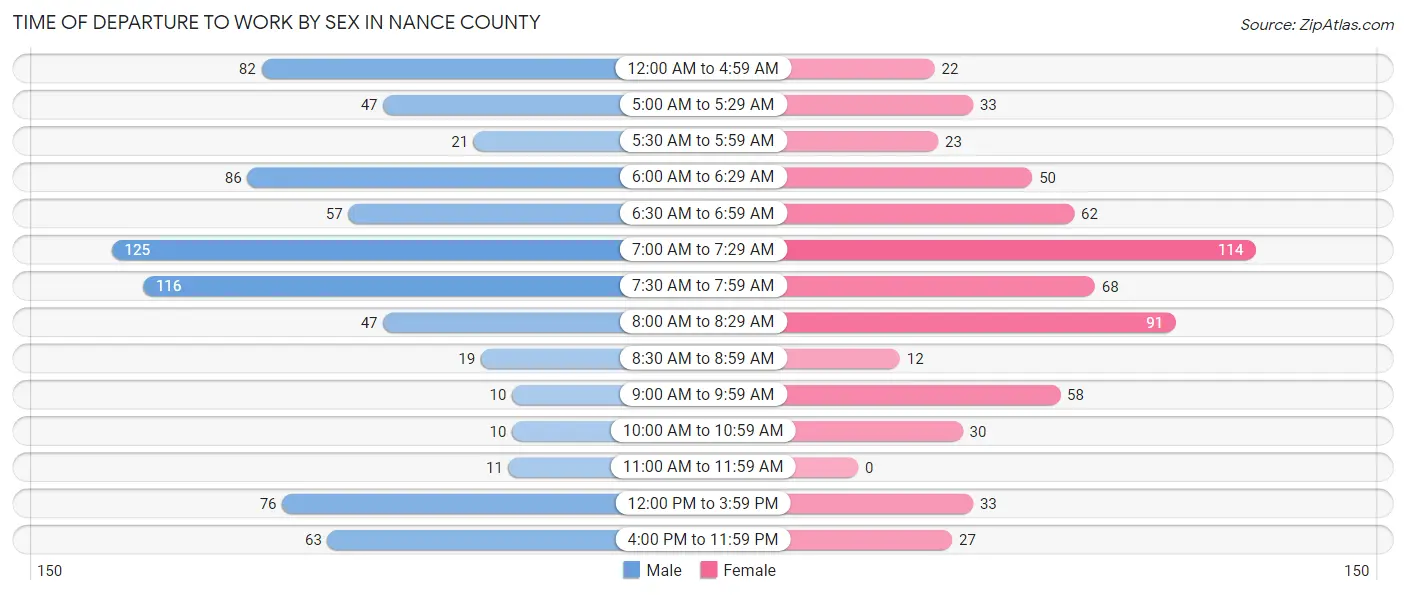
| Time of Departure | Male | Female |
| 12:00 AM to 4:59 AM | 82 (10.6%) | 22 (3.5%) |
| 5:00 AM to 5:29 AM | 47 (6.1%) | 33 (5.3%) |
| 5:30 AM to 5:59 AM | 21 (2.7%) | 23 (3.7%) |
| 6:00 AM to 6:29 AM | 86 (11.2%) | 50 (8.0%) |
| 6:30 AM to 6:59 AM | 57 (7.4%) | 62 (10.0%) |
| 7:00 AM to 7:29 AM | 125 (16.2%) | 114 (18.3%) |
| 7:30 AM to 7:59 AM | 116 (15.1%) | 68 (10.9%) |
| 8:00 AM to 8:29 AM | 47 (6.1%) | 91 (14.6%) |
| 8:30 AM to 8:59 AM | 19 (2.5%) | 12 (1.9%) |
| 9:00 AM to 9:59 AM | 10 (1.3%) | 58 (9.3%) |
| 10:00 AM to 10:59 AM | 10 (1.3%) | 30 (4.8%) |
| 11:00 AM to 11:59 AM | 11 (1.4%) | 0 (0.0%) |
| 12:00 PM to 3:59 PM | 76 (9.9%) | 33 (5.3%) |
| 4:00 PM to 11:59 PM | 63 (8.2%) | 27 (4.3%) |
| Total | 770 (100.0%) | 623 (100.0%) |
Housing Occupancy in Nance County
Occupancy by Ownership in Nance County
Of the total 1,307 dwellings in Nance County, owner-occupied units account for 1,081 (82.7%), while renter-occupied units make up 226 (17.3%).
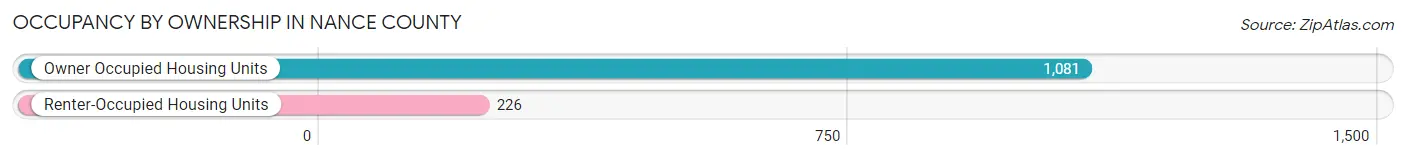
| Occupancy | # Housing Units | % Housing Units |
| Owner Occupied Housing Units | 1,081 | 82.7% |
| Renter-Occupied Housing Units | 226 | 17.3% |
| Total Occupied Housing Units | 1,307 | 100.0% |
Occupancy by Household Size in Nance County
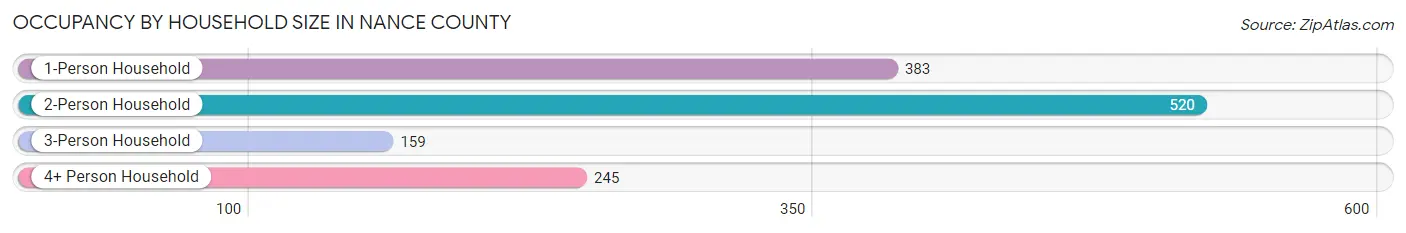
| Household Size | # Housing Units | % Housing Units |
| 1-Person Household | 383 | 29.3% |
| 2-Person Household | 520 | 39.8% |
| 3-Person Household | 159 | 12.2% |
| 4+ Person Household | 245 | 18.8% |
| Total Housing Units | 1,307 | 100.0% |
Occupancy by Ownership by Household Size in Nance County
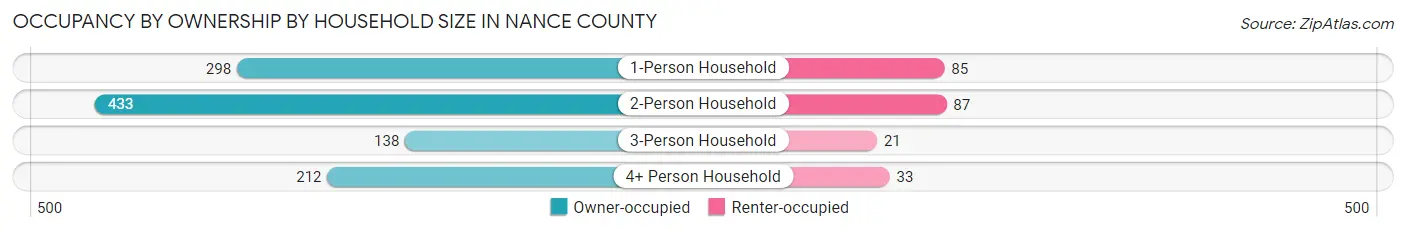
| Household Size | Owner-occupied | Renter-occupied |
| 1-Person Household | 298 (77.8%) | 85 (22.2%) |
| 2-Person Household | 433 (83.3%) | 87 (16.7%) |
| 3-Person Household | 138 (86.8%) | 21 (13.2%) |
| 4+ Person Household | 212 (86.5%) | 33 (13.5%) |
| Total Housing Units | 1,081 (82.7%) | 226 (17.3%) |
Occupancy by Educational Attainment in Nance County
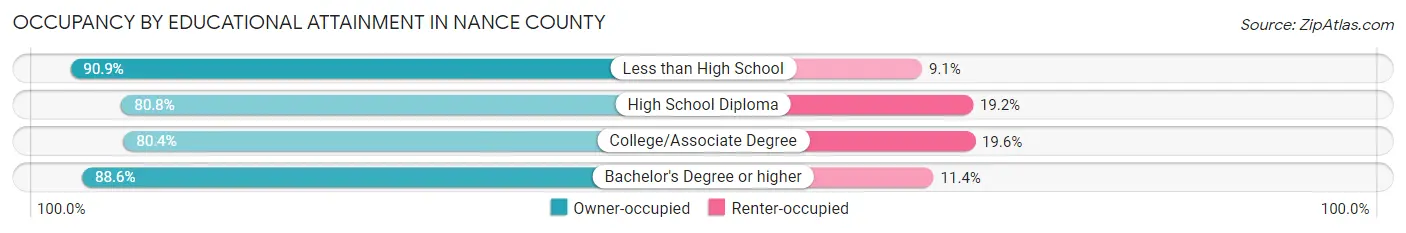
| Household Size | Owner-occupied | Renter-occupied |
| Less than High School | 50 (90.9%) | 5 (9.1%) |
| High School Diploma | 400 (80.8%) | 95 (19.2%) |
| College/Associate Degree | 390 (80.4%) | 95 (19.6%) |
| Bachelor's Degree or higher | 241 (88.6%) | 31 (11.4%) |
Occupancy by Age of Householder in Nance County
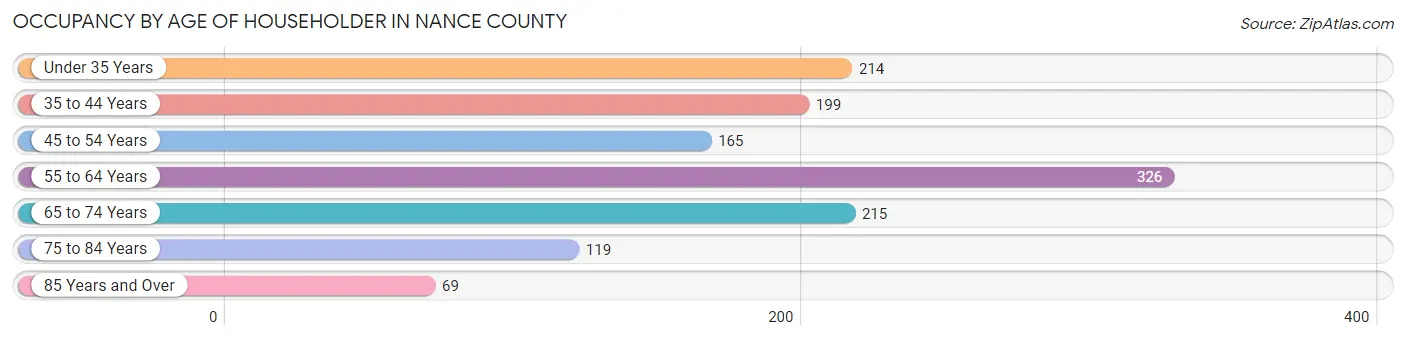
| Age Bracket | # Households | % Households |
| Under 35 Years | 214 | 16.4% |
| 35 to 44 Years | 199 | 15.2% |
| 45 to 54 Years | 165 | 12.6% |
| 55 to 64 Years | 326 | 24.9% |
| 65 to 74 Years | 215 | 16.5% |
| 75 to 84 Years | 119 | 9.1% |
| 85 Years and Over | 69 | 5.3% |
| Total | 1,307 | 100.0% |
Housing Finances in Nance County
Median Income by Occupancy in Nance County
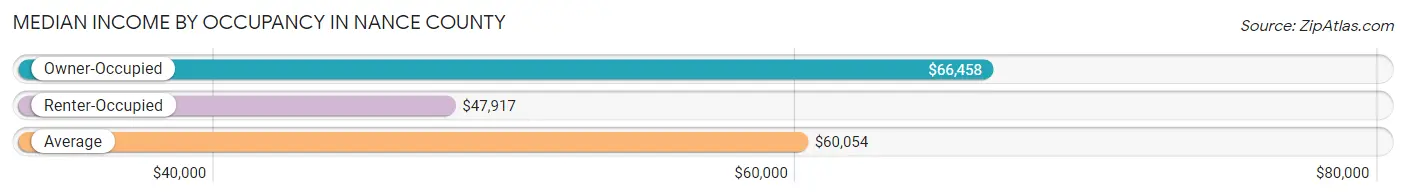
| Occupancy Type | # Households | Median Income |
| Owner-Occupied | 1,081 (82.7%) | $66,458 |
| Renter-Occupied | 226 (17.3%) | $47,917 |
| Average | 1,307 (100.0%) | $60,054 |
Occupancy by Householder Income Bracket in Nance County
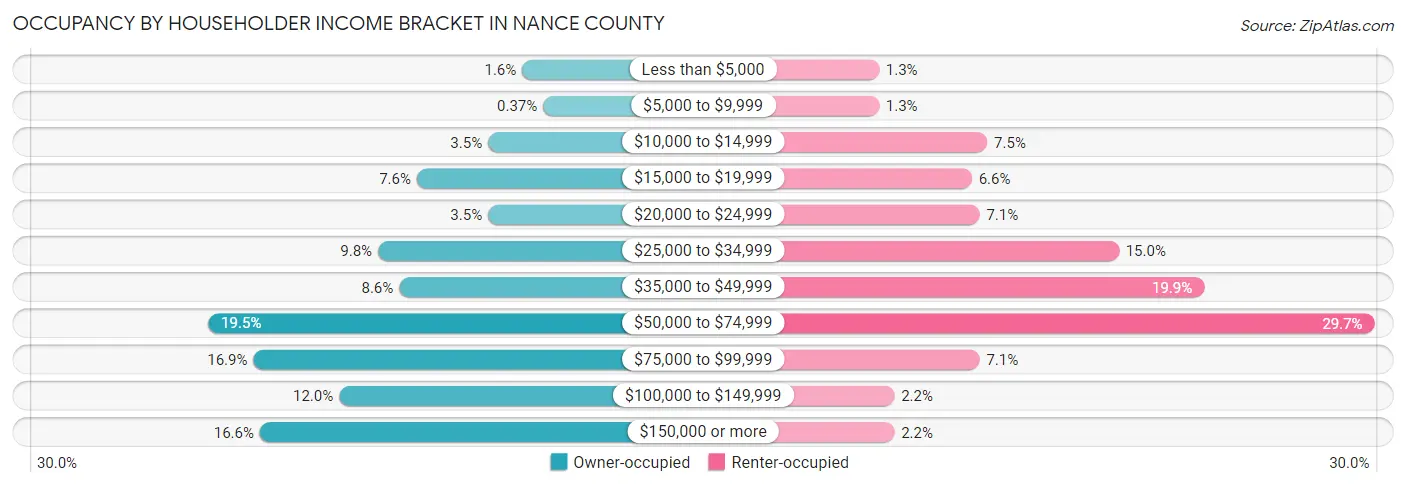
| Income Bracket | Owner-occupied | Renter-occupied |
| Less than $5,000 | 17 (1.6%) | 3 (1.3%) |
| $5,000 to $9,999 | 4 (0.4%) | 3 (1.3%) |
| $10,000 to $14,999 | 38 (3.5%) | 17 (7.5%) |
| $15,000 to $19,999 | 82 (7.6%) | 15 (6.6%) |
| $20,000 to $24,999 | 38 (3.5%) | 16 (7.1%) |
| $25,000 to $34,999 | 106 (9.8%) | 34 (15.0%) |
| $35,000 to $49,999 | 93 (8.6%) | 45 (19.9%) |
| $50,000 to $74,999 | 211 (19.5%) | 67 (29.6%) |
| $75,000 to $99,999 | 183 (16.9%) | 16 (7.1%) |
| $100,000 to $149,999 | 130 (12.0%) | 5 (2.2%) |
| $150,000 or more | 179 (16.6%) | 5 (2.2%) |
| Total | 1,081 (100.0%) | 226 (100.0%) |
Monthly Housing Cost Tiers in Nance County
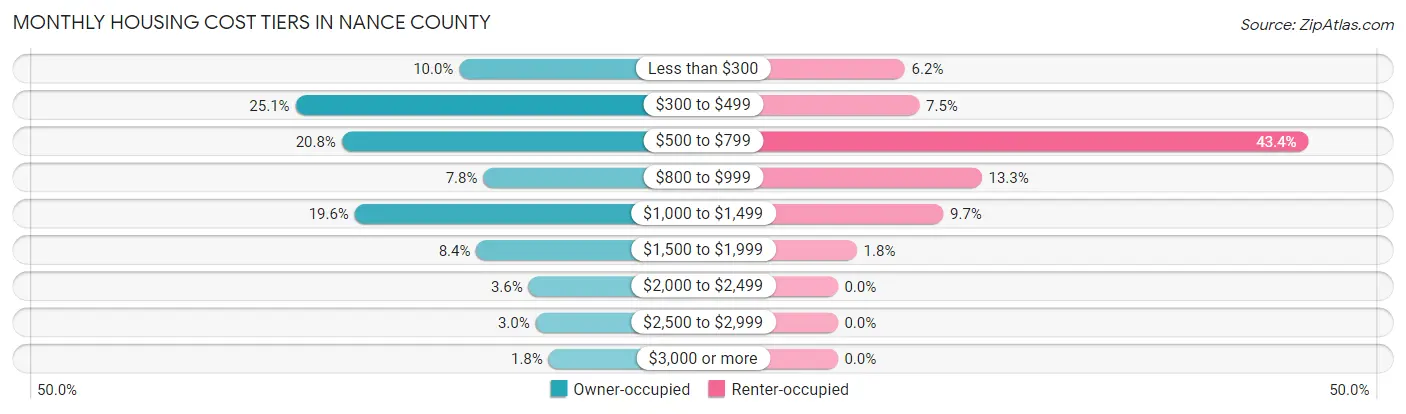
| Monthly Cost | Owner-occupied | Renter-occupied |
| Less than $300 | 108 (10.0%) | 14 (6.2%) |
| $300 to $499 | 271 (25.1%) | 17 (7.5%) |
| $500 to $799 | 225 (20.8%) | 98 (43.4%) |
| $800 to $999 | 84 (7.8%) | 30 (13.3%) |
| $1,000 to $1,499 | 212 (19.6%) | 22 (9.7%) |
| $1,500 to $1,999 | 91 (8.4%) | 4 (1.8%) |
| $2,000 to $2,499 | 39 (3.6%) | 0 (0.0%) |
| $2,500 to $2,999 | 32 (3.0%) | 0 (0.0%) |
| $3,000 or more | 19 (1.8%) | 0 (0.0%) |
| Total | 1,081 (100.0%) | 226 (100.0%) |
Physical Housing Characteristics in Nance County
Housing Structures in Nance County
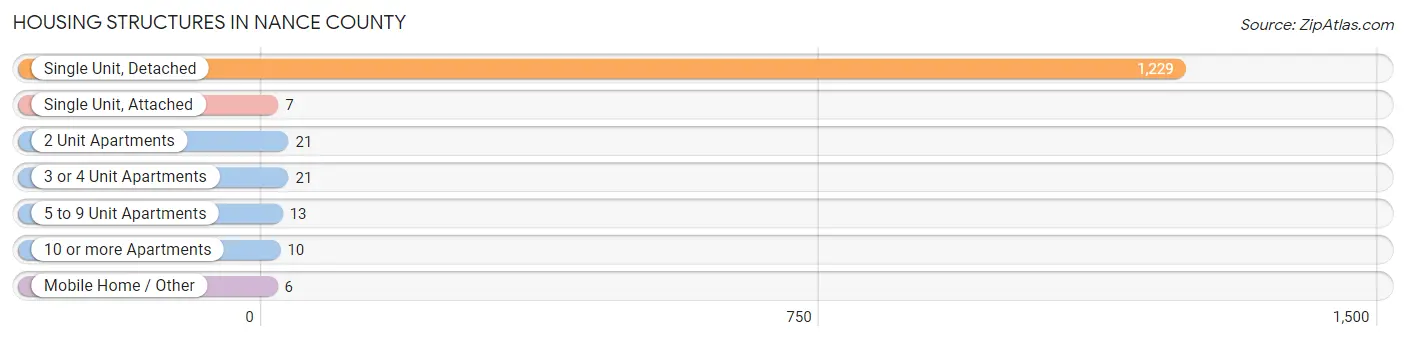
| Structure Type | # Housing Units | % Housing Units |
| Single Unit, Detached | 1,229 | 94.0% |
| Single Unit, Attached | 7 | 0.5% |
| 2 Unit Apartments | 21 | 1.6% |
| 3 or 4 Unit Apartments | 21 | 1.6% |
| 5 to 9 Unit Apartments | 13 | 1.0% |
| 10 or more Apartments | 10 | 0.8% |
| Mobile Home / Other | 6 | 0.5% |
| Total | 1,307 | 100.0% |
Housing Structures by Occupancy in Nance County
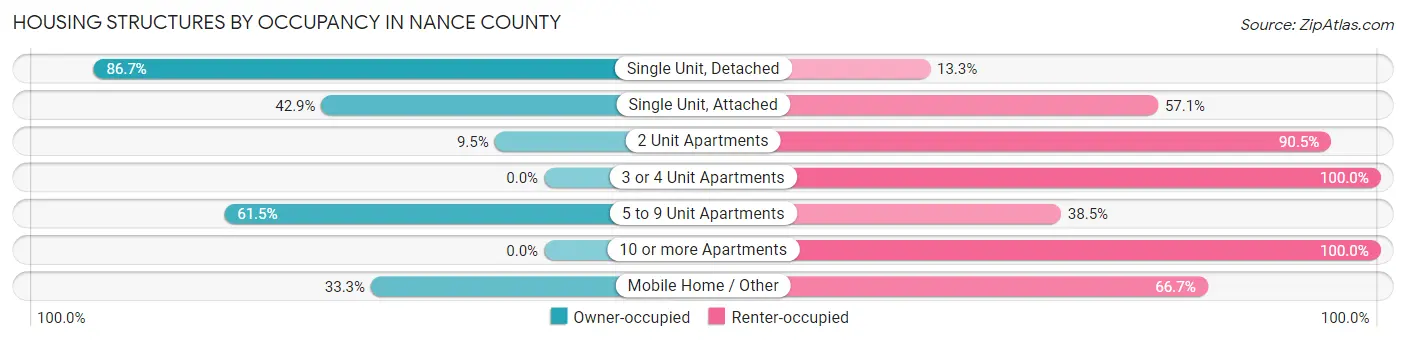
| Structure Type | Owner-occupied | Renter-occupied |
| Single Unit, Detached | 1,066 (86.7%) | 163 (13.3%) |
| Single Unit, Attached | 3 (42.9%) | 4 (57.1%) |
| 2 Unit Apartments | 2 (9.5%) | 19 (90.5%) |
| 3 or 4 Unit Apartments | 0 (0.0%) | 21 (100.0%) |
| 5 to 9 Unit Apartments | 8 (61.5%) | 5 (38.5%) |
| 10 or more Apartments | 0 (0.0%) | 10 (100.0%) |
| Mobile Home / Other | 2 (33.3%) | 4 (66.7%) |
| Total | 1,081 (82.7%) | 226 (17.3%) |
Housing Structures by Number of Rooms in Nance County
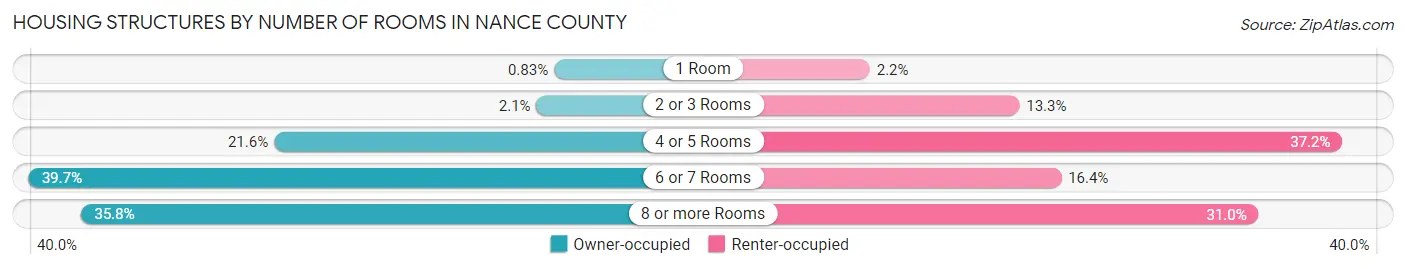
| Number of Rooms | Owner-occupied | Renter-occupied |
| 1 Room | 9 (0.8%) | 5 (2.2%) |
| 2 or 3 Rooms | 23 (2.1%) | 30 (13.3%) |
| 4 or 5 Rooms | 233 (21.5%) | 84 (37.2%) |
| 6 or 7 Rooms | 429 (39.7%) | 37 (16.4%) |
| 8 or more Rooms | 387 (35.8%) | 70 (31.0%) |
| Total | 1,081 (100.0%) | 226 (100.0%) |
Housing Structure by Heating Type in Nance County
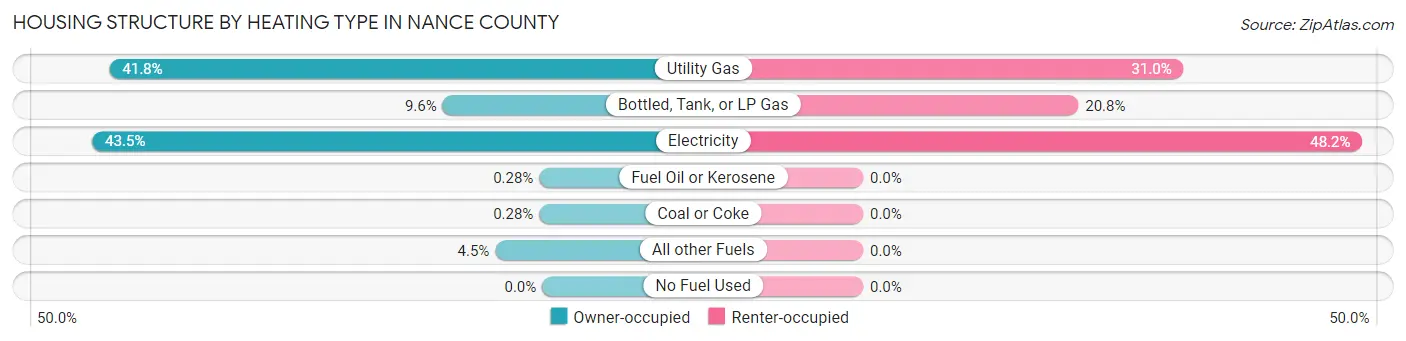
| Heating Type | Owner-occupied | Renter-occupied |
| Utility Gas | 452 (41.8%) | 70 (31.0%) |
| Bottled, Tank, or LP Gas | 104 (9.6%) | 47 (20.8%) |
| Electricity | 470 (43.5%) | 109 (48.2%) |
| Fuel Oil or Kerosene | 3 (0.3%) | 0 (0.0%) |
| Coal or Coke | 3 (0.3%) | 0 (0.0%) |
| All other Fuels | 49 (4.5%) | 0 (0.0%) |
| No Fuel Used | 0 (0.0%) | 0 (0.0%) |
| Total | 1,081 (100.0%) | 226 (100.0%) |
Household Vehicle Usage in Nance County
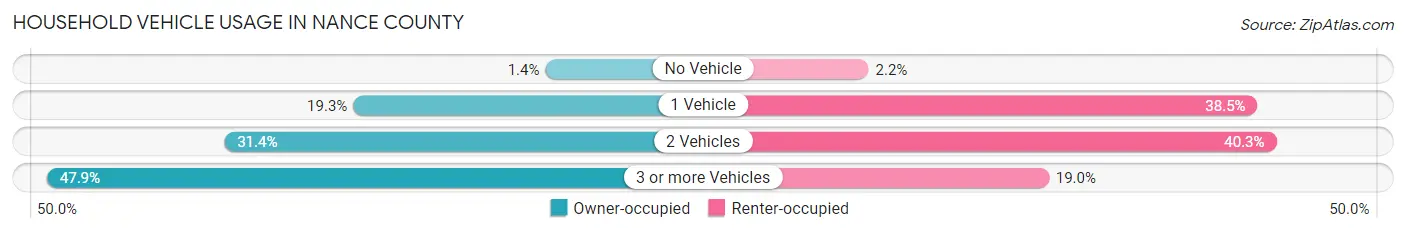
| Vehicles per Household | Owner-occupied | Renter-occupied |
| No Vehicle | 15 (1.4%) | 5 (2.2%) |
| 1 Vehicle | 209 (19.3%) | 87 (38.5%) |
| 2 Vehicles | 339 (31.4%) | 91 (40.3%) |
| 3 or more Vehicles | 518 (47.9%) | 43 (19.0%) |
| Total | 1,081 (100.0%) | 226 (100.0%) |
Real Estate & Mortgages in Nance County
Real Estate and Mortgage Overview in Nance County
| Characteristic | Without Mortgage | With Mortgage |
| Housing Units | 606 | 475 |
| Median Property Value | $77,900 | $167,100 |
| Median Household Income | $53,854 | $88 |
| Monthly Housing Costs | $428 | $19 |
| Real Estate Taxes | $938 | $18 |
Property Value by Mortgage Status in Nance County
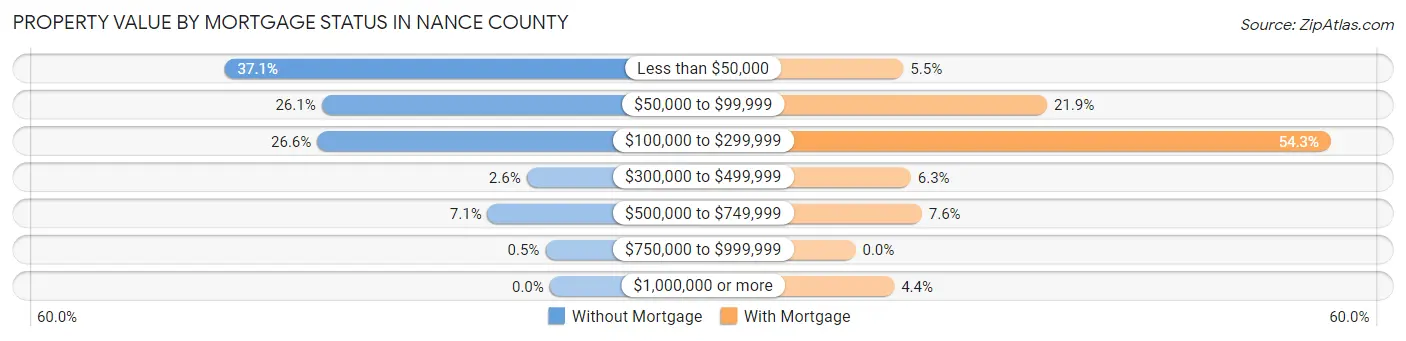
| Property Value | Without Mortgage | With Mortgage |
| Less than $50,000 | 225 (37.1%) | 26 (5.5%) |
| $50,000 to $99,999 | 158 (26.1%) | 104 (21.9%) |
| $100,000 to $299,999 | 161 (26.6%) | 258 (54.3%) |
| $300,000 to $499,999 | 16 (2.6%) | 30 (6.3%) |
| $500,000 to $749,999 | 43 (7.1%) | 36 (7.6%) |
| $750,000 to $999,999 | 3 (0.5%) | 0 (0.0%) |
| $1,000,000 or more | 0 (0.0%) | 21 (4.4%) |
| Total | 606 (100.0%) | 475 (100.0%) |
Household Income by Mortgage Status in Nance County
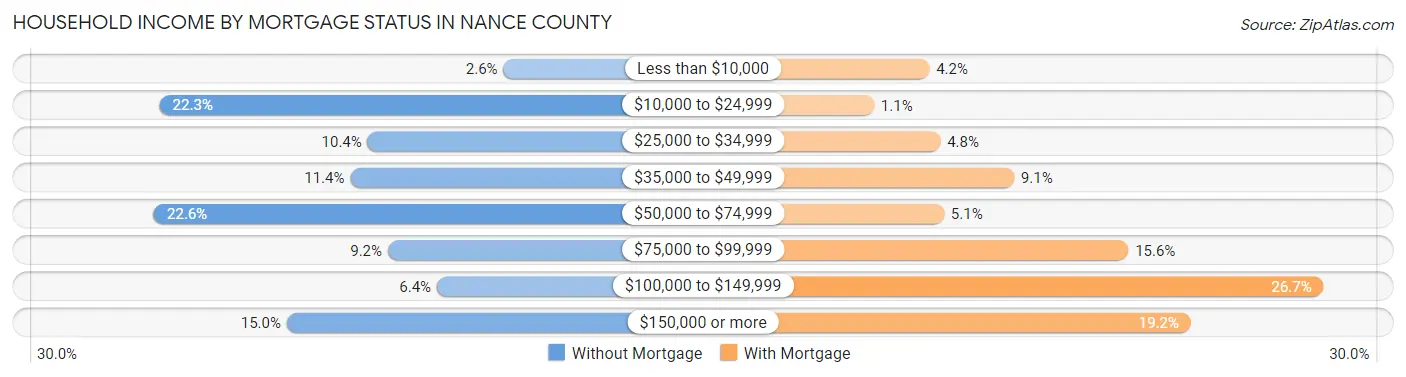
| Household Income | Without Mortgage | With Mortgage |
| Less than $10,000 | 16 (2.6%) | 20 (4.2%) |
| $10,000 to $24,999 | 135 (22.3%) | 5 (1.1%) |
| $25,000 to $34,999 | 63 (10.4%) | 23 (4.8%) |
| $35,000 to $49,999 | 69 (11.4%) | 43 (9.0%) |
| $50,000 to $74,999 | 137 (22.6%) | 24 (5.1%) |
| $75,000 to $99,999 | 56 (9.2%) | 74 (15.6%) |
| $100,000 to $149,999 | 39 (6.4%) | 127 (26.7%) |
| $150,000 or more | 91 (15.0%) | 91 (19.2%) |
| Total | 606 (100.0%) | 475 (100.0%) |
Property Value to Household Income Ratio in Nance County
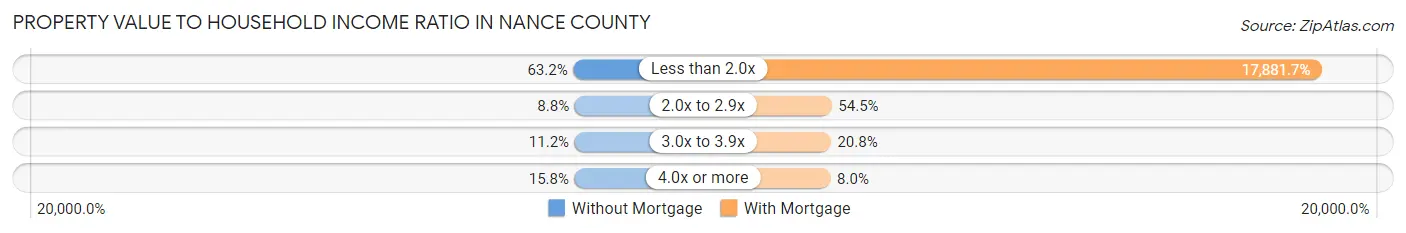
| Value-to-Income Ratio | Without Mortgage | With Mortgage |
| Less than 2.0x | 383 (63.2%) | 84,938 (17,881.7%) |
| 2.0x to 2.9x | 53 (8.7%) | 259 (54.5%) |
| 3.0x to 3.9x | 68 (11.2%) | 99 (20.8%) |
| 4.0x or more | 96 (15.8%) | 38 (8.0%) |
| Total | 606 (100.0%) | 475 (100.0%) |
Real Estate Taxes by Mortgage Status in Nance County
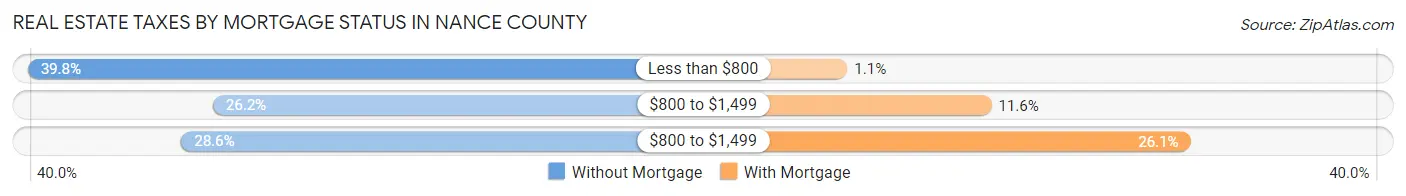
| Property Taxes | Without Mortgage | With Mortgage |
| Less than $800 | 241 (39.8%) | 5 (1.1%) |
| $800 to $1,499 | 159 (26.2%) | 55 (11.6%) |
| $800 to $1,499 | 173 (28.5%) | 124 (26.1%) |
| Total | 606 (100.0%) | 475 (100.0%) |
Health & Disability in Nance County
Health Insurance Coverage by Age in Nance County
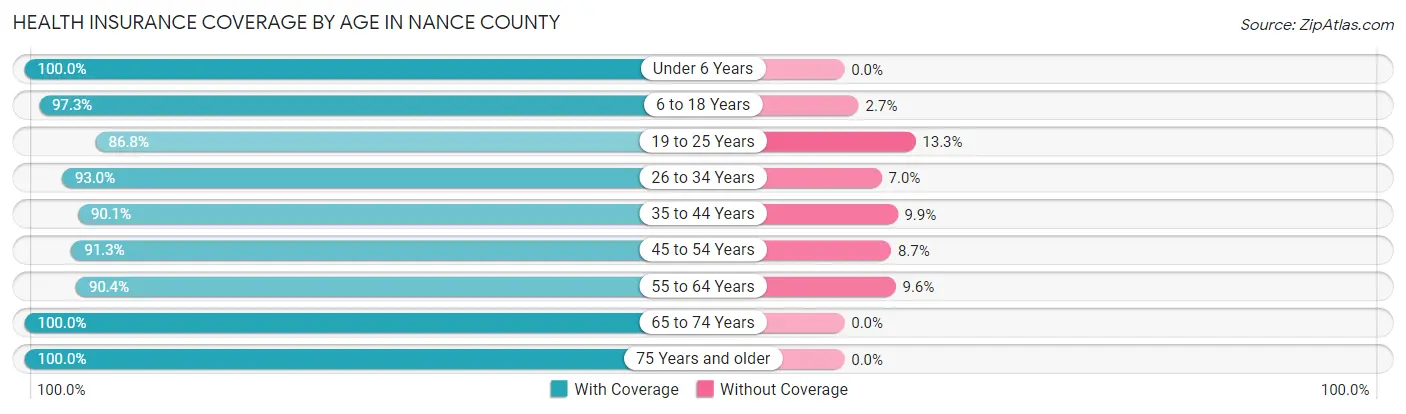
| Age Bracket | With Coverage | Without Coverage |
| Under 6 Years | 186 (100.0%) | 0 (0.0%) |
| 6 to 18 Years | 582 (97.3%) | 16 (2.7%) |
| 19 to 25 Years | 216 (86.8%) | 33 (13.3%) |
| 26 to 34 Years | 294 (93.0%) | 22 (7.0%) |
| 35 to 44 Years | 345 (90.1%) | 38 (9.9%) |
| 45 to 54 Years | 304 (91.3%) | 29 (8.7%) |
| 55 to 64 Years | 511 (90.4%) | 54 (9.6%) |
| 65 to 74 Years | 390 (100.0%) | 0 (0.0%) |
| 75 Years and older | 268 (100.0%) | 0 (0.0%) |
| Total | 3,096 (94.2%) | 192 (5.8%) |
Health Insurance Coverage by Citizenship Status in Nance County
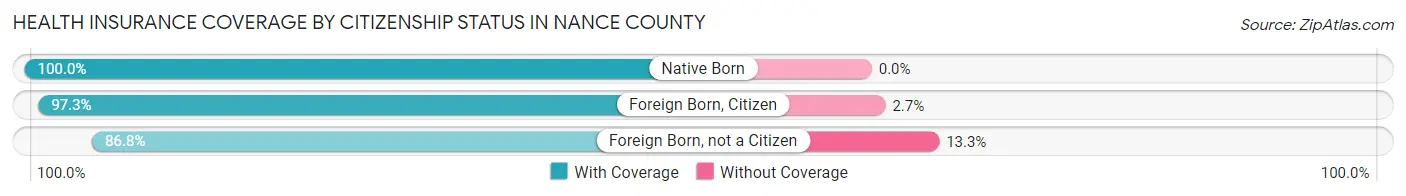
| Citizenship Status | With Coverage | Without Coverage |
| Native Born | 186 (100.0%) | 0 (0.0%) |
| Foreign Born, Citizen | 582 (97.3%) | 16 (2.7%) |
| Foreign Born, not a Citizen | 216 (86.8%) | 33 (13.3%) |
Health Insurance Coverage by Household Income in Nance County
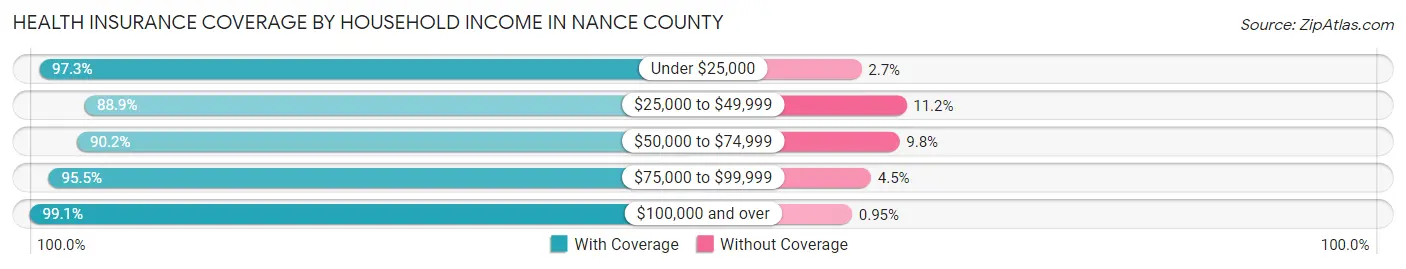
| Household Income | With Coverage | Without Coverage |
| Under $25,000 | 322 (97.3%) | 9 (2.7%) |
| $25,000 to $49,999 | 574 (88.8%) | 72 (11.2%) |
| $50,000 to $74,999 | 632 (90.2%) | 69 (9.8%) |
| $75,000 to $99,999 | 487 (95.5%) | 23 (4.5%) |
| $100,000 and over | 1,038 (99.1%) | 10 (0.9%) |
Public vs Private Health Insurance Coverage by Age in Nance County
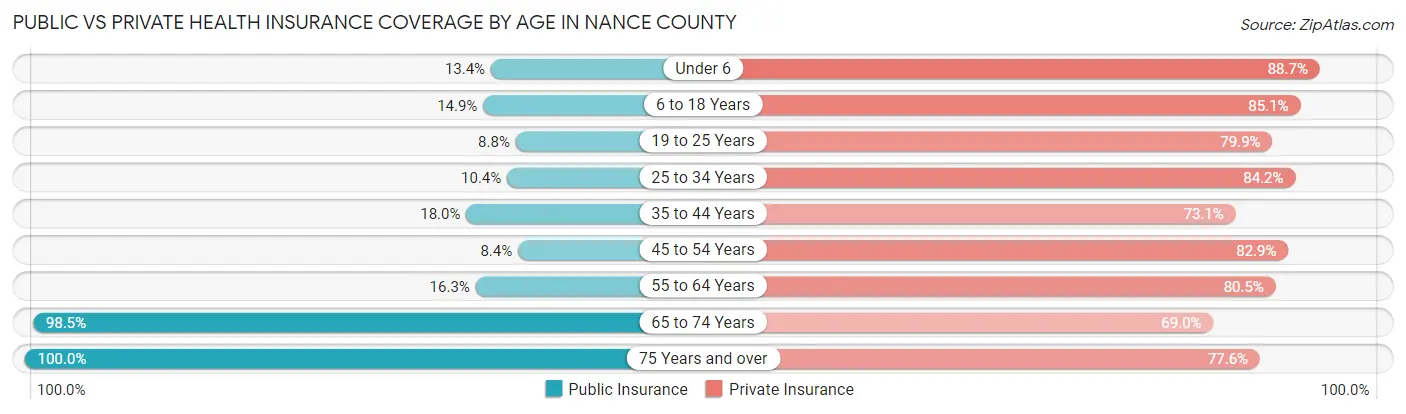
| Age Bracket | Public Insurance | Private Insurance |
| Under 6 | 25 (13.4%) | 165 (88.7%) |
| 6 to 18 Years | 89 (14.9%) | 509 (85.1%) |
| 19 to 25 Years | 22 (8.8%) | 199 (79.9%) |
| 25 to 34 Years | 33 (10.4%) | 266 (84.2%) |
| 35 to 44 Years | 69 (18.0%) | 280 (73.1%) |
| 45 to 54 Years | 28 (8.4%) | 276 (82.9%) |
| 55 to 64 Years | 92 (16.3%) | 455 (80.5%) |
| 65 to 74 Years | 384 (98.5%) | 269 (69.0%) |
| 75 Years and over | 268 (100.0%) | 208 (77.6%) |
| Total | 1,010 (30.7%) | 2,627 (79.9%) |
Disability Status by Sex by Age in Nance County
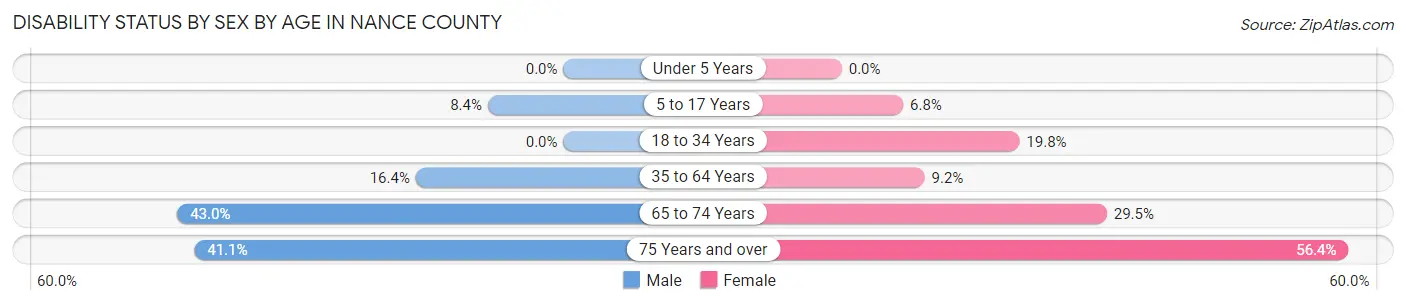
| Age Bracket | Male | Female |
| Under 5 Years | 0 (0.0%) | 0 (0.0%) |
| 5 to 17 Years | 26 (8.4%) | 19 (6.8%) |
| 18 to 34 Years | 0 (0.0%) | 53 (19.8%) |
| 35 to 64 Years | 109 (16.4%) | 57 (9.2%) |
| 65 to 74 Years | 89 (43.0%) | 54 (29.5%) |
| 75 Years and over | 30 (41.1%) | 110 (56.4%) |
Disability Class by Sex by Age in Nance County
Disability Class: Hearing Difficulty
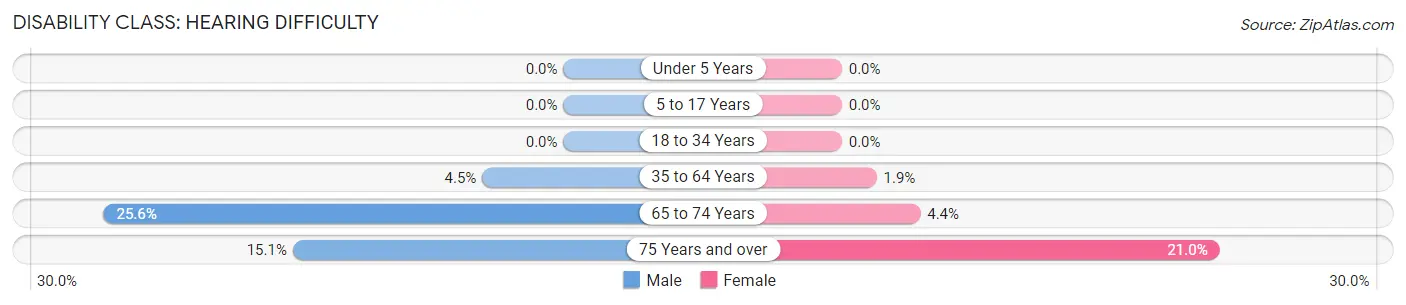
| Age Bracket | Male | Female |
| Under 5 Years | 0 (0.0%) | 0 (0.0%) |
| 5 to 17 Years | 0 (0.0%) | 0 (0.0%) |
| 18 to 34 Years | 0 (0.0%) | 0 (0.0%) |
| 35 to 64 Years | 30 (4.5%) | 12 (1.9%) |
| 65 to 74 Years | 53 (25.6%) | 8 (4.4%) |
| 75 Years and over | 11 (15.1%) | 41 (21.0%) |
Disability Class: Vision Difficulty
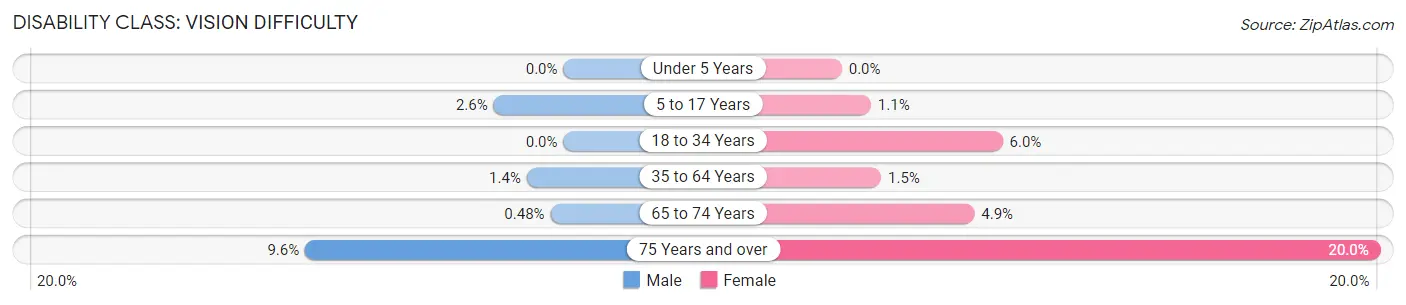
| Age Bracket | Male | Female |
| Under 5 Years | 0 (0.0%) | 0 (0.0%) |
| 5 to 17 Years | 8 (2.6%) | 3 (1.1%) |
| 18 to 34 Years | 0 (0.0%) | 16 (6.0%) |
| 35 to 64 Years | 9 (1.4%) | 9 (1.5%) |
| 65 to 74 Years | 1 (0.5%) | 9 (4.9%) |
| 75 Years and over | 7 (9.6%) | 39 (20.0%) |
Disability Class: Cognitive Difficulty
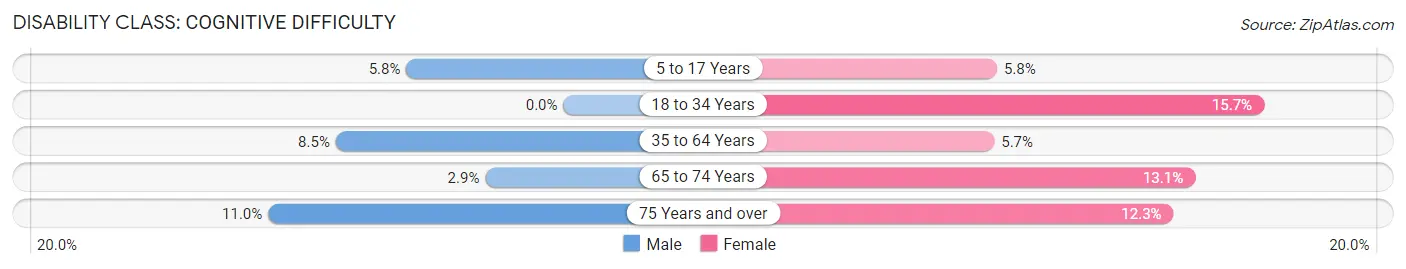
| Age Bracket | Male | Female |
| 5 to 17 Years | 18 (5.8%) | 16 (5.8%) |
| 18 to 34 Years | 0 (0.0%) | 42 (15.7%) |
| 35 to 64 Years | 56 (8.5%) | 35 (5.7%) |
| 65 to 74 Years | 6 (2.9%) | 24 (13.1%) |
| 75 Years and over | 8 (11.0%) | 24 (12.3%) |
Disability Class: Ambulatory Difficulty
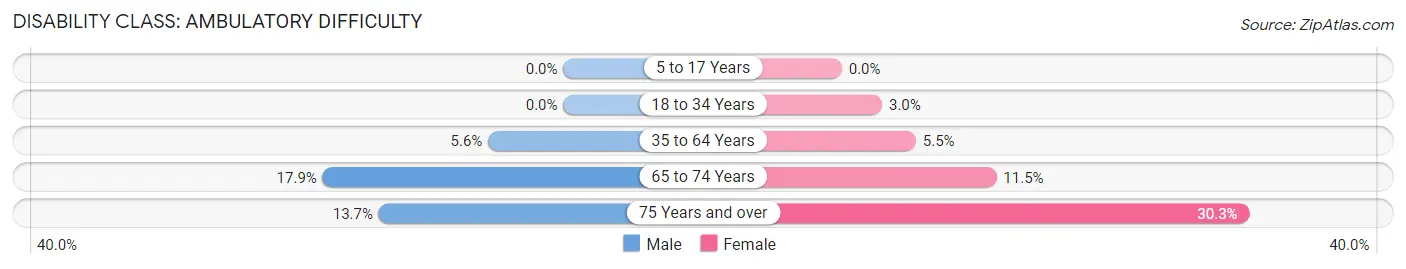
| Age Bracket | Male | Female |
| 5 to 17 Years | 0 (0.0%) | 0 (0.0%) |
| 18 to 34 Years | 0 (0.0%) | 8 (3.0%) |
| 35 to 64 Years | 37 (5.6%) | 34 (5.5%) |
| 65 to 74 Years | 37 (17.9%) | 21 (11.5%) |
| 75 Years and over | 10 (13.7%) | 59 (30.3%) |
Disability Class: Self-Care Difficulty
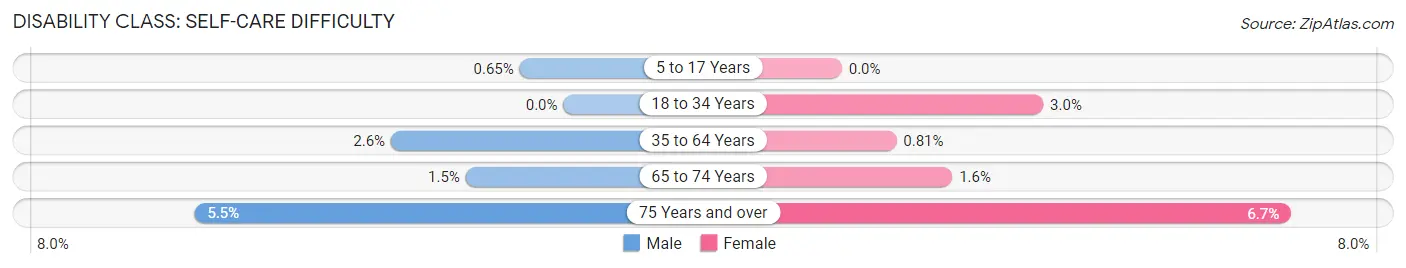
| Age Bracket | Male | Female |
| 5 to 17 Years | 2 (0.6%) | 0 (0.0%) |
| 18 to 34 Years | 0 (0.0%) | 8 (3.0%) |
| 35 to 64 Years | 17 (2.6%) | 5 (0.8%) |
| 65 to 74 Years | 3 (1.5%) | 3 (1.6%) |
| 75 Years and over | 4 (5.5%) | 13 (6.7%) |
Technology Access in Nance County
Computing Device Access in Nance County
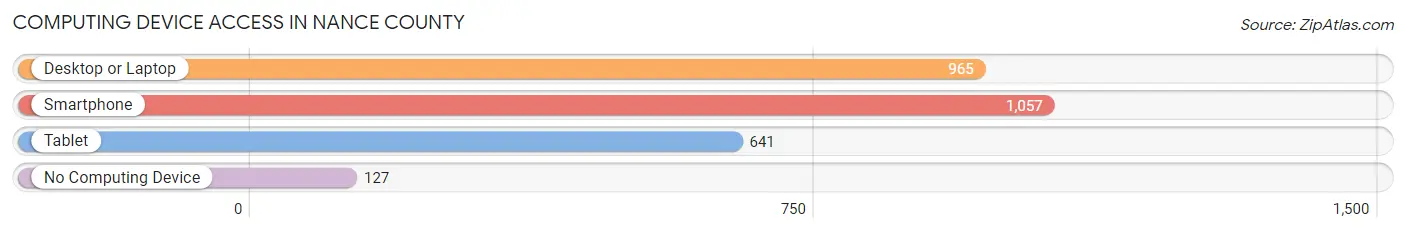
| Device Type | # Households | % Households |
| Desktop or Laptop | 965 | 73.8% |
| Smartphone | 1,057 | 80.9% |
| Tablet | 641 | 49.0% |
| No Computing Device | 127 | 9.7% |
| Total | 1,307 | 100.0% |
Internet Access in Nance County
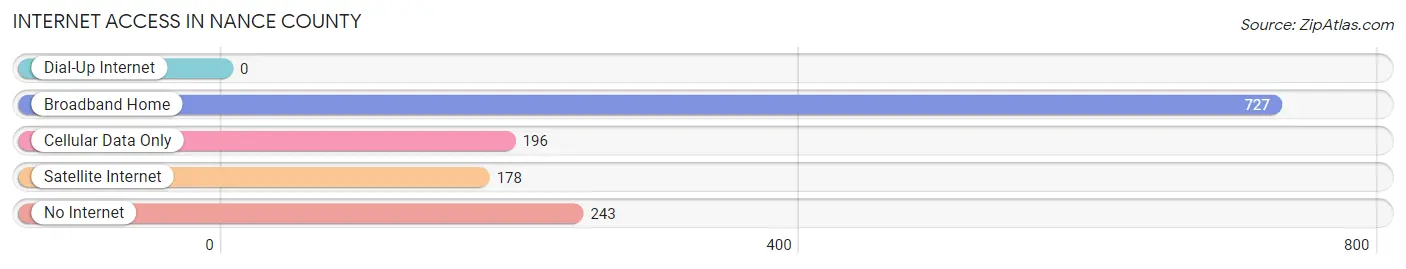
| Internet Type | # Households | % Households |
| Dial-Up Internet | 0 | 0.0% |
| Broadband Home | 727 | 55.6% |
| Cellular Data Only | 196 | 15.0% |
| Satellite Internet | 178 | 13.6% |
| No Internet | 243 | 18.6% |
| Total | 1,307 | 100.0% |
Nance County Summary
Nance County is located in the central part of Nebraska, in the Midwestern United States. It is bordered by Platte, Merrick, Boone, and Howard counties. The county seat is Fullerton. The county was named after Albinus Nance, a pioneer settler and state legislator.
Geography
Nance County covers an area of 576 square miles, of which 575 square miles is land and 1 square mile is water. The county is located in the Platte River Valley, and is drained by the Platte River and its tributaries. The terrain is generally flat, with some rolling hills in the western part of the county. The highest point in the county is located in the northwest corner, at an elevation of 1,890 feet.
The county is home to several state parks and wildlife areas, including the Platte River State Wildlife Management Area, the Nance County State Wildlife Management Area, and the Nance County State Recreation Area.
Demographics
As of the 2010 United States Census, there were 5,890 people, 2,310 households, and 1,567 families residing in the county. The population density was 10.3 people per square mile. The racial makeup of the county was 97.3% White, 0.3% Black or African American, 0.2% Native American, 0.2% Asian, 0.1% Pacific Islander, 0.7% from other races, and 1.2% from two or more races. Hispanic or Latino of any race were 2.2% of the population.
The median income for a household in the county was $41,944, and the median income for a family was $50,938. The per capita income for the county was $20,845. About 8.2% of families and 11.2% of the population were below the poverty line, including 14.2% of those under age 18 and 8.2% of those age 65 or over.
Economy
Agriculture is the main economic activity in Nance County. The county is home to a variety of crops, including corn, soybeans, wheat, and hay. Livestock production is also important, with cattle, hogs, and sheep being raised in the area.
The county is also home to several manufacturing companies, including a furniture manufacturer, a plastics manufacturer, and a metal fabrication company.
The county is served by two airports, the Fullerton Municipal Airport and the Nance County Airport. The county is also served by several highways, including U.S. Route 81, Nebraska Highway 22, and Nebraska Highway 23.
Conclusion
Nance County is a rural county located in the central part of Nebraska. It is home to a variety of agricultural activities, as well as several manufacturing companies. The county is served by two airports and several highways, making it easily accessible. The population of the county is diverse, with a mix of races and ethnicities. The median income for a household in the county is slightly above the state average, and the poverty rate is slightly below the state average.
Common Questions
What is Per Capita Income in Nance County?
Per Capita income in Nance County is $32,568.
What is the Median Family Income in Nance County?
Median Family Income in Nance County is $80,787.
What is the Median Household income in Nance County?
Median Household Income in Nance County is $60,054.
What is Income or Wage Gap in Nance County?
Income or Wage Gap in Nance County is 24.1%.
Women in Nance County earn 75.9 cents for every dollar earned by a man.
What is Inequality or Gini Index in Nance County?
Inequality or Gini Index in Nance County is 0.45.
What is the Total Population of Nance County?
Total Population of Nance County is 3,366.
What is the Total Male Population of Nance County?
Total Male Population of Nance County is 1,697.
What is the Total Female Population of Nance County?
Total Female Population of Nance County is 1,669.
What is the Ratio of Males per 100 Females in Nance County?
There are 101.68 Males per 100 Females in Nance County.
What is the Ratio of Females per 100 Males in Nance County?
There are 98.35 Females per 100 Males in Nance County.
What is the Median Population Age in Nance County?
Median Population Age in Nance County is 44.0 Years.
What is the Average Family Size in Nance County
Average Family Size in Nance County is 3.1 People.
What is the Average Household Size in Nance County
Average Household Size in Nance County is 2.5 People.
How Large is the Labor Force in Nance County?
There are 1,737 People in the Labor Forcein in Nance County.
What is the Percentage of People in the Labor Force in Nance County?
64.9% of People are in the Labor Force in Nance County.
What is the Unemployment Rate in Nance County?
Unemployment Rate in Nance County is 4.4%.