McPherson County, NE Map & Demographics
McPherson County Map
McPherson County Overview
$32,675
PER CAPITA INCOME
$63,750
AVG FAMILY INCOME
$58,250
AVG HOUSEHOLD INCOME
46.7%
WAGE / INCOME GAP [ % ]
53.3¢/ $1
WAGE / INCOME GAP [ $ ]
$10,383
FAMILY INCOME DEFICIT
0.34
INEQUALITY / GINI INDEX
456
TOTAL POPULATION
239
MALE POPULATION
217
FEMALE POPULATION
110.14
MALES / 100 FEMALES
90.79
FEMALES / 100 MALES
56.3
MEDIAN AGE
2.8
AVG FAMILY SIZE
2.4
AVG HOUSEHOLD SIZE
252
LABOR FORCE [ PEOPLE ]
66.3%
PERCENT IN LABOR FORCE
McPherson County Area Codes
Income in McPherson County
Income Overview in McPherson County
Per Capita Income in McPherson County is $32,675, while median incomes of families and households are $63,750 and $58,250 respectively.
| Characteristic | Number | Measure |
| Per Capita Income | 456 | $32,675 |
| Median Family Income | 143 | $63,750 |
| Mean Family Income | 143 | $77,281 |
| Median Household Income | 193 | $58,250 |
| Mean Household Income | 193 | $74,665 |
| Income Deficit | 143 | $10,383 |
| Wage / Income Gap (%) | 456 | 46.67% |
| Wage / Income Gap ($) | 456 | 53.33¢ per $1 |
| Gini / Inequality Index | 456 | 0.34 |
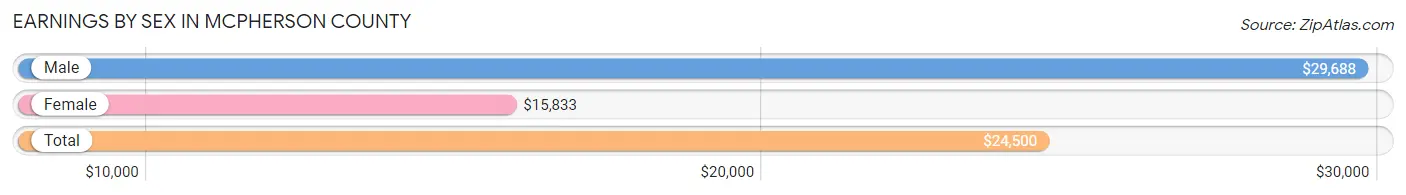
Earnings by Sex in McPherson County
Average Earnings in McPherson County are $24,500, $29,688 for men and $15,833 for women, a difference of 46.7%.
| Sex | Number | Average Earnings |
| Male | 152 (52.0%) | $29,688 |
| Female | 140 (47.9%) | $15,833 |
| Total | 292 (100.0%) | $24,500 |
Earnings by Sex by Income Bracket in McPherson County
The most common earnings brackets in McPherson County are $25,000 to $29,999 for men (24 | 15.8%) and $2,499 or less for women (19 | 13.6%).

| Income | Male | Female |
| $2,499 or less | 12 (7.9%) | 19 (13.6%) |
| $2,500 to $4,999 | 1 (0.7%) | 15 (10.7%) |
| $5,000 to $7,499 | 4 (2.6%) | 6 (4.3%) |
| $7,500 to $9,999 | 15 (9.9%) | 7 (5.0%) |
| $10,000 to $12,499 | 0 (0.0%) | 12 (8.6%) |
| $12,500 to $14,999 | 4 (2.6%) | 8 (5.7%) |
| $15,000 to $17,499 | 0 (0.0%) | 9 (6.4%) |
| $17,500 to $19,999 | 5 (3.3%) | 1 (0.7%) |
| $20,000 to $22,499 | 11 (7.2%) | 1 (0.7%) |
| $22,500 to $24,999 | 3 (2.0%) | 17 (12.1%) |
| $25,000 to $29,999 | 24 (15.8%) | 4 (2.9%) |
| $30,000 to $34,999 | 6 (4.0%) | 5 (3.6%) |
| $35,000 to $39,999 | 5 (3.3%) | 4 (2.9%) |
| $40,000 to $44,999 | 9 (5.9%) | 13 (9.3%) |
| $45,000 to $49,999 | 11 (7.2%) | 3 (2.1%) |
| $50,000 to $54,999 | 0 (0.0%) | 7 (5.0%) |
| $55,000 to $64,999 | 5 (3.3%) | 2 (1.4%) |
| $65,000 to $74,999 | 10 (6.6%) | 0 (0.0%) |
| $75,000 to $99,999 | 13 (8.6%) | 1 (0.7%) |
| $100,000+ | 14 (9.2%) | 6 (4.3%) |
| Total | 152 (100.0%) | 140 (100.0%) |
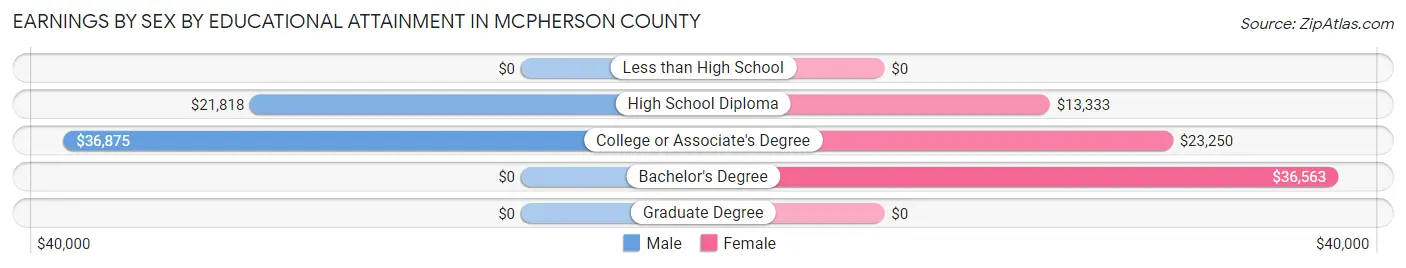
Earnings by Sex by Educational Attainment in McPherson County
Average earnings in McPherson County are $29,688 for men and $22,647 for women, a difference of 23.7%. Men with an educational attainment of college or associate's degree enjoy the highest average annual earnings of $36,875, while those with high school diploma education earn the least with $21,818. Women with an educational attainment of bachelor's degree earn the most with the average annual earnings of $36,563, while those with high school diploma education have the smallest earnings of $13,333.
| Educational Attainment | Male Income | Female Income |
| Less than High School | - | - |
| High School Diploma | $21,818 | $13,333 |
| College or Associate's Degree | $36,875 | $23,250 |
| Bachelor's Degree | - | - |
| Graduate Degree | - | - |
| Total | $29,688 | $22,647 |
Family Income in McPherson County
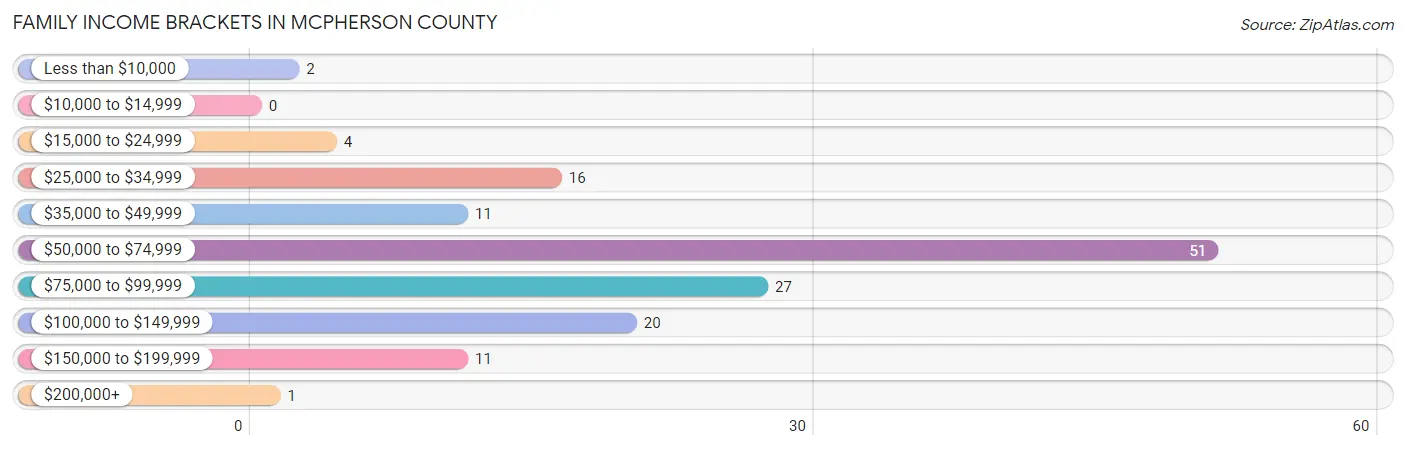
Family Income Brackets in McPherson County
According to the McPherson County family income data, there are 51 families falling into the $50,000 to $74,999 income range, which is the most common income bracket and makes up 35.7% of all families.
| Income Bracket | # Families | % Families |
| Less than $10,000 | 2 | 1.4% |
| $10,000 to $14,999 | 0 | 0.0% |
| $15,000 to $24,999 | 4 | 2.8% |
| $25,000 to $34,999 | 16 | 11.2% |
| $35,000 to $49,999 | 11 | 7.7% |
| $50,000 to $74,999 | 51 | 35.7% |
| $75,000 to $99,999 | 27 | 18.9% |
| $100,000 to $149,999 | 20 | 14.0% |
| $150,000 to $199,999 | 11 | 7.7% |
| $200,000+ | 1 | 0.7% |
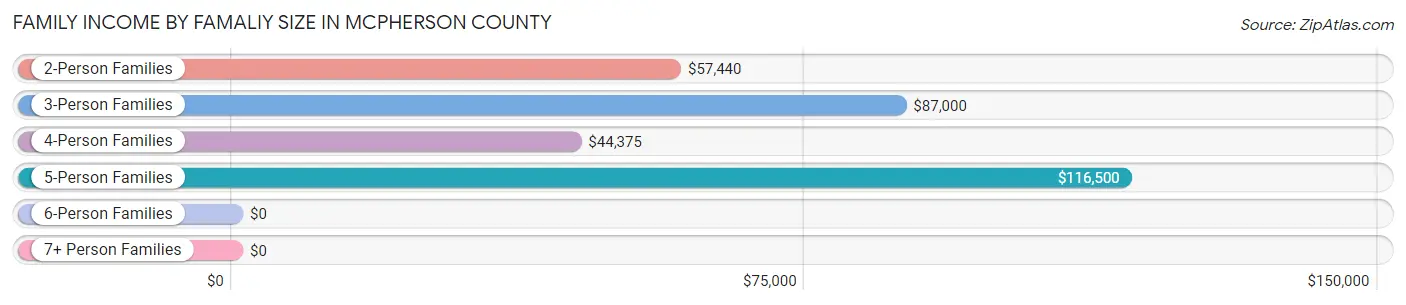
Family Income by Famaliy Size in McPherson County
5-person families (10 | 7.0%) account for the highest median family income in McPherson County with $116,500 per family, while 3-person families (16 | 11.2%) have the highest median income of $29,000 per family member.
| Income Bracket | # Families | Median Income |
| 2-Person Families | 103 (72.0%) | $57,440 |
| 3-Person Families | 16 (11.2%) | $87,000 |
| 4-Person Families | 11 (7.7%) | $44,375 |
| 5-Person Families | 10 (7.0%) | $116,500 |
| 6-Person Families | 0 (0.0%) | $0 |
| 7+ Person Families | 3 (2.1%) | $0 |
| Total | 143 (100.0%) | $63,750 |
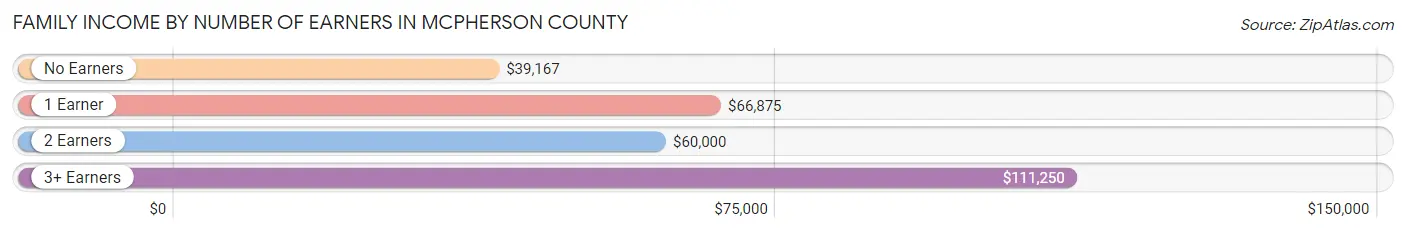
Family Income by Number of Earners in McPherson County
The median family income in McPherson County is $63,750, with families comprising 3+ earners (8) having the highest median family income of $111,250, while families with no earners (10) have the lowest median family income of $39,167, accounting for 5.6% and 7.0% of families, respectively.
| Number of Earners | # Families | Median Income |
| No Earners | 10 (7.0%) | $39,167 |
| 1 Earner | 39 (27.3%) | $66,875 |
| 2 Earners | 86 (60.1%) | $60,000 |
| 3+ Earners | 8 (5.6%) | $111,250 |
| Total | 143 (100.0%) | $63,750 |
Household Income in McPherson County
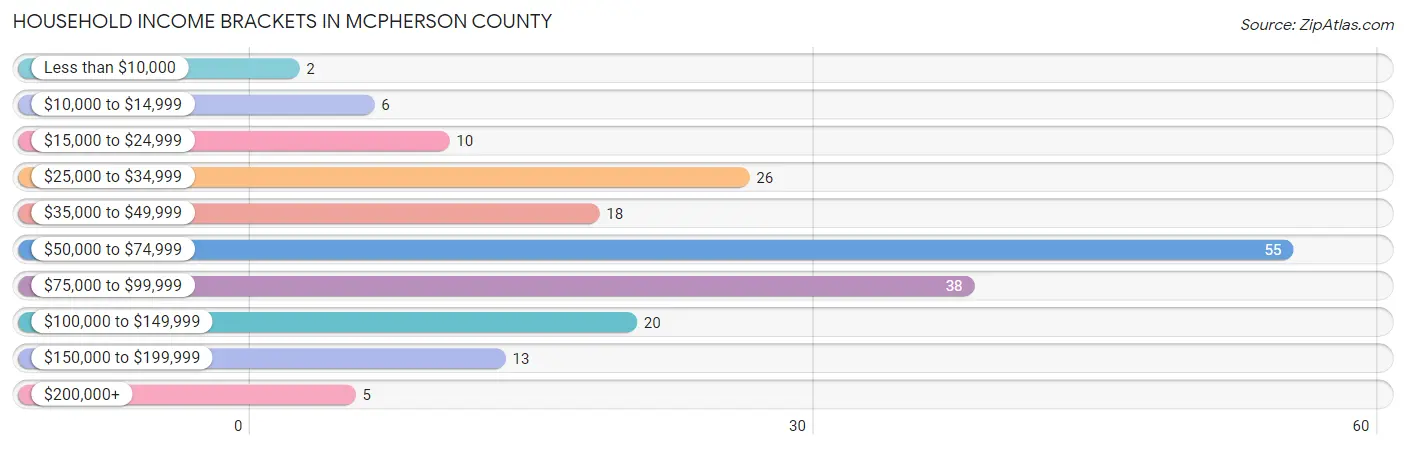
Household Income Brackets in McPherson County
With 55 households falling in the category, the $50,000 to $74,999 income range is the most frequent in McPherson County, accounting for 28.5% of all households. In contrast, only 2 households (1.0%) fall into the less than $10,000 income bracket, making it the least populous group.
| Income Bracket | # Households | % Households |
| Less than $10,000 | 2 | 1.0% |
| $10,000 to $14,999 | 6 | 3.1% |
| $15,000 to $24,999 | 10 | 5.2% |
| $25,000 to $34,999 | 26 | 13.5% |
| $35,000 to $49,999 | 18 | 9.3% |
| $50,000 to $74,999 | 55 | 28.5% |
| $75,000 to $99,999 | 38 | 19.7% |
| $100,000 to $149,999 | 20 | 10.4% |
| $150,000 to $199,999 | 13 | 6.7% |
| $200,000+ | 5 | 2.6% |
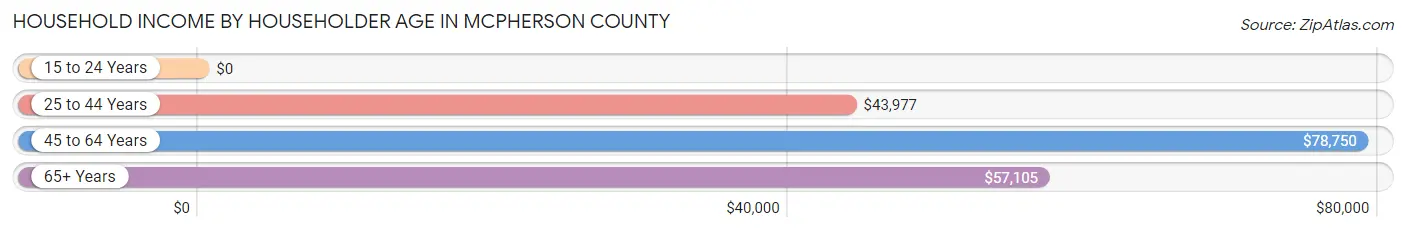
Household Income by Householder Age in McPherson County
The median household income in McPherson County is $58,250, with the highest median household income of $78,750 found in the 45 to 64 years age bracket for the primary householder. A total of 60 households (31.1%) fall into this category. Meanwhile, the 15 to 24 years age bracket for the primary householder has the lowest median household income of $0, with 4 households (2.1%) in this group.
| Income Bracket | # Households | Median Income |
| 15 to 24 Years | 4 (2.1%) | $0 |
| 25 to 44 Years | 45 (23.3%) | $43,977 |
| 45 to 64 Years | 60 (31.1%) | $78,750 |
| 65+ Years | 84 (43.5%) | $57,105 |
| Total | 193 (100.0%) | $58,250 |
Poverty in McPherson County
Income Below Poverty by Sex and Age in McPherson County
With 6.7% poverty level for males and 8.8% for females among the residents of McPherson County, 6 to 11 year old males and 12 to 14 year old females are the most vulnerable to poverty, with 5 males (55.6%) and 3 females (50.0%) in their respective age groups living below the poverty level.
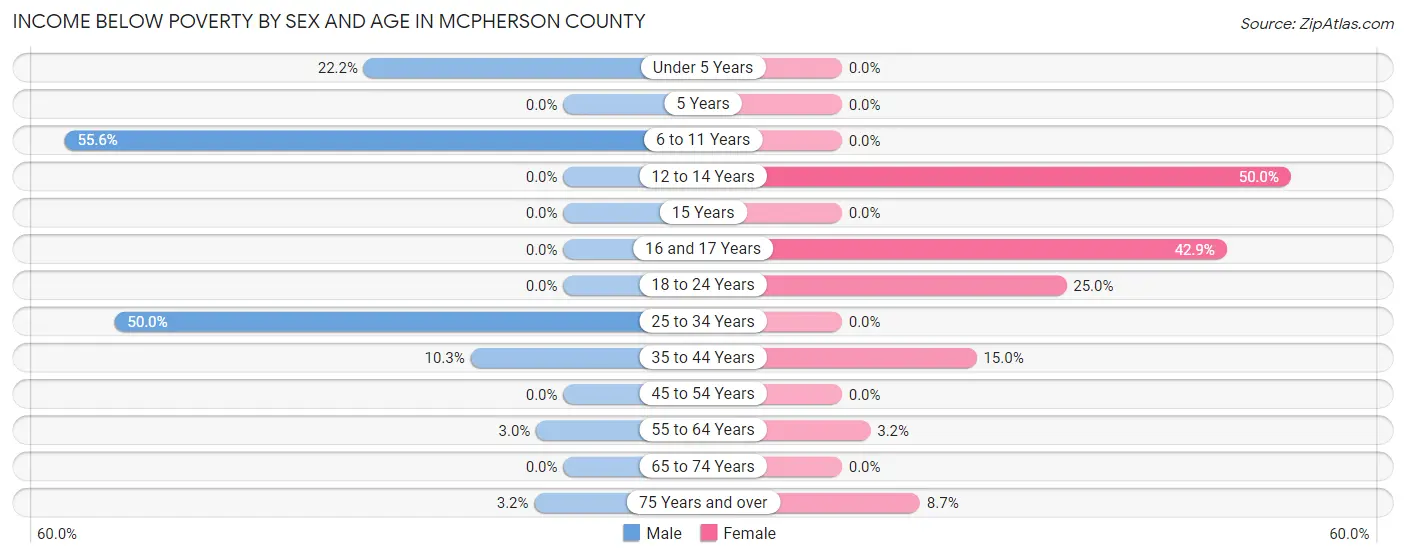
| Age Bracket | Male | Female |
| Under 5 Years | 2 (22.2%) | 0 (0.0%) |
| 5 Years | 0 (0.0%) | 0 (0.0%) |
| 6 to 11 Years | 5 (55.6%) | 0 (0.0%) |
| 12 to 14 Years | 0 (0.0%) | 3 (50.0%) |
| 15 Years | 0 (0.0%) | 0 (0.0%) |
| 16 and 17 Years | 0 (0.0%) | 3 (42.9%) |
| 18 to 24 Years | 0 (0.0%) | 6 (25.0%) |
| 25 to 34 Years | 4 (50.0%) | 0 (0.0%) |
| 35 to 44 Years | 3 (10.3%) | 3 (15.0%) |
| 45 to 54 Years | 0 (0.0%) | 0 (0.0%) |
| 55 to 64 Years | 1 (3.0%) | 2 (3.2%) |
| 65 to 74 Years | 0 (0.0%) | 0 (0.0%) |
| 75 Years and over | 1 (3.2%) | 2 (8.7%) |
| Total | 16 (6.7%) | 19 (8.8%) |
Income Above Poverty by Sex and Age in McPherson County
According to the poverty statistics in McPherson County, males aged 12 to 14 years and females aged under 5 years are the age groups that are most secure financially, with 100.0% of males and 100.0% of females in these age groups living above the poverty line.
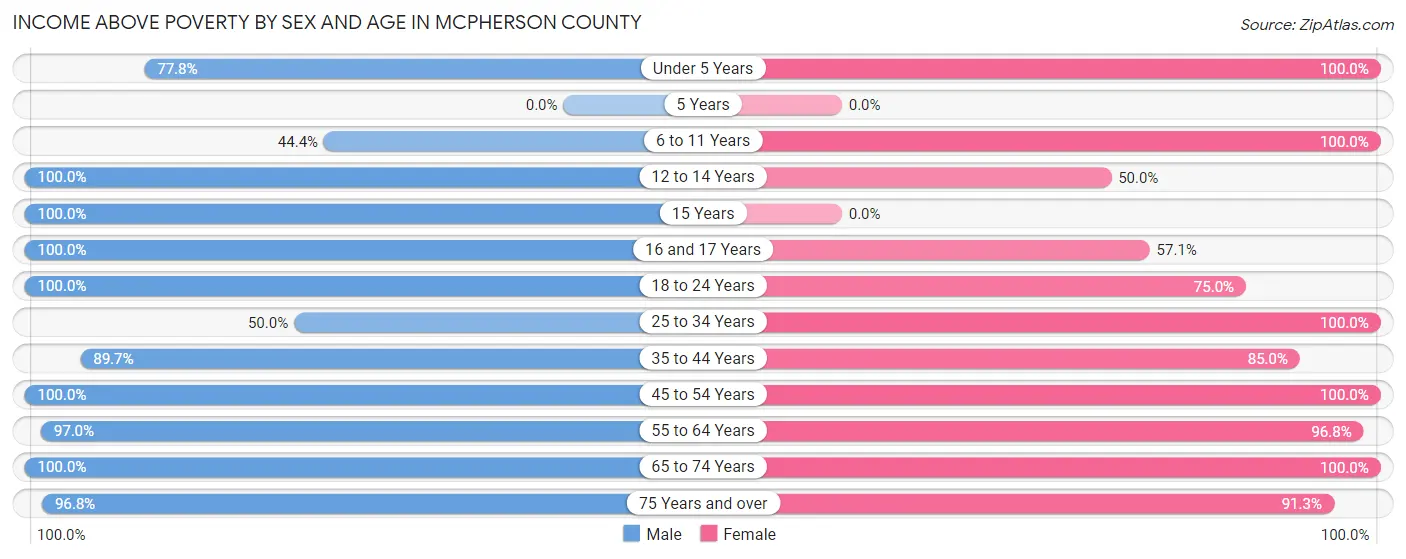
| Age Bracket | Male | Female |
| Under 5 Years | 7 (77.8%) | 8 (100.0%) |
| 5 Years | 0 (0.0%) | 0 (0.0%) |
| 6 to 11 Years | 4 (44.4%) | 4 (100.0%) |
| 12 to 14 Years | 37 (100.0%) | 3 (50.0%) |
| 15 Years | 3 (100.0%) | 0 (0.0%) |
| 16 and 17 Years | 3 (100.0%) | 4 (57.1%) |
| 18 to 24 Years | 7 (100.0%) | 18 (75.0%) |
| 25 to 34 Years | 4 (50.0%) | 11 (100.0%) |
| 35 to 44 Years | 26 (89.7%) | 17 (85.0%) |
| 45 to 54 Years | 22 (100.0%) | 19 (100.0%) |
| 55 to 64 Years | 32 (97.0%) | 61 (96.8%) |
| 65 to 74 Years | 48 (100.0%) | 32 (100.0%) |
| 75 Years and over | 30 (96.8%) | 21 (91.3%) |
| Total | 223 (93.3%) | 198 (91.2%) |
Income Below Poverty Among Married-Couple Families in McPherson County
The poverty statistics for married-couple families in McPherson County show that 4.3% or 6 of the total 139 families live below the poverty line. Families with 5 or more children have the highest poverty rate of 100.0%, comprising of 3 families. On the other hand, families with 1 or 2 children have the lowest poverty rate of 0.0%, which includes 0 families.
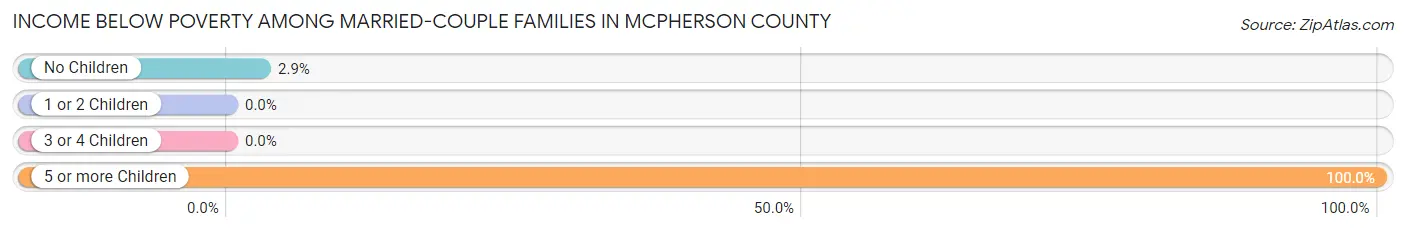
| Children | Above Poverty | Below Poverty |
| No Children | 101 (97.1%) | 3 (2.9%) |
| 1 or 2 Children | 26 (100.0%) | 0 (0.0%) |
| 3 or 4 Children | 6 (100.0%) | 0 (0.0%) |
| 5 or more Children | 0 (0.0%) | 3 (100.0%) |
| Total | 133 (95.7%) | 6 (4.3%) |
Income Below Poverty Among Single-Parent Households in McPherson County
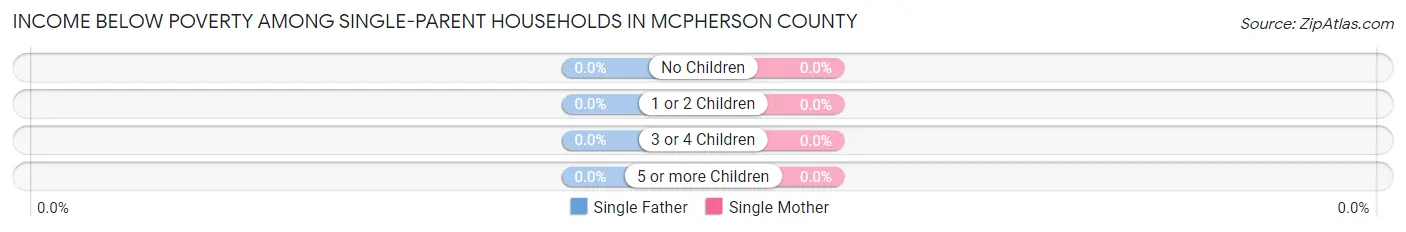
| Children | Single Father | Single Mother |
| No Children | 0 (0.0%) | 0 (0.0%) |
| 1 or 2 Children | 0 (0.0%) | 0 (0.0%) |
| 3 or 4 Children | 0 (0.0%) | 0 (0.0%) |
| 5 or more Children | 0 (0.0%) | 0 (0.0%) |
| Total | 0 (0.0%) | 0 (0.0%) |
Income Below Poverty Among Married-Couple vs Single-Parent Households in McPherson County
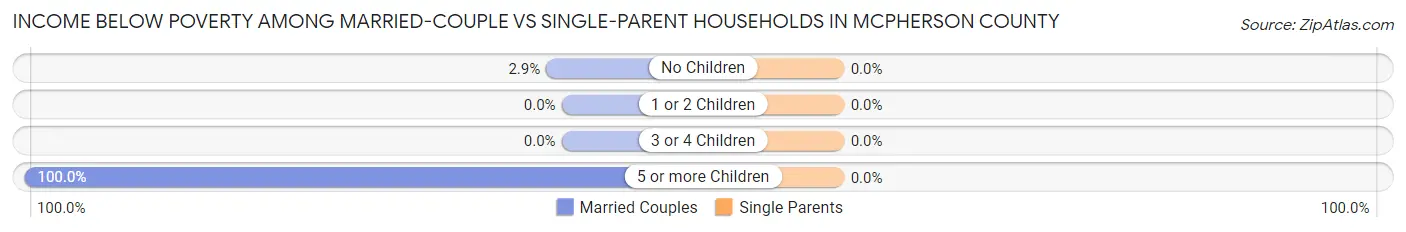
| Children | Married-Couple Families | Single-Parent Households |
| No Children | 3 (2.9%) | 0 (0.0%) |
| 1 or 2 Children | 0 (0.0%) | 0 (0.0%) |
| 3 or 4 Children | 0 (0.0%) | 0 (0.0%) |
| 5 or more Children | 3 (100.0%) | 0 (0.0%) |
| Total | 6 (4.3%) | 0 (0.0%) |
Race in McPherson County
The most populous races in McPherson County are White / Caucasian (449 | 98.5%), Two or more Races (4 | 0.9%), and Hispanic or Latino (3 | 0.7%).
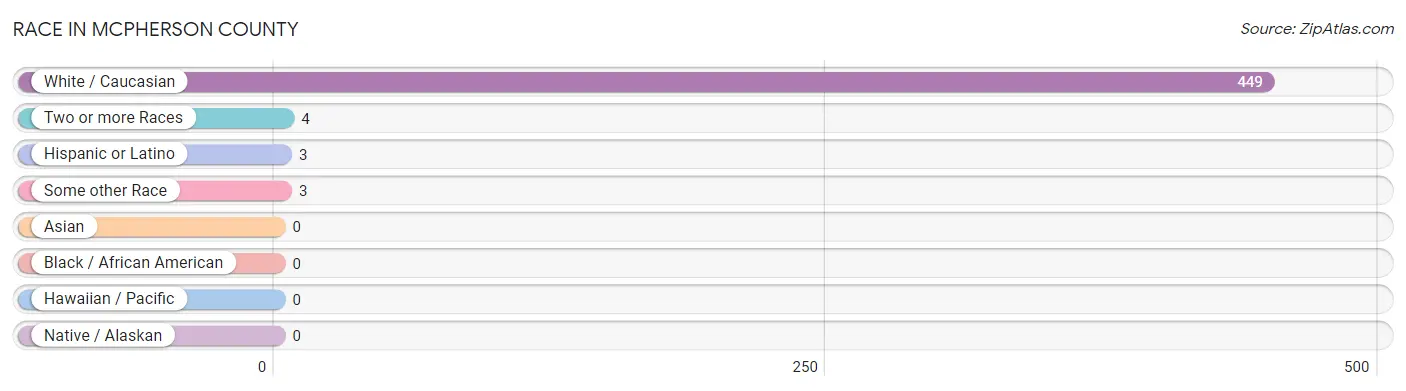
| Race | # Population | % Population |
| Asian | 0 | 0.0% |
| Black / African American | 0 | 0.0% |
| Hawaiian / Pacific | 0 | 0.0% |
| Hispanic or Latino | 3 | 0.7% |
| Native / Alaskan | 0 | 0.0% |
| White / Caucasian | 449 | 98.5% |
| Two or more Races | 4 | 0.9% |
| Some other Race | 3 | 0.7% |
| Total | 456 | 100.0% |
Ancestry in McPherson County
The most populous ancestries reported in McPherson County are German (210 | 46.1%), English (51 | 11.2%), Swedish (43 | 9.4%), Irish (36 | 7.9%), and American (24 | 5.3%), together accounting for 79.8% of all McPherson County residents.
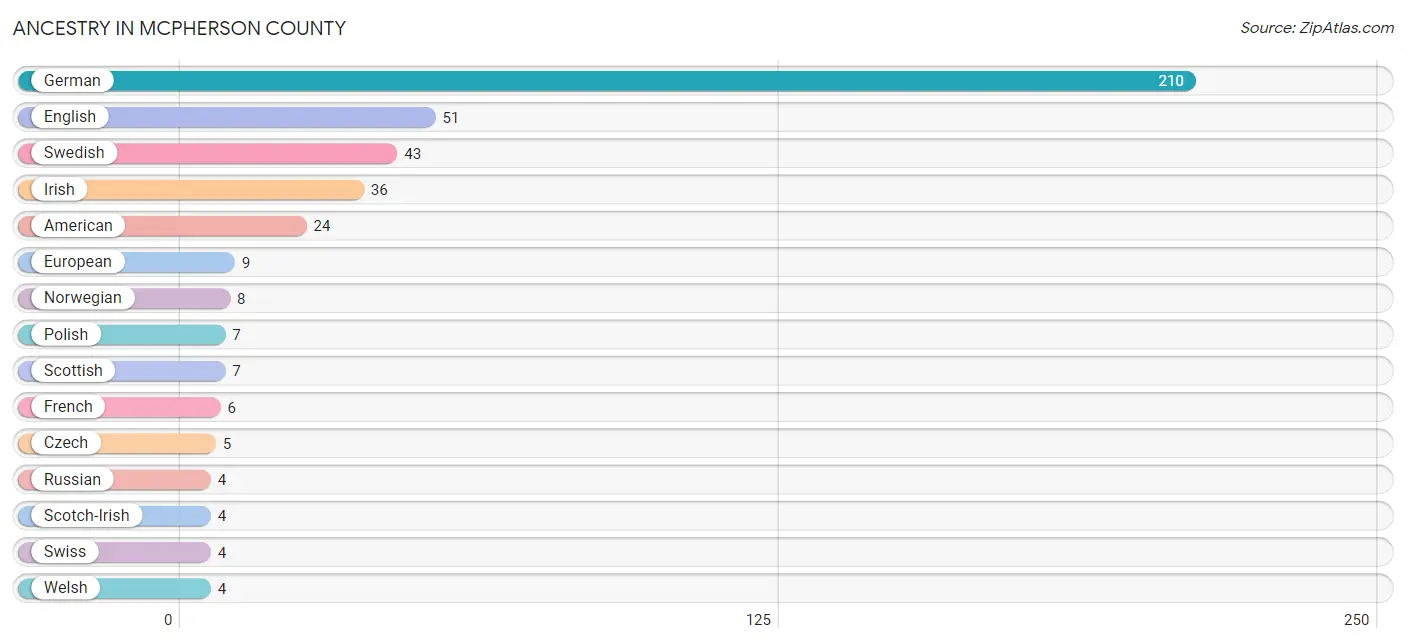
| Ancestry | # Population | % Population |
| American | 24 | 5.3% |
| Belgian | 2 | 0.4% |
| Czech | 5 | 1.1% |
| Danish | 2 | 0.4% |
| Dutch | 2 | 0.4% |
| English | 51 | 11.2% |
| European | 9 | 2.0% |
| French | 6 | 1.3% |
| German | 210 | 46.1% |
| Irish | 36 | 7.9% |
| Mexican | 3 | 0.7% |
| Norwegian | 8 | 1.8% |
| Polish | 7 | 1.5% |
| Russian | 4 | 0.9% |
| Scandinavian | 1 | 0.2% |
| Scotch-Irish | 4 | 0.9% |
| Scottish | 7 | 1.5% |
| Sioux | 2 | 0.4% |
| Swedish | 43 | 9.4% |
| Swiss | 4 | 0.9% |
| Welsh | 4 | 0.9% | View All 21 Rows |
Immigrants in McPherson County
The most numerous immigrant groups reported in McPherson County came from Europe (2 | 0.4%), France (2 | 0.4%), and Western Europe (2 | 0.4%), together accounting for 1.3% of all McPherson County residents.
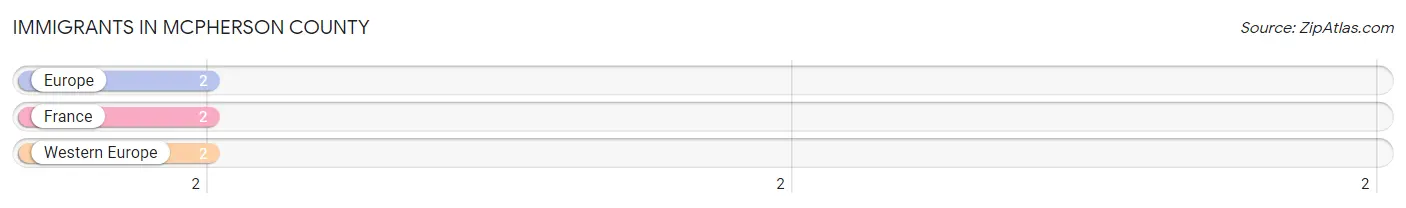
| Immigration Origin | # Population | % Population |
| Europe | 2 | 0.4% |
| France | 2 | 0.4% |
| Western Europe | 2 | 0.4% | View All 3 Rows |
Sex and Age in McPherson County
Sex and Age in McPherson County
The most populous age groups in McPherson County are 10 to 14 Years (46 | 19.3%) for men and 55 to 59 Years (34 | 15.7%) for women.
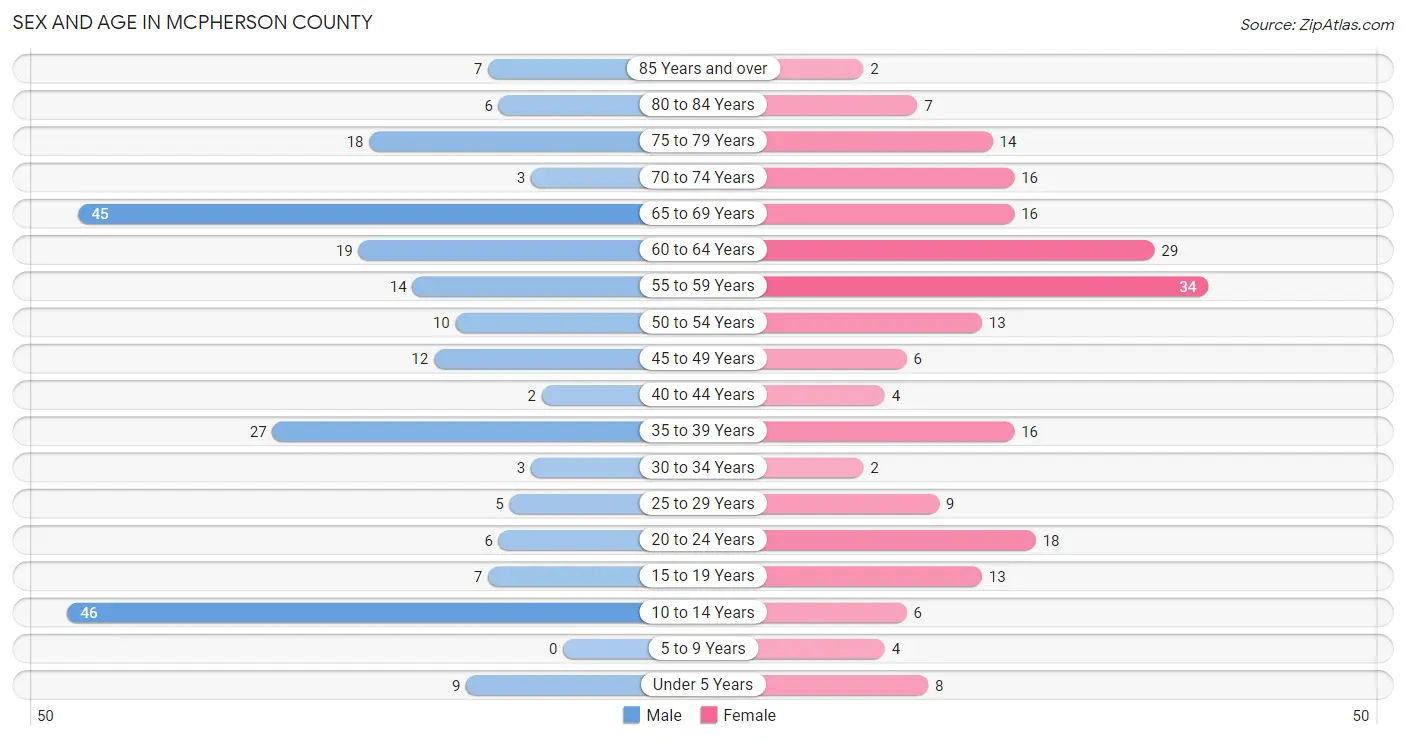
| Age Bracket | Male | Female |
| Under 5 Years | 9 (3.8%) | 8 (3.7%) |
| 5 to 9 Years | 0 (0.0%) | 4 (1.8%) |
| 10 to 14 Years | 46 (19.3%) | 6 (2.8%) |
| 15 to 19 Years | 7 (2.9%) | 13 (6.0%) |
| 20 to 24 Years | 6 (2.5%) | 18 (8.3%) |
| 25 to 29 Years | 5 (2.1%) | 9 (4.2%) |
| 30 to 34 Years | 3 (1.3%) | 2 (0.9%) |
| 35 to 39 Years | 27 (11.3%) | 16 (7.4%) |
| 40 to 44 Years | 2 (0.8%) | 4 (1.8%) |
| 45 to 49 Years | 12 (5.0%) | 6 (2.8%) |
| 50 to 54 Years | 10 (4.2%) | 13 (6.0%) |
| 55 to 59 Years | 14 (5.9%) | 34 (15.7%) |
| 60 to 64 Years | 19 (8.0%) | 29 (13.4%) |
| 65 to 69 Years | 45 (18.8%) | 16 (7.4%) |
| 70 to 74 Years | 3 (1.3%) | 16 (7.4%) |
| 75 to 79 Years | 18 (7.5%) | 14 (6.5%) |
| 80 to 84 Years | 6 (2.5%) | 7 (3.2%) |
| 85 Years and over | 7 (2.9%) | 2 (0.9%) |
| Total | 239 (100.0%) | 217 (100.0%) |
Families and Households in McPherson County
Median Family Size in McPherson County
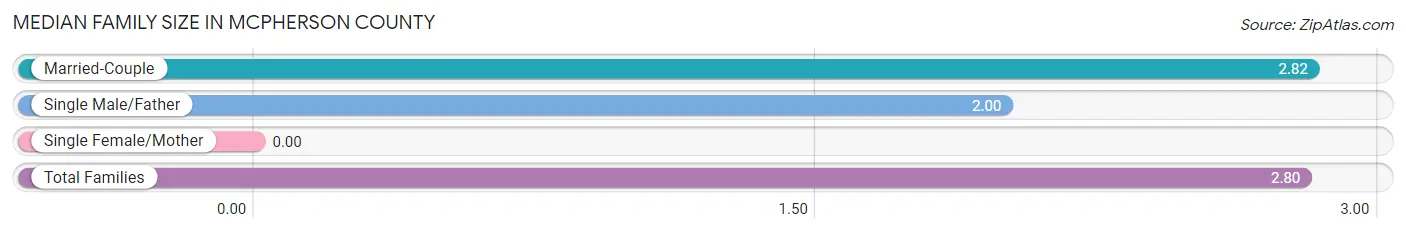
| Family Type | # Families | Family Size |
| Married-Couple | 139 (97.2%) | 2.82 |
| Single Male/Father | 4 (2.8%) | 2.00 |
| Single Female/Mother | 0 (0.0%) | - |
| Total Families | 143 (100.0%) | 2.80 |
Median Household Size in McPherson County
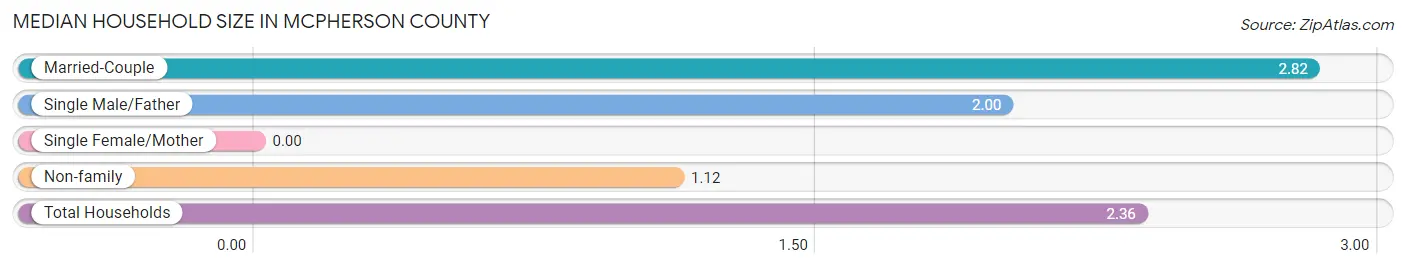
| Household Type | # Households | Household Size |
| Married-Couple | 139 (72.0%) | 2.82 |
| Single Male/Father | 4 (2.1%) | 2.00 |
| Single Female/Mother | 0 (0.0%) | - |
| Non-family | 50 (25.9%) | 1.12 |
| Total Households | 193 (100.0%) | 2.36 |
Household Size by Marriage Status in McPherson County
Out of a total of 193 households in McPherson County, 143 (74.1%) are family households, while 50 (25.9%) are nonfamily households. The most numerous type of family households are 2-person households, comprising 103, and the most common type of nonfamily households are 1-person households, comprising 46.
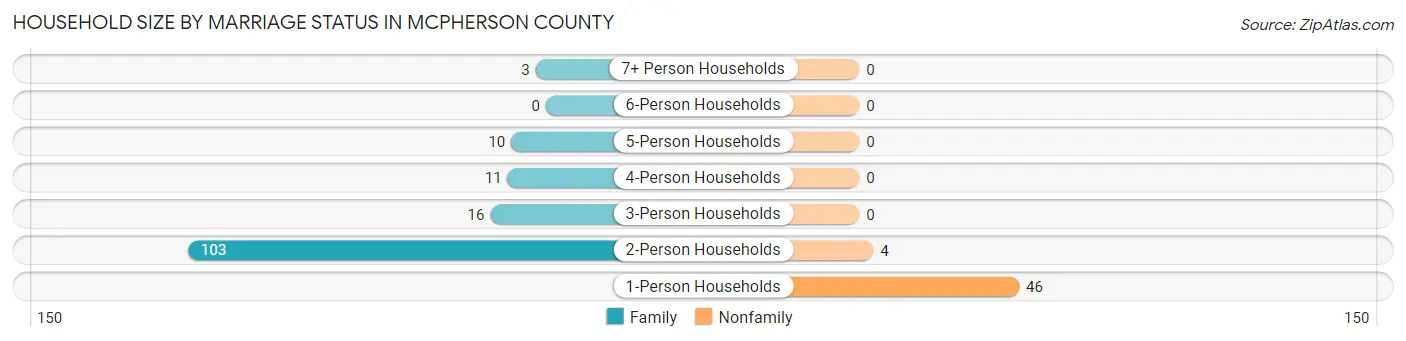
| Household Size | Family Households | Nonfamily Households |
| 1-Person Households | - | 46 (23.8%) |
| 2-Person Households | 103 (53.4%) | 4 (2.1%) |
| 3-Person Households | 16 (8.3%) | 0 (0.0%) |
| 4-Person Households | 11 (5.7%) | 0 (0.0%) |
| 5-Person Households | 10 (5.2%) | 0 (0.0%) |
| 6-Person Households | 0 (0.0%) | 0 (0.0%) |
| 7+ Person Households | 3 (1.5%) | 0 (0.0%) |
| Total | 143 (74.1%) | 50 (25.9%) |
Female Fertility in McPherson County
Fertility by Age in McPherson County
| Age Bracket | Women with Births | Births / 1,000 Women |
| 15 to 19 years | 0 (0.0%) | 0.0 |
| 20 to 34 years | 0 (0.0%) | 0.0 |
| 35 to 50 years | 0 (0.0%) | 0.0 |
| Total | 0 (0.0%) | 0.0 |
Fertility by Age by Marriage Status in McPherson County
| Age Bracket | Married | Unmarried |
| 15 to 19 years | 0 (0.0%) | 0 (0.0%) |
| 20 to 34 years | 0 (0.0%) | 0 (0.0%) |
| 35 to 50 years | 0 (0.0%) | 0 (0.0%) |
| Total | 0 (0.0%) | 0 (0.0%) |
Fertility by Education in McPherson County
| Educational Attainment | Women with Births | Births / 1,000 Women |
| Less than High School | 0 (0.0%) | 0.0 |
| High School Diploma | 0 (0.0%) | 0.0 |
| College or Associate's Degree | 0 (0.0%) | 0.0 |
| Bachelor's Degree | 0 (0.0%) | 0.0 |
| Graduate Degree | 0 (0.0%) | 0.0 |
| Total | 0 (0.0%) | 0.0 |
Fertility by Education by Marriage Status in McPherson County
| Educational Attainment | Married | Unmarried |
| Less than High School | 0 (0.0%) | 0 (0.0%) |
| High School Diploma | 0 (0.0%) | 0 (0.0%) |
| College or Associate's Degree | 0 (0.0%) | 0 (0.0%) |
| Bachelor's Degree | 0 (0.0%) | 0 (0.0%) |
| Graduate Degree | 0 (0.0%) | 0 (0.0%) |
| Total | 0 (0.0%) | 0 (0.0%) |
Employment Characteristics in McPherson County
Employment by Class of Employer in McPherson County
Among the 252 employed individuals in McPherson County, private company employees (106 | 42.1%), self-employed (not incorporated) (72 | 28.6%), and local government employees (25 | 9.9%) make up the most common classes of employment.
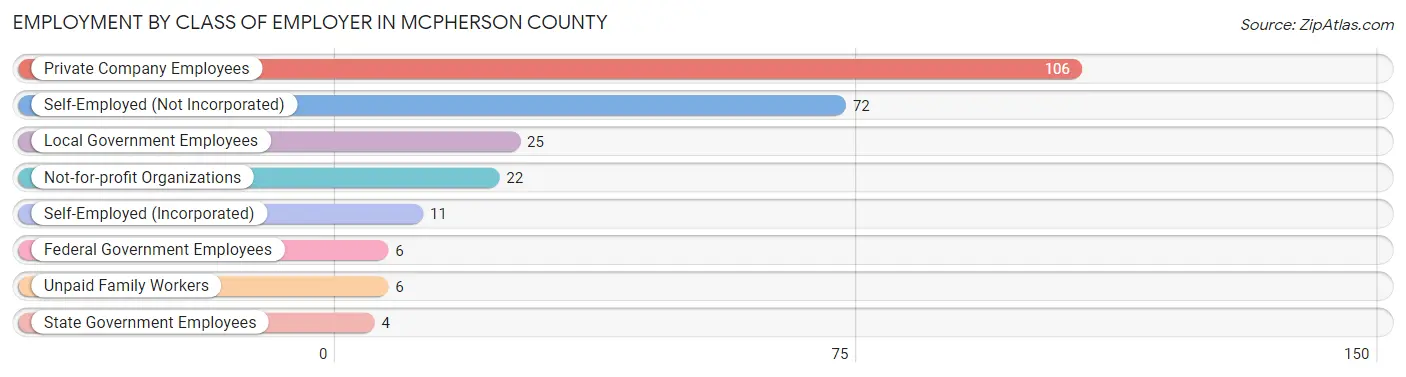
| Employer Class | # Employees | % Employees |
| Private Company Employees | 106 | 42.1% |
| Self-Employed (Incorporated) | 11 | 4.4% |
| Self-Employed (Not Incorporated) | 72 | 28.6% |
| Not-for-profit Organizations | 22 | 8.7% |
| Local Government Employees | 25 | 9.9% |
| State Government Employees | 4 | 1.6% |
| Federal Government Employees | 6 | 2.4% |
| Unpaid Family Workers | 6 | 2.4% |
| Total | 252 | 100.0% |
Employment Status by Age in McPherson County
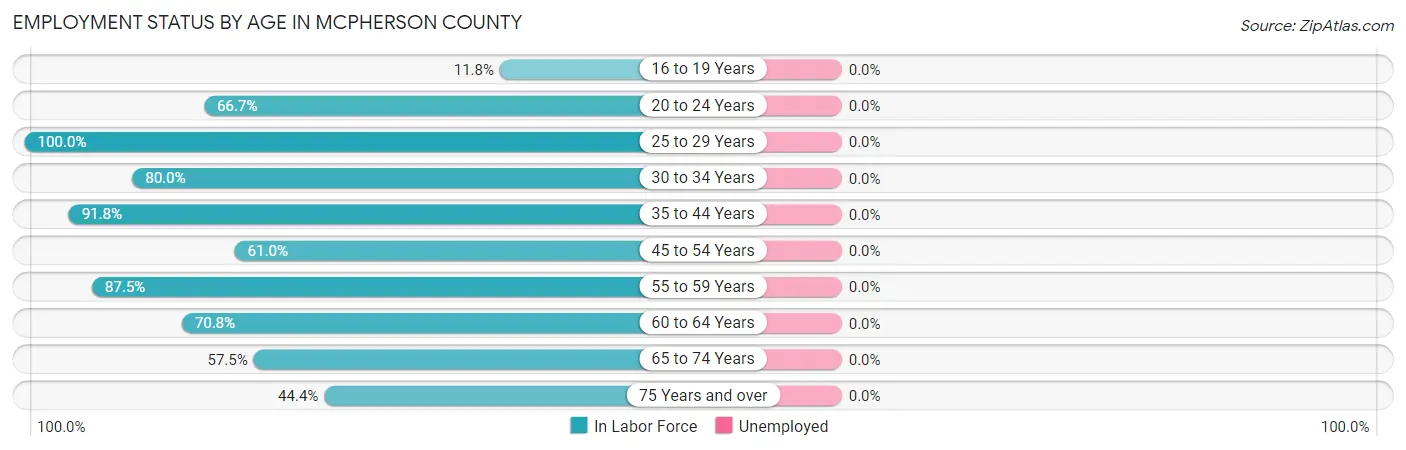
| Age Bracket | In Labor Force | Unemployed |
| 16 to 19 Years | 2 (11.8%) | 0 (0.0%) |
| 20 to 24 Years | 16 (66.7%) | 0 (0.0%) |
| 25 to 29 Years | 14 (100.0%) | 0 (0.0%) |
| 30 to 34 Years | 4 (80.0%) | 0 (0.0%) |
| 35 to 44 Years | 45 (91.8%) | 0 (0.0%) |
| 45 to 54 Years | 25 (61.0%) | 0 (0.0%) |
| 55 to 59 Years | 42 (87.5%) | 0 (0.0%) |
| 60 to 64 Years | 34 (70.8%) | 0 (0.0%) |
| 65 to 74 Years | 46 (57.5%) | 0 (0.0%) |
| 75 Years and over | 24 (44.4%) | 0 (0.0%) |
| Total | 252 (66.3%) | 0 (0.0%) |
Employment Status by Educational Attainment in McPherson County
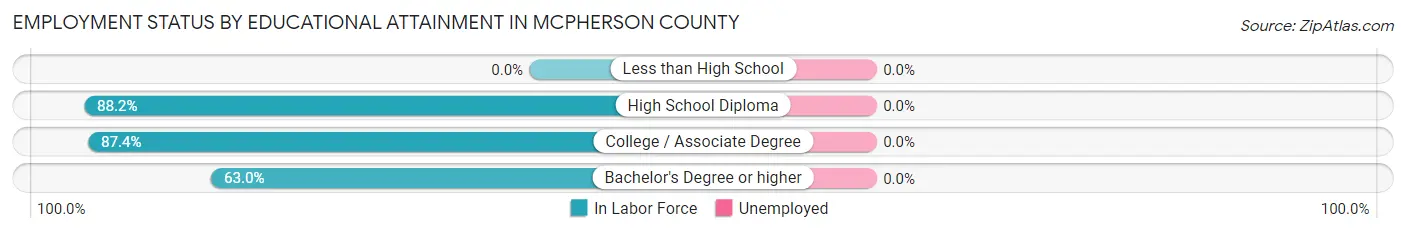
| Educational Attainment | In Labor Force | Unemployed |
| Less than High School | 0 (0.0%) | 0 (0.0%) |
| High School Diploma | 45 (88.2%) | 0 (0.0%) |
| College / Associate Degree | 90 (87.4%) | 0 (0.0%) |
| Bachelor's Degree or higher | 29 (63.0%) | 0 (0.0%) |
| Total | 164 (80.0%) | 0 (0.0%) |
Employment Occupations by Sex in McPherson County
Management, Business, Science and Arts Occupations
The most common Management, Business, Science and Arts occupations in McPherson County are Management (77 | 30.6%), Community & Social Service (17 | 6.8%), and Education Instruction & Library (17 | 6.8%).
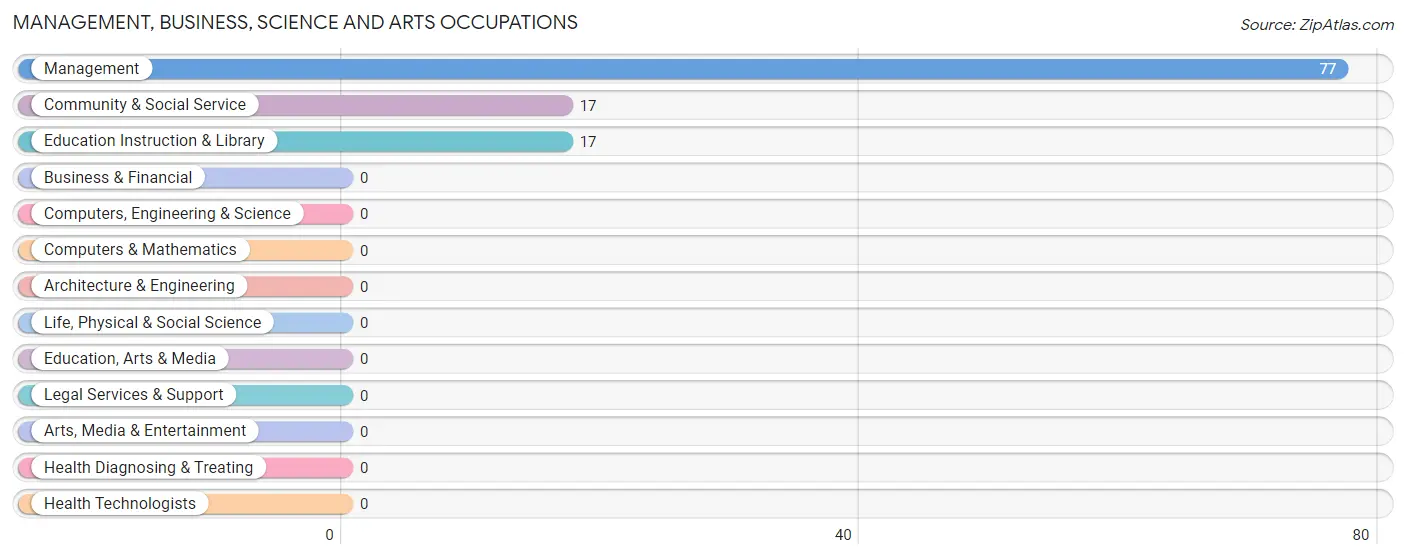
Management, Business, Science and Arts Occupations by Sex
Within the Management, Business, Science and Arts occupations in McPherson County, the most male-oriented occupations are Management (71.4%), Community & Social Service (11.8%), and Education Instruction & Library (11.8%), while the most female-oriented occupations are Community & Social Service (88.2%), Education Instruction & Library (88.2%), and Management (28.6%).
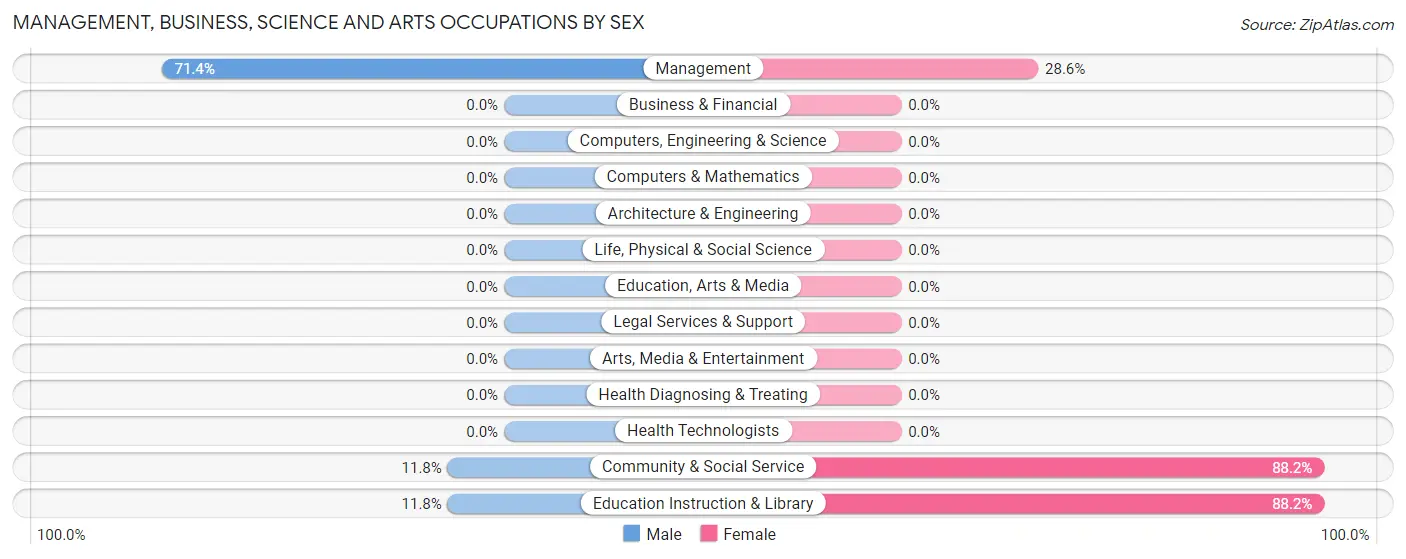
| Occupation | Male | Female |
| Management | 55 (71.4%) | 22 (28.6%) |
| Business & Financial | 0 (0.0%) | 0 (0.0%) |
| Computers, Engineering & Science | 0 (0.0%) | 0 (0.0%) |
| Computers & Mathematics | 0 (0.0%) | 0 (0.0%) |
| Architecture & Engineering | 0 (0.0%) | 0 (0.0%) |
| Life, Physical & Social Science | 0 (0.0%) | 0 (0.0%) |
| Community & Social Service | 2 (11.8%) | 15 (88.2%) |
| Education, Arts & Media | 0 (0.0%) | 0 (0.0%) |
| Legal Services & Support | 0 (0.0%) | 0 (0.0%) |
| Education Instruction & Library | 2 (11.8%) | 15 (88.2%) |
| Arts, Media & Entertainment | 0 (0.0%) | 0 (0.0%) |
| Health Diagnosing & Treating | 0 (0.0%) | 0 (0.0%) |
| Health Technologists | 0 (0.0%) | 0 (0.0%) |
| Total (Category) | 57 (60.6%) | 37 (39.4%) |
| Total (Overall) | 142 (56.4%) | 110 (43.6%) |
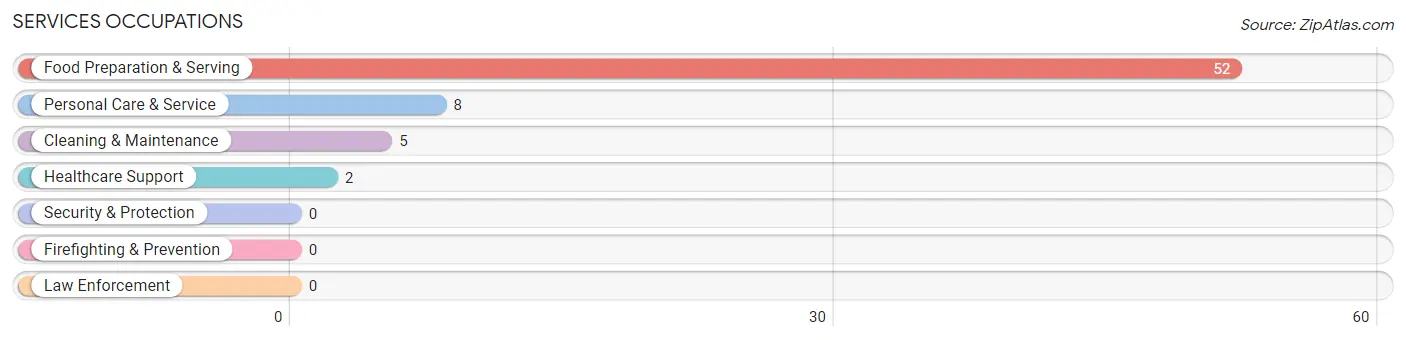
Services Occupations
The most common Services occupations in McPherson County are Food Preparation & Serving (52 | 20.6%), Personal Care & Service (8 | 3.2%), Cleaning & Maintenance (5 | 2.0%), and Healthcare Support (2 | 0.8%).
Services Occupations by Sex
Within the Services occupations in McPherson County, the most male-oriented occupations are Healthcare Support (100.0%), and Food Preparation & Serving (46.2%), while the most female-oriented occupations are Cleaning & Maintenance (100.0%), Personal Care & Service (100.0%), and Food Preparation & Serving (53.8%).
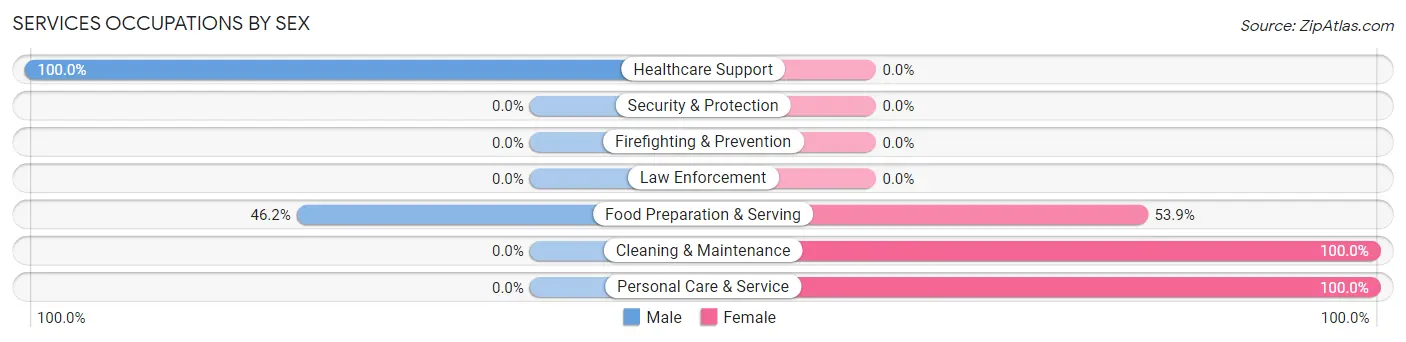
| Occupation | Male | Female |
| Healthcare Support | 2 (100.0%) | 0 (0.0%) |
| Security & Protection | 0 (0.0%) | 0 (0.0%) |
| Firefighting & Prevention | 0 (0.0%) | 0 (0.0%) |
| Law Enforcement | 0 (0.0%) | 0 (0.0%) |
| Food Preparation & Serving | 24 (46.2%) | 28 (53.8%) |
| Cleaning & Maintenance | 0 (0.0%) | 5 (100.0%) |
| Personal Care & Service | 0 (0.0%) | 8 (100.0%) |
| Total (Category) | 26 (38.8%) | 41 (61.2%) |
| Total (Overall) | 142 (56.4%) | 110 (43.6%) |
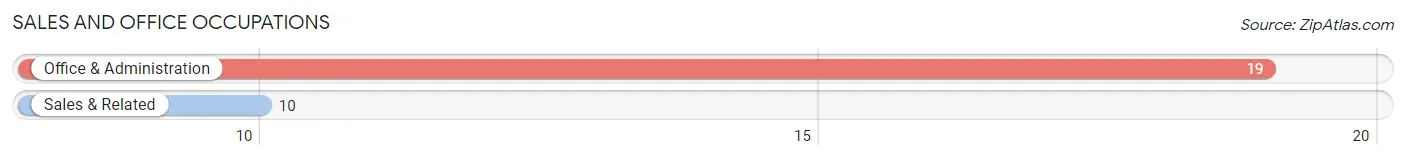
Sales and Office Occupations
The most common Sales and Office occupations in McPherson County are Office & Administration (19 | 7.5%), and Sales & Related (10 | 4.0%).
Sales and Office Occupations by Sex
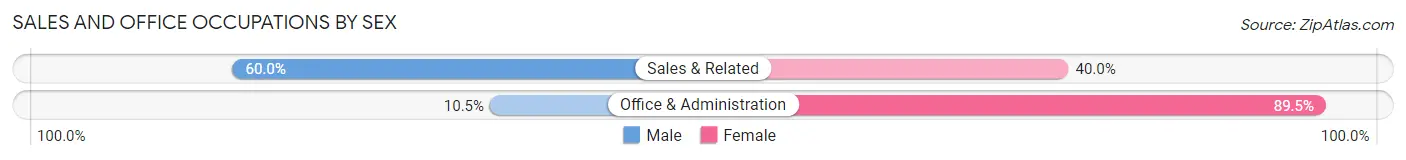
| Occupation | Male | Female |
| Sales & Related | 6 (60.0%) | 4 (40.0%) |
| Office & Administration | 2 (10.5%) | 17 (89.5%) |
| Total (Category) | 8 (27.6%) | 21 (72.4%) |
| Total (Overall) | 142 (56.4%) | 110 (43.6%) |
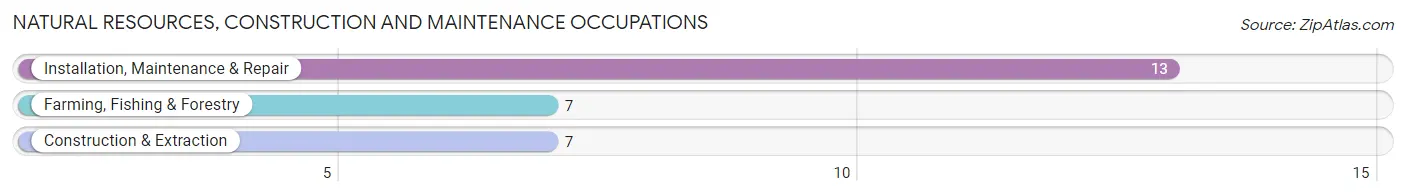
Natural Resources, Construction and Maintenance Occupations
The most common Natural Resources, Construction and Maintenance occupations in McPherson County are Installation, Maintenance & Repair (13 | 5.2%), Farming, Fishing & Forestry (7 | 2.8%), and Construction & Extraction (7 | 2.8%).
Natural Resources, Construction and Maintenance Occupations by Sex
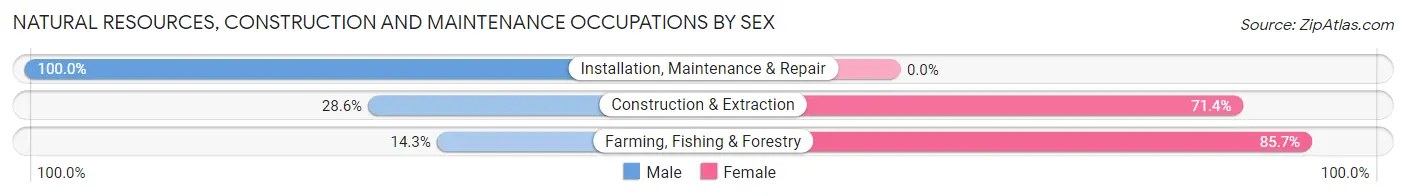
| Occupation | Male | Female |
| Farming, Fishing & Forestry | 1 (14.3%) | 6 (85.7%) |
| Construction & Extraction | 2 (28.6%) | 5 (71.4%) |
| Installation, Maintenance & Repair | 13 (100.0%) | 0 (0.0%) |
| Total (Category) | 16 (59.3%) | 11 (40.7%) |
| Total (Overall) | 142 (56.4%) | 110 (43.6%) |
Production, Transportation and Moving Occupations
The most common Production, Transportation and Moving occupations in McPherson County are Transportation (27 | 10.7%), Production (4 | 1.6%), and Material Moving (4 | 1.6%).
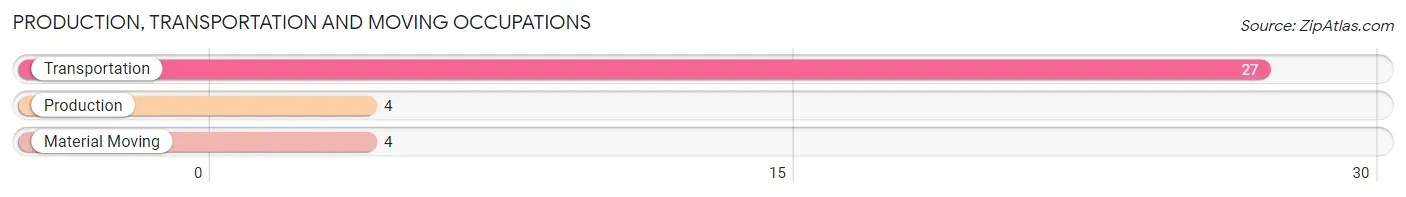
Production, Transportation and Moving Occupations by Sex
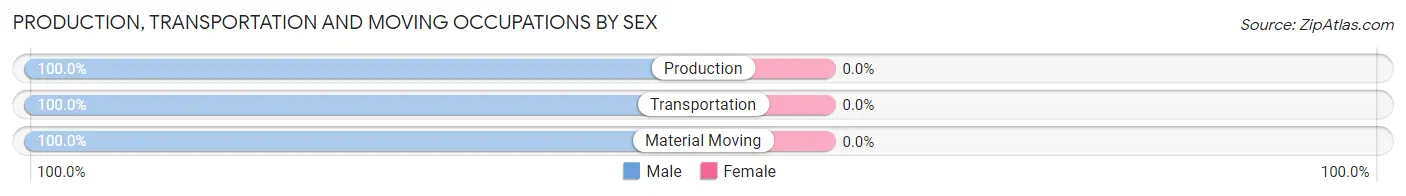
| Occupation | Male | Female |
| Production | 4 (100.0%) | 0 (0.0%) |
| Transportation | 27 (100.0%) | 0 (0.0%) |
| Material Moving | 4 (100.0%) | 0 (0.0%) |
| Total (Category) | 35 (100.0%) | 0 (0.0%) |
| Total (Overall) | 142 (56.4%) | 110 (43.6%) |
Employment Industries by Sex in McPherson County
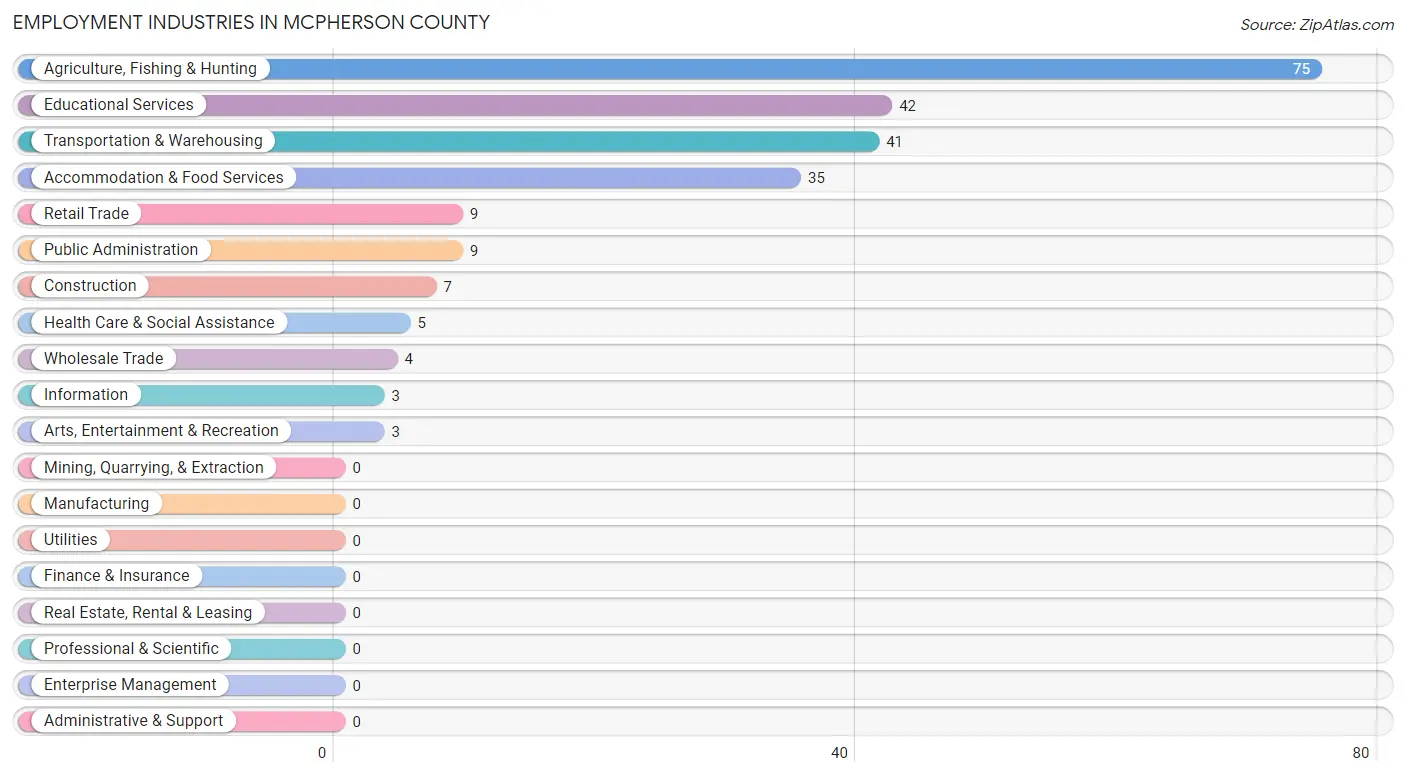
Employment Industries in McPherson County
The major employment industries in McPherson County include Agriculture, Fishing & Hunting (75 | 29.8%), Educational Services (42 | 16.7%), Transportation & Warehousing (41 | 16.3%), Accommodation & Food Services (35 | 13.9%), and Retail Trade (9 | 3.6%).
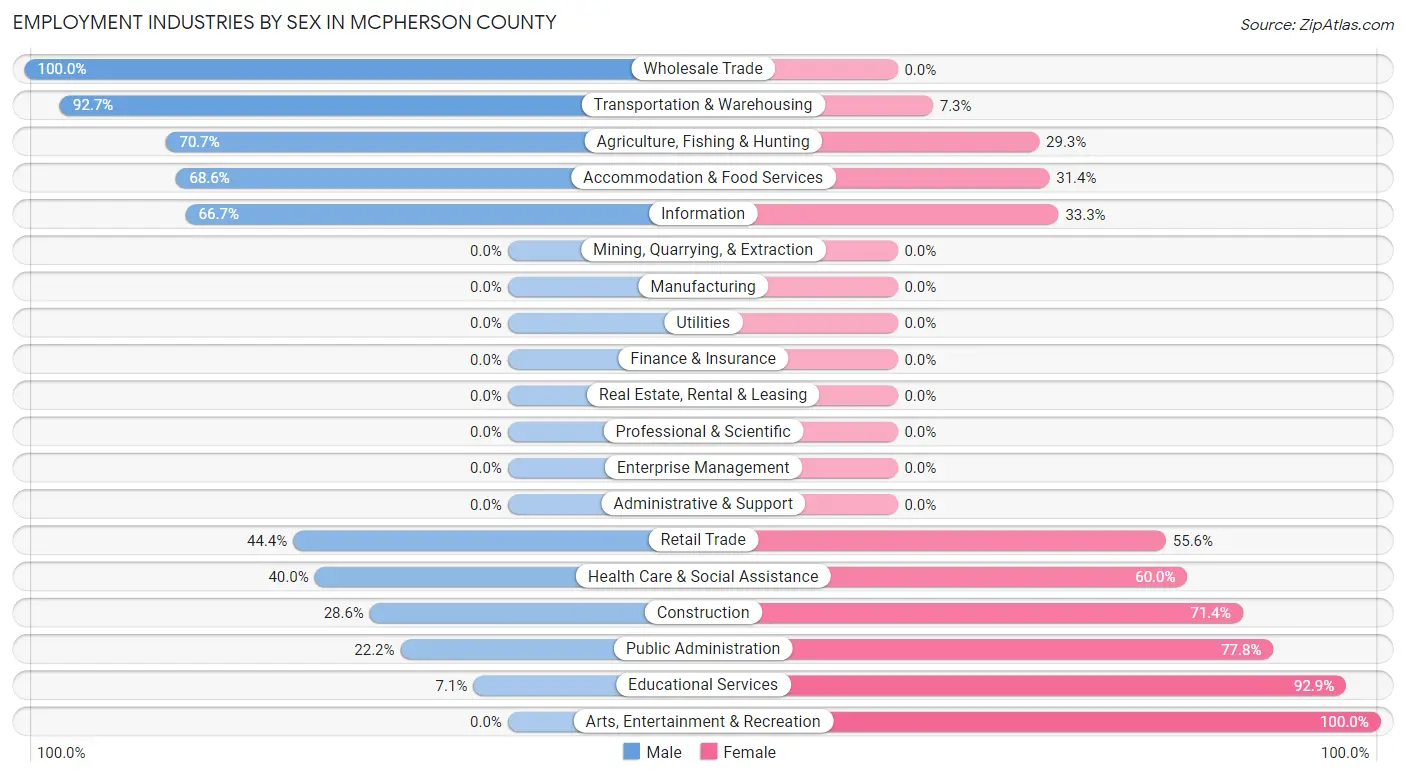
Employment Industries by Sex in McPherson County
The McPherson County industries that see more men than women are Wholesale Trade (100.0%), Transportation & Warehousing (92.7%), and Agriculture, Fishing & Hunting (70.7%), whereas the industries that tend to have a higher number of women are Arts, Entertainment & Recreation (100.0%), Educational Services (92.9%), and Public Administration (77.8%).
| Industry | Male | Female |
| Agriculture, Fishing & Hunting | 53 (70.7%) | 22 (29.3%) |
| Mining, Quarrying, & Extraction | 0 (0.0%) | 0 (0.0%) |
| Construction | 2 (28.6%) | 5 (71.4%) |
| Manufacturing | 0 (0.0%) | 0 (0.0%) |
| Wholesale Trade | 4 (100.0%) | 0 (0.0%) |
| Retail Trade | 4 (44.4%) | 5 (55.6%) |
| Transportation & Warehousing | 38 (92.7%) | 3 (7.3%) |
| Utilities | 0 (0.0%) | 0 (0.0%) |
| Information | 2 (66.7%) | 1 (33.3%) |
| Finance & Insurance | 0 (0.0%) | 0 (0.0%) |
| Real Estate, Rental & Leasing | 0 (0.0%) | 0 (0.0%) |
| Professional & Scientific | 0 (0.0%) | 0 (0.0%) |
| Enterprise Management | 0 (0.0%) | 0 (0.0%) |
| Administrative & Support | 0 (0.0%) | 0 (0.0%) |
| Educational Services | 3 (7.1%) | 39 (92.9%) |
| Health Care & Social Assistance | 2 (40.0%) | 3 (60.0%) |
| Arts, Entertainment & Recreation | 0 (0.0%) | 3 (100.0%) |
| Accommodation & Food Services | 24 (68.6%) | 11 (31.4%) |
| Public Administration | 2 (22.2%) | 7 (77.8%) |
| Total | 142 (56.4%) | 110 (43.6%) |
Education in McPherson County
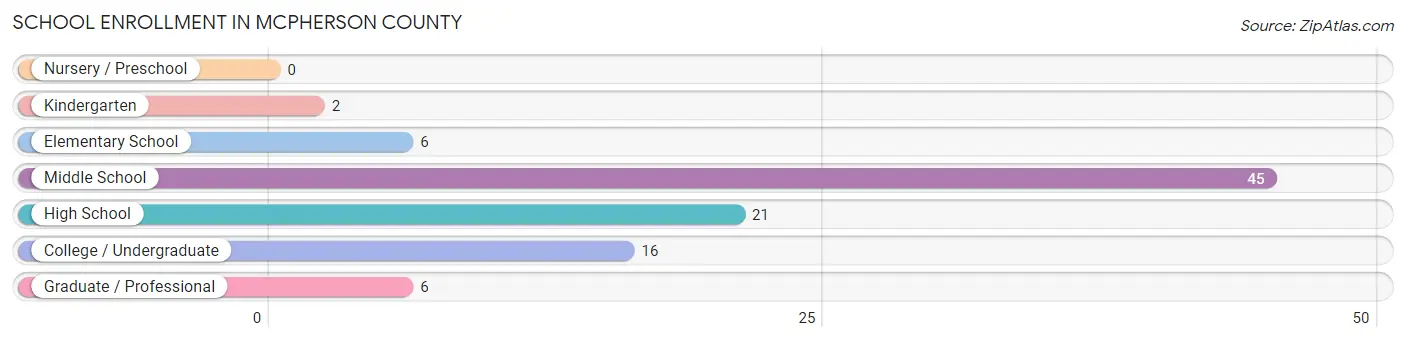
School Enrollment in McPherson County
The most common levels of schooling among the 96 students in McPherson County are middle school (45 | 46.9%), high school (21 | 21.9%), and college / undergraduate (16 | 16.7%).
| School Level | # Students | % Students |
| Nursery / Preschool | 0 | 0.0% |
| Kindergarten | 2 | 2.1% |
| Elementary School | 6 | 6.2% |
| Middle School | 45 | 46.9% |
| High School | 21 | 21.9% |
| College / Undergraduate | 16 | 16.7% |
| Graduate / Professional | 6 | 6.2% |
| Total | 96 | 100.0% |
School Enrollment by Age by Funding Source in McPherson County
Out of a total of 96 students who are enrolled in schools in McPherson County, 10 (10.4%) attend a private institution, while the remaining 86 (89.6%) are enrolled in public schools. The age group of 35 years and over has the highest likelihood of being enrolled in private schools, with 3 (25.0% in the age bracket) enrolled. Conversely, the age group of 5 to 9 year old has the lowest likelihood of being enrolled in a private school, with 4 (100.0% in the age bracket) attending a public institution.
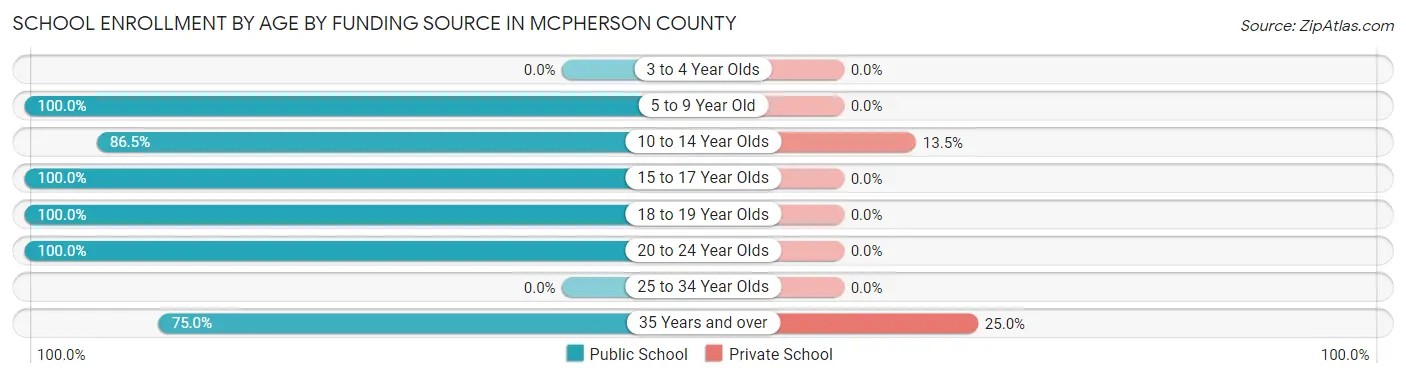
| Age Bracket | Public School | Private School |
| 3 to 4 Year Olds | 0 (0.0%) | 0 (0.0%) |
| 5 to 9 Year Old | 4 (100.0%) | 0 (0.0%) |
| 10 to 14 Year Olds | 45 (86.5%) | 7 (13.5%) |
| 15 to 17 Year Olds | 13 (100.0%) | 0 (0.0%) |
| 18 to 19 Year Olds | 7 (100.0%) | 0 (0.0%) |
| 20 to 24 Year Olds | 8 (100.0%) | 0 (0.0%) |
| 25 to 34 Year Olds | 0 (0.0%) | 0 (0.0%) |
| 35 Years and over | 9 (75.0%) | 3 (25.0%) |
| Total | 86 (89.6%) | 10 (10.4%) |
Educational Attainment by Field of Study in McPherson County
Education (19 | 32.2%), bio, nature & agricultural (17 | 28.8%), psychology (7 | 11.9%), social sciences (5 | 8.5%), and liberal arts & history (4 | 6.8%) are the most common fields of study among 59 individuals in McPherson County who have obtained a bachelor's degree or higher.
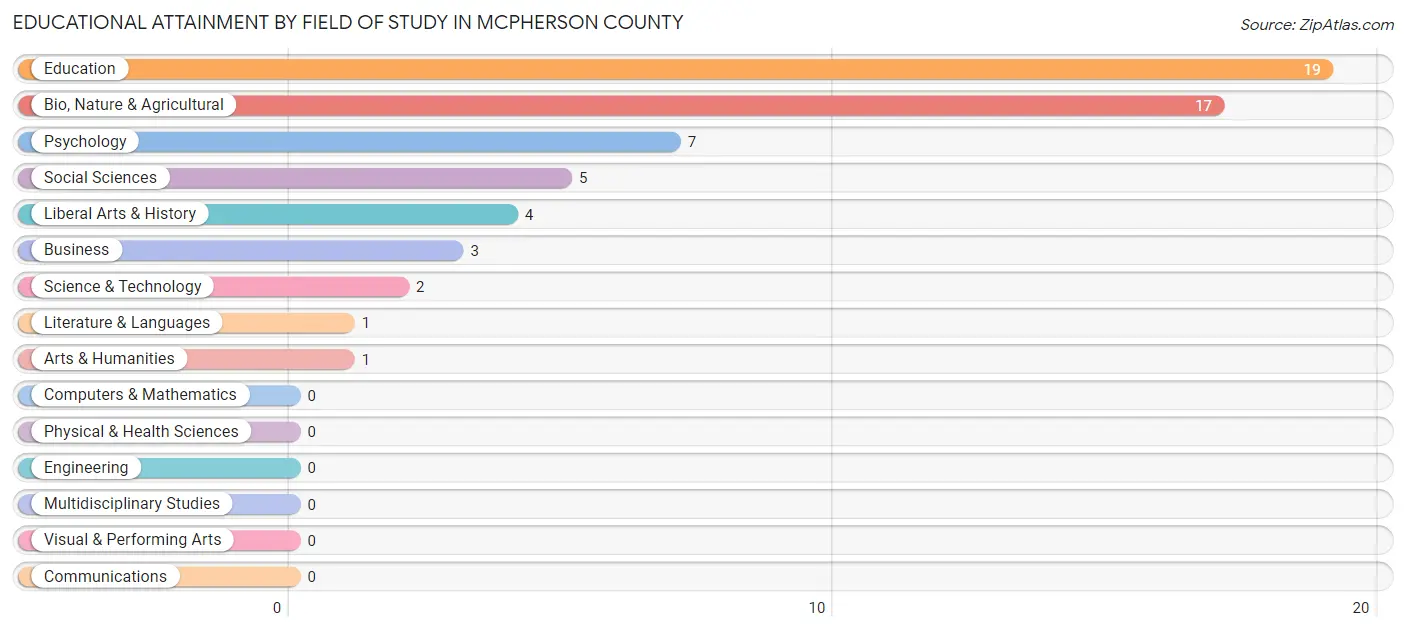
| Field of Study | # Graduates | % Graduates |
| Computers & Mathematics | 0 | 0.0% |
| Bio, Nature & Agricultural | 17 | 28.8% |
| Physical & Health Sciences | 0 | 0.0% |
| Psychology | 7 | 11.9% |
| Social Sciences | 5 | 8.5% |
| Engineering | 0 | 0.0% |
| Multidisciplinary Studies | 0 | 0.0% |
| Science & Technology | 2 | 3.4% |
| Business | 3 | 5.1% |
| Education | 19 | 32.2% |
| Literature & Languages | 1 | 1.7% |
| Liberal Arts & History | 4 | 6.8% |
| Visual & Performing Arts | 0 | 0.0% |
| Communications | 0 | 0.0% |
| Arts & Humanities | 1 | 1.7% |
| Total | 59 | 100.0% |
Transportation & Commute in McPherson County
Vehicle Availability by Sex in McPherson County
The most prevalent vehicle ownership categories in McPherson County are males with 2 vehicles (47, accounting for 33.1%) and females with 2 vehicles (29, making up 42.7%).
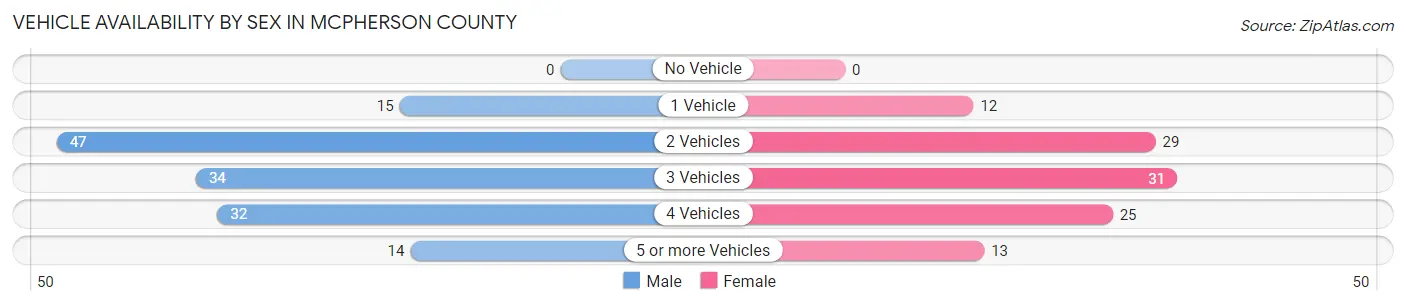
| Vehicles Available | Male | Female |
| No Vehicle | 0 (0.0%) | 0 (0.0%) |
| 1 Vehicle | 15 (10.6%) | 12 (10.9%) |
| 2 Vehicles | 47 (33.1%) | 29 (26.4%) |
| 3 Vehicles | 34 (23.9%) | 31 (28.2%) |
| 4 Vehicles | 32 (22.5%) | 25 (22.7%) |
| 5 or more Vehicles | 14 (9.9%) | 13 (11.8%) |
| Total | 142 (100.0%) | 110 (100.0%) |
Commute Time in McPherson County
The most frequently occuring commute durations in McPherson County are 5 to 9 minutes (46 commuters, 23.2%), less than 5 minutes (40 commuters, 20.2%), and 45 to 59 minutes (34 commuters, 17.2%).
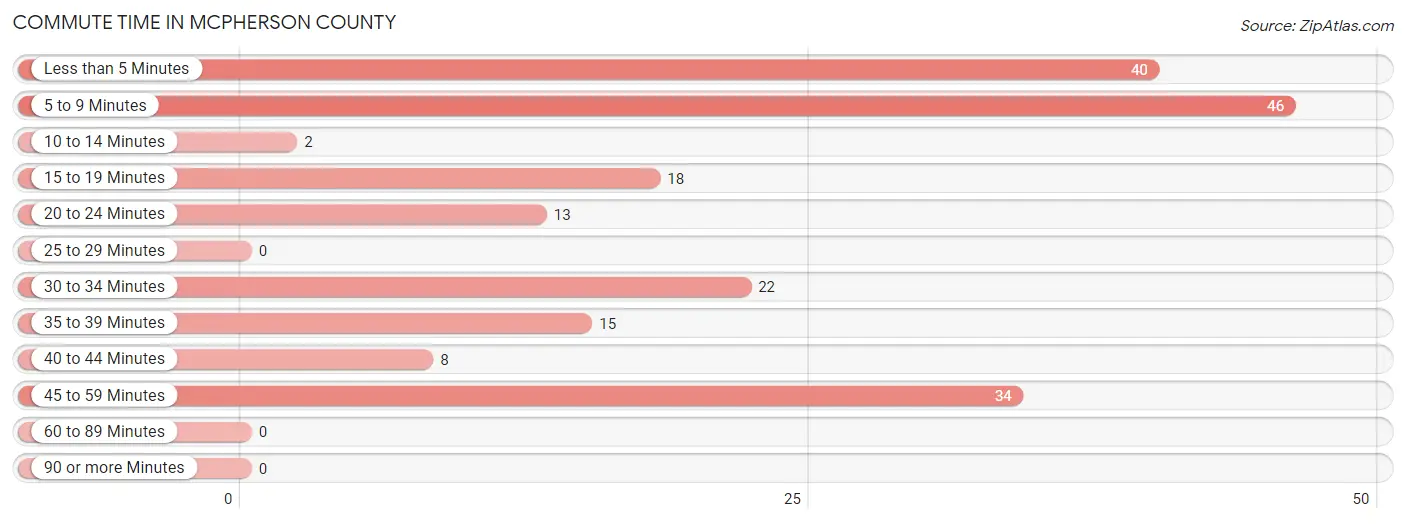
| Commute Time | # Commuters | % Commuters |
| Less than 5 Minutes | 40 | 20.2% |
| 5 to 9 Minutes | 46 | 23.2% |
| 10 to 14 Minutes | 2 | 1.0% |
| 15 to 19 Minutes | 18 | 9.1% |
| 20 to 24 Minutes | 13 | 6.6% |
| 25 to 29 Minutes | 0 | 0.0% |
| 30 to 34 Minutes | 22 | 11.1% |
| 35 to 39 Minutes | 15 | 7.6% |
| 40 to 44 Minutes | 8 | 4.0% |
| 45 to 59 Minutes | 34 | 17.2% |
| 60 to 89 Minutes | 0 | 0.0% |
| 90 or more Minutes | 0 | 0.0% |
Commute Time by Sex in McPherson County
The most common commute times in McPherson County are 5 to 9 minutes (35 commuters, 30.7%) for males and 15 to 19 minutes (17 commuters, 20.2%) for females.
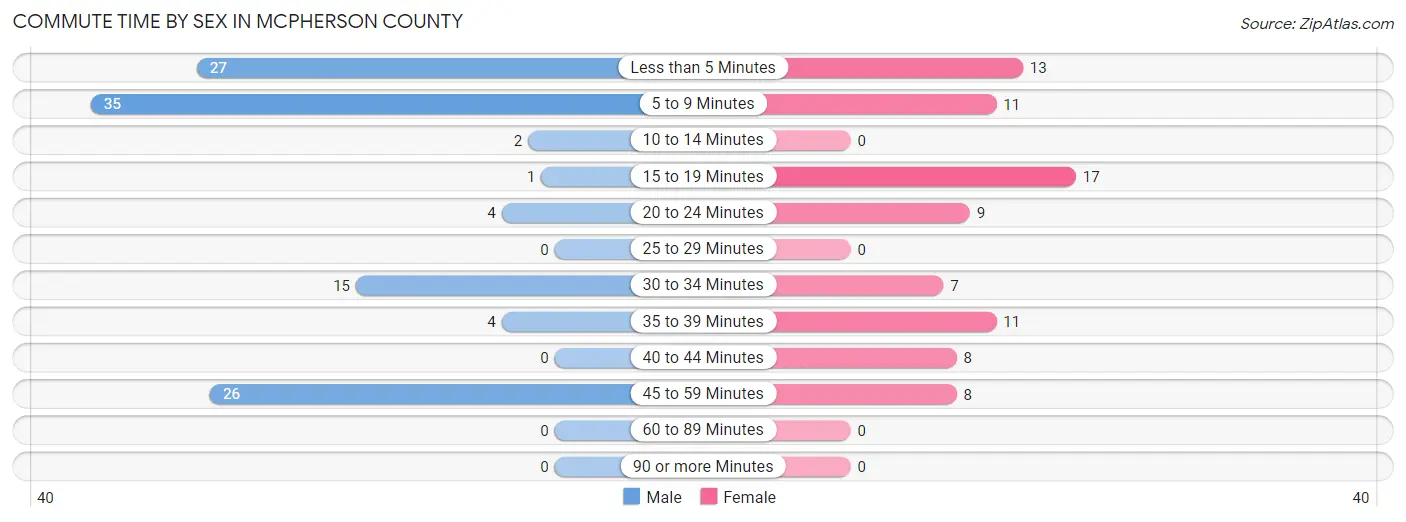
| Commute Time | Male | Female |
| Less than 5 Minutes | 27 (23.7%) | 13 (15.5%) |
| 5 to 9 Minutes | 35 (30.7%) | 11 (13.1%) |
| 10 to 14 Minutes | 2 (1.8%) | 0 (0.0%) |
| 15 to 19 Minutes | 1 (0.9%) | 17 (20.2%) |
| 20 to 24 Minutes | 4 (3.5%) | 9 (10.7%) |
| 25 to 29 Minutes | 0 (0.0%) | 0 (0.0%) |
| 30 to 34 Minutes | 15 (13.2%) | 7 (8.3%) |
| 35 to 39 Minutes | 4 (3.5%) | 11 (13.1%) |
| 40 to 44 Minutes | 0 (0.0%) | 8 (9.5%) |
| 45 to 59 Minutes | 26 (22.8%) | 8 (9.5%) |
| 60 to 89 Minutes | 0 (0.0%) | 0 (0.0%) |
| 90 or more Minutes | 0 (0.0%) | 0 (0.0%) |
Time of Departure to Work by Sex in McPherson County
The most frequent times of departure to work in McPherson County are 4:00 PM to 11:59 PM (28, 24.6%) for males and 7:00 AM to 7:29 AM (27, 32.1%) for females.
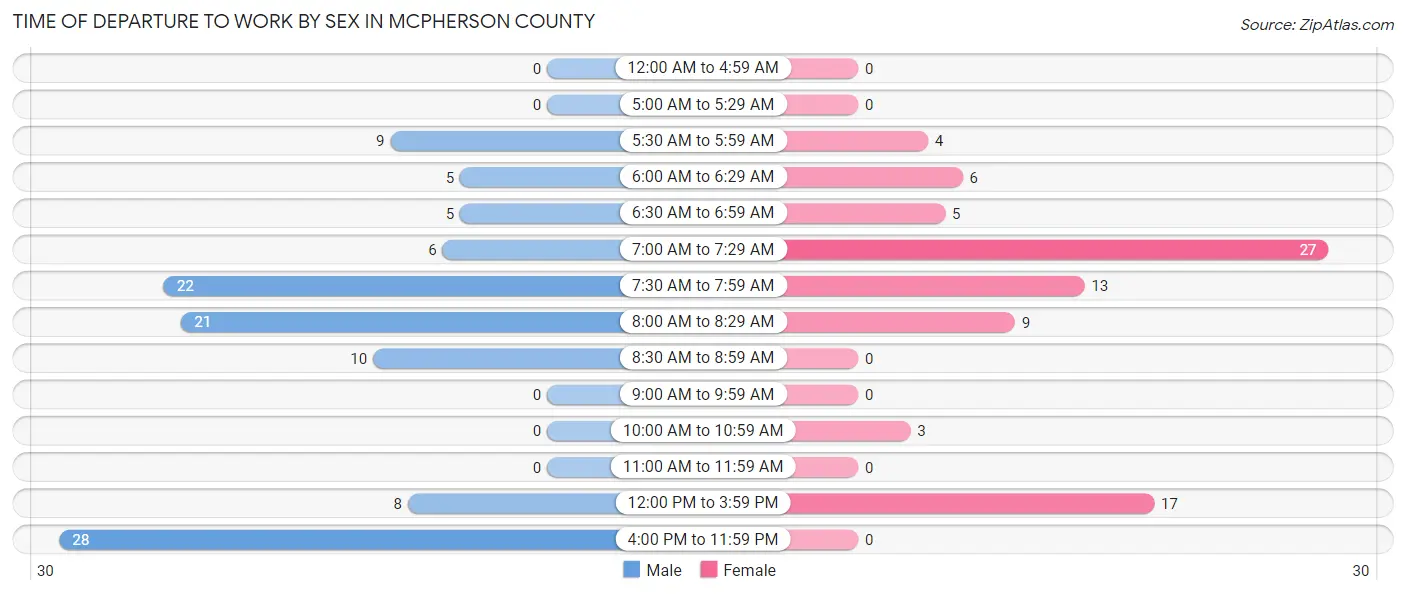
| Time of Departure | Male | Female |
| 12:00 AM to 4:59 AM | 0 (0.0%) | 0 (0.0%) |
| 5:00 AM to 5:29 AM | 0 (0.0%) | 0 (0.0%) |
| 5:30 AM to 5:59 AM | 9 (7.9%) | 4 (4.8%) |
| 6:00 AM to 6:29 AM | 5 (4.4%) | 6 (7.1%) |
| 6:30 AM to 6:59 AM | 5 (4.4%) | 5 (5.9%) |
| 7:00 AM to 7:29 AM | 6 (5.3%) | 27 (32.1%) |
| 7:30 AM to 7:59 AM | 22 (19.3%) | 13 (15.5%) |
| 8:00 AM to 8:29 AM | 21 (18.4%) | 9 (10.7%) |
| 8:30 AM to 8:59 AM | 10 (8.8%) | 0 (0.0%) |
| 9:00 AM to 9:59 AM | 0 (0.0%) | 0 (0.0%) |
| 10:00 AM to 10:59 AM | 0 (0.0%) | 3 (3.6%) |
| 11:00 AM to 11:59 AM | 0 (0.0%) | 0 (0.0%) |
| 12:00 PM to 3:59 PM | 8 (7.0%) | 17 (20.2%) |
| 4:00 PM to 11:59 PM | 28 (24.6%) | 0 (0.0%) |
| Total | 114 (100.0%) | 84 (100.0%) |
Housing Occupancy in McPherson County
Occupancy by Ownership in McPherson County
Of the total 193 dwellings in McPherson County, owner-occupied units account for 148 (76.7%), while renter-occupied units make up 45 (23.3%).
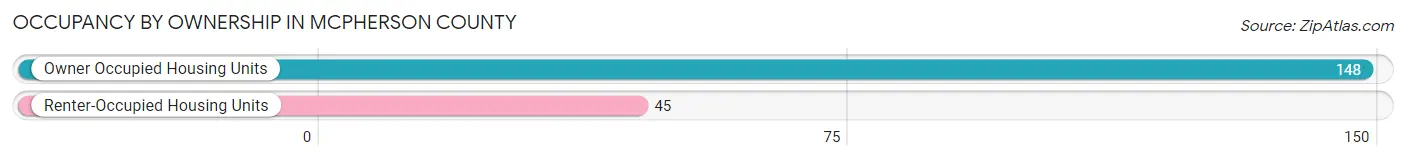
| Occupancy | # Housing Units | % Housing Units |
| Owner Occupied Housing Units | 148 | 76.7% |
| Renter-Occupied Housing Units | 45 | 23.3% |
| Total Occupied Housing Units | 193 | 100.0% |
Occupancy by Household Size in McPherson County
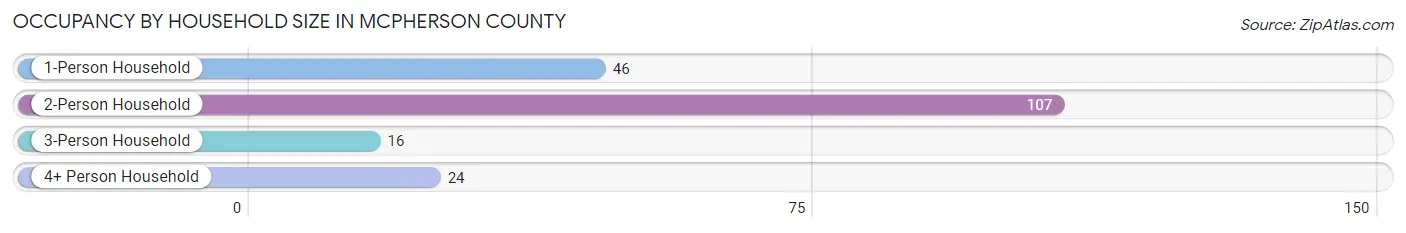
| Household Size | # Housing Units | % Housing Units |
| 1-Person Household | 46 | 23.8% |
| 2-Person Household | 107 | 55.4% |
| 3-Person Household | 16 | 8.3% |
| 4+ Person Household | 24 | 12.4% |
| Total Housing Units | 193 | 100.0% |
Occupancy by Ownership by Household Size in McPherson County
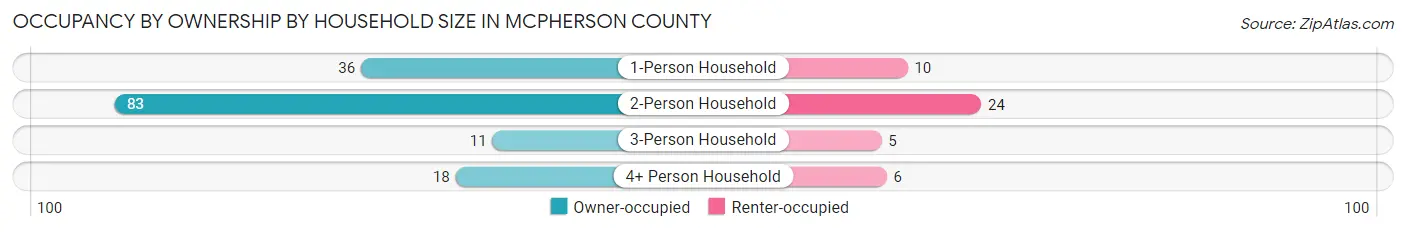
| Household Size | Owner-occupied | Renter-occupied |
| 1-Person Household | 36 (78.3%) | 10 (21.7%) |
| 2-Person Household | 83 (77.6%) | 24 (22.4%) |
| 3-Person Household | 11 (68.8%) | 5 (31.2%) |
| 4+ Person Household | 18 (75.0%) | 6 (25.0%) |
| Total Housing Units | 148 (76.7%) | 45 (23.3%) |
Occupancy by Educational Attainment in McPherson County
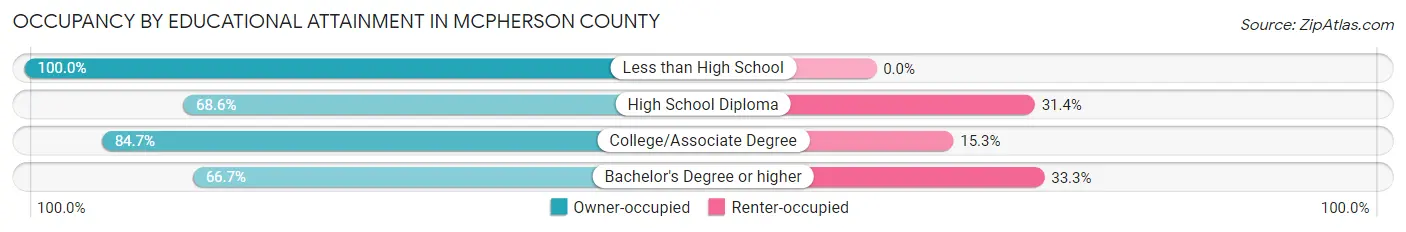
| Household Size | Owner-occupied | Renter-occupied |
| Less than High School | 8 (100.0%) | 0 (0.0%) |
| High School Diploma | 48 (68.6%) | 22 (31.4%) |
| College/Associate Degree | 72 (84.7%) | 13 (15.3%) |
| Bachelor's Degree or higher | 20 (66.7%) | 10 (33.3%) |
Occupancy by Age of Householder in McPherson County
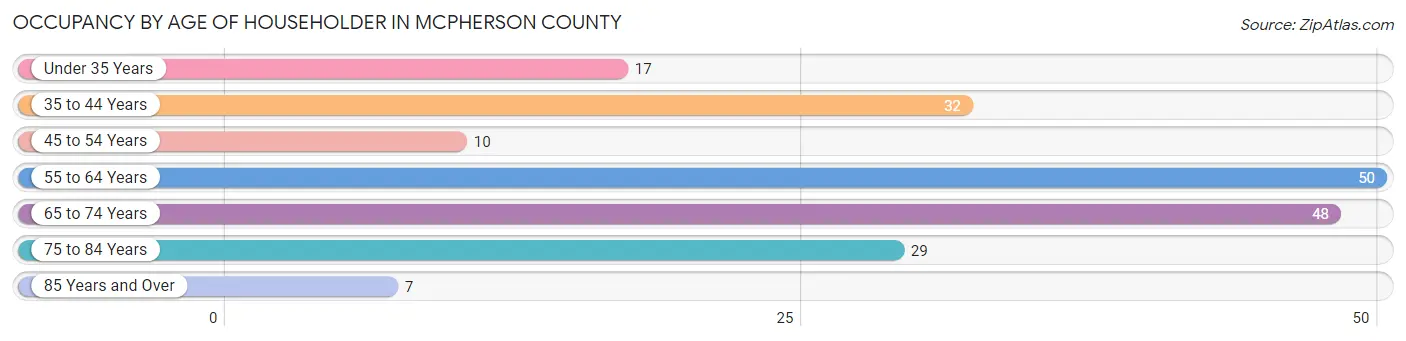
| Age Bracket | # Households | % Households |
| Under 35 Years | 17 | 8.8% |
| 35 to 44 Years | 32 | 16.6% |
| 45 to 54 Years | 10 | 5.2% |
| 55 to 64 Years | 50 | 25.9% |
| 65 to 74 Years | 48 | 24.9% |
| 75 to 84 Years | 29 | 15.0% |
| 85 Years and Over | 7 | 3.6% |
| Total | 193 | 100.0% |
Housing Finances in McPherson County
Median Income by Occupancy in McPherson County
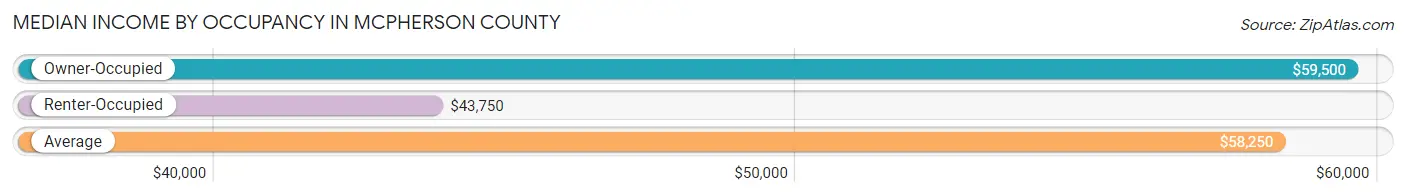
| Occupancy Type | # Households | Median Income |
| Owner-Occupied | 148 (76.7%) | $59,500 |
| Renter-Occupied | 45 (23.3%) | $43,750 |
| Average | 193 (100.0%) | $58,250 |
Occupancy by Householder Income Bracket in McPherson County
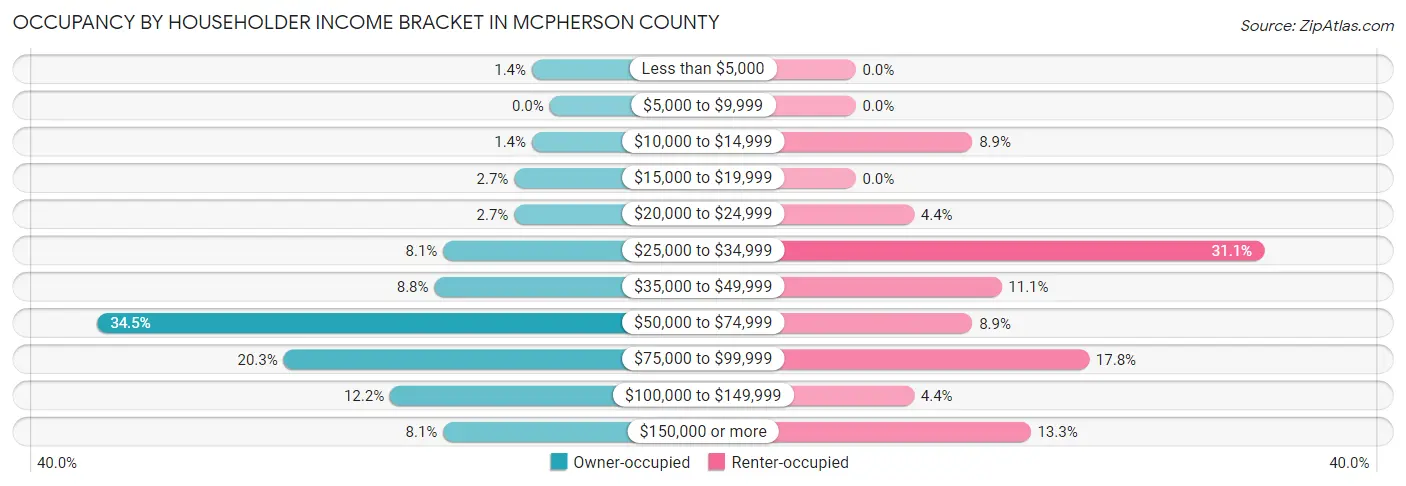
| Income Bracket | Owner-occupied | Renter-occupied |
| Less than $5,000 | 2 (1.3%) | 0 (0.0%) |
| $5,000 to $9,999 | 0 (0.0%) | 0 (0.0%) |
| $10,000 to $14,999 | 2 (1.3%) | 4 (8.9%) |
| $15,000 to $19,999 | 4 (2.7%) | 0 (0.0%) |
| $20,000 to $24,999 | 4 (2.7%) | 2 (4.4%) |
| $25,000 to $34,999 | 12 (8.1%) | 14 (31.1%) |
| $35,000 to $49,999 | 13 (8.8%) | 5 (11.1%) |
| $50,000 to $74,999 | 51 (34.5%) | 4 (8.9%) |
| $75,000 to $99,999 | 30 (20.3%) | 8 (17.8%) |
| $100,000 to $149,999 | 18 (12.2%) | 2 (4.4%) |
| $150,000 or more | 12 (8.1%) | 6 (13.3%) |
| Total | 148 (100.0%) | 45 (100.0%) |
Monthly Housing Cost Tiers in McPherson County
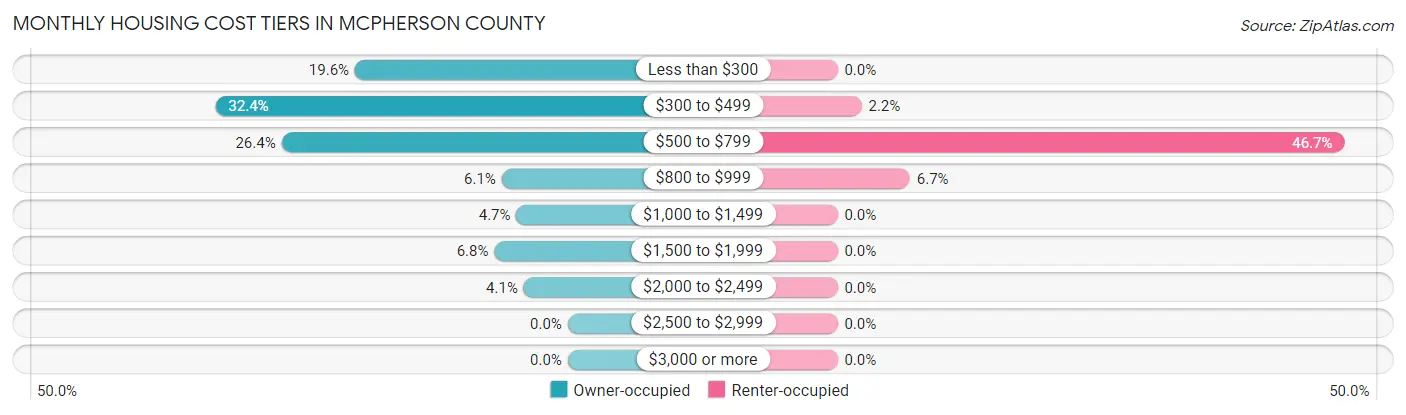
| Monthly Cost | Owner-occupied | Renter-occupied |
| Less than $300 | 29 (19.6%) | 0 (0.0%) |
| $300 to $499 | 48 (32.4%) | 1 (2.2%) |
| $500 to $799 | 39 (26.4%) | 21 (46.7%) |
| $800 to $999 | 9 (6.1%) | 3 (6.7%) |
| $1,000 to $1,499 | 7 (4.7%) | 0 (0.0%) |
| $1,500 to $1,999 | 10 (6.8%) | 0 (0.0%) |
| $2,000 to $2,499 | 6 (4.1%) | 0 (0.0%) |
| $2,500 to $2,999 | 0 (0.0%) | 0 (0.0%) |
| $3,000 or more | 0 (0.0%) | 0 (0.0%) |
| Total | 148 (100.0%) | 45 (100.0%) |
Physical Housing Characteristics in McPherson County
Housing Structures in McPherson County
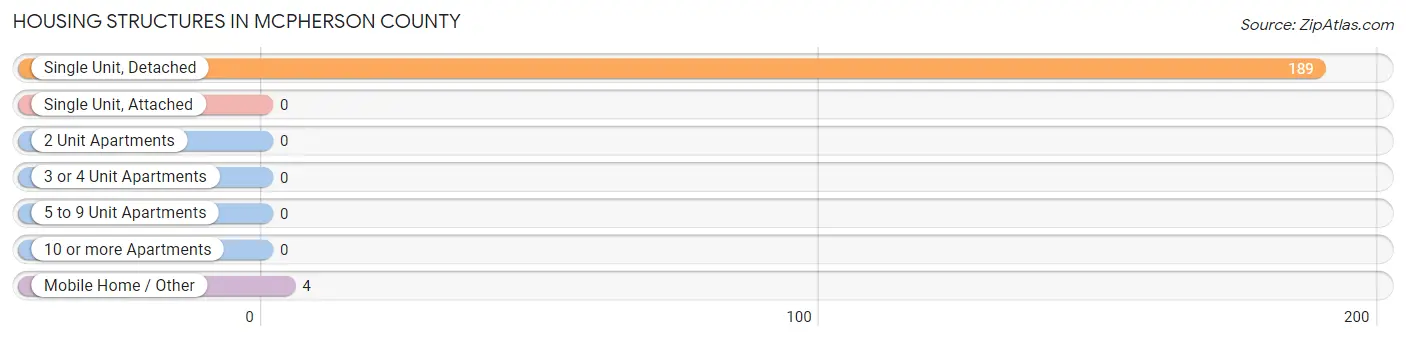
| Structure Type | # Housing Units | % Housing Units |
| Single Unit, Detached | 189 | 97.9% |
| Single Unit, Attached | 0 | 0.0% |
| 2 Unit Apartments | 0 | 0.0% |
| 3 or 4 Unit Apartments | 0 | 0.0% |
| 5 to 9 Unit Apartments | 0 | 0.0% |
| 10 or more Apartments | 0 | 0.0% |
| Mobile Home / Other | 4 | 2.1% |
| Total | 193 | 100.0% |
Housing Structures by Occupancy in McPherson County
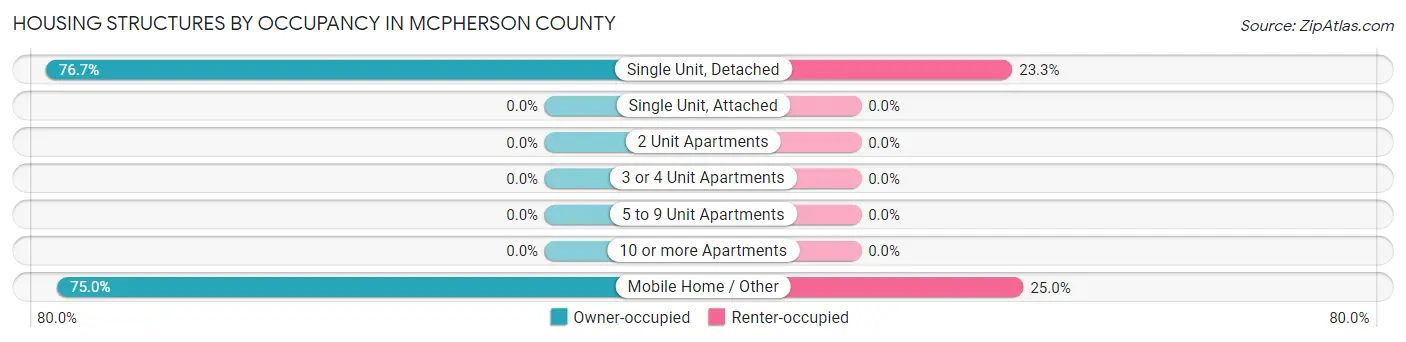
| Structure Type | Owner-occupied | Renter-occupied |
| Single Unit, Detached | 145 (76.7%) | 44 (23.3%) |
| Single Unit, Attached | 0 (0.0%) | 0 (0.0%) |
| 2 Unit Apartments | 0 (0.0%) | 0 (0.0%) |
| 3 or 4 Unit Apartments | 0 (0.0%) | 0 (0.0%) |
| 5 to 9 Unit Apartments | 0 (0.0%) | 0 (0.0%) |
| 10 or more Apartments | 0 (0.0%) | 0 (0.0%) |
| Mobile Home / Other | 3 (75.0%) | 1 (25.0%) |
| Total | 148 (76.7%) | 45 (23.3%) |
Housing Structures by Number of Rooms in McPherson County
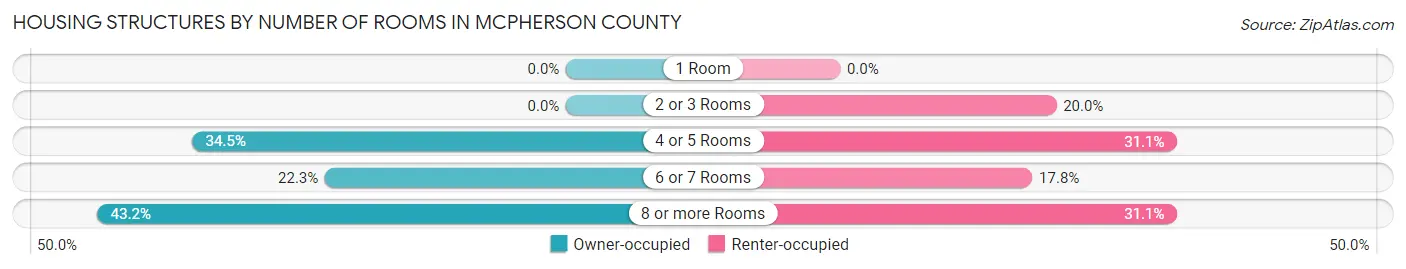
| Number of Rooms | Owner-occupied | Renter-occupied |
| 1 Room | 0 (0.0%) | 0 (0.0%) |
| 2 or 3 Rooms | 0 (0.0%) | 9 (20.0%) |
| 4 or 5 Rooms | 51 (34.5%) | 14 (31.1%) |
| 6 or 7 Rooms | 33 (22.3%) | 8 (17.8%) |
| 8 or more Rooms | 64 (43.2%) | 14 (31.1%) |
| Total | 148 (100.0%) | 45 (100.0%) |
Housing Structure by Heating Type in McPherson County
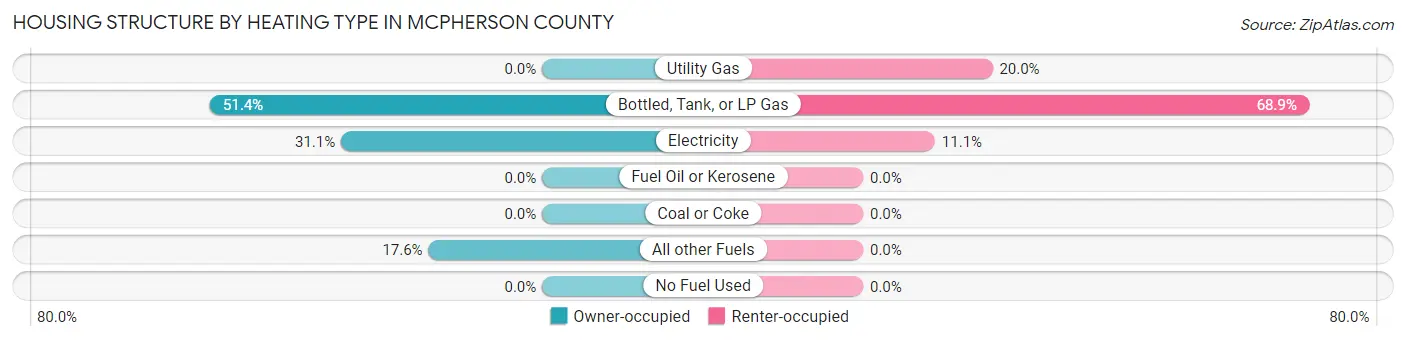
| Heating Type | Owner-occupied | Renter-occupied |
| Utility Gas | 0 (0.0%) | 9 (20.0%) |
| Bottled, Tank, or LP Gas | 76 (51.3%) | 31 (68.9%) |
| Electricity | 46 (31.1%) | 5 (11.1%) |
| Fuel Oil or Kerosene | 0 (0.0%) | 0 (0.0%) |
| Coal or Coke | 0 (0.0%) | 0 (0.0%) |
| All other Fuels | 26 (17.6%) | 0 (0.0%) |
| No Fuel Used | 0 (0.0%) | 0 (0.0%) |
| Total | 148 (100.0%) | 45 (100.0%) |
Household Vehicle Usage in McPherson County
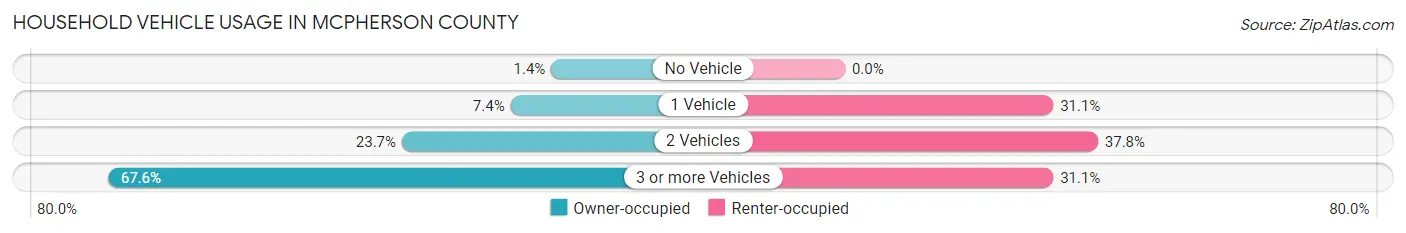
| Vehicles per Household | Owner-occupied | Renter-occupied |
| No Vehicle | 2 (1.3%) | 0 (0.0%) |
| 1 Vehicle | 11 (7.4%) | 14 (31.1%) |
| 2 Vehicles | 35 (23.6%) | 17 (37.8%) |
| 3 or more Vehicles | 100 (67.6%) | 14 (31.1%) |
| Total | 148 (100.0%) | 45 (100.0%) |
Real Estate & Mortgages in McPherson County
Real Estate and Mortgage Overview in McPherson County
| Characteristic | Without Mortgage | With Mortgage |
| Housing Units | 110 | 38 |
| Median Property Value | $102,900 | $137,500 |
| Median Household Income | $63,750 | $3 |
| Monthly Housing Costs | $410 | $0 |
| Real Estate Taxes | $880 | $2 |
Property Value by Mortgage Status in McPherson County
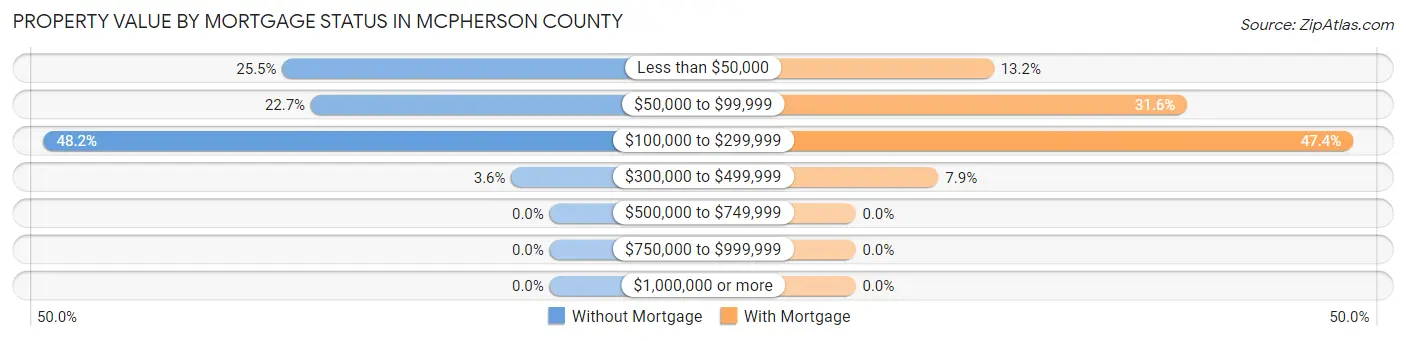
| Property Value | Without Mortgage | With Mortgage |
| Less than $50,000 | 28 (25.5%) | 5 (13.2%) |
| $50,000 to $99,999 | 25 (22.7%) | 12 (31.6%) |
| $100,000 to $299,999 | 53 (48.2%) | 18 (47.4%) |
| $300,000 to $499,999 | 4 (3.6%) | 3 (7.9%) |
| $500,000 to $749,999 | 0 (0.0%) | 0 (0.0%) |
| $750,000 to $999,999 | 0 (0.0%) | 0 (0.0%) |
| $1,000,000 or more | 0 (0.0%) | 0 (0.0%) |
| Total | 110 (100.0%) | 38 (100.0%) |
Household Income by Mortgage Status in McPherson County
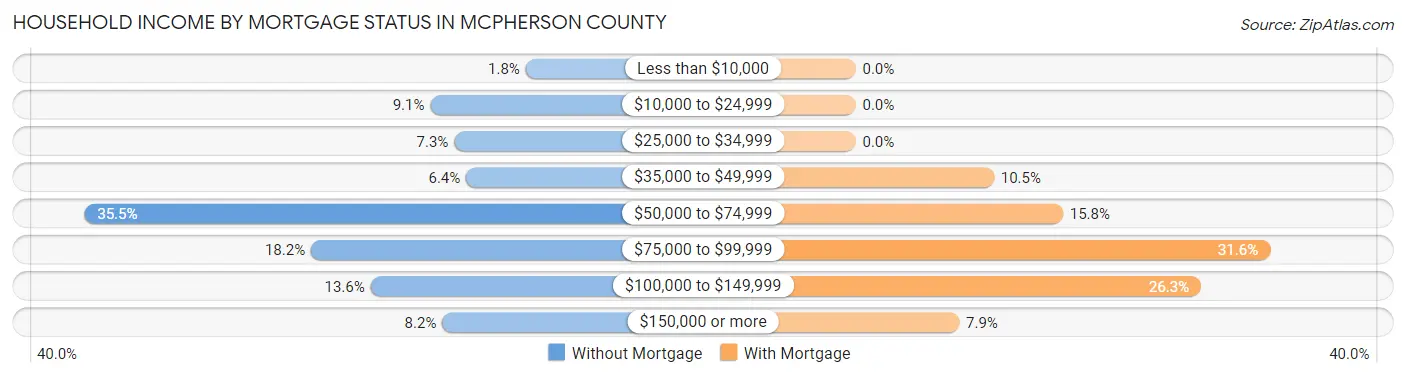
| Household Income | Without Mortgage | With Mortgage |
| Less than $10,000 | 2 (1.8%) | 0 (0.0%) |
| $10,000 to $24,999 | 10 (9.1%) | 0 (0.0%) |
| $25,000 to $34,999 | 8 (7.3%) | 0 (0.0%) |
| $35,000 to $49,999 | 7 (6.4%) | 4 (10.5%) |
| $50,000 to $74,999 | 39 (35.4%) | 6 (15.8%) |
| $75,000 to $99,999 | 20 (18.2%) | 12 (31.6%) |
| $100,000 to $149,999 | 15 (13.6%) | 10 (26.3%) |
| $150,000 or more | 9 (8.2%) | 3 (7.9%) |
| Total | 110 (100.0%) | 38 (100.0%) |
Property Value to Household Income Ratio in McPherson County
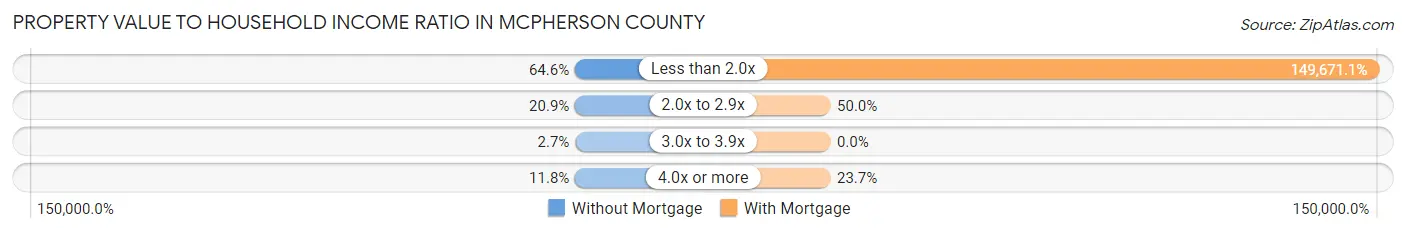
| Value-to-Income Ratio | Without Mortgage | With Mortgage |
| Less than 2.0x | 71 (64.5%) | 56,875 (149,671.0%) |
| 2.0x to 2.9x | 23 (20.9%) | 19 (50.0%) |
| 3.0x to 3.9x | 3 (2.7%) | 0 (0.0%) |
| 4.0x or more | 13 (11.8%) | 9 (23.7%) |
| Total | 110 (100.0%) | 38 (100.0%) |
Real Estate Taxes by Mortgage Status in McPherson County
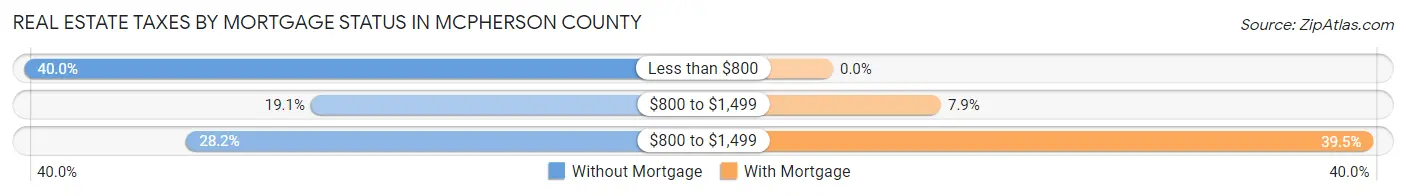
| Property Taxes | Without Mortgage | With Mortgage |
| Less than $800 | 44 (40.0%) | 0 (0.0%) |
| $800 to $1,499 | 21 (19.1%) | 3 (7.9%) |
| $800 to $1,499 | 31 (28.2%) | 15 (39.5%) |
| Total | 110 (100.0%) | 38 (100.0%) |
Health & Disability in McPherson County
Health Insurance Coverage by Age in McPherson County
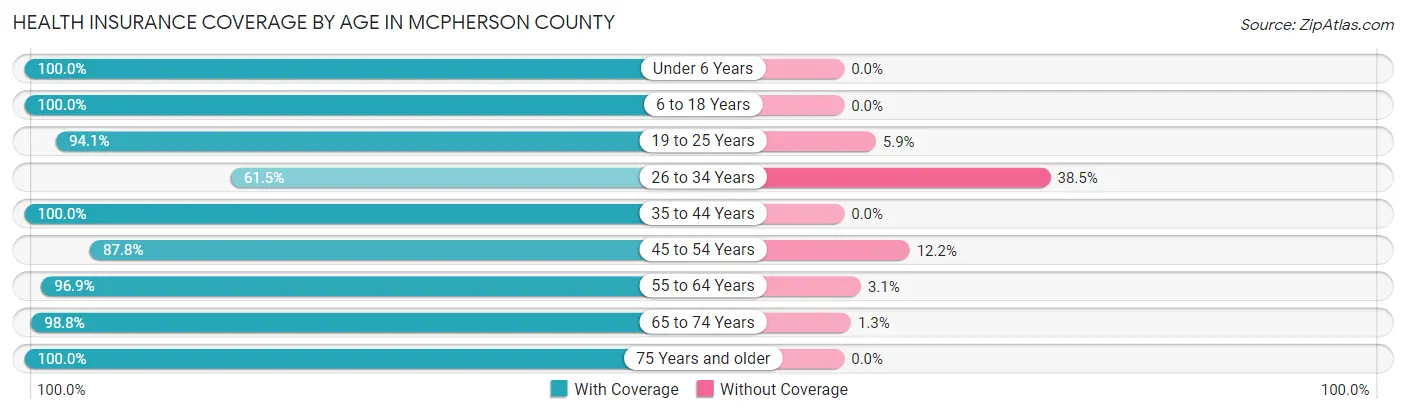
| Age Bracket | With Coverage | Without Coverage |
| Under 6 Years | 17 (100.0%) | 0 (0.0%) |
| 6 to 18 Years | 72 (100.0%) | 0 (0.0%) |
| 19 to 25 Years | 32 (94.1%) | 2 (5.9%) |
| 26 to 34 Years | 8 (61.5%) | 5 (38.5%) |
| 35 to 44 Years | 49 (100.0%) | 0 (0.0%) |
| 45 to 54 Years | 36 (87.8%) | 5 (12.2%) |
| 55 to 64 Years | 93 (96.9%) | 3 (3.1%) |
| 65 to 74 Years | 79 (98.8%) | 1 (1.3%) |
| 75 Years and older | 54 (100.0%) | 0 (0.0%) |
| Total | 440 (96.5%) | 16 (3.5%) |
Health Insurance Coverage by Citizenship Status in McPherson County
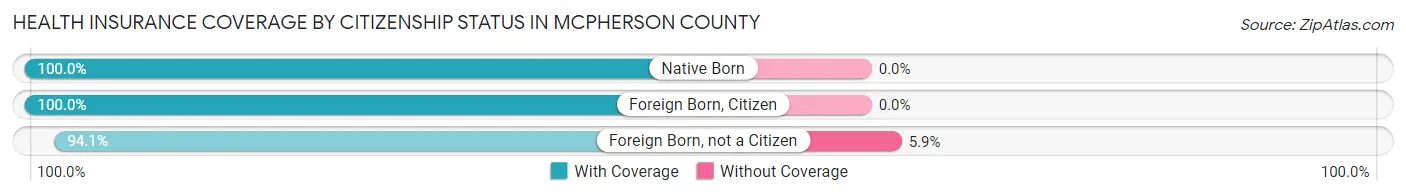
| Citizenship Status | With Coverage | Without Coverage |
| Native Born | 17 (100.0%) | 0 (0.0%) |
| Foreign Born, Citizen | 72 (100.0%) | 0 (0.0%) |
| Foreign Born, not a Citizen | 32 (94.1%) | 2 (5.9%) |
Health Insurance Coverage by Household Income in McPherson County
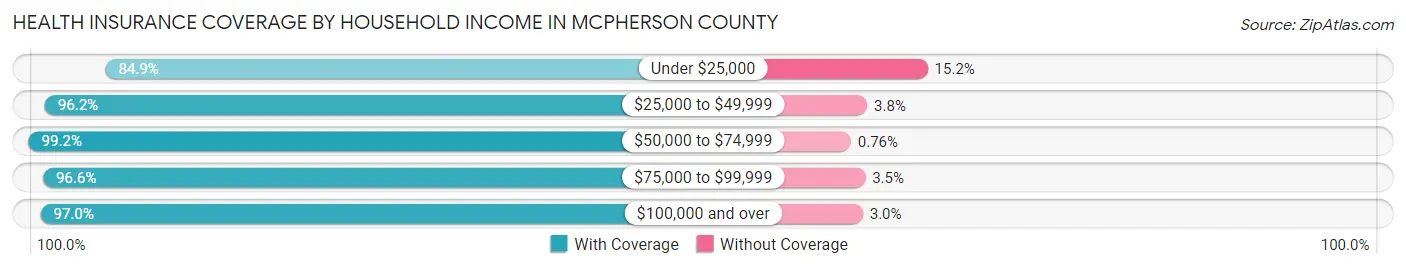
| Household Income | With Coverage | Without Coverage |
| Under $25,000 | 28 (84.9%) | 5 (15.1%) |
| $25,000 to $49,999 | 101 (96.2%) | 4 (3.8%) |
| $50,000 to $74,999 | 130 (99.2%) | 1 (0.8%) |
| $75,000 to $99,999 | 84 (96.6%) | 3 (3.5%) |
| $100,000 and over | 97 (97.0%) | 3 (3.0%) |
Public vs Private Health Insurance Coverage by Age in McPherson County
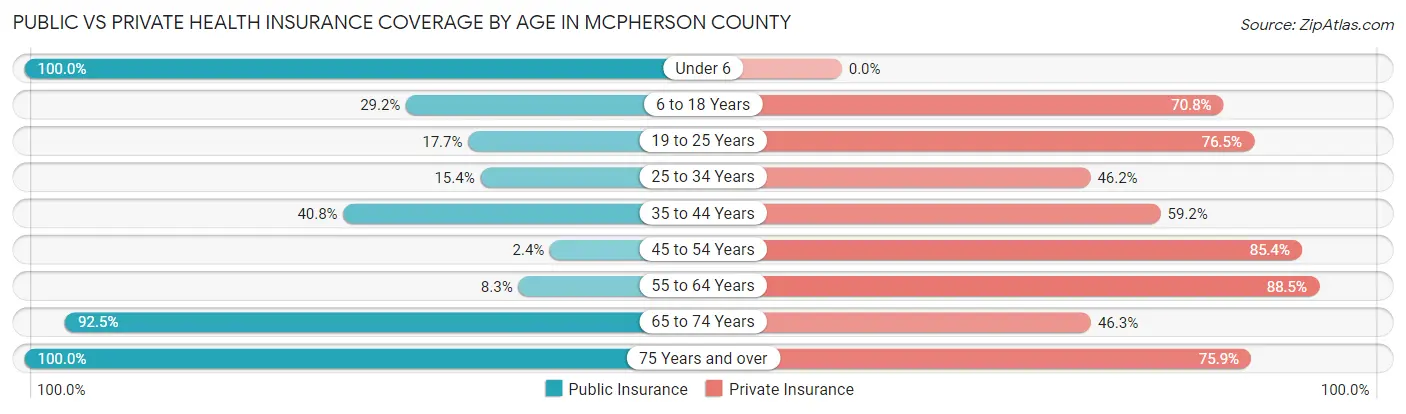
| Age Bracket | Public Insurance | Private Insurance |
| Under 6 | 17 (100.0%) | 0 (0.0%) |
| 6 to 18 Years | 21 (29.2%) | 51 (70.8%) |
| 19 to 25 Years | 6 (17.6%) | 26 (76.5%) |
| 25 to 34 Years | 2 (15.4%) | 6 (46.2%) |
| 35 to 44 Years | 20 (40.8%) | 29 (59.2%) |
| 45 to 54 Years | 1 (2.4%) | 35 (85.4%) |
| 55 to 64 Years | 8 (8.3%) | 85 (88.5%) |
| 65 to 74 Years | 74 (92.5%) | 37 (46.3%) |
| 75 Years and over | 54 (100.0%) | 41 (75.9%) |
| Total | 203 (44.5%) | 310 (68.0%) |
Disability Status by Sex by Age in McPherson County
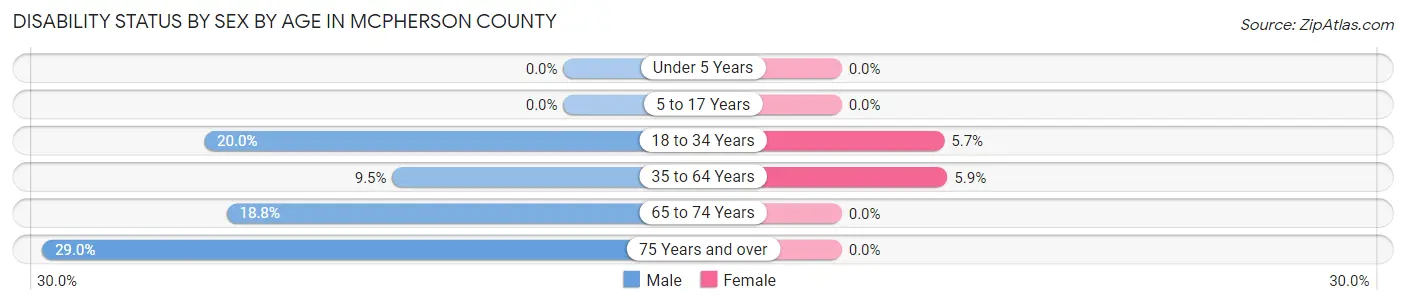
| Age Bracket | Male | Female |
| Under 5 Years | 0 (0.0%) | 0 (0.0%) |
| 5 to 17 Years | 0 (0.0%) | 0 (0.0%) |
| 18 to 34 Years | 3 (20.0%) | 2 (5.7%) |
| 35 to 64 Years | 8 (9.5%) | 6 (5.9%) |
| 65 to 74 Years | 9 (18.8%) | 0 (0.0%) |
| 75 Years and over | 9 (29.0%) | 0 (0.0%) |
Disability Class by Sex by Age in McPherson County
Disability Class: Hearing Difficulty
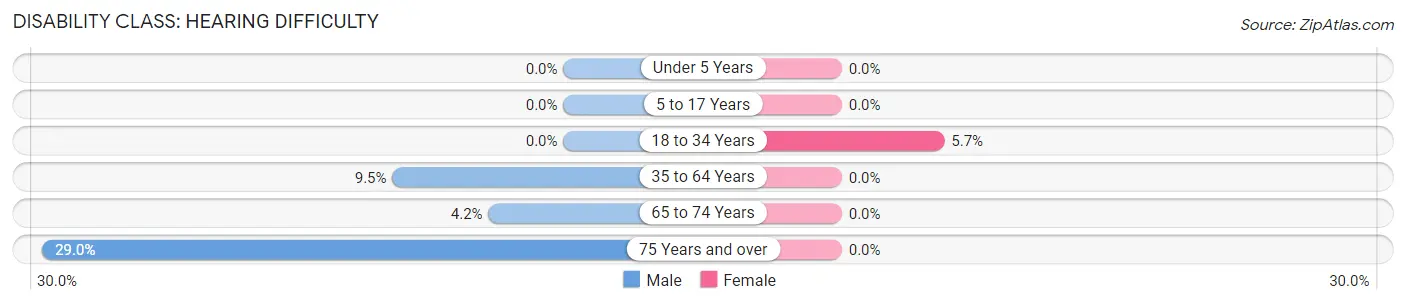
| Age Bracket | Male | Female |
| Under 5 Years | 0 (0.0%) | 0 (0.0%) |
| 5 to 17 Years | 0 (0.0%) | 0 (0.0%) |
| 18 to 34 Years | 0 (0.0%) | 2 (5.7%) |
| 35 to 64 Years | 8 (9.5%) | 0 (0.0%) |
| 65 to 74 Years | 2 (4.2%) | 0 (0.0%) |
| 75 Years and over | 9 (29.0%) | 0 (0.0%) |
Disability Class: Vision Difficulty
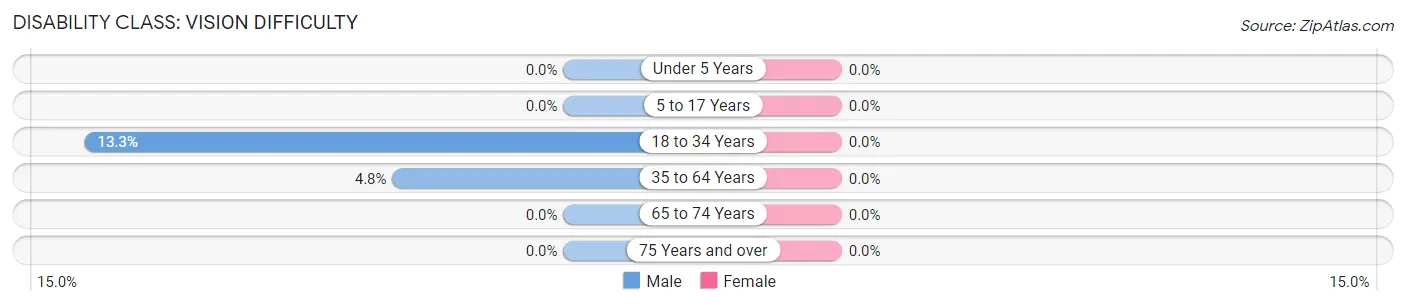
| Age Bracket | Male | Female |
| Under 5 Years | 0 (0.0%) | 0 (0.0%) |
| 5 to 17 Years | 0 (0.0%) | 0 (0.0%) |
| 18 to 34 Years | 2 (13.3%) | 0 (0.0%) |
| 35 to 64 Years | 4 (4.8%) | 0 (0.0%) |
| 65 to 74 Years | 0 (0.0%) | 0 (0.0%) |
| 75 Years and over | 0 (0.0%) | 0 (0.0%) |
Disability Class: Cognitive Difficulty
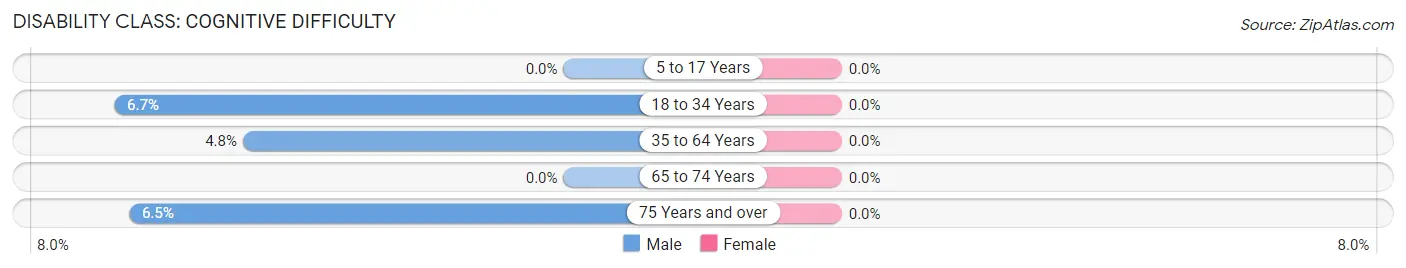
| Age Bracket | Male | Female |
| 5 to 17 Years | 0 (0.0%) | 0 (0.0%) |
| 18 to 34 Years | 1 (6.7%) | 0 (0.0%) |
| 35 to 64 Years | 4 (4.8%) | 0 (0.0%) |
| 65 to 74 Years | 0 (0.0%) | 0 (0.0%) |
| 75 Years and over | 2 (6.5%) | 0 (0.0%) |
Disability Class: Ambulatory Difficulty
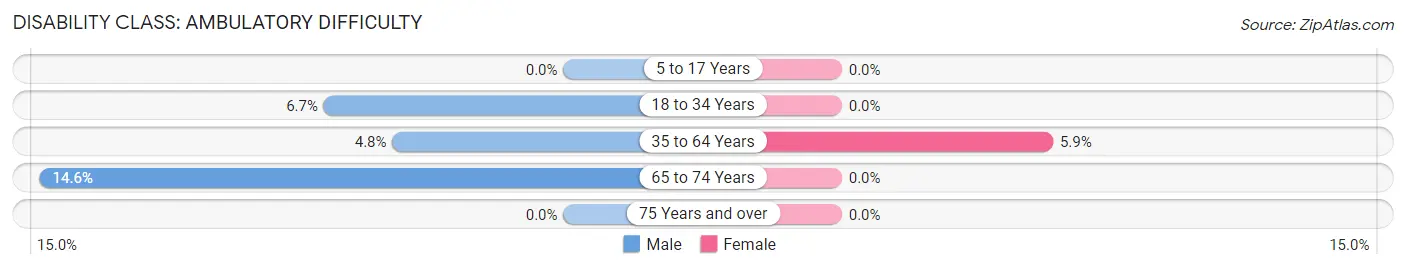
| Age Bracket | Male | Female |
| 5 to 17 Years | 0 (0.0%) | 0 (0.0%) |
| 18 to 34 Years | 1 (6.7%) | 0 (0.0%) |
| 35 to 64 Years | 4 (4.8%) | 6 (5.9%) |
| 65 to 74 Years | 7 (14.6%) | 0 (0.0%) |
| 75 Years and over | 0 (0.0%) | 0 (0.0%) |
Disability Class: Self-Care Difficulty
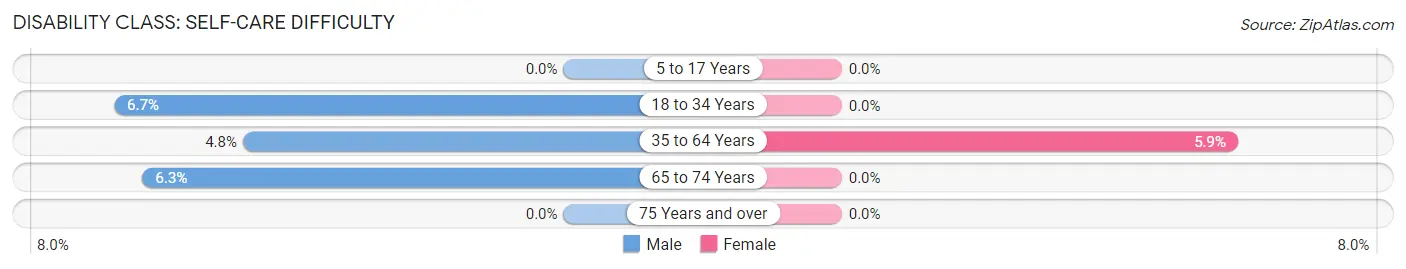
| Age Bracket | Male | Female |
| 5 to 17 Years | 0 (0.0%) | 0 (0.0%) |
| 18 to 34 Years | 1 (6.7%) | 0 (0.0%) |
| 35 to 64 Years | 4 (4.8%) | 6 (5.9%) |
| 65 to 74 Years | 3 (6.2%) | 0 (0.0%) |
| 75 Years and over | 0 (0.0%) | 0 (0.0%) |
Technology Access in McPherson County
Computing Device Access in McPherson County
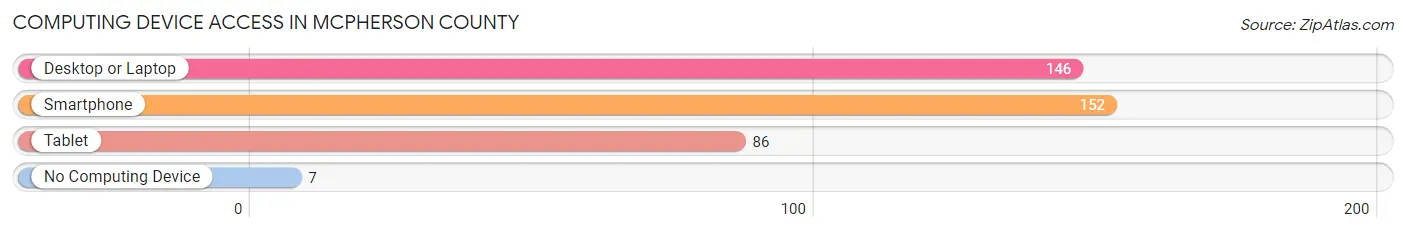
| Device Type | # Households | % Households |
| Desktop or Laptop | 146 | 75.6% |
| Smartphone | 152 | 78.8% |
| Tablet | 86 | 44.6% |
| No Computing Device | 7 | 3.6% |
| Total | 193 | 100.0% |
Internet Access in McPherson County
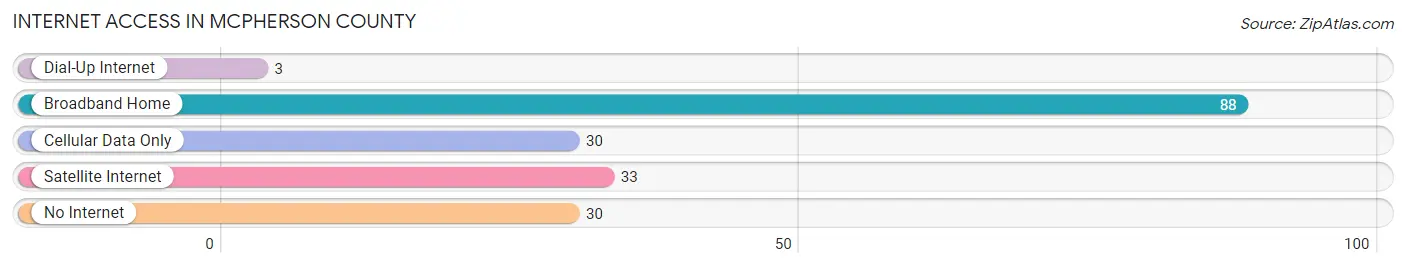
| Internet Type | # Households | % Households |
| Dial-Up Internet | 3 | 1.5% |
| Broadband Home | 88 | 45.6% |
| Cellular Data Only | 30 | 15.5% |
| Satellite Internet | 33 | 17.1% |
| No Internet | 30 | 15.5% |
| Total | 193 | 100.0% |
McPherson County Summary
McPherson County is located in the central part of Nebraska, in the Great Plains region of the United States. It is bordered by Custer County to the north, Lincoln County to the east, Perkins County to the south, and Logan County to the west. The county seat is Tryon, and the largest city is North Platte. The county was named after Civil War General James B. McPherson.
Geography
McPherson County covers an area of 1,072 square miles, making it the fourth-largest county in Nebraska. The county is mostly flat, with rolling hills in the east and south. The terrain is mostly grassland, with some cropland and wooded areas. The county is drained by the North Platte River, which flows through the county from north to south.
The county has a semi-arid climate, with hot summers and cold winters. The average annual temperature is 52°F, and the average annual precipitation is 19 inches.
Demographics
As of the 2010 census, there were 2,945 people, 1,093 households, and 790 families living in the county. The population density was 2.7 people per square mile. The racial makeup of the county was 97.3% White, 0.3% African American, 0.3% Native American, 0.2% Asian, 0.1% Pacific Islander, 0.7% from other races, and 0.9% from two or more races. Hispanic or Latino of any race were 2.2% of the population.
The median income for a household in the county was $41,944, and the median income for a family was $50,000. The per capita income for the county was $19,945. About 8.2% of families and 10.2% of the population were below the poverty line, including 13.2% of those under age 18 and 8.2% of those age 65 or over.
Economy
Agriculture is the main economic activity in McPherson County. The county is home to a variety of crops, including corn, soybeans, wheat, and sorghum. Livestock production is also important, with cattle, hogs, and sheep being raised in the county.
The county is also home to several manufacturing companies, including a plastics plant, a metal fabrication plant, and a food processing plant. The county also has a number of small businesses, including restaurants, retail stores, and service providers.
The county is served by the North Platte Regional Airport, which offers daily flights to Denver, Colorado. The county is also served by several major highways, including Interstate 80, U.S. Route 30, and Nebraska Highway 23.
Conclusion
McPherson County is a rural county in central Nebraska, with a population of just under 3,000 people. The county is mostly agricultural, with crops such as corn, soybeans, wheat, and sorghum being grown in the area. The county also has a number of manufacturing companies, as well as small businesses. The county is served by the North Platte Regional Airport, as well as several major highways.
Common Questions
What is Per Capita Income in McPherson County?
Per Capita income in McPherson County is $32,675.
What is the Median Family Income in McPherson County?
Median Family Income in McPherson County is $63,750.
What is the Median Household income in McPherson County?
Median Household Income in McPherson County is $58,250.
What is Income or Wage Gap in McPherson County?
Income or Wage Gap in McPherson County is 46.7%.
Women in McPherson County earn 53.3 cents for every dollar earned by a man.
What is Family Income Deficit in McPherson County?
Family Income Deficit in McPherson County is $10,383.
Families that are below poverty line in McPherson County earn $10,383 less on average than the poverty threshold level.
What is Inequality or Gini Index in McPherson County?
Inequality or Gini Index in McPherson County is 0.34.
What is the Total Population of McPherson County?
Total Population of McPherson County is 456.
What is the Total Male Population of McPherson County?
Total Male Population of McPherson County is 239.
What is the Total Female Population of McPherson County?
Total Female Population of McPherson County is 217.
What is the Ratio of Males per 100 Females in McPherson County?
There are 110.14 Males per 100 Females in McPherson County.
What is the Ratio of Females per 100 Males in McPherson County?
There are 90.79 Females per 100 Males in McPherson County.
What is the Median Population Age in McPherson County?
Median Population Age in McPherson County is 56.3 Years.
What is the Average Family Size in McPherson County
Average Family Size in McPherson County is 2.8 People.
What is the Average Household Size in McPherson County
Average Household Size in McPherson County is 2.4 People.
How Large is the Labor Force in McPherson County?
There are 252 People in the Labor Forcein in McPherson County.
What is the Percentage of People in the Labor Force in McPherson County?
66.3% of People are in the Labor Force in McPherson County.