Knox County, NE Map & Demographics
Knox County Overview
$31,269
PER CAPITA INCOME
$77,402
AVG FAMILY INCOME
$61,250
AVG HOUSEHOLD INCOME
33.6%
WAGE / INCOME GAP [ % ]
66.4¢/ $1
WAGE / INCOME GAP [ $ ]
$12,156
FAMILY INCOME DEFICIT
0.42
INEQUALITY / GINI INDEX
8,415
TOTAL POPULATION
4,225
MALE POPULATION
4,190
FEMALE POPULATION
100.84
MALES / 100 FEMALES
99.17
FEMALES / 100 MALES
43.9
MEDIAN AGE
3.2
AVG FAMILY SIZE
2.5
AVG HOUSEHOLD SIZE
4,207
LABOR FORCE [ PEOPLE ]
63.3%
PERCENT IN LABOR FORCE
4.1%
UNEMPLOYMENT RATE
Knox County Area Codes
Income in Knox County
Income Overview in Knox County
Per Capita Income in Knox County is $31,269, while median incomes of families and households are $77,402 and $61,250 respectively.
| Characteristic | Number | Measure |
| Per Capita Income | 8,415 | $31,269 |
| Median Family Income | 2,162 | $77,402 |
| Mean Family Income | 2,162 | $86,131 |
| Median Household Income | 3,269 | $61,250 |
| Mean Household Income | 3,269 | $75,276 |
| Income Deficit | 2,162 | $12,156 |
| Wage / Income Gap (%) | 8,415 | 33.63% |
| Wage / Income Gap ($) | 8,415 | 66.37¢ per $1 |
| Gini / Inequality Index | 8,415 | 0.42 |
Earnings by Sex in Knox County
Average Earnings in Knox County are $33,741, $41,190 for men and $27,336 for women, a difference of 33.6%.
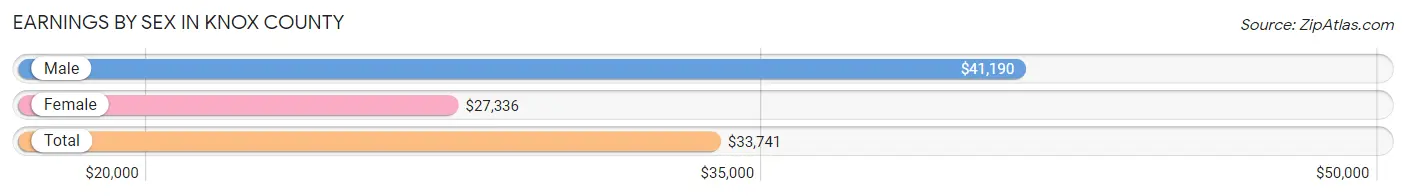
| Sex | Number | Average Earnings |
| Male | 2,506 (56.1%) | $41,190 |
| Female | 1,960 (43.9%) | $27,336 |
| Total | 4,466 (100.0%) | $33,741 |
Earnings by Sex by Income Bracket in Knox County
The most common earnings brackets in Knox County are $55,000 to $64,999 for men (251 | 10.0%) and $2,499 or less for women (207 | 10.6%).
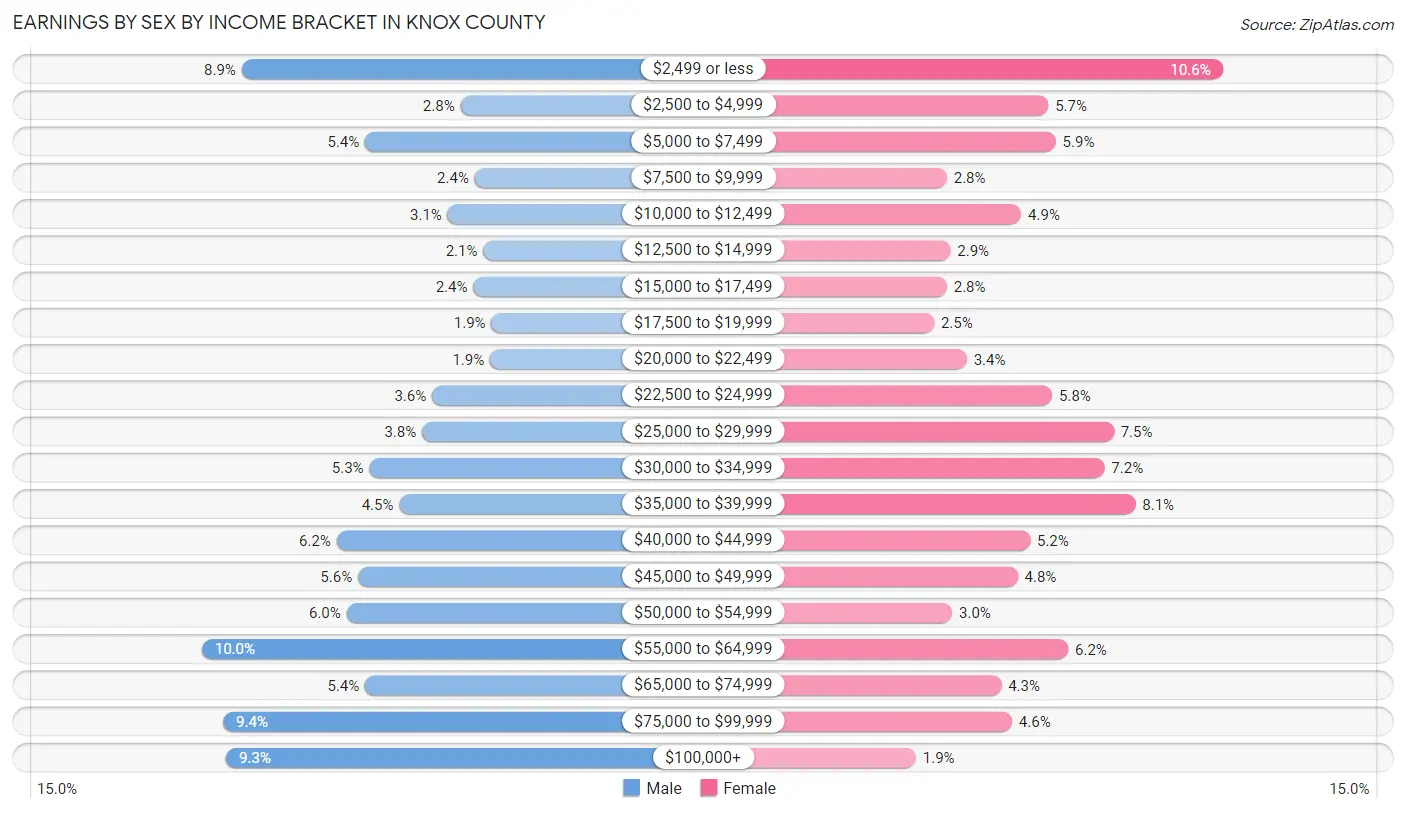
| Income | Male | Female |
| $2,499 or less | 223 (8.9%) | 207 (10.6%) |
| $2,500 to $4,999 | 69 (2.8%) | 111 (5.7%) |
| $5,000 to $7,499 | 136 (5.4%) | 115 (5.9%) |
| $7,500 to $9,999 | 59 (2.4%) | 55 (2.8%) |
| $10,000 to $12,499 | 78 (3.1%) | 96 (4.9%) |
| $12,500 to $14,999 | 53 (2.1%) | 57 (2.9%) |
| $15,000 to $17,499 | 60 (2.4%) | 55 (2.8%) |
| $17,500 to $19,999 | 47 (1.9%) | 48 (2.5%) |
| $20,000 to $22,499 | 48 (1.9%) | 66 (3.4%) |
| $22,500 to $24,999 | 89 (3.5%) | 113 (5.8%) |
| $25,000 to $29,999 | 96 (3.8%) | 147 (7.5%) |
| $30,000 to $34,999 | 133 (5.3%) | 142 (7.2%) |
| $35,000 to $39,999 | 112 (4.5%) | 159 (8.1%) |
| $40,000 to $44,999 | 156 (6.2%) | 101 (5.1%) |
| $45,000 to $49,999 | 141 (5.6%) | 94 (4.8%) |
| $50,000 to $54,999 | 149 (5.9%) | 58 (3.0%) |
| $55,000 to $64,999 | 251 (10.0%) | 122 (6.2%) |
| $65,000 to $74,999 | 136 (5.4%) | 85 (4.3%) |
| $75,000 to $99,999 | 236 (9.4%) | 91 (4.6%) |
| $100,000+ | 234 (9.3%) | 38 (1.9%) |
| Total | 2,506 (100.0%) | 1,960 (100.0%) |
Earnings by Sex by Educational Attainment in Knox County
Average earnings in Knox County are $47,444 for men and $31,080 for women, a difference of 34.5%. Men with an educational attainment of graduate degree enjoy the highest average annual earnings of $61,875, while those with less than high school education earn the least with $22,500. Women with an educational attainment of graduate degree earn the most with the average annual earnings of $61,875, while those with high school diploma education have the smallest earnings of $19,022.
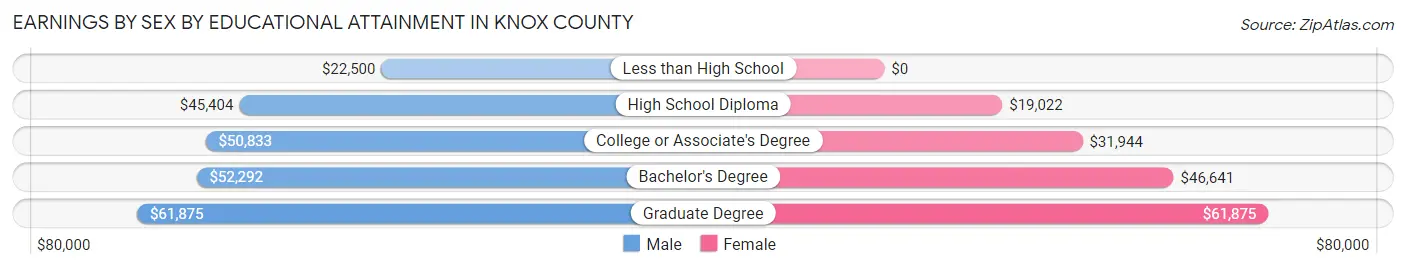
| Educational Attainment | Male Income | Female Income |
| Less than High School | $22,500 | $0 |
| High School Diploma | $45,404 | $19,022 |
| College or Associate's Degree | $50,833 | $31,944 |
| Bachelor's Degree | $52,292 | $46,641 |
| Graduate Degree | $61,875 | $61,875 |
| Total | $47,444 | $31,080 |
Family Income in Knox County
Family Income Brackets in Knox County
According to the Knox County family income data, there are 473 families falling into the $75,000 to $99,999 income range, which is the most common income bracket and makes up 21.9% of all families. Conversely, the $10,000 to $14,999 income bracket is the least frequent group with only 24 families (1.1%) belonging to this category.
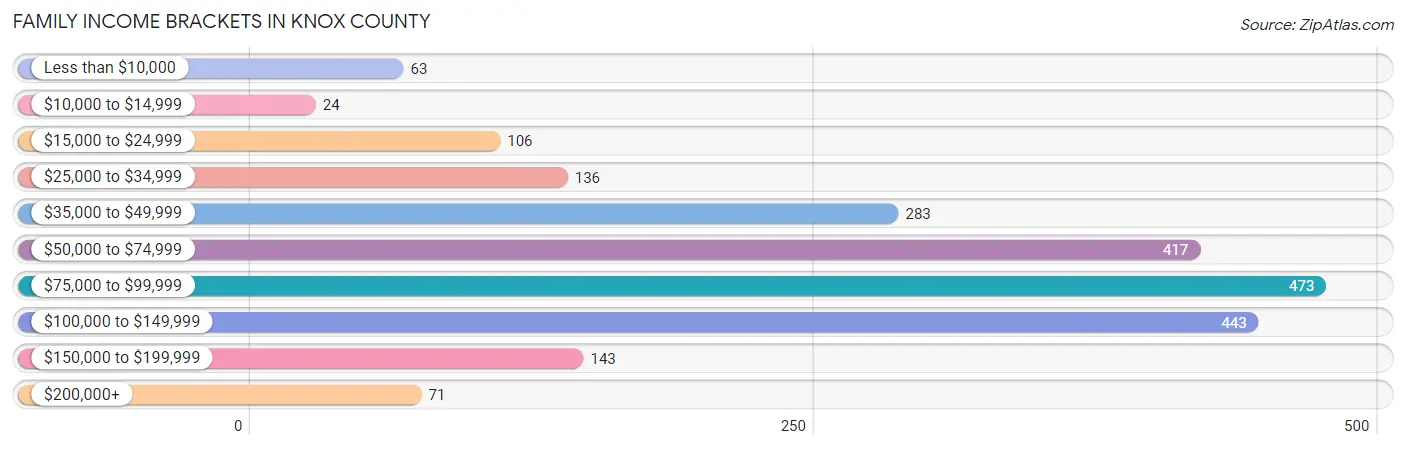
| Income Bracket | # Families | % Families |
| Less than $10,000 | 63 | 2.9% |
| $10,000 to $14,999 | 24 | 1.1% |
| $15,000 to $24,999 | 106 | 4.9% |
| $25,000 to $34,999 | 136 | 6.3% |
| $35,000 to $49,999 | 283 | 13.1% |
| $50,000 to $74,999 | 417 | 19.3% |
| $75,000 to $99,999 | 473 | 21.9% |
| $100,000 to $149,999 | 443 | 20.5% |
| $150,000 to $199,999 | 143 | 6.6% |
| $200,000+ | 71 | 3.3% |
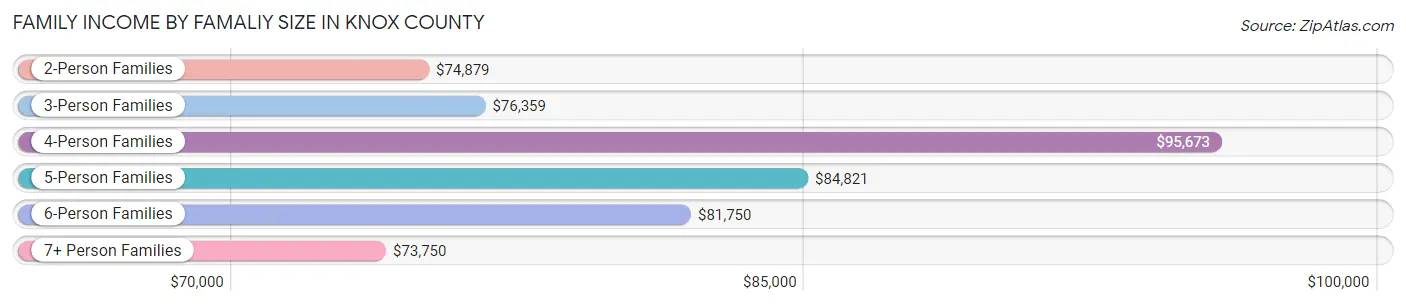
Family Income by Famaliy Size in Knox County
4-person families (264 | 12.2%) account for the highest median family income in Knox County with $95,673 per family, while 2-person families (1,289 | 59.6%) have the highest median income of $37,440 per family member.
| Income Bracket | # Families | Median Income |
| 2-Person Families | 1,289 (59.6%) | $74,879 |
| 3-Person Families | 289 (13.4%) | $76,359 |
| 4-Person Families | 264 (12.2%) | $95,673 |
| 5-Person Families | 161 (7.4%) | $84,821 |
| 6-Person Families | 105 (4.9%) | $81,750 |
| 7+ Person Families | 54 (2.5%) | $73,750 |
| Total | 2,162 (100.0%) | $77,402 |
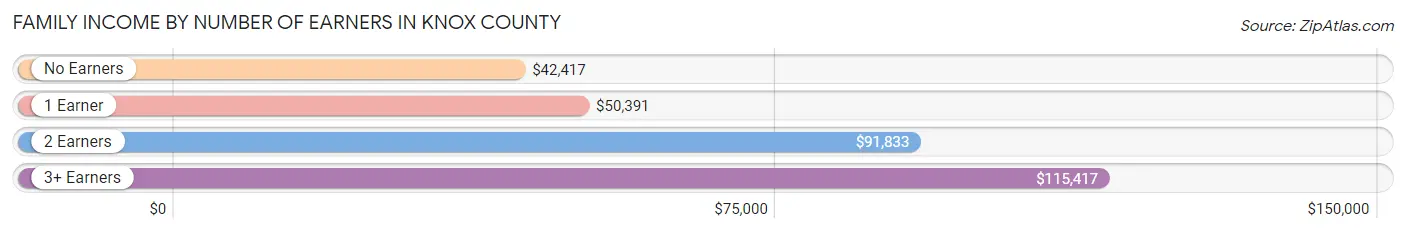
Family Income by Number of Earners in Knox County
The median family income in Knox County is $77,402, with families comprising 3+ earners (222) having the highest median family income of $115,417, while families with no earners (364) have the lowest median family income of $42,417, accounting for 10.3% and 16.8% of families, respectively.
| Number of Earners | # Families | Median Income |
| No Earners | 364 (16.8%) | $42,417 |
| 1 Earner | 606 (28.0%) | $50,391 |
| 2 Earners | 970 (44.9%) | $91,833 |
| 3+ Earners | 222 (10.3%) | $115,417 |
| Total | 2,162 (100.0%) | $77,402 |
Household Income in Knox County
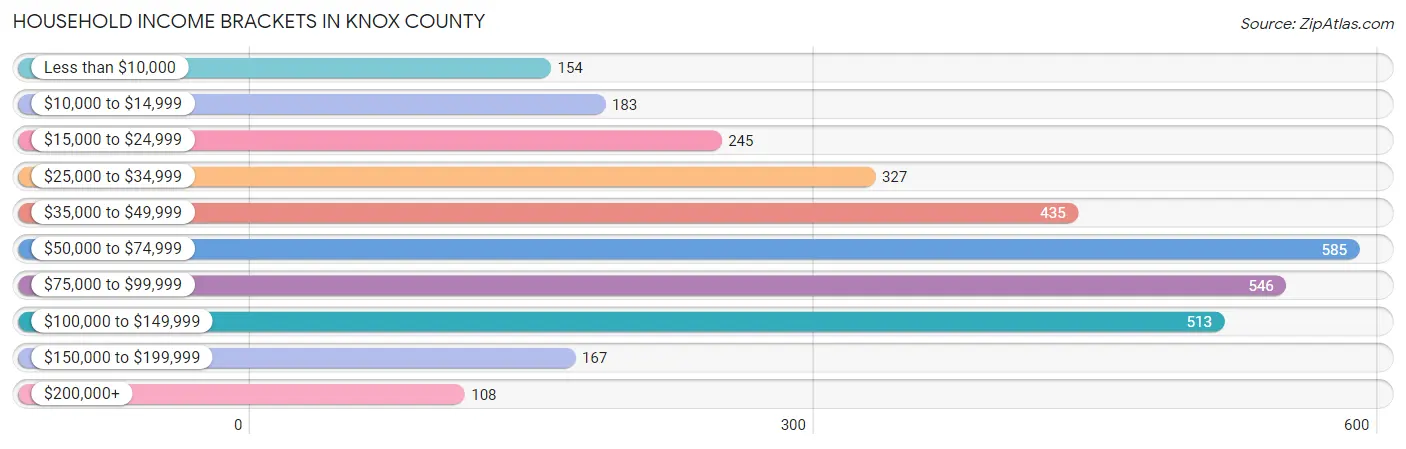
Household Income Brackets in Knox County
With 585 households falling in the category, the $50,000 to $74,999 income range is the most frequent in Knox County, accounting for 17.9% of all households. In contrast, only 108 households (3.3%) fall into the $200,000+ income bracket, making it the least populous group.
| Income Bracket | # Households | % Households |
| Less than $10,000 | 154 | 4.7% |
| $10,000 to $14,999 | 183 | 5.6% |
| $15,000 to $24,999 | 245 | 7.5% |
| $25,000 to $34,999 | 327 | 10.0% |
| $35,000 to $49,999 | 435 | 13.3% |
| $50,000 to $74,999 | 585 | 17.9% |
| $75,000 to $99,999 | 546 | 16.7% |
| $100,000 to $149,999 | 513 | 15.7% |
| $150,000 to $199,999 | 167 | 5.1% |
| $200,000+ | 108 | 3.3% |
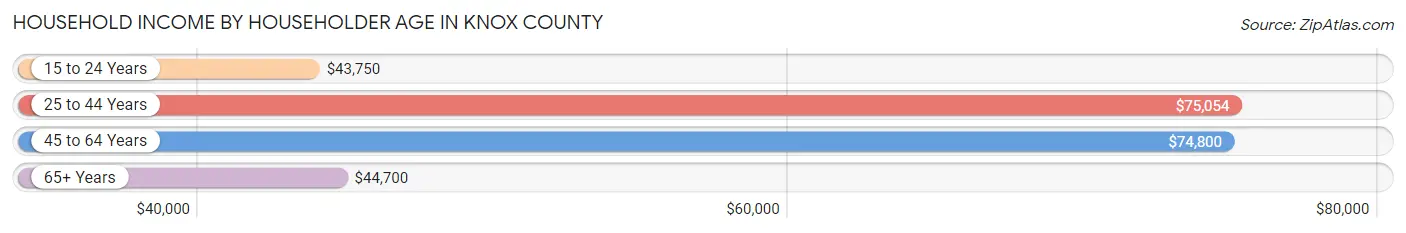
Household Income by Householder Age in Knox County
The median household income in Knox County is $61,250, with the highest median household income of $75,054 found in the 25 to 44 years age bracket for the primary householder. A total of 837 households (25.6%) fall into this category. Meanwhile, the 15 to 24 years age bracket for the primary householder has the lowest median household income of $43,750, with 84 households (2.6%) in this group.
| Income Bracket | # Households | Median Income |
| 15 to 24 Years | 84 (2.6%) | $43,750 |
| 25 to 44 Years | 837 (25.6%) | $75,054 |
| 45 to 64 Years | 1,114 (34.1%) | $74,800 |
| 65+ Years | 1,234 (37.8%) | $44,700 |
| Total | 3,269 (100.0%) | $61,250 |
Poverty in Knox County
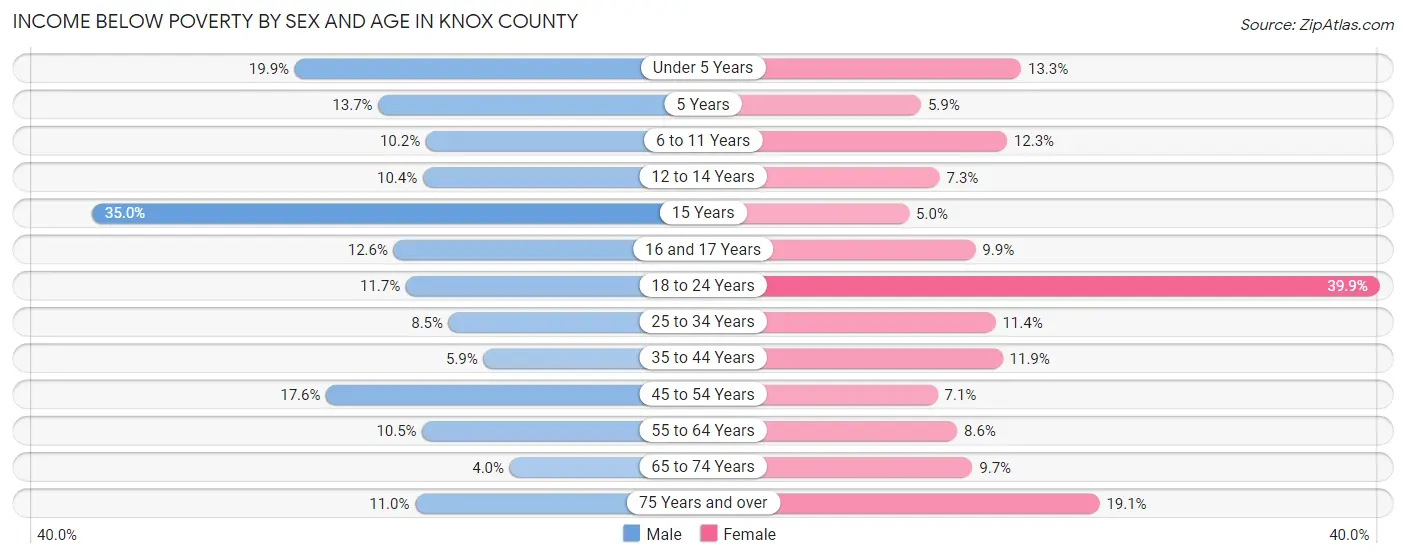
Income Below Poverty by Sex and Age in Knox County
With 10.8% poverty level for males and 13.2% for females among the residents of Knox County, 15 year old males and 18 to 24 year old females are the most vulnerable to poverty, with 14 males (35.0%) and 115 females (39.9%) in their respective age groups living below the poverty level.
| Age Bracket | Male | Female |
| Under 5 Years | 55 (19.9%) | 33 (13.3%) |
| 5 Years | 7 (13.7%) | 2 (5.9%) |
| 6 to 11 Years | 35 (10.2%) | 39 (12.3%) |
| 12 to 14 Years | 20 (10.4%) | 13 (7.3%) |
| 15 Years | 14 (35.0%) | 3 (5.0%) |
| 16 and 17 Years | 17 (12.6%) | 13 (9.9%) |
| 18 to 24 Years | 41 (11.7%) | 115 (39.9%) |
| 25 to 34 Years | 34 (8.5%) | 43 (11.4%) |
| 35 to 44 Years | 26 (5.9%) | 45 (11.9%) |
| 45 to 54 Years | 72 (17.6%) | 29 (7.1%) |
| 55 to 64 Years | 64 (10.5%) | 51 (8.6%) |
| 65 to 74 Years | 21 (4.0%) | 53 (9.7%) |
| 75 Years and over | 41 (11.0%) | 97 (19.1%) |
| Total | 447 (10.8%) | 536 (13.2%) |
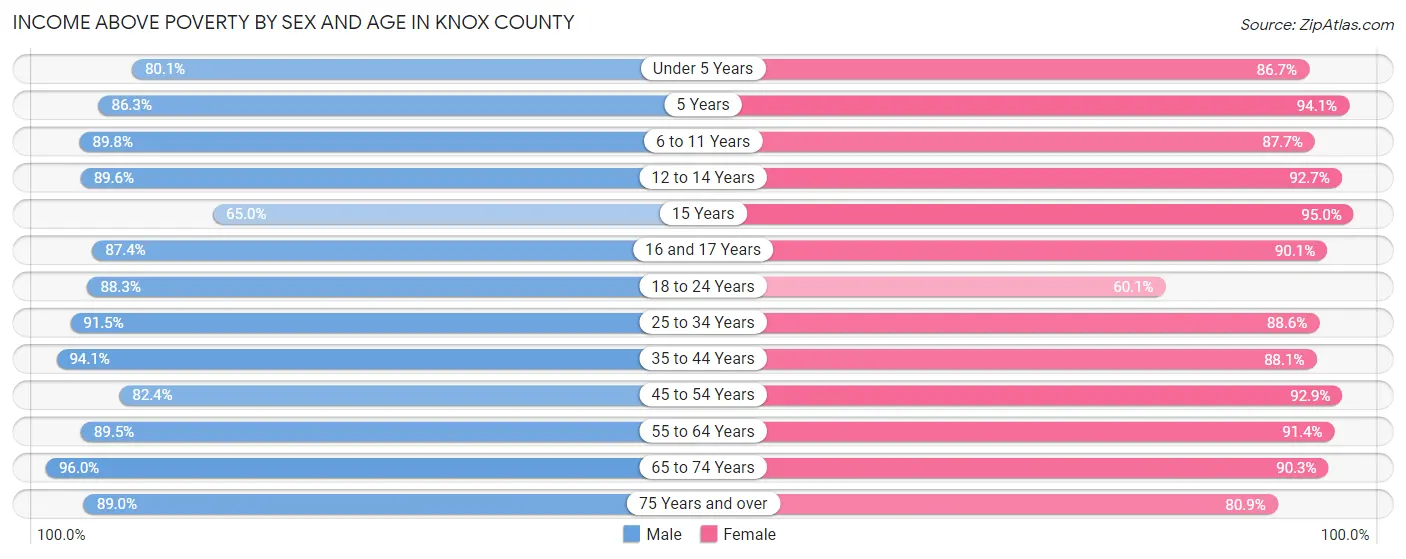
Income Above Poverty by Sex and Age in Knox County
According to the poverty statistics in Knox County, males aged 65 to 74 years and females aged 15 years are the age groups that are most secure financially, with 96.0% of males and 95.0% of females in these age groups living above the poverty line.
| Age Bracket | Male | Female |
| Under 5 Years | 221 (80.1%) | 215 (86.7%) |
| 5 Years | 44 (86.3%) | 32 (94.1%) |
| 6 to 11 Years | 308 (89.8%) | 279 (87.7%) |
| 12 to 14 Years | 172 (89.6%) | 166 (92.7%) |
| 15 Years | 26 (65.0%) | 57 (95.0%) |
| 16 and 17 Years | 118 (87.4%) | 118 (90.1%) |
| 18 to 24 Years | 310 (88.3%) | 173 (60.1%) |
| 25 to 34 Years | 366 (91.5%) | 334 (88.6%) |
| 35 to 44 Years | 413 (94.1%) | 332 (88.1%) |
| 45 to 54 Years | 337 (82.4%) | 379 (92.9%) |
| 55 to 64 Years | 548 (89.5%) | 545 (91.4%) |
| 65 to 74 Years | 508 (96.0%) | 494 (90.3%) |
| 75 Years and over | 332 (89.0%) | 410 (80.9%) |
| Total | 3,703 (89.2%) | 3,534 (86.8%) |
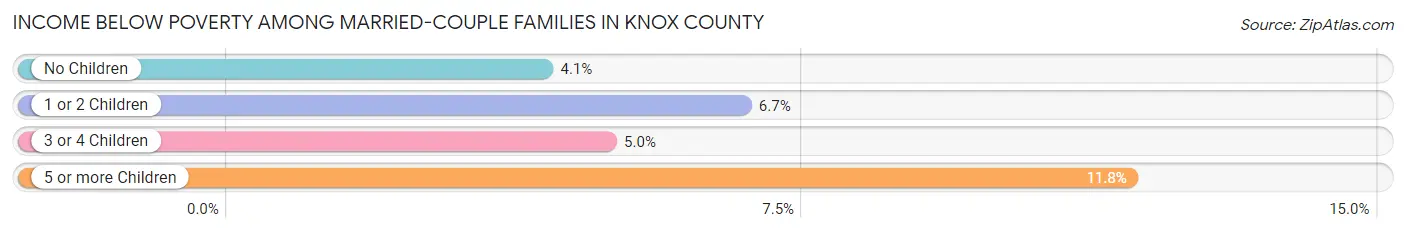
Income Below Poverty Among Married-Couple Families in Knox County
The poverty statistics for married-couple families in Knox County show that 4.8% or 87 of the total 1,820 families live below the poverty line. Families with 5 or more children have the highest poverty rate of 11.8%, comprising of 2 families. On the other hand, families with no children have the lowest poverty rate of 4.1%, which includes 51 families.
| Children | Above Poverty | Below Poverty |
| No Children | 1,187 (95.9%) | 51 (4.1%) |
| 1 or 2 Children | 320 (93.3%) | 23 (6.7%) |
| 3 or 4 Children | 211 (95.1%) | 11 (5.0%) |
| 5 or more Children | 15 (88.2%) | 2 (11.8%) |
| Total | 1,733 (95.2%) | 87 (4.8%) |
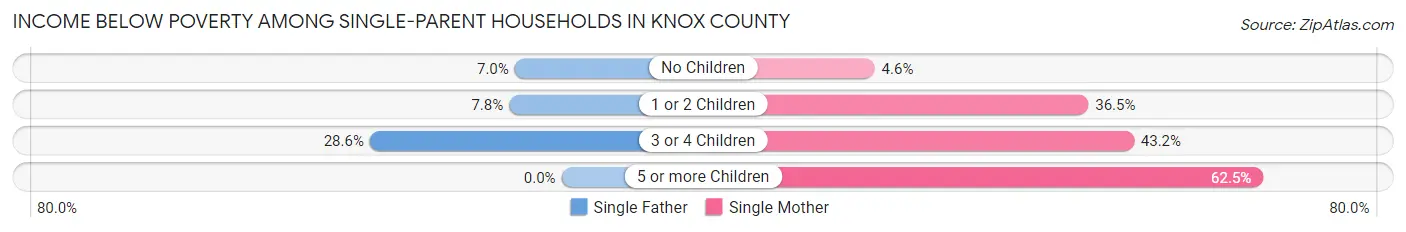
Income Below Poverty Among Single-Parent Households in Knox County
According to the poverty data in Knox County, 8.0% or 10 single-father households and 29.0% or 63 single-mother households are living below the poverty line. Among single-father households, those with 3 or 4 children have the highest poverty rate, with 2 households (28.6%) experiencing poverty. Likewise, among single-mother households, those with 5 or more children have the highest poverty rate, with 5 households (62.5%) falling below the poverty line.
| Children | Single Father | Single Mother |
| No Children | 3 (7.0%) | 3 (4.6%) |
| 1 or 2 Children | 5 (7.8%) | 39 (36.4%) |
| 3 or 4 Children | 2 (28.6%) | 16 (43.2%) |
| 5 or more Children | 0 (0.0%) | 5 (62.5%) |
| Total | 10 (8.0%) | 63 (29.0%) |
Income Below Poverty Among Married-Couple vs Single-Parent Households in Knox County
The poverty data for Knox County shows that 87 of the married-couple family households (4.8%) and 73 of the single-parent households (21.3%) are living below the poverty level. Within the married-couple family households, those with 5 or more children have the highest poverty rate, with 2 households (11.8%) falling below the poverty line. Among the single-parent households, those with 3 or 4 children have the highest poverty rate, with 18 household (40.9%) living below poverty.
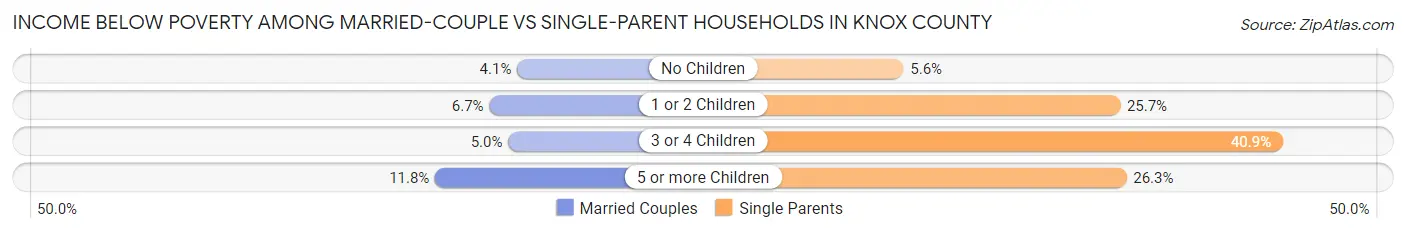
| Children | Married-Couple Families | Single-Parent Households |
| No Children | 51 (4.1%) | 6 (5.6%) |
| 1 or 2 Children | 23 (6.7%) | 44 (25.7%) |
| 3 or 4 Children | 11 (5.0%) | 18 (40.9%) |
| 5 or more Children | 2 (11.8%) | 5 (26.3%) |
| Total | 87 (4.8%) | 73 (21.3%) |
Race in Knox County
The most populous races in Knox County are White / Caucasian (7,197 | 85.5%), Native / Alaskan (772 | 9.2%), and Two or more Races (304 | 3.6%).
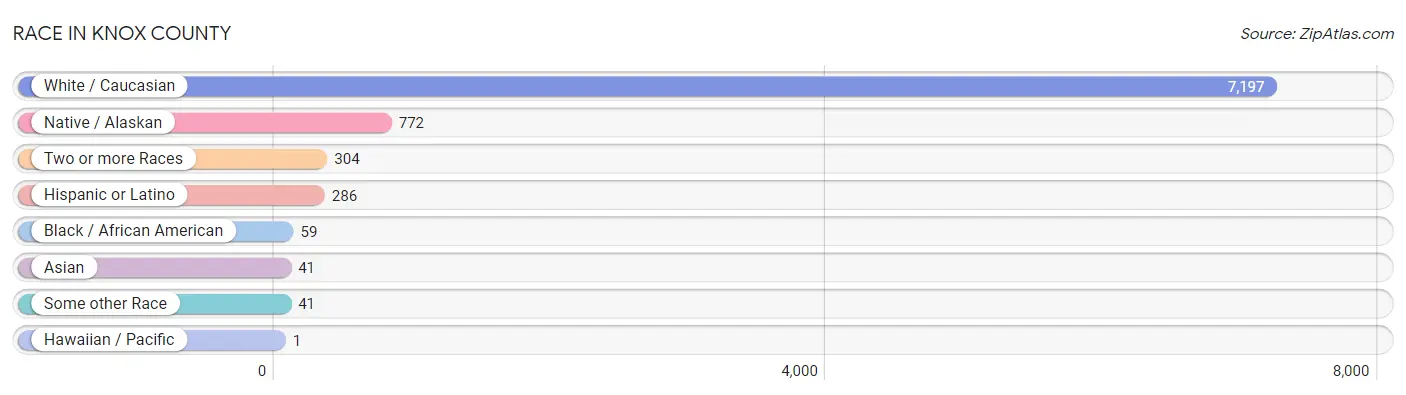
| Race | # Population | % Population |
| Asian | 41 | 0.5% |
| Black / African American | 59 | 0.7% |
| Hawaiian / Pacific | 1 | 0.0% |
| Hispanic or Latino | 286 | 3.4% |
| Native / Alaskan | 772 | 9.2% |
| White / Caucasian | 7,197 | 85.5% |
| Two or more Races | 304 | 3.6% |
| Some other Race | 41 | 0.5% |
| Total | 8,415 | 100.0% |
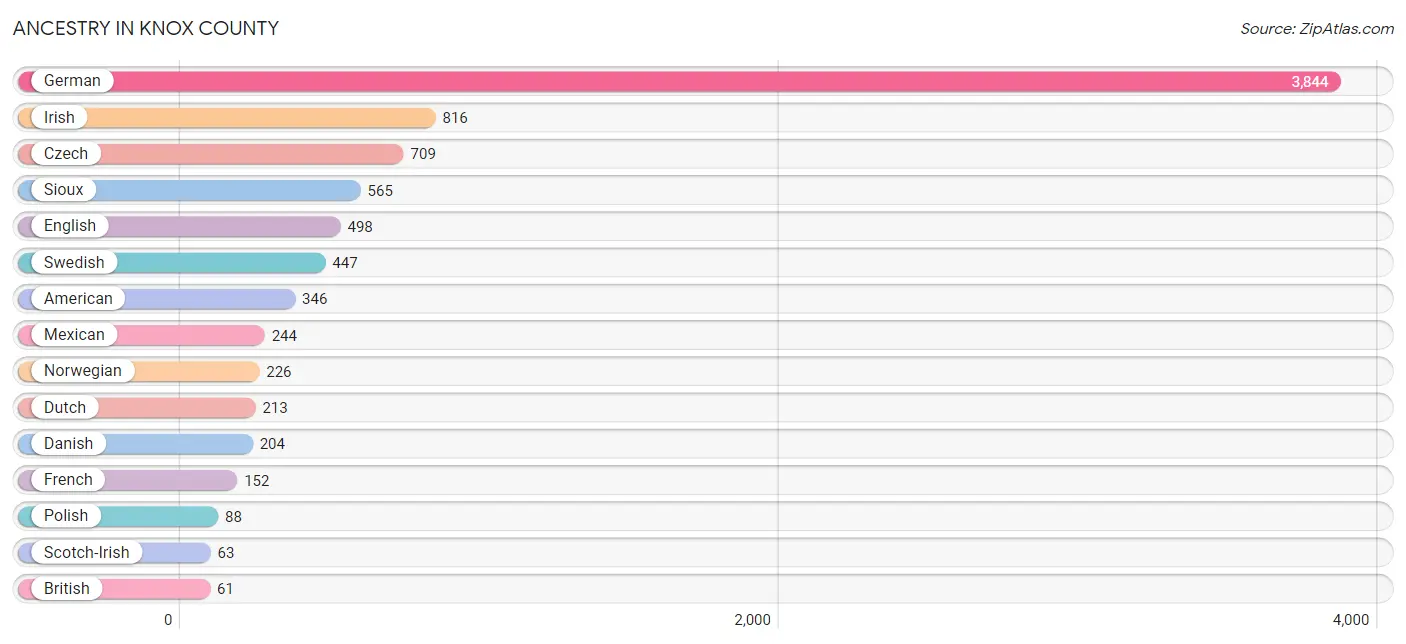
Ancestry in Knox County
The most populous ancestries reported in Knox County are German (3,844 | 45.7%), Irish (816 | 9.7%), Czech (709 | 8.4%), Sioux (565 | 6.7%), and English (498 | 5.9%), together accounting for 76.4% of all Knox County residents.
| Ancestry | # Population | % Population |
| American | 346 | 4.1% |
| Arapaho | 6 | 0.1% |
| Austrian | 5 | 0.1% |
| Belgian | 2 | 0.0% |
| Bhutanese | 2 | 0.0% |
| Brazilian | 2 | 0.0% |
| British | 61 | 0.7% |
| Burmese | 11 | 0.1% |
| Central American | 25 | 0.3% |
| Cherokee | 26 | 0.3% |
| Chippewa | 5 | 0.1% |
| Choctaw | 9 | 0.1% |
| Comanche | 1 | 0.0% |
| Cree | 5 | 0.1% |
| Czech | 709 | 8.4% |
| Czechoslovakian | 16 | 0.2% |
| Danish | 204 | 2.4% |
| Dutch | 213 | 2.5% |
| Eastern European | 2 | 0.0% |
| English | 498 | 5.9% |
| Ethiopian | 4 | 0.1% |
| European | 11 | 0.1% |
| Finnish | 2 | 0.0% |
| French | 152 | 1.8% |
| French Canadian | 3 | 0.0% |
| German | 3,844 | 45.7% |
| German Russian | 5 | 0.1% |
| Guatemalan | 25 | 0.3% |
| Indian (Asian) | 17 | 0.2% |
| Irish | 816 | 9.7% |
| Iroquois | 2 | 0.0% |
| Italian | 21 | 0.3% |
| Korean | 25 | 0.3% |
| Liberian | 4 | 0.1% |
| Luxembourger | 8 | 0.1% |
| Malaysian | 3 | 0.0% |
| Mexican | 244 | 2.9% |
| Mexican American Indian | 14 | 0.2% |
| Navajo | 5 | 0.1% |
| Norwegian | 226 | 2.7% |
| Paiute | 2 | 0.0% |
| Polish | 88 | 1.1% |
| Portuguese | 3 | 0.0% |
| Potawatomi | 35 | 0.4% |
| Puerto Rican | 10 | 0.1% |
| Russian | 15 | 0.2% |
| Samoan | 1 | 0.0% |
| Scandinavian | 17 | 0.2% |
| Scotch-Irish | 63 | 0.7% |
| Scottish | 35 | 0.4% |
| Seminole | 1 | 0.0% |
| Sioux | 565 | 6.7% |
| Slovak | 1 | 0.0% |
| Spaniard | 1 | 0.0% |
| Subsaharan African | 8 | 0.1% |
| Swedish | 447 | 5.3% |
| Swiss | 13 | 0.2% |
| Thai | 7 | 0.1% |
| Welsh | 33 | 0.4% | View All 59 Rows |
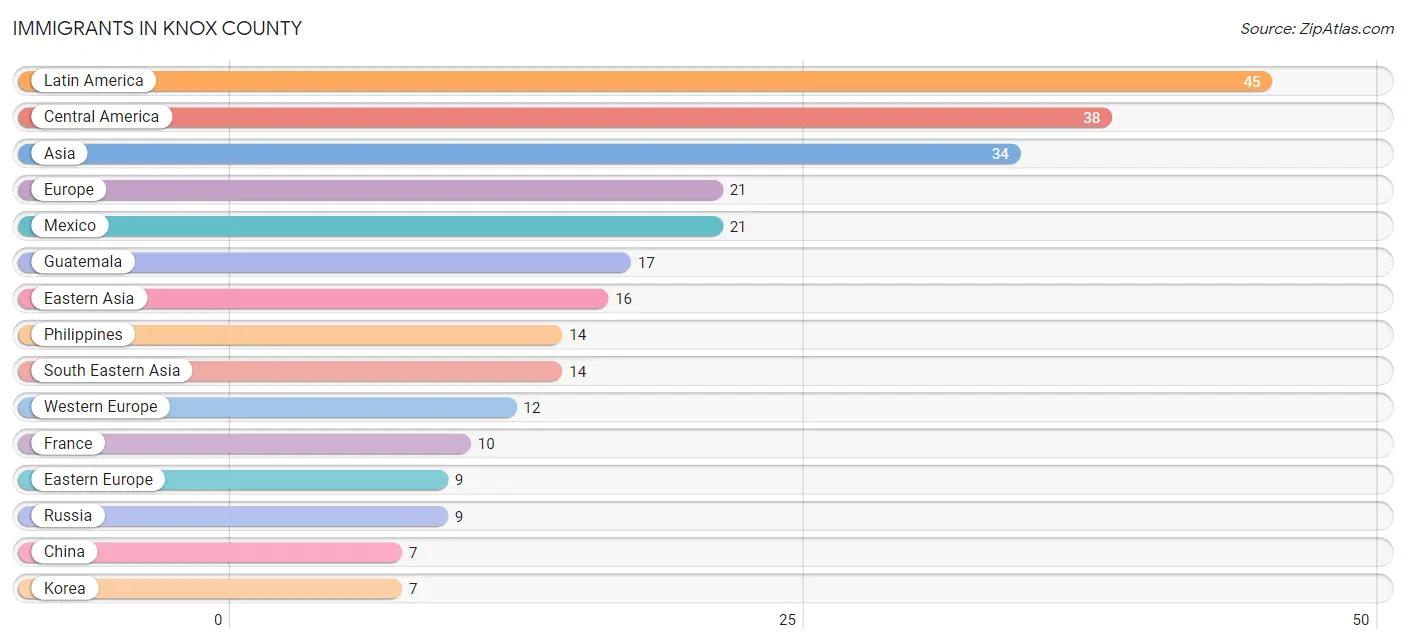
Immigrants in Knox County
The most numerous immigrant groups reported in Knox County came from Latin America (45 | 0.5%), Central America (38 | 0.4%), Asia (34 | 0.4%), Europe (21 | 0.3%), and Mexico (21 | 0.3%), together accounting for 1.9% of all Knox County residents.
| Immigration Origin | # Population | % Population |
| Africa | 4 | 0.1% |
| Asia | 34 | 0.4% |
| Australia | 2 | 0.0% |
| Brazil | 1 | 0.0% |
| Caribbean | 6 | 0.1% |
| Central America | 38 | 0.4% |
| China | 7 | 0.1% |
| Eastern Africa | 4 | 0.1% |
| Eastern Asia | 16 | 0.2% |
| Eastern Europe | 9 | 0.1% |
| Ethiopia | 4 | 0.1% |
| Europe | 21 | 0.3% |
| France | 10 | 0.1% |
| Germany | 2 | 0.0% |
| Guatemala | 17 | 0.2% |
| India | 2 | 0.0% |
| Japan | 2 | 0.0% |
| Korea | 7 | 0.1% |
| Latin America | 45 | 0.5% |
| Mexico | 21 | 0.3% |
| Nepal | 2 | 0.0% |
| Oceania | 3 | 0.0% |
| Philippines | 14 | 0.2% |
| Russia | 9 | 0.1% |
| South America | 1 | 0.0% |
| South Central Asia | 4 | 0.1% |
| South Eastern Asia | 14 | 0.2% |
| Trinidad and Tobago | 6 | 0.1% |
| Western Europe | 12 | 0.1% | View All 29 Rows |
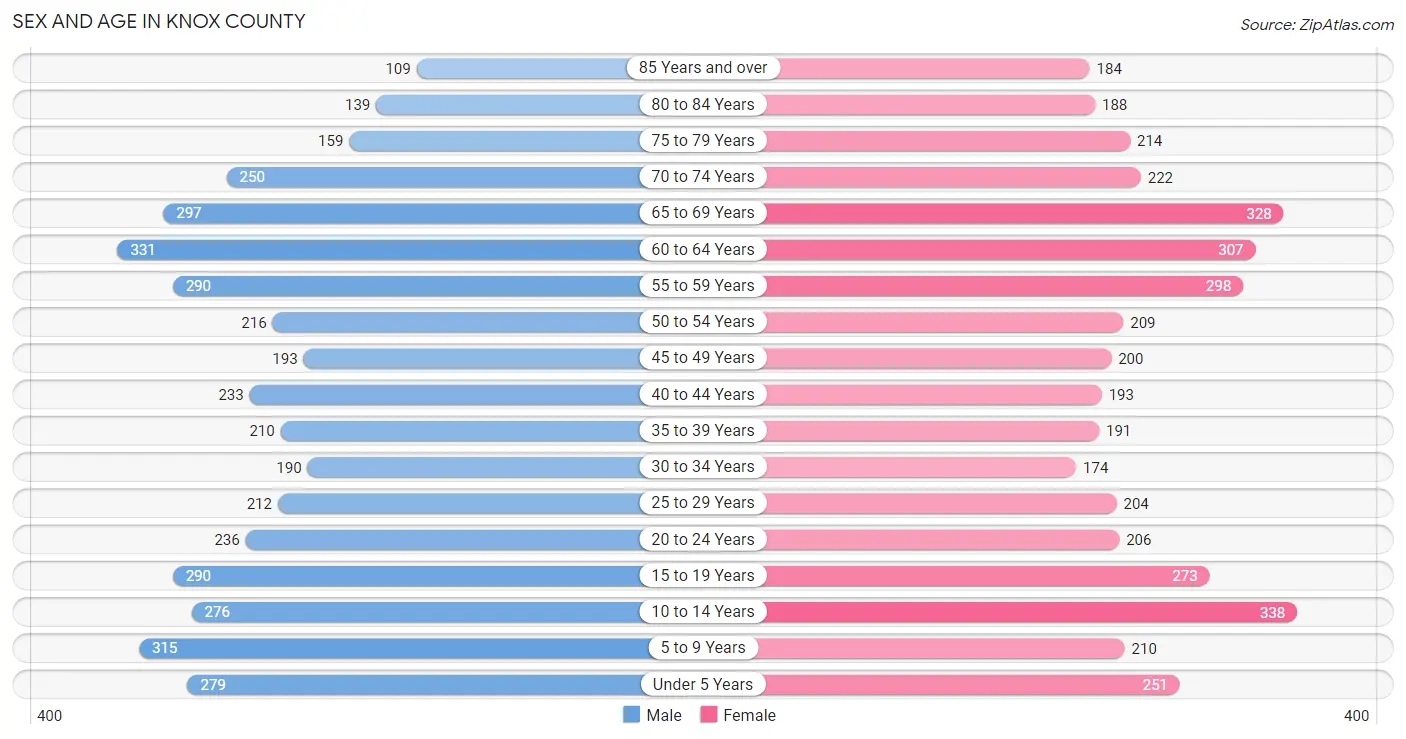
Sex and Age in Knox County
Sex and Age in Knox County
The most populous age groups in Knox County are 60 to 64 Years (331 | 7.8%) for men and 10 to 14 Years (338 | 8.1%) for women.
| Age Bracket | Male | Female |
| Under 5 Years | 279 (6.6%) | 251 (6.0%) |
| 5 to 9 Years | 315 (7.5%) | 210 (5.0%) |
| 10 to 14 Years | 276 (6.5%) | 338 (8.1%) |
| 15 to 19 Years | 290 (6.9%) | 273 (6.5%) |
| 20 to 24 Years | 236 (5.6%) | 206 (4.9%) |
| 25 to 29 Years | 212 (5.0%) | 204 (4.9%) |
| 30 to 34 Years | 190 (4.5%) | 174 (4.2%) |
| 35 to 39 Years | 210 (5.0%) | 191 (4.6%) |
| 40 to 44 Years | 233 (5.5%) | 193 (4.6%) |
| 45 to 49 Years | 193 (4.6%) | 200 (4.8%) |
| 50 to 54 Years | 216 (5.1%) | 209 (5.0%) |
| 55 to 59 Years | 290 (6.9%) | 298 (7.1%) |
| 60 to 64 Years | 331 (7.8%) | 307 (7.3%) |
| 65 to 69 Years | 297 (7.0%) | 328 (7.8%) |
| 70 to 74 Years | 250 (5.9%) | 222 (5.3%) |
| 75 to 79 Years | 159 (3.8%) | 214 (5.1%) |
| 80 to 84 Years | 139 (3.3%) | 188 (4.5%) |
| 85 Years and over | 109 (2.6%) | 184 (4.4%) |
| Total | 4,225 (100.0%) | 4,190 (100.0%) |
Families and Households in Knox County
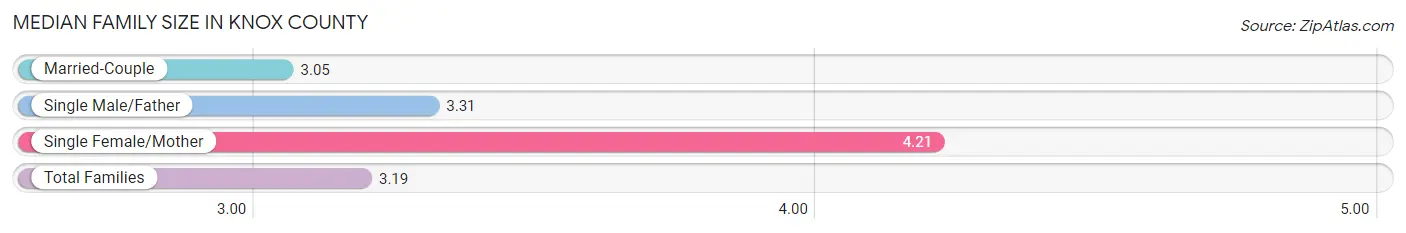
Median Family Size in Knox County
The median family size in Knox County is 3.19 persons per family, with single female/mother families (217 | 10.0%) accounting for the largest median family size of 4.21 persons per family. On the other hand, married-couple families (1,820 | 84.2%) represent the smallest median family size with 3.05 persons per family.
| Family Type | # Families | Family Size |
| Married-Couple | 1,820 (84.2%) | 3.05 |
| Single Male/Father | 125 (5.8%) | 3.31 |
| Single Female/Mother | 217 (10.0%) | 4.21 |
| Total Families | 2,162 (100.0%) | 3.19 |
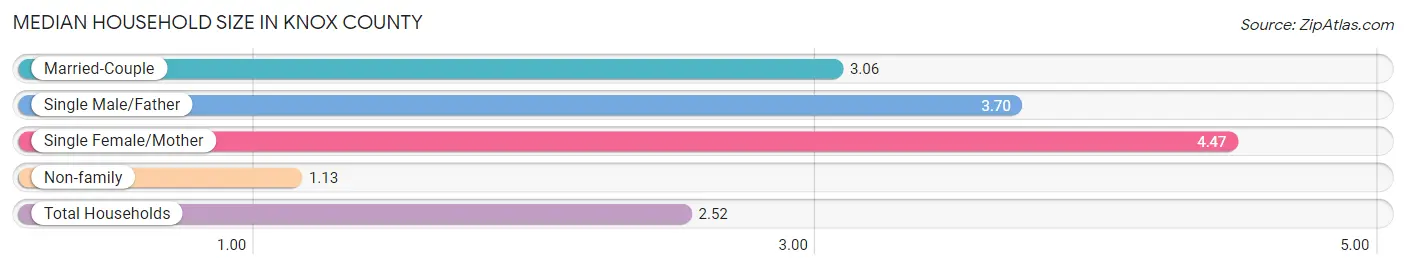
Median Household Size in Knox County
The median household size in Knox County is 2.52 persons per household, with single female/mother households (217 | 6.6%) accounting for the largest median household size of 4.47 persons per household. non-family households (1,107 | 33.9%) represent the smallest median household size with 1.13 persons per household.
| Household Type | # Households | Household Size |
| Married-Couple | 1,820 (55.7%) | 3.06 |
| Single Male/Father | 125 (3.8%) | 3.70 |
| Single Female/Mother | 217 (6.6%) | 4.47 |
| Non-family | 1,107 (33.9%) | 1.13 |
| Total Households | 3,269 (100.0%) | 2.52 |
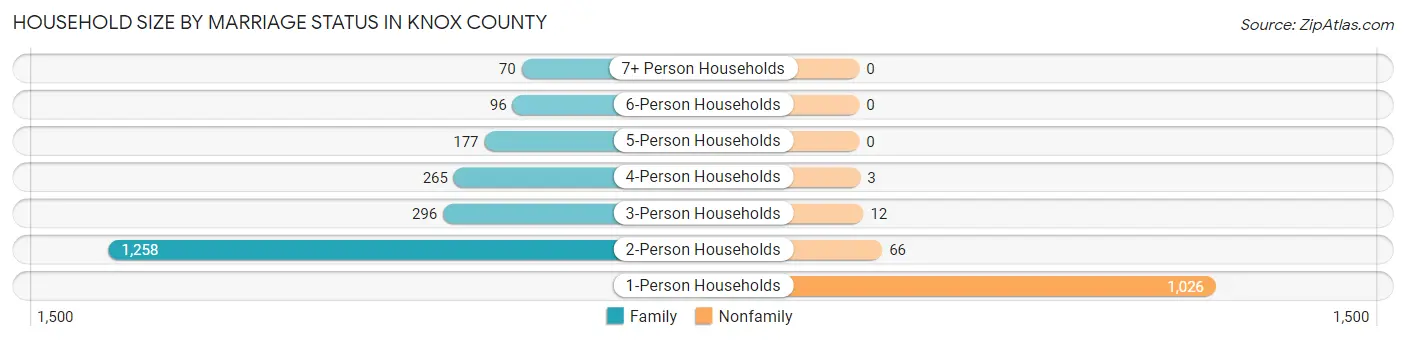
Household Size by Marriage Status in Knox County
Out of a total of 3,269 households in Knox County, 2,162 (66.1%) are family households, while 1,107 (33.9%) are nonfamily households. The most numerous type of family households are 2-person households, comprising 1,258, and the most common type of nonfamily households are 1-person households, comprising 1,026.
| Household Size | Family Households | Nonfamily Households |
| 1-Person Households | - | 1,026 (31.4%) |
| 2-Person Households | 1,258 (38.5%) | 66 (2.0%) |
| 3-Person Households | 296 (9.0%) | 12 (0.4%) |
| 4-Person Households | 265 (8.1%) | 3 (0.1%) |
| 5-Person Households | 177 (5.4%) | 0 (0.0%) |
| 6-Person Households | 96 (2.9%) | 0 (0.0%) |
| 7+ Person Households | 70 (2.1%) | 0 (0.0%) |
| Total | 2,162 (66.1%) | 1,107 (33.9%) |
Female Fertility in Knox County
Fertility by Age in Knox County
Average fertility rate in Knox County is 88.0 births per 1,000 women. Women in the age bracket of 20 to 34 years have the highest fertility rate with 185.0 births per 1,000 women. Women in the age bracket of 20 to 34 years acount for 83.1% of all women with births.
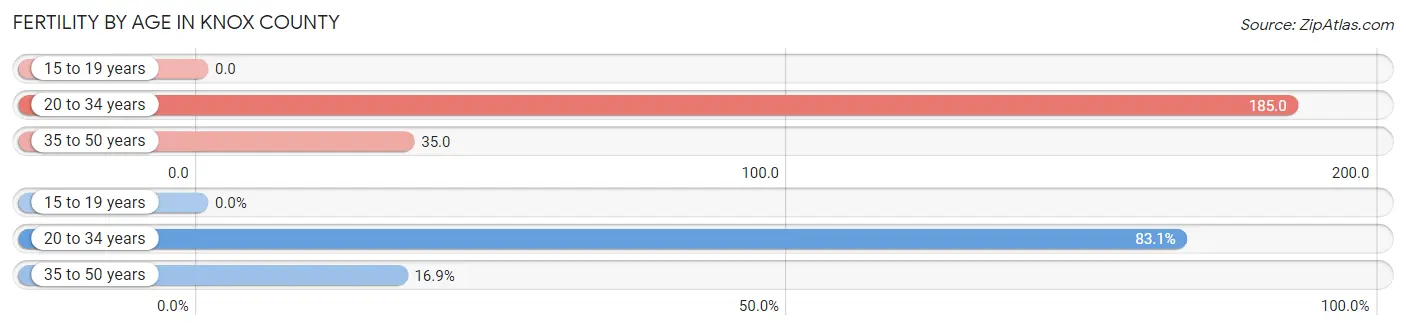
| Age Bracket | Women with Births | Births / 1,000 Women |
| 15 to 19 years | 0 (0.0%) | 0.0 |
| 20 to 34 years | 108 (83.1%) | 185.0 |
| 35 to 50 years | 22 (16.9%) | 35.0 |
| Total | 130 (100.0%) | 88.0 |
Fertility by Age by Marriage Status in Knox County
66.9% of women with births (130) in Knox County are married. The highest percentage of unmarried women with births falls into 35 to 50 years age bracket with 72.7% of them unmarried at the time of birth, while the lowest percentage of unmarried women with births belong to 20 to 34 years age bracket with 25.0% of them unmarried.
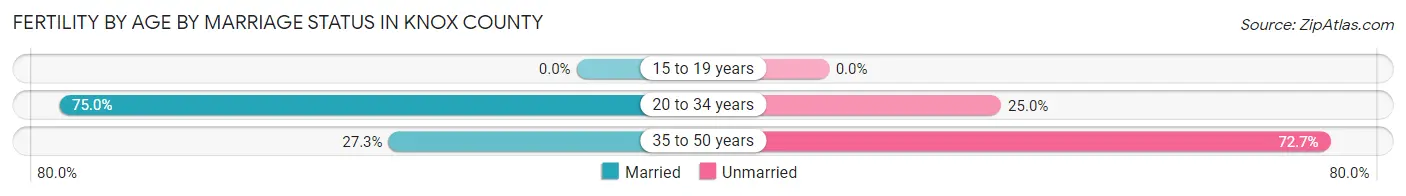
| Age Bracket | Married | Unmarried |
| 15 to 19 years | 0 (0.0%) | 0 (0.0%) |
| 20 to 34 years | 81 (75.0%) | 27 (25.0%) |
| 35 to 50 years | 6 (27.3%) | 16 (72.7%) |
| Total | 87 (66.9%) | 43 (33.1%) |
Fertility by Education in Knox County
Average fertility rate in Knox County is 88.0 births per 1,000 women. Women with the education attainment of high school diploma have the highest fertility rate of 231.0 births per 1,000 women, while women with the education attainment of less than high school have the lowest fertility at 16.0 births per 1,000 women. Women with the education attainment of high school diploma represent 53.8% of all women with births.
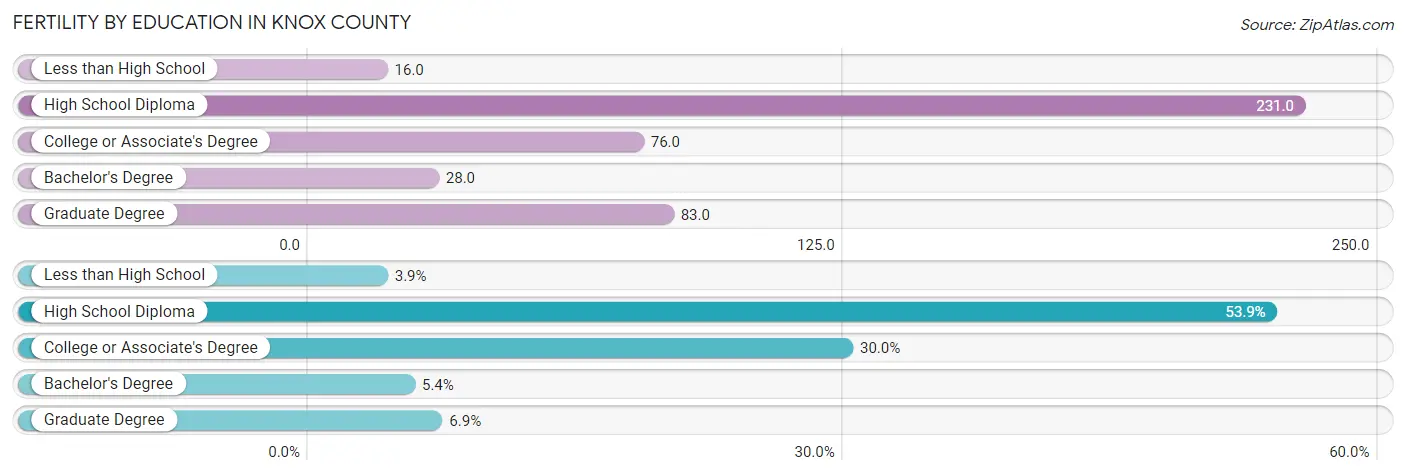
| Educational Attainment | Women with Births | Births / 1,000 Women |
| Less than High School | 5 (3.8%) | 16.0 |
| High School Diploma | 70 (53.8%) | 231.0 |
| College or Associate's Degree | 39 (30.0%) | 76.0 |
| Bachelor's Degree | 7 (5.4%) | 28.0 |
| Graduate Degree | 9 (6.9%) | 83.0 |
| Total | 130 (100.0%) | 88.0 |
Fertility by Education by Marriage Status in Knox County
33.1% of women with births in Knox County are unmarried. Women with the educational attainment of bachelor's degree are most likely to be married with 100.0% of them married at childbirth, while women with the educational attainment of less than high school are least likely to be married with 100.0% of them unmarried at childbirth.
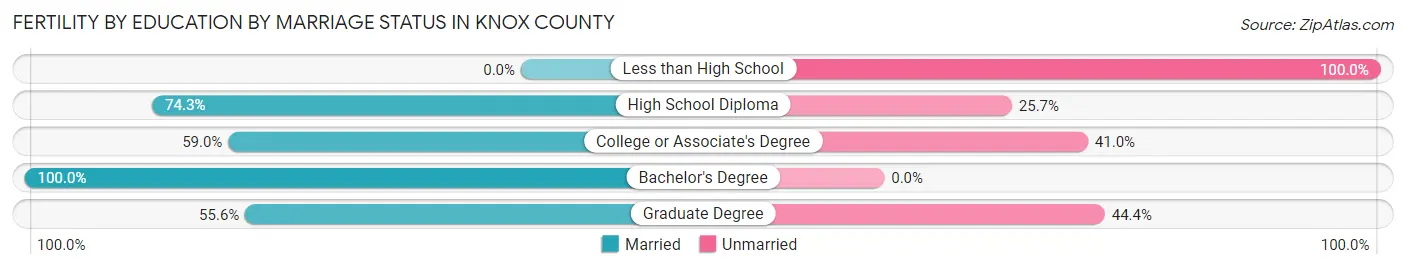
| Educational Attainment | Married | Unmarried |
| Less than High School | 0 (0.0%) | 5 (100.0%) |
| High School Diploma | 52 (74.3%) | 18 (25.7%) |
| College or Associate's Degree | 23 (59.0%) | 16 (41.0%) |
| Bachelor's Degree | 7 (100.0%) | 0 (0.0%) |
| Graduate Degree | 5 (55.6%) | 4 (44.4%) |
| Total | 87 (66.9%) | 43 (33.1%) |
Employment Characteristics in Knox County
Employment by Class of Employer in Knox County
Among the 3,930 employed individuals in Knox County, private company employees (2,193 | 55.8%), self-employed (not incorporated) (682 | 17.3%), and local government employees (428 | 10.9%) make up the most common classes of employment.
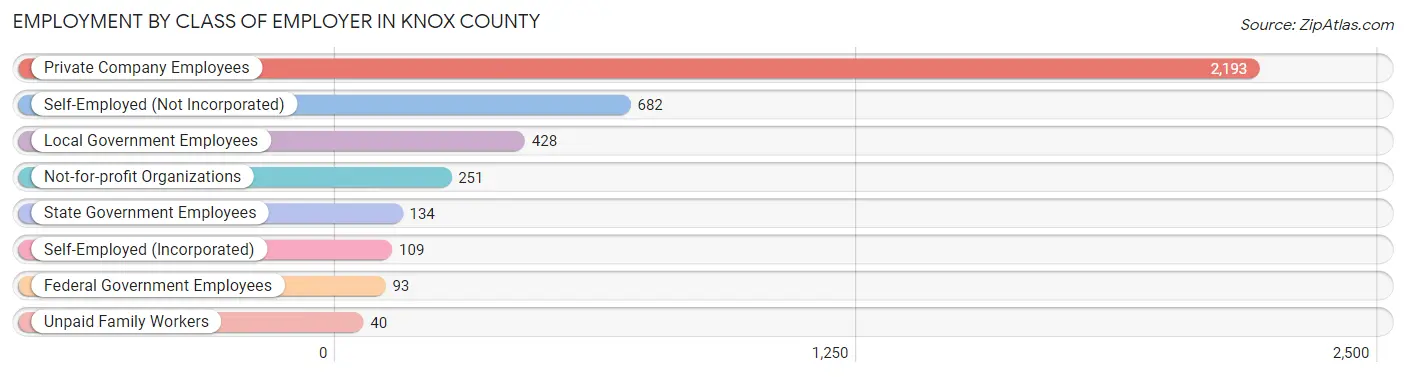
| Employer Class | # Employees | % Employees |
| Private Company Employees | 2,193 | 55.8% |
| Self-Employed (Incorporated) | 109 | 2.8% |
| Self-Employed (Not Incorporated) | 682 | 17.3% |
| Not-for-profit Organizations | 251 | 6.4% |
| Local Government Employees | 428 | 10.9% |
| State Government Employees | 134 | 3.4% |
| Federal Government Employees | 93 | 2.4% |
| Unpaid Family Workers | 40 | 1.0% |
| Total | 3,930 | 100.0% |
Employment Status by Age in Knox County
According to the labor force statistics for Knox County, out of the total population over 16 years of age (6,646), 63.3% or 4,207 individuals are in the labor force, with 4.1% or 172 of them unemployed. The age group with the highest labor force participation rate is 35 to 44 years, with 92.0% or 761 individuals in the labor force. Within the labor force, the 16 to 19 years age range has the highest percentage of unemployed individuals, with 10.5% or 28 of them being unemployed.
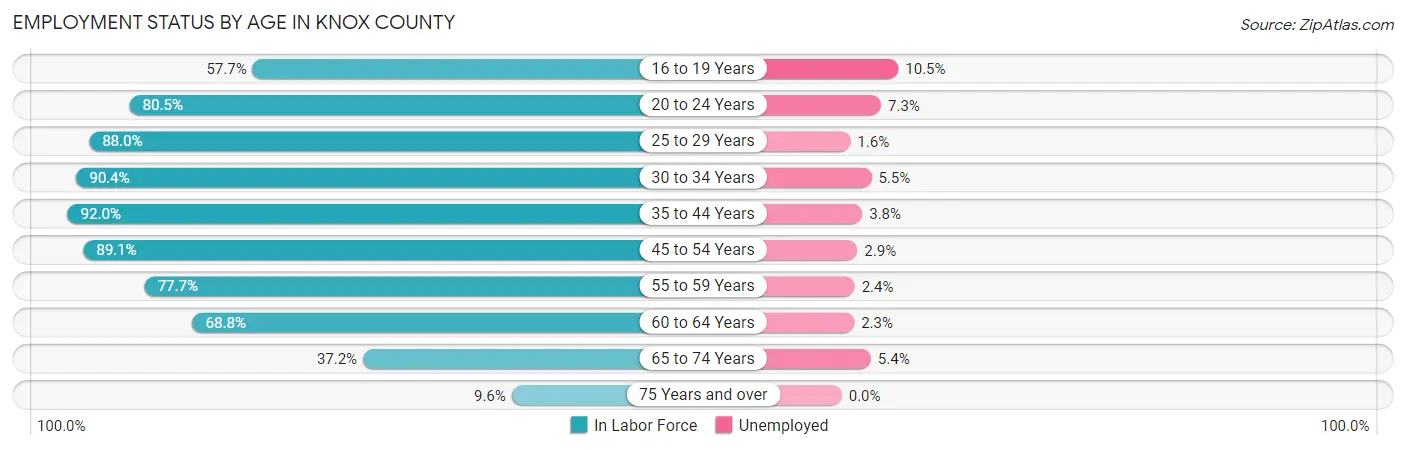
| Age Bracket | In Labor Force | Unemployed |
| 16 to 19 Years | 267 (57.7%) | 28 (10.5%) |
| 20 to 24 Years | 356 (80.5%) | 26 (7.3%) |
| 25 to 29 Years | 366 (88.0%) | 6 (1.6%) |
| 30 to 34 Years | 329 (90.4%) | 18 (5.5%) |
| 35 to 44 Years | 761 (92.0%) | 29 (3.8%) |
| 45 to 54 Years | 729 (89.1%) | 21 (2.9%) |
| 55 to 59 Years | 457 (77.7%) | 11 (2.4%) |
| 60 to 64 Years | 439 (68.8%) | 10 (2.3%) |
| 65 to 74 Years | 408 (37.2%) | 22 (5.4%) |
| 75 Years and over | 95 (9.6%) | 0 (0.0%) |
| Total | 4,207 (63.3%) | 172 (4.1%) |
Employment Status by Educational Attainment in Knox County
According to labor force statistics for Knox County, 84.4% of individuals (3,081) out of the total population between 25 and 64 years of age (3,651) are in the labor force, with 3.1% or 96 of them being unemployed. The group with the highest labor force participation rate are those with the educational attainment of bachelor's degree or higher, with 90.2% or 681 individuals in the labor force. Within the labor force, individuals with less than high school education have the highest percentage of unemployment, with 10.1% or 14 of them being unemployed.
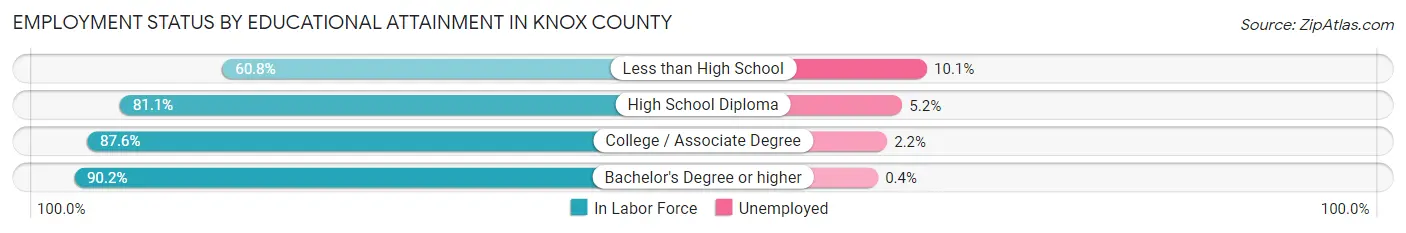
| Educational Attainment | In Labor Force | Unemployed |
| Less than High School | 138 (60.8%) | 23 (10.1%) |
| High School Diploma | 952 (81.1%) | 61 (5.2%) |
| College / Associate Degree | 1,310 (87.6%) | 33 (2.2%) |
| Bachelor's Degree or higher | 681 (90.2%) | 3 (0.4%) |
| Total | 3,081 (84.4%) | 113 (3.1%) |
Employment Occupations by Sex in Knox County
Management, Business, Science and Arts Occupations
The most common Management, Business, Science and Arts occupations in Knox County are Management (720 | 17.8%), Community & Social Service (301 | 7.5%), Health Diagnosing & Treating (238 | 5.9%), Education Instruction & Library (231 | 5.7%), and Health Technologists (169 | 4.2%).
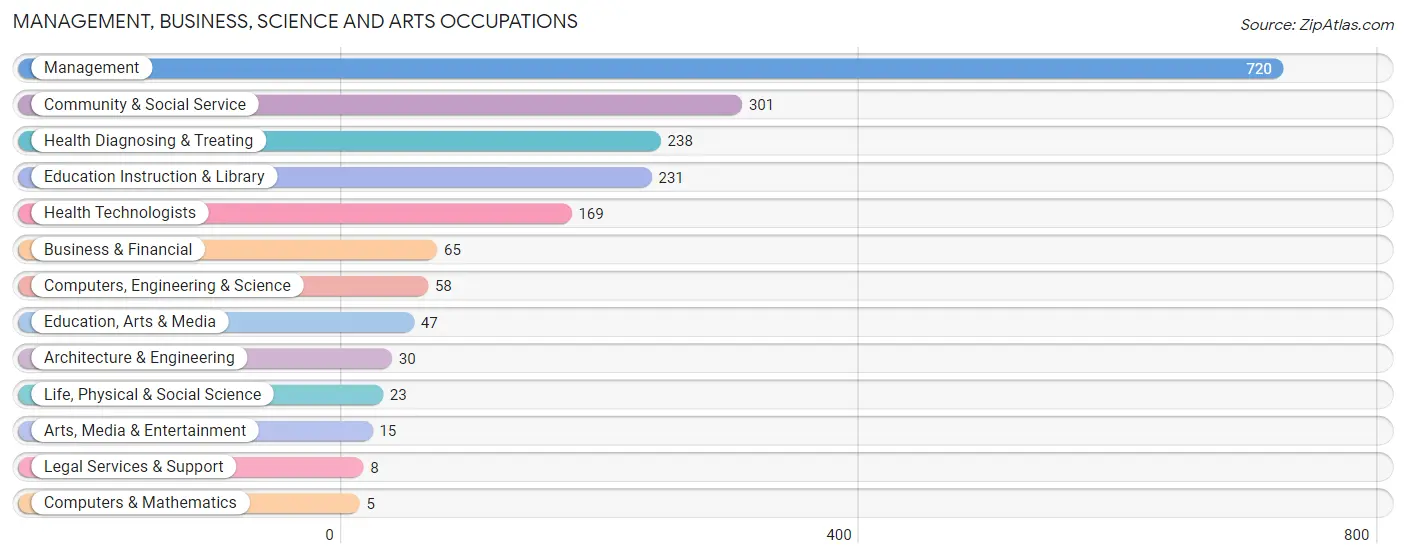
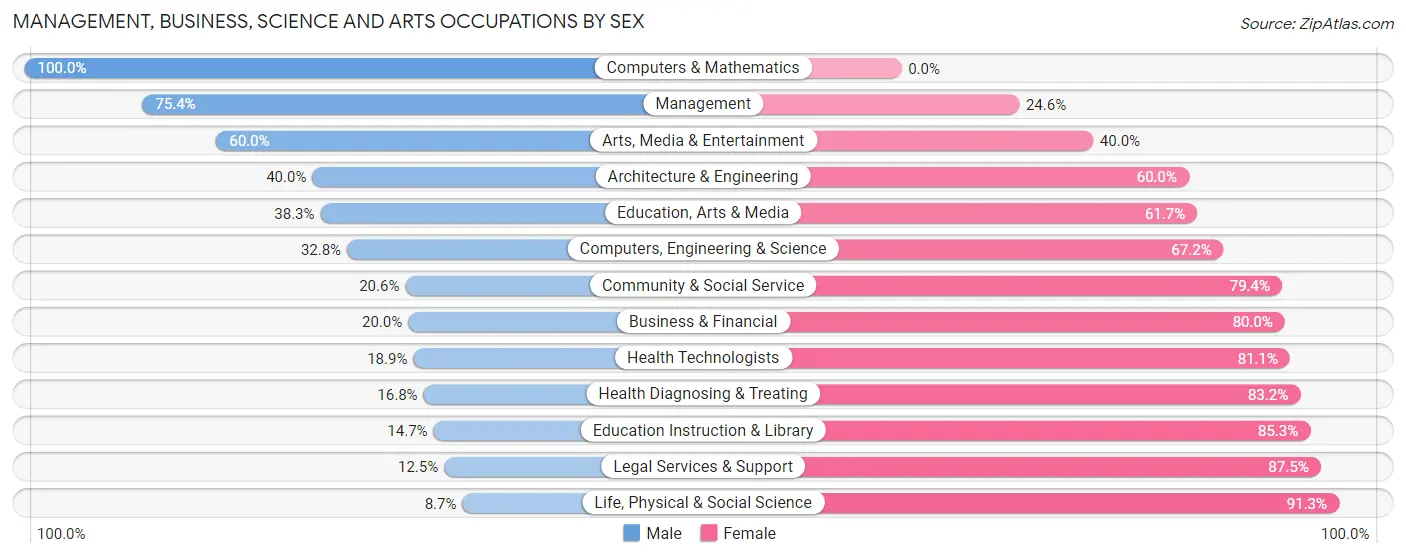
Management, Business, Science and Arts Occupations by Sex
Within the Management, Business, Science and Arts occupations in Knox County, the most male-oriented occupations are Computers & Mathematics (100.0%), Management (75.4%), and Arts, Media & Entertainment (60.0%), while the most female-oriented occupations are Life, Physical & Social Science (91.3%), Legal Services & Support (87.5%), and Education Instruction & Library (85.3%).
| Occupation | Male | Female |
| Management | 543 (75.4%) | 177 (24.6%) |
| Business & Financial | 13 (20.0%) | 52 (80.0%) |
| Computers, Engineering & Science | 19 (32.8%) | 39 (67.2%) |
| Computers & Mathematics | 5 (100.0%) | 0 (0.0%) |
| Architecture & Engineering | 12 (40.0%) | 18 (60.0%) |
| Life, Physical & Social Science | 2 (8.7%) | 21 (91.3%) |
| Community & Social Service | 62 (20.6%) | 239 (79.4%) |
| Education, Arts & Media | 18 (38.3%) | 29 (61.7%) |
| Legal Services & Support | 1 (12.5%) | 7 (87.5%) |
| Education Instruction & Library | 34 (14.7%) | 197 (85.3%) |
| Arts, Media & Entertainment | 9 (60.0%) | 6 (40.0%) |
| Health Diagnosing & Treating | 40 (16.8%) | 198 (83.2%) |
| Health Technologists | 32 (18.9%) | 137 (81.1%) |
| Total (Category) | 677 (49.0%) | 705 (51.0%) |
| Total (Overall) | 2,268 (56.2%) | 1,766 (43.8%) |
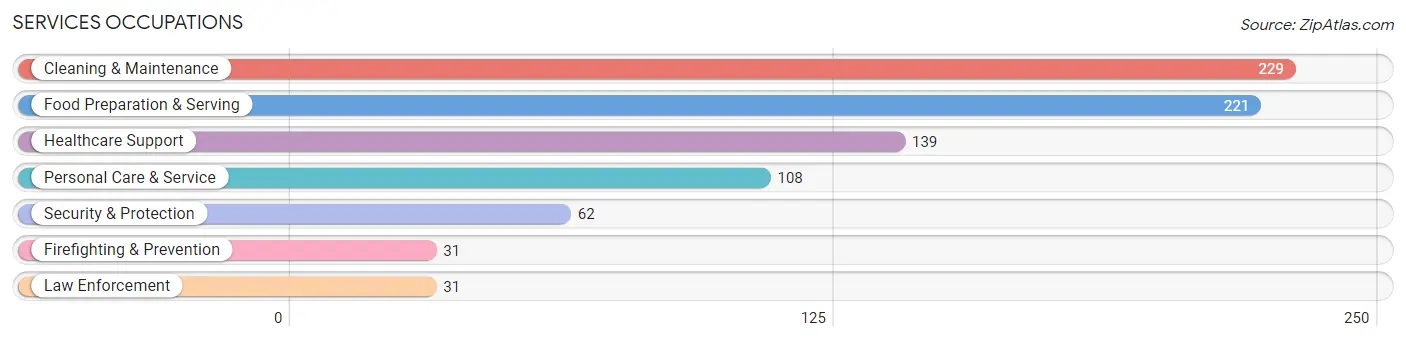
Services Occupations
The most common Services occupations in Knox County are Cleaning & Maintenance (229 | 5.7%), Food Preparation & Serving (221 | 5.5%), Healthcare Support (139 | 3.5%), Personal Care & Service (108 | 2.7%), and Security & Protection (62 | 1.5%).
Services Occupations by Sex
Within the Services occupations in Knox County, the most male-oriented occupations are Security & Protection (100.0%), Firefighting & Prevention (100.0%), and Law Enforcement (100.0%), while the most female-oriented occupations are Healthcare Support (83.5%), Food Preparation & Serving (76.9%), and Personal Care & Service (49.1%).
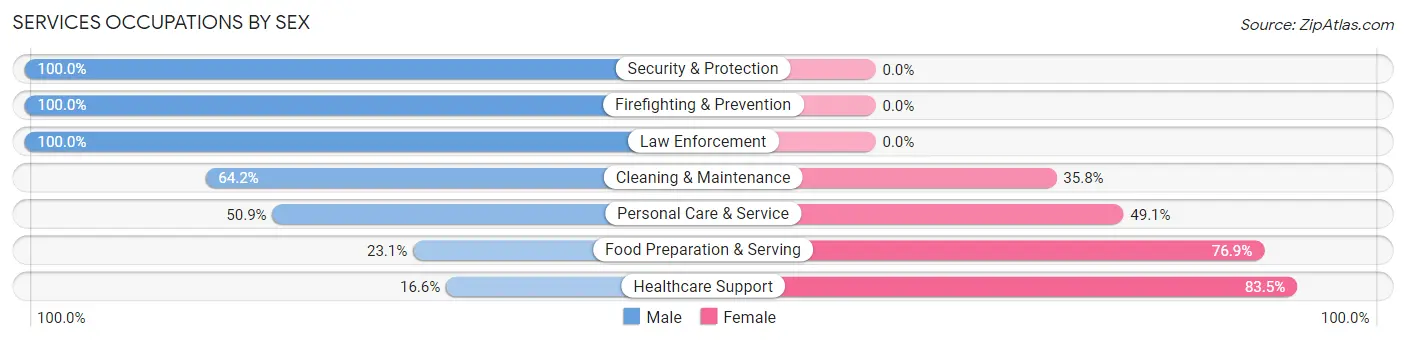
| Occupation | Male | Female |
| Healthcare Support | 23 (16.6%) | 116 (83.5%) |
| Security & Protection | 62 (100.0%) | 0 (0.0%) |
| Firefighting & Prevention | 31 (100.0%) | 0 (0.0%) |
| Law Enforcement | 31 (100.0%) | 0 (0.0%) |
| Food Preparation & Serving | 51 (23.1%) | 170 (76.9%) |
| Cleaning & Maintenance | 147 (64.2%) | 82 (35.8%) |
| Personal Care & Service | 55 (50.9%) | 53 (49.1%) |
| Total (Category) | 338 (44.5%) | 421 (55.5%) |
| Total (Overall) | 2,268 (56.2%) | 1,766 (43.8%) |
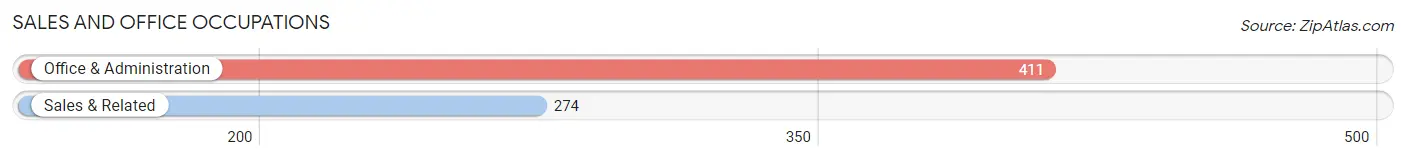
Sales and Office Occupations
The most common Sales and Office occupations in Knox County are Office & Administration (411 | 10.2%), and Sales & Related (274 | 6.8%).
Sales and Office Occupations by Sex
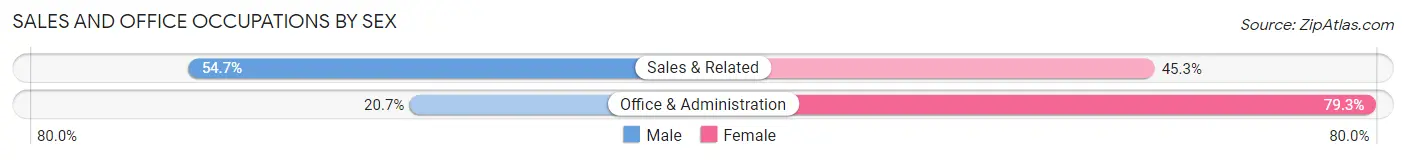
| Occupation | Male | Female |
| Sales & Related | 150 (54.7%) | 124 (45.3%) |
| Office & Administration | 85 (20.7%) | 326 (79.3%) |
| Total (Category) | 235 (34.3%) | 450 (65.7%) |
| Total (Overall) | 2,268 (56.2%) | 1,766 (43.8%) |
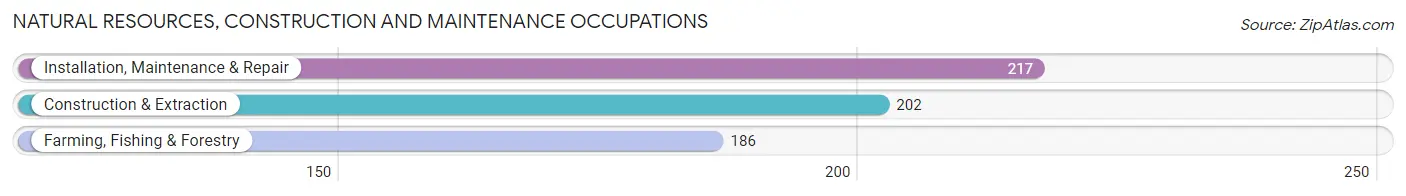
Natural Resources, Construction and Maintenance Occupations
The most common Natural Resources, Construction and Maintenance occupations in Knox County are Installation, Maintenance & Repair (217 | 5.4%), Construction & Extraction (202 | 5.0%), and Farming, Fishing & Forestry (186 | 4.6%).
Natural Resources, Construction and Maintenance Occupations by Sex
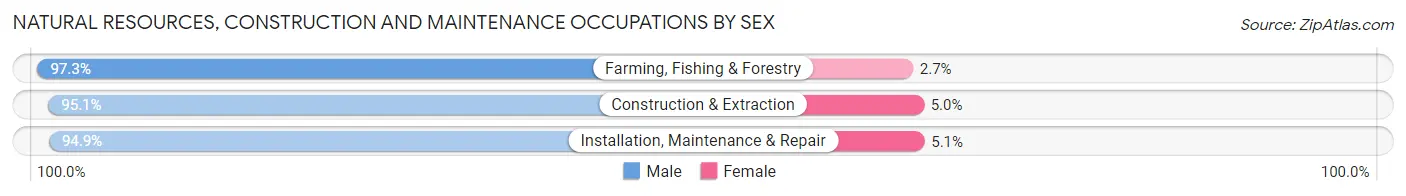
| Occupation | Male | Female |
| Farming, Fishing & Forestry | 181 (97.3%) | 5 (2.7%) |
| Construction & Extraction | 192 (95.1%) | 10 (5.0%) |
| Installation, Maintenance & Repair | 206 (94.9%) | 11 (5.1%) |
| Total (Category) | 579 (95.7%) | 26 (4.3%) |
| Total (Overall) | 2,268 (56.2%) | 1,766 (43.8%) |
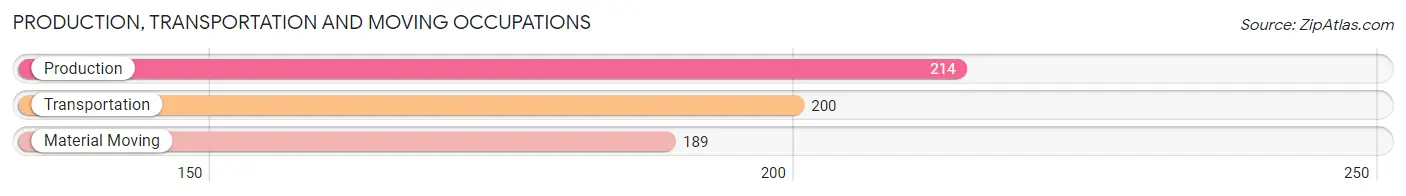
Production, Transportation and Moving Occupations
The most common Production, Transportation and Moving occupations in Knox County are Production (214 | 5.3%), Transportation (200 | 5.0%), and Material Moving (189 | 4.7%).
Production, Transportation and Moving Occupations by Sex
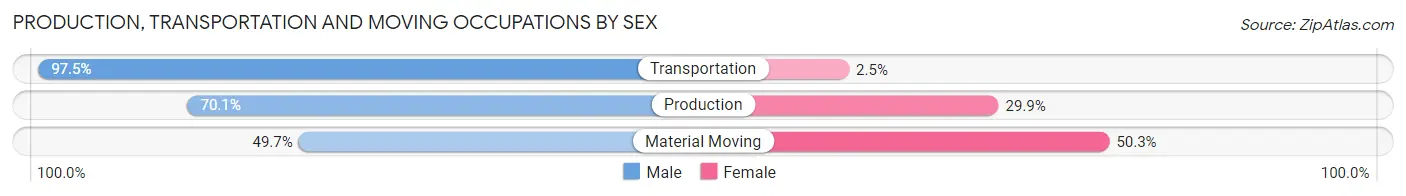
| Occupation | Male | Female |
| Production | 150 (70.1%) | 64 (29.9%) |
| Transportation | 195 (97.5%) | 5 (2.5%) |
| Material Moving | 94 (49.7%) | 95 (50.3%) |
| Total (Category) | 439 (72.8%) | 164 (27.2%) |
| Total (Overall) | 2,268 (56.2%) | 1,766 (43.8%) |
Employment Industries by Sex in Knox County
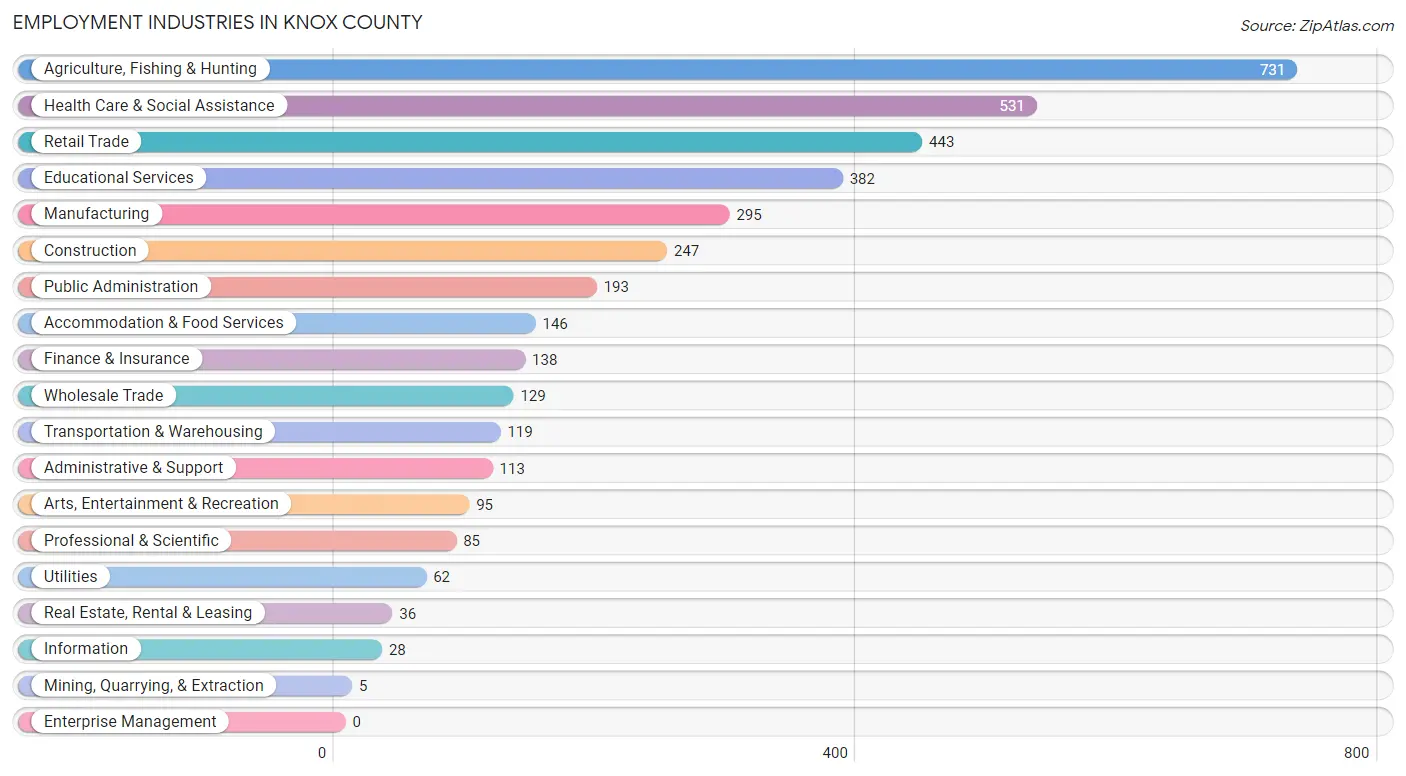
Employment Industries in Knox County
The major employment industries in Knox County include Agriculture, Fishing & Hunting (731 | 18.1%), Health Care & Social Assistance (531 | 13.2%), Retail Trade (443 | 11.0%), Educational Services (382 | 9.5%), and Manufacturing (295 | 7.3%).
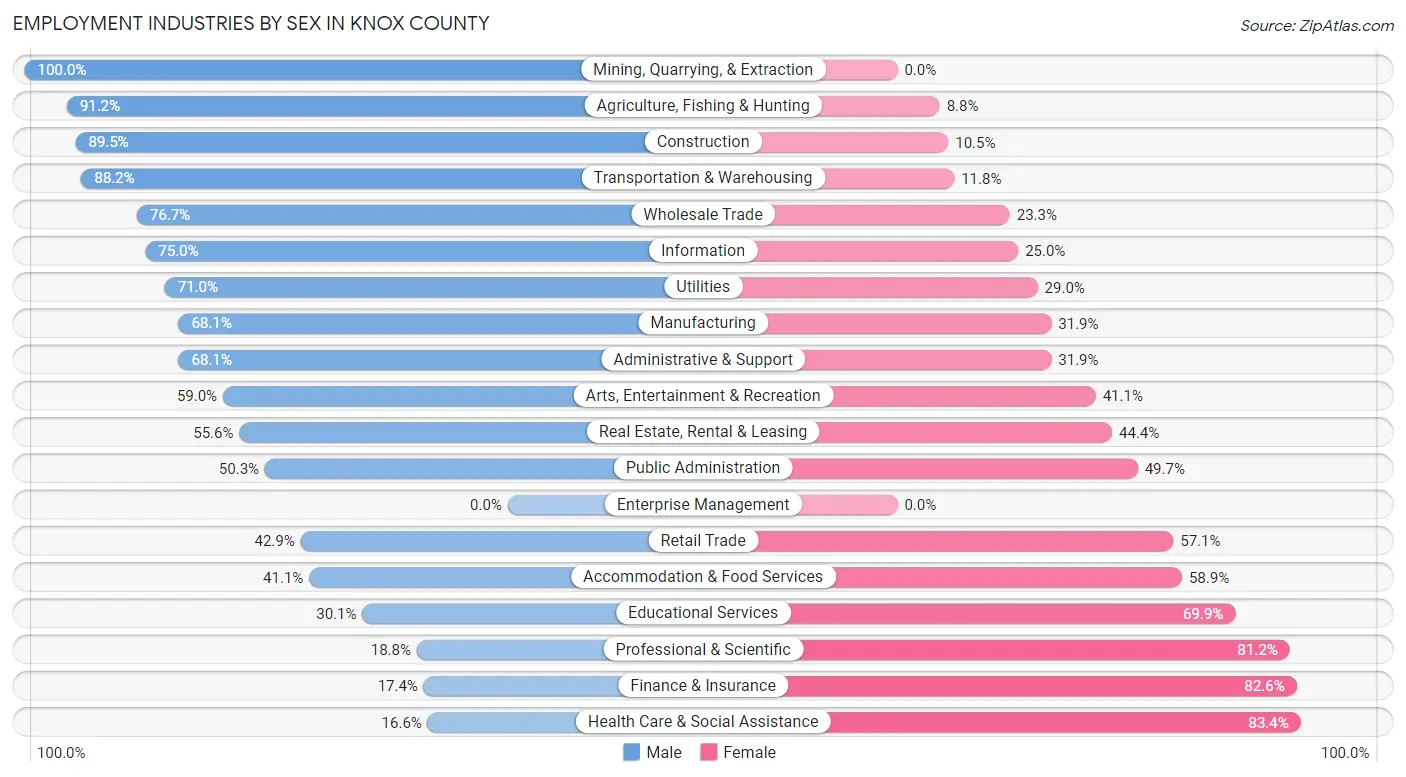
Employment Industries by Sex in Knox County
The Knox County industries that see more men than women are Mining, Quarrying, & Extraction (100.0%), Agriculture, Fishing & Hunting (91.2%), and Construction (89.5%), whereas the industries that tend to have a higher number of women are Health Care & Social Assistance (83.4%), Finance & Insurance (82.6%), and Professional & Scientific (81.2%).
| Industry | Male | Female |
| Agriculture, Fishing & Hunting | 667 (91.2%) | 64 (8.8%) |
| Mining, Quarrying, & Extraction | 5 (100.0%) | 0 (0.0%) |
| Construction | 221 (89.5%) | 26 (10.5%) |
| Manufacturing | 201 (68.1%) | 94 (31.9%) |
| Wholesale Trade | 99 (76.7%) | 30 (23.3%) |
| Retail Trade | 190 (42.9%) | 253 (57.1%) |
| Transportation & Warehousing | 105 (88.2%) | 14 (11.8%) |
| Utilities | 44 (71.0%) | 18 (29.0%) |
| Information | 21 (75.0%) | 7 (25.0%) |
| Finance & Insurance | 24 (17.4%) | 114 (82.6%) |
| Real Estate, Rental & Leasing | 20 (55.6%) | 16 (44.4%) |
| Professional & Scientific | 16 (18.8%) | 69 (81.2%) |
| Enterprise Management | 0 (0.0%) | 0 (0.0%) |
| Administrative & Support | 77 (68.1%) | 36 (31.9%) |
| Educational Services | 115 (30.1%) | 267 (69.9%) |
| Health Care & Social Assistance | 88 (16.6%) | 443 (83.4%) |
| Arts, Entertainment & Recreation | 56 (59.0%) | 39 (41.0%) |
| Accommodation & Food Services | 60 (41.1%) | 86 (58.9%) |
| Public Administration | 97 (50.3%) | 96 (49.7%) |
| Total | 2,268 (56.2%) | 1,766 (43.8%) |
Education in Knox County
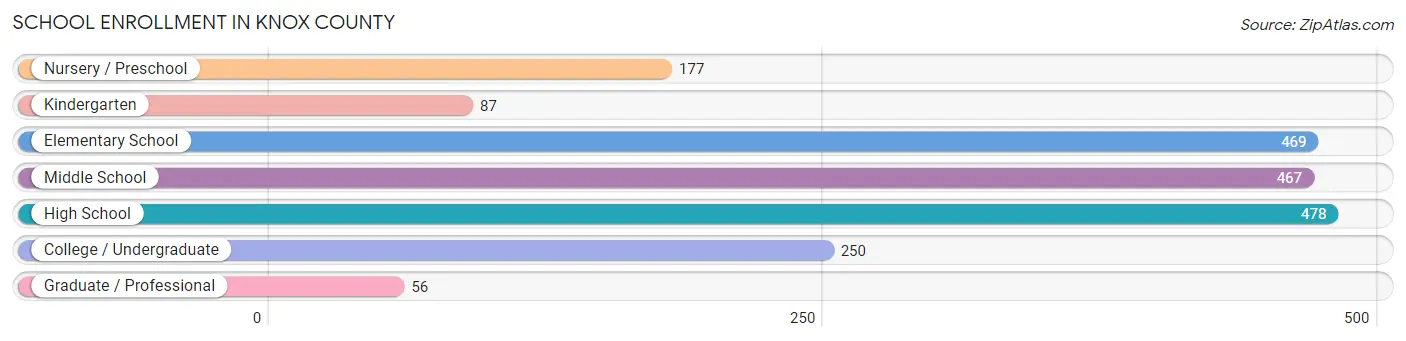
School Enrollment in Knox County
The most common levels of schooling among the 1,984 students in Knox County are high school (478 | 24.1%), elementary school (469 | 23.6%), and middle school (467 | 23.5%).
| School Level | # Students | % Students |
| Nursery / Preschool | 177 | 8.9% |
| Kindergarten | 87 | 4.4% |
| Elementary School | 469 | 23.6% |
| Middle School | 467 | 23.5% |
| High School | 478 | 24.1% |
| College / Undergraduate | 250 | 12.6% |
| Graduate / Professional | 56 | 2.8% |
| Total | 1,984 | 100.0% |
School Enrollment by Age by Funding Source in Knox County
Out of a total of 1,984 students who are enrolled in schools in Knox County, 278 (14.0%) attend a private institution, while the remaining 1,706 (86.0%) are enrolled in public schools. The age group of 20 to 24 year olds has the highest likelihood of being enrolled in private schools, with 29 (38.2% in the age bracket) enrolled. Conversely, the age group of 15 to 17 year olds has the lowest likelihood of being enrolled in a private school, with 352 (98.1% in the age bracket) attending a public institution.
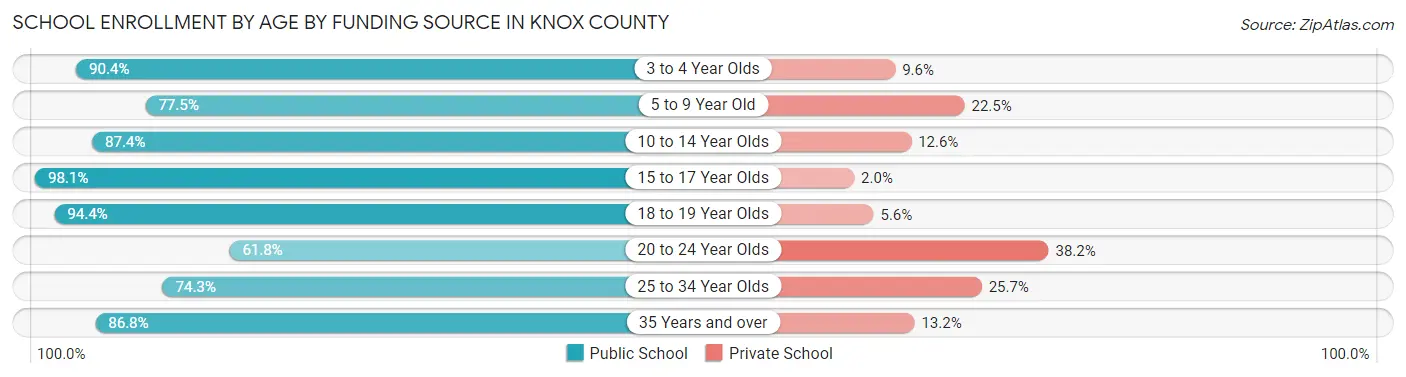
| Age Bracket | Public School | Private School |
| 3 to 4 Year Olds | 113 (90.4%) | 12 (9.6%) |
| 5 to 9 Year Old | 399 (77.5%) | 116 (22.5%) |
| 10 to 14 Year Olds | 528 (87.4%) | 76 (12.6%) |
| 15 to 17 Year Olds | 352 (98.1%) | 7 (1.9%) |
| 18 to 19 Year Olds | 136 (94.4%) | 8 (5.6%) |
| 20 to 24 Year Olds | 47 (61.8%) | 29 (38.2%) |
| 25 to 34 Year Olds | 52 (74.3%) | 18 (25.7%) |
| 35 Years and over | 79 (86.8%) | 12 (13.2%) |
| Total | 1,706 (86.0%) | 278 (14.0%) |
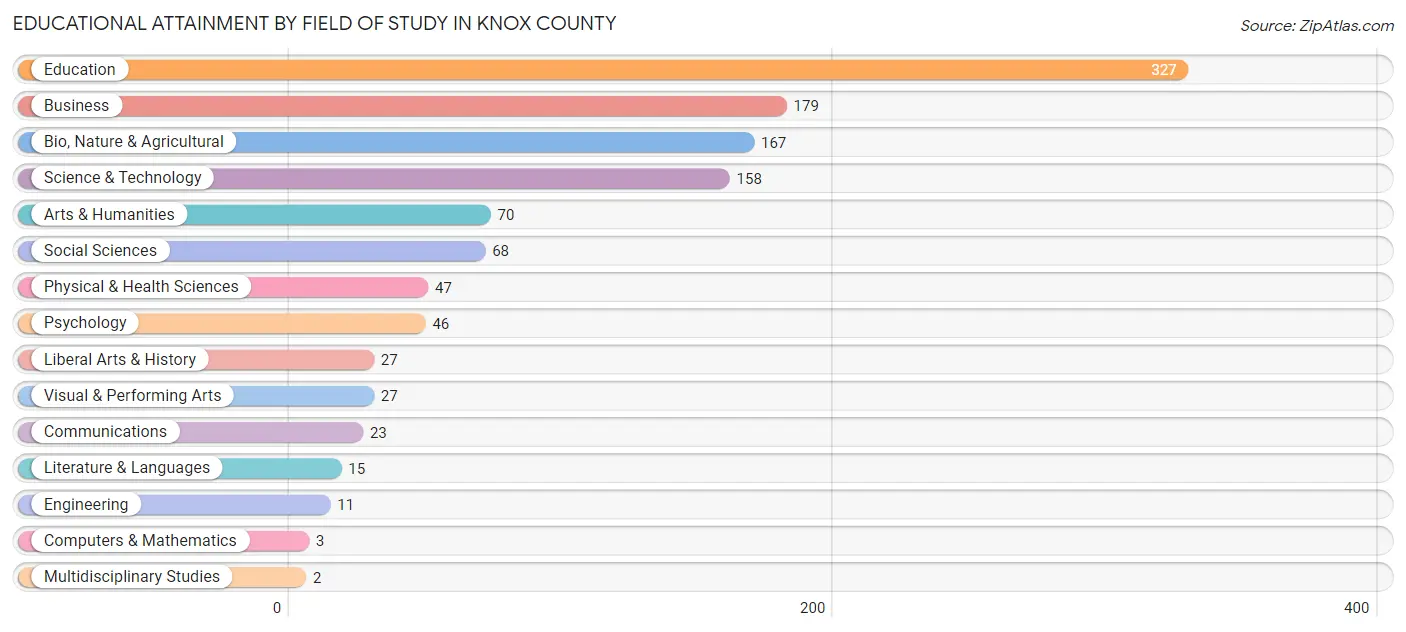
Educational Attainment by Field of Study in Knox County
Education (327 | 28.0%), business (179 | 15.3%), bio, nature & agricultural (167 | 14.3%), science & technology (158 | 13.5%), and arts & humanities (70 | 6.0%) are the most common fields of study among 1,170 individuals in Knox County who have obtained a bachelor's degree or higher.
| Field of Study | # Graduates | % Graduates |
| Computers & Mathematics | 3 | 0.3% |
| Bio, Nature & Agricultural | 167 | 14.3% |
| Physical & Health Sciences | 47 | 4.0% |
| Psychology | 46 | 3.9% |
| Social Sciences | 68 | 5.8% |
| Engineering | 11 | 0.9% |
| Multidisciplinary Studies | 2 | 0.2% |
| Science & Technology | 158 | 13.5% |
| Business | 179 | 15.3% |
| Education | 327 | 28.0% |
| Literature & Languages | 15 | 1.3% |
| Liberal Arts & History | 27 | 2.3% |
| Visual & Performing Arts | 27 | 2.3% |
| Communications | 23 | 2.0% |
| Arts & Humanities | 70 | 6.0% |
| Total | 1,170 | 100.0% |
Transportation & Commute in Knox County
Vehicle Availability by Sex in Knox County
The most prevalent vehicle ownership categories in Knox County are males with 2 vehicles (739, accounting for 33.2%) and females with 2 vehicles (601, making up 43.3%).
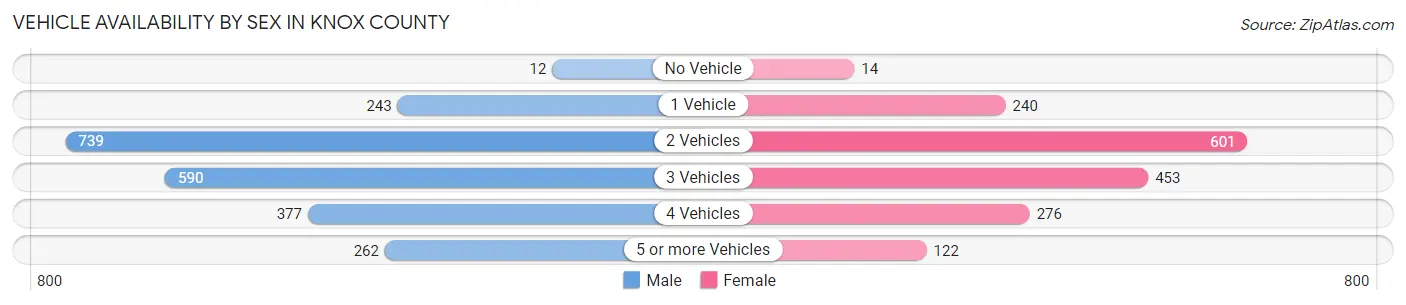
| Vehicles Available | Male | Female |
| No Vehicle | 12 (0.5%) | 14 (0.8%) |
| 1 Vehicle | 243 (10.9%) | 240 (14.1%) |
| 2 Vehicles | 739 (33.2%) | 601 (35.2%) |
| 3 Vehicles | 590 (26.5%) | 453 (26.6%) |
| 4 Vehicles | 377 (17.0%) | 276 (16.2%) |
| 5 or more Vehicles | 262 (11.8%) | 122 (7.1%) |
| Total | 2,223 (100.0%) | 1,706 (100.0%) |
Commute Time in Knox County
The most frequently occuring commute durations in Knox County are less than 5 minutes (675 commuters, 19.0%), 5 to 9 minutes (586 commuters, 16.5%), and 10 to 14 minutes (563 commuters, 15.9%).
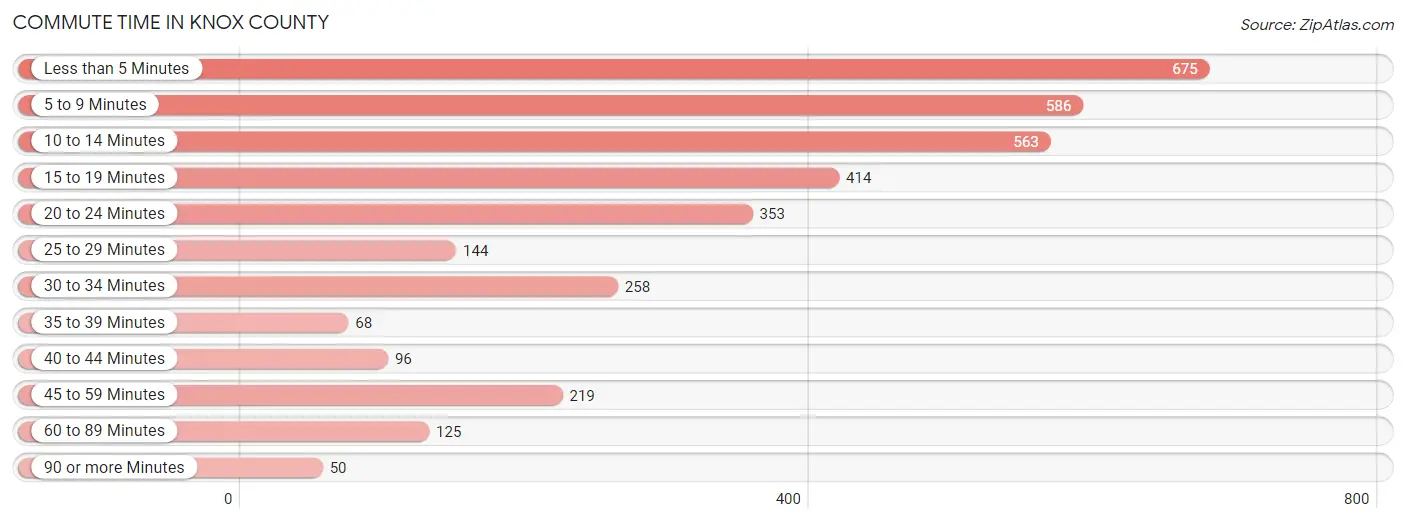
| Commute Time | # Commuters | % Commuters |
| Less than 5 Minutes | 675 | 19.0% |
| 5 to 9 Minutes | 586 | 16.5% |
| 10 to 14 Minutes | 563 | 15.9% |
| 15 to 19 Minutes | 414 | 11.7% |
| 20 to 24 Minutes | 353 | 9.9% |
| 25 to 29 Minutes | 144 | 4.1% |
| 30 to 34 Minutes | 258 | 7.3% |
| 35 to 39 Minutes | 68 | 1.9% |
| 40 to 44 Minutes | 96 | 2.7% |
| 45 to 59 Minutes | 219 | 6.2% |
| 60 to 89 Minutes | 125 | 3.5% |
| 90 or more Minutes | 50 | 1.4% |
Commute Time by Sex in Knox County
The most common commute times in Knox County are less than 5 minutes (360 commuters, 18.5%) for males and less than 5 minutes (315 commuters, 19.6%) for females.
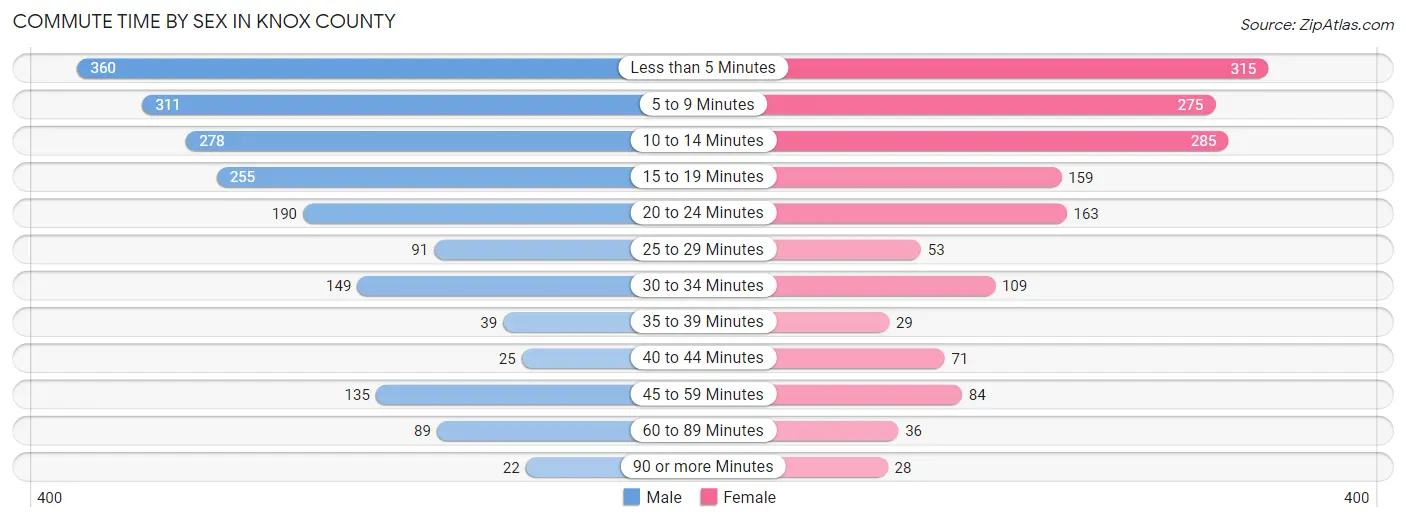
| Commute Time | Male | Female |
| Less than 5 Minutes | 360 (18.5%) | 315 (19.6%) |
| 5 to 9 Minutes | 311 (16.0%) | 275 (17.1%) |
| 10 to 14 Minutes | 278 (14.3%) | 285 (17.7%) |
| 15 to 19 Minutes | 255 (13.1%) | 159 (9.9%) |
| 20 to 24 Minutes | 190 (9.8%) | 163 (10.1%) |
| 25 to 29 Minutes | 91 (4.7%) | 53 (3.3%) |
| 30 to 34 Minutes | 149 (7.7%) | 109 (6.8%) |
| 35 to 39 Minutes | 39 (2.0%) | 29 (1.8%) |
| 40 to 44 Minutes | 25 (1.3%) | 71 (4.4%) |
| 45 to 59 Minutes | 135 (6.9%) | 84 (5.2%) |
| 60 to 89 Minutes | 89 (4.6%) | 36 (2.2%) |
| 90 or more Minutes | 22 (1.1%) | 28 (1.7%) |
Time of Departure to Work by Sex in Knox County
The most frequent times of departure to work in Knox County are 7:30 AM to 7:59 AM (445, 22.9%) for males and 7:30 AM to 7:59 AM (353, 22.0%) for females.
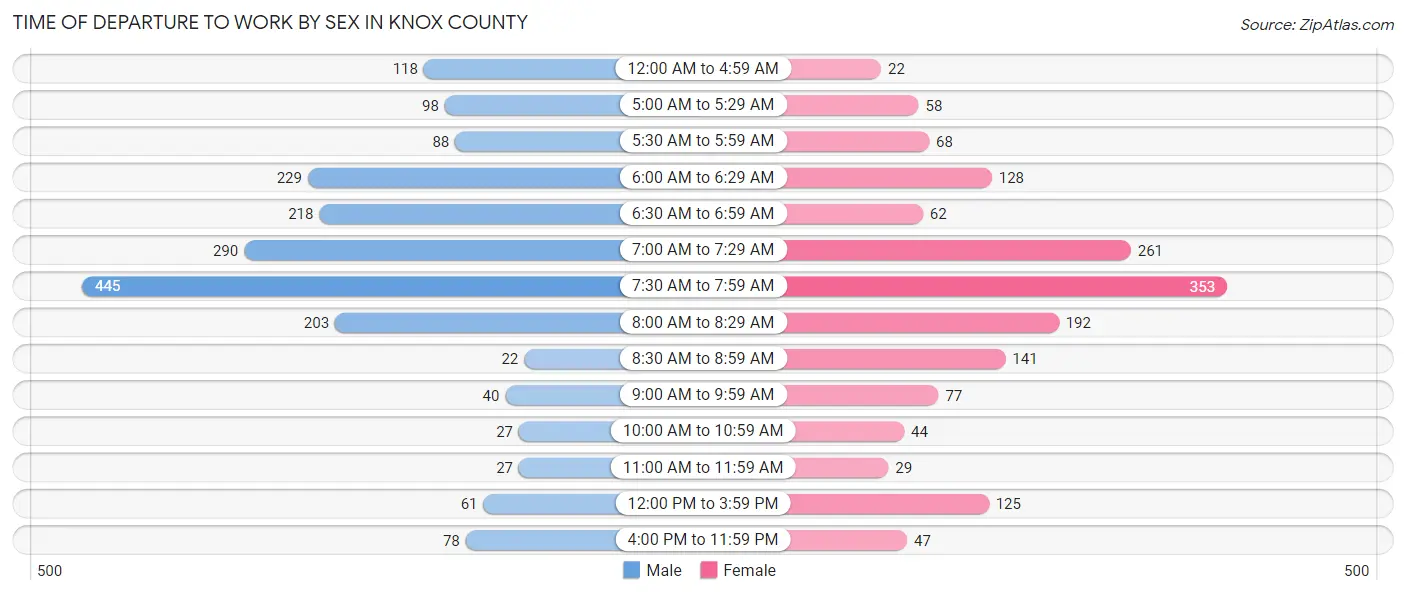
| Time of Departure | Male | Female |
| 12:00 AM to 4:59 AM | 118 (6.1%) | 22 (1.4%) |
| 5:00 AM to 5:29 AM | 98 (5.0%) | 58 (3.6%) |
| 5:30 AM to 5:59 AM | 88 (4.5%) | 68 (4.2%) |
| 6:00 AM to 6:29 AM | 229 (11.8%) | 128 (8.0%) |
| 6:30 AM to 6:59 AM | 218 (11.2%) | 62 (3.9%) |
| 7:00 AM to 7:29 AM | 290 (14.9%) | 261 (16.2%) |
| 7:30 AM to 7:59 AM | 445 (22.9%) | 353 (22.0%) |
| 8:00 AM to 8:29 AM | 203 (10.4%) | 192 (11.9%) |
| 8:30 AM to 8:59 AM | 22 (1.1%) | 141 (8.8%) |
| 9:00 AM to 9:59 AM | 40 (2.1%) | 77 (4.8%) |
| 10:00 AM to 10:59 AM | 27 (1.4%) | 44 (2.7%) |
| 11:00 AM to 11:59 AM | 27 (1.4%) | 29 (1.8%) |
| 12:00 PM to 3:59 PM | 61 (3.1%) | 125 (7.8%) |
| 4:00 PM to 11:59 PM | 78 (4.0%) | 47 (2.9%) |
| Total | 1,944 (100.0%) | 1,607 (100.0%) |
Housing Occupancy in Knox County
Occupancy by Ownership in Knox County
Of the total 3,269 dwellings in Knox County, owner-occupied units account for 2,482 (75.9%), while renter-occupied units make up 787 (24.1%).
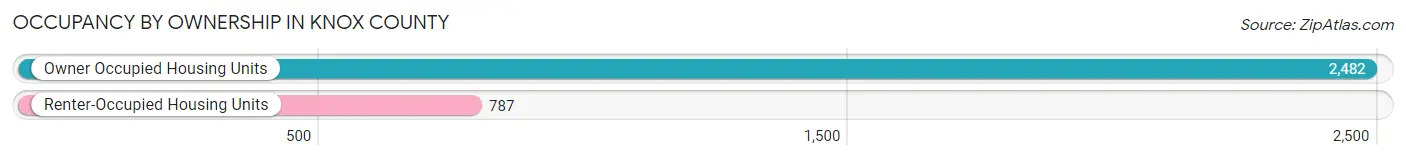
| Occupancy | # Housing Units | % Housing Units |
| Owner Occupied Housing Units | 2,482 | 75.9% |
| Renter-Occupied Housing Units | 787 | 24.1% |
| Total Occupied Housing Units | 3,269 | 100.0% |
Occupancy by Household Size in Knox County
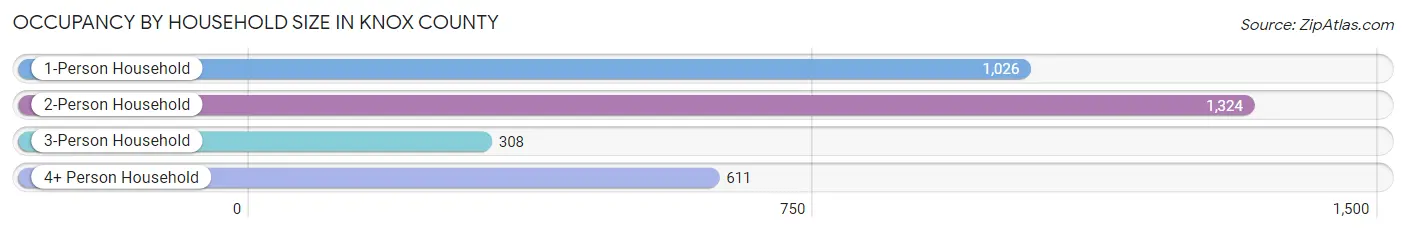
| Household Size | # Housing Units | % Housing Units |
| 1-Person Household | 1,026 | 31.4% |
| 2-Person Household | 1,324 | 40.5% |
| 3-Person Household | 308 | 9.4% |
| 4+ Person Household | 611 | 18.7% |
| Total Housing Units | 3,269 | 100.0% |
Occupancy by Ownership by Household Size in Knox County
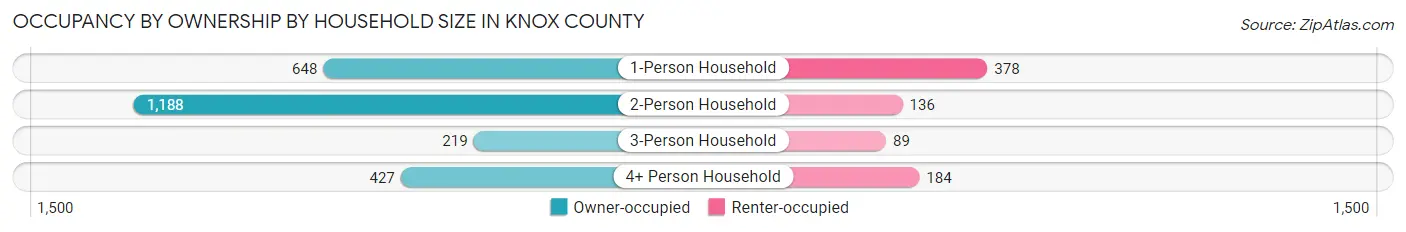
| Household Size | Owner-occupied | Renter-occupied |
| 1-Person Household | 648 (63.2%) | 378 (36.8%) |
| 2-Person Household | 1,188 (89.7%) | 136 (10.3%) |
| 3-Person Household | 219 (71.1%) | 89 (28.9%) |
| 4+ Person Household | 427 (69.9%) | 184 (30.1%) |
| Total Housing Units | 2,482 (75.9%) | 787 (24.1%) |
Occupancy by Educational Attainment in Knox County
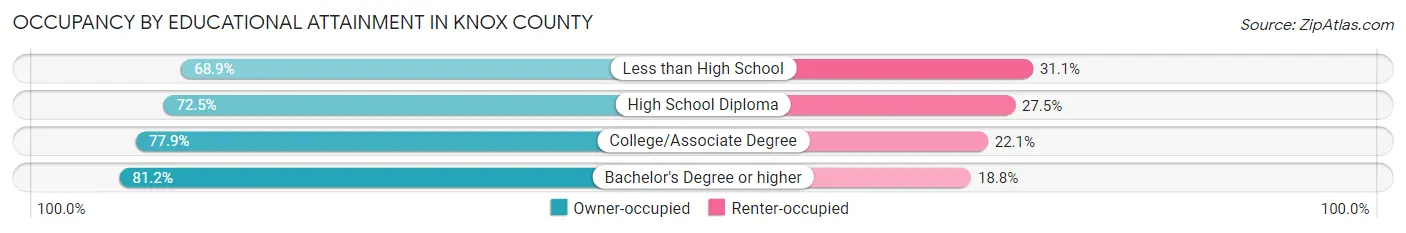
| Household Size | Owner-occupied | Renter-occupied |
| Less than High School | 153 (68.9%) | 69 (31.1%) |
| High School Diploma | 863 (72.5%) | 328 (27.5%) |
| College/Associate Degree | 957 (77.9%) | 272 (22.1%) |
| Bachelor's Degree or higher | 509 (81.2%) | 118 (18.8%) |
Occupancy by Age of Householder in Knox County
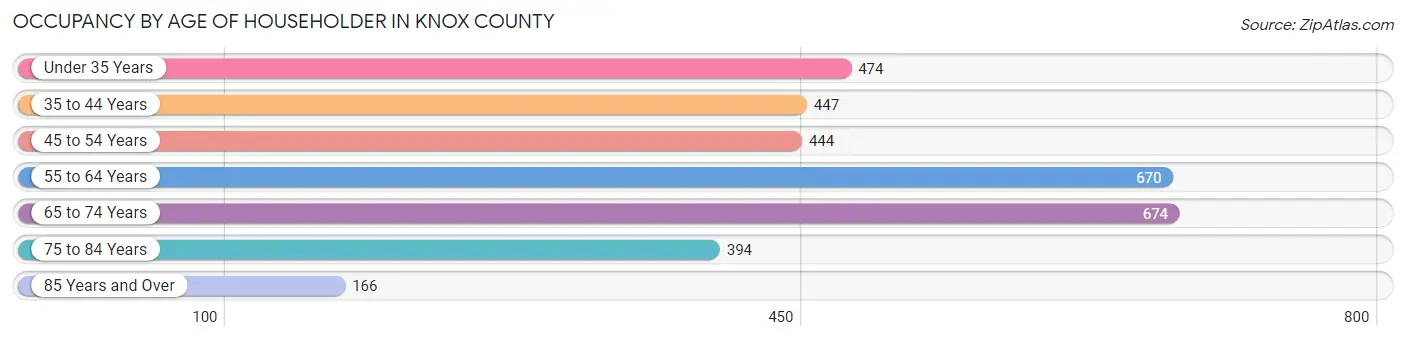
| Age Bracket | # Households | % Households |
| Under 35 Years | 474 | 14.5% |
| 35 to 44 Years | 447 | 13.7% |
| 45 to 54 Years | 444 | 13.6% |
| 55 to 64 Years | 670 | 20.5% |
| 65 to 74 Years | 674 | 20.6% |
| 75 to 84 Years | 394 | 12.0% |
| 85 Years and Over | 166 | 5.1% |
| Total | 3,269 | 100.0% |
Housing Finances in Knox County
Median Income by Occupancy in Knox County
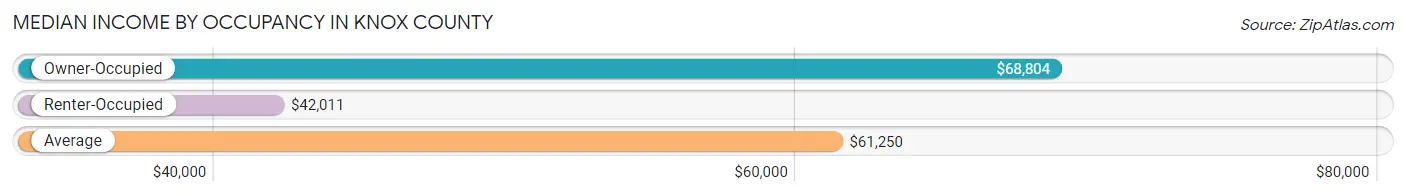
| Occupancy Type | # Households | Median Income |
| Owner-Occupied | 2,482 (75.9%) | $68,804 |
| Renter-Occupied | 787 (24.1%) | $42,011 |
| Average | 3,269 (100.0%) | $61,250 |
Occupancy by Householder Income Bracket in Knox County
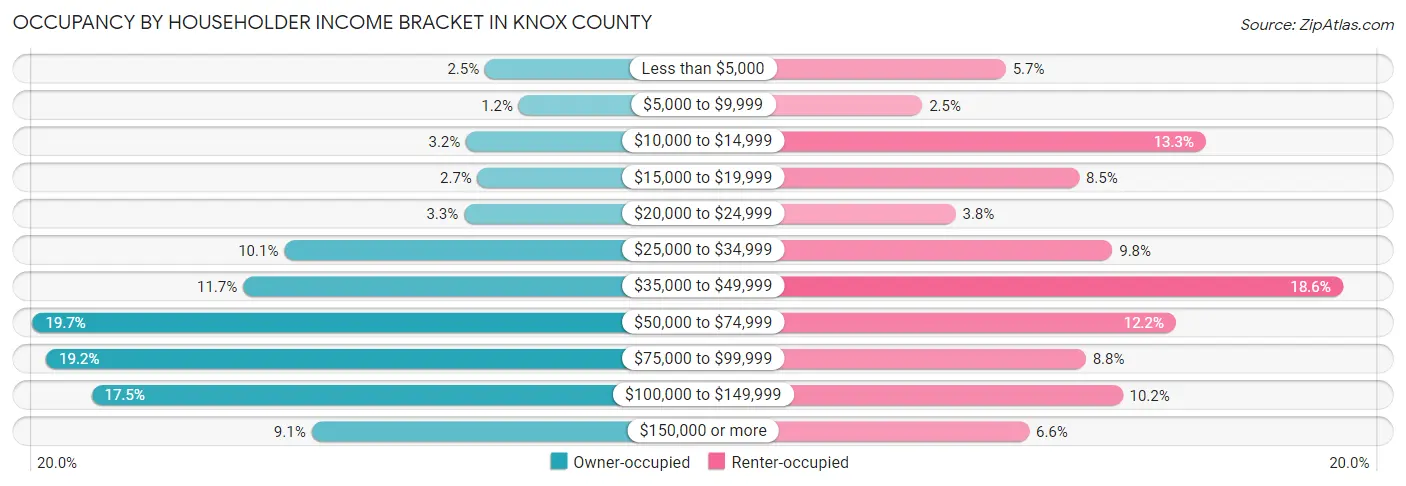
| Income Bracket | Owner-occupied | Renter-occupied |
| Less than $5,000 | 61 (2.5%) | 45 (5.7%) |
| $5,000 to $9,999 | 29 (1.2%) | 20 (2.5%) |
| $10,000 to $14,999 | 79 (3.2%) | 105 (13.3%) |
| $15,000 to $19,999 | 68 (2.7%) | 67 (8.5%) |
| $20,000 to $24,999 | 81 (3.3%) | 30 (3.8%) |
| $25,000 to $34,999 | 251 (10.1%) | 77 (9.8%) |
| $35,000 to $49,999 | 290 (11.7%) | 146 (18.5%) |
| $50,000 to $74,999 | 489 (19.7%) | 96 (12.2%) |
| $75,000 to $99,999 | 476 (19.2%) | 69 (8.8%) |
| $100,000 to $149,999 | 433 (17.4%) | 80 (10.2%) |
| $150,000 or more | 225 (9.1%) | 52 (6.6%) |
| Total | 2,482 (100.0%) | 787 (100.0%) |
Monthly Housing Cost Tiers in Knox County
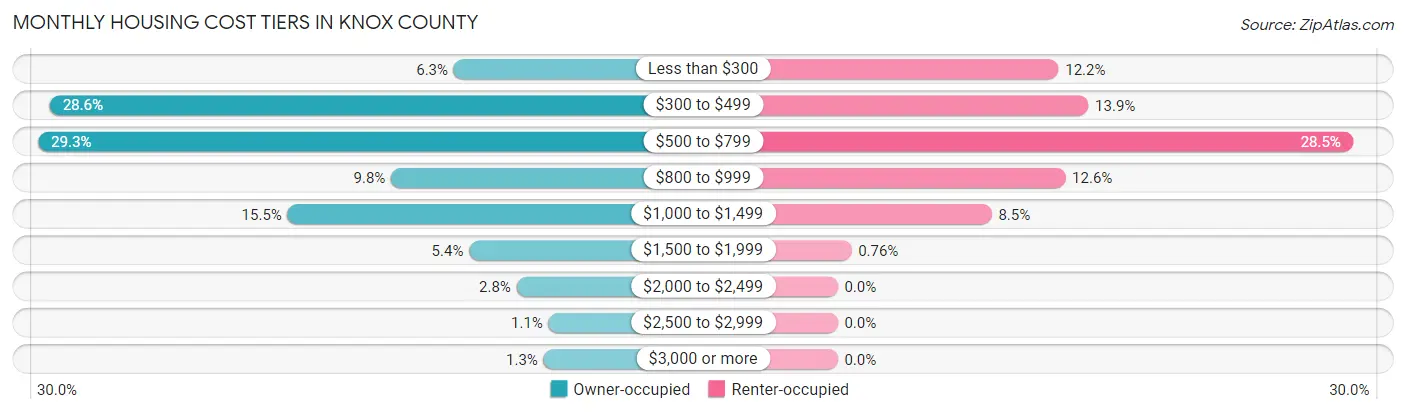
| Monthly Cost | Owner-occupied | Renter-occupied |
| Less than $300 | 156 (6.3%) | 96 (12.2%) |
| $300 to $499 | 710 (28.6%) | 109 (13.9%) |
| $500 to $799 | 726 (29.2%) | 224 (28.5%) |
| $800 to $999 | 242 (9.8%) | 99 (12.6%) |
| $1,000 to $1,499 | 384 (15.5%) | 67 (8.5%) |
| $1,500 to $1,999 | 135 (5.4%) | 6 (0.8%) |
| $2,000 to $2,499 | 70 (2.8%) | 0 (0.0%) |
| $2,500 to $2,999 | 26 (1.1%) | 0 (0.0%) |
| $3,000 or more | 33 (1.3%) | 0 (0.0%) |
| Total | 2,482 (100.0%) | 787 (100.0%) |
Physical Housing Characteristics in Knox County
Housing Structures in Knox County
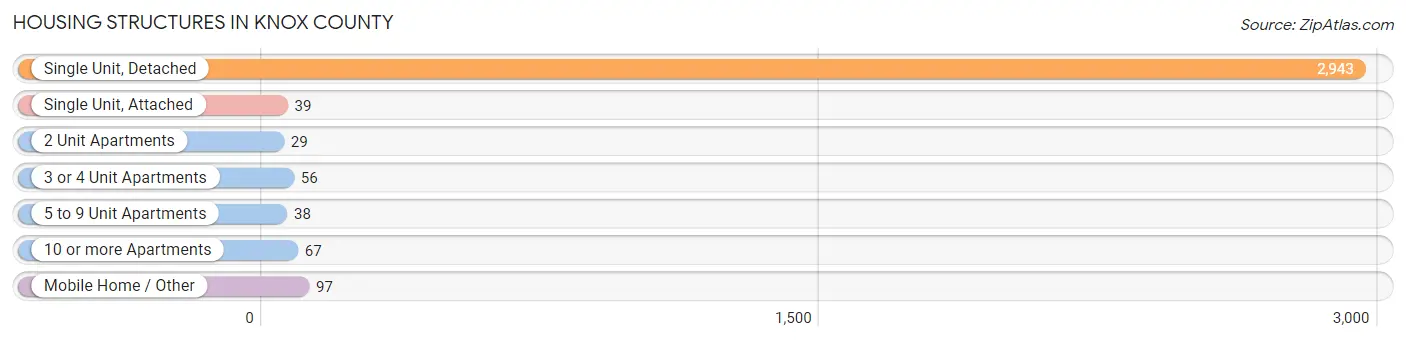
| Structure Type | # Housing Units | % Housing Units |
| Single Unit, Detached | 2,943 | 90.0% |
| Single Unit, Attached | 39 | 1.2% |
| 2 Unit Apartments | 29 | 0.9% |
| 3 or 4 Unit Apartments | 56 | 1.7% |
| 5 to 9 Unit Apartments | 38 | 1.2% |
| 10 or more Apartments | 67 | 2.1% |
| Mobile Home / Other | 97 | 3.0% |
| Total | 3,269 | 100.0% |
Housing Structures by Occupancy in Knox County
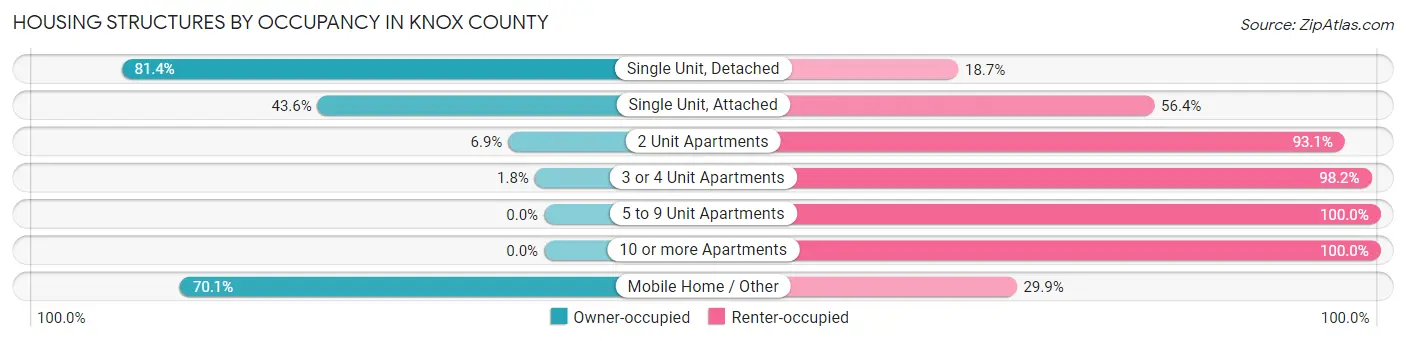
| Structure Type | Owner-occupied | Renter-occupied |
| Single Unit, Detached | 2,394 (81.4%) | 549 (18.6%) |
| Single Unit, Attached | 17 (43.6%) | 22 (56.4%) |
| 2 Unit Apartments | 2 (6.9%) | 27 (93.1%) |
| 3 or 4 Unit Apartments | 1 (1.8%) | 55 (98.2%) |
| 5 to 9 Unit Apartments | 0 (0.0%) | 38 (100.0%) |
| 10 or more Apartments | 0 (0.0%) | 67 (100.0%) |
| Mobile Home / Other | 68 (70.1%) | 29 (29.9%) |
| Total | 2,482 (75.9%) | 787 (24.1%) |
Housing Structures by Number of Rooms in Knox County
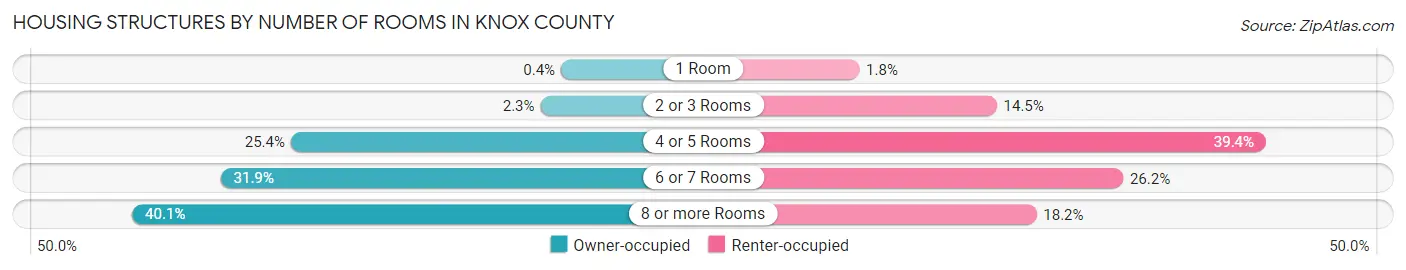
| Number of Rooms | Owner-occupied | Renter-occupied |
| 1 Room | 10 (0.4%) | 14 (1.8%) |
| 2 or 3 Rooms | 57 (2.3%) | 114 (14.5%) |
| 4 or 5 Rooms | 630 (25.4%) | 310 (39.4%) |
| 6 or 7 Rooms | 791 (31.9%) | 206 (26.2%) |
| 8 or more Rooms | 994 (40.1%) | 143 (18.2%) |
| Total | 2,482 (100.0%) | 787 (100.0%) |
Housing Structure by Heating Type in Knox County
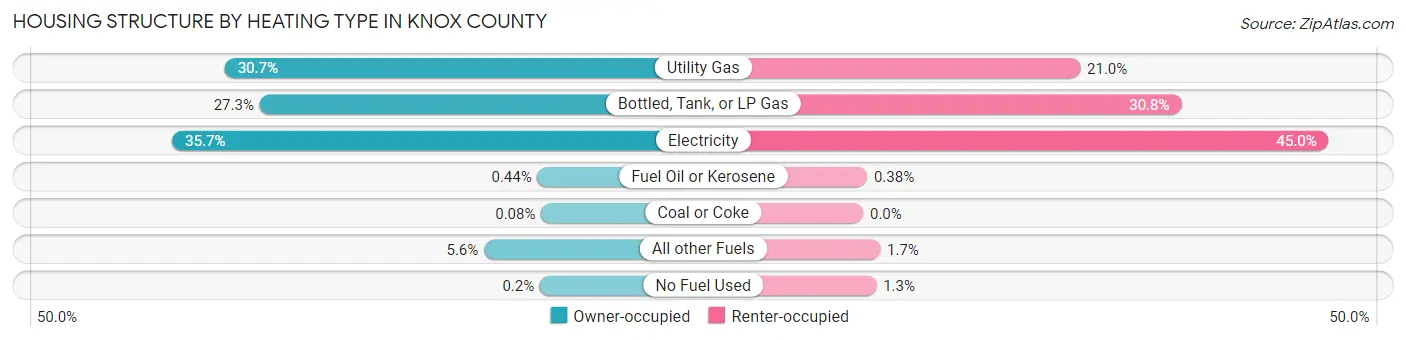
| Heating Type | Owner-occupied | Renter-occupied |
| Utility Gas | 761 (30.7%) | 165 (21.0%) |
| Bottled, Tank, or LP Gas | 677 (27.3%) | 242 (30.7%) |
| Electricity | 887 (35.7%) | 354 (45.0%) |
| Fuel Oil or Kerosene | 11 (0.4%) | 3 (0.4%) |
| Coal or Coke | 2 (0.1%) | 0 (0.0%) |
| All other Fuels | 139 (5.6%) | 13 (1.7%) |
| No Fuel Used | 5 (0.2%) | 10 (1.3%) |
| Total | 2,482 (100.0%) | 787 (100.0%) |
Household Vehicle Usage in Knox County
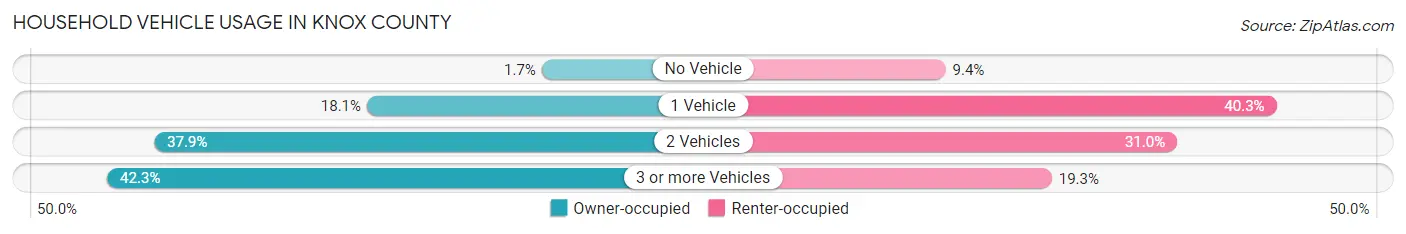
| Vehicles per Household | Owner-occupied | Renter-occupied |
| No Vehicle | 43 (1.7%) | 74 (9.4%) |
| 1 Vehicle | 448 (18.0%) | 317 (40.3%) |
| 2 Vehicles | 941 (37.9%) | 244 (31.0%) |
| 3 or more Vehicles | 1,050 (42.3%) | 152 (19.3%) |
| Total | 2,482 (100.0%) | 787 (100.0%) |
Real Estate & Mortgages in Knox County
Real Estate and Mortgage Overview in Knox County
| Characteristic | Without Mortgage | With Mortgage |
| Housing Units | 1,621 | 861 |
| Median Property Value | $103,100 | $130,800 |
| Median Household Income | $59,094 | $92 |
| Monthly Housing Costs | $491 | $29 |
| Real Estate Taxes | $1,326 | $9 |
Property Value by Mortgage Status in Knox County
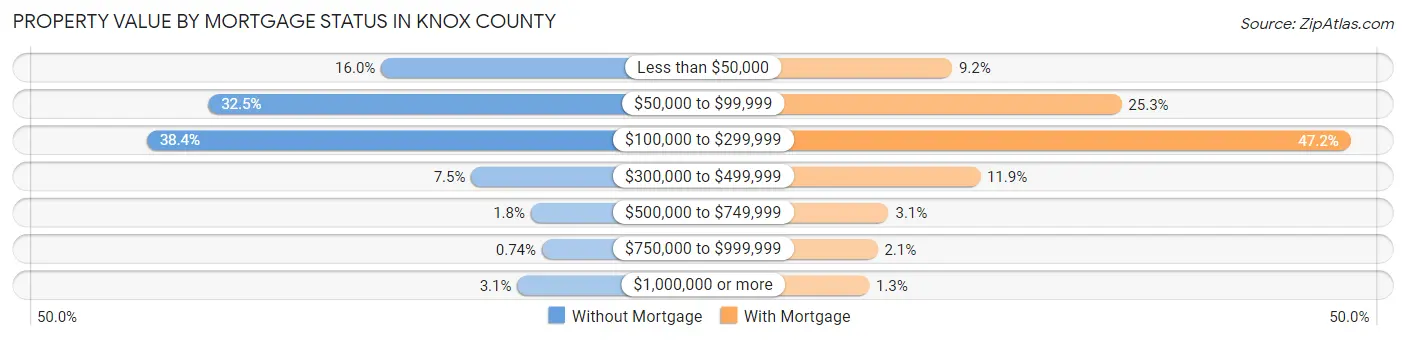
| Property Value | Without Mortgage | With Mortgage |
| Less than $50,000 | 260 (16.0%) | 79 (9.2%) |
| $50,000 to $99,999 | 527 (32.5%) | 218 (25.3%) |
| $100,000 to $299,999 | 622 (38.4%) | 406 (47.1%) |
| $300,000 to $499,999 | 121 (7.5%) | 102 (11.8%) |
| $500,000 to $749,999 | 29 (1.8%) | 27 (3.1%) |
| $750,000 to $999,999 | 12 (0.7%) | 18 (2.1%) |
| $1,000,000 or more | 50 (3.1%) | 11 (1.3%) |
| Total | 1,621 (100.0%) | 861 (100.0%) |
Household Income by Mortgage Status in Knox County
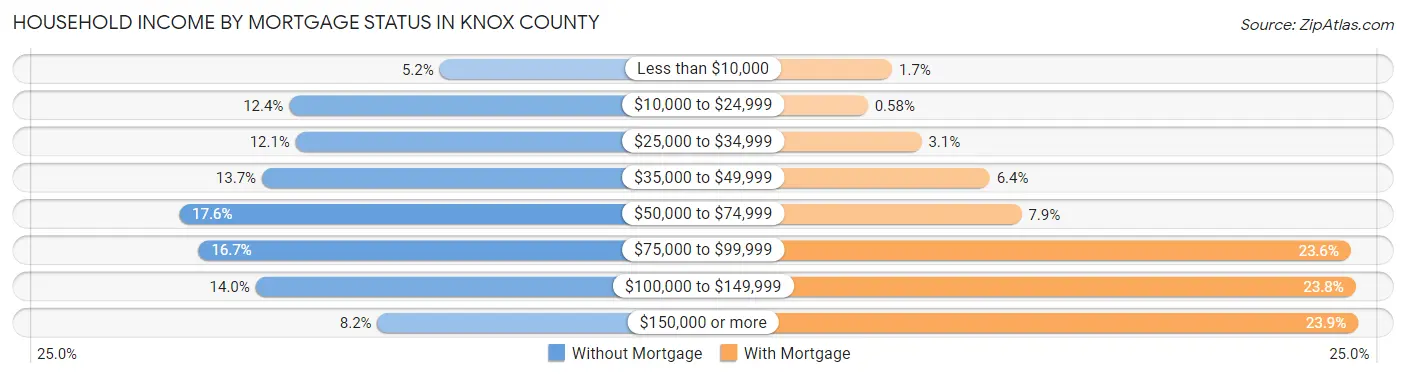
| Household Income | Without Mortgage | With Mortgage |
| Less than $10,000 | 85 (5.2%) | 15 (1.7%) |
| $10,000 to $24,999 | 201 (12.4%) | 5 (0.6%) |
| $25,000 to $34,999 | 196 (12.1%) | 27 (3.1%) |
| $35,000 to $49,999 | 222 (13.7%) | 55 (6.4%) |
| $50,000 to $74,999 | 286 (17.6%) | 68 (7.9%) |
| $75,000 to $99,999 | 271 (16.7%) | 203 (23.6%) |
| $100,000 to $149,999 | 227 (14.0%) | 205 (23.8%) |
| $150,000 or more | 133 (8.2%) | 206 (23.9%) |
| Total | 1,621 (100.0%) | 861 (100.0%) |
Property Value to Household Income Ratio in Knox County
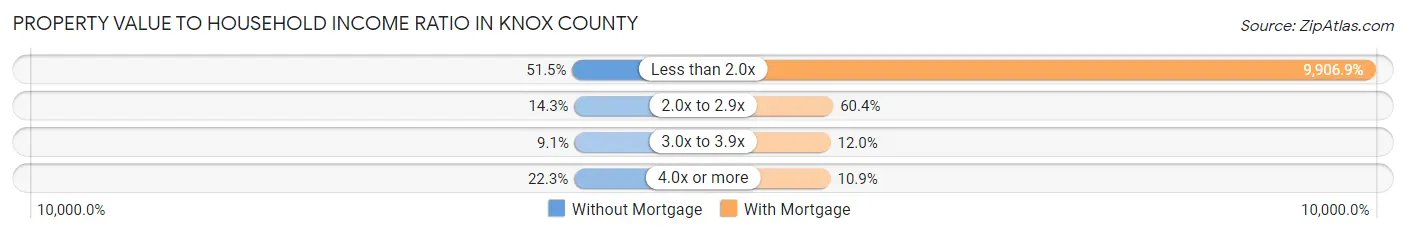
| Value-to-Income Ratio | Without Mortgage | With Mortgage |
| Less than 2.0x | 834 (51.4%) | 85,298 (9,906.9%) |
| 2.0x to 2.9x | 232 (14.3%) | 520 (60.4%) |
| 3.0x to 3.9x | 147 (9.1%) | 103 (12.0%) |
| 4.0x or more | 362 (22.3%) | 94 (10.9%) |
| Total | 1,621 (100.0%) | 861 (100.0%) |
Real Estate Taxes by Mortgage Status in Knox County
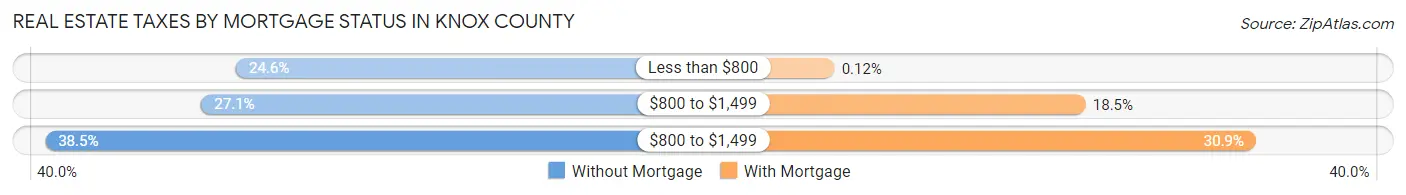
| Property Taxes | Without Mortgage | With Mortgage |
| Less than $800 | 398 (24.5%) | 1 (0.1%) |
| $800 to $1,499 | 439 (27.1%) | 159 (18.5%) |
| $800 to $1,499 | 624 (38.5%) | 266 (30.9%) |
| Total | 1,621 (100.0%) | 861 (100.0%) |
Health & Disability in Knox County
Health Insurance Coverage by Age in Knox County
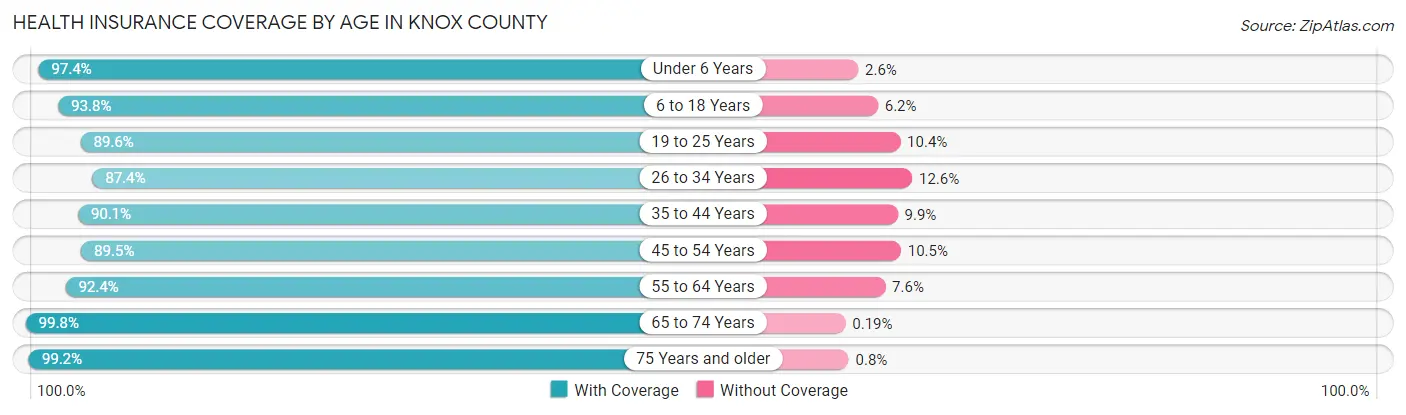
| Age Bracket | With Coverage | Without Coverage |
| Under 6 Years | 603 (97.4%) | 16 (2.6%) |
| 6 to 18 Years | 1,428 (93.8%) | 95 (6.2%) |
| 19 to 25 Years | 576 (89.6%) | 67 (10.4%) |
| 26 to 34 Years | 581 (87.4%) | 84 (12.6%) |
| 35 to 44 Years | 734 (90.1%) | 81 (9.9%) |
| 45 to 54 Years | 731 (89.5%) | 86 (10.5%) |
| 55 to 64 Years | 1,116 (92.4%) | 92 (7.6%) |
| 65 to 74 Years | 1,074 (99.8%) | 2 (0.2%) |
| 75 Years and older | 873 (99.2%) | 7 (0.8%) |
| Total | 7,716 (93.6%) | 530 (6.4%) |
Health Insurance Coverage by Citizenship Status in Knox County
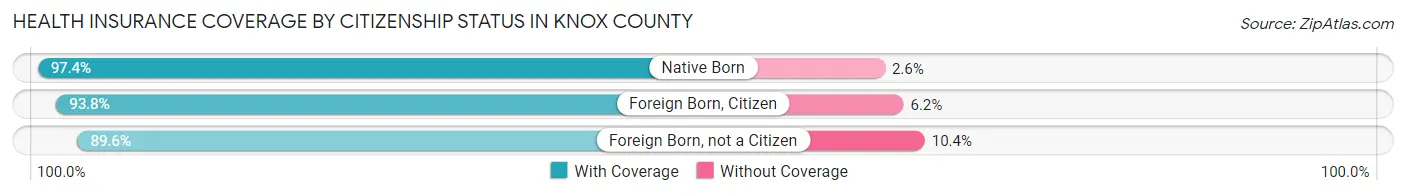
| Citizenship Status | With Coverage | Without Coverage |
| Native Born | 603 (97.4%) | 16 (2.6%) |
| Foreign Born, Citizen | 1,428 (93.8%) | 95 (6.2%) |
| Foreign Born, not a Citizen | 576 (89.6%) | 67 (10.4%) |
Health Insurance Coverage by Household Income in Knox County
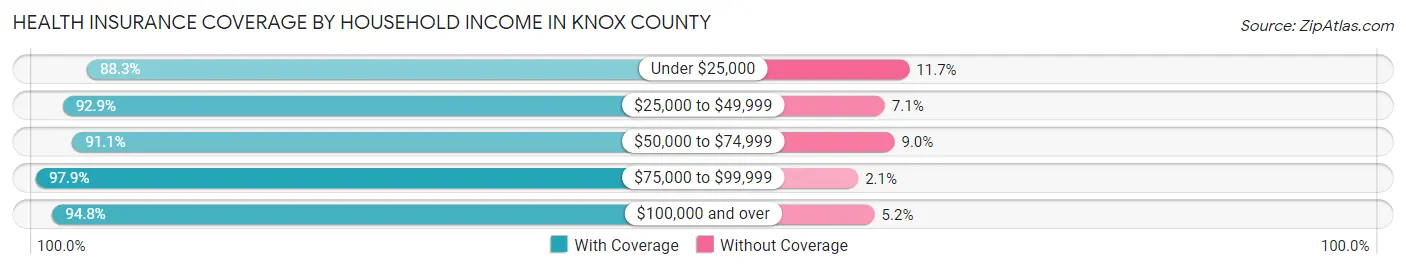
| Household Income | With Coverage | Without Coverage |
| Under $25,000 | 820 (88.3%) | 109 (11.7%) |
| $25,000 to $49,999 | 1,560 (92.9%) | 120 (7.1%) |
| $50,000 to $74,999 | 1,404 (91.0%) | 138 (8.9%) |
| $75,000 to $99,999 | 1,644 (97.9%) | 36 (2.1%) |
| $100,000 and over | 2,286 (94.8%) | 126 (5.2%) |
Public vs Private Health Insurance Coverage by Age in Knox County
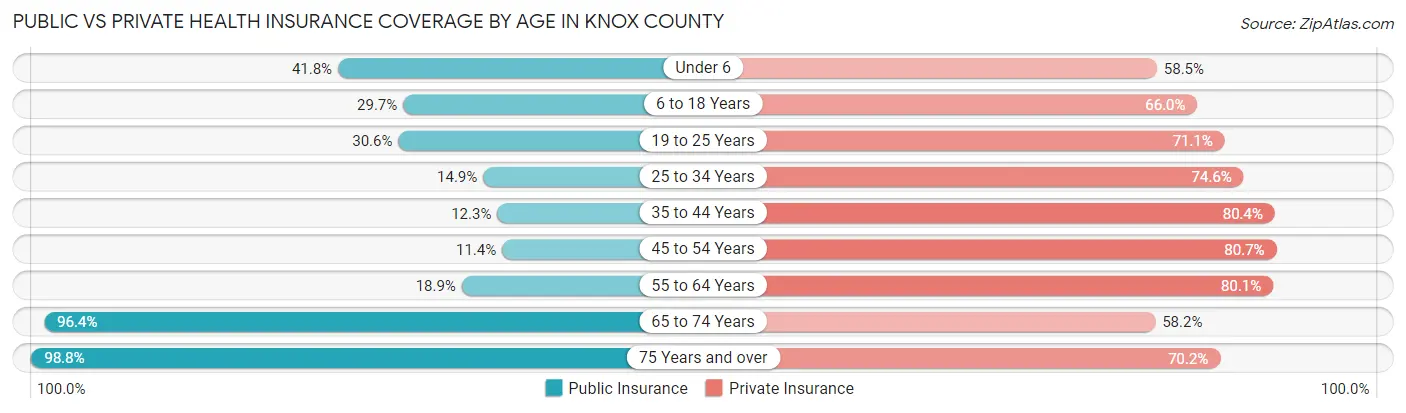
| Age Bracket | Public Insurance | Private Insurance |
| Under 6 | 259 (41.8%) | 362 (58.5%) |
| 6 to 18 Years | 453 (29.7%) | 1,005 (66.0%) |
| 19 to 25 Years | 197 (30.6%) | 457 (71.1%) |
| 25 to 34 Years | 99 (14.9%) | 496 (74.6%) |
| 35 to 44 Years | 100 (12.3%) | 655 (80.4%) |
| 45 to 54 Years | 93 (11.4%) | 659 (80.7%) |
| 55 to 64 Years | 228 (18.9%) | 967 (80.0%) |
| 65 to 74 Years | 1,037 (96.4%) | 626 (58.2%) |
| 75 Years and over | 869 (98.8%) | 618 (70.2%) |
| Total | 3,335 (40.4%) | 5,845 (70.9%) |
Disability Status by Sex by Age in Knox County
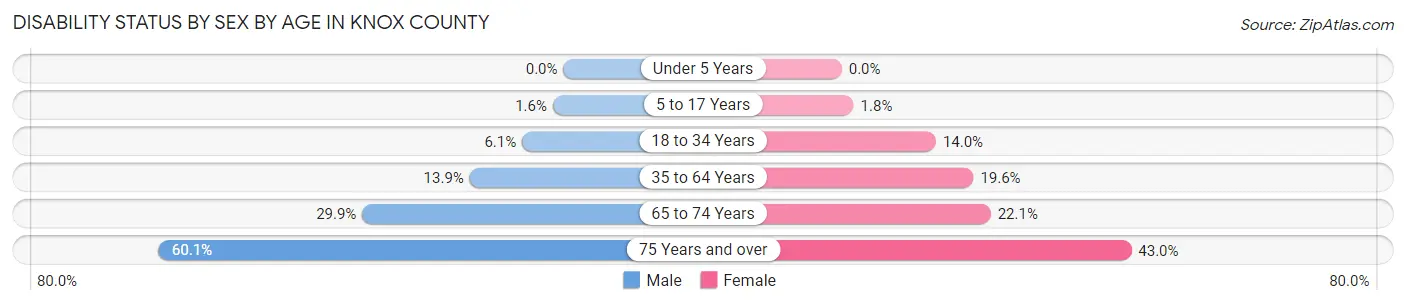
| Age Bracket | Male | Female |
| Under 5 Years | 0 (0.0%) | 0 (0.0%) |
| 5 to 17 Years | 12 (1.6%) | 13 (1.8%) |
| 18 to 34 Years | 46 (6.1%) | 93 (14.0%) |
| 35 to 64 Years | 203 (13.9%) | 270 (19.6%) |
| 65 to 74 Years | 158 (29.9%) | 121 (22.1%) |
| 75 Years and over | 224 (60.1%) | 218 (43.0%) |
Disability Class by Sex by Age in Knox County
Disability Class: Hearing Difficulty
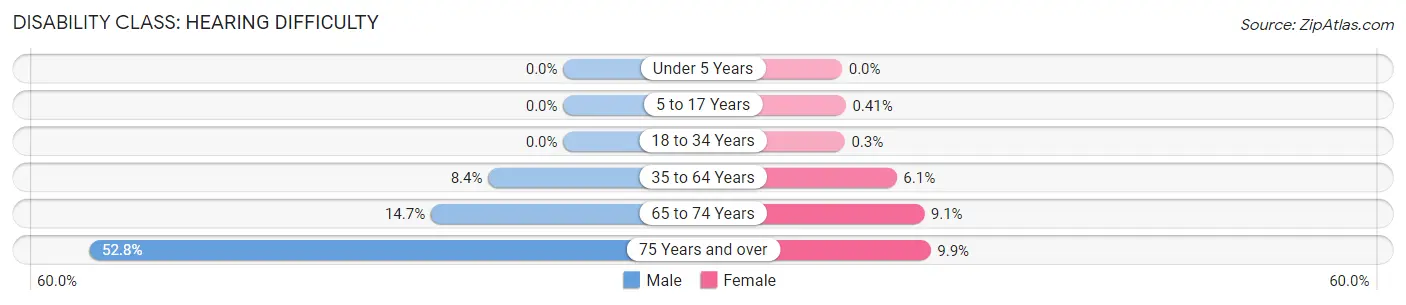
| Age Bracket | Male | Female |
| Under 5 Years | 0 (0.0%) | 0 (0.0%) |
| 5 to 17 Years | 0 (0.0%) | 3 (0.4%) |
| 18 to 34 Years | 0 (0.0%) | 2 (0.3%) |
| 35 to 64 Years | 122 (8.4%) | 84 (6.1%) |
| 65 to 74 Years | 78 (14.7%) | 50 (9.1%) |
| 75 Years and over | 197 (52.8%) | 50 (9.9%) |
Disability Class: Vision Difficulty
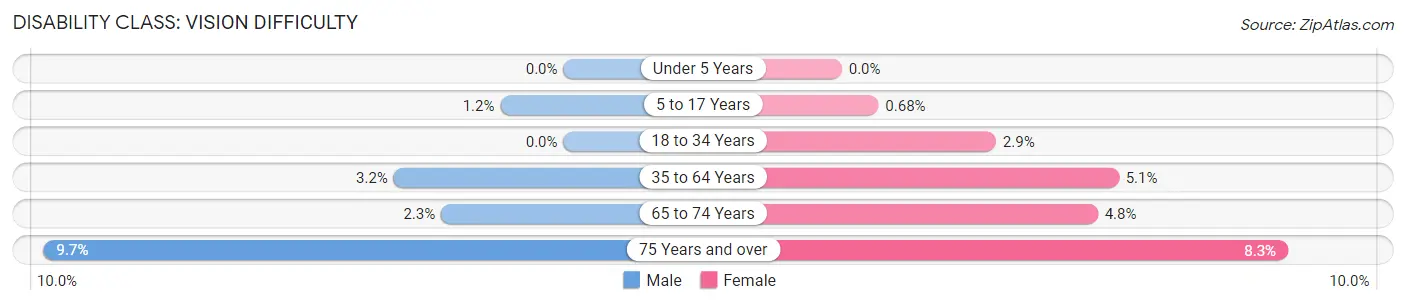
| Age Bracket | Male | Female |
| Under 5 Years | 0 (0.0%) | 0 (0.0%) |
| 5 to 17 Years | 9 (1.2%) | 5 (0.7%) |
| 18 to 34 Years | 0 (0.0%) | 19 (2.9%) |
| 35 to 64 Years | 46 (3.2%) | 71 (5.1%) |
| 65 to 74 Years | 12 (2.3%) | 26 (4.8%) |
| 75 Years and over | 36 (9.7%) | 42 (8.3%) |
Disability Class: Cognitive Difficulty
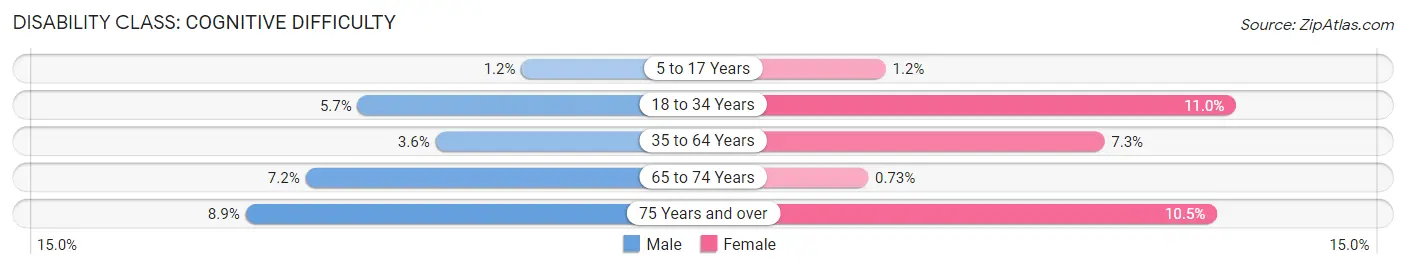
| Age Bracket | Male | Female |
| 5 to 17 Years | 9 (1.2%) | 9 (1.2%) |
| 18 to 34 Years | 43 (5.7%) | 73 (11.0%) |
| 35 to 64 Years | 52 (3.6%) | 101 (7.3%) |
| 65 to 74 Years | 38 (7.2%) | 4 (0.7%) |
| 75 Years and over | 33 (8.8%) | 53 (10.4%) |
Disability Class: Ambulatory Difficulty
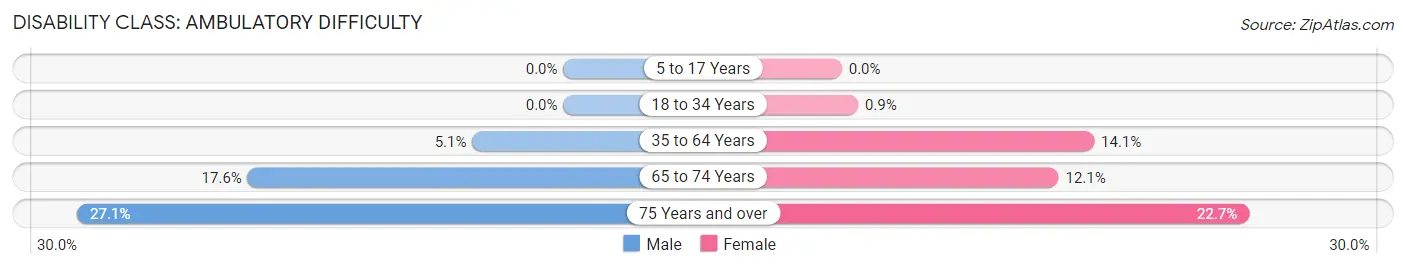
| Age Bracket | Male | Female |
| 5 to 17 Years | 0 (0.0%) | 0 (0.0%) |
| 18 to 34 Years | 0 (0.0%) | 6 (0.9%) |
| 35 to 64 Years | 74 (5.1%) | 194 (14.1%) |
| 65 to 74 Years | 93 (17.6%) | 66 (12.1%) |
| 75 Years and over | 101 (27.1%) | 115 (22.7%) |
Disability Class: Self-Care Difficulty
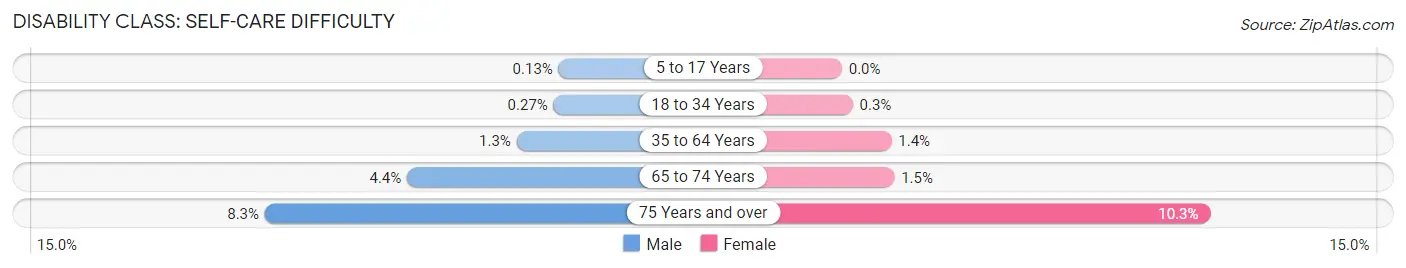
| Age Bracket | Male | Female |
| 5 to 17 Years | 1 (0.1%) | 0 (0.0%) |
| 18 to 34 Years | 2 (0.3%) | 2 (0.3%) |
| 35 to 64 Years | 19 (1.3%) | 19 (1.4%) |
| 65 to 74 Years | 23 (4.3%) | 8 (1.5%) |
| 75 Years and over | 31 (8.3%) | 52 (10.3%) |
Technology Access in Knox County
Computing Device Access in Knox County
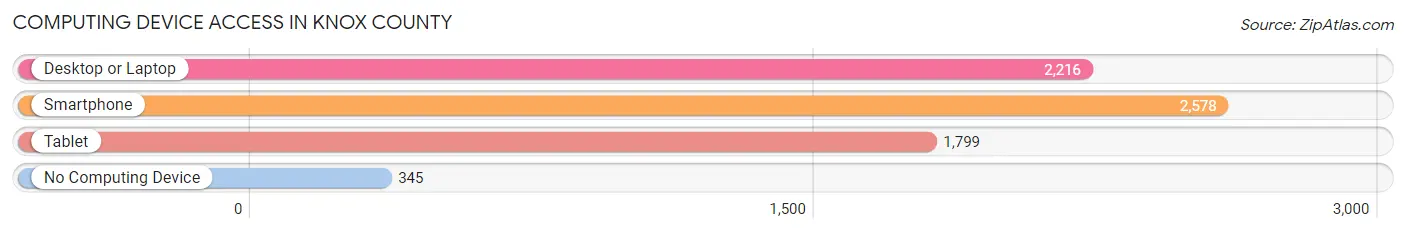
| Device Type | # Households | % Households |
| Desktop or Laptop | 2,216 | 67.8% |
| Smartphone | 2,578 | 78.9% |
| Tablet | 1,799 | 55.0% |
| No Computing Device | 345 | 10.5% |
| Total | 3,269 | 100.0% |
Internet Access in Knox County
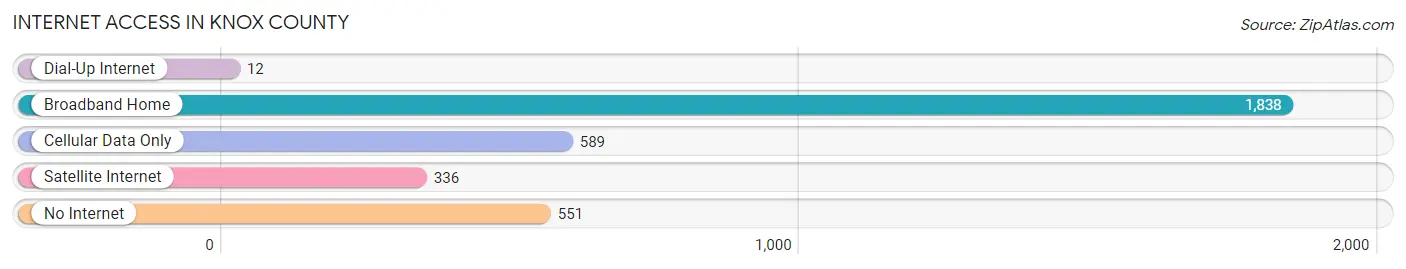
| Internet Type | # Households | % Households |
| Dial-Up Internet | 12 | 0.4% |
| Broadband Home | 1,838 | 56.2% |
| Cellular Data Only | 589 | 18.0% |
| Satellite Internet | 336 | 10.3% |
| No Internet | 551 | 16.9% |
| Total | 3,269 | 100.0% |
Knox County Summary
Knox County is located in the northeastern corner of Nebraska, and is bordered by Cedar, Dixon, Dakota, and Thurston counties. It is part of the Sioux City, IA-NE-SD Metropolitan Statistical Area. As of the 2010 census, the population of Knox County was 7,313, making it the second least populous county in Nebraska.
History
Knox County was established in 1871 and named after Major General Henry Knox, the first United States Secretary of War. The county was originally part of Dakota County, which was established in 1855. The county seat is Center, which was founded in 1871.
Geography
Knox County covers an area of 576 square miles, making it the fourth smallest county in Nebraska. The county is located in the northeastern corner of the state, and is bordered by Cedar, Dixon, Dakota, and Thurston counties. The terrain is mostly flat, with some rolling hills in the western part of the county. The county is drained by the Niobrara River, which flows through the northern part of the county.
The county is home to several state parks and wildlife areas, including Niobrara State Park, Ponca State Park, and the Niobrara National Wildlife Refuge.
Economy
The economy of Knox County is largely based on agriculture. The county is home to several large farms, and the main crops grown in the county are corn, soybeans, and wheat. The county also has a large livestock industry, with cattle, hogs, and sheep being the main animals raised.
Knox County also has a small manufacturing sector, with several small companies producing a variety of products, including furniture, clothing, and food products.
Demographics
As of the 2010 census, the population of Knox County was 7,313, making it the second least populous county in Nebraska. The population is spread out, with the largest city being Center, which has a population of 1,845. The racial makeup of the county is 95.3% White, 0.7% African American, 0.4% Native American, 0.2% Asian, 0.1% Pacific Islander, 1.7% from other races, and 1.6% from two or more races. Hispanic or Latino of any race were 4.2% of the population.
The median income for a household in the county was $41,945, and the median income for a family was $50,938. The per capita income for the county was $20,845. About 8.7% of families and 11.7% of the population were below the poverty line, including 14.2% of those under age 18 and 8.2% of those age 65 or over.
Common Questions
What is Per Capita Income in Knox County?
Per Capita income in Knox County is $31,269.
What is the Median Family Income in Knox County?
Median Family Income in Knox County is $77,402.
What is the Median Household income in Knox County?
Median Household Income in Knox County is $61,250.
What is Income or Wage Gap in Knox County?
Income or Wage Gap in Knox County is 33.6%.
Women in Knox County earn 66.4 cents for every dollar earned by a man.
What is Family Income Deficit in Knox County?
Family Income Deficit in Knox County is $12,156.
Families that are below poverty line in Knox County earn $12,156 less on average than the poverty threshold level.
What is Inequality or Gini Index in Knox County?
Inequality or Gini Index in Knox County is 0.42.
What is the Total Population of Knox County?
Total Population of Knox County is 8,415.
What is the Total Male Population of Knox County?
Total Male Population of Knox County is 4,225.
What is the Total Female Population of Knox County?
Total Female Population of Knox County is 4,190.
What is the Ratio of Males per 100 Females in Knox County?
There are 100.84 Males per 100 Females in Knox County.
What is the Ratio of Females per 100 Males in Knox County?
There are 99.17 Females per 100 Males in Knox County.
What is the Median Population Age in Knox County?
Median Population Age in Knox County is 43.9 Years.
What is the Average Family Size in Knox County
Average Family Size in Knox County is 3.2 People.
What is the Average Household Size in Knox County
Average Household Size in Knox County is 2.5 People.
How Large is the Labor Force in Knox County?
There are 4,207 People in the Labor Forcein in Knox County.
What is the Percentage of People in the Labor Force in Knox County?
63.3% of People are in the Labor Force in Knox County.
What is the Unemployment Rate in Knox County?
Unemployment Rate in Knox County is 4.1%.