Jefferson County, NE Map & Demographics
Jefferson County Map
Jefferson County Overview
$30,363
PER CAPITA INCOME
$70,764
AVG FAMILY INCOME
$54,494
AVG HOUSEHOLD INCOME
29.9%
WAGE / INCOME GAP [ % ]
70.1¢/ $1
WAGE / INCOME GAP [ $ ]
0.42
INEQUALITY / GINI INDEX
7,185
TOTAL POPULATION
3,475
MALE POPULATION
3,710
FEMALE POPULATION
93.67
MALES / 100 FEMALES
106.76
FEMALES / 100 MALES
45.8
MEDIAN AGE
3.0
AVG FAMILY SIZE
2.3
AVG HOUSEHOLD SIZE
3,517
LABOR FORCE [ PEOPLE ]
60.8%
PERCENT IN LABOR FORCE
1.1%
UNEMPLOYMENT RATE
Jefferson County Area Codes
Income in Jefferson County
Income Overview in Jefferson County
Per Capita Income in Jefferson County is $30,363, while median incomes of families and households are $70,764 and $54,494 respectively.
| Characteristic | Number | Measure |
| Per Capita Income | 7,185 | $30,363 |
| Median Family Income | 1,798 | $70,764 |
| Mean Family Income | 1,798 | $85,973 |
| Median Household Income | 3,122 | $54,494 |
| Mean Household Income | 3,122 | $69,943 |
| Income Deficit | 1,798 | $0 |
| Wage / Income Gap (%) | 7,185 | 29.93% |
| Wage / Income Gap ($) | 7,185 | 70.07¢ per $1 |
| Gini / Inequality Index | 7,185 | 0.42 |
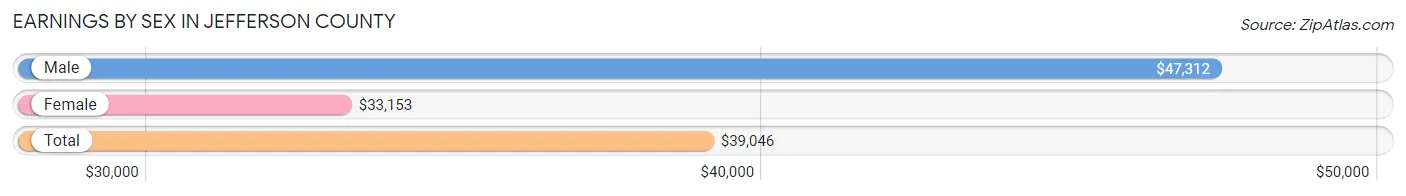
Earnings by Sex in Jefferson County
Average Earnings in Jefferson County are $39,046, $47,312 for men and $33,153 for women, a difference of 29.9%.
| Sex | Number | Average Earnings |
| Male | 1,936 (51.9%) | $47,312 |
| Female | 1,791 (48.0%) | $33,153 |
| Total | 3,727 (100.0%) | $39,046 |
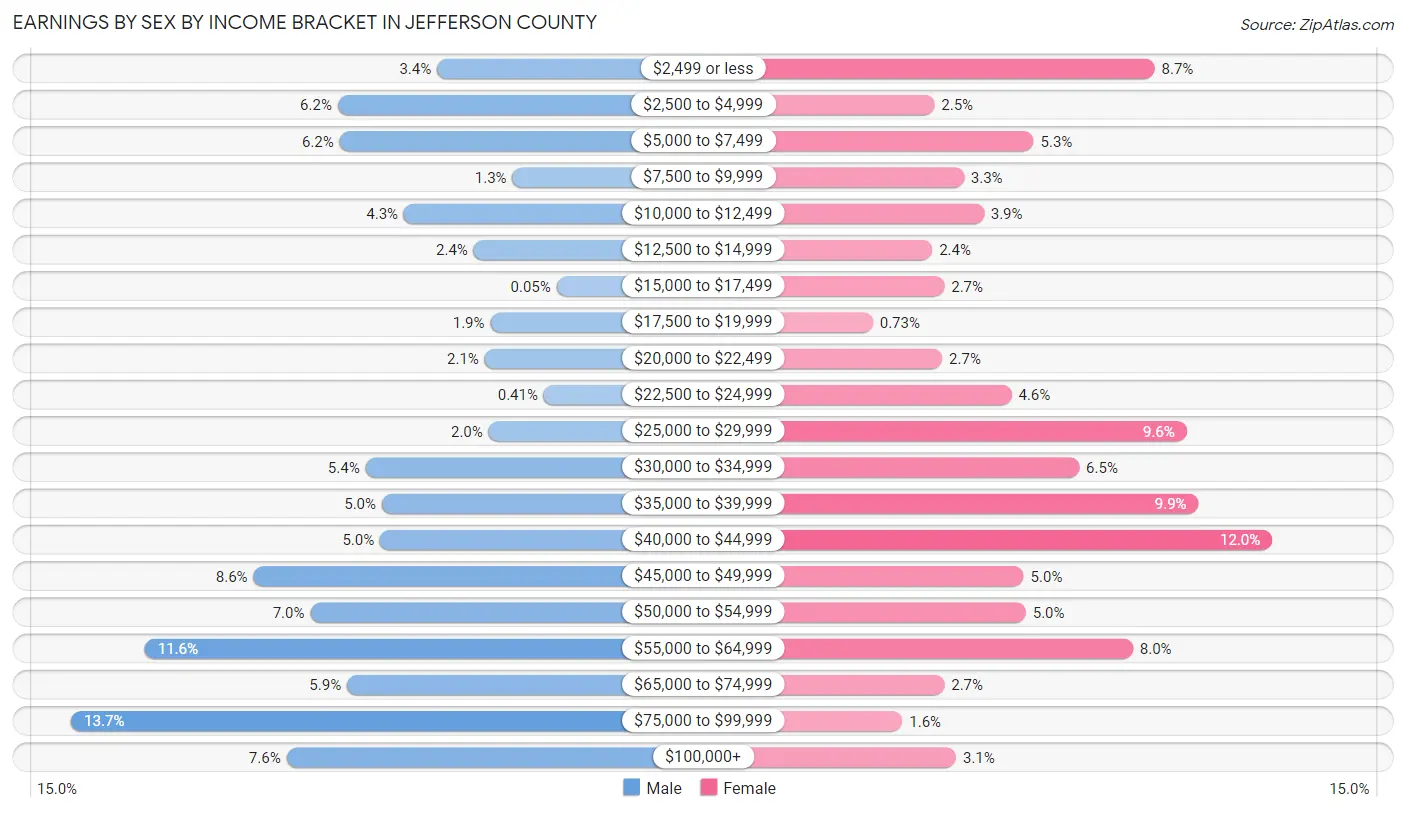
Earnings by Sex by Income Bracket in Jefferson County
The most common earnings brackets in Jefferson County are $75,000 to $99,999 for men (265 | 13.7%) and $40,000 to $44,999 for women (214 | 11.9%).
| Income | Male | Female |
| $2,499 or less | 66 (3.4%) | 155 (8.6%) |
| $2,500 to $4,999 | 120 (6.2%) | 44 (2.5%) |
| $5,000 to $7,499 | 119 (6.1%) | 94 (5.2%) |
| $7,500 to $9,999 | 25 (1.3%) | 59 (3.3%) |
| $10,000 to $12,499 | 84 (4.3%) | 69 (3.8%) |
| $12,500 to $14,999 | 46 (2.4%) | 43 (2.4%) |
| $15,000 to $17,499 | 1 (0.1%) | 49 (2.7%) |
| $17,500 to $19,999 | 37 (1.9%) | 13 (0.7%) |
| $20,000 to $22,499 | 40 (2.1%) | 48 (2.7%) |
| $22,500 to $24,999 | 8 (0.4%) | 83 (4.6%) |
| $25,000 to $29,999 | 38 (2.0%) | 171 (9.6%) |
| $30,000 to $34,999 | 105 (5.4%) | 117 (6.5%) |
| $35,000 to $39,999 | 96 (5.0%) | 177 (9.9%) |
| $40,000 to $44,999 | 97 (5.0%) | 214 (11.9%) |
| $45,000 to $49,999 | 166 (8.6%) | 89 (5.0%) |
| $50,000 to $54,999 | 135 (7.0%) | 90 (5.0%) |
| $55,000 to $64,999 | 225 (11.6%) | 144 (8.0%) |
| $65,000 to $74,999 | 115 (5.9%) | 49 (2.7%) |
| $75,000 to $99,999 | 265 (13.7%) | 28 (1.6%) |
| $100,000+ | 148 (7.6%) | 55 (3.1%) |
| Total | 1,936 (100.0%) | 1,791 (100.0%) |
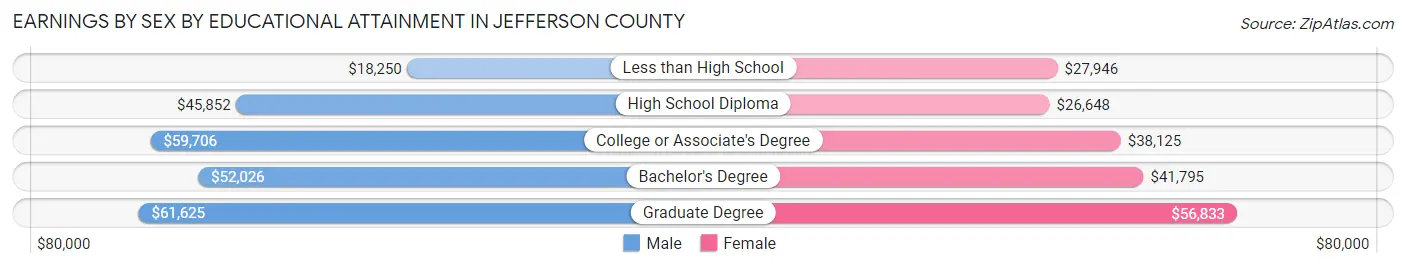
Earnings by Sex by Educational Attainment in Jefferson County
Average earnings in Jefferson County are $50,625 for men and $35,345 for women, a difference of 30.2%. Men with an educational attainment of graduate degree enjoy the highest average annual earnings of $61,625, while those with less than high school education earn the least with $18,250. Women with an educational attainment of graduate degree earn the most with the average annual earnings of $56,833, while those with high school diploma education have the smallest earnings of $26,648.
| Educational Attainment | Male Income | Female Income |
| Less than High School | $18,250 | $27,946 |
| High School Diploma | $45,852 | $26,648 |
| College or Associate's Degree | $59,706 | $38,125 |
| Bachelor's Degree | $52,026 | $41,795 |
| Graduate Degree | $61,625 | $56,833 |
| Total | $50,625 | $35,345 |
Family Income in Jefferson County
Family Income Brackets in Jefferson County
According to the Jefferson County family income data, there are 405 families falling into the $100,000 to $149,999 income range, which is the most common income bracket and makes up 22.5% of all families. Conversely, the less than $10,000 income bracket is the least frequent group with only 41 families (2.3%) belonging to this category.
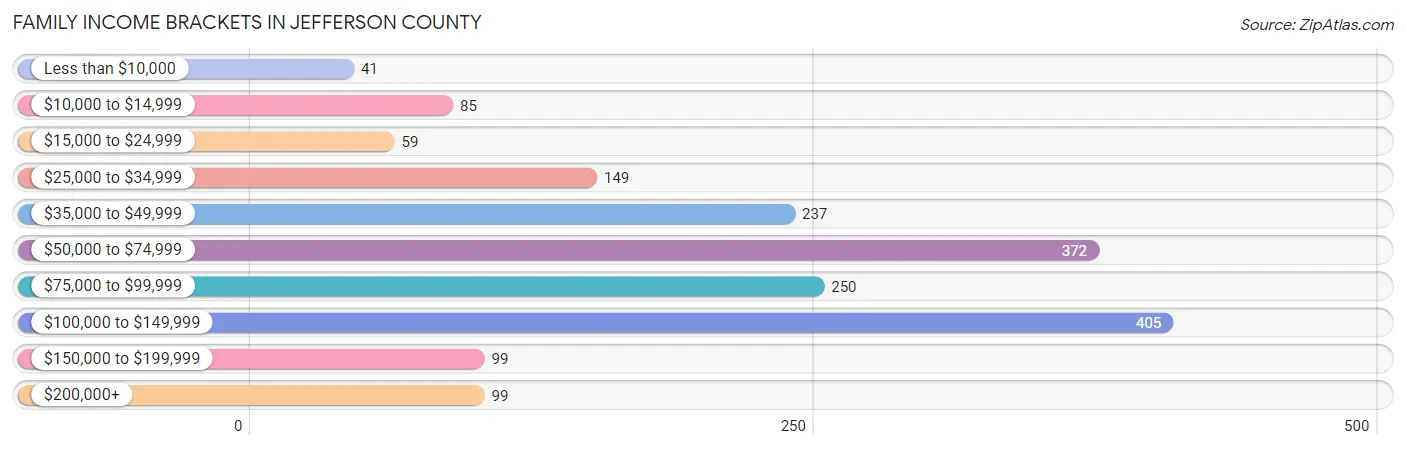
| Income Bracket | # Families | % Families |
| Less than $10,000 | 41 | 2.3% |
| $10,000 to $14,999 | 85 | 4.7% |
| $15,000 to $24,999 | 59 | 3.3% |
| $25,000 to $34,999 | 149 | 8.3% |
| $35,000 to $49,999 | 237 | 13.2% |
| $50,000 to $74,999 | 372 | 20.7% |
| $75,000 to $99,999 | 250 | 13.9% |
| $100,000 to $149,999 | 405 | 22.5% |
| $150,000 to $199,999 | 99 | 5.5% |
| $200,000+ | 99 | 5.5% |
Family Income by Famaliy Size in Jefferson County
6-person families (51 | 2.8%) account for the highest median family income in Jefferson County with $121,458 per family, while 2-person families (1,120 | 62.3%) have the highest median income of $30,822 per family member.
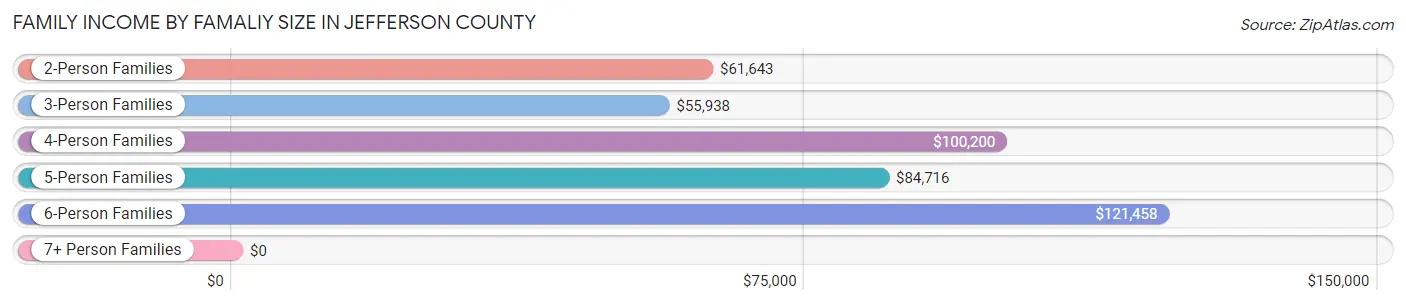
| Income Bracket | # Families | Median Income |
| 2-Person Families | 1,120 (62.3%) | $61,643 |
| 3-Person Families | 257 (14.3%) | $55,938 |
| 4-Person Families | 202 (11.2%) | $100,200 |
| 5-Person Families | 159 (8.8%) | $84,716 |
| 6-Person Families | 51 (2.8%) | $121,458 |
| 7+ Person Families | 9 (0.5%) | $0 |
| Total | 1,798 (100.0%) | $70,764 |
Family Income by Number of Earners in Jefferson County
The median family income in Jefferson County is $70,764, with families comprising 3+ earners (99) having the highest median family income of $148,482, while families with no earners (268) have the lowest median family income of $32,417, accounting for 5.5% and 14.9% of families, respectively.
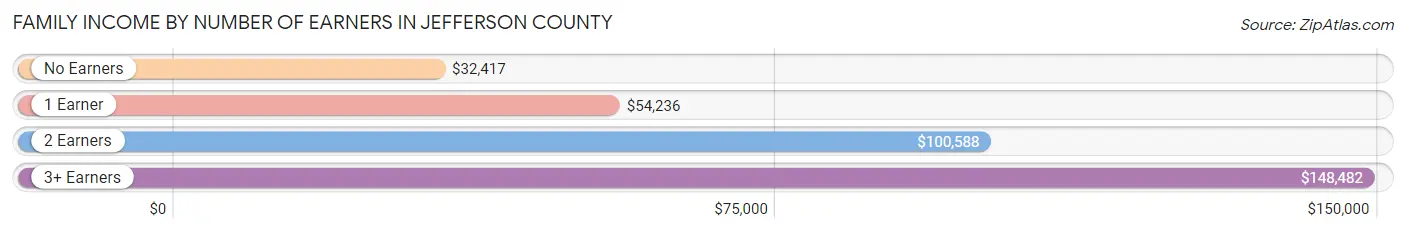
| Number of Earners | # Families | Median Income |
| No Earners | 268 (14.9%) | $32,417 |
| 1 Earner | 647 (36.0%) | $54,236 |
| 2 Earners | 784 (43.6%) | $100,588 |
| 3+ Earners | 99 (5.5%) | $148,482 |
| Total | 1,798 (100.0%) | $70,764 |
Household Income in Jefferson County
Household Income Brackets in Jefferson County
With 574 households falling in the category, the $50,000 to $74,999 income range is the most frequent in Jefferson County, accounting for 18.4% of all households. In contrast, only 106 households (3.4%) fall into the $200,000+ income bracket, making it the least populous group.
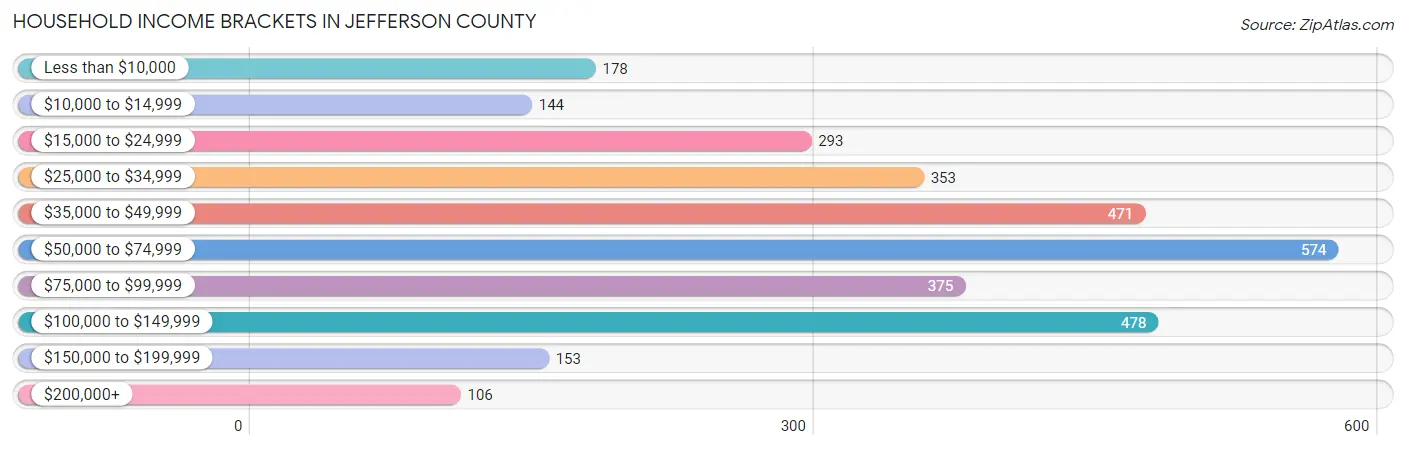
| Income Bracket | # Households | % Households |
| Less than $10,000 | 178 | 5.7% |
| $10,000 to $14,999 | 144 | 4.6% |
| $15,000 to $24,999 | 293 | 9.4% |
| $25,000 to $34,999 | 353 | 11.3% |
| $35,000 to $49,999 | 471 | 15.1% |
| $50,000 to $74,999 | 574 | 18.4% |
| $75,000 to $99,999 | 375 | 12.0% |
| $100,000 to $149,999 | 478 | 15.3% |
| $150,000 to $199,999 | 153 | 4.9% |
| $200,000+ | 106 | 3.4% |
Household Income by Householder Age in Jefferson County
The median household income in Jefferson County is $54,494, with the highest median household income of $74,226 found in the 45 to 64 years age bracket for the primary householder. A total of 1,009 households (32.3%) fall into this category. Meanwhile, the 15 to 24 years age bracket for the primary householder has the lowest median household income of $37,981, with 121 households (3.9%) in this group.
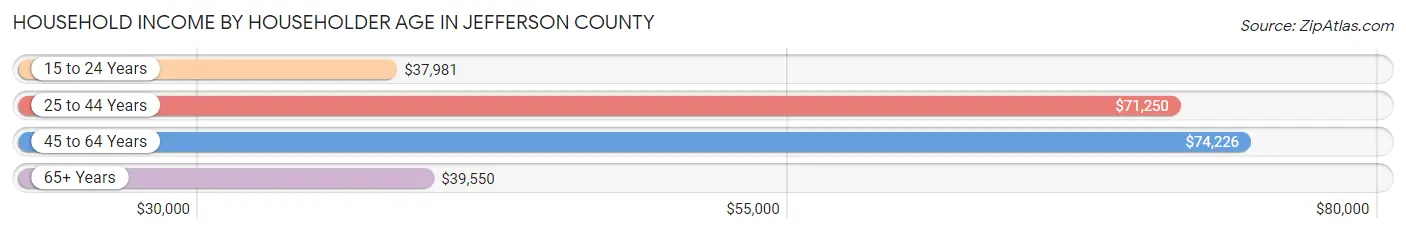
| Income Bracket | # Households | Median Income |
| 15 to 24 Years | 121 (3.9%) | $37,981 |
| 25 to 44 Years | 800 (25.6%) | $71,250 |
| 45 to 64 Years | 1,009 (32.3%) | $74,226 |
| 65+ Years | 1,192 (38.2%) | $39,550 |
| Total | 3,122 (100.0%) | $54,494 |
Poverty in Jefferson County
Income Below Poverty by Sex and Age in Jefferson County
With 9.0% poverty level for males and 13.1% for females among the residents of Jefferson County, 35 to 44 year old males and 35 to 44 year old females are the most vulnerable to poverty, with 130 males (32.8%) and 110 females (30.7%) in their respective age groups living below the poverty level.
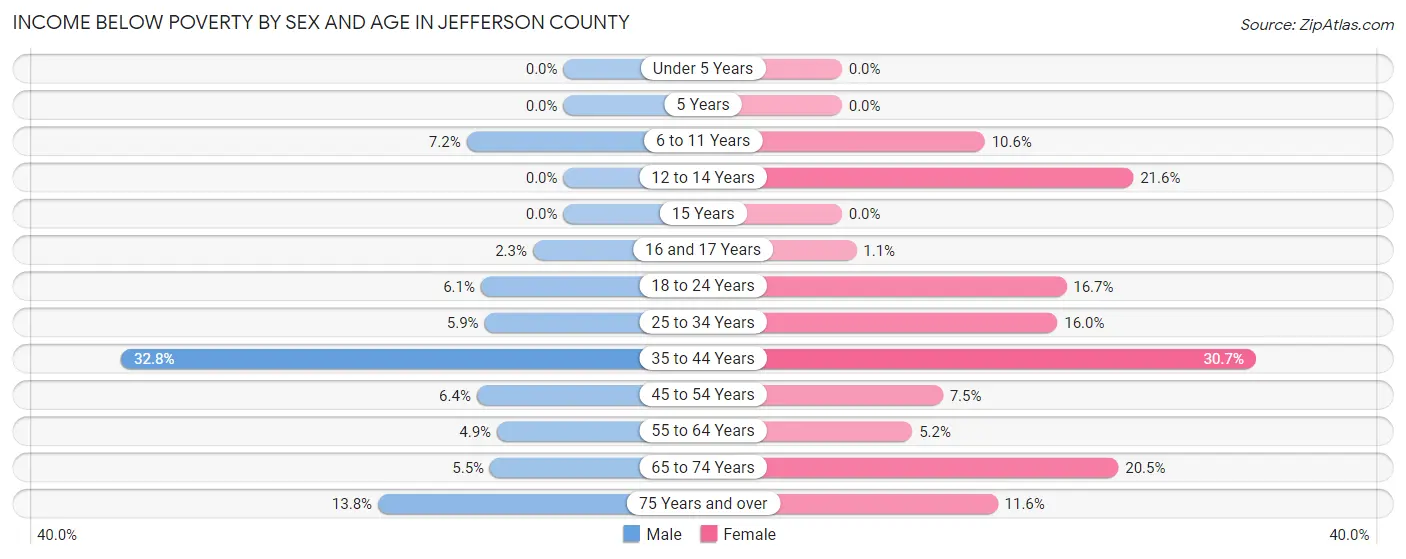
| Age Bracket | Male | Female |
| Under 5 Years | 0 (0.0%) | 0 (0.0%) |
| 5 Years | 0 (0.0%) | 0 (0.0%) |
| 6 to 11 Years | 22 (7.2%) | 26 (10.6%) |
| 12 to 14 Years | 0 (0.0%) | 29 (21.6%) |
| 15 Years | 0 (0.0%) | 0 (0.0%) |
| 16 and 17 Years | 2 (2.3%) | 1 (1.1%) |
| 18 to 24 Years | 13 (6.1%) | 37 (16.7%) |
| 25 to 34 Years | 19 (5.9%) | 68 (16.0%) |
| 35 to 44 Years | 130 (32.8%) | 110 (30.7%) |
| 45 to 54 Years | 25 (6.4%) | 28 (7.5%) |
| 55 to 64 Years | 28 (4.9%) | 28 (5.2%) |
| 65 to 74 Years | 26 (5.4%) | 93 (20.5%) |
| 75 Years and over | 42 (13.8%) | 53 (11.6%) |
| Total | 307 (9.0%) | 473 (13.1%) |
Income Above Poverty by Sex and Age in Jefferson County
According to the poverty statistics in Jefferson County, males aged under 5 years and females aged under 5 years are the age groups that are most secure financially, with 100.0% of males and 100.0% of females in these age groups living above the poverty line.
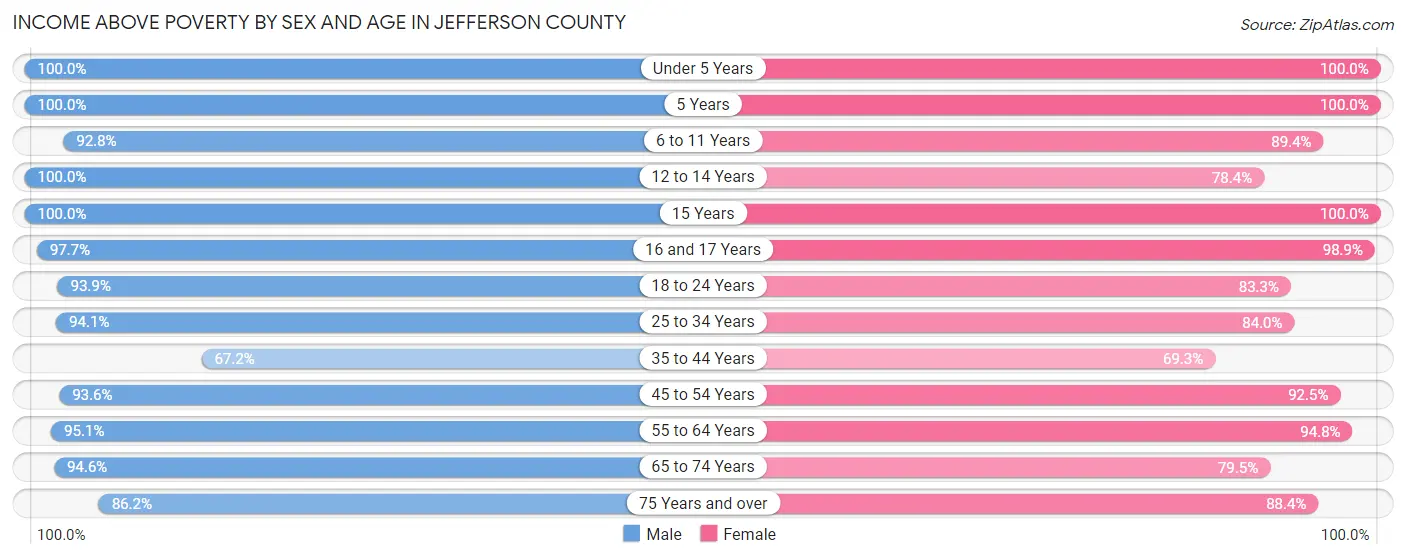
| Age Bracket | Male | Female |
| Under 5 Years | 171 (100.0%) | 219 (100.0%) |
| 5 Years | 78 (100.0%) | 32 (100.0%) |
| 6 to 11 Years | 284 (92.8%) | 219 (89.4%) |
| 12 to 14 Years | 73 (100.0%) | 105 (78.4%) |
| 15 Years | 36 (100.0%) | 57 (100.0%) |
| 16 and 17 Years | 86 (97.7%) | 92 (98.9%) |
| 18 to 24 Years | 199 (93.9%) | 185 (83.3%) |
| 25 to 34 Years | 305 (94.1%) | 357 (84.0%) |
| 35 to 44 Years | 266 (67.2%) | 248 (69.3%) |
| 45 to 54 Years | 364 (93.6%) | 346 (92.5%) |
| 55 to 64 Years | 540 (95.1%) | 507 (94.8%) |
| 65 to 74 Years | 451 (94.6%) | 360 (79.5%) |
| 75 Years and over | 263 (86.2%) | 405 (88.4%) |
| Total | 3,116 (91.0%) | 3,132 (86.9%) |
Income Below Poverty Among Married-Couple Families in Jefferson County
The poverty statistics for married-couple families in Jefferson County show that 7.8% or 119 of the total 1,522 families live below the poverty line. Families with no children have the highest poverty rate of 11.6%, comprising of 119 families. On the other hand, families with 1 or 2 children have the lowest poverty rate of 0.0%, which includes 0 families.
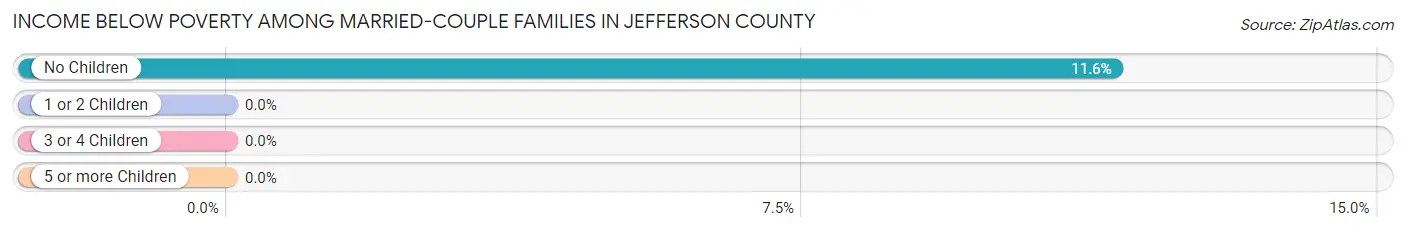
| Children | Above Poverty | Below Poverty |
| No Children | 910 (88.4%) | 119 (11.6%) |
| 1 or 2 Children | 327 (100.0%) | 0 (0.0%) |
| 3 or 4 Children | 166 (100.0%) | 0 (0.0%) |
| 5 or more Children | 0 (0.0%) | 0 (0.0%) |
| Total | 1,403 (92.2%) | 119 (7.8%) |
Income Below Poverty Among Single-Parent Households in Jefferson County
According to the poverty data in Jefferson County, 20.8% or 16 single-father households and 11.1% or 22 single-mother households are living below the poverty line. Among single-father households, those with no children have the highest poverty rate, with 16 households (40.0%) experiencing poverty. Likewise, among single-mother households, those with 3 or 4 children have the highest poverty rate, with 11 households (37.9%) falling below the poverty line.
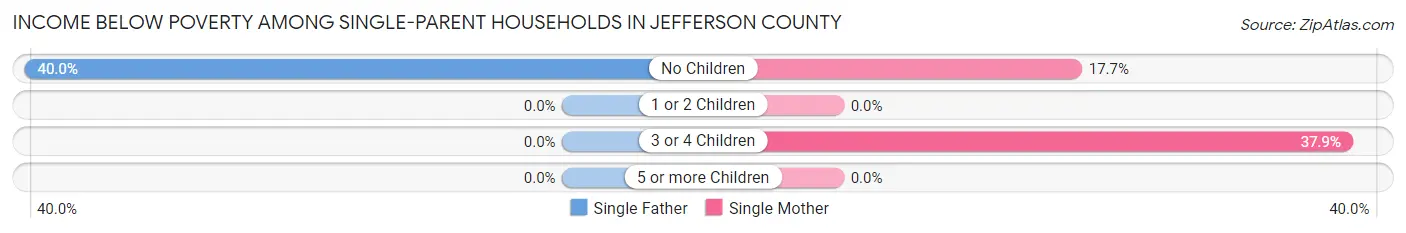
| Children | Single Father | Single Mother |
| No Children | 16 (40.0%) | 11 (17.7%) |
| 1 or 2 Children | 0 (0.0%) | 0 (0.0%) |
| 3 or 4 Children | 0 (0.0%) | 11 (37.9%) |
| 5 or more Children | 0 (0.0%) | 0 (0.0%) |
| Total | 16 (20.8%) | 22 (11.1%) |
Income Below Poverty Among Married-Couple vs Single-Parent Households in Jefferson County
The poverty data for Jefferson County shows that 119 of the married-couple family households (7.8%) and 38 of the single-parent households (13.8%) are living below the poverty level. Within the married-couple family households, those with no children have the highest poverty rate, with 119 households (11.6%) falling below the poverty line. Among the single-parent households, those with 3 or 4 children have the highest poverty rate, with 11 household (37.9%) living below poverty.
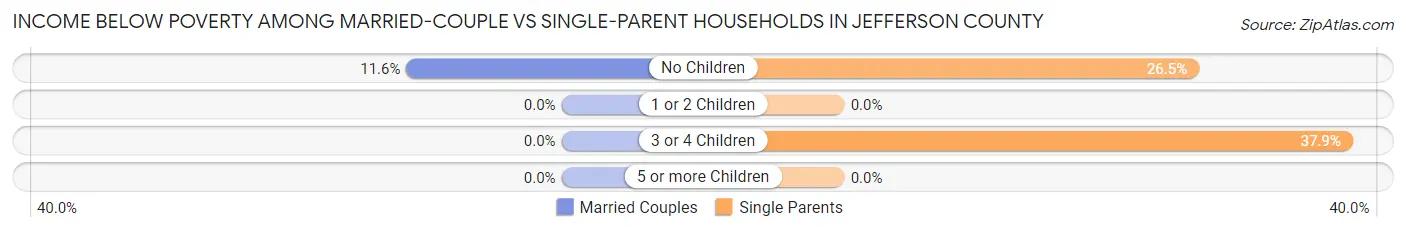
| Children | Married-Couple Families | Single-Parent Households |
| No Children | 119 (11.6%) | 27 (26.5%) |
| 1 or 2 Children | 0 (0.0%) | 0 (0.0%) |
| 3 or 4 Children | 0 (0.0%) | 11 (37.9%) |
| 5 or more Children | 0 (0.0%) | 0 (0.0%) |
| Total | 119 (7.8%) | 38 (13.8%) |
Race in Jefferson County
The most populous races in Jefferson County are White / Caucasian (6,783 | 94.4%), Hispanic or Latino (363 | 5.1%), and Two or more Races (291 | 4.1%).
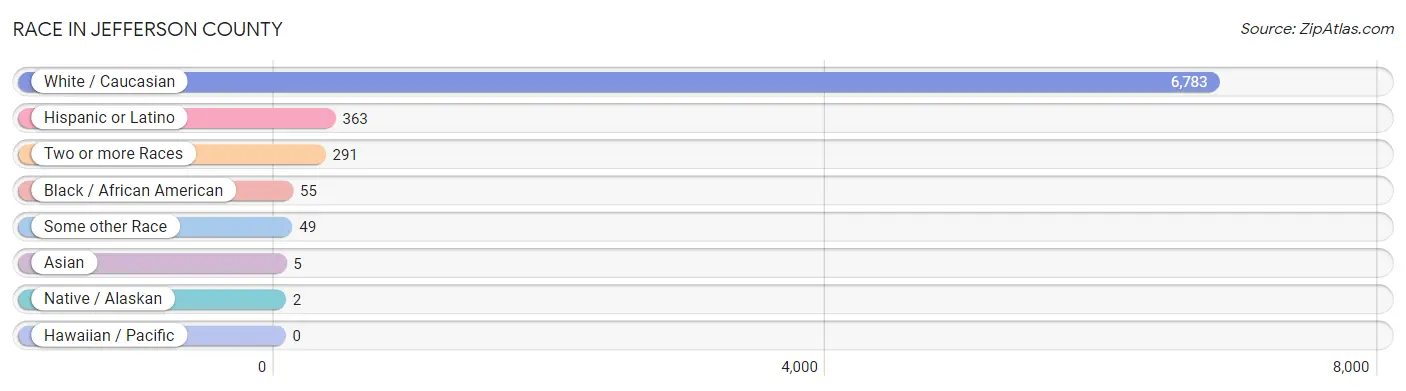
| Race | # Population | % Population |
| Asian | 5 | 0.1% |
| Black / African American | 55 | 0.8% |
| Hawaiian / Pacific | 0 | 0.0% |
| Hispanic or Latino | 363 | 5.1% |
| Native / Alaskan | 2 | 0.0% |
| White / Caucasian | 6,783 | 94.4% |
| Two or more Races | 291 | 4.1% |
| Some other Race | 49 | 0.7% |
| Total | 7,185 | 100.0% |
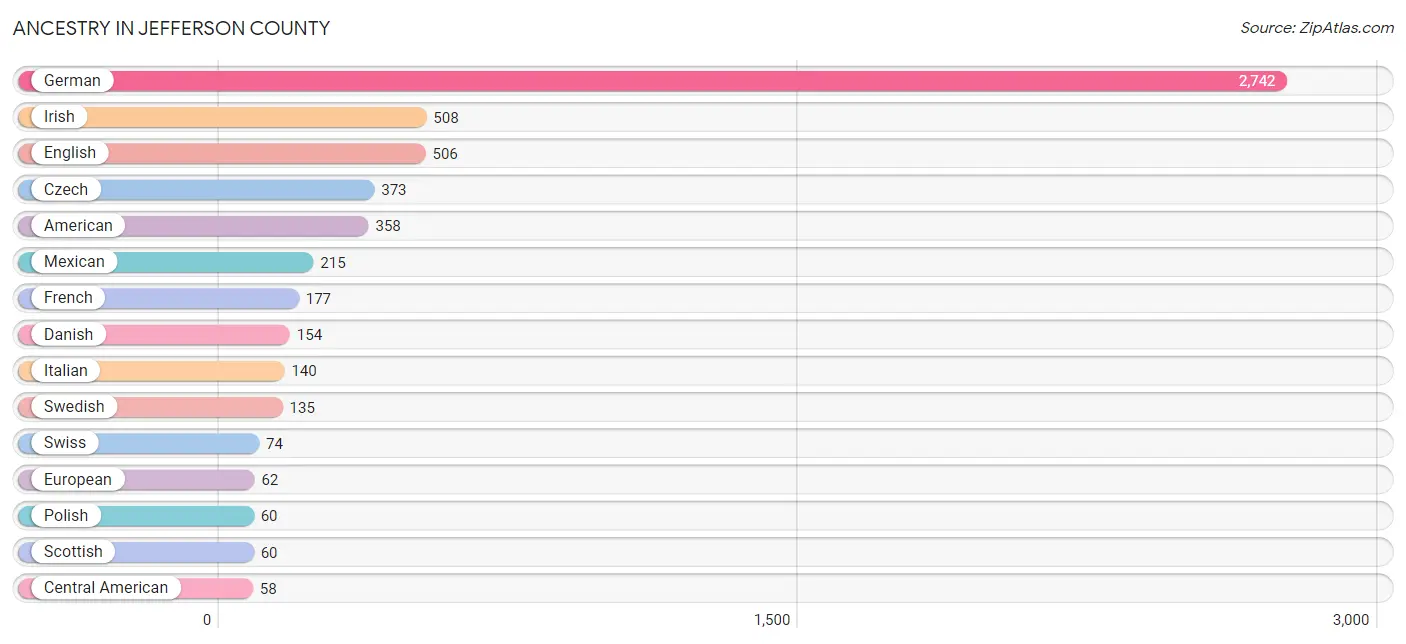
Ancestry in Jefferson County
The most populous ancestries reported in Jefferson County are German (2,742 | 38.2%), Irish (508 | 7.1%), English (506 | 7.0%), Czech (373 | 5.2%), and American (358 | 5.0%), together accounting for 62.4% of all Jefferson County residents.
| Ancestry | # Population | % Population |
| American | 358 | 5.0% |
| Arab | 7 | 0.1% |
| Austrian | 6 | 0.1% |
| Belgian | 4 | 0.1% |
| Bhutanese | 2 | 0.0% |
| British | 10 | 0.1% |
| Canadian | 15 | 0.2% |
| Central American | 58 | 0.8% |
| Cherokee | 1 | 0.0% |
| Cuban | 38 | 0.5% |
| Czech | 373 | 5.2% |
| Czechoslovakian | 14 | 0.2% |
| Danish | 154 | 2.1% |
| Dutch | 32 | 0.4% |
| English | 506 | 7.0% |
| European | 62 | 0.9% |
| Fijian | 6 | 0.1% |
| French | 177 | 2.5% |
| French Canadian | 8 | 0.1% |
| German | 2,742 | 38.2% |
| Greek | 11 | 0.2% |
| Guatemalan | 1 | 0.0% |
| Honduran | 57 | 0.8% |
| Hungarian | 4 | 0.1% |
| Irish | 508 | 7.1% |
| Italian | 140 | 1.9% |
| Korean | 13 | 0.2% |
| Lithuanian | 38 | 0.5% |
| Mexican | 215 | 3.0% |
| Norwegian | 30 | 0.4% |
| Pakistani | 3 | 0.0% |
| Pennsylvania German | 4 | 0.1% |
| Polish | 60 | 0.8% |
| Potawatomi | 2 | 0.0% |
| Romanian | 3 | 0.0% |
| Russian | 18 | 0.3% |
| Samoan | 10 | 0.1% |
| Scandinavian | 16 | 0.2% |
| Scotch-Irish | 24 | 0.3% |
| Scottish | 60 | 0.8% |
| Sioux | 11 | 0.2% |
| Slovak | 4 | 0.1% |
| Subsaharan African | 35 | 0.5% |
| Sudanese | 35 | 0.5% |
| Swedish | 135 | 1.9% |
| Swiss | 74 | 1.0% |
| Syrian | 7 | 0.1% |
| Welsh | 8 | 0.1% | View All 48 Rows |
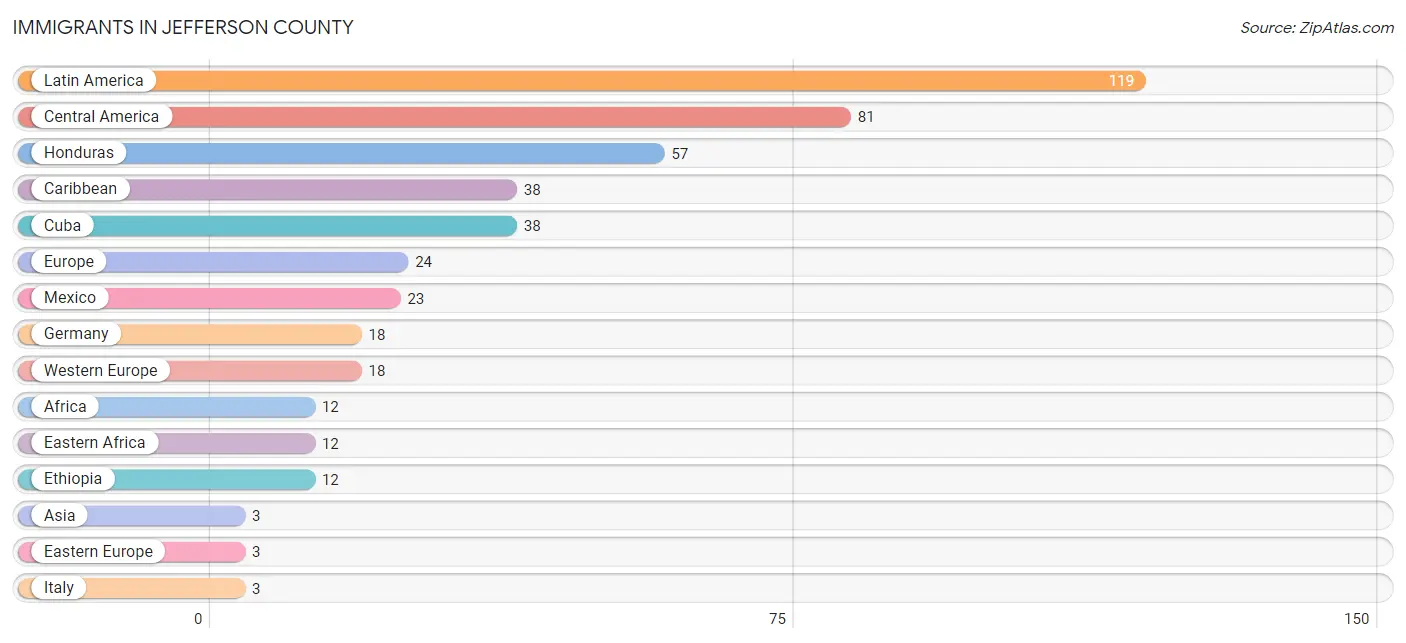
Immigrants in Jefferson County
The most numerous immigrant groups reported in Jefferson County came from Latin America (119 | 1.7%), Central America (81 | 1.1%), Honduras (57 | 0.8%), Caribbean (38 | 0.5%), and Cuba (38 | 0.5%), together accounting for 4.6% of all Jefferson County residents.
| Immigration Origin | # Population | % Population |
| Africa | 12 | 0.2% |
| Asia | 3 | 0.0% |
| Caribbean | 38 | 0.5% |
| Central America | 81 | 1.1% |
| Cuba | 38 | 0.5% |
| Eastern Africa | 12 | 0.2% |
| Eastern Europe | 3 | 0.0% |
| Ethiopia | 12 | 0.2% |
| Europe | 24 | 0.3% |
| Germany | 18 | 0.3% |
| Guatemala | 1 | 0.0% |
| Honduras | 57 | 0.8% |
| Italy | 3 | 0.0% |
| Latin America | 119 | 1.7% |
| Mexico | 23 | 0.3% |
| South Eastern Asia | 3 | 0.0% |
| Southern Europe | 3 | 0.0% |
| Thailand | 3 | 0.0% |
| Western Europe | 18 | 0.3% | View All 19 Rows |
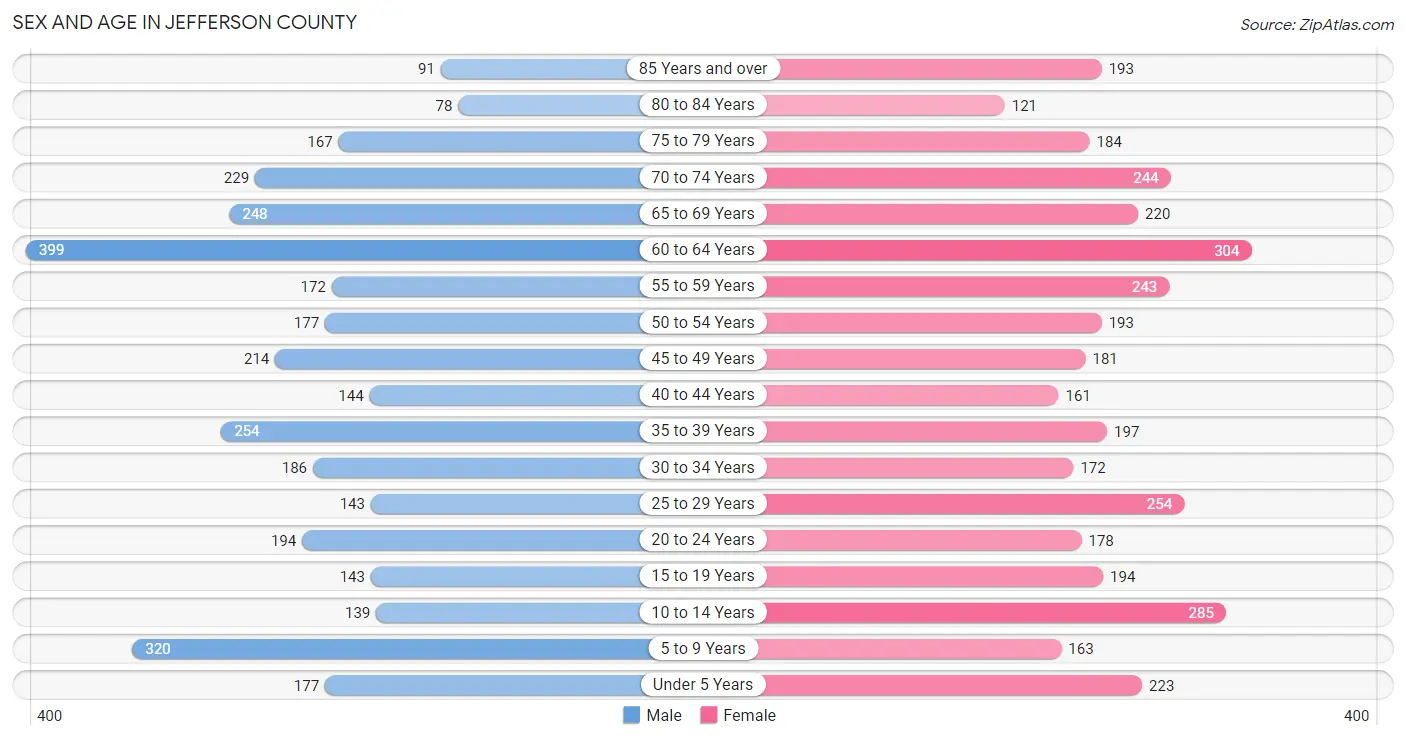
Sex and Age in Jefferson County
Sex and Age in Jefferson County
The most populous age groups in Jefferson County are 60 to 64 Years (399 | 11.5%) for men and 60 to 64 Years (304 | 8.2%) for women.
| Age Bracket | Male | Female |
| Under 5 Years | 177 (5.1%) | 223 (6.0%) |
| 5 to 9 Years | 320 (9.2%) | 163 (4.4%) |
| 10 to 14 Years | 139 (4.0%) | 285 (7.7%) |
| 15 to 19 Years | 143 (4.1%) | 194 (5.2%) |
| 20 to 24 Years | 194 (5.6%) | 178 (4.8%) |
| 25 to 29 Years | 143 (4.1%) | 254 (6.9%) |
| 30 to 34 Years | 186 (5.3%) | 172 (4.6%) |
| 35 to 39 Years | 254 (7.3%) | 197 (5.3%) |
| 40 to 44 Years | 144 (4.1%) | 161 (4.3%) |
| 45 to 49 Years | 214 (6.2%) | 181 (4.9%) |
| 50 to 54 Years | 177 (5.1%) | 193 (5.2%) |
| 55 to 59 Years | 172 (5.0%) | 243 (6.6%) |
| 60 to 64 Years | 399 (11.5%) | 304 (8.2%) |
| 65 to 69 Years | 248 (7.1%) | 220 (5.9%) |
| 70 to 74 Years | 229 (6.6%) | 244 (6.6%) |
| 75 to 79 Years | 167 (4.8%) | 184 (5.0%) |
| 80 to 84 Years | 78 (2.2%) | 121 (3.3%) |
| 85 Years and over | 91 (2.6%) | 193 (5.2%) |
| Total | 3,475 (100.0%) | 3,710 (100.0%) |
Families and Households in Jefferson County
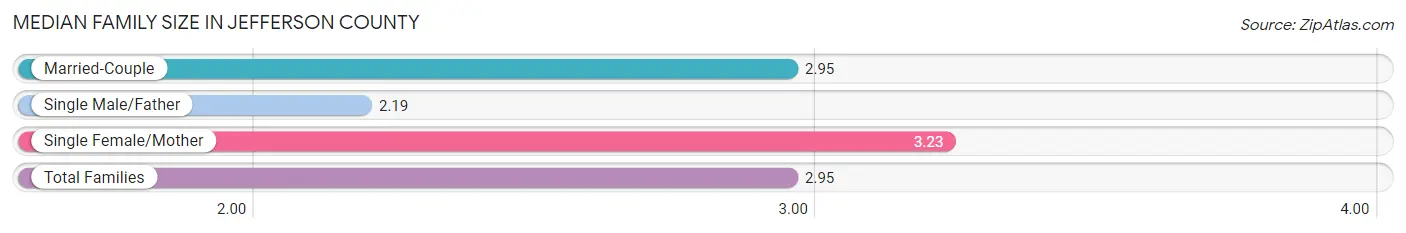
Median Family Size in Jefferson County
The median family size in Jefferson County is 2.95 persons per family, with single female/mother families (199 | 11.1%) accounting for the largest median family size of 3.23 persons per family. On the other hand, single male/father families (77 | 4.3%) represent the smallest median family size with 2.19 persons per family.
| Family Type | # Families | Family Size |
| Married-Couple | 1,522 (84.7%) | 2.95 |
| Single Male/Father | 77 (4.3%) | 2.19 |
| Single Female/Mother | 199 (11.1%) | 3.23 |
| Total Families | 1,798 (100.0%) | 2.95 |
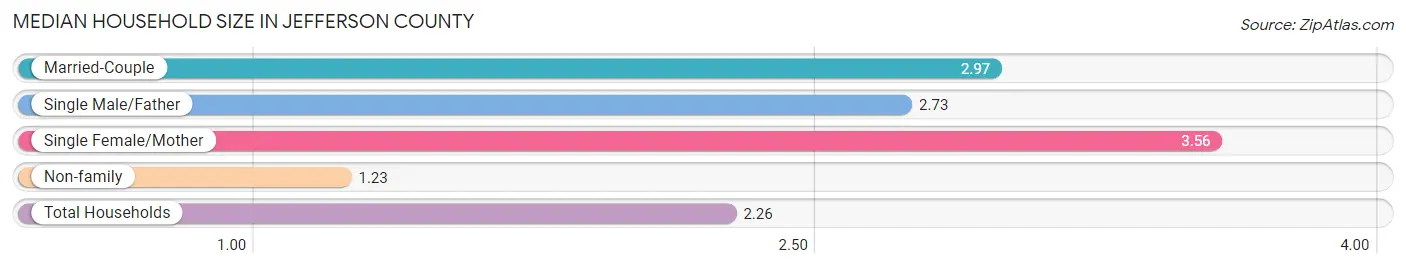
Median Household Size in Jefferson County
The median household size in Jefferson County is 2.26 persons per household, with single female/mother households (199 | 6.4%) accounting for the largest median household size of 3.56 persons per household. non-family households (1,324 | 42.4%) represent the smallest median household size with 1.23 persons per household.
| Household Type | # Households | Household Size |
| Married-Couple | 1,522 (48.7%) | 2.97 |
| Single Male/Father | 77 (2.5%) | 2.73 |
| Single Female/Mother | 199 (6.4%) | 3.56 |
| Non-family | 1,324 (42.4%) | 1.23 |
| Total Households | 3,122 (100.0%) | 2.26 |
Household Size by Marriage Status in Jefferson County
Out of a total of 3,122 households in Jefferson County, 1,798 (57.6%) are family households, while 1,324 (42.4%) are nonfamily households. The most numerous type of family households are 2-person households, comprising 1,050, and the most common type of nonfamily households are 1-person households, comprising 1,112.
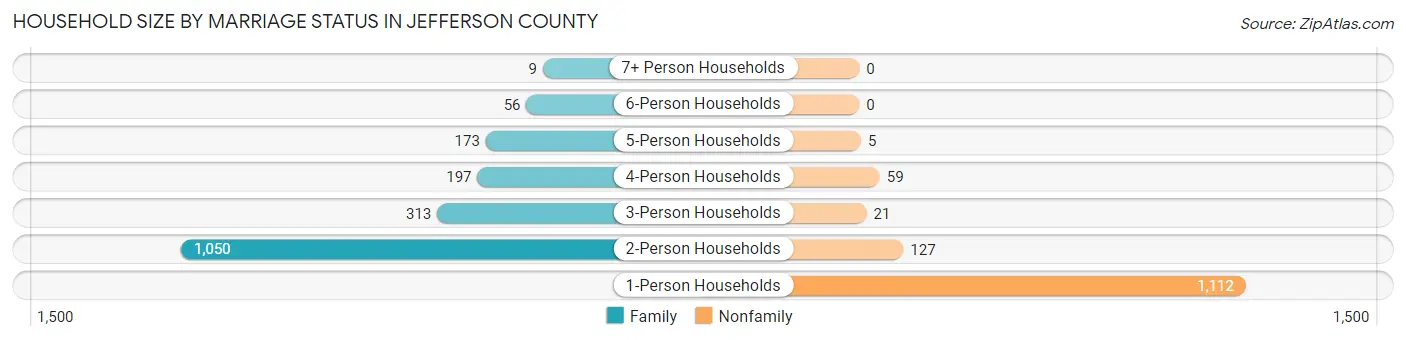
| Household Size | Family Households | Nonfamily Households |
| 1-Person Households | - | 1,112 (35.6%) |
| 2-Person Households | 1,050 (33.6%) | 127 (4.1%) |
| 3-Person Households | 313 (10.0%) | 21 (0.7%) |
| 4-Person Households | 197 (6.3%) | 59 (1.9%) |
| 5-Person Households | 173 (5.5%) | 5 (0.2%) |
| 6-Person Households | 56 (1.8%) | 0 (0.0%) |
| 7+ Person Households | 9 (0.3%) | 0 (0.0%) |
| Total | 1,798 (57.6%) | 1,324 (42.4%) |
Female Fertility in Jefferson County
Fertility by Age in Jefferson County
Average fertility rate in Jefferson County is 97.0 births per 1,000 women. Women in the age bracket of 20 to 34 years have the highest fertility rate with 192.0 births per 1,000 women. Women in the age bracket of 20 to 34 years acount for 88.5% of all women with births.
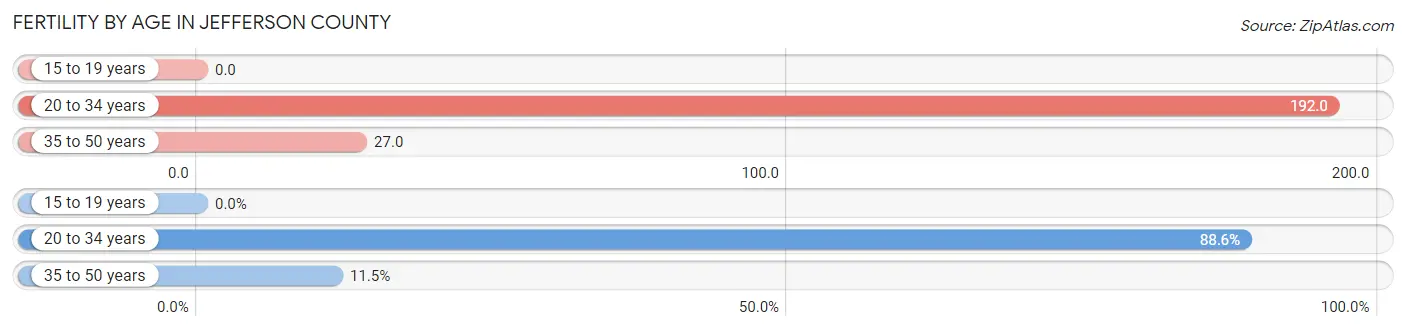
| Age Bracket | Women with Births | Births / 1,000 Women |
| 15 to 19 years | 0 (0.0%) | 0.0 |
| 20 to 34 years | 116 (88.5%) | 192.0 |
| 35 to 50 years | 15 (11.5%) | 27.0 |
| Total | 131 (100.0%) | 97.0 |
Fertility by Age by Marriage Status in Jefferson County
72.5% of women with births (131) in Jefferson County are married. The highest percentage of unmarried women with births falls into 20 to 34 years age bracket with 31.0% of them unmarried at the time of birth, while the lowest percentage of unmarried women with births belong to 35 to 50 years age bracket with 0.0% of them unmarried.
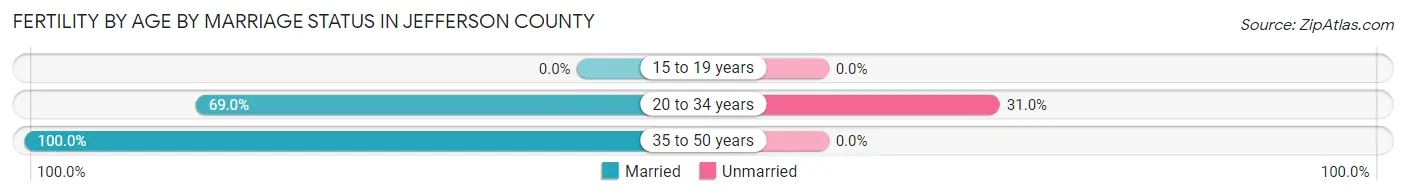
| Age Bracket | Married | Unmarried |
| 15 to 19 years | 0 (0.0%) | 0 (0.0%) |
| 20 to 34 years | 80 (69.0%) | 36 (31.0%) |
| 35 to 50 years | 15 (100.0%) | 0 (0.0%) |
| Total | 95 (72.5%) | 36 (27.5%) |
Fertility by Education in Jefferson County
Average fertility rate in Jefferson County is 97.0 births per 1,000 women. Women with the education attainment of graduate degree have the highest fertility rate of 317.0 births per 1,000 women, while women with the education attainment of college or associate's degree have the lowest fertility at 21.0 births per 1,000 women. Women with the education attainment of high school diploma represent 40.5% of all women with births.
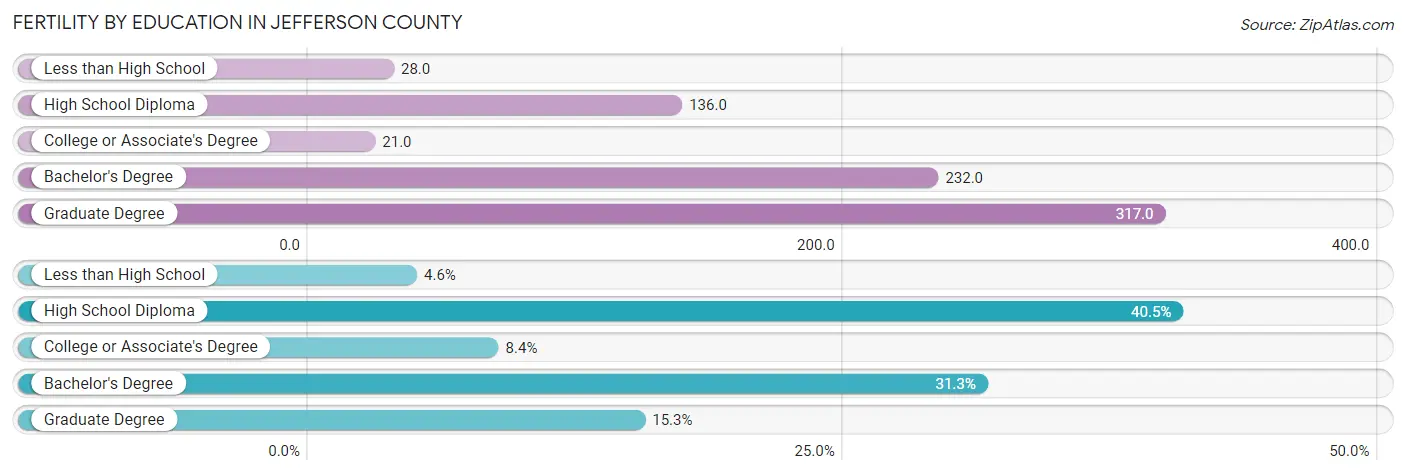
| Educational Attainment | Women with Births | Births / 1,000 Women |
| Less than High School | 6 (4.6%) | 28.0 |
| High School Diploma | 53 (40.5%) | 136.0 |
| College or Associate's Degree | 11 (8.4%) | 21.0 |
| Bachelor's Degree | 41 (31.3%) | 232.0 |
| Graduate Degree | 20 (15.3%) | 317.0 |
| Total | 131 (100.0%) | 97.0 |
Fertility by Education by Marriage Status in Jefferson County
27.5% of women with births in Jefferson County are unmarried. Women with the educational attainment of college or associate's degree are most likely to be married with 100.0% of them married at childbirth, while women with the educational attainment of less than high school are least likely to be married with 100.0% of them unmarried at childbirth.
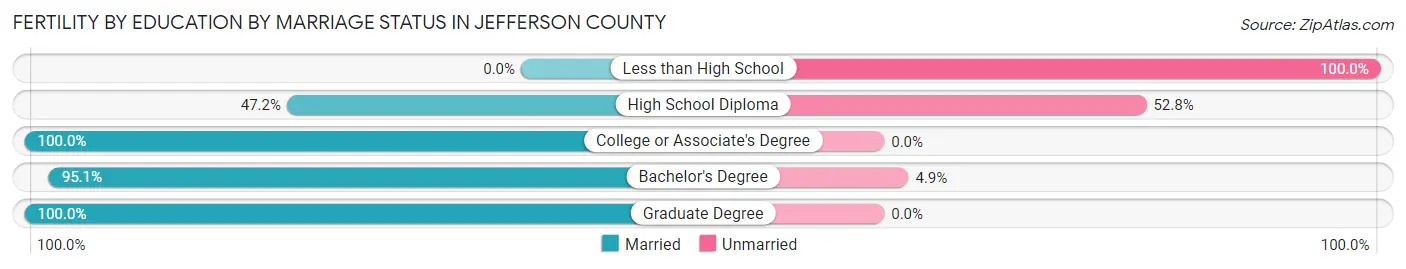
| Educational Attainment | Married | Unmarried |
| Less than High School | 0 (0.0%) | 6 (100.0%) |
| High School Diploma | 25 (47.2%) | 28 (52.8%) |
| College or Associate's Degree | 11 (100.0%) | 0 (0.0%) |
| Bachelor's Degree | 39 (95.1%) | 2 (4.9%) |
| Graduate Degree | 20 (100.0%) | 0 (0.0%) |
| Total | 95 (72.5%) | 36 (27.5%) |
Employment Characteristics in Jefferson County
Employment by Class of Employer in Jefferson County
Among the 3,428 employed individuals in Jefferson County, private company employees (2,110 | 61.6%), not-for-profit organizations (416 | 12.1%), and self-employed (not incorporated) (329 | 9.6%) make up the most common classes of employment.
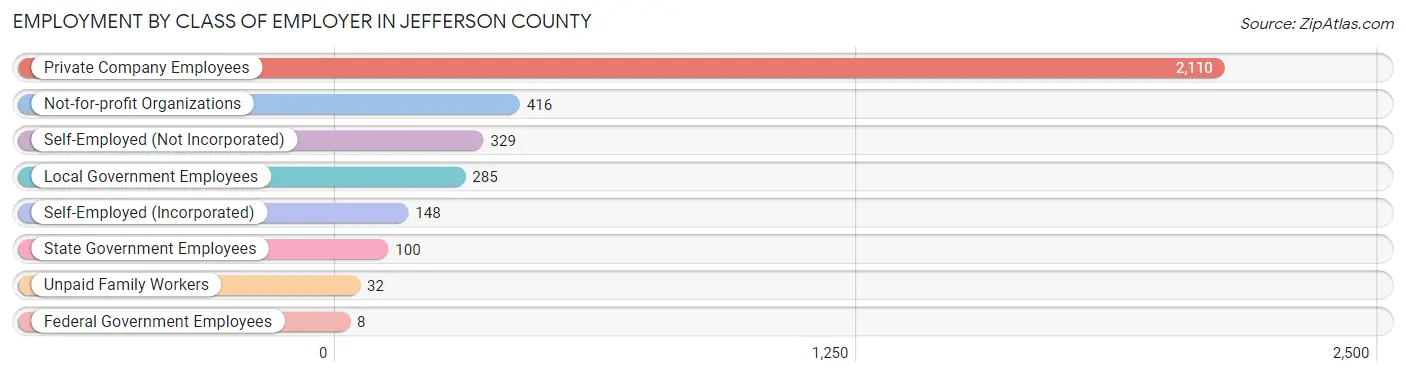
| Employer Class | # Employees | % Employees |
| Private Company Employees | 2,110 | 61.6% |
| Self-Employed (Incorporated) | 148 | 4.3% |
| Self-Employed (Not Incorporated) | 329 | 9.6% |
| Not-for-profit Organizations | 416 | 12.1% |
| Local Government Employees | 285 | 8.3% |
| State Government Employees | 100 | 2.9% |
| Federal Government Employees | 8 | 0.2% |
| Unpaid Family Workers | 32 | 0.9% |
| Total | 3,428 | 100.0% |
Employment Status by Age in Jefferson County
According to the labor force statistics for Jefferson County, out of the total population over 16 years of age (5,785), 60.8% or 3,517 individuals are in the labor force, with 1.1% or 39 of them unemployed. The age group with the highest labor force participation rate is 25 to 29 years, with 91.9% or 365 individuals in the labor force. Within the labor force, the 25 to 29 years age range has the highest percentage of unemployed individuals, with 3.0% or 11 of them being unemployed.
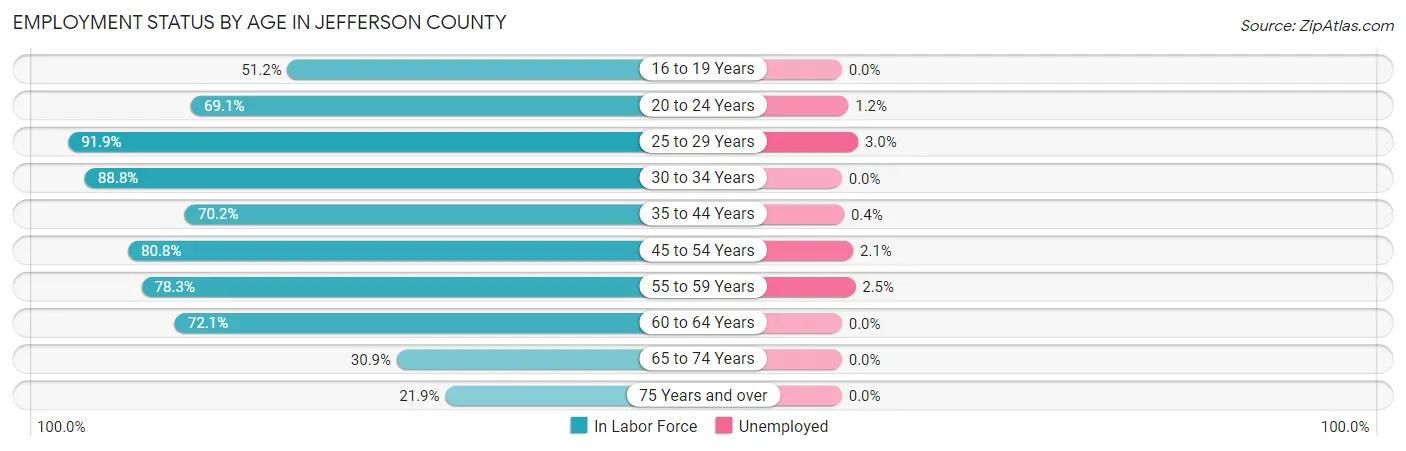
| Age Bracket | In Labor Force | Unemployed |
| 16 to 19 Years | 125 (51.2%) | 0 (0.0%) |
| 20 to 24 Years | 257 (69.1%) | 3 (1.2%) |
| 25 to 29 Years | 365 (91.9%) | 11 (3.0%) |
| 30 to 34 Years | 318 (88.8%) | 0 (0.0%) |
| 35 to 44 Years | 531 (70.2%) | 2 (0.4%) |
| 45 to 54 Years | 618 (80.8%) | 13 (2.1%) |
| 55 to 59 Years | 325 (78.3%) | 8 (2.5%) |
| 60 to 64 Years | 507 (72.1%) | 0 (0.0%) |
| 65 to 74 Years | 291 (30.9%) | 0 (0.0%) |
| 75 Years and over | 183 (21.9%) | 0 (0.0%) |
| Total | 3,517 (60.8%) | 39 (1.1%) |
Employment Status by Educational Attainment in Jefferson County
According to labor force statistics for Jefferson County, 78.5% of individuals (2,664) out of the total population between 25 and 64 years of age (3,394) are in the labor force, with 1.3% or 35 of them being unemployed. The group with the highest labor force participation rate are those with the educational attainment of college / associate degree, with 84.4% or 1,122 individuals in the labor force. Within the labor force, individuals with less than high school education have the highest percentage of unemployment, with 3.3% or 6 of them being unemployed.
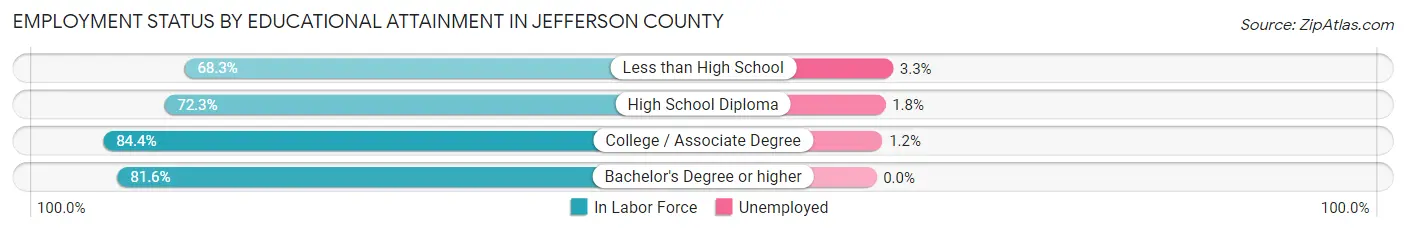
| Educational Attainment | In Labor Force | Unemployed |
| Less than High School | 183 (68.3%) | 9 (3.3%) |
| High School Diploma | 835 (72.3%) | 21 (1.8%) |
| College / Associate Degree | 1,122 (84.4%) | 16 (1.2%) |
| Bachelor's Degree or higher | 524 (81.6%) | 0 (0.0%) |
| Total | 2,664 (78.5%) | 44 (1.3%) |
Employment Occupations by Sex in Jefferson County
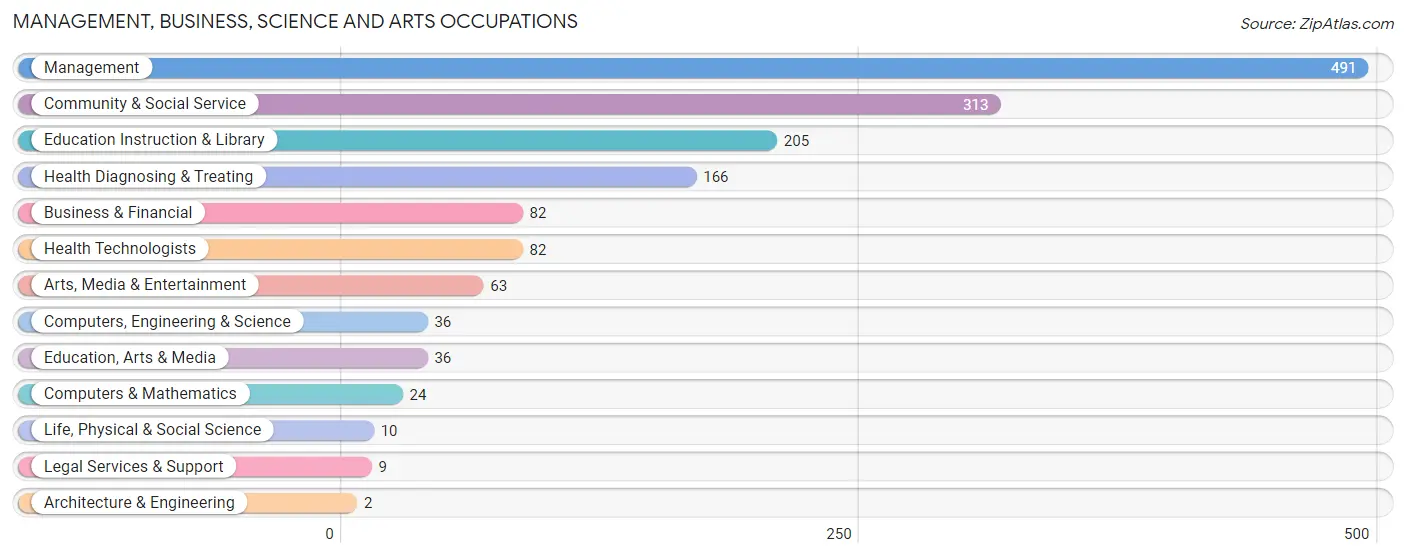
Management, Business, Science and Arts Occupations
The most common Management, Business, Science and Arts occupations in Jefferson County are Management (491 | 14.1%), Community & Social Service (313 | 9.0%), Education Instruction & Library (205 | 5.9%), Health Diagnosing & Treating (166 | 4.8%), and Business & Financial (82 | 2.4%).
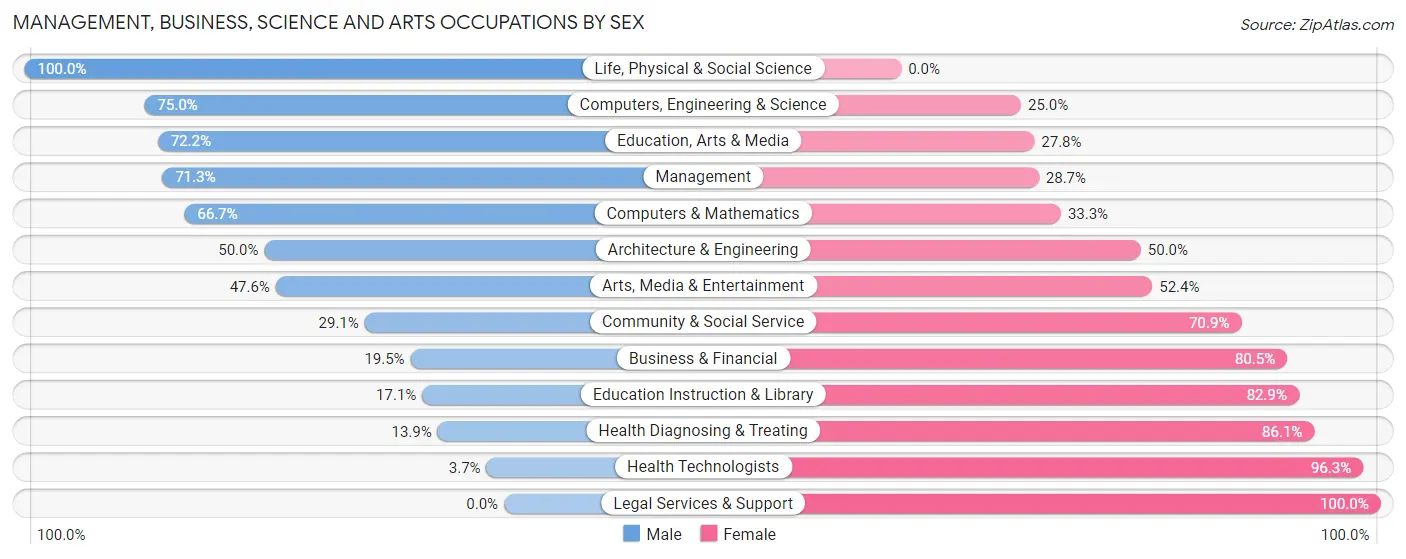
Management, Business, Science and Arts Occupations by Sex
Within the Management, Business, Science and Arts occupations in Jefferson County, the most male-oriented occupations are Life, Physical & Social Science (100.0%), Computers, Engineering & Science (75.0%), and Education, Arts & Media (72.2%), while the most female-oriented occupations are Legal Services & Support (100.0%), Health Technologists (96.3%), and Health Diagnosing & Treating (86.1%).
| Occupation | Male | Female |
| Management | 350 (71.3%) | 141 (28.7%) |
| Business & Financial | 16 (19.5%) | 66 (80.5%) |
| Computers, Engineering & Science | 27 (75.0%) | 9 (25.0%) |
| Computers & Mathematics | 16 (66.7%) | 8 (33.3%) |
| Architecture & Engineering | 1 (50.0%) | 1 (50.0%) |
| Life, Physical & Social Science | 10 (100.0%) | 0 (0.0%) |
| Community & Social Service | 91 (29.1%) | 222 (70.9%) |
| Education, Arts & Media | 26 (72.2%) | 10 (27.8%) |
| Legal Services & Support | 0 (0.0%) | 9 (100.0%) |
| Education Instruction & Library | 35 (17.1%) | 170 (82.9%) |
| Arts, Media & Entertainment | 30 (47.6%) | 33 (52.4%) |
| Health Diagnosing & Treating | 23 (13.9%) | 143 (86.1%) |
| Health Technologists | 3 (3.7%) | 79 (96.3%) |
| Total (Category) | 507 (46.6%) | 581 (53.4%) |
| Total (Overall) | 1,780 (51.1%) | 1,703 (48.9%) |
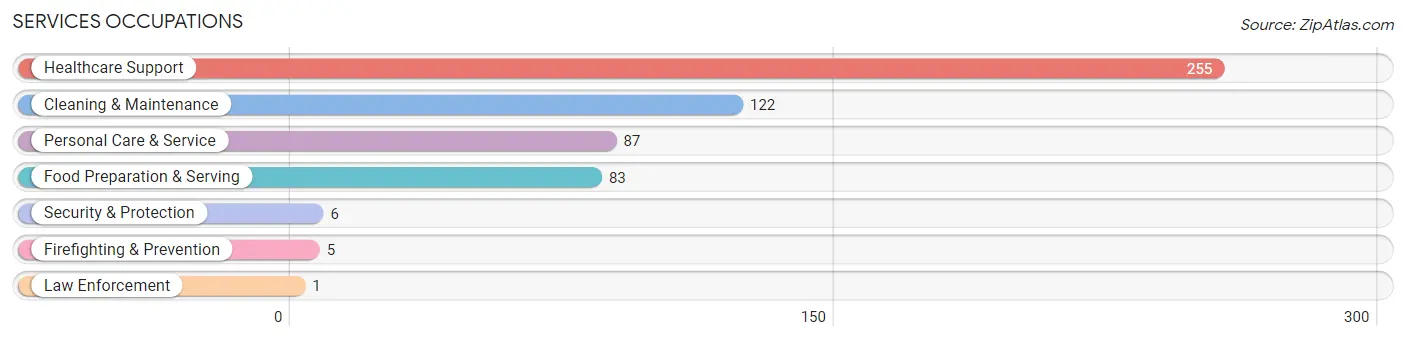
Services Occupations
The most common Services occupations in Jefferson County are Healthcare Support (255 | 7.3%), Cleaning & Maintenance (122 | 3.5%), Personal Care & Service (87 | 2.5%), Food Preparation & Serving (83 | 2.4%), and Security & Protection (6 | 0.2%).
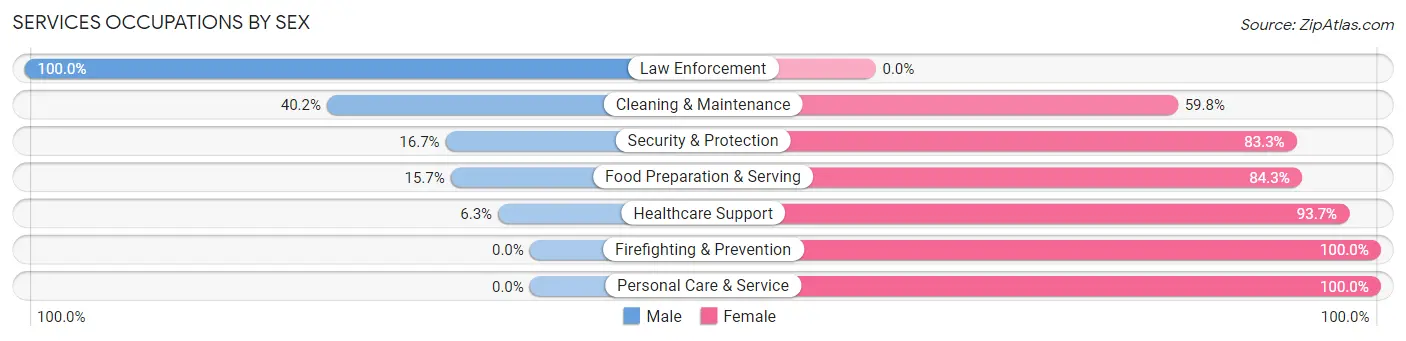
Services Occupations by Sex
Within the Services occupations in Jefferson County, the most male-oriented occupations are Law Enforcement (100.0%), Cleaning & Maintenance (40.2%), and Security & Protection (16.7%), while the most female-oriented occupations are Firefighting & Prevention (100.0%), Personal Care & Service (100.0%), and Healthcare Support (93.7%).
| Occupation | Male | Female |
| Healthcare Support | 16 (6.3%) | 239 (93.7%) |
| Security & Protection | 1 (16.7%) | 5 (83.3%) |
| Firefighting & Prevention | 0 (0.0%) | 5 (100.0%) |
| Law Enforcement | 1 (100.0%) | 0 (0.0%) |
| Food Preparation & Serving | 13 (15.7%) | 70 (84.3%) |
| Cleaning & Maintenance | 49 (40.2%) | 73 (59.8%) |
| Personal Care & Service | 0 (0.0%) | 87 (100.0%) |
| Total (Category) | 79 (14.3%) | 474 (85.7%) |
| Total (Overall) | 1,780 (51.1%) | 1,703 (48.9%) |
Sales and Office Occupations
The most common Sales and Office occupations in Jefferson County are Office & Administration (302 | 8.7%), and Sales & Related (273 | 7.8%).
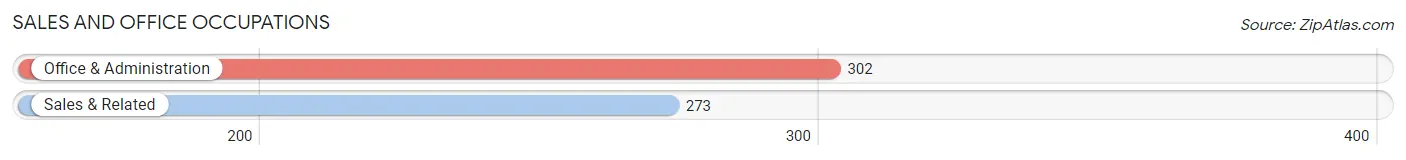
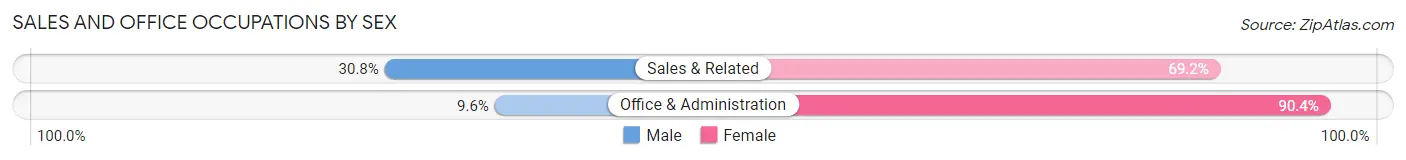
Sales and Office Occupations by Sex
| Occupation | Male | Female |
| Sales & Related | 84 (30.8%) | 189 (69.2%) |
| Office & Administration | 29 (9.6%) | 273 (90.4%) |
| Total (Category) | 113 (19.7%) | 462 (80.3%) |
| Total (Overall) | 1,780 (51.1%) | 1,703 (48.9%) |
Natural Resources, Construction and Maintenance Occupations
The most common Natural Resources, Construction and Maintenance occupations in Jefferson County are Construction & Extraction (258 | 7.4%), Farming, Fishing & Forestry (205 | 5.9%), and Installation, Maintenance & Repair (105 | 3.0%).
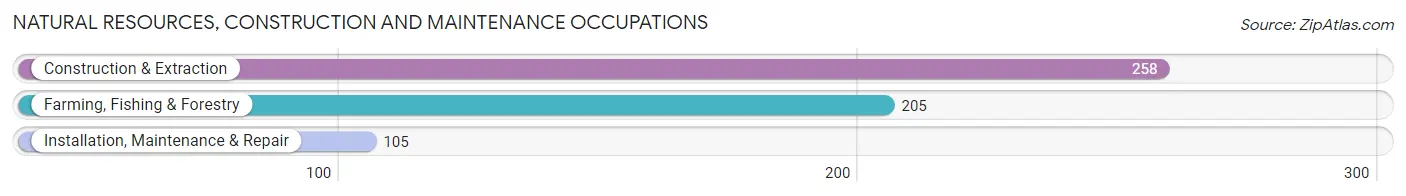
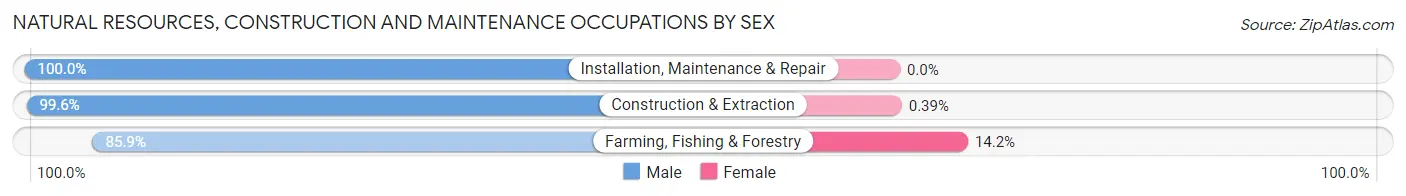
Natural Resources, Construction and Maintenance Occupations by Sex
| Occupation | Male | Female |
| Farming, Fishing & Forestry | 176 (85.9%) | 29 (14.1%) |
| Construction & Extraction | 257 (99.6%) | 1 (0.4%) |
| Installation, Maintenance & Repair | 105 (100.0%) | 0 (0.0%) |
| Total (Category) | 538 (94.7%) | 30 (5.3%) |
| Total (Overall) | 1,780 (51.1%) | 1,703 (48.9%) |
Production, Transportation and Moving Occupations
The most common Production, Transportation and Moving occupations in Jefferson County are Production (305 | 8.8%), Transportation (299 | 8.6%), and Material Moving (95 | 2.7%).
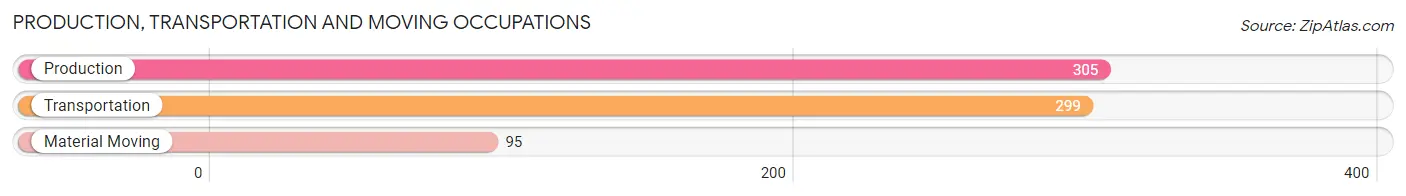
Production, Transportation and Moving Occupations by Sex
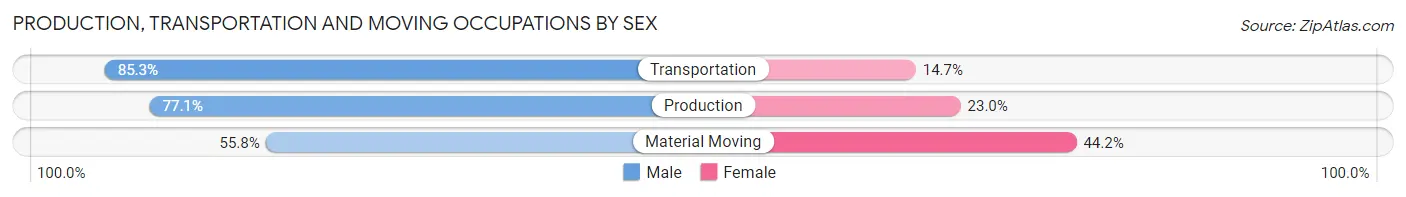
| Occupation | Male | Female |
| Production | 235 (77.0%) | 70 (23.0%) |
| Transportation | 255 (85.3%) | 44 (14.7%) |
| Material Moving | 53 (55.8%) | 42 (44.2%) |
| Total (Category) | 543 (77.7%) | 156 (22.3%) |
| Total (Overall) | 1,780 (51.1%) | 1,703 (48.9%) |
Employment Industries by Sex in Jefferson County
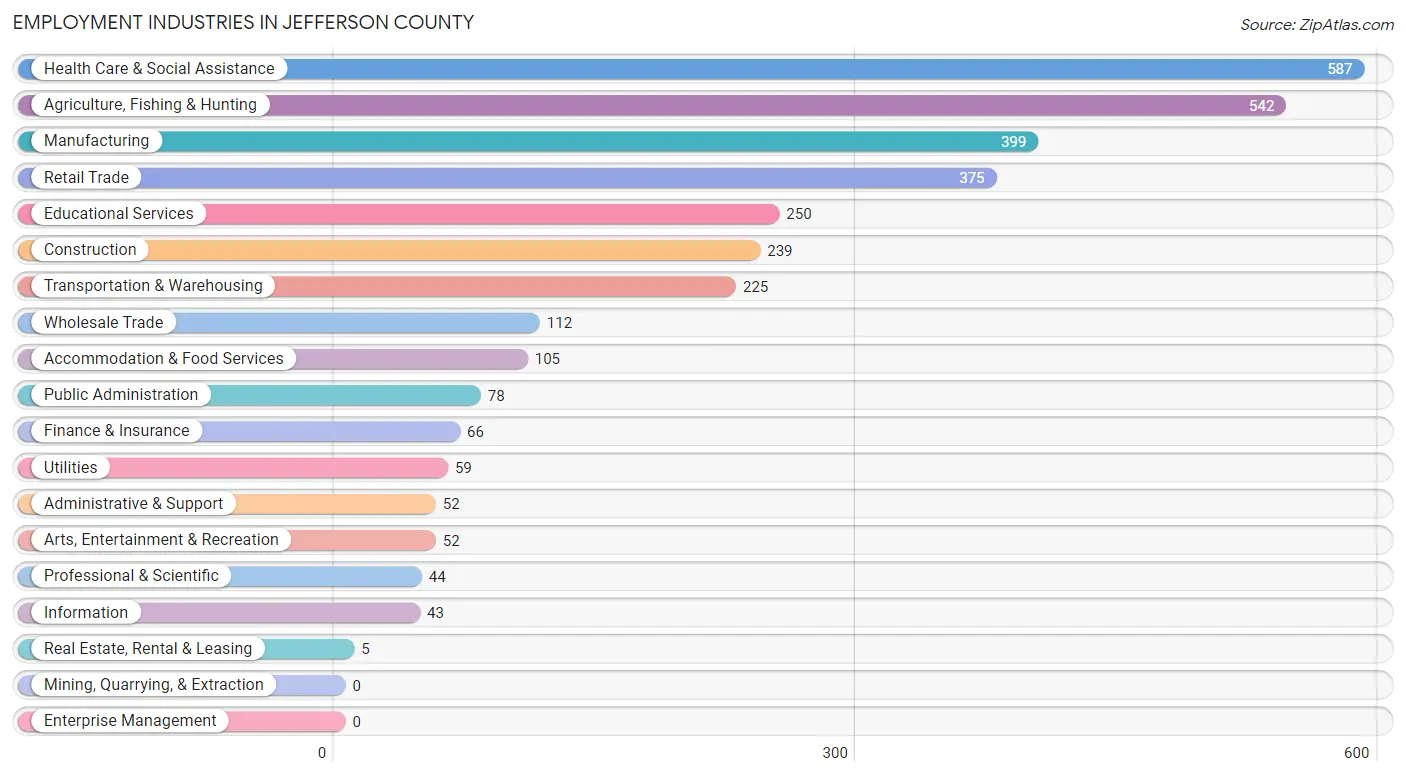
Employment Industries in Jefferson County
The major employment industries in Jefferson County include Health Care & Social Assistance (587 | 16.9%), Agriculture, Fishing & Hunting (542 | 15.6%), Manufacturing (399 | 11.5%), Retail Trade (375 | 10.8%), and Educational Services (250 | 7.2%).
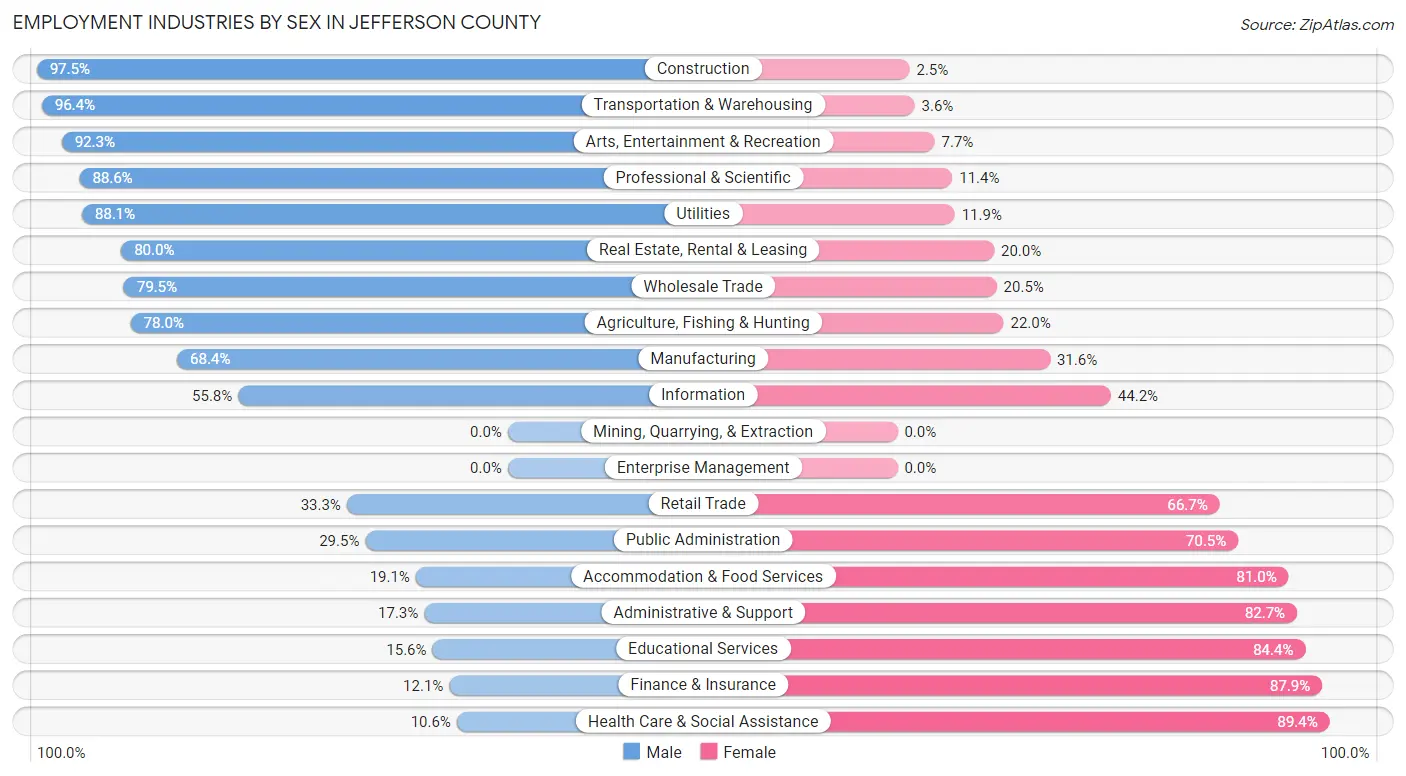
Employment Industries by Sex in Jefferson County
The Jefferson County industries that see more men than women are Construction (97.5%), Transportation & Warehousing (96.4%), and Arts, Entertainment & Recreation (92.3%), whereas the industries that tend to have a higher number of women are Health Care & Social Assistance (89.4%), Finance & Insurance (87.9%), and Educational Services (84.4%).
| Industry | Male | Female |
| Agriculture, Fishing & Hunting | 423 (78.0%) | 119 (22.0%) |
| Mining, Quarrying, & Extraction | 0 (0.0%) | 0 (0.0%) |
| Construction | 233 (97.5%) | 6 (2.5%) |
| Manufacturing | 273 (68.4%) | 126 (31.6%) |
| Wholesale Trade | 89 (79.5%) | 23 (20.5%) |
| Retail Trade | 125 (33.3%) | 250 (66.7%) |
| Transportation & Warehousing | 217 (96.4%) | 8 (3.6%) |
| Utilities | 52 (88.1%) | 7 (11.9%) |
| Information | 24 (55.8%) | 19 (44.2%) |
| Finance & Insurance | 8 (12.1%) | 58 (87.9%) |
| Real Estate, Rental & Leasing | 4 (80.0%) | 1 (20.0%) |
| Professional & Scientific | 39 (88.6%) | 5 (11.4%) |
| Enterprise Management | 0 (0.0%) | 0 (0.0%) |
| Administrative & Support | 9 (17.3%) | 43 (82.7%) |
| Educational Services | 39 (15.6%) | 211 (84.4%) |
| Health Care & Social Assistance | 62 (10.6%) | 525 (89.4%) |
| Arts, Entertainment & Recreation | 48 (92.3%) | 4 (7.7%) |
| Accommodation & Food Services | 20 (19.1%) | 85 (80.9%) |
| Public Administration | 23 (29.5%) | 55 (70.5%) |
| Total | 1,780 (51.1%) | 1,703 (48.9%) |
Education in Jefferson County
School Enrollment in Jefferson County
The most common levels of schooling among the 1,492 students in Jefferson County are elementary school (375 | 25.1%), middle school (345 | 23.1%), and high school (320 | 21.4%).
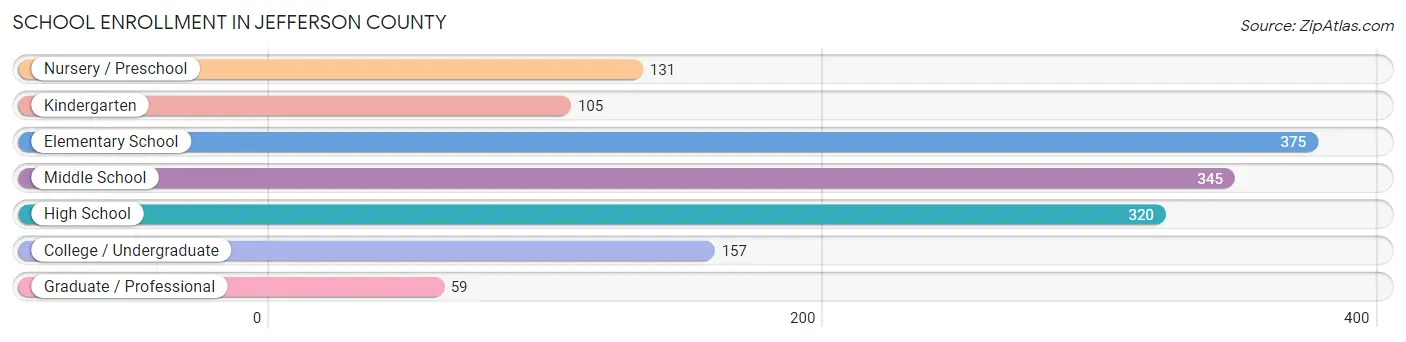
| School Level | # Students | % Students |
| Nursery / Preschool | 131 | 8.8% |
| Kindergarten | 105 | 7.0% |
| Elementary School | 375 | 25.1% |
| Middle School | 345 | 23.1% |
| High School | 320 | 21.4% |
| College / Undergraduate | 157 | 10.5% |
| Graduate / Professional | 59 | 4.0% |
| Total | 1,492 | 100.0% |
School Enrollment by Age by Funding Source in Jefferson County
Out of a total of 1,492 students who are enrolled in schools in Jefferson County, 215 (14.4%) attend a private institution, while the remaining 1,277 (85.6%) are enrolled in public schools. The age group of 20 to 24 year olds has the highest likelihood of being enrolled in private schools, with 91 (77.8% in the age bracket) enrolled. Conversely, the age group of 15 to 17 year olds has the lowest likelihood of being enrolled in a private school, with 274 (100.0% in the age bracket) attending a public institution.
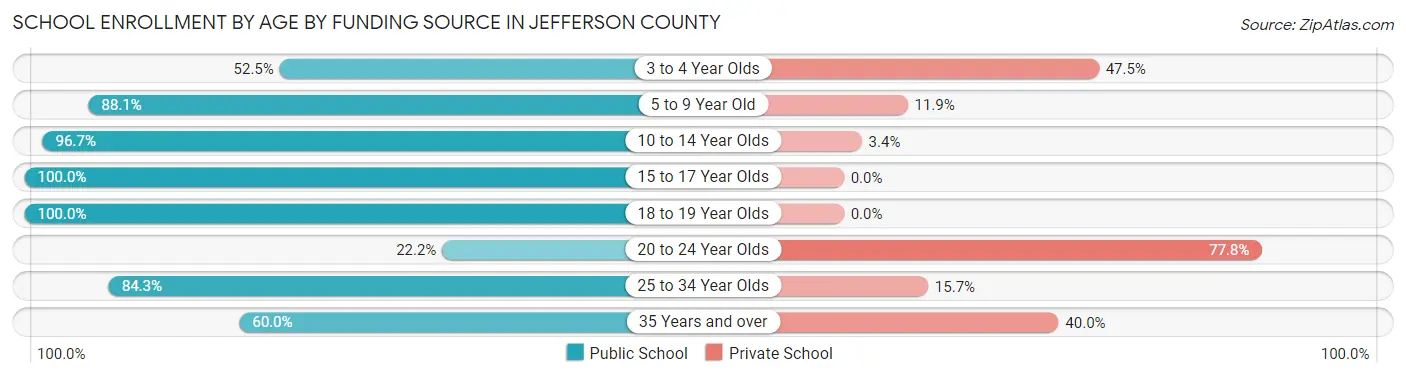
| Age Bracket | Public School | Private School |
| 3 to 4 Year Olds | 42 (52.5%) | 38 (47.5%) |
| 5 to 9 Year Old | 415 (88.1%) | 56 (11.9%) |
| 10 to 14 Year Olds | 404 (96.7%) | 14 (3.4%) |
| 15 to 17 Year Olds | 274 (100.0%) | 0 (0.0%) |
| 18 to 19 Year Olds | 61 (100.0%) | 0 (0.0%) |
| 20 to 24 Year Olds | 26 (22.2%) | 91 (77.8%) |
| 25 to 34 Year Olds | 43 (84.3%) | 8 (15.7%) |
| 35 Years and over | 12 (60.0%) | 8 (40.0%) |
| Total | 1,277 (85.6%) | 215 (14.4%) |
Educational Attainment by Field of Study in Jefferson County
Education (282 | 26.3%), bio, nature & agricultural (194 | 18.1%), business (159 | 14.8%), arts & humanities (102 | 9.5%), and social sciences (89 | 8.3%) are the most common fields of study among 1,073 individuals in Jefferson County who have obtained a bachelor's degree or higher.
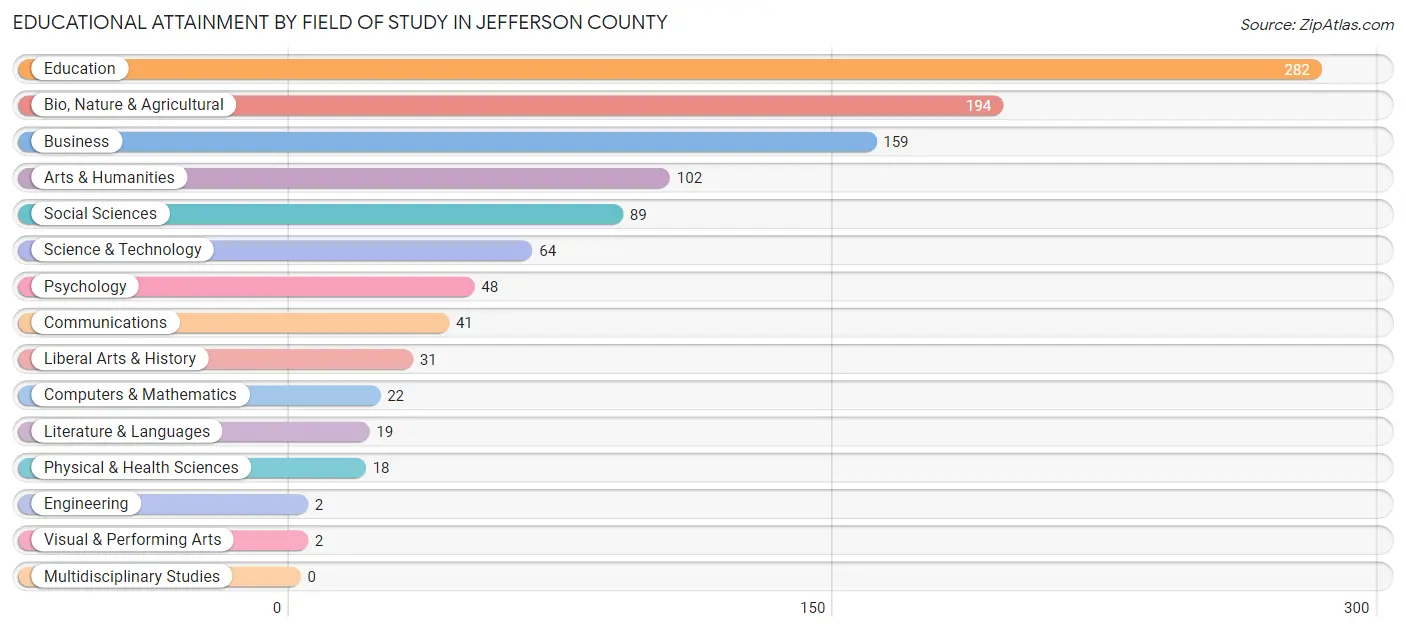
| Field of Study | # Graduates | % Graduates |
| Computers & Mathematics | 22 | 2.1% |
| Bio, Nature & Agricultural | 194 | 18.1% |
| Physical & Health Sciences | 18 | 1.7% |
| Psychology | 48 | 4.5% |
| Social Sciences | 89 | 8.3% |
| Engineering | 2 | 0.2% |
| Multidisciplinary Studies | 0 | 0.0% |
| Science & Technology | 64 | 6.0% |
| Business | 159 | 14.8% |
| Education | 282 | 26.3% |
| Literature & Languages | 19 | 1.8% |
| Liberal Arts & History | 31 | 2.9% |
| Visual & Performing Arts | 2 | 0.2% |
| Communications | 41 | 3.8% |
| Arts & Humanities | 102 | 9.5% |
| Total | 1,073 | 100.0% |
Transportation & Commute in Jefferson County
Vehicle Availability by Sex in Jefferson County
The most prevalent vehicle ownership categories in Jefferson County are males with 2 vehicles (624, accounting for 35.1%) and females with 2 vehicles (579, making up 37.9%).
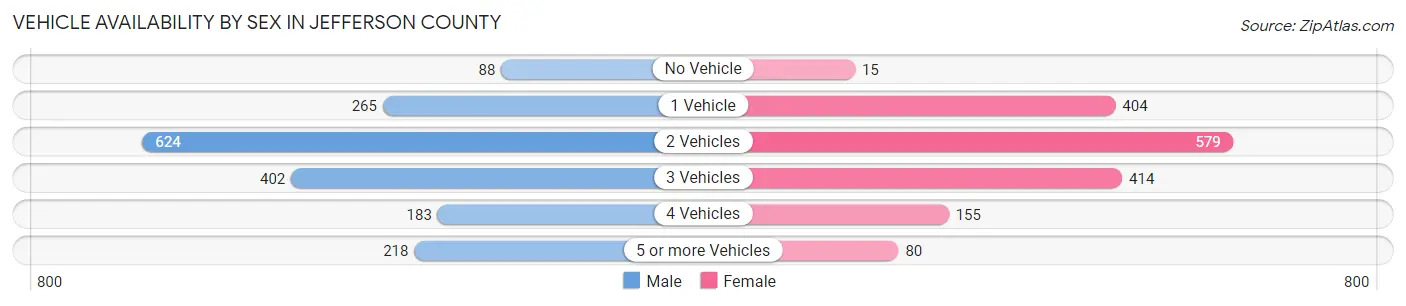
| Vehicles Available | Male | Female |
| No Vehicle | 88 (4.9%) | 15 (0.9%) |
| 1 Vehicle | 265 (14.9%) | 404 (24.5%) |
| 2 Vehicles | 624 (35.1%) | 579 (35.1%) |
| 3 Vehicles | 402 (22.6%) | 414 (25.1%) |
| 4 Vehicles | 183 (10.3%) | 155 (9.4%) |
| 5 or more Vehicles | 218 (12.2%) | 80 (4.9%) |
| Total | 1,780 (100.0%) | 1,647 (100.0%) |
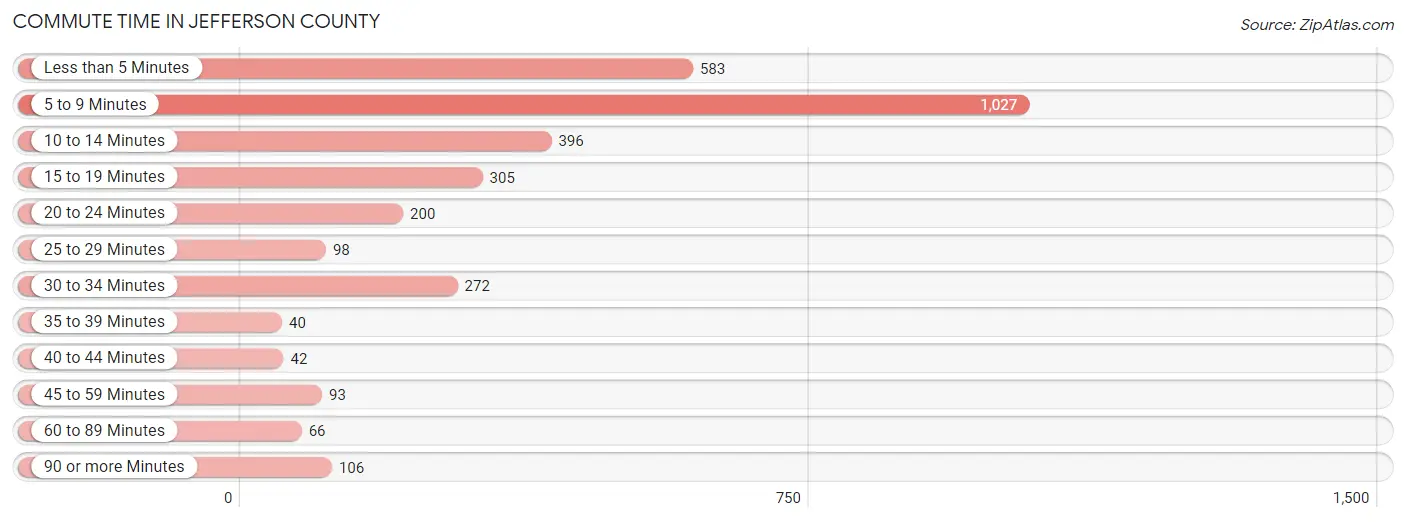
Commute Time in Jefferson County
The most frequently occuring commute durations in Jefferson County are 5 to 9 minutes (1,027 commuters, 31.8%), less than 5 minutes (583 commuters, 18.1%), and 10 to 14 minutes (396 commuters, 12.3%).
| Commute Time | # Commuters | % Commuters |
| Less than 5 Minutes | 583 | 18.1% |
| 5 to 9 Minutes | 1,027 | 31.8% |
| 10 to 14 Minutes | 396 | 12.3% |
| 15 to 19 Minutes | 305 | 9.5% |
| 20 to 24 Minutes | 200 | 6.2% |
| 25 to 29 Minutes | 98 | 3.0% |
| 30 to 34 Minutes | 272 | 8.4% |
| 35 to 39 Minutes | 40 | 1.2% |
| 40 to 44 Minutes | 42 | 1.3% |
| 45 to 59 Minutes | 93 | 2.9% |
| 60 to 89 Minutes | 66 | 2.0% |
| 90 or more Minutes | 106 | 3.3% |
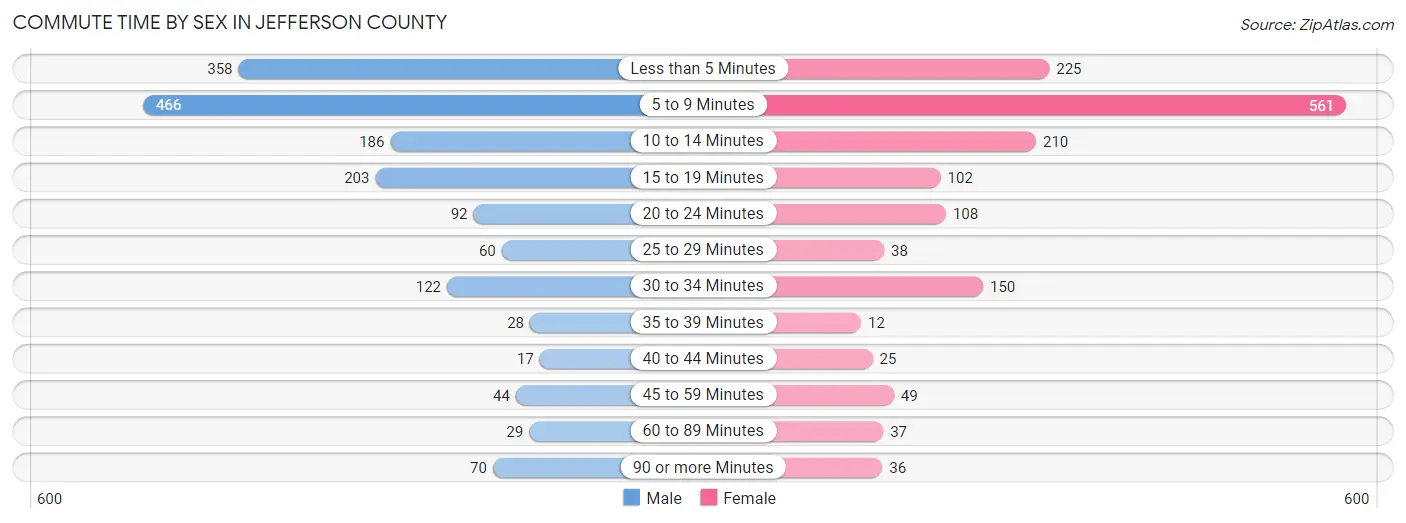
Commute Time by Sex in Jefferson County
The most common commute times in Jefferson County are 5 to 9 minutes (466 commuters, 27.8%) for males and 5 to 9 minutes (561 commuters, 36.1%) for females.
| Commute Time | Male | Female |
| Less than 5 Minutes | 358 (21.4%) | 225 (14.5%) |
| 5 to 9 Minutes | 466 (27.8%) | 561 (36.1%) |
| 10 to 14 Minutes | 186 (11.1%) | 210 (13.5%) |
| 15 to 19 Minutes | 203 (12.1%) | 102 (6.6%) |
| 20 to 24 Minutes | 92 (5.5%) | 108 (7.0%) |
| 25 to 29 Minutes | 60 (3.6%) | 38 (2.5%) |
| 30 to 34 Minutes | 122 (7.3%) | 150 (9.7%) |
| 35 to 39 Minutes | 28 (1.7%) | 12 (0.8%) |
| 40 to 44 Minutes | 17 (1.0%) | 25 (1.6%) |
| 45 to 59 Minutes | 44 (2.6%) | 49 (3.2%) |
| 60 to 89 Minutes | 29 (1.7%) | 37 (2.4%) |
| 90 or more Minutes | 70 (4.2%) | 36 (2.3%) |
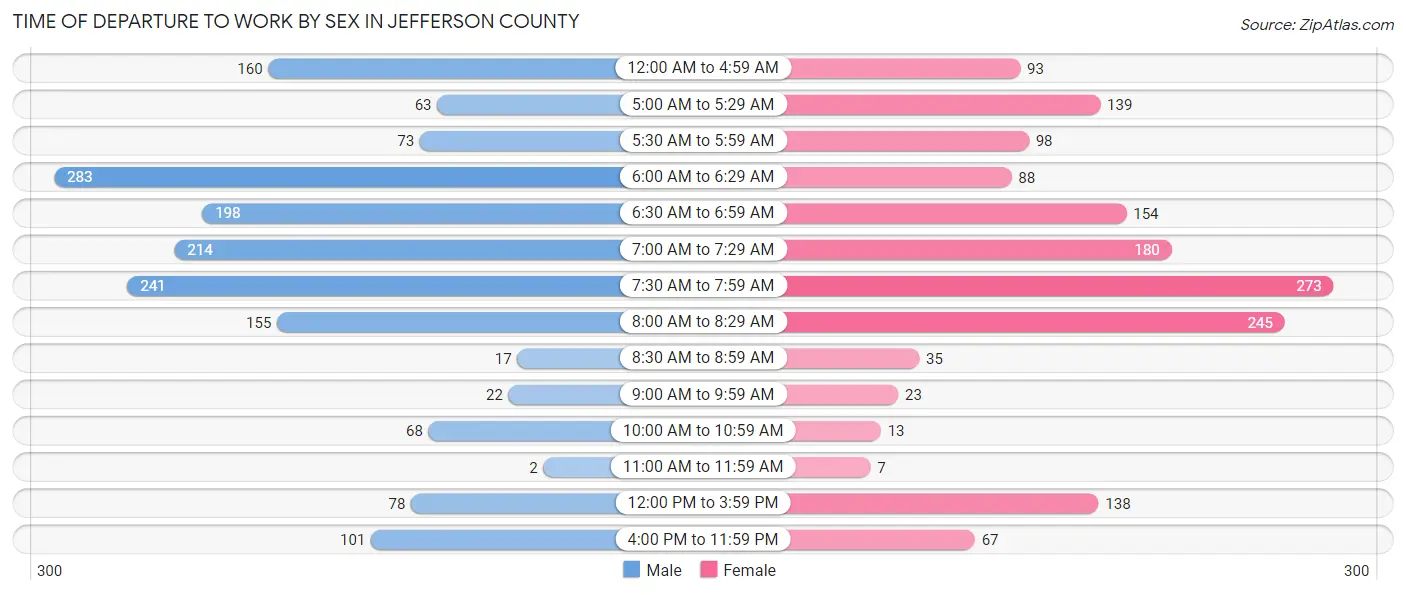
Time of Departure to Work by Sex in Jefferson County
The most frequent times of departure to work in Jefferson County are 6:00 AM to 6:29 AM (283, 16.9%) for males and 7:30 AM to 7:59 AM (273, 17.6%) for females.
| Time of Departure | Male | Female |
| 12:00 AM to 4:59 AM | 160 (9.6%) | 93 (6.0%) |
| 5:00 AM to 5:29 AM | 63 (3.8%) | 139 (8.9%) |
| 5:30 AM to 5:59 AM | 73 (4.4%) | 98 (6.3%) |
| 6:00 AM to 6:29 AM | 283 (16.9%) | 88 (5.7%) |
| 6:30 AM to 6:59 AM | 198 (11.8%) | 154 (9.9%) |
| 7:00 AM to 7:29 AM | 214 (12.8%) | 180 (11.6%) |
| 7:30 AM to 7:59 AM | 241 (14.4%) | 273 (17.6%) |
| 8:00 AM to 8:29 AM | 155 (9.2%) | 245 (15.8%) |
| 8:30 AM to 8:59 AM | 17 (1.0%) | 35 (2.2%) |
| 9:00 AM to 9:59 AM | 22 (1.3%) | 23 (1.5%) |
| 10:00 AM to 10:59 AM | 68 (4.1%) | 13 (0.8%) |
| 11:00 AM to 11:59 AM | 2 (0.1%) | 7 (0.4%) |
| 12:00 PM to 3:59 PM | 78 (4.7%) | 138 (8.9%) |
| 4:00 PM to 11:59 PM | 101 (6.0%) | 67 (4.3%) |
| Total | 1,675 (100.0%) | 1,553 (100.0%) |
Housing Occupancy in Jefferson County
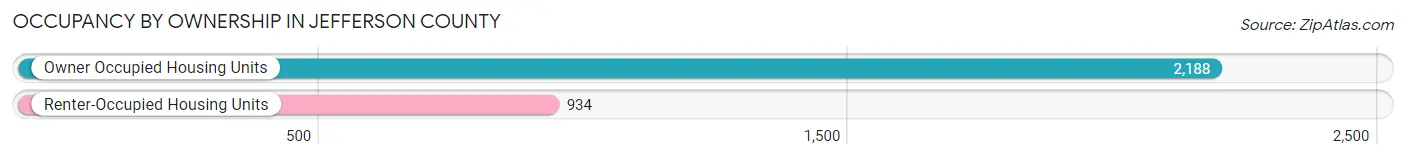
Occupancy by Ownership in Jefferson County
Of the total 3,122 dwellings in Jefferson County, owner-occupied units account for 2,188 (70.1%), while renter-occupied units make up 934 (29.9%).
| Occupancy | # Housing Units | % Housing Units |
| Owner Occupied Housing Units | 2,188 | 70.1% |
| Renter-Occupied Housing Units | 934 | 29.9% |
| Total Occupied Housing Units | 3,122 | 100.0% |
Occupancy by Household Size in Jefferson County
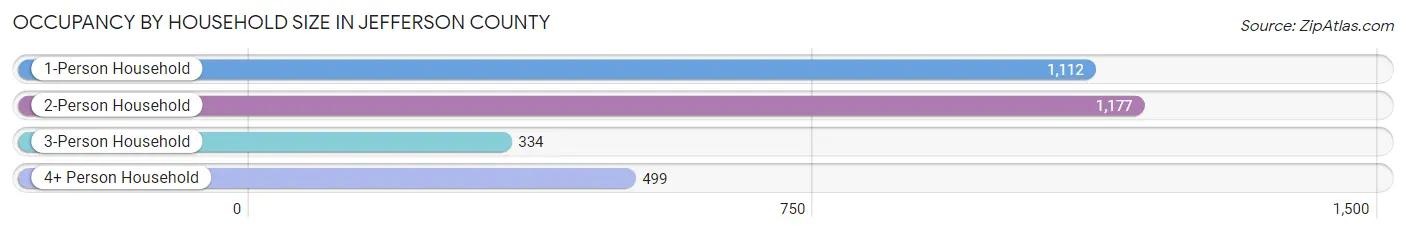
| Household Size | # Housing Units | % Housing Units |
| 1-Person Household | 1,112 | 35.6% |
| 2-Person Household | 1,177 | 37.7% |
| 3-Person Household | 334 | 10.7% |
| 4+ Person Household | 499 | 16.0% |
| Total Housing Units | 3,122 | 100.0% |
Occupancy by Ownership by Household Size in Jefferson County
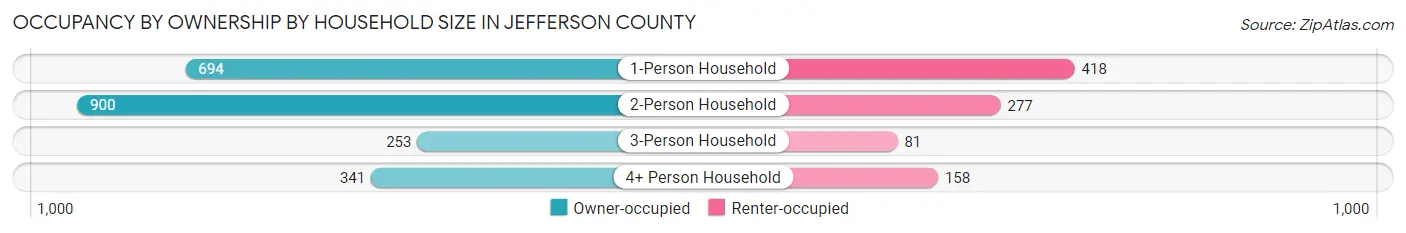
| Household Size | Owner-occupied | Renter-occupied |
| 1-Person Household | 694 (62.4%) | 418 (37.6%) |
| 2-Person Household | 900 (76.5%) | 277 (23.5%) |
| 3-Person Household | 253 (75.7%) | 81 (24.2%) |
| 4+ Person Household | 341 (68.3%) | 158 (31.7%) |
| Total Housing Units | 2,188 (70.1%) | 934 (29.9%) |
Occupancy by Educational Attainment in Jefferson County
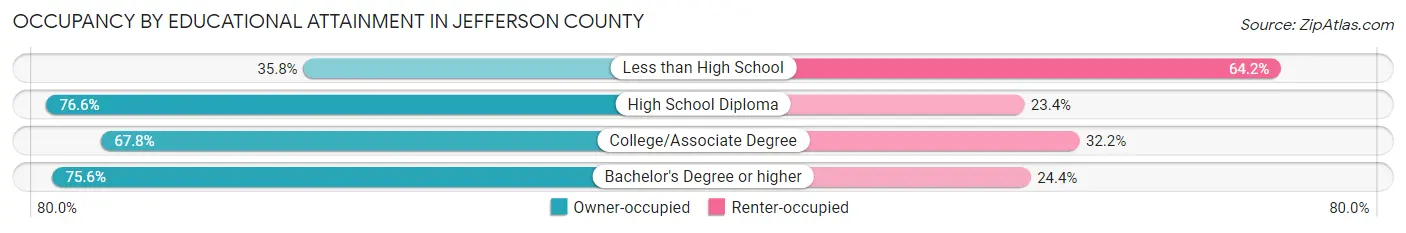
| Household Size | Owner-occupied | Renter-occupied |
| Less than High School | 88 (35.8%) | 158 (64.2%) |
| High School Diploma | 863 (76.6%) | 264 (23.4%) |
| College/Associate Degree | 742 (67.8%) | 352 (32.2%) |
| Bachelor's Degree or higher | 495 (75.6%) | 160 (24.4%) |
Occupancy by Age of Householder in Jefferson County
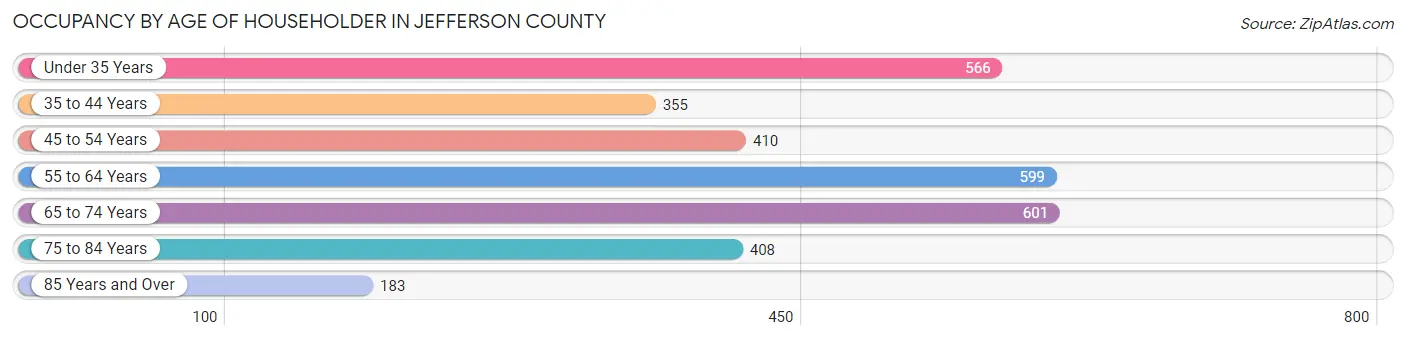
| Age Bracket | # Households | % Households |
| Under 35 Years | 566 | 18.1% |
| 35 to 44 Years | 355 | 11.4% |
| 45 to 54 Years | 410 | 13.1% |
| 55 to 64 Years | 599 | 19.2% |
| 65 to 74 Years | 601 | 19.3% |
| 75 to 84 Years | 408 | 13.1% |
| 85 Years and Over | 183 | 5.9% |
| Total | 3,122 | 100.0% |
Housing Finances in Jefferson County
Median Income by Occupancy in Jefferson County
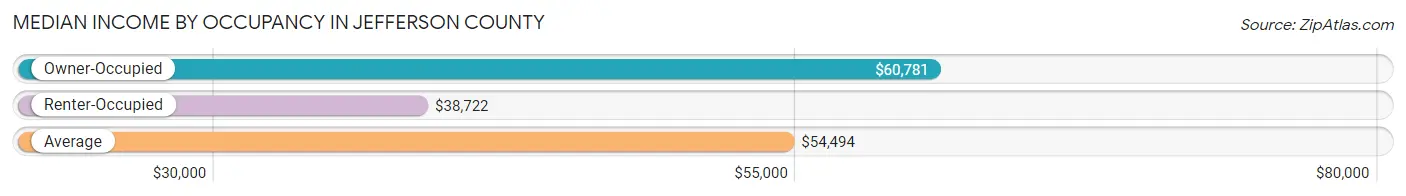
| Occupancy Type | # Households | Median Income |
| Owner-Occupied | 2,188 (70.1%) | $60,781 |
| Renter-Occupied | 934 (29.9%) | $38,722 |
| Average | 3,122 (100.0%) | $54,494 |
Occupancy by Householder Income Bracket in Jefferson County
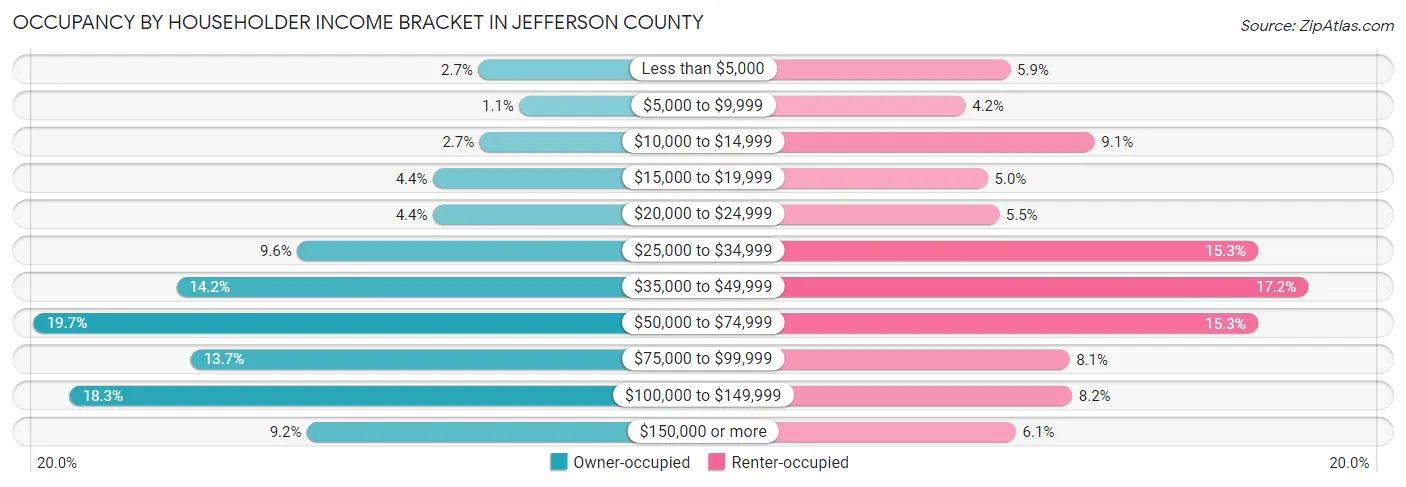
| Income Bracket | Owner-occupied | Renter-occupied |
| Less than $5,000 | 59 (2.7%) | 55 (5.9%) |
| $5,000 to $9,999 | 25 (1.1%) | 39 (4.2%) |
| $10,000 to $14,999 | 58 (2.6%) | 85 (9.1%) |
| $15,000 to $19,999 | 97 (4.4%) | 47 (5.0%) |
| $20,000 to $24,999 | 97 (4.4%) | 51 (5.5%) |
| $25,000 to $34,999 | 210 (9.6%) | 143 (15.3%) |
| $35,000 to $49,999 | 311 (14.2%) | 161 (17.2%) |
| $50,000 to $74,999 | 430 (19.7%) | 143 (15.3%) |
| $75,000 to $99,999 | 299 (13.7%) | 76 (8.1%) |
| $100,000 to $149,999 | 400 (18.3%) | 77 (8.2%) |
| $150,000 or more | 202 (9.2%) | 57 (6.1%) |
| Total | 2,188 (100.0%) | 934 (100.0%) |
Monthly Housing Cost Tiers in Jefferson County
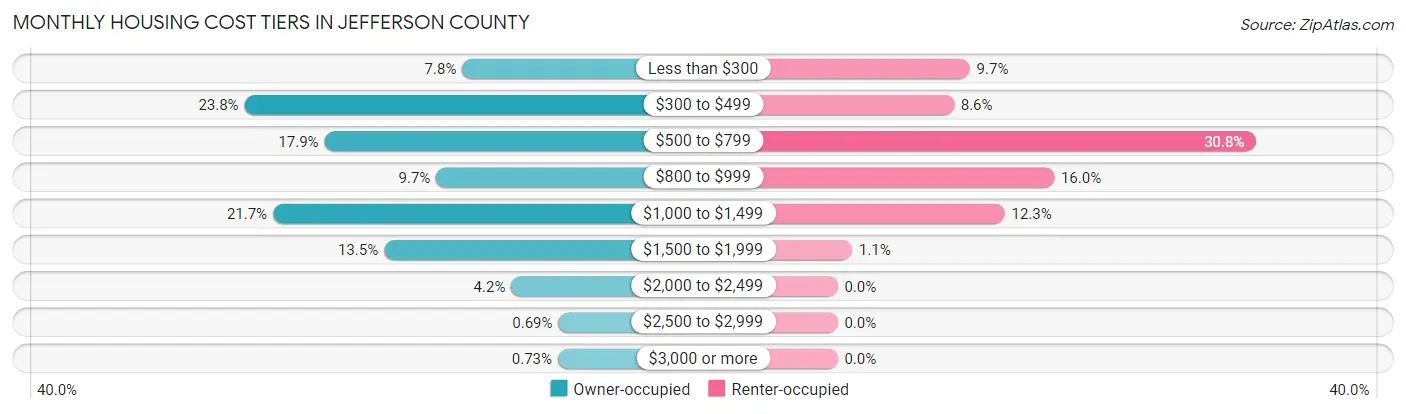
| Monthly Cost | Owner-occupied | Renter-occupied |
| Less than $300 | 170 (7.8%) | 91 (9.7%) |
| $300 to $499 | 521 (23.8%) | 80 (8.6%) |
| $500 to $799 | 392 (17.9%) | 288 (30.8%) |
| $800 to $999 | 212 (9.7%) | 149 (16.0%) |
| $1,000 to $1,499 | 475 (21.7%) | 115 (12.3%) |
| $1,500 to $1,999 | 296 (13.5%) | 10 (1.1%) |
| $2,000 to $2,499 | 91 (4.2%) | 0 (0.0%) |
| $2,500 to $2,999 | 15 (0.7%) | 0 (0.0%) |
| $3,000 or more | 16 (0.7%) | 0 (0.0%) |
| Total | 2,188 (100.0%) | 934 (100.0%) |
Physical Housing Characteristics in Jefferson County
Housing Structures in Jefferson County
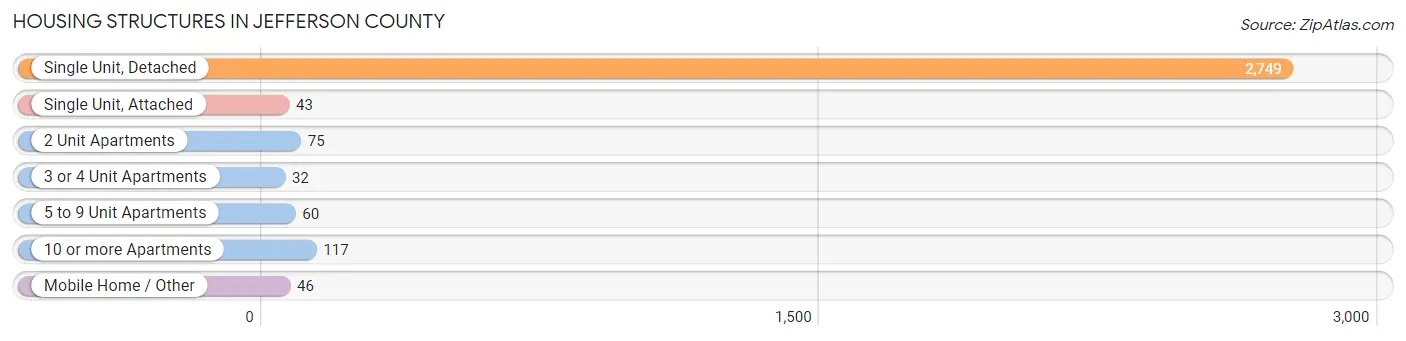
| Structure Type | # Housing Units | % Housing Units |
| Single Unit, Detached | 2,749 | 88.0% |
| Single Unit, Attached | 43 | 1.4% |
| 2 Unit Apartments | 75 | 2.4% |
| 3 or 4 Unit Apartments | 32 | 1.0% |
| 5 to 9 Unit Apartments | 60 | 1.9% |
| 10 or more Apartments | 117 | 3.7% |
| Mobile Home / Other | 46 | 1.5% |
| Total | 3,122 | 100.0% |
Housing Structures by Occupancy in Jefferson County
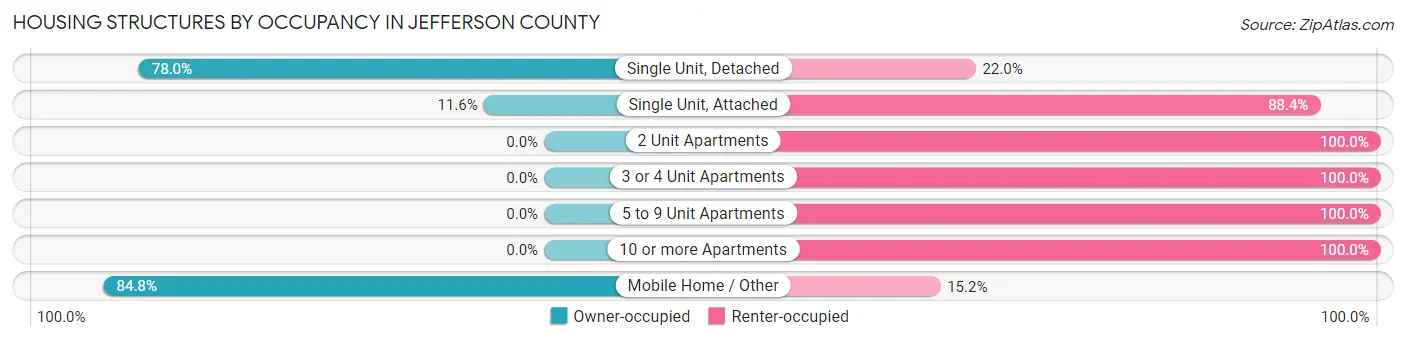
| Structure Type | Owner-occupied | Renter-occupied |
| Single Unit, Detached | 2,144 (78.0%) | 605 (22.0%) |
| Single Unit, Attached | 5 (11.6%) | 38 (88.4%) |
| 2 Unit Apartments | 0 (0.0%) | 75 (100.0%) |
| 3 or 4 Unit Apartments | 0 (0.0%) | 32 (100.0%) |
| 5 to 9 Unit Apartments | 0 (0.0%) | 60 (100.0%) |
| 10 or more Apartments | 0 (0.0%) | 117 (100.0%) |
| Mobile Home / Other | 39 (84.8%) | 7 (15.2%) |
| Total | 2,188 (70.1%) | 934 (29.9%) |
Housing Structures by Number of Rooms in Jefferson County
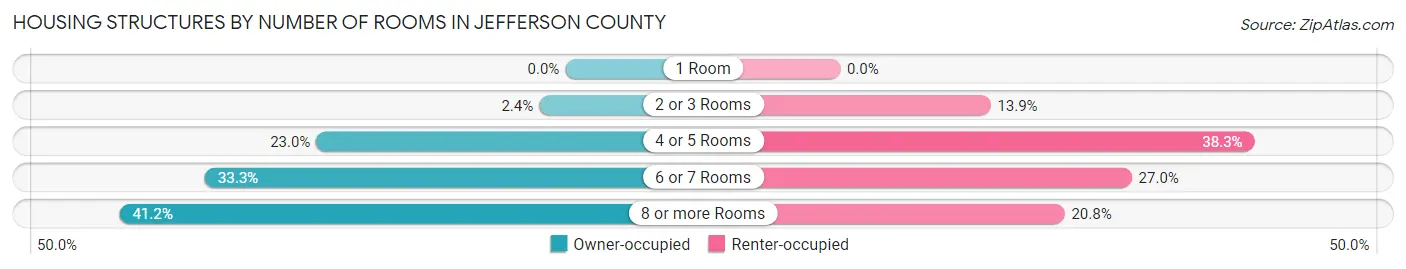
| Number of Rooms | Owner-occupied | Renter-occupied |
| 1 Room | 0 (0.0%) | 0 (0.0%) |
| 2 or 3 Rooms | 53 (2.4%) | 130 (13.9%) |
| 4 or 5 Rooms | 504 (23.0%) | 358 (38.3%) |
| 6 or 7 Rooms | 729 (33.3%) | 252 (27.0%) |
| 8 or more Rooms | 902 (41.2%) | 194 (20.8%) |
| Total | 2,188 (100.0%) | 934 (100.0%) |
Housing Structure by Heating Type in Jefferson County
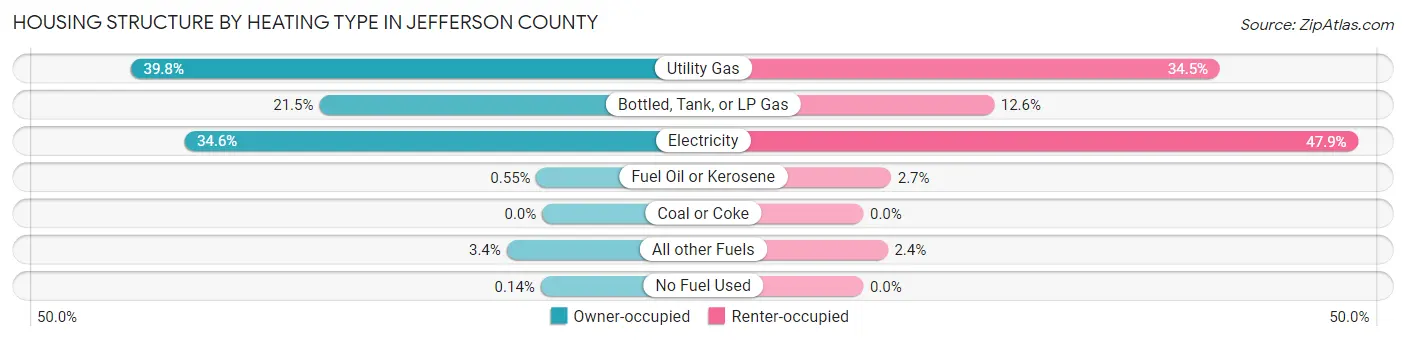
| Heating Type | Owner-occupied | Renter-occupied |
| Utility Gas | 870 (39.8%) | 322 (34.5%) |
| Bottled, Tank, or LP Gas | 471 (21.5%) | 118 (12.6%) |
| Electricity | 757 (34.6%) | 447 (47.9%) |
| Fuel Oil or Kerosene | 12 (0.5%) | 25 (2.7%) |
| Coal or Coke | 0 (0.0%) | 0 (0.0%) |
| All other Fuels | 75 (3.4%) | 22 (2.4%) |
| No Fuel Used | 3 (0.1%) | 0 (0.0%) |
| Total | 2,188 (100.0%) | 934 (100.0%) |
Household Vehicle Usage in Jefferson County
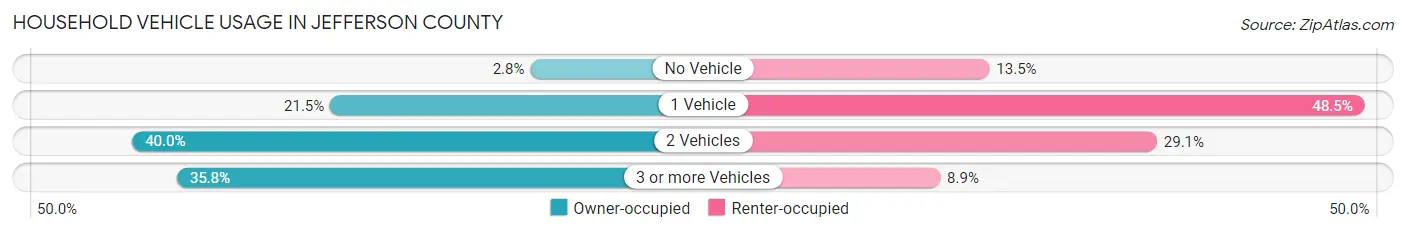
| Vehicles per Household | Owner-occupied | Renter-occupied |
| No Vehicle | 61 (2.8%) | 126 (13.5%) |
| 1 Vehicle | 470 (21.5%) | 453 (48.5%) |
| 2 Vehicles | 874 (40.0%) | 272 (29.1%) |
| 3 or more Vehicles | 783 (35.8%) | 83 (8.9%) |
| Total | 2,188 (100.0%) | 934 (100.0%) |
Real Estate & Mortgages in Jefferson County
Real Estate and Mortgage Overview in Jefferson County
| Characteristic | Without Mortgage | With Mortgage |
| Housing Units | 1,231 | 957 |
| Median Property Value | $89,900 | $137,000 |
| Median Household Income | $50,179 | $109 |
| Monthly Housing Costs | $476 | $16 |
| Real Estate Taxes | $1,473 | $33 |
Property Value by Mortgage Status in Jefferson County
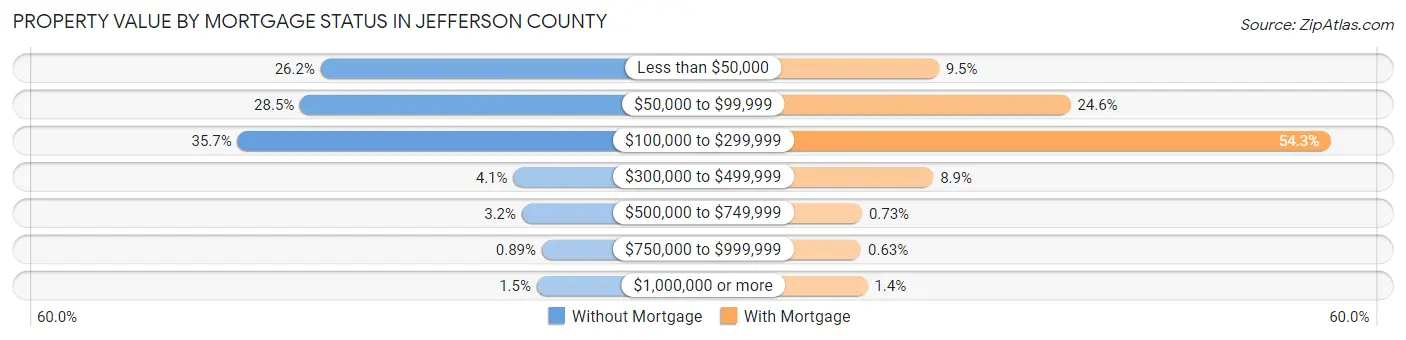
| Property Value | Without Mortgage | With Mortgage |
| Less than $50,000 | 322 (26.2%) | 91 (9.5%) |
| $50,000 to $99,999 | 351 (28.5%) | 235 (24.6%) |
| $100,000 to $299,999 | 439 (35.7%) | 520 (54.3%) |
| $300,000 to $499,999 | 51 (4.1%) | 85 (8.9%) |
| $500,000 to $749,999 | 39 (3.2%) | 7 (0.7%) |
| $750,000 to $999,999 | 11 (0.9%) | 6 (0.6%) |
| $1,000,000 or more | 18 (1.5%) | 13 (1.4%) |
| Total | 1,231 (100.0%) | 957 (100.0%) |
Household Income by Mortgage Status in Jefferson County
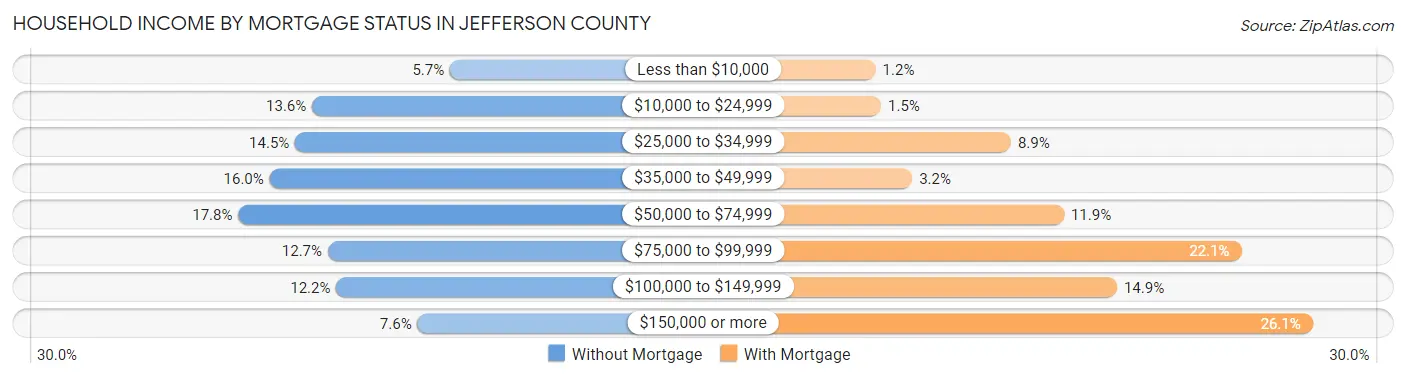
| Household Income | Without Mortgage | With Mortgage |
| Less than $10,000 | 70 (5.7%) | 11 (1.1%) |
| $10,000 to $24,999 | 167 (13.6%) | 14 (1.5%) |
| $25,000 to $34,999 | 179 (14.5%) | 85 (8.9%) |
| $35,000 to $49,999 | 197 (16.0%) | 31 (3.2%) |
| $50,000 to $74,999 | 219 (17.8%) | 114 (11.9%) |
| $75,000 to $99,999 | 156 (12.7%) | 211 (22.1%) |
| $100,000 to $149,999 | 150 (12.2%) | 143 (14.9%) |
| $150,000 or more | 93 (7.5%) | 250 (26.1%) |
| Total | 1,231 (100.0%) | 957 (100.0%) |
Property Value to Household Income Ratio in Jefferson County
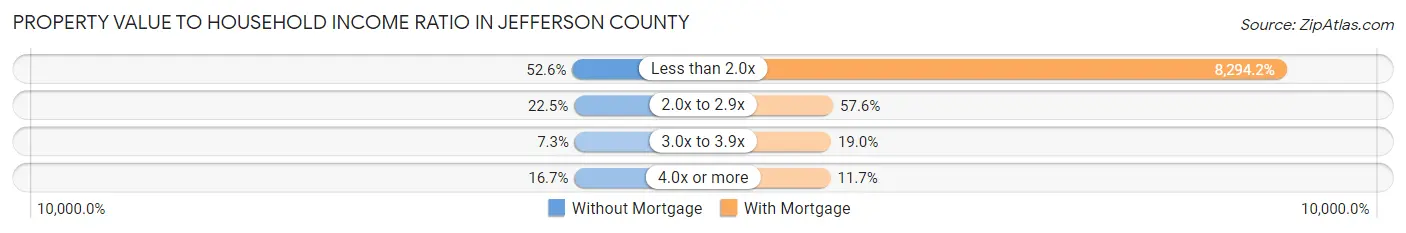
| Value-to-Income Ratio | Without Mortgage | With Mortgage |
| Less than 2.0x | 647 (52.6%) | 79,375 (8,294.2%) |
| 2.0x to 2.9x | 277 (22.5%) | 551 (57.6%) |
| 3.0x to 3.9x | 90 (7.3%) | 182 (19.0%) |
| 4.0x or more | 205 (16.7%) | 112 (11.7%) |
| Total | 1,231 (100.0%) | 957 (100.0%) |
Real Estate Taxes by Mortgage Status in Jefferson County
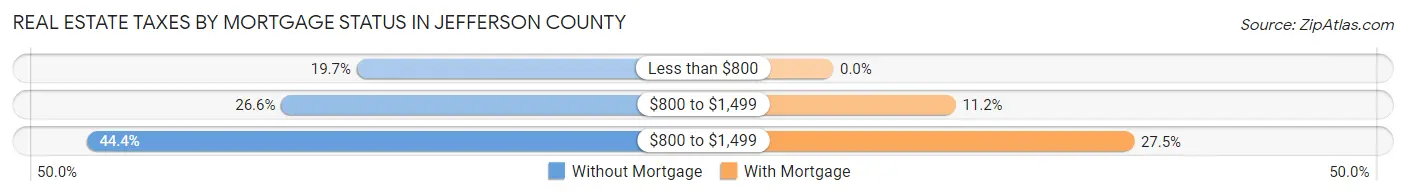
| Property Taxes | Without Mortgage | With Mortgage |
| Less than $800 | 242 (19.7%) | 0 (0.0%) |
| $800 to $1,499 | 327 (26.6%) | 107 (11.2%) |
| $800 to $1,499 | 546 (44.4%) | 263 (27.5%) |
| Total | 1,231 (100.0%) | 957 (100.0%) |
Health & Disability in Jefferson County
Health Insurance Coverage by Age in Jefferson County
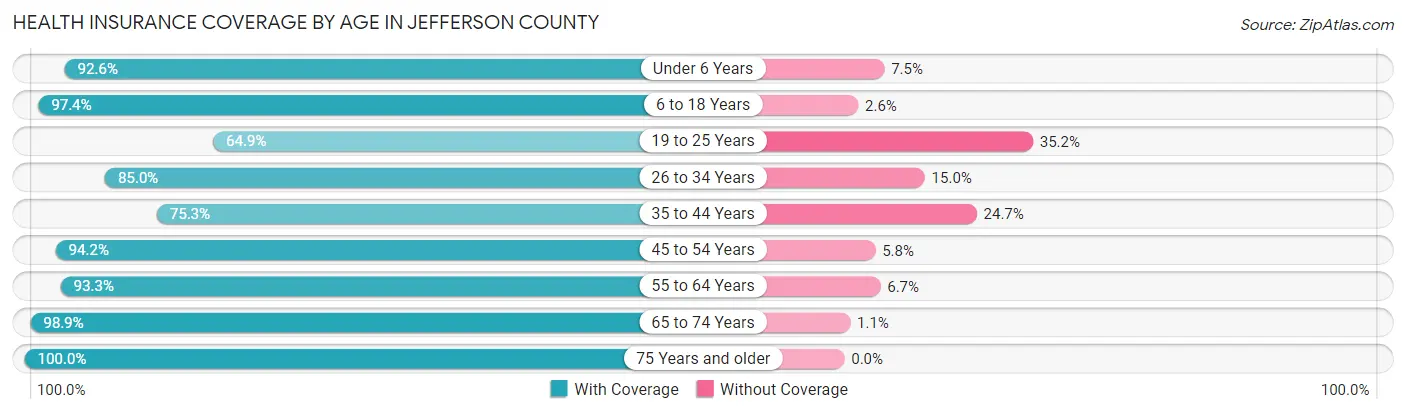
| Age Bracket | With Coverage | Without Coverage |
| Under 6 Years | 472 (92.5%) | 38 (7.4%) |
| 6 to 18 Years | 1,100 (97.4%) | 29 (2.6%) |
| 19 to 25 Years | 297 (64.8%) | 161 (35.1%) |
| 26 to 34 Years | 567 (85.0%) | 100 (15.0%) |
| 35 to 44 Years | 568 (75.3%) | 186 (24.7%) |
| 45 to 54 Years | 719 (94.2%) | 44 (5.8%) |
| 55 to 64 Years | 1,029 (93.3%) | 74 (6.7%) |
| 65 to 74 Years | 920 (98.9%) | 10 (1.1%) |
| 75 Years and older | 763 (100.0%) | 0 (0.0%) |
| Total | 6,435 (90.9%) | 642 (9.1%) |
Health Insurance Coverage by Citizenship Status in Jefferson County
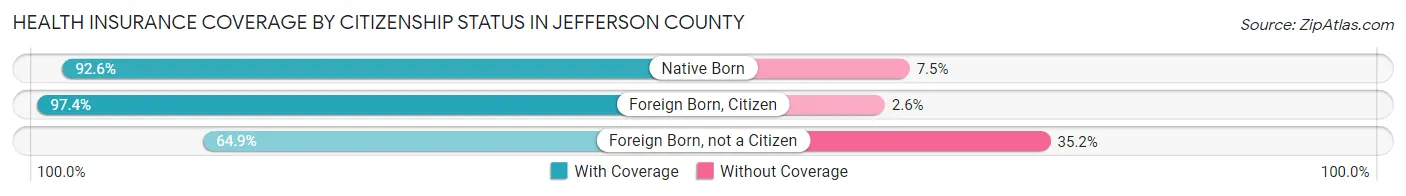
| Citizenship Status | With Coverage | Without Coverage |
| Native Born | 472 (92.5%) | 38 (7.4%) |
| Foreign Born, Citizen | 1,100 (97.4%) | 29 (2.6%) |
| Foreign Born, not a Citizen | 297 (64.8%) | 161 (35.1%) |
Health Insurance Coverage by Household Income in Jefferson County
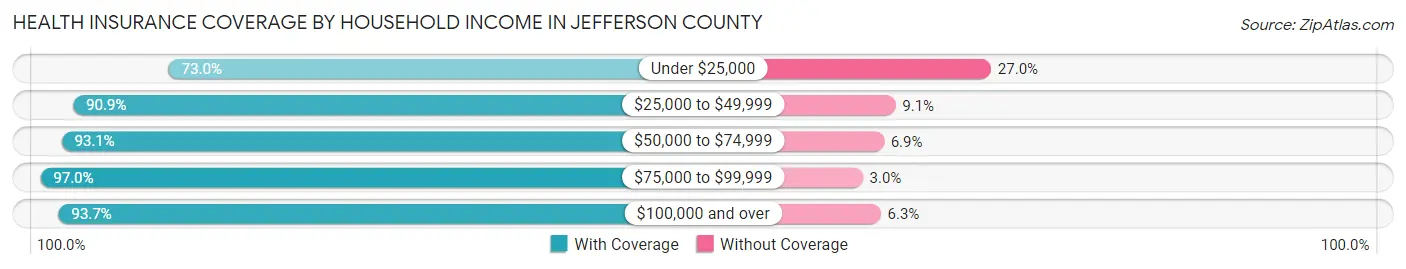
| Household Income | With Coverage | Without Coverage |
| Under $25,000 | 619 (73.0%) | 229 (27.0%) |
| $25,000 to $49,999 | 1,270 (90.9%) | 127 (9.1%) |
| $50,000 to $74,999 | 1,454 (93.1%) | 108 (6.9%) |
| $75,000 to $99,999 | 886 (97.0%) | 27 (3.0%) |
| $100,000 and over | 2,201 (93.7%) | 149 (6.3%) |
Public vs Private Health Insurance Coverage by Age in Jefferson County
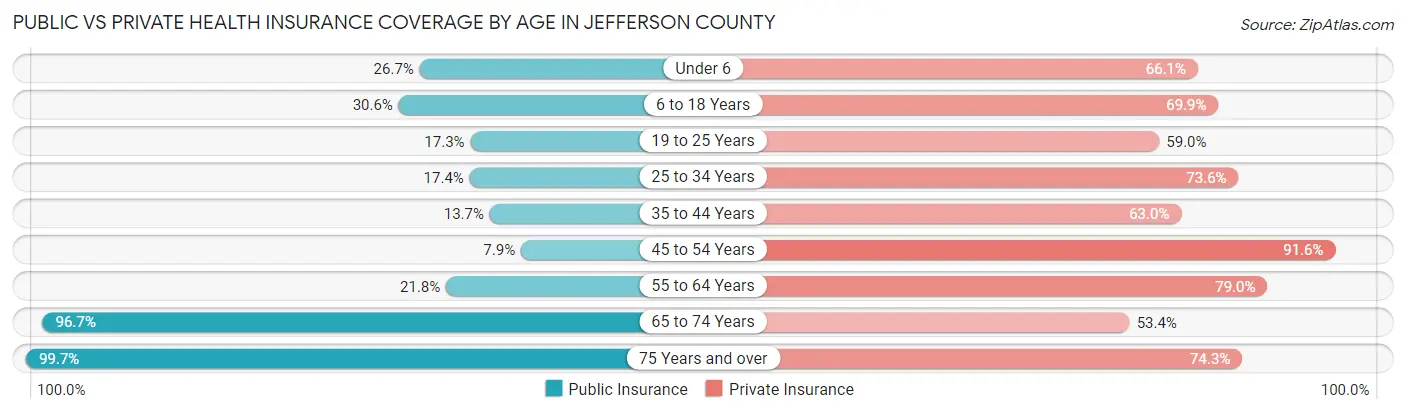
| Age Bracket | Public Insurance | Private Insurance |
| Under 6 | 136 (26.7%) | 337 (66.1%) |
| 6 to 18 Years | 345 (30.6%) | 789 (69.9%) |
| 19 to 25 Years | 79 (17.2%) | 270 (59.0%) |
| 25 to 34 Years | 116 (17.4%) | 491 (73.6%) |
| 35 to 44 Years | 103 (13.7%) | 475 (63.0%) |
| 45 to 54 Years | 60 (7.9%) | 699 (91.6%) |
| 55 to 64 Years | 240 (21.8%) | 871 (79.0%) |
| 65 to 74 Years | 899 (96.7%) | 497 (53.4%) |
| 75 Years and over | 761 (99.7%) | 567 (74.3%) |
| Total | 2,739 (38.7%) | 4,996 (70.6%) |
Disability Status by Sex by Age in Jefferson County
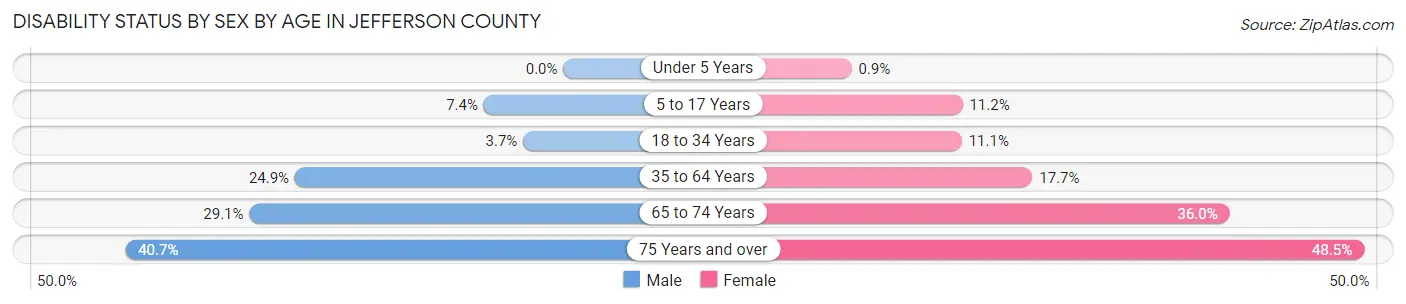
| Age Bracket | Male | Female |
| Under 5 Years | 0 (0.0%) | 2 (0.9%) |
| 5 to 17 Years | 43 (7.4%) | 67 (11.2%) |
| 18 to 34 Years | 20 (3.7%) | 72 (11.1%) |
| 35 to 64 Years | 337 (24.9%) | 224 (17.7%) |
| 65 to 74 Years | 139 (29.1%) | 163 (36.0%) |
| 75 Years and over | 124 (40.7%) | 222 (48.5%) |
Disability Class by Sex by Age in Jefferson County
Disability Class: Hearing Difficulty
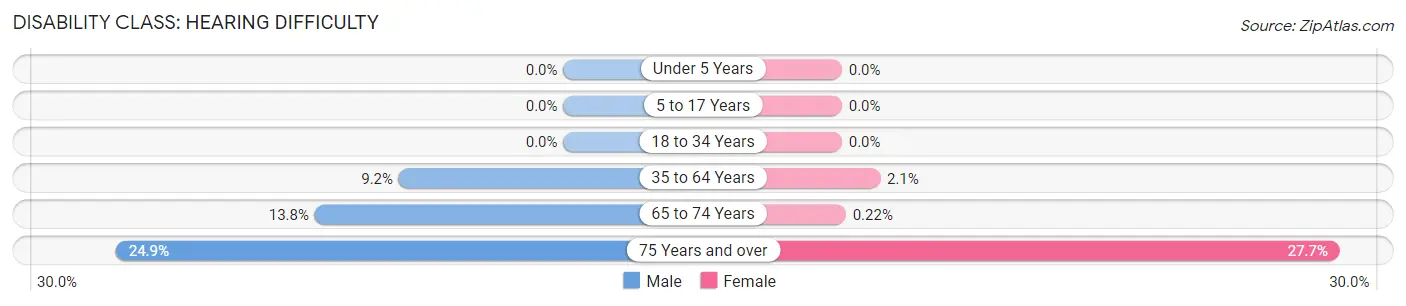
| Age Bracket | Male | Female |
| Under 5 Years | 0 (0.0%) | 0 (0.0%) |
| 5 to 17 Years | 0 (0.0%) | 0 (0.0%) |
| 18 to 34 Years | 0 (0.0%) | 0 (0.0%) |
| 35 to 64 Years | 124 (9.2%) | 27 (2.1%) |
| 65 to 74 Years | 66 (13.8%) | 1 (0.2%) |
| 75 Years and over | 76 (24.9%) | 127 (27.7%) |
Disability Class: Vision Difficulty
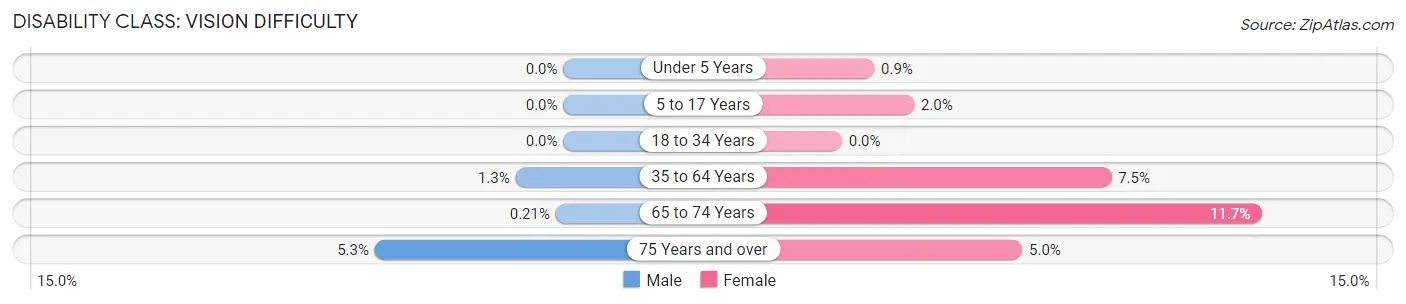
| Age Bracket | Male | Female |
| Under 5 Years | 0 (0.0%) | 2 (0.9%) |
| 5 to 17 Years | 0 (0.0%) | 12 (2.0%) |
| 18 to 34 Years | 0 (0.0%) | 0 (0.0%) |
| 35 to 64 Years | 18 (1.3%) | 95 (7.5%) |
| 65 to 74 Years | 1 (0.2%) | 53 (11.7%) |
| 75 Years and over | 16 (5.2%) | 23 (5.0%) |
Disability Class: Cognitive Difficulty
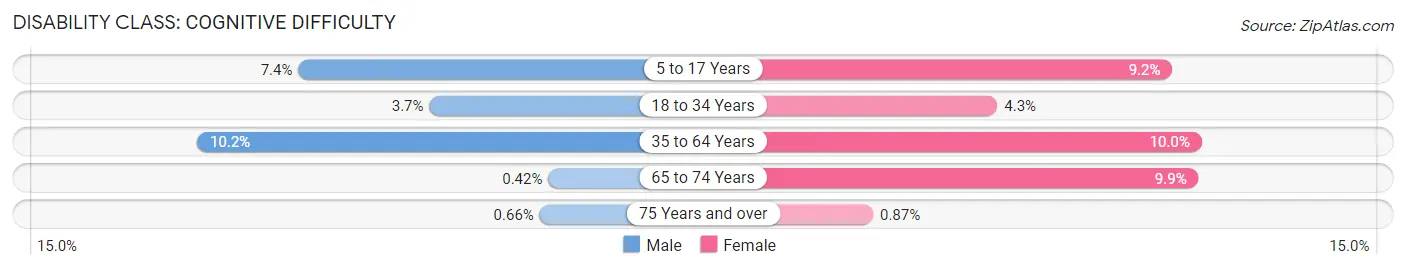
| Age Bracket | Male | Female |
| 5 to 17 Years | 43 (7.4%) | 55 (9.2%) |
| 18 to 34 Years | 20 (3.7%) | 28 (4.3%) |
| 35 to 64 Years | 138 (10.2%) | 127 (10.0%) |
| 65 to 74 Years | 2 (0.4%) | 45 (9.9%) |
| 75 Years and over | 2 (0.7%) | 4 (0.9%) |
Disability Class: Ambulatory Difficulty
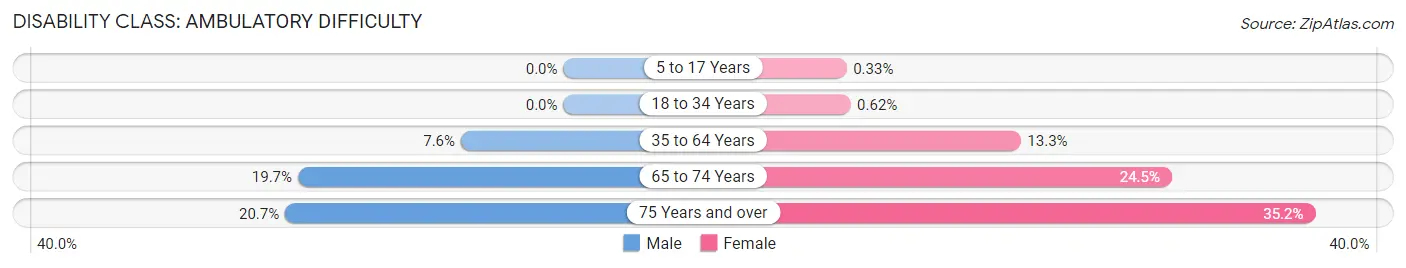
| Age Bracket | Male | Female |
| 5 to 17 Years | 0 (0.0%) | 2 (0.3%) |
| 18 to 34 Years | 0 (0.0%) | 4 (0.6%) |
| 35 to 64 Years | 103 (7.6%) | 168 (13.3%) |
| 65 to 74 Years | 94 (19.7%) | 111 (24.5%) |
| 75 Years and over | 63 (20.7%) | 161 (35.1%) |
Disability Class: Self-Care Difficulty
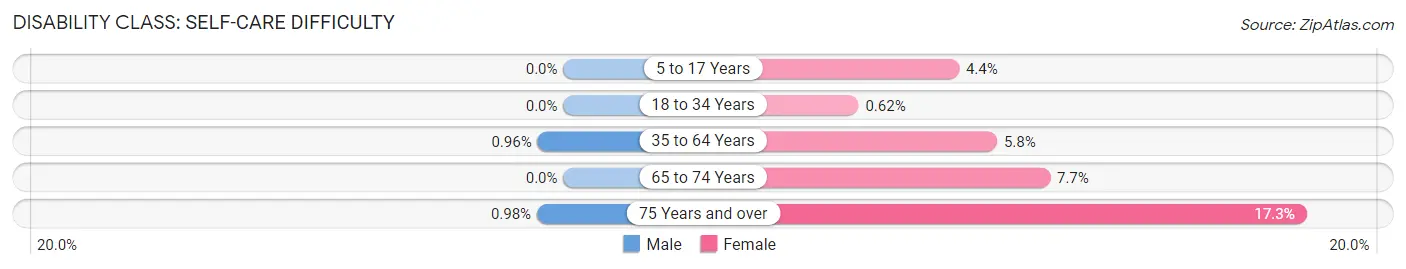
| Age Bracket | Male | Female |
| 5 to 17 Years | 0 (0.0%) | 26 (4.3%) |
| 18 to 34 Years | 0 (0.0%) | 4 (0.6%) |
| 35 to 64 Years | 13 (1.0%) | 73 (5.8%) |
| 65 to 74 Years | 0 (0.0%) | 35 (7.7%) |
| 75 Years and over | 3 (1.0%) | 79 (17.2%) |
Technology Access in Jefferson County
Computing Device Access in Jefferson County
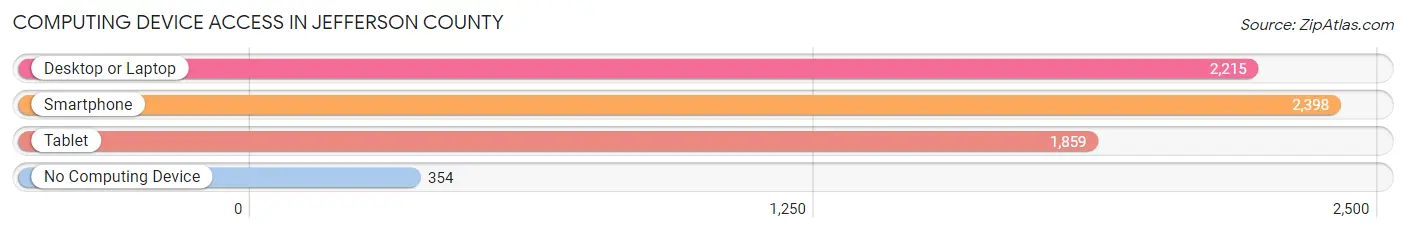
| Device Type | # Households | % Households |
| Desktop or Laptop | 2,215 | 71.0% |
| Smartphone | 2,398 | 76.8% |
| Tablet | 1,859 | 59.6% |
| No Computing Device | 354 | 11.3% |
| Total | 3,122 | 100.0% |
Internet Access in Jefferson County
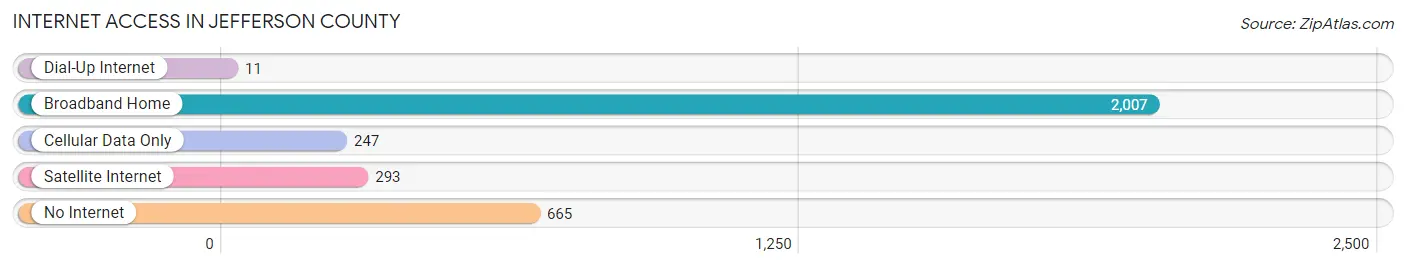
| Internet Type | # Households | % Households |
| Dial-Up Internet | 11 | 0.4% |
| Broadband Home | 2,007 | 64.3% |
| Cellular Data Only | 247 | 7.9% |
| Satellite Internet | 293 | 9.4% |
| No Internet | 665 | 21.3% |
| Total | 3,122 | 100.0% |
Jefferson County Summary
Jefferson County, Nebraska is located in the southeastern corner of the state and is bordered by Gage, Saline, Thayer, and Lancaster counties. It is part of the Lincoln, Nebraska Metropolitan Statistical Area. The county was established in 1854 and named after Thomas Jefferson, the third president of the United States. As of the 2010 census, the population was 7,567, making it the second least populous county in Nebraska.
Geography
Jefferson County is located in the southeastern corner of Nebraska and is bordered by Gage, Saline, Thayer, and Lancaster counties. It is part of the Lincoln, Nebraska Metropolitan Statistical Area. The county has a total area of 576 square miles, of which 575 square miles is land and 1 square mile is water. The county is mostly flat with some rolling hills. The highest point in the county is located in the northwest corner at an elevation of 1,400 feet. The county is drained by the Big Blue River, which flows through the center of the county.
Demographics
As of the 2010 census, there were 7,567 people, 2,845 households, and 1,945 families residing in the county. The population density was 13 people per square mile. There were 3,093 housing units at an average density of 5 per square mile. The racial makeup of the county was 97.3% White, 0.3% Black or African American, 0.3% Native American, 0.2% Asian, 0.1% Pacific Islander, 0.7% from other races, and 1.1% from two or more races. Hispanic or Latino of any race were 2.2% of the population.
There were 2,845 households, out of which 32.2% had children under the age of 18 living with them, 57.2% were married couples living together, 7.7% had a female householder with no husband present, and 31.2% were non-families. 26.7% of all households were made up of individuals, and 12.2% had someone living alone who was 65 years of age or older. The average household size was 2.54 and the average family size was 3.09.
The median age in the county was 38.7 years. 25.7% of residents were under the age of 18; 6.7% were between the ages of 18 and 24; 24.2% were from 25 to 44; 27.2% were from 45 to 64; and 16.2% were 65 years of age or older. The gender makeup of the county was 49.2% male and 50.8% female.
Economy
Jefferson County is largely an agricultural county, with the majority of the land being used for farming and ranching. The county is home to several large farms, including the largest dairy farm in the state. The county also has a large number of small family farms. The county is also home to several small businesses, including a few restaurants, a few retail stores, and a few service businesses.
The county is home to a few manufacturing companies, including a plastics manufacturer and a metal fabrication company. The county is also home to a few technology companies, including a software development company and a web design company.
The county is served by two airports, one in Fairbury and one in Diller. The county is also served by two railroads, the Burlington Northern Santa Fe and the Union Pacific.
The median household income in the county was $45,845 in 2018. The median home value was $117,400 in 2018. The unemployment rate was 2.7% in 2018.
Conclusion
Jefferson County, Nebraska is a rural county located in the southeastern corner of the state. It is part of the Lincoln, Nebraska Metropolitan Statistical Area. The county was established in 1854 and named after Thomas Jefferson, the third president of the United States. As of the 2010 census, the population was 7,567, making it the second least populous county in Nebraska. The county is mostly flat with some rolling hills and is drained by the Big Blue River. The county is largely an agricultural county, with the majority of the land being used for farming and ranching. The county is also home to several small businesses, manufacturing companies, and technology companies. The median household income in the county was $45,845 in 2018 and the median home value was $117,400 in 2018.
Common Questions
What is Per Capita Income in Jefferson County?
Per Capita income in Jefferson County is $30,363.
What is the Median Family Income in Jefferson County?
Median Family Income in Jefferson County is $70,764.
What is the Median Household income in Jefferson County?
Median Household Income in Jefferson County is $54,494.
What is Income or Wage Gap in Jefferson County?
Income or Wage Gap in Jefferson County is 29.9%.
Women in Jefferson County earn 70.1 cents for every dollar earned by a man.
What is Inequality or Gini Index in Jefferson County?
Inequality or Gini Index in Jefferson County is 0.42.
What is the Total Population of Jefferson County?
Total Population of Jefferson County is 7,185.
What is the Total Male Population of Jefferson County?
Total Male Population of Jefferson County is 3,475.
What is the Total Female Population of Jefferson County?
Total Female Population of Jefferson County is 3,710.
What is the Ratio of Males per 100 Females in Jefferson County?
There are 93.67 Males per 100 Females in Jefferson County.
What is the Ratio of Females per 100 Males in Jefferson County?
There are 106.76 Females per 100 Males in Jefferson County.
What is the Median Population Age in Jefferson County?
Median Population Age in Jefferson County is 45.8 Years.
What is the Average Family Size in Jefferson County
Average Family Size in Jefferson County is 3.0 People.
What is the Average Household Size in Jefferson County
Average Household Size in Jefferson County is 2.3 People.
How Large is the Labor Force in Jefferson County?
There are 3,517 People in the Labor Forcein in Jefferson County.
What is the Percentage of People in the Labor Force in Jefferson County?
60.8% of People are in the Labor Force in Jefferson County.
What is the Unemployment Rate in Jefferson County?
Unemployment Rate in Jefferson County is 1.1%.