Hitchcock County, NE Map & Demographics
Hitchcock County Map
Hitchcock County Overview
$30,595
PER CAPITA INCOME
$68,702
AVG FAMILY INCOME
$49,456
AVG HOUSEHOLD INCOME
10.5%
WAGE / INCOME GAP [ % ]
89.5¢/ $1
WAGE / INCOME GAP [ $ ]
0.47
INEQUALITY / GINI INDEX
2,620
TOTAL POPULATION
1,352
MALE POPULATION
1,268
FEMALE POPULATION
106.62
MALES / 100 FEMALES
93.79
FEMALES / 100 MALES
43.3
MEDIAN AGE
3.1
AVG FAMILY SIZE
2.3
AVG HOUSEHOLD SIZE
1,208
LABOR FORCE [ PEOPLE ]
58.5%
PERCENT IN LABOR FORCE
1.9%
UNEMPLOYMENT RATE
Hitchcock County Area Codes
Income in Hitchcock County
Income Overview in Hitchcock County
Per Capita Income in Hitchcock County is $30,595, while median incomes of families and households are $68,702 and $49,456 respectively.
| Characteristic | Number | Measure |
| Per Capita Income | 2,620 | $30,595 |
| Median Family Income | 665 | $68,702 |
| Mean Family Income | 665 | $88,313 |
| Median Household Income | 1,109 | $49,456 |
| Mean Household Income | 1,109 | $69,763 |
| Income Deficit | 665 | $0 |
| Wage / Income Gap (%) | 2,620 | 10.51% |
| Wage / Income Gap ($) | 2,620 | 89.49¢ per $1 |
| Gini / Inequality Index | 2,620 | 0.47 |
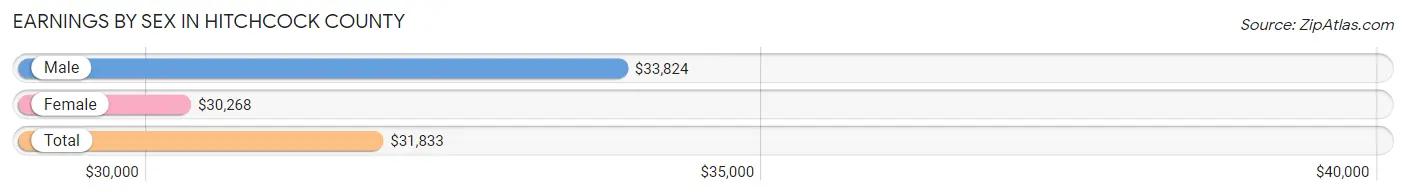
Earnings by Sex in Hitchcock County
Average Earnings in Hitchcock County are $31,833, $33,824 for men and $30,268 for women, a difference of 10.5%.
| Sex | Number | Average Earnings |
| Male | 686 (54.3%) | $33,824 |
| Female | 578 (45.7%) | $30,268 |
| Total | 1,264 (100.0%) | $31,833 |
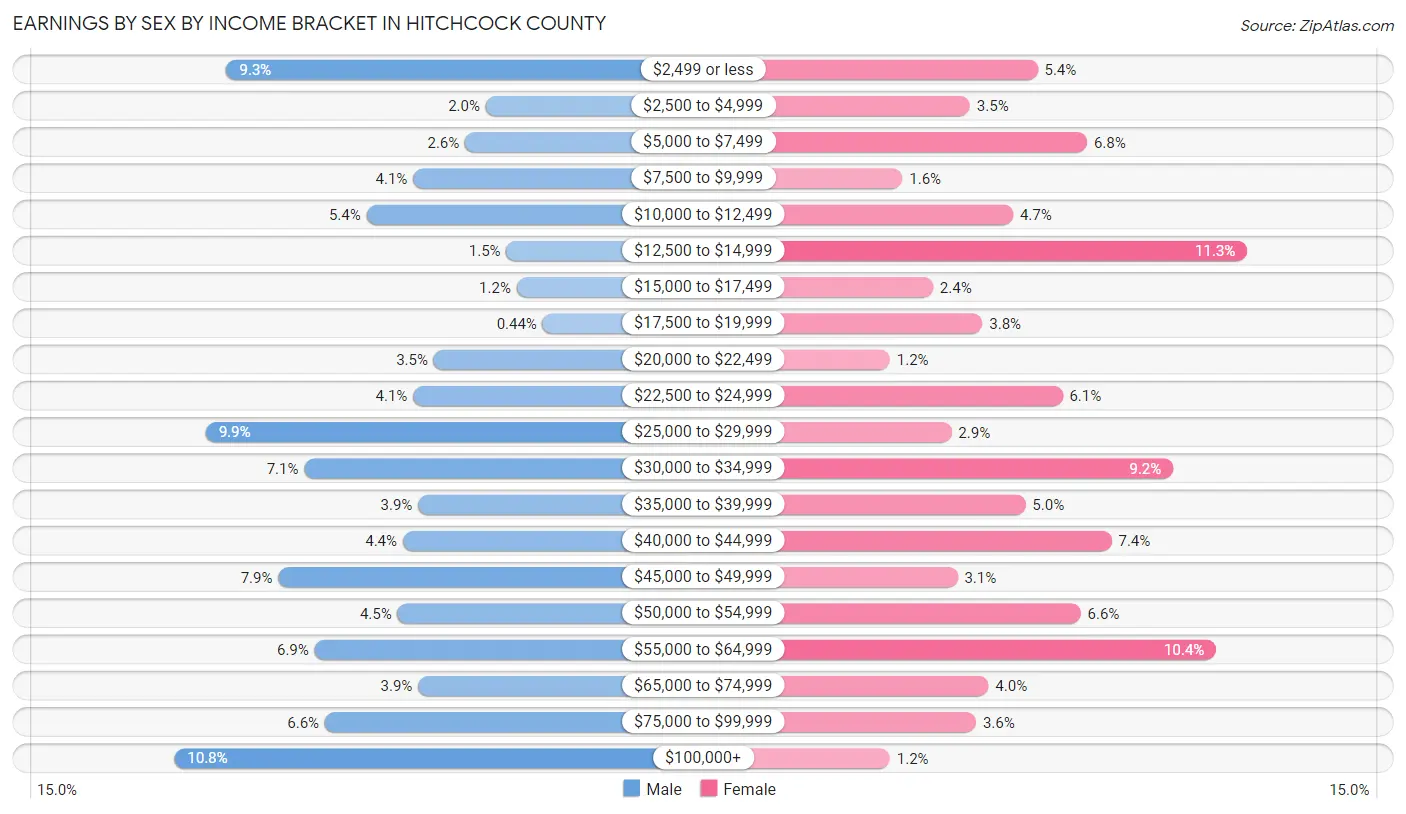
Earnings by Sex by Income Bracket in Hitchcock County
The most common earnings brackets in Hitchcock County are $100,000+ for men (74 | 10.8%) and $12,500 to $14,999 for women (65 | 11.3%).
| Income | Male | Female |
| $2,499 or less | 64 (9.3%) | 31 (5.4%) |
| $2,500 to $4,999 | 14 (2.0%) | 20 (3.5%) |
| $5,000 to $7,499 | 18 (2.6%) | 39 (6.8%) |
| $7,500 to $9,999 | 28 (4.1%) | 9 (1.6%) |
| $10,000 to $12,499 | 37 (5.4%) | 27 (4.7%) |
| $12,500 to $14,999 | 10 (1.5%) | 65 (11.3%) |
| $15,000 to $17,499 | 8 (1.2%) | 14 (2.4%) |
| $17,500 to $19,999 | 3 (0.4%) | 22 (3.8%) |
| $20,000 to $22,499 | 24 (3.5%) | 7 (1.2%) |
| $22,500 to $24,999 | 28 (4.1%) | 35 (6.1%) |
| $25,000 to $29,999 | 68 (9.9%) | 17 (2.9%) |
| $30,000 to $34,999 | 49 (7.1%) | 53 (9.2%) |
| $35,000 to $39,999 | 27 (3.9%) | 29 (5.0%) |
| $40,000 to $44,999 | 30 (4.4%) | 43 (7.4%) |
| $45,000 to $49,999 | 54 (7.9%) | 18 (3.1%) |
| $50,000 to $54,999 | 31 (4.5%) | 38 (6.6%) |
| $55,000 to $64,999 | 47 (6.9%) | 60 (10.4%) |
| $65,000 to $74,999 | 27 (3.9%) | 23 (4.0%) |
| $75,000 to $99,999 | 45 (6.6%) | 21 (3.6%) |
| $100,000+ | 74 (10.8%) | 7 (1.2%) |
| Total | 686 (100.0%) | 578 (100.0%) |
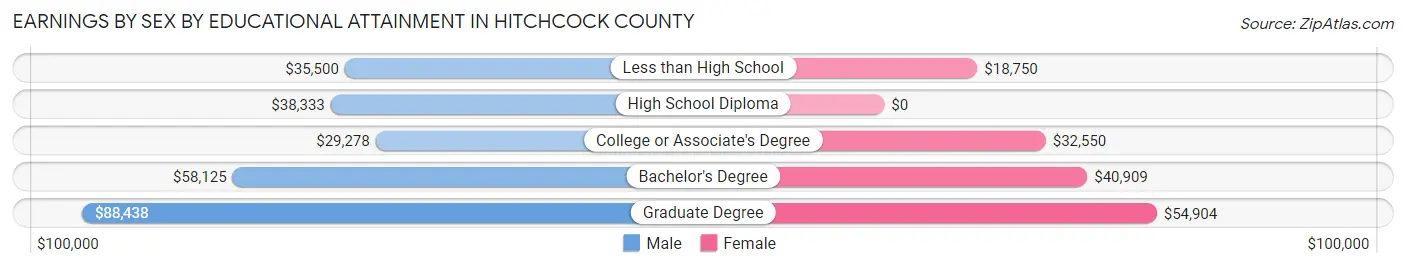
Earnings by Sex by Educational Attainment in Hitchcock County
Average earnings in Hitchcock County are $36,953 for men and $33,450 for women, a difference of 9.5%. Men with an educational attainment of graduate degree enjoy the highest average annual earnings of $88,438, while those with college or associate's degree education earn the least with $29,278. Women with an educational attainment of graduate degree earn the most with the average annual earnings of $54,904, while those with less than high school education have the smallest earnings of $18,750.
| Educational Attainment | Male Income | Female Income |
| Less than High School | $35,500 | $18,750 |
| High School Diploma | $38,333 | $0 |
| College or Associate's Degree | $29,278 | $32,550 |
| Bachelor's Degree | $58,125 | $40,909 |
| Graduate Degree | $88,438 | $54,904 |
| Total | $36,953 | $33,450 |
Family Income in Hitchcock County
Family Income Brackets in Hitchcock County
According to the Hitchcock County family income data, there are 130 families falling into the $50,000 to $74,999 income range, which is the most common income bracket and makes up 19.6% of all families. Conversely, the $150,000 to $199,999 income bracket is the least frequent group with only 17 families (2.6%) belonging to this category.
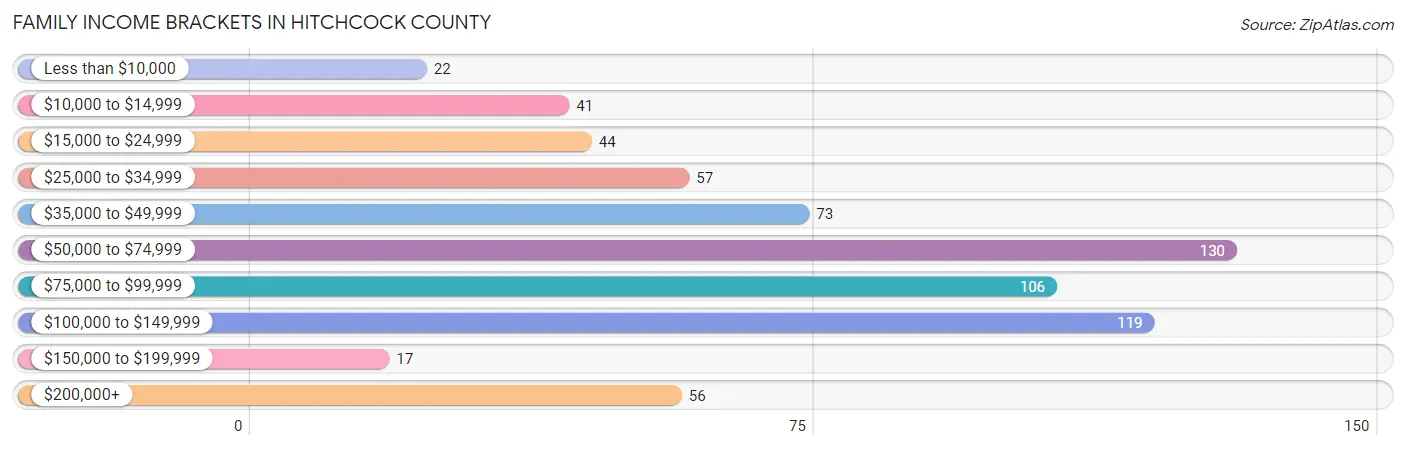
| Income Bracket | # Families | % Families |
| Less than $10,000 | 22 | 3.3% |
| $10,000 to $14,999 | 41 | 6.2% |
| $15,000 to $24,999 | 44 | 6.6% |
| $25,000 to $34,999 | 57 | 8.6% |
| $35,000 to $49,999 | 73 | 11.0% |
| $50,000 to $74,999 | 130 | 19.5% |
| $75,000 to $99,999 | 106 | 15.9% |
| $100,000 to $149,999 | 119 | 17.9% |
| $150,000 to $199,999 | 17 | 2.6% |
| $200,000+ | 56 | 8.4% |
Family Income by Famaliy Size in Hitchcock County
5-person families (33 | 5.0%) account for the highest median family income in Hitchcock County with $110,673 per family, while 2-person families (396 | 59.6%) have the highest median income of $33,125 per family member.
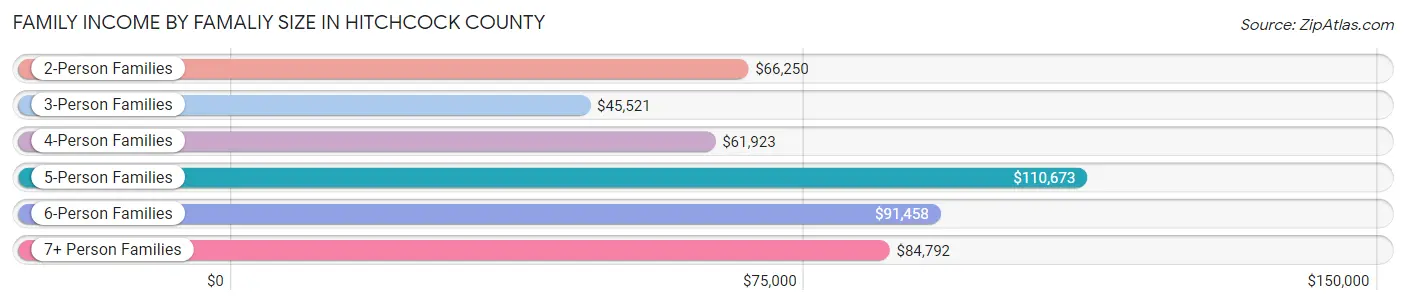
| Income Bracket | # Families | Median Income |
| 2-Person Families | 396 (59.6%) | $66,250 |
| 3-Person Families | 63 (9.5%) | $45,521 |
| 4-Person Families | 118 (17.7%) | $61,923 |
| 5-Person Families | 33 (5.0%) | $110,673 |
| 6-Person Families | 33 (5.0%) | $91,458 |
| 7+ Person Families | 22 (3.3%) | $84,792 |
| Total | 665 (100.0%) | $68,702 |
Family Income by Number of Earners in Hitchcock County
The median family income in Hitchcock County is $68,702, with families comprising 3+ earners (23) having the highest median family income of $110,313, while families with no earners (136) have the lowest median family income of $30,595, accounting for 3.5% and 20.4% of families, respectively.
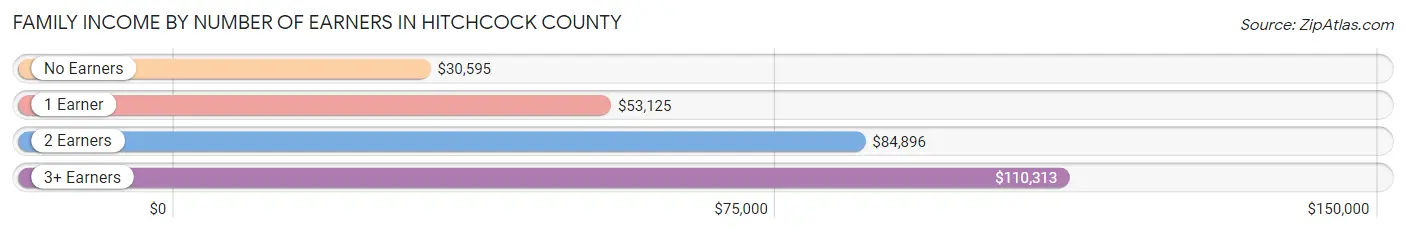
| Number of Earners | # Families | Median Income |
| No Earners | 136 (20.4%) | $30,595 |
| 1 Earner | 217 (32.6%) | $53,125 |
| 2 Earners | 289 (43.5%) | $84,896 |
| 3+ Earners | 23 (3.5%) | $110,313 |
| Total | 665 (100.0%) | $68,702 |
Household Income in Hitchcock County
Household Income Brackets in Hitchcock County
With 170 households falling in the category, the $50,000 to $74,999 income range is the most frequent in Hitchcock County, accounting for 15.3% of all households. In contrast, only 19 households (1.7%) fall into the $150,000 to $199,999 income bracket, making it the least populous group.
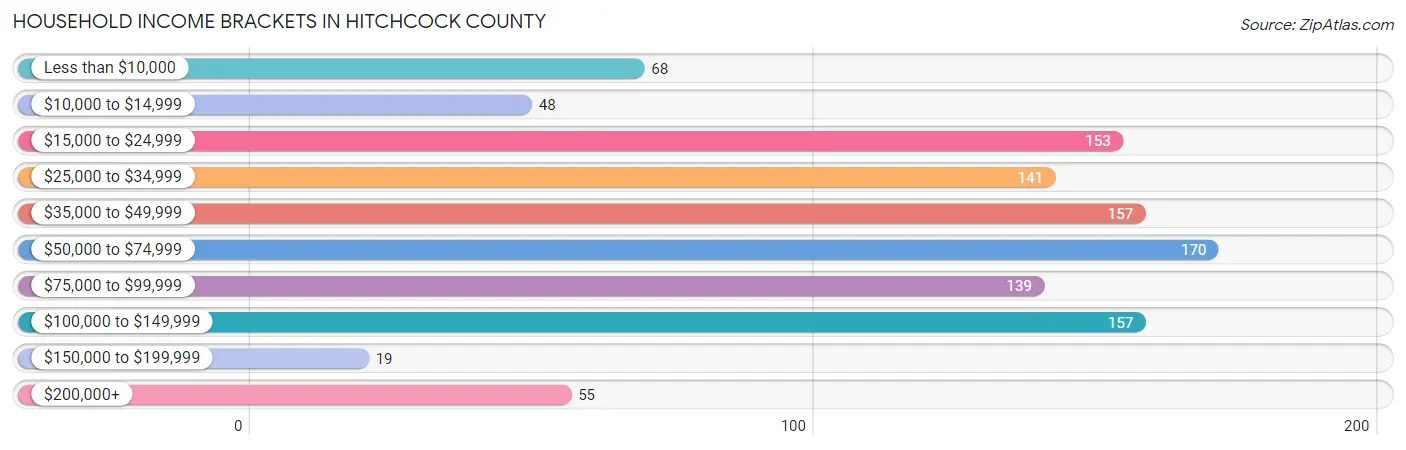
| Income Bracket | # Households | % Households |
| Less than $10,000 | 68 | 6.1% |
| $10,000 to $14,999 | 48 | 4.3% |
| $15,000 to $24,999 | 153 | 13.8% |
| $25,000 to $34,999 | 141 | 12.7% |
| $35,000 to $49,999 | 157 | 14.2% |
| $50,000 to $74,999 | 170 | 15.3% |
| $75,000 to $99,999 | 139 | 12.5% |
| $100,000 to $149,999 | 157 | 14.2% |
| $150,000 to $199,999 | 19 | 1.7% |
| $200,000+ | 55 | 5.0% |
Household Income by Householder Age in Hitchcock County
The median household income in Hitchcock County is $49,456, with the highest median household income of $61,250 found in the 25 to 44 years age bracket for the primary householder. A total of 278 households (25.1%) fall into this category. Meanwhile, the 15 to 24 years age bracket for the primary householder has the lowest median household income of $21,595, with 47 households (4.2%) in this group.
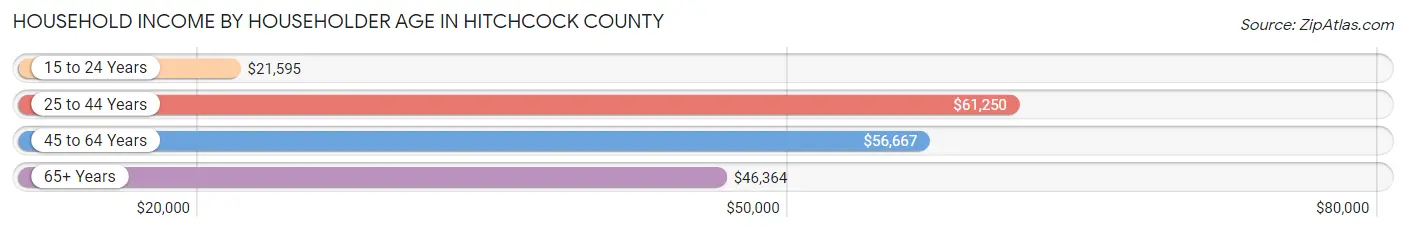
| Income Bracket | # Households | Median Income |
| 15 to 24 Years | 47 (4.2%) | $21,595 |
| 25 to 44 Years | 278 (25.1%) | $61,250 |
| 45 to 64 Years | 360 (32.5%) | $56,667 |
| 65+ Years | 424 (38.2%) | $46,364 |
| Total | 1,109 (100.0%) | $49,456 |
Poverty in Hitchcock County
Income Below Poverty by Sex and Age in Hitchcock County
With 11.6% poverty level for males and 13.2% for females among the residents of Hitchcock County, under 5 year old males and 18 to 24 year old females are the most vulnerable to poverty, with 47 males (43.9%) and 37 females (57.8%) in their respective age groups living below the poverty level.
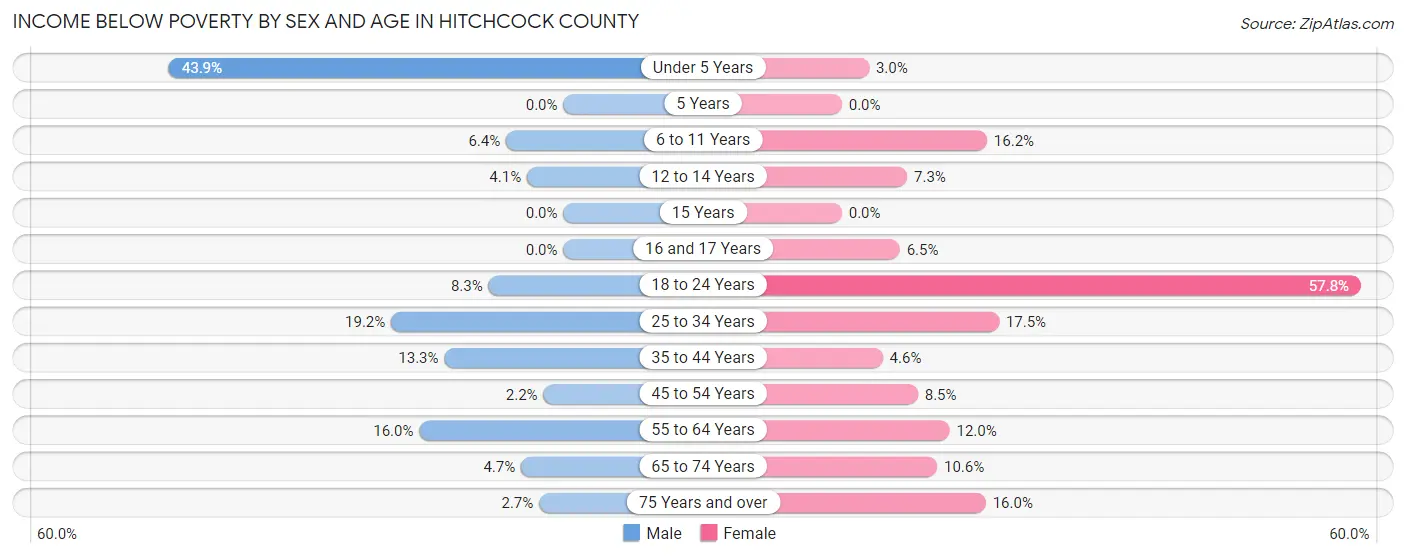
| Age Bracket | Male | Female |
| Under 5 Years | 47 (43.9%) | 2 (3.0%) |
| 5 Years | 0 (0.0%) | 0 (0.0%) |
| 6 to 11 Years | 6 (6.4%) | 16 (16.2%) |
| 12 to 14 Years | 3 (4.1%) | 4 (7.3%) |
| 15 Years | 0 (0.0%) | 0 (0.0%) |
| 16 and 17 Years | 0 (0.0%) | 2 (6.5%) |
| 18 to 24 Years | 6 (8.3%) | 37 (57.8%) |
| 25 to 34 Years | 28 (19.2%) | 21 (17.5%) |
| 35 to 44 Years | 20 (13.3%) | 6 (4.5%) |
| 45 to 54 Years | 3 (2.2%) | 11 (8.5%) |
| 55 to 64 Years | 30 (16.0%) | 21 (12.0%) |
| 65 to 74 Years | 9 (4.7%) | 19 (10.6%) |
| 75 Years and over | 3 (2.7%) | 25 (16.0%) |
| Total | 155 (11.6%) | 164 (13.2%) |
Income Above Poverty by Sex and Age in Hitchcock County
According to the poverty statistics in Hitchcock County, males aged 5 years and females aged 5 years are the age groups that are most secure financially, with 100.0% of males and 100.0% of females in these age groups living above the poverty line.
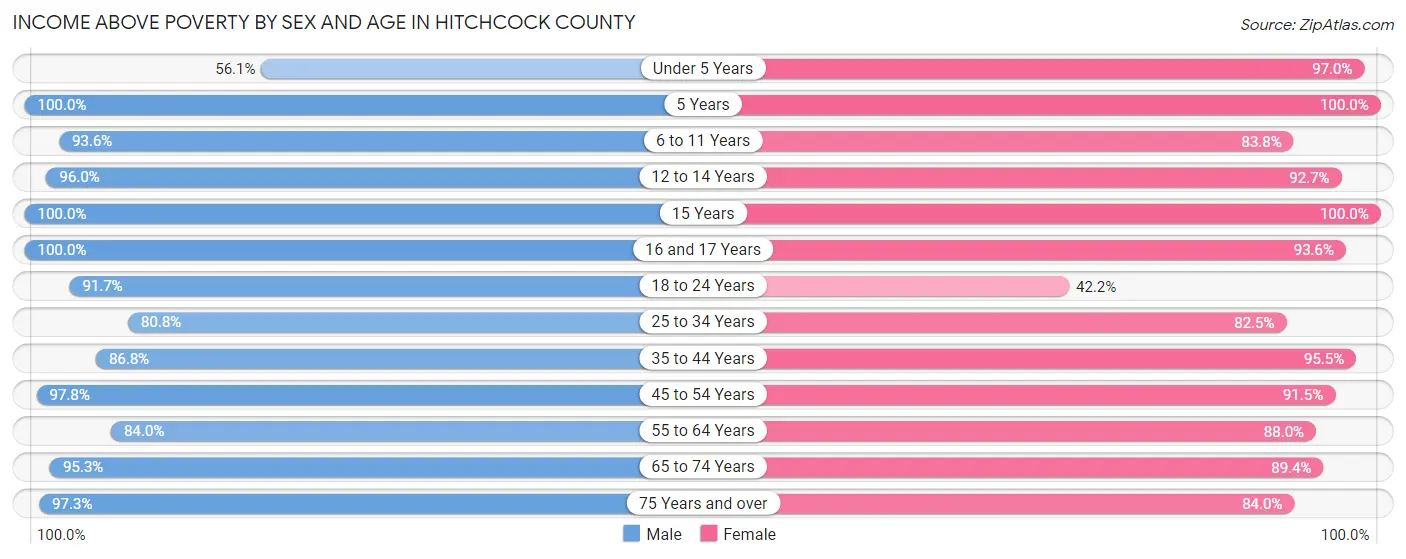
| Age Bracket | Male | Female |
| Under 5 Years | 60 (56.1%) | 64 (97.0%) |
| 5 Years | 9 (100.0%) | 22 (100.0%) |
| 6 to 11 Years | 88 (93.6%) | 83 (83.8%) |
| 12 to 14 Years | 71 (96.0%) | 51 (92.7%) |
| 15 Years | 7 (100.0%) | 18 (100.0%) |
| 16 and 17 Years | 49 (100.0%) | 29 (93.5%) |
| 18 to 24 Years | 66 (91.7%) | 27 (42.2%) |
| 25 to 34 Years | 118 (80.8%) | 99 (82.5%) |
| 35 to 44 Years | 131 (86.8%) | 126 (95.5%) |
| 45 to 54 Years | 132 (97.8%) | 119 (91.5%) |
| 55 to 64 Years | 157 (84.0%) | 154 (88.0%) |
| 65 to 74 Years | 182 (95.3%) | 160 (89.4%) |
| 75 Years and over | 108 (97.3%) | 131 (84.0%) |
| Total | 1,178 (88.4%) | 1,083 (86.9%) |
Income Below Poverty Among Married-Couple Families in Hitchcock County
The poverty statistics for married-couple families in Hitchcock County show that 3.6% or 19 of the total 520 families live below the poverty line. Families with no children have the highest poverty rate of 5.4%, comprising of 18 families. On the other hand, families with 3 or 4 children have the lowest poverty rate of 0.0%, which includes 0 families.
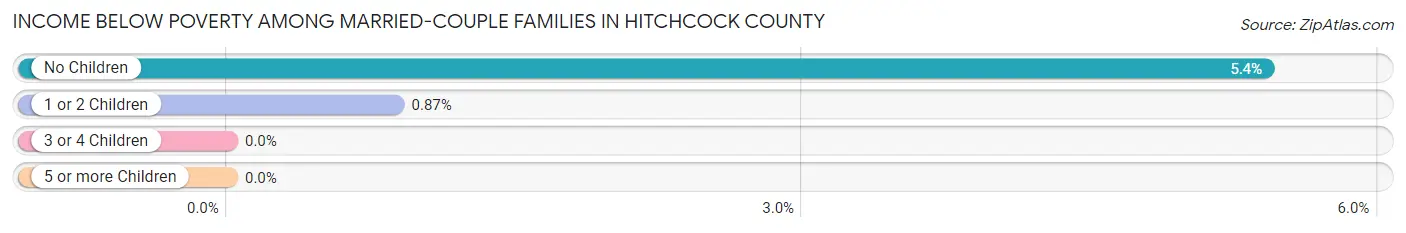
| Children | Above Poverty | Below Poverty |
| No Children | 315 (94.6%) | 18 (5.4%) |
| 1 or 2 Children | 114 (99.1%) | 1 (0.9%) |
| 3 or 4 Children | 50 (100.0%) | 0 (0.0%) |
| 5 or more Children | 22 (100.0%) | 0 (0.0%) |
| Total | 501 (96.4%) | 19 (3.6%) |
Income Below Poverty Among Single-Parent Households in Hitchcock County
According to the poverty data in Hitchcock County, 14.8% or 4 single-father households and 44.9% or 53 single-mother households are living below the poverty line. Among single-father households, those with no children have the highest poverty rate, with 4 households (22.2%) experiencing poverty. Likewise, among single-mother households, those with 3 or 4 children have the highest poverty rate, with 34 households (85.0%) falling below the poverty line.
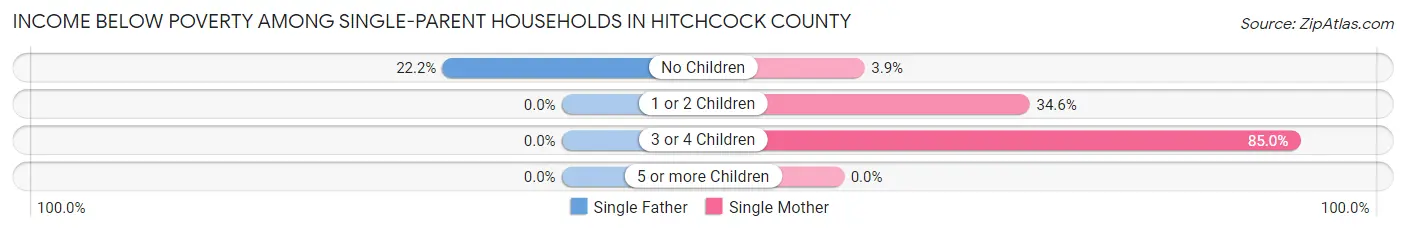
| Children | Single Father | Single Mother |
| No Children | 4 (22.2%) | 1 (3.8%) |
| 1 or 2 Children | 0 (0.0%) | 18 (34.6%) |
| 3 or 4 Children | 0 (0.0%) | 34 (85.0%) |
| 5 or more Children | 0 (0.0%) | 0 (0.0%) |
| Total | 4 (14.8%) | 53 (44.9%) |
Income Below Poverty Among Married-Couple vs Single-Parent Households in Hitchcock County
The poverty data for Hitchcock County shows that 19 of the married-couple family households (3.6%) and 57 of the single-parent households (39.3%) are living below the poverty level. Within the married-couple family households, those with no children have the highest poverty rate, with 18 households (5.4%) falling below the poverty line. Among the single-parent households, those with 3 or 4 children have the highest poverty rate, with 34 household (85.0%) living below poverty.
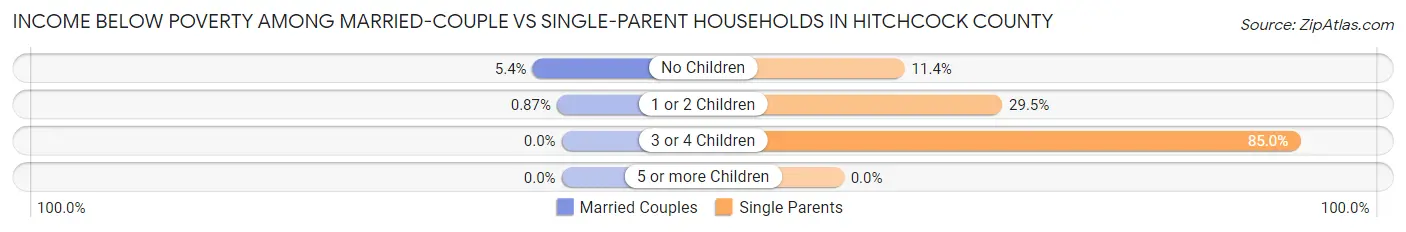
| Children | Married-Couple Families | Single-Parent Households |
| No Children | 18 (5.4%) | 5 (11.4%) |
| 1 or 2 Children | 1 (0.9%) | 18 (29.5%) |
| 3 or 4 Children | 0 (0.0%) | 34 (85.0%) |
| 5 or more Children | 0 (0.0%) | 0 (0.0%) |
| Total | 19 (3.6%) | 57 (39.3%) |
Race in Hitchcock County
The most populous races in Hitchcock County are White / Caucasian (2,502 | 95.5%), Hispanic or Latino (103 | 3.9%), and Two or more Races (95 | 3.6%).
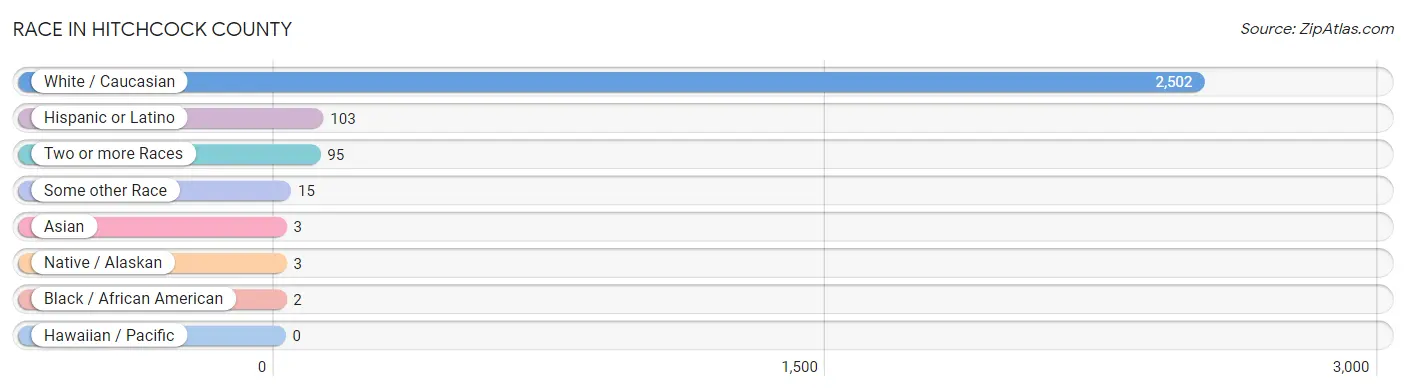
| Race | # Population | % Population |
| Asian | 3 | 0.1% |
| Black / African American | 2 | 0.1% |
| Hawaiian / Pacific | 0 | 0.0% |
| Hispanic or Latino | 103 | 3.9% |
| Native / Alaskan | 3 | 0.1% |
| White / Caucasian | 2,502 | 95.5% |
| Two or more Races | 95 | 3.6% |
| Some other Race | 15 | 0.6% |
| Total | 2,620 | 100.0% |
Ancestry in Hitchcock County
The most populous ancestries reported in Hitchcock County are German (690 | 26.3%), Irish (253 | 9.7%), English (232 | 8.8%), American (120 | 4.6%), and Scottish (95 | 3.6%), together accounting for 53.1% of all Hitchcock County residents.
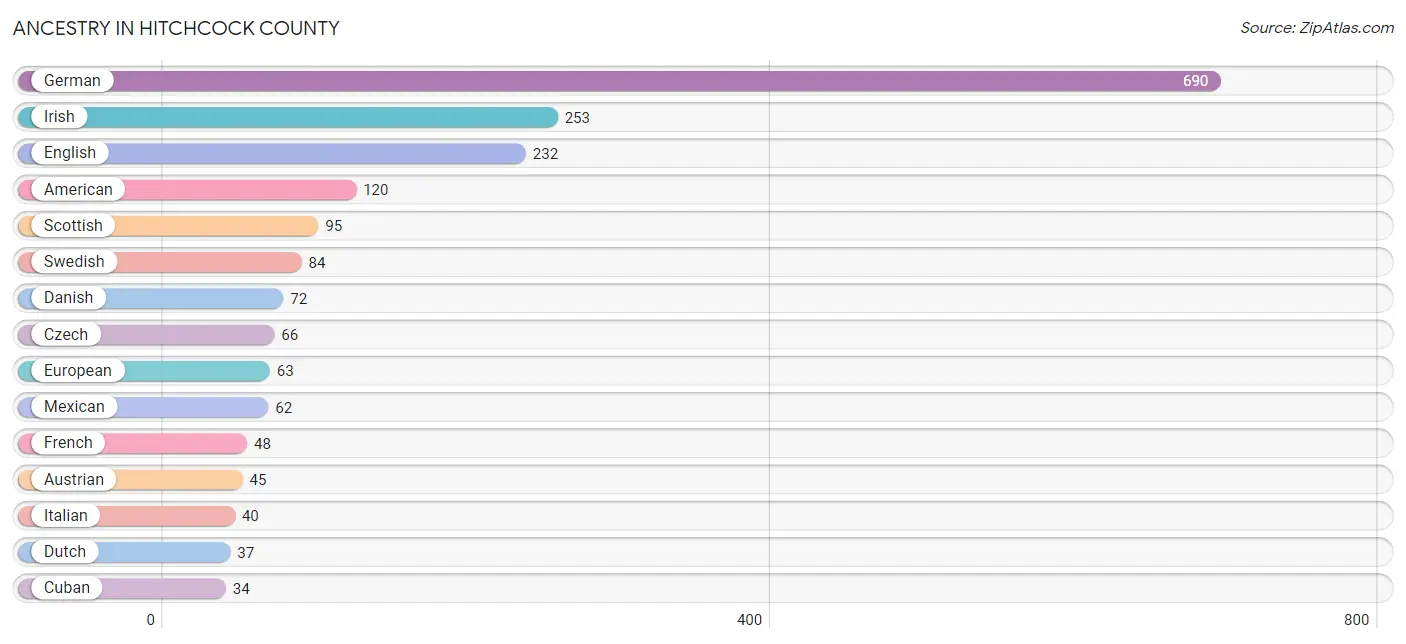
| Ancestry | # Population | % Population |
| African | 1 | 0.0% |
| American | 120 | 4.6% |
| Australian | 2 | 0.1% |
| Austrian | 45 | 1.7% |
| British | 6 | 0.2% |
| Cherokee | 1 | 0.0% |
| Cuban | 34 | 1.3% |
| Czech | 66 | 2.5% |
| Danish | 72 | 2.8% |
| Dutch | 37 | 1.4% |
| English | 232 | 8.8% |
| European | 63 | 2.4% |
| French | 48 | 1.8% |
| French Canadian | 7 | 0.3% |
| German | 690 | 26.3% |
| Hungarian | 5 | 0.2% |
| Irish | 253 | 9.7% |
| Italian | 40 | 1.5% |
| Korean | 3 | 0.1% |
| Mexican | 62 | 2.4% |
| Norwegian | 25 | 0.9% |
| Pakistani | 3 | 0.1% |
| Polish | 11 | 0.4% |
| Russian | 3 | 0.1% |
| Scandinavian | 11 | 0.4% |
| Scotch-Irish | 21 | 0.8% |
| Scottish | 95 | 3.6% |
| Sioux | 3 | 0.1% |
| Slavic | 3 | 0.1% |
| Spaniard | 7 | 0.3% |
| Subsaharan African | 1 | 0.0% |
| Swedish | 84 | 3.2% |
| Welsh | 8 | 0.3% | View All 33 Rows |
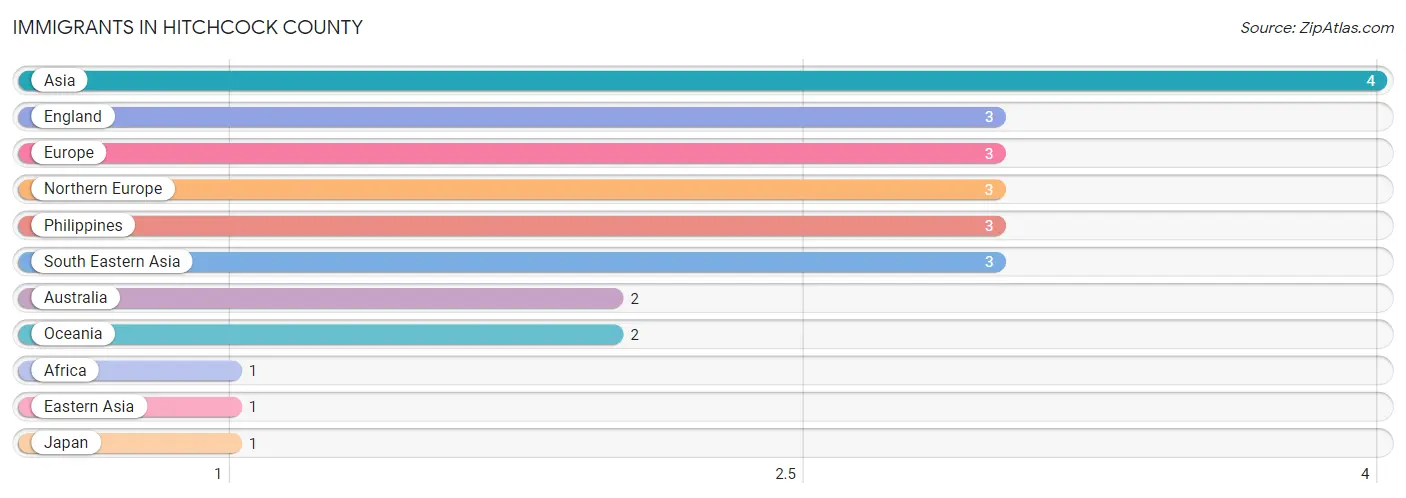
Immigrants in Hitchcock County
The most numerous immigrant groups reported in Hitchcock County came from Asia (4 | 0.2%), England (3 | 0.1%), Europe (3 | 0.1%), Northern Europe (3 | 0.1%), and Philippines (3 | 0.1%), together accounting for 0.6% of all Hitchcock County residents.
| Immigration Origin | # Population | % Population |
| Africa | 1 | 0.0% |
| Asia | 4 | 0.2% |
| Australia | 2 | 0.1% |
| Eastern Asia | 1 | 0.0% |
| England | 3 | 0.1% |
| Europe | 3 | 0.1% |
| Japan | 1 | 0.0% |
| Northern Europe | 3 | 0.1% |
| Oceania | 2 | 0.1% |
| Philippines | 3 | 0.1% |
| South Eastern Asia | 3 | 0.1% | View All 11 Rows |
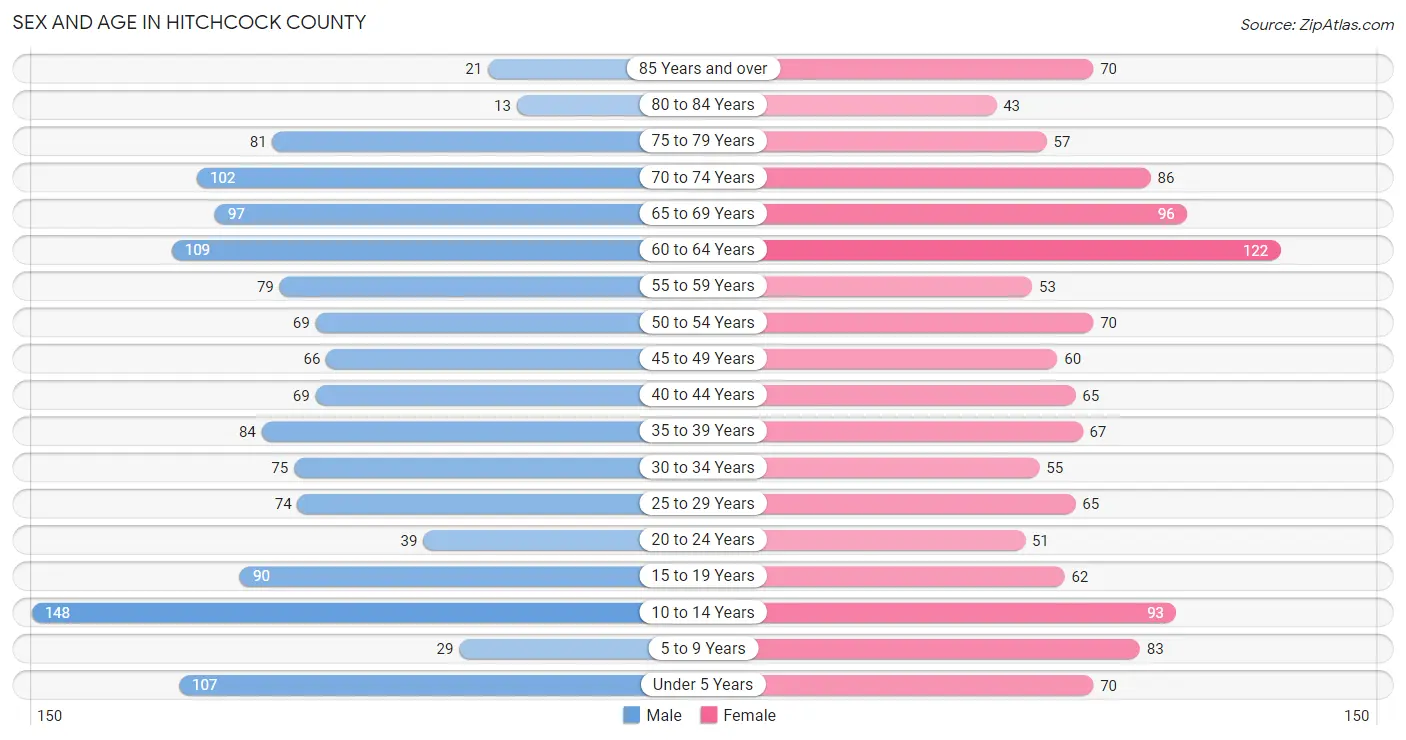
Sex and Age in Hitchcock County
Sex and Age in Hitchcock County
The most populous age groups in Hitchcock County are 10 to 14 Years (148 | 11.0%) for men and 60 to 64 Years (122 | 9.6%) for women.
| Age Bracket | Male | Female |
| Under 5 Years | 107 (7.9%) | 70 (5.5%) |
| 5 to 9 Years | 29 (2.1%) | 83 (6.6%) |
| 10 to 14 Years | 148 (11.0%) | 93 (7.3%) |
| 15 to 19 Years | 90 (6.7%) | 62 (4.9%) |
| 20 to 24 Years | 39 (2.9%) | 51 (4.0%) |
| 25 to 29 Years | 74 (5.5%) | 65 (5.1%) |
| 30 to 34 Years | 75 (5.6%) | 55 (4.3%) |
| 35 to 39 Years | 84 (6.2%) | 67 (5.3%) |
| 40 to 44 Years | 69 (5.1%) | 65 (5.1%) |
| 45 to 49 Years | 66 (4.9%) | 60 (4.7%) |
| 50 to 54 Years | 69 (5.1%) | 70 (5.5%) |
| 55 to 59 Years | 79 (5.8%) | 53 (4.2%) |
| 60 to 64 Years | 109 (8.1%) | 122 (9.6%) |
| 65 to 69 Years | 97 (7.2%) | 96 (7.6%) |
| 70 to 74 Years | 102 (7.5%) | 86 (6.8%) |
| 75 to 79 Years | 81 (6.0%) | 57 (4.5%) |
| 80 to 84 Years | 13 (1.0%) | 43 (3.4%) |
| 85 Years and over | 21 (1.5%) | 70 (5.5%) |
| Total | 1,352 (100.0%) | 1,268 (100.0%) |
Families and Households in Hitchcock County
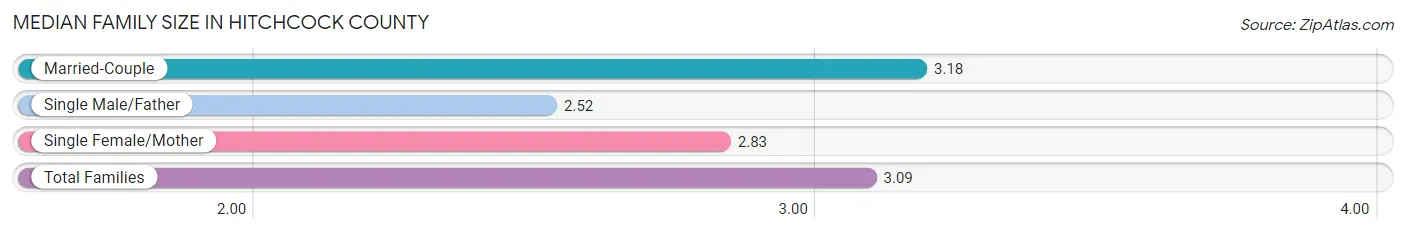
Median Family Size in Hitchcock County
The median family size in Hitchcock County is 3.09 persons per family, with married-couple families (520 | 78.2%) accounting for the largest median family size of 3.18 persons per family. On the other hand, single male/father families (27 | 4.1%) represent the smallest median family size with 2.52 persons per family.
| Family Type | # Families | Family Size |
| Married-Couple | 520 (78.2%) | 3.18 |
| Single Male/Father | 27 (4.1%) | 2.52 |
| Single Female/Mother | 118 (17.7%) | 2.83 |
| Total Families | 665 (100.0%) | 3.09 |
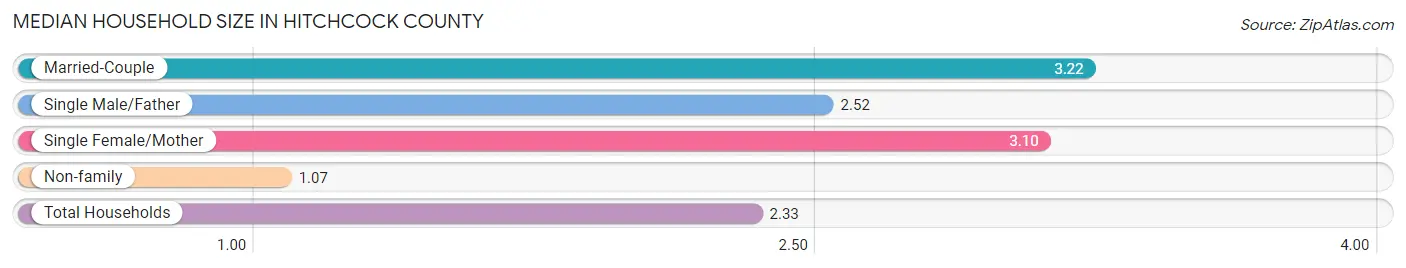
Median Household Size in Hitchcock County
The median household size in Hitchcock County is 2.33 persons per household, with married-couple households (520 | 46.9%) accounting for the largest median household size of 3.22 persons per household. non-family households (444 | 40.0%) represent the smallest median household size with 1.07 persons per household.
| Household Type | # Households | Household Size |
| Married-Couple | 520 (46.9%) | 3.22 |
| Single Male/Father | 27 (2.4%) | 2.52 |
| Single Female/Mother | 118 (10.6%) | 3.10 |
| Non-family | 444 (40.0%) | 1.07 |
| Total Households | 1,109 (100.0%) | 2.33 |
Household Size by Marriage Status in Hitchcock County
Out of a total of 1,109 households in Hitchcock County, 665 (60.0%) are family households, while 444 (40.0%) are nonfamily households. The most numerous type of family households are 2-person households, comprising 394, and the most common type of nonfamily households are 1-person households, comprising 414.
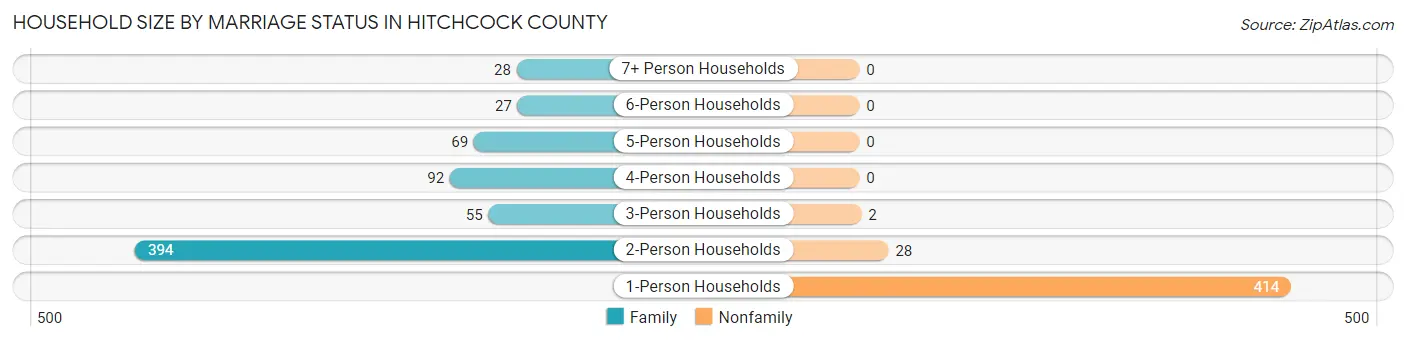
| Household Size | Family Households | Nonfamily Households |
| 1-Person Households | - | 414 (37.3%) |
| 2-Person Households | 394 (35.5%) | 28 (2.5%) |
| 3-Person Households | 55 (5.0%) | 2 (0.2%) |
| 4-Person Households | 92 (8.3%) | 0 (0.0%) |
| 5-Person Households | 69 (6.2%) | 0 (0.0%) |
| 6-Person Households | 27 (2.4%) | 0 (0.0%) |
| 7+ Person Households | 28 (2.5%) | 0 (0.0%) |
| Total | 665 (60.0%) | 444 (40.0%) |
Female Fertility in Hitchcock County
Fertility by Age in Hitchcock County
Average fertility rate in Hitchcock County is 150.0 births per 1,000 women. Women in the age bracket of 20 to 34 years have the highest fertility rate with 310.0 births per 1,000 women. Women in the age bracket of 20 to 34 years acount for 80.3% of all women with births.
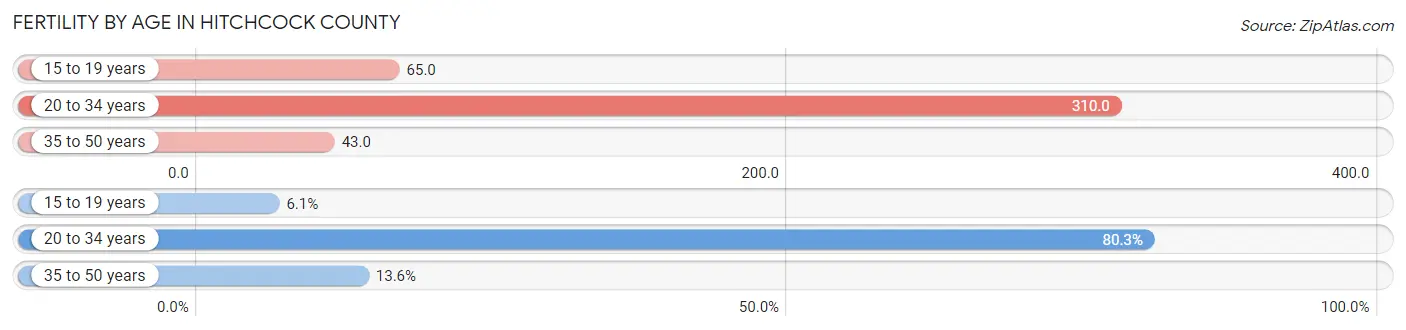
| Age Bracket | Women with Births | Births / 1,000 Women |
| 15 to 19 years | 4 (6.1%) | 65.0 |
| 20 to 34 years | 53 (80.3%) | 310.0 |
| 35 to 50 years | 9 (13.6%) | 43.0 |
| Total | 66 (100.0%) | 150.0 |
Fertility by Age by Marriage Status in Hitchcock County
83.3% of women with births (66) in Hitchcock County are married. The highest percentage of unmarried women with births falls into 15 to 19 years age bracket with 100.0% of them unmarried at the time of birth, while the lowest percentage of unmarried women with births belong to 35 to 50 years age bracket with 0.0% of them unmarried.
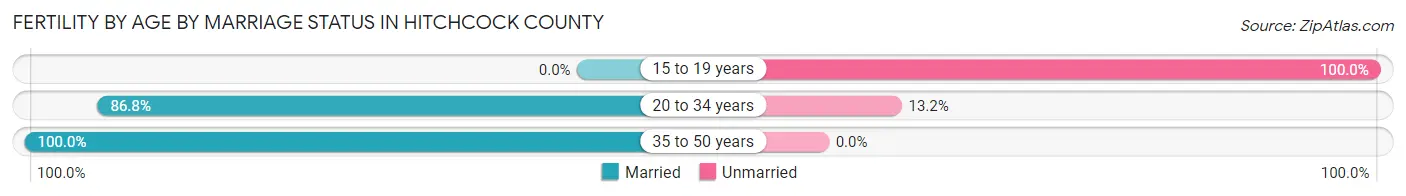
| Age Bracket | Married | Unmarried |
| 15 to 19 years | 0 (0.0%) | 4 (100.0%) |
| 20 to 34 years | 46 (86.8%) | 7 (13.2%) |
| 35 to 50 years | 9 (100.0%) | 0 (0.0%) |
| Total | 55 (83.3%) | 11 (16.7%) |
Fertility by Education in Hitchcock County
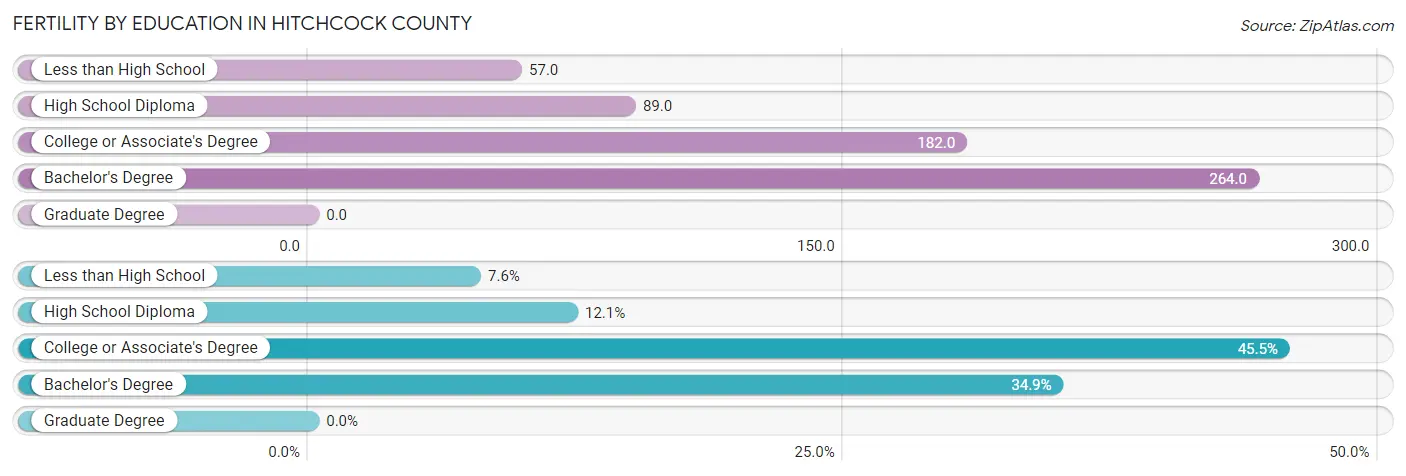
| Educational Attainment | Women with Births | Births / 1,000 Women |
| Less than High School | 5 (7.6%) | 57.0 |
| High School Diploma | 8 (12.1%) | 89.0 |
| College or Associate's Degree | 30 (45.5%) | 182.0 |
| Bachelor's Degree | 23 (34.8%) | 264.0 |
| Graduate Degree | 0 (0.0%) | 0.0 |
| Total | 66 (100.0%) | 150.0 |
Fertility by Education by Marriage Status in Hitchcock County
16.7% of women with births in Hitchcock County are unmarried. Women with the educational attainment of less than high school are most likely to be married with 100.0% of them married at childbirth, while women with the educational attainment of high school diploma are least likely to be married with 75.0% of them unmarried at childbirth.
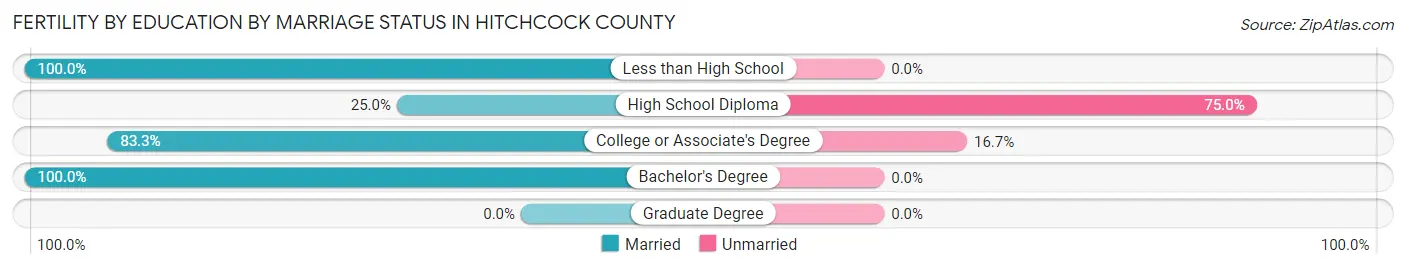
| Educational Attainment | Married | Unmarried |
| Less than High School | 5 (100.0%) | 0 (0.0%) |
| High School Diploma | 2 (25.0%) | 6 (75.0%) |
| College or Associate's Degree | 25 (83.3%) | 5 (16.7%) |
| Bachelor's Degree | 23 (100.0%) | 0 (0.0%) |
| Graduate Degree | 0 (0.0%) | 0 (0.0%) |
| Total | 55 (83.3%) | 11 (16.7%) |
Employment Characteristics in Hitchcock County
Employment by Class of Employer in Hitchcock County
Among the 1,126 employed individuals in Hitchcock County, private company employees (575 | 51.1%), self-employed (not incorporated) (183 | 16.3%), and local government employees (167 | 14.8%) make up the most common classes of employment.
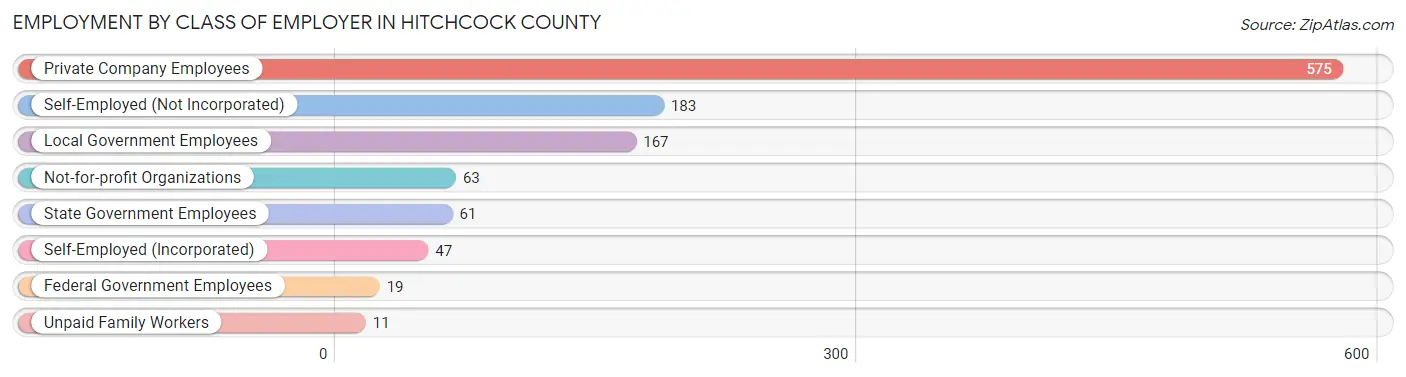
| Employer Class | # Employees | % Employees |
| Private Company Employees | 575 | 51.1% |
| Self-Employed (Incorporated) | 47 | 4.2% |
| Self-Employed (Not Incorporated) | 183 | 16.3% |
| Not-for-profit Organizations | 63 | 5.6% |
| Local Government Employees | 167 | 14.8% |
| State Government Employees | 61 | 5.4% |
| Federal Government Employees | 19 | 1.7% |
| Unpaid Family Workers | 11 | 1.0% |
| Total | 1,126 | 100.0% |
Employment Status by Age in Hitchcock County
According to the labor force statistics for Hitchcock County, out of the total population over 16 years of age (2,065), 58.5% or 1,208 individuals are in the labor force, with 1.9% or 23 of them unemployed. The age group with the highest labor force participation rate is 30 to 34 years, with 94.6% or 123 individuals in the labor force. Within the labor force, the 20 to 24 years age range has the highest percentage of unemployed individuals, with 8.2% or 7 of them being unemployed.
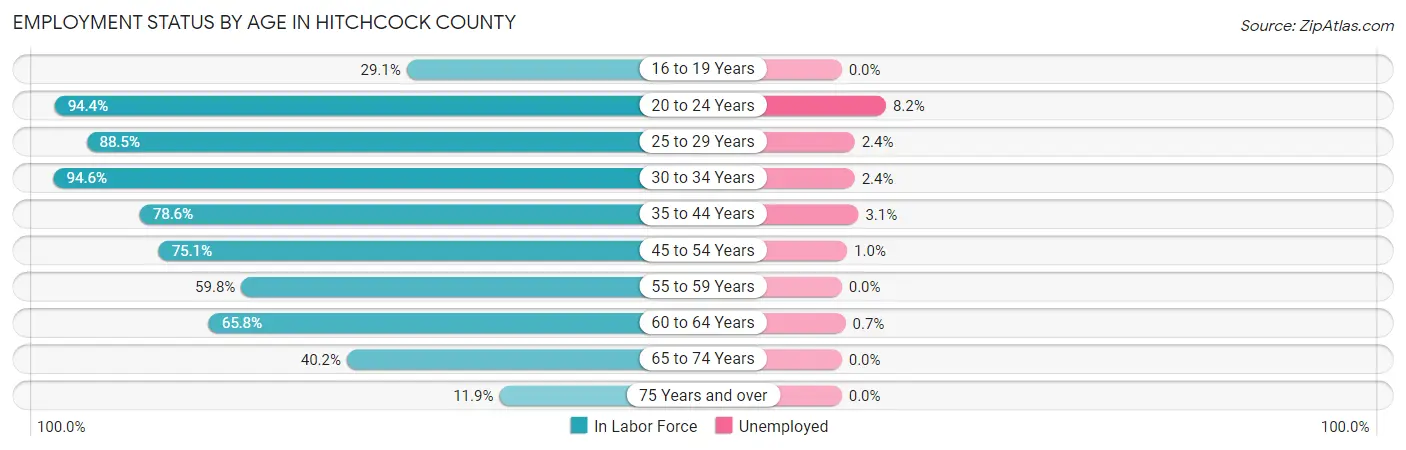
| Age Bracket | In Labor Force | Unemployed |
| 16 to 19 Years | 37 (29.1%) | 0 (0.0%) |
| 20 to 24 Years | 85 (94.4%) | 7 (8.2%) |
| 25 to 29 Years | 123 (88.5%) | 3 (2.4%) |
| 30 to 34 Years | 123 (94.6%) | 3 (2.4%) |
| 35 to 44 Years | 224 (78.6%) | 7 (3.1%) |
| 45 to 54 Years | 199 (75.1%) | 2 (1.0%) |
| 55 to 59 Years | 79 (59.8%) | 0 (0.0%) |
| 60 to 64 Years | 152 (65.8%) | 1 (0.7%) |
| 65 to 74 Years | 153 (40.2%) | 0 (0.0%) |
| 75 Years and over | 34 (11.9%) | 0 (0.0%) |
| Total | 1,208 (58.5%) | 23 (1.9%) |
Employment Status by Educational Attainment in Hitchcock County
According to labor force statistics for Hitchcock County, 76.1% of individuals (900) out of the total population between 25 and 64 years of age (1,182) are in the labor force, with 1.8% or 16 of them being unemployed. The group with the highest labor force participation rate are those with the educational attainment of bachelor's degree or higher, with 82.0% or 200 individuals in the labor force. Within the labor force, individuals with less than high school education have the highest percentage of unemployment, with 5.9% or 3 of them being unemployed.
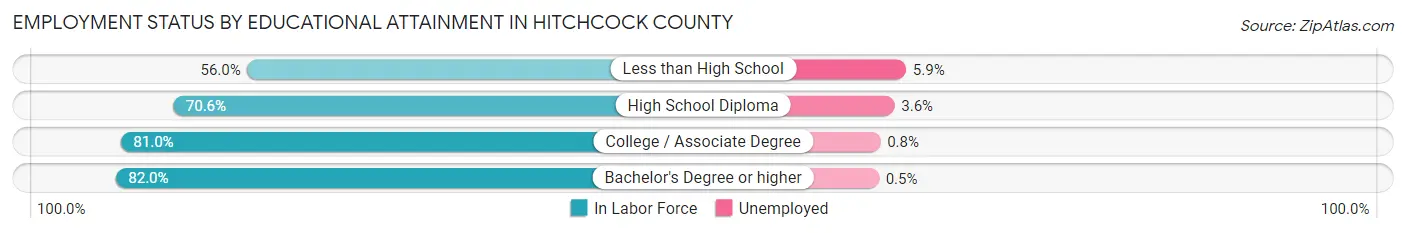
| Educational Attainment | In Labor Force | Unemployed |
| Less than High School | 51 (56.0%) | 5 (5.9%) |
| High School Diploma | 252 (70.6%) | 13 (3.6%) |
| College / Associate Degree | 397 (81.0%) | 4 (0.8%) |
| Bachelor's Degree or higher | 200 (82.0%) | 1 (0.5%) |
| Total | 900 (76.1%) | 21 (1.8%) |
Employment Occupations by Sex in Hitchcock County
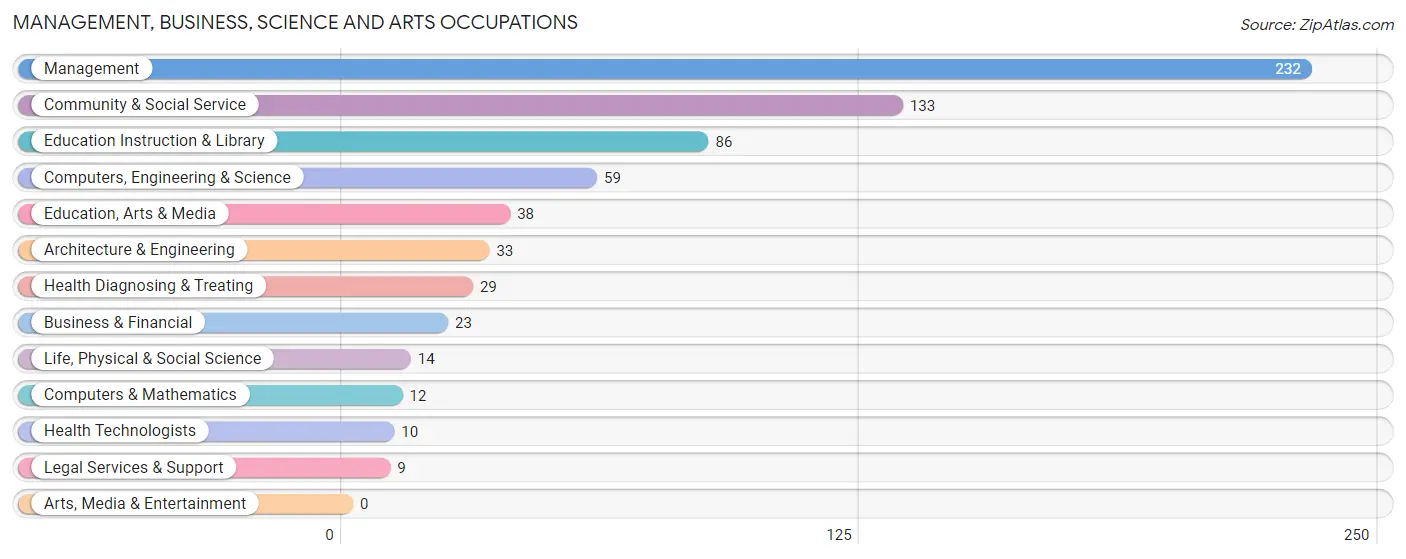
Management, Business, Science and Arts Occupations
The most common Management, Business, Science and Arts occupations in Hitchcock County are Management (232 | 19.6%), Community & Social Service (133 | 11.2%), Education Instruction & Library (86 | 7.2%), Computers, Engineering & Science (59 | 5.0%), and Education, Arts & Media (38 | 3.2%).
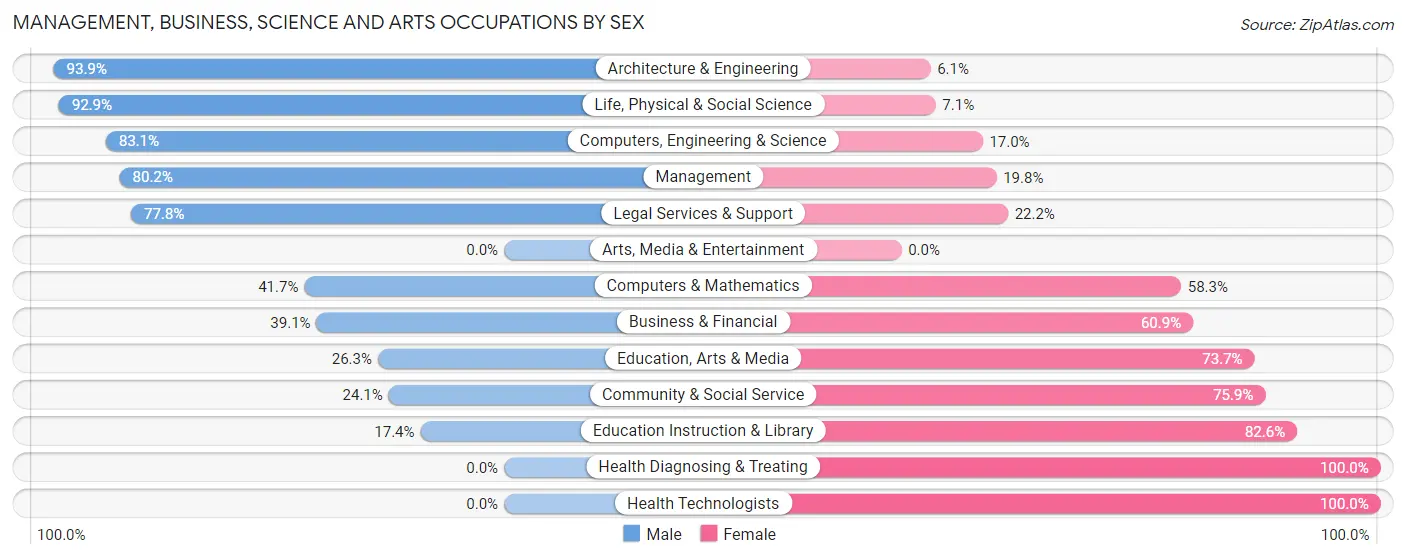
Management, Business, Science and Arts Occupations by Sex
Within the Management, Business, Science and Arts occupations in Hitchcock County, the most male-oriented occupations are Architecture & Engineering (93.9%), Life, Physical & Social Science (92.9%), and Computers, Engineering & Science (83.1%), while the most female-oriented occupations are Health Diagnosing & Treating (100.0%), Health Technologists (100.0%), and Education Instruction & Library (82.6%).
| Occupation | Male | Female |
| Management | 186 (80.2%) | 46 (19.8%) |
| Business & Financial | 9 (39.1%) | 14 (60.9%) |
| Computers, Engineering & Science | 49 (83.1%) | 10 (17.0%) |
| Computers & Mathematics | 5 (41.7%) | 7 (58.3%) |
| Architecture & Engineering | 31 (93.9%) | 2 (6.1%) |
| Life, Physical & Social Science | 13 (92.9%) | 1 (7.1%) |
| Community & Social Service | 32 (24.1%) | 101 (75.9%) |
| Education, Arts & Media | 10 (26.3%) | 28 (73.7%) |
| Legal Services & Support | 7 (77.8%) | 2 (22.2%) |
| Education Instruction & Library | 15 (17.4%) | 71 (82.6%) |
| Arts, Media & Entertainment | 0 (0.0%) | 0 (0.0%) |
| Health Diagnosing & Treating | 0 (0.0%) | 29 (100.0%) |
| Health Technologists | 0 (0.0%) | 10 (100.0%) |
| Total (Category) | 276 (58.0%) | 200 (42.0%) |
| Total (Overall) | 664 (56.0%) | 522 (44.0%) |
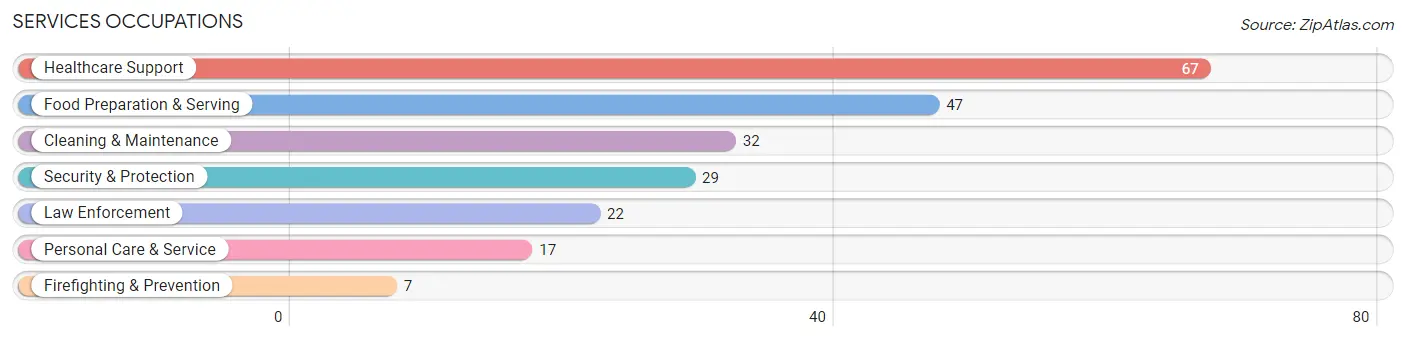
Services Occupations
The most common Services occupations in Hitchcock County are Healthcare Support (67 | 5.7%), Food Preparation & Serving (47 | 4.0%), Cleaning & Maintenance (32 | 2.7%), Security & Protection (29 | 2.5%), and Law Enforcement (22 | 1.8%).
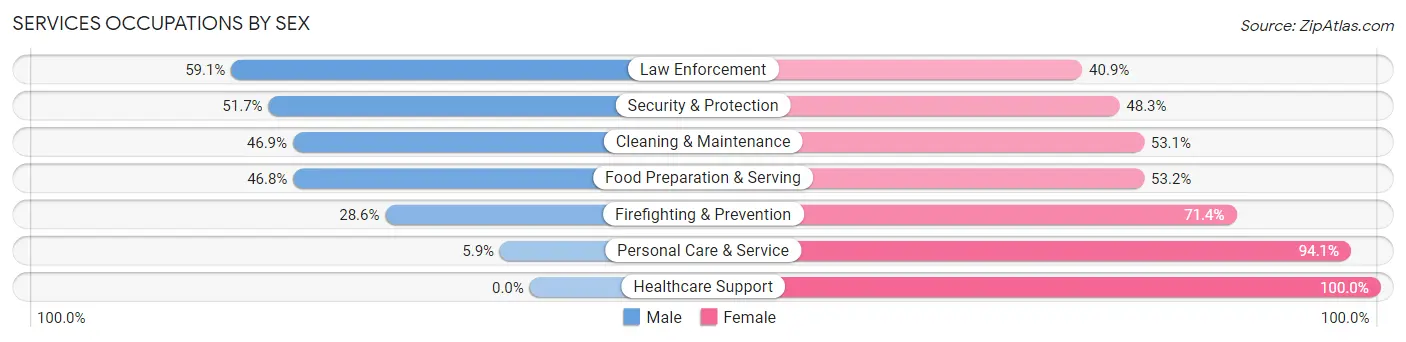
Services Occupations by Sex
Within the Services occupations in Hitchcock County, the most male-oriented occupations are Law Enforcement (59.1%), Security & Protection (51.7%), and Cleaning & Maintenance (46.9%), while the most female-oriented occupations are Healthcare Support (100.0%), Personal Care & Service (94.1%), and Firefighting & Prevention (71.4%).
| Occupation | Male | Female |
| Healthcare Support | 0 (0.0%) | 67 (100.0%) |
| Security & Protection | 15 (51.7%) | 14 (48.3%) |
| Firefighting & Prevention | 2 (28.6%) | 5 (71.4%) |
| Law Enforcement | 13 (59.1%) | 9 (40.9%) |
| Food Preparation & Serving | 22 (46.8%) | 25 (53.2%) |
| Cleaning & Maintenance | 15 (46.9%) | 17 (53.1%) |
| Personal Care & Service | 1 (5.9%) | 16 (94.1%) |
| Total (Category) | 53 (27.6%) | 139 (72.4%) |
| Total (Overall) | 664 (56.0%) | 522 (44.0%) |
Sales and Office Occupations
The most common Sales and Office occupations in Hitchcock County are Sales & Related (138 | 11.6%), and Office & Administration (82 | 6.9%).
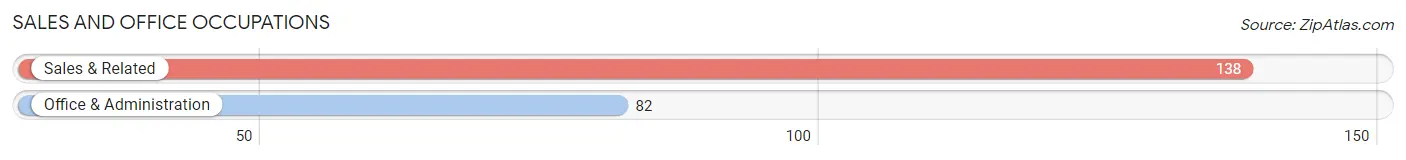
Sales and Office Occupations by Sex
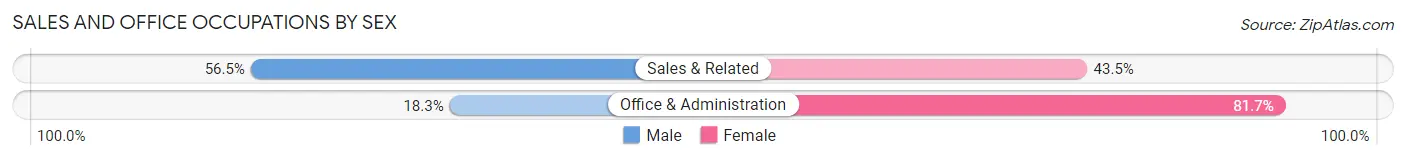
| Occupation | Male | Female |
| Sales & Related | 78 (56.5%) | 60 (43.5%) |
| Office & Administration | 15 (18.3%) | 67 (81.7%) |
| Total (Category) | 93 (42.3%) | 127 (57.7%) |
| Total (Overall) | 664 (56.0%) | 522 (44.0%) |
Natural Resources, Construction and Maintenance Occupations
The most common Natural Resources, Construction and Maintenance occupations in Hitchcock County are Construction & Extraction (53 | 4.5%), Installation, Maintenance & Repair (35 | 2.9%), and Farming, Fishing & Forestry (26 | 2.2%).
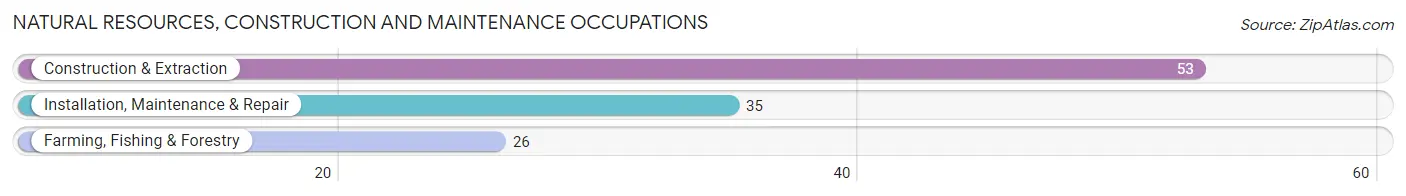
Natural Resources, Construction and Maintenance Occupations by Sex
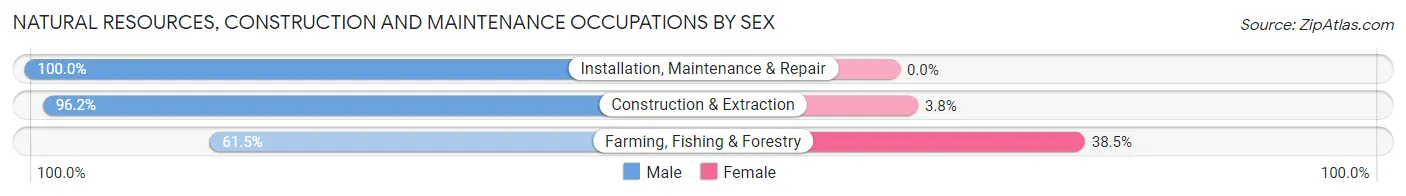
| Occupation | Male | Female |
| Farming, Fishing & Forestry | 16 (61.5%) | 10 (38.5%) |
| Construction & Extraction | 51 (96.2%) | 2 (3.8%) |
| Installation, Maintenance & Repair | 35 (100.0%) | 0 (0.0%) |
| Total (Category) | 102 (89.5%) | 12 (10.5%) |
| Total (Overall) | 664 (56.0%) | 522 (44.0%) |
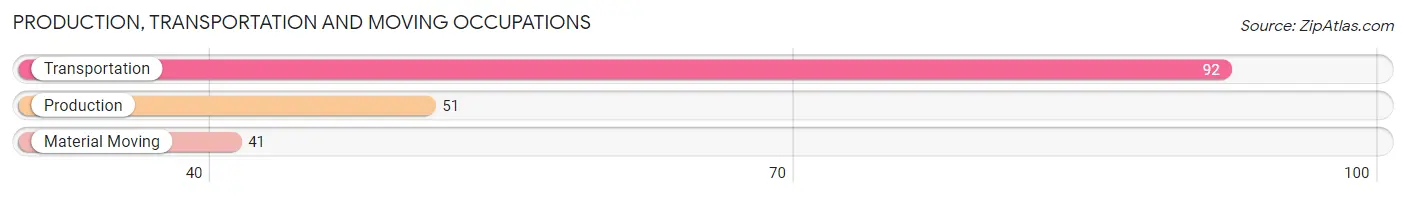
Production, Transportation and Moving Occupations
The most common Production, Transportation and Moving occupations in Hitchcock County are Transportation (92 | 7.8%), Production (51 | 4.3%), and Material Moving (41 | 3.5%).
Production, Transportation and Moving Occupations by Sex
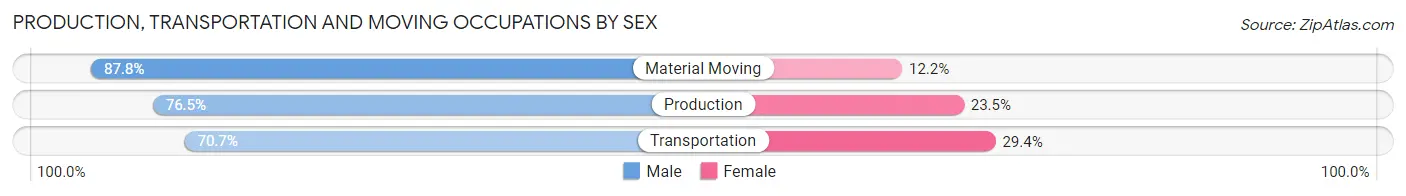
| Occupation | Male | Female |
| Production | 39 (76.5%) | 12 (23.5%) |
| Transportation | 65 (70.7%) | 27 (29.3%) |
| Material Moving | 36 (87.8%) | 5 (12.2%) |
| Total (Category) | 140 (76.1%) | 44 (23.9%) |
| Total (Overall) | 664 (56.0%) | 522 (44.0%) |
Employment Industries by Sex in Hitchcock County
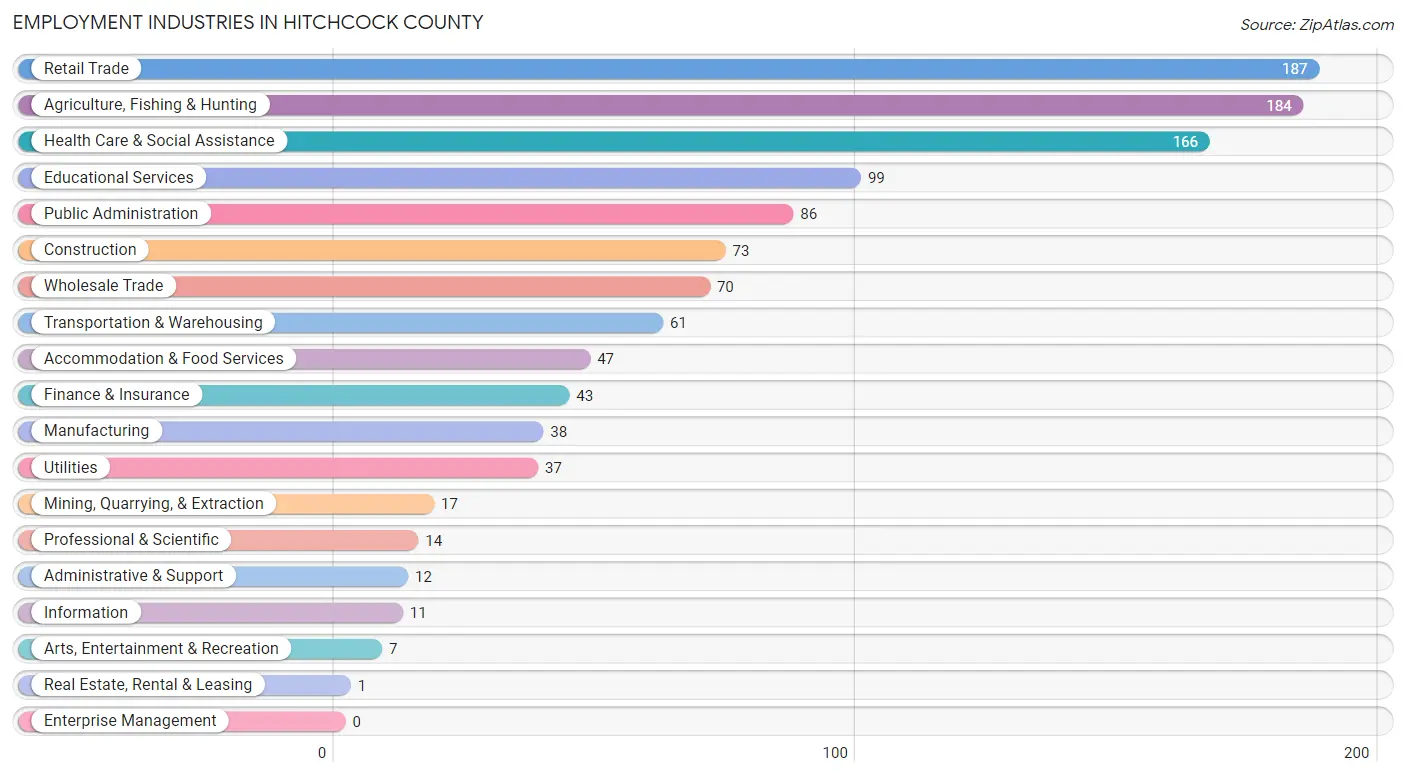
Employment Industries in Hitchcock County
The major employment industries in Hitchcock County include Retail Trade (187 | 15.8%), Agriculture, Fishing & Hunting (184 | 15.5%), Health Care & Social Assistance (166 | 14.0%), Educational Services (99 | 8.4%), and Public Administration (86 | 7.2%).
Employment Industries by Sex in Hitchcock County
The Hitchcock County industries that see more men than women are Mining, Quarrying, & Extraction (100.0%), Utilities (91.9%), and Construction (91.8%), whereas the industries that tend to have a higher number of women are Real Estate, Rental & Leasing (100.0%), Professional & Scientific (92.9%), and Health Care & Social Assistance (91.0%).
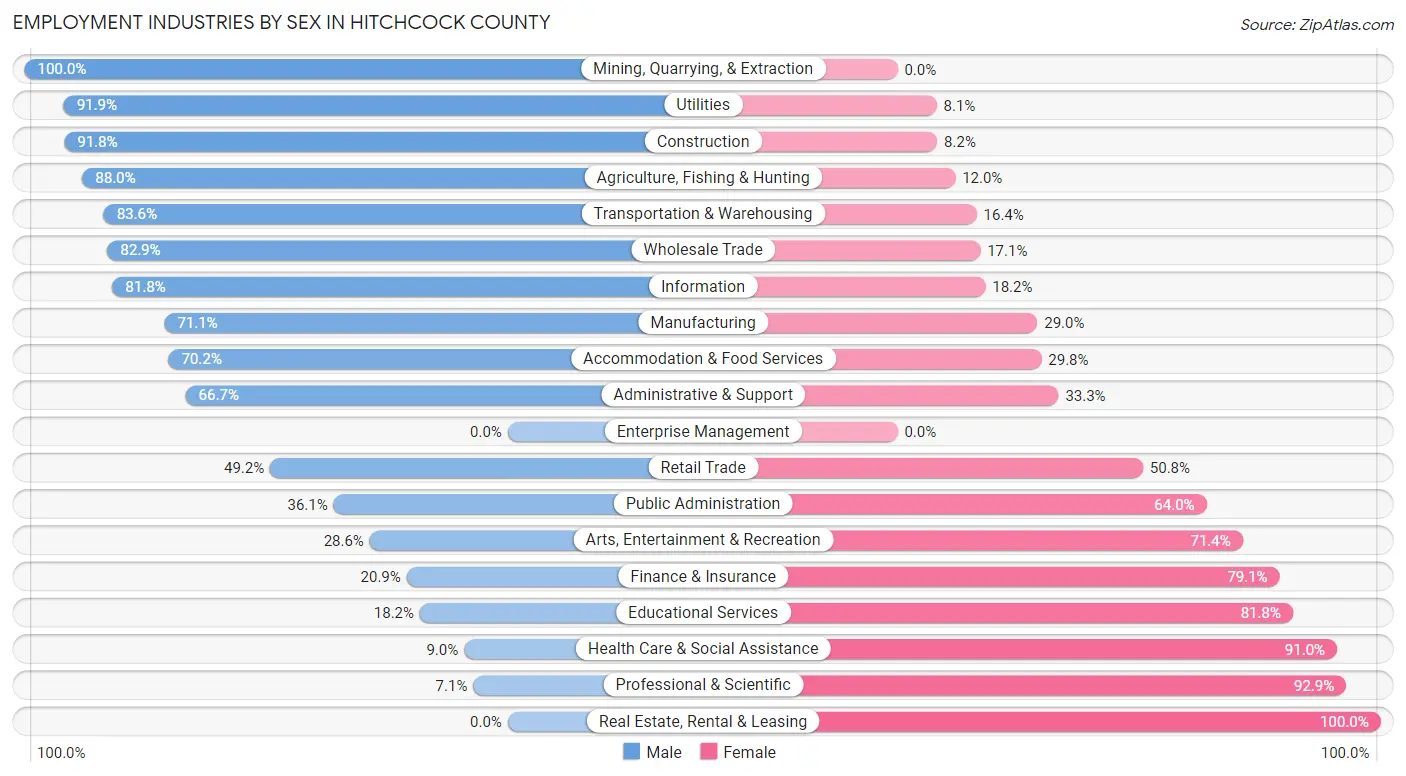
| Industry | Male | Female |
| Agriculture, Fishing & Hunting | 162 (88.0%) | 22 (12.0%) |
| Mining, Quarrying, & Extraction | 17 (100.0%) | 0 (0.0%) |
| Construction | 67 (91.8%) | 6 (8.2%) |
| Manufacturing | 27 (71.1%) | 11 (28.9%) |
| Wholesale Trade | 58 (82.9%) | 12 (17.1%) |
| Retail Trade | 92 (49.2%) | 95 (50.8%) |
| Transportation & Warehousing | 51 (83.6%) | 10 (16.4%) |
| Utilities | 34 (91.9%) | 3 (8.1%) |
| Information | 9 (81.8%) | 2 (18.2%) |
| Finance & Insurance | 9 (20.9%) | 34 (79.1%) |
| Real Estate, Rental & Leasing | 0 (0.0%) | 1 (100.0%) |
| Professional & Scientific | 1 (7.1%) | 13 (92.9%) |
| Enterprise Management | 0 (0.0%) | 0 (0.0%) |
| Administrative & Support | 8 (66.7%) | 4 (33.3%) |
| Educational Services | 18 (18.2%) | 81 (81.8%) |
| Health Care & Social Assistance | 15 (9.0%) | 151 (91.0%) |
| Arts, Entertainment & Recreation | 2 (28.6%) | 5 (71.4%) |
| Accommodation & Food Services | 33 (70.2%) | 14 (29.8%) |
| Public Administration | 31 (36.0%) | 55 (63.9%) |
| Total | 664 (56.0%) | 522 (44.0%) |
Education in Hitchcock County
School Enrollment in Hitchcock County
The most common levels of schooling among the 594 students in Hitchcock County are middle school (203 | 34.2%), high school (156 | 26.3%), and elementary school (102 | 17.2%).
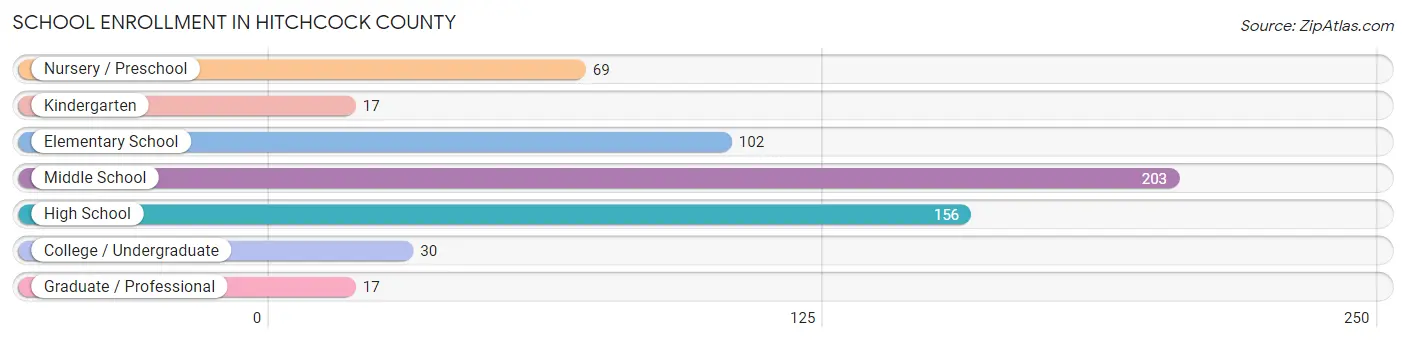
| School Level | # Students | % Students |
| Nursery / Preschool | 69 | 11.6% |
| Kindergarten | 17 | 2.9% |
| Elementary School | 102 | 17.2% |
| Middle School | 203 | 34.2% |
| High School | 156 | 26.3% |
| College / Undergraduate | 30 | 5.1% |
| Graduate / Professional | 17 | 2.9% |
| Total | 594 | 100.0% |
School Enrollment by Age by Funding Source in Hitchcock County
Out of a total of 594 students who are enrolled in schools in Hitchcock County, 36 (6.1%) attend a private institution, while the remaining 558 (93.9%) are enrolled in public schools. The age group of 3 to 4 year olds has the highest likelihood of being enrolled in private schools, with 8 (17.8% in the age bracket) enrolled. Conversely, the age group of 15 to 17 year olds has the lowest likelihood of being enrolled in a private school, with 105 (100.0% in the age bracket) attending a public institution.
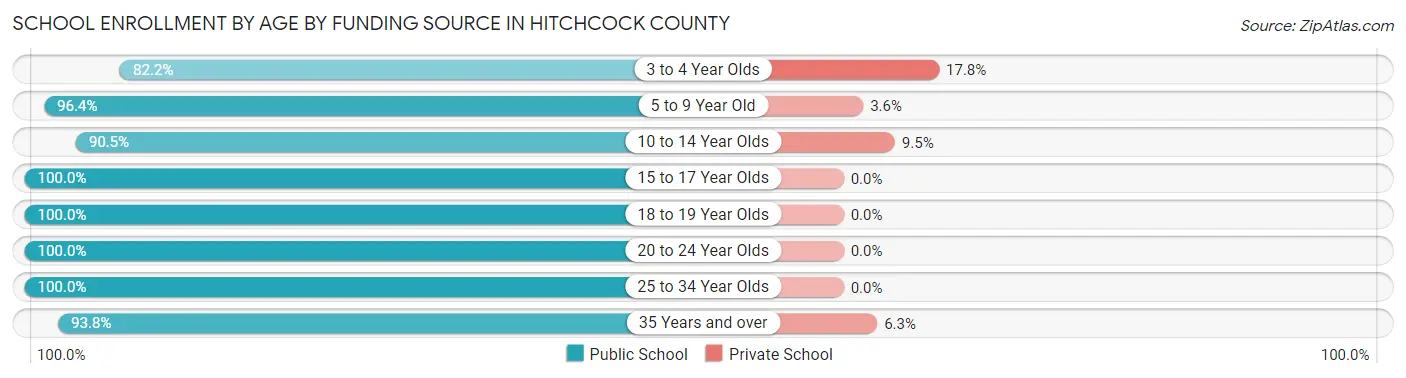
| Age Bracket | Public School | Private School |
| 3 to 4 Year Olds | 37 (82.2%) | 8 (17.8%) |
| 5 to 9 Year Old | 106 (96.4%) | 4 (3.6%) |
| 10 to 14 Year Olds | 218 (90.5%) | 23 (9.5%) |
| 15 to 17 Year Olds | 105 (100.0%) | 0 (0.0%) |
| 18 to 19 Year Olds | 47 (100.0%) | 0 (0.0%) |
| 20 to 24 Year Olds | 25 (100.0%) | 0 (0.0%) |
| 25 to 34 Year Olds | 5 (100.0%) | 0 (0.0%) |
| 35 Years and over | 15 (93.8%) | 1 (6.2%) |
| Total | 558 (93.9%) | 36 (6.1%) |
Educational Attainment by Field of Study in Hitchcock County
Education (147 | 40.9%), bio, nature & agricultural (76 | 21.2%), business (52 | 14.5%), science & technology (24 | 6.7%), and arts & humanities (11 | 3.1%) are the most common fields of study among 359 individuals in Hitchcock County who have obtained a bachelor's degree or higher.
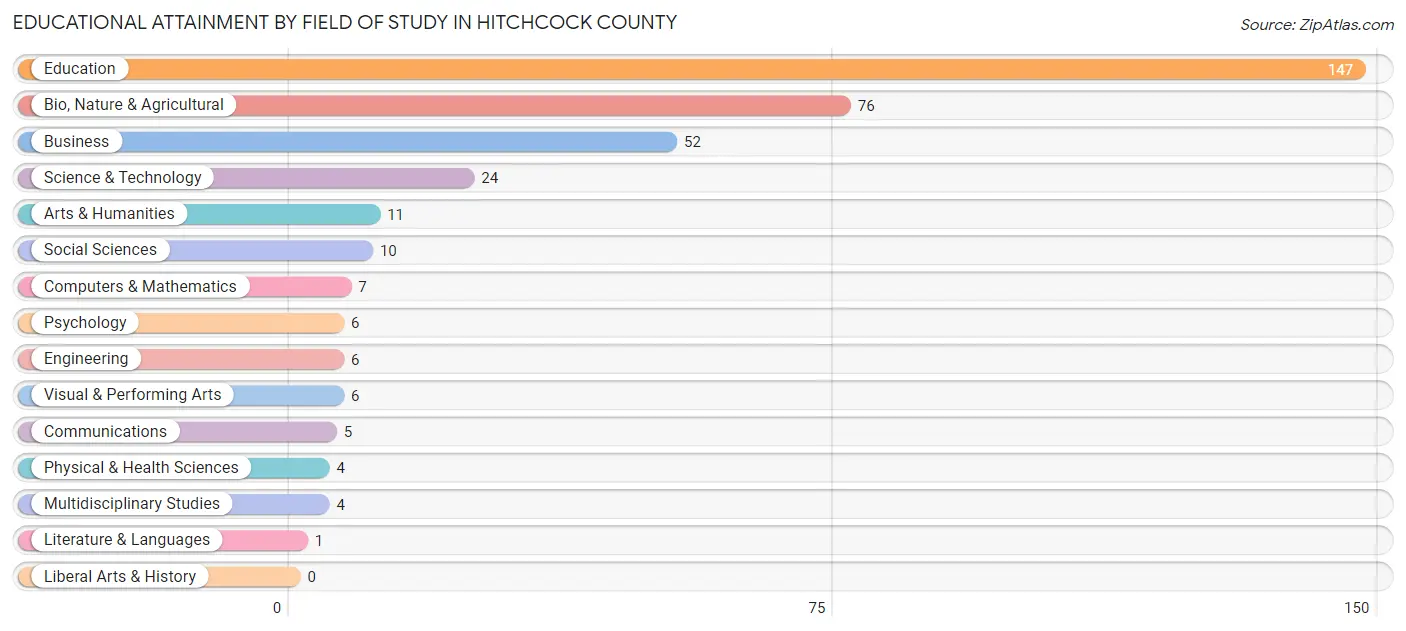
| Field of Study | # Graduates | % Graduates |
| Computers & Mathematics | 7 | 1.9% |
| Bio, Nature & Agricultural | 76 | 21.2% |
| Physical & Health Sciences | 4 | 1.1% |
| Psychology | 6 | 1.7% |
| Social Sciences | 10 | 2.8% |
| Engineering | 6 | 1.7% |
| Multidisciplinary Studies | 4 | 1.1% |
| Science & Technology | 24 | 6.7% |
| Business | 52 | 14.5% |
| Education | 147 | 40.9% |
| Literature & Languages | 1 | 0.3% |
| Liberal Arts & History | 0 | 0.0% |
| Visual & Performing Arts | 6 | 1.7% |
| Communications | 5 | 1.4% |
| Arts & Humanities | 11 | 3.1% |
| Total | 359 | 100.0% |
Transportation & Commute in Hitchcock County
Vehicle Availability by Sex in Hitchcock County
The most prevalent vehicle ownership categories in Hitchcock County are males with 2 vehicles (269, accounting for 41.5%) and females with 2 vehicles (175, making up 56.3%).
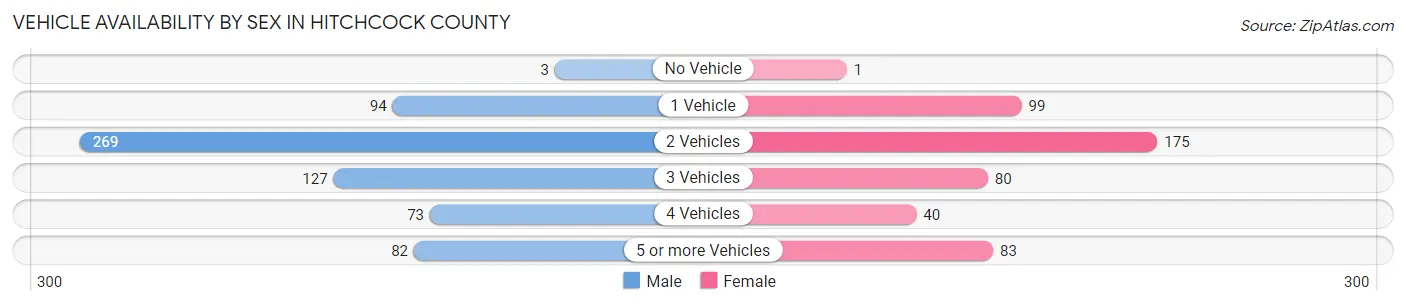
| Vehicles Available | Male | Female |
| No Vehicle | 3 (0.5%) | 1 (0.2%) |
| 1 Vehicle | 94 (14.5%) | 99 (20.7%) |
| 2 Vehicles | 269 (41.5%) | 175 (36.6%) |
| 3 Vehicles | 127 (19.6%) | 80 (16.7%) |
| 4 Vehicles | 73 (11.3%) | 40 (8.4%) |
| 5 or more Vehicles | 82 (12.7%) | 83 (17.4%) |
| Total | 648 (100.0%) | 478 (100.0%) |
Commute Time in Hitchcock County
The most frequently occuring commute durations in Hitchcock County are 15 to 19 minutes (279 commuters, 26.8%), less than 5 minutes (138 commuters, 13.3%), and 5 to 9 minutes (129 commuters, 12.4%).
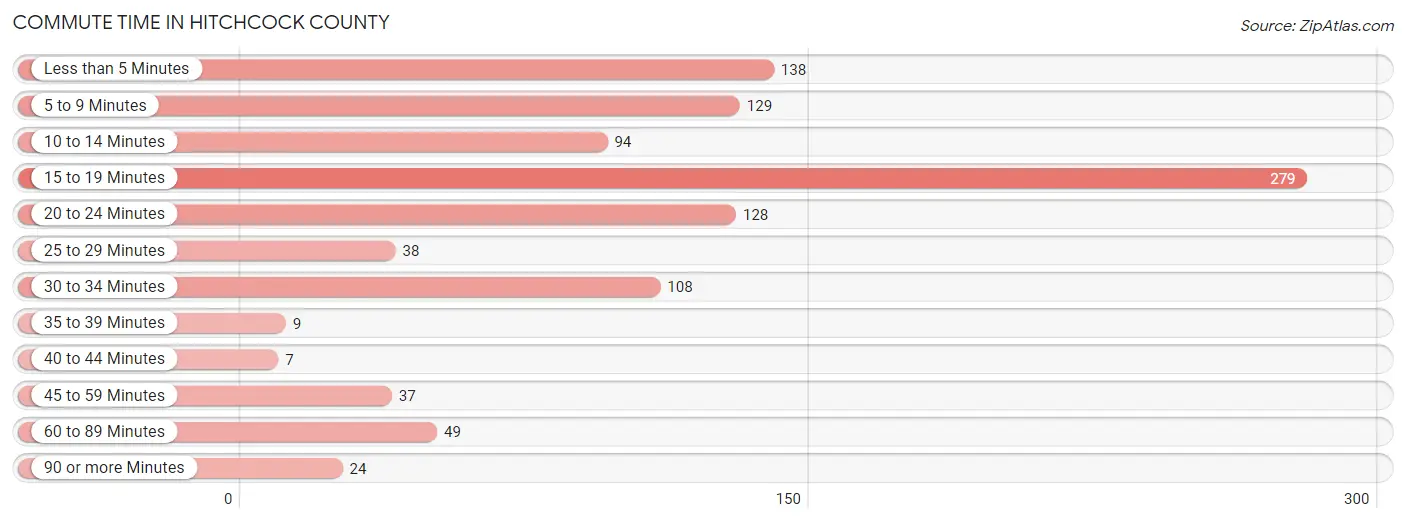
| Commute Time | # Commuters | % Commuters |
| Less than 5 Minutes | 138 | 13.3% |
| 5 to 9 Minutes | 129 | 12.4% |
| 10 to 14 Minutes | 94 | 9.0% |
| 15 to 19 Minutes | 279 | 26.8% |
| 20 to 24 Minutes | 128 | 12.3% |
| 25 to 29 Minutes | 38 | 3.6% |
| 30 to 34 Minutes | 108 | 10.4% |
| 35 to 39 Minutes | 9 | 0.9% |
| 40 to 44 Minutes | 7 | 0.7% |
| 45 to 59 Minutes | 37 | 3.6% |
| 60 to 89 Minutes | 49 | 4.7% |
| 90 or more Minutes | 24 | 2.3% |
Commute Time by Sex in Hitchcock County
The most common commute times in Hitchcock County are 15 to 19 minutes (137 commuters, 22.5%) for males and 15 to 19 minutes (142 commuters, 33.0%) for females.
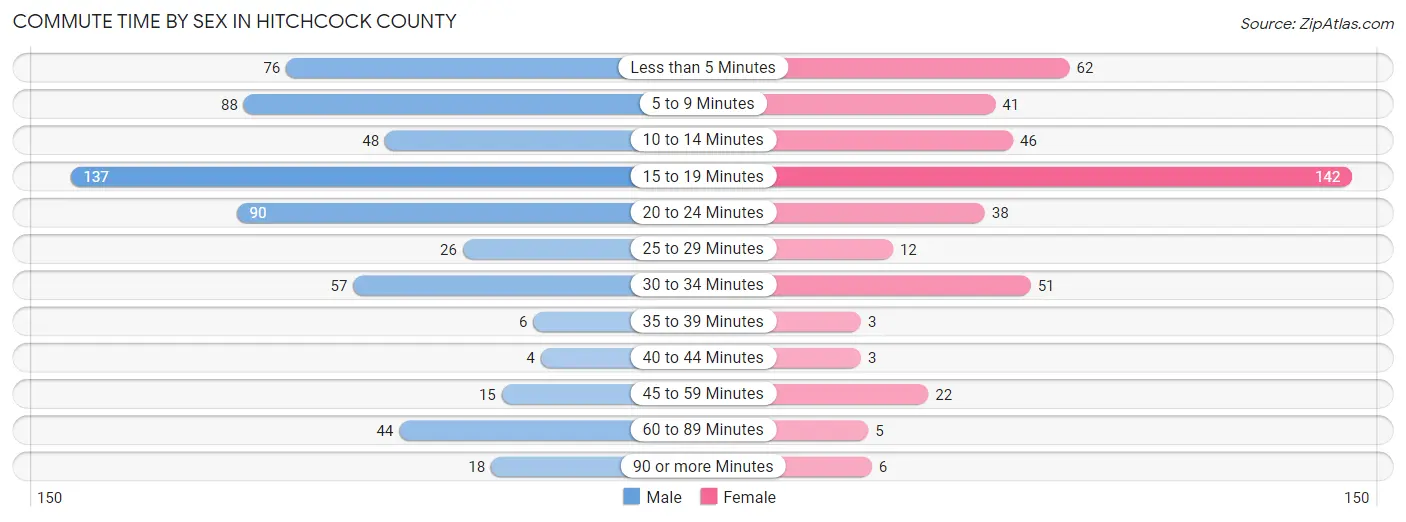
| Commute Time | Male | Female |
| Less than 5 Minutes | 76 (12.5%) | 62 (14.4%) |
| 5 to 9 Minutes | 88 (14.4%) | 41 (9.5%) |
| 10 to 14 Minutes | 48 (7.9%) | 46 (10.7%) |
| 15 to 19 Minutes | 137 (22.5%) | 142 (33.0%) |
| 20 to 24 Minutes | 90 (14.8%) | 38 (8.8%) |
| 25 to 29 Minutes | 26 (4.3%) | 12 (2.8%) |
| 30 to 34 Minutes | 57 (9.4%) | 51 (11.8%) |
| 35 to 39 Minutes | 6 (1.0%) | 3 (0.7%) |
| 40 to 44 Minutes | 4 (0.7%) | 3 (0.7%) |
| 45 to 59 Minutes | 15 (2.5%) | 22 (5.1%) |
| 60 to 89 Minutes | 44 (7.2%) | 5 (1.2%) |
| 90 or more Minutes | 18 (3.0%) | 6 (1.4%) |
Time of Departure to Work by Sex in Hitchcock County
The most frequent times of departure to work in Hitchcock County are 7:00 AM to 7:29 AM (156, 25.6%) for males and 7:30 AM to 7:59 AM (95, 22.0%) for females.
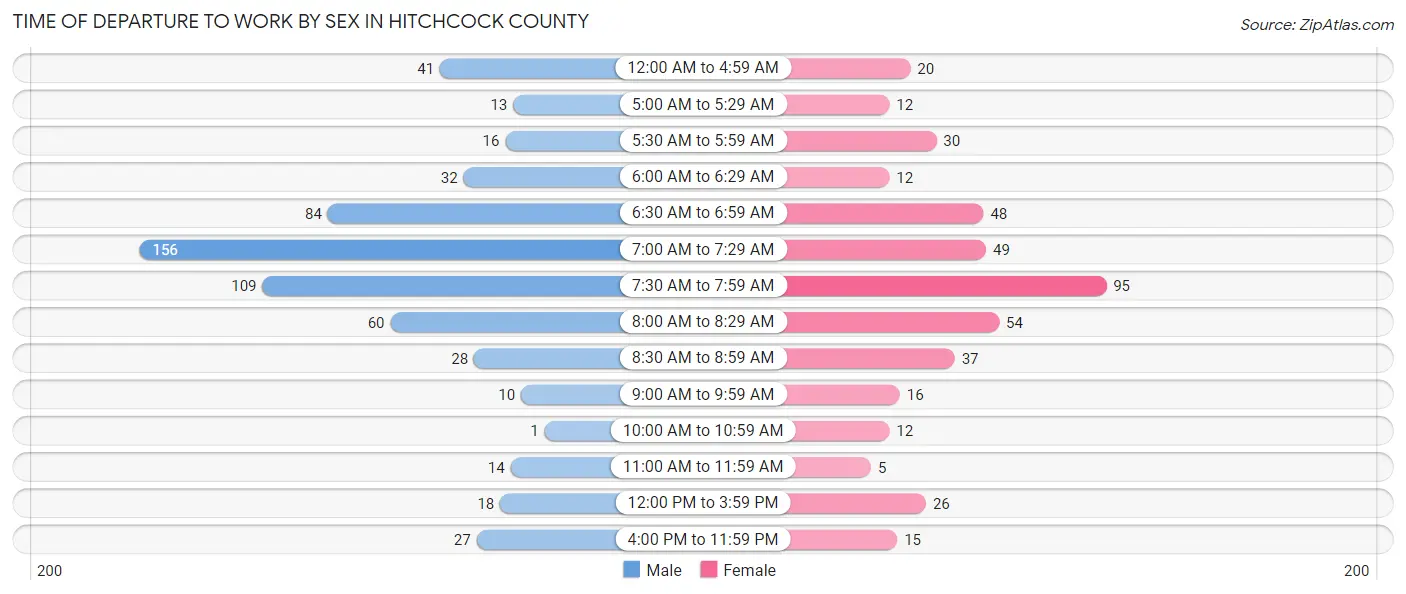
| Time of Departure | Male | Female |
| 12:00 AM to 4:59 AM | 41 (6.7%) | 20 (4.6%) |
| 5:00 AM to 5:29 AM | 13 (2.1%) | 12 (2.8%) |
| 5:30 AM to 5:59 AM | 16 (2.6%) | 30 (7.0%) |
| 6:00 AM to 6:29 AM | 32 (5.2%) | 12 (2.8%) |
| 6:30 AM to 6:59 AM | 84 (13.8%) | 48 (11.1%) |
| 7:00 AM to 7:29 AM | 156 (25.6%) | 49 (11.4%) |
| 7:30 AM to 7:59 AM | 109 (17.9%) | 95 (22.0%) |
| 8:00 AM to 8:29 AM | 60 (9.9%) | 54 (12.5%) |
| 8:30 AM to 8:59 AM | 28 (4.6%) | 37 (8.6%) |
| 9:00 AM to 9:59 AM | 10 (1.6%) | 16 (3.7%) |
| 10:00 AM to 10:59 AM | 1 (0.2%) | 12 (2.8%) |
| 11:00 AM to 11:59 AM | 14 (2.3%) | 5 (1.2%) |
| 12:00 PM to 3:59 PM | 18 (3.0%) | 26 (6.0%) |
| 4:00 PM to 11:59 PM | 27 (4.4%) | 15 (3.5%) |
| Total | 609 (100.0%) | 431 (100.0%) |
Housing Occupancy in Hitchcock County
Occupancy by Ownership in Hitchcock County
Of the total 1,109 dwellings in Hitchcock County, owner-occupied units account for 856 (77.2%), while renter-occupied units make up 253 (22.8%).
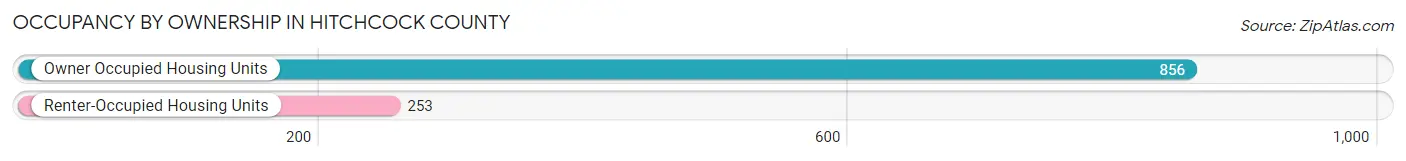
| Occupancy | # Housing Units | % Housing Units |
| Owner Occupied Housing Units | 856 | 77.2% |
| Renter-Occupied Housing Units | 253 | 22.8% |
| Total Occupied Housing Units | 1,109 | 100.0% |
Occupancy by Household Size in Hitchcock County
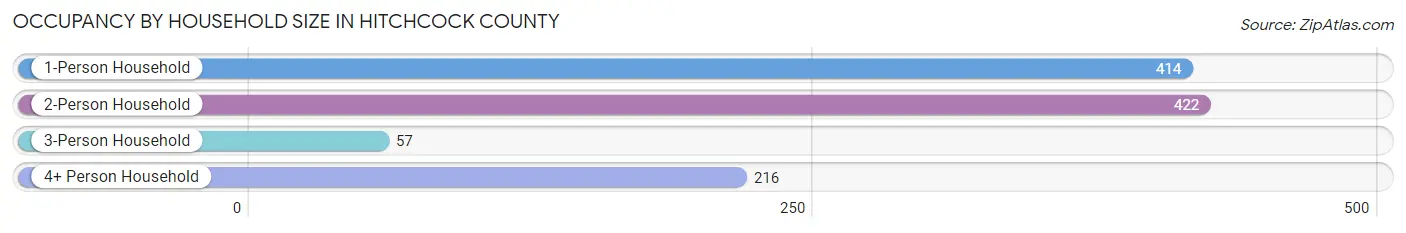
| Household Size | # Housing Units | % Housing Units |
| 1-Person Household | 414 | 37.3% |
| 2-Person Household | 422 | 38.1% |
| 3-Person Household | 57 | 5.1% |
| 4+ Person Household | 216 | 19.5% |
| Total Housing Units | 1,109 | 100.0% |
Occupancy by Ownership by Household Size in Hitchcock County
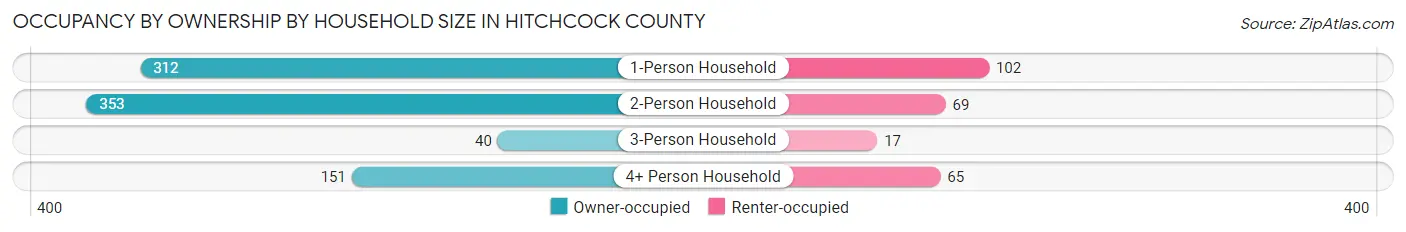
| Household Size | Owner-occupied | Renter-occupied |
| 1-Person Household | 312 (75.4%) | 102 (24.6%) |
| 2-Person Household | 353 (83.7%) | 69 (16.4%) |
| 3-Person Household | 40 (70.2%) | 17 (29.8%) |
| 4+ Person Household | 151 (69.9%) | 65 (30.1%) |
| Total Housing Units | 856 (77.2%) | 253 (22.8%) |
Occupancy by Educational Attainment in Hitchcock County
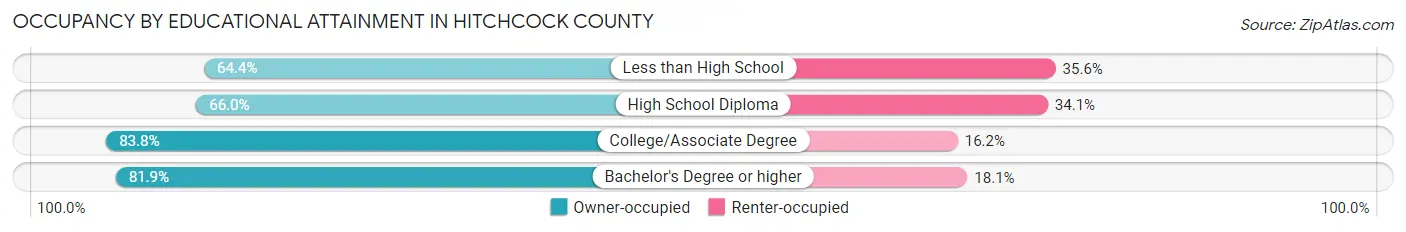
| Household Size | Owner-occupied | Renter-occupied |
| Less than High School | 38 (64.4%) | 21 (35.6%) |
| High School Diploma | 215 (65.9%) | 111 (34.1%) |
| College/Associate Degree | 440 (83.8%) | 85 (16.2%) |
| Bachelor's Degree or higher | 163 (81.9%) | 36 (18.1%) |
Occupancy by Age of Householder in Hitchcock County
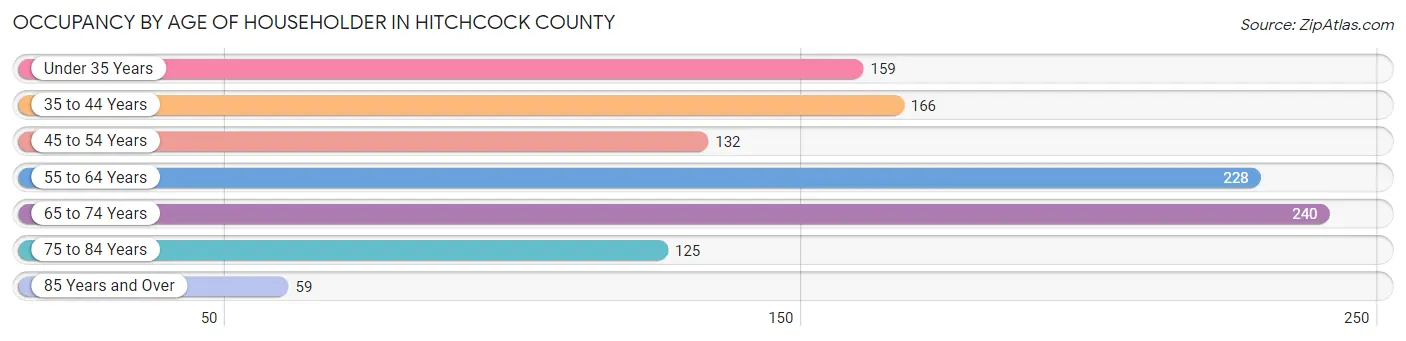
| Age Bracket | # Households | % Households |
| Under 35 Years | 159 | 14.3% |
| 35 to 44 Years | 166 | 15.0% |
| 45 to 54 Years | 132 | 11.9% |
| 55 to 64 Years | 228 | 20.6% |
| 65 to 74 Years | 240 | 21.6% |
| 75 to 84 Years | 125 | 11.3% |
| 85 Years and Over | 59 | 5.3% |
| Total | 1,109 | 100.0% |
Housing Finances in Hitchcock County
Median Income by Occupancy in Hitchcock County
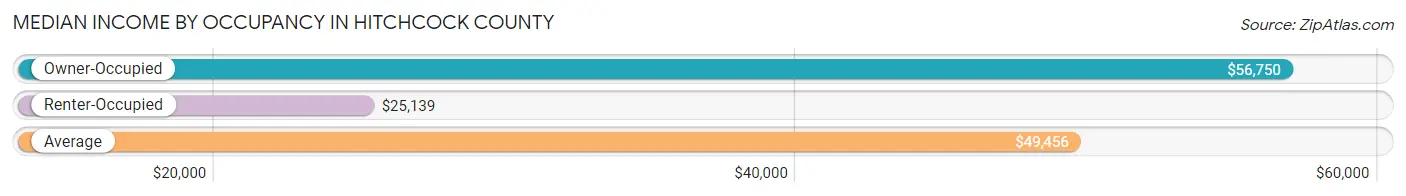
| Occupancy Type | # Households | Median Income |
| Owner-Occupied | 856 (77.2%) | $56,750 |
| Renter-Occupied | 253 (22.8%) | $25,139 |
| Average | 1,109 (100.0%) | $49,456 |
Occupancy by Householder Income Bracket in Hitchcock County
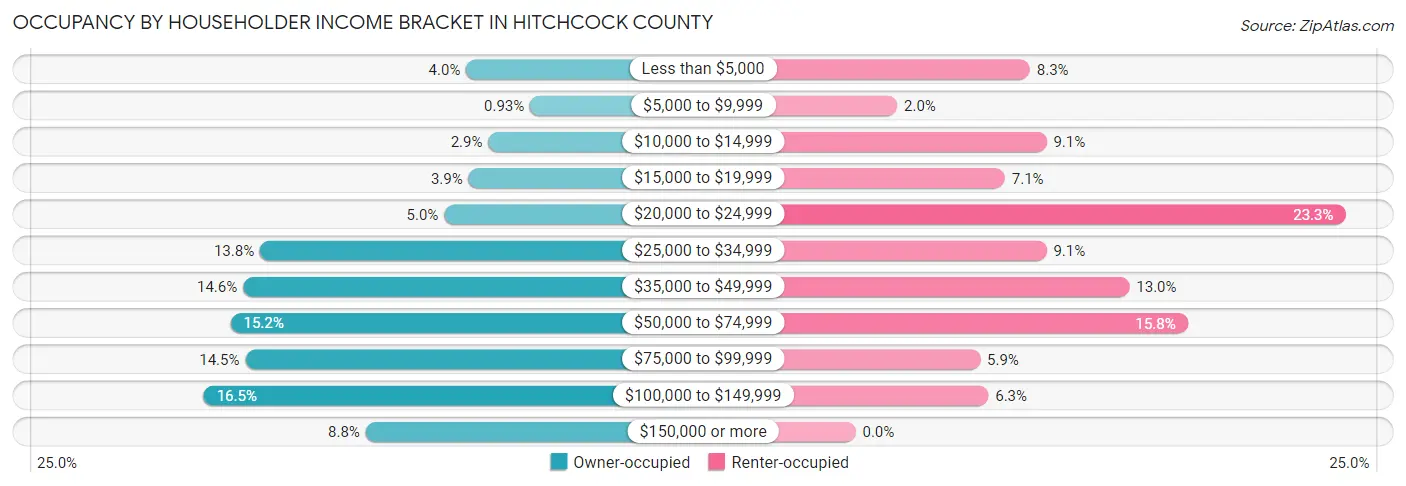
| Income Bracket | Owner-occupied | Renter-occupied |
| Less than $5,000 | 34 (4.0%) | 21 (8.3%) |
| $5,000 to $9,999 | 8 (0.9%) | 5 (2.0%) |
| $10,000 to $14,999 | 25 (2.9%) | 23 (9.1%) |
| $15,000 to $19,999 | 33 (3.9%) | 18 (7.1%) |
| $20,000 to $24,999 | 43 (5.0%) | 59 (23.3%) |
| $25,000 to $34,999 | 118 (13.8%) | 23 (9.1%) |
| $35,000 to $49,999 | 125 (14.6%) | 33 (13.0%) |
| $50,000 to $74,999 | 130 (15.2%) | 40 (15.8%) |
| $75,000 to $99,999 | 124 (14.5%) | 15 (5.9%) |
| $100,000 to $149,999 | 141 (16.5%) | 16 (6.3%) |
| $150,000 or more | 75 (8.8%) | 0 (0.0%) |
| Total | 856 (100.0%) | 253 (100.0%) |
Monthly Housing Cost Tiers in Hitchcock County
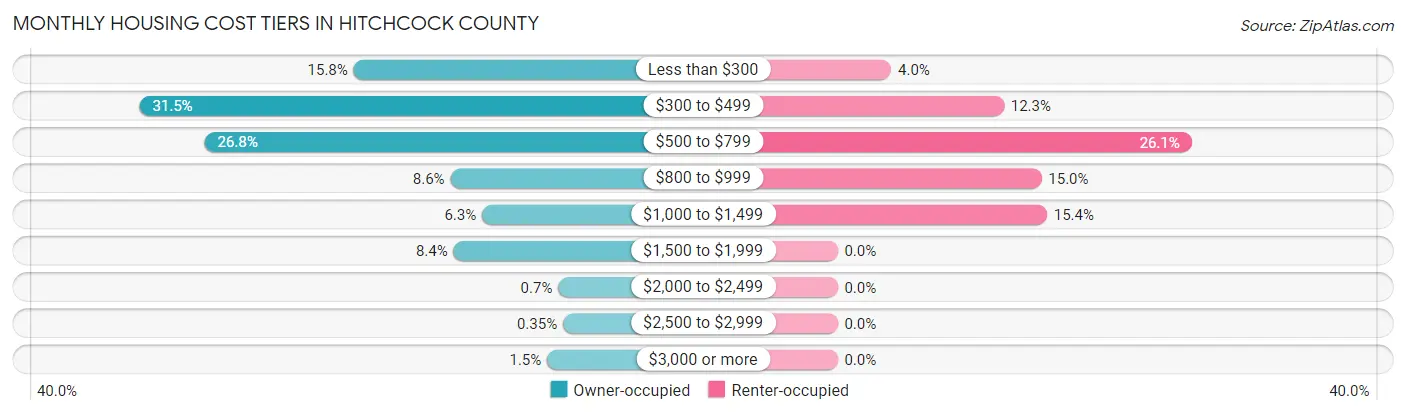
| Monthly Cost | Owner-occupied | Renter-occupied |
| Less than $300 | 135 (15.8%) | 10 (4.0%) |
| $300 to $499 | 270 (31.5%) | 31 (12.2%) |
| $500 to $799 | 229 (26.8%) | 66 (26.1%) |
| $800 to $999 | 74 (8.6%) | 38 (15.0%) |
| $1,000 to $1,499 | 54 (6.3%) | 39 (15.4%) |
| $1,500 to $1,999 | 72 (8.4%) | 0 (0.0%) |
| $2,000 to $2,499 | 6 (0.7%) | 0 (0.0%) |
| $2,500 to $2,999 | 3 (0.4%) | 0 (0.0%) |
| $3,000 or more | 13 (1.5%) | 0 (0.0%) |
| Total | 856 (100.0%) | 253 (100.0%) |
Physical Housing Characteristics in Hitchcock County
Housing Structures in Hitchcock County
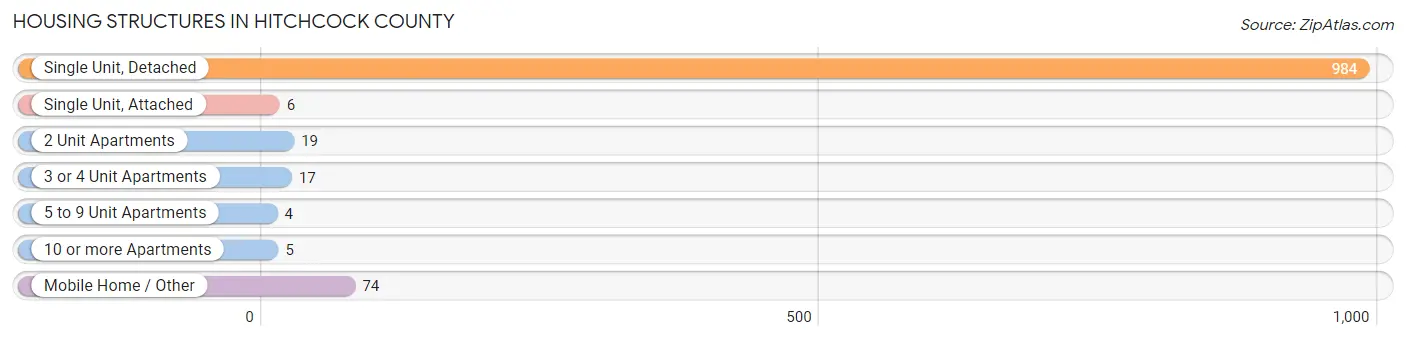
| Structure Type | # Housing Units | % Housing Units |
| Single Unit, Detached | 984 | 88.7% |
| Single Unit, Attached | 6 | 0.5% |
| 2 Unit Apartments | 19 | 1.7% |
| 3 or 4 Unit Apartments | 17 | 1.5% |
| 5 to 9 Unit Apartments | 4 | 0.4% |
| 10 or more Apartments | 5 | 0.4% |
| Mobile Home / Other | 74 | 6.7% |
| Total | 1,109 | 100.0% |
Housing Structures by Occupancy in Hitchcock County
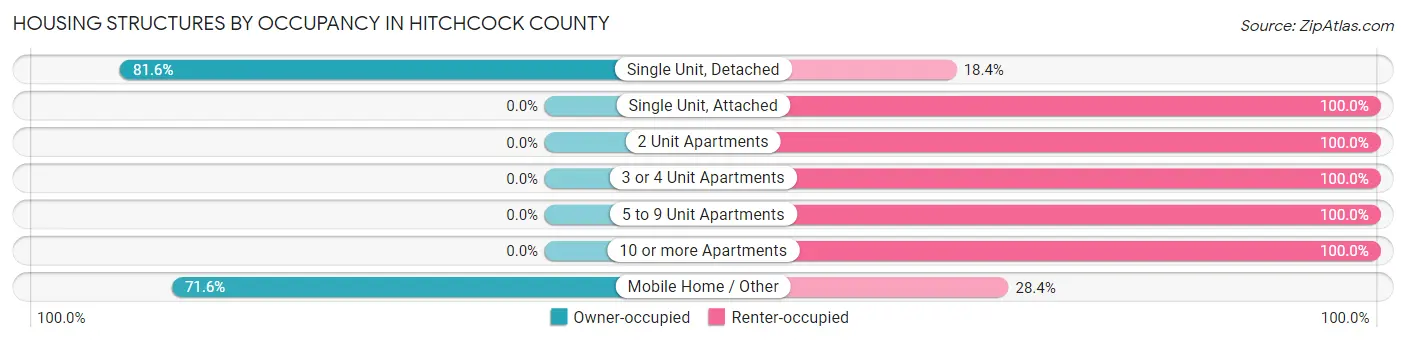
| Structure Type | Owner-occupied | Renter-occupied |
| Single Unit, Detached | 803 (81.6%) | 181 (18.4%) |
| Single Unit, Attached | 0 (0.0%) | 6 (100.0%) |
| 2 Unit Apartments | 0 (0.0%) | 19 (100.0%) |
| 3 or 4 Unit Apartments | 0 (0.0%) | 17 (100.0%) |
| 5 to 9 Unit Apartments | 0 (0.0%) | 4 (100.0%) |
| 10 or more Apartments | 0 (0.0%) | 5 (100.0%) |
| Mobile Home / Other | 53 (71.6%) | 21 (28.4%) |
| Total | 856 (77.2%) | 253 (22.8%) |
Housing Structures by Number of Rooms in Hitchcock County
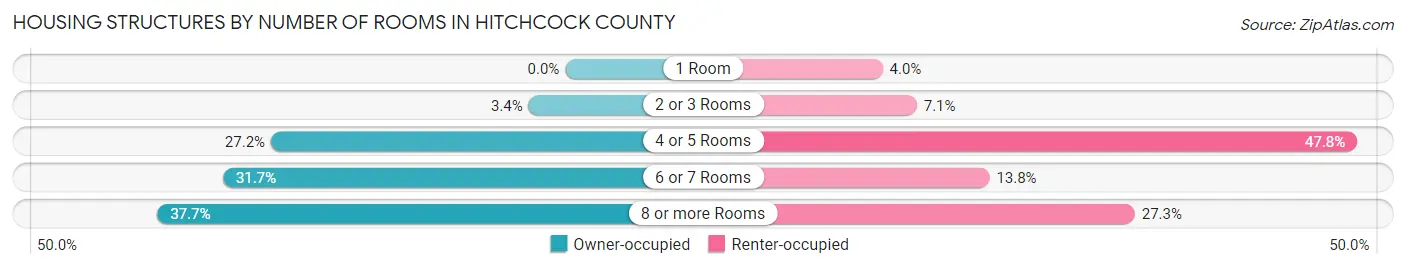
| Number of Rooms | Owner-occupied | Renter-occupied |
| 1 Room | 0 (0.0%) | 10 (4.0%) |
| 2 or 3 Rooms | 29 (3.4%) | 18 (7.1%) |
| 4 or 5 Rooms | 233 (27.2%) | 121 (47.8%) |
| 6 or 7 Rooms | 271 (31.7%) | 35 (13.8%) |
| 8 or more Rooms | 323 (37.7%) | 69 (27.3%) |
| Total | 856 (100.0%) | 253 (100.0%) |
Housing Structure by Heating Type in Hitchcock County
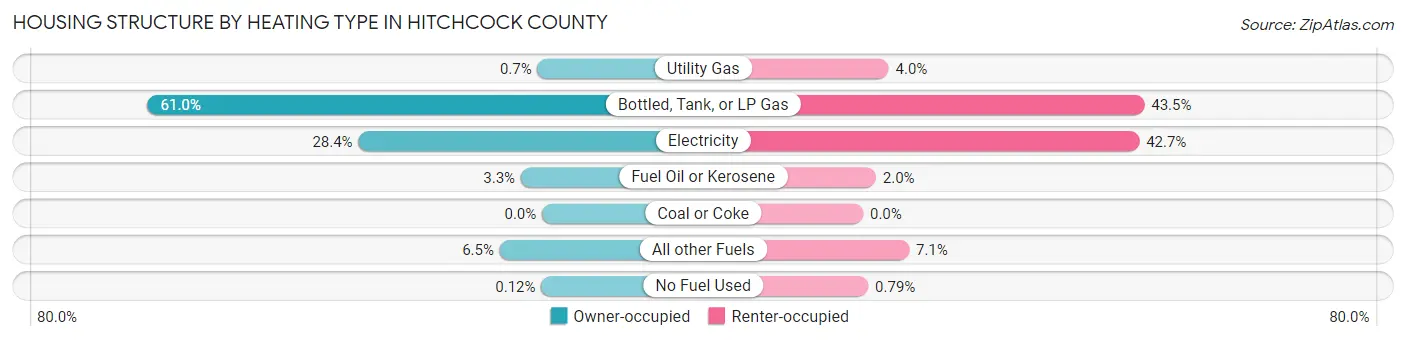
| Heating Type | Owner-occupied | Renter-occupied |
| Utility Gas | 6 (0.7%) | 10 (4.0%) |
| Bottled, Tank, or LP Gas | 522 (61.0%) | 110 (43.5%) |
| Electricity | 243 (28.4%) | 108 (42.7%) |
| Fuel Oil or Kerosene | 28 (3.3%) | 5 (2.0%) |
| Coal or Coke | 0 (0.0%) | 0 (0.0%) |
| All other Fuels | 56 (6.5%) | 18 (7.1%) |
| No Fuel Used | 1 (0.1%) | 2 (0.8%) |
| Total | 856 (100.0%) | 253 (100.0%) |
Household Vehicle Usage in Hitchcock County
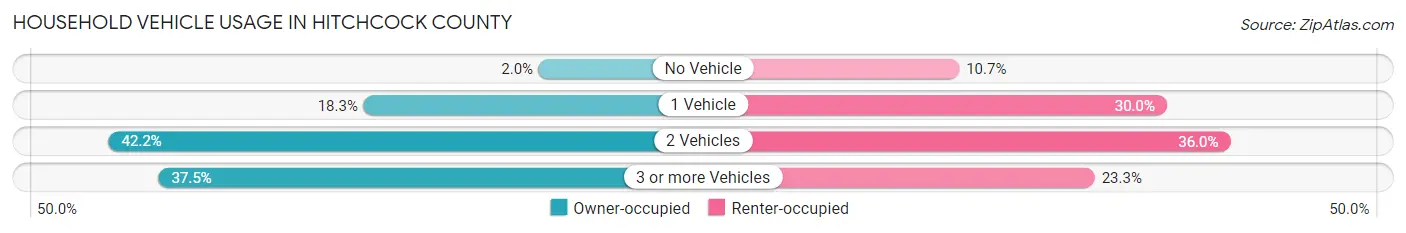
| Vehicles per Household | Owner-occupied | Renter-occupied |
| No Vehicle | 17 (2.0%) | 27 (10.7%) |
| 1 Vehicle | 157 (18.3%) | 76 (30.0%) |
| 2 Vehicles | 361 (42.2%) | 91 (36.0%) |
| 3 or more Vehicles | 321 (37.5%) | 59 (23.3%) |
| Total | 856 (100.0%) | 253 (100.0%) |
Real Estate & Mortgages in Hitchcock County
Real Estate and Mortgage Overview in Hitchcock County
| Characteristic | Without Mortgage | With Mortgage |
| Housing Units | 581 | 275 |
| Median Property Value | $76,700 | $101,400 |
| Median Household Income | $51,458 | $24 |
| Monthly Housing Costs | $422 | $13 |
| Real Estate Taxes | $817 | $5 |
Property Value by Mortgage Status in Hitchcock County
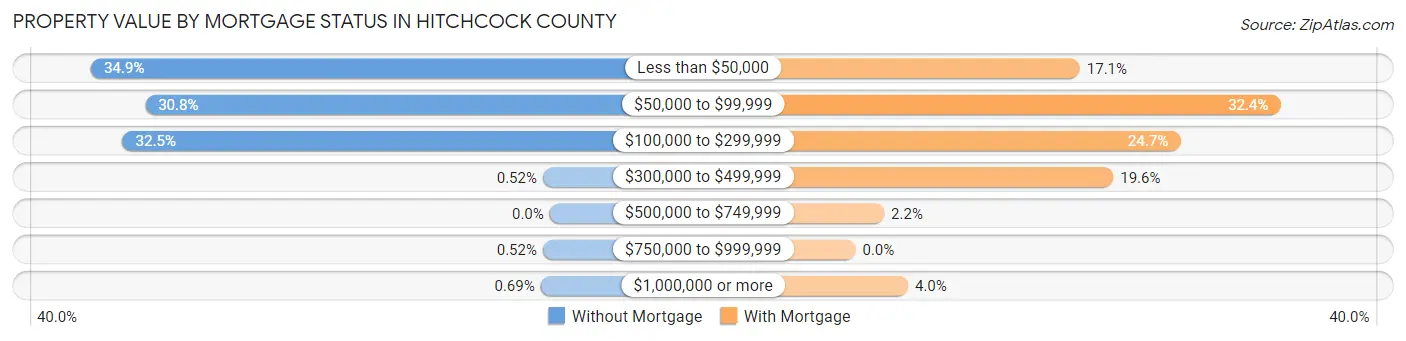
| Property Value | Without Mortgage | With Mortgage |
| Less than $50,000 | 203 (34.9%) | 47 (17.1%) |
| $50,000 to $99,999 | 179 (30.8%) | 89 (32.4%) |
| $100,000 to $299,999 | 189 (32.5%) | 68 (24.7%) |
| $300,000 to $499,999 | 3 (0.5%) | 54 (19.6%) |
| $500,000 to $749,999 | 0 (0.0%) | 6 (2.2%) |
| $750,000 to $999,999 | 3 (0.5%) | 0 (0.0%) |
| $1,000,000 or more | 4 (0.7%) | 11 (4.0%) |
| Total | 581 (100.0%) | 275 (100.0%) |
Household Income by Mortgage Status in Hitchcock County
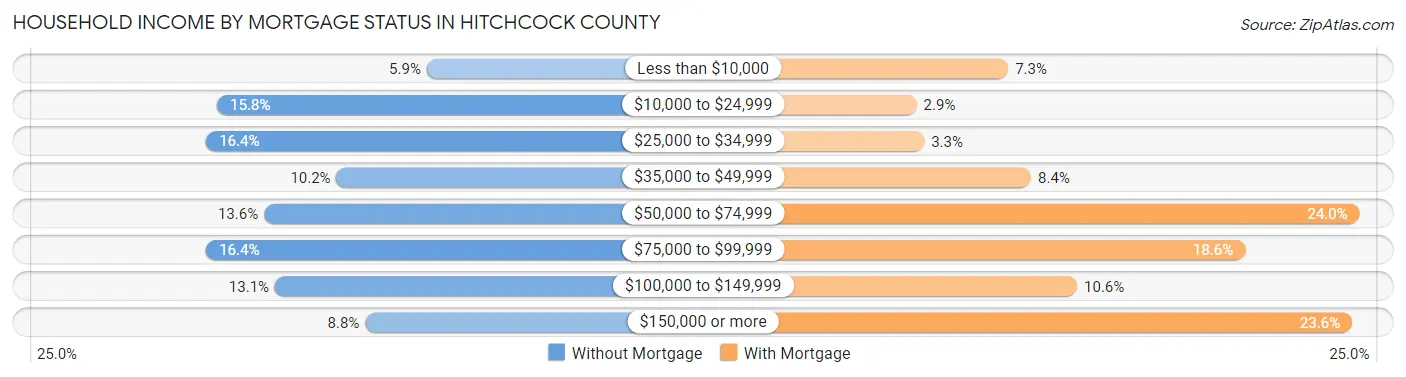
| Household Income | Without Mortgage | With Mortgage |
| Less than $10,000 | 34 (5.9%) | 20 (7.3%) |
| $10,000 to $24,999 | 92 (15.8%) | 8 (2.9%) |
| $25,000 to $34,999 | 95 (16.4%) | 9 (3.3%) |
| $35,000 to $49,999 | 59 (10.2%) | 23 (8.4%) |
| $50,000 to $74,999 | 79 (13.6%) | 66 (24.0%) |
| $75,000 to $99,999 | 95 (16.4%) | 51 (18.5%) |
| $100,000 to $149,999 | 76 (13.1%) | 29 (10.5%) |
| $150,000 or more | 51 (8.8%) | 65 (23.6%) |
| Total | 581 (100.0%) | 275 (100.0%) |
Property Value to Household Income Ratio in Hitchcock County
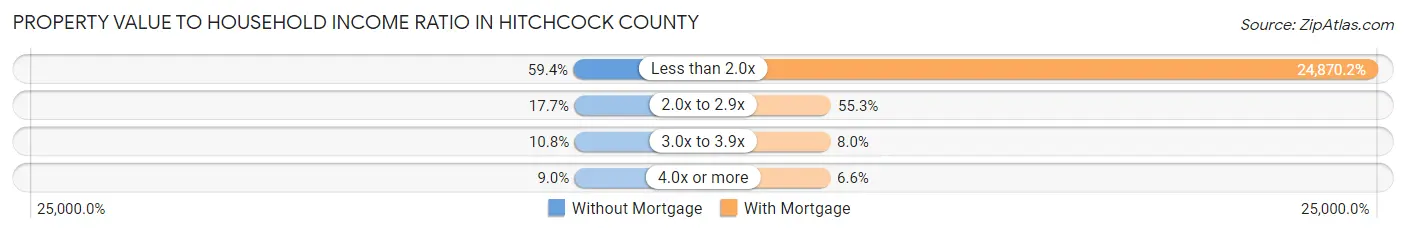
| Value-to-Income Ratio | Without Mortgage | With Mortgage |
| Less than 2.0x | 345 (59.4%) | 68,393 (24,870.2%) |
| 2.0x to 2.9x | 103 (17.7%) | 152 (55.3%) |
| 3.0x to 3.9x | 63 (10.8%) | 22 (8.0%) |
| 4.0x or more | 52 (8.9%) | 18 (6.6%) |
| Total | 581 (100.0%) | 275 (100.0%) |
Real Estate Taxes by Mortgage Status in Hitchcock County
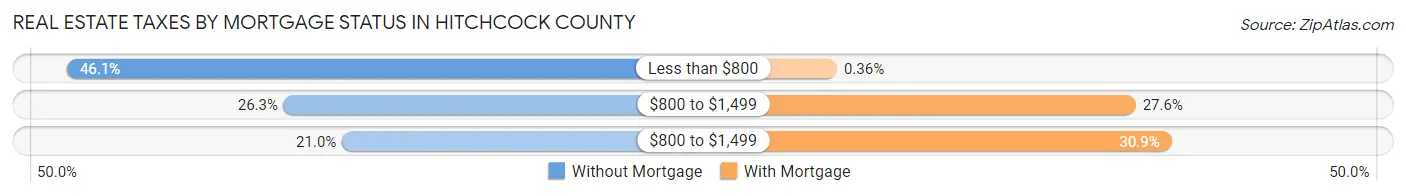
| Property Taxes | Without Mortgage | With Mortgage |
| Less than $800 | 268 (46.1%) | 1 (0.4%) |
| $800 to $1,499 | 153 (26.3%) | 76 (27.6%) |
| $800 to $1,499 | 122 (21.0%) | 85 (30.9%) |
| Total | 581 (100.0%) | 275 (100.0%) |
Health & Disability in Hitchcock County
Health Insurance Coverage by Age in Hitchcock County
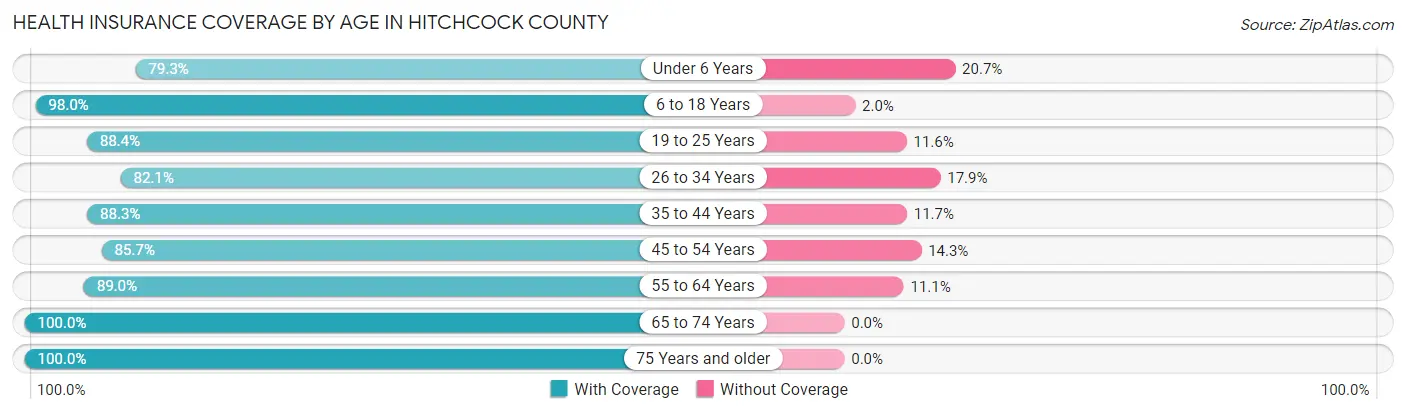
| Age Bracket | With Coverage | Without Coverage |
| Under 6 Years | 165 (79.3%) | 43 (20.7%) |
| 6 to 18 Years | 436 (98.0%) | 9 (2.0%) |
| 19 to 25 Years | 137 (88.4%) | 18 (11.6%) |
| 26 to 34 Years | 188 (82.1%) | 41 (17.9%) |
| 35 to 44 Years | 250 (88.3%) | 33 (11.7%) |
| 45 to 54 Years | 227 (85.7%) | 38 (14.3%) |
| 55 to 64 Years | 322 (88.9%) | 40 (11.1%) |
| 65 to 74 Years | 370 (100.0%) | 0 (0.0%) |
| 75 Years and older | 267 (100.0%) | 0 (0.0%) |
| Total | 2,362 (91.4%) | 222 (8.6%) |
Health Insurance Coverage by Citizenship Status in Hitchcock County
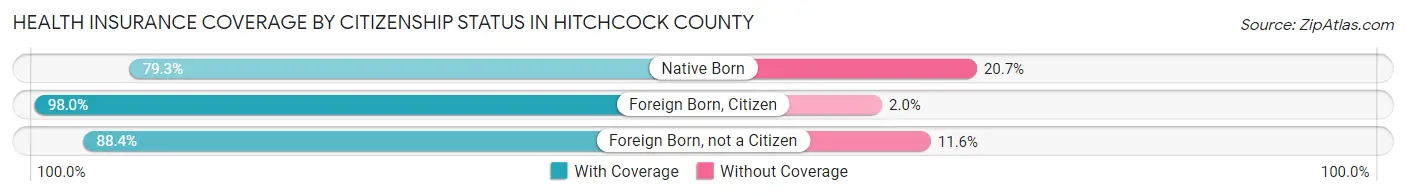
| Citizenship Status | With Coverage | Without Coverage |
| Native Born | 165 (79.3%) | 43 (20.7%) |
| Foreign Born, Citizen | 436 (98.0%) | 9 (2.0%) |
| Foreign Born, not a Citizen | 137 (88.4%) | 18 (11.6%) |
Health Insurance Coverage by Household Income in Hitchcock County
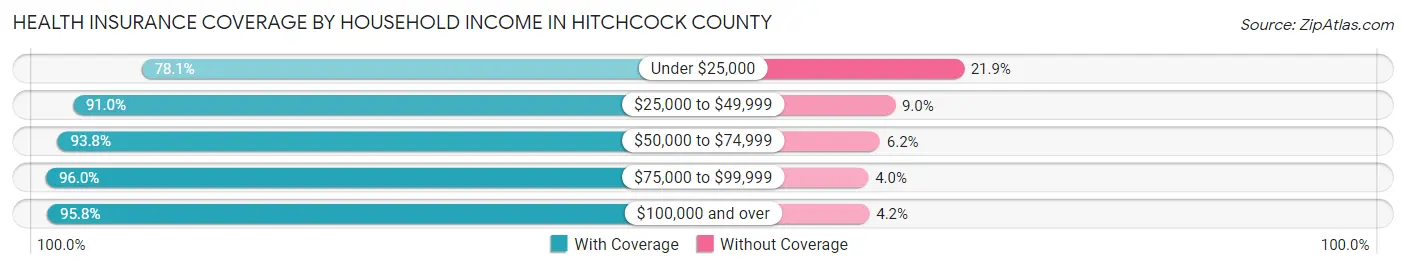
| Household Income | With Coverage | Without Coverage |
| Under $25,000 | 346 (78.1%) | 97 (21.9%) |
| $25,000 to $49,999 | 504 (91.0%) | 50 (9.0%) |
| $50,000 to $74,999 | 424 (93.8%) | 28 (6.2%) |
| $75,000 to $99,999 | 383 (96.0%) | 16 (4.0%) |
| $100,000 and over | 705 (95.8%) | 31 (4.2%) |
Public vs Private Health Insurance Coverage by Age in Hitchcock County
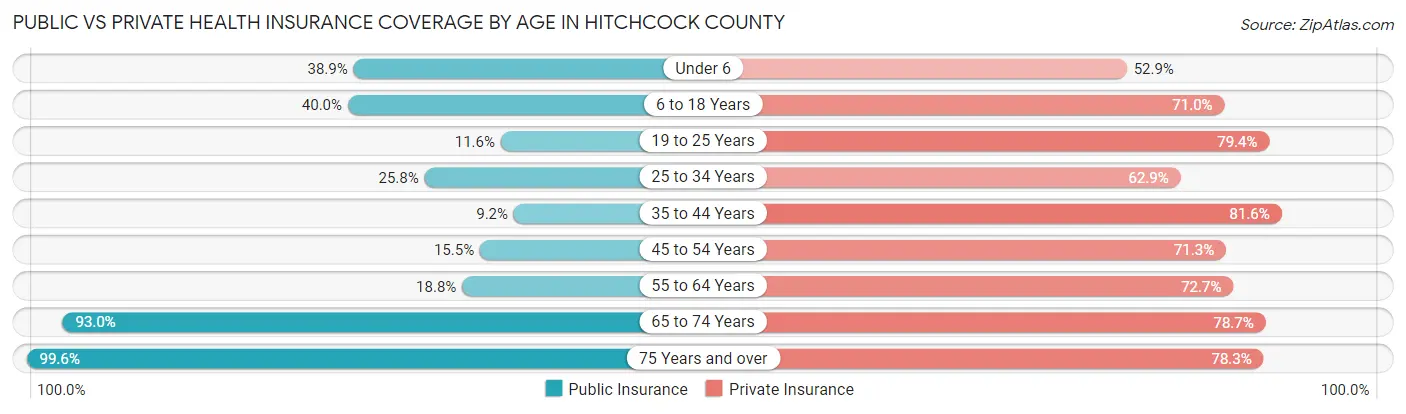
| Age Bracket | Public Insurance | Private Insurance |
| Under 6 | 81 (38.9%) | 110 (52.9%) |
| 6 to 18 Years | 178 (40.0%) | 316 (71.0%) |
| 19 to 25 Years | 18 (11.6%) | 123 (79.3%) |
| 25 to 34 Years | 59 (25.8%) | 144 (62.9%) |
| 35 to 44 Years | 26 (9.2%) | 231 (81.6%) |
| 45 to 54 Years | 41 (15.5%) | 189 (71.3%) |
| 55 to 64 Years | 68 (18.8%) | 263 (72.7%) |
| 65 to 74 Years | 344 (93.0%) | 291 (78.6%) |
| 75 Years and over | 266 (99.6%) | 209 (78.3%) |
| Total | 1,081 (41.8%) | 1,876 (72.6%) |
Disability Status by Sex by Age in Hitchcock County
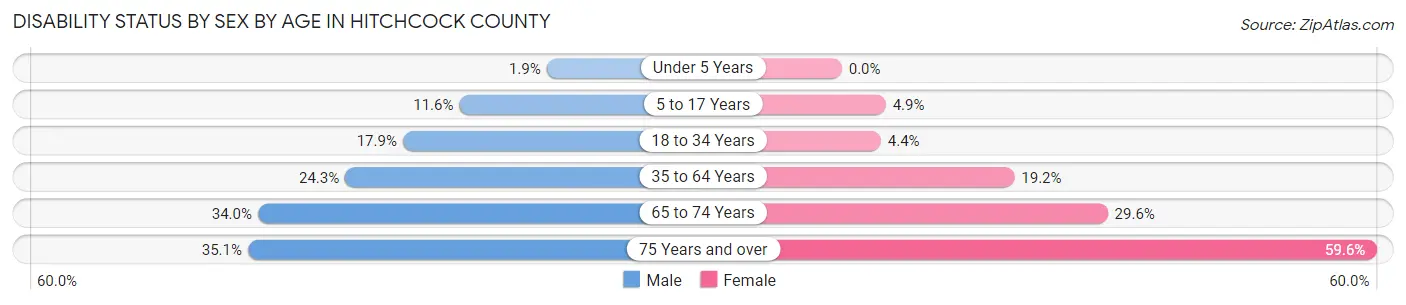
| Age Bracket | Male | Female |
| Under 5 Years | 2 (1.9%) | 0 (0.0%) |
| 5 to 17 Years | 27 (11.6%) | 11 (4.9%) |
| 18 to 34 Years | 39 (17.9%) | 8 (4.3%) |
| 35 to 64 Years | 115 (24.3%) | 84 (19.2%) |
| 65 to 74 Years | 65 (34.0%) | 53 (29.6%) |
| 75 Years and over | 39 (35.1%) | 93 (59.6%) |
Disability Class by Sex by Age in Hitchcock County
Disability Class: Hearing Difficulty
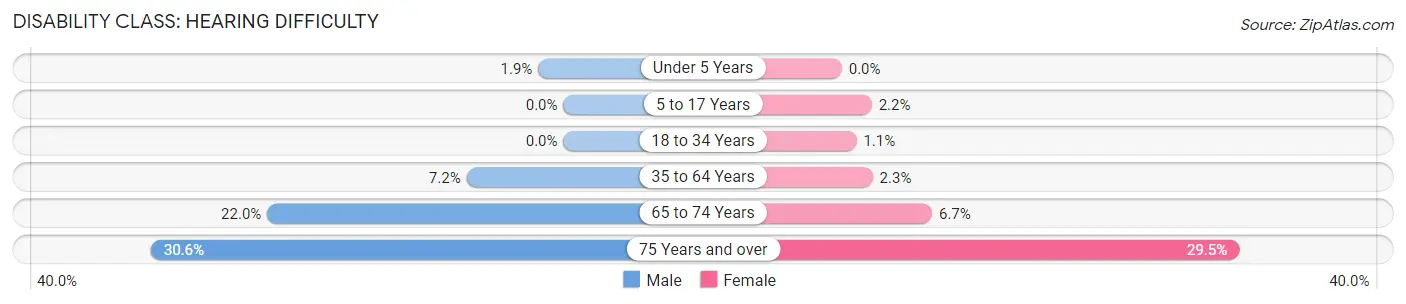
| Age Bracket | Male | Female |
| Under 5 Years | 2 (1.9%) | 0 (0.0%) |
| 5 to 17 Years | 0 (0.0%) | 5 (2.2%) |
| 18 to 34 Years | 0 (0.0%) | 2 (1.1%) |
| 35 to 64 Years | 34 (7.2%) | 10 (2.3%) |
| 65 to 74 Years | 42 (22.0%) | 12 (6.7%) |
| 75 Years and over | 34 (30.6%) | 46 (29.5%) |
Disability Class: Vision Difficulty
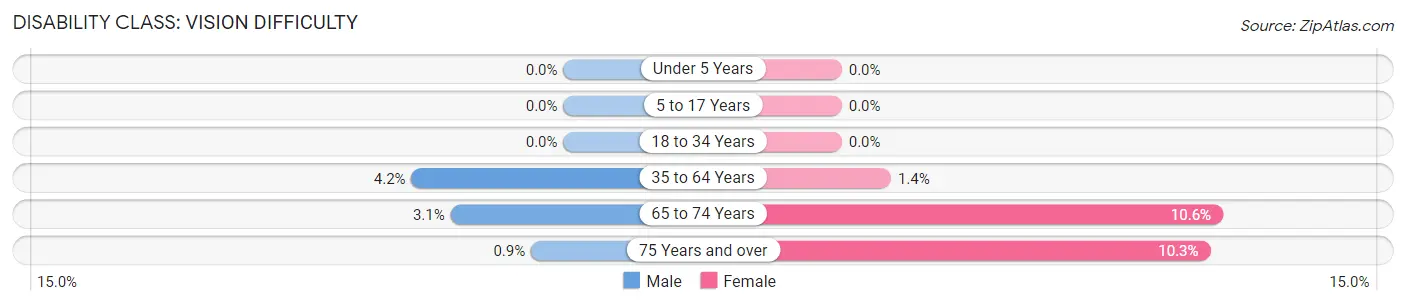
| Age Bracket | Male | Female |
| Under 5 Years | 0 (0.0%) | 0 (0.0%) |
| 5 to 17 Years | 0 (0.0%) | 0 (0.0%) |
| 18 to 34 Years | 0 (0.0%) | 0 (0.0%) |
| 35 to 64 Years | 20 (4.2%) | 6 (1.4%) |
| 65 to 74 Years | 6 (3.1%) | 19 (10.6%) |
| 75 Years and over | 1 (0.9%) | 16 (10.3%) |
Disability Class: Cognitive Difficulty
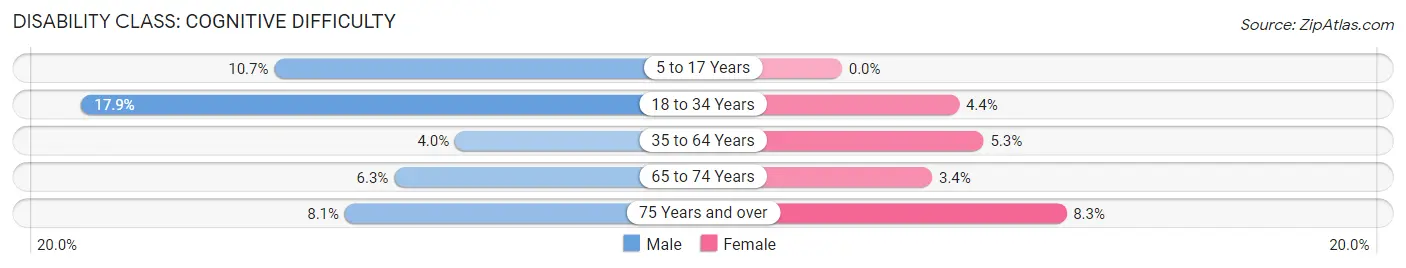
| Age Bracket | Male | Female |
| 5 to 17 Years | 25 (10.7%) | 0 (0.0%) |
| 18 to 34 Years | 39 (17.9%) | 8 (4.3%) |
| 35 to 64 Years | 19 (4.0%) | 23 (5.3%) |
| 65 to 74 Years | 12 (6.3%) | 6 (3.4%) |
| 75 Years and over | 9 (8.1%) | 13 (8.3%) |
Disability Class: Ambulatory Difficulty
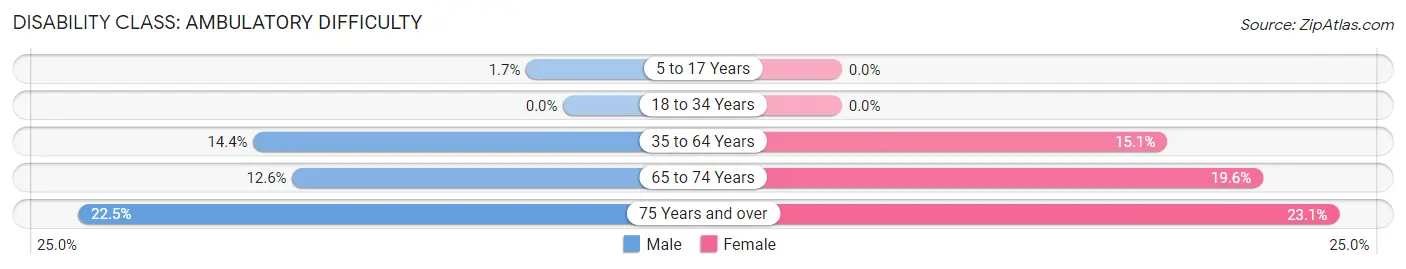
| Age Bracket | Male | Female |
| 5 to 17 Years | 4 (1.7%) | 0 (0.0%) |
| 18 to 34 Years | 0 (0.0%) | 0 (0.0%) |
| 35 to 64 Years | 68 (14.4%) | 66 (15.1%) |
| 65 to 74 Years | 24 (12.6%) | 35 (19.6%) |
| 75 Years and over | 25 (22.5%) | 36 (23.1%) |
Disability Class: Self-Care Difficulty
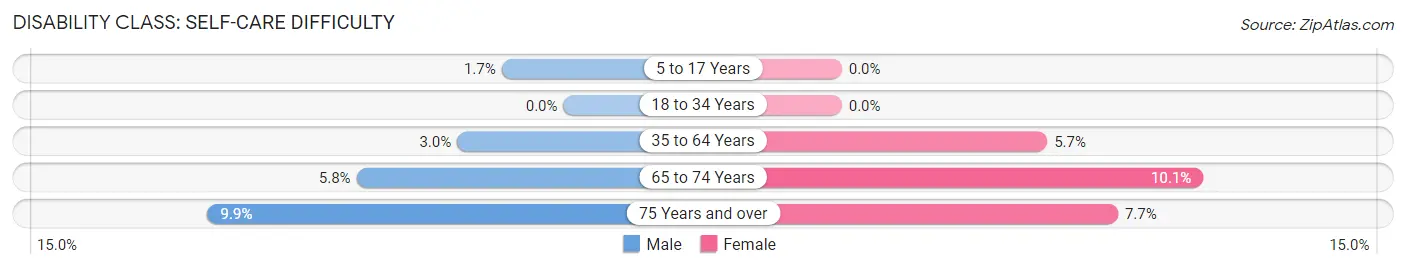
| Age Bracket | Male | Female |
| 5 to 17 Years | 4 (1.7%) | 0 (0.0%) |
| 18 to 34 Years | 0 (0.0%) | 0 (0.0%) |
| 35 to 64 Years | 14 (3.0%) | 25 (5.7%) |
| 65 to 74 Years | 11 (5.8%) | 18 (10.1%) |
| 75 Years and over | 11 (9.9%) | 12 (7.7%) |
Technology Access in Hitchcock County
Computing Device Access in Hitchcock County
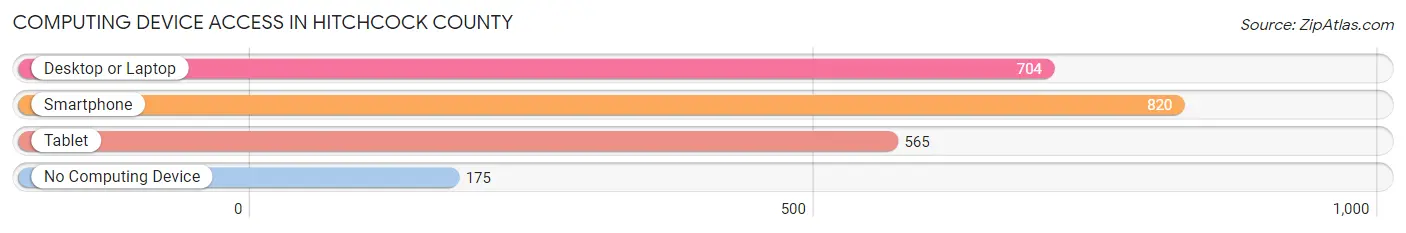
| Device Type | # Households | % Households |
| Desktop or Laptop | 704 | 63.5% |
| Smartphone | 820 | 73.9% |
| Tablet | 565 | 50.9% |
| No Computing Device | 175 | 15.8% |
| Total | 1,109 | 100.0% |
Internet Access in Hitchcock County
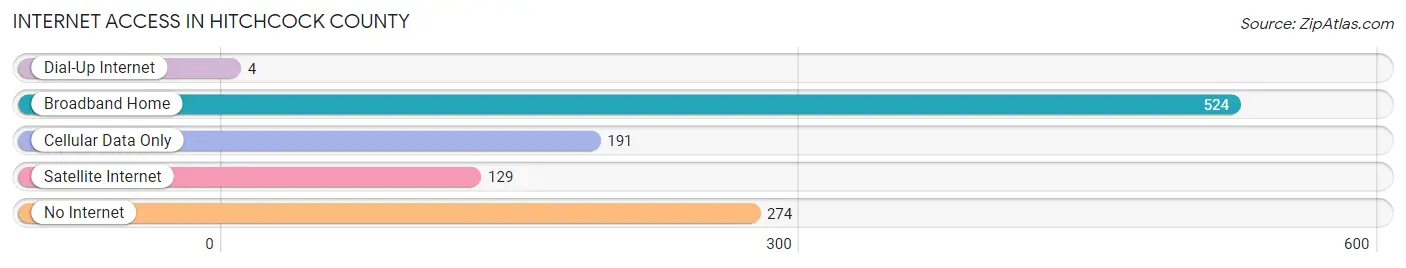
| Internet Type | # Households | % Households |
| Dial-Up Internet | 4 | 0.4% |
| Broadband Home | 524 | 47.2% |
| Cellular Data Only | 191 | 17.2% |
| Satellite Internet | 129 | 11.6% |
| No Internet | 274 | 24.7% |
| Total | 1,109 | 100.0% |
Hitchcock County Summary
Hitchcock County is located in the southwestern corner of Nebraska, and is bordered by the states of Colorado and Kansas. It is part of the Nebraska Panhandle, and is the second-smallest county in the state. The county was named after Major General Ethan Allen Hitchcock, who served in the War of 1812 and the Mexican-American War.
Geography
Hitchcock County covers an area of 576 square miles, and is located in the High Plains region of the Great Plains. The county is mostly flat, with some rolling hills in the western part. The county is drained by the Republican River, which flows through the county from north to south. The county is also home to several small lakes, including Lake McConaughy, which is the largest lake in the state.
The county has a semi-arid climate, with hot summers and cold winters. The average annual precipitation is around 18 inches, with most of it falling in the spring and summer months.
Demographics
As of the 2010 census, the population of Hitchcock County was 2,945, making it the second-least populous county in Nebraska. The population density was 5.1 people per square mile. The racial makeup of the county was 95.3% White, 0.3% African American, 0.7% Native American, 0.2% Asian, 0.1% Pacific Islander, 2.2% from other races, and 1.3% from two or more races. Hispanic or Latino of any race were 4.2% of the population.
Economy
Agriculture is the main economic activity in Hitchcock County. The county is home to a variety of crops, including corn, wheat, sorghum, soybeans, and alfalfa. Livestock production is also important, with cattle, hogs, and sheep being raised in the county.
The county is also home to several small businesses, including a few restaurants, a grocery store, and a few retail stores. The county is also home to a few manufacturing companies, including a furniture factory and a plastics factory.
History
Hitchcock County was established in 1873, and was named after Major General Ethan Allen Hitchcock. The county was originally part of Cheyenne County, and was created to provide better access to the Republican River.
The county was largely settled by farmers and ranchers, and the economy was based on agriculture. The county was also home to several small towns, including Culbertson, Trenton, and Palisade.
In the early 20th century, the county was home to several oil and gas fields, and the county's economy was bolstered by the oil and gas industry. The county also experienced a population boom during this time, as many people moved to the area to work in the oil and gas fields.
In the late 20th century, the county's economy shifted away from oil and gas, and back to agriculture. The county is now home to several small towns, and the population has remained relatively stable since the 1950s.
Common Questions
What is Per Capita Income in Hitchcock County?
Per Capita income in Hitchcock County is $30,595.
What is the Median Family Income in Hitchcock County?
Median Family Income in Hitchcock County is $68,702.
What is the Median Household income in Hitchcock County?
Median Household Income in Hitchcock County is $49,456.
What is Income or Wage Gap in Hitchcock County?
Income or Wage Gap in Hitchcock County is 10.5%.
Women in Hitchcock County earn 89.5 cents for every dollar earned by a man.
What is Inequality or Gini Index in Hitchcock County?
Inequality or Gini Index in Hitchcock County is 0.47.
What is the Total Population of Hitchcock County?
Total Population of Hitchcock County is 2,620.
What is the Total Male Population of Hitchcock County?
Total Male Population of Hitchcock County is 1,352.
What is the Total Female Population of Hitchcock County?
Total Female Population of Hitchcock County is 1,268.
What is the Ratio of Males per 100 Females in Hitchcock County?
There are 106.62 Males per 100 Females in Hitchcock County.
What is the Ratio of Females per 100 Males in Hitchcock County?
There are 93.79 Females per 100 Males in Hitchcock County.
What is the Median Population Age in Hitchcock County?
Median Population Age in Hitchcock County is 43.3 Years.
What is the Average Family Size in Hitchcock County
Average Family Size in Hitchcock County is 3.1 People.
What is the Average Household Size in Hitchcock County
Average Household Size in Hitchcock County is 2.3 People.
How Large is the Labor Force in Hitchcock County?
There are 1,208 People in the Labor Forcein in Hitchcock County.
What is the Percentage of People in the Labor Force in Hitchcock County?
58.5% of People are in the Labor Force in Hitchcock County.
What is the Unemployment Rate in Hitchcock County?
Unemployment Rate in Hitchcock County is 1.9%.