Hayes County, NE Map & Demographics
Hayes County Map
Hayes County Overview
$35,135
PER CAPITA INCOME
$78,309
AVG FAMILY INCOME
$59,405
AVG HOUSEHOLD INCOME
51.1%
WAGE / INCOME GAP [ % ]
48.9¢/ $1
WAGE / INCOME GAP [ $ ]
0.46
INEQUALITY / GINI INDEX
919
TOTAL POPULATION
457
MALE POPULATION
462
FEMALE POPULATION
98.92
MALES / 100 FEMALES
101.09
FEMALES / 100 MALES
48.9
MEDIAN AGE
3.1
AVG FAMILY SIZE
2.5
AVG HOUSEHOLD SIZE
429
LABOR FORCE [ PEOPLE ]
58.6%
PERCENT IN LABOR FORCE
0.2%
UNEMPLOYMENT RATE
Hayes County Area Codes
Income in Hayes County
Income Overview in Hayes County
Per Capita Income in Hayes County is $35,135, while median incomes of families and households are $78,309 and $59,405 respectively.
| Characteristic | Number | Measure |
| Per Capita Income | 919 | $35,135 |
| Median Family Income | 243 | $78,309 |
| Mean Family Income | 243 | $93,383 |
| Median Household Income | 374 | $59,405 |
| Mean Household Income | 374 | $77,279 |
| Income Deficit | 243 | $0 |
| Wage / Income Gap (%) | 919 | 51.09% |
| Wage / Income Gap ($) | 919 | 48.91¢ per $1 |
| Gini / Inequality Index | 919 | 0.46 |
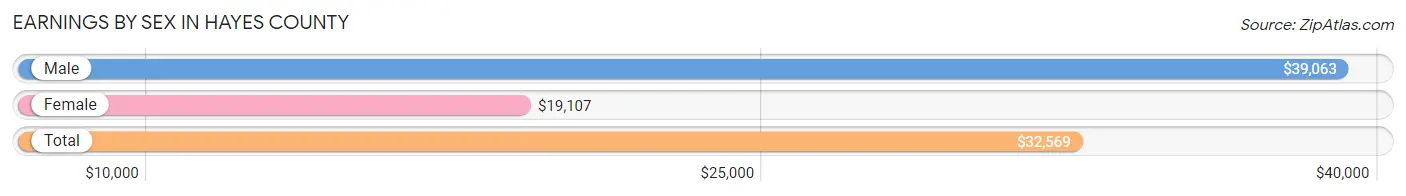
Earnings by Sex in Hayes County
Average Earnings in Hayes County are $32,569, $39,063 for men and $19,107 for women, a difference of 51.1%.
| Sex | Number | Average Earnings |
| Male | 285 (59.1%) | $39,063 |
| Female | 197 (40.9%) | $19,107 |
| Total | 482 (100.0%) | $32,569 |
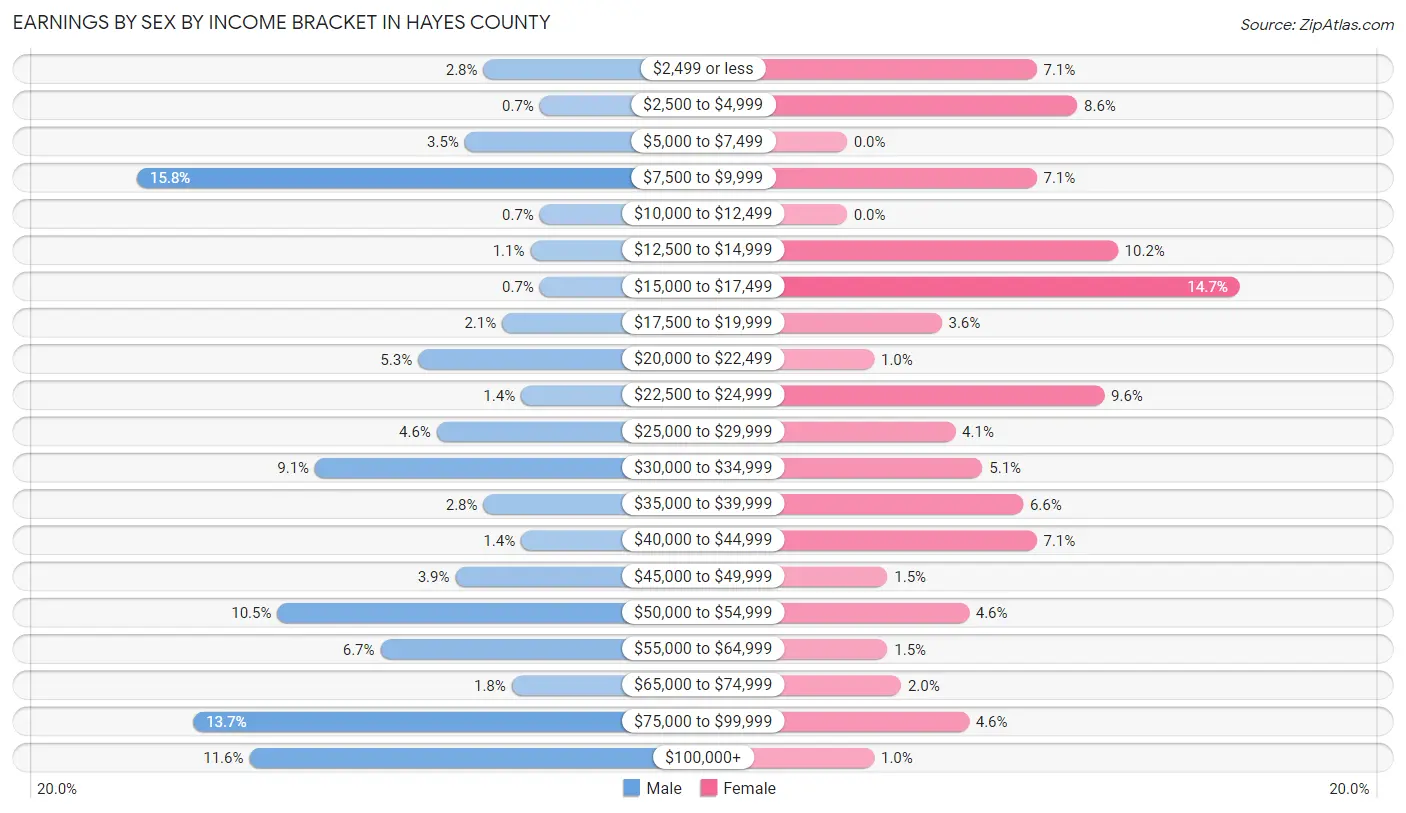
Earnings by Sex by Income Bracket in Hayes County
The most common earnings brackets in Hayes County are $7,500 to $9,999 for men (45 | 15.8%) and $15,000 to $17,499 for women (29 | 14.7%).
| Income | Male | Female |
| $2,499 or less | 8 (2.8%) | 14 (7.1%) |
| $2,500 to $4,999 | 2 (0.7%) | 17 (8.6%) |
| $5,000 to $7,499 | 10 (3.5%) | 0 (0.0%) |
| $7,500 to $9,999 | 45 (15.8%) | 14 (7.1%) |
| $10,000 to $12,499 | 2 (0.7%) | 0 (0.0%) |
| $12,500 to $14,999 | 3 (1.1%) | 20 (10.2%) |
| $15,000 to $17,499 | 2 (0.7%) | 29 (14.7%) |
| $17,500 to $19,999 | 6 (2.1%) | 7 (3.5%) |
| $20,000 to $22,499 | 15 (5.3%) | 2 (1.0%) |
| $22,500 to $24,999 | 4 (1.4%) | 19 (9.6%) |
| $25,000 to $29,999 | 13 (4.6%) | 8 (4.1%) |
| $30,000 to $34,999 | 26 (9.1%) | 10 (5.1%) |
| $35,000 to $39,999 | 8 (2.8%) | 13 (6.6%) |
| $40,000 to $44,999 | 4 (1.4%) | 14 (7.1%) |
| $45,000 to $49,999 | 11 (3.9%) | 3 (1.5%) |
| $50,000 to $54,999 | 30 (10.5%) | 9 (4.6%) |
| $55,000 to $64,999 | 19 (6.7%) | 3 (1.5%) |
| $65,000 to $74,999 | 5 (1.8%) | 4 (2.0%) |
| $75,000 to $99,999 | 39 (13.7%) | 9 (4.6%) |
| $100,000+ | 33 (11.6%) | 2 (1.0%) |
| Total | 285 (100.0%) | 197 (100.0%) |
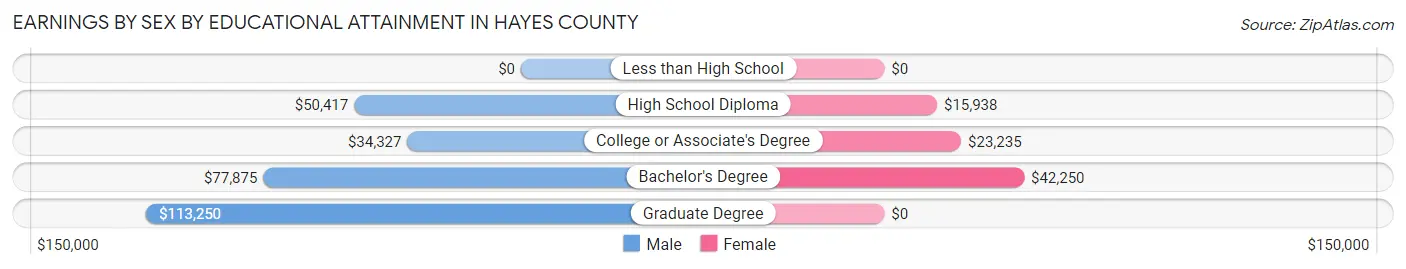
Earnings by Sex by Educational Attainment in Hayes County
Average earnings in Hayes County are $48,333 for men and $20,000 for women, a difference of 58.6%. Men with an educational attainment of graduate degree enjoy the highest average annual earnings of $113,250, while those with college or associate's degree education earn the least with $34,327. Women with an educational attainment of bachelor's degree earn the most with the average annual earnings of $42,250, while those with high school diploma education have the smallest earnings of $15,938.
| Educational Attainment | Male Income | Female Income |
| Less than High School | - | - |
| High School Diploma | $50,417 | $15,938 |
| College or Associate's Degree | $34,327 | $23,235 |
| Bachelor's Degree | $77,875 | $42,250 |
| Graduate Degree | $113,250 | $0 |
| Total | $48,333 | $20,000 |
Family Income in Hayes County
Family Income Brackets in Hayes County
According to the Hayes County family income data, there are 53 families falling into the $100,000 to $149,999 income range, which is the most common income bracket and makes up 21.8% of all families.
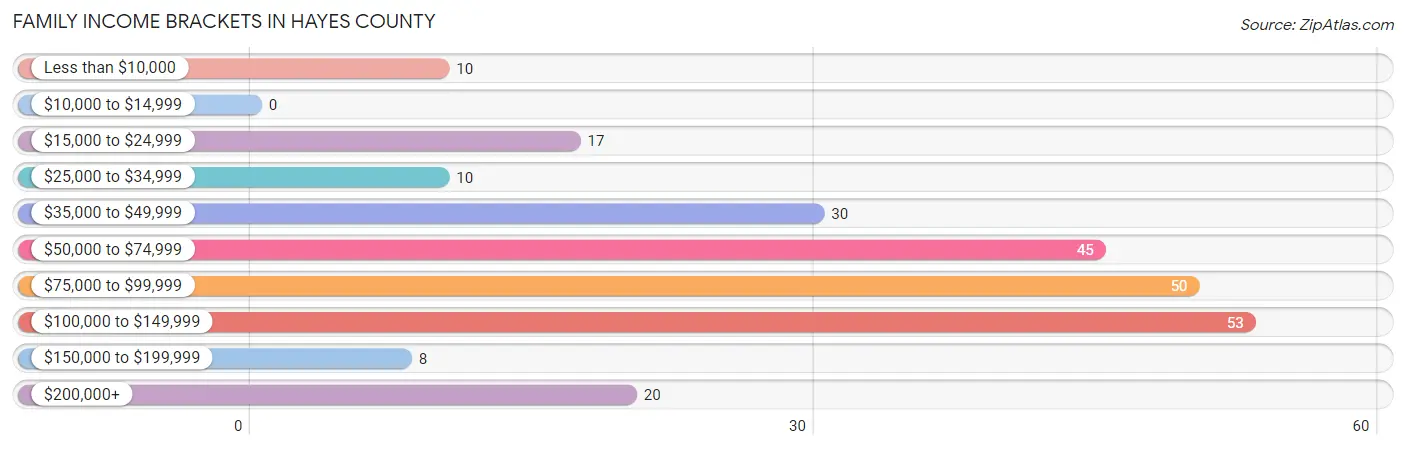
| Income Bracket | # Families | % Families |
| Less than $10,000 | 10 | 4.1% |
| $10,000 to $14,999 | 0 | 0.0% |
| $15,000 to $24,999 | 17 | 7.0% |
| $25,000 to $34,999 | 10 | 4.1% |
| $35,000 to $49,999 | 30 | 12.3% |
| $50,000 to $74,999 | 45 | 18.5% |
| $75,000 to $99,999 | 50 | 20.6% |
| $100,000 to $149,999 | 53 | 21.8% |
| $150,000 to $199,999 | 8 | 3.3% |
| $200,000+ | 20 | 8.2% |
Family Income by Famaliy Size in Hayes County
4-person families (23 | 9.5%) account for the highest median family income in Hayes County with $124,583 per family, while 2-person families (144 | 59.3%) have the highest median income of $36,875 per family member.
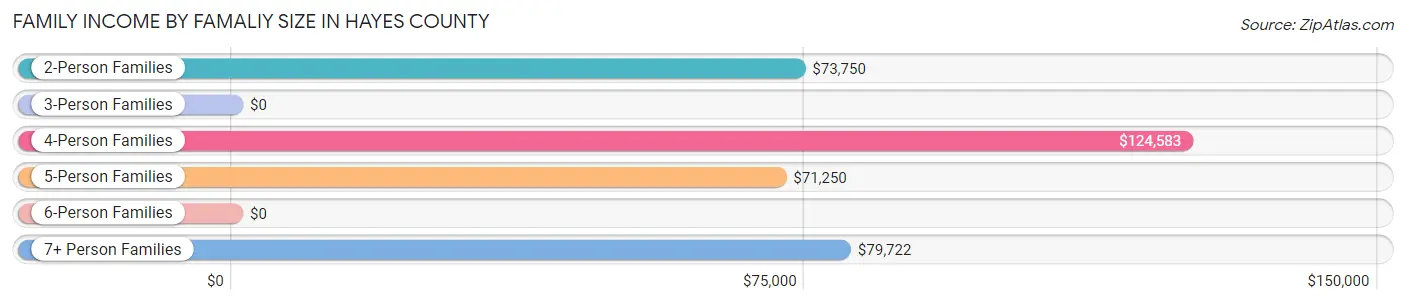
| Income Bracket | # Families | Median Income |
| 2-Person Families | 144 (59.3%) | $73,750 |
| 3-Person Families | 41 (16.9%) | $0 |
| 4-Person Families | 23 (9.5%) | $124,583 |
| 5-Person Families | 17 (7.0%) | $71,250 |
| 6-Person Families | 2 (0.8%) | $0 |
| 7+ Person Families | 16 (6.6%) | $79,722 |
| Total | 243 (100.0%) | $78,309 |
Family Income by Number of Earners in Hayes County
The median family income in Hayes County is $78,309, with families comprising 3+ earners (24) having the highest median family income of $131,250, while families with no earners (60) have the lowest median family income of $56,875, accounting for 9.9% and 24.7% of families, respectively.
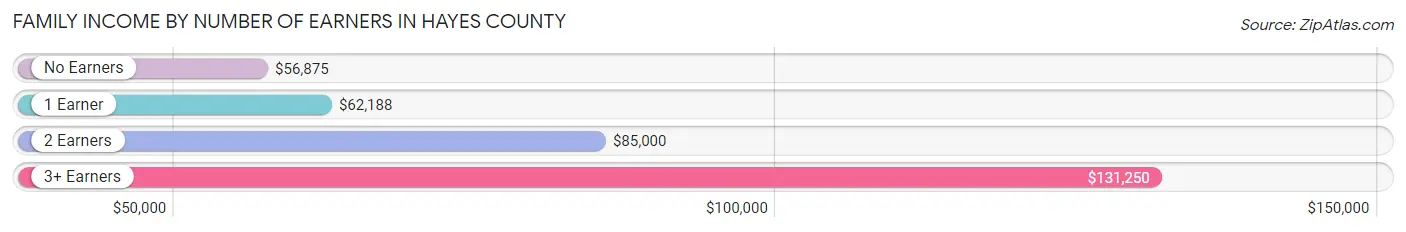
| Number of Earners | # Families | Median Income |
| No Earners | 60 (24.7%) | $56,875 |
| 1 Earner | 51 (21.0%) | $62,188 |
| 2 Earners | 108 (44.4%) | $85,000 |
| 3+ Earners | 24 (9.9%) | $131,250 |
| Total | 243 (100.0%) | $78,309 |
Household Income in Hayes County
Household Income Brackets in Hayes County
With 72 households falling in the category, the $50,000 to $74,999 income range is the most frequent in Hayes County, accounting for 19.3% of all households. In contrast, only 10 households (2.7%) fall into the $150,000 to $199,999 income bracket, making it the least populous group.
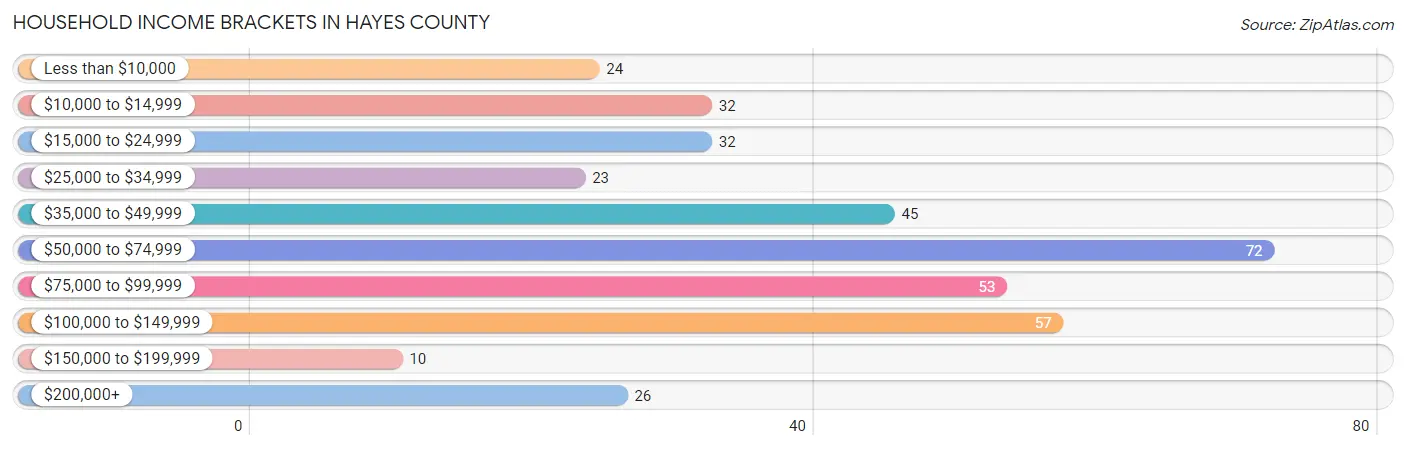
| Income Bracket | # Households | % Households |
| Less than $10,000 | 24 | 6.4% |
| $10,000 to $14,999 | 32 | 8.6% |
| $15,000 to $24,999 | 32 | 8.6% |
| $25,000 to $34,999 | 23 | 6.1% |
| $35,000 to $49,999 | 45 | 12.0% |
| $50,000 to $74,999 | 72 | 19.3% |
| $75,000 to $99,999 | 53 | 14.2% |
| $100,000 to $149,999 | 57 | 15.2% |
| $150,000 to $199,999 | 10 | 2.7% |
| $200,000+ | 26 | 7.0% |
Household Income by Householder Age in Hayes County
The median household income in Hayes County is $59,405, with the highest median household income of $93,750 found in the 25 to 44 years age bracket for the primary householder. A total of 88 households (23.5%) fall into this category. Meanwhile, the 15 to 24 years age bracket for the primary householder has the lowest median household income of $0, with 2 households (0.5%) in this group.
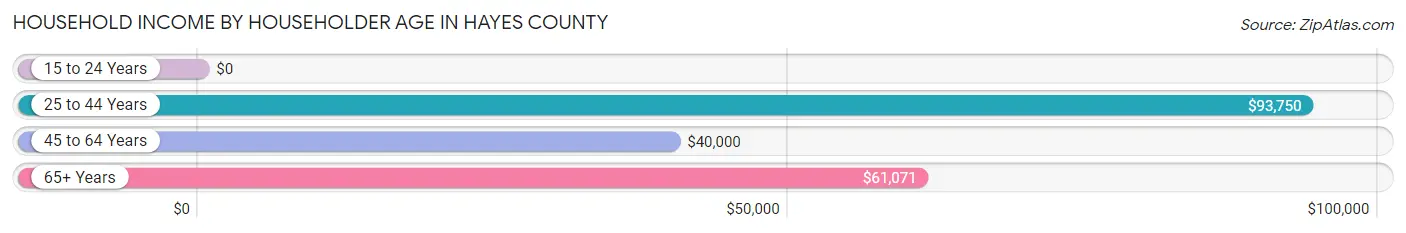
| Income Bracket | # Households | Median Income |
| 15 to 24 Years | 2 (0.5%) | $0 |
| 25 to 44 Years | 88 (23.5%) | $93,750 |
| 45 to 64 Years | 144 (38.5%) | $40,000 |
| 65+ Years | 140 (37.4%) | $61,071 |
| Total | 374 (100.0%) | $59,405 |
Poverty in Hayes County
Income Below Poverty by Sex and Age in Hayes County
With 12.2% poverty level for males and 17.1% for females among the residents of Hayes County, 5 year old males and 15 year old females are the most vulnerable to poverty, with 2 males (66.7%) and 4 females (50.0%) in their respective age groups living below the poverty level.
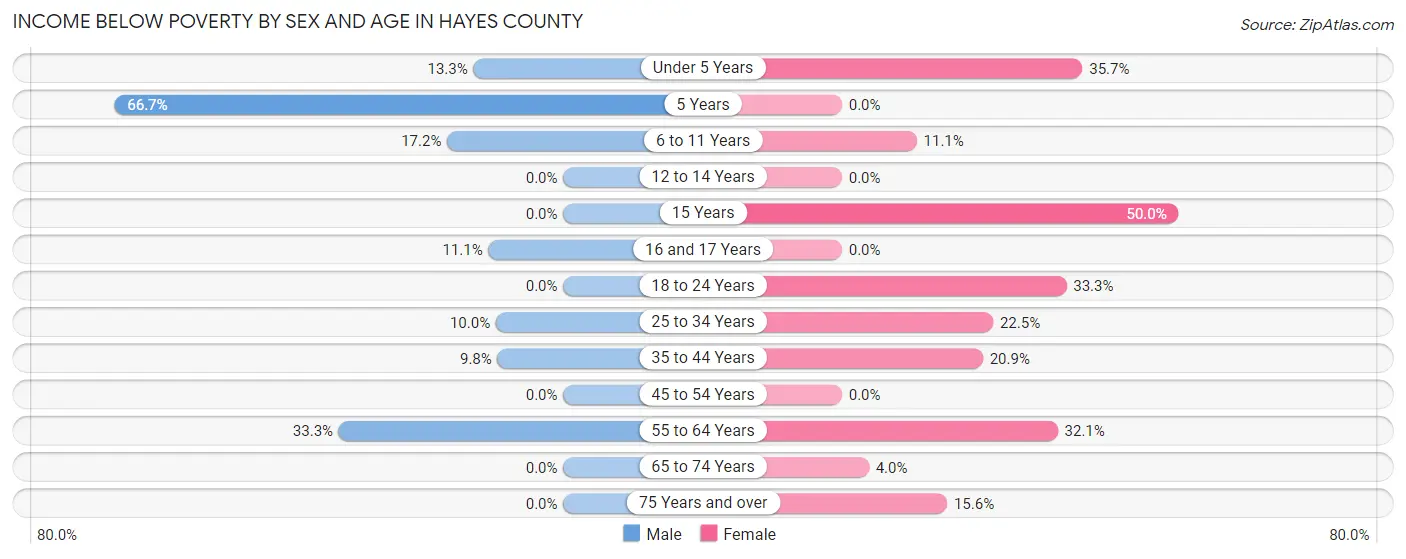
| Age Bracket | Male | Female |
| Under 5 Years | 4 (13.3%) | 10 (35.7%) |
| 5 Years | 2 (66.7%) | 0 (0.0%) |
| 6 to 11 Years | 5 (17.2%) | 4 (11.1%) |
| 12 to 14 Years | 0 (0.0%) | 0 (0.0%) |
| 15 Years | 0 (0.0%) | 4 (50.0%) |
| 16 and 17 Years | 1 (11.1%) | 0 (0.0%) |
| 18 to 24 Years | 0 (0.0%) | 4 (33.3%) |
| 25 to 34 Years | 4 (10.0%) | 11 (22.5%) |
| 35 to 44 Years | 4 (9.8%) | 9 (20.9%) |
| 45 to 54 Years | 0 (0.0%) | 0 (0.0%) |
| 55 to 64 Years | 36 (33.3%) | 25 (32.1%) |
| 65 to 74 Years | 0 (0.0%) | 2 (4.0%) |
| 75 Years and over | 0 (0.0%) | 10 (15.6%) |
| Total | 56 (12.2%) | 79 (17.1%) |
Income Above Poverty by Sex and Age in Hayes County
According to the poverty statistics in Hayes County, males aged 12 to 14 years and females aged 5 years are the age groups that are most secure financially, with 100.0% of males and 100.0% of females in these age groups living above the poverty line.
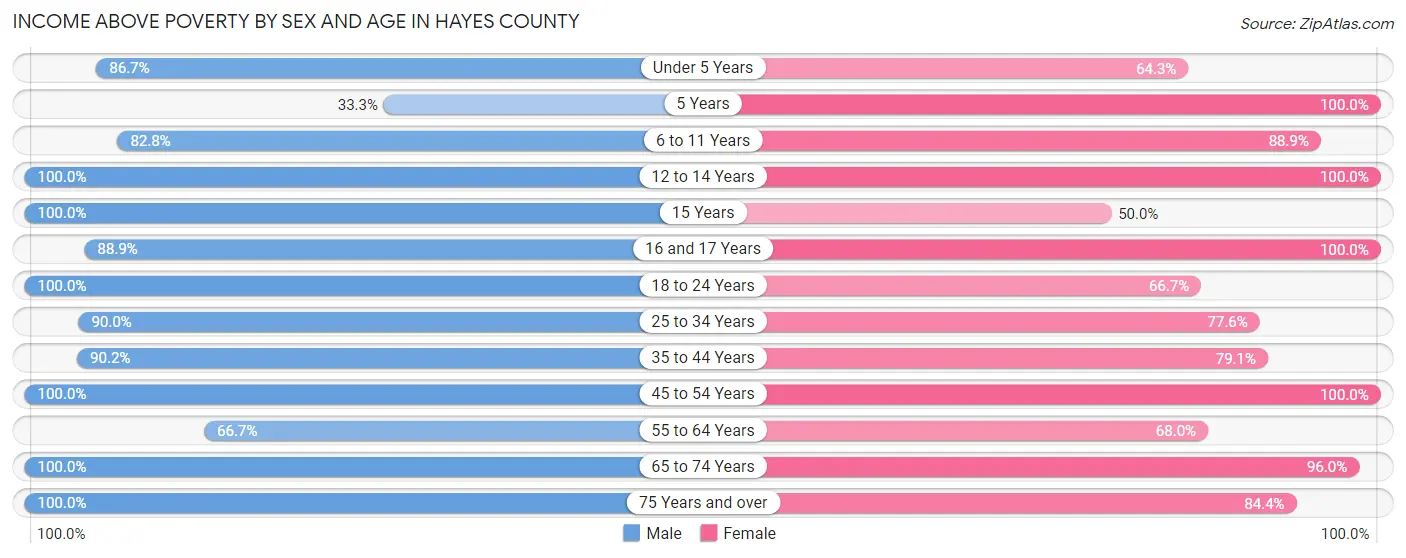
| Age Bracket | Male | Female |
| Under 5 Years | 26 (86.7%) | 18 (64.3%) |
| 5 Years | 1 (33.3%) | 15 (100.0%) |
| 6 to 11 Years | 24 (82.8%) | 32 (88.9%) |
| 12 to 14 Years | 13 (100.0%) | 16 (100.0%) |
| 15 Years | 9 (100.0%) | 4 (50.0%) |
| 16 and 17 Years | 8 (88.9%) | 7 (100.0%) |
| 18 to 24 Years | 23 (100.0%) | 8 (66.7%) |
| 25 to 34 Years | 36 (90.0%) | 38 (77.5%) |
| 35 to 44 Years | 37 (90.2%) | 34 (79.1%) |
| 45 to 54 Years | 47 (100.0%) | 56 (100.0%) |
| 55 to 64 Years | 72 (66.7%) | 53 (67.9%) |
| 65 to 74 Years | 68 (100.0%) | 48 (96.0%) |
| 75 Years and over | 37 (100.0%) | 54 (84.4%) |
| Total | 401 (87.7%) | 383 (82.9%) |
Income Below Poverty Among Married-Couple Families in Hayes County
The poverty statistics for married-couple families in Hayes County show that 5.9% or 13 of the total 222 families live below the poverty line. Families with 3 or 4 children have the highest poverty rate of 23.1%, comprising of 3 families. On the other hand, families with 1 or 2 children have the lowest poverty rate of 0.0%, which includes 0 families.
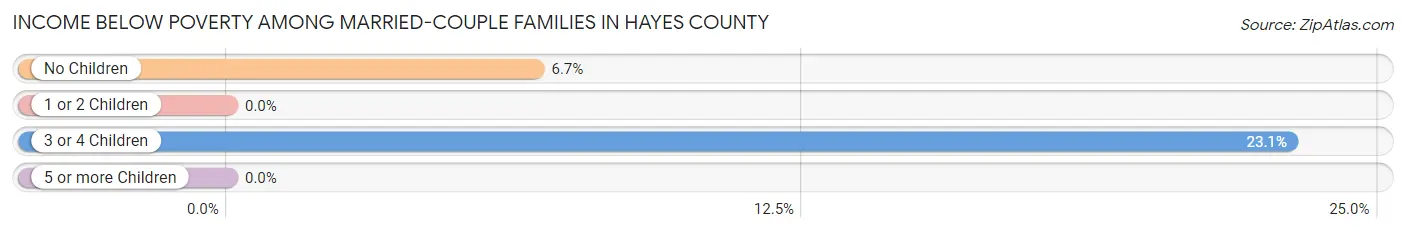
| Children | Above Poverty | Below Poverty |
| No Children | 140 (93.3%) | 10 (6.7%) |
| 1 or 2 Children | 43 (100.0%) | 0 (0.0%) |
| 3 or 4 Children | 10 (76.9%) | 3 (23.1%) |
| 5 or more Children | 16 (100.0%) | 0 (0.0%) |
| Total | 209 (94.1%) | 13 (5.9%) |
Income Below Poverty Among Single-Parent Households in Hayes County
According to the poverty data in Hayes County, 25.0% or 2 single-father households and 76.9% or 10 single-mother households are living below the poverty line. Among single-father households, those with 1 or 2 children have the highest poverty rate, with 2 households (40.0%) experiencing poverty. Likewise, among single-mother households, those with 1 or 2 children have the highest poverty rate, with 7 households (100.0%) falling below the poverty line.
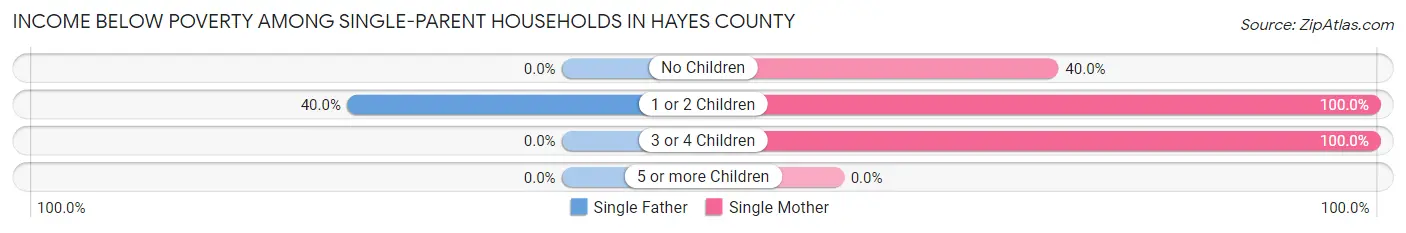
| Children | Single Father | Single Mother |
| No Children | 0 (0.0%) | 2 (40.0%) |
| 1 or 2 Children | 2 (40.0%) | 7 (100.0%) |
| 3 or 4 Children | 0 (0.0%) | 1 (100.0%) |
| 5 or more Children | 0 (0.0%) | 0 (0.0%) |
| Total | 2 (25.0%) | 10 (76.9%) |
Income Below Poverty Among Married-Couple vs Single-Parent Households in Hayes County
The poverty data for Hayes County shows that 13 of the married-couple family households (5.9%) and 12 of the single-parent households (57.1%) are living below the poverty level. Within the married-couple family households, those with 3 or 4 children have the highest poverty rate, with 3 households (23.1%) falling below the poverty line. Among the single-parent households, those with 3 or 4 children have the highest poverty rate, with 1 household (100.0%) living below poverty.
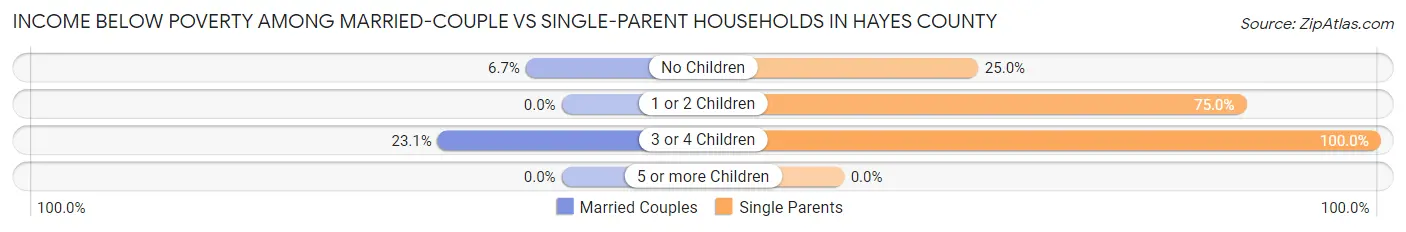
| Children | Married-Couple Families | Single-Parent Households |
| No Children | 10 (6.7%) | 2 (25.0%) |
| 1 or 2 Children | 0 (0.0%) | 9 (75.0%) |
| 3 or 4 Children | 3 (23.1%) | 1 (100.0%) |
| 5 or more Children | 0 (0.0%) | 0 (0.0%) |
| Total | 13 (5.9%) | 12 (57.1%) |
Race in Hayes County
The most populous races in Hayes County are White / Caucasian (867 | 94.3%), Hispanic or Latino (62 | 6.8%), and Some other Race (26 | 2.8%).
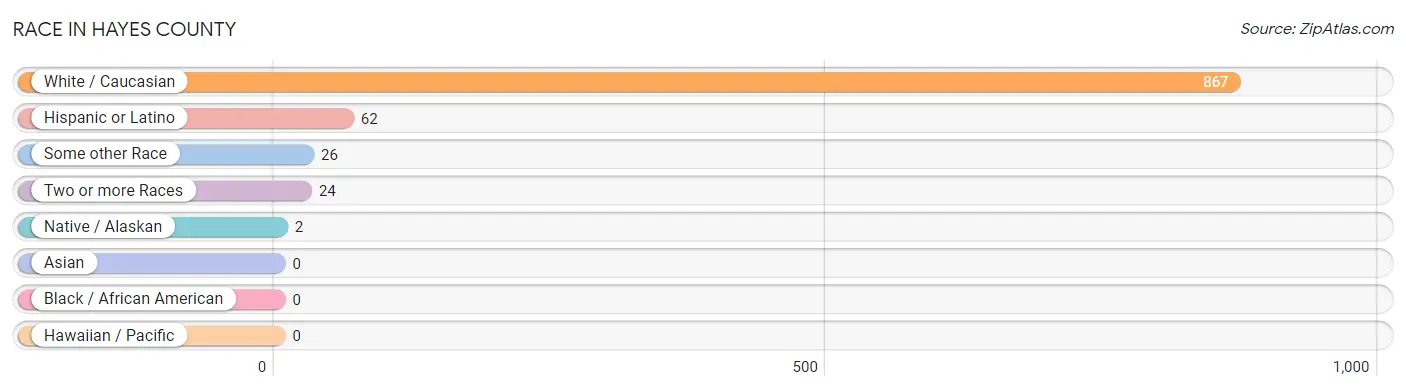
| Race | # Population | % Population |
| Asian | 0 | 0.0% |
| Black / African American | 0 | 0.0% |
| Hawaiian / Pacific | 0 | 0.0% |
| Hispanic or Latino | 62 | 6.8% |
| Native / Alaskan | 2 | 0.2% |
| White / Caucasian | 867 | 94.3% |
| Two or more Races | 24 | 2.6% |
| Some other Race | 26 | 2.8% |
| Total | 919 | 100.0% |
Ancestry in Hayes County
The most populous ancestries reported in Hayes County are German (243 | 26.4%), English (110 | 12.0%), Irish (90 | 9.8%), Mexican (51 | 5.6%), and American (49 | 5.3%), together accounting for 59.1% of all Hayes County residents.
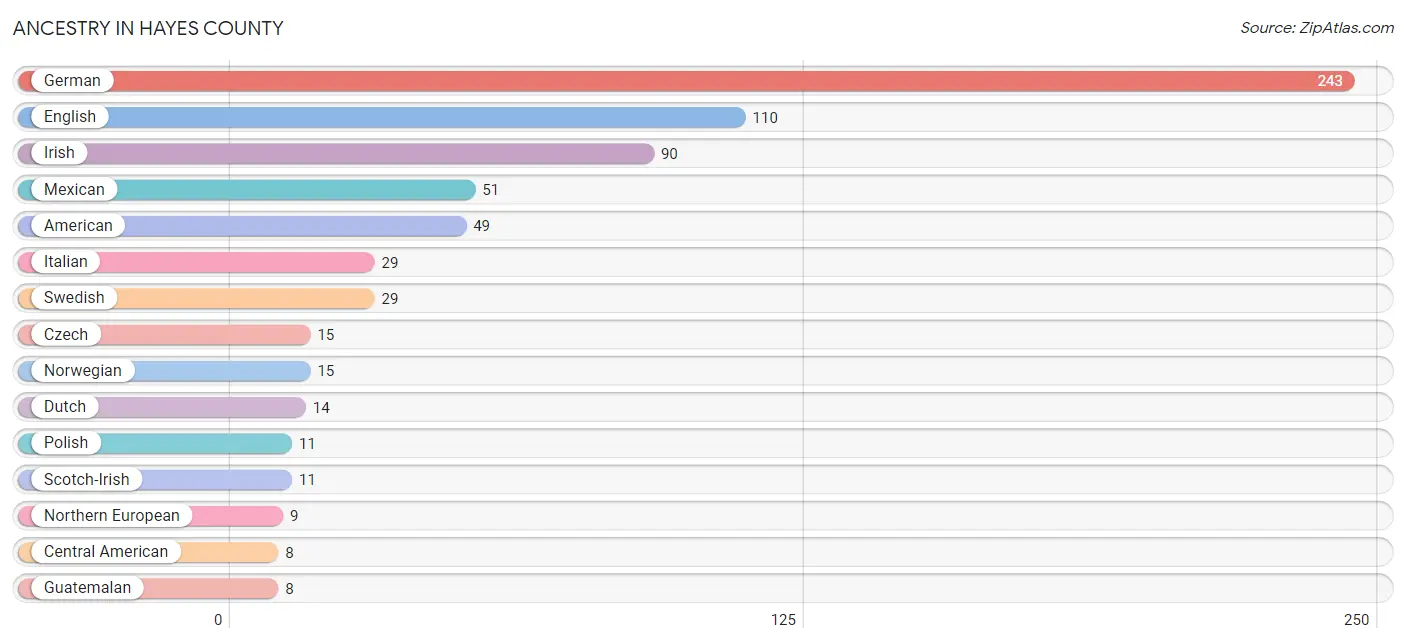
| Ancestry | # Population | % Population |
| American | 49 | 5.3% |
| Central American | 8 | 0.9% |
| Czech | 15 | 1.6% |
| Czechoslovakian | 1 | 0.1% |
| Dutch | 14 | 1.5% |
| English | 110 | 12.0% |
| European | 1 | 0.1% |
| French | 4 | 0.4% |
| French Canadian | 7 | 0.8% |
| German | 243 | 26.4% |
| Guatemalan | 8 | 0.9% |
| Irish | 90 | 9.8% |
| Italian | 29 | 3.2% |
| Mexican | 51 | 5.6% |
| Northern European | 9 | 1.0% |
| Norwegian | 15 | 1.6% |
| Pennsylvania German | 2 | 0.2% |
| Polish | 11 | 1.2% |
| Portuguese | 1 | 0.1% |
| Scotch-Irish | 11 | 1.2% |
| Scottish | 1 | 0.1% |
| Sioux | 1 | 0.1% |
| South American | 1 | 0.1% |
| Spanish | 2 | 0.2% |
| Swedish | 29 | 3.2% |
| Uruguayan | 1 | 0.1% |
| Welsh | 7 | 0.8% | View All 27 Rows |
Immigrants in Hayes County
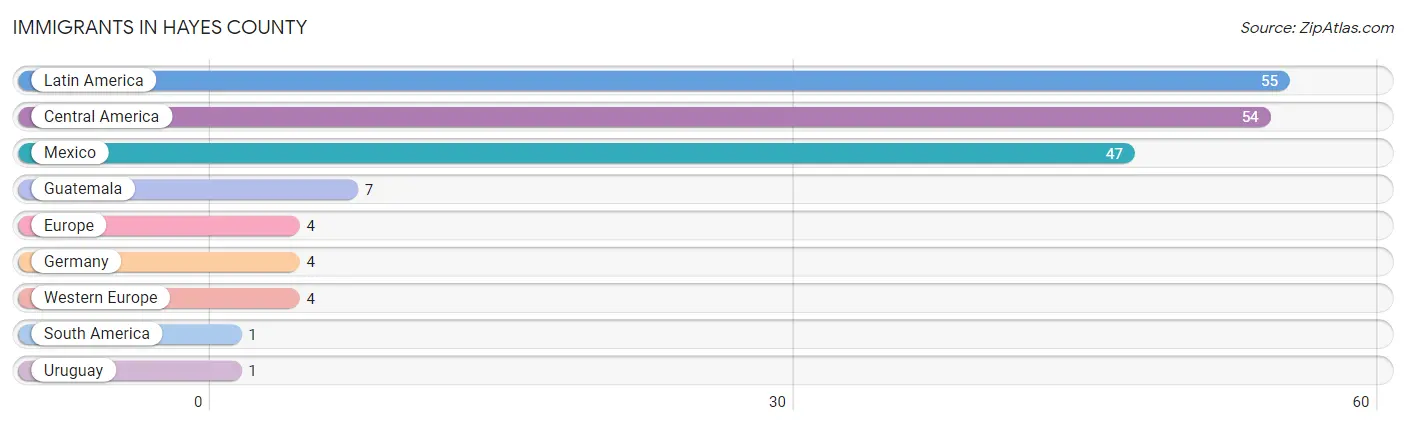
The most numerous immigrant groups reported in Hayes County came from Latin America (55 | 6.0%), Central America (54 | 5.9%), Mexico (47 | 5.1%), Guatemala (7 | 0.8%), and Europe (4 | 0.4%), together accounting for 18.2% of all Hayes County residents.
| Immigration Origin | # Population | % Population |
| Central America | 54 | 5.9% |
| Europe | 4 | 0.4% |
| Germany | 4 | 0.4% |
| Guatemala | 7 | 0.8% |
| Latin America | 55 | 6.0% |
| Mexico | 47 | 5.1% |
| South America | 1 | 0.1% |
| Uruguay | 1 | 0.1% |
| Western Europe | 4 | 0.4% | View All 9 Rows |
Sex and Age in Hayes County
Sex and Age in Hayes County
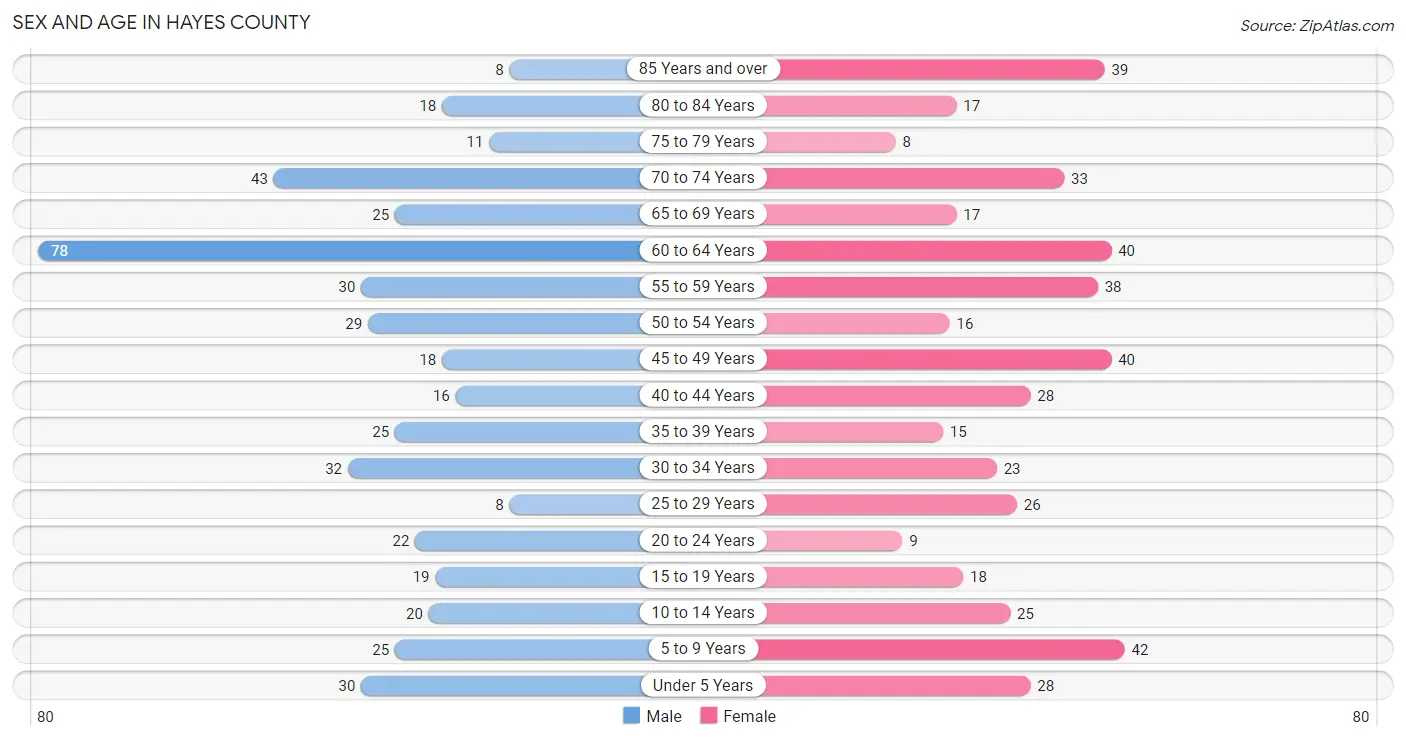
The most populous age groups in Hayes County are 60 to 64 Years (78 | 17.1%) for men and 5 to 9 Years (42 | 9.1%) for women.
| Age Bracket | Male | Female |
| Under 5 Years | 30 (6.6%) | 28 (6.1%) |
| 5 to 9 Years | 25 (5.5%) | 42 (9.1%) |
| 10 to 14 Years | 20 (4.4%) | 25 (5.4%) |
| 15 to 19 Years | 19 (4.2%) | 18 (3.9%) |
| 20 to 24 Years | 22 (4.8%) | 9 (1.9%) |
| 25 to 29 Years | 8 (1.8%) | 26 (5.6%) |
| 30 to 34 Years | 32 (7.0%) | 23 (5.0%) |
| 35 to 39 Years | 25 (5.5%) | 15 (3.3%) |
| 40 to 44 Years | 16 (3.5%) | 28 (6.1%) |
| 45 to 49 Years | 18 (3.9%) | 40 (8.7%) |
| 50 to 54 Years | 29 (6.4%) | 16 (3.5%) |
| 55 to 59 Years | 30 (6.6%) | 38 (8.2%) |
| 60 to 64 Years | 78 (17.1%) | 40 (8.7%) |
| 65 to 69 Years | 25 (5.5%) | 17 (3.7%) |
| 70 to 74 Years | 43 (9.4%) | 33 (7.1%) |
| 75 to 79 Years | 11 (2.4%) | 8 (1.7%) |
| 80 to 84 Years | 18 (3.9%) | 17 (3.7%) |
| 85 Years and over | 8 (1.8%) | 39 (8.4%) |
| Total | 457 (100.0%) | 462 (100.0%) |
Families and Households in Hayes County
Median Family Size in Hayes County
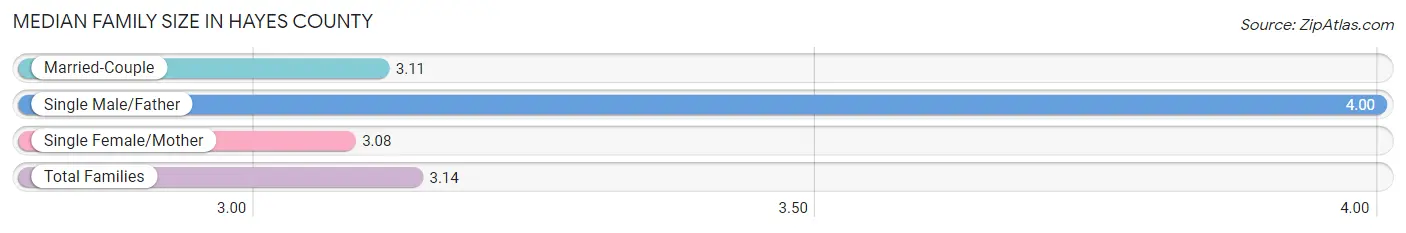
The median family size in Hayes County is 3.14 persons per family, with single male/father families (8 | 3.3%) accounting for the largest median family size of 4 persons per family. On the other hand, single female/mother families (13 | 5.3%) represent the smallest median family size with 3.08 persons per family.
| Family Type | # Families | Family Size |
| Married-Couple | 222 (91.4%) | 3.11 |
| Single Male/Father | 8 (3.3%) | 4.00 |
| Single Female/Mother | 13 (5.3%) | 3.08 |
| Total Families | 243 (100.0%) | 3.14 |
Median Household Size in Hayes County
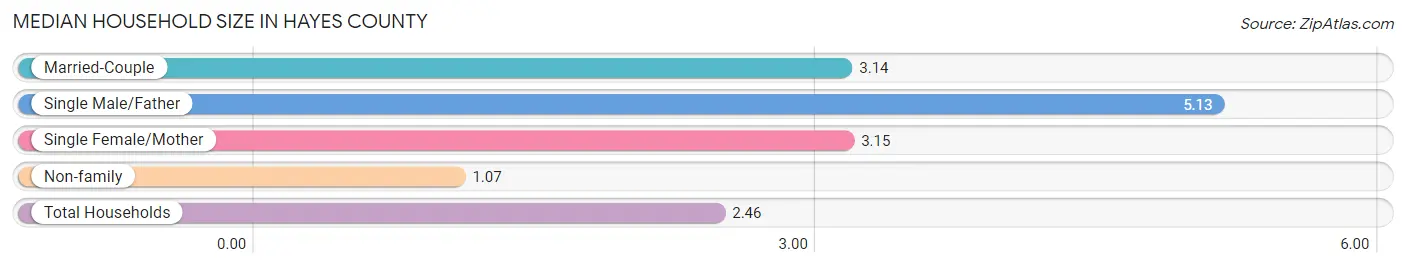
The median household size in Hayes County is 2.46 persons per household, with single male/father households (8 | 2.1%) accounting for the largest median household size of 5.13 persons per household. non-family households (131 | 35.0%) represent the smallest median household size with 1.07 persons per household.
| Household Type | # Households | Household Size |
| Married-Couple | 222 (59.4%) | 3.14 |
| Single Male/Father | 8 (2.1%) | 5.13 |
| Single Female/Mother | 13 (3.5%) | 3.15 |
| Non-family | 131 (35.0%) | 1.07 |
| Total Households | 374 (100.0%) | 2.46 |
Household Size by Marriage Status in Hayes County
Out of a total of 374 households in Hayes County, 243 (65.0%) are family households, while 131 (35.0%) are nonfamily households. The most numerous type of family households are 2-person households, comprising 143, and the most common type of nonfamily households are 1-person households, comprising 126.
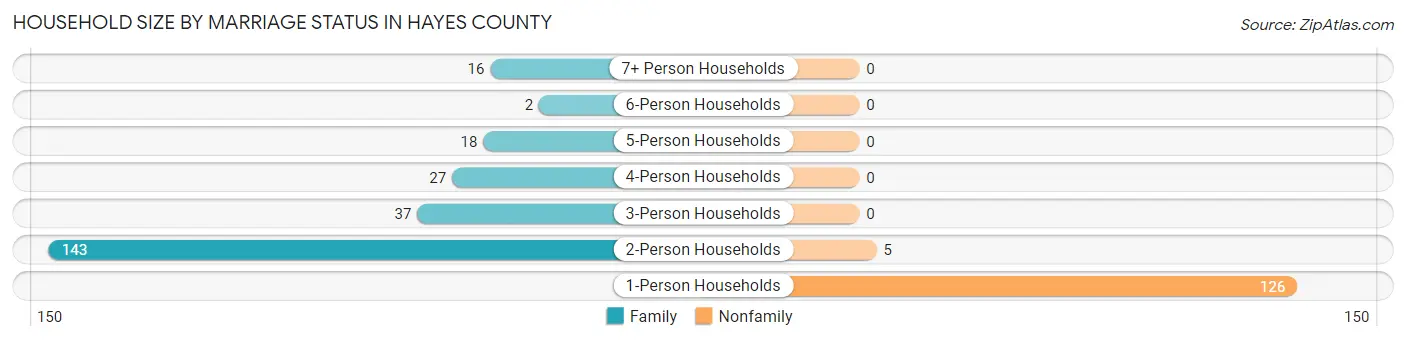
| Household Size | Family Households | Nonfamily Households |
| 1-Person Households | - | 126 (33.7%) |
| 2-Person Households | 143 (38.2%) | 5 (1.3%) |
| 3-Person Households | 37 (9.9%) | 0 (0.0%) |
| 4-Person Households | 27 (7.2%) | 0 (0.0%) |
| 5-Person Households | 18 (4.8%) | 0 (0.0%) |
| 6-Person Households | 2 (0.5%) | 0 (0.0%) |
| 7+ Person Households | 16 (4.3%) | 0 (0.0%) |
| Total | 243 (65.0%) | 131 (35.0%) |
Female Fertility in Hayes County
Fertility by Age in Hayes County
Average fertility rate in Hayes County is 63.0 births per 1,000 women. Women in the age bracket of 20 to 34 years have the highest fertility rate with 172.0 births per 1,000 women. Women in the age bracket of 20 to 34 years acount for 100.0% of all women with births.
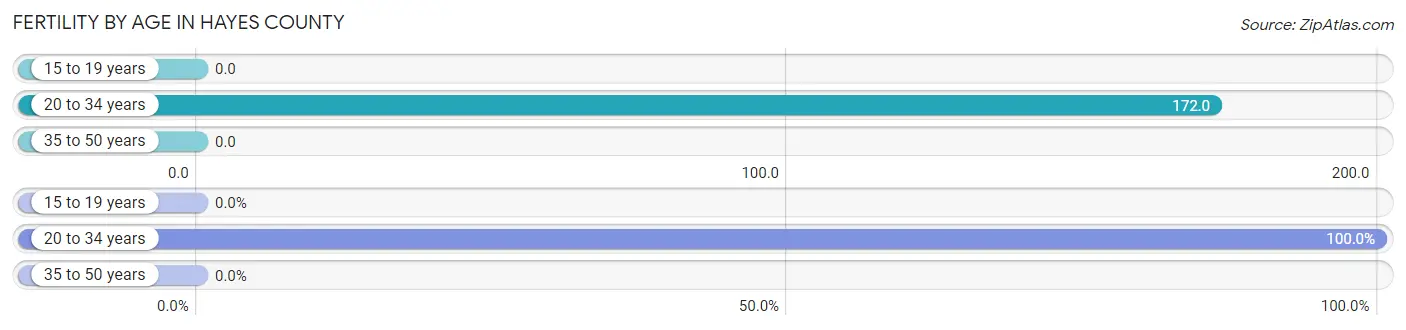
| Age Bracket | Women with Births | Births / 1,000 Women |
| 15 to 19 years | 0 (0.0%) | 0.0 |
| 20 to 34 years | 10 (100.0%) | 172.0 |
| 35 to 50 years | 0 (0.0%) | 0.0 |
| Total | 10 (100.0%) | 63.0 |
Fertility by Age by Marriage Status in Hayes County
90.0% of women with births (10) in Hayes County are married. The highest percentage of unmarried women with births falls into 20 to 34 years age bracket with 10.0% of them unmarried at the time of birth, while the lowest percentage of unmarried women with births belong to 20 to 34 years age bracket with 10.0% of them unmarried.
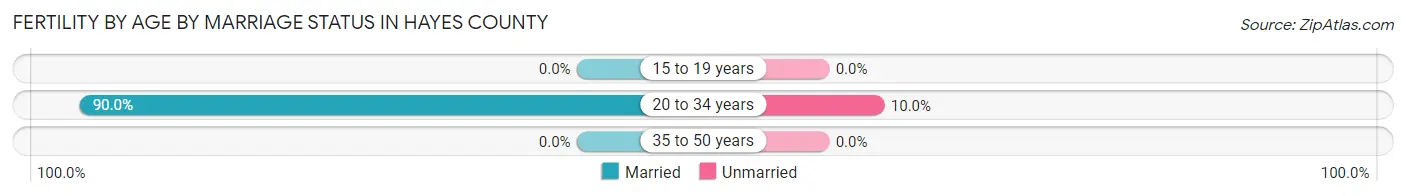
| Age Bracket | Married | Unmarried |
| 15 to 19 years | 0 (0.0%) | 0 (0.0%) |
| 20 to 34 years | 9 (90.0%) | 1 (10.0%) |
| 35 to 50 years | 0 (0.0%) | 0 (0.0%) |
| Total | 9 (90.0%) | 1 (10.0%) |
Fertility by Education in Hayes County
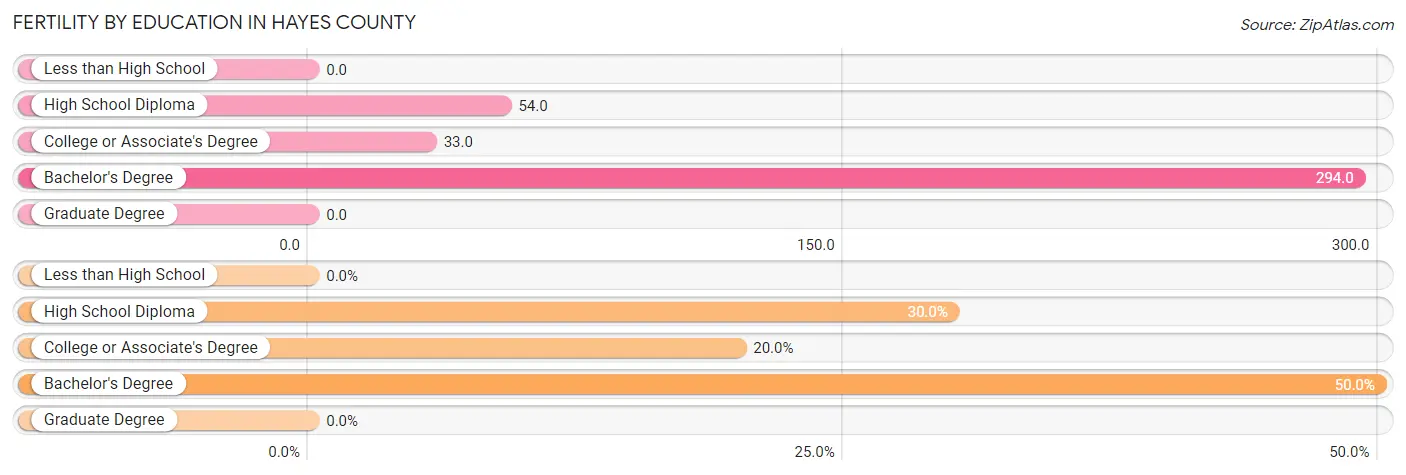
| Educational Attainment | Women with Births | Births / 1,000 Women |
| Less than High School | 0 (0.0%) | 0.0 |
| High School Diploma | 3 (30.0%) | 54.0 |
| College or Associate's Degree | 2 (20.0%) | 33.0 |
| Bachelor's Degree | 5 (50.0%) | 294.0 |
| Graduate Degree | 0 (0.0%) | 0.0 |
| Total | 10 (100.0%) | 63.0 |
Fertility by Education by Marriage Status in Hayes County
10.0% of women with births in Hayes County are unmarried. Women with the educational attainment of college or associate's degree are most likely to be married with 100.0% of them married at childbirth, while women with the educational attainment of high school diploma are least likely to be married with 33.3% of them unmarried at childbirth.
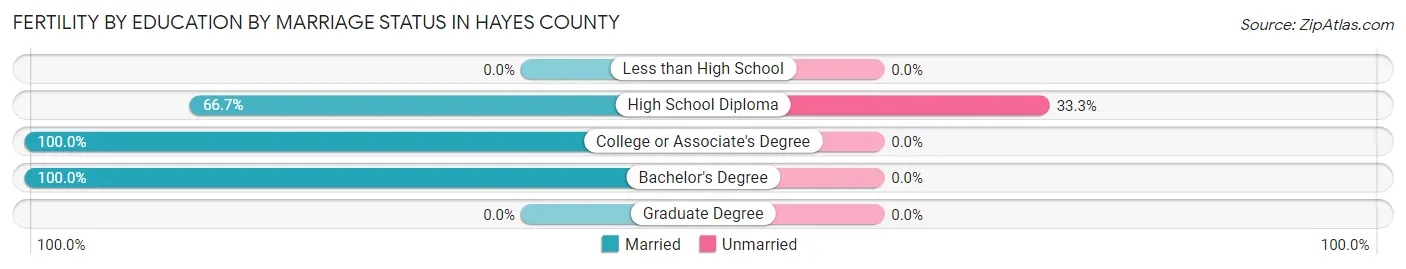
| Educational Attainment | Married | Unmarried |
| Less than High School | 0 (0.0%) | 0 (0.0%) |
| High School Diploma | 2 (66.7%) | 1 (33.3%) |
| College or Associate's Degree | 2 (100.0%) | 0 (0.0%) |
| Bachelor's Degree | 5 (100.0%) | 0 (0.0%) |
| Graduate Degree | 0 (0.0%) | 0 (0.0%) |
| Total | 9 (90.0%) | 1 (10.0%) |
Employment Characteristics in Hayes County
Employment by Class of Employer in Hayes County
Among the 427 employed individuals in Hayes County, private company employees (179 | 41.9%), self-employed (not incorporated) (86 | 20.1%), and self-employed (incorporated) (42 | 9.8%) make up the most common classes of employment.
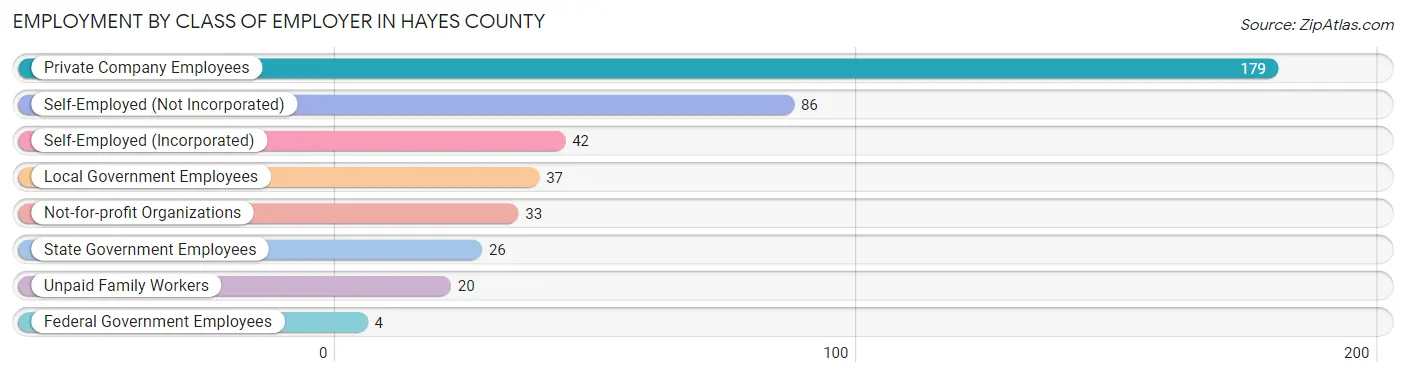
| Employer Class | # Employees | % Employees |
| Private Company Employees | 179 | 41.9% |
| Self-Employed (Incorporated) | 42 | 9.8% |
| Self-Employed (Not Incorporated) | 86 | 20.1% |
| Not-for-profit Organizations | 33 | 7.7% |
| Local Government Employees | 37 | 8.7% |
| State Government Employees | 26 | 6.1% |
| Federal Government Employees | 4 | 0.9% |
| Unpaid Family Workers | 20 | 4.7% |
| Total | 427 | 100.0% |
Employment Status by Age in Hayes County
According to the labor force statistics for Hayes County, out of the total population over 16 years of age (732), 58.6% or 429 individuals are in the labor force, with 0.2% or 1 of them unemployed. The age group with the highest labor force participation rate is 25 to 29 years, with 100.0% or 34 individuals in the labor force. Within the labor force, the 60 to 64 years age range has the highest percentage of unemployed individuals, with 1.2% or 1 of them being unemployed.
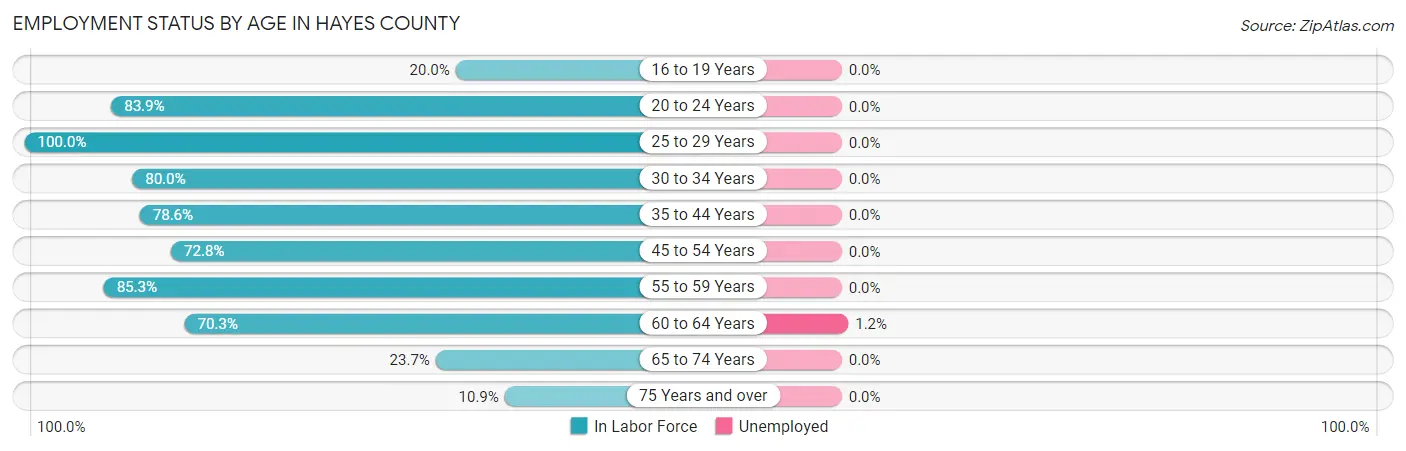
| Age Bracket | In Labor Force | Unemployed |
| 16 to 19 Years | 4 (20.0%) | 0 (0.0%) |
| 20 to 24 Years | 26 (83.9%) | 0 (0.0%) |
| 25 to 29 Years | 34 (100.0%) | 0 (0.0%) |
| 30 to 34 Years | 44 (80.0%) | 0 (0.0%) |
| 35 to 44 Years | 66 (78.6%) | 0 (0.0%) |
| 45 to 54 Years | 75 (72.8%) | 0 (0.0%) |
| 55 to 59 Years | 58 (85.3%) | 0 (0.0%) |
| 60 to 64 Years | 83 (70.3%) | 1 (1.2%) |
| 65 to 74 Years | 28 (23.7%) | 0 (0.0%) |
| 75 Years and over | 11 (10.9%) | 0 (0.0%) |
| Total | 429 (58.6%) | 1 (0.2%) |
Employment Status by Educational Attainment in Hayes County
According to labor force statistics for Hayes County, 77.9% of individuals (360) out of the total population between 25 and 64 years of age (462) are in the labor force, with 0.3% or 1 of them being unemployed. The group with the highest labor force participation rate are those with the educational attainment of bachelor's degree or higher, with 93.5% or 72 individuals in the labor force. Within the labor force, individuals with college / associate degree education have the highest percentage of unemployment, with 0.6% or 1 of them being unemployed.
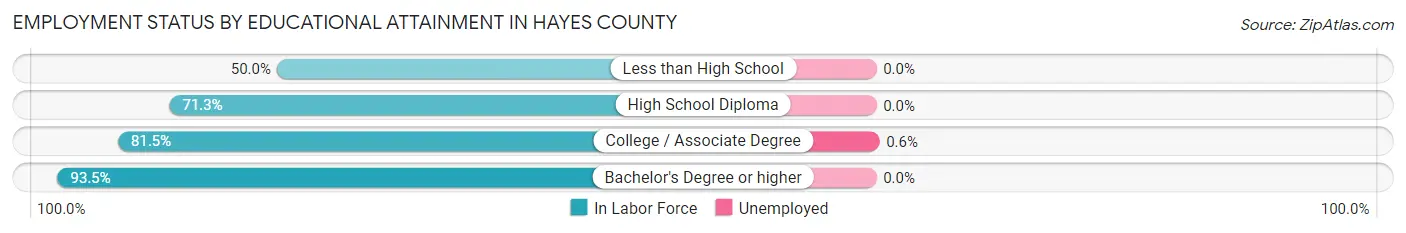
| Educational Attainment | In Labor Force | Unemployed |
| Less than High School | 15 (50.0%) | 0 (0.0%) |
| High School Diploma | 114 (71.3%) | 0 (0.0%) |
| College / Associate Degree | 159 (81.5%) | 1 (0.6%) |
| Bachelor's Degree or higher | 72 (93.5%) | 0 (0.0%) |
| Total | 360 (77.9%) | 1 (0.3%) |
Employment Occupations by Sex in Hayes County
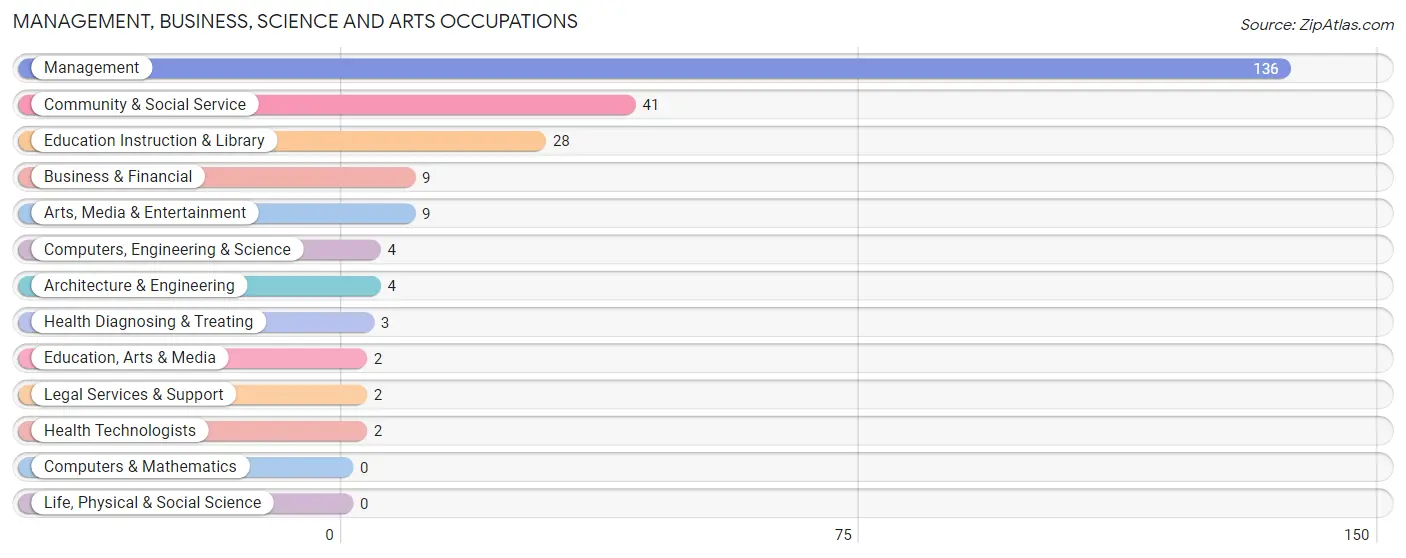
Management, Business, Science and Arts Occupations
The most common Management, Business, Science and Arts occupations in Hayes County are Management (136 | 31.8%), Community & Social Service (41 | 9.6%), Education Instruction & Library (28 | 6.5%), Business & Financial (9 | 2.1%), and Arts, Media & Entertainment (9 | 2.1%).
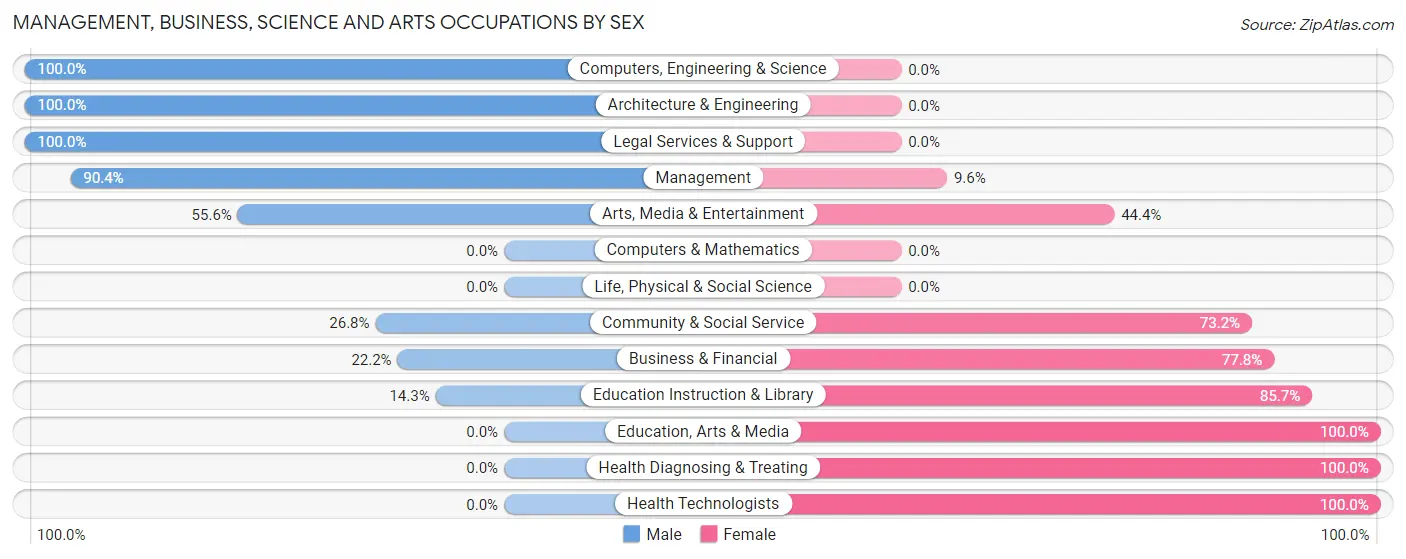
Management, Business, Science and Arts Occupations by Sex
Within the Management, Business, Science and Arts occupations in Hayes County, the most male-oriented occupations are Computers, Engineering & Science (100.0%), Architecture & Engineering (100.0%), and Legal Services & Support (100.0%), while the most female-oriented occupations are Education, Arts & Media (100.0%), Health Diagnosing & Treating (100.0%), and Health Technologists (100.0%).
| Occupation | Male | Female |
| Management | 123 (90.4%) | 13 (9.6%) |
| Business & Financial | 2 (22.2%) | 7 (77.8%) |
| Computers, Engineering & Science | 4 (100.0%) | 0 (0.0%) |
| Computers & Mathematics | 0 (0.0%) | 0 (0.0%) |
| Architecture & Engineering | 4 (100.0%) | 0 (0.0%) |
| Life, Physical & Social Science | 0 (0.0%) | 0 (0.0%) |
| Community & Social Service | 11 (26.8%) | 30 (73.2%) |
| Education, Arts & Media | 0 (0.0%) | 2 (100.0%) |
| Legal Services & Support | 2 (100.0%) | 0 (0.0%) |
| Education Instruction & Library | 4 (14.3%) | 24 (85.7%) |
| Arts, Media & Entertainment | 5 (55.6%) | 4 (44.4%) |
| Health Diagnosing & Treating | 0 (0.0%) | 3 (100.0%) |
| Health Technologists | 0 (0.0%) | 2 (100.0%) |
| Total (Category) | 140 (72.5%) | 53 (27.5%) |
| Total (Overall) | 263 (61.5%) | 165 (38.6%) |
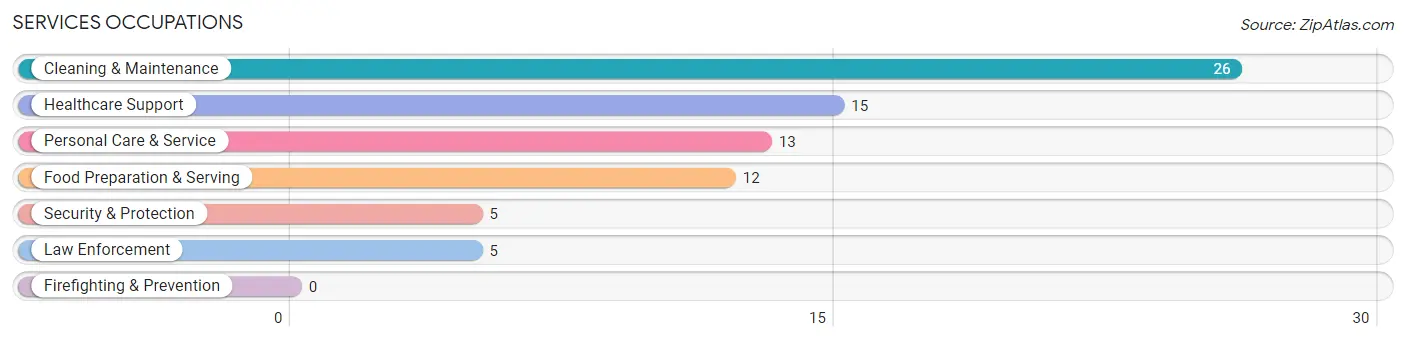
Services Occupations
The most common Services occupations in Hayes County are Cleaning & Maintenance (26 | 6.1%), Healthcare Support (15 | 3.5%), Personal Care & Service (13 | 3.0%), Food Preparation & Serving (12 | 2.8%), and Security & Protection (5 | 1.2%).
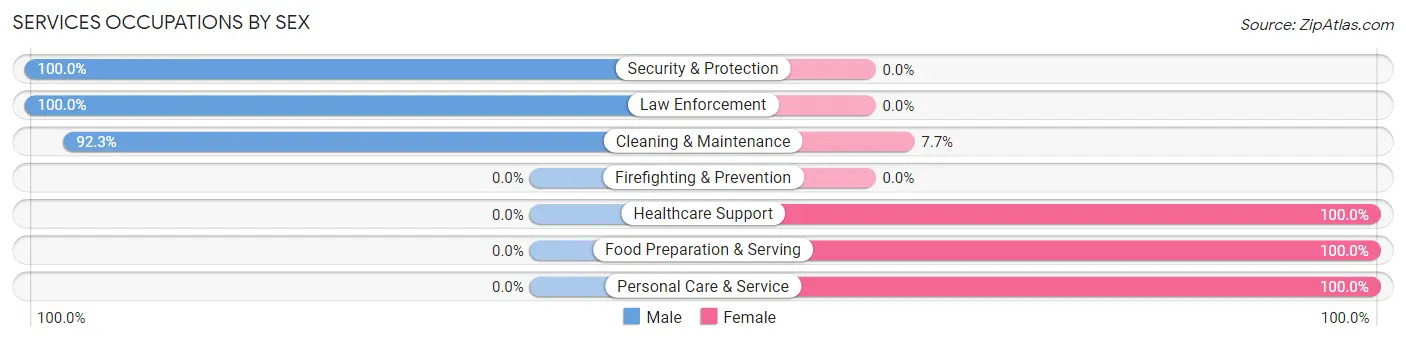
Services Occupations by Sex
Within the Services occupations in Hayes County, the most male-oriented occupations are Security & Protection (100.0%), Law Enforcement (100.0%), and Cleaning & Maintenance (92.3%), while the most female-oriented occupations are Healthcare Support (100.0%), Food Preparation & Serving (100.0%), and Personal Care & Service (100.0%).
| Occupation | Male | Female |
| Healthcare Support | 0 (0.0%) | 15 (100.0%) |
| Security & Protection | 5 (100.0%) | 0 (0.0%) |
| Firefighting & Prevention | 0 (0.0%) | 0 (0.0%) |
| Law Enforcement | 5 (100.0%) | 0 (0.0%) |
| Food Preparation & Serving | 0 (0.0%) | 12 (100.0%) |
| Cleaning & Maintenance | 24 (92.3%) | 2 (7.7%) |
| Personal Care & Service | 0 (0.0%) | 13 (100.0%) |
| Total (Category) | 29 (40.8%) | 42 (59.2%) |
| Total (Overall) | 263 (61.5%) | 165 (38.6%) |
Sales and Office Occupations
The most common Sales and Office occupations in Hayes County are Office & Administration (54 | 12.6%), and Sales & Related (4 | 0.9%).
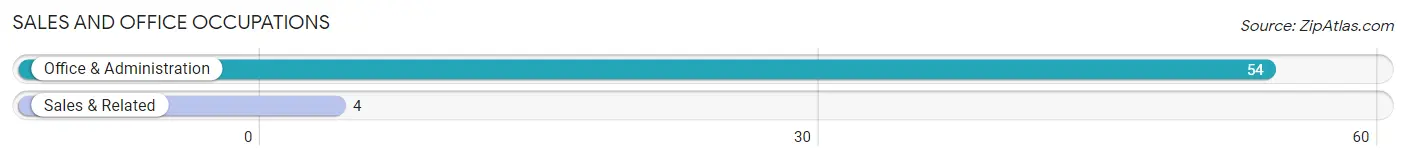
Sales and Office Occupations by Sex
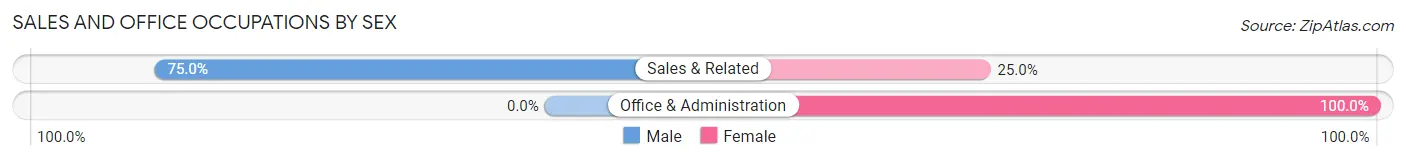
| Occupation | Male | Female |
| Sales & Related | 3 (75.0%) | 1 (25.0%) |
| Office & Administration | 0 (0.0%) | 54 (100.0%) |
| Total (Category) | 3 (5.2%) | 55 (94.8%) |
| Total (Overall) | 263 (61.5%) | 165 (38.6%) |
Natural Resources, Construction and Maintenance Occupations
The most common Natural Resources, Construction and Maintenance occupations in Hayes County are Farming, Fishing & Forestry (52 | 12.1%), Installation, Maintenance & Repair (13 | 3.0%), and Construction & Extraction (5 | 1.2%).
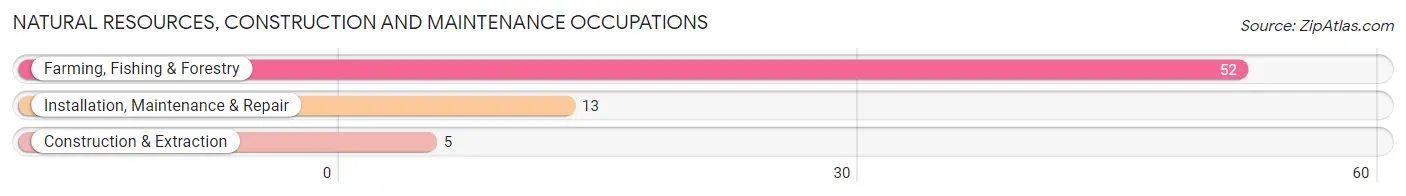
Natural Resources, Construction and Maintenance Occupations by Sex
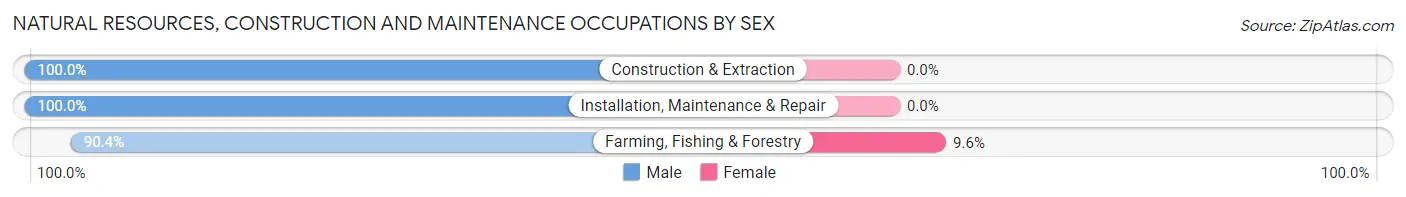
| Occupation | Male | Female |
| Farming, Fishing & Forestry | 47 (90.4%) | 5 (9.6%) |
| Construction & Extraction | 5 (100.0%) | 0 (0.0%) |
| Installation, Maintenance & Repair | 13 (100.0%) | 0 (0.0%) |
| Total (Category) | 65 (92.9%) | 5 (7.1%) |
| Total (Overall) | 263 (61.5%) | 165 (38.6%) |
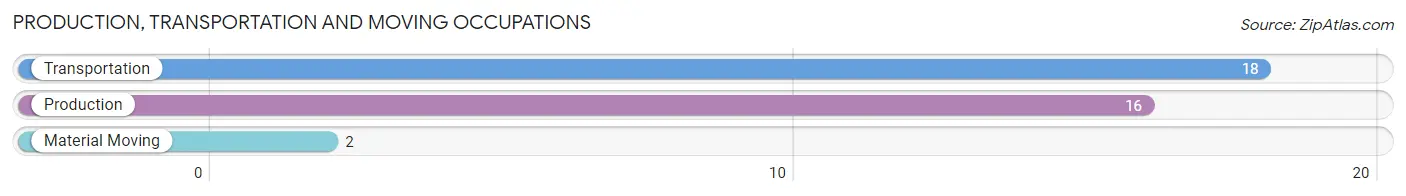
Production, Transportation and Moving Occupations
The most common Production, Transportation and Moving occupations in Hayes County are Transportation (18 | 4.2%), Production (16 | 3.7%), and Material Moving (2 | 0.5%).
Production, Transportation and Moving Occupations by Sex
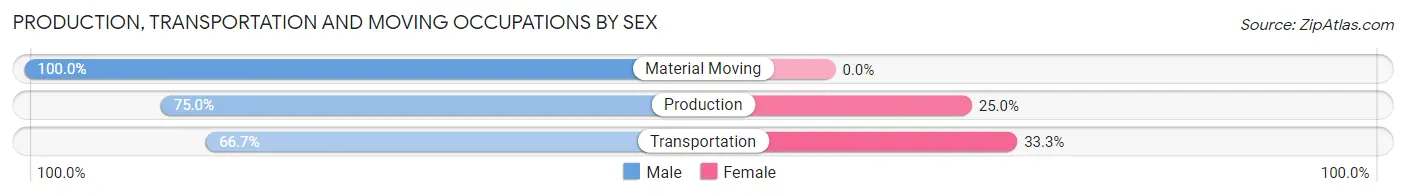
| Occupation | Male | Female |
| Production | 12 (75.0%) | 4 (25.0%) |
| Transportation | 12 (66.7%) | 6 (33.3%) |
| Material Moving | 2 (100.0%) | 0 (0.0%) |
| Total (Category) | 26 (72.2%) | 10 (27.8%) |
| Total (Overall) | 263 (61.5%) | 165 (38.6%) |
Employment Industries by Sex in Hayes County
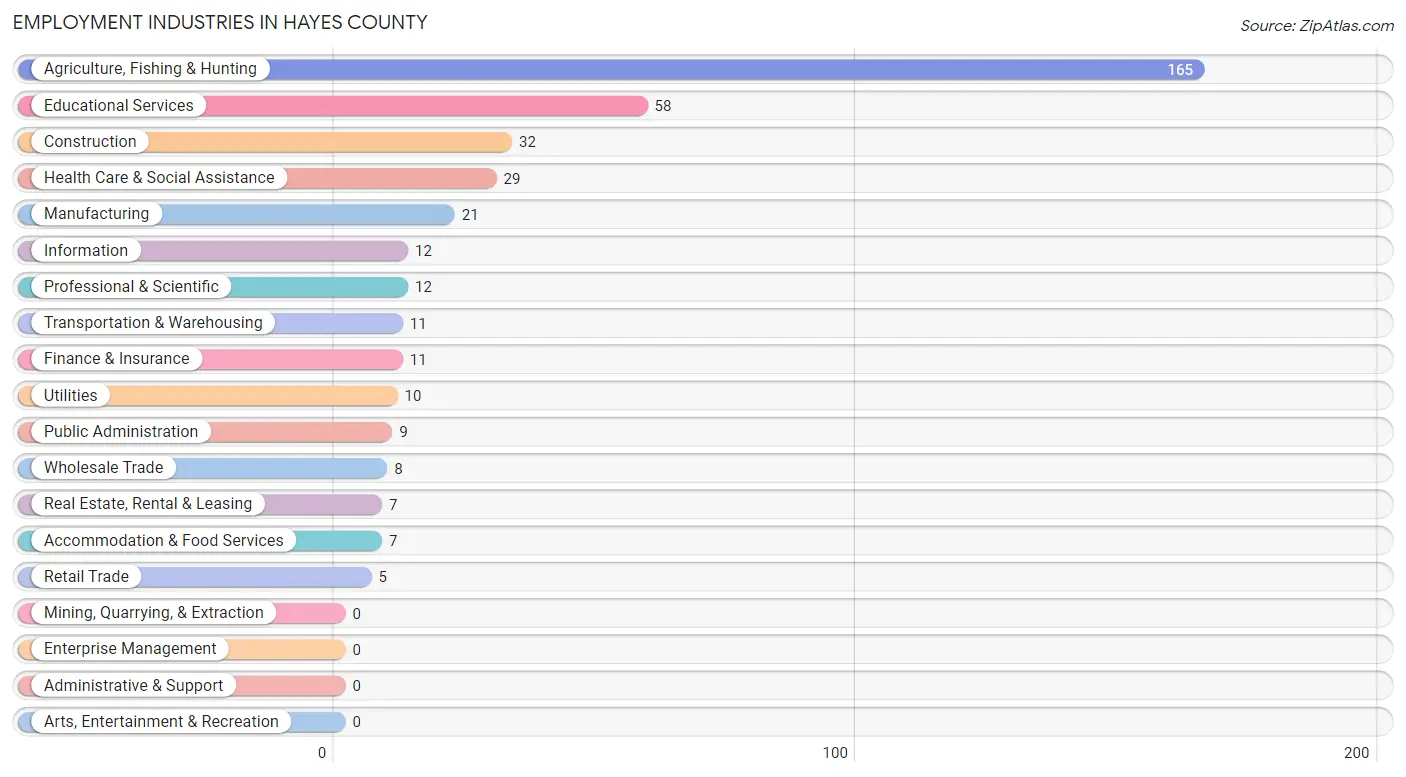
Employment Industries in Hayes County
The major employment industries in Hayes County include Agriculture, Fishing & Hunting (165 | 38.6%), Educational Services (58 | 13.6%), Construction (32 | 7.5%), Health Care & Social Assistance (29 | 6.8%), and Manufacturing (21 | 4.9%).
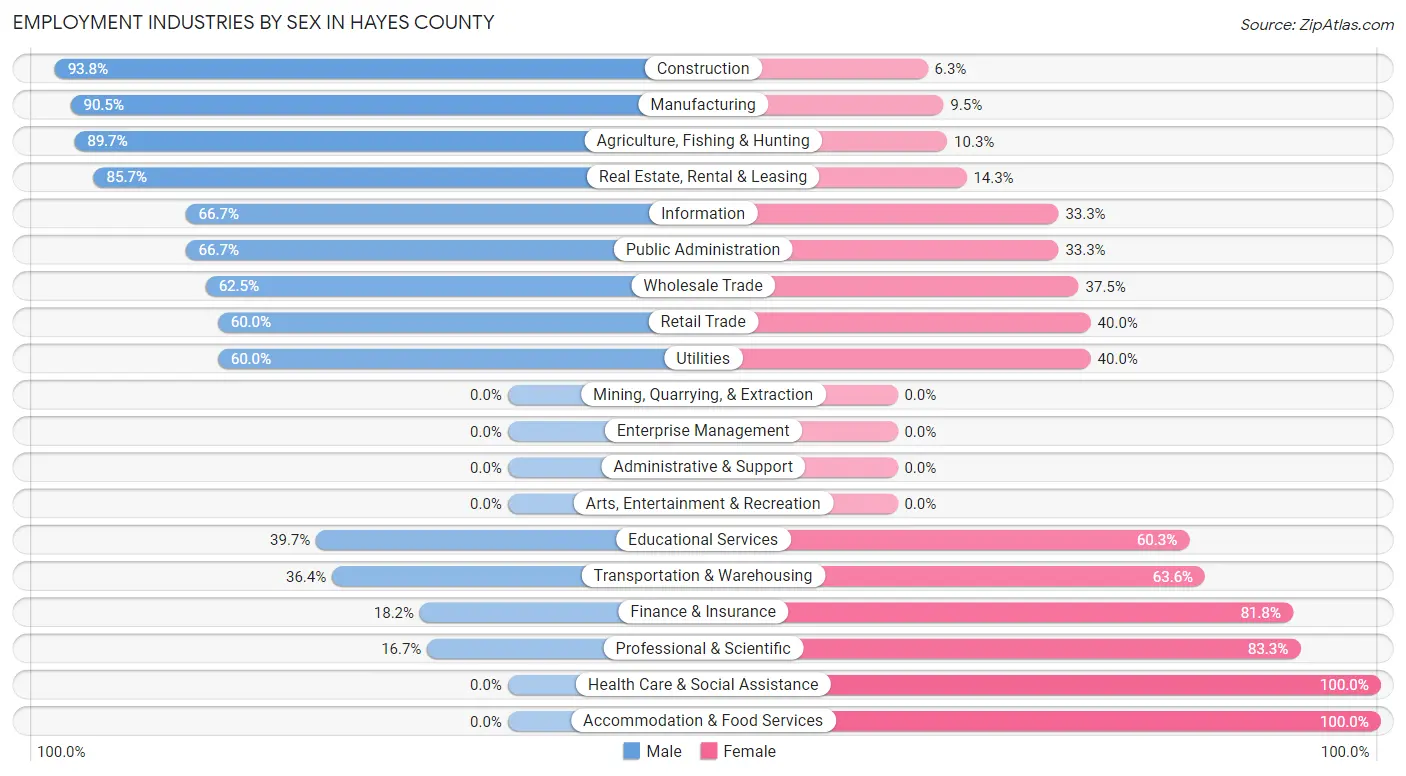
Employment Industries by Sex in Hayes County
The Hayes County industries that see more men than women are Construction (93.8%), Manufacturing (90.5%), and Agriculture, Fishing & Hunting (89.7%), whereas the industries that tend to have a higher number of women are Health Care & Social Assistance (100.0%), Accommodation & Food Services (100.0%), and Professional & Scientific (83.3%).
| Industry | Male | Female |
| Agriculture, Fishing & Hunting | 148 (89.7%) | 17 (10.3%) |
| Mining, Quarrying, & Extraction | 0 (0.0%) | 0 (0.0%) |
| Construction | 30 (93.8%) | 2 (6.2%) |
| Manufacturing | 19 (90.5%) | 2 (9.5%) |
| Wholesale Trade | 5 (62.5%) | 3 (37.5%) |
| Retail Trade | 3 (60.0%) | 2 (40.0%) |
| Transportation & Warehousing | 4 (36.4%) | 7 (63.6%) |
| Utilities | 6 (60.0%) | 4 (40.0%) |
| Information | 8 (66.7%) | 4 (33.3%) |
| Finance & Insurance | 2 (18.2%) | 9 (81.8%) |
| Real Estate, Rental & Leasing | 6 (85.7%) | 1 (14.3%) |
| Professional & Scientific | 2 (16.7%) | 10 (83.3%) |
| Enterprise Management | 0 (0.0%) | 0 (0.0%) |
| Administrative & Support | 0 (0.0%) | 0 (0.0%) |
| Educational Services | 23 (39.7%) | 35 (60.3%) |
| Health Care & Social Assistance | 0 (0.0%) | 29 (100.0%) |
| Arts, Entertainment & Recreation | 0 (0.0%) | 0 (0.0%) |
| Accommodation & Food Services | 0 (0.0%) | 7 (100.0%) |
| Public Administration | 6 (66.7%) | 3 (33.3%) |
| Total | 263 (61.5%) | 165 (38.6%) |
Education in Hayes County
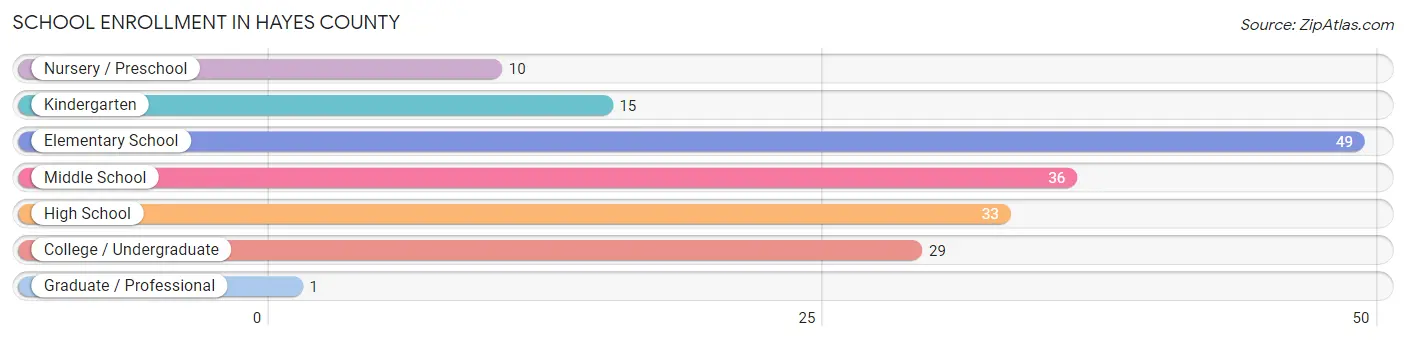
School Enrollment in Hayes County
The most common levels of schooling among the 173 students in Hayes County are elementary school (49 | 28.3%), middle school (36 | 20.8%), and high school (33 | 19.1%).
| School Level | # Students | % Students |
| Nursery / Preschool | 10 | 5.8% |
| Kindergarten | 15 | 8.7% |
| Elementary School | 49 | 28.3% |
| Middle School | 36 | 20.8% |
| High School | 33 | 19.1% |
| College / Undergraduate | 29 | 16.8% |
| Graduate / Professional | 1 | 0.6% |
| Total | 173 | 100.0% |
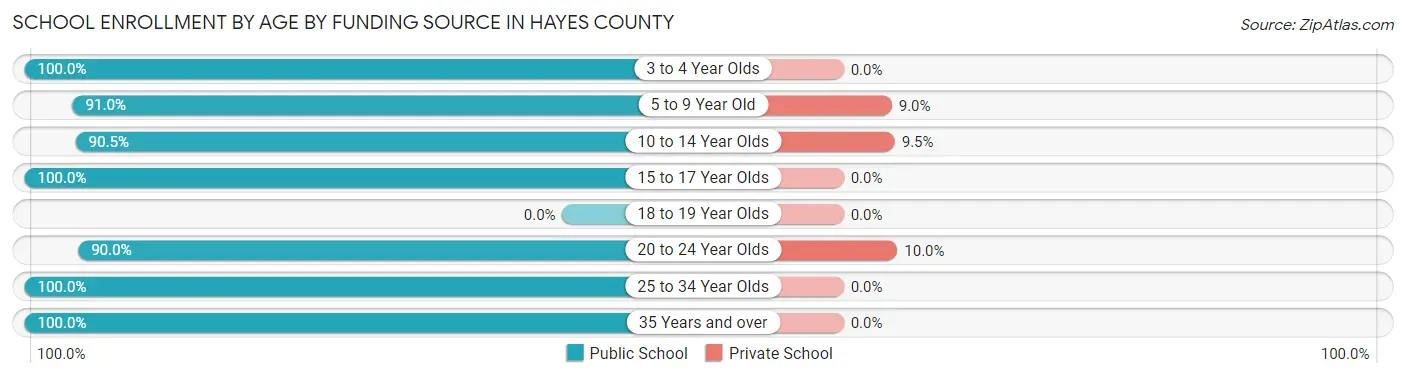
School Enrollment by Age by Funding Source in Hayes County
Out of a total of 173 students who are enrolled in schools in Hayes County, 12 (6.9%) attend a private institution, while the remaining 161 (93.1%) are enrolled in public schools. The age group of 20 to 24 year olds has the highest likelihood of being enrolled in private schools, with 2 (10.0% in the age bracket) enrolled. Conversely, the age group of 3 to 4 year olds has the lowest likelihood of being enrolled in a private school, with 1 (100.0% in the age bracket) attending a public institution.
| Age Bracket | Public School | Private School |
| 3 to 4 Year Olds | 1 (100.0%) | 0 (0.0%) |
| 5 to 9 Year Old | 61 (91.0%) | 6 (9.0%) |
| 10 to 14 Year Olds | 38 (90.5%) | 4 (9.5%) |
| 15 to 17 Year Olds | 33 (100.0%) | 0 (0.0%) |
| 18 to 19 Year Olds | 0 (0.0%) | 0 (0.0%) |
| 20 to 24 Year Olds | 18 (90.0%) | 2 (10.0%) |
| 25 to 34 Year Olds | 5 (100.0%) | 0 (0.0%) |
| 35 Years and over | 5 (100.0%) | 0 (0.0%) |
| Total | 161 (93.1%) | 12 (6.9%) |
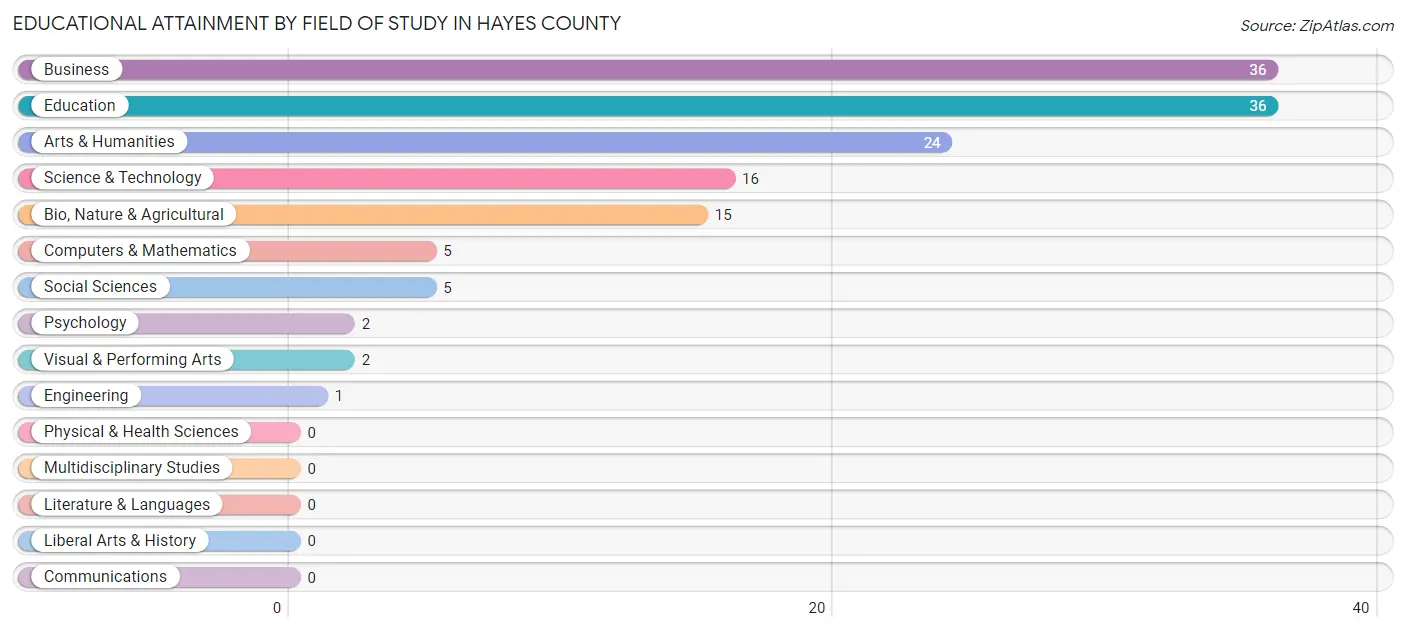
Educational Attainment by Field of Study in Hayes County
Business (36 | 25.4%), education (36 | 25.4%), arts & humanities (24 | 16.9%), science & technology (16 | 11.3%), and bio, nature & agricultural (15 | 10.6%) are the most common fields of study among 142 individuals in Hayes County who have obtained a bachelor's degree or higher.
| Field of Study | # Graduates | % Graduates |
| Computers & Mathematics | 5 | 3.5% |
| Bio, Nature & Agricultural | 15 | 10.6% |
| Physical & Health Sciences | 0 | 0.0% |
| Psychology | 2 | 1.4% |
| Social Sciences | 5 | 3.5% |
| Engineering | 1 | 0.7% |
| Multidisciplinary Studies | 0 | 0.0% |
| Science & Technology | 16 | 11.3% |
| Business | 36 | 25.4% |
| Education | 36 | 25.4% |
| Literature & Languages | 0 | 0.0% |
| Liberal Arts & History | 0 | 0.0% |
| Visual & Performing Arts | 2 | 1.4% |
| Communications | 0 | 0.0% |
| Arts & Humanities | 24 | 16.9% |
| Total | 142 | 100.0% |
Transportation & Commute in Hayes County
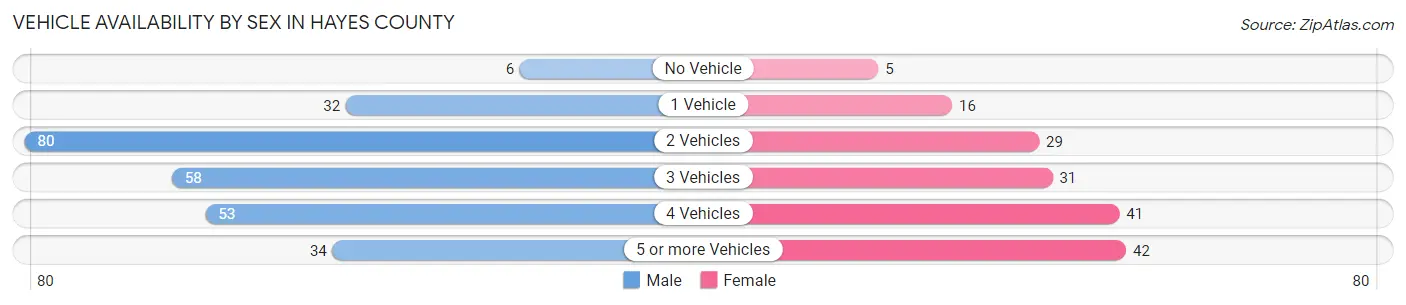
Vehicle Availability by Sex in Hayes County
The most prevalent vehicle ownership categories in Hayes County are males with 2 vehicles (80, accounting for 30.4%) and females with 2 vehicles (29, making up 48.8%).
| Vehicles Available | Male | Female |
| No Vehicle | 6 (2.3%) | 5 (3.0%) |
| 1 Vehicle | 32 (12.2%) | 16 (9.8%) |
| 2 Vehicles | 80 (30.4%) | 29 (17.7%) |
| 3 Vehicles | 58 (22.1%) | 31 (18.9%) |
| 4 Vehicles | 53 (20.2%) | 41 (25.0%) |
| 5 or more Vehicles | 34 (12.9%) | 42 (25.6%) |
| Total | 263 (100.0%) | 164 (100.0%) |
Commute Time in Hayes County
The most frequently occuring commute durations in Hayes County are 5 to 9 minutes (65 commuters, 18.2%), 10 to 14 minutes (64 commuters, 17.9%), and 20 to 24 minutes (58 commuters, 16.3%).
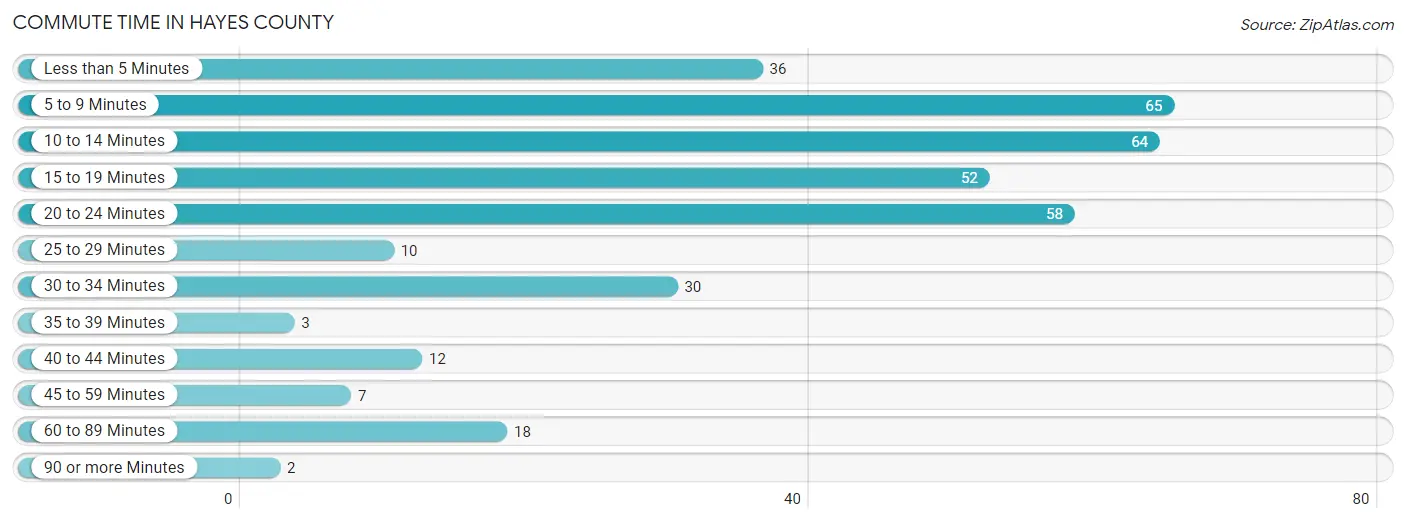
| Commute Time | # Commuters | % Commuters |
| Less than 5 Minutes | 36 | 10.1% |
| 5 to 9 Minutes | 65 | 18.2% |
| 10 to 14 Minutes | 64 | 17.9% |
| 15 to 19 Minutes | 52 | 14.6% |
| 20 to 24 Minutes | 58 | 16.3% |
| 25 to 29 Minutes | 10 | 2.8% |
| 30 to 34 Minutes | 30 | 8.4% |
| 35 to 39 Minutes | 3 | 0.8% |
| 40 to 44 Minutes | 12 | 3.4% |
| 45 to 59 Minutes | 7 | 2.0% |
| 60 to 89 Minutes | 18 | 5.0% |
| 90 or more Minutes | 2 | 0.6% |
Commute Time by Sex in Hayes County
The most common commute times in Hayes County are 10 to 14 minutes (53 commuters, 23.8%) for males and 20 to 24 minutes (41 commuters, 30.6%) for females.
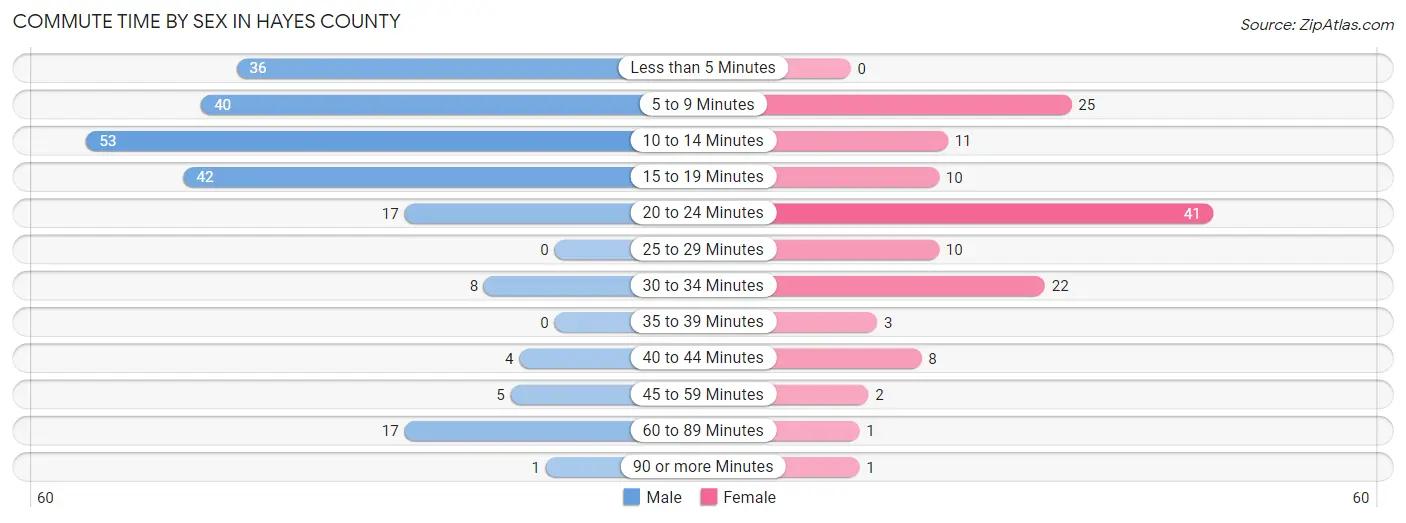
| Commute Time | Male | Female |
| Less than 5 Minutes | 36 (16.1%) | 0 (0.0%) |
| 5 to 9 Minutes | 40 (17.9%) | 25 (18.7%) |
| 10 to 14 Minutes | 53 (23.8%) | 11 (8.2%) |
| 15 to 19 Minutes | 42 (18.8%) | 10 (7.5%) |
| 20 to 24 Minutes | 17 (7.6%) | 41 (30.6%) |
| 25 to 29 Minutes | 0 (0.0%) | 10 (7.5%) |
| 30 to 34 Minutes | 8 (3.6%) | 22 (16.4%) |
| 35 to 39 Minutes | 0 (0.0%) | 3 (2.2%) |
| 40 to 44 Minutes | 4 (1.8%) | 8 (6.0%) |
| 45 to 59 Minutes | 5 (2.2%) | 2 (1.5%) |
| 60 to 89 Minutes | 17 (7.6%) | 1 (0.7%) |
| 90 or more Minutes | 1 (0.4%) | 1 (0.7%) |
Time of Departure to Work by Sex in Hayes County
The most frequent times of departure to work in Hayes County are 7:30 AM to 7:59 AM (73, 32.7%) for males and 7:30 AM to 7:59 AM (49, 36.6%) for females.
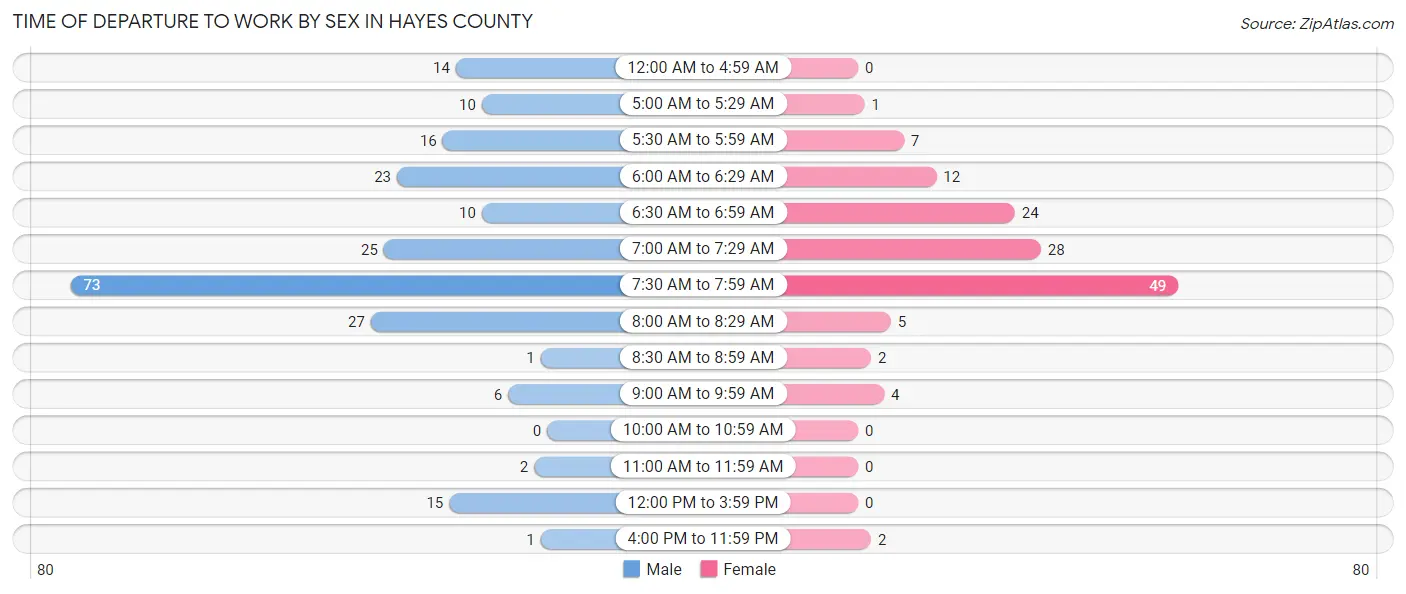
| Time of Departure | Male | Female |
| 12:00 AM to 4:59 AM | 14 (6.3%) | 0 (0.0%) |
| 5:00 AM to 5:29 AM | 10 (4.5%) | 1 (0.7%) |
| 5:30 AM to 5:59 AM | 16 (7.2%) | 7 (5.2%) |
| 6:00 AM to 6:29 AM | 23 (10.3%) | 12 (9.0%) |
| 6:30 AM to 6:59 AM | 10 (4.5%) | 24 (17.9%) |
| 7:00 AM to 7:29 AM | 25 (11.2%) | 28 (20.9%) |
| 7:30 AM to 7:59 AM | 73 (32.7%) | 49 (36.6%) |
| 8:00 AM to 8:29 AM | 27 (12.1%) | 5 (3.7%) |
| 8:30 AM to 8:59 AM | 1 (0.4%) | 2 (1.5%) |
| 9:00 AM to 9:59 AM | 6 (2.7%) | 4 (3.0%) |
| 10:00 AM to 10:59 AM | 0 (0.0%) | 0 (0.0%) |
| 11:00 AM to 11:59 AM | 2 (0.9%) | 0 (0.0%) |
| 12:00 PM to 3:59 PM | 15 (6.7%) | 0 (0.0%) |
| 4:00 PM to 11:59 PM | 1 (0.4%) | 2 (1.5%) |
| Total | 223 (100.0%) | 134 (100.0%) |
Housing Occupancy in Hayes County
Occupancy by Ownership in Hayes County
Of the total 374 dwellings in Hayes County, owner-occupied units account for 266 (71.1%), while renter-occupied units make up 108 (28.9%).
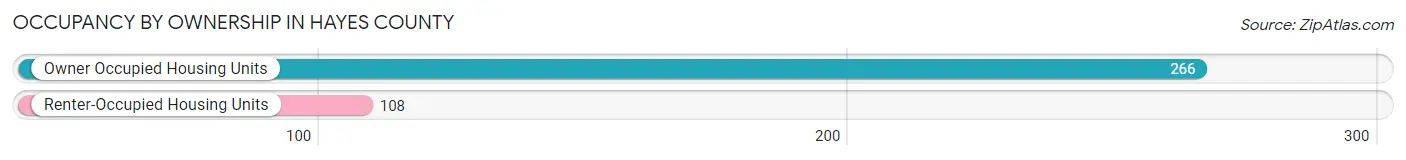
| Occupancy | # Housing Units | % Housing Units |
| Owner Occupied Housing Units | 266 | 71.1% |
| Renter-Occupied Housing Units | 108 | 28.9% |
| Total Occupied Housing Units | 374 | 100.0% |
Occupancy by Household Size in Hayes County
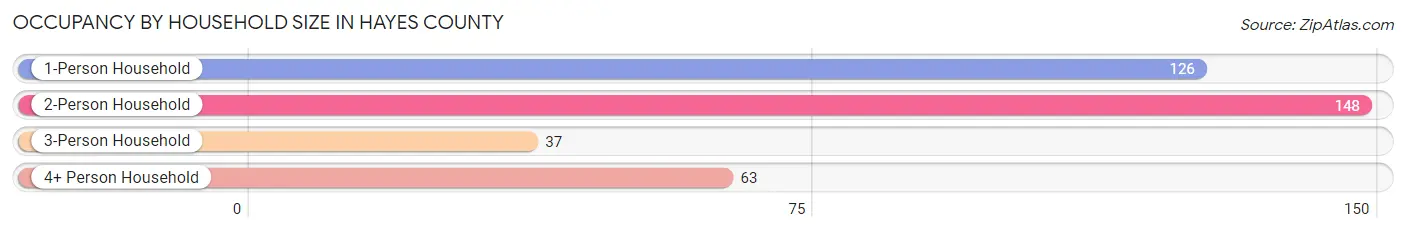
| Household Size | # Housing Units | % Housing Units |
| 1-Person Household | 126 | 33.7% |
| 2-Person Household | 148 | 39.6% |
| 3-Person Household | 37 | 9.9% |
| 4+ Person Household | 63 | 16.8% |
| Total Housing Units | 374 | 100.0% |
Occupancy by Ownership by Household Size in Hayes County
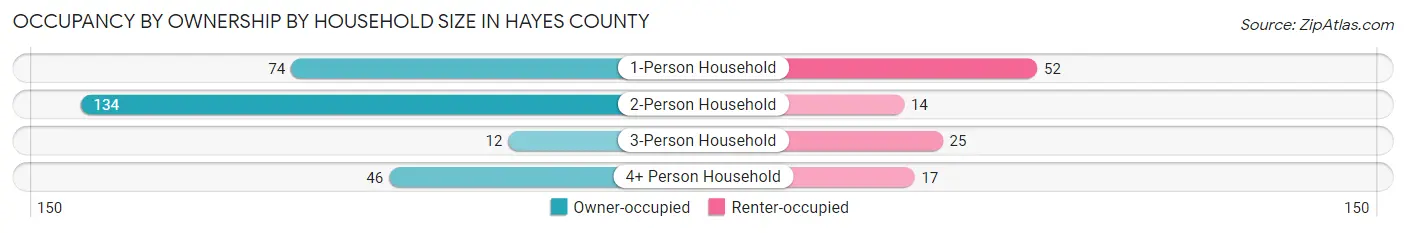
| Household Size | Owner-occupied | Renter-occupied |
| 1-Person Household | 74 (58.7%) | 52 (41.3%) |
| 2-Person Household | 134 (90.5%) | 14 (9.5%) |
| 3-Person Household | 12 (32.4%) | 25 (67.6%) |
| 4+ Person Household | 46 (73.0%) | 17 (27.0%) |
| Total Housing Units | 266 (71.1%) | 108 (28.9%) |
Occupancy by Educational Attainment in Hayes County
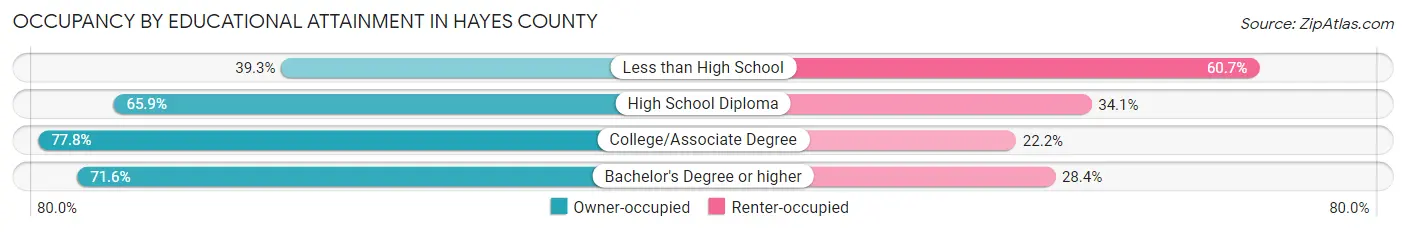
| Household Size | Owner-occupied | Renter-occupied |
| Less than High School | 11 (39.3%) | 17 (60.7%) |
| High School Diploma | 56 (65.9%) | 29 (34.1%) |
| College/Associate Degree | 151 (77.8%) | 43 (22.2%) |
| Bachelor's Degree or higher | 48 (71.6%) | 19 (28.4%) |
Occupancy by Age of Householder in Hayes County
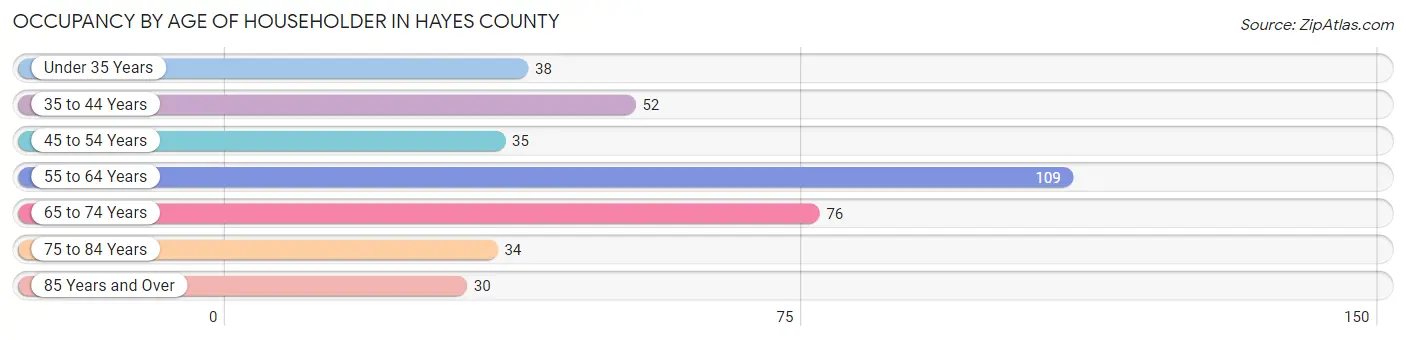
| Age Bracket | # Households | % Households |
| Under 35 Years | 38 | 10.2% |
| 35 to 44 Years | 52 | 13.9% |
| 45 to 54 Years | 35 | 9.4% |
| 55 to 64 Years | 109 | 29.1% |
| 65 to 74 Years | 76 | 20.3% |
| 75 to 84 Years | 34 | 9.1% |
| 85 Years and Over | 30 | 8.0% |
| Total | 374 | 100.0% |
Housing Finances in Hayes County
Median Income by Occupancy in Hayes County
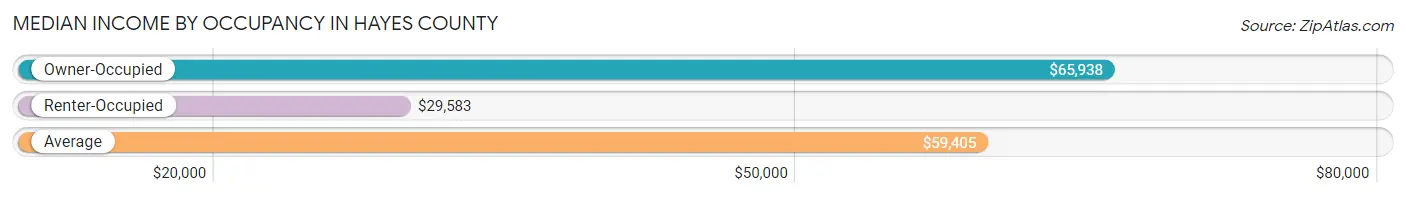
| Occupancy Type | # Households | Median Income |
| Owner-Occupied | 266 (71.1%) | $65,938 |
| Renter-Occupied | 108 (28.9%) | $29,583 |
| Average | 374 (100.0%) | $59,405 |
Occupancy by Householder Income Bracket in Hayes County
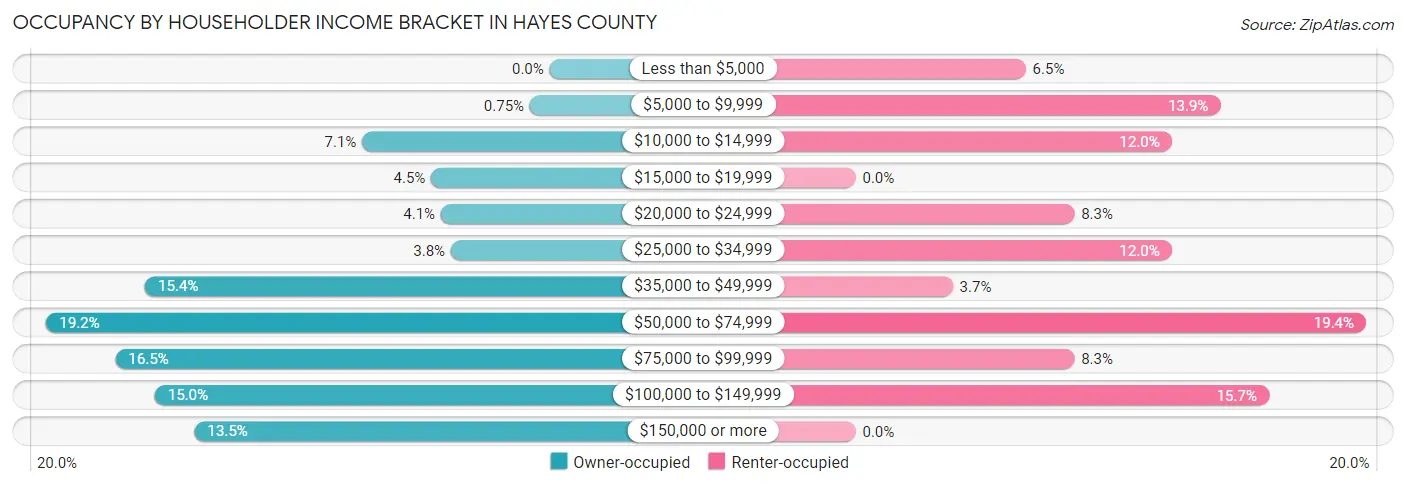
| Income Bracket | Owner-occupied | Renter-occupied |
| Less than $5,000 | 0 (0.0%) | 7 (6.5%) |
| $5,000 to $9,999 | 2 (0.7%) | 15 (13.9%) |
| $10,000 to $14,999 | 19 (7.1%) | 13 (12.0%) |
| $15,000 to $19,999 | 12 (4.5%) | 0 (0.0%) |
| $20,000 to $24,999 | 11 (4.1%) | 9 (8.3%) |
| $25,000 to $34,999 | 10 (3.8%) | 13 (12.0%) |
| $35,000 to $49,999 | 41 (15.4%) | 4 (3.7%) |
| $50,000 to $74,999 | 51 (19.2%) | 21 (19.4%) |
| $75,000 to $99,999 | 44 (16.5%) | 9 (8.3%) |
| $100,000 to $149,999 | 40 (15.0%) | 17 (15.7%) |
| $150,000 or more | 36 (13.5%) | 0 (0.0%) |
| Total | 266 (100.0%) | 108 (100.0%) |
Monthly Housing Cost Tiers in Hayes County
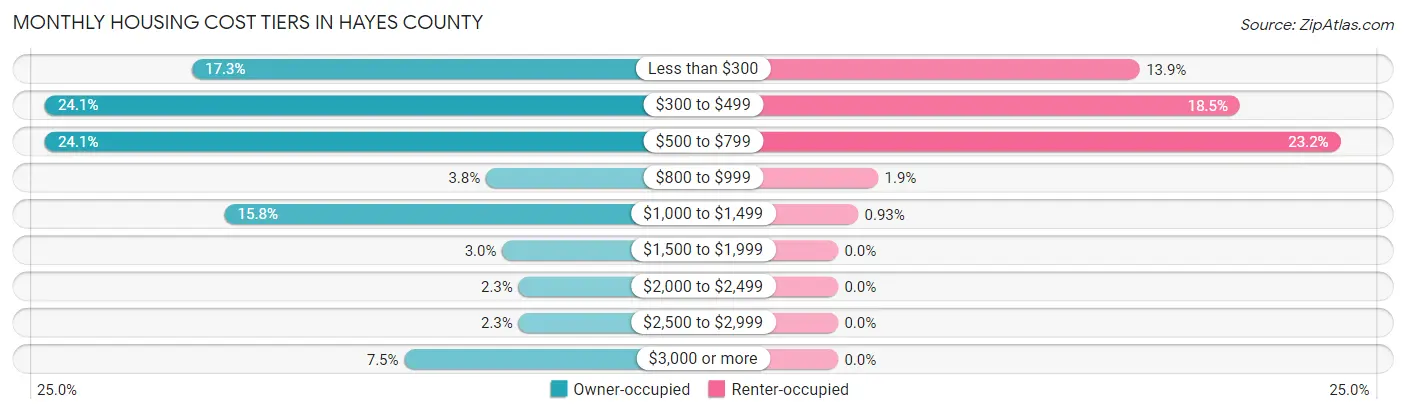
| Monthly Cost | Owner-occupied | Renter-occupied |
| Less than $300 | 46 (17.3%) | 15 (13.9%) |
| $300 to $499 | 64 (24.1%) | 20 (18.5%) |
| $500 to $799 | 64 (24.1%) | 25 (23.2%) |
| $800 to $999 | 10 (3.8%) | 2 (1.8%) |
| $1,000 to $1,499 | 42 (15.8%) | 1 (0.9%) |
| $1,500 to $1,999 | 8 (3.0%) | 0 (0.0%) |
| $2,000 to $2,499 | 6 (2.3%) | 0 (0.0%) |
| $2,500 to $2,999 | 6 (2.3%) | 0 (0.0%) |
| $3,000 or more | 20 (7.5%) | 0 (0.0%) |
| Total | 266 (100.0%) | 108 (100.0%) |
Physical Housing Characteristics in Hayes County
Housing Structures in Hayes County
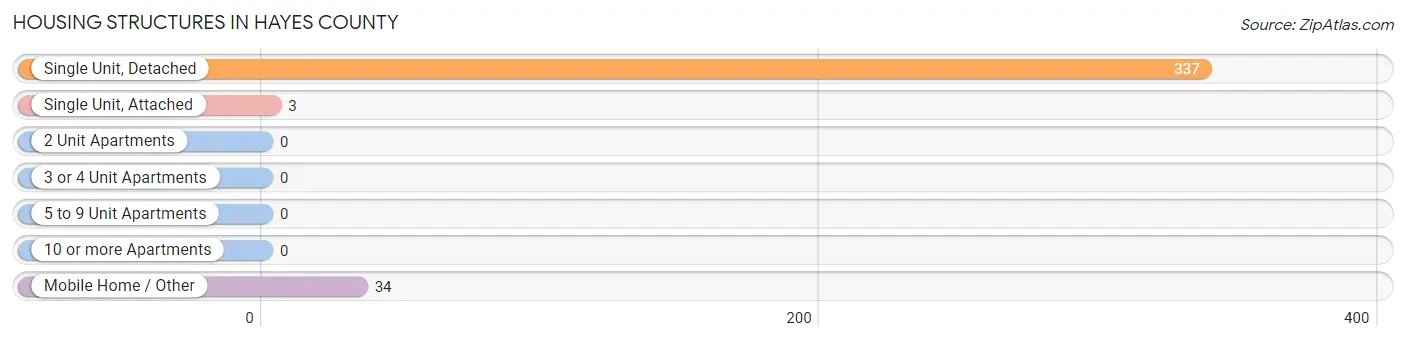
| Structure Type | # Housing Units | % Housing Units |
| Single Unit, Detached | 337 | 90.1% |
| Single Unit, Attached | 3 | 0.8% |
| 2 Unit Apartments | 0 | 0.0% |
| 3 or 4 Unit Apartments | 0 | 0.0% |
| 5 to 9 Unit Apartments | 0 | 0.0% |
| 10 or more Apartments | 0 | 0.0% |
| Mobile Home / Other | 34 | 9.1% |
| Total | 374 | 100.0% |
Housing Structures by Occupancy in Hayes County
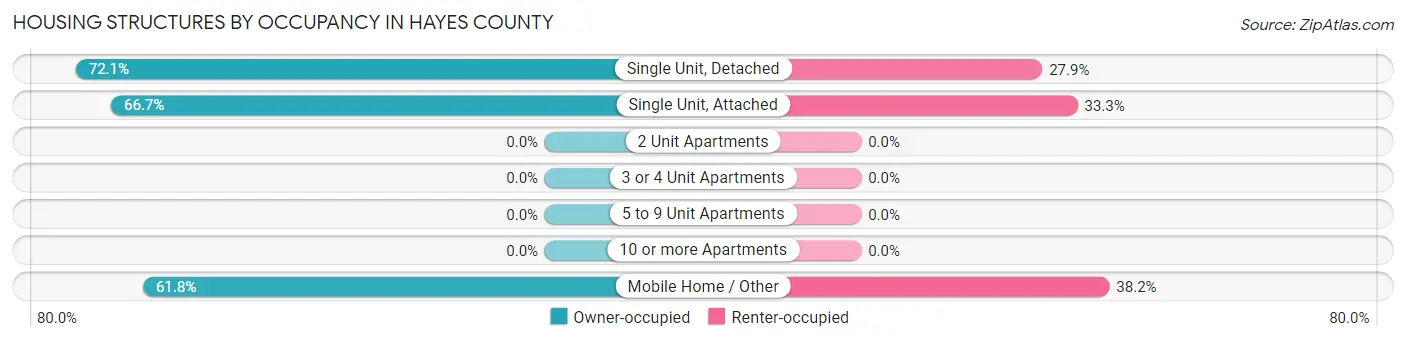
| Structure Type | Owner-occupied | Renter-occupied |
| Single Unit, Detached | 243 (72.1%) | 94 (27.9%) |
| Single Unit, Attached | 2 (66.7%) | 1 (33.3%) |
| 2 Unit Apartments | 0 (0.0%) | 0 (0.0%) |
| 3 or 4 Unit Apartments | 0 (0.0%) | 0 (0.0%) |
| 5 to 9 Unit Apartments | 0 (0.0%) | 0 (0.0%) |
| 10 or more Apartments | 0 (0.0%) | 0 (0.0%) |
| Mobile Home / Other | 21 (61.8%) | 13 (38.2%) |
| Total | 266 (71.1%) | 108 (28.9%) |
Housing Structures by Number of Rooms in Hayes County
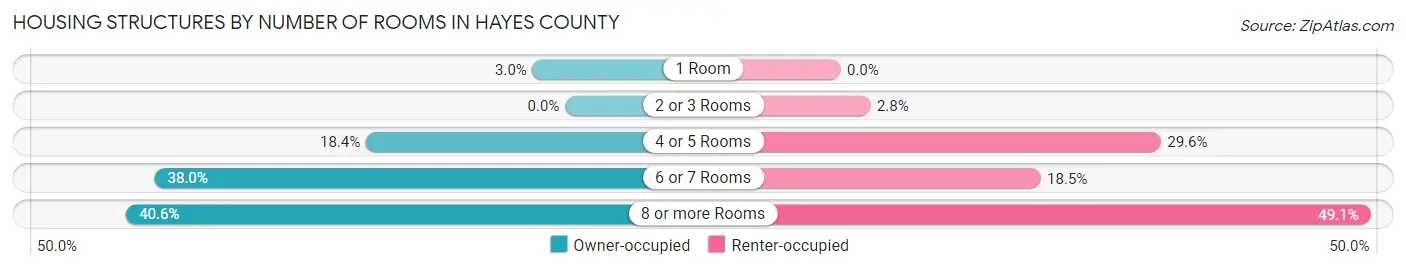
| Number of Rooms | Owner-occupied | Renter-occupied |
| 1 Room | 8 (3.0%) | 0 (0.0%) |
| 2 or 3 Rooms | 0 (0.0%) | 3 (2.8%) |
| 4 or 5 Rooms | 49 (18.4%) | 32 (29.6%) |
| 6 or 7 Rooms | 101 (38.0%) | 20 (18.5%) |
| 8 or more Rooms | 108 (40.6%) | 53 (49.1%) |
| Total | 266 (100.0%) | 108 (100.0%) |
Housing Structure by Heating Type in Hayes County
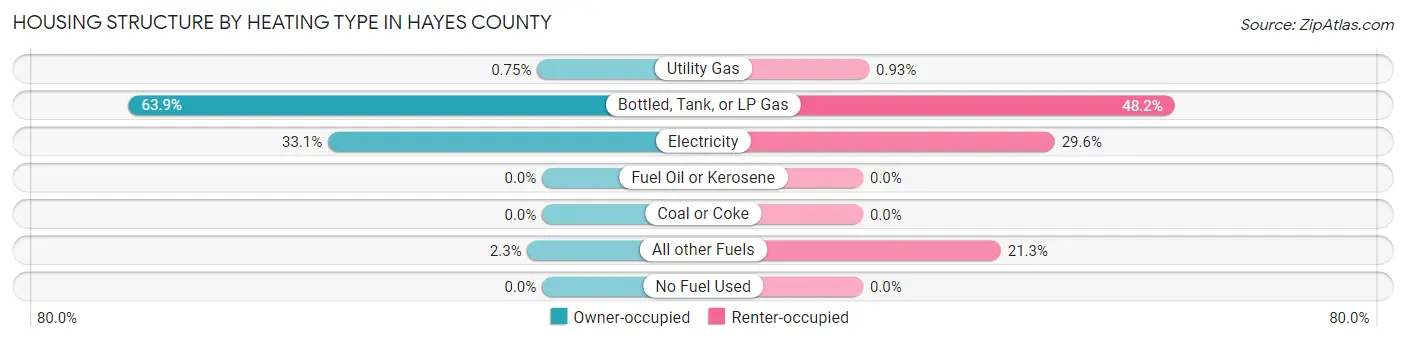
| Heating Type | Owner-occupied | Renter-occupied |
| Utility Gas | 2 (0.7%) | 1 (0.9%) |
| Bottled, Tank, or LP Gas | 170 (63.9%) | 52 (48.1%) |
| Electricity | 88 (33.1%) | 32 (29.6%) |
| Fuel Oil or Kerosene | 0 (0.0%) | 0 (0.0%) |
| Coal or Coke | 0 (0.0%) | 0 (0.0%) |
| All other Fuels | 6 (2.3%) | 23 (21.3%) |
| No Fuel Used | 0 (0.0%) | 0 (0.0%) |
| Total | 266 (100.0%) | 108 (100.0%) |
Household Vehicle Usage in Hayes County
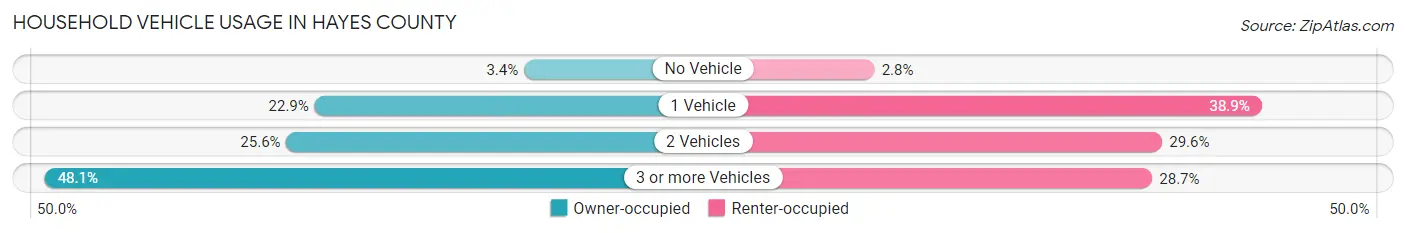
| Vehicles per Household | Owner-occupied | Renter-occupied |
| No Vehicle | 9 (3.4%) | 3 (2.8%) |
| 1 Vehicle | 61 (22.9%) | 42 (38.9%) |
| 2 Vehicles | 68 (25.6%) | 32 (29.6%) |
| 3 or more Vehicles | 128 (48.1%) | 31 (28.7%) |
| Total | 266 (100.0%) | 108 (100.0%) |
Real Estate & Mortgages in Hayes County
Real Estate and Mortgage Overview in Hayes County
| Characteristic | Without Mortgage | With Mortgage |
| Housing Units | 182 | 84 |
| Median Property Value | $82,500 | $162,500 |
| Median Household Income | $58,611 | $15 |
| Monthly Housing Costs | $464 | $20 |
| Real Estate Taxes | $1,035 | $1 |
Property Value by Mortgage Status in Hayes County
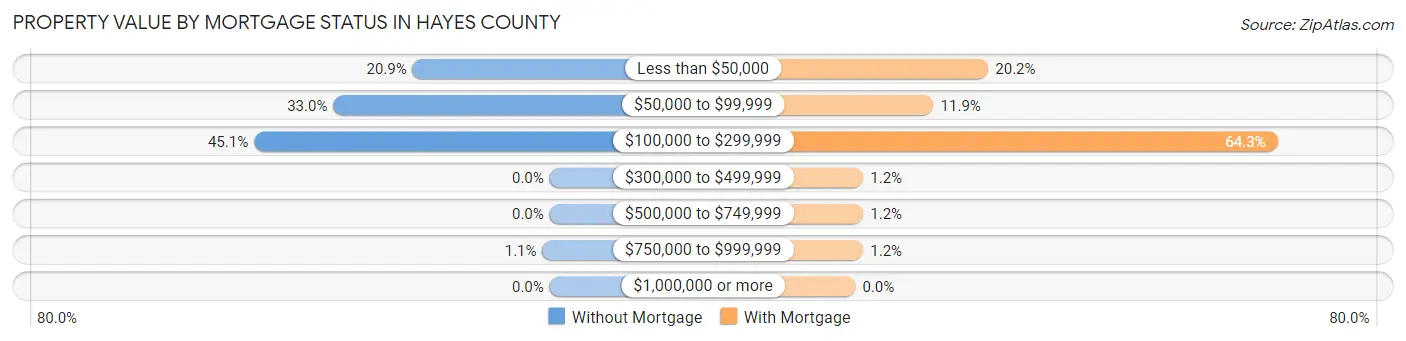
| Property Value | Without Mortgage | With Mortgage |
| Less than $50,000 | 38 (20.9%) | 17 (20.2%) |
| $50,000 to $99,999 | 60 (33.0%) | 10 (11.9%) |
| $100,000 to $299,999 | 82 (45.1%) | 54 (64.3%) |
| $300,000 to $499,999 | 0 (0.0%) | 1 (1.2%) |
| $500,000 to $749,999 | 0 (0.0%) | 1 (1.2%) |
| $750,000 to $999,999 | 2 (1.1%) | 1 (1.2%) |
| $1,000,000 or more | 0 (0.0%) | 0 (0.0%) |
| Total | 182 (100.0%) | 84 (100.0%) |
Household Income by Mortgage Status in Hayes County
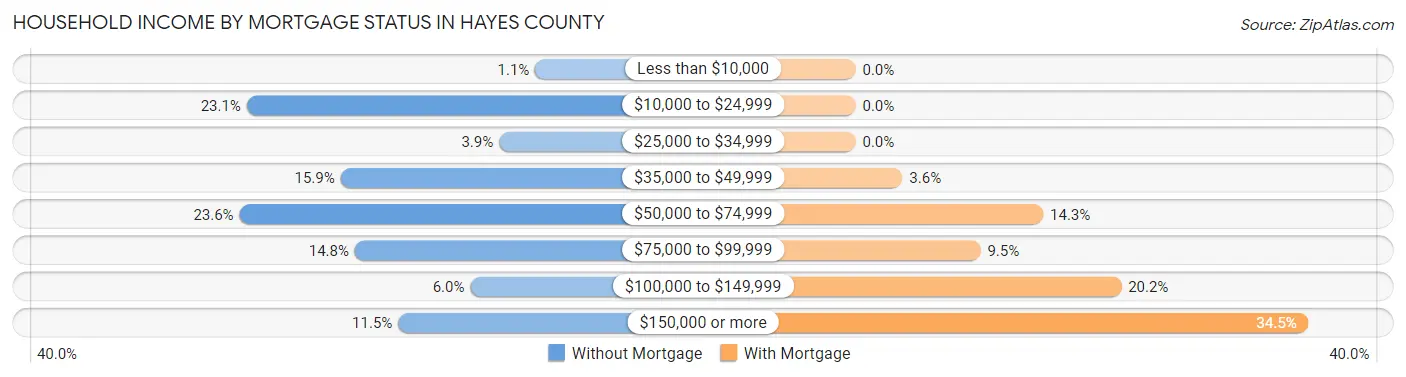
| Household Income | Without Mortgage | With Mortgage |
| Less than $10,000 | 2 (1.1%) | 0 (0.0%) |
| $10,000 to $24,999 | 42 (23.1%) | 0 (0.0%) |
| $25,000 to $34,999 | 7 (3.8%) | 0 (0.0%) |
| $35,000 to $49,999 | 29 (15.9%) | 3 (3.6%) |
| $50,000 to $74,999 | 43 (23.6%) | 12 (14.3%) |
| $75,000 to $99,999 | 27 (14.8%) | 8 (9.5%) |
| $100,000 to $149,999 | 11 (6.0%) | 17 (20.2%) |
| $150,000 or more | 21 (11.5%) | 29 (34.5%) |
| Total | 182 (100.0%) | 84 (100.0%) |
Property Value to Household Income Ratio in Hayes County
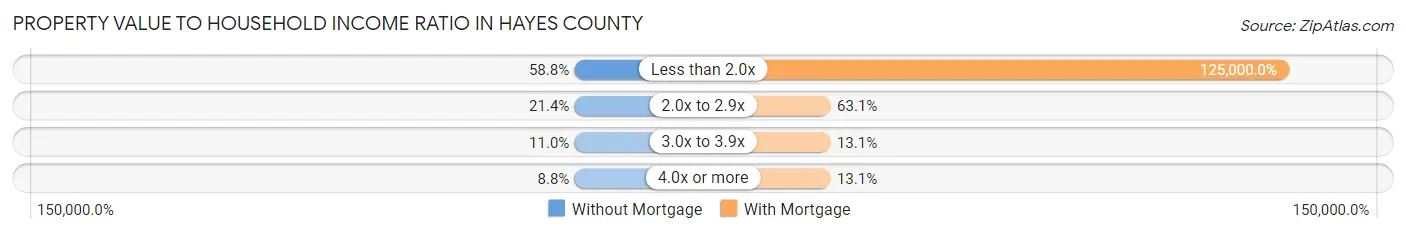
| Value-to-Income Ratio | Without Mortgage | With Mortgage |
| Less than 2.0x | 107 (58.8%) | 105,000 (125,000.0%) |
| 2.0x to 2.9x | 39 (21.4%) | 53 (63.1%) |
| 3.0x to 3.9x | 20 (11.0%) | 11 (13.1%) |
| 4.0x or more | 16 (8.8%) | 11 (13.1%) |
| Total | 182 (100.0%) | 84 (100.0%) |
Real Estate Taxes by Mortgage Status in Hayes County
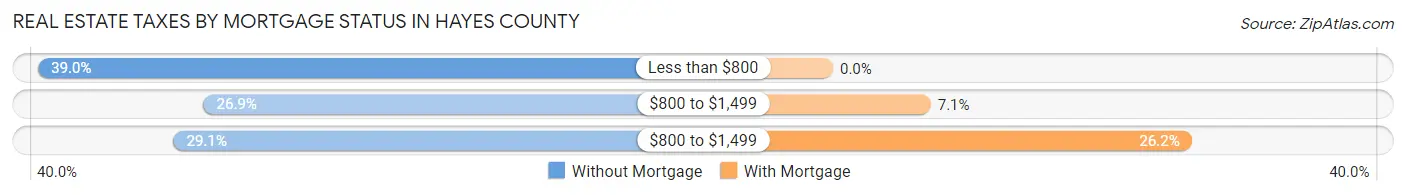
| Property Taxes | Without Mortgage | With Mortgage |
| Less than $800 | 71 (39.0%) | 0 (0.0%) |
| $800 to $1,499 | 49 (26.9%) | 6 (7.1%) |
| $800 to $1,499 | 53 (29.1%) | 22 (26.2%) |
| Total | 182 (100.0%) | 84 (100.0%) |
Health & Disability in Hayes County
Health Insurance Coverage by Age in Hayes County
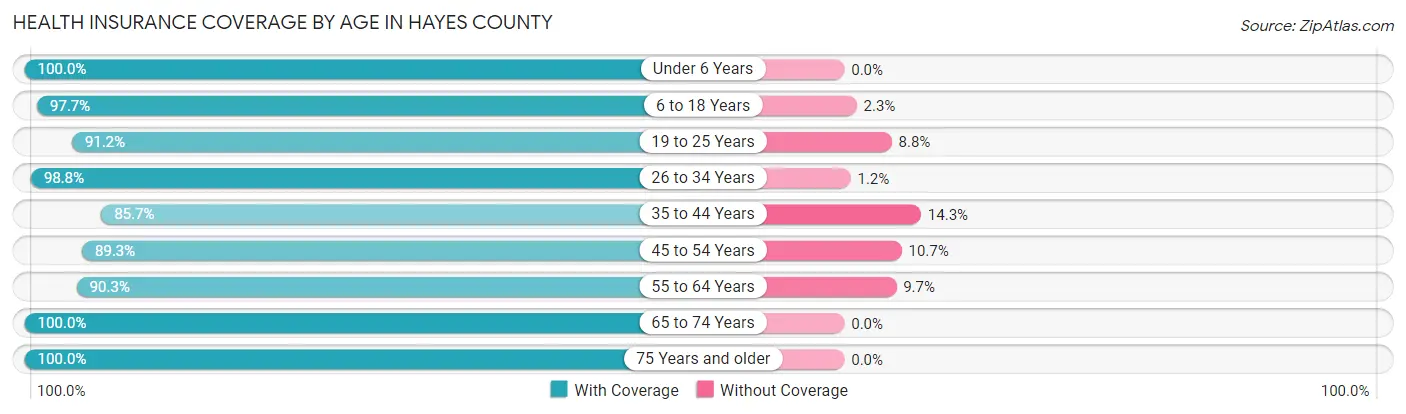
| Age Bracket | With Coverage | Without Coverage |
| Under 6 Years | 76 (100.0%) | 0 (0.0%) |
| 6 to 18 Years | 128 (97.7%) | 3 (2.3%) |
| 19 to 25 Years | 31 (91.2%) | 3 (8.8%) |
| 26 to 34 Years | 85 (98.8%) | 1 (1.2%) |
| 35 to 44 Years | 72 (85.7%) | 12 (14.3%) |
| 45 to 54 Years | 92 (89.3%) | 11 (10.7%) |
| 55 to 64 Years | 168 (90.3%) | 18 (9.7%) |
| 65 to 74 Years | 118 (100.0%) | 0 (0.0%) |
| 75 Years and older | 101 (100.0%) | 0 (0.0%) |
| Total | 871 (94.8%) | 48 (5.2%) |
Health Insurance Coverage by Citizenship Status in Hayes County
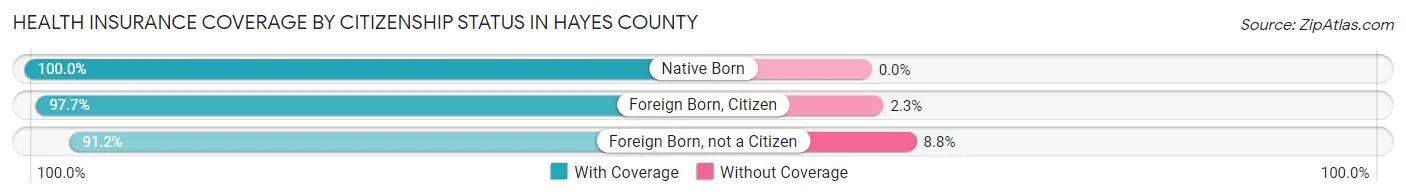
| Citizenship Status | With Coverage | Without Coverage |
| Native Born | 76 (100.0%) | 0 (0.0%) |
| Foreign Born, Citizen | 128 (97.7%) | 3 (2.3%) |
| Foreign Born, not a Citizen | 31 (91.2%) | 3 (8.8%) |
Health Insurance Coverage by Household Income in Hayes County
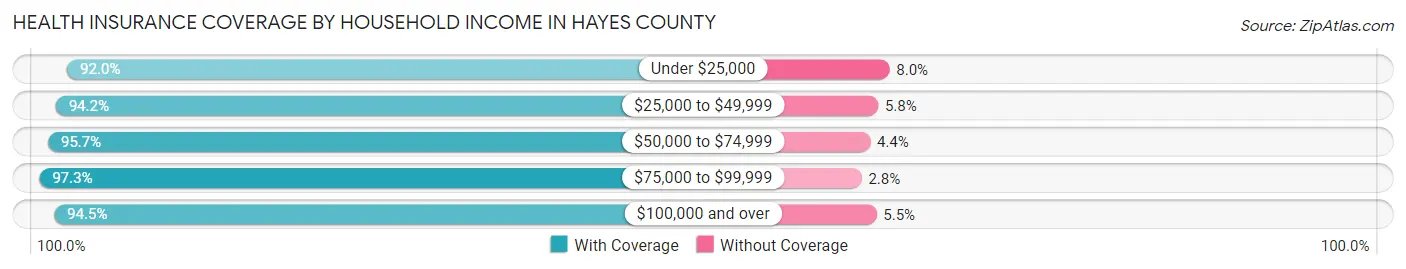
| Household Income | With Coverage | Without Coverage |
| Under $25,000 | 127 (92.0%) | 11 (8.0%) |
| $25,000 to $49,999 | 145 (94.2%) | 9 (5.8%) |
| $50,000 to $74,999 | 132 (95.7%) | 6 (4.3%) |
| $75,000 to $99,999 | 177 (97.3%) | 5 (2.8%) |
| $100,000 and over | 290 (94.5%) | 17 (5.5%) |
Public vs Private Health Insurance Coverage by Age in Hayes County
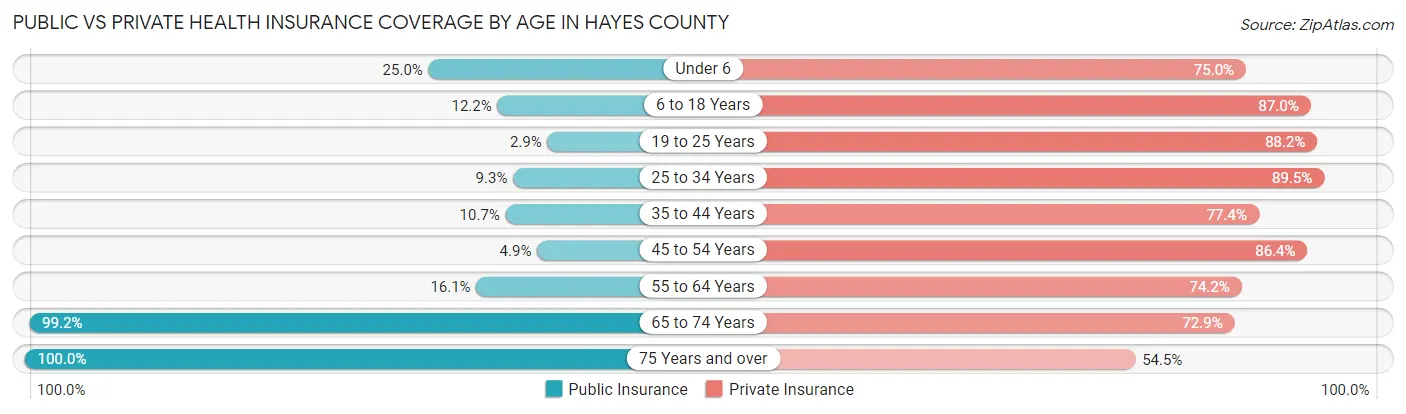
| Age Bracket | Public Insurance | Private Insurance |
| Under 6 | 19 (25.0%) | 57 (75.0%) |
| 6 to 18 Years | 16 (12.2%) | 114 (87.0%) |
| 19 to 25 Years | 1 (2.9%) | 30 (88.2%) |
| 25 to 34 Years | 8 (9.3%) | 77 (89.5%) |
| 35 to 44 Years | 9 (10.7%) | 65 (77.4%) |
| 45 to 54 Years | 5 (4.9%) | 89 (86.4%) |
| 55 to 64 Years | 30 (16.1%) | 138 (74.2%) |
| 65 to 74 Years | 117 (99.2%) | 86 (72.9%) |
| 75 Years and over | 101 (100.0%) | 55 (54.5%) |
| Total | 306 (33.3%) | 711 (77.4%) |
Disability Status by Sex by Age in Hayes County
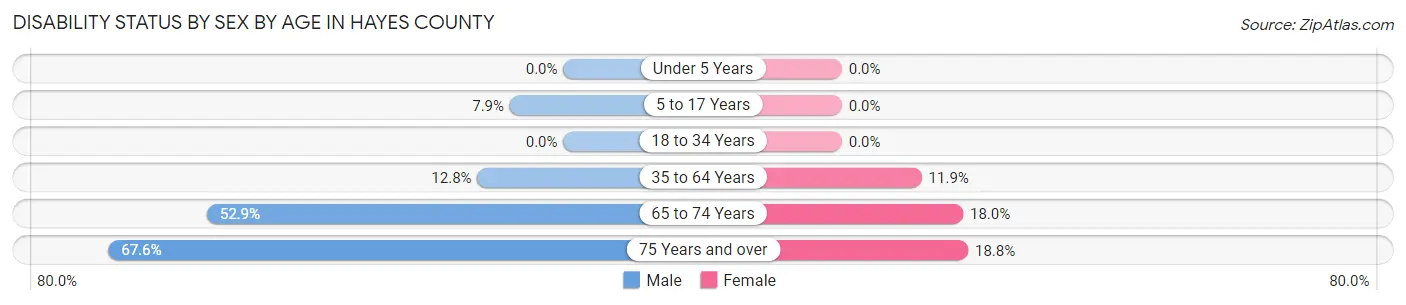
| Age Bracket | Male | Female |
| Under 5 Years | 0 (0.0%) | 0 (0.0%) |
| 5 to 17 Years | 5 (7.9%) | 0 (0.0%) |
| 18 to 34 Years | 0 (0.0%) | 0 (0.0%) |
| 35 to 64 Years | 25 (12.8%) | 21 (11.9%) |
| 65 to 74 Years | 36 (52.9%) | 9 (18.0%) |
| 75 Years and over | 25 (67.6%) | 12 (18.8%) |
Disability Class by Sex by Age in Hayes County
Disability Class: Hearing Difficulty
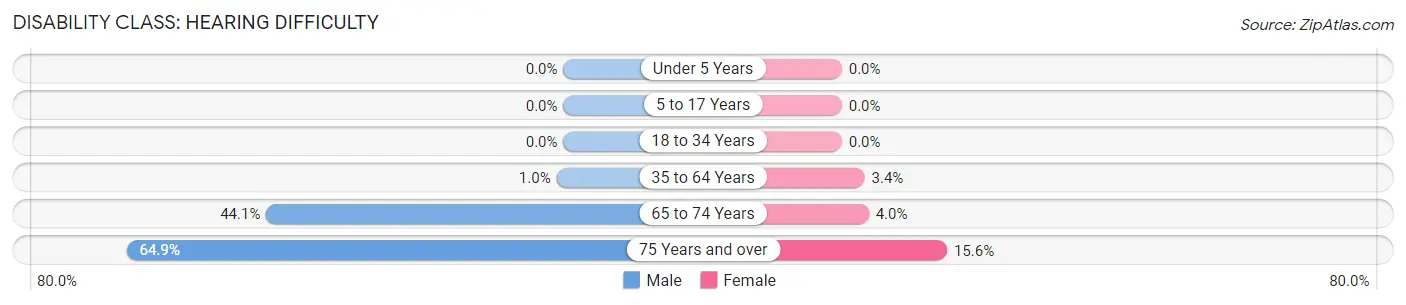
| Age Bracket | Male | Female |
| Under 5 Years | 0 (0.0%) | 0 (0.0%) |
| 5 to 17 Years | 0 (0.0%) | 0 (0.0%) |
| 18 to 34 Years | 0 (0.0%) | 0 (0.0%) |
| 35 to 64 Years | 2 (1.0%) | 6 (3.4%) |
| 65 to 74 Years | 30 (44.1%) | 2 (4.0%) |
| 75 Years and over | 24 (64.9%) | 10 (15.6%) |
Disability Class: Vision Difficulty
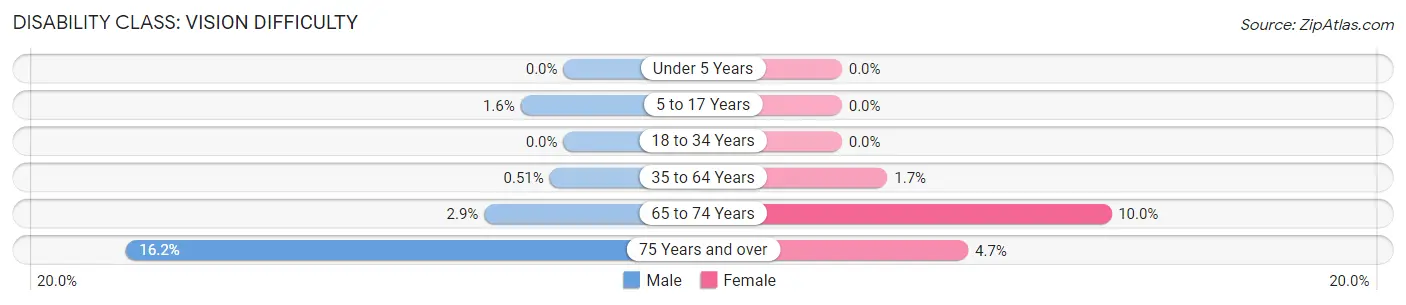
| Age Bracket | Male | Female |
| Under 5 Years | 0 (0.0%) | 0 (0.0%) |
| 5 to 17 Years | 1 (1.6%) | 0 (0.0%) |
| 18 to 34 Years | 0 (0.0%) | 0 (0.0%) |
| 35 to 64 Years | 1 (0.5%) | 3 (1.7%) |
| 65 to 74 Years | 2 (2.9%) | 5 (10.0%) |
| 75 Years and over | 6 (16.2%) | 3 (4.7%) |
Disability Class: Cognitive Difficulty
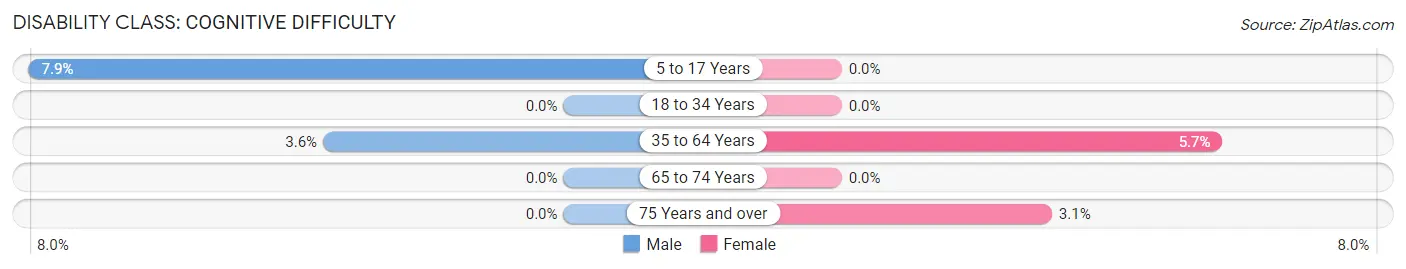
| Age Bracket | Male | Female |
| 5 to 17 Years | 5 (7.9%) | 0 (0.0%) |
| 18 to 34 Years | 0 (0.0%) | 0 (0.0%) |
| 35 to 64 Years | 7 (3.6%) | 10 (5.7%) |
| 65 to 74 Years | 0 (0.0%) | 0 (0.0%) |
| 75 Years and over | 0 (0.0%) | 2 (3.1%) |
Disability Class: Ambulatory Difficulty
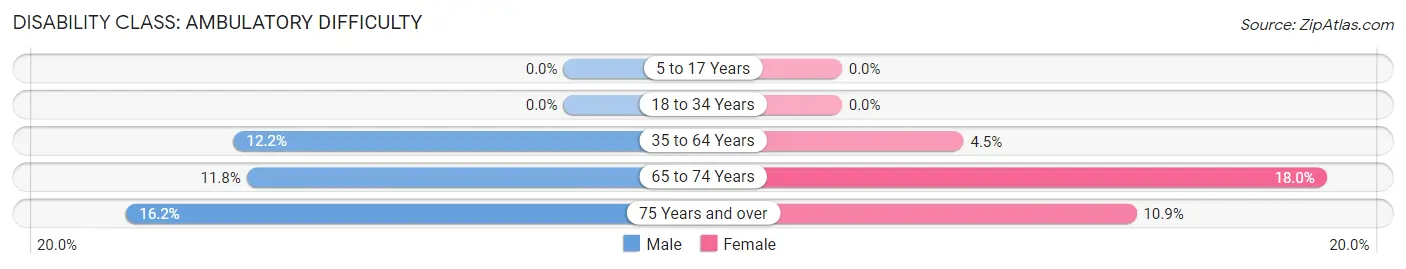
| Age Bracket | Male | Female |
| 5 to 17 Years | 0 (0.0%) | 0 (0.0%) |
| 18 to 34 Years | 0 (0.0%) | 0 (0.0%) |
| 35 to 64 Years | 24 (12.2%) | 8 (4.5%) |
| 65 to 74 Years | 8 (11.8%) | 9 (18.0%) |
| 75 Years and over | 6 (16.2%) | 7 (10.9%) |
Disability Class: Self-Care Difficulty
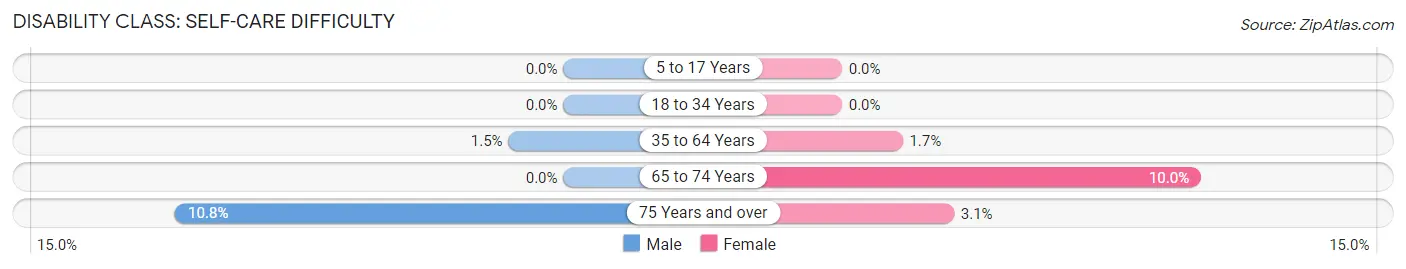
| Age Bracket | Male | Female |
| 5 to 17 Years | 0 (0.0%) | 0 (0.0%) |
| 18 to 34 Years | 0 (0.0%) | 0 (0.0%) |
| 35 to 64 Years | 3 (1.5%) | 3 (1.7%) |
| 65 to 74 Years | 0 (0.0%) | 5 (10.0%) |
| 75 Years and over | 4 (10.8%) | 2 (3.1%) |
Technology Access in Hayes County
Computing Device Access in Hayes County
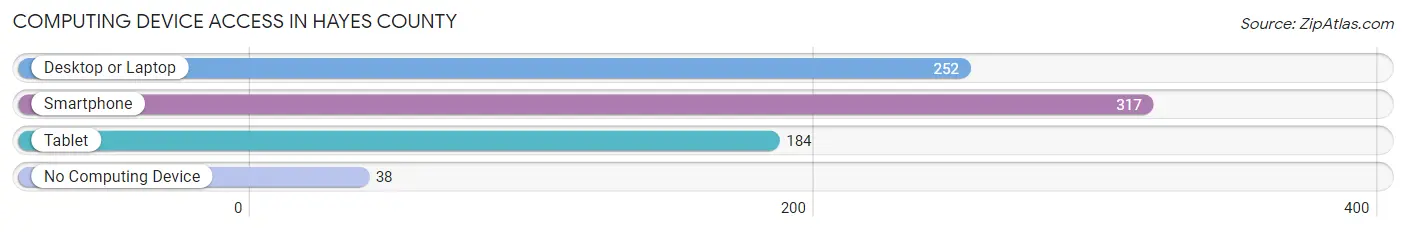
| Device Type | # Households | % Households |
| Desktop or Laptop | 252 | 67.4% |
| Smartphone | 317 | 84.8% |
| Tablet | 184 | 49.2% |
| No Computing Device | 38 | 10.2% |
| Total | 374 | 100.0% |
Internet Access in Hayes County
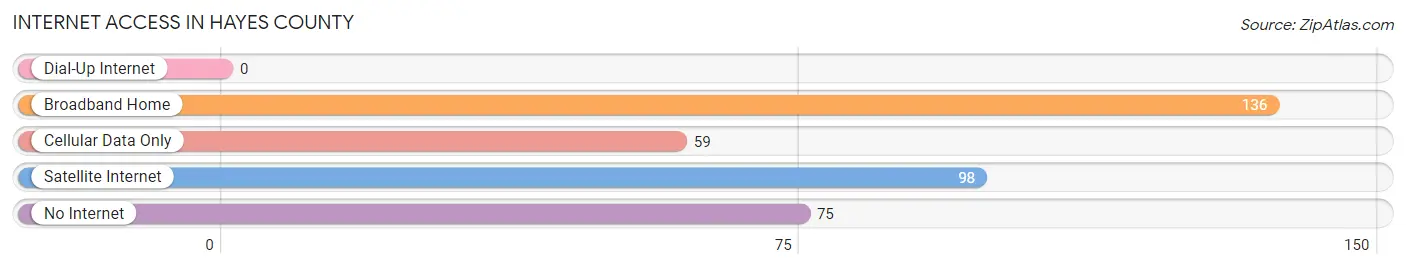
| Internet Type | # Households | % Households |
| Dial-Up Internet | 0 | 0.0% |
| Broadband Home | 136 | 36.4% |
| Cellular Data Only | 59 | 15.8% |
| Satellite Internet | 98 | 26.2% |
| No Internet | 75 | 20.1% |
| Total | 374 | 100.0% |
Hayes County Summary
Hayes County is located in the central part of Nebraska, in the Great Plains region of the United States. It is bordered by Frontier County to the north, Lincoln County to the east, Gosper County to the south, and Hitchcock County to the west. The county seat is Hayes Center, and the county has a total area of 576 square miles.
History
Hayes County was established in 1877 and named after Rutherford B. Hayes, the 19th President of the United States. The county was originally part of Lincoln County, but was split off in 1877. The first settlers in the area were homesteaders who arrived in the late 1870s. The county was largely agricultural, with the main crops being wheat, corn, and hay.
Geography
Hayes County is located in the Great Plains region of the United States. The county is mostly flat, with some rolling hills in the western part of the county. The county is drained by the Republican River, which flows through the county from north to south. The county is also home to several small lakes, including Hayes Lake, which is located in the northern part of the county.
The climate of Hayes County is semi-arid, with hot summers and cold winters. The average annual temperature is around 50 degrees Fahrenheit, and the average annual precipitation is around 20 inches.
Economy
The economy of Hayes County is largely based on agriculture. The main crops grown in the county are wheat, corn, and hay. The county also has a large cattle industry, with many ranches located in the area.
In addition to agriculture, Hayes County also has a growing tourism industry. The county is home to several state parks, including Lake McConaughy State Recreation Area and Fort Robinson State Park. The county also has several museums, including the Hayes County Historical Museum and the Hayes County Courthouse Museum.
Demographics
As of the 2010 census, the population of Hayes County was 2,845. The population is largely white (94.3%), with small percentages of African American (1.2%), Native American (1.1%), Asian (0.3%), and Hispanic or Latino (2.1%) residents. The median household income in the county is $45,938, and the median home value is $90,400.
The largest city in Hayes County is Hayes Center, which has a population of 545. Other cities in the county include Venango, Wauneta, and Palisade.
Conclusion
Hayes County is a rural county located in the Great Plains region of Nebraska. The county is largely agricultural, with the main crops being wheat, corn, and hay. The county also has a growing tourism industry, with several state parks and museums located in the area. The population of Hayes County is largely white, with small percentages of African American, Native American, Asian, and Hispanic or Latino residents. The median household income in the county is $45,938, and the median home value is $90,400.
Common Questions
What is Per Capita Income in Hayes County?
Per Capita income in Hayes County is $35,135.
What is the Median Family Income in Hayes County?
Median Family Income in Hayes County is $78,309.
What is the Median Household income in Hayes County?
Median Household Income in Hayes County is $59,405.
What is Income or Wage Gap in Hayes County?
Income or Wage Gap in Hayes County is 51.1%.
Women in Hayes County earn 48.9 cents for every dollar earned by a man.
What is Inequality or Gini Index in Hayes County?
Inequality or Gini Index in Hayes County is 0.46.
What is the Total Population of Hayes County?
Total Population of Hayes County is 919.
What is the Total Male Population of Hayes County?
Total Male Population of Hayes County is 457.
What is the Total Female Population of Hayes County?
Total Female Population of Hayes County is 462.
What is the Ratio of Males per 100 Females in Hayes County?
There are 98.92 Males per 100 Females in Hayes County.
What is the Ratio of Females per 100 Males in Hayes County?
There are 101.09 Females per 100 Males in Hayes County.
What is the Median Population Age in Hayes County?
Median Population Age in Hayes County is 48.9 Years.
What is the Average Family Size in Hayes County
Average Family Size in Hayes County is 3.1 People.
What is the Average Household Size in Hayes County
Average Household Size in Hayes County is 2.5 People.
How Large is the Labor Force in Hayes County?
There are 429 People in the Labor Forcein in Hayes County.
What is the Percentage of People in the Labor Force in Hayes County?
58.6% of People are in the Labor Force in Hayes County.
What is the Unemployment Rate in Hayes County?
Unemployment Rate in Hayes County is 0.2%.