Harlan County, NE Map & Demographics
Harlan County Map
Harlan County Overview
$38,129
PER CAPITA INCOME
$89,653
AVG FAMILY INCOME
$64,583
AVG HOUSEHOLD INCOME
34.2%
WAGE / INCOME GAP [ % ]
65.8¢/ $1
WAGE / INCOME GAP [ $ ]
0.48
INEQUALITY / GINI INDEX
3,094
TOTAL POPULATION
1,590
MALE POPULATION
1,504
FEMALE POPULATION
105.72
MALES / 100 FEMALES
94.59
FEMALES / 100 MALES
47.5
MEDIAN AGE
3.3
AVG FAMILY SIZE
2.5
AVG HOUSEHOLD SIZE
1,518
LABOR FORCE [ PEOPLE ]
62.1%
PERCENT IN LABOR FORCE
2.0%
UNEMPLOYMENT RATE
Harlan County Area Codes
Income in Harlan County
Income Overview in Harlan County
Per Capita Income in Harlan County is $38,129, while median incomes of families and households are $89,653 and $64,583 respectively.
| Characteristic | Number | Measure |
| Per Capita Income | 3,094 | $38,129 |
| Median Family Income | 761 | $89,653 |
| Mean Family Income | 761 | $120,354 |
| Median Household Income | 1,221 | $64,583 |
| Mean Household Income | 1,221 | $91,064 |
| Income Deficit | 761 | $0 |
| Wage / Income Gap (%) | 3,094 | 34.25% |
| Wage / Income Gap ($) | 3,094 | 65.75¢ per $1 |
| Gini / Inequality Index | 3,094 | 0.48 |
Earnings by Sex in Harlan County
Average Earnings in Harlan County are $41,210, $48,631 for men and $31,976 for women, a difference of 34.3%.
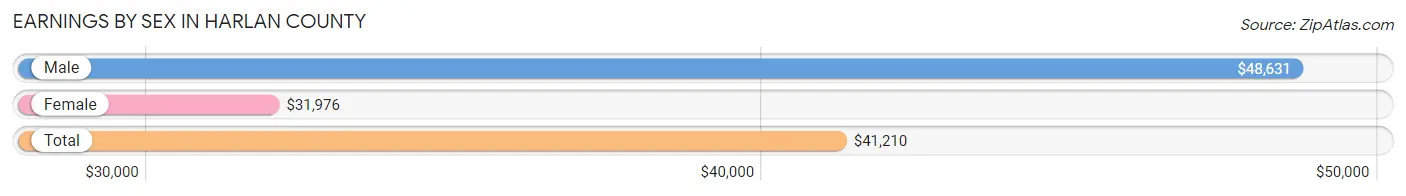
| Sex | Number | Average Earnings |
| Male | 863 (54.5%) | $48,631 |
| Female | 721 (45.5%) | $31,976 |
| Total | 1,584 (100.0%) | $41,210 |
Earnings by Sex by Income Bracket in Harlan County
The most common earnings brackets in Harlan County are $100,000+ for men (149 | 17.3%) and $2,499 or less for women (81 | 11.2%).
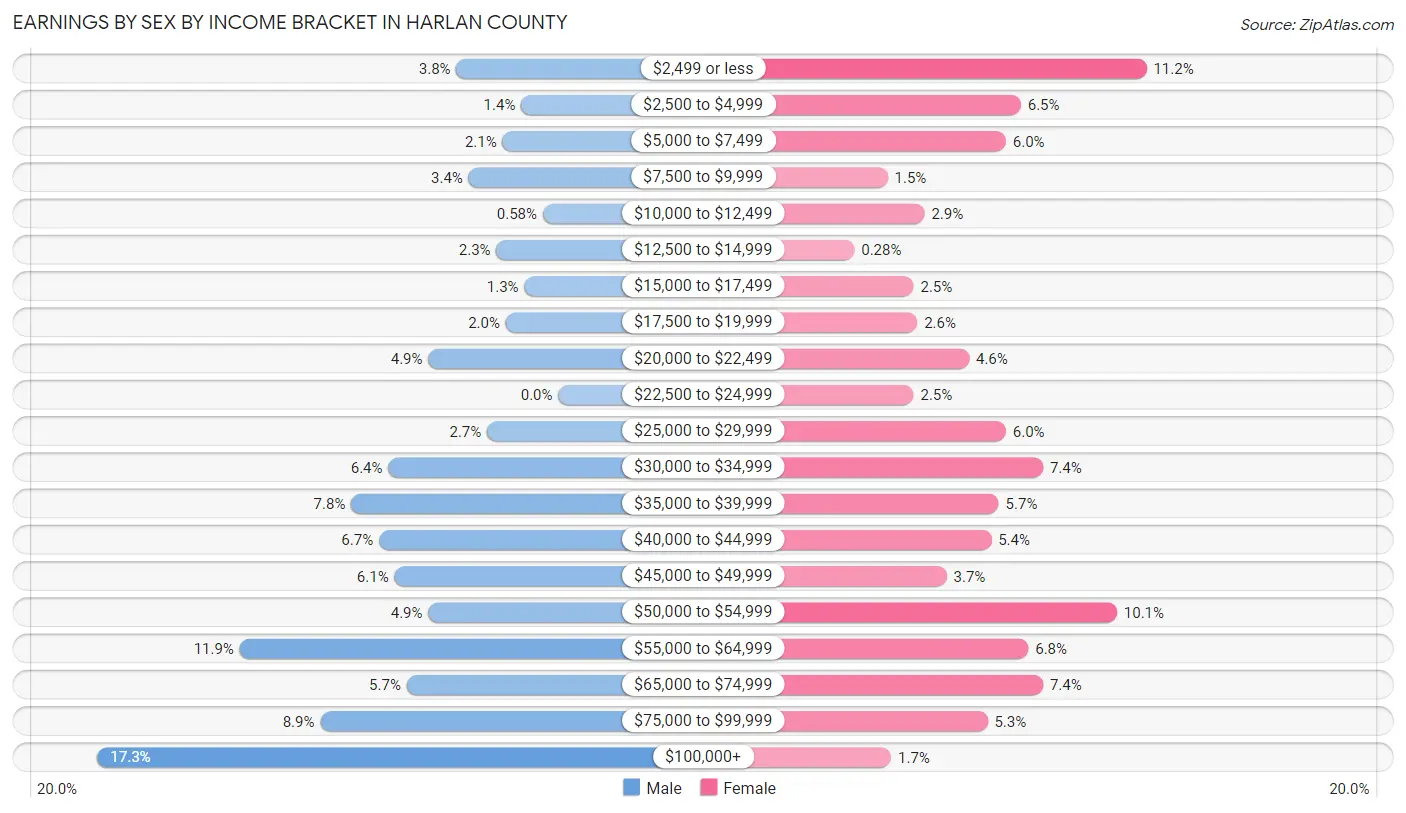
| Income | Male | Female |
| $2,499 or less | 33 (3.8%) | 81 (11.2%) |
| $2,500 to $4,999 | 12 (1.4%) | 47 (6.5%) |
| $5,000 to $7,499 | 18 (2.1%) | 43 (6.0%) |
| $7,500 to $9,999 | 29 (3.4%) | 11 (1.5%) |
| $10,000 to $12,499 | 5 (0.6%) | 21 (2.9%) |
| $12,500 to $14,999 | 20 (2.3%) | 2 (0.3%) |
| $15,000 to $17,499 | 11 (1.3%) | 18 (2.5%) |
| $17,500 to $19,999 | 17 (2.0%) | 19 (2.6%) |
| $20,000 to $22,499 | 42 (4.9%) | 33 (4.6%) |
| $22,500 to $24,999 | 0 (0.0%) | 18 (2.5%) |
| $25,000 to $29,999 | 23 (2.7%) | 43 (6.0%) |
| $30,000 to $34,999 | 55 (6.4%) | 53 (7.3%) |
| $35,000 to $39,999 | 67 (7.8%) | 41 (5.7%) |
| $40,000 to $44,999 | 58 (6.7%) | 39 (5.4%) |
| $45,000 to $49,999 | 53 (6.1%) | 27 (3.7%) |
| $50,000 to $54,999 | 42 (4.9%) | 73 (10.1%) |
| $55,000 to $64,999 | 103 (11.9%) | 49 (6.8%) |
| $65,000 to $74,999 | 49 (5.7%) | 53 (7.3%) |
| $75,000 to $99,999 | 77 (8.9%) | 38 (5.3%) |
| $100,000+ | 149 (17.3%) | 12 (1.7%) |
| Total | 863 (100.0%) | 721 (100.0%) |
Earnings by Sex by Educational Attainment in Harlan County
Average earnings in Harlan County are $53,125 for men and $37,917 for women, a difference of 28.6%. Men with an educational attainment of graduate degree enjoy the highest average annual earnings of $99,000, while those with less than high school education earn the least with $37,143. Women with an educational attainment of graduate degree earn the most with the average annual earnings of $64,375, while those with high school diploma education have the smallest earnings of $26,442.
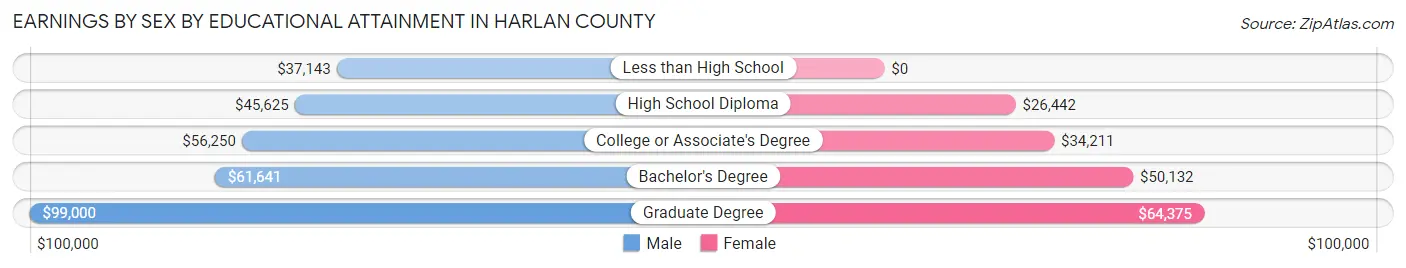
| Educational Attainment | Male Income | Female Income |
| Less than High School | $37,143 | $0 |
| High School Diploma | $45,625 | $26,442 |
| College or Associate's Degree | $56,250 | $34,211 |
| Bachelor's Degree | $61,641 | $50,132 |
| Graduate Degree | $99,000 | $64,375 |
| Total | $53,125 | $37,917 |
Family Income in Harlan County
Family Income Brackets in Harlan County
According to the Harlan County family income data, there are 201 families falling into the $100,000 to $149,999 income range, which is the most common income bracket and makes up 26.4% of all families. Conversely, the $10,000 to $14,999 income bracket is the least frequent group with only 2 families (0.3%) belonging to this category.
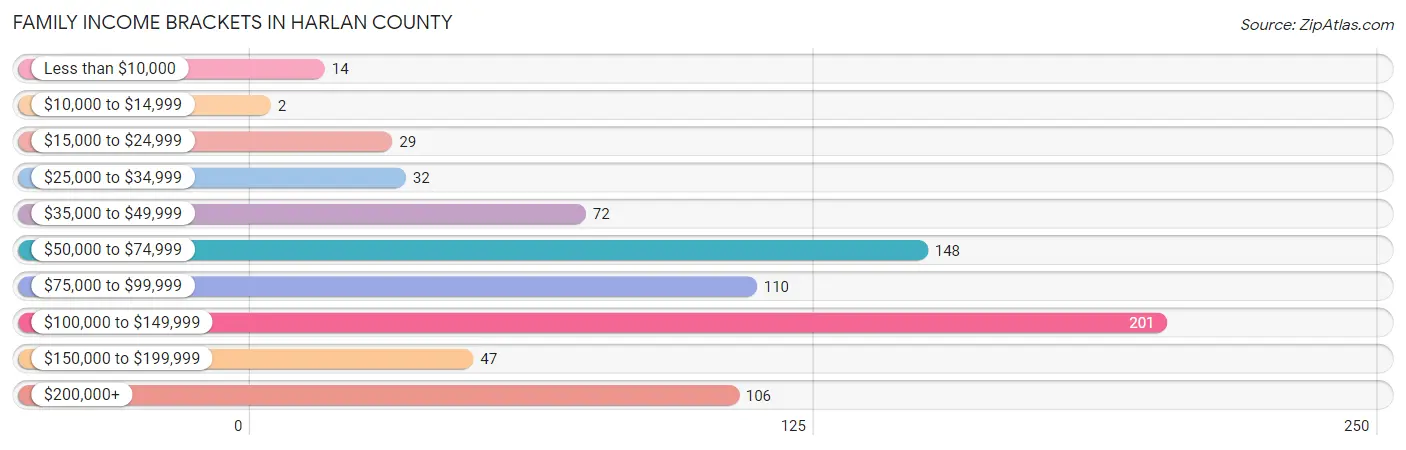
| Income Bracket | # Families | % Families |
| Less than $10,000 | 14 | 1.8% |
| $10,000 to $14,999 | 2 | 0.3% |
| $15,000 to $24,999 | 29 | 3.8% |
| $25,000 to $34,999 | 32 | 4.2% |
| $35,000 to $49,999 | 72 | 9.5% |
| $50,000 to $74,999 | 148 | 19.4% |
| $75,000 to $99,999 | 110 | 14.5% |
| $100,000 to $149,999 | 201 | 26.4% |
| $150,000 to $199,999 | 47 | 6.2% |
| $200,000+ | 106 | 13.9% |
Family Income by Famaliy Size in Harlan County
5-person families (95 | 12.5%) account for the highest median family income in Harlan County with $246,250 per family, while 5-person families (95 | 12.5%) have the highest median income of $49,250 per family member.
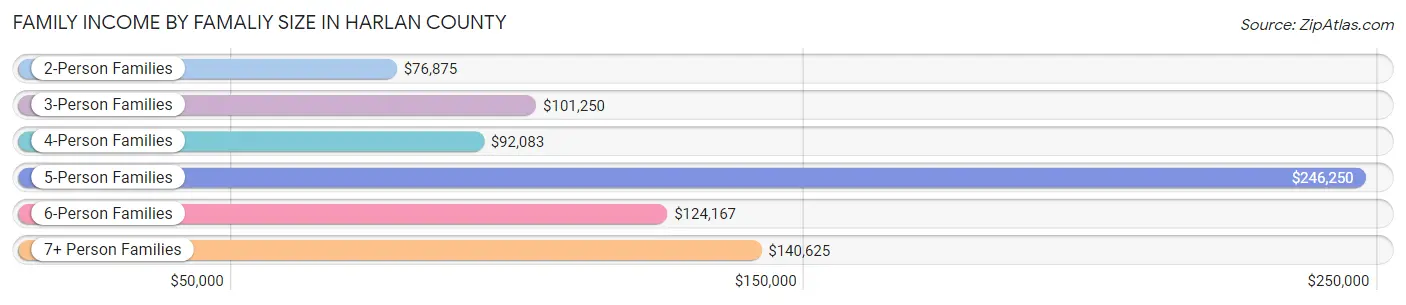
| Income Bracket | # Families | Median Income |
| 2-Person Families | 462 (60.7%) | $76,875 |
| 3-Person Families | 60 (7.9%) | $101,250 |
| 4-Person Families | 101 (13.3%) | $92,083 |
| 5-Person Families | 95 (12.5%) | $246,250 |
| 6-Person Families | 28 (3.7%) | $124,167 |
| 7+ Person Families | 15 (2.0%) | $140,625 |
| Total | 761 (100.0%) | $89,653 |
Family Income by Number of Earners in Harlan County
The median family income in Harlan County is $89,653, with families comprising 3+ earners (52) having the highest median family income of $138,750, while families with no earners (104) have the lowest median family income of $39,643, accounting for 6.8% and 13.7% of families, respectively.
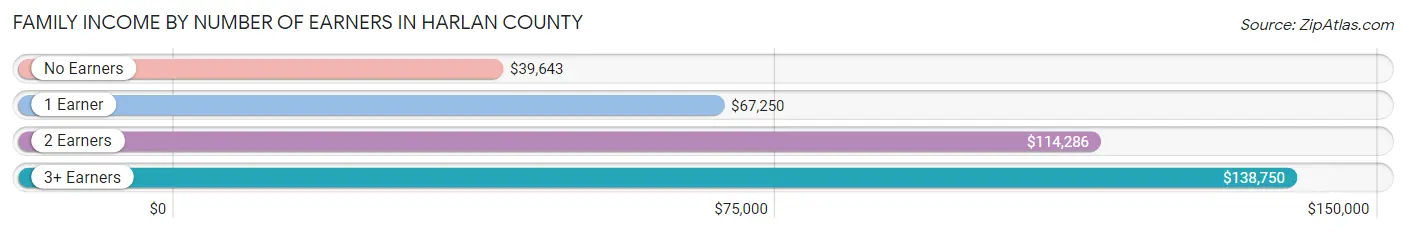
| Number of Earners | # Families | Median Income |
| No Earners | 104 (13.7%) | $39,643 |
| 1 Earner | 203 (26.7%) | $67,250 |
| 2 Earners | 402 (52.8%) | $114,286 |
| 3+ Earners | 52 (6.8%) | $138,750 |
| Total | 761 (100.0%) | $89,653 |
Household Income in Harlan County
Household Income Brackets in Harlan County
With 236 households falling in the category, the $100,000 to $149,999 income range is the most frequent in Harlan County, accounting for 19.3% of all households. In contrast, only 37 households (3.0%) fall into the $10,000 to $14,999 income bracket, making it the least populous group.
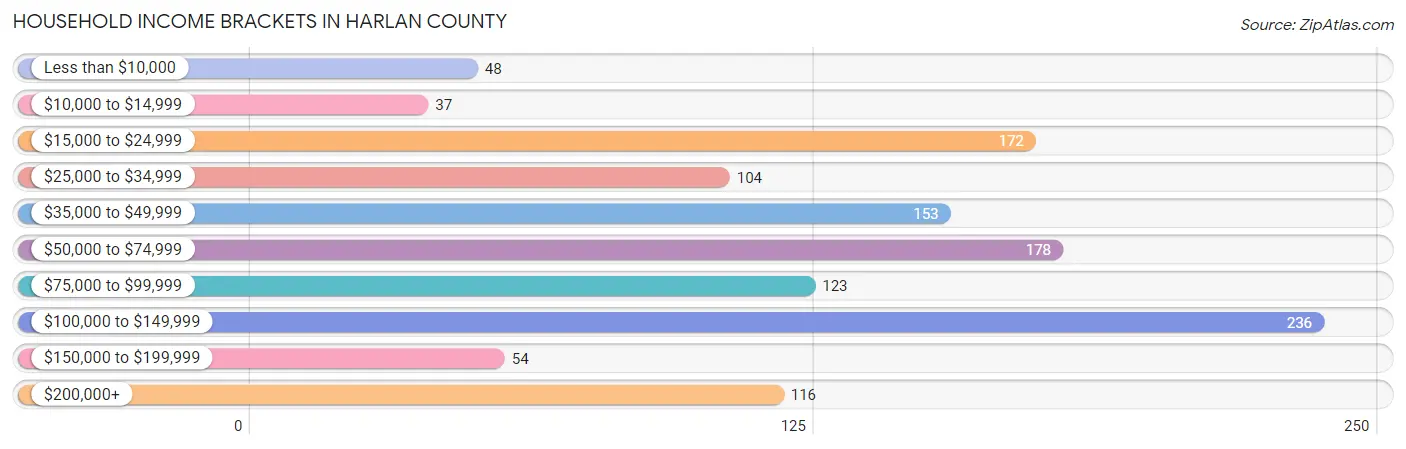
| Income Bracket | # Households | % Households |
| Less than $10,000 | 48 | 3.9% |
| $10,000 to $14,999 | 37 | 3.0% |
| $15,000 to $24,999 | 172 | 14.1% |
| $25,000 to $34,999 | 104 | 8.5% |
| $35,000 to $49,999 | 153 | 12.5% |
| $50,000 to $74,999 | 178 | 14.6% |
| $75,000 to $99,999 | 123 | 10.1% |
| $100,000 to $149,999 | 236 | 19.3% |
| $150,000 to $199,999 | 54 | 4.4% |
| $200,000+ | 116 | 9.5% |
Household Income by Householder Age in Harlan County
The median household income in Harlan County is $64,583, with the highest median household income of $100,481 found in the 25 to 44 years age bracket for the primary householder. A total of 277 households (22.7%) fall into this category. Meanwhile, the 65+ years age bracket for the primary householder has the lowest median household income of $38,102, with 501 households (41.0%) in this group.
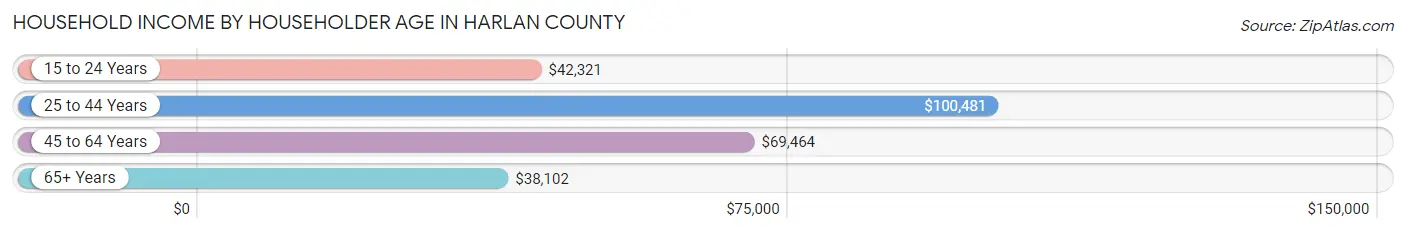
| Income Bracket | # Households | Median Income |
| 15 to 24 Years | 21 (1.7%) | $42,321 |
| 25 to 44 Years | 277 (22.7%) | $100,481 |
| 45 to 64 Years | 422 (34.6%) | $69,464 |
| 65+ Years | 501 (41.0%) | $38,102 |
| Total | 1,221 (100.0%) | $64,583 |
Poverty in Harlan County
Income Below Poverty by Sex and Age in Harlan County
With 5.9% poverty level for males and 8.9% for females among the residents of Harlan County, 75 year old and over males and 18 to 24 year old females are the most vulnerable to poverty, with 17 males (10.2%) and 27 females (25.7%) in their respective age groups living below the poverty level.
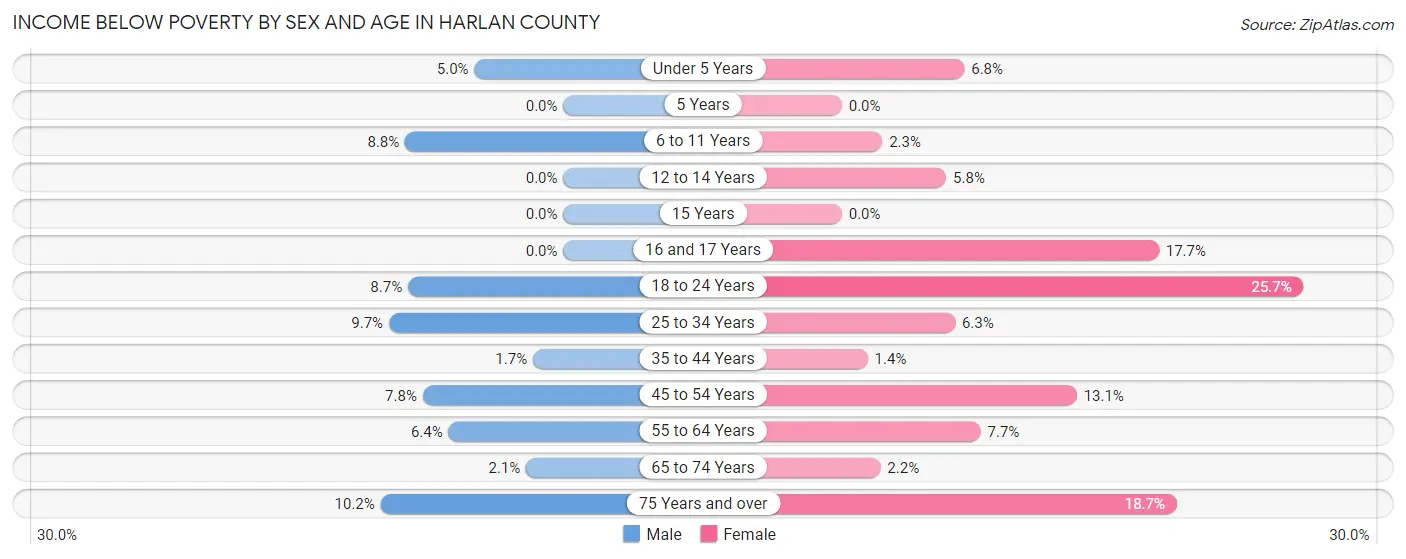
| Age Bracket | Male | Female |
| Under 5 Years | 5 (5.0%) | 6 (6.8%) |
| 5 Years | 0 (0.0%) | 0 (0.0%) |
| 6 to 11 Years | 14 (8.8%) | 2 (2.2%) |
| 12 to 14 Years | 0 (0.0%) | 5 (5.8%) |
| 15 Years | 0 (0.0%) | 0 (0.0%) |
| 16 and 17 Years | 0 (0.0%) | 6 (17.6%) |
| 18 to 24 Years | 9 (8.6%) | 27 (25.7%) |
| 25 to 34 Years | 10 (9.7%) | 8 (6.3%) |
| 35 to 44 Years | 3 (1.7%) | 2 (1.4%) |
| 45 to 54 Years | 13 (7.8%) | 17 (13.1%) |
| 55 to 64 Years | 17 (6.4%) | 18 (7.7%) |
| 65 to 74 Years | 4 (2.1%) | 5 (2.1%) |
| 75 Years and over | 17 (10.2%) | 36 (18.6%) |
| Total | 92 (5.9%) | 132 (8.9%) |
Income Above Poverty by Sex and Age in Harlan County
According to the poverty statistics in Harlan County, males aged 5 years and females aged 5 years are the age groups that are most secure financially, with 100.0% of males and 100.0% of females in these age groups living above the poverty line.
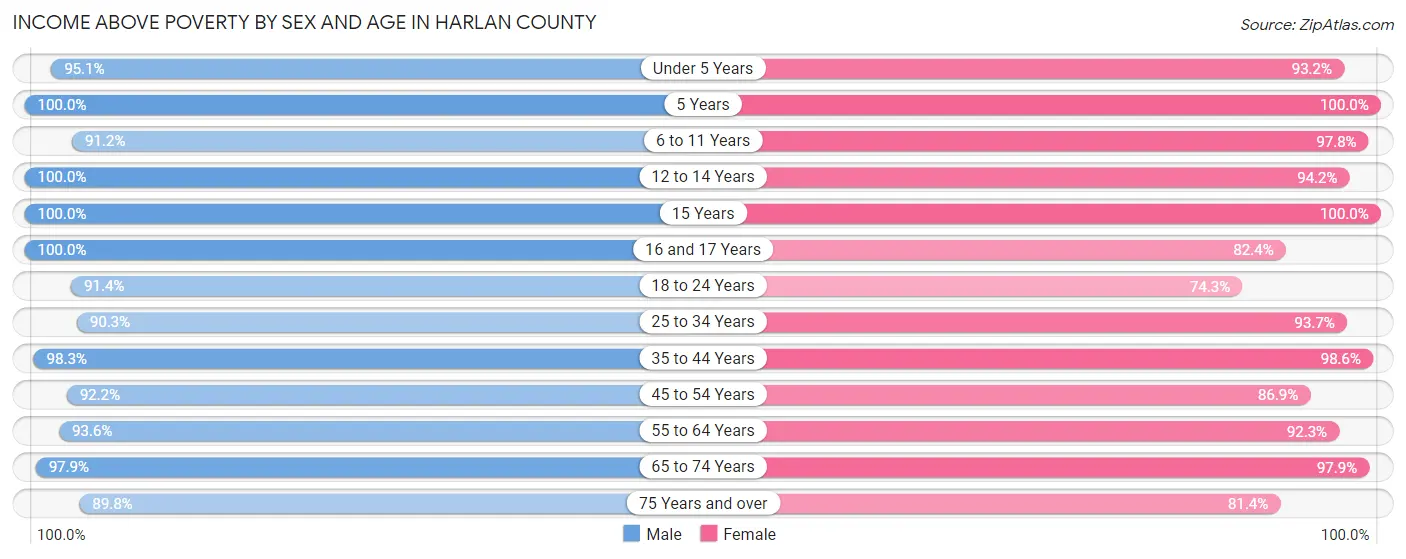
| Age Bracket | Male | Female |
| Under 5 Years | 96 (95.1%) | 82 (93.2%) |
| 5 Years | 17 (100.0%) | 8 (100.0%) |
| 6 to 11 Years | 145 (91.2%) | 87 (97.8%) |
| 12 to 14 Years | 44 (100.0%) | 81 (94.2%) |
| 15 Years | 39 (100.0%) | 17 (100.0%) |
| 16 and 17 Years | 29 (100.0%) | 28 (82.4%) |
| 18 to 24 Years | 95 (91.3%) | 78 (74.3%) |
| 25 to 34 Years | 93 (90.3%) | 119 (93.7%) |
| 35 to 44 Years | 175 (98.3%) | 137 (98.6%) |
| 45 to 54 Years | 153 (92.2%) | 113 (86.9%) |
| 55 to 64 Years | 249 (93.6%) | 215 (92.3%) |
| 65 to 74 Years | 189 (97.9%) | 228 (97.9%) |
| 75 Years and over | 150 (89.8%) | 157 (81.4%) |
| Total | 1,474 (94.1%) | 1,350 (91.1%) |
Income Below Poverty Among Married-Couple Families in Harlan County
The poverty statistics for married-couple families in Harlan County show that 2.2% or 15 of the total 667 families live below the poverty line. Families with no children have the highest poverty rate of 3.5%, comprising of 15 families. On the other hand, families with 1 or 2 children have the lowest poverty rate of 0.0%, which includes 0 families.
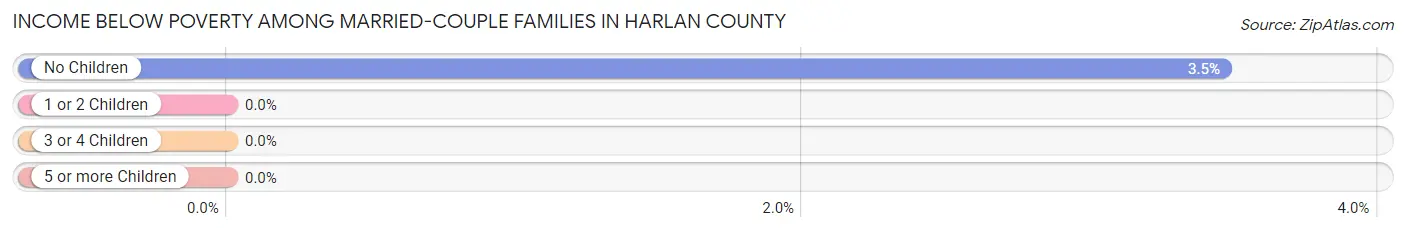
| Children | Above Poverty | Below Poverty |
| No Children | 419 (96.5%) | 15 (3.5%) |
| 1 or 2 Children | 111 (100.0%) | 0 (0.0%) |
| 3 or 4 Children | 122 (100.0%) | 0 (0.0%) |
| 5 or more Children | 0 (0.0%) | 0 (0.0%) |
| Total | 652 (97.8%) | 15 (2.2%) |
Income Below Poverty Among Single-Parent Households in Harlan County
According to the poverty data in Harlan County, 13.0% or 6 single-father households and 35.4% or 17 single-mother households are living below the poverty line. Among single-father households, those with 3 or 4 children have the highest poverty rate, with 3 households (100.0%) experiencing poverty. Likewise, among single-mother households, those with no children have the highest poverty rate, with 2 households (40.0%) falling below the poverty line.
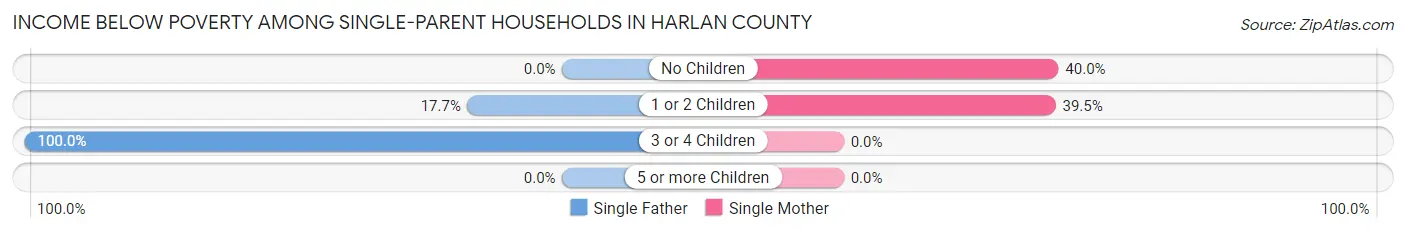
| Children | Single Father | Single Mother |
| No Children | 0 (0.0%) | 2 (40.0%) |
| 1 or 2 Children | 3 (17.6%) | 15 (39.5%) |
| 3 or 4 Children | 3 (100.0%) | 0 (0.0%) |
| 5 or more Children | 0 (0.0%) | 0 (0.0%) |
| Total | 6 (13.0%) | 17 (35.4%) |
Income Below Poverty Among Married-Couple vs Single-Parent Households in Harlan County
The poverty data for Harlan County shows that 15 of the married-couple family households (2.2%) and 23 of the single-parent households (24.5%) are living below the poverty level. Within the married-couple family households, those with no children have the highest poverty rate, with 15 households (3.5%) falling below the poverty line. Among the single-parent households, those with 3 or 4 children have the highest poverty rate, with 3 household (37.5%) living below poverty.
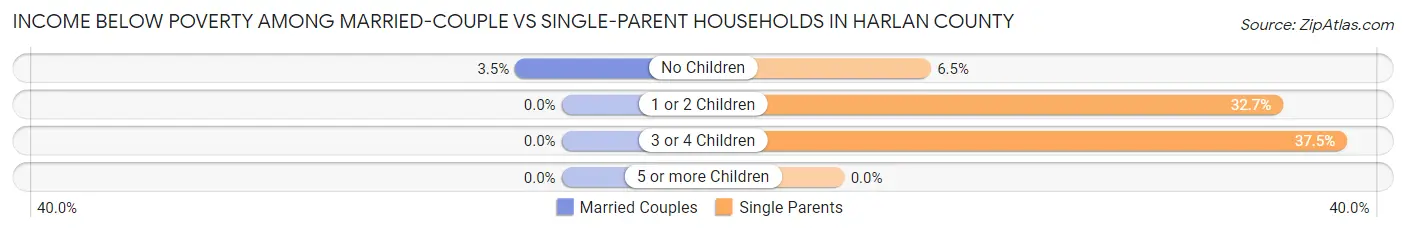
| Children | Married-Couple Families | Single-Parent Households |
| No Children | 15 (3.5%) | 2 (6.5%) |
| 1 or 2 Children | 0 (0.0%) | 18 (32.7%) |
| 3 or 4 Children | 0 (0.0%) | 3 (37.5%) |
| 5 or more Children | 0 (0.0%) | 0 (0.0%) |
| Total | 15 (2.2%) | 23 (24.5%) |
Race in Harlan County
The most populous races in Harlan County are White / Caucasian (2,904 | 93.9%), Two or more Races (108 | 3.5%), and Hispanic or Latino (104 | 3.4%).
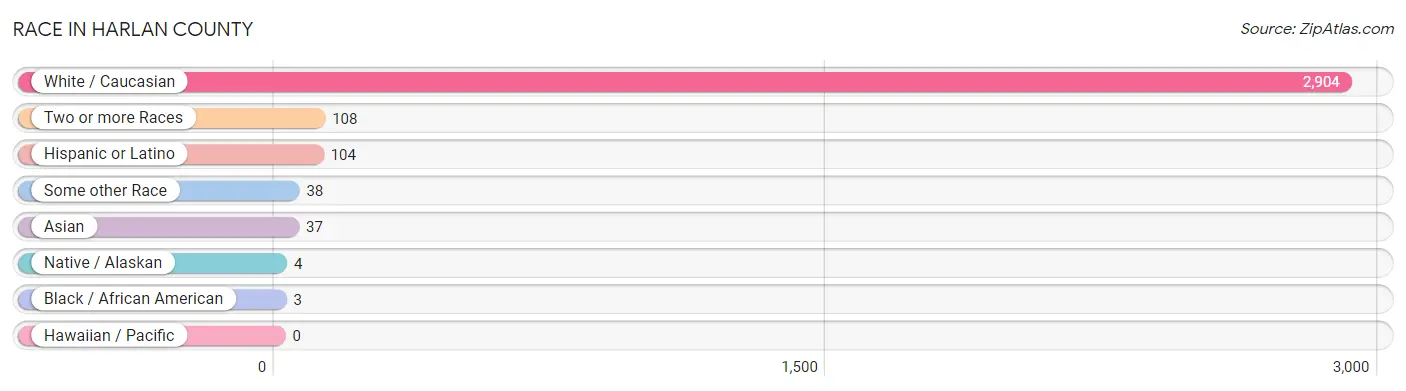
| Race | # Population | % Population |
| Asian | 37 | 1.2% |
| Black / African American | 3 | 0.1% |
| Hawaiian / Pacific | 0 | 0.0% |
| Hispanic or Latino | 104 | 3.4% |
| Native / Alaskan | 4 | 0.1% |
| White / Caucasian | 2,904 | 93.9% |
| Two or more Races | 108 | 3.5% |
| Some other Race | 38 | 1.2% |
| Total | 3,094 | 100.0% |
Ancestry in Harlan County
The most populous ancestries reported in Harlan County are German (1,125 | 36.4%), English (390 | 12.6%), Swedish (254 | 8.2%), Irish (214 | 6.9%), and American (129 | 4.2%), together accounting for 68.3% of all Harlan County residents.
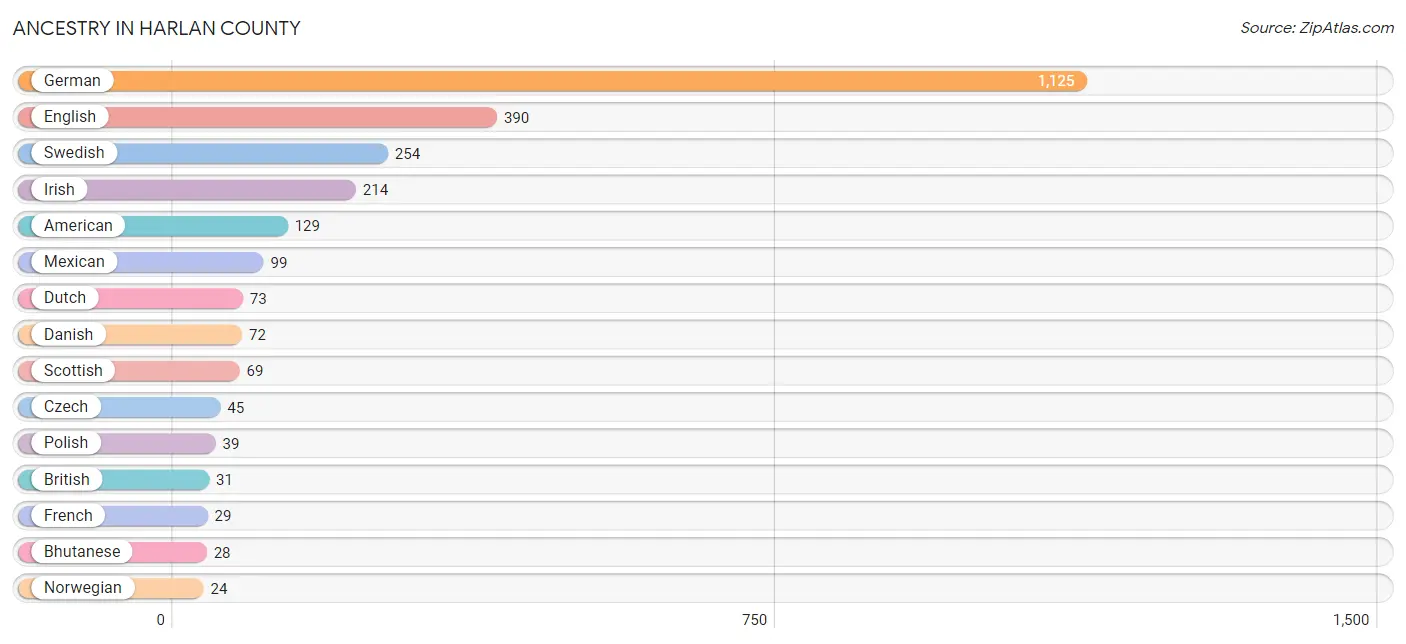
| Ancestry | # Population | % Population |
| American | 129 | 4.2% |
| Austrian | 1 | 0.0% |
| Belgian | 4 | 0.1% |
| Bhutanese | 28 | 0.9% |
| Blackfeet | 5 | 0.2% |
| British | 31 | 1.0% |
| Burmese | 9 | 0.3% |
| Choctaw | 3 | 0.1% |
| Czech | 45 | 1.5% |
| Czechoslovakian | 4 | 0.1% |
| Danish | 72 | 2.3% |
| Dutch | 73 | 2.4% |
| English | 390 | 12.6% |
| European | 13 | 0.4% |
| French | 29 | 0.9% |
| French Canadian | 4 | 0.1% |
| German | 1,125 | 36.4% |
| Hungarian | 4 | 0.1% |
| Icelander | 4 | 0.1% |
| Irish | 214 | 6.9% |
| Italian | 15 | 0.5% |
| Korean | 1 | 0.0% |
| Mexican | 99 | 3.2% |
| Mexican American Indian | 1 | 0.0% |
| Norwegian | 24 | 0.8% |
| Pennsylvania German | 9 | 0.3% |
| Polish | 39 | 1.3% |
| Russian | 1 | 0.0% |
| Scandinavian | 4 | 0.1% |
| Scotch-Irish | 15 | 0.5% |
| Scottish | 69 | 2.2% |
| Slovene | 5 | 0.2% |
| South African | 9 | 0.3% |
| Spaniard | 4 | 0.1% |
| Subsaharan African | 9 | 0.3% |
| Swedish | 254 | 8.2% |
| Swiss | 5 | 0.2% |
| Thai | 7 | 0.2% |
| Welsh | 15 | 0.5% | View All 39 Rows |
Immigrants in Harlan County
The most numerous immigrant groups reported in Harlan County came from Asia (37 | 1.2%), Central America (32 | 1.0%), Latin America (32 | 1.0%), Eastern Asia (30 | 1.0%), and Japan (28 | 0.9%), together accounting for 5.1% of all Harlan County residents.
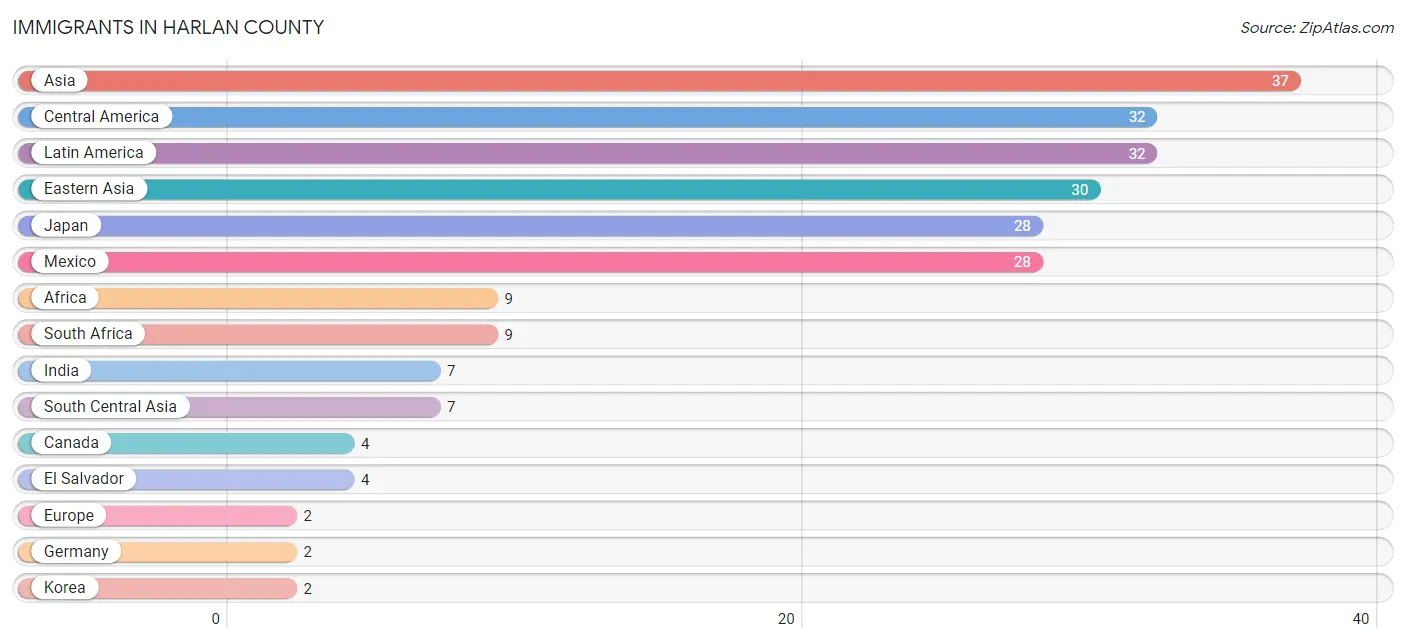
| Immigration Origin | # Population | % Population |
| Africa | 9 | 0.3% |
| Asia | 37 | 1.2% |
| Canada | 4 | 0.1% |
| Central America | 32 | 1.0% |
| Eastern Asia | 30 | 1.0% |
| El Salvador | 4 | 0.1% |
| Europe | 2 | 0.1% |
| Germany | 2 | 0.1% |
| India | 7 | 0.2% |
| Japan | 28 | 0.9% |
| Korea | 2 | 0.1% |
| Latin America | 32 | 1.0% |
| Mexico | 28 | 0.9% |
| South Africa | 9 | 0.3% |
| South Central Asia | 7 | 0.2% |
| Western Europe | 2 | 0.1% | View All 16 Rows |
Sex and Age in Harlan County
Sex and Age in Harlan County
The most populous age groups in Harlan County are 5 to 9 Years (153 | 9.6%) for men and 60 to 64 Years (137 | 9.1%) for women.
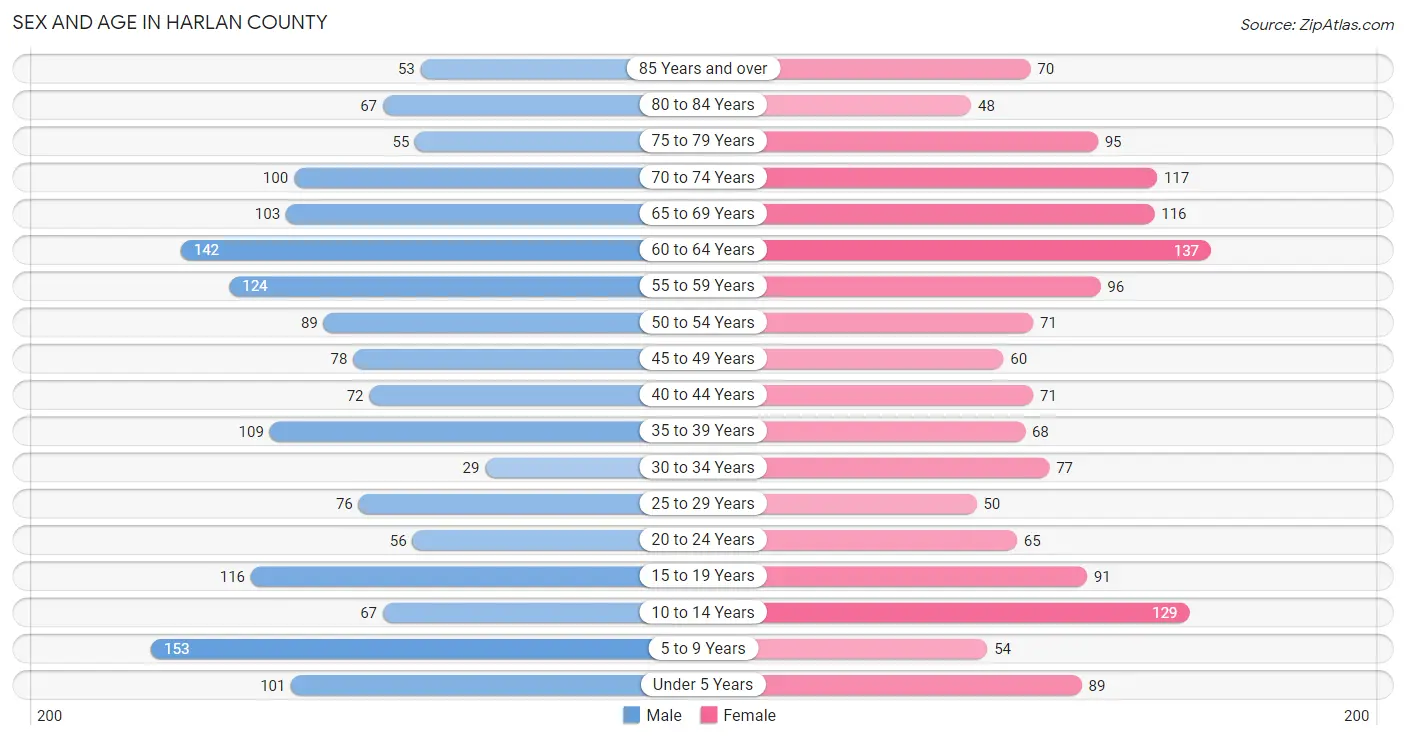
| Age Bracket | Male | Female |
| Under 5 Years | 101 (6.4%) | 89 (5.9%) |
| 5 to 9 Years | 153 (9.6%) | 54 (3.6%) |
| 10 to 14 Years | 67 (4.2%) | 129 (8.6%) |
| 15 to 19 Years | 116 (7.3%) | 91 (6.0%) |
| 20 to 24 Years | 56 (3.5%) | 65 (4.3%) |
| 25 to 29 Years | 76 (4.8%) | 50 (3.3%) |
| 30 to 34 Years | 29 (1.8%) | 77 (5.1%) |
| 35 to 39 Years | 109 (6.9%) | 68 (4.5%) |
| 40 to 44 Years | 72 (4.5%) | 71 (4.7%) |
| 45 to 49 Years | 78 (4.9%) | 60 (4.0%) |
| 50 to 54 Years | 89 (5.6%) | 71 (4.7%) |
| 55 to 59 Years | 124 (7.8%) | 96 (6.4%) |
| 60 to 64 Years | 142 (8.9%) | 137 (9.1%) |
| 65 to 69 Years | 103 (6.5%) | 116 (7.7%) |
| 70 to 74 Years | 100 (6.3%) | 117 (7.8%) |
| 75 to 79 Years | 55 (3.5%) | 95 (6.3%) |
| 80 to 84 Years | 67 (4.2%) | 48 (3.2%) |
| 85 Years and over | 53 (3.3%) | 70 (4.6%) |
| Total | 1,590 (100.0%) | 1,504 (100.0%) |
Families and Households in Harlan County
Median Family Size in Harlan County
The median family size in Harlan County is 3.29 persons per family, with single male/father families (46 | 6.0%) accounting for the largest median family size of 4.24 persons per family. On the other hand, single female/mother families (48 | 6.3%) represent the smallest median family size with 3.15 persons per family.
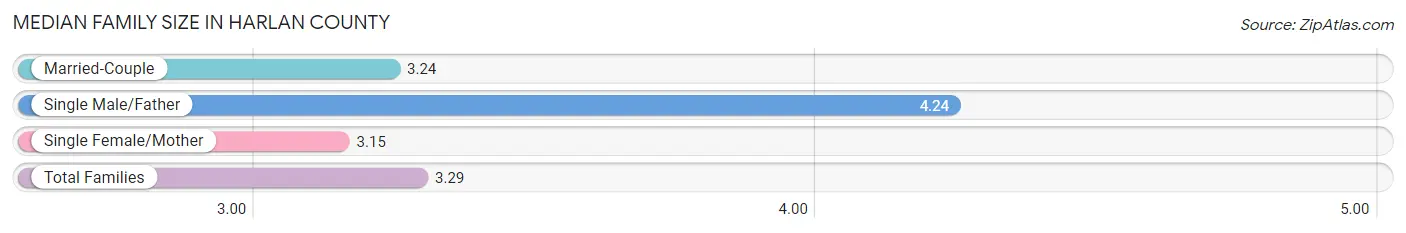
| Family Type | # Families | Family Size |
| Married-Couple | 667 (87.6%) | 3.24 |
| Single Male/Father | 46 (6.0%) | 4.24 |
| Single Female/Mother | 48 (6.3%) | 3.15 |
| Total Families | 761 (100.0%) | 3.29 |
Median Household Size in Harlan County
The median household size in Harlan County is 2.49 persons per household, with single male/father households (46 | 3.8%) accounting for the largest median household size of 4.43 persons per household. non-family households (460 | 37.7%) represent the smallest median household size with 1.14 persons per household.
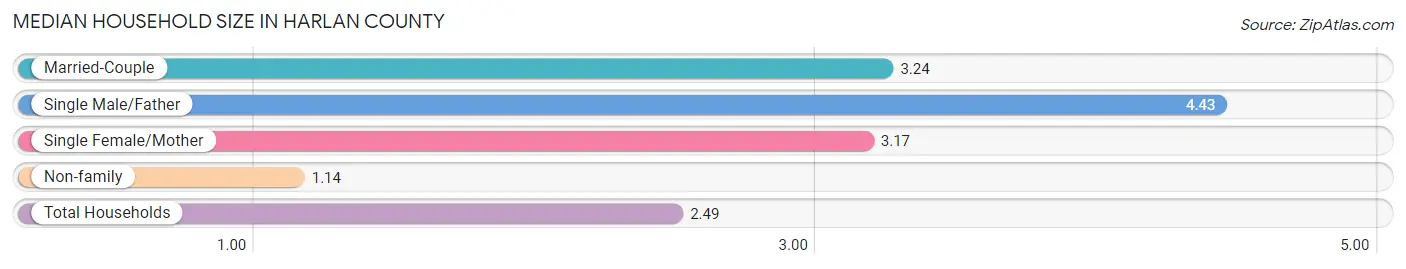
| Household Type | # Households | Household Size |
| Married-Couple | 667 (54.6%) | 3.24 |
| Single Male/Father | 46 (3.8%) | 4.43 |
| Single Female/Mother | 48 (3.9%) | 3.17 |
| Non-family | 460 (37.7%) | 1.14 |
| Total Households | 1,221 (100.0%) | 2.49 |
Household Size by Marriage Status in Harlan County
Out of a total of 1,221 households in Harlan County, 761 (62.3%) are family households, while 460 (37.7%) are nonfamily households. The most numerous type of family households are 2-person households, comprising 457, and the most common type of nonfamily households are 1-person households, comprising 413.
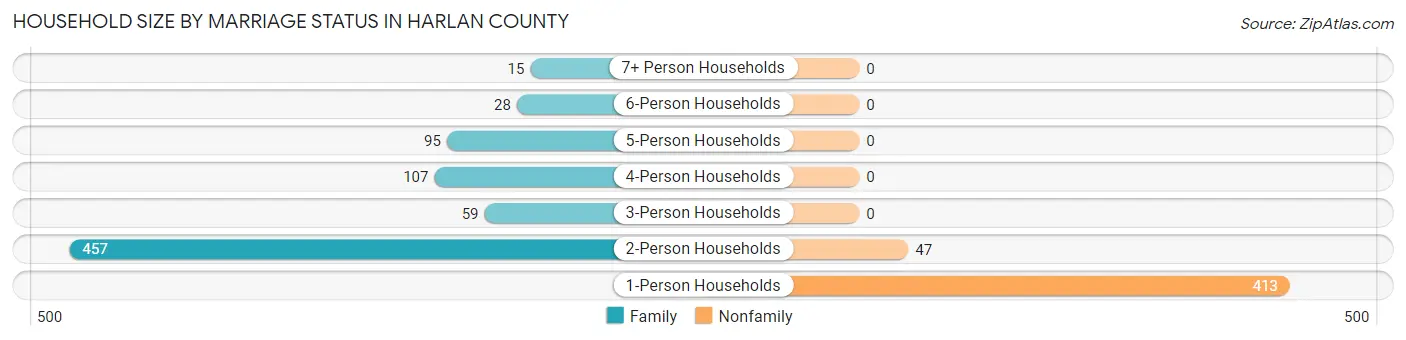
| Household Size | Family Households | Nonfamily Households |
| 1-Person Households | - | 413 (33.8%) |
| 2-Person Households | 457 (37.4%) | 47 (3.8%) |
| 3-Person Households | 59 (4.8%) | 0 (0.0%) |
| 4-Person Households | 107 (8.8%) | 0 (0.0%) |
| 5-Person Households | 95 (7.8%) | 0 (0.0%) |
| 6-Person Households | 28 (2.3%) | 0 (0.0%) |
| 7+ Person Households | 15 (1.2%) | 0 (0.0%) |
| Total | 761 (62.3%) | 460 (37.7%) |
Female Fertility in Harlan County
Fertility by Age in Harlan County
Average fertility rate in Harlan County is 20.0 births per 1,000 women. Women in the age bracket of 20 to 34 years have the highest fertility rate with 52.0 births per 1,000 women. Women in the age bracket of 20 to 34 years acount for 100.0% of all women with births.
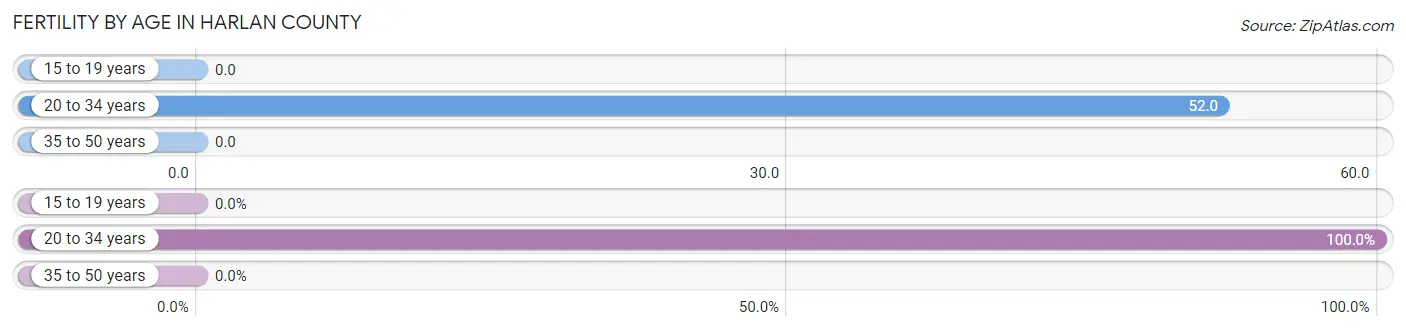
| Age Bracket | Women with Births | Births / 1,000 Women |
| 15 to 19 years | 0 (0.0%) | 0.0 |
| 20 to 34 years | 10 (100.0%) | 52.0 |
| 35 to 50 years | 0 (0.0%) | 0.0 |
| Total | 10 (100.0%) | 20.0 |
Fertility by Age by Marriage Status in Harlan County
90.0% of women with births (10) in Harlan County are married. The highest percentage of unmarried women with births falls into 20 to 34 years age bracket with 10.0% of them unmarried at the time of birth, while the lowest percentage of unmarried women with births belong to 20 to 34 years age bracket with 10.0% of them unmarried.
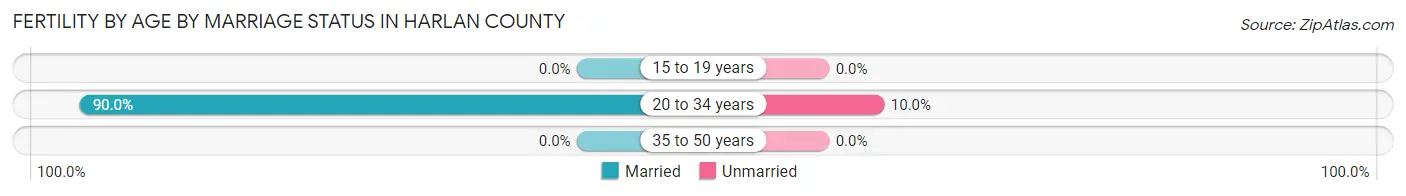
| Age Bracket | Married | Unmarried |
| 15 to 19 years | 0 (0.0%) | 0 (0.0%) |
| 20 to 34 years | 9 (90.0%) | 1 (10.0%) |
| 35 to 50 years | 0 (0.0%) | 0 (0.0%) |
| Total | 9 (90.0%) | 1 (10.0%) |
Fertility by Education in Harlan County
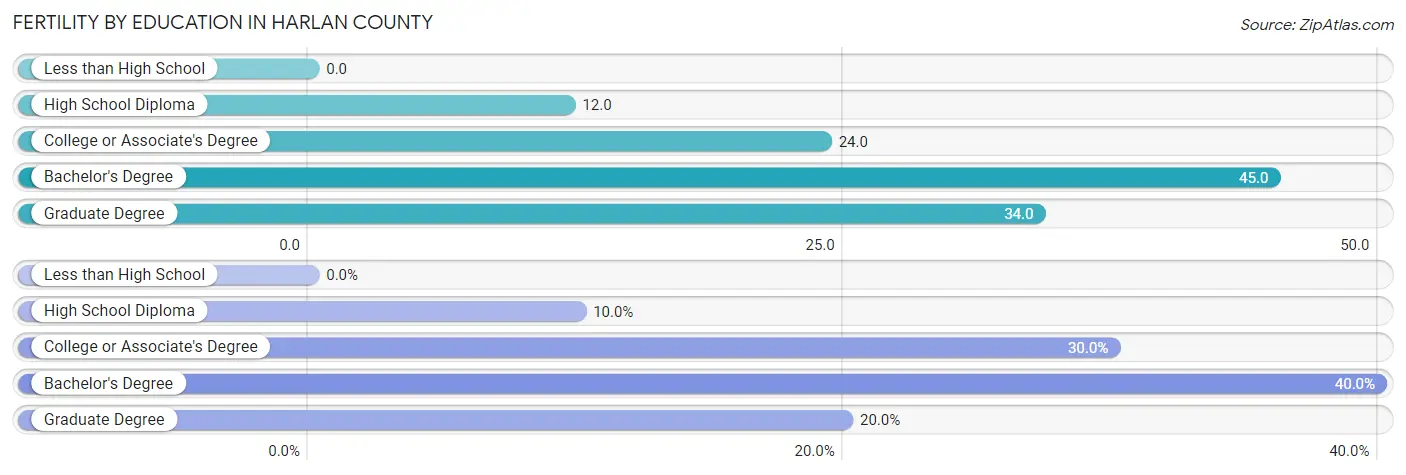
| Educational Attainment | Women with Births | Births / 1,000 Women |
| Less than High School | 0 (0.0%) | 0.0 |
| High School Diploma | 1 (10.0%) | 12.0 |
| College or Associate's Degree | 3 (30.0%) | 24.0 |
| Bachelor's Degree | 4 (40.0%) | 45.0 |
| Graduate Degree | 2 (20.0%) | 34.0 |
| Total | 10 (100.0%) | 20.0 |
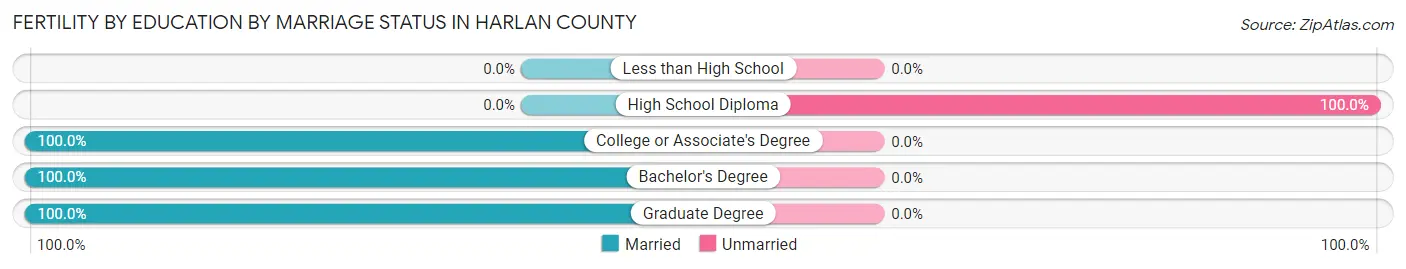
Fertility by Education by Marriage Status in Harlan County
10.0% of women with births in Harlan County are unmarried. Women with the educational attainment of college or associate's degree are most likely to be married with 100.0% of them married at childbirth, while women with the educational attainment of high school diploma are least likely to be married with 100.0% of them unmarried at childbirth.
| Educational Attainment | Married | Unmarried |
| Less than High School | 0 (0.0%) | 0 (0.0%) |
| High School Diploma | 0 (0.0%) | 1 (100.0%) |
| College or Associate's Degree | 3 (100.0%) | 0 (0.0%) |
| Bachelor's Degree | 4 (100.0%) | 0 (0.0%) |
| Graduate Degree | 2 (100.0%) | 0 (0.0%) |
| Total | 9 (90.0%) | 1 (10.0%) |
Employment Characteristics in Harlan County
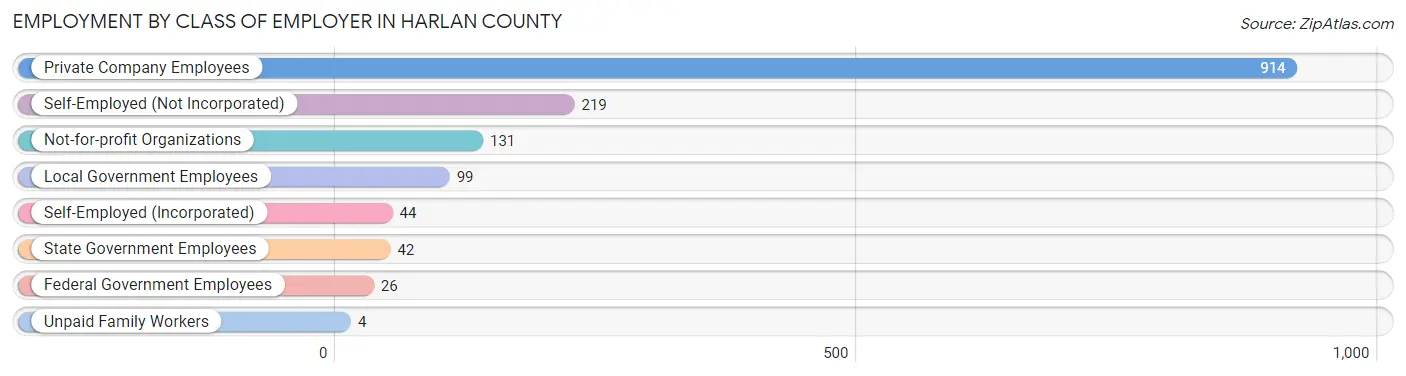
Employment by Class of Employer in Harlan County
Among the 1,479 employed individuals in Harlan County, private company employees (914 | 61.8%), self-employed (not incorporated) (219 | 14.8%), and not-for-profit organizations (131 | 8.9%) make up the most common classes of employment.
| Employer Class | # Employees | % Employees |
| Private Company Employees | 914 | 61.8% |
| Self-Employed (Incorporated) | 44 | 3.0% |
| Self-Employed (Not Incorporated) | 219 | 14.8% |
| Not-for-profit Organizations | 131 | 8.9% |
| Local Government Employees | 99 | 6.7% |
| State Government Employees | 42 | 2.8% |
| Federal Government Employees | 26 | 1.8% |
| Unpaid Family Workers | 4 | 0.3% |
| Total | 1,479 | 100.0% |
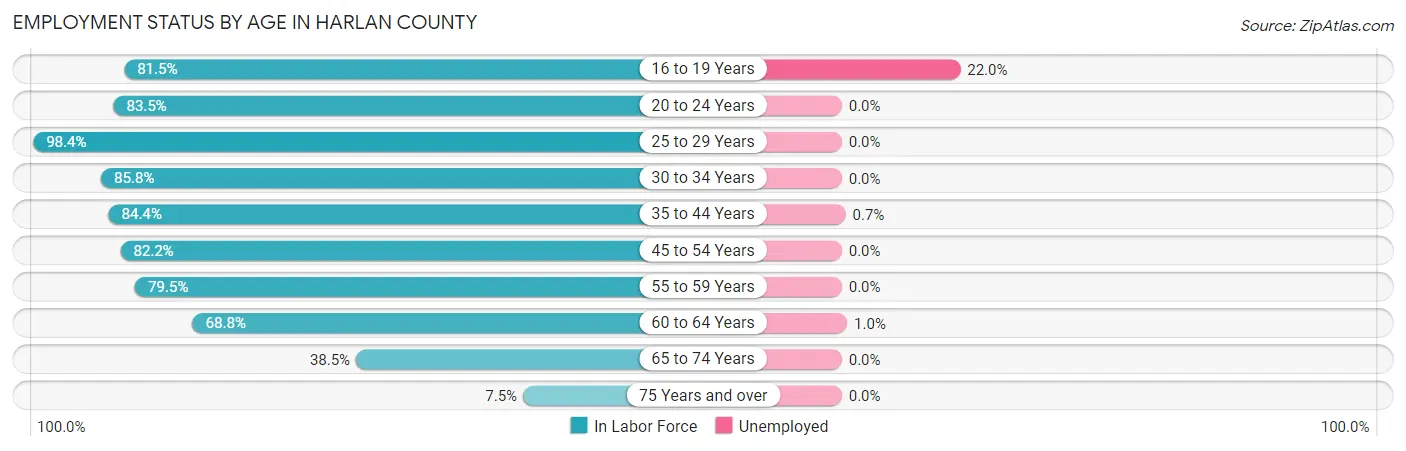
Employment Status by Age in Harlan County
According to the labor force statistics for Harlan County, out of the total population over 16 years of age (2,445), 62.1% or 1,518 individuals are in the labor force, with 2.0% or 30 of them unemployed. The age group with the highest labor force participation rate is 25 to 29 years, with 98.4% or 124 individuals in the labor force. Within the labor force, the 16 to 19 years age range has the highest percentage of unemployed individuals, with 22.0% or 27 of them being unemployed.
| Age Bracket | In Labor Force | Unemployed |
| 16 to 19 Years | 123 (81.5%) | 27 (22.0%) |
| 20 to 24 Years | 101 (83.5%) | 0 (0.0%) |
| 25 to 29 Years | 124 (98.4%) | 0 (0.0%) |
| 30 to 34 Years | 91 (85.8%) | 0 (0.0%) |
| 35 to 44 Years | 270 (84.4%) | 2 (0.7%) |
| 45 to 54 Years | 245 (82.2%) | 0 (0.0%) |
| 55 to 59 Years | 175 (79.5%) | 0 (0.0%) |
| 60 to 64 Years | 192 (68.8%) | 2 (1.0%) |
| 65 to 74 Years | 168 (38.5%) | 0 (0.0%) |
| 75 Years and over | 29 (7.5%) | 0 (0.0%) |
| Total | 1,518 (62.1%) | 30 (2.0%) |
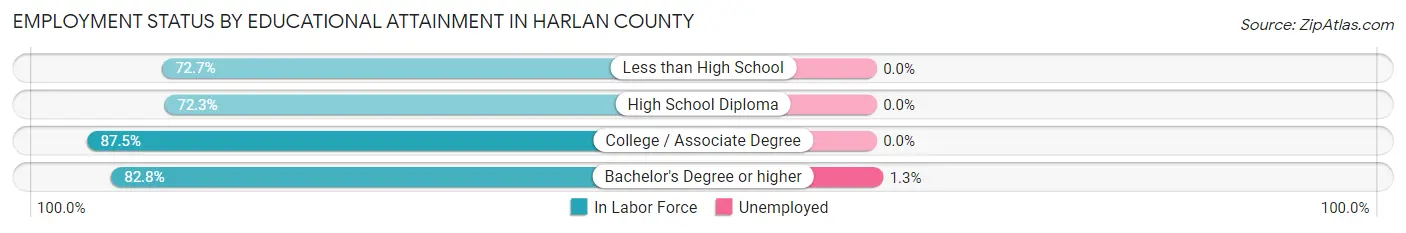
Employment Status by Educational Attainment in Harlan County
According to labor force statistics for Harlan County, 81.3% of individuals (1,097) out of the total population between 25 and 64 years of age (1,349) are in the labor force, with 0.4% or 4 of them being unemployed. The group with the highest labor force participation rate are those with the educational attainment of college / associate degree, with 87.5% or 474 individuals in the labor force. Within the labor force, individuals with bachelor's degree or higher education have the highest percentage of unemployment, with 1.3% or 4 of them being unemployed.
| Educational Attainment | In Labor Force | Unemployed |
| Less than High School | 64 (72.7%) | 0 (0.0%) |
| High School Diploma | 251 (72.3%) | 0 (0.0%) |
| College / Associate Degree | 474 (87.5%) | 0 (0.0%) |
| Bachelor's Degree or higher | 308 (82.8%) | 5 (1.3%) |
| Total | 1,097 (81.3%) | 5 (0.4%) |
Employment Occupations by Sex in Harlan County
Management, Business, Science and Arts Occupations
The most common Management, Business, Science and Arts occupations in Harlan County are Management (200 | 13.5%), Community & Social Service (140 | 9.4%), Education Instruction & Library (107 | 7.2%), Health Diagnosing & Treating (84 | 5.7%), and Health Technologists (60 | 4.0%).
Management, Business, Science and Arts Occupations by Sex
Within the Management, Business, Science and Arts occupations in Harlan County, the most male-oriented occupations are Computers & Mathematics (100.0%), Life, Physical & Social Science (100.0%), and Computers, Engineering & Science (88.9%), while the most female-oriented occupations are Education Instruction & Library (85.1%), Health Technologists (73.3%), and Business & Financial (73.1%).
| Occupation | Male | Female |
| Management | 131 (65.5%) | 69 (34.5%) |
| Business & Financial | 7 (26.9%) | 19 (73.1%) |
| Computers, Engineering & Science | 32 (88.9%) | 4 (11.1%) |
| Computers & Mathematics | 2 (100.0%) | 0 (0.0%) |
| Architecture & Engineering | 3 (42.9%) | 4 (57.1%) |
| Life, Physical & Social Science | 27 (100.0%) | 0 (0.0%) |
| Community & Social Service | 41 (29.3%) | 99 (70.7%) |
| Education, Arts & Media | 21 (80.8%) | 5 (19.2%) |
| Legal Services & Support | 4 (57.1%) | 3 (42.9%) |
| Education Instruction & Library | 16 (14.9%) | 91 (85.1%) |
| Arts, Media & Entertainment | 0 (0.0%) | 0 (0.0%) |
| Health Diagnosing & Treating | 32 (38.1%) | 52 (61.9%) |
| Health Technologists | 16 (26.7%) | 44 (73.3%) |
| Total (Category) | 243 (50.0%) | 243 (50.0%) |
| Total (Overall) | 819 (55.1%) | 668 (44.9%) |
Services Occupations
The most common Services occupations in Harlan County are Cleaning & Maintenance (75 | 5.0%), Food Preparation & Serving (64 | 4.3%), Healthcare Support (56 | 3.8%), Personal Care & Service (44 | 3.0%), and Security & Protection (13 | 0.9%).
Services Occupations by Sex
Within the Services occupations in Harlan County, the most male-oriented occupations are Law Enforcement (100.0%), Food Preparation & Serving (48.4%), and Security & Protection (46.2%), while the most female-oriented occupations are Firefighting & Prevention (100.0%), Personal Care & Service (97.7%), and Healthcare Support (89.3%).
| Occupation | Male | Female |
| Healthcare Support | 6 (10.7%) | 50 (89.3%) |
| Security & Protection | 6 (46.2%) | 7 (53.8%) |
| Firefighting & Prevention | 0 (0.0%) | 7 (100.0%) |
| Law Enforcement | 6 (100.0%) | 0 (0.0%) |
| Food Preparation & Serving | 31 (48.4%) | 33 (51.6%) |
| Cleaning & Maintenance | 19 (25.3%) | 56 (74.7%) |
| Personal Care & Service | 1 (2.3%) | 43 (97.7%) |
| Total (Category) | 63 (25.0%) | 189 (75.0%) |
| Total (Overall) | 819 (55.1%) | 668 (44.9%) |
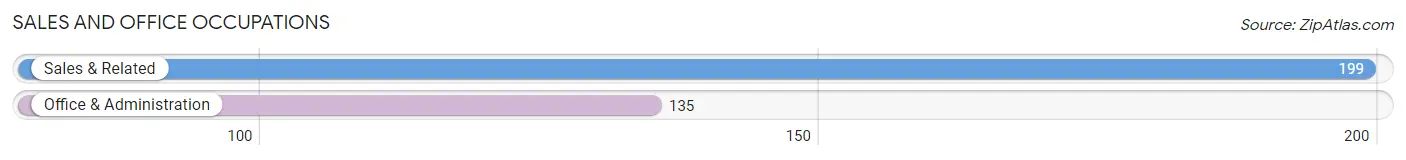
Sales and Office Occupations
The most common Sales and Office occupations in Harlan County are Sales & Related (199 | 13.4%), and Office & Administration (135 | 9.1%).
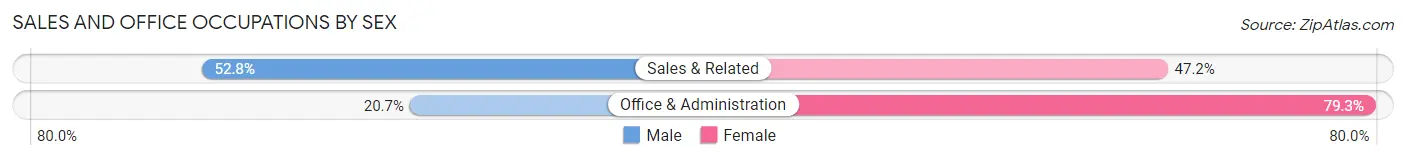
Sales and Office Occupations by Sex
| Occupation | Male | Female |
| Sales & Related | 105 (52.8%) | 94 (47.2%) |
| Office & Administration | 28 (20.7%) | 107 (79.3%) |
| Total (Category) | 133 (39.8%) | 201 (60.2%) |
| Total (Overall) | 819 (55.1%) | 668 (44.9%) |
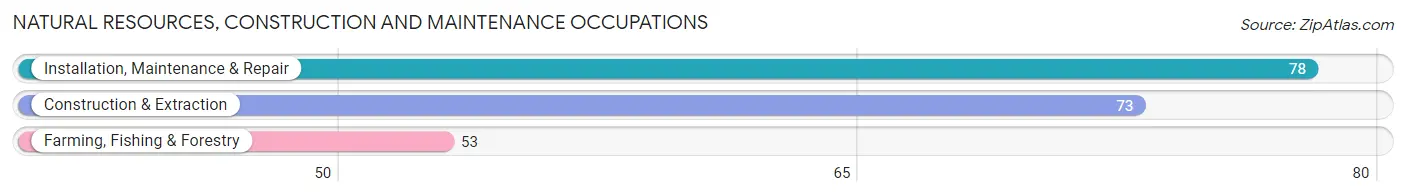
Natural Resources, Construction and Maintenance Occupations
The most common Natural Resources, Construction and Maintenance occupations in Harlan County are Installation, Maintenance & Repair (78 | 5.2%), Construction & Extraction (73 | 4.9%), and Farming, Fishing & Forestry (53 | 3.6%).
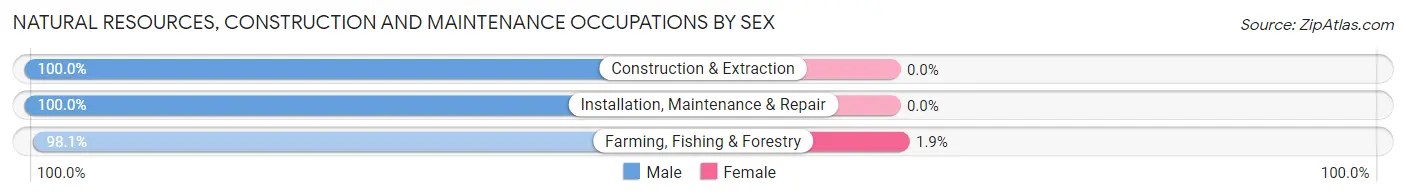
Natural Resources, Construction and Maintenance Occupations by Sex
| Occupation | Male | Female |
| Farming, Fishing & Forestry | 52 (98.1%) | 1 (1.9%) |
| Construction & Extraction | 73 (100.0%) | 0 (0.0%) |
| Installation, Maintenance & Repair | 78 (100.0%) | 0 (0.0%) |
| Total (Category) | 203 (99.5%) | 1 (0.5%) |
| Total (Overall) | 819 (55.1%) | 668 (44.9%) |
Production, Transportation and Moving Occupations
The most common Production, Transportation and Moving occupations in Harlan County are Transportation (83 | 5.6%), Production (77 | 5.2%), and Material Moving (51 | 3.4%).
Production, Transportation and Moving Occupations by Sex
| Occupation | Male | Female |
| Production | 61 (79.2%) | 16 (20.8%) |
| Transportation | 72 (86.8%) | 11 (13.3%) |
| Material Moving | 44 (86.3%) | 7 (13.7%) |
| Total (Category) | 177 (83.9%) | 34 (16.1%) |
| Total (Overall) | 819 (55.1%) | 668 (44.9%) |
Employment Industries by Sex in Harlan County
Employment Industries in Harlan County
The major employment industries in Harlan County include Agriculture, Fishing & Hunting (243 | 16.3%), Health Care & Social Assistance (173 | 11.6%), Educational Services (148 | 10.0%), Retail Trade (145 | 9.8%), and Manufacturing (129 | 8.7%).
Employment Industries by Sex in Harlan County
The Harlan County industries that see more men than women are Mining, Quarrying, & Extraction (100.0%), Utilities (100.0%), and Arts, Entertainment & Recreation (100.0%), whereas the industries that tend to have a higher number of women are Real Estate, Rental & Leasing (100.0%), Information (94.7%), and Educational Services (82.4%).
| Industry | Male | Female |
| Agriculture, Fishing & Hunting | 218 (89.7%) | 25 (10.3%) |
| Mining, Quarrying, & Extraction | 5 (100.0%) | 0 (0.0%) |
| Construction | 51 (86.4%) | 8 (13.6%) |
| Manufacturing | 104 (80.6%) | 25 (19.4%) |
| Wholesale Trade | 93 (87.7%) | 13 (12.3%) |
| Retail Trade | 58 (40.0%) | 87 (60.0%) |
| Transportation & Warehousing | 25 (67.6%) | 12 (32.4%) |
| Utilities | 15 (100.0%) | 0 (0.0%) |
| Information | 1 (5.3%) | 18 (94.7%) |
| Finance & Insurance | 24 (40.0%) | 36 (60.0%) |
| Real Estate, Rental & Leasing | 0 (0.0%) | 24 (100.0%) |
| Professional & Scientific | 18 (36.0%) | 32 (64.0%) |
| Enterprise Management | 0 (0.0%) | 0 (0.0%) |
| Administrative & Support | 12 (40.0%) | 18 (60.0%) |
| Educational Services | 26 (17.6%) | 122 (82.4%) |
| Health Care & Social Assistance | 43 (24.9%) | 130 (75.1%) |
| Arts, Entertainment & Recreation | 23 (100.0%) | 0 (0.0%) |
| Accommodation & Food Services | 33 (48.5%) | 35 (51.5%) |
| Public Administration | 19 (46.3%) | 22 (53.7%) |
| Total | 819 (55.1%) | 668 (44.9%) |
Education in Harlan County
School Enrollment in Harlan County
The most common levels of schooling among the 659 students in Harlan County are high school (173 | 26.3%), middle school (159 | 24.1%), and elementary school (151 | 22.9%).
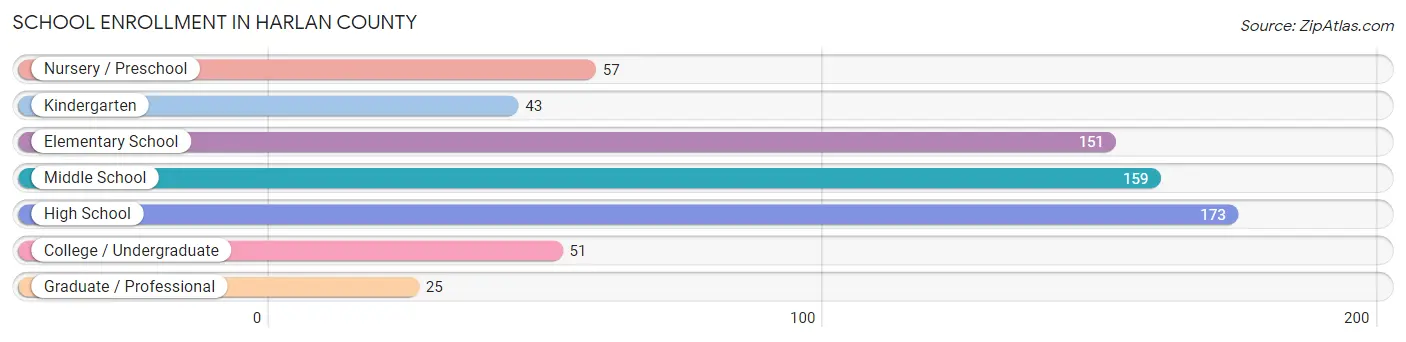
| School Level | # Students | % Students |
| Nursery / Preschool | 57 | 8.6% |
| Kindergarten | 43 | 6.5% |
| Elementary School | 151 | 22.9% |
| Middle School | 159 | 24.1% |
| High School | 173 | 26.3% |
| College / Undergraduate | 51 | 7.7% |
| Graduate / Professional | 25 | 3.8% |
| Total | 659 | 100.0% |
School Enrollment by Age by Funding Source in Harlan County
Out of a total of 659 students who are enrolled in schools in Harlan County, 75 (11.4%) attend a private institution, while the remaining 584 (88.6%) are enrolled in public schools. The age group of 20 to 24 year olds has the highest likelihood of being enrolled in private schools, with 10 (58.8% in the age bracket) enrolled. Conversely, the age group of 25 to 34 year olds has the lowest likelihood of being enrolled in a private school, with 22 (100.0% in the age bracket) attending a public institution.
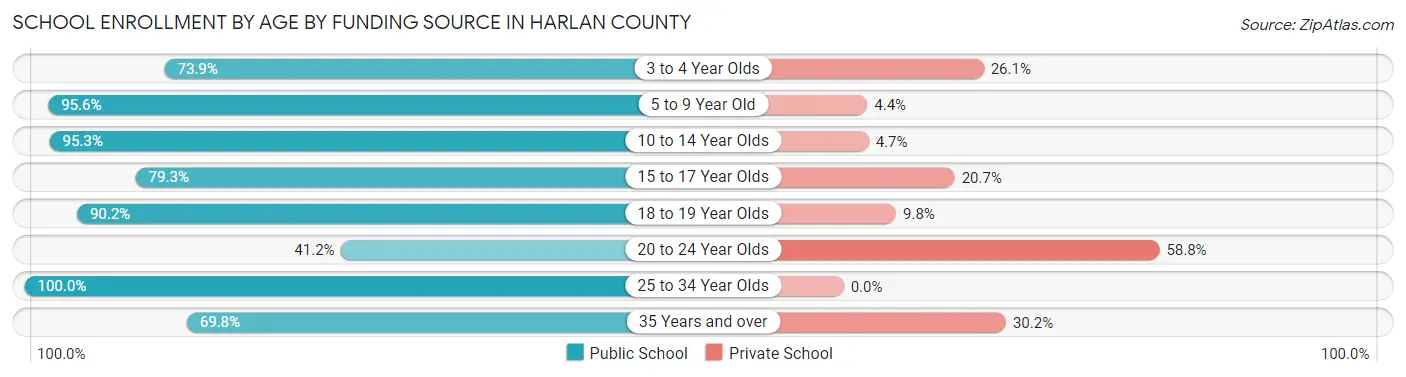
| Age Bracket | Public School | Private School |
| 3 to 4 Year Olds | 17 (73.9%) | 6 (26.1%) |
| 5 to 9 Year Old | 195 (95.6%) | 9 (4.4%) |
| 10 to 14 Year Olds | 184 (95.3%) | 9 (4.7%) |
| 15 to 17 Year Olds | 92 (79.3%) | 24 (20.7%) |
| 18 to 19 Year Olds | 37 (90.2%) | 4 (9.8%) |
| 20 to 24 Year Olds | 7 (41.2%) | 10 (58.8%) |
| 25 to 34 Year Olds | 22 (100.0%) | 0 (0.0%) |
| 35 Years and over | 30 (69.8%) | 13 (30.2%) |
| Total | 584 (88.6%) | 75 (11.4%) |
Educational Attainment by Field of Study in Harlan County
Education (169 | 30.8%), bio, nature & agricultural (88 | 16.0%), arts & humanities (79 | 14.4%), business (54 | 9.8%), and science & technology (40 | 7.3%) are the most common fields of study among 549 individuals in Harlan County who have obtained a bachelor's degree or higher.
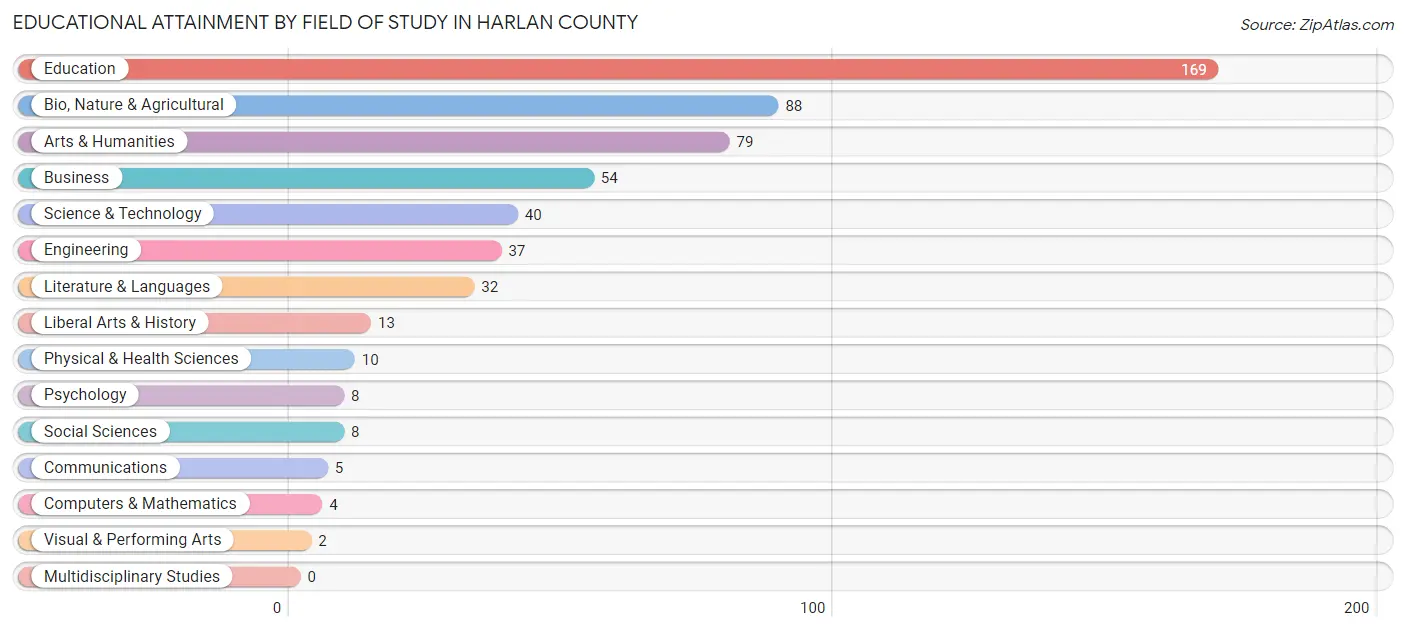
| Field of Study | # Graduates | % Graduates |
| Computers & Mathematics | 4 | 0.7% |
| Bio, Nature & Agricultural | 88 | 16.0% |
| Physical & Health Sciences | 10 | 1.8% |
| Psychology | 8 | 1.5% |
| Social Sciences | 8 | 1.5% |
| Engineering | 37 | 6.7% |
| Multidisciplinary Studies | 0 | 0.0% |
| Science & Technology | 40 | 7.3% |
| Business | 54 | 9.8% |
| Education | 169 | 30.8% |
| Literature & Languages | 32 | 5.8% |
| Liberal Arts & History | 13 | 2.4% |
| Visual & Performing Arts | 2 | 0.4% |
| Communications | 5 | 0.9% |
| Arts & Humanities | 79 | 14.4% |
| Total | 549 | 100.0% |
Transportation & Commute in Harlan County
Vehicle Availability by Sex in Harlan County
The most prevalent vehicle ownership categories in Harlan County are males with 2 vehicles (282, accounting for 34.6%) and females with 2 vehicles (196, making up 42.6%).
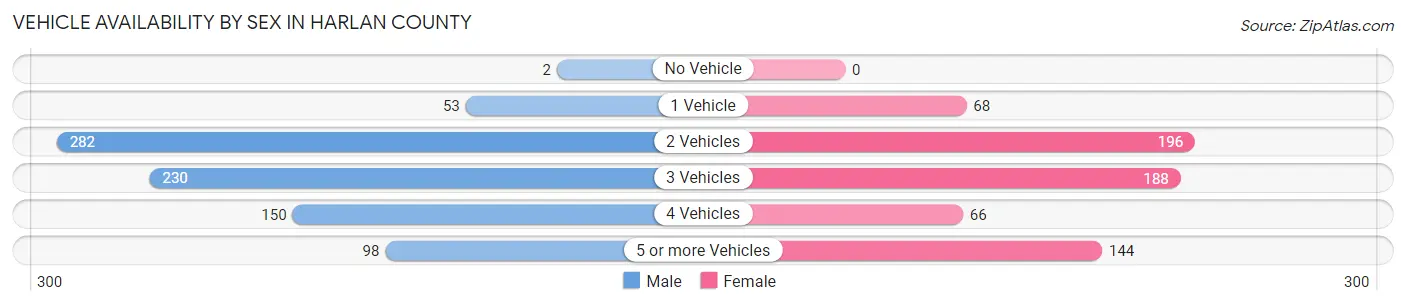
| Vehicles Available | Male | Female |
| No Vehicle | 2 (0.3%) | 0 (0.0%) |
| 1 Vehicle | 53 (6.5%) | 68 (10.3%) |
| 2 Vehicles | 282 (34.6%) | 196 (29.6%) |
| 3 Vehicles | 230 (28.2%) | 188 (28.4%) |
| 4 Vehicles | 150 (18.4%) | 66 (10.0%) |
| 5 or more Vehicles | 98 (12.0%) | 144 (21.7%) |
| Total | 815 (100.0%) | 662 (100.0%) |
Commute Time in Harlan County
The most frequently occuring commute durations in Harlan County are less than 5 minutes (319 commuters, 22.7%), 5 to 9 minutes (269 commuters, 19.2%), and 10 to 14 minutes (180 commuters, 12.8%).
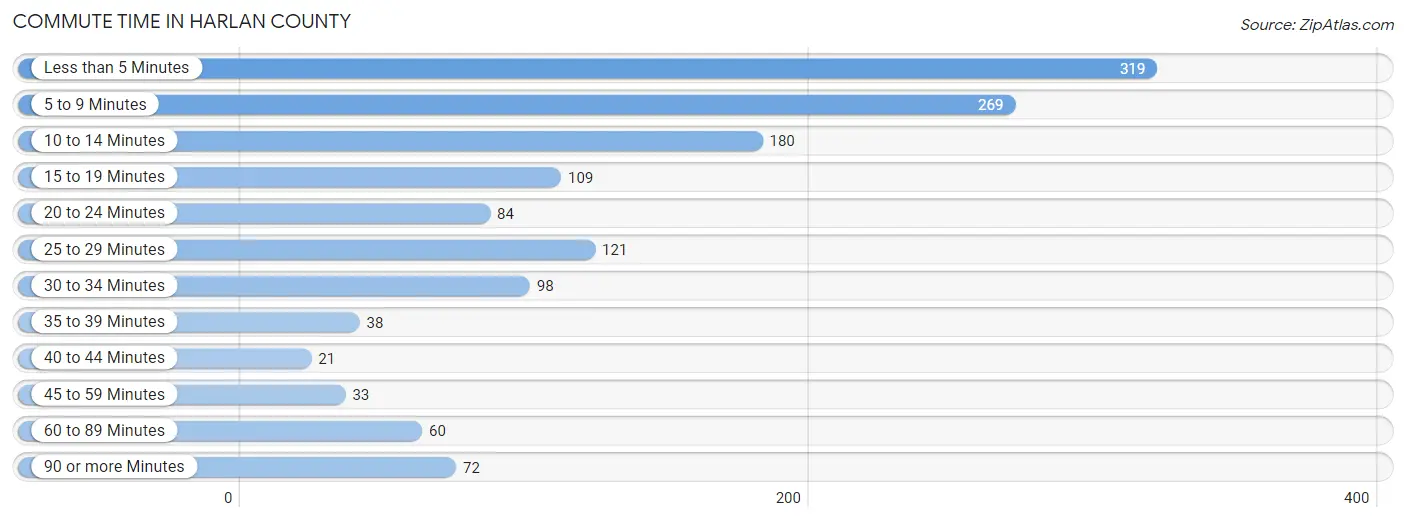
| Commute Time | # Commuters | % Commuters |
| Less than 5 Minutes | 319 | 22.7% |
| 5 to 9 Minutes | 269 | 19.2% |
| 10 to 14 Minutes | 180 | 12.8% |
| 15 to 19 Minutes | 109 | 7.8% |
| 20 to 24 Minutes | 84 | 6.0% |
| 25 to 29 Minutes | 121 | 8.6% |
| 30 to 34 Minutes | 98 | 7.0% |
| 35 to 39 Minutes | 38 | 2.7% |
| 40 to 44 Minutes | 21 | 1.5% |
| 45 to 59 Minutes | 33 | 2.4% |
| 60 to 89 Minutes | 60 | 4.3% |
| 90 or more Minutes | 72 | 5.1% |
Commute Time by Sex in Harlan County
The most common commute times in Harlan County are less than 5 minutes (201 commuters, 25.9%) for males and less than 5 minutes (118 commuters, 18.8%) for females.
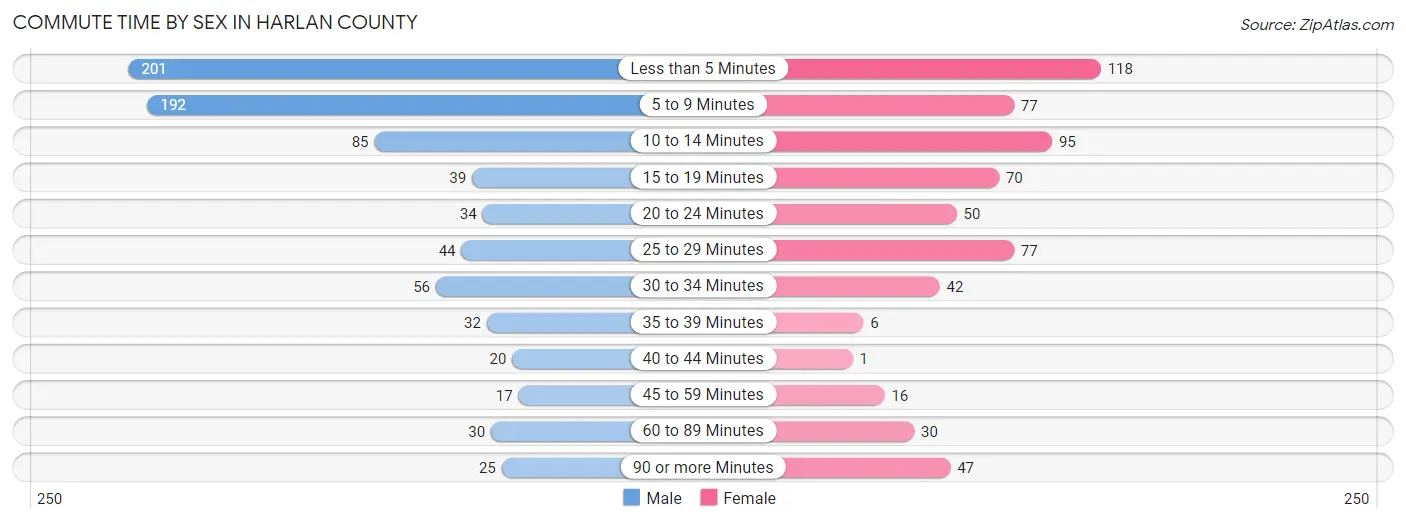
| Commute Time | Male | Female |
| Less than 5 Minutes | 201 (25.9%) | 118 (18.8%) |
| 5 to 9 Minutes | 192 (24.8%) | 77 (12.2%) |
| 10 to 14 Minutes | 85 (11.0%) | 95 (15.1%) |
| 15 to 19 Minutes | 39 (5.0%) | 70 (11.1%) |
| 20 to 24 Minutes | 34 (4.4%) | 50 (8.0%) |
| 25 to 29 Minutes | 44 (5.7%) | 77 (12.2%) |
| 30 to 34 Minutes | 56 (7.2%) | 42 (6.7%) |
| 35 to 39 Minutes | 32 (4.1%) | 6 (0.9%) |
| 40 to 44 Minutes | 20 (2.6%) | 1 (0.2%) |
| 45 to 59 Minutes | 17 (2.2%) | 16 (2.5%) |
| 60 to 89 Minutes | 30 (3.9%) | 30 (4.8%) |
| 90 or more Minutes | 25 (3.2%) | 47 (7.5%) |
Time of Departure to Work by Sex in Harlan County
The most frequent times of departure to work in Harlan County are 8:00 AM to 8:29 AM (156, 20.1%) for males and 7:30 AM to 7:59 AM (226, 35.9%) for females.
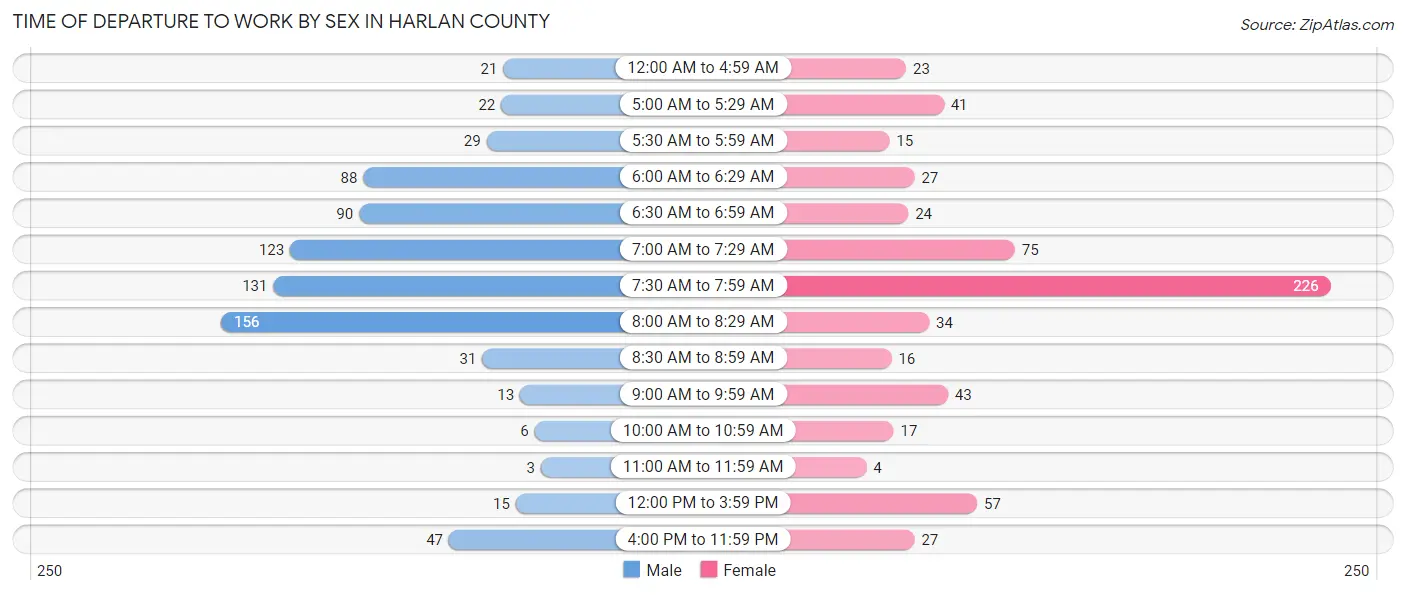
| Time of Departure | Male | Female |
| 12:00 AM to 4:59 AM | 21 (2.7%) | 23 (3.7%) |
| 5:00 AM to 5:29 AM | 22 (2.8%) | 41 (6.5%) |
| 5:30 AM to 5:59 AM | 29 (3.7%) | 15 (2.4%) |
| 6:00 AM to 6:29 AM | 88 (11.4%) | 27 (4.3%) |
| 6:30 AM to 6:59 AM | 90 (11.6%) | 24 (3.8%) |
| 7:00 AM to 7:29 AM | 123 (15.9%) | 75 (11.9%) |
| 7:30 AM to 7:59 AM | 131 (16.9%) | 226 (35.9%) |
| 8:00 AM to 8:29 AM | 156 (20.1%) | 34 (5.4%) |
| 8:30 AM to 8:59 AM | 31 (4.0%) | 16 (2.5%) |
| 9:00 AM to 9:59 AM | 13 (1.7%) | 43 (6.8%) |
| 10:00 AM to 10:59 AM | 6 (0.8%) | 17 (2.7%) |
| 11:00 AM to 11:59 AM | 3 (0.4%) | 4 (0.6%) |
| 12:00 PM to 3:59 PM | 15 (1.9%) | 57 (9.1%) |
| 4:00 PM to 11:59 PM | 47 (6.1%) | 27 (4.3%) |
| Total | 775 (100.0%) | 629 (100.0%) |
Housing Occupancy in Harlan County
Occupancy by Ownership in Harlan County
Of the total 1,221 dwellings in Harlan County, owner-occupied units account for 1,013 (83.0%), while renter-occupied units make up 208 (17.0%).
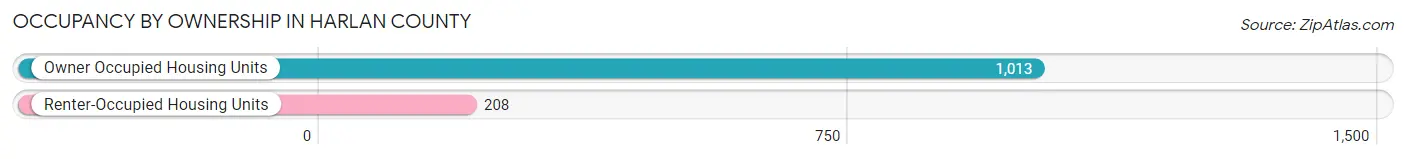
| Occupancy | # Housing Units | % Housing Units |
| Owner Occupied Housing Units | 1,013 | 83.0% |
| Renter-Occupied Housing Units | 208 | 17.0% |
| Total Occupied Housing Units | 1,221 | 100.0% |
Occupancy by Household Size in Harlan County
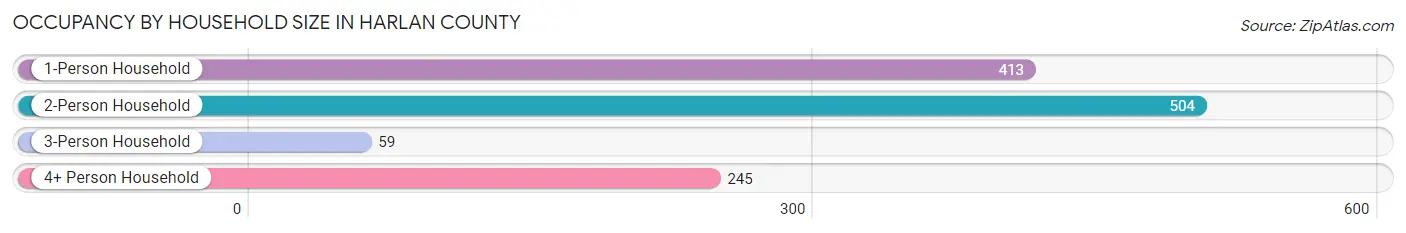
| Household Size | # Housing Units | % Housing Units |
| 1-Person Household | 413 | 33.8% |
| 2-Person Household | 504 | 41.3% |
| 3-Person Household | 59 | 4.8% |
| 4+ Person Household | 245 | 20.1% |
| Total Housing Units | 1,221 | 100.0% |
Occupancy by Ownership by Household Size in Harlan County
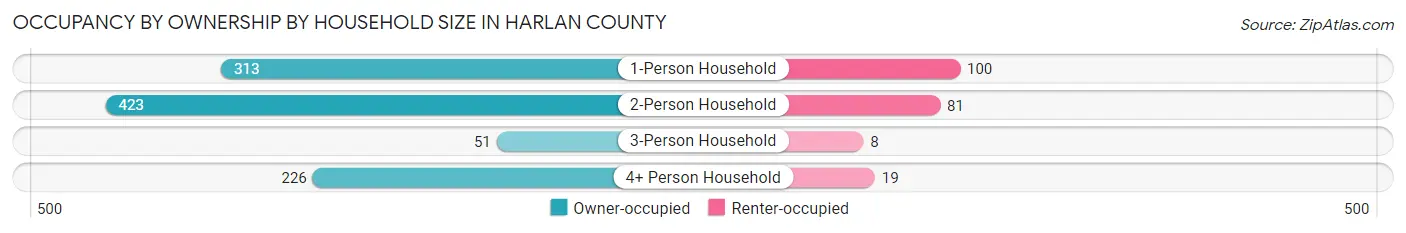
| Household Size | Owner-occupied | Renter-occupied |
| 1-Person Household | 313 (75.8%) | 100 (24.2%) |
| 2-Person Household | 423 (83.9%) | 81 (16.1%) |
| 3-Person Household | 51 (86.4%) | 8 (13.6%) |
| 4+ Person Household | 226 (92.2%) | 19 (7.8%) |
| Total Housing Units | 1,013 (83.0%) | 208 (17.0%) |
Occupancy by Educational Attainment in Harlan County
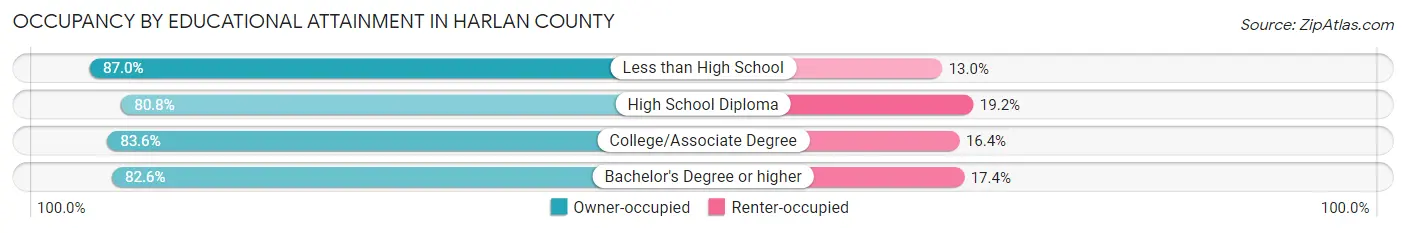
| Household Size | Owner-occupied | Renter-occupied |
| Less than High School | 87 (87.0%) | 13 (13.0%) |
| High School Diploma | 236 (80.8%) | 56 (19.2%) |
| College/Associate Degree | 433 (83.6%) | 85 (16.4%) |
| Bachelor's Degree or higher | 257 (82.6%) | 54 (17.4%) |
Occupancy by Age of Householder in Harlan County
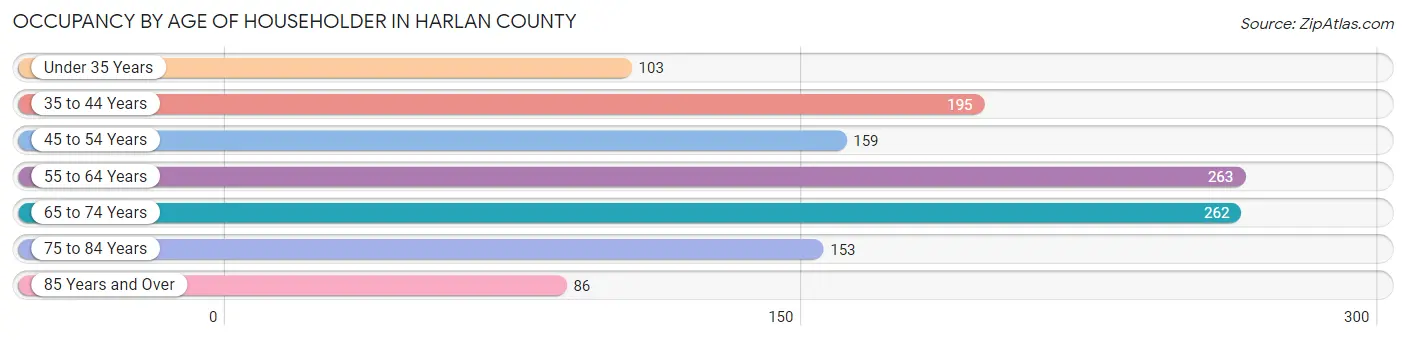
| Age Bracket | # Households | % Households |
| Under 35 Years | 103 | 8.4% |
| 35 to 44 Years | 195 | 16.0% |
| 45 to 54 Years | 159 | 13.0% |
| 55 to 64 Years | 263 | 21.5% |
| 65 to 74 Years | 262 | 21.5% |
| 75 to 84 Years | 153 | 12.5% |
| 85 Years and Over | 86 | 7.0% |
| Total | 1,221 | 100.0% |
Housing Finances in Harlan County
Median Income by Occupancy in Harlan County
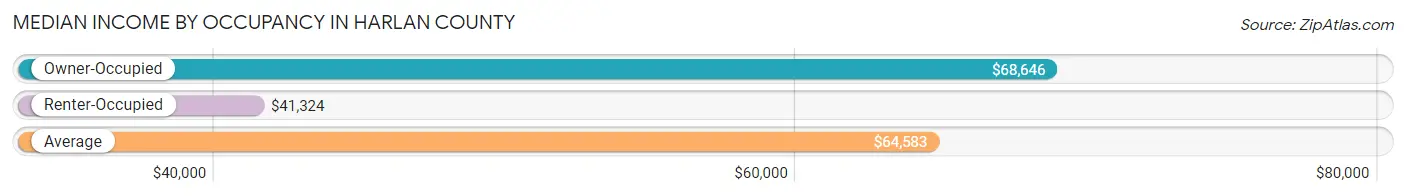
| Occupancy Type | # Households | Median Income |
| Owner-Occupied | 1,013 (83.0%) | $68,646 |
| Renter-Occupied | 208 (17.0%) | $41,324 |
| Average | 1,221 (100.0%) | $64,583 |
Occupancy by Householder Income Bracket in Harlan County
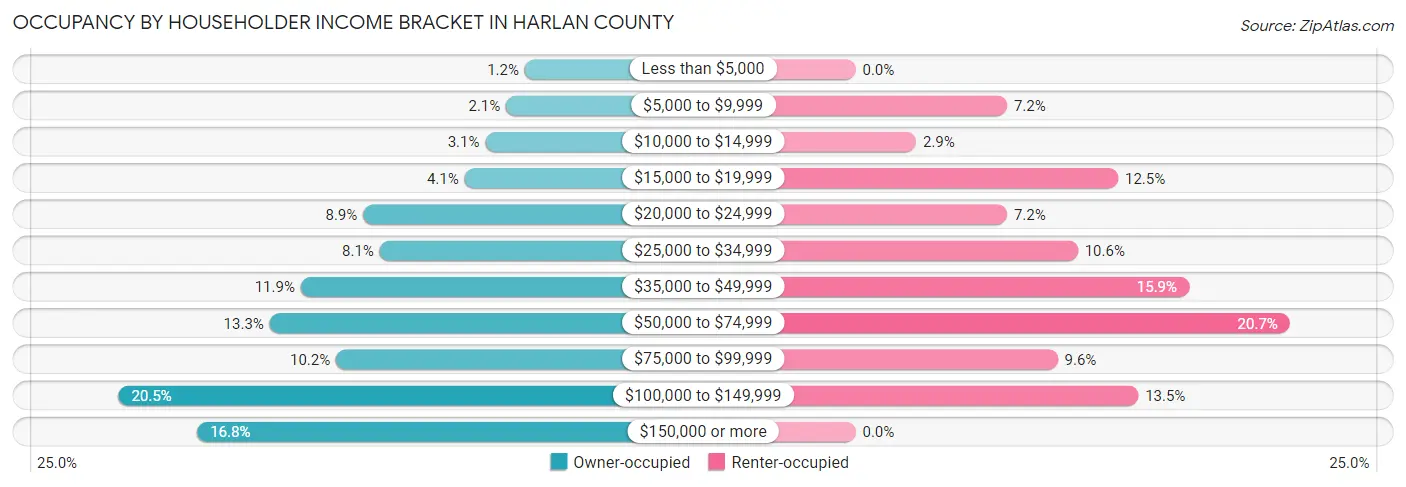
| Income Bracket | Owner-occupied | Renter-occupied |
| Less than $5,000 | 12 (1.2%) | 0 (0.0%) |
| $5,000 to $9,999 | 21 (2.1%) | 15 (7.2%) |
| $10,000 to $14,999 | 31 (3.1%) | 6 (2.9%) |
| $15,000 to $19,999 | 41 (4.1%) | 26 (12.5%) |
| $20,000 to $24,999 | 90 (8.9%) | 15 (7.2%) |
| $25,000 to $34,999 | 82 (8.1%) | 22 (10.6%) |
| $35,000 to $49,999 | 120 (11.8%) | 33 (15.9%) |
| $50,000 to $74,999 | 135 (13.3%) | 43 (20.7%) |
| $75,000 to $99,999 | 103 (10.2%) | 20 (9.6%) |
| $100,000 to $149,999 | 208 (20.5%) | 28 (13.5%) |
| $150,000 or more | 170 (16.8%) | 0 (0.0%) |
| Total | 1,013 (100.0%) | 208 (100.0%) |
Monthly Housing Cost Tiers in Harlan County
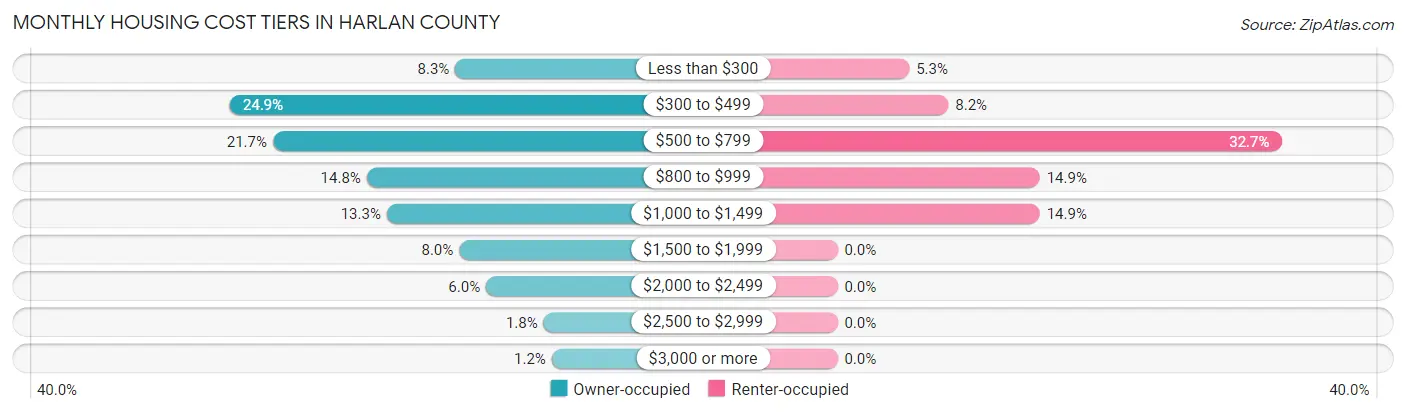
| Monthly Cost | Owner-occupied | Renter-occupied |
| Less than $300 | 84 (8.3%) | 11 (5.3%) |
| $300 to $499 | 252 (24.9%) | 17 (8.2%) |
| $500 to $799 | 220 (21.7%) | 68 (32.7%) |
| $800 to $999 | 150 (14.8%) | 31 (14.9%) |
| $1,000 to $1,499 | 135 (13.3%) | 31 (14.9%) |
| $1,500 to $1,999 | 81 (8.0%) | 0 (0.0%) |
| $2,000 to $2,499 | 61 (6.0%) | 0 (0.0%) |
| $2,500 to $2,999 | 18 (1.8%) | 0 (0.0%) |
| $3,000 or more | 12 (1.2%) | 0 (0.0%) |
| Total | 1,013 (100.0%) | 208 (100.0%) |
Physical Housing Characteristics in Harlan County
Housing Structures in Harlan County
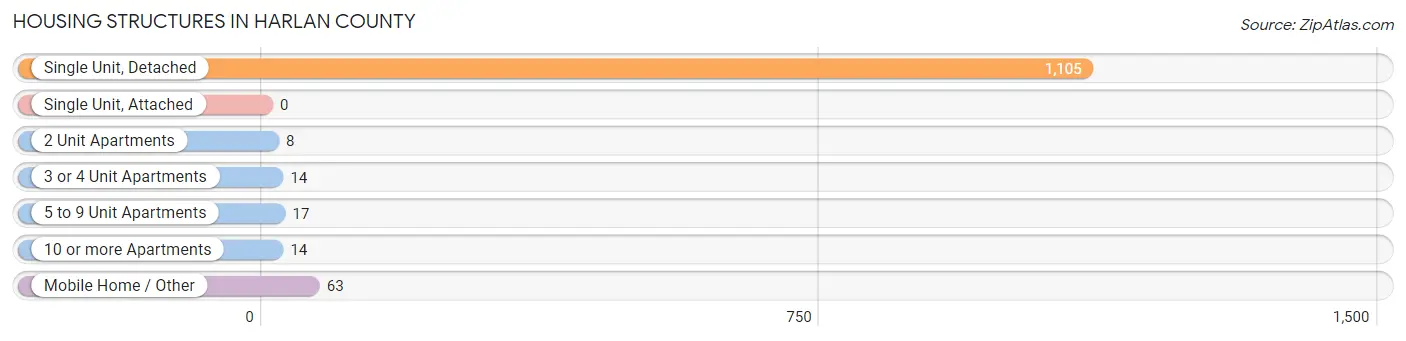
| Structure Type | # Housing Units | % Housing Units |
| Single Unit, Detached | 1,105 | 90.5% |
| Single Unit, Attached | 0 | 0.0% |
| 2 Unit Apartments | 8 | 0.7% |
| 3 or 4 Unit Apartments | 14 | 1.1% |
| 5 to 9 Unit Apartments | 17 | 1.4% |
| 10 or more Apartments | 14 | 1.1% |
| Mobile Home / Other | 63 | 5.2% |
| Total | 1,221 | 100.0% |
Housing Structures by Occupancy in Harlan County
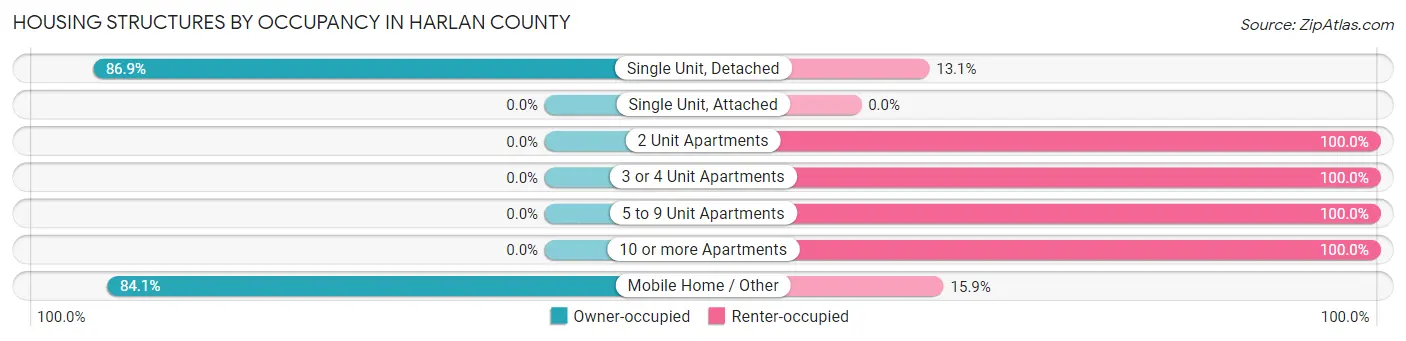
| Structure Type | Owner-occupied | Renter-occupied |
| Single Unit, Detached | 960 (86.9%) | 145 (13.1%) |
| Single Unit, Attached | 0 (0.0%) | 0 (0.0%) |
| 2 Unit Apartments | 0 (0.0%) | 8 (100.0%) |
| 3 or 4 Unit Apartments | 0 (0.0%) | 14 (100.0%) |
| 5 to 9 Unit Apartments | 0 (0.0%) | 17 (100.0%) |
| 10 or more Apartments | 0 (0.0%) | 14 (100.0%) |
| Mobile Home / Other | 53 (84.1%) | 10 (15.9%) |
| Total | 1,013 (83.0%) | 208 (17.0%) |
Housing Structures by Number of Rooms in Harlan County
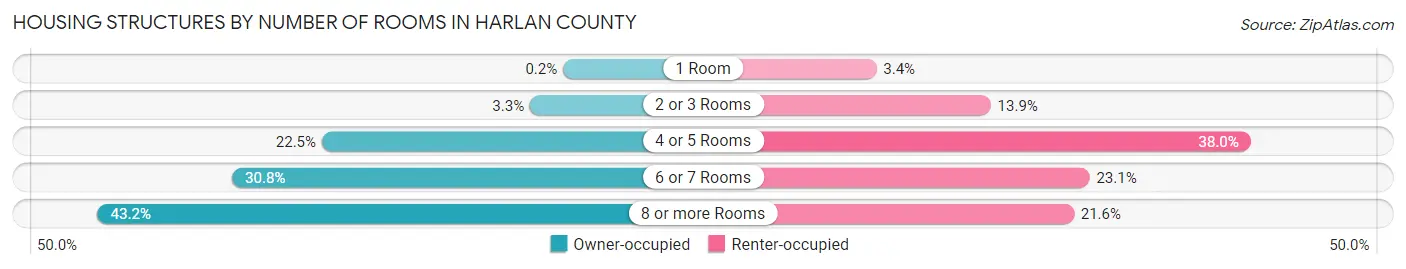
| Number of Rooms | Owner-occupied | Renter-occupied |
| 1 Room | 2 (0.2%) | 7 (3.4%) |
| 2 or 3 Rooms | 33 (3.3%) | 29 (13.9%) |
| 4 or 5 Rooms | 228 (22.5%) | 79 (38.0%) |
| 6 or 7 Rooms | 312 (30.8%) | 48 (23.1%) |
| 8 or more Rooms | 438 (43.2%) | 45 (21.6%) |
| Total | 1,013 (100.0%) | 208 (100.0%) |
Housing Structure by Heating Type in Harlan County
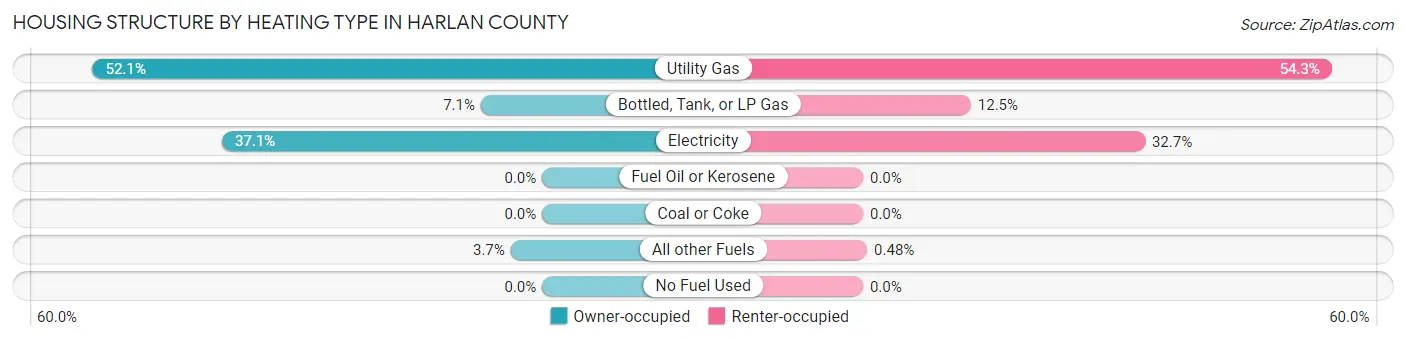
| Heating Type | Owner-occupied | Renter-occupied |
| Utility Gas | 528 (52.1%) | 113 (54.3%) |
| Bottled, Tank, or LP Gas | 72 (7.1%) | 26 (12.5%) |
| Electricity | 376 (37.1%) | 68 (32.7%) |
| Fuel Oil or Kerosene | 0 (0.0%) | 0 (0.0%) |
| Coal or Coke | 0 (0.0%) | 0 (0.0%) |
| All other Fuels | 37 (3.6%) | 1 (0.5%) |
| No Fuel Used | 0 (0.0%) | 0 (0.0%) |
| Total | 1,013 (100.0%) | 208 (100.0%) |
Household Vehicle Usage in Harlan County
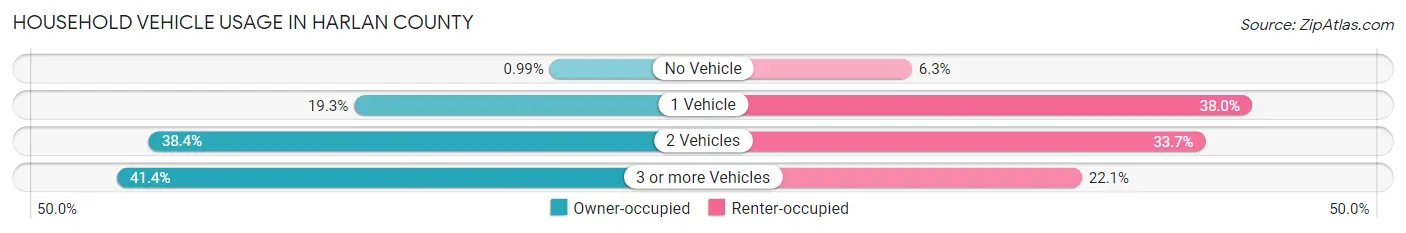
| Vehicles per Household | Owner-occupied | Renter-occupied |
| No Vehicle | 10 (1.0%) | 13 (6.2%) |
| 1 Vehicle | 195 (19.3%) | 79 (38.0%) |
| 2 Vehicles | 389 (38.4%) | 70 (33.7%) |
| 3 or more Vehicles | 419 (41.4%) | 46 (22.1%) |
| Total | 1,013 (100.0%) | 208 (100.0%) |
Real Estate & Mortgages in Harlan County
Real Estate and Mortgage Overview in Harlan County
| Characteristic | Without Mortgage | With Mortgage |
| Housing Units | 579 | 434 |
| Median Property Value | $120,800 | $157,100 |
| Median Household Income | $52,625 | $98 |
| Monthly Housing Costs | $471 | $12 |
| Real Estate Taxes | $1,510 | $3 |
Property Value by Mortgage Status in Harlan County
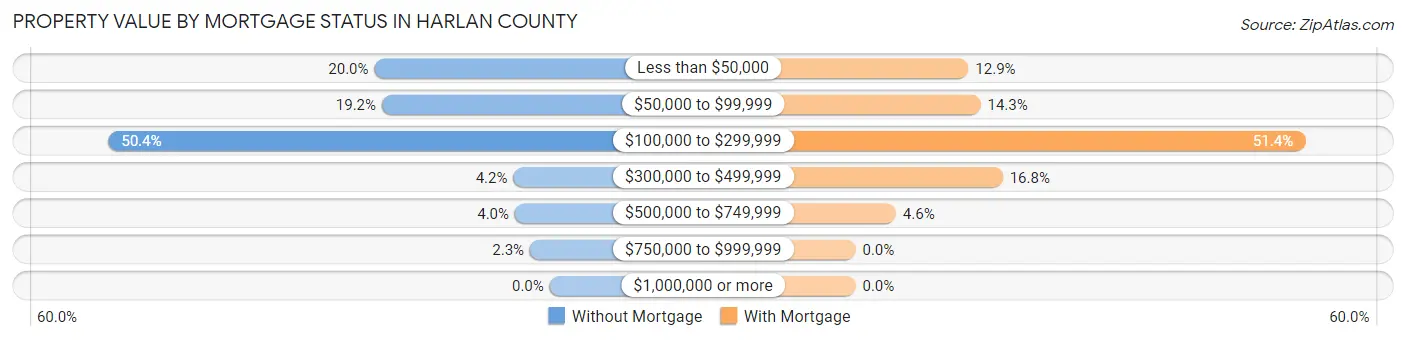
| Property Value | Without Mortgage | With Mortgage |
| Less than $50,000 | 116 (20.0%) | 56 (12.9%) |
| $50,000 to $99,999 | 111 (19.2%) | 62 (14.3%) |
| $100,000 to $299,999 | 292 (50.4%) | 223 (51.4%) |
| $300,000 to $499,999 | 24 (4.2%) | 73 (16.8%) |
| $500,000 to $749,999 | 23 (4.0%) | 20 (4.6%) |
| $750,000 to $999,999 | 13 (2.2%) | 0 (0.0%) |
| $1,000,000 or more | 0 (0.0%) | 0 (0.0%) |
| Total | 579 (100.0%) | 434 (100.0%) |
Household Income by Mortgage Status in Harlan County
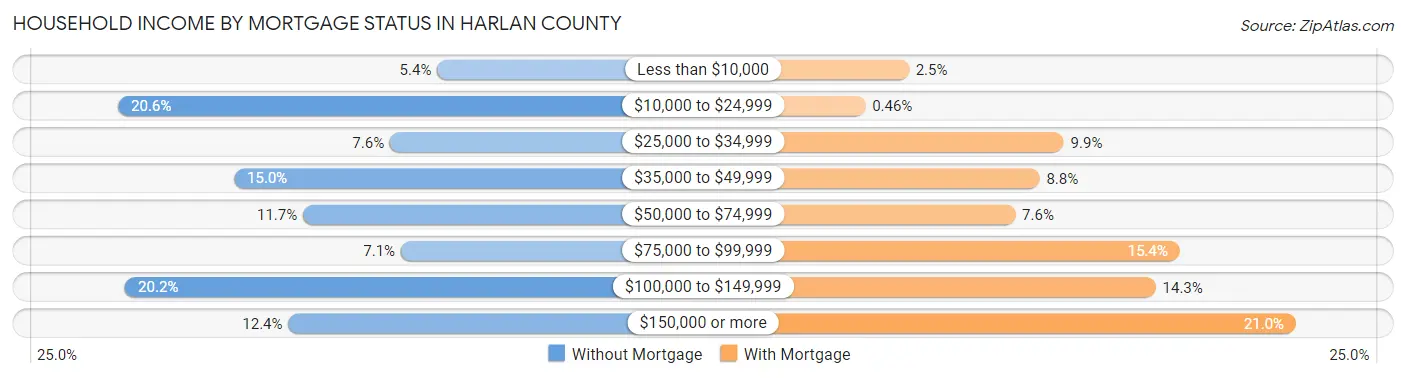
| Household Income | Without Mortgage | With Mortgage |
| Less than $10,000 | 31 (5.3%) | 11 (2.5%) |
| $10,000 to $24,999 | 119 (20.5%) | 2 (0.5%) |
| $25,000 to $34,999 | 44 (7.6%) | 43 (9.9%) |
| $35,000 to $49,999 | 87 (15.0%) | 38 (8.8%) |
| $50,000 to $74,999 | 68 (11.7%) | 33 (7.6%) |
| $75,000 to $99,999 | 41 (7.1%) | 67 (15.4%) |
| $100,000 to $149,999 | 117 (20.2%) | 62 (14.3%) |
| $150,000 or more | 72 (12.4%) | 91 (21.0%) |
| Total | 579 (100.0%) | 434 (100.0%) |
Property Value to Household Income Ratio in Harlan County
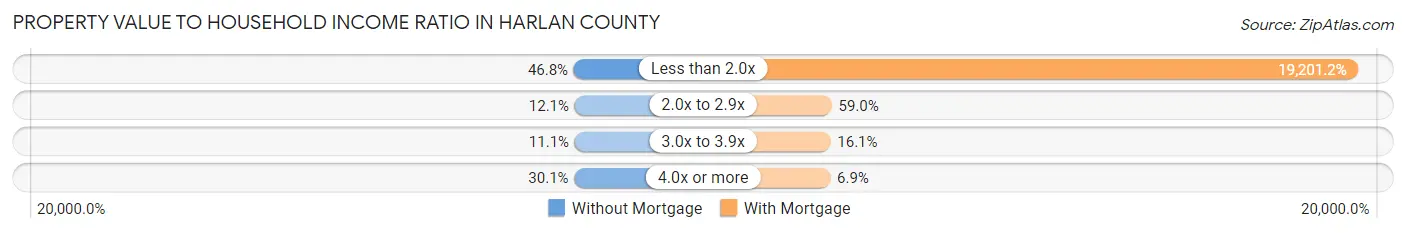
| Value-to-Income Ratio | Without Mortgage | With Mortgage |
| Less than 2.0x | 271 (46.8%) | 83,333 (19,201.2%) |
| 2.0x to 2.9x | 70 (12.1%) | 256 (59.0%) |
| 3.0x to 3.9x | 64 (11.1%) | 70 (16.1%) |
| 4.0x or more | 174 (30.0%) | 30 (6.9%) |
| Total | 579 (100.0%) | 434 (100.0%) |
Real Estate Taxes by Mortgage Status in Harlan County
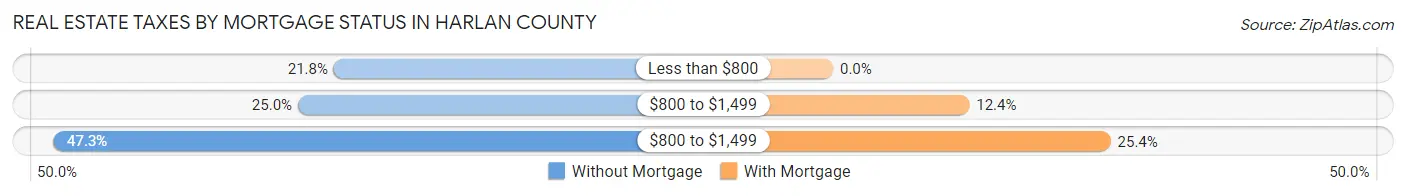
| Property Taxes | Without Mortgage | With Mortgage |
| Less than $800 | 126 (21.8%) | 0 (0.0%) |
| $800 to $1,499 | 145 (25.0%) | 54 (12.4%) |
| $800 to $1,499 | 274 (47.3%) | 110 (25.4%) |
| Total | 579 (100.0%) | 434 (100.0%) |
Health & Disability in Harlan County
Health Insurance Coverage by Age in Harlan County
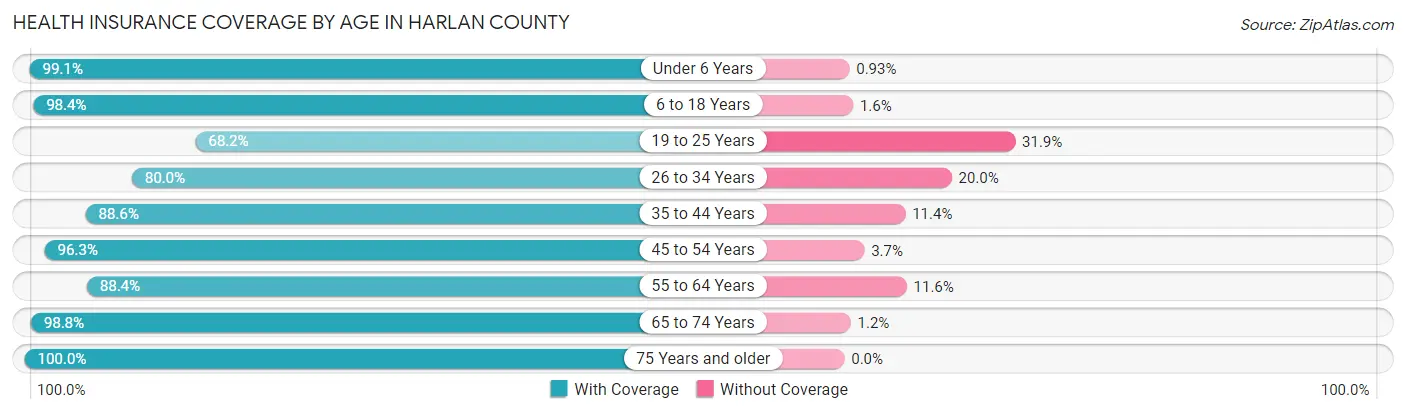
| Age Bracket | With Coverage | Without Coverage |
| Under 6 Years | 212 (99.1%) | 2 (0.9%) |
| 6 to 18 Years | 550 (98.4%) | 9 (1.6%) |
| 19 to 25 Years | 107 (68.1%) | 50 (31.9%) |
| 26 to 34 Years | 176 (80.0%) | 44 (20.0%) |
| 35 to 44 Years | 281 (88.6%) | 36 (11.4%) |
| 45 to 54 Years | 285 (96.3%) | 11 (3.7%) |
| 55 to 64 Years | 441 (88.4%) | 58 (11.6%) |
| 65 to 74 Years | 421 (98.8%) | 5 (1.2%) |
| 75 Years and older | 360 (100.0%) | 0 (0.0%) |
| Total | 2,833 (92.9%) | 215 (7.0%) |
Health Insurance Coverage by Citizenship Status in Harlan County
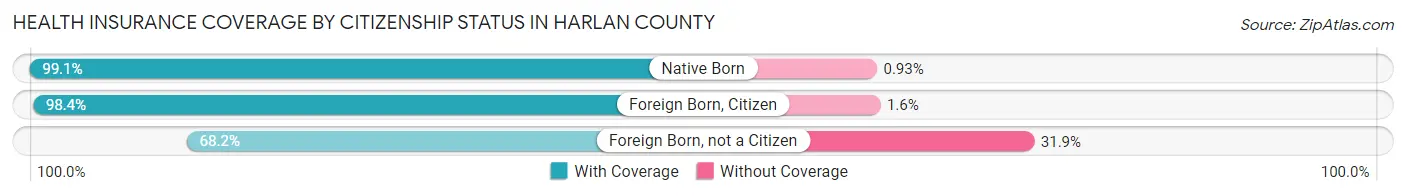
| Citizenship Status | With Coverage | Without Coverage |
| Native Born | 212 (99.1%) | 2 (0.9%) |
| Foreign Born, Citizen | 550 (98.4%) | 9 (1.6%) |
| Foreign Born, not a Citizen | 107 (68.1%) | 50 (31.9%) |
Health Insurance Coverage by Household Income in Harlan County
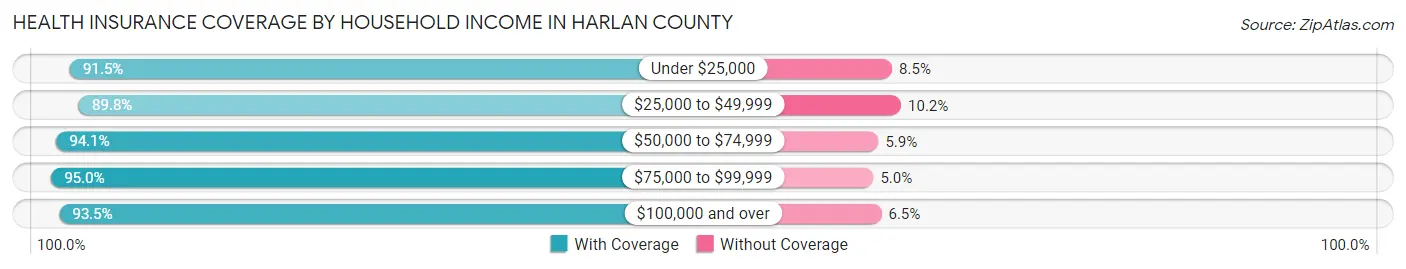
| Household Income | With Coverage | Without Coverage |
| Under $25,000 | 280 (91.5%) | 26 (8.5%) |
| $25,000 to $49,999 | 406 (89.8%) | 46 (10.2%) |
| $50,000 to $74,999 | 459 (94.1%) | 29 (5.9%) |
| $75,000 to $99,999 | 380 (95.0%) | 20 (5.0%) |
| $100,000 and over | 1,306 (93.5%) | 91 (6.5%) |
Public vs Private Health Insurance Coverage by Age in Harlan County
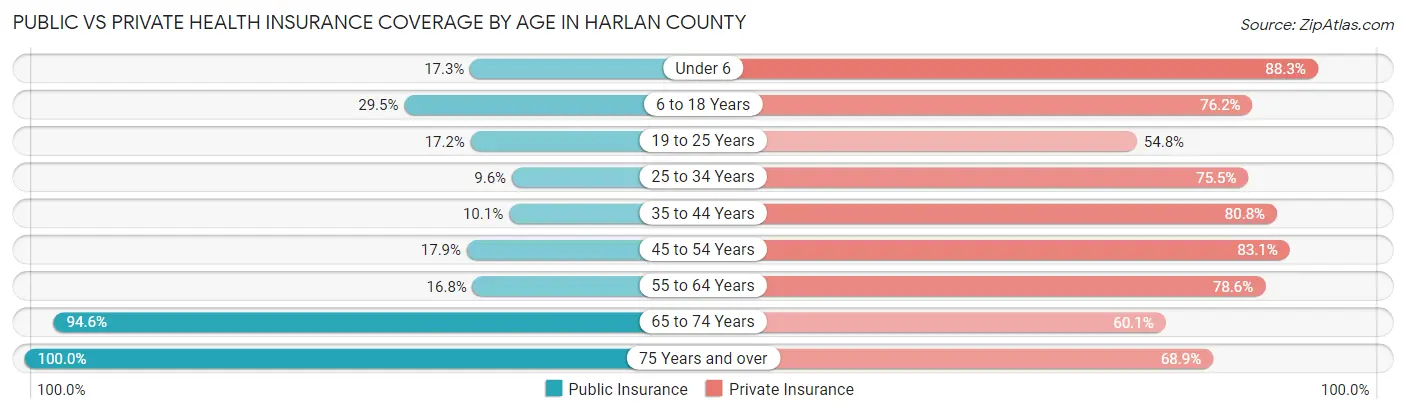
| Age Bracket | Public Insurance | Private Insurance |
| Under 6 | 37 (17.3%) | 189 (88.3%) |
| 6 to 18 Years | 165 (29.5%) | 426 (76.2%) |
| 19 to 25 Years | 27 (17.2%) | 86 (54.8%) |
| 25 to 34 Years | 21 (9.6%) | 166 (75.4%) |
| 35 to 44 Years | 32 (10.1%) | 256 (80.8%) |
| 45 to 54 Years | 53 (17.9%) | 246 (83.1%) |
| 55 to 64 Years | 84 (16.8%) | 392 (78.6%) |
| 65 to 74 Years | 403 (94.6%) | 256 (60.1%) |
| 75 Years and over | 360 (100.0%) | 248 (68.9%) |
| Total | 1,182 (38.8%) | 2,265 (74.3%) |
Disability Status by Sex by Age in Harlan County
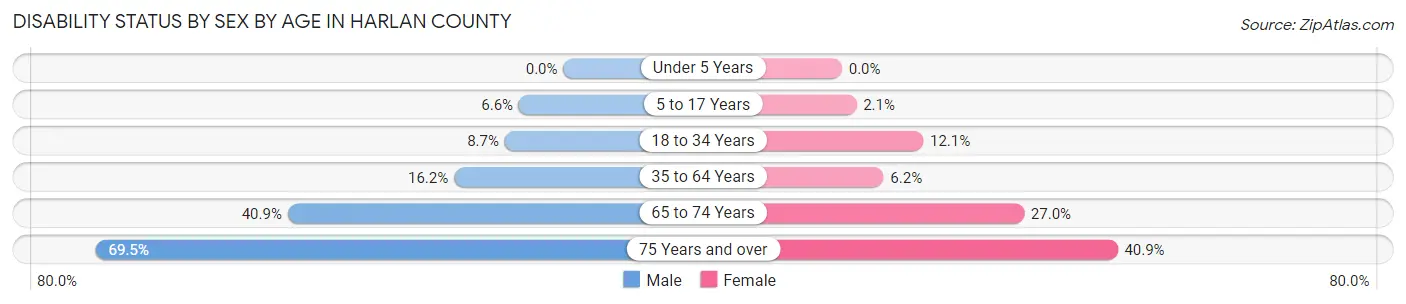
| Age Bracket | Male | Female |
| Under 5 Years | 0 (0.0%) | 0 (0.0%) |
| 5 to 17 Years | 19 (6.6%) | 5 (2.1%) |
| 18 to 34 Years | 18 (8.7%) | 28 (12.1%) |
| 35 to 64 Years | 99 (16.2%) | 31 (6.2%) |
| 65 to 74 Years | 79 (40.9%) | 63 (27.0%) |
| 75 Years and over | 116 (69.5%) | 79 (40.9%) |
Disability Class by Sex by Age in Harlan County
Disability Class: Hearing Difficulty
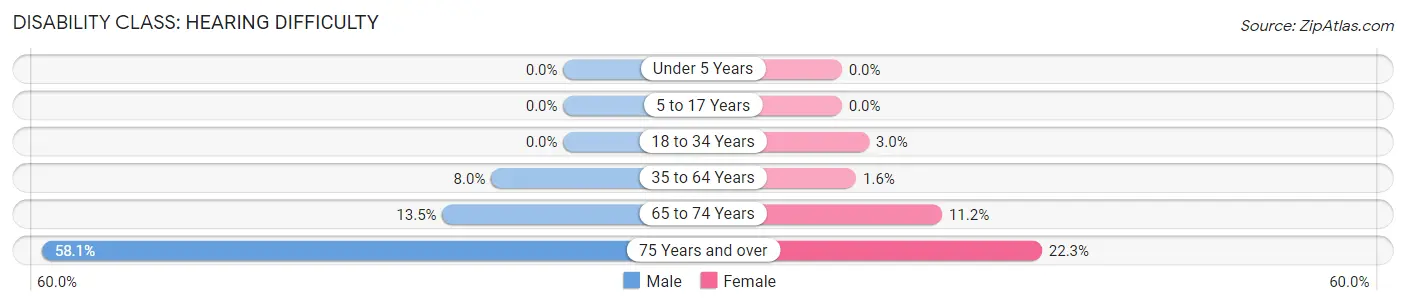
| Age Bracket | Male | Female |
| Under 5 Years | 0 (0.0%) | 0 (0.0%) |
| 5 to 17 Years | 0 (0.0%) | 0 (0.0%) |
| 18 to 34 Years | 0 (0.0%) | 7 (3.0%) |
| 35 to 64 Years | 49 (8.0%) | 8 (1.6%) |
| 65 to 74 Years | 26 (13.5%) | 26 (11.2%) |
| 75 Years and over | 97 (58.1%) | 43 (22.3%) |
Disability Class: Vision Difficulty
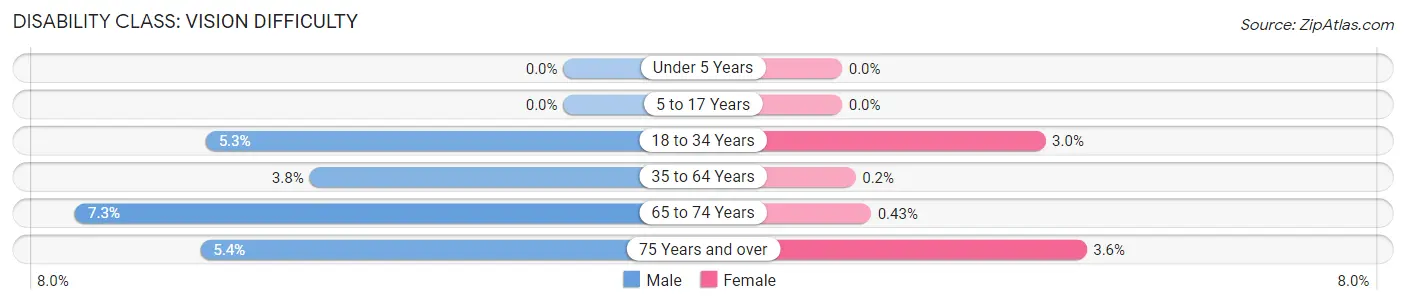
| Age Bracket | Male | Female |
| Under 5 Years | 0 (0.0%) | 0 (0.0%) |
| 5 to 17 Years | 0 (0.0%) | 0 (0.0%) |
| 18 to 34 Years | 11 (5.3%) | 7 (3.0%) |
| 35 to 64 Years | 23 (3.8%) | 1 (0.2%) |
| 65 to 74 Years | 14 (7.2%) | 1 (0.4%) |
| 75 Years and over | 9 (5.4%) | 7 (3.6%) |
Disability Class: Cognitive Difficulty
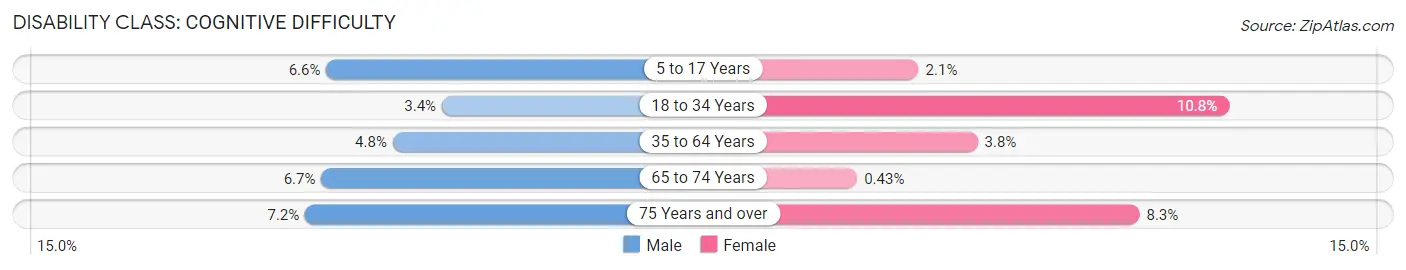
| Age Bracket | Male | Female |
| 5 to 17 Years | 19 (6.6%) | 5 (2.1%) |
| 18 to 34 Years | 7 (3.4%) | 25 (10.8%) |
| 35 to 64 Years | 29 (4.8%) | 19 (3.8%) |
| 65 to 74 Years | 13 (6.7%) | 1 (0.4%) |
| 75 Years and over | 12 (7.2%) | 16 (8.3%) |
Disability Class: Ambulatory Difficulty
| Age Bracket | Male | Female |
| 5 to 17 Years | 0 (0.0%) | 5 (2.1%) |
| 18 to 34 Years | 0 (0.0%) | 0 (0.0%) |
| 35 to 64 Years | 42 (6.9%) | 26 (5.2%) |
| 65 to 74 Years | 49 (25.4%) | 36 (15.4%) |
| 75 Years and over | 54 (32.3%) | 54 (28.0%) |
Disability Class: Self-Care Difficulty
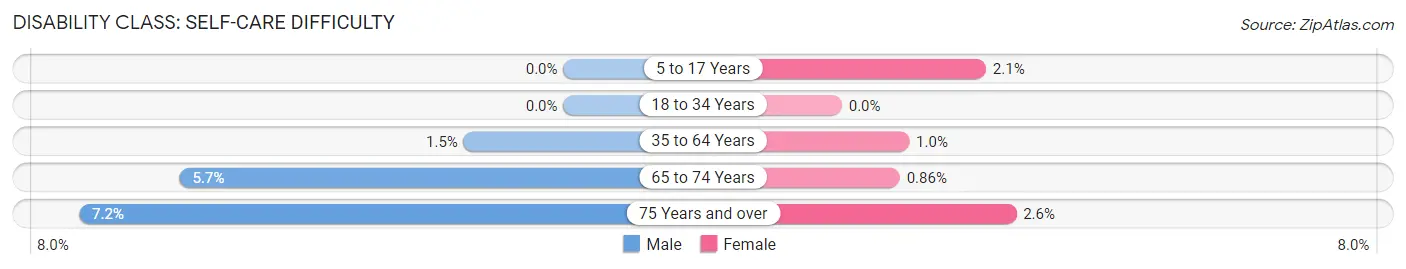
| Age Bracket | Male | Female |
| 5 to 17 Years | 0 (0.0%) | 5 (2.1%) |
| 18 to 34 Years | 0 (0.0%) | 0 (0.0%) |
| 35 to 64 Years | 9 (1.5%) | 5 (1.0%) |
| 65 to 74 Years | 11 (5.7%) | 2 (0.9%) |
| 75 Years and over | 12 (7.2%) | 5 (2.6%) |
Technology Access in Harlan County
Computing Device Access in Harlan County
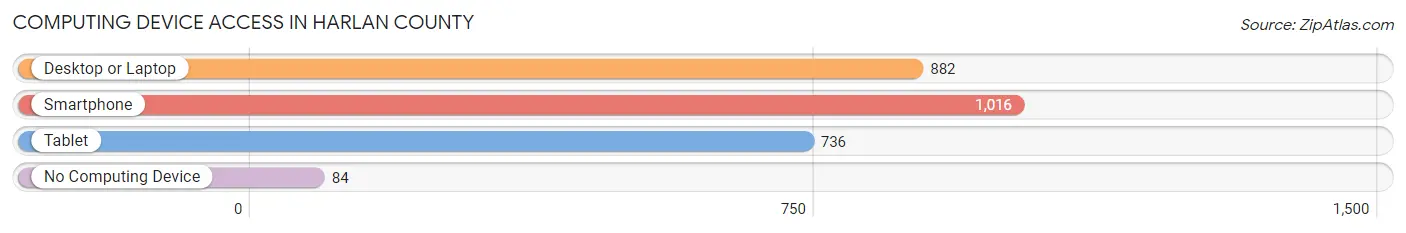
| Device Type | # Households | % Households |
| Desktop or Laptop | 882 | 72.2% |
| Smartphone | 1,016 | 83.2% |
| Tablet | 736 | 60.3% |
| No Computing Device | 84 | 6.9% |
| Total | 1,221 | 100.0% |
Internet Access in Harlan County
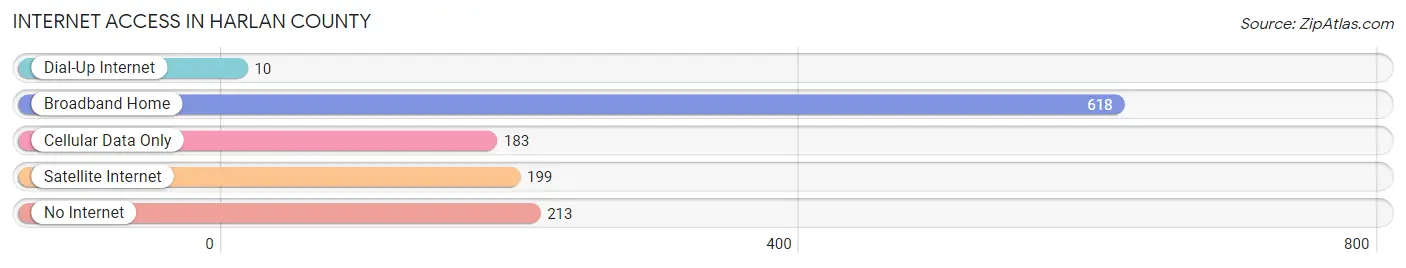
| Internet Type | # Households | % Households |
| Dial-Up Internet | 10 | 0.8% |
| Broadband Home | 618 | 50.6% |
| Cellular Data Only | 183 | 15.0% |
| Satellite Internet | 199 | 16.3% |
| No Internet | 213 | 17.4% |
| Total | 1,221 | 100.0% |
Harlan County Summary
Harlan County is located in the south-central region of Nebraska, and is part of the Sandhills region. It is bordered by Franklin County to the north, Kearney County to the east, Phelps County to the south, and Hayes and Frontier Counties to the west. The county seat is Alma, and the county was named after James Harlan, a U.S. Senator from Iowa.
Geography
Harlan County covers an area of 845 square miles, and is mostly flat, with some rolling hills. The county is located in the High Plains region of the Great Plains, and is part of the Sandhills region. The county is drained by the Republican River, which flows through the county from north to south. The county is mostly covered in grasslands, with some cropland and woodlands. The county is home to several wildlife refuges, including the Harlan County Wildlife Refuge, which is located in the northern part of the county.
Demographics
As of the 2010 census, the population of Harlan County was 3,541, with a population density of 4.2 people per square mile. The racial makeup of the county was 97.3% White, 0.3% African American, 0.3% Native American, 0.2% Asian, 0.1% Pacific Islander, 0.7% from other races, and 1.1% from two or more races. Hispanic or Latino of any race were 2.2% of the population.
The median income for a household in the county was $41,944, and the median income for a family was $50,938. The per capita income for the county was $20,845. About 8.7% of families and 11.2% of the population were below the poverty line, including 14.2% of those under age 18 and 8.2% of those age 65 or over.
Economy
Harlan County is primarily an agricultural county, with the majority of the population employed in farming and ranching. The county is home to several large farms, including the Harlan County Farms, which is one of the largest farms in the state. The county is also home to several small businesses, including a few restaurants, a grocery store, and a few gas stations.
The county is also home to several manufacturing companies, including the Harlan County Manufacturing Company, which produces agricultural equipment. The county is also home to several wind farms, which provide renewable energy to the area.
Conclusion
Harlan County is a rural county located in the south-central region of Nebraska. The county is mostly flat, with some rolling hills, and is part of the Sandhills region. The county is primarily agricultural, with the majority of the population employed in farming and ranching. The county is also home to several manufacturing companies, and several wind farms, which provide renewable energy to the area. The population of the county is 3,541, with a median income of $41,944.
Common Questions
What is Per Capita Income in Harlan County?
Per Capita income in Harlan County is $38,129.
What is the Median Family Income in Harlan County?
Median Family Income in Harlan County is $89,653.
What is the Median Household income in Harlan County?
Median Household Income in Harlan County is $64,583.
What is Income or Wage Gap in Harlan County?
Income or Wage Gap in Harlan County is 34.2%.
Women in Harlan County earn 65.8 cents for every dollar earned by a man.
What is Inequality or Gini Index in Harlan County?
Inequality or Gini Index in Harlan County is 0.48.
What is the Total Population of Harlan County?
Total Population of Harlan County is 3,094.
What is the Total Male Population of Harlan County?
Total Male Population of Harlan County is 1,590.
What is the Total Female Population of Harlan County?
Total Female Population of Harlan County is 1,504.
What is the Ratio of Males per 100 Females in Harlan County?
There are 105.72 Males per 100 Females in Harlan County.
What is the Ratio of Females per 100 Males in Harlan County?
There are 94.59 Females per 100 Males in Harlan County.
What is the Median Population Age in Harlan County?
Median Population Age in Harlan County is 47.5 Years.
What is the Average Family Size in Harlan County
Average Family Size in Harlan County is 3.3 People.
What is the Average Household Size in Harlan County
Average Household Size in Harlan County is 2.5 People.
How Large is the Labor Force in Harlan County?
There are 1,518 People in the Labor Forcein in Harlan County.
What is the Percentage of People in the Labor Force in Harlan County?
62.1% of People are in the Labor Force in Harlan County.
What is the Unemployment Rate in Harlan County?
Unemployment Rate in Harlan County is 2.0%.