Greeley County, NE Map & Demographics
Greeley County Map
Greeley County Overview
$28,736
PER CAPITA INCOME
$76,500
AVG FAMILY INCOME
$52,813
AVG HOUSEHOLD INCOME
29.7%
WAGE / INCOME GAP [ % ]
70.3¢/ $1
WAGE / INCOME GAP [ $ ]
$13,052
FAMILY INCOME DEFICIT
0.41
INEQUALITY / GINI INDEX
2,212
TOTAL POPULATION
1,134
MALE POPULATION
1,078
FEMALE POPULATION
105.19
MALES / 100 FEMALES
95.06
FEMALES / 100 MALES
43.6
MEDIAN AGE
3.1
AVG FAMILY SIZE
2.4
AVG HOUSEHOLD SIZE
1,009
LABOR FORCE [ PEOPLE ]
57.8%
PERCENT IN LABOR FORCE
1.8%
UNEMPLOYMENT RATE
Greeley County Area Codes
Income in Greeley County
Income Overview in Greeley County
Per Capita Income in Greeley County is $28,736, while median incomes of families and households are $76,500 and $52,813 respectively.
| Characteristic | Number | Measure |
| Per Capita Income | 2,212 | $28,736 |
| Median Family Income | 580 | $76,500 |
| Mean Family Income | 580 | $83,737 |
| Median Household Income | 907 | $52,813 |
| Mean Household Income | 907 | $68,001 |
| Income Deficit | 580 | $13,052 |
| Wage / Income Gap (%) | 2,212 | 29.74% |
| Wage / Income Gap ($) | 2,212 | 70.26¢ per $1 |
| Gini / Inequality Index | 2,212 | 0.41 |
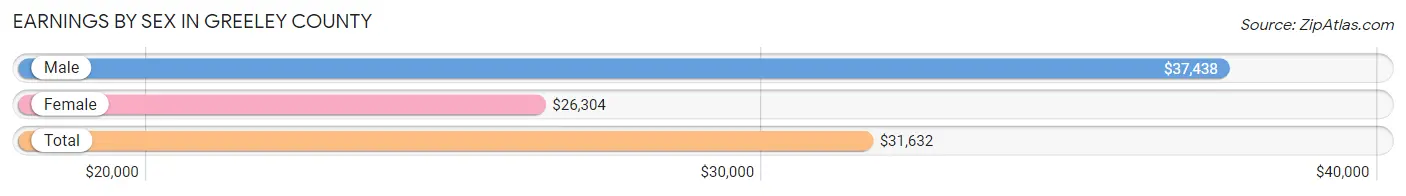
Earnings by Sex in Greeley County
Average Earnings in Greeley County are $31,632, $37,438 for men and $26,304 for women, a difference of 29.7%.
| Sex | Number | Average Earnings |
| Male | 641 (57.2%) | $37,438 |
| Female | 480 (42.8%) | $26,304 |
| Total | 1,121 (100.0%) | $31,632 |
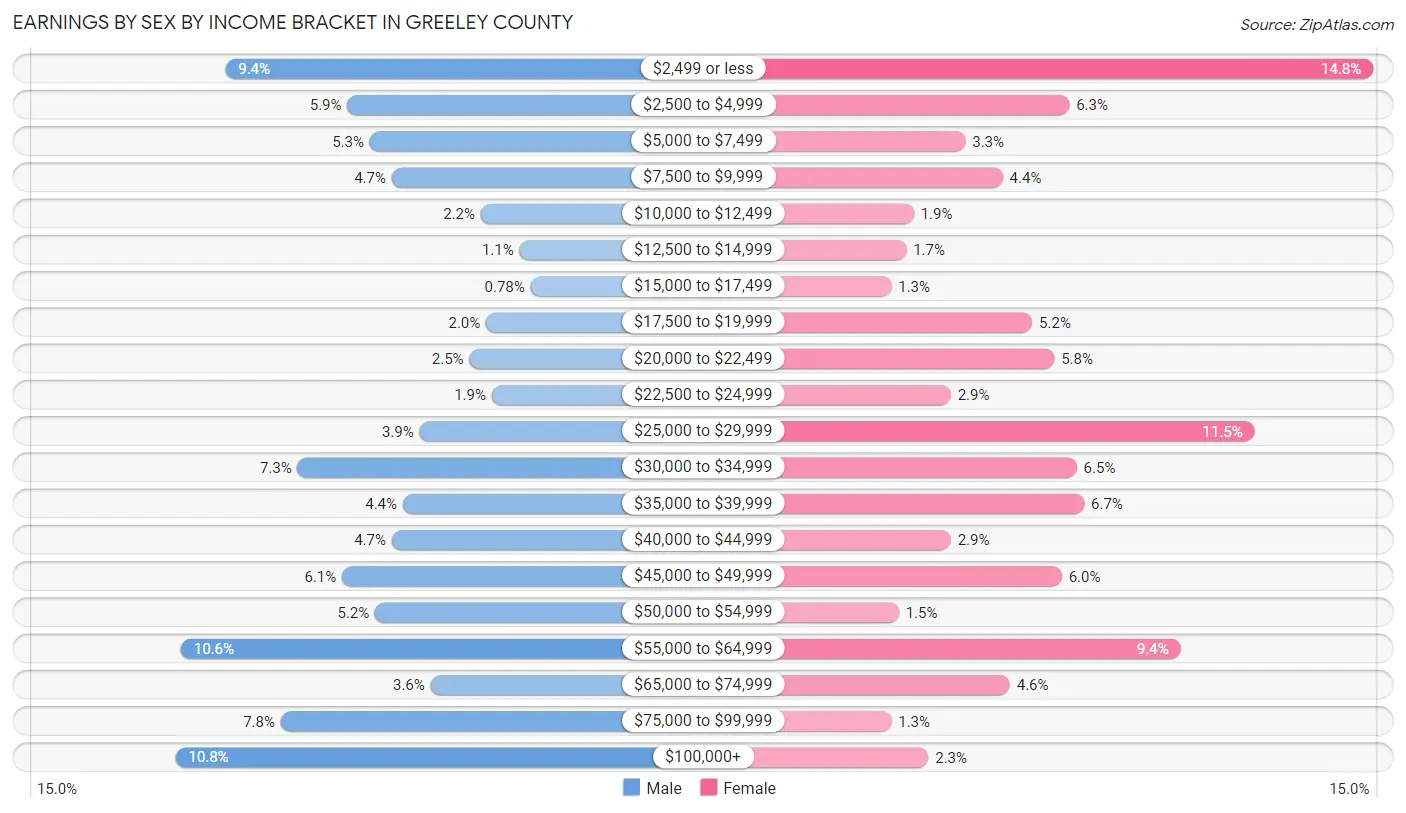
Earnings by Sex by Income Bracket in Greeley County
The most common earnings brackets in Greeley County are $100,000+ for men (69 | 10.8%) and $2,499 or less for women (71 | 14.8%).
| Income | Male | Female |
| $2,499 or less | 60 (9.4%) | 71 (14.8%) |
| $2,500 to $4,999 | 38 (5.9%) | 30 (6.2%) |
| $5,000 to $7,499 | 34 (5.3%) | 16 (3.3%) |
| $7,500 to $9,999 | 30 (4.7%) | 21 (4.4%) |
| $10,000 to $12,499 | 14 (2.2%) | 9 (1.9%) |
| $12,500 to $14,999 | 7 (1.1%) | 8 (1.7%) |
| $15,000 to $17,499 | 5 (0.8%) | 6 (1.3%) |
| $17,500 to $19,999 | 13 (2.0%) | 25 (5.2%) |
| $20,000 to $22,499 | 16 (2.5%) | 28 (5.8%) |
| $22,500 to $24,999 | 12 (1.9%) | 14 (2.9%) |
| $25,000 to $29,999 | 25 (3.9%) | 55 (11.5%) |
| $30,000 to $34,999 | 47 (7.3%) | 31 (6.5%) |
| $35,000 to $39,999 | 28 (4.4%) | 32 (6.7%) |
| $40,000 to $44,999 | 30 (4.7%) | 14 (2.9%) |
| $45,000 to $49,999 | 39 (6.1%) | 29 (6.0%) |
| $50,000 to $54,999 | 33 (5.1%) | 7 (1.5%) |
| $55,000 to $64,999 | 68 (10.6%) | 45 (9.4%) |
| $65,000 to $74,999 | 23 (3.6%) | 22 (4.6%) |
| $75,000 to $99,999 | 50 (7.8%) | 6 (1.3%) |
| $100,000+ | 69 (10.8%) | 11 (2.3%) |
| Total | 641 (100.0%) | 480 (100.0%) |
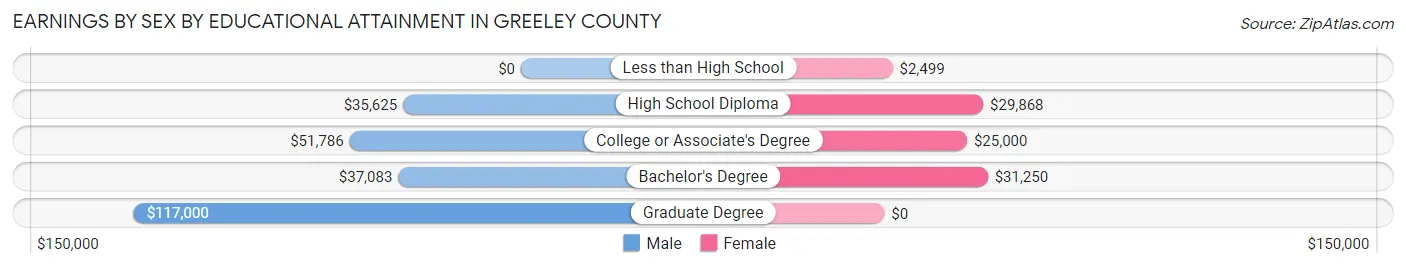
Earnings by Sex by Educational Attainment in Greeley County
Average earnings in Greeley County are $45,735 for men and $28,828 for women, a difference of 37.0%. Men with an educational attainment of graduate degree enjoy the highest average annual earnings of $117,000, while those with high school diploma education earn the least with $35,625. Women with an educational attainment of bachelor's degree earn the most with the average annual earnings of $31,250, while those with less than high school education have the smallest earnings of $2,499.
| Educational Attainment | Male Income | Female Income |
| Less than High School | - | - |
| High School Diploma | $35,625 | $29,868 |
| College or Associate's Degree | $51,786 | $25,000 |
| Bachelor's Degree | $37,083 | $31,250 |
| Graduate Degree | $117,000 | $0 |
| Total | $45,735 | $28,828 |
Family Income in Greeley County
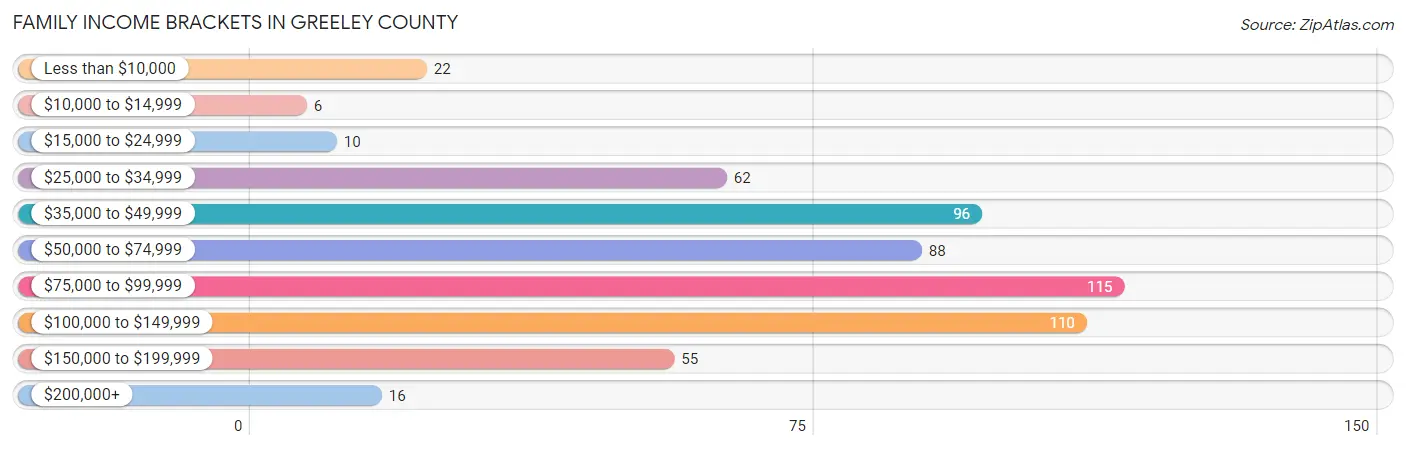
Family Income Brackets in Greeley County
According to the Greeley County family income data, there are 115 families falling into the $75,000 to $99,999 income range, which is the most common income bracket and makes up 19.8% of all families. Conversely, the $10,000 to $14,999 income bracket is the least frequent group with only 6 families (1.0%) belonging to this category.
| Income Bracket | # Families | % Families |
| Less than $10,000 | 22 | 3.8% |
| $10,000 to $14,999 | 6 | 1.0% |
| $15,000 to $24,999 | 10 | 1.7% |
| $25,000 to $34,999 | 62 | 10.7% |
| $35,000 to $49,999 | 96 | 16.6% |
| $50,000 to $74,999 | 88 | 15.2% |
| $75,000 to $99,999 | 115 | 19.8% |
| $100,000 to $149,999 | 110 | 19.0% |
| $150,000 to $199,999 | 55 | 9.5% |
| $200,000+ | 16 | 2.8% |
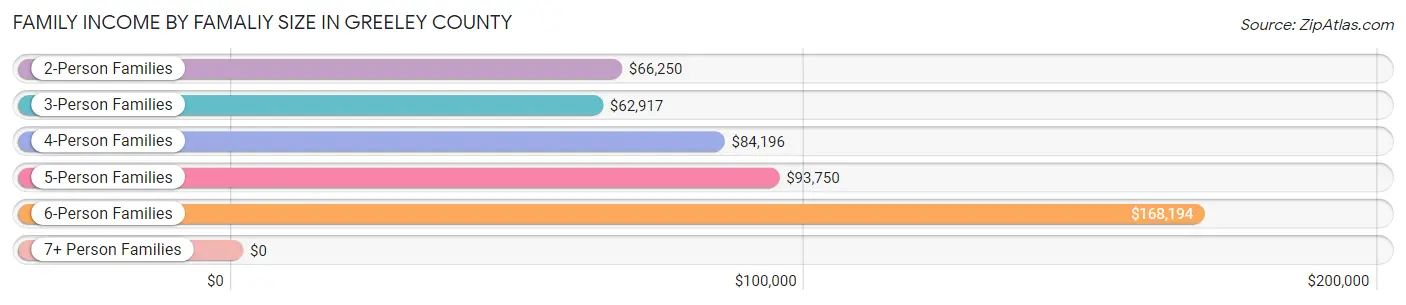
Family Income by Famaliy Size in Greeley County
6-person families (13 | 2.2%) account for the highest median family income in Greeley County with $168,194 per family, while 2-person families (347 | 59.8%) have the highest median income of $33,125 per family member.
| Income Bracket | # Families | Median Income |
| 2-Person Families | 347 (59.8%) | $66,250 |
| 3-Person Families | 83 (14.3%) | $62,917 |
| 4-Person Families | 75 (12.9%) | $84,196 |
| 5-Person Families | 52 (9.0%) | $93,750 |
| 6-Person Families | 13 (2.2%) | $168,194 |
| 7+ Person Families | 10 (1.7%) | $0 |
| Total | 580 (100.0%) | $76,500 |
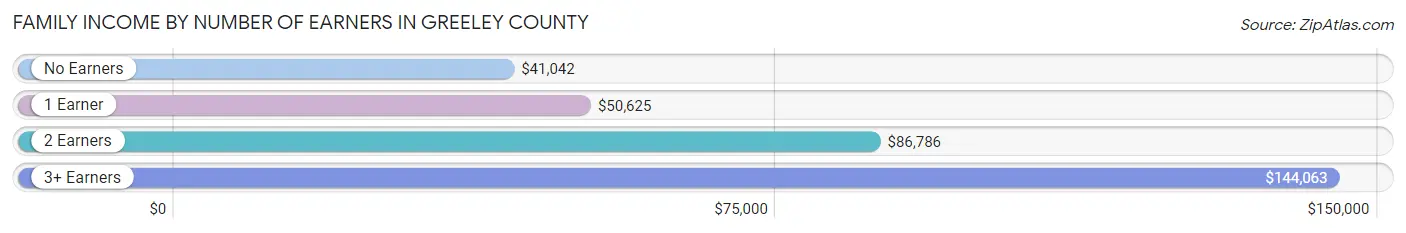
Family Income by Number of Earners in Greeley County
The median family income in Greeley County is $76,500, with families comprising 3+ earners (43) having the highest median family income of $144,063, while families with no earners (111) have the lowest median family income of $41,042, accounting for 7.4% and 19.1% of families, respectively.
| Number of Earners | # Families | Median Income |
| No Earners | 111 (19.1%) | $41,042 |
| 1 Earner | 158 (27.2%) | $50,625 |
| 2 Earners | 268 (46.2%) | $86,786 |
| 3+ Earners | 43 (7.4%) | $144,063 |
| Total | 580 (100.0%) | $76,500 |
Household Income in Greeley County
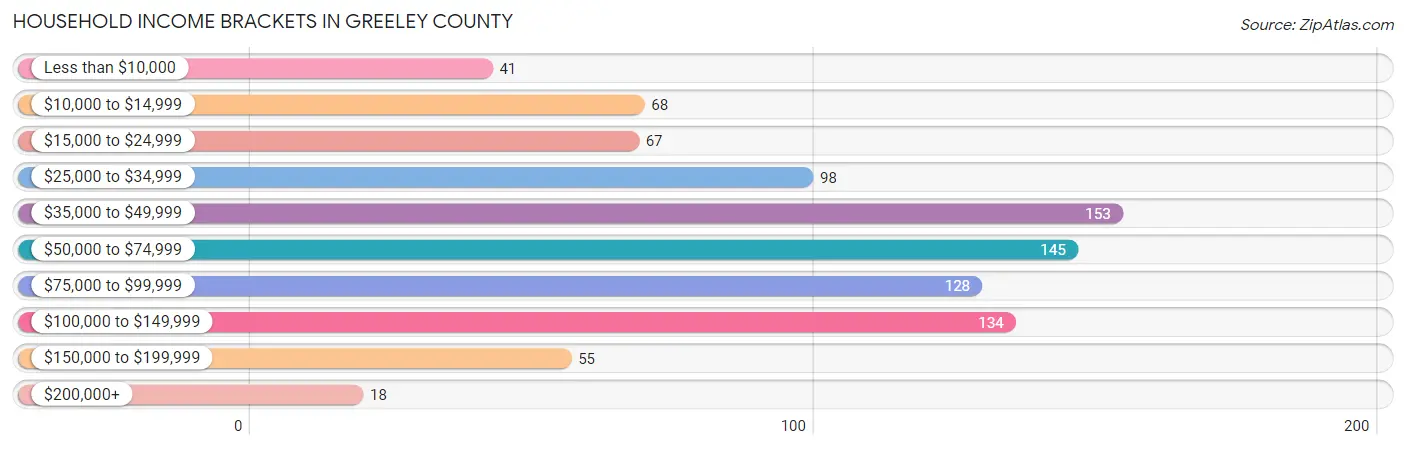
Household Income Brackets in Greeley County
With 153 households falling in the category, the $35,000 to $49,999 income range is the most frequent in Greeley County, accounting for 16.9% of all households. In contrast, only 18 households (2.0%) fall into the $200,000+ income bracket, making it the least populous group.
| Income Bracket | # Households | % Households |
| Less than $10,000 | 41 | 4.5% |
| $10,000 to $14,999 | 68 | 7.5% |
| $15,000 to $24,999 | 67 | 7.4% |
| $25,000 to $34,999 | 98 | 10.8% |
| $35,000 to $49,999 | 153 | 16.9% |
| $50,000 to $74,999 | 145 | 16.0% |
| $75,000 to $99,999 | 128 | 14.1% |
| $100,000 to $149,999 | 134 | 14.8% |
| $150,000 to $199,999 | 55 | 6.1% |
| $200,000+ | 18 | 2.0% |
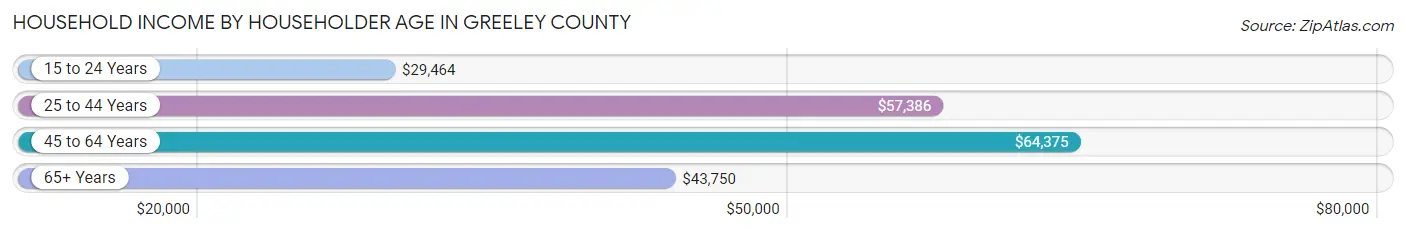
Household Income by Householder Age in Greeley County
The median household income in Greeley County is $52,813, with the highest median household income of $64,375 found in the 45 to 64 years age bracket for the primary householder. A total of 294 households (32.4%) fall into this category. Meanwhile, the 15 to 24 years age bracket for the primary householder has the lowest median household income of $29,464, with 37 households (4.1%) in this group.
| Income Bracket | # Households | Median Income |
| 15 to 24 Years | 37 (4.1%) | $29,464 |
| 25 to 44 Years | 215 (23.7%) | $57,386 |
| 45 to 64 Years | 294 (32.4%) | $64,375 |
| 65+ Years | 361 (39.8%) | $43,750 |
| Total | 907 (100.0%) | $52,813 |
Poverty in Greeley County
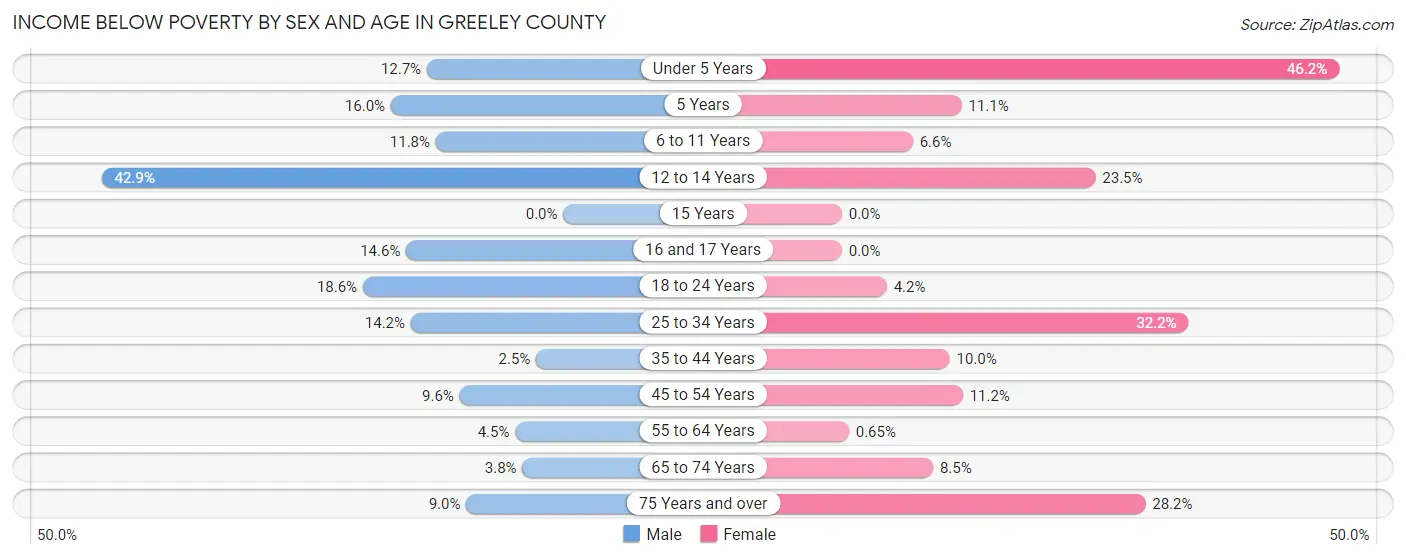
Income Below Poverty by Sex and Age in Greeley County
With 9.7% poverty level for males and 15.3% for females among the residents of Greeley County, 12 to 14 year old males and under 5 year old females are the most vulnerable to poverty, with 9 males (42.9%) and 30 females (46.2%) in their respective age groups living below the poverty level.
| Age Bracket | Male | Female |
| Under 5 Years | 10 (12.7%) | 30 (46.2%) |
| 5 Years | 4 (16.0%) | 2 (11.1%) |
| 6 to 11 Years | 11 (11.8%) | 5 (6.6%) |
| 12 to 14 Years | 9 (42.9%) | 12 (23.5%) |
| 15 Years | 0 (0.0%) | 0 (0.0%) |
| 16 and 17 Years | 7 (14.6%) | 0 (0.0%) |
| 18 to 24 Years | 16 (18.6%) | 3 (4.2%) |
| 25 to 34 Years | 15 (14.1%) | 37 (32.2%) |
| 35 to 44 Years | 3 (2.5%) | 11 (10.0%) |
| 45 to 54 Years | 10 (9.6%) | 11 (11.2%) |
| 55 to 64 Years | 7 (4.5%) | 1 (0.6%) |
| 65 to 74 Years | 6 (3.8%) | 11 (8.5%) |
| 75 Years and over | 10 (9.0%) | 40 (28.2%) |
| Total | 108 (9.7%) | 163 (15.3%) |
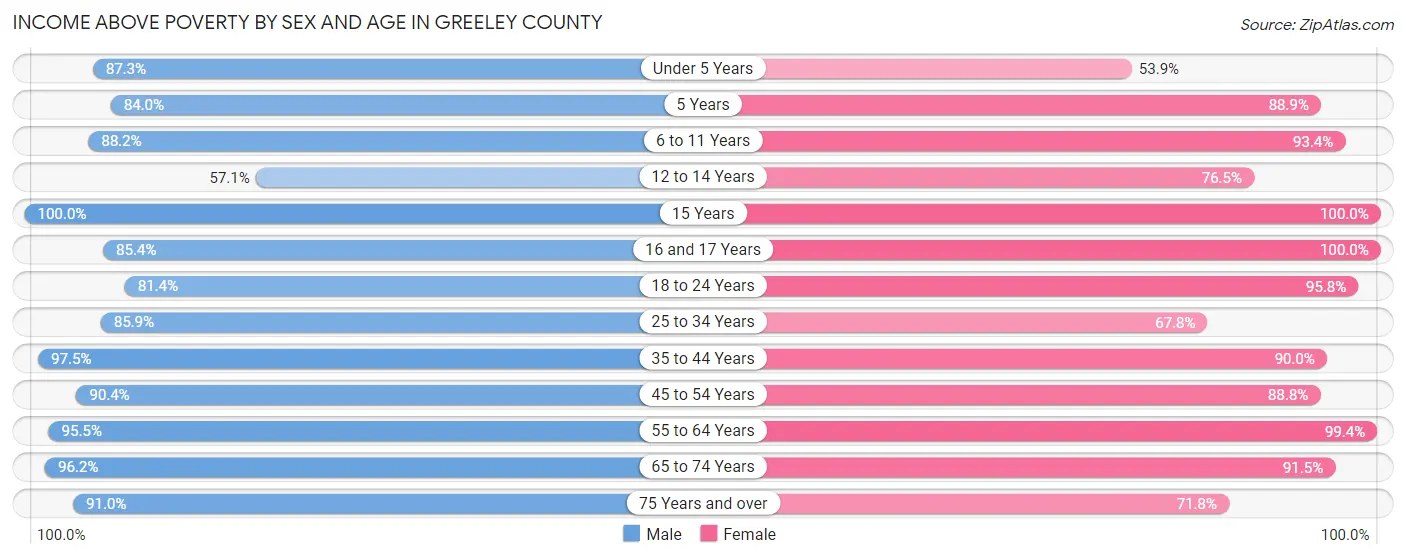
Income Above Poverty by Sex and Age in Greeley County
According to the poverty statistics in Greeley County, males aged 15 years and females aged 15 years are the age groups that are most secure financially, with 100.0% of males and 100.0% of females in these age groups living above the poverty line.
| Age Bracket | Male | Female |
| Under 5 Years | 69 (87.3%) | 35 (53.8%) |
| 5 Years | 21 (84.0%) | 16 (88.9%) |
| 6 to 11 Years | 82 (88.2%) | 71 (93.4%) |
| 12 to 14 Years | 12 (57.1%) | 39 (76.5%) |
| 15 Years | 4 (100.0%) | 26 (100.0%) |
| 16 and 17 Years | 41 (85.4%) | 5 (100.0%) |
| 18 to 24 Years | 70 (81.4%) | 69 (95.8%) |
| 25 to 34 Years | 91 (85.9%) | 78 (67.8%) |
| 35 to 44 Years | 116 (97.5%) | 99 (90.0%) |
| 45 to 54 Years | 94 (90.4%) | 87 (88.8%) |
| 55 to 64 Years | 150 (95.5%) | 153 (99.4%) |
| 65 to 74 Years | 152 (96.2%) | 119 (91.5%) |
| 75 Years and over | 101 (91.0%) | 102 (71.8%) |
| Total | 1,003 (90.3%) | 899 (84.7%) |
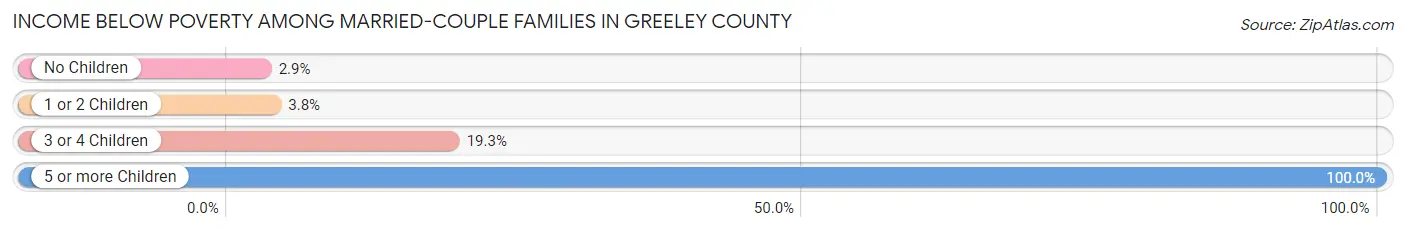
Income Below Poverty Among Married-Couple Families in Greeley County
The poverty statistics for married-couple families in Greeley County show that 5.7% or 27 of the total 473 families live below the poverty line. Families with 5 or more children have the highest poverty rate of 100.0%, comprising of 3 families. On the other hand, families with no children have the lowest poverty rate of 2.9%, which includes 9 families.
| Children | Above Poverty | Below Poverty |
| No Children | 298 (97.1%) | 9 (2.9%) |
| 1 or 2 Children | 102 (96.2%) | 4 (3.8%) |
| 3 or 4 Children | 46 (80.7%) | 11 (19.3%) |
| 5 or more Children | 0 (0.0%) | 3 (100.0%) |
| Total | 446 (94.3%) | 27 (5.7%) |
Income Below Poverty Among Single-Parent Households in Greeley County
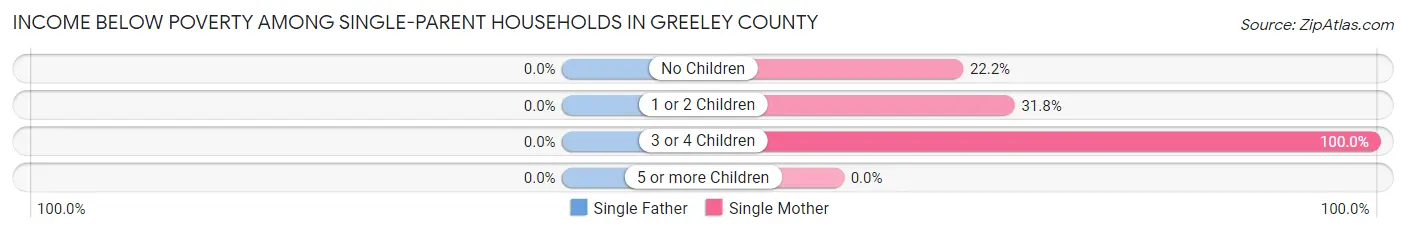
| Children | Single Father | Single Mother |
| No Children | 0 (0.0%) | 6 (22.2%) |
| 1 or 2 Children | 0 (0.0%) | 7 (31.8%) |
| 3 or 4 Children | 0 (0.0%) | 6 (100.0%) |
| 5 or more Children | 0 (0.0%) | 0 (0.0%) |
| Total | 0 (0.0%) | 19 (34.5%) |
Income Below Poverty Among Married-Couple vs Single-Parent Households in Greeley County
The poverty data for Greeley County shows that 27 of the married-couple family households (5.7%) and 19 of the single-parent households (17.8%) are living below the poverty level. Within the married-couple family households, those with 5 or more children have the highest poverty rate, with 3 households (100.0%) falling below the poverty line. Among the single-parent households, those with 3 or 4 children have the highest poverty rate, with 6 household (50.0%) living below poverty.
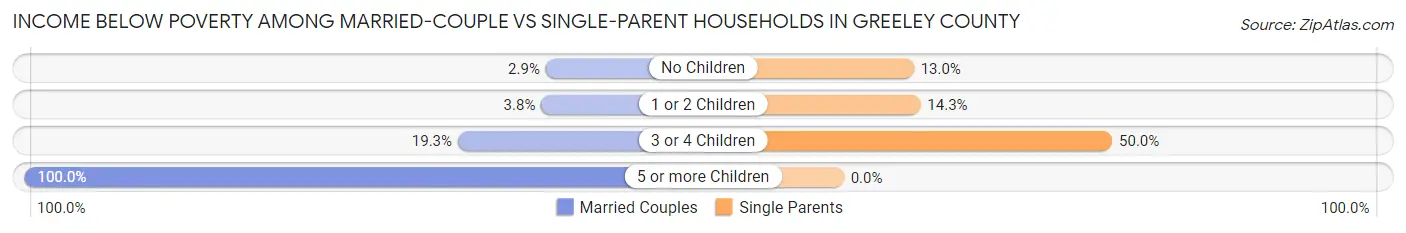
| Children | Married-Couple Families | Single-Parent Households |
| No Children | 9 (2.9%) | 6 (13.0%) |
| 1 or 2 Children | 4 (3.8%) | 7 (14.3%) |
| 3 or 4 Children | 11 (19.3%) | 6 (50.0%) |
| 5 or more Children | 3 (100.0%) | 0 (0.0%) |
| Total | 27 (5.7%) | 19 (17.8%) |
Race in Greeley County
The most populous races in Greeley County are White / Caucasian (2,106 | 95.2%), Hispanic or Latino (46 | 2.1%), and Some other Race (46 | 2.1%).
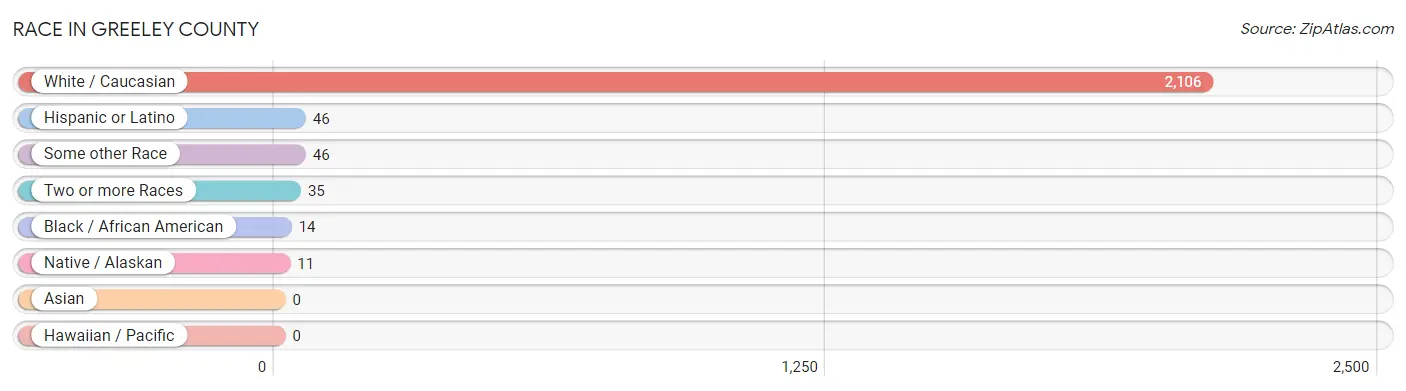
| Race | # Population | % Population |
| Asian | 0 | 0.0% |
| Black / African American | 14 | 0.6% |
| Hawaiian / Pacific | 0 | 0.0% |
| Hispanic or Latino | 46 | 2.1% |
| Native / Alaskan | 11 | 0.5% |
| White / Caucasian | 2,106 | 95.2% |
| Two or more Races | 35 | 1.6% |
| Some other Race | 46 | 2.1% |
| Total | 2,212 | 100.0% |
Ancestry in Greeley County
The most populous ancestries reported in Greeley County are German (866 | 39.2%), Irish (539 | 24.4%), English (218 | 9.9%), Polish (98 | 4.4%), and Czech (76 | 3.4%), together accounting for 81.2% of all Greeley County residents.
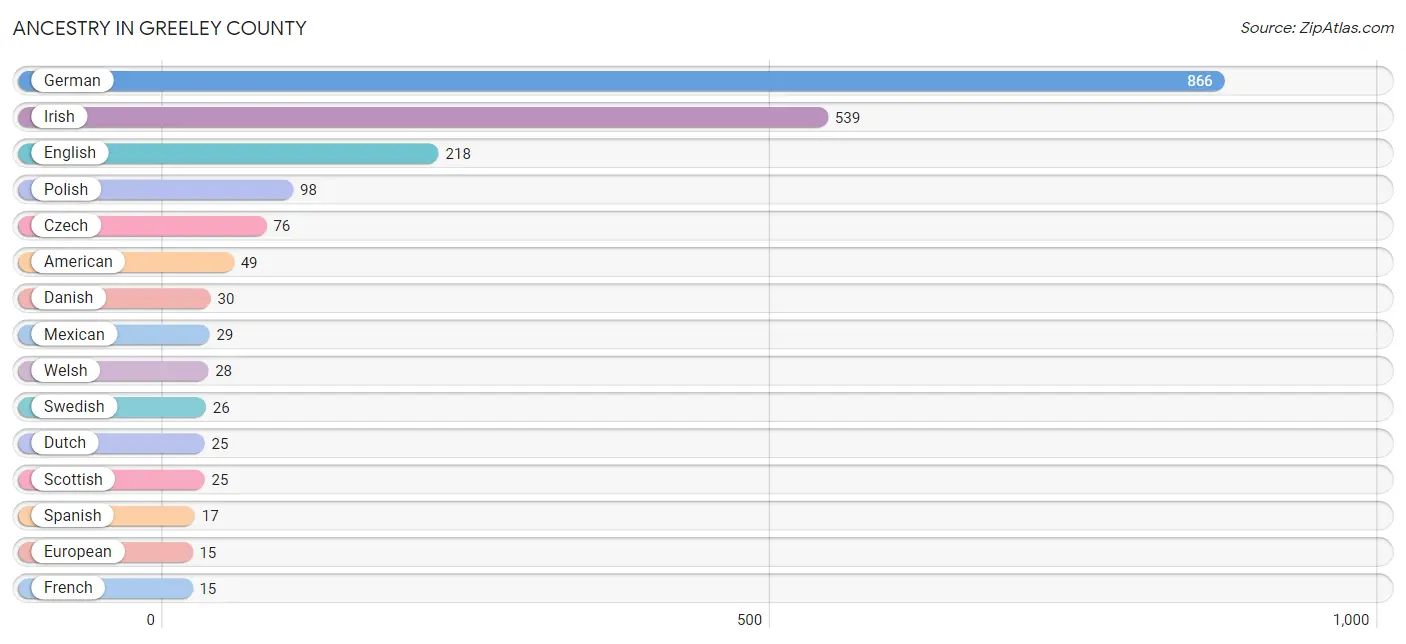
| Ancestry | # Population | % Population |
| American | 49 | 2.2% |
| Apache | 10 | 0.4% |
| Choctaw | 7 | 0.3% |
| Croatian | 2 | 0.1% |
| Czech | 76 | 3.4% |
| Czechoslovakian | 1 | 0.1% |
| Danish | 30 | 1.4% |
| Dutch | 25 | 1.1% |
| English | 218 | 9.9% |
| European | 15 | 0.7% |
| French | 15 | 0.7% |
| French Canadian | 7 | 0.3% |
| German | 866 | 39.2% |
| Hungarian | 2 | 0.1% |
| Inupiat | 7 | 0.3% |
| Irish | 539 | 24.4% |
| Italian | 12 | 0.5% |
| Mexican | 29 | 1.3% |
| Norwegian | 2 | 0.1% |
| Polish | 98 | 4.4% |
| Potawatomi | 5 | 0.2% |
| Scandinavian | 3 | 0.1% |
| Scotch-Irish | 1 | 0.1% |
| Scottish | 25 | 1.1% |
| Spanish | 17 | 0.8% |
| Swedish | 26 | 1.2% |
| Welsh | 28 | 1.3% | View All 27 Rows |
Immigrants in Greeley County
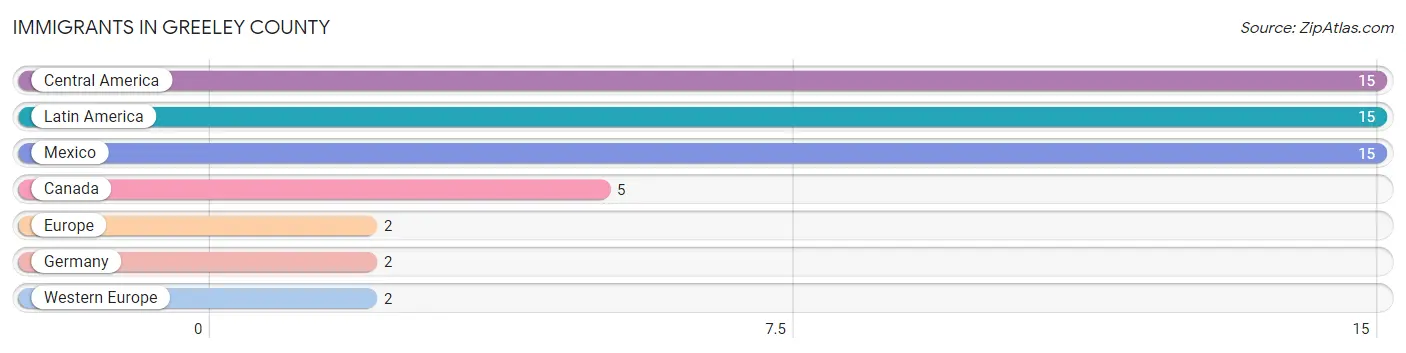
The most numerous immigrant groups reported in Greeley County came from Central America (15 | 0.7%), Latin America (15 | 0.7%), Mexico (15 | 0.7%), Canada (5 | 0.2%), and Europe (2 | 0.1%), together accounting for 2.4% of all Greeley County residents.
| Immigration Origin | # Population | % Population |
| Canada | 5 | 0.2% |
| Central America | 15 | 0.7% |
| Europe | 2 | 0.1% |
| Germany | 2 | 0.1% |
| Latin America | 15 | 0.7% |
| Mexico | 15 | 0.7% |
| Western Europe | 2 | 0.1% | View All 7 Rows |
Sex and Age in Greeley County
Sex and Age in Greeley County
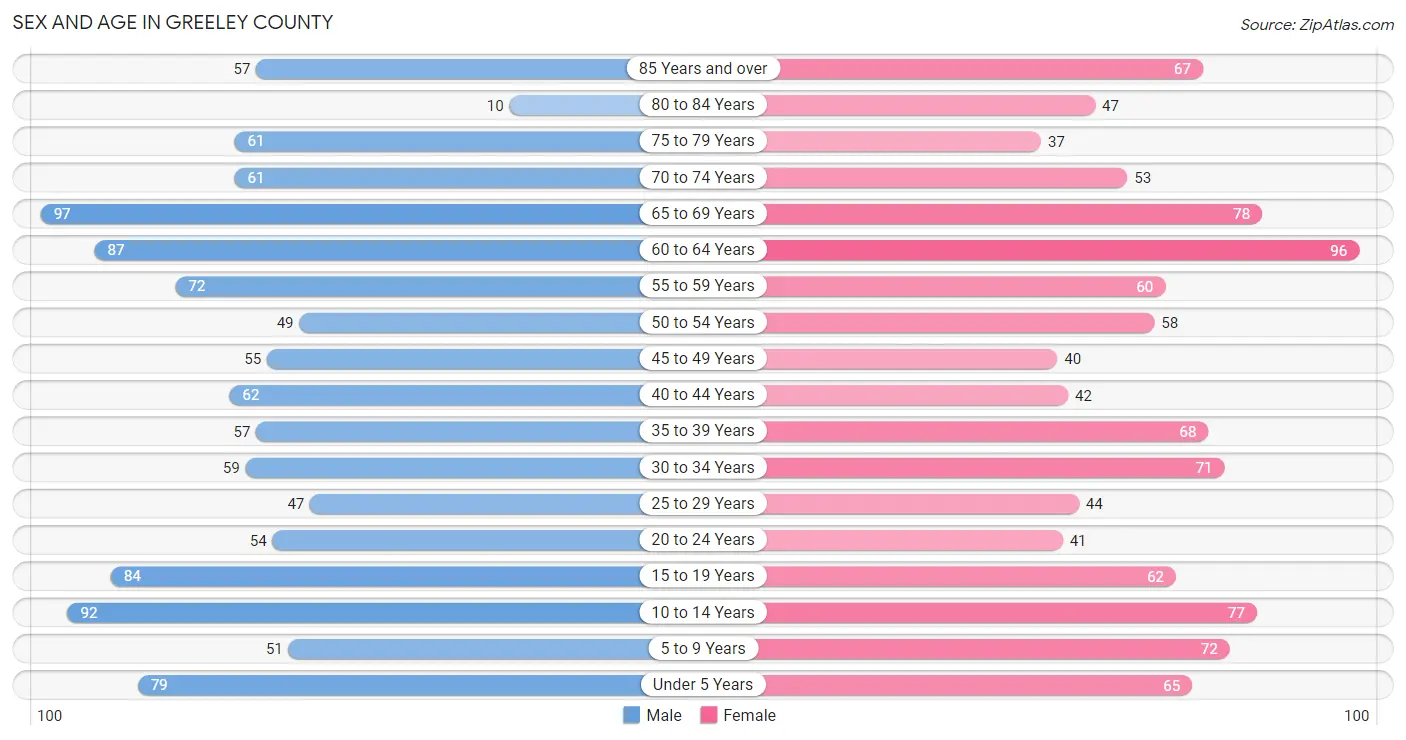
The most populous age groups in Greeley County are 65 to 69 Years (97 | 8.6%) for men and 60 to 64 Years (96 | 8.9%) for women.
| Age Bracket | Male | Female |
| Under 5 Years | 79 (7.0%) | 65 (6.0%) |
| 5 to 9 Years | 51 (4.5%) | 72 (6.7%) |
| 10 to 14 Years | 92 (8.1%) | 77 (7.1%) |
| 15 to 19 Years | 84 (7.4%) | 62 (5.8%) |
| 20 to 24 Years | 54 (4.8%) | 41 (3.8%) |
| 25 to 29 Years | 47 (4.1%) | 44 (4.1%) |
| 30 to 34 Years | 59 (5.2%) | 71 (6.6%) |
| 35 to 39 Years | 57 (5.0%) | 68 (6.3%) |
| 40 to 44 Years | 62 (5.5%) | 42 (3.9%) |
| 45 to 49 Years | 55 (4.9%) | 40 (3.7%) |
| 50 to 54 Years | 49 (4.3%) | 58 (5.4%) |
| 55 to 59 Years | 72 (6.4%) | 60 (5.6%) |
| 60 to 64 Years | 87 (7.7%) | 96 (8.9%) |
| 65 to 69 Years | 97 (8.6%) | 78 (7.2%) |
| 70 to 74 Years | 61 (5.4%) | 53 (4.9%) |
| 75 to 79 Years | 61 (5.4%) | 37 (3.4%) |
| 80 to 84 Years | 10 (0.9%) | 47 (4.4%) |
| 85 Years and over | 57 (5.0%) | 67 (6.2%) |
| Total | 1,134 (100.0%) | 1,078 (100.0%) |
Families and Households in Greeley County
Median Family Size in Greeley County
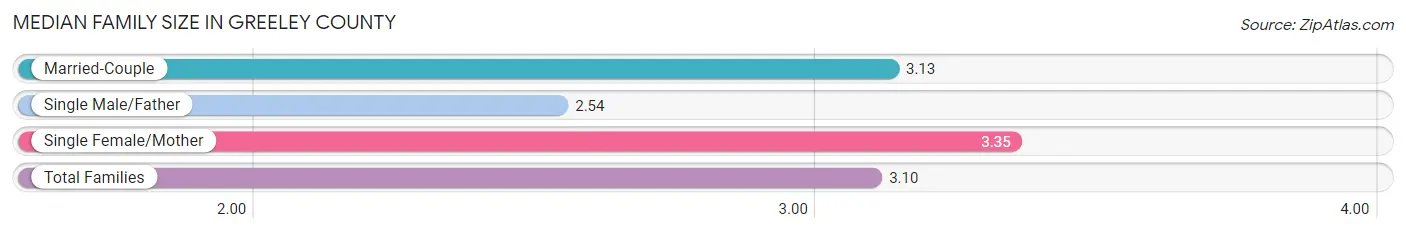
The median family size in Greeley County is 3.10 persons per family, with single female/mother families (55 | 9.5%) accounting for the largest median family size of 3.35 persons per family. On the other hand, single male/father families (52 | 9.0%) represent the smallest median family size with 2.54 persons per family.
| Family Type | # Families | Family Size |
| Married-Couple | 473 (81.6%) | 3.13 |
| Single Male/Father | 52 (9.0%) | 2.54 |
| Single Female/Mother | 55 (9.5%) | 3.35 |
| Total Families | 580 (100.0%) | 3.10 |
Median Household Size in Greeley County
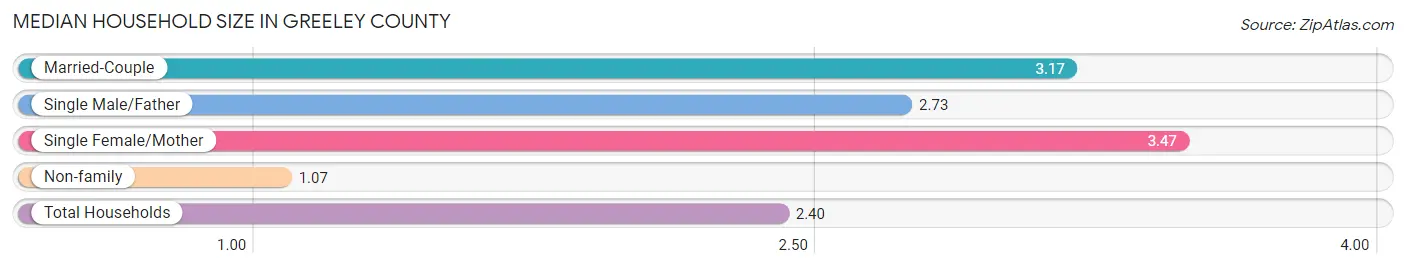
The median household size in Greeley County is 2.40 persons per household, with single female/mother households (55 | 6.1%) accounting for the largest median household size of 3.47 persons per household. non-family households (327 | 36.0%) represent the smallest median household size with 1.07 persons per household.
| Household Type | # Households | Household Size |
| Married-Couple | 473 (52.1%) | 3.17 |
| Single Male/Father | 52 (5.7%) | 2.73 |
| Single Female/Mother | 55 (6.1%) | 3.47 |
| Non-family | 327 (36.0%) | 1.07 |
| Total Households | 907 (100.0%) | 2.40 |
Household Size by Marriage Status in Greeley County
Out of a total of 907 households in Greeley County, 580 (63.9%) are family households, while 327 (36.0%) are nonfamily households. The most numerous type of family households are 2-person households, comprising 341, and the most common type of nonfamily households are 1-person households, comprising 306.
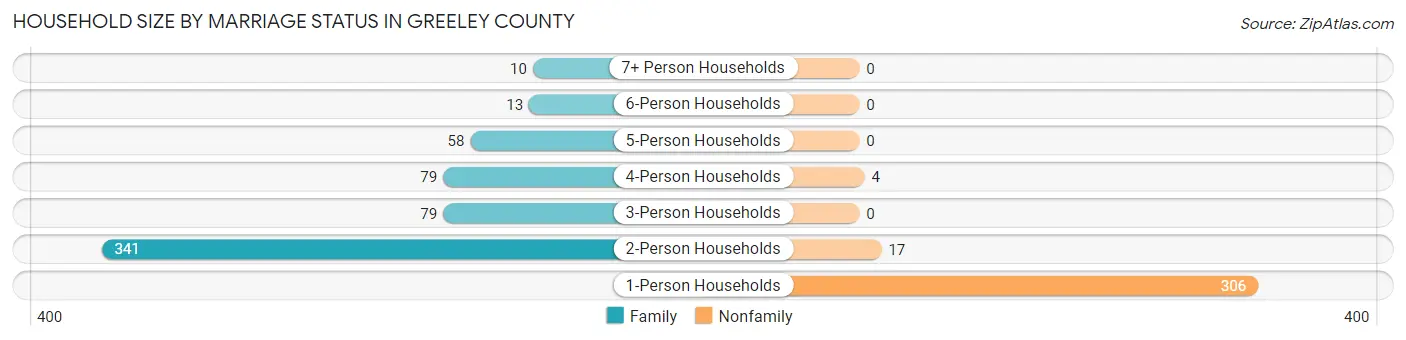
| Household Size | Family Households | Nonfamily Households |
| 1-Person Households | - | 306 (33.7%) |
| 2-Person Households | 341 (37.6%) | 17 (1.9%) |
| 3-Person Households | 79 (8.7%) | 0 (0.0%) |
| 4-Person Households | 79 (8.7%) | 4 (0.4%) |
| 5-Person Households | 58 (6.4%) | 0 (0.0%) |
| 6-Person Households | 13 (1.4%) | 0 (0.0%) |
| 7+ Person Households | 10 (1.1%) | 0 (0.0%) |
| Total | 580 (63.9%) | 327 (36.0%) |
Female Fertility in Greeley County
Fertility by Age in Greeley County
Average fertility rate in Greeley County is 107.0 births per 1,000 women. Women in the age bracket of 20 to 34 years have the highest fertility rate with 179.0 births per 1,000 women. Women in the age bracket of 20 to 34 years acount for 70.0% of all women with births.
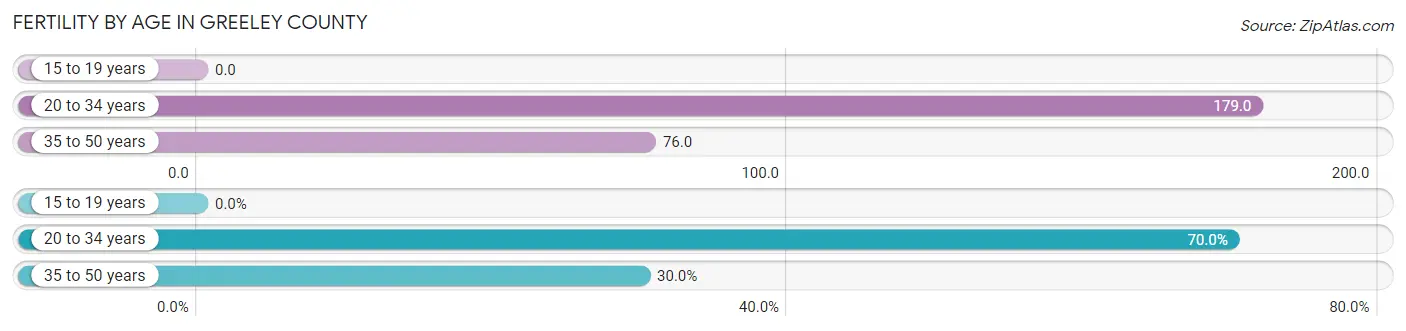
| Age Bracket | Women with Births | Births / 1,000 Women |
| 15 to 19 years | 0 (0.0%) | 0.0 |
| 20 to 34 years | 28 (70.0%) | 179.0 |
| 35 to 50 years | 12 (30.0%) | 76.0 |
| Total | 40 (100.0%) | 107.0 |
Fertility by Age by Marriage Status in Greeley County
80.0% of women with births (40) in Greeley County are married. The highest percentage of unmarried women with births falls into 35 to 50 years age bracket with 33.3% of them unmarried at the time of birth, while the lowest percentage of unmarried women with births belong to 20 to 34 years age bracket with 14.3% of them unmarried.
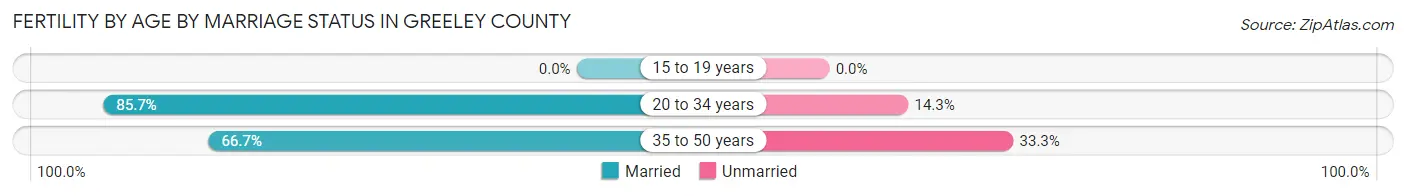
| Age Bracket | Married | Unmarried |
| 15 to 19 years | 0 (0.0%) | 0 (0.0%) |
| 20 to 34 years | 24 (85.7%) | 4 (14.3%) |
| 35 to 50 years | 8 (66.7%) | 4 (33.3%) |
| Total | 32 (80.0%) | 8 (20.0%) |
Fertility by Education in Greeley County
Average fertility rate in Greeley County is 107.0 births per 1,000 women. Women with the education attainment of graduate degree have the highest fertility rate of 286.0 births per 1,000 women, while women with the education attainment of less than high school have the lowest fertility at 31.0 births per 1,000 women. Women with the education attainment of college or associate's degree represent 55.0% of all women with births.
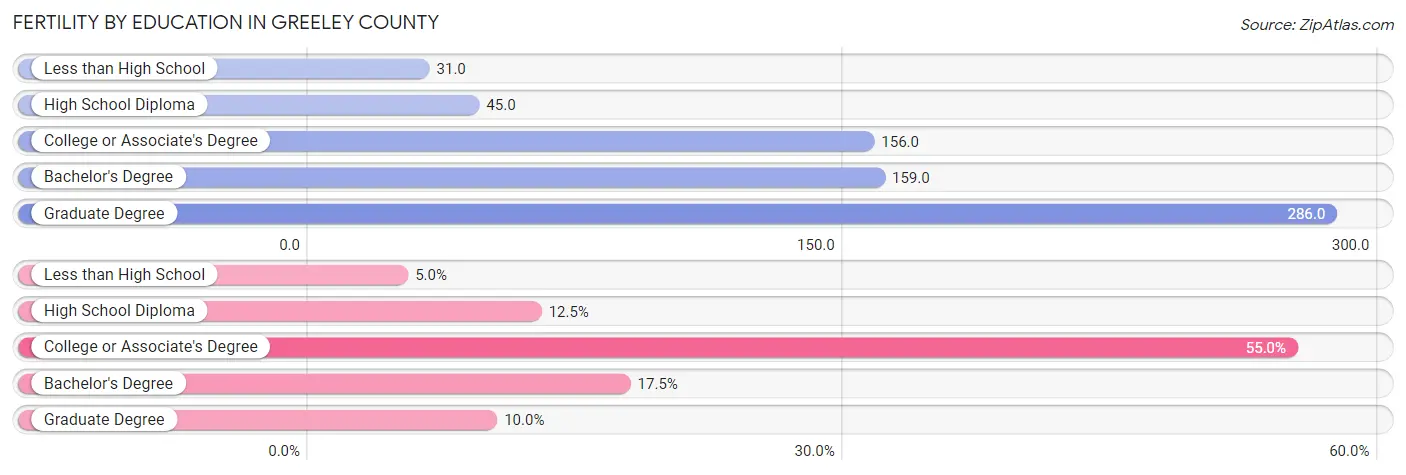
| Educational Attainment | Women with Births | Births / 1,000 Women |
| Less than High School | 2 (5.0%) | 31.0 |
| High School Diploma | 5 (12.5%) | 45.0 |
| College or Associate's Degree | 22 (55.0%) | 156.0 |
| Bachelor's Degree | 7 (17.5%) | 159.0 |
| Graduate Degree | 4 (10.0%) | 286.0 |
| Total | 40 (100.0%) | 107.0 |
Fertility by Education by Marriage Status in Greeley County
20.0% of women with births in Greeley County are unmarried. Women with the educational attainment of less than high school are most likely to be married with 100.0% of them married at childbirth, while women with the educational attainment of high school diploma are least likely to be married with 100.0% of them unmarried at childbirth.
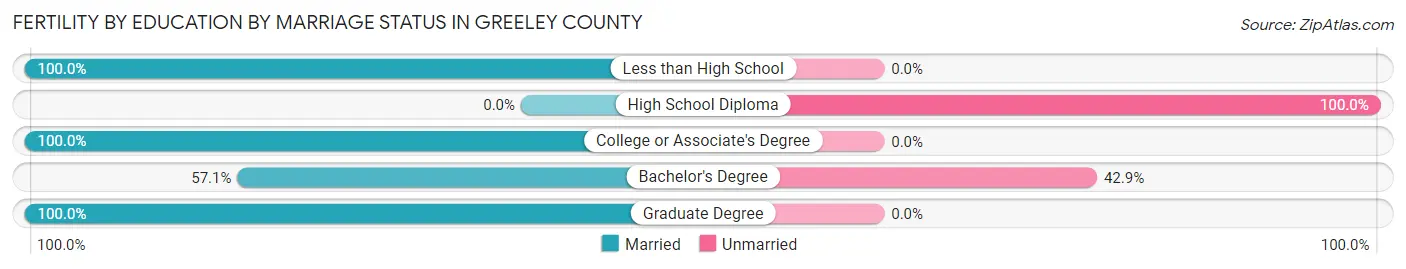
| Educational Attainment | Married | Unmarried |
| Less than High School | 2 (100.0%) | 0 (0.0%) |
| High School Diploma | 0 (0.0%) | 5 (100.0%) |
| College or Associate's Degree | 22 (100.0%) | 0 (0.0%) |
| Bachelor's Degree | 4 (57.1%) | 3 (42.9%) |
| Graduate Degree | 4 (100.0%) | 0 (0.0%) |
| Total | 32 (80.0%) | 8 (20.0%) |
Employment Characteristics in Greeley County
Employment by Class of Employer in Greeley County
Among the 986 employed individuals in Greeley County, private company employees (499 | 50.6%), self-employed (not incorporated) (187 | 19.0%), and self-employed (incorporated) (105 | 10.6%) make up the most common classes of employment.
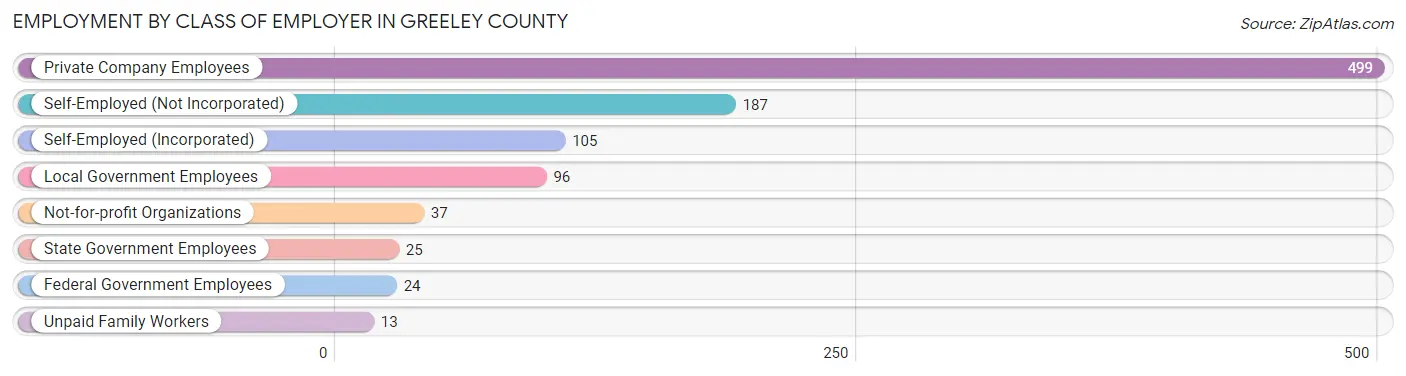
| Employer Class | # Employees | % Employees |
| Private Company Employees | 499 | 50.6% |
| Self-Employed (Incorporated) | 105 | 10.6% |
| Self-Employed (Not Incorporated) | 187 | 19.0% |
| Not-for-profit Organizations | 37 | 3.7% |
| Local Government Employees | 96 | 9.7% |
| State Government Employees | 25 | 2.5% |
| Federal Government Employees | 24 | 2.4% |
| Unpaid Family Workers | 13 | 1.3% |
| Total | 986 | 100.0% |
Employment Status by Age in Greeley County
According to the labor force statistics for Greeley County, out of the total population over 16 years of age (1,746), 57.8% or 1,009 individuals are in the labor force, with 1.8% or 18 of them unemployed. The age group with the highest labor force participation rate is 55 to 59 years, with 87.9% or 116 individuals in the labor force. Within the labor force, the 16 to 19 years age range has the highest percentage of unemployed individuals, with 18.8% or 9 of them being unemployed.
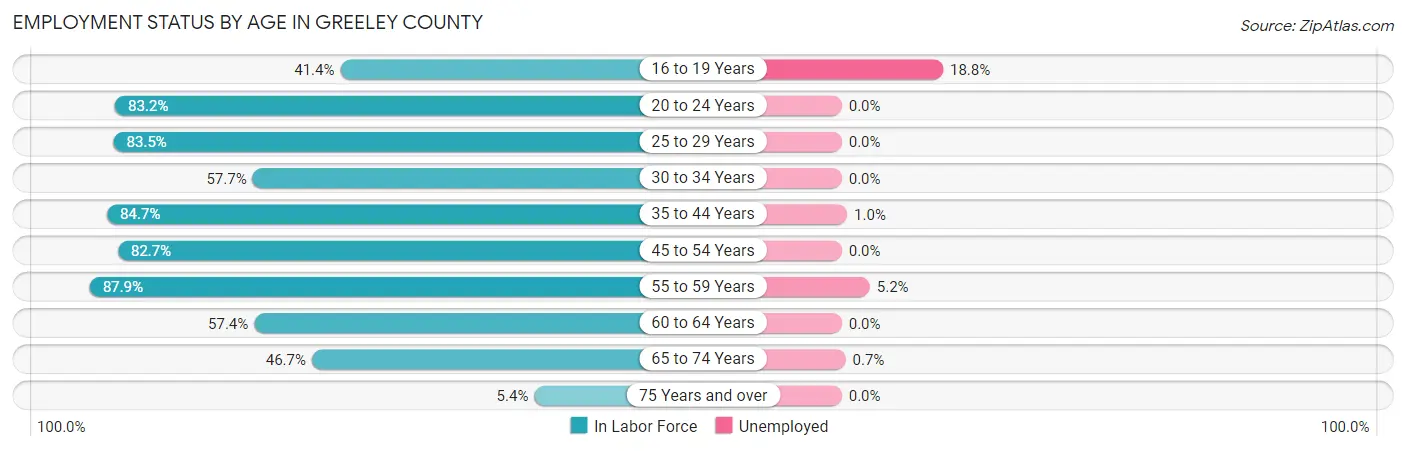
| Age Bracket | In Labor Force | Unemployed |
| 16 to 19 Years | 48 (41.4%) | 9 (18.8%) |
| 20 to 24 Years | 79 (83.2%) | 0 (0.0%) |
| 25 to 29 Years | 76 (83.5%) | 0 (0.0%) |
| 30 to 34 Years | 75 (57.7%) | 0 (0.0%) |
| 35 to 44 Years | 194 (84.7%) | 2 (1.0%) |
| 45 to 54 Years | 167 (82.7%) | 0 (0.0%) |
| 55 to 59 Years | 116 (87.9%) | 6 (5.2%) |
| 60 to 64 Years | 105 (57.4%) | 0 (0.0%) |
| 65 to 74 Years | 135 (46.7%) | 1 (0.7%) |
| 75 Years and over | 15 (5.4%) | 0 (0.0%) |
| Total | 1,009 (57.8%) | 18 (1.8%) |
Employment Status by Educational Attainment in Greeley County
According to labor force statistics for Greeley County, 75.8% of individuals (733) out of the total population between 25 and 64 years of age (967) are in the labor force, with 1.1% or 8 of them being unemployed. The group with the highest labor force participation rate are those with the educational attainment of bachelor's degree or higher, with 85.5% or 148 individuals in the labor force. Within the labor force, individuals with high school diploma education have the highest percentage of unemployment, with 2.8% or 6 of them being unemployed.
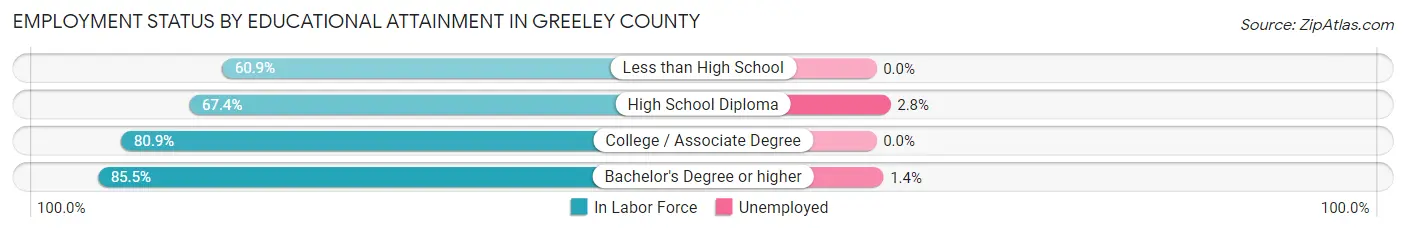
| Educational Attainment | In Labor Force | Unemployed |
| Less than High School | 42 (60.9%) | 0 (0.0%) |
| High School Diploma | 217 (67.4%) | 9 (2.8%) |
| College / Associate Degree | 326 (80.9%) | 0 (0.0%) |
| Bachelor's Degree or higher | 148 (85.5%) | 2 (1.4%) |
| Total | 733 (75.8%) | 11 (1.1%) |
Employment Occupations by Sex in Greeley County
Management, Business, Science and Arts Occupations
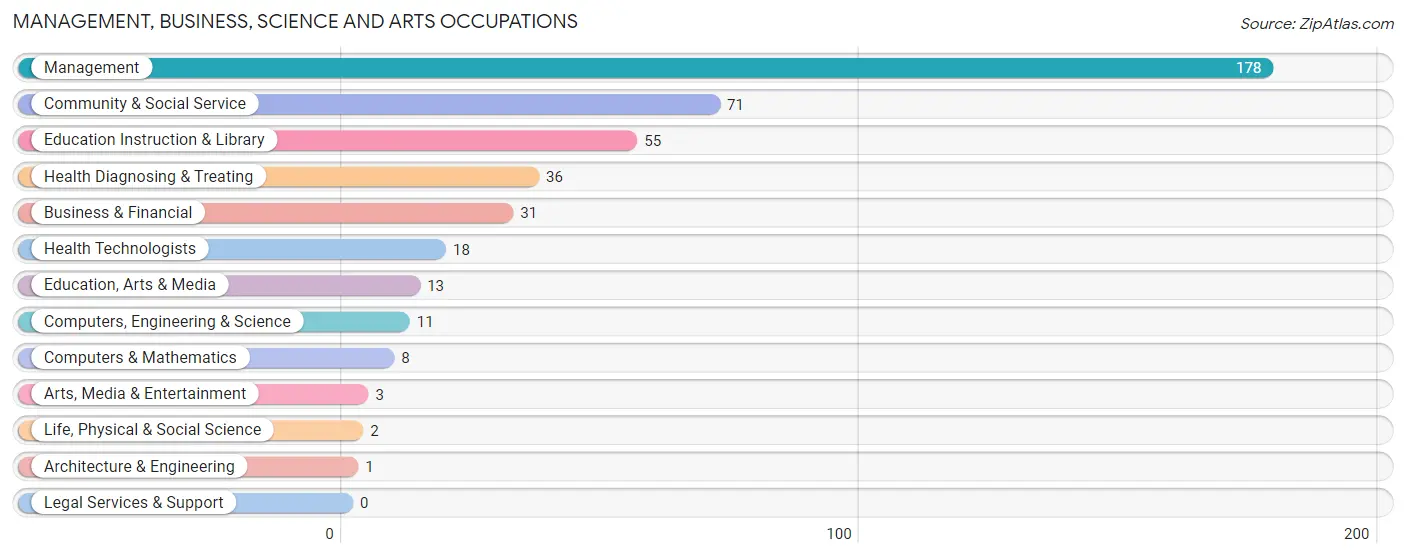
The most common Management, Business, Science and Arts occupations in Greeley County are Management (178 | 17.9%), Community & Social Service (71 | 7.2%), Education Instruction & Library (55 | 5.5%), Health Diagnosing & Treating (36 | 3.6%), and Business & Financial (31 | 3.1%).
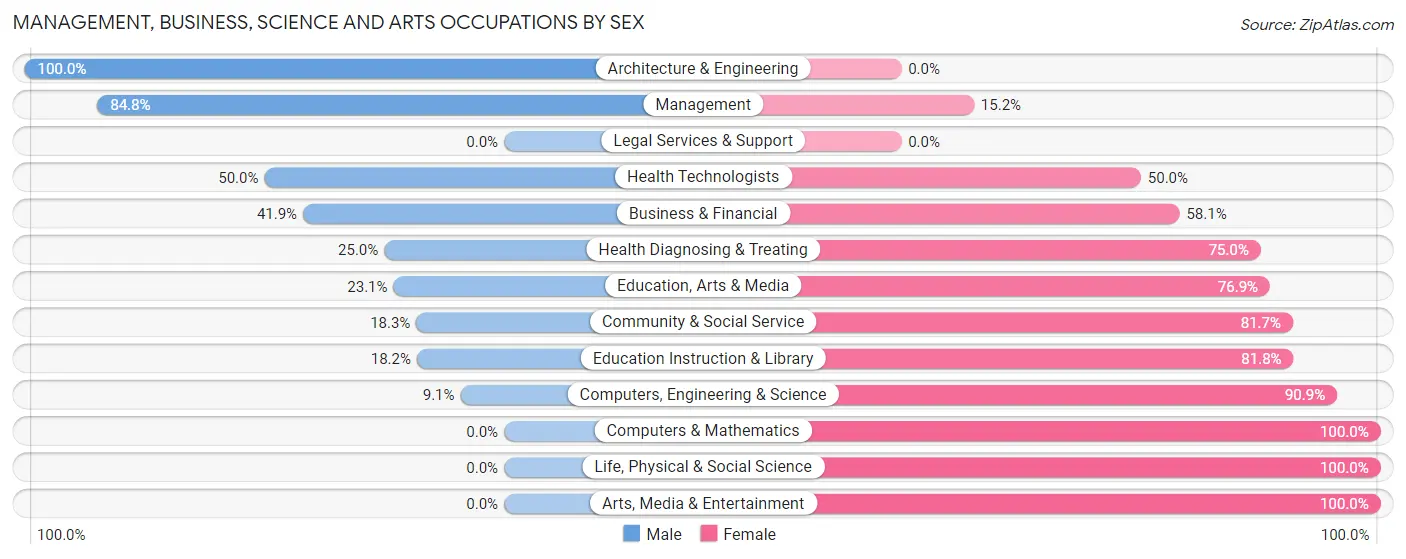
Management, Business, Science and Arts Occupations by Sex
Within the Management, Business, Science and Arts occupations in Greeley County, the most male-oriented occupations are Architecture & Engineering (100.0%), Management (84.8%), and Health Technologists (50.0%), while the most female-oriented occupations are Computers & Mathematics (100.0%), Life, Physical & Social Science (100.0%), and Arts, Media & Entertainment (100.0%).
| Occupation | Male | Female |
| Management | 151 (84.8%) | 27 (15.2%) |
| Business & Financial | 13 (41.9%) | 18 (58.1%) |
| Computers, Engineering & Science | 1 (9.1%) | 10 (90.9%) |
| Computers & Mathematics | 0 (0.0%) | 8 (100.0%) |
| Architecture & Engineering | 1 (100.0%) | 0 (0.0%) |
| Life, Physical & Social Science | 0 (0.0%) | 2 (100.0%) |
| Community & Social Service | 13 (18.3%) | 58 (81.7%) |
| Education, Arts & Media | 3 (23.1%) | 10 (76.9%) |
| Legal Services & Support | 0 (0.0%) | 0 (0.0%) |
| Education Instruction & Library | 10 (18.2%) | 45 (81.8%) |
| Arts, Media & Entertainment | 0 (0.0%) | 3 (100.0%) |
| Health Diagnosing & Treating | 9 (25.0%) | 27 (75.0%) |
| Health Technologists | 9 (50.0%) | 9 (50.0%) |
| Total (Category) | 187 (57.2%) | 140 (42.8%) |
| Total (Overall) | 579 (58.4%) | 413 (41.6%) |
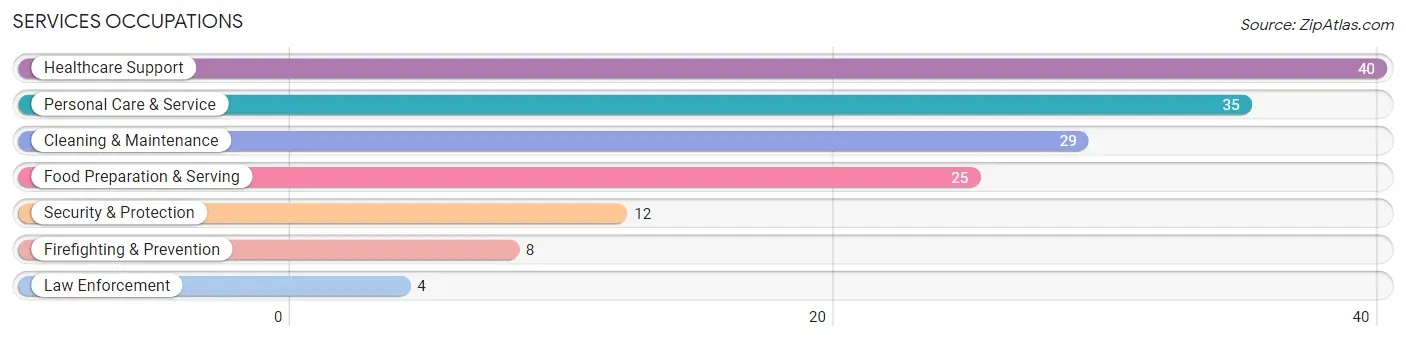
Services Occupations
The most common Services occupations in Greeley County are Healthcare Support (40 | 4.0%), Personal Care & Service (35 | 3.5%), Cleaning & Maintenance (29 | 2.9%), Food Preparation & Serving (25 | 2.5%), and Security & Protection (12 | 1.2%).
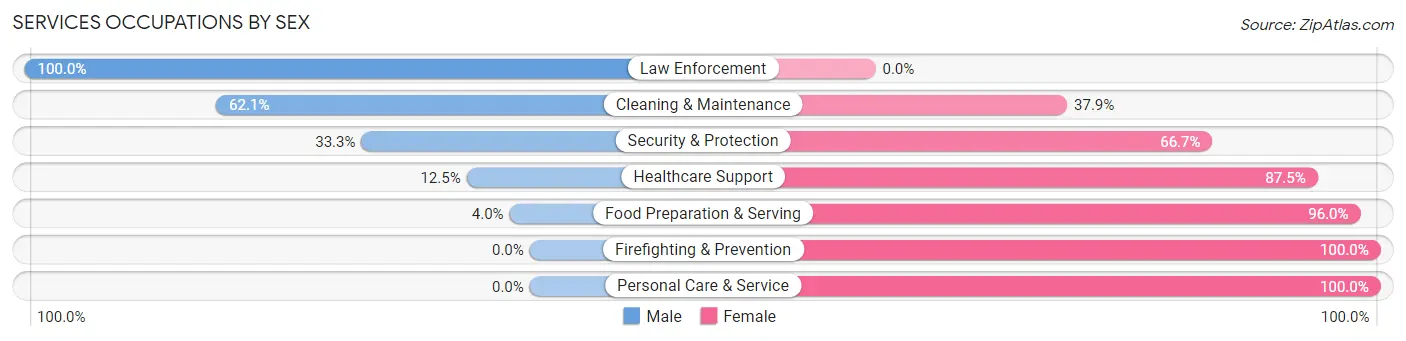
Services Occupations by Sex
Within the Services occupations in Greeley County, the most male-oriented occupations are Law Enforcement (100.0%), Cleaning & Maintenance (62.1%), and Security & Protection (33.3%), while the most female-oriented occupations are Firefighting & Prevention (100.0%), Personal Care & Service (100.0%), and Food Preparation & Serving (96.0%).
| Occupation | Male | Female |
| Healthcare Support | 5 (12.5%) | 35 (87.5%) |
| Security & Protection | 4 (33.3%) | 8 (66.7%) |
| Firefighting & Prevention | 0 (0.0%) | 8 (100.0%) |
| Law Enforcement | 4 (100.0%) | 0 (0.0%) |
| Food Preparation & Serving | 1 (4.0%) | 24 (96.0%) |
| Cleaning & Maintenance | 18 (62.1%) | 11 (37.9%) |
| Personal Care & Service | 0 (0.0%) | 35 (100.0%) |
| Total (Category) | 28 (19.9%) | 113 (80.1%) |
| Total (Overall) | 579 (58.4%) | 413 (41.6%) |
Sales and Office Occupations
The most common Sales and Office occupations in Greeley County are Sales & Related (98 | 9.9%), and Office & Administration (87 | 8.8%).
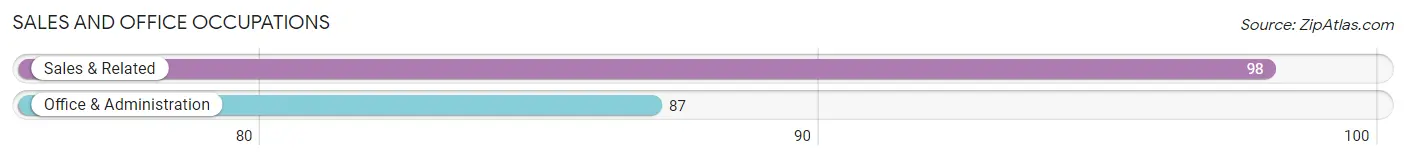
Sales and Office Occupations by Sex
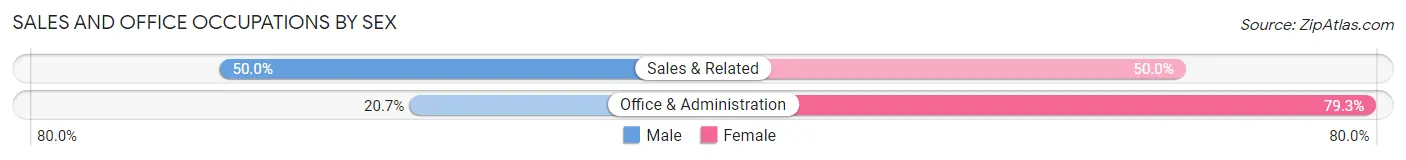
| Occupation | Male | Female |
| Sales & Related | 49 (50.0%) | 49 (50.0%) |
| Office & Administration | 18 (20.7%) | 69 (79.3%) |
| Total (Category) | 67 (36.2%) | 118 (63.8%) |
| Total (Overall) | 579 (58.4%) | 413 (41.6%) |
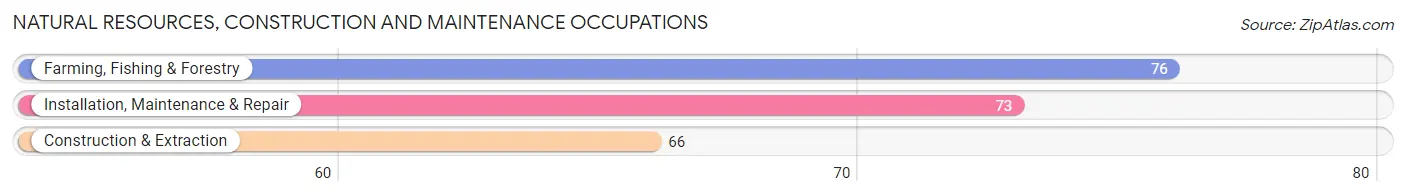
Natural Resources, Construction and Maintenance Occupations
The most common Natural Resources, Construction and Maintenance occupations in Greeley County are Farming, Fishing & Forestry (76 | 7.7%), Installation, Maintenance & Repair (73 | 7.4%), and Construction & Extraction (66 | 6.7%).
Natural Resources, Construction and Maintenance Occupations by Sex
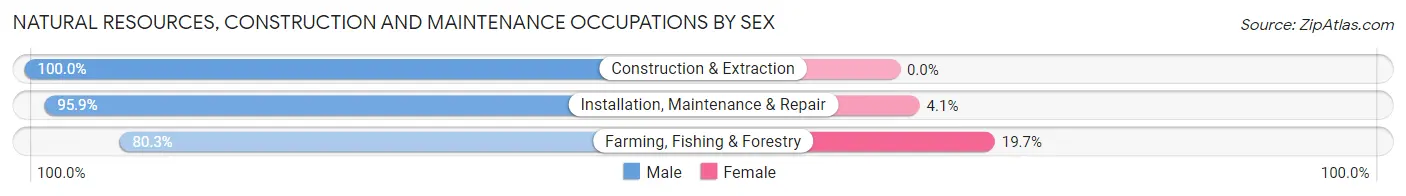
| Occupation | Male | Female |
| Farming, Fishing & Forestry | 61 (80.3%) | 15 (19.7%) |
| Construction & Extraction | 66 (100.0%) | 0 (0.0%) |
| Installation, Maintenance & Repair | 70 (95.9%) | 3 (4.1%) |
| Total (Category) | 197 (91.6%) | 18 (8.4%) |
| Total (Overall) | 579 (58.4%) | 413 (41.6%) |
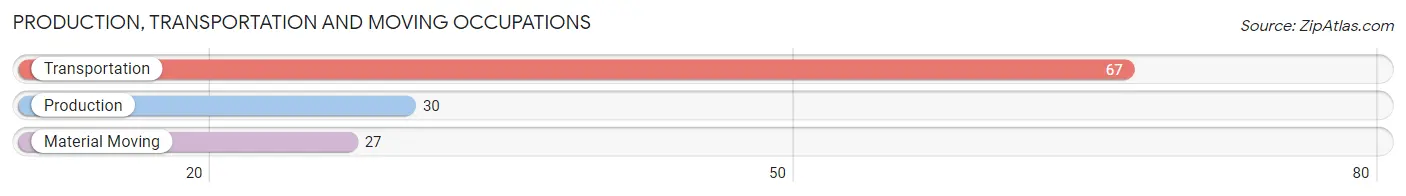
Production, Transportation and Moving Occupations
The most common Production, Transportation and Moving occupations in Greeley County are Transportation (67 | 6.8%), Production (30 | 3.0%), and Material Moving (27 | 2.7%).
Production, Transportation and Moving Occupations by Sex
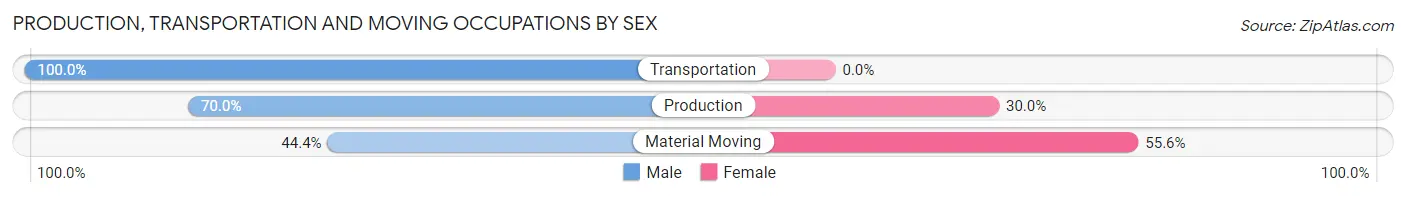
| Occupation | Male | Female |
| Production | 21 (70.0%) | 9 (30.0%) |
| Transportation | 67 (100.0%) | 0 (0.0%) |
| Material Moving | 12 (44.4%) | 15 (55.6%) |
| Total (Category) | 100 (80.6%) | 24 (19.4%) |
| Total (Overall) | 579 (58.4%) | 413 (41.6%) |
Employment Industries by Sex in Greeley County
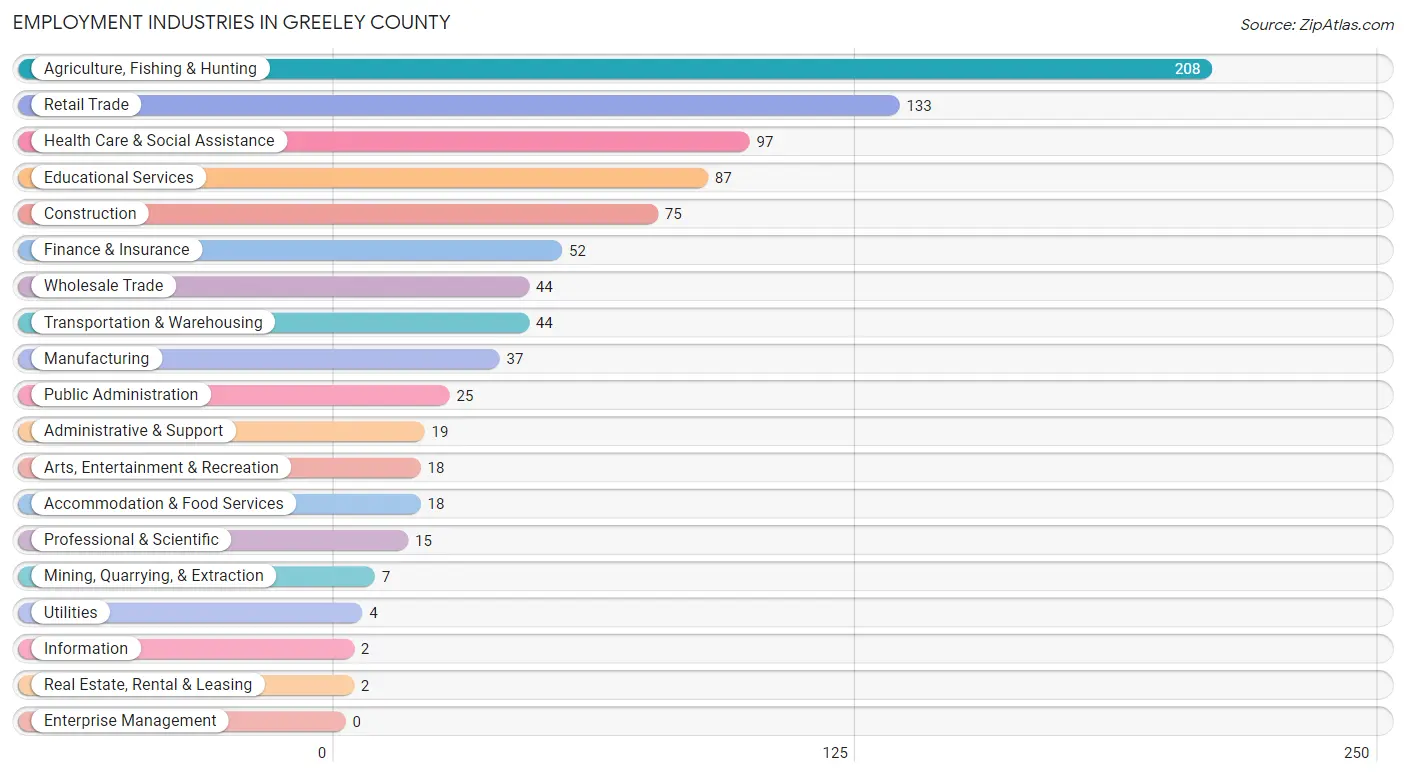
Employment Industries in Greeley County
The major employment industries in Greeley County include Agriculture, Fishing & Hunting (208 | 21.0%), Retail Trade (133 | 13.4%), Health Care & Social Assistance (97 | 9.8%), Educational Services (87 | 8.8%), and Construction (75 | 7.6%).
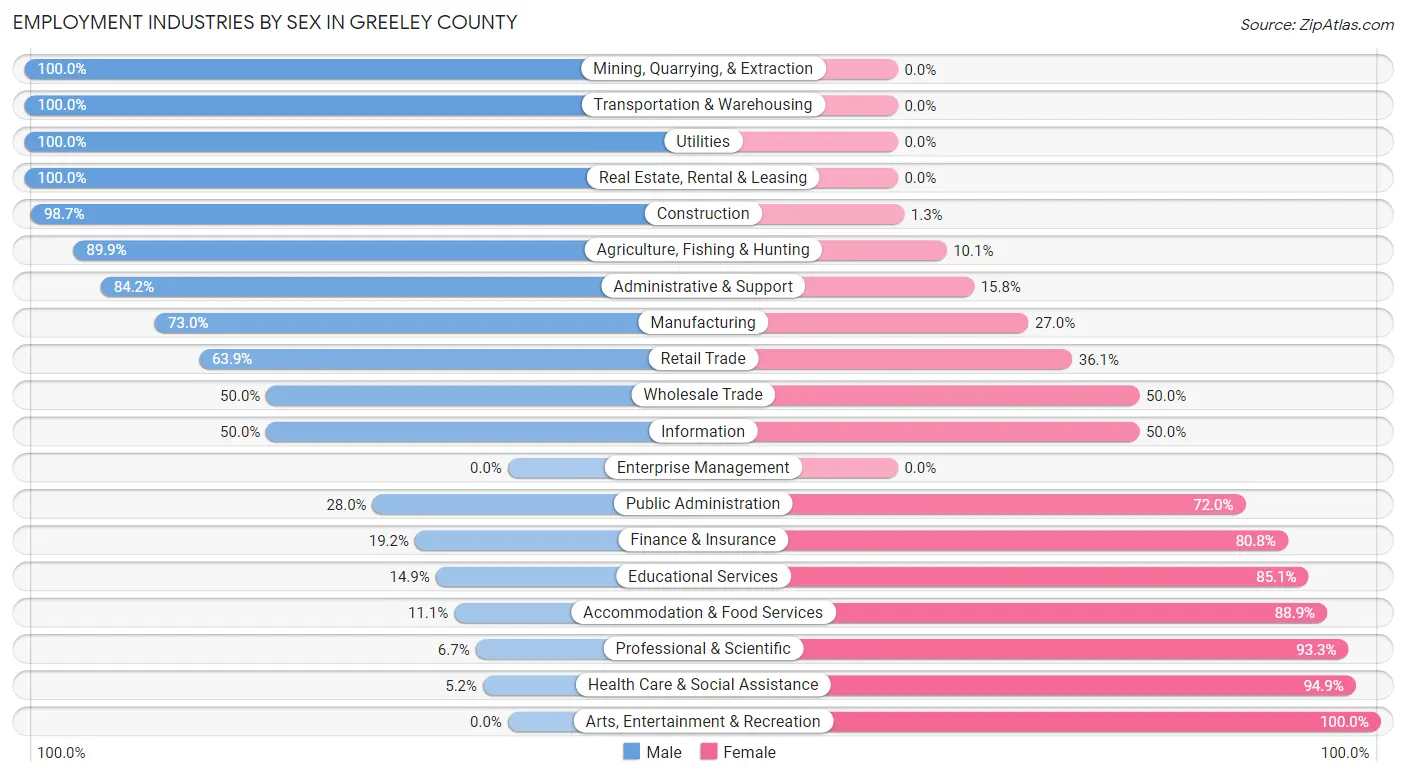
Employment Industries by Sex in Greeley County
The Greeley County industries that see more men than women are Mining, Quarrying, & Extraction (100.0%), Transportation & Warehousing (100.0%), and Utilities (100.0%), whereas the industries that tend to have a higher number of women are Arts, Entertainment & Recreation (100.0%), Health Care & Social Assistance (94.9%), and Professional & Scientific (93.3%).
| Industry | Male | Female |
| Agriculture, Fishing & Hunting | 187 (89.9%) | 21 (10.1%) |
| Mining, Quarrying, & Extraction | 7 (100.0%) | 0 (0.0%) |
| Construction | 74 (98.7%) | 1 (1.3%) |
| Manufacturing | 27 (73.0%) | 10 (27.0%) |
| Wholesale Trade | 22 (50.0%) | 22 (50.0%) |
| Retail Trade | 85 (63.9%) | 48 (36.1%) |
| Transportation & Warehousing | 44 (100.0%) | 0 (0.0%) |
| Utilities | 4 (100.0%) | 0 (0.0%) |
| Information | 1 (50.0%) | 1 (50.0%) |
| Finance & Insurance | 10 (19.2%) | 42 (80.8%) |
| Real Estate, Rental & Leasing | 2 (100.0%) | 0 (0.0%) |
| Professional & Scientific | 1 (6.7%) | 14 (93.3%) |
| Enterprise Management | 0 (0.0%) | 0 (0.0%) |
| Administrative & Support | 16 (84.2%) | 3 (15.8%) |
| Educational Services | 13 (14.9%) | 74 (85.1%) |
| Health Care & Social Assistance | 5 (5.1%) | 92 (94.9%) |
| Arts, Entertainment & Recreation | 0 (0.0%) | 18 (100.0%) |
| Accommodation & Food Services | 2 (11.1%) | 16 (88.9%) |
| Public Administration | 7 (28.0%) | 18 (72.0%) |
| Total | 579 (58.4%) | 413 (41.6%) |
Education in Greeley County
School Enrollment in Greeley County
The most common levels of schooling among the 494 students in Greeley County are middle school (132 | 26.7%), high school (121 | 24.5%), and college / undergraduate (79 | 16.0%).
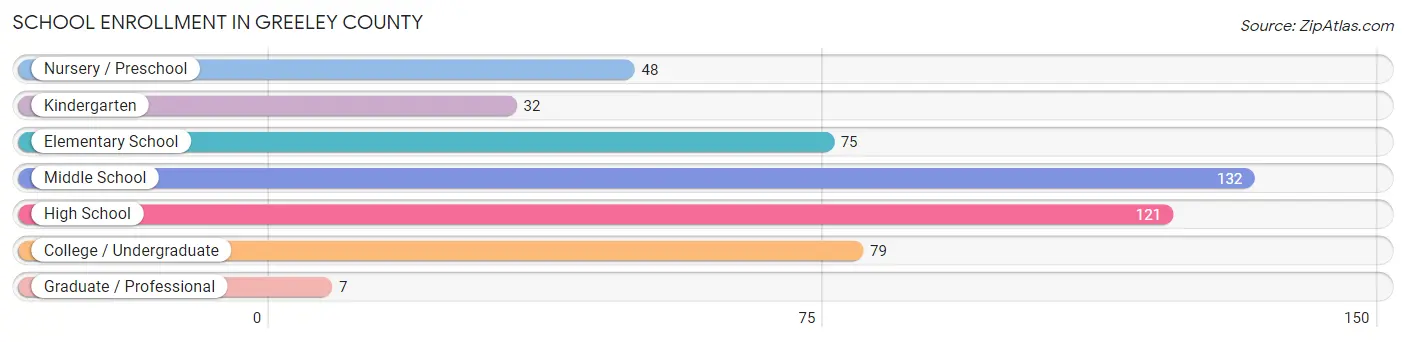
| School Level | # Students | % Students |
| Nursery / Preschool | 48 | 9.7% |
| Kindergarten | 32 | 6.5% |
| Elementary School | 75 | 15.2% |
| Middle School | 132 | 26.7% |
| High School | 121 | 24.5% |
| College / Undergraduate | 79 | 16.0% |
| Graduate / Professional | 7 | 1.4% |
| Total | 494 | 100.0% |
School Enrollment by Age by Funding Source in Greeley County
Out of a total of 494 students who are enrolled in schools in Greeley County, 87 (17.6%) attend a private institution, while the remaining 407 (82.4%) are enrolled in public schools. The age group of 3 to 4 year olds has the highest likelihood of being enrolled in private schools, with 9 (29.0% in the age bracket) enrolled. Conversely, the age group of 25 to 34 year olds has the lowest likelihood of being enrolled in a private school, with 11 (100.0% in the age bracket) attending a public institution.
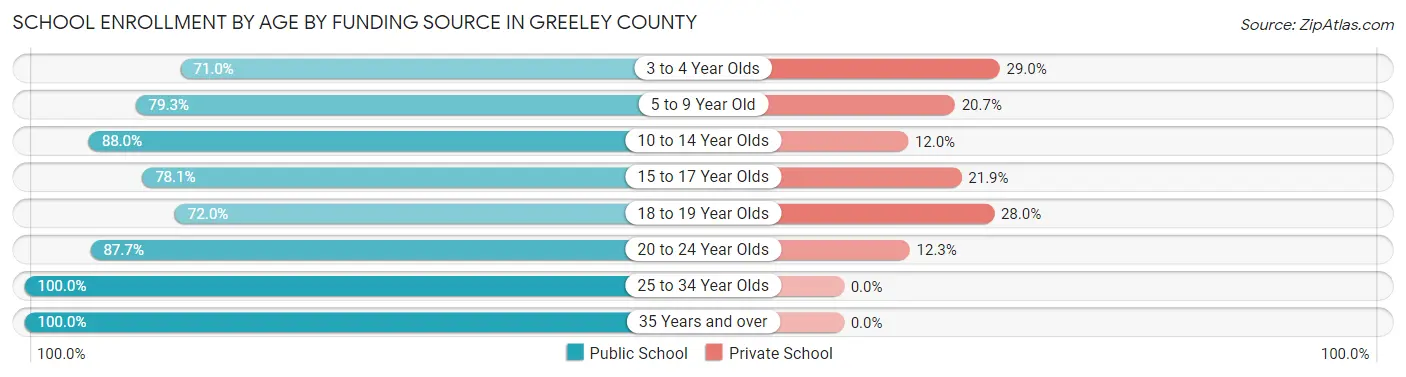
| Age Bracket | Public School | Private School |
| 3 to 4 Year Olds | 22 (71.0%) | 9 (29.0%) |
| 5 to 9 Year Old | 92 (79.3%) | 24 (20.7%) |
| 10 to 14 Year Olds | 125 (88.0%) | 17 (12.0%) |
| 15 to 17 Year Olds | 57 (78.1%) | 16 (21.9%) |
| 18 to 19 Year Olds | 36 (72.0%) | 14 (28.0%) |
| 20 to 24 Year Olds | 50 (87.7%) | 7 (12.3%) |
| 25 to 34 Year Olds | 11 (100.0%) | 0 (0.0%) |
| 35 Years and over | 14 (100.0%) | 0 (0.0%) |
| Total | 407 (82.4%) | 87 (17.6%) |
Educational Attainment by Field of Study in Greeley County
Education (67 | 23.5%), business (65 | 22.8%), bio, nature & agricultural (38 | 13.3%), science & technology (36 | 12.6%), and arts & humanities (28 | 9.8%) are the most common fields of study among 285 individuals in Greeley County who have obtained a bachelor's degree or higher.
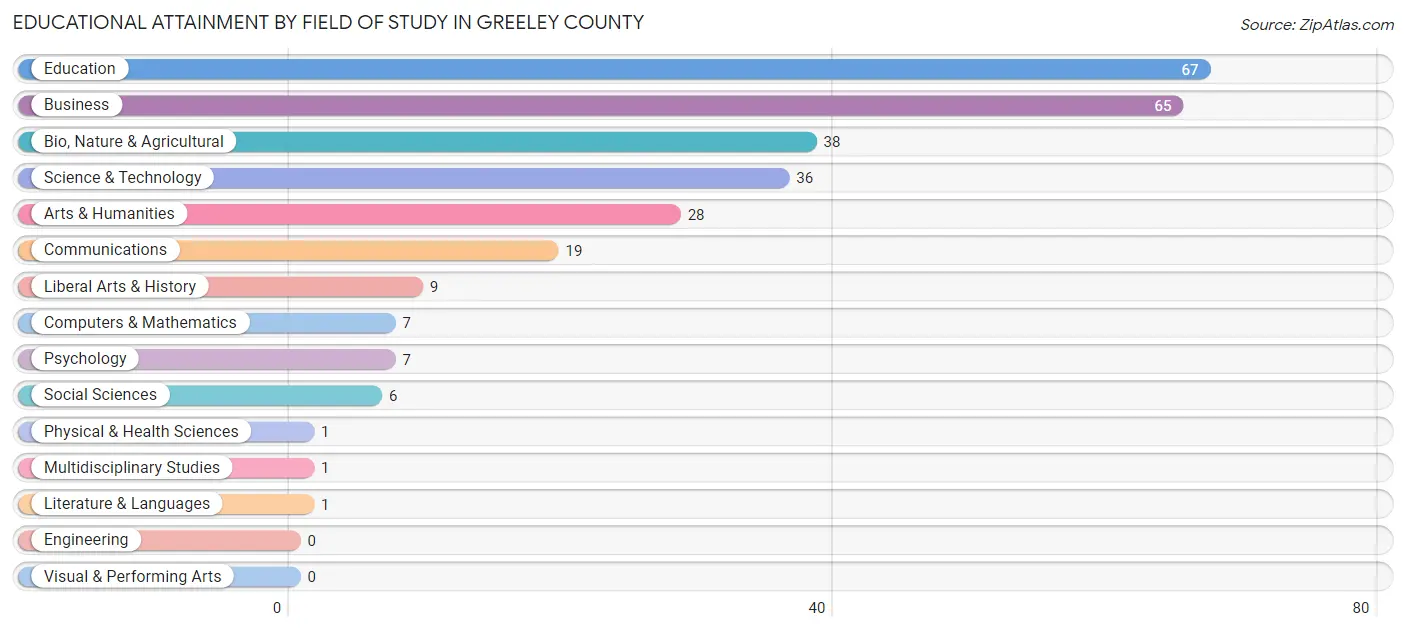
| Field of Study | # Graduates | % Graduates |
| Computers & Mathematics | 7 | 2.5% |
| Bio, Nature & Agricultural | 38 | 13.3% |
| Physical & Health Sciences | 1 | 0.4% |
| Psychology | 7 | 2.5% |
| Social Sciences | 6 | 2.1% |
| Engineering | 0 | 0.0% |
| Multidisciplinary Studies | 1 | 0.4% |
| Science & Technology | 36 | 12.6% |
| Business | 65 | 22.8% |
| Education | 67 | 23.5% |
| Literature & Languages | 1 | 0.4% |
| Liberal Arts & History | 9 | 3.2% |
| Visual & Performing Arts | 0 | 0.0% |
| Communications | 19 | 6.7% |
| Arts & Humanities | 28 | 9.8% |
| Total | 285 | 100.0% |
Transportation & Commute in Greeley County
Vehicle Availability by Sex in Greeley County
The most prevalent vehicle ownership categories in Greeley County are males with 3 vehicles (234, accounting for 40.6%) and females with 3 vehicles (148, making up 57.2%).
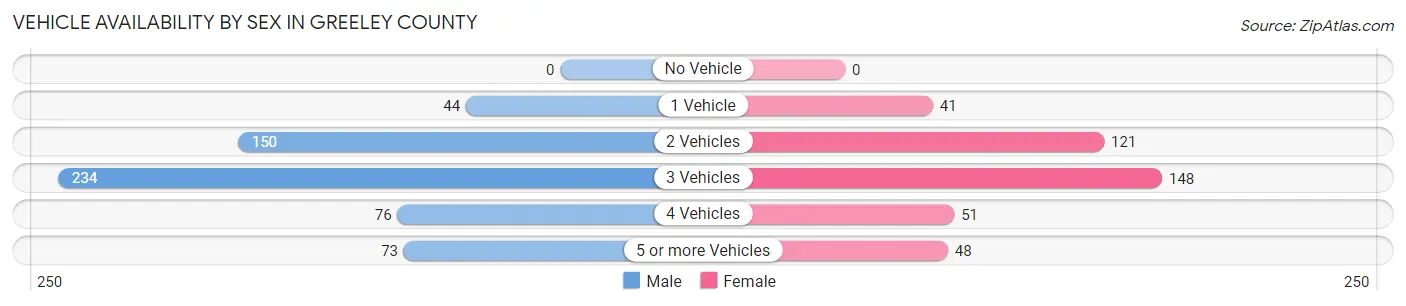
| Vehicles Available | Male | Female |
| No Vehicle | 0 (0.0%) | 0 (0.0%) |
| 1 Vehicle | 44 (7.6%) | 41 (10.0%) |
| 2 Vehicles | 150 (26.0%) | 121 (29.6%) |
| 3 Vehicles | 234 (40.6%) | 148 (36.2%) |
| 4 Vehicles | 76 (13.2%) | 51 (12.5%) |
| 5 or more Vehicles | 73 (12.7%) | 48 (11.7%) |
| Total | 577 (100.0%) | 409 (100.0%) |
Commute Time in Greeley County
The most frequently occuring commute durations in Greeley County are 5 to 9 minutes (225 commuters, 25.9%), less than 5 minutes (189 commuters, 21.8%), and 20 to 24 minutes (93 commuters, 10.7%).
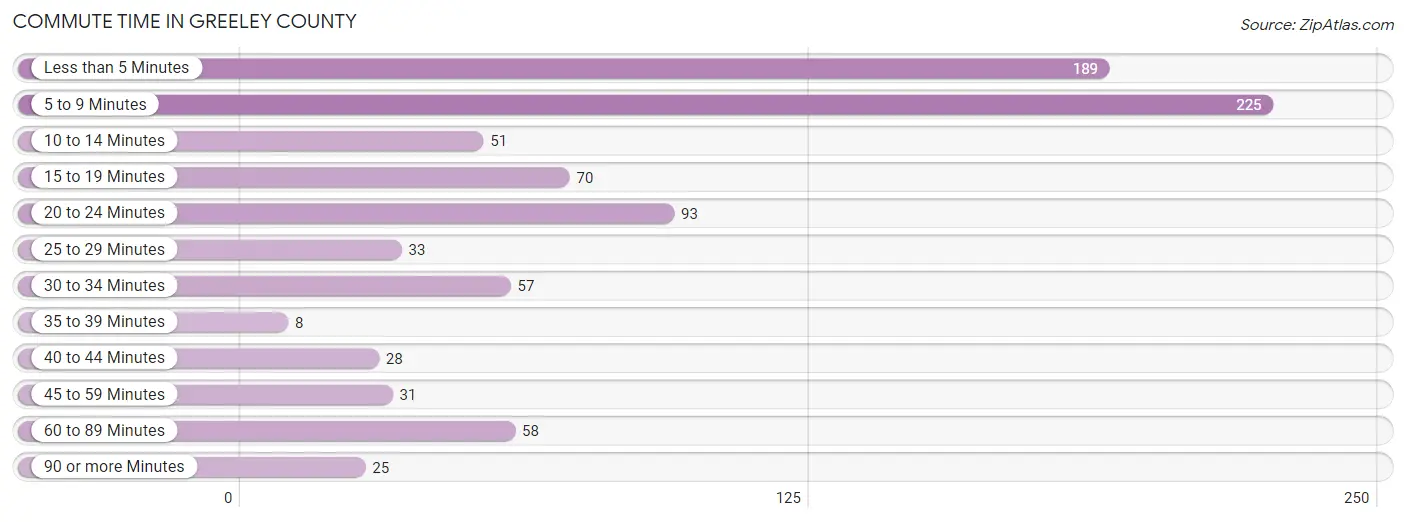
| Commute Time | # Commuters | % Commuters |
| Less than 5 Minutes | 189 | 21.8% |
| 5 to 9 Minutes | 225 | 25.9% |
| 10 to 14 Minutes | 51 | 5.9% |
| 15 to 19 Minutes | 70 | 8.1% |
| 20 to 24 Minutes | 93 | 10.7% |
| 25 to 29 Minutes | 33 | 3.8% |
| 30 to 34 Minutes | 57 | 6.6% |
| 35 to 39 Minutes | 8 | 0.9% |
| 40 to 44 Minutes | 28 | 3.2% |
| 45 to 59 Minutes | 31 | 3.6% |
| 60 to 89 Minutes | 58 | 6.7% |
| 90 or more Minutes | 25 | 2.9% |
Commute Time by Sex in Greeley County
The most common commute times in Greeley County are 5 to 9 minutes (162 commuters, 31.7%) for males and 5 to 9 minutes (63 commuters, 17.6%) for females.
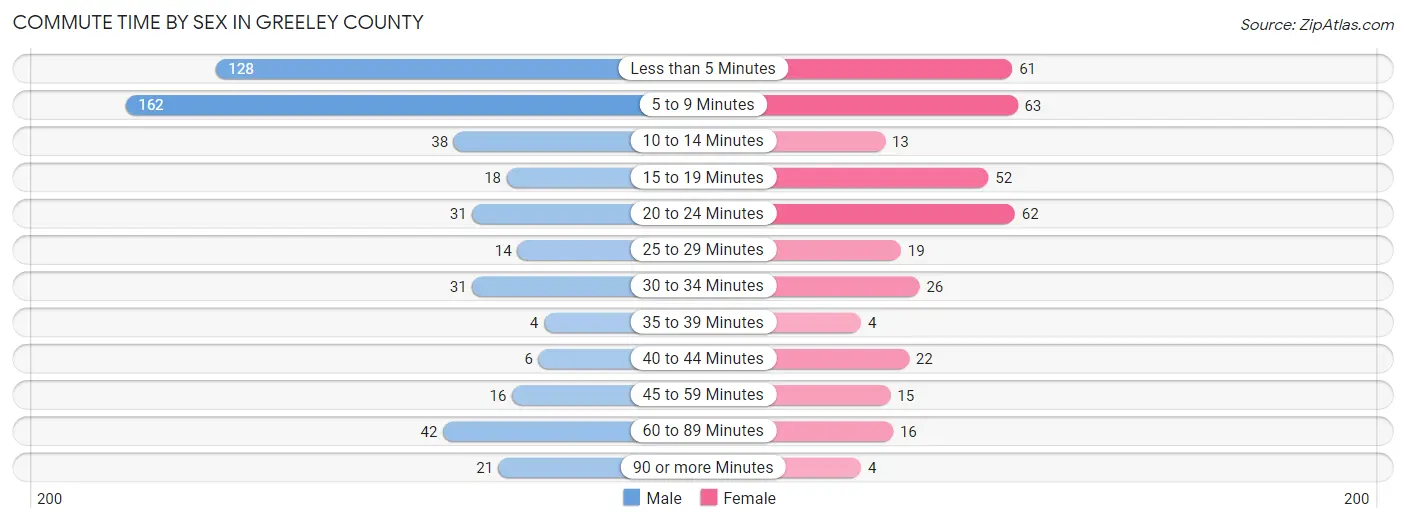
| Commute Time | Male | Female |
| Less than 5 Minutes | 128 (25.1%) | 61 (17.1%) |
| 5 to 9 Minutes | 162 (31.7%) | 63 (17.6%) |
| 10 to 14 Minutes | 38 (7.4%) | 13 (3.6%) |
| 15 to 19 Minutes | 18 (3.5%) | 52 (14.6%) |
| 20 to 24 Minutes | 31 (6.1%) | 62 (17.4%) |
| 25 to 29 Minutes | 14 (2.7%) | 19 (5.3%) |
| 30 to 34 Minutes | 31 (6.1%) | 26 (7.3%) |
| 35 to 39 Minutes | 4 (0.8%) | 4 (1.1%) |
| 40 to 44 Minutes | 6 (1.2%) | 22 (6.2%) |
| 45 to 59 Minutes | 16 (3.1%) | 15 (4.2%) |
| 60 to 89 Minutes | 42 (8.2%) | 16 (4.5%) |
| 90 or more Minutes | 21 (4.1%) | 4 (1.1%) |
Time of Departure to Work by Sex in Greeley County
The most frequent times of departure to work in Greeley County are 7:30 AM to 7:59 AM (157, 30.7%) for males and 7:30 AM to 7:59 AM (90, 25.2%) for females.
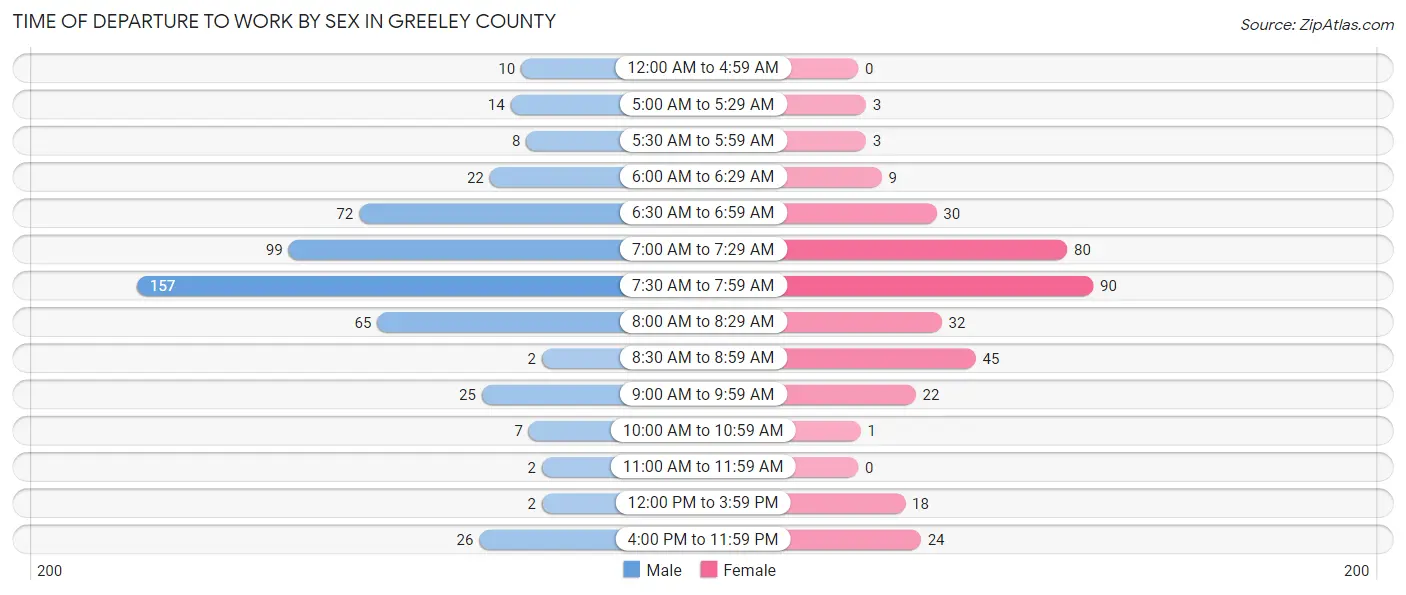
| Time of Departure | Male | Female |
| 12:00 AM to 4:59 AM | 10 (2.0%) | 0 (0.0%) |
| 5:00 AM to 5:29 AM | 14 (2.7%) | 3 (0.8%) |
| 5:30 AM to 5:59 AM | 8 (1.6%) | 3 (0.8%) |
| 6:00 AM to 6:29 AM | 22 (4.3%) | 9 (2.5%) |
| 6:30 AM to 6:59 AM | 72 (14.1%) | 30 (8.4%) |
| 7:00 AM to 7:29 AM | 99 (19.4%) | 80 (22.4%) |
| 7:30 AM to 7:59 AM | 157 (30.7%) | 90 (25.2%) |
| 8:00 AM to 8:29 AM | 65 (12.7%) | 32 (9.0%) |
| 8:30 AM to 8:59 AM | 2 (0.4%) | 45 (12.6%) |
| 9:00 AM to 9:59 AM | 25 (4.9%) | 22 (6.2%) |
| 10:00 AM to 10:59 AM | 7 (1.4%) | 1 (0.3%) |
| 11:00 AM to 11:59 AM | 2 (0.4%) | 0 (0.0%) |
| 12:00 PM to 3:59 PM | 2 (0.4%) | 18 (5.0%) |
| 4:00 PM to 11:59 PM | 26 (5.1%) | 24 (6.7%) |
| Total | 511 (100.0%) | 357 (100.0%) |
Housing Occupancy in Greeley County
Occupancy by Ownership in Greeley County
Of the total 907 dwellings in Greeley County, owner-occupied units account for 748 (82.5%), while renter-occupied units make up 159 (17.5%).
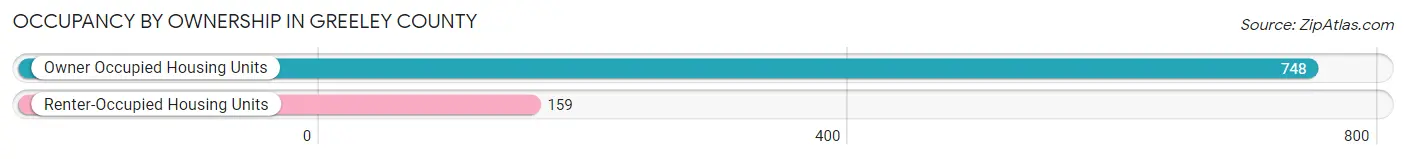
| Occupancy | # Housing Units | % Housing Units |
| Owner Occupied Housing Units | 748 | 82.5% |
| Renter-Occupied Housing Units | 159 | 17.5% |
| Total Occupied Housing Units | 907 | 100.0% |
Occupancy by Household Size in Greeley County
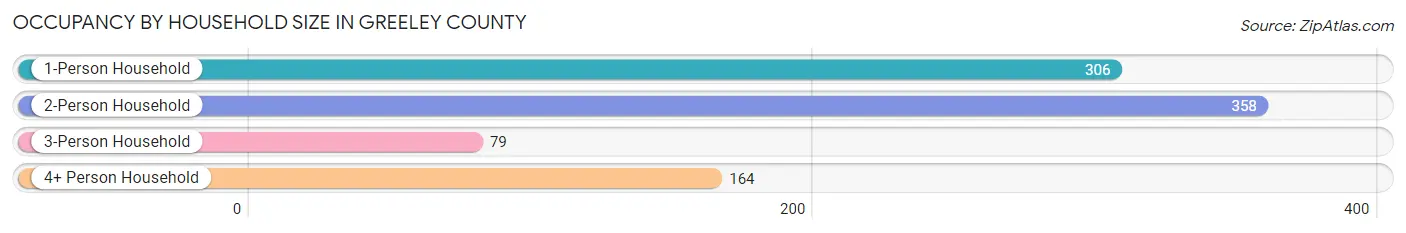
| Household Size | # Housing Units | % Housing Units |
| 1-Person Household | 306 | 33.7% |
| 2-Person Household | 358 | 39.5% |
| 3-Person Household | 79 | 8.7% |
| 4+ Person Household | 164 | 18.1% |
| Total Housing Units | 907 | 100.0% |
Occupancy by Ownership by Household Size in Greeley County
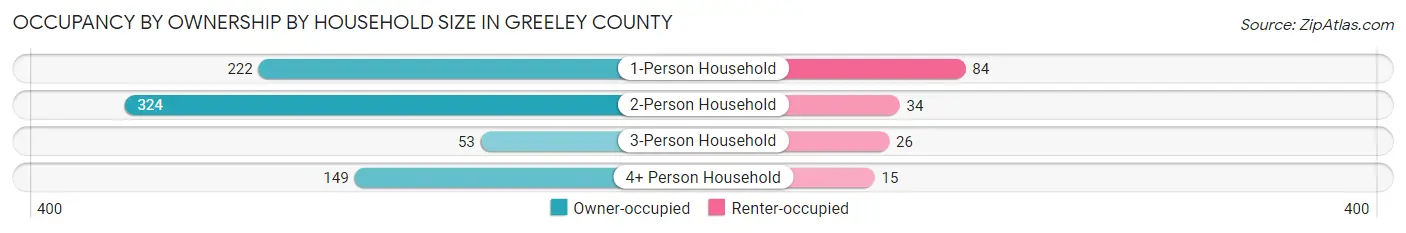
| Household Size | Owner-occupied | Renter-occupied |
| 1-Person Household | 222 (72.6%) | 84 (27.5%) |
| 2-Person Household | 324 (90.5%) | 34 (9.5%) |
| 3-Person Household | 53 (67.1%) | 26 (32.9%) |
| 4+ Person Household | 149 (90.8%) | 15 (9.1%) |
| Total Housing Units | 748 (82.5%) | 159 (17.5%) |
Occupancy by Educational Attainment in Greeley County
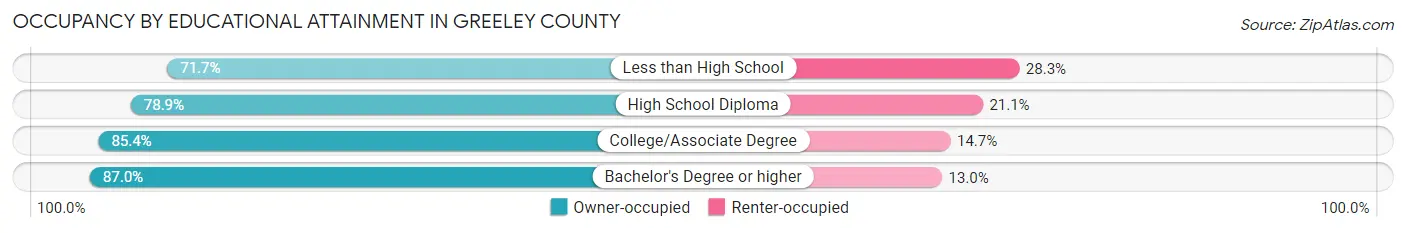
| Household Size | Owner-occupied | Renter-occupied |
| Less than High School | 38 (71.7%) | 15 (28.3%) |
| High School Diploma | 266 (78.9%) | 71 (21.1%) |
| College/Associate Degree | 303 (85.4%) | 52 (14.6%) |
| Bachelor's Degree or higher | 141 (87.0%) | 21 (13.0%) |
Occupancy by Age of Householder in Greeley County
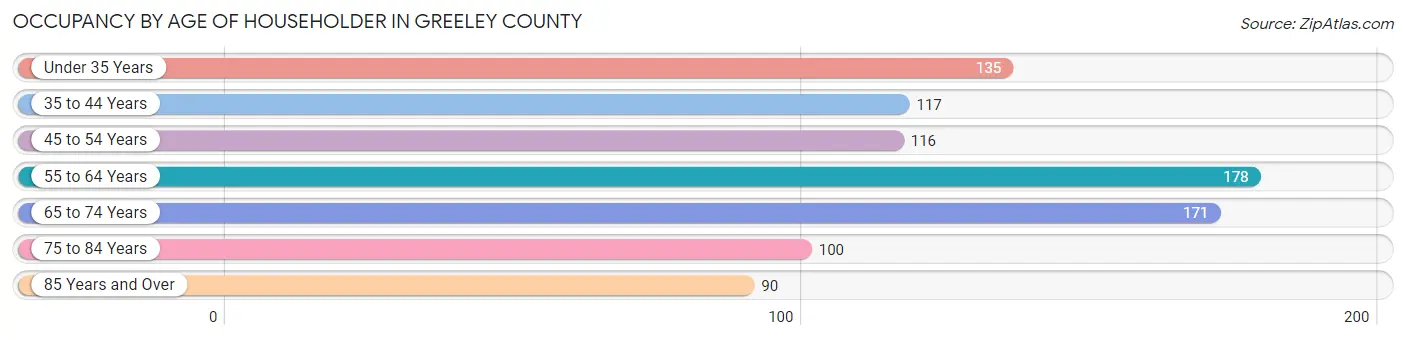
| Age Bracket | # Households | % Households |
| Under 35 Years | 135 | 14.9% |
| 35 to 44 Years | 117 | 12.9% |
| 45 to 54 Years | 116 | 12.8% |
| 55 to 64 Years | 178 | 19.6% |
| 65 to 74 Years | 171 | 18.9% |
| 75 to 84 Years | 100 | 11.0% |
| 85 Years and Over | 90 | 9.9% |
| Total | 907 | 100.0% |
Housing Finances in Greeley County
Median Income by Occupancy in Greeley County
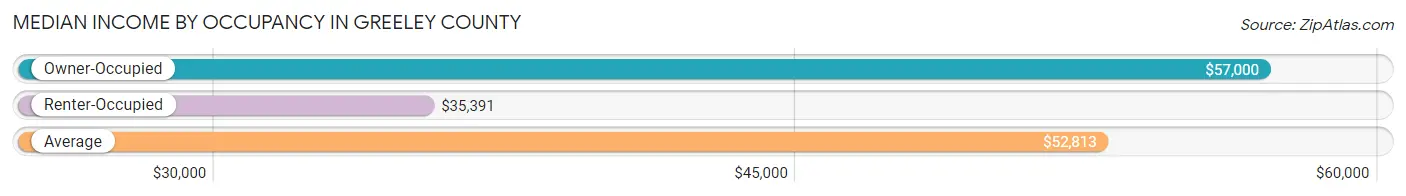
| Occupancy Type | # Households | Median Income |
| Owner-Occupied | 748 (82.5%) | $57,000 |
| Renter-Occupied | 159 (17.5%) | $35,391 |
| Average | 907 (100.0%) | $52,813 |
Occupancy by Householder Income Bracket in Greeley County
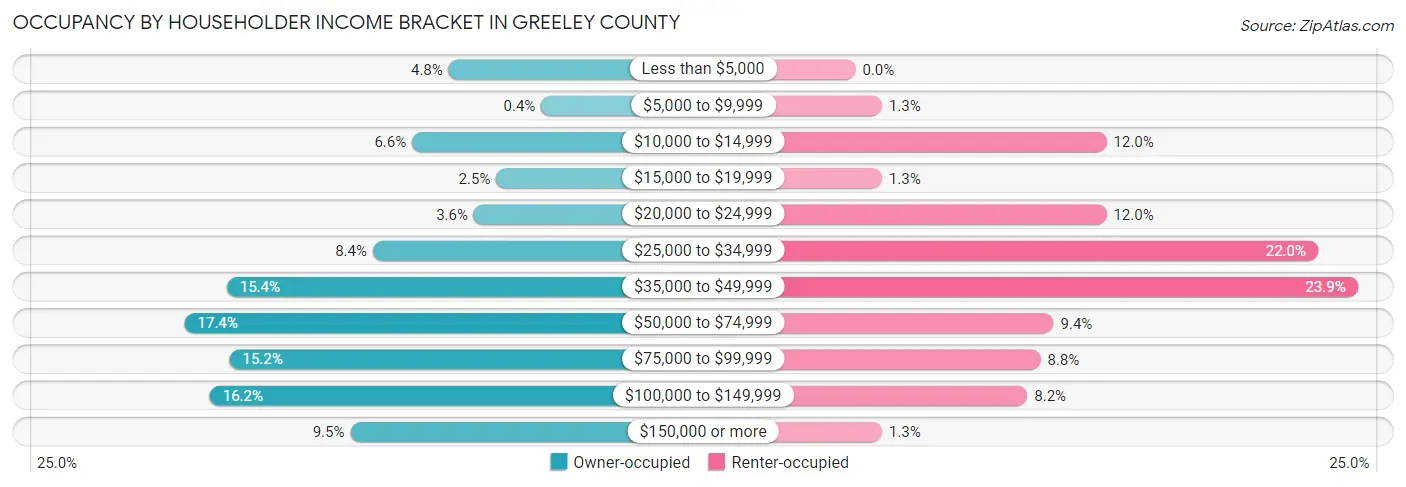
| Income Bracket | Owner-occupied | Renter-occupied |
| Less than $5,000 | 36 (4.8%) | 0 (0.0%) |
| $5,000 to $9,999 | 3 (0.4%) | 2 (1.3%) |
| $10,000 to $14,999 | 49 (6.6%) | 19 (11.9%) |
| $15,000 to $19,999 | 19 (2.5%) | 2 (1.3%) |
| $20,000 to $24,999 | 27 (3.6%) | 19 (11.9%) |
| $25,000 to $34,999 | 63 (8.4%) | 35 (22.0%) |
| $35,000 to $49,999 | 115 (15.4%) | 38 (23.9%) |
| $50,000 to $74,999 | 130 (17.4%) | 15 (9.4%) |
| $75,000 to $99,999 | 114 (15.2%) | 14 (8.8%) |
| $100,000 to $149,999 | 121 (16.2%) | 13 (8.2%) |
| $150,000 or more | 71 (9.5%) | 2 (1.3%) |
| Total | 748 (100.0%) | 159 (100.0%) |
Monthly Housing Cost Tiers in Greeley County
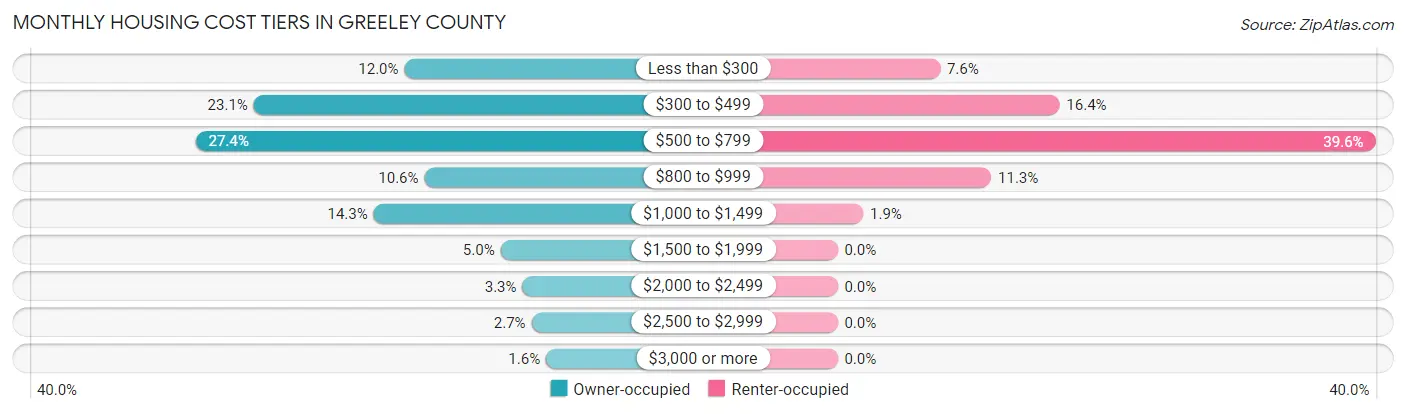
| Monthly Cost | Owner-occupied | Renter-occupied |
| Less than $300 | 90 (12.0%) | 12 (7.5%) |
| $300 to $499 | 173 (23.1%) | 26 (16.4%) |
| $500 to $799 | 205 (27.4%) | 63 (39.6%) |
| $800 to $999 | 79 (10.6%) | 18 (11.3%) |
| $1,000 to $1,499 | 107 (14.3%) | 3 (1.9%) |
| $1,500 to $1,999 | 37 (5.0%) | 0 (0.0%) |
| $2,000 to $2,499 | 25 (3.3%) | 0 (0.0%) |
| $2,500 to $2,999 | 20 (2.7%) | 0 (0.0%) |
| $3,000 or more | 12 (1.6%) | 0 (0.0%) |
| Total | 748 (100.0%) | 159 (100.0%) |
Physical Housing Characteristics in Greeley County
Housing Structures in Greeley County
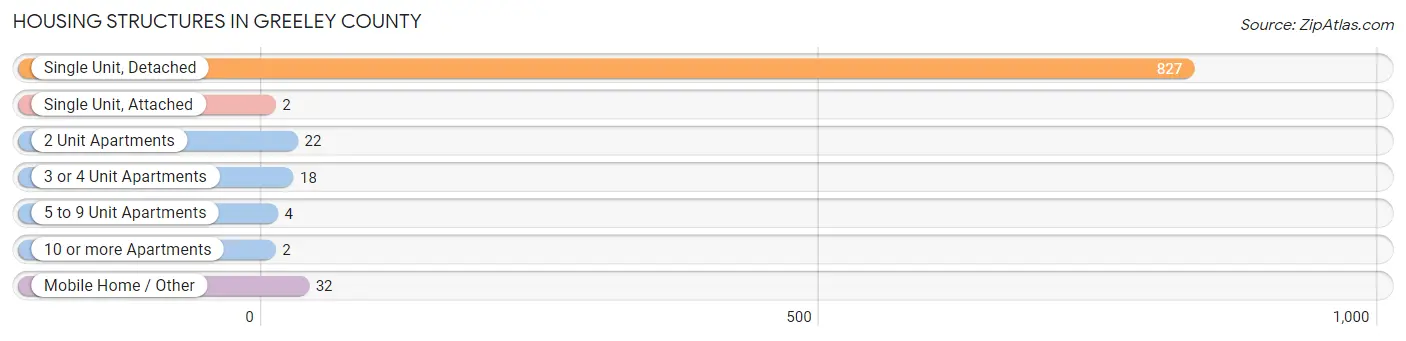
| Structure Type | # Housing Units | % Housing Units |
| Single Unit, Detached | 827 | 91.2% |
| Single Unit, Attached | 2 | 0.2% |
| 2 Unit Apartments | 22 | 2.4% |
| 3 or 4 Unit Apartments | 18 | 2.0% |
| 5 to 9 Unit Apartments | 4 | 0.4% |
| 10 or more Apartments | 2 | 0.2% |
| Mobile Home / Other | 32 | 3.5% |
| Total | 907 | 100.0% |
Housing Structures by Occupancy in Greeley County
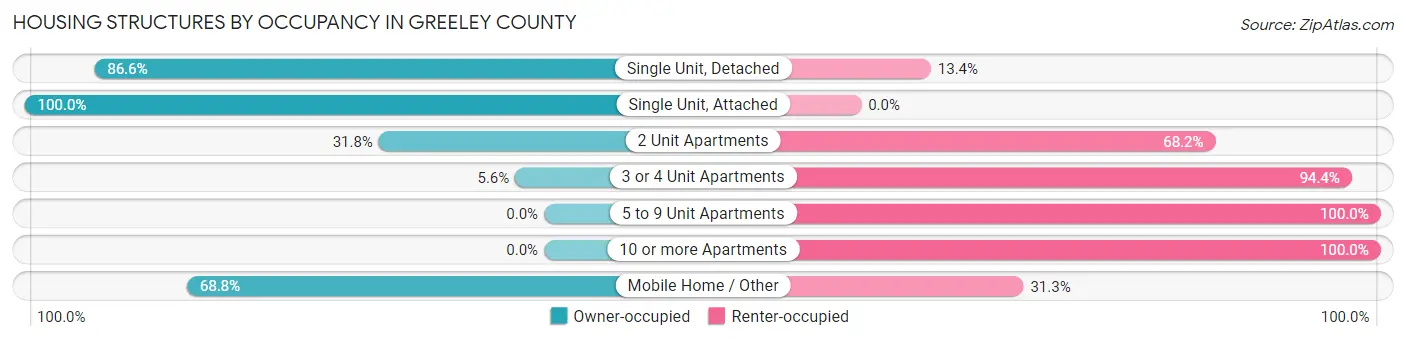
| Structure Type | Owner-occupied | Renter-occupied |
| Single Unit, Detached | 716 (86.6%) | 111 (13.4%) |
| Single Unit, Attached | 2 (100.0%) | 0 (0.0%) |
| 2 Unit Apartments | 7 (31.8%) | 15 (68.2%) |
| 3 or 4 Unit Apartments | 1 (5.6%) | 17 (94.4%) |
| 5 to 9 Unit Apartments | 0 (0.0%) | 4 (100.0%) |
| 10 or more Apartments | 0 (0.0%) | 2 (100.0%) |
| Mobile Home / Other | 22 (68.8%) | 10 (31.2%) |
| Total | 748 (82.5%) | 159 (17.5%) |
Housing Structures by Number of Rooms in Greeley County
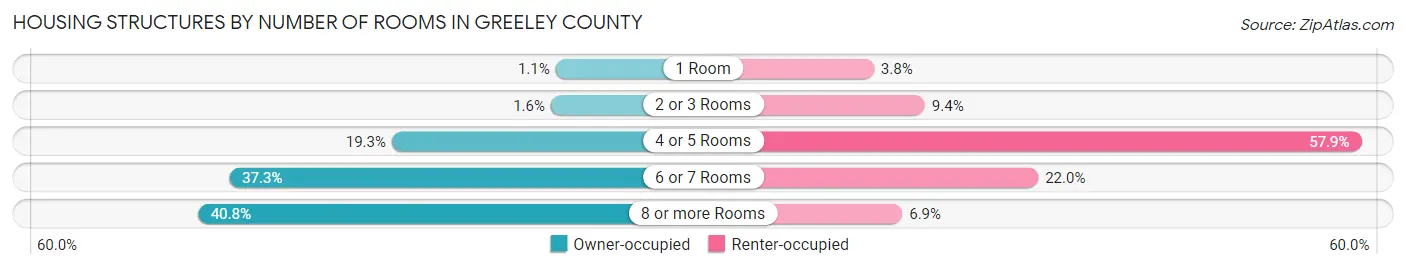
| Number of Rooms | Owner-occupied | Renter-occupied |
| 1 Room | 8 (1.1%) | 6 (3.8%) |
| 2 or 3 Rooms | 12 (1.6%) | 15 (9.4%) |
| 4 or 5 Rooms | 144 (19.3%) | 92 (57.9%) |
| 6 or 7 Rooms | 279 (37.3%) | 35 (22.0%) |
| 8 or more Rooms | 305 (40.8%) | 11 (6.9%) |
| Total | 748 (100.0%) | 159 (100.0%) |
Housing Structure by Heating Type in Greeley County
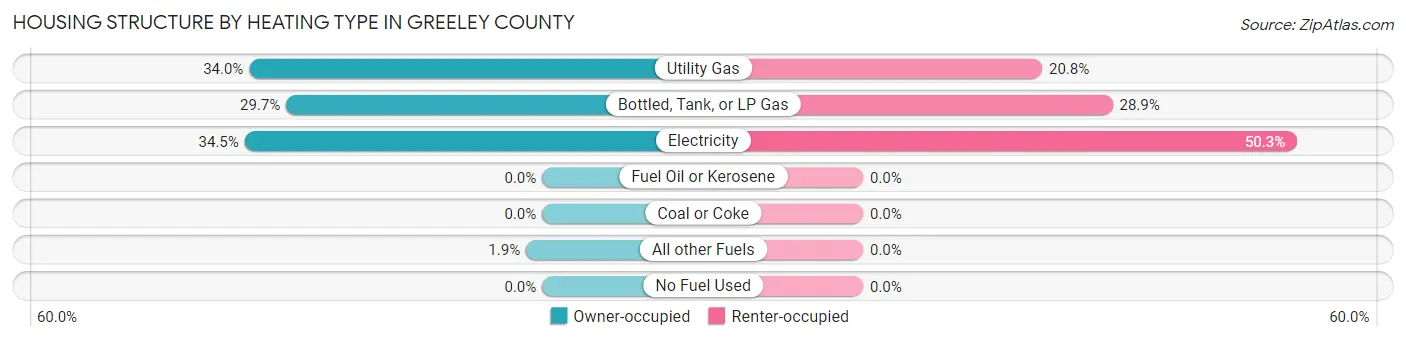
| Heating Type | Owner-occupied | Renter-occupied |
| Utility Gas | 254 (34.0%) | 33 (20.7%) |
| Bottled, Tank, or LP Gas | 222 (29.7%) | 46 (28.9%) |
| Electricity | 258 (34.5%) | 80 (50.3%) |
| Fuel Oil or Kerosene | 0 (0.0%) | 0 (0.0%) |
| Coal or Coke | 0 (0.0%) | 0 (0.0%) |
| All other Fuels | 14 (1.9%) | 0 (0.0%) |
| No Fuel Used | 0 (0.0%) | 0 (0.0%) |
| Total | 748 (100.0%) | 159 (100.0%) |
Household Vehicle Usage in Greeley County
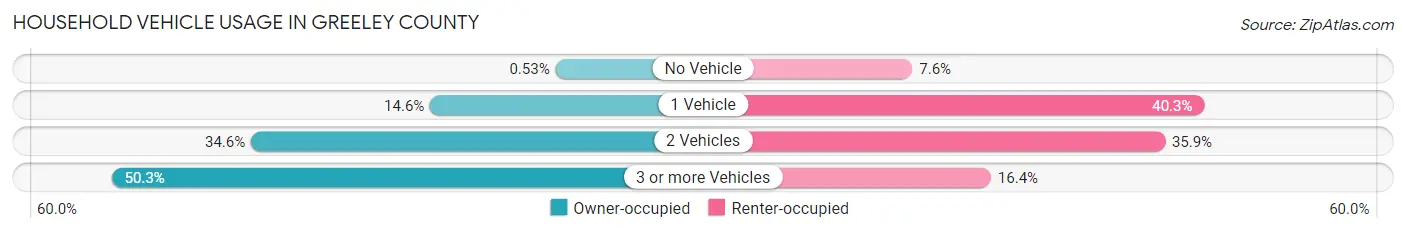
| Vehicles per Household | Owner-occupied | Renter-occupied |
| No Vehicle | 4 (0.5%) | 12 (7.5%) |
| 1 Vehicle | 109 (14.6%) | 64 (40.3%) |
| 2 Vehicles | 259 (34.6%) | 57 (35.8%) |
| 3 or more Vehicles | 376 (50.3%) | 26 (16.4%) |
| Total | 748 (100.0%) | 159 (100.0%) |
Real Estate & Mortgages in Greeley County
Real Estate and Mortgage Overview in Greeley County
| Characteristic | Without Mortgage | With Mortgage |
| Housing Units | 495 | 253 |
| Median Property Value | $61,900 | $116,000 |
| Median Household Income | $54,766 | $28 |
| Monthly Housing Costs | $492 | $12 |
| Real Estate Taxes | $1,209 | $11 |
Property Value by Mortgage Status in Greeley County
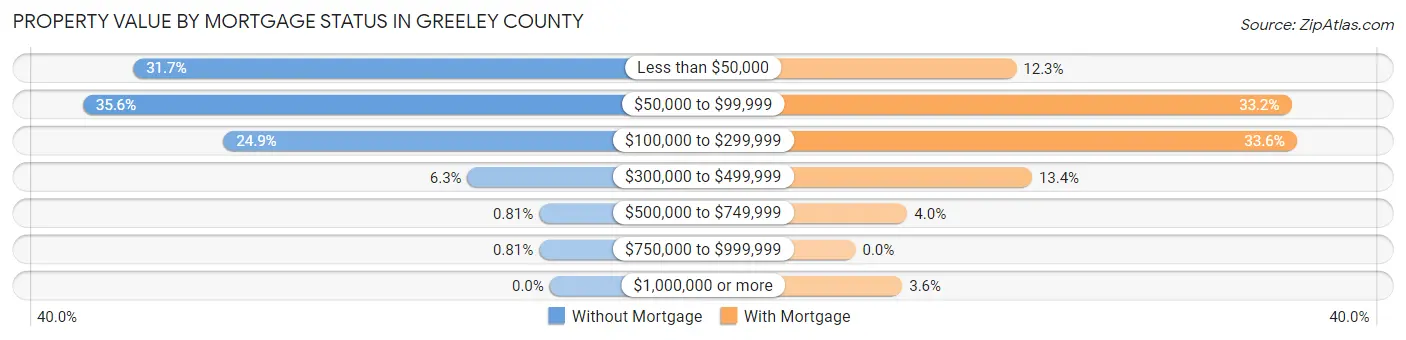
| Property Value | Without Mortgage | With Mortgage |
| Less than $50,000 | 157 (31.7%) | 31 (12.2%) |
| $50,000 to $99,999 | 176 (35.6%) | 84 (33.2%) |
| $100,000 to $299,999 | 123 (24.8%) | 85 (33.6%) |
| $300,000 to $499,999 | 31 (6.3%) | 34 (13.4%) |
| $500,000 to $749,999 | 4 (0.8%) | 10 (4.0%) |
| $750,000 to $999,999 | 4 (0.8%) | 0 (0.0%) |
| $1,000,000 or more | 0 (0.0%) | 9 (3.6%) |
| Total | 495 (100.0%) | 253 (100.0%) |
Household Income by Mortgage Status in Greeley County
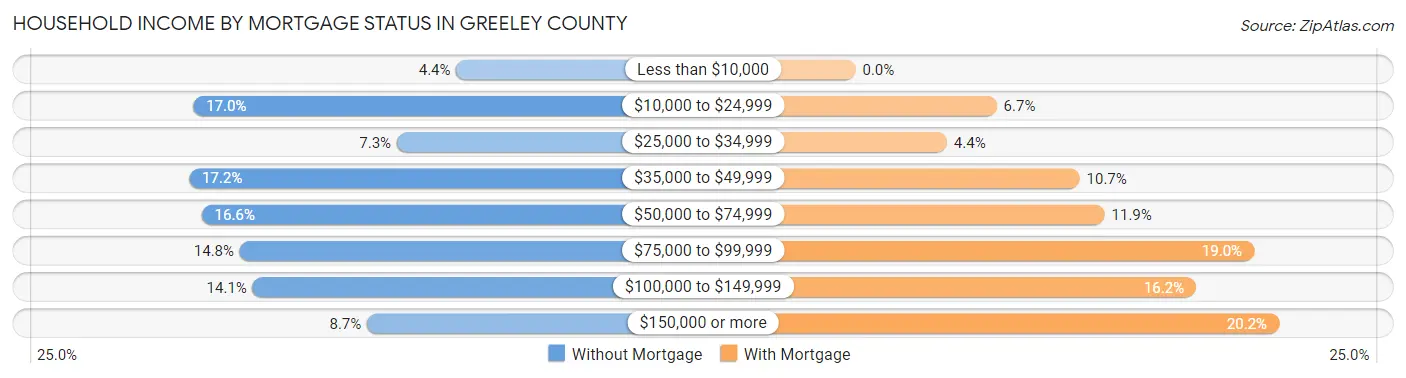
| Household Income | Without Mortgage | With Mortgage |
| Less than $10,000 | 22 (4.4%) | 0 (0.0%) |
| $10,000 to $24,999 | 84 (17.0%) | 17 (6.7%) |
| $25,000 to $34,999 | 36 (7.3%) | 11 (4.3%) |
| $35,000 to $49,999 | 85 (17.2%) | 27 (10.7%) |
| $50,000 to $74,999 | 82 (16.6%) | 30 (11.9%) |
| $75,000 to $99,999 | 73 (14.7%) | 48 (19.0%) |
| $100,000 to $149,999 | 70 (14.1%) | 41 (16.2%) |
| $150,000 or more | 43 (8.7%) | 51 (20.2%) |
| Total | 495 (100.0%) | 253 (100.0%) |
Property Value to Household Income Ratio in Greeley County
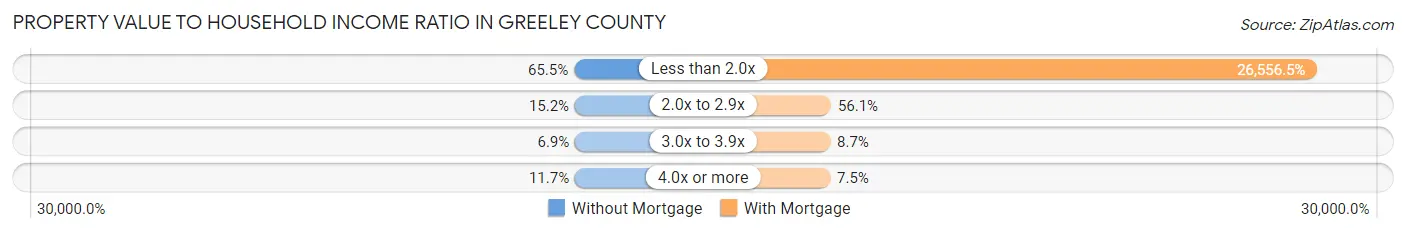
| Value-to-Income Ratio | Without Mortgage | With Mortgage |
| Less than 2.0x | 324 (65.4%) | 67,188 (26,556.5%) |
| 2.0x to 2.9x | 75 (15.1%) | 142 (56.1%) |
| 3.0x to 3.9x | 34 (6.9%) | 22 (8.7%) |
| 4.0x or more | 58 (11.7%) | 19 (7.5%) |
| Total | 495 (100.0%) | 253 (100.0%) |
Real Estate Taxes by Mortgage Status in Greeley County
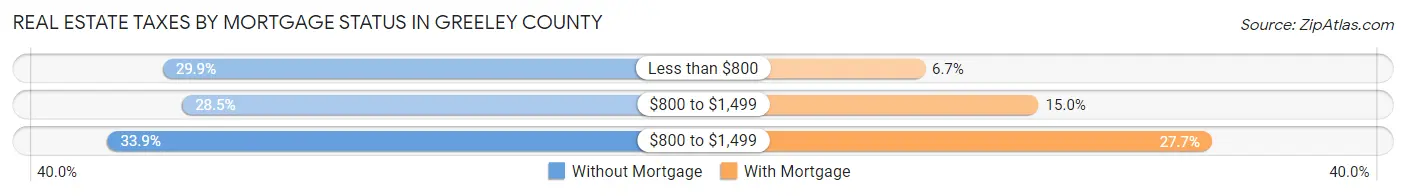
| Property Taxes | Without Mortgage | With Mortgage |
| Less than $800 | 148 (29.9%) | 17 (6.7%) |
| $800 to $1,499 | 141 (28.5%) | 38 (15.0%) |
| $800 to $1,499 | 168 (33.9%) | 70 (27.7%) |
| Total | 495 (100.0%) | 253 (100.0%) |
Health & Disability in Greeley County
Health Insurance Coverage by Age in Greeley County
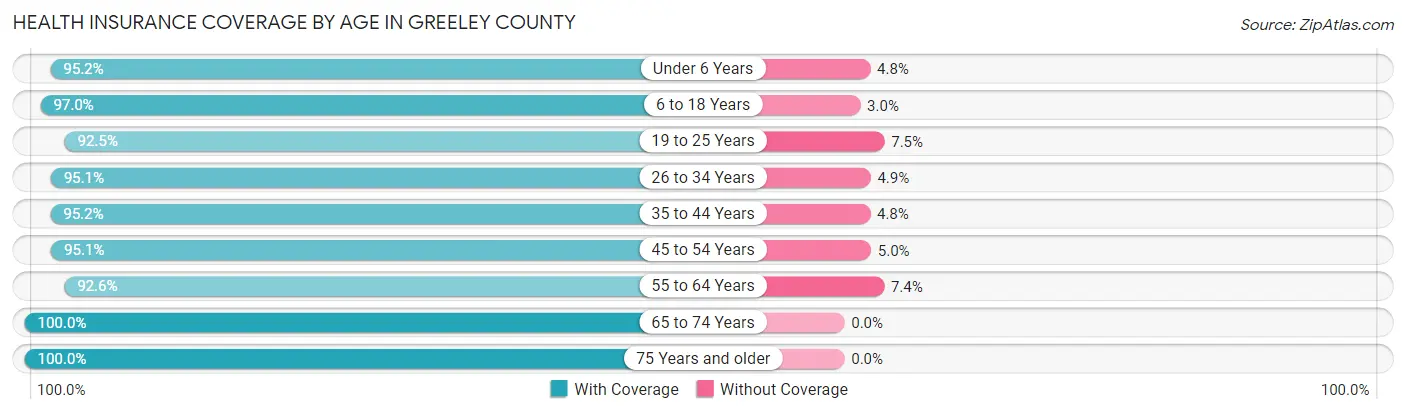
| Age Bracket | With Coverage | Without Coverage |
| Under 6 Years | 178 (95.2%) | 9 (4.8%) |
| 6 to 18 Years | 361 (97.0%) | 11 (3.0%) |
| 19 to 25 Years | 124 (92.5%) | 10 (7.5%) |
| 26 to 34 Years | 195 (95.1%) | 10 (4.9%) |
| 35 to 44 Years | 218 (95.2%) | 11 (4.8%) |
| 45 to 54 Years | 192 (95.1%) | 10 (5.0%) |
| 55 to 64 Years | 288 (92.6%) | 23 (7.4%) |
| 65 to 74 Years | 288 (100.0%) | 0 (0.0%) |
| 75 Years and older | 253 (100.0%) | 0 (0.0%) |
| Total | 2,097 (96.2%) | 84 (3.8%) |
Health Insurance Coverage by Citizenship Status in Greeley County
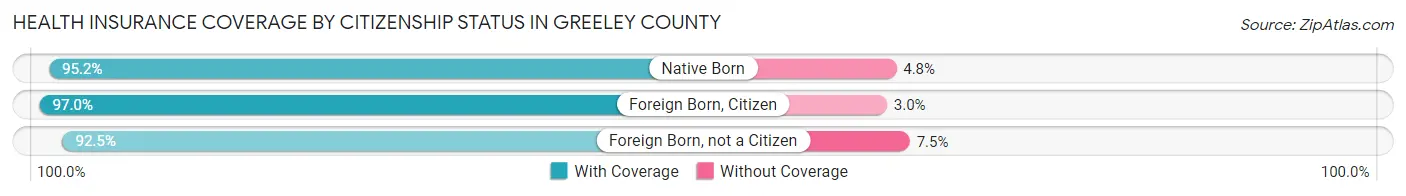
| Citizenship Status | With Coverage | Without Coverage |
| Native Born | 178 (95.2%) | 9 (4.8%) |
| Foreign Born, Citizen | 361 (97.0%) | 11 (3.0%) |
| Foreign Born, not a Citizen | 124 (92.5%) | 10 (7.5%) |
Health Insurance Coverage by Household Income in Greeley County
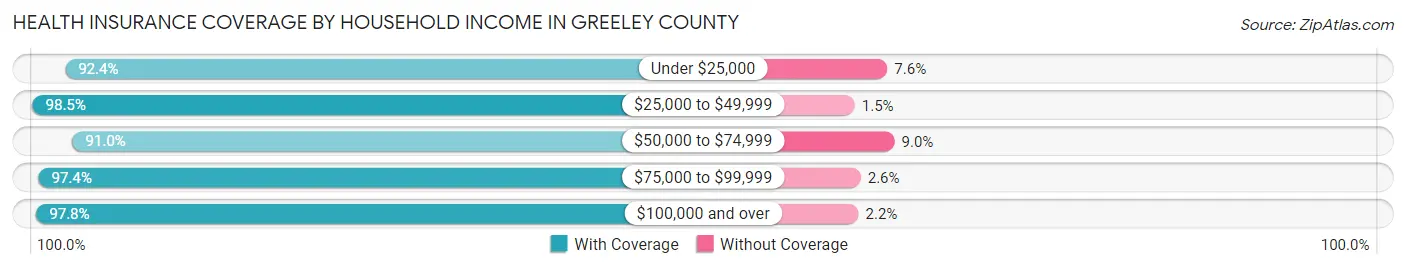
| Household Income | With Coverage | Without Coverage |
| Under $25,000 | 255 (92.4%) | 21 (7.6%) |
| $25,000 to $49,999 | 521 (98.5%) | 8 (1.5%) |
| $50,000 to $74,999 | 315 (91.0%) | 31 (9.0%) |
| $75,000 to $99,999 | 297 (97.4%) | 8 (2.6%) |
| $100,000 and over | 709 (97.8%) | 16 (2.2%) |
Public vs Private Health Insurance Coverage by Age in Greeley County
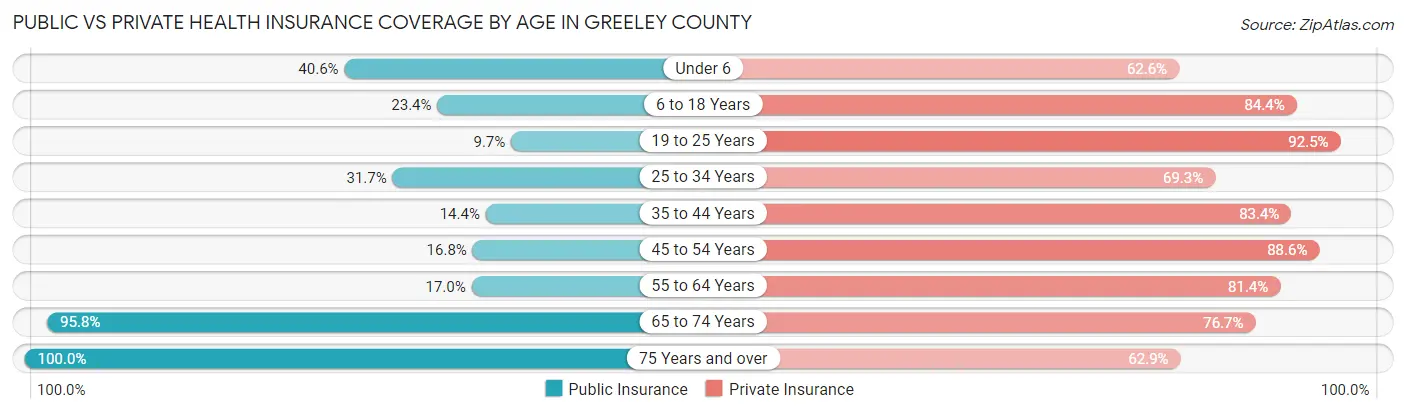
| Age Bracket | Public Insurance | Private Insurance |
| Under 6 | 76 (40.6%) | 117 (62.6%) |
| 6 to 18 Years | 87 (23.4%) | 314 (84.4%) |
| 19 to 25 Years | 13 (9.7%) | 124 (92.5%) |
| 25 to 34 Years | 65 (31.7%) | 142 (69.3%) |
| 35 to 44 Years | 33 (14.4%) | 191 (83.4%) |
| 45 to 54 Years | 34 (16.8%) | 179 (88.6%) |
| 55 to 64 Years | 53 (17.0%) | 253 (81.4%) |
| 65 to 74 Years | 276 (95.8%) | 221 (76.7%) |
| 75 Years and over | 253 (100.0%) | 159 (62.8%) |
| Total | 890 (40.8%) | 1,700 (77.9%) |
Disability Status by Sex by Age in Greeley County
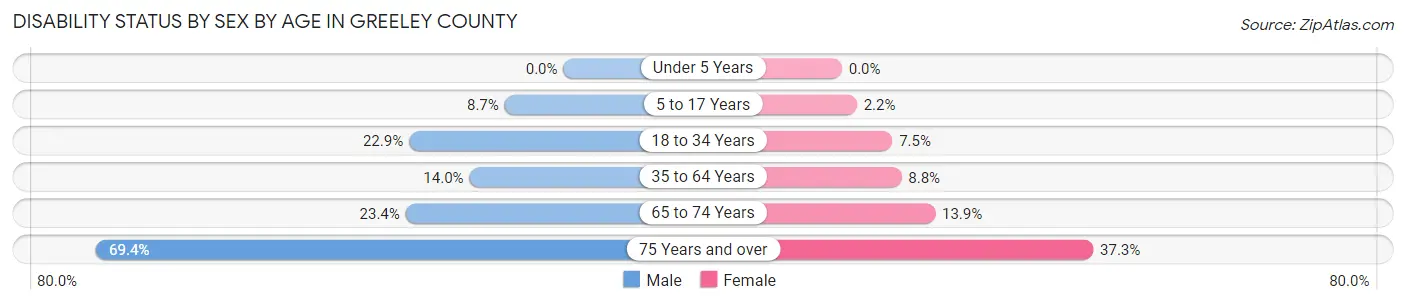
| Age Bracket | Male | Female |
| Under 5 Years | 0 (0.0%) | 0 (0.0%) |
| 5 to 17 Years | 17 (8.7%) | 4 (2.2%) |
| 18 to 34 Years | 44 (22.9%) | 14 (7.5%) |
| 35 to 64 Years | 53 (14.0%) | 32 (8.8%) |
| 65 to 74 Years | 37 (23.4%) | 18 (13.9%) |
| 75 Years and over | 77 (69.4%) | 53 (37.3%) |
Disability Class by Sex by Age in Greeley County
Disability Class: Hearing Difficulty
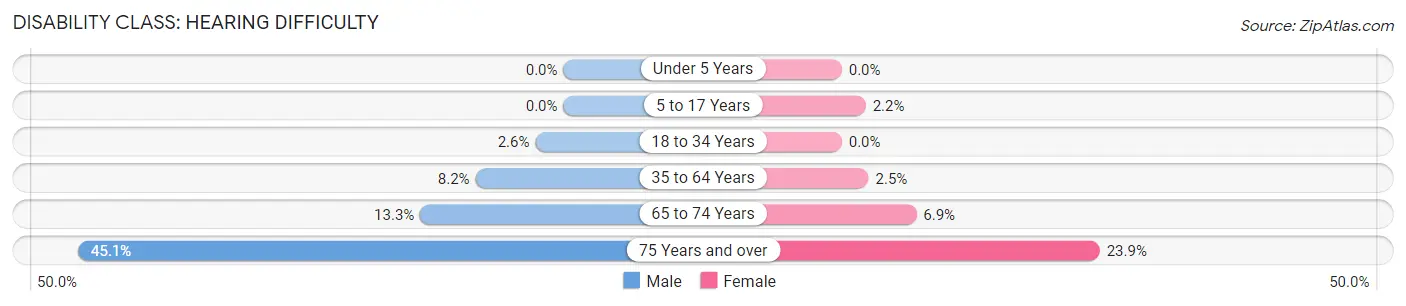
| Age Bracket | Male | Female |
| Under 5 Years | 0 (0.0%) | 0 (0.0%) |
| 5 to 17 Years | 0 (0.0%) | 4 (2.2%) |
| 18 to 34 Years | 5 (2.6%) | 0 (0.0%) |
| 35 to 64 Years | 31 (8.2%) | 9 (2.5%) |
| 65 to 74 Years | 21 (13.3%) | 9 (6.9%) |
| 75 Years and over | 50 (45.1%) | 34 (23.9%) |
Disability Class: Vision Difficulty
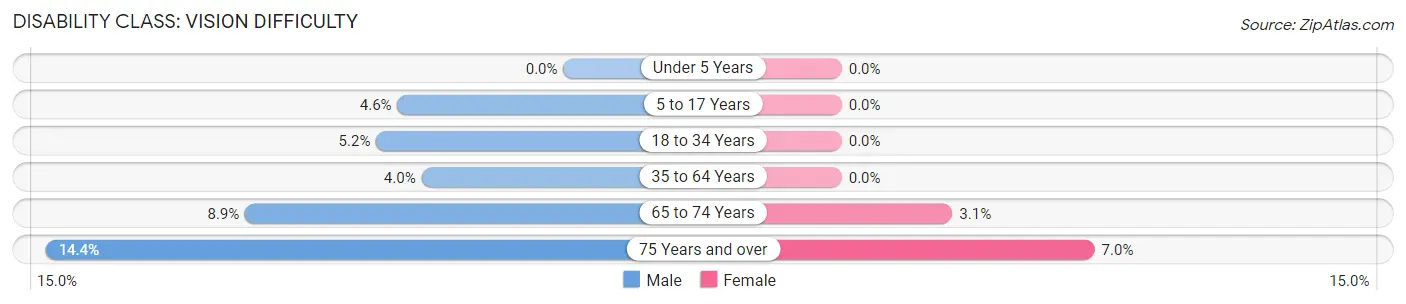
| Age Bracket | Male | Female |
| Under 5 Years | 0 (0.0%) | 0 (0.0%) |
| 5 to 17 Years | 9 (4.6%) | 0 (0.0%) |
| 18 to 34 Years | 10 (5.2%) | 0 (0.0%) |
| 35 to 64 Years | 15 (4.0%) | 0 (0.0%) |
| 65 to 74 Years | 14 (8.9%) | 4 (3.1%) |
| 75 Years and over | 16 (14.4%) | 10 (7.0%) |
Disability Class: Cognitive Difficulty
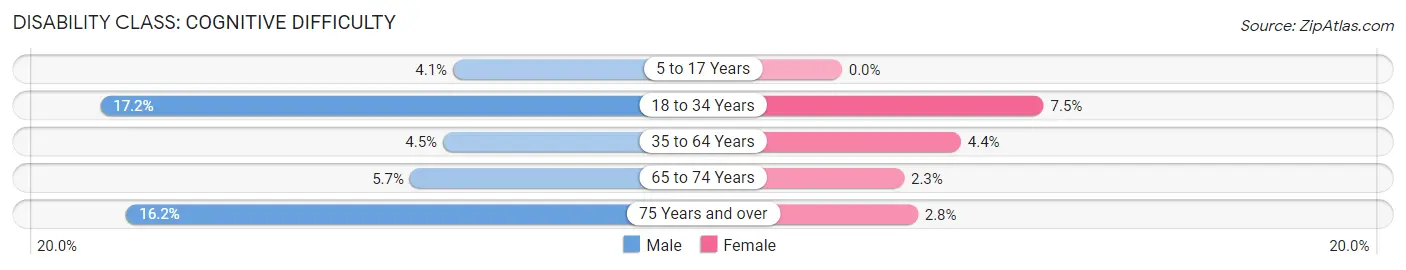
| Age Bracket | Male | Female |
| 5 to 17 Years | 8 (4.1%) | 0 (0.0%) |
| 18 to 34 Years | 33 (17.2%) | 14 (7.5%) |
| 35 to 64 Years | 17 (4.5%) | 16 (4.4%) |
| 65 to 74 Years | 9 (5.7%) | 3 (2.3%) |
| 75 Years and over | 18 (16.2%) | 4 (2.8%) |
Disability Class: Ambulatory Difficulty
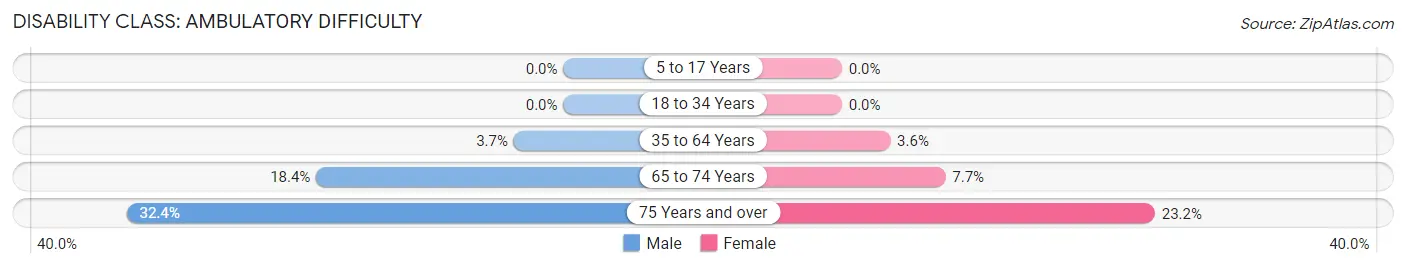
| Age Bracket | Male | Female |
| 5 to 17 Years | 0 (0.0%) | 0 (0.0%) |
| 18 to 34 Years | 0 (0.0%) | 0 (0.0%) |
| 35 to 64 Years | 14 (3.7%) | 13 (3.6%) |
| 65 to 74 Years | 29 (18.3%) | 10 (7.7%) |
| 75 Years and over | 36 (32.4%) | 33 (23.2%) |
Disability Class: Self-Care Difficulty
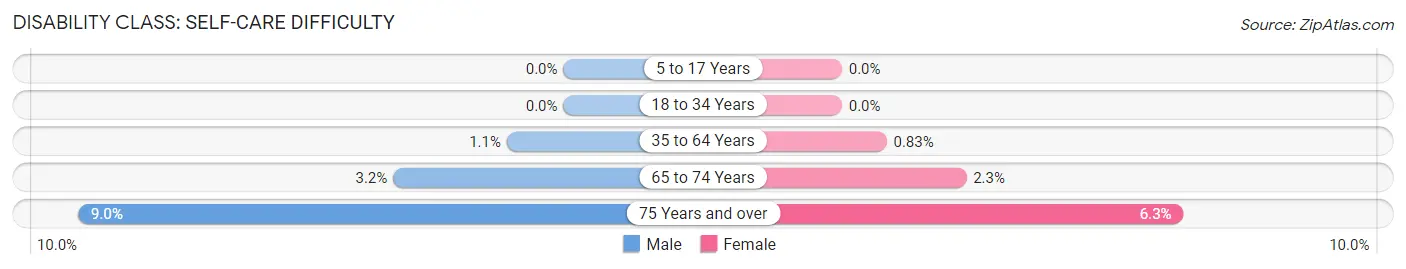
| Age Bracket | Male | Female |
| 5 to 17 Years | 0 (0.0%) | 0 (0.0%) |
| 18 to 34 Years | 0 (0.0%) | 0 (0.0%) |
| 35 to 64 Years | 4 (1.1%) | 3 (0.8%) |
| 65 to 74 Years | 5 (3.2%) | 3 (2.3%) |
| 75 Years and over | 10 (9.0%) | 9 (6.3%) |
Technology Access in Greeley County
Computing Device Access in Greeley County
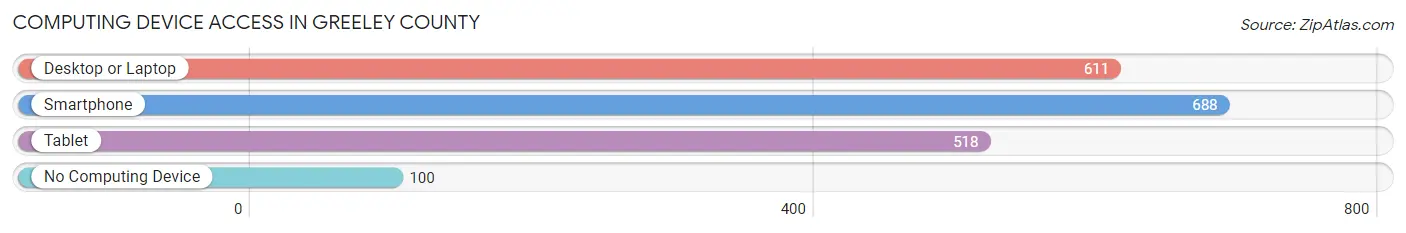
| Device Type | # Households | % Households |
| Desktop or Laptop | 611 | 67.4% |
| Smartphone | 688 | 75.8% |
| Tablet | 518 | 57.1% |
| No Computing Device | 100 | 11.0% |
| Total | 907 | 100.0% |
Internet Access in Greeley County
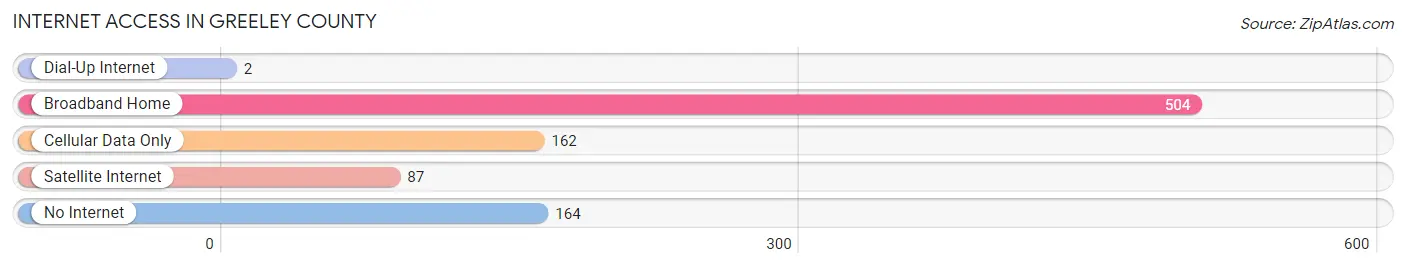
| Internet Type | # Households | % Households |
| Dial-Up Internet | 2 | 0.2% |
| Broadband Home | 504 | 55.6% |
| Cellular Data Only | 162 | 17.9% |
| Satellite Internet | 87 | 9.6% |
| No Internet | 164 | 18.1% |
| Total | 907 | 100.0% |
Greeley County Summary
Greeley County is located in the state of Nebraska in the Midwestern United States. It is bordered by Wheeler County to the north, Howard County to the east, Valley County to the south, and Sherman County to the west. The county seat is Spalding, and the largest city is Greeley. As of the 2010 census, the population was 1,541, making it the second-least populous county in Nebraska.
Geography
Greeley County is located in the Sandhills region of Nebraska. The county has a total area of 576 square miles, of which 575 square miles is land and 1.2 square miles (0.2%) is water. The terrain is generally flat, with some rolling hills in the western part of the county. The county is drained by the North Loup River, which flows through the center of the county.
Climate
Greeley County has a semi-arid climate, with hot summers and cold winters. Average temperatures range from a low of 16°F in January to a high of 86°F in July. Average annual precipitation is around 20 inches.
Demographics
As of the 2010 census, there were 1,541 people, 645 households, and 441 families residing in the county. The population density was 2.7 people per square mile. The racial makeup of the county was 97.2% White, 0.3% Native American, 0.2% Asian, 0.1% Black or African American, 0.1% Pacific Islander, 0.7% from other races, and 1.4% from two or more races. Hispanic or Latino of any race were 2.2% of the population.
Economy
Greeley County is primarily an agricultural county, with the majority of the population employed in farming and ranching. The county is also home to several small businesses, including a lumber yard, a feed store, and a hardware store. The county is also home to a wind farm, which generates electricity for the region.
History
Greeley County was established in 1873 and named after Horace Greeley, the editor of the New York Tribune. The county was originally part of Wheeler County, but was split off in 1873. The county seat was originally located in the town of Greeley, but was moved to Spalding in 1877.
In the late 19th century, the county was home to several small towns, including Greeley, Spalding, and Scotia. The county was also home to several Native American tribes, including the Omaha, Pawnee, and Otoe.
In the early 20th century, the county was home to several small businesses, including a lumber yard, a feed store, and a hardware store. The county was also home to several small farms, which grew wheat, corn, and other crops.
In the late 20th century, the county was home to a wind farm, which generates electricity for the region. The county is also home to several small businesses, including a lumber yard, a feed store, and a hardware store.
Today, Greeley County is a rural county with a population of 1,541. The county is home to several small businesses, including a lumber yard, a feed store, and a hardware store. The county is also home to a wind farm, which generates electricity for the region.
Common Questions
What is Per Capita Income in Greeley County?
Per Capita income in Greeley County is $28,736.
What is the Median Family Income in Greeley County?
Median Family Income in Greeley County is $76,500.
What is the Median Household income in Greeley County?
Median Household Income in Greeley County is $52,813.
What is Income or Wage Gap in Greeley County?
Income or Wage Gap in Greeley County is 29.7%.
Women in Greeley County earn 70.3 cents for every dollar earned by a man.
What is Family Income Deficit in Greeley County?
Family Income Deficit in Greeley County is $13,052.
Families that are below poverty line in Greeley County earn $13,052 less on average than the poverty threshold level.
What is Inequality or Gini Index in Greeley County?
Inequality or Gini Index in Greeley County is 0.41.
What is the Total Population of Greeley County?
Total Population of Greeley County is 2,212.
What is the Total Male Population of Greeley County?
Total Male Population of Greeley County is 1,134.
What is the Total Female Population of Greeley County?
Total Female Population of Greeley County is 1,078.
What is the Ratio of Males per 100 Females in Greeley County?
There are 105.19 Males per 100 Females in Greeley County.
What is the Ratio of Females per 100 Males in Greeley County?
There are 95.06 Females per 100 Males in Greeley County.
What is the Median Population Age in Greeley County?
Median Population Age in Greeley County is 43.6 Years.
What is the Average Family Size in Greeley County
Average Family Size in Greeley County is 3.1 People.
What is the Average Household Size in Greeley County
Average Household Size in Greeley County is 2.4 People.
How Large is the Labor Force in Greeley County?
There are 1,009 People in the Labor Forcein in Greeley County.
What is the Percentage of People in the Labor Force in Greeley County?
57.8% of People are in the Labor Force in Greeley County.
What is the Unemployment Rate in Greeley County?
Unemployment Rate in Greeley County is 1.8%.