Furnas County, NE Map & Demographics
Furnas County Map
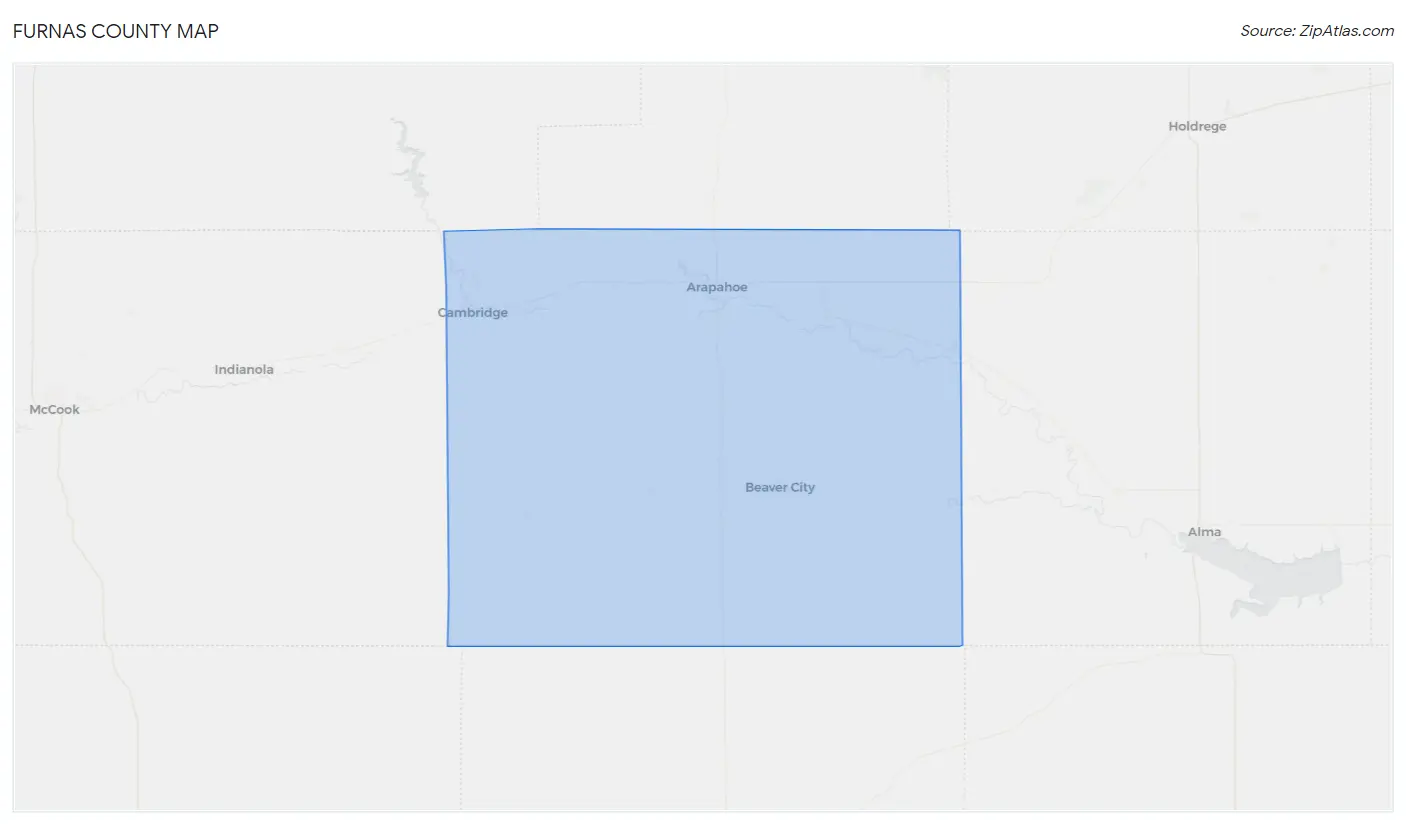
Furnas County Overview
$32,494
PER CAPITA INCOME
$71,602
AVG FAMILY INCOME
$58,895
AVG HOUSEHOLD INCOME
33.2%
WAGE / INCOME GAP [ % ]
66.8¢/ $1
WAGE / INCOME GAP [ $ ]
$11,080
FAMILY INCOME DEFICIT
0.42
INEQUALITY / GINI INDEX
4,630
TOTAL POPULATION
2,344
MALE POPULATION
2,286
FEMALE POPULATION
102.54
MALES / 100 FEMALES
97.53
FEMALES / 100 MALES
47.0
MEDIAN AGE
2.7
AVG FAMILY SIZE
2.3
AVG HOUSEHOLD SIZE
2,241
LABOR FORCE [ PEOPLE ]
59.0%
PERCENT IN LABOR FORCE
1.0%
UNEMPLOYMENT RATE
Furnas County Area Codes
Income in Furnas County
Income Overview in Furnas County
Per Capita Income in Furnas County is $32,494, while median incomes of families and households are $71,602 and $58,895 respectively.
| Characteristic | Number | Measure |
| Per Capita Income | 4,630 | $32,494 |
| Median Family Income | 1,343 | $71,602 |
| Mean Family Income | 1,343 | $88,116 |
| Median Household Income | 2,003 | $58,895 |
| Mean Household Income | 2,003 | $73,955 |
| Income Deficit | 1,343 | $11,080 |
| Wage / Income Gap (%) | 4,630 | 33.15% |
| Wage / Income Gap ($) | 4,630 | 66.85¢ per $1 |
| Gini / Inequality Index | 4,630 | 0.42 |
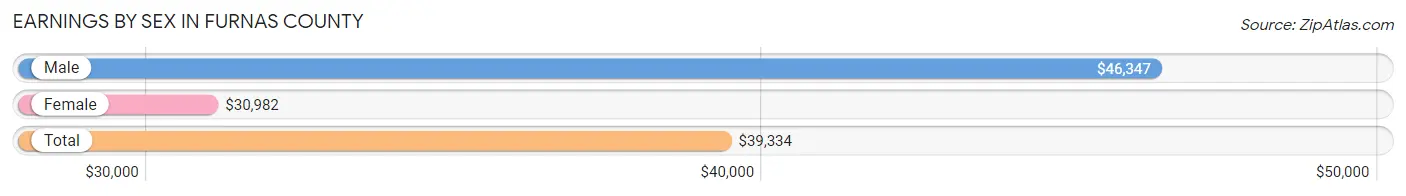
Earnings by Sex in Furnas County
Average Earnings in Furnas County are $39,334, $46,347 for men and $30,982 for women, a difference of 33.2%.
| Sex | Number | Average Earnings |
| Male | 1,357 (56.6%) | $46,347 |
| Female | 1,040 (43.4%) | $30,982 |
| Total | 2,397 (100.0%) | $39,334 |
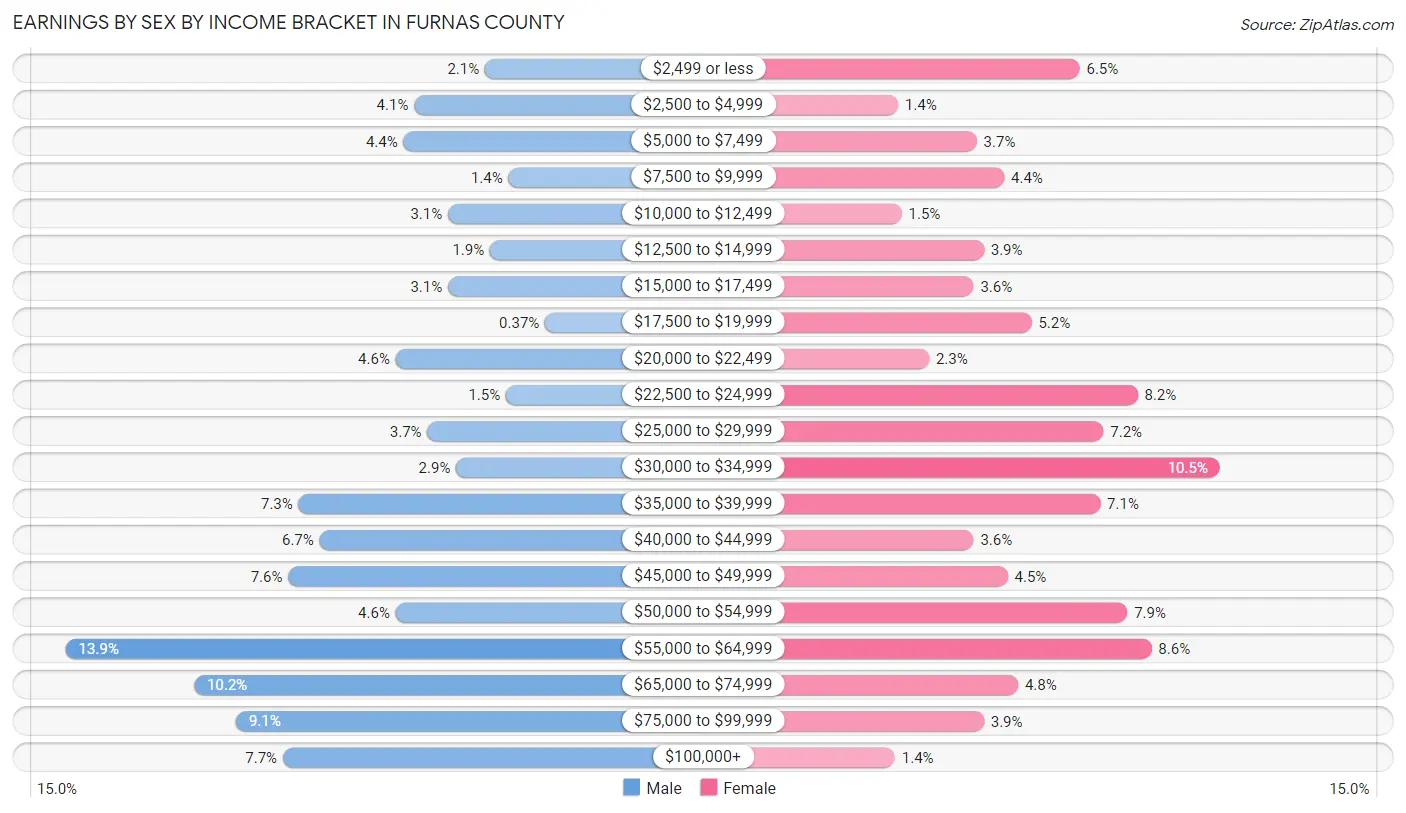
Earnings by Sex by Income Bracket in Furnas County
The most common earnings brackets in Furnas County are $55,000 to $64,999 for men (188 | 13.9%) and $30,000 to $34,999 for women (109 | 10.5%).
| Income | Male | Female |
| $2,499 or less | 28 (2.1%) | 68 (6.5%) |
| $2,500 to $4,999 | 55 (4.1%) | 15 (1.4%) |
| $5,000 to $7,499 | 59 (4.3%) | 38 (3.6%) |
| $7,500 to $9,999 | 19 (1.4%) | 46 (4.4%) |
| $10,000 to $12,499 | 42 (3.1%) | 16 (1.5%) |
| $12,500 to $14,999 | 26 (1.9%) | 40 (3.8%) |
| $15,000 to $17,499 | 42 (3.1%) | 37 (3.6%) |
| $17,500 to $19,999 | 5 (0.4%) | 54 (5.2%) |
| $20,000 to $22,499 | 62 (4.6%) | 24 (2.3%) |
| $22,500 to $24,999 | 20 (1.5%) | 85 (8.2%) |
| $25,000 to $29,999 | 50 (3.7%) | 75 (7.2%) |
| $30,000 to $34,999 | 39 (2.9%) | 109 (10.5%) |
| $35,000 to $39,999 | 99 (7.3%) | 74 (7.1%) |
| $40,000 to $44,999 | 91 (6.7%) | 37 (3.6%) |
| $45,000 to $49,999 | 103 (7.6%) | 47 (4.5%) |
| $50,000 to $54,999 | 62 (4.6%) | 82 (7.9%) |
| $55,000 to $64,999 | 188 (13.9%) | 89 (8.6%) |
| $65,000 to $74,999 | 139 (10.2%) | 50 (4.8%) |
| $75,000 to $99,999 | 123 (9.1%) | 40 (3.8%) |
| $100,000+ | 105 (7.7%) | 14 (1.3%) |
| Total | 1,357 (100.0%) | 1,040 (100.0%) |
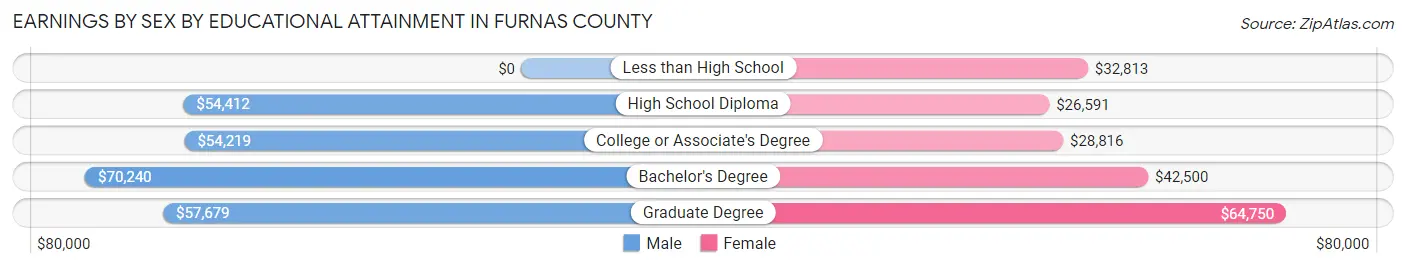
Earnings by Sex by Educational Attainment in Furnas County
Average earnings in Furnas County are $50,536 for men and $33,083 for women, a difference of 34.5%. Men with an educational attainment of bachelor's degree enjoy the highest average annual earnings of $70,240, while those with college or associate's degree education earn the least with $54,219. Women with an educational attainment of graduate degree earn the most with the average annual earnings of $64,750, while those with high school diploma education have the smallest earnings of $26,591.
| Educational Attainment | Male Income | Female Income |
| Less than High School | - | - |
| High School Diploma | $54,412 | $26,591 |
| College or Associate's Degree | $54,219 | $28,816 |
| Bachelor's Degree | $70,240 | $42,500 |
| Graduate Degree | $57,679 | $64,750 |
| Total | $50,536 | $33,083 |
Family Income in Furnas County
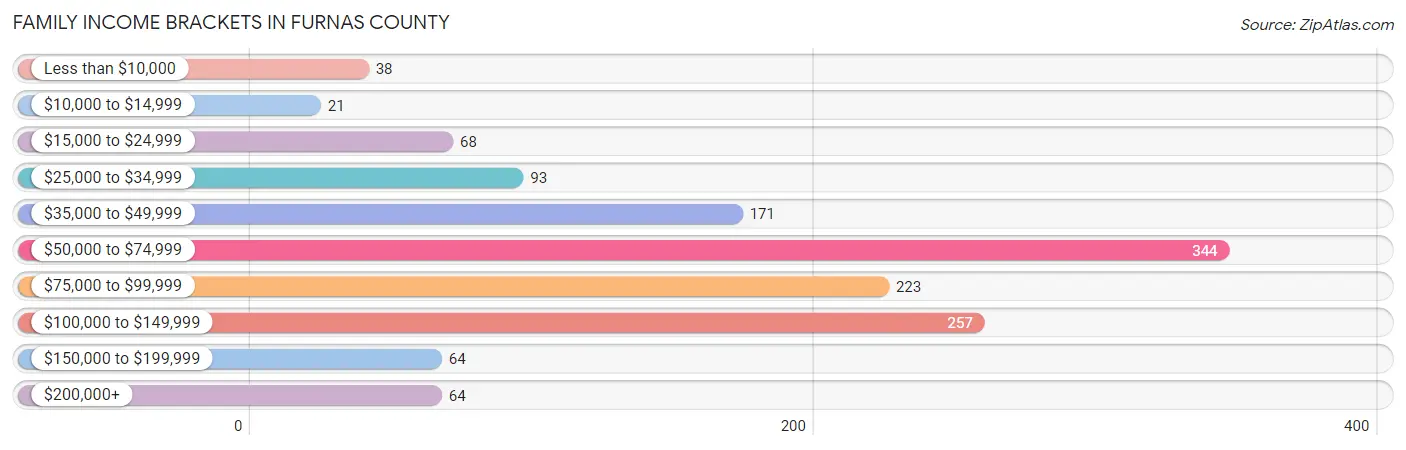
Family Income Brackets in Furnas County
According to the Furnas County family income data, there are 344 families falling into the $50,000 to $74,999 income range, which is the most common income bracket and makes up 25.6% of all families. Conversely, the $10,000 to $14,999 income bracket is the least frequent group with only 21 families (1.6%) belonging to this category.
| Income Bracket | # Families | % Families |
| Less than $10,000 | 38 | 2.8% |
| $10,000 to $14,999 | 21 | 1.6% |
| $15,000 to $24,999 | 68 | 5.1% |
| $25,000 to $34,999 | 93 | 6.9% |
| $35,000 to $49,999 | 171 | 12.7% |
| $50,000 to $74,999 | 344 | 25.6% |
| $75,000 to $99,999 | 223 | 16.6% |
| $100,000 to $149,999 | 257 | 19.1% |
| $150,000 to $199,999 | 64 | 4.8% |
| $200,000+ | 64 | 4.8% |
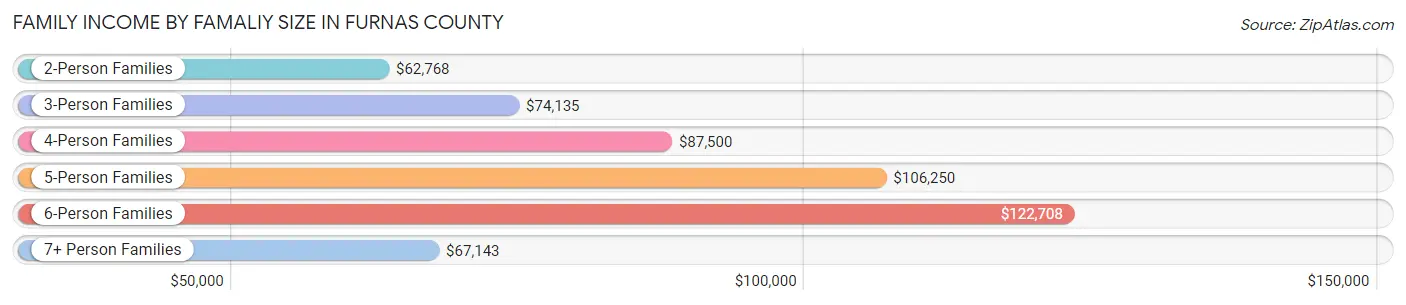
Family Income by Famaliy Size in Furnas County
6-person families (54 | 4.0%) account for the highest median family income in Furnas County with $122,708 per family, while 2-person families (797 | 59.3%) have the highest median income of $31,384 per family member.
| Income Bracket | # Families | Median Income |
| 2-Person Families | 797 (59.3%) | $62,768 |
| 3-Person Families | 186 (13.9%) | $74,135 |
| 4-Person Families | 220 (16.4%) | $87,500 |
| 5-Person Families | 66 (4.9%) | $106,250 |
| 6-Person Families | 54 (4.0%) | $122,708 |
| 7+ Person Families | 20 (1.5%) | $67,143 |
| Total | 1,343 (100.0%) | $71,602 |
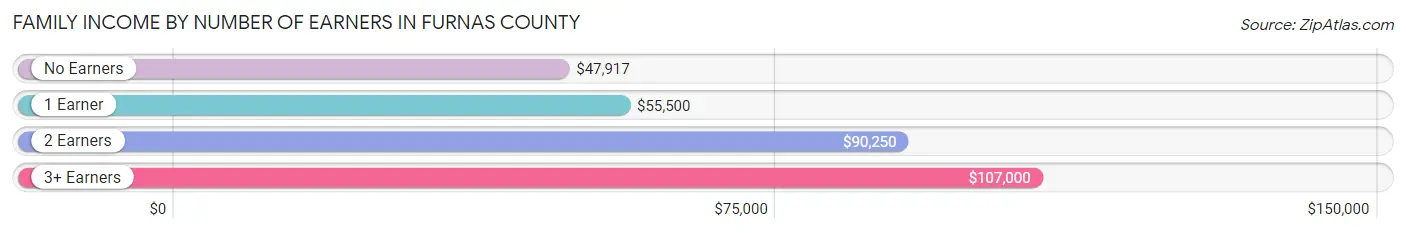
Family Income by Number of Earners in Furnas County
The median family income in Furnas County is $71,602, with families comprising 3+ earners (64) having the highest median family income of $107,000, while families with no earners (259) have the lowest median family income of $47,917, accounting for 4.8% and 19.3% of families, respectively.
| Number of Earners | # Families | Median Income |
| No Earners | 259 (19.3%) | $47,917 |
| 1 Earner | 356 (26.5%) | $55,500 |
| 2 Earners | 664 (49.4%) | $90,250 |
| 3+ Earners | 64 (4.8%) | $107,000 |
| Total | 1,343 (100.0%) | $71,602 |
Household Income in Furnas County
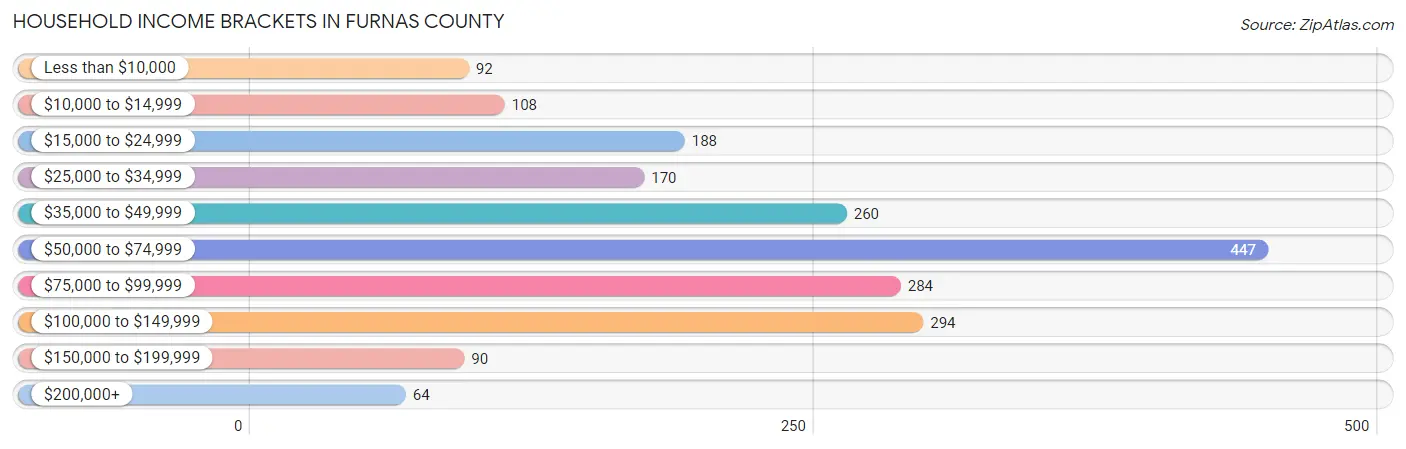
Household Income Brackets in Furnas County
With 447 households falling in the category, the $50,000 to $74,999 income range is the most frequent in Furnas County, accounting for 22.3% of all households. In contrast, only 64 households (3.2%) fall into the $200,000+ income bracket, making it the least populous group.
| Income Bracket | # Households | % Households |
| Less than $10,000 | 92 | 4.6% |
| $10,000 to $14,999 | 108 | 5.4% |
| $15,000 to $24,999 | 188 | 9.4% |
| $25,000 to $34,999 | 170 | 8.5% |
| $35,000 to $49,999 | 260 | 13.0% |
| $50,000 to $74,999 | 447 | 22.3% |
| $75,000 to $99,999 | 284 | 14.2% |
| $100,000 to $149,999 | 294 | 14.7% |
| $150,000 to $199,999 | 90 | 4.5% |
| $200,000+ | 64 | 3.2% |
Household Income by Householder Age in Furnas County
The median household income in Furnas County is $58,895, with the highest median household income of $79,048 found in the 25 to 44 years age bracket for the primary householder. A total of 482 households (24.1%) fall into this category. Meanwhile, the 65+ years age bracket for the primary householder has the lowest median household income of $42,917, with 779 households (38.9%) in this group.
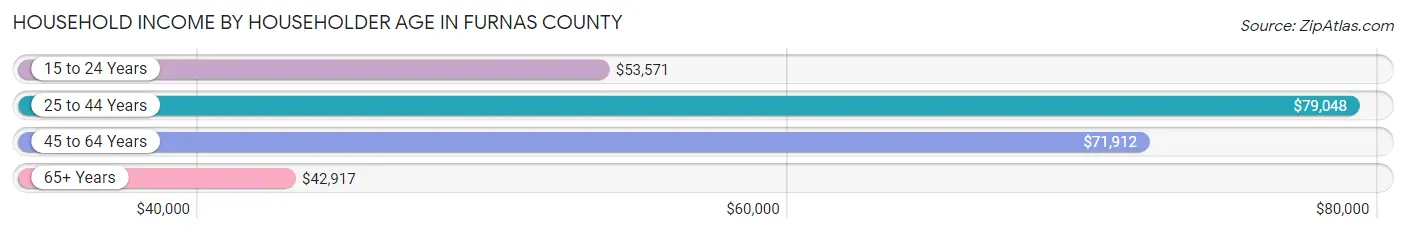
| Income Bracket | # Households | Median Income |
| 15 to 24 Years | 102 (5.1%) | $53,571 |
| 25 to 44 Years | 482 (24.1%) | $79,048 |
| 45 to 64 Years | 640 (32.0%) | $71,912 |
| 65+ Years | 779 (38.9%) | $42,917 |
| Total | 2,003 (100.0%) | $58,895 |
Poverty in Furnas County
Income Below Poverty by Sex and Age in Furnas County
With 11.0% poverty level for males and 11.3% for females among the residents of Furnas County, 5 year old males and 25 to 34 year old females are the most vulnerable to poverty, with 14 males (45.2%) and 38 females (19.4%) in their respective age groups living below the poverty level.
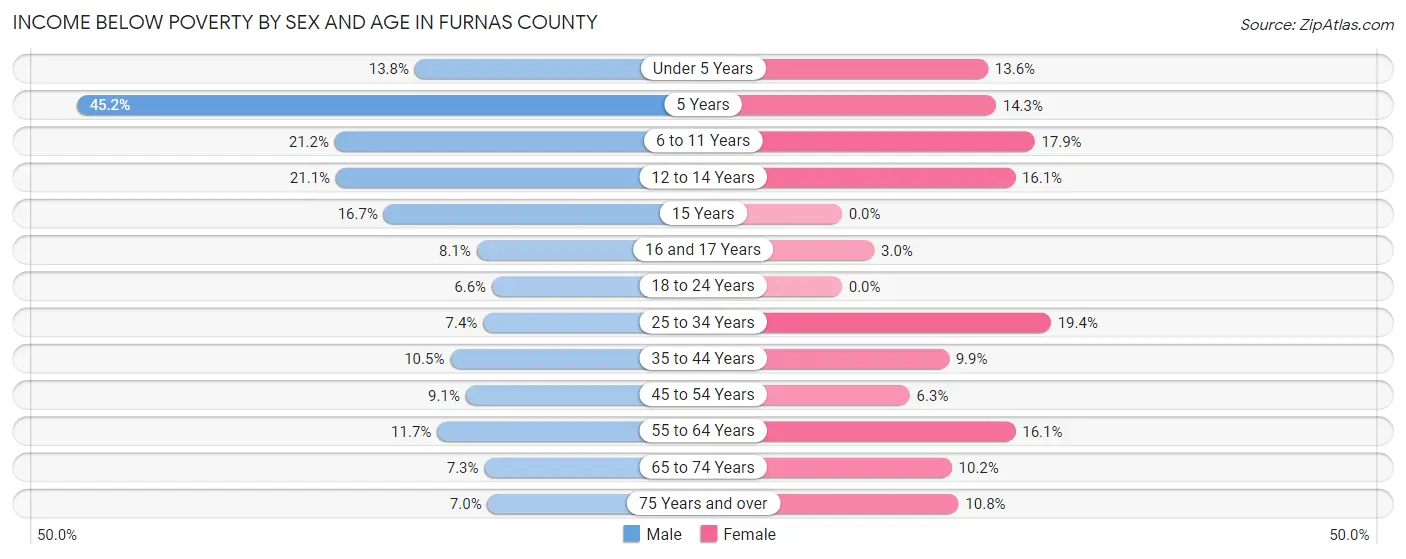
| Age Bracket | Male | Female |
| Under 5 Years | 20 (13.8%) | 16 (13.6%) |
| 5 Years | 14 (45.2%) | 5 (14.3%) |
| 6 to 11 Years | 35 (21.2%) | 27 (17.9%) |
| 12 to 14 Years | 19 (21.1%) | 9 (16.1%) |
| 15 Years | 2 (16.7%) | 0 (0.0%) |
| 16 and 17 Years | 7 (8.1%) | 3 (3.0%) |
| 18 to 24 Years | 12 (6.6%) | 0 (0.0%) |
| 25 to 34 Years | 16 (7.4%) | 38 (19.4%) |
| 35 to 44 Years | 25 (10.5%) | 24 (9.9%) |
| 45 to 54 Years | 26 (9.1%) | 16 (6.3%) |
| 55 to 64 Years | 41 (11.7%) | 52 (16.1%) |
| 65 to 74 Years | 22 (7.3%) | 33 (10.2%) |
| 75 Years and over | 15 (7.0%) | 29 (10.8%) |
| Total | 254 (11.0%) | 252 (11.3%) |
Income Above Poverty by Sex and Age in Furnas County
According to the poverty statistics in Furnas County, males aged 18 to 24 years and females aged 15 years are the age groups that are most secure financially, with 93.4% of males and 100.0% of females in these age groups living above the poverty line.
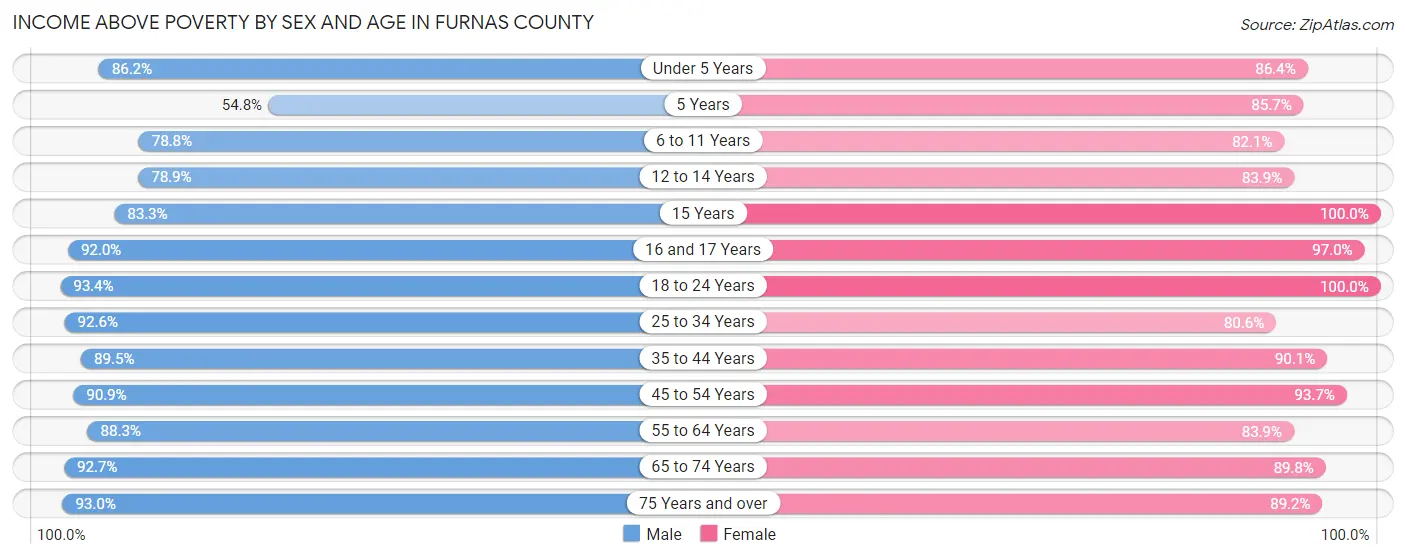
| Age Bracket | Male | Female |
| Under 5 Years | 125 (86.2%) | 102 (86.4%) |
| 5 Years | 17 (54.8%) | 30 (85.7%) |
| 6 to 11 Years | 130 (78.8%) | 124 (82.1%) |
| 12 to 14 Years | 71 (78.9%) | 47 (83.9%) |
| 15 Years | 10 (83.3%) | 14 (100.0%) |
| 16 and 17 Years | 80 (91.9%) | 97 (97.0%) |
| 18 to 24 Years | 169 (93.4%) | 143 (100.0%) |
| 25 to 34 Years | 199 (92.6%) | 158 (80.6%) |
| 35 to 44 Years | 213 (89.5%) | 218 (90.1%) |
| 45 to 54 Years | 261 (90.9%) | 238 (93.7%) |
| 55 to 64 Years | 309 (88.3%) | 271 (83.9%) |
| 65 to 74 Years | 278 (92.7%) | 291 (89.8%) |
| 75 Years and over | 198 (93.0%) | 239 (89.2%) |
| Total | 2,060 (89.0%) | 1,972 (88.7%) |
Income Below Poverty Among Married-Couple Families in Furnas County
The poverty statistics for married-couple families in Furnas County show that 5.0% or 59 of the total 1,192 families live below the poverty line. Families with 5 or more children have the highest poverty rate of 22.2%, comprising of 4 families. On the other hand, families with 1 or 2 children have the lowest poverty rate of 3.2%, which includes 11 families.
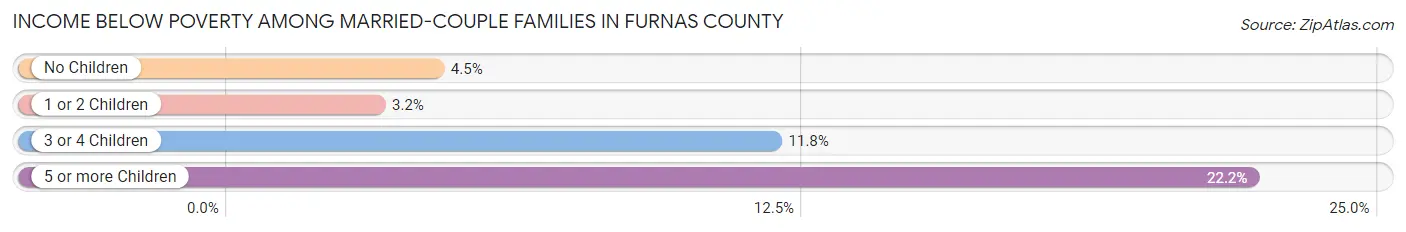
| Children | Above Poverty | Below Poverty |
| No Children | 704 (95.5%) | 33 (4.5%) |
| 1 or 2 Children | 333 (96.8%) | 11 (3.2%) |
| 3 or 4 Children | 82 (88.2%) | 11 (11.8%) |
| 5 or more Children | 14 (77.8%) | 4 (22.2%) |
| Total | 1,133 (95.1%) | 59 (5.0%) |
Income Below Poverty Among Single-Parent Households in Furnas County
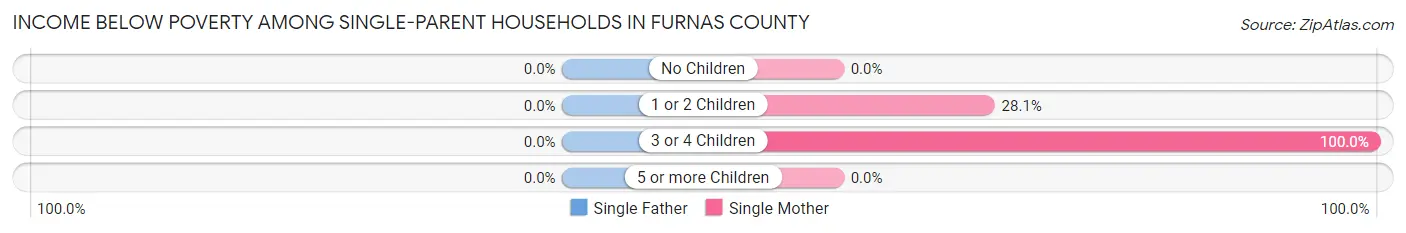
| Children | Single Father | Single Mother |
| No Children | 0 (0.0%) | 0 (0.0%) |
| 1 or 2 Children | 0 (0.0%) | 18 (28.1%) |
| 3 or 4 Children | 0 (0.0%) | 14 (100.0%) |
| 5 or more Children | 0 (0.0%) | 0 (0.0%) |
| Total | 0 (0.0%) | 32 (32.3%) |
Income Below Poverty Among Married-Couple vs Single-Parent Households in Furnas County
The poverty data for Furnas County shows that 59 of the married-couple family households (5.0%) and 32 of the single-parent households (21.2%) are living below the poverty level. Within the married-couple family households, those with 5 or more children have the highest poverty rate, with 4 households (22.2%) falling below the poverty line. Among the single-parent households, those with 3 or 4 children have the highest poverty rate, with 14 household (73.7%) living below poverty.
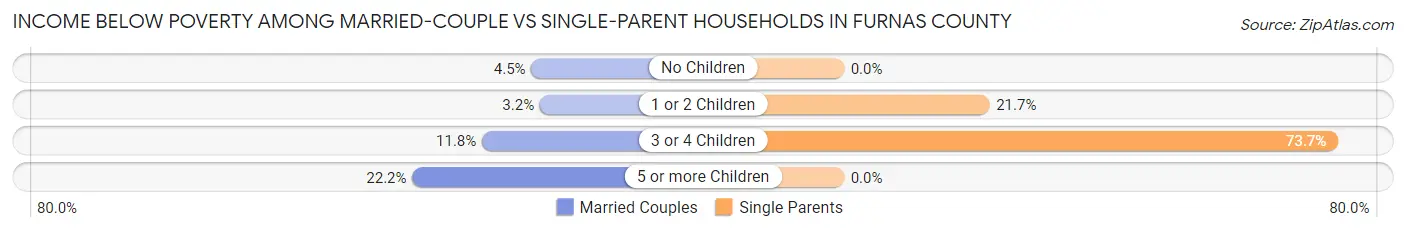
| Children | Married-Couple Families | Single-Parent Households |
| No Children | 33 (4.5%) | 0 (0.0%) |
| 1 or 2 Children | 11 (3.2%) | 18 (21.7%) |
| 3 or 4 Children | 11 (11.8%) | 14 (73.7%) |
| 5 or more Children | 4 (22.2%) | 0 (0.0%) |
| Total | 59 (5.0%) | 32 (21.2%) |
Race in Furnas County
The most populous races in Furnas County are White / Caucasian (4,435 | 95.8%), Hispanic or Latino (228 | 4.9%), and Two or more Races (115 | 2.5%).
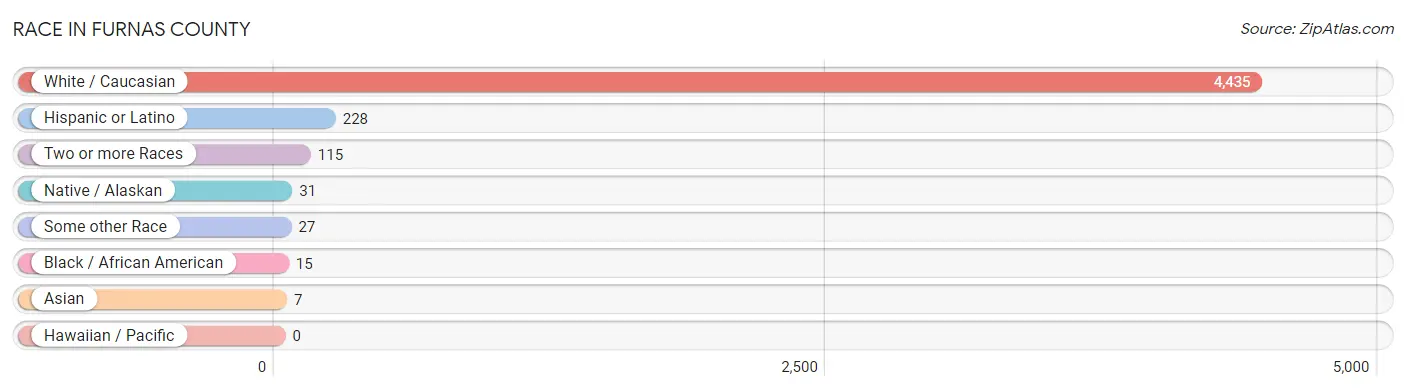
| Race | # Population | % Population |
| Asian | 7 | 0.2% |
| Black / African American | 15 | 0.3% |
| Hawaiian / Pacific | 0 | 0.0% |
| Hispanic or Latino | 228 | 4.9% |
| Native / Alaskan | 31 | 0.7% |
| White / Caucasian | 4,435 | 95.8% |
| Two or more Races | 115 | 2.5% |
| Some other Race | 27 | 0.6% |
| Total | 4,630 | 100.0% |
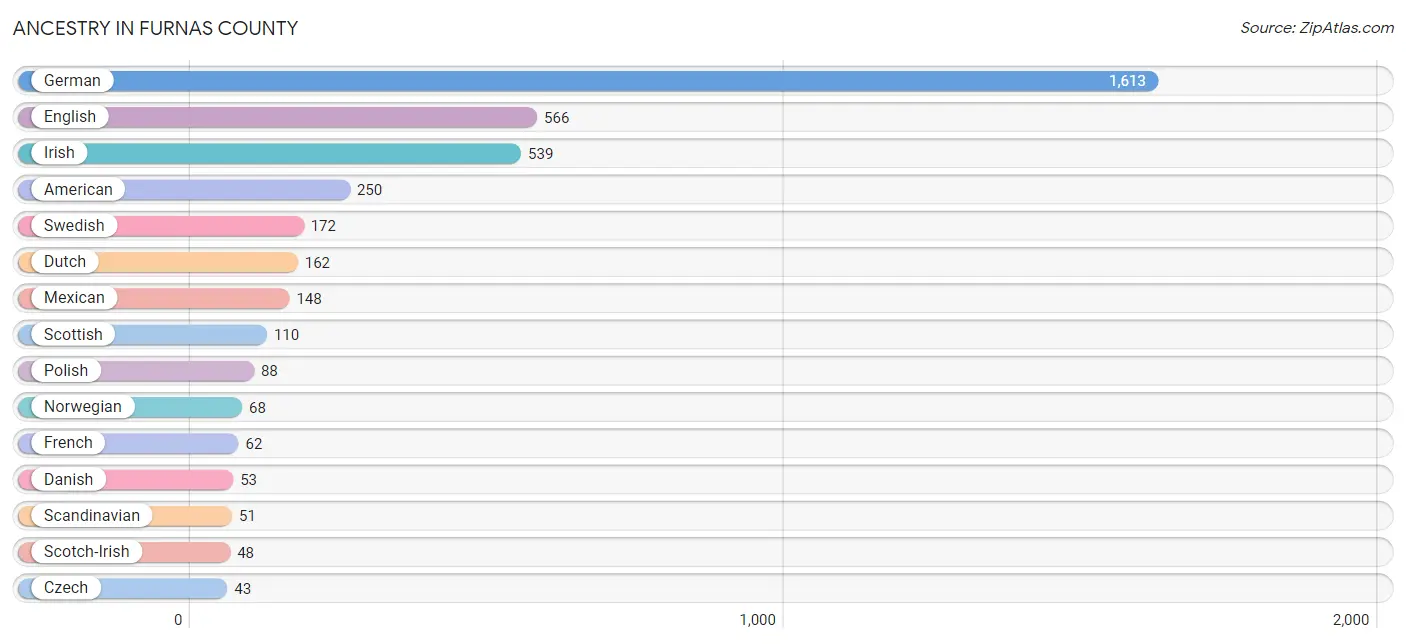
Ancestry in Furnas County
The most populous ancestries reported in Furnas County are German (1,613 | 34.8%), English (566 | 12.2%), Irish (539 | 11.6%), American (250 | 5.4%), and Swedish (172 | 3.7%), together accounting for 67.8% of all Furnas County residents.
| Ancestry | # Population | % Population |
| American | 250 | 5.4% |
| Bhutanese | 2 | 0.0% |
| British | 11 | 0.2% |
| Burmese | 2 | 0.0% |
| Central American | 13 | 0.3% |
| Cherokee | 14 | 0.3% |
| Chickasaw | 29 | 0.6% |
| Czech | 43 | 0.9% |
| Danish | 53 | 1.1% |
| Dutch | 162 | 3.5% |
| Eastern European | 7 | 0.2% |
| English | 566 | 12.2% |
| European | 21 | 0.4% |
| French | 62 | 1.3% |
| French American Indian | 3 | 0.1% |
| French Canadian | 5 | 0.1% |
| German | 1,613 | 34.8% |
| German Russian | 6 | 0.1% |
| Guatemalan | 2 | 0.0% |
| Hungarian | 3 | 0.1% |
| Indian (Asian) | 4 | 0.1% |
| Irish | 539 | 11.6% |
| Italian | 27 | 0.6% |
| Korean | 3 | 0.1% |
| Mexican | 148 | 3.2% |
| Native Hawaiian | 1 | 0.0% |
| Norwegian | 68 | 1.5% |
| Pakistani | 4 | 0.1% |
| Panamanian | 11 | 0.2% |
| Pennsylvania German | 1 | 0.0% |
| Polish | 88 | 1.9% |
| Potawatomi | 4 | 0.1% |
| Puerto Rican | 3 | 0.1% |
| Russian | 3 | 0.1% |
| Scandinavian | 51 | 1.1% |
| Scotch-Irish | 48 | 1.0% |
| Scottish | 110 | 2.4% |
| Sioux | 10 | 0.2% |
| Spaniard | 7 | 0.2% |
| Swedish | 172 | 3.7% |
| Swiss | 31 | 0.7% |
| Turkish | 2 | 0.0% |
| Welsh | 25 | 0.5% | View All 43 Rows |
Immigrants in Furnas County
The most numerous immigrant groups reported in Furnas County came from Central America (60 | 1.3%), Latin America (60 | 1.3%), Mexico (51 | 1.1%), Africa (14 | 0.3%), and Europe (10 | 0.2%), together accounting for 4.2% of all Furnas County residents.
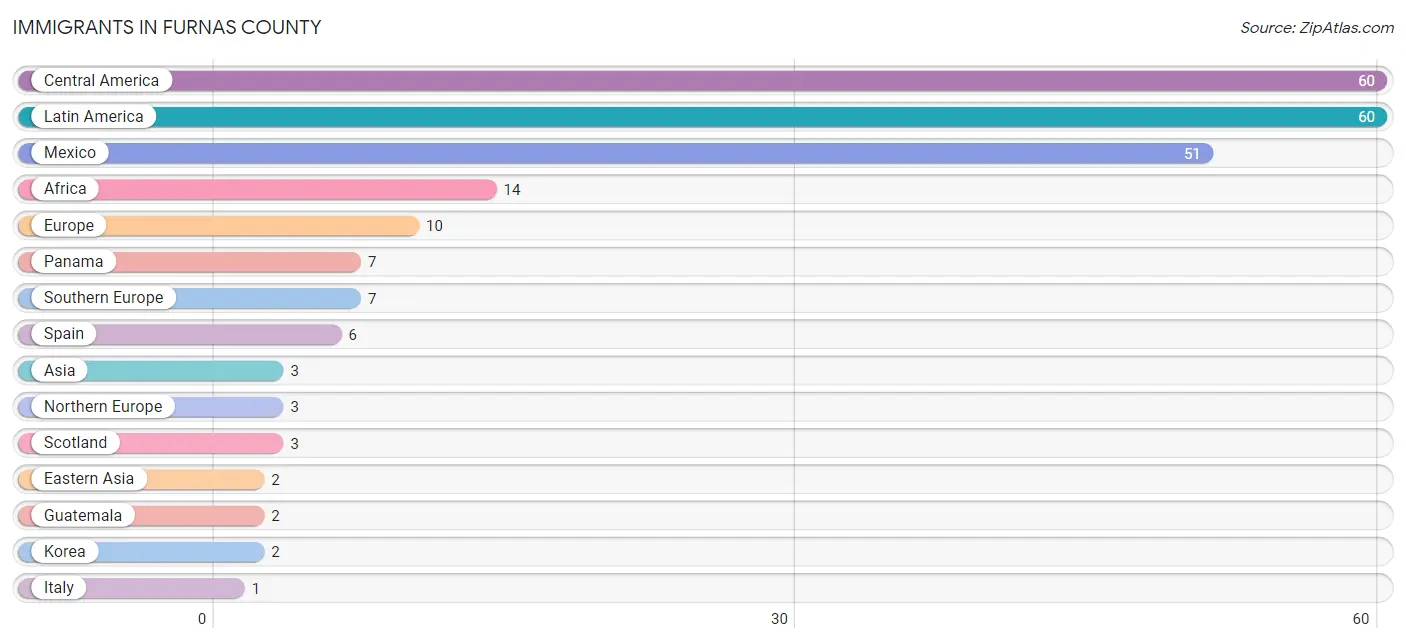
| Immigration Origin | # Population | % Population |
| Africa | 14 | 0.3% |
| Asia | 3 | 0.1% |
| Central America | 60 | 1.3% |
| Eastern Asia | 2 | 0.0% |
| Europe | 10 | 0.2% |
| Guatemala | 2 | 0.0% |
| Italy | 1 | 0.0% |
| Korea | 2 | 0.0% |
| Latin America | 60 | 1.3% |
| Mexico | 51 | 1.1% |
| Northern Europe | 3 | 0.1% |
| Panama | 7 | 0.2% |
| Philippines | 1 | 0.0% |
| Scotland | 3 | 0.1% |
| South Eastern Asia | 1 | 0.0% |
| Southern Europe | 7 | 0.2% |
| Spain | 6 | 0.1% | View All 17 Rows |
Sex and Age in Furnas County
Sex and Age in Furnas County
The most populous age groups in Furnas County are 60 to 64 Years (211 | 9.0%) for men and 65 to 69 Years (204 | 8.9%) for women.
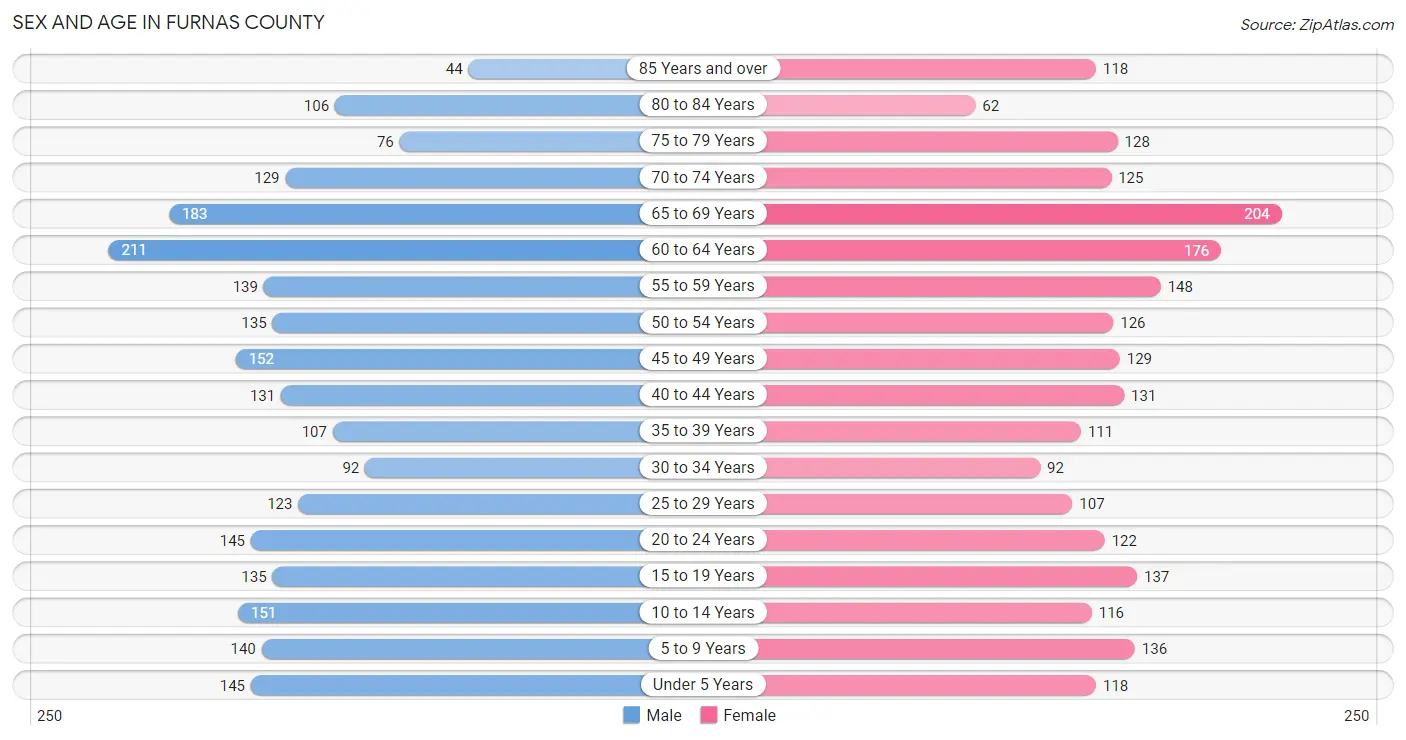
| Age Bracket | Male | Female |
| Under 5 Years | 145 (6.2%) | 118 (5.2%) |
| 5 to 9 Years | 140 (6.0%) | 136 (5.9%) |
| 10 to 14 Years | 151 (6.4%) | 116 (5.1%) |
| 15 to 19 Years | 135 (5.8%) | 137 (6.0%) |
| 20 to 24 Years | 145 (6.2%) | 122 (5.3%) |
| 25 to 29 Years | 123 (5.2%) | 107 (4.7%) |
| 30 to 34 Years | 92 (3.9%) | 92 (4.0%) |
| 35 to 39 Years | 107 (4.6%) | 111 (4.9%) |
| 40 to 44 Years | 131 (5.6%) | 131 (5.7%) |
| 45 to 49 Years | 152 (6.5%) | 129 (5.6%) |
| 50 to 54 Years | 135 (5.8%) | 126 (5.5%) |
| 55 to 59 Years | 139 (5.9%) | 148 (6.5%) |
| 60 to 64 Years | 211 (9.0%) | 176 (7.7%) |
| 65 to 69 Years | 183 (7.8%) | 204 (8.9%) |
| 70 to 74 Years | 129 (5.5%) | 125 (5.5%) |
| 75 to 79 Years | 76 (3.2%) | 128 (5.6%) |
| 80 to 84 Years | 106 (4.5%) | 62 (2.7%) |
| 85 Years and over | 44 (1.9%) | 118 (5.2%) |
| Total | 2,344 (100.0%) | 2,286 (100.0%) |
Families and Households in Furnas County
Median Family Size in Furnas County
The median family size in Furnas County is 2.74 persons per family, with single female/mother families (99 | 7.4%) accounting for the largest median family size of 2.82 persons per family. On the other hand, single male/father families (52 | 3.9%) represent the smallest median family size with 2.19 persons per family.
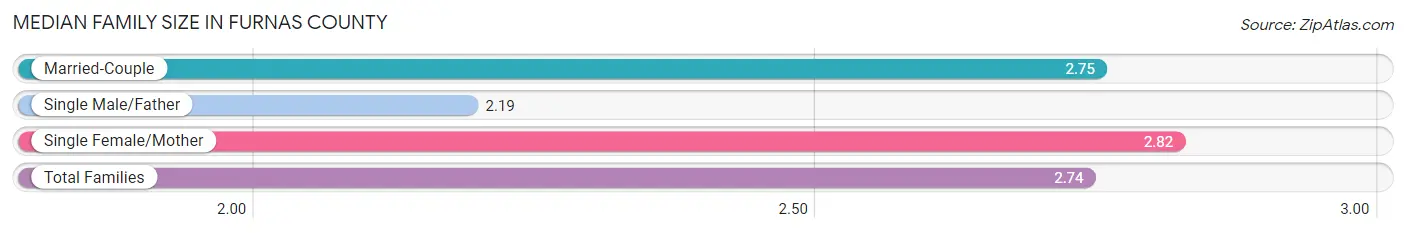
| Family Type | # Families | Family Size |
| Married-Couple | 1,192 (88.8%) | 2.75 |
| Single Male/Father | 52 (3.9%) | 2.19 |
| Single Female/Mother | 99 (7.4%) | 2.82 |
| Total Families | 1,343 (100.0%) | 2.74 |
Median Household Size in Furnas County
The median household size in Furnas County is 2.27 persons per household, with single female/mother households (99 | 4.9%) accounting for the largest median household size of 3.22 persons per household. non-family households (660 | 33.0%) represent the smallest median household size with 1.16 persons per household.
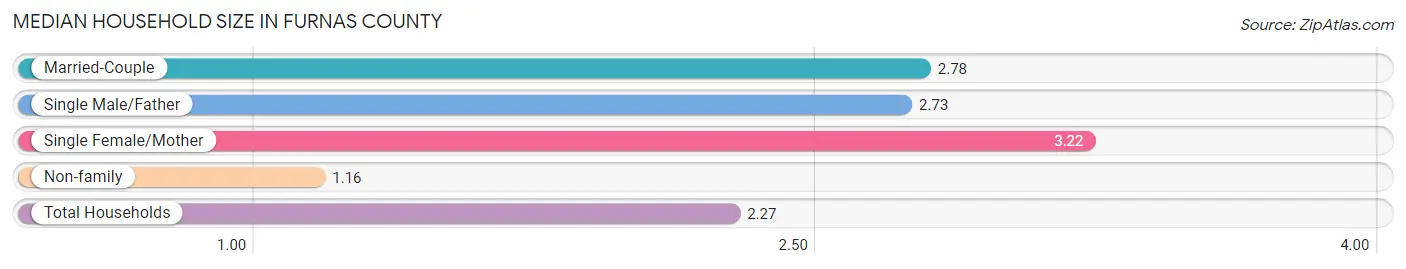
| Household Type | # Households | Household Size |
| Married-Couple | 1,192 (59.5%) | 2.78 |
| Single Male/Father | 52 (2.6%) | 2.73 |
| Single Female/Mother | 99 (4.9%) | 3.22 |
| Non-family | 660 (33.0%) | 1.16 |
| Total Households | 2,003 (100.0%) | 2.27 |
Household Size by Marriage Status in Furnas County
Out of a total of 2,003 households in Furnas County, 1,343 (67.0%) are family households, while 660 (33.0%) are nonfamily households. The most numerous type of family households are 2-person households, comprising 750, and the most common type of nonfamily households are 1-person households, comprising 576.
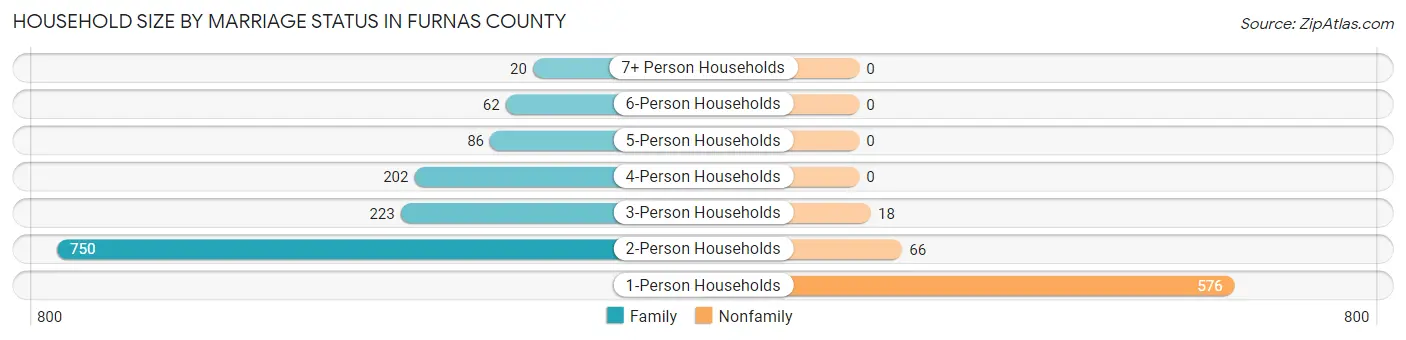
| Household Size | Family Households | Nonfamily Households |
| 1-Person Households | - | 576 (28.8%) |
| 2-Person Households | 750 (37.4%) | 66 (3.3%) |
| 3-Person Households | 223 (11.1%) | 18 (0.9%) |
| 4-Person Households | 202 (10.1%) | 0 (0.0%) |
| 5-Person Households | 86 (4.3%) | 0 (0.0%) |
| 6-Person Households | 62 (3.1%) | 0 (0.0%) |
| 7+ Person Households | 20 (1.0%) | 0 (0.0%) |
| Total | 1,343 (67.0%) | 660 (33.0%) |
Female Fertility in Furnas County
Fertility by Age in Furnas County
Average fertility rate in Furnas County is 115.0 births per 1,000 women. Women in the age bracket of 20 to 34 years have the highest fertility rate with 287.0 births per 1,000 women. Women in the age bracket of 20 to 34 years acount for 92.9% of all women with births.
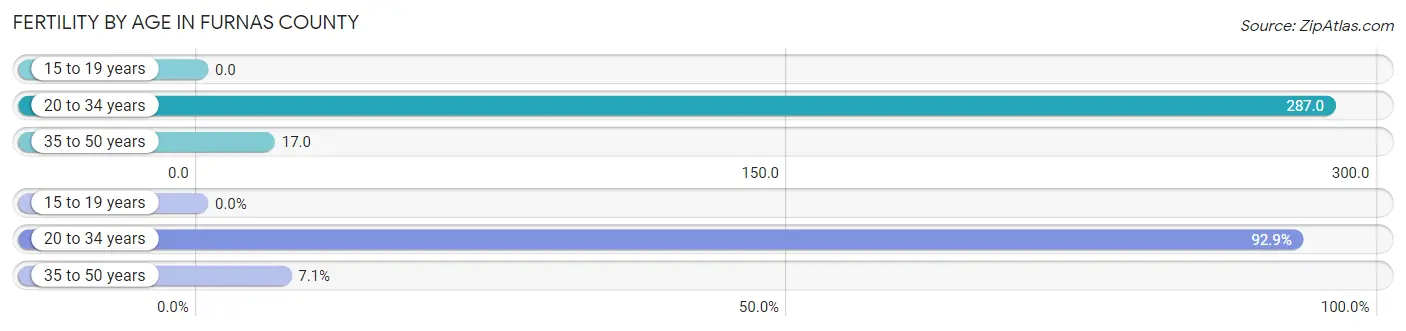
| Age Bracket | Women with Births | Births / 1,000 Women |
| 15 to 19 years | 0 (0.0%) | 0.0 |
| 20 to 34 years | 92 (92.9%) | 287.0 |
| 35 to 50 years | 7 (7.1%) | 17.0 |
| Total | 99 (100.0%) | 115.0 |
Fertility by Age by Marriage Status in Furnas County
86.9% of women with births (99) in Furnas County are married. The highest percentage of unmarried women with births falls into 20 to 34 years age bracket with 14.1% of them unmarried at the time of birth, while the lowest percentage of unmarried women with births belong to 35 to 50 years age bracket with 0.0% of them unmarried.
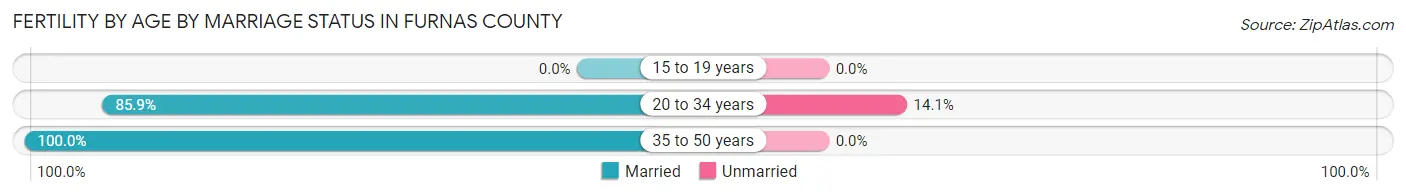
| Age Bracket | Married | Unmarried |
| 15 to 19 years | 0 (0.0%) | 0 (0.0%) |
| 20 to 34 years | 79 (85.9%) | 13 (14.1%) |
| 35 to 50 years | 7 (100.0%) | 0 (0.0%) |
| Total | 86 (86.9%) | 13 (13.1%) |
Fertility by Education in Furnas County
Average fertility rate in Furnas County is 115.0 births per 1,000 women. Women with the education attainment of high school diploma have the highest fertility rate of 239.0 births per 1,000 women, while women with the education attainment of less than high school have the lowest fertility at 27.0 births per 1,000 women. Women with the education attainment of high school diploma represent 43.4% of all women with births.
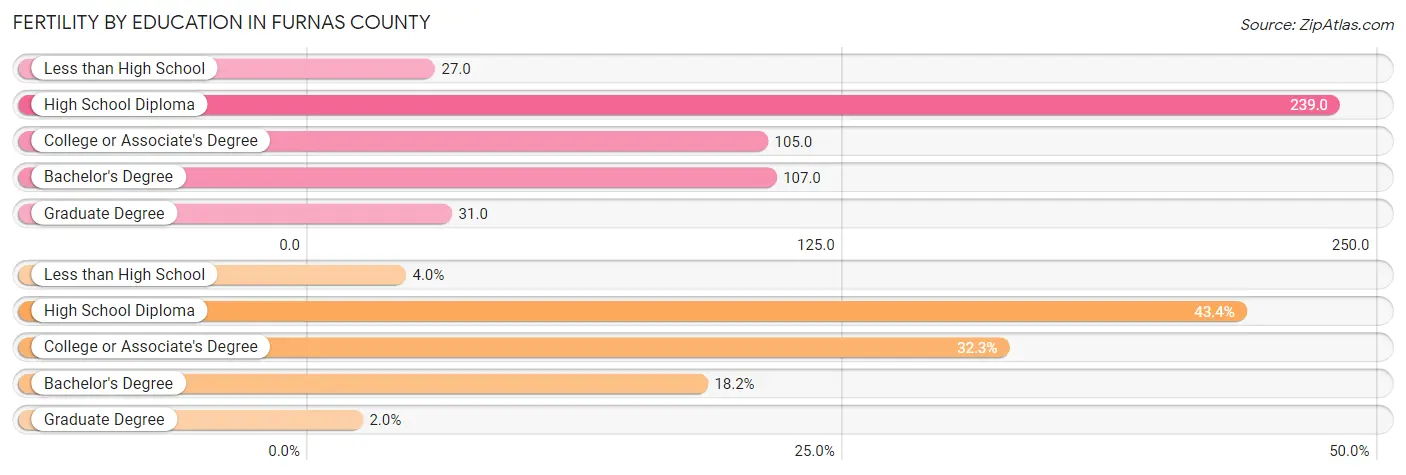
| Educational Attainment | Women with Births | Births / 1,000 Women |
| Less than High School | 4 (4.0%) | 27.0 |
| High School Diploma | 43 (43.4%) | 239.0 |
| College or Associate's Degree | 32 (32.3%) | 105.0 |
| Bachelor's Degree | 18 (18.2%) | 107.0 |
| Graduate Degree | 2 (2.0%) | 31.0 |
| Total | 99 (100.0%) | 115.0 |
Fertility by Education by Marriage Status in Furnas County
13.1% of women with births in Furnas County are unmarried. Women with the educational attainment of bachelor's degree are most likely to be married with 100.0% of them married at childbirth, while women with the educational attainment of less than high school are least likely to be married with 25.0% of them unmarried at childbirth.
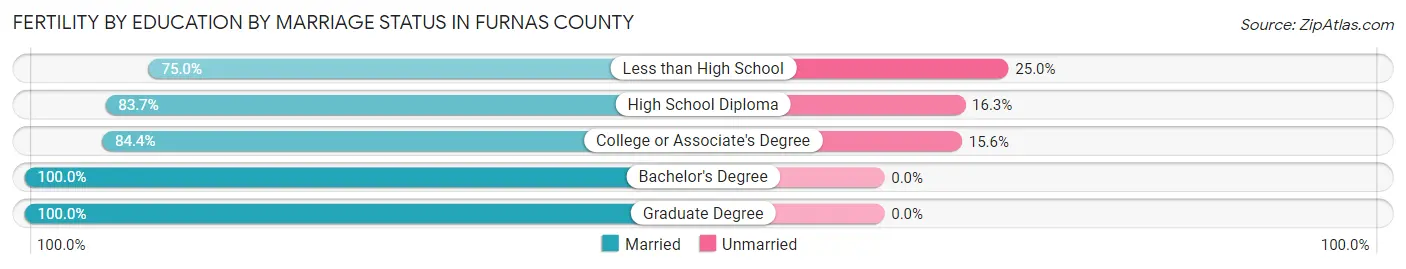
| Educational Attainment | Married | Unmarried |
| Less than High School | 3 (75.0%) | 1 (25.0%) |
| High School Diploma | 36 (83.7%) | 7 (16.3%) |
| College or Associate's Degree | 27 (84.4%) | 5 (15.6%) |
| Bachelor's Degree | 18 (100.0%) | 0 (0.0%) |
| Graduate Degree | 2 (100.0%) | 0 (0.0%) |
| Total | 86 (86.9%) | 13 (13.1%) |
Employment Characteristics in Furnas County
Employment by Class of Employer in Furnas County
Among the 2,189 employed individuals in Furnas County, private company employees (1,209 | 55.2%), self-employed (not incorporated) (270 | 12.3%), and local government employees (267 | 12.2%) make up the most common classes of employment.
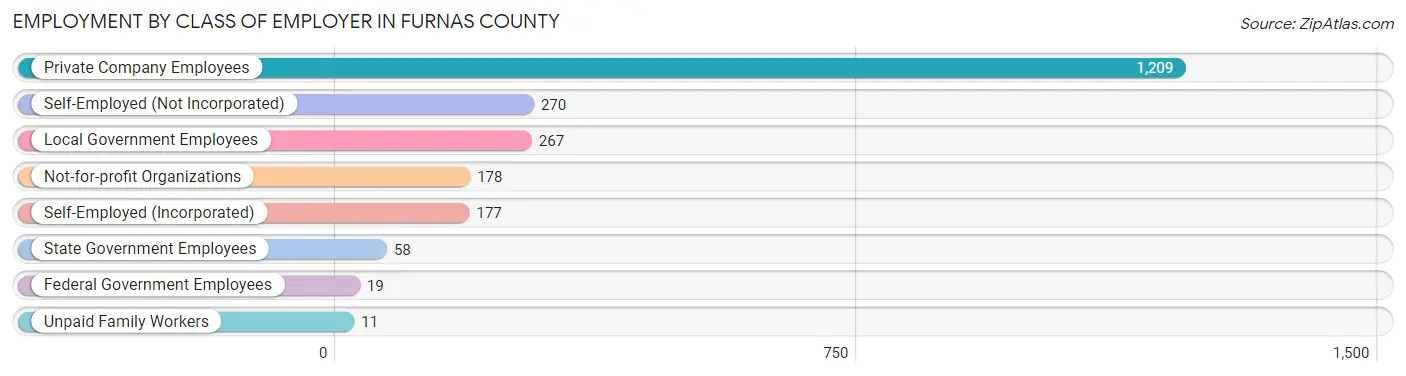
| Employer Class | # Employees | % Employees |
| Private Company Employees | 1,209 | 55.2% |
| Self-Employed (Incorporated) | 177 | 8.1% |
| Self-Employed (Not Incorporated) | 270 | 12.3% |
| Not-for-profit Organizations | 178 | 8.1% |
| Local Government Employees | 267 | 12.2% |
| State Government Employees | 58 | 2.6% |
| Federal Government Employees | 19 | 0.9% |
| Unpaid Family Workers | 11 | 0.5% |
| Total | 2,189 | 100.0% |
Employment Status by Age in Furnas County
According to the labor force statistics for Furnas County, out of the total population over 16 years of age (3,798), 59.0% or 2,241 individuals are in the labor force, with 1.0% or 22 of them unemployed. The age group with the highest labor force participation rate is 25 to 29 years, with 90.0% or 207 individuals in the labor force. Within the labor force, the 16 to 19 years age range has the highest percentage of unemployed individuals, with 11.6% or 10 of them being unemployed.
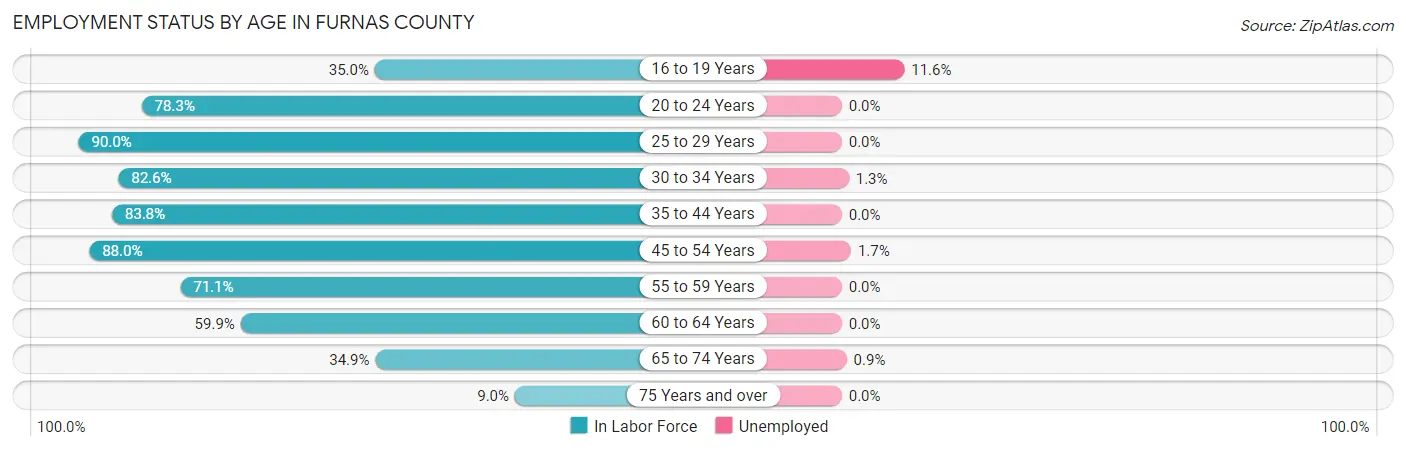
| Age Bracket | In Labor Force | Unemployed |
| 16 to 19 Years | 86 (35.0%) | 10 (11.6%) |
| 20 to 24 Years | 209 (78.3%) | 0 (0.0%) |
| 25 to 29 Years | 207 (90.0%) | 0 (0.0%) |
| 30 to 34 Years | 152 (82.6%) | 2 (1.3%) |
| 35 to 44 Years | 402 (83.8%) | 0 (0.0%) |
| 45 to 54 Years | 477 (88.0%) | 8 (1.7%) |
| 55 to 59 Years | 204 (71.1%) | 0 (0.0%) |
| 60 to 64 Years | 232 (59.9%) | 0 (0.0%) |
| 65 to 74 Years | 224 (34.9%) | 2 (0.9%) |
| 75 Years and over | 48 (9.0%) | 0 (0.0%) |
| Total | 2,241 (59.0%) | 22 (1.0%) |
Employment Status by Educational Attainment in Furnas County
According to labor force statistics for Furnas County, 79.3% of individuals (1,673) out of the total population between 25 and 64 years of age (2,110) are in the labor force, with 0.6% or 10 of them being unemployed. The group with the highest labor force participation rate are those with the educational attainment of college / associate degree, with 83.1% or 707 individuals in the labor force. Within the labor force, individuals with college / associate degree education have the highest percentage of unemployment, with 1.1% or 8 of them being unemployed.
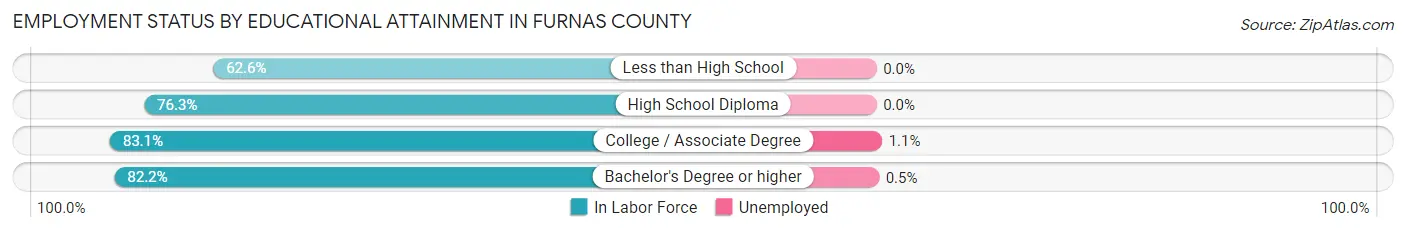
| Educational Attainment | In Labor Force | Unemployed |
| Less than High School | 109 (62.6%) | 0 (0.0%) |
| High School Diploma | 438 (76.3%) | 0 (0.0%) |
| College / Associate Degree | 707 (83.1%) | 9 (1.1%) |
| Bachelor's Degree or higher | 420 (82.2%) | 3 (0.5%) |
| Total | 1,673 (79.3%) | 13 (0.6%) |
Employment Occupations by Sex in Furnas County
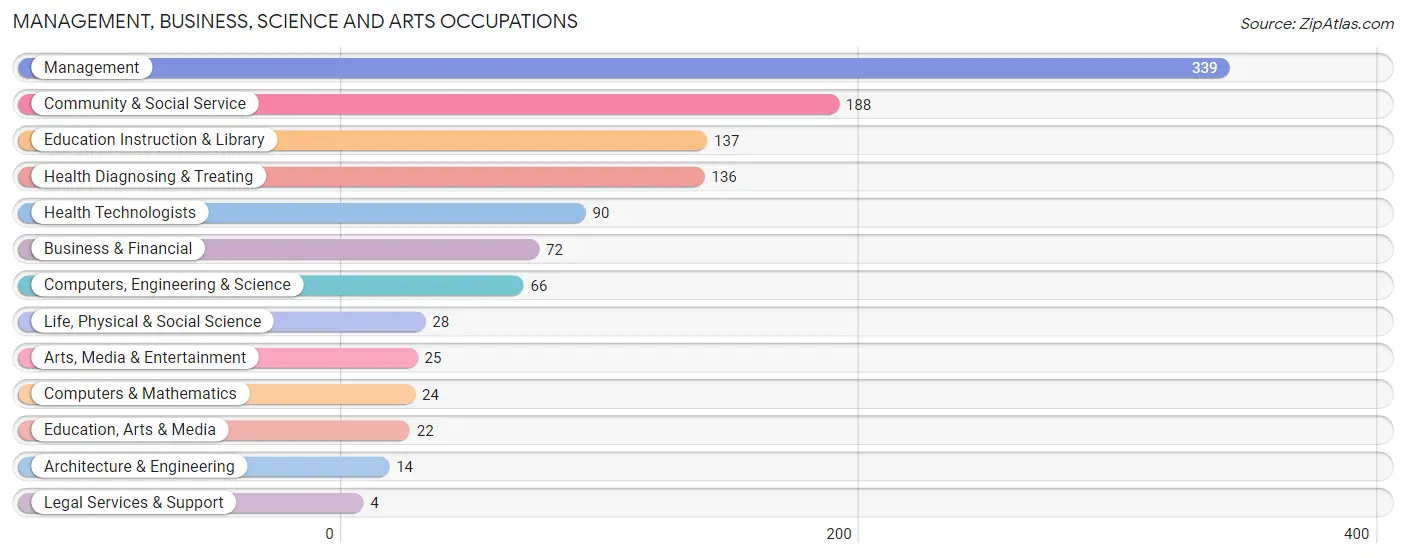
Management, Business, Science and Arts Occupations
The most common Management, Business, Science and Arts occupations in Furnas County are Management (339 | 15.3%), Community & Social Service (188 | 8.5%), Education Instruction & Library (137 | 6.2%), Health Diagnosing & Treating (136 | 6.1%), and Health Technologists (90 | 4.1%).
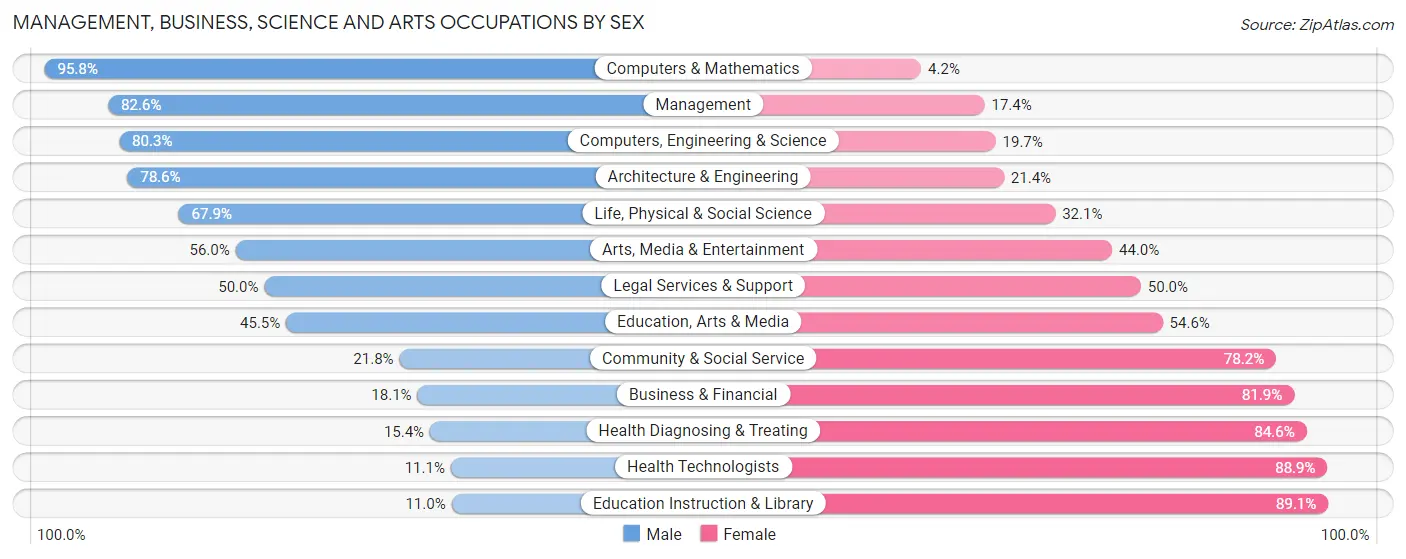
Management, Business, Science and Arts Occupations by Sex
Within the Management, Business, Science and Arts occupations in Furnas County, the most male-oriented occupations are Computers & Mathematics (95.8%), Management (82.6%), and Computers, Engineering & Science (80.3%), while the most female-oriented occupations are Education Instruction & Library (89.0%), Health Technologists (88.9%), and Health Diagnosing & Treating (84.6%).
| Occupation | Male | Female |
| Management | 280 (82.6%) | 59 (17.4%) |
| Business & Financial | 13 (18.1%) | 59 (81.9%) |
| Computers, Engineering & Science | 53 (80.3%) | 13 (19.7%) |
| Computers & Mathematics | 23 (95.8%) | 1 (4.2%) |
| Architecture & Engineering | 11 (78.6%) | 3 (21.4%) |
| Life, Physical & Social Science | 19 (67.9%) | 9 (32.1%) |
| Community & Social Service | 41 (21.8%) | 147 (78.2%) |
| Education, Arts & Media | 10 (45.5%) | 12 (54.5%) |
| Legal Services & Support | 2 (50.0%) | 2 (50.0%) |
| Education Instruction & Library | 15 (11.0%) | 122 (89.0%) |
| Arts, Media & Entertainment | 14 (56.0%) | 11 (44.0%) |
| Health Diagnosing & Treating | 21 (15.4%) | 115 (84.6%) |
| Health Technologists | 10 (11.1%) | 80 (88.9%) |
| Total (Category) | 408 (50.9%) | 393 (49.1%) |
| Total (Overall) | 1,270 (57.2%) | 949 (42.8%) |
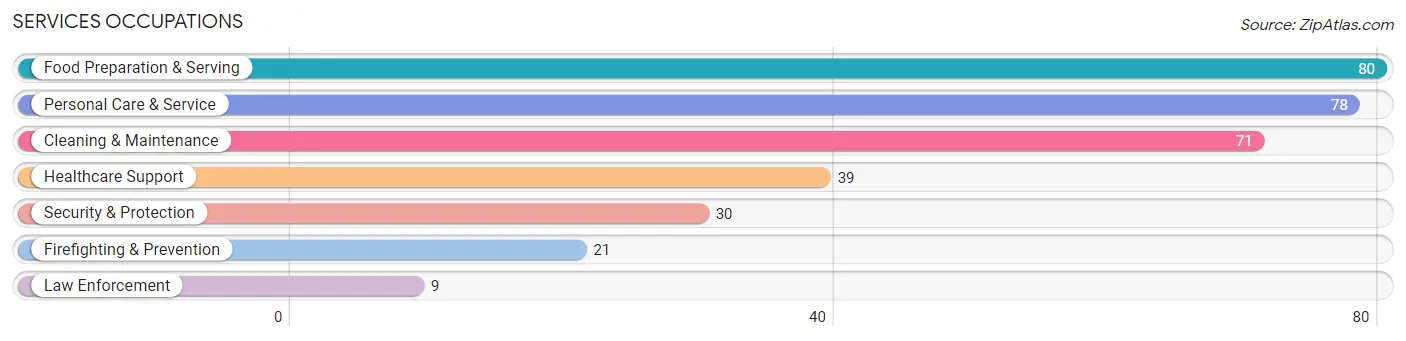
Services Occupations
The most common Services occupations in Furnas County are Food Preparation & Serving (80 | 3.6%), Personal Care & Service (78 | 3.5%), Cleaning & Maintenance (71 | 3.2%), Healthcare Support (39 | 1.8%), and Security & Protection (30 | 1.3%).
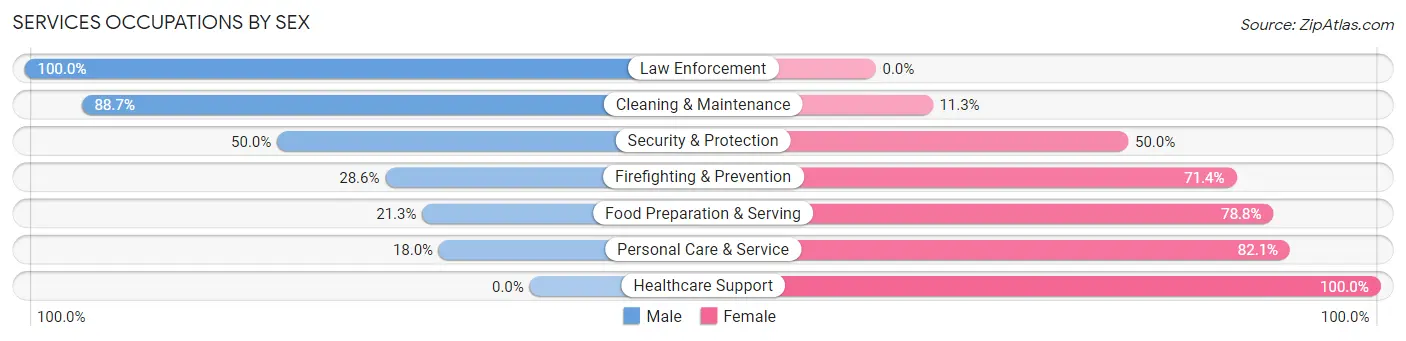
Services Occupations by Sex
Within the Services occupations in Furnas County, the most male-oriented occupations are Law Enforcement (100.0%), Cleaning & Maintenance (88.7%), and Security & Protection (50.0%), while the most female-oriented occupations are Healthcare Support (100.0%), Personal Care & Service (82.1%), and Food Preparation & Serving (78.7%).
| Occupation | Male | Female |
| Healthcare Support | 0 (0.0%) | 39 (100.0%) |
| Security & Protection | 15 (50.0%) | 15 (50.0%) |
| Firefighting & Prevention | 6 (28.6%) | 15 (71.4%) |
| Law Enforcement | 9 (100.0%) | 0 (0.0%) |
| Food Preparation & Serving | 17 (21.2%) | 63 (78.7%) |
| Cleaning & Maintenance | 63 (88.7%) | 8 (11.3%) |
| Personal Care & Service | 14 (17.9%) | 64 (82.1%) |
| Total (Category) | 109 (36.6%) | 189 (63.4%) |
| Total (Overall) | 1,270 (57.2%) | 949 (42.8%) |
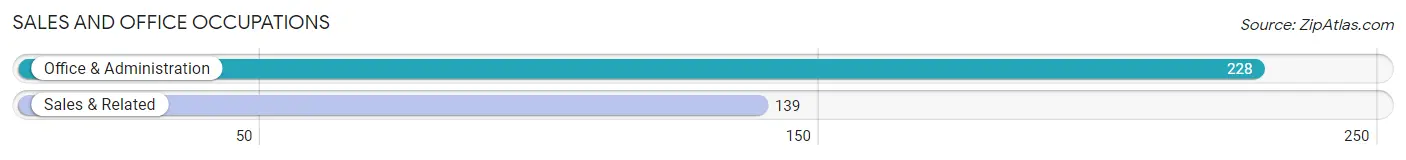
Sales and Office Occupations
The most common Sales and Office occupations in Furnas County are Office & Administration (228 | 10.3%), and Sales & Related (139 | 6.3%).
Sales and Office Occupations by Sex
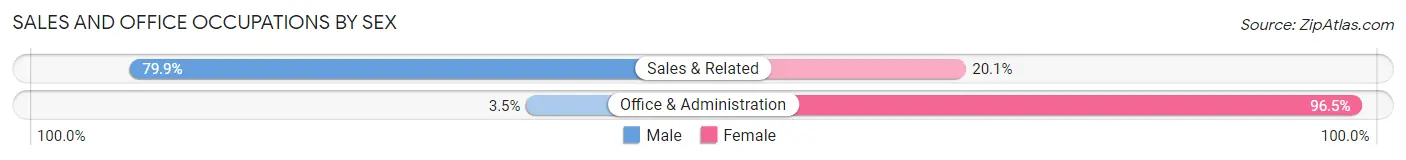
| Occupation | Male | Female |
| Sales & Related | 111 (79.9%) | 28 (20.1%) |
| Office & Administration | 8 (3.5%) | 220 (96.5%) |
| Total (Category) | 119 (32.4%) | 248 (67.6%) |
| Total (Overall) | 1,270 (57.2%) | 949 (42.8%) |
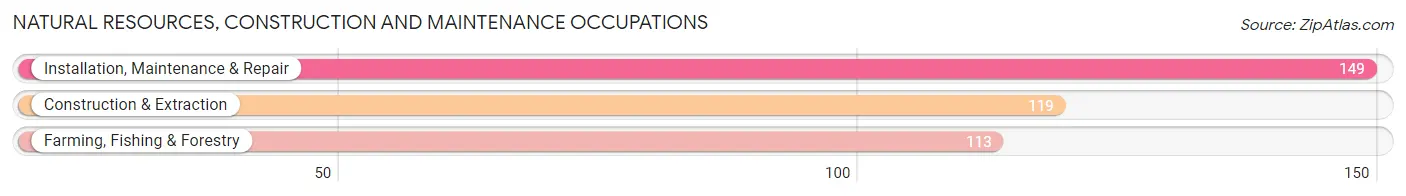
Natural Resources, Construction and Maintenance Occupations
The most common Natural Resources, Construction and Maintenance occupations in Furnas County are Installation, Maintenance & Repair (149 | 6.7%), Construction & Extraction (119 | 5.4%), and Farming, Fishing & Forestry (113 | 5.1%).
Natural Resources, Construction and Maintenance Occupations by Sex
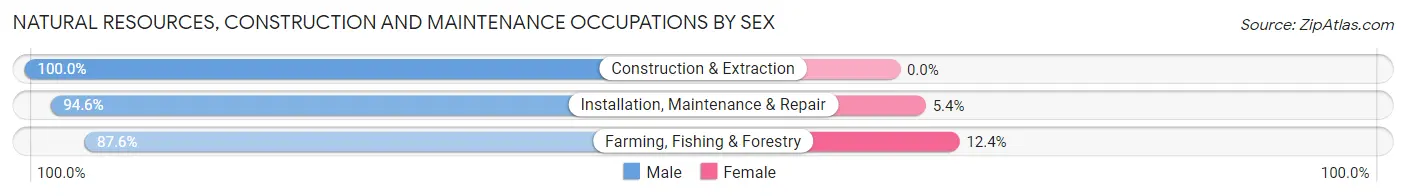
| Occupation | Male | Female |
| Farming, Fishing & Forestry | 99 (87.6%) | 14 (12.4%) |
| Construction & Extraction | 119 (100.0%) | 0 (0.0%) |
| Installation, Maintenance & Repair | 141 (94.6%) | 8 (5.4%) |
| Total (Category) | 359 (94.2%) | 22 (5.8%) |
| Total (Overall) | 1,270 (57.2%) | 949 (42.8%) |
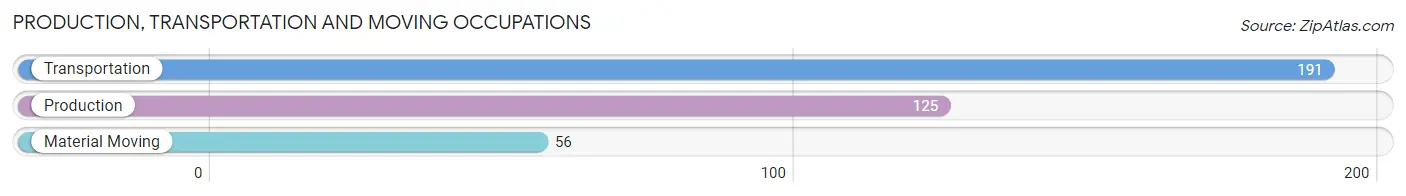
Production, Transportation and Moving Occupations
The most common Production, Transportation and Moving occupations in Furnas County are Transportation (191 | 8.6%), Production (125 | 5.6%), and Material Moving (56 | 2.5%).
Production, Transportation and Moving Occupations by Sex
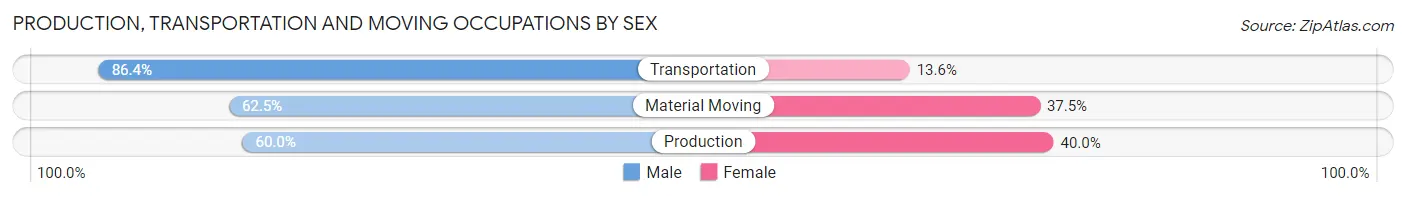
| Occupation | Male | Female |
| Production | 75 (60.0%) | 50 (40.0%) |
| Transportation | 165 (86.4%) | 26 (13.6%) |
| Material Moving | 35 (62.5%) | 21 (37.5%) |
| Total (Category) | 275 (73.9%) | 97 (26.1%) |
| Total (Overall) | 1,270 (57.2%) | 949 (42.8%) |
Employment Industries by Sex in Furnas County
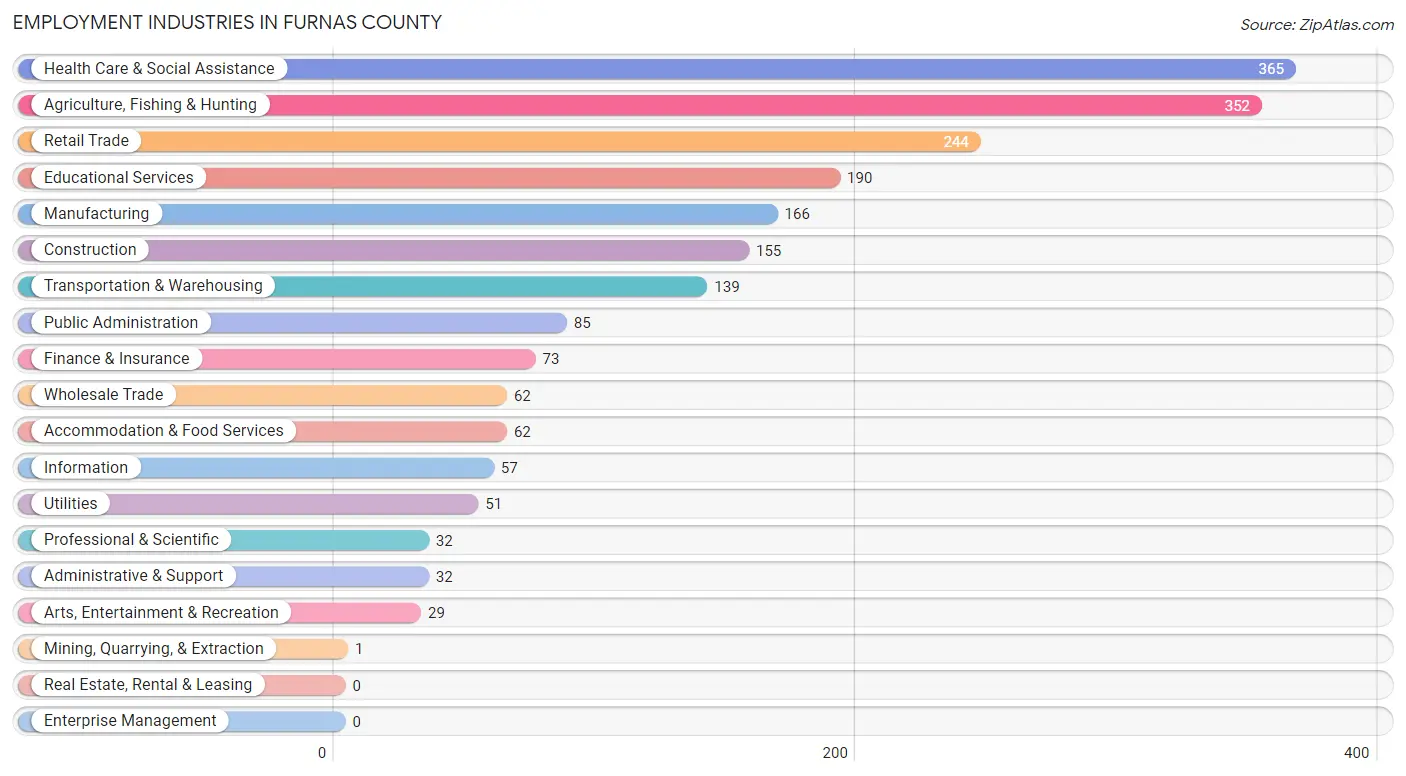
Employment Industries in Furnas County
The major employment industries in Furnas County include Health Care & Social Assistance (365 | 16.5%), Agriculture, Fishing & Hunting (352 | 15.9%), Retail Trade (244 | 11.0%), Educational Services (190 | 8.6%), and Manufacturing (166 | 7.5%).
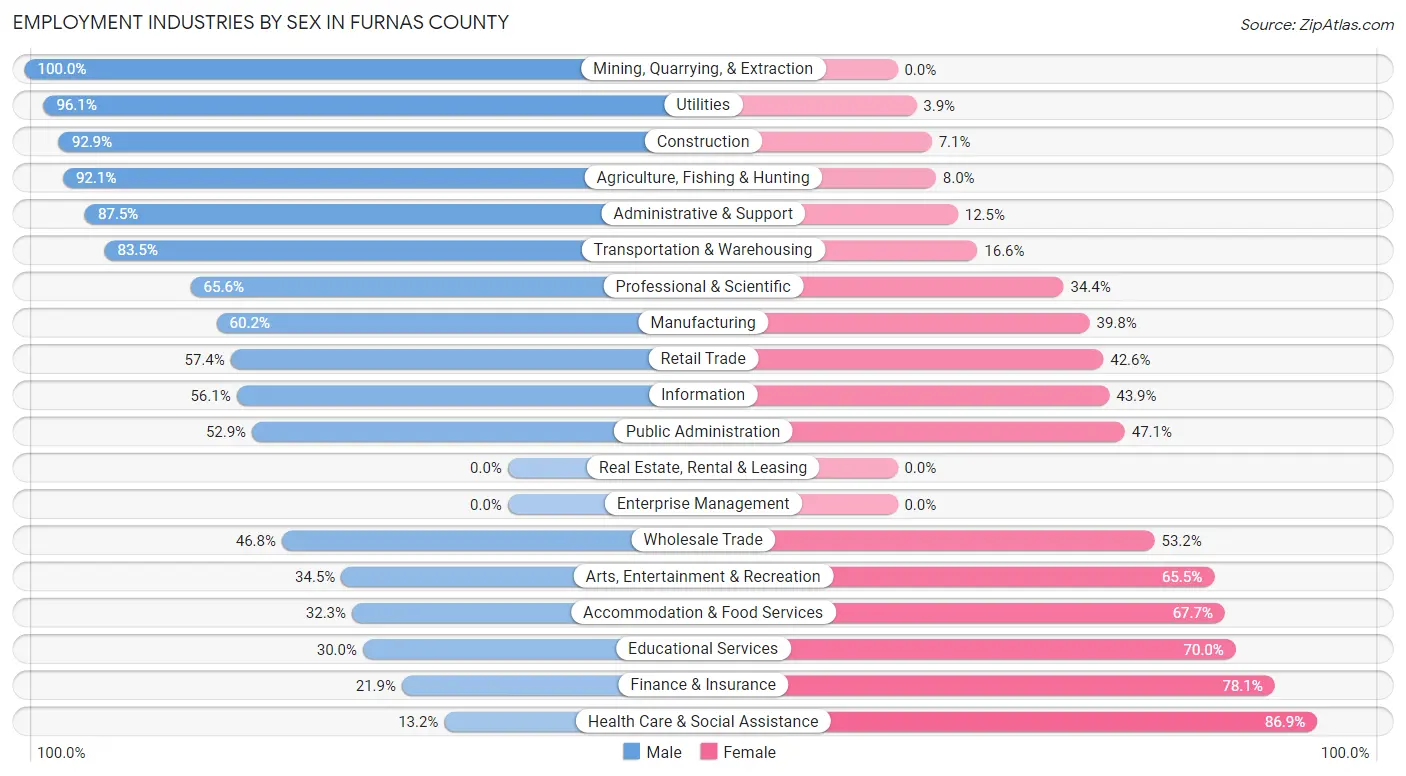
Employment Industries by Sex in Furnas County
The Furnas County industries that see more men than women are Mining, Quarrying, & Extraction (100.0%), Utilities (96.1%), and Construction (92.9%), whereas the industries that tend to have a higher number of women are Health Care & Social Assistance (86.9%), Finance & Insurance (78.1%), and Educational Services (70.0%).
| Industry | Male | Female |
| Agriculture, Fishing & Hunting | 324 (92.0%) | 28 (8.0%) |
| Mining, Quarrying, & Extraction | 1 (100.0%) | 0 (0.0%) |
| Construction | 144 (92.9%) | 11 (7.1%) |
| Manufacturing | 100 (60.2%) | 66 (39.8%) |
| Wholesale Trade | 29 (46.8%) | 33 (53.2%) |
| Retail Trade | 140 (57.4%) | 104 (42.6%) |
| Transportation & Warehousing | 116 (83.5%) | 23 (16.6%) |
| Utilities | 49 (96.1%) | 2 (3.9%) |
| Information | 32 (56.1%) | 25 (43.9%) |
| Finance & Insurance | 16 (21.9%) | 57 (78.1%) |
| Real Estate, Rental & Leasing | 0 (0.0%) | 0 (0.0%) |
| Professional & Scientific | 21 (65.6%) | 11 (34.4%) |
| Enterprise Management | 0 (0.0%) | 0 (0.0%) |
| Administrative & Support | 28 (87.5%) | 4 (12.5%) |
| Educational Services | 57 (30.0%) | 133 (70.0%) |
| Health Care & Social Assistance | 48 (13.2%) | 317 (86.9%) |
| Arts, Entertainment & Recreation | 10 (34.5%) | 19 (65.5%) |
| Accommodation & Food Services | 20 (32.3%) | 42 (67.7%) |
| Public Administration | 45 (52.9%) | 40 (47.1%) |
| Total | 1,270 (57.2%) | 949 (42.8%) |
Education in Furnas County
School Enrollment in Furnas County
The most common levels of schooling among the 859 students in Furnas County are high school (244 | 28.4%), middle school (211 | 24.6%), and elementary school (202 | 23.5%).
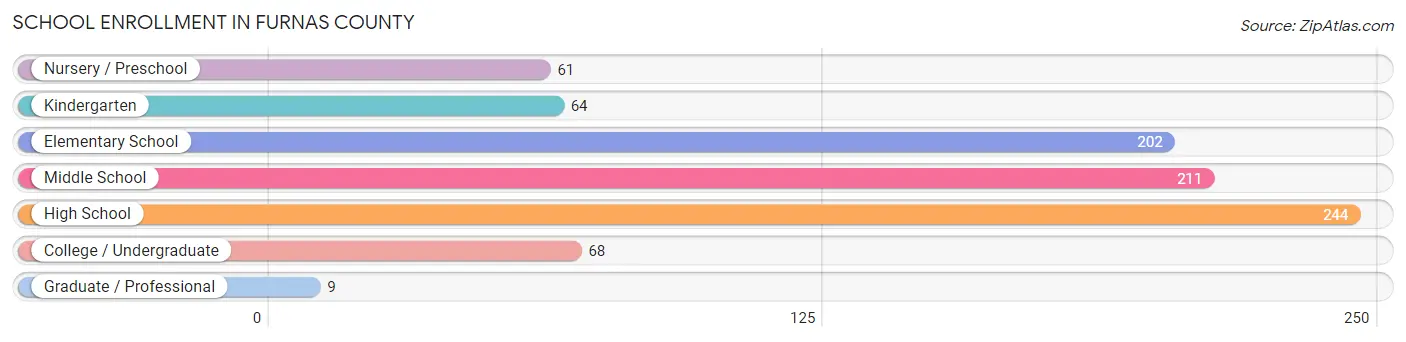
| School Level | # Students | % Students |
| Nursery / Preschool | 61 | 7.1% |
| Kindergarten | 64 | 7.4% |
| Elementary School | 202 | 23.5% |
| Middle School | 211 | 24.6% |
| High School | 244 | 28.4% |
| College / Undergraduate | 68 | 7.9% |
| Graduate / Professional | 9 | 1.1% |
| Total | 859 | 100.0% |
School Enrollment by Age by Funding Source in Furnas County
Out of a total of 859 students who are enrolled in schools in Furnas County, 7 (0.8%) attend a private institution, while the remaining 852 (99.2%) are enrolled in public schools. The age group of 35 years and over has the highest likelihood of being enrolled in private schools, with 3 (12.5% in the age bracket) enrolled. Conversely, the age group of 3 to 4 year olds has the lowest likelihood of being enrolled in a private school, with 28 (100.0% in the age bracket) attending a public institution.
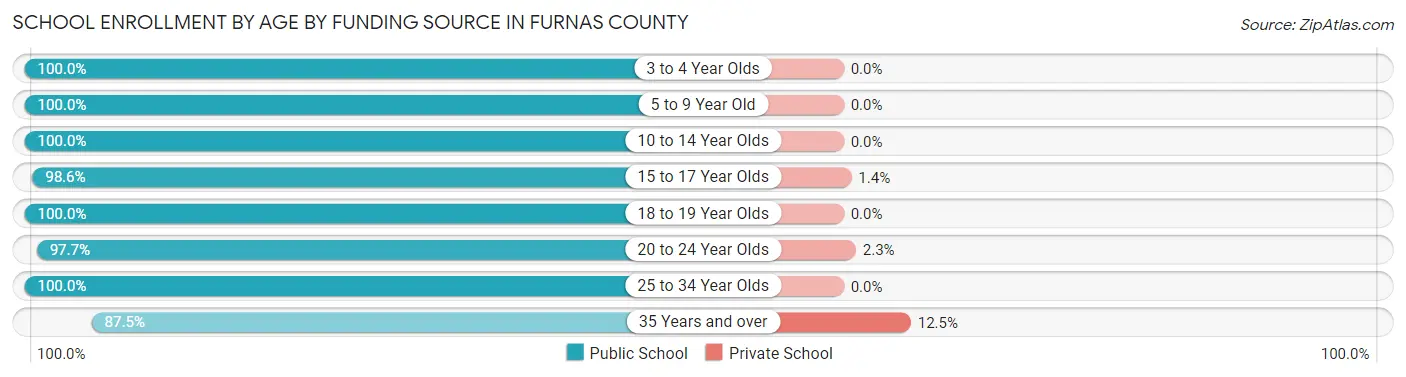
| Age Bracket | Public School | Private School |
| 3 to 4 Year Olds | 28 (100.0%) | 0 (0.0%) |
| 5 to 9 Year Old | 260 (100.0%) | 0 (0.0%) |
| 10 to 14 Year Olds | 262 (100.0%) | 0 (0.0%) |
| 15 to 17 Year Olds | 205 (98.6%) | 3 (1.4%) |
| 18 to 19 Year Olds | 24 (100.0%) | 0 (0.0%) |
| 20 to 24 Year Olds | 43 (97.7%) | 1 (2.3%) |
| 25 to 34 Year Olds | 9 (100.0%) | 0 (0.0%) |
| 35 Years and over | 21 (87.5%) | 3 (12.5%) |
| Total | 852 (99.2%) | 7 (0.8%) |
Educational Attainment by Field of Study in Furnas County
Education (204 | 27.7%), business (102 | 13.9%), bio, nature & agricultural (101 | 13.7%), science & technology (99 | 13.5%), and arts & humanities (49 | 6.7%) are the most common fields of study among 736 individuals in Furnas County who have obtained a bachelor's degree or higher.
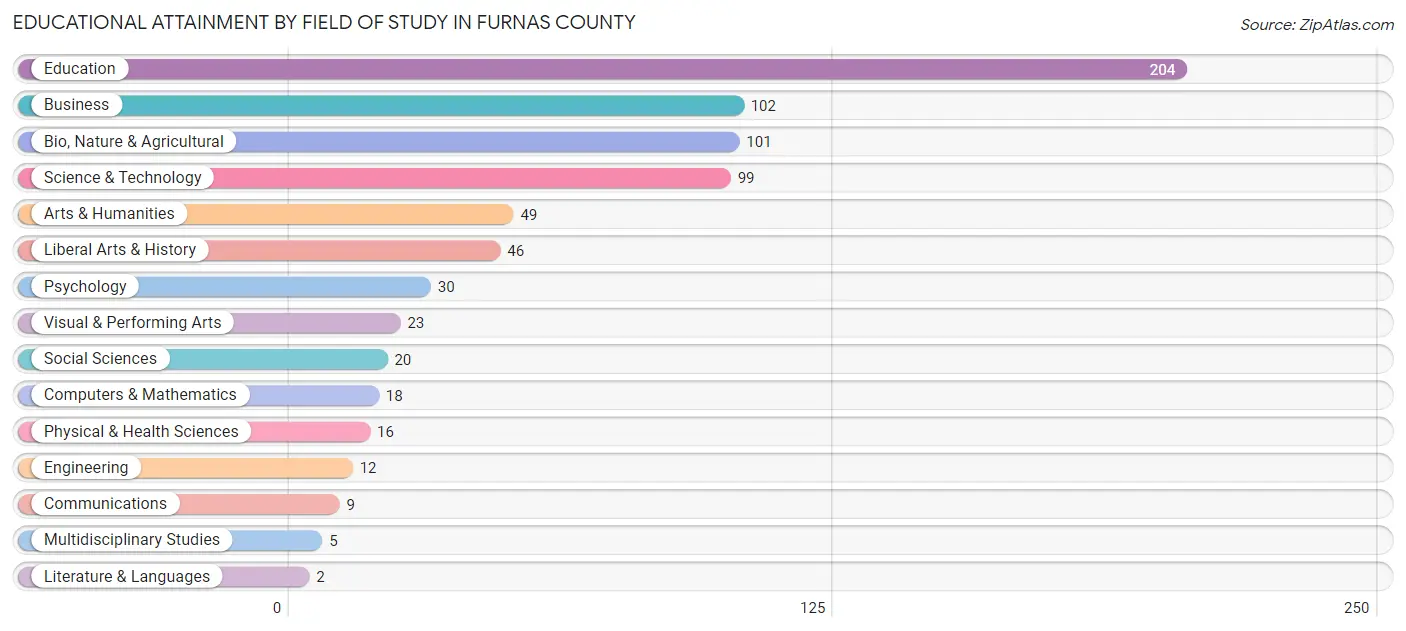
| Field of Study | # Graduates | % Graduates |
| Computers & Mathematics | 18 | 2.5% |
| Bio, Nature & Agricultural | 101 | 13.7% |
| Physical & Health Sciences | 16 | 2.2% |
| Psychology | 30 | 4.1% |
| Social Sciences | 20 | 2.7% |
| Engineering | 12 | 1.6% |
| Multidisciplinary Studies | 5 | 0.7% |
| Science & Technology | 99 | 13.5% |
| Business | 102 | 13.9% |
| Education | 204 | 27.7% |
| Literature & Languages | 2 | 0.3% |
| Liberal Arts & History | 46 | 6.2% |
| Visual & Performing Arts | 23 | 3.1% |
| Communications | 9 | 1.2% |
| Arts & Humanities | 49 | 6.7% |
| Total | 736 | 100.0% |
Transportation & Commute in Furnas County
Vehicle Availability by Sex in Furnas County
The most prevalent vehicle ownership categories in Furnas County are males with 2 vehicles (455, accounting for 35.8%) and females with 2 vehicles (352, making up 49.6%).
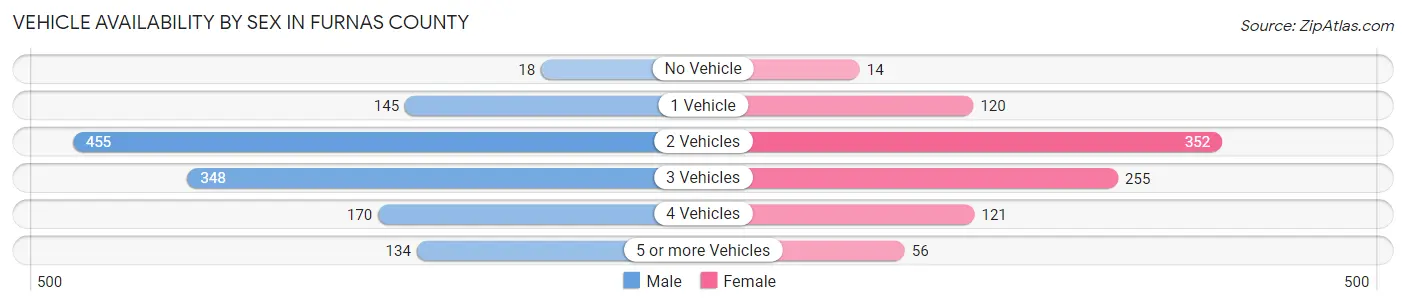
| Vehicles Available | Male | Female |
| No Vehicle | 18 (1.4%) | 14 (1.5%) |
| 1 Vehicle | 145 (11.4%) | 120 (13.1%) |
| 2 Vehicles | 455 (35.8%) | 352 (38.3%) |
| 3 Vehicles | 348 (27.4%) | 255 (27.8%) |
| 4 Vehicles | 170 (13.4%) | 121 (13.2%) |
| 5 or more Vehicles | 134 (10.5%) | 56 (6.1%) |
| Total | 1,270 (100.0%) | 918 (100.0%) |
Commute Time in Furnas County
The most frequently occuring commute durations in Furnas County are 5 to 9 minutes (536 commuters, 25.9%), less than 5 minutes (399 commuters, 19.3%), and 20 to 24 minutes (276 commuters, 13.3%).
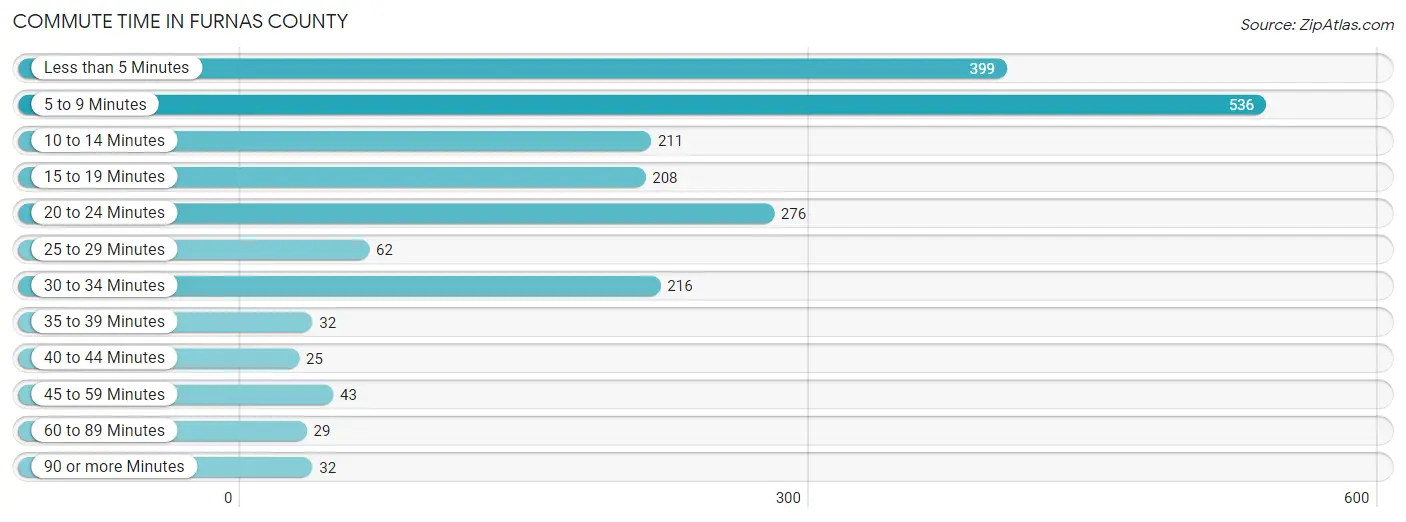
| Commute Time | # Commuters | % Commuters |
| Less than 5 Minutes | 399 | 19.3% |
| 5 to 9 Minutes | 536 | 25.9% |
| 10 to 14 Minutes | 211 | 10.2% |
| 15 to 19 Minutes | 208 | 10.1% |
| 20 to 24 Minutes | 276 | 13.3% |
| 25 to 29 Minutes | 62 | 3.0% |
| 30 to 34 Minutes | 216 | 10.4% |
| 35 to 39 Minutes | 32 | 1.5% |
| 40 to 44 Minutes | 25 | 1.2% |
| 45 to 59 Minutes | 43 | 2.1% |
| 60 to 89 Minutes | 29 | 1.4% |
| 90 or more Minutes | 32 | 1.5% |
Commute Time by Sex in Furnas County
The most common commute times in Furnas County are 5 to 9 minutes (319 commuters, 26.7%) for males and 5 to 9 minutes (217 commuters, 24.8%) for females.
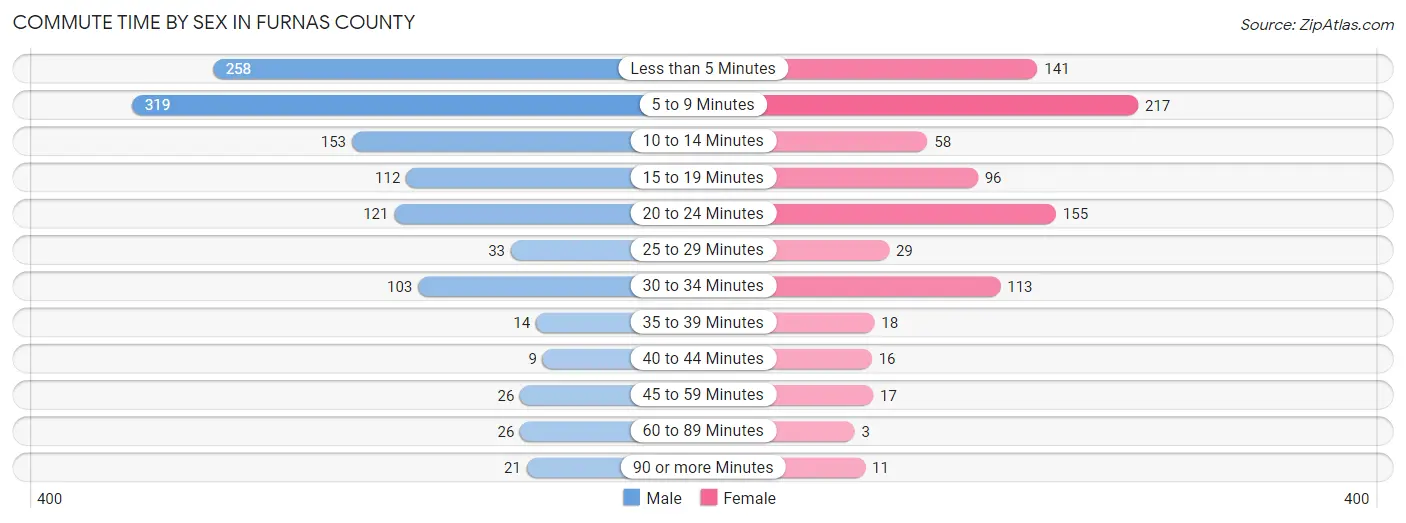
| Commute Time | Male | Female |
| Less than 5 Minutes | 258 (21.6%) | 141 (16.1%) |
| 5 to 9 Minutes | 319 (26.7%) | 217 (24.8%) |
| 10 to 14 Minutes | 153 (12.8%) | 58 (6.6%) |
| 15 to 19 Minutes | 112 (9.4%) | 96 (11.0%) |
| 20 to 24 Minutes | 121 (10.1%) | 155 (17.7%) |
| 25 to 29 Minutes | 33 (2.8%) | 29 (3.3%) |
| 30 to 34 Minutes | 103 (8.6%) | 113 (12.9%) |
| 35 to 39 Minutes | 14 (1.2%) | 18 (2.1%) |
| 40 to 44 Minutes | 9 (0.7%) | 16 (1.8%) |
| 45 to 59 Minutes | 26 (2.2%) | 17 (1.9%) |
| 60 to 89 Minutes | 26 (2.2%) | 3 (0.3%) |
| 90 or more Minutes | 21 (1.8%) | 11 (1.3%) |
Time of Departure to Work by Sex in Furnas County
The most frequent times of departure to work in Furnas County are 7:30 AM to 7:59 AM (282, 23.6%) for males and 7:30 AM to 7:59 AM (185, 21.2%) for females.
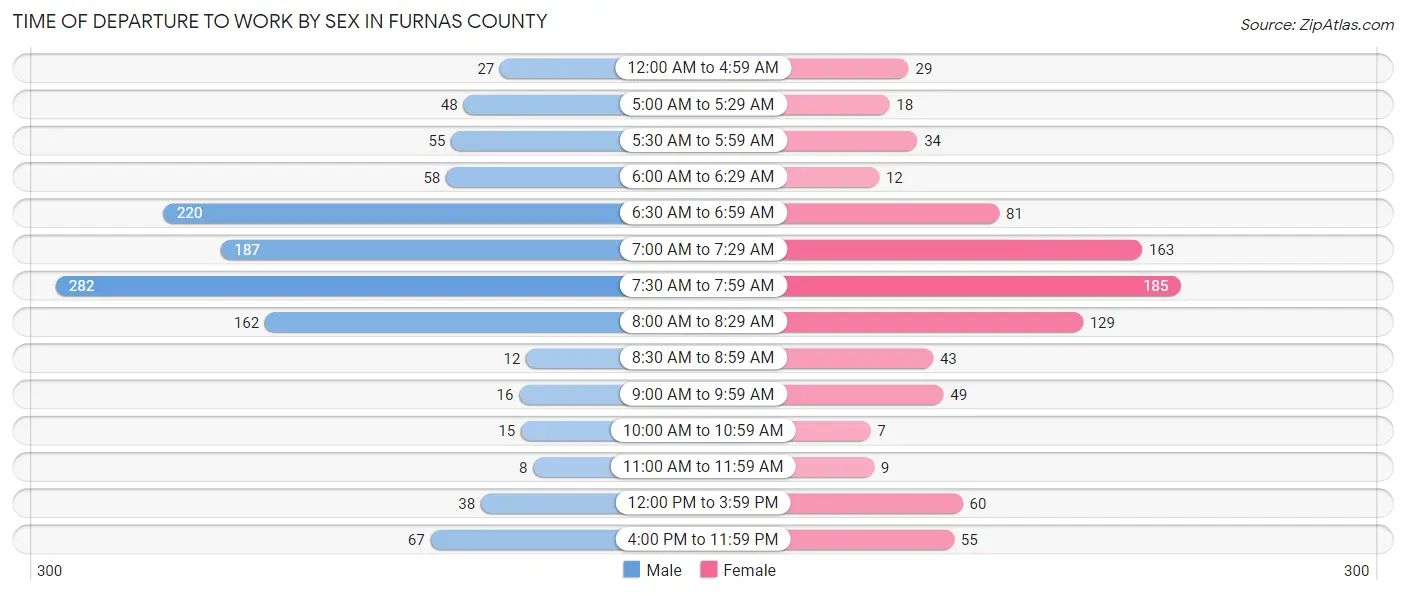
| Time of Departure | Male | Female |
| 12:00 AM to 4:59 AM | 27 (2.3%) | 29 (3.3%) |
| 5:00 AM to 5:29 AM | 48 (4.0%) | 18 (2.1%) |
| 5:30 AM to 5:59 AM | 55 (4.6%) | 34 (3.9%) |
| 6:00 AM to 6:29 AM | 58 (4.9%) | 12 (1.4%) |
| 6:30 AM to 6:59 AM | 220 (18.4%) | 81 (9.3%) |
| 7:00 AM to 7:29 AM | 187 (15.7%) | 163 (18.6%) |
| 7:30 AM to 7:59 AM | 282 (23.6%) | 185 (21.2%) |
| 8:00 AM to 8:29 AM | 162 (13.6%) | 129 (14.8%) |
| 8:30 AM to 8:59 AM | 12 (1.0%) | 43 (4.9%) |
| 9:00 AM to 9:59 AM | 16 (1.3%) | 49 (5.6%) |
| 10:00 AM to 10:59 AM | 15 (1.3%) | 7 (0.8%) |
| 11:00 AM to 11:59 AM | 8 (0.7%) | 9 (1.0%) |
| 12:00 PM to 3:59 PM | 38 (3.2%) | 60 (6.9%) |
| 4:00 PM to 11:59 PM | 67 (5.6%) | 55 (6.3%) |
| Total | 1,195 (100.0%) | 874 (100.0%) |
Housing Occupancy in Furnas County
Occupancy by Ownership in Furnas County
Of the total 2,003 dwellings in Furnas County, owner-occupied units account for 1,564 (78.1%), while renter-occupied units make up 439 (21.9%).
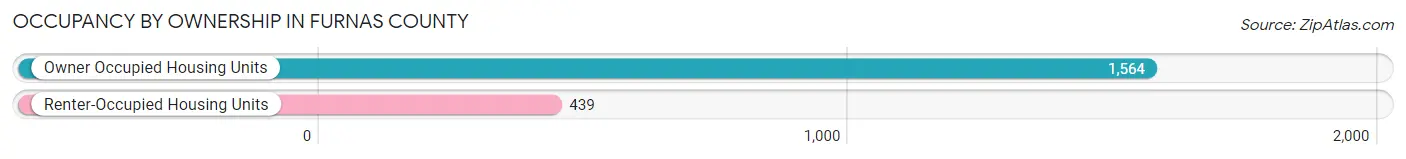
| Occupancy | # Housing Units | % Housing Units |
| Owner Occupied Housing Units | 1,564 | 78.1% |
| Renter-Occupied Housing Units | 439 | 21.9% |
| Total Occupied Housing Units | 2,003 | 100.0% |
Occupancy by Household Size in Furnas County
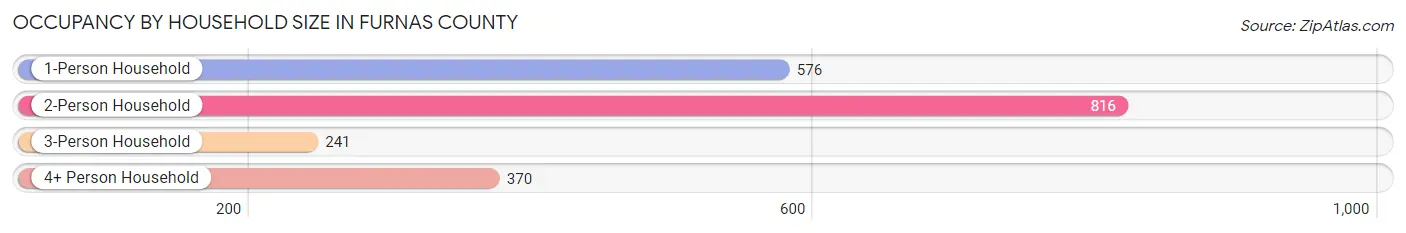
| Household Size | # Housing Units | % Housing Units |
| 1-Person Household | 576 | 28.8% |
| 2-Person Household | 816 | 40.7% |
| 3-Person Household | 241 | 12.0% |
| 4+ Person Household | 370 | 18.5% |
| Total Housing Units | 2,003 | 100.0% |
Occupancy by Ownership by Household Size in Furnas County
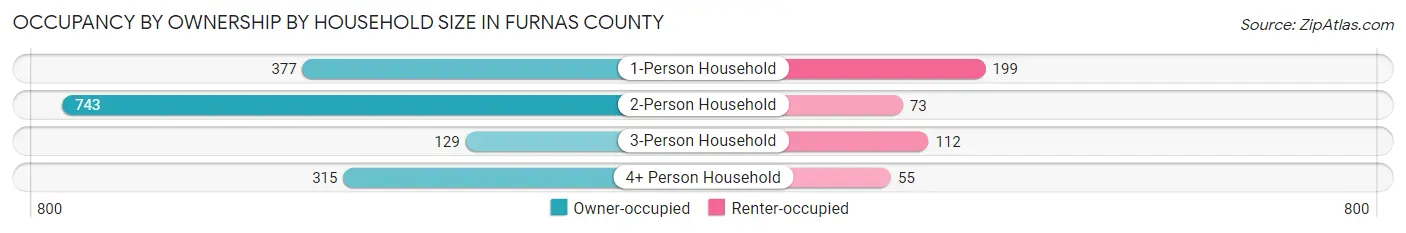
| Household Size | Owner-occupied | Renter-occupied |
| 1-Person Household | 377 (65.4%) | 199 (34.5%) |
| 2-Person Household | 743 (91.0%) | 73 (8.9%) |
| 3-Person Household | 129 (53.5%) | 112 (46.5%) |
| 4+ Person Household | 315 (85.1%) | 55 (14.9%) |
| Total Housing Units | 1,564 (78.1%) | 439 (21.9%) |
Occupancy by Educational Attainment in Furnas County
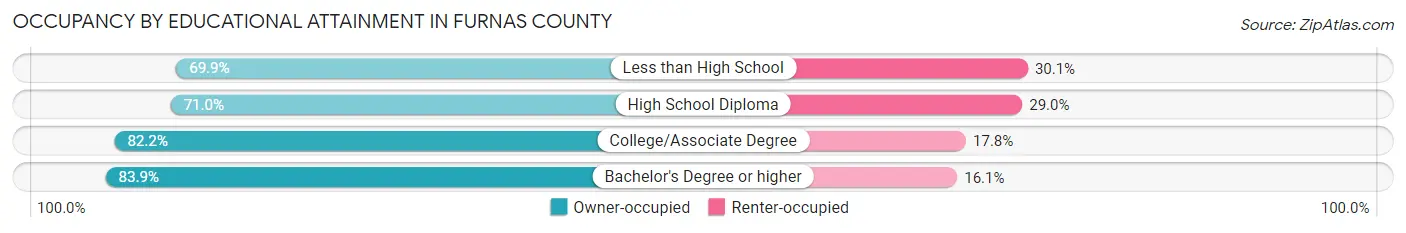
| Household Size | Owner-occupied | Renter-occupied |
| Less than High School | 151 (69.9%) | 65 (30.1%) |
| High School Diploma | 397 (71.0%) | 162 (29.0%) |
| College/Associate Degree | 682 (82.2%) | 148 (17.8%) |
| Bachelor's Degree or higher | 334 (83.9%) | 64 (16.1%) |
Occupancy by Age of Householder in Furnas County
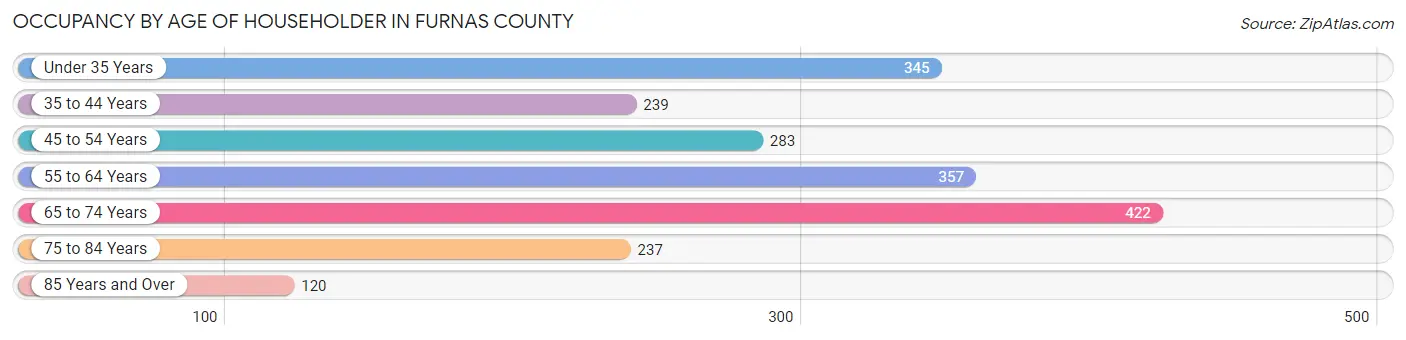
| Age Bracket | # Households | % Households |
| Under 35 Years | 345 | 17.2% |
| 35 to 44 Years | 239 | 11.9% |
| 45 to 54 Years | 283 | 14.1% |
| 55 to 64 Years | 357 | 17.8% |
| 65 to 74 Years | 422 | 21.1% |
| 75 to 84 Years | 237 | 11.8% |
| 85 Years and Over | 120 | 6.0% |
| Total | 2,003 | 100.0% |
Housing Finances in Furnas County
Median Income by Occupancy in Furnas County
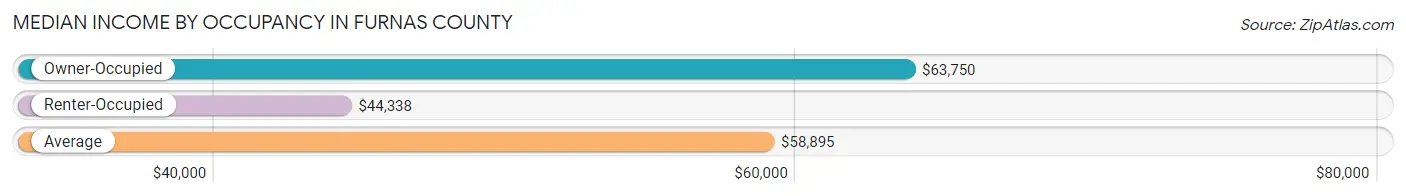
| Occupancy Type | # Households | Median Income |
| Owner-Occupied | 1,564 (78.1%) | $63,750 |
| Renter-Occupied | 439 (21.9%) | $44,338 |
| Average | 2,003 (100.0%) | $58,895 |
Occupancy by Householder Income Bracket in Furnas County
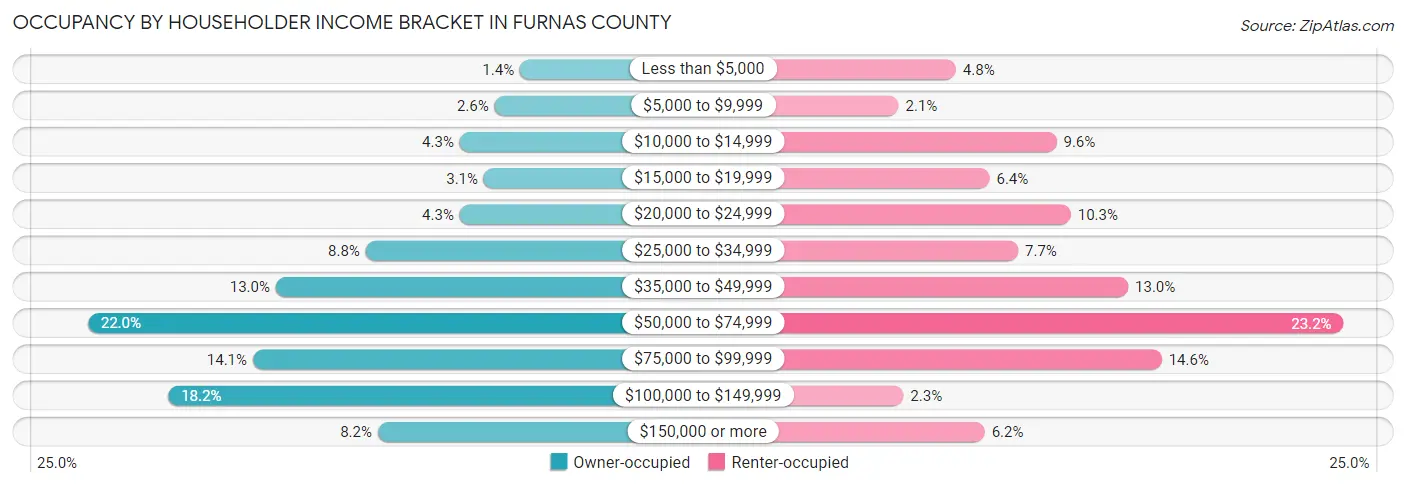
| Income Bracket | Owner-occupied | Renter-occupied |
| Less than $5,000 | 22 (1.4%) | 21 (4.8%) |
| $5,000 to $9,999 | 41 (2.6%) | 9 (2.1%) |
| $10,000 to $14,999 | 67 (4.3%) | 42 (9.6%) |
| $15,000 to $19,999 | 49 (3.1%) | 28 (6.4%) |
| $20,000 to $24,999 | 67 (4.3%) | 45 (10.2%) |
| $25,000 to $34,999 | 137 (8.8%) | 34 (7.7%) |
| $35,000 to $49,999 | 204 (13.0%) | 57 (13.0%) |
| $50,000 to $74,999 | 344 (22.0%) | 102 (23.2%) |
| $75,000 to $99,999 | 221 (14.1%) | 64 (14.6%) |
| $100,000 to $149,999 | 284 (18.2%) | 10 (2.3%) |
| $150,000 or more | 128 (8.2%) | 27 (6.1%) |
| Total | 1,564 (100.0%) | 439 (100.0%) |
Monthly Housing Cost Tiers in Furnas County
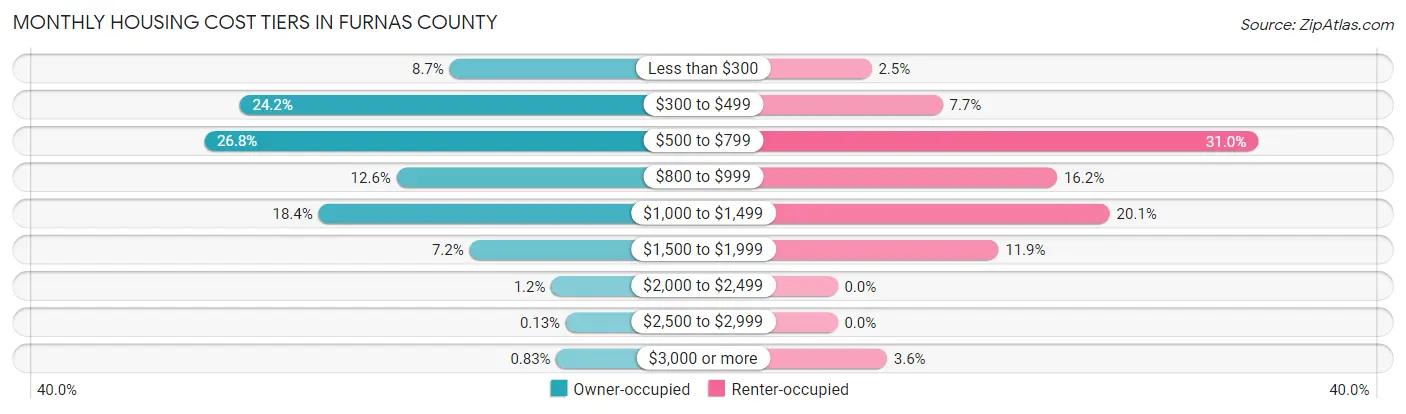
| Monthly Cost | Owner-occupied | Renter-occupied |
| Less than $300 | 136 (8.7%) | 11 (2.5%) |
| $300 to $499 | 378 (24.2%) | 34 (7.7%) |
| $500 to $799 | 419 (26.8%) | 136 (31.0%) |
| $800 to $999 | 197 (12.6%) | 71 (16.2%) |
| $1,000 to $1,499 | 287 (18.3%) | 88 (20.1%) |
| $1,500 to $1,999 | 113 (7.2%) | 52 (11.8%) |
| $2,000 to $2,499 | 19 (1.2%) | 0 (0.0%) |
| $2,500 to $2,999 | 2 (0.1%) | 0 (0.0%) |
| $3,000 or more | 13 (0.8%) | 16 (3.6%) |
| Total | 1,564 (100.0%) | 439 (100.0%) |
Physical Housing Characteristics in Furnas County
Housing Structures in Furnas County
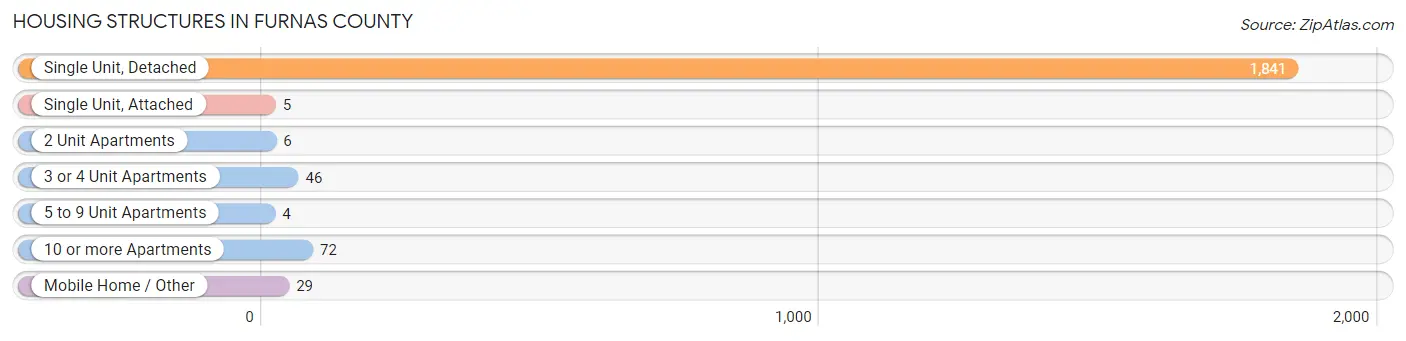
| Structure Type | # Housing Units | % Housing Units |
| Single Unit, Detached | 1,841 | 91.9% |
| Single Unit, Attached | 5 | 0.3% |
| 2 Unit Apartments | 6 | 0.3% |
| 3 or 4 Unit Apartments | 46 | 2.3% |
| 5 to 9 Unit Apartments | 4 | 0.2% |
| 10 or more Apartments | 72 | 3.6% |
| Mobile Home / Other | 29 | 1.5% |
| Total | 2,003 | 100.0% |
Housing Structures by Occupancy in Furnas County
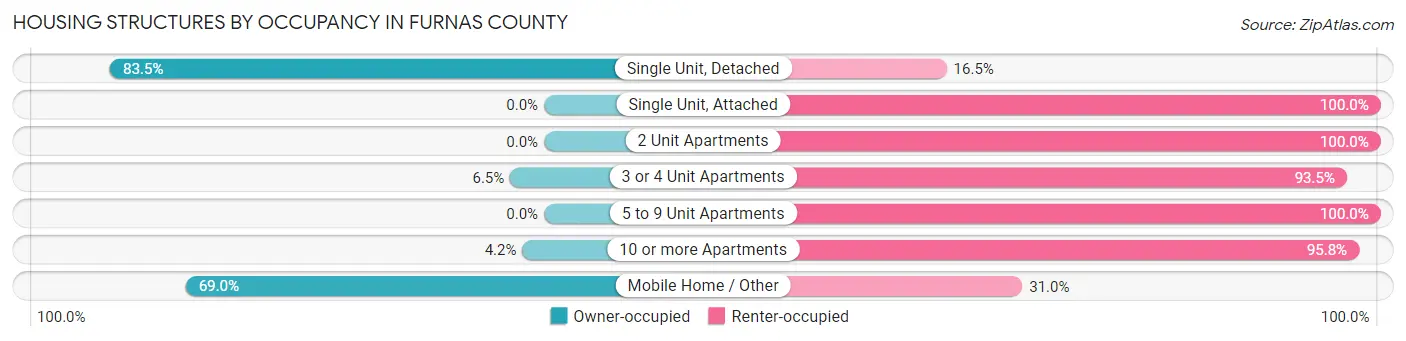
| Structure Type | Owner-occupied | Renter-occupied |
| Single Unit, Detached | 1,538 (83.5%) | 303 (16.5%) |
| Single Unit, Attached | 0 (0.0%) | 5 (100.0%) |
| 2 Unit Apartments | 0 (0.0%) | 6 (100.0%) |
| 3 or 4 Unit Apartments | 3 (6.5%) | 43 (93.5%) |
| 5 to 9 Unit Apartments | 0 (0.0%) | 4 (100.0%) |
| 10 or more Apartments | 3 (4.2%) | 69 (95.8%) |
| Mobile Home / Other | 20 (69.0%) | 9 (31.0%) |
| Total | 1,564 (78.1%) | 439 (21.9%) |
Housing Structures by Number of Rooms in Furnas County
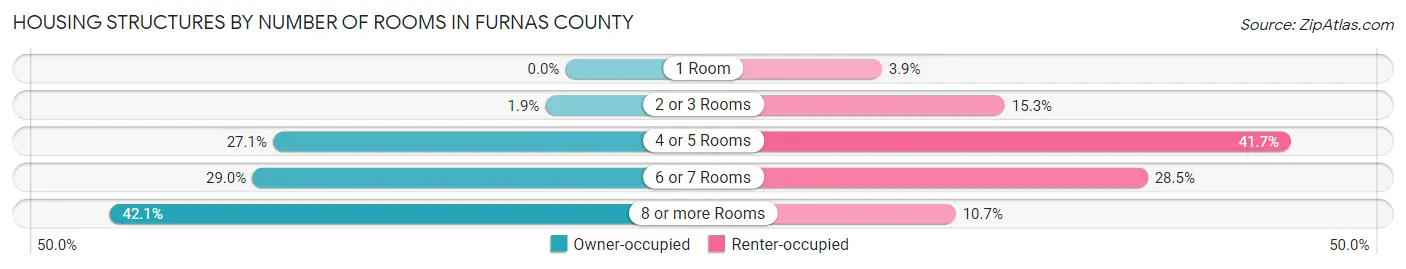
| Number of Rooms | Owner-occupied | Renter-occupied |
| 1 Room | 0 (0.0%) | 17 (3.9%) |
| 2 or 3 Rooms | 29 (1.8%) | 67 (15.3%) |
| 4 or 5 Rooms | 423 (27.1%) | 183 (41.7%) |
| 6 or 7 Rooms | 453 (29.0%) | 125 (28.5%) |
| 8 or more Rooms | 659 (42.1%) | 47 (10.7%) |
| Total | 1,564 (100.0%) | 439 (100.0%) |
Housing Structure by Heating Type in Furnas County
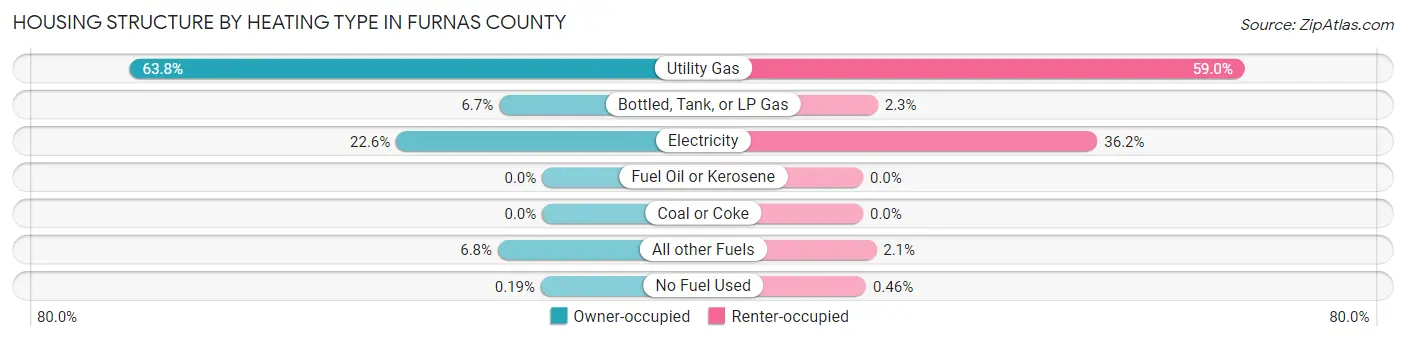
| Heating Type | Owner-occupied | Renter-occupied |
| Utility Gas | 997 (63.7%) | 259 (59.0%) |
| Bottled, Tank, or LP Gas | 104 (6.7%) | 10 (2.3%) |
| Electricity | 353 (22.6%) | 159 (36.2%) |
| Fuel Oil or Kerosene | 0 (0.0%) | 0 (0.0%) |
| Coal or Coke | 0 (0.0%) | 0 (0.0%) |
| All other Fuels | 107 (6.8%) | 9 (2.1%) |
| No Fuel Used | 3 (0.2%) | 2 (0.5%) |
| Total | 1,564 (100.0%) | 439 (100.0%) |
Household Vehicle Usage in Furnas County
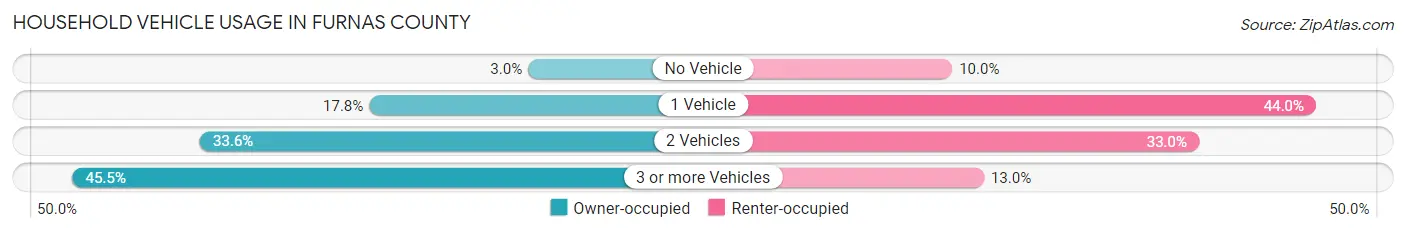
| Vehicles per Household | Owner-occupied | Renter-occupied |
| No Vehicle | 47 (3.0%) | 44 (10.0%) |
| 1 Vehicle | 279 (17.8%) | 193 (44.0%) |
| 2 Vehicles | 526 (33.6%) | 145 (33.0%) |
| 3 or more Vehicles | 712 (45.5%) | 57 (13.0%) |
| Total | 1,564 (100.0%) | 439 (100.0%) |
Real Estate & Mortgages in Furnas County
Real Estate and Mortgage Overview in Furnas County
| Characteristic | Without Mortgage | With Mortgage |
| Housing Units | 975 | 589 |
| Median Property Value | $67,300 | $110,500 |
| Median Household Income | $53,967 | $46 |
| Monthly Housing Costs | $493 | $9 |
| Real Estate Taxes | $1,037 | $18 |
Property Value by Mortgage Status in Furnas County
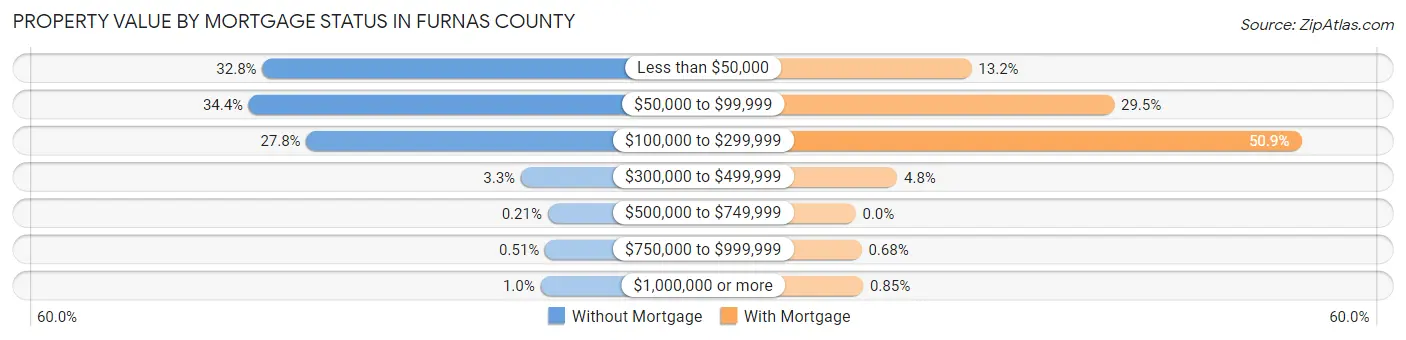
| Property Value | Without Mortgage | With Mortgage |
| Less than $50,000 | 320 (32.8%) | 78 (13.2%) |
| $50,000 to $99,999 | 335 (34.4%) | 174 (29.5%) |
| $100,000 to $299,999 | 271 (27.8%) | 300 (50.9%) |
| $300,000 to $499,999 | 32 (3.3%) | 28 (4.8%) |
| $500,000 to $749,999 | 2 (0.2%) | 0 (0.0%) |
| $750,000 to $999,999 | 5 (0.5%) | 4 (0.7%) |
| $1,000,000 or more | 10 (1.0%) | 5 (0.9%) |
| Total | 975 (100.0%) | 589 (100.0%) |
Household Income by Mortgage Status in Furnas County
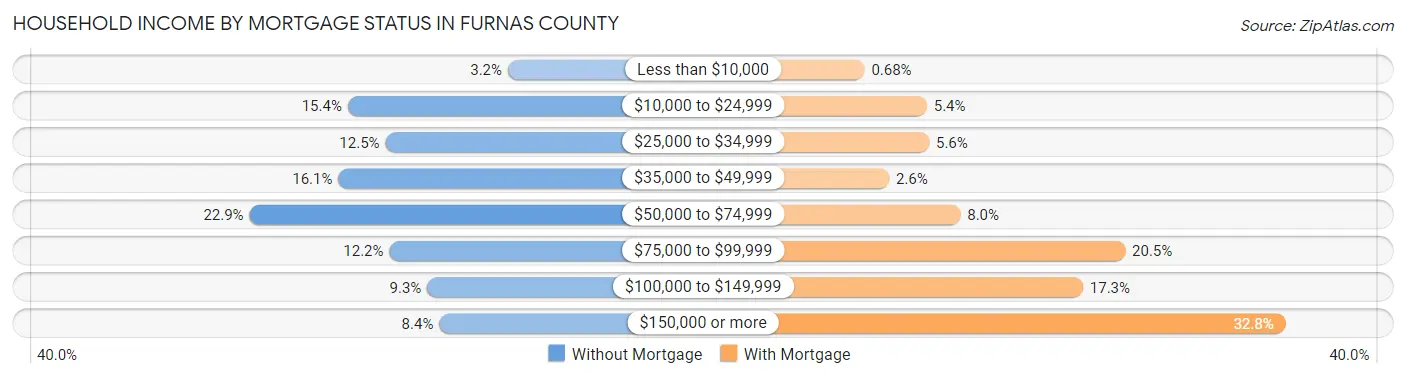
| Household Income | Without Mortgage | With Mortgage |
| Less than $10,000 | 31 (3.2%) | 4 (0.7%) |
| $10,000 to $24,999 | 150 (15.4%) | 32 (5.4%) |
| $25,000 to $34,999 | 122 (12.5%) | 33 (5.6%) |
| $35,000 to $49,999 | 157 (16.1%) | 15 (2.5%) |
| $50,000 to $74,999 | 223 (22.9%) | 47 (8.0%) |
| $75,000 to $99,999 | 119 (12.2%) | 121 (20.5%) |
| $100,000 to $149,999 | 91 (9.3%) | 102 (17.3%) |
| $150,000 or more | 82 (8.4%) | 193 (32.8%) |
| Total | 975 (100.0%) | 589 (100.0%) |
Property Value to Household Income Ratio in Furnas County
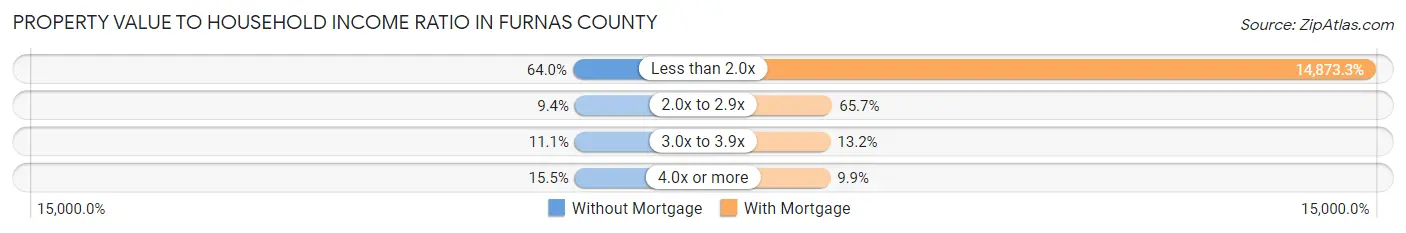
| Value-to-Income Ratio | Without Mortgage | With Mortgage |
| Less than 2.0x | 624 (64.0%) | 87,604 (14,873.3%) |
| 2.0x to 2.9x | 92 (9.4%) | 387 (65.7%) |
| 3.0x to 3.9x | 108 (11.1%) | 78 (13.2%) |
| 4.0x or more | 151 (15.5%) | 58 (9.9%) |
| Total | 975 (100.0%) | 589 (100.0%) |
Real Estate Taxes by Mortgage Status in Furnas County
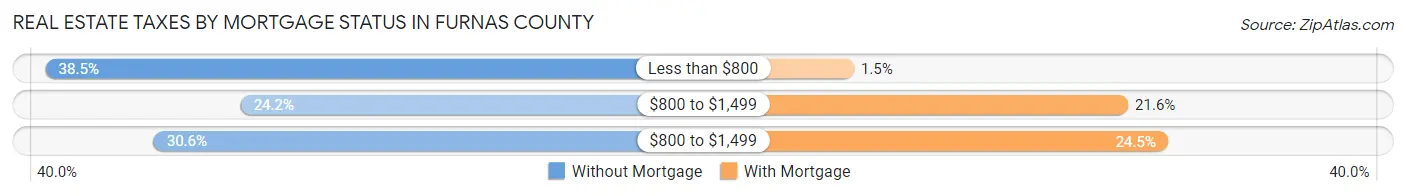
| Property Taxes | Without Mortgage | With Mortgage |
| Less than $800 | 375 (38.5%) | 9 (1.5%) |
| $800 to $1,499 | 236 (24.2%) | 127 (21.6%) |
| $800 to $1,499 | 298 (30.6%) | 144 (24.4%) |
| Total | 975 (100.0%) | 589 (100.0%) |
Health & Disability in Furnas County
Health Insurance Coverage by Age in Furnas County
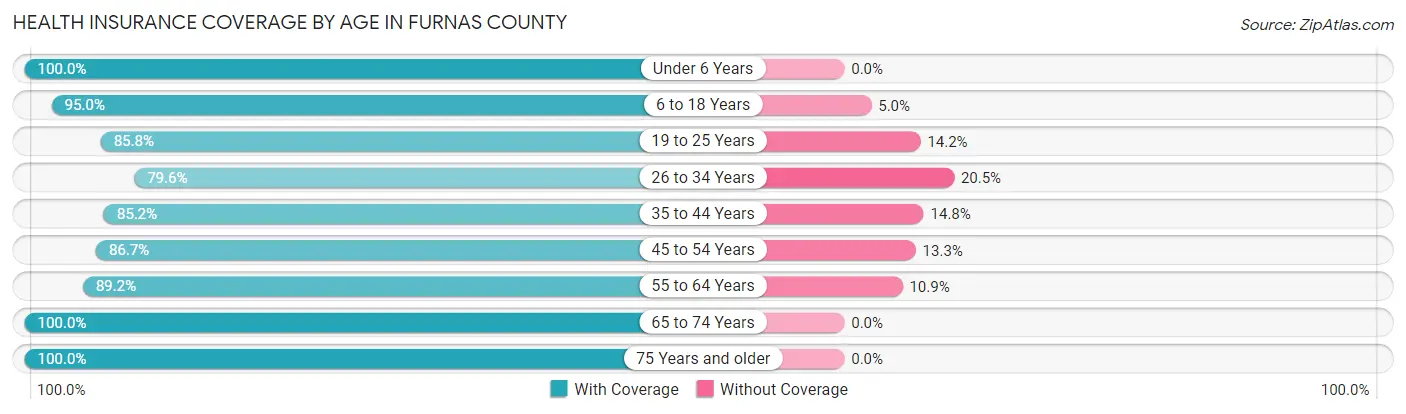
| Age Bracket | With Coverage | Without Coverage |
| Under 6 Years | 329 (100.0%) | 0 (0.0%) |
| 6 to 18 Years | 680 (95.0%) | 36 (5.0%) |
| 19 to 25 Years | 302 (85.8%) | 50 (14.2%) |
| 26 to 34 Years | 284 (79.5%) | 73 (20.4%) |
| 35 to 44 Years | 409 (85.2%) | 71 (14.8%) |
| 45 to 54 Years | 469 (86.7%) | 72 (13.3%) |
| 55 to 64 Years | 600 (89.1%) | 73 (10.8%) |
| 65 to 74 Years | 624 (100.0%) | 0 (0.0%) |
| 75 Years and older | 481 (100.0%) | 0 (0.0%) |
| Total | 4,178 (91.8%) | 375 (8.2%) |
Health Insurance Coverage by Citizenship Status in Furnas County
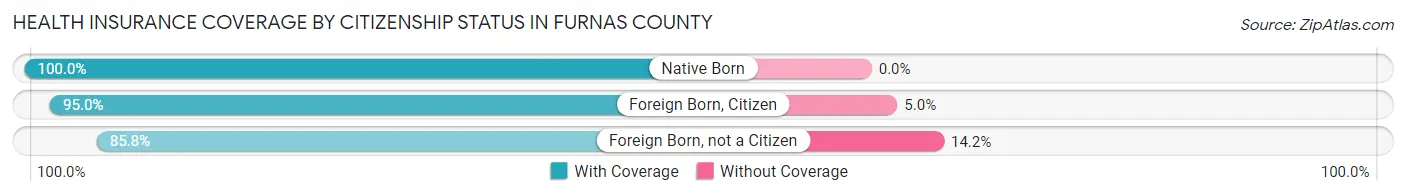
| Citizenship Status | With Coverage | Without Coverage |
| Native Born | 329 (100.0%) | 0 (0.0%) |
| Foreign Born, Citizen | 680 (95.0%) | 36 (5.0%) |
| Foreign Born, not a Citizen | 302 (85.8%) | 50 (14.2%) |
Health Insurance Coverage by Household Income in Furnas County
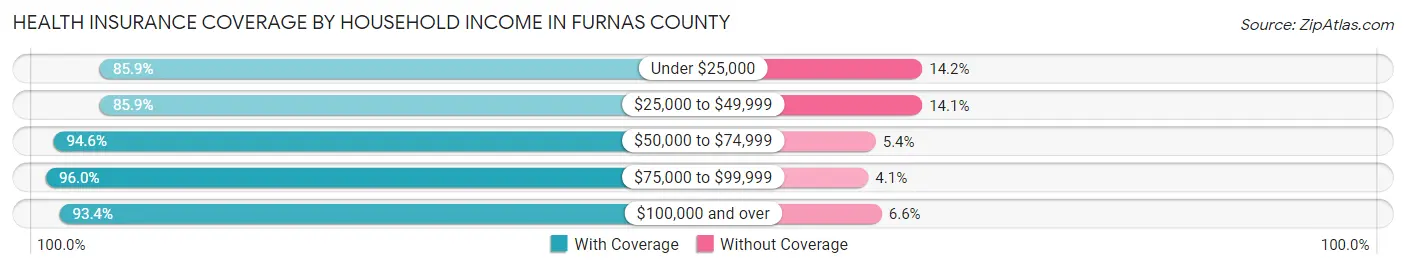
| Household Income | With Coverage | Without Coverage |
| Under $25,000 | 437 (85.9%) | 72 (14.1%) |
| $25,000 to $49,999 | 772 (85.9%) | 127 (14.1%) |
| $50,000 to $74,999 | 958 (94.6%) | 55 (5.4%) |
| $75,000 to $99,999 | 735 (96.0%) | 31 (4.1%) |
| $100,000 and over | 1,265 (93.4%) | 89 (6.6%) |
Public vs Private Health Insurance Coverage by Age in Furnas County
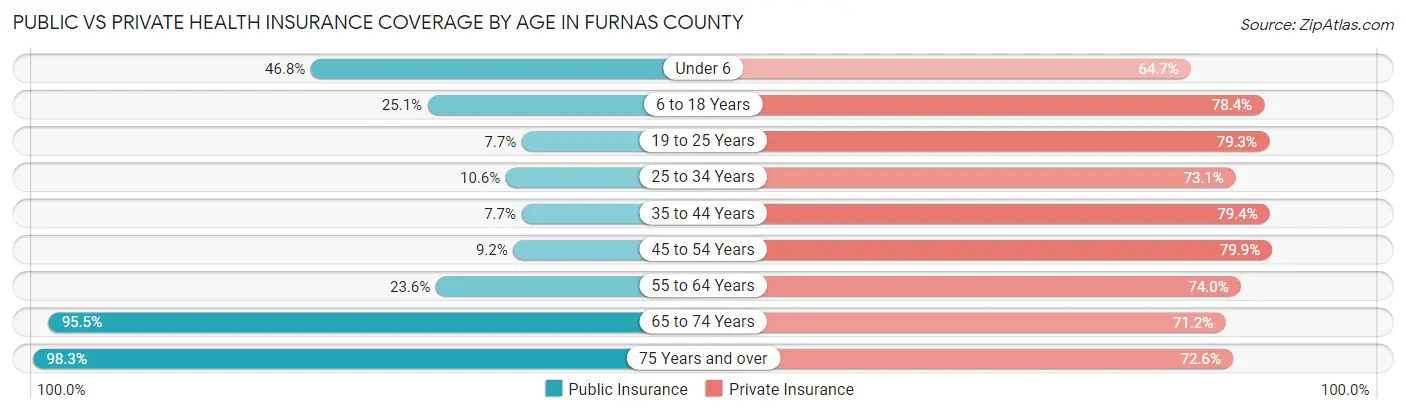
| Age Bracket | Public Insurance | Private Insurance |
| Under 6 | 154 (46.8%) | 213 (64.7%) |
| 6 to 18 Years | 180 (25.1%) | 561 (78.3%) |
| 19 to 25 Years | 27 (7.7%) | 279 (79.3%) |
| 25 to 34 Years | 38 (10.6%) | 261 (73.1%) |
| 35 to 44 Years | 37 (7.7%) | 381 (79.4%) |
| 45 to 54 Years | 50 (9.2%) | 432 (79.8%) |
| 55 to 64 Years | 159 (23.6%) | 498 (74.0%) |
| 65 to 74 Years | 596 (95.5%) | 444 (71.2%) |
| 75 Years and over | 473 (98.3%) | 349 (72.6%) |
| Total | 1,714 (37.7%) | 3,418 (75.1%) |
Disability Status by Sex by Age in Furnas County
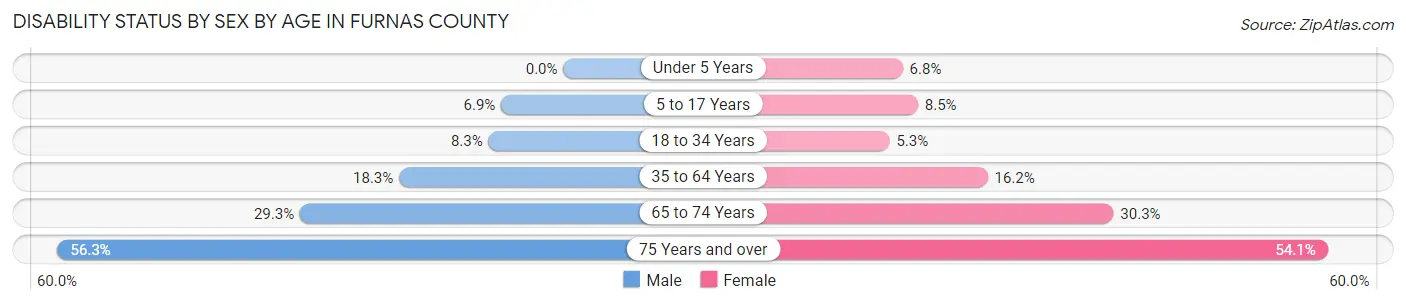
| Age Bracket | Male | Female |
| Under 5 Years | 0 (0.0%) | 8 (6.8%) |
| 5 to 17 Years | 27 (6.9%) | 31 (8.5%) |
| 18 to 34 Years | 33 (8.3%) | 18 (5.3%) |
| 35 to 64 Years | 160 (18.3%) | 133 (16.2%) |
| 65 to 74 Years | 88 (29.3%) | 98 (30.2%) |
| 75 Years and over | 120 (56.3%) | 145 (54.1%) |
Disability Class by Sex by Age in Furnas County
Disability Class: Hearing Difficulty
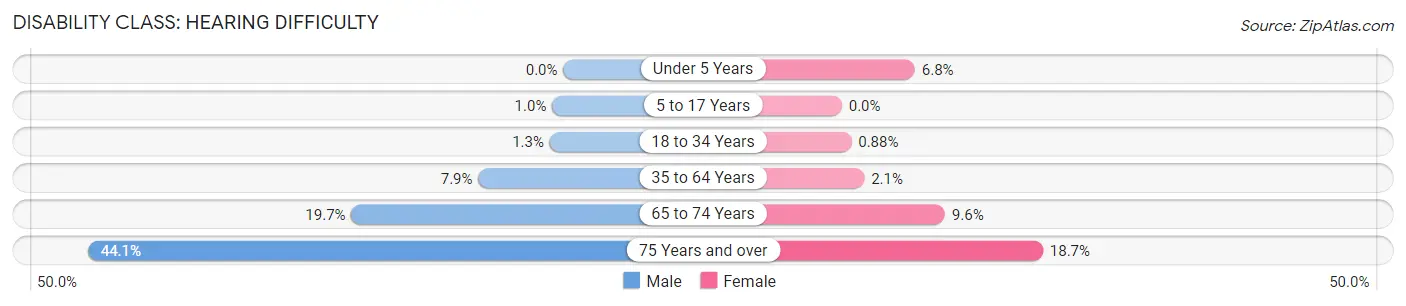
| Age Bracket | Male | Female |
| Under 5 Years | 0 (0.0%) | 8 (6.8%) |
| 5 to 17 Years | 4 (1.0%) | 0 (0.0%) |
| 18 to 34 Years | 5 (1.3%) | 3 (0.9%) |
| 35 to 64 Years | 69 (7.9%) | 17 (2.1%) |
| 65 to 74 Years | 59 (19.7%) | 31 (9.6%) |
| 75 Years and over | 94 (44.1%) | 50 (18.7%) |
Disability Class: Vision Difficulty
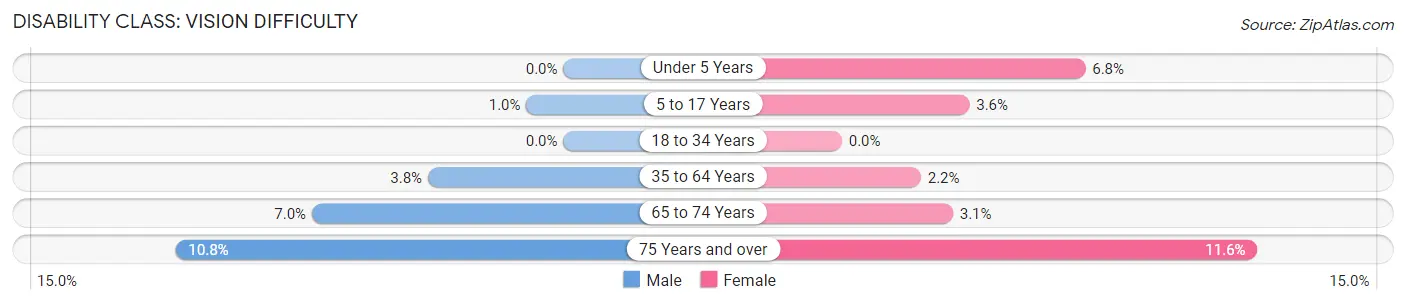
| Age Bracket | Male | Female |
| Under 5 Years | 0 (0.0%) | 8 (6.8%) |
| 5 to 17 Years | 4 (1.0%) | 13 (3.5%) |
| 18 to 34 Years | 0 (0.0%) | 0 (0.0%) |
| 35 to 64 Years | 33 (3.8%) | 18 (2.2%) |
| 65 to 74 Years | 21 (7.0%) | 10 (3.1%) |
| 75 Years and over | 23 (10.8%) | 31 (11.6%) |
Disability Class: Cognitive Difficulty
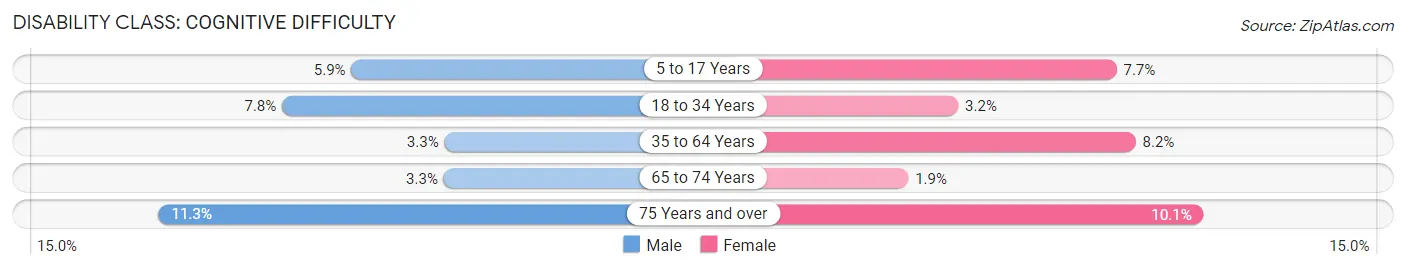
| Age Bracket | Male | Female |
| 5 to 17 Years | 23 (5.9%) | 28 (7.6%) |
| 18 to 34 Years | 31 (7.8%) | 11 (3.2%) |
| 35 to 64 Years | 29 (3.3%) | 67 (8.2%) |
| 65 to 74 Years | 10 (3.3%) | 6 (1.8%) |
| 75 Years and over | 24 (11.3%) | 27 (10.1%) |
Disability Class: Ambulatory Difficulty
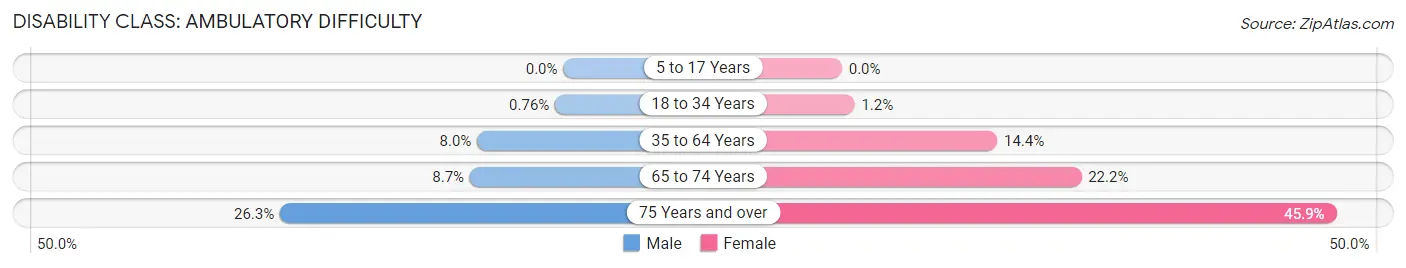
| Age Bracket | Male | Female |
| 5 to 17 Years | 0 (0.0%) | 0 (0.0%) |
| 18 to 34 Years | 3 (0.8%) | 4 (1.2%) |
| 35 to 64 Years | 70 (8.0%) | 118 (14.4%) |
| 65 to 74 Years | 26 (8.7%) | 72 (22.2%) |
| 75 Years and over | 56 (26.3%) | 123 (45.9%) |
Disability Class: Self-Care Difficulty
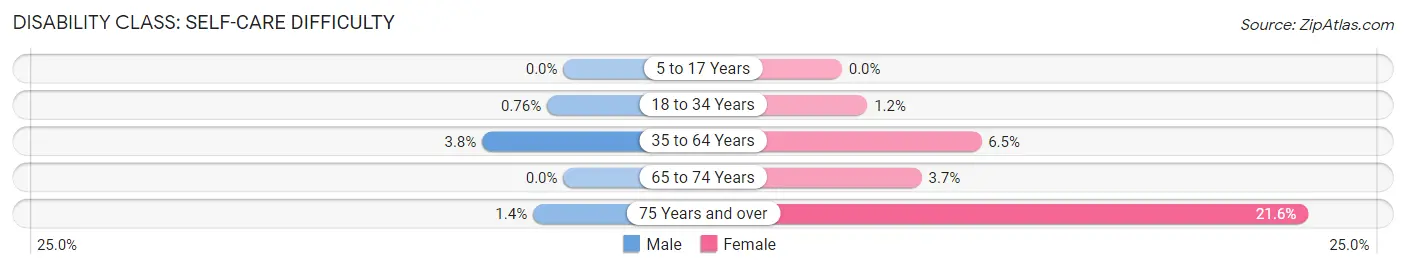
| Age Bracket | Male | Female |
| 5 to 17 Years | 0 (0.0%) | 0 (0.0%) |
| 18 to 34 Years | 3 (0.8%) | 4 (1.2%) |
| 35 to 64 Years | 33 (3.8%) | 53 (6.5%) |
| 65 to 74 Years | 0 (0.0%) | 12 (3.7%) |
| 75 Years and over | 3 (1.4%) | 58 (21.6%) |
Technology Access in Furnas County
Computing Device Access in Furnas County
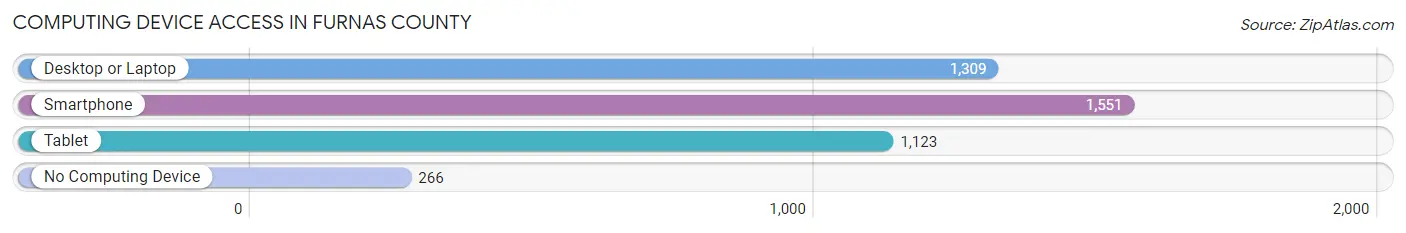
| Device Type | # Households | % Households |
| Desktop or Laptop | 1,309 | 65.3% |
| Smartphone | 1,551 | 77.4% |
| Tablet | 1,123 | 56.1% |
| No Computing Device | 266 | 13.3% |
| Total | 2,003 | 100.0% |
Internet Access in Furnas County
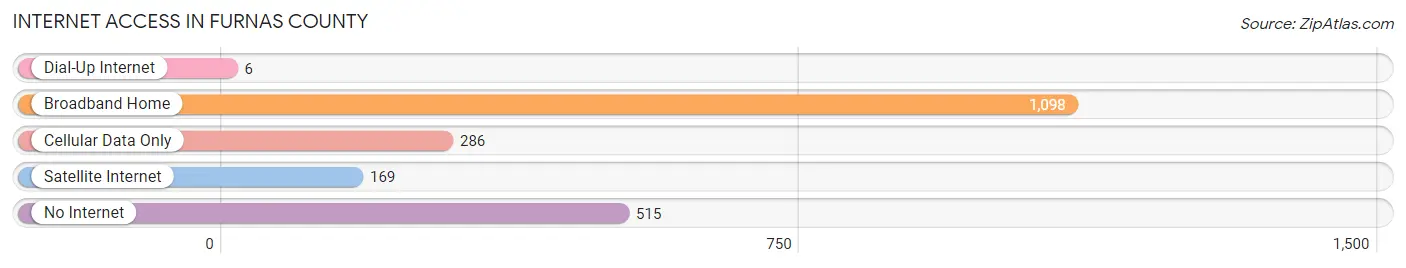
| Internet Type | # Households | % Households |
| Dial-Up Internet | 6 | 0.3% |
| Broadband Home | 1,098 | 54.8% |
| Cellular Data Only | 286 | 14.3% |
| Satellite Internet | 169 | 8.4% |
| No Internet | 515 | 25.7% |
| Total | 2,003 | 100.0% |
Furnas County Summary
Furnas County is located in the south-central part of the state of Nebraska, in the Great Plains region of the United States. It is bordered by Harlan County to the north, Gosper County to the east, Phelps County to the south, and Frontier County to the west. The county seat is Beaver City, and the largest city is Arapahoe. The county was named after Stephen A. Furnas, the Governor of Nebraska from 1873 to 1875.
Geography
Furnas County covers an area of 845 square miles, of which 844 square miles is land and 1 square mile is water. The county is located in the Sandhills region of Nebraska, and is characterized by rolling hills and grasslands. The Republican River flows through the county, and there are several small lakes and reservoirs. The highest point in the county is located in the northwest corner, at an elevation of 2,845 feet.
Demographics
As of the 2010 census, there were 5,966 people, 2,521 households, and 1,637 families living in Furnas County. The population density was 7 people per square mile. The racial makeup of the county was 97.3% White, 0.3% African American, 0.3% Native American, 0.2% Asian, 0.1% Pacific Islander, 0.7% from other races, and 0.9% from two or more races. Hispanic or Latino of any race were 2.2% of the population.
The median income for a household in the county was $37,917, and the median income for a family was $45,938. The per capita income for the county was $18,845. About 10.2% of families and 13.2% of the population were below the poverty line, including 16.2% of those under age 18 and 10.2% of those age 65 or over.
Economy
The economy of Furnas County is largely based on agriculture. The county is home to a variety of crops, including corn, soybeans, wheat, sorghum, and hay. Livestock production is also important, with cattle, hogs, and sheep being raised in the area.
The county is also home to several manufacturing companies, including a furniture factory, a plastics factory, and a metal fabrication plant. There are also several small businesses in the county, including restaurants, retail stores, and service providers.
The county is served by two airports, the Beaver City Municipal Airport and the Arapahoe Municipal Airport. The county is also served by several highways, including U.S. Route 6, Nebraska Highway 4, and Nebraska Highway 23.
Conclusion
Furnas County is a rural county located in the south-central part of Nebraska. It is characterized by rolling hills and grasslands, and is home to a variety of crops and livestock. The economy of the county is largely based on agriculture, but there are also several manufacturing companies and small businesses in the area. The county is served by two airports and several highways, making it easily accessible to the rest of the state.
Common Questions
What is Per Capita Income in Furnas County?
Per Capita income in Furnas County is $32,494.
What is the Median Family Income in Furnas County?
Median Family Income in Furnas County is $71,602.
What is the Median Household income in Furnas County?
Median Household Income in Furnas County is $58,895.
What is Income or Wage Gap in Furnas County?
Income or Wage Gap in Furnas County is 33.2%.
Women in Furnas County earn 66.8 cents for every dollar earned by a man.
What is Family Income Deficit in Furnas County?
Family Income Deficit in Furnas County is $11,080.
Families that are below poverty line in Furnas County earn $11,080 less on average than the poverty threshold level.
What is Inequality or Gini Index in Furnas County?
Inequality or Gini Index in Furnas County is 0.42.
What is the Total Population of Furnas County?
Total Population of Furnas County is 4,630.
What is the Total Male Population of Furnas County?
Total Male Population of Furnas County is 2,344.
What is the Total Female Population of Furnas County?
Total Female Population of Furnas County is 2,286.
What is the Ratio of Males per 100 Females in Furnas County?
There are 102.54 Males per 100 Females in Furnas County.
What is the Ratio of Females per 100 Males in Furnas County?
There are 97.53 Females per 100 Males in Furnas County.
What is the Median Population Age in Furnas County?
Median Population Age in Furnas County is 47.0 Years.
What is the Average Family Size in Furnas County
Average Family Size in Furnas County is 2.7 People.
What is the Average Household Size in Furnas County
Average Household Size in Furnas County is 2.3 People.
How Large is the Labor Force in Furnas County?
There are 2,241 People in the Labor Forcein in Furnas County.
What is the Percentage of People in the Labor Force in Furnas County?
59.0% of People are in the Labor Force in Furnas County.
What is the Unemployment Rate in Furnas County?
Unemployment Rate in Furnas County is 1.0%.